3D Surface Reconstruction Using Graph Cuts with Surface Constraints
Upload
independentCategory
view
3download
0
Contents lists available at SciVerse ScienceDirect
Journal of the Mechanics and Physics of Solids
Journal of the Mechanics and Physics of Solids 59 (2011) 2370–2381
0022-50
doi:10.1
n Corr
Firenze
E-m
journal homepage: www.elsevier.com/locate/jmps
Propagation of acoustic surface waves on a phononic surfaceinvestigated by transient reflecting grating spectroscopy
I. Malfanti a,b, A. Taschin a,c, P. Bartolini a, B. Bonello d, R. Torre a,b,n
a European Laboratory for Non-Linear Spectroscopy (LENS), Univ. di Firenze, Via N. Carrara 1, I-50019 Sesto Fiorentino, Firenze, Italyb Dip. di Fisica ed Astronomia, Univ. di Firenze, Via Sansone 1, I-50019 Sesto Fiorentino, Firenze, Italyc Istituto Nazionale di Ottica (INO) - CNR, Largo E. Fermi 6, I-50125 Firenze, Italyd Institute de NanoSciences de Paris (INSP), 140 rue de Lourmel, 75015 Paris, France
a r t i c l e i n f o
Article history:
Received 12 May 2011
Received in revised form
21 July 2011
Accepted 30 July 2011Available online 31 August 2011
Keywords:
Time-resolved optical spectroscopy
Transient reflecting grating
Surface acoustic waves
Nano/micro structures
Phononic properties
96/$ - see front matter & 2011 Elsevier Ltd. A
016/j.jmps.2011.07.010
esponding author at: European Laboratory f
, Italy. Tel.: þ39 0554572495; fax: þ39 0554
ail address: [email protected] (R. Torre).
a b s t r a c t
We present a study of surface acoustic waves (SAW) propagation on a 1D phononic
surface (PS) by mean of an heterodyne-detected transient reflecting grating experiment.
We excited and detected coherent stationary SAWs characterized by variable wave-
vectors. The measured SAW frequencies enables the characterization of the band
diagram of this PS sample beyond the first Brillouin zone (BZ). Four different SAW
frequencies have been revealed, whose band diagram show articulated dispersion
phenomena. In order to address the nature of the investigated SAWs, the experimental
results are compared with a numerical simulation of elastic modes based on a finite
element model. The observed SAWs are addressed to four Bloch waves characterized by
different frequencies and surface energy localization. Moreover, we measured the SAW
propagation on a flat non-phononic part of the sample surface and compared it with
results from the PS.
& 2011 Elsevier Ltd. All rights reserved.
1. Introduction
The study of propagation of surface acoustic waves (SAW) has relevant interest in both fundamental research andtechnological applications, from geophysical studies on seismic waves to the realization of electro-acoustic devices.Starting with the pioneering works of Lord Rayleigh (1885, 1888) a large number of experimental and theoretical studieshave been published on SAW science (Landau and Lifshitz, 1959; Auld, 1973; Victorov, 1981; Oliner, 1978).
During the last 20 years, there was a great deal of interest for periodic elastic structures, which are called since thattime phononic crystals, by analogy with their optical counterpart the photonic crystals. The propagation of acoustic wavesin phononic crystals shows many peculiar phenomena that open the possibility for the realization of acousticmetamaterials (for a review see Lu et al., 2009). A clear example is the creation of phononic band gaps (Kushwahaet al., 1994) (i.e. a frequency intervals over which the propagation of sound is forbidden), that enables a unique control onthe propagation of sound (Khelif et al., 2004). Other phenomena are connected with the acoustic processes characterizedby frequencies and wave-vectors at the band edge, where the folding and bending of the acoustic bands take place.
ll rights reserved.
or Non-Linear Spectroscopy (LENS), Univ. di Firenze, Via N. Carrara 1, I-50019 Sesto Fiorentino,
572451.
I. Malfanti et al. / J. Mech. Phys. Solids 59 (2011) 2370–2381 2371
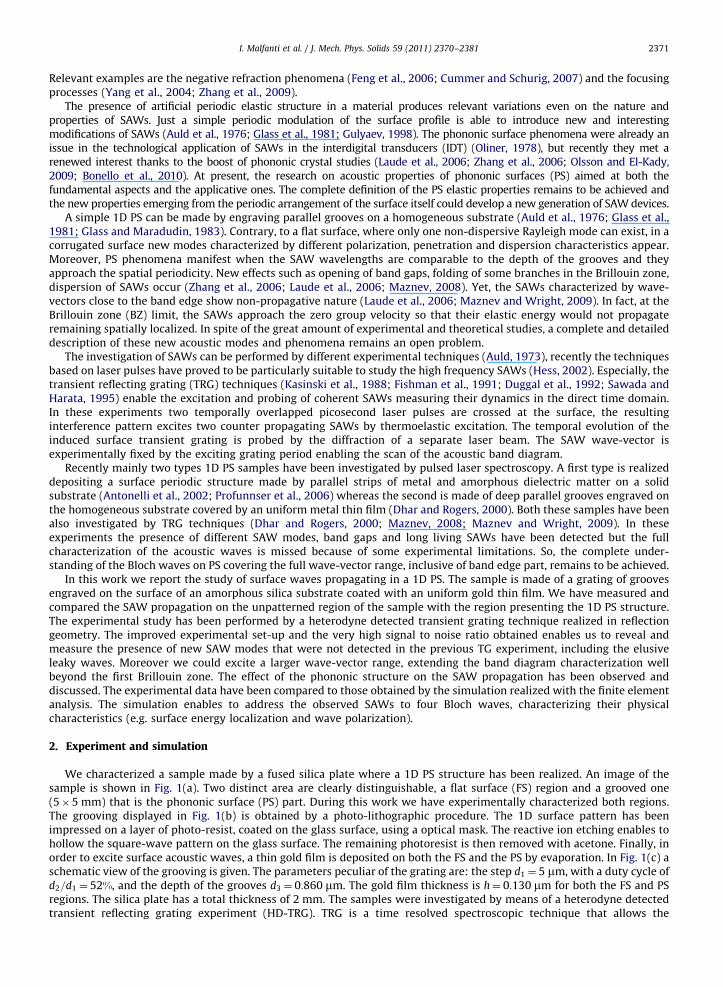
Relevant examples are the negative refraction phenomena (Feng et al., 2006; Cummer and Schurig, 2007) and the focusingprocesses (Yang et al., 2004; Zhang et al., 2009).
The presence of artificial periodic elastic structure in a material produces relevant variations even on the nature andproperties of SAWs. Just a simple periodic modulation of the surface profile is able to introduce new and interestingmodifications of SAWs (Auld et al., 1976; Glass et al., 1981; Gulyaev, 1998). The phononic surface phenomena were already anissue in the technological application of SAWs in the interdigital transducers (IDT) (Oliner, 1978), but recently they met arenewed interest thanks to the boost of phononic crystal studies (Laude et al., 2006; Zhang et al., 2006; Olsson and El-Kady,2009; Bonello et al., 2010). At present, the research on acoustic properties of phononic surfaces (PS) aimed at both thefundamental aspects and the applicative ones. The complete definition of the PS elastic properties remains to be achieved andthe new properties emerging from the periodic arrangement of the surface itself could develop a new generation of SAW devices.
A simple 1D PS can be made by engraving parallel grooves on a homogeneous substrate (Auld et al., 1976; Glass et al.,1981; Glass and Maradudin, 1983). Contrary, to a flat surface, where only one non-dispersive Rayleigh mode can exist, in acorrugated surface new modes characterized by different polarization, penetration and dispersion characteristics appear.Moreover, PS phenomena manifest when the SAW wavelengths are comparable to the depth of the grooves and theyapproach the spatial periodicity. New effects such as opening of band gaps, folding of some branches in the Brillouin zone,dispersion of SAWs occur (Zhang et al., 2006; Laude et al., 2006; Maznev, 2008). Yet, the SAWs characterized by wave-vectors close to the band edge show non-propagative nature (Laude et al., 2006; Maznev and Wright, 2009). In fact, at theBrillouin zone (BZ) limit, the SAWs approach the zero group velocity so that their elastic energy would not propagateremaining spatially localized. In spite of the great amount of experimental and theoretical studies, a complete and detaileddescription of these new acoustic modes and phenomena remains an open problem.
The investigation of SAWs can be performed by different experimental techniques (Auld, 1973), recently the techniquesbased on laser pulses have proved to be particularly suitable to study the high frequency SAWs (Hess, 2002). Especially, thetransient reflecting grating (TRG) techniques (Kasinski et al., 1988; Fishman et al., 1991; Duggal et al., 1992; Sawada andHarata, 1995) enable the excitation and probing of coherent SAWs measuring their dynamics in the direct time domain.In these experiments two temporally overlapped picosecond laser pulses are crossed at the surface, the resultinginterference pattern excites two counter propagating SAWs by thermoelastic excitation. The temporal evolution of theinduced surface transient grating is probed by the diffraction of a separate laser beam. The SAW wave-vector isexperimentally fixed by the exciting grating period enabling the scan of the acoustic band diagram.
Recently mainly two types 1D PS samples have been investigated by pulsed laser spectroscopy. A first type is realizeddepositing a surface periodic structure made by parallel strips of metal and amorphous dielectric matter on a solidsubstrate (Antonelli et al., 2002; Profunnser et al., 2006) whereas the second is made of deep parallel grooves engraved onthe homogeneous substrate covered by an uniform metal thin film (Dhar and Rogers, 2000). Both these samples have beenalso investigated by TRG techniques (Dhar and Rogers, 2000; Maznev, 2008; Maznev and Wright, 2009). In theseexperiments the presence of different SAW modes, band gaps and long living SAWs have been detected but the fullcharacterization of the acoustic waves is missed because of some experimental limitations. So, the complete under-standing of the Bloch waves on PS covering the full wave-vector range, inclusive of band edge part, remains to be achieved.
In this work we report the study of surface waves propagating in a 1D PS. The sample is made of a grating of groovesengraved on the surface of an amorphous silica substrate coated with an uniform gold thin film. We have measured andcompared the SAW propagation on the unpatterned region of the sample with the region presenting the 1D PS structure.The experimental study has been performed by a heterodyne detected transient grating technique realized in reflectiongeometry. The improved experimental set-up and the very high signal to noise ratio obtained enables us to reveal andmeasure the presence of new SAW modes that were not detected in the previous TG experiment, including the elusiveleaky waves. Moreover we could excite a larger wave-vector range, extending the band diagram characterization wellbeyond the first Brillouin zone. The effect of the phononic structure on the SAW propagation has been observed anddiscussed. The experimental data have been compared to those obtained by the simulation realized with the finite elementanalysis. The simulation enables to address the observed SAWs to four Bloch waves, characterizing their physicalcharacteristics (e.g. surface energy localization and wave polarization).
2. Experiment and simulation
We characterized a sample made by a fused silica plate where a 1D PS structure has been realized. An image of thesample is shown in Fig. 1(a). Two distinct area are clearly distinguishable, a flat surface (FS) region and a grooved one(5�5 mm) that is the phononic surface (PS) part. During this work we have experimentally characterized both regions.The grooving displayed in Fig. 1(b) is obtained by a photo-lithographic procedure. The 1D surface pattern has beenimpressed on a layer of photo-resist, coated on the glass surface, using a optical mask. The reactive ion etching enables tohollow the square-wave pattern on the glass surface. The remaining photoresist is then removed with acetone. Finally, inorder to excite surface acoustic waves, a thin gold film is deposited on both the FS and the PS by evaporation. In Fig. 1(c) aschematic view of the grooving is given. The parameters peculiar of the grating are: the step d1 ¼ 5 mm, with a duty cycle ofd2=d1 ¼ 52%, and the depth of the grooves d3 ¼ 0:860 mm. The gold film thickness is h¼ 0:130 mm for both the FS and PSregions. The silica plate has a total thickness of 2 mm. The samples were investigated by means of a heterodyne detectedtransient reflecting grating experiment (HD-TRG). TRG is a time resolved spectroscopic technique that allows the
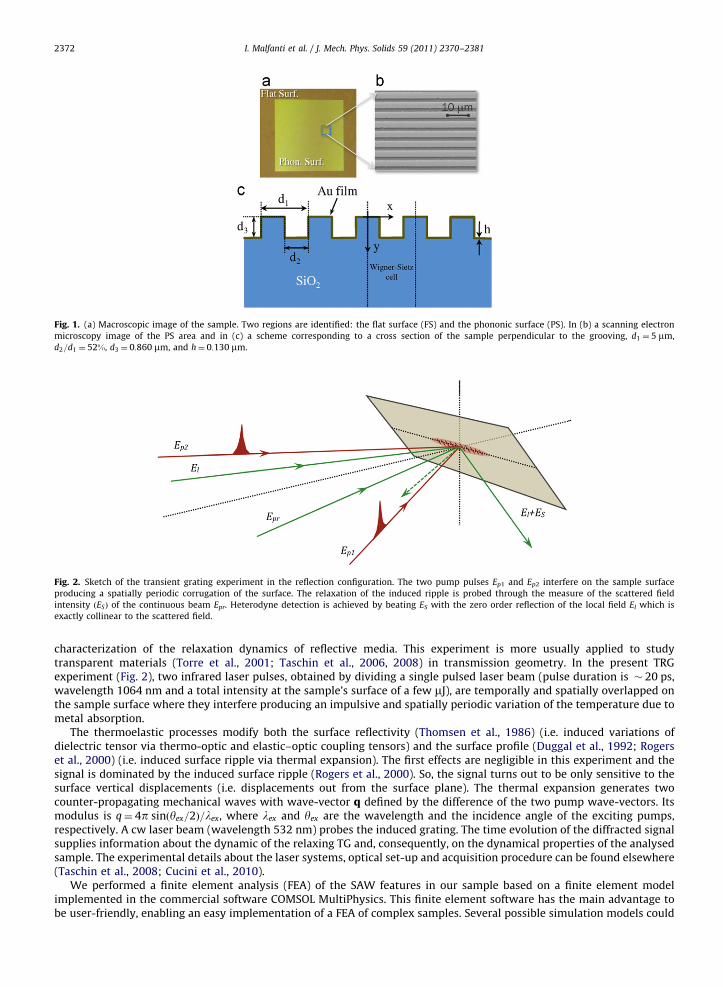
Fig. 1. (a) Macroscopic image of the sample. Two regions are identified: the flat surface (FS) and the phononic surface (PS). In (b) a scanning electron
microscopy image of the PS area and in (c) a scheme corresponding to a cross section of the sample perpendicular to the grooving, d1 ¼ 5 mm,
d2=d1 ¼ 52%, d3 ¼ 0:860 mm, and h¼ 0:130 mm.
Fig. 2. Sketch of the transient grating experiment in the reflection configuration. The two pump pulses Ep1 and Ep2 interfere on the sample surface
producing a spatially periodic corrugation of the surface. The relaxation of the induced ripple is probed through the measure of the scattered field
intensity ðESÞ of the continuous beam Epr. Heterodyne detection is achieved by beating ES with the zero order reflection of the local field El which is
exactly collinear to the scattered field.
I. Malfanti et al. / J. Mech. Phys. Solids 59 (2011) 2370–23812372
characterization of the relaxation dynamics of reflective media. This experiment is more usually applied to studytransparent materials (Torre et al., 2001; Taschin et al., 2006, 2008) in transmission geometry. In the present TRGexperiment (Fig. 2), two infrared laser pulses, obtained by dividing a single pulsed laser beam (pulse duration is � 20 ps,wavelength 1064 nm and a total intensity at the sample’s surface of a few mJ), are temporally and spatially overlapped onthe sample surface where they interfere producing an impulsive and spatially periodic variation of the temperature due tometal absorption.
The thermoelastic processes modify both the surface reflectivity (Thomsen et al., 1986) (i.e. induced variations ofdielectric tensor via thermo-optic and elastic–optic coupling tensors) and the surface profile (Duggal et al., 1992; Rogerset al., 2000) (i.e. induced surface ripple via thermal expansion). The first effects are negligible in this experiment and thesignal is dominated by the induced surface ripple (Rogers et al., 2000). So, the signal turns out to be only sensitive to thesurface vertical displacements (i.e. displacements out from the surface plane). The thermal expansion generates twocounter-propagating mechanical waves with wave-vector q defined by the difference of the two pump wave-vectors. Itsmodulus is q¼ 4p sinðyex=2Þ=lex, where lex and yex are the wavelength and the incidence angle of the exciting pumps,respectively. A cw laser beam (wavelength 532 nm) probes the induced grating. The time evolution of the diffracted signalsupplies information about the dynamic of the relaxing TG and, consequently, on the dynamical properties of the analysedsample. The experimental details about the laser systems, optical set-up and acquisition procedure can be found elsewhere(Taschin et al., 2008; Cucini et al., 2010).
We performed a finite element analysis (FEA) of the SAW features in our sample based on a finite element modelimplemented in the commercial software COMSOL MultiPhysics. This finite element software has the main advantage tobe user-friendly, enabling an easy implementation of a FEA of complex samples. Several possible simulation models could
I. Malfanti et al. / J. Mech. Phys. Solids 59 (2011) 2370–2381 2373
be realized, using the ComsolMultiPhysics platform, relevant to present experiments. A possible one would consist in thedefinition of a physical model able to describe both the excitation mechanism and the dynamic properties of SAWpropagating on a phononic surface, see for example Duhring et al. (2009). The numerical solution of such a model wouldgive a deep understanding of the SAW generation and propagation, enabling a more direct comparison with experimentalresults. Nevertheless this procedure is quite complex and requires an evolute physic and simulation model. A simpler wayto characterize the measured SAW on a PS is to use an eigenvalue analysis for structural mechanical problems (Nardi et al.,2009), this enables to retrieve the Bloch eigen-functions and eigen-frequencies that are supported by a given elasticstructure. This approach is already implemented in a COMSOL module software. Once all the geometrical and mechanicalcharacteristics of the structure are specified, it allows to determine the eigen-frequencies associated to a specifiedeigenvector and their associated displacement field. It is therefore clear that the polarization state at each eigen-frequencycan be evaluated.
The simulation has been performed using the geometrical features already reported at the beginning of this section andsketched in Fig. 1 and the following mechanical characteristics are reported in Table 1.
In the present TRG experimental investigation we need to address the measured SAW frequencies to the specific Blochwaves and characterize them. So we perform the eigenvalue analysis that enables the necessary understanding of theelastic properties of the sample without requiring a more demanding theoretical and simulation work. The simulationswere realized over the Wigner–Seitz cell (WSC), sketched in Fig. 1(c), imposing Bloch conditions at the boundary to thedisplacement field u(x, y)¼(u(x, y), v(x, y)) (where u and v are horizontal, x, and vertical, y, displacement field respectively).
3. Results
The HD-TRG data have been collected at room temperature for a q-vector range extending from q¼ 0:09 mm�1 up toq¼ 1:04 mm�1 which widely covers the first BZ. We performed the HD-TRG experiments on both the FS and the PS of thesample. In the PS we investigated the SAW with wave-vectors q parallel or orthogonal to the 1D structure (i.e. parallel ororthogonal to the grooves).
3.1. Flat surface
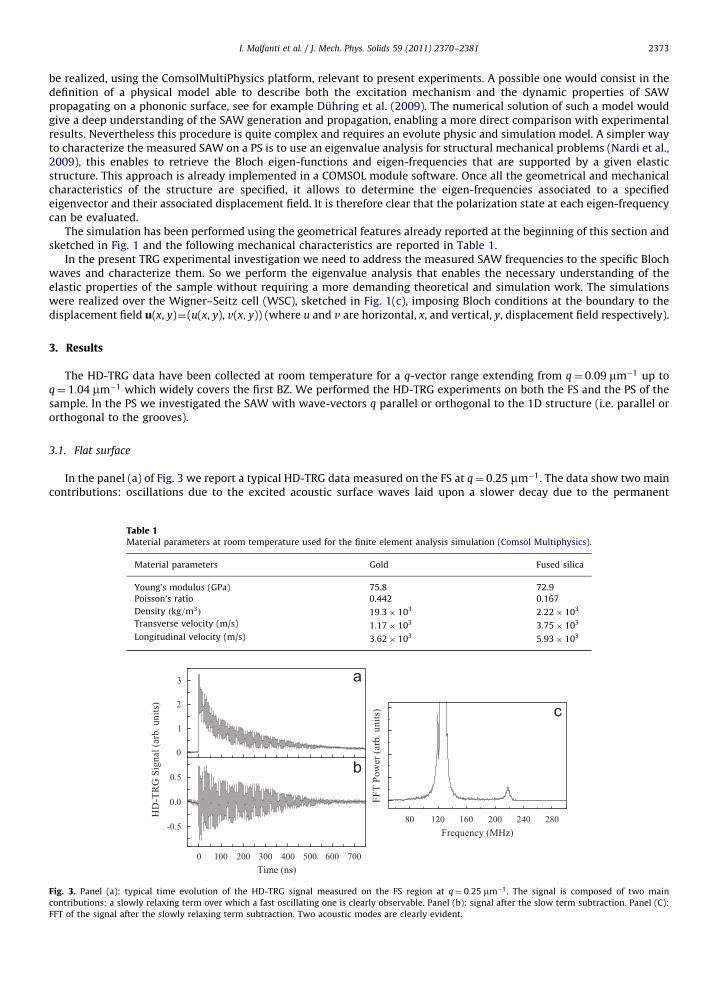
In the panel (a) of Fig. 3 we report a typical HD-TRG data measured on the FS at q¼ 0:25 mm�1. The data show two maincontributions: oscillations due to the excited acoustic surface waves laid upon a slower decay due to the permanent
Table 1Material parameters at room temperature used for the finite element analysis simulation (Comsol Multiphysics).
Material parameters Gold Fused silica
Young’s modulus (GPa) 75.8 72.9
Poisson’s ratio 0.442 0.167
Density ðkg=m3Þ 19:3� 103 2:22� 103
Transverse velocity (m/s) 1:17� 103 3:75� 103
Longitudinal velocity (m/s) 3:62� 103 5:93� 103
Fig. 3. Panel (a): typical time evolution of the HD-TRG signal measured on the FS region at q¼ 0:25 mm�1. The signal is composed of two main
contributions: a slowly relaxing term over which a fast oscillating one is clearly observable. Panel (b): signal after the slow term subtraction. Panel (C):
FFT of the signal after the slowly relaxing term subtraction. Two acoustic modes are clearly evident.

I. Malfanti et al. / J. Mech. Phys. Solids 59 (2011) 2370–23812374
temperature grating relaxing by thermal diffusion. In order to better infer the acoustic parameters of interest from thesignal, we subtracted the thermal decay, as reported in the panel (b) of Fig. 3, and then we performed a fast Fouriertransform (FFT) algorithm of the resulting data. In the panel (c) of the same figure we show the acoustic spectra content ofsignal at q¼ 0:25 mm�1, the presence of two acoustic modes is evident. All HD-TRG data measured on FS showed only thepresence of these two modes. We have then induced waves on the patterned region with wave-vector parallel to thegrooves and, as we expected, the two modes did not show changes in the relation dispersion (see Fig. 4 grey circles andsquare respectively). The induced waves do not sense the surface structure as long as it propagates parallel to groovessince, being contained in the sagittal plane, no periodicity is present. In the following, we will generally refer to the FS dataalso the case of propagation in the patterned sample with wave-vector parallel to grooves will be considered. The relativedispersion relations are shown in Fig. 4. Red ones correspond to the fundamental mode and blue ones to the secondweaker mode. Consistently with the previous considerations the dependence of the frequency on the wave-vector is notlinear for both the waves.
3.2. Phononic surface
In the panel (a) of Fig. 5 we report the HD-TRG data measured at q¼ 0:82 mm�1 on the PS for wave-vector propagatingorthogonal to the grooves. In the panel (b) the signal after the slow term subtraction is shown. Performing a FFT algorithm
Fig. 4. Measured and simulated dispersion of surface modes. Blue square and red circle symbols correspond to experimental measured frequency of
surface acoustic modes in FS region, grey squares and circles correspond to data in PS with wave-vectors parallel to the grooves. Red circles (grey circles)
represent the Rayleigh mode, blue square (grey squares) correspond to first Sezawa mode (or second mode). Orange and light blue continuous lines
correspond to simulated dispersion diagram. Black dotted (dashed) line corresponds to the transverse (longitudinal) mode of the substrate.
(For interpretation of the references to colour in this figure legend, the reader is referred to the web version of this article.)
Fig. 5. Panel (a): Temporal behaviour of the HD-TRG signal measured on the PS for wave vector ðq¼ 0:82 mm�1Þ propagating orthogonal to the grooves.
Panel (b): signal after the slow term subtraction. Panel (c): FFT of the signal after the slowly relaxing term subtraction. Four acoustic modes are clearly
evident.
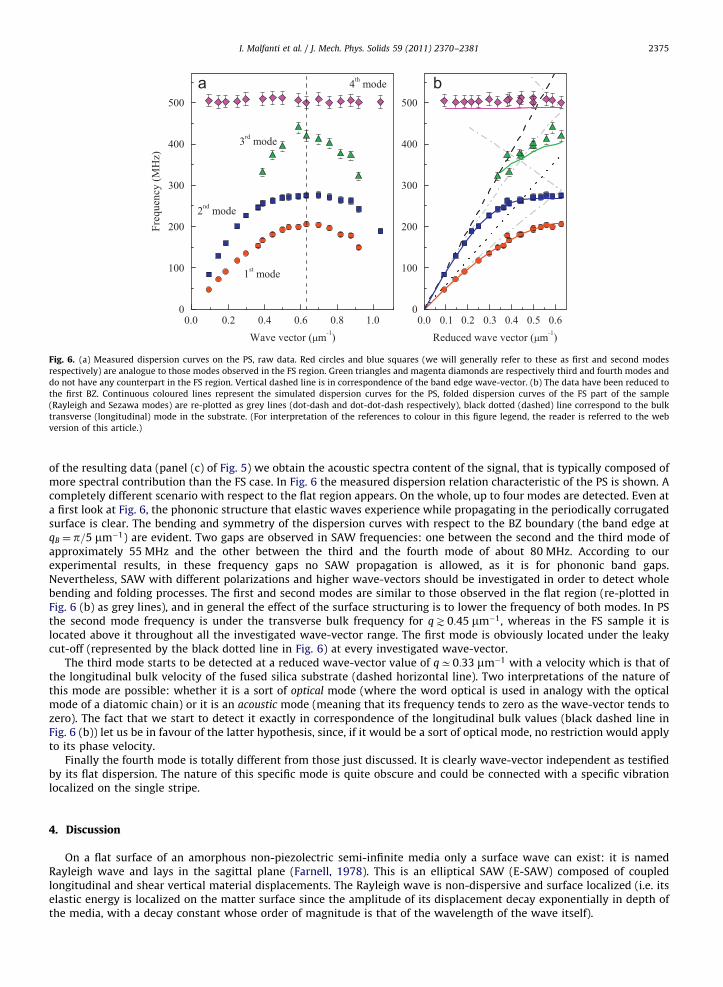
Fig. 6. (a) Measured dispersion curves on the PS, raw data. Red circles and blue squares (we will generally refer to these as first and second modes
respectively) are analogue to those modes observed in the FS region. Green triangles and magenta diamonds are respectively third and fourth modes and
do not have any counterpart in the FS region. Vertical dashed line is in correspondence of the band edge wave-vector. (b) The data have been reduced to
the first BZ. Continuous coloured lines represent the simulated dispersion curves for the PS, folded dispersion curves of the FS part of the sample
(Rayleigh and Sezawa modes) are re-plotted as grey lines (dot-dash and dot-dot-dash respectively), black dotted (dashed) line correspond to the bulk
transverse (longitudinal) mode in the substrate. (For interpretation of the references to colour in this figure legend, the reader is referred to the web
version of this article.)
I. Malfanti et al. / J. Mech. Phys. Solids 59 (2011) 2370–2381 2375
of the resulting data (panel (c) of Fig. 5) we obtain the acoustic spectra content of the signal, that is typically composed ofmore spectral contribution than the FS case. In Fig. 6 the measured dispersion relation characteristic of the PS is shown. Acompletely different scenario with respect to the flat region appears. On the whole, up to four modes are detected. Even ata first look at Fig. 6, the phononic structure that elastic waves experience while propagating in the periodically corrugatedsurface is clear. The bending and symmetry of the dispersion curves with respect to the BZ boundary (the band edge atqB ¼ p=5 mm�1) are evident. Two gaps are observed in SAW frequencies: one between the second and the third mode ofapproximately 55 MHz and the other between the third and the fourth mode of about 80 MHz. According to ourexperimental results, in these frequency gaps no SAW propagation is allowed, as it is for phononic band gaps.Nevertheless, SAW with different polarizations and higher wave-vectors should be investigated in order to detect wholebending and folding processes. The first and second modes are similar to those observed in the flat region (re-plotted inFig. 6 (b) as grey lines), and in general the effect of the surface structuring is to lower the frequency of both modes. In PSthe second mode frequency is under the transverse bulk frequency for q\0:45 mm�1, whereas in the FS sample it islocated above it throughout all the investigated wave-vector range. The first mode is obviously located under the leakycut-off (represented by the black dotted line in Fig. 6) at every investigated wave-vector.
The third mode starts to be detected at a reduced wave-vector value of qC0:33 mm�1 with a velocity which is that ofthe longitudinal bulk velocity of the fused silica substrate (dashed horizontal line). Two interpretations of the nature ofthis mode are possible: whether it is a sort of optical mode (where the word optical is used in analogy with the opticalmode of a diatomic chain) or it is an acoustic mode (meaning that its frequency tends to zero as the wave-vector tends tozero). The fact that we start to detect it exactly in correspondence of the longitudinal bulk values (black dashed line inFig. 6 (b)) let us be in favour of the latter hypothesis, since, if it would be a sort of optical mode, no restriction would applyto its phase velocity.
Finally the fourth mode is totally different from those just discussed. It is clearly wave-vector independent as testifiedby its flat dispersion. The nature of this specific mode is quite obscure and could be connected with a specific vibrationlocalized on the single stripe.
4. Discussion
On a flat surface of an amorphous non-piezolectric semi-infinite media only a surface wave can exist: it is namedRayleigh wave and lays in the sagittal plane (Farnell, 1978). This is an elliptical SAW (E-SAW) composed of coupledlongitudinal and shear vertical material displacements. The Rayleigh wave is non-dispersive and surface localized (i.e. itselastic energy is localized on the matter surface since the amplitude of its displacement decay exponentially in depth ofthe media, with a decay constant whose order of magnitude is that of the wavelength of the wave itself).
I. Malfanti et al. / J. Mech. Phys. Solids 59 (2011) 2370–23812376
The presence of a periodic corrugation or a film bounded to the substrate’s surface deeply influences the propagation ofSAW giving rise to new SAWs characterized by different polarizations, dispersive and localization features (Farnell, 1978;Gulyaev, 1998). In a corrugated surface the Rayleigh wave becomes dispersive and other E-SAW can exist (Glass et al.,1981), besides new shear horizontal SAWs (SH-SAW) can propagate on the surfaces (Auld et al., 1976). Typically the newE-SAWs are characterized by phase velocities higher than the transverse bulk velocity of substrate becoming ‘‘leaky’’waves (i.e. surface waves whose elastic energy decays weakly in depth of the media) (Giovannini et al., 1992; Lee et al.,1994). Also the presence of a thin film on a flat surface strongly modifies the SAWs propagation creating new surfaceacoustic modes (Farnell, 1978). The lower frequency E-SAW mode is again addressed to as Rayleigh mode. Besidesnumerous higher frequency E-SAW modes exist and they are generally referred to as Sezawa modes, together withSH-SAWs that are known as Love waves. Also in this case, some of these SAWs become leaky (Farnell, 1978). To ourknowledge, for media presenting simultaneously corrugation and thin film neither general theoretical nor numericalstudies exist. Nevertheless the studies on the IDT, on a piezoelectric substrate (Duhring et al., 2009) or amorphous media(Nardi et al., 2009), present many similarities with a thin film coated 1D PS.
In a HD-TRG experiment the signal is dominated by the transient ripple excited on the surface (Rogers et al., 2000). Sothis experiment is sensitive only to the E-SAWs that are characterized by some vertical displacement, whereas it is notsensitive to pure SH-SAW. Hence in the following discussion we will limit to compare our HD-TRG data with the simulatedE-SAW modes. In particular some leaky E-SAW, even though elliptical, are dominated by longitudinal surface displace-ments (9u949v9) (da Cunha and Adler, 1995), so that requires an excellent signal to noise ratio in order to experimentallydetect them.
With respect to the above considerations, there are two interesting quantities to discuss: the total displacement as afunction of depth in the material and a coefficient to estimate the polarization SAW components. We define a y dependentquantity that is the quadratic total displacement averaged along the x direction,
bðyÞ ¼Z 2p=q
0½uðx,yÞ2þvðx,yÞ2� dx ð1Þ
and the ellipticity-like coefficient instead as average quadratic ratio of u and v,
a¼R R 2p=q
0 vðx,yÞ2 dx dyR R 2p=q0 uðx,yÞ2 dx dy
ð2Þ
4.1. Flat surface
As first step, we will analyse the HD-TRG data on the FS. In the general case of a ‘‘slow’’ film on a ‘‘fast’’ substrate(Farnell, 1978), the Rayleigh wave phase velocity cR is comprised between the substrate’s Rayleigh velocity cRs and thefilm’s Rayleigh velocity cRf with cR-cRs for qh-0, q being the SAW wave-vector and h the film thickness. In ourexperiments the value of qh remain very small for any wave-vector excited, it varies from qh¼0.012 to qh¼0.14. So thephase velocity of the first mode at the lower induced wave-vector (i.e. qh¼0.12) is cR ¼ 3290 m/s and it corresponds to theRayleigh velocity of the substrate. In fact: at this value the wavelength is much bigger than the film thickness so that thewave does not effectively sense the presence of the film. As much as the product qh grows the wave is more and moreaffected by the film presence and slows down so that the phase velocity corresponding to the higher induced wave-vector(where qh¼0.14) is cR ¼ 2600 m=s.
For the Sezawa waves exist a cut-off velocity for qh-0 that is the transverse velocity of the substrate cTs (Farnell, 1978).The present measured second mode has always phase velocities above the cTs, represented by the straight dotted line inFig. 4. So this wave is over the cut-off velocity for any wave-vectors and it acquires a leaky nature. In order to understandthe nature of these two modes we calculated the dispersion relations of our sample by the FEA described previously. Fromeigenvalue analysis only two surface modes have been retrieved. These are shown as orange and blue continuous lines inFig. 4 and are in optimum agreement with the experimental data. In Fig. 7 we report the simulated displacement field(represented by the arrows) and the total displacement (in colour scale) at q¼ 0:628 mm�1 (corresponding to a wavelengthof 10 mm) of the first and second mode. Some of the general features characteristic of the two modes throughout all theinvestigated wave-vector range can be appreciated. In particular the different polarization state and the different profiledecay are evident. As already discussed there are some interesting parameters that can be obtained from the simulateddisplacement fields. In panel (a) of Fig. 8 the wave-vector behaviour of a for the second mode is shown. It can be observedthat as the wave-vector increases the value of a also raises. This implies that as wave-vector grows the Sezawa waveacquires a vertical transverse polarization character. Given the vertical displacement’s sensitivity of the experiment, thistrend is confirmed by comparing the amplitude of the leaky SAW peak relative to q¼ 0:092 mm�1 and to q¼ 1:04 mm�1
(panel (b) of Fig. 8). As expected, the intensity of this peak (each spectra has been normalized so that the maximum of thefirst peak is unity) is higher for the bigger wave-vector. Finally the different in depth decays behaviour of the two modesare well described by the calculated b parameter shown in panel (c) of Fig. 8. As expected the first mode decaysexponentially in depth whilst the second oscillates around a non-zero value also in substrate’s depth which is typical ofleaky waves that involves motion also in the bulk substrate (Farnell, 1978).
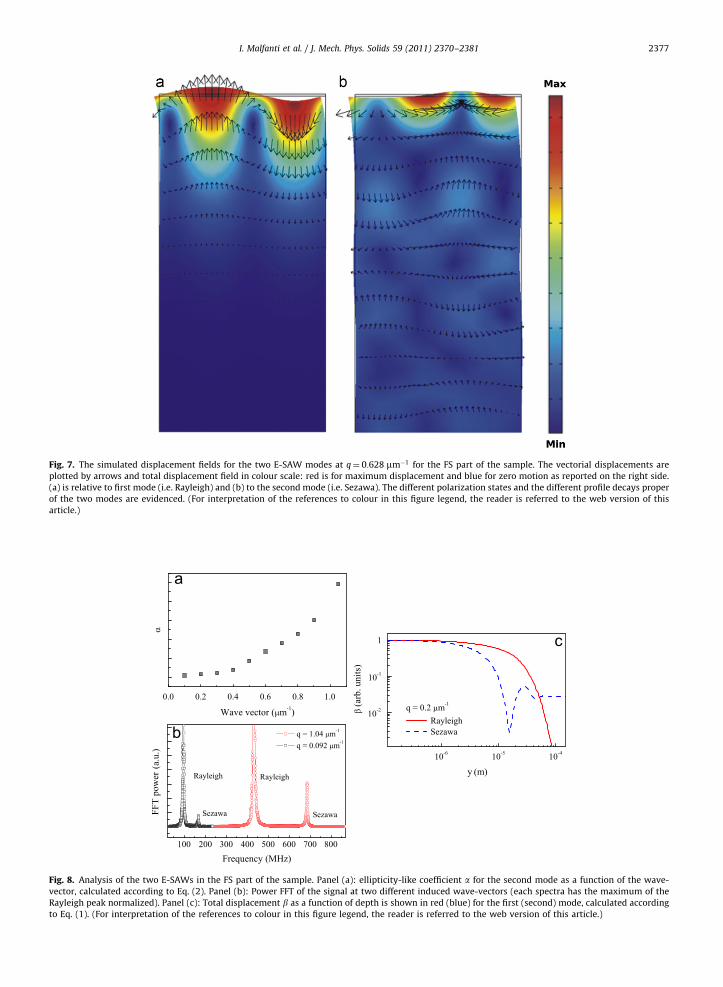
Fig. 7. The simulated displacement fields for the two E-SAW modes at q¼ 0:628 mm�1 for the FS part of the sample. The vectorial displacements are
plotted by arrows and total displacement field in colour scale: red is for maximum displacement and blue for zero motion as reported on the right side.
(a) is relative to first mode (i.e. Rayleigh) and (b) to the second mode (i.e. Sezawa). The different polarization states and the different profile decays proper
of the two modes are evidenced. (For interpretation of the references to colour in this figure legend, the reader is referred to the web version of this
article.)
Fig. 8. Analysis of the two E-SAWs in the FS part of the sample. Panel (a): ellipticity-like coefficient a for the second mode as a function of the wave-
vector, calculated according to Eq. (2). Panel (b): Power FFT of the signal at two different induced wave-vectors (each spectra has the maximum of the
Rayleigh peak normalized). Panel (c): Total displacement b as a function of depth is shown in red (blue) for the first (second) mode, calculated according
to Eq. (1). (For interpretation of the references to colour in this figure legend, the reader is referred to the web version of this article.)
I. Malfanti et al. / J. Mech. Phys. Solids 59 (2011) 2370–2381 2377
I. Malfanti et al. / J. Mech. Phys. Solids 59 (2011) 2370–23812378
4.2. Phononic surface
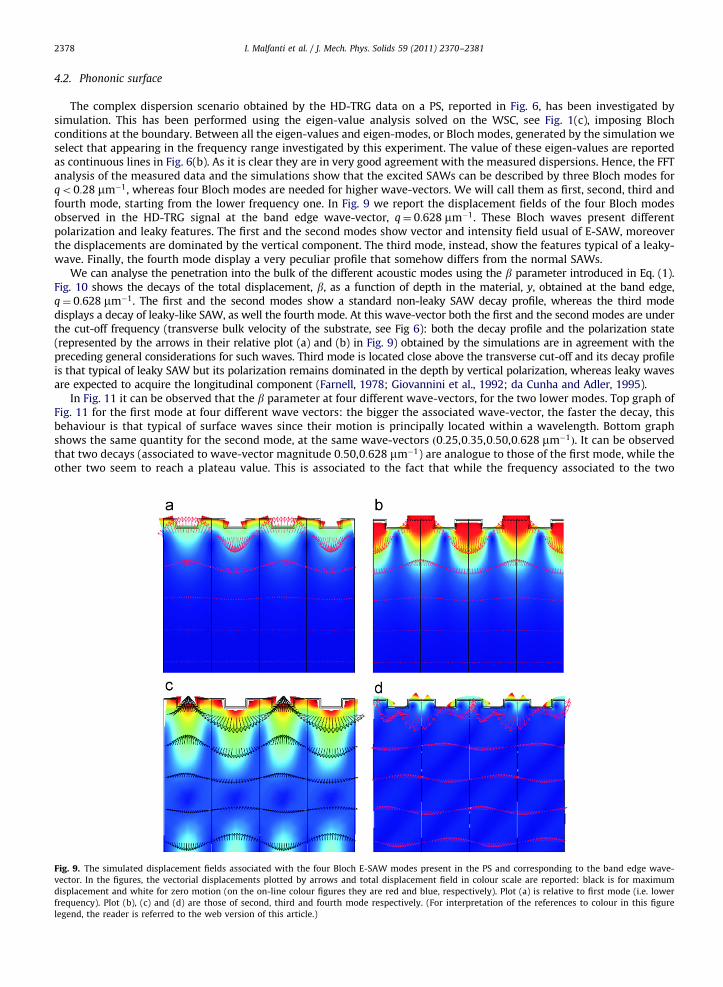
The complex dispersion scenario obtained by the HD-TRG data on a PS, reported in Fig. 6, has been investigated bysimulation. This has been performed using the eigen-value analysis solved on the WSC, see Fig. 1(c), imposing Blochconditions at the boundary. Between all the eigen-values and eigen-modes, or Bloch modes, generated by the simulation weselect that appearing in the frequency range investigated by this experiment. The value of these eigen-values are reportedas continuous lines in Fig. 6(b). As it is clear they are in very good agreement with the measured dispersions. Hence, the FFTanalysis of the measured data and the simulations show that the excited SAWs can be described by three Bloch modes forqo0:28 mm�1, whereas four Bloch modes are needed for higher wave-vectors. We will call them as first, second, third andfourth mode, starting from the lower frequency one. In Fig. 9 we report the displacement fields of the four Bloch modesobserved in the HD-TRG signal at the band edge wave-vector, q¼ 0:628 mm�1. These Bloch waves present differentpolarization and leaky features. The first and the second modes show vector and intensity field usual of E-SAW, moreoverthe displacements are dominated by the vertical component. The third mode, instead, show the features typical of a leaky-wave. Finally, the fourth mode display a very peculiar profile that somehow differs from the normal SAWs.
We can analyse the penetration into the bulk of the different acoustic modes using the b parameter introduced in Eq. (1).Fig. 10 shows the decays of the total displacement, b, as a function of depth in the material, y, obtained at the band edge,q¼ 0:628 mm�1. The first and the second modes show a standard non-leaky SAW decay profile, whereas the third modedisplays a decay of leaky-like SAW, as well the fourth mode. At this wave-vector both the first and the second modes are underthe cut-off frequency (transverse bulk velocity of the substrate, see Fig 6): both the decay profile and the polarization state(represented by the arrows in their relative plot (a) and (b) in Fig. 9) obtained by the simulations are in agreement with thepreceding general considerations for such waves. Third mode is located close above the transverse cut-off and its decay profileis that typical of leaky SAW but its polarization remains dominated in the depth by vertical polarization, whereas leaky wavesare expected to acquire the longitudinal component (Farnell, 1978; Giovannini et al., 1992; da Cunha and Adler, 1995).
In Fig. 11 it can be observed that the b parameter at four different wave-vectors, for the two lower modes. Top graph ofFig. 11 for the first mode at four different wave vectors: the bigger the associated wave-vector, the faster the decay, thisbehaviour is that typical of surface waves since their motion is principally located within a wavelength. Bottom graphshows the same quantity for the second mode, at the same wave-vectors ð0:25,0:35,0:50,0:628 mm�1Þ. It can be observedthat two decays (associated to wave-vector magnitude 0:50,0:628 mm�1) are analogue to those of the first mode, while theother two seem to reach a plateau value. This is associated to the fact that while the frequency associated to the two
Fig. 9. The simulated displacement fields associated with the four Bloch E-SAW modes present in the PS and corresponding to the band edge wave-
vector. In the figures, the vectorial displacements plotted by arrows and total displacement field in colour scale are reported: black is for maximum
displacement and white for zero motion (on the on-line colour figures they are red and blue, respectively). Plot (a) is relative to first mode (i.e. lower
frequency). Plot (b), (c) and (d) are those of second, third and fourth mode respectively. (For interpretation of the references to colour in this figure
legend, the reader is referred to the web version of this article.)

Fig. 10. Total displacement, b, as a function of depth in the material, y, for the four modes present at the band edge, q¼ 0:628 mm�1, calculated according
to Eq. (1). The first (continuous line) and the second (dashed line) modes show a typical SAW decay profile. The third mode (dotted line) display a decay
of leaky-like SAW, as well the fourth mode (dashed-dot line).
Fig. 11. The total displacement decay, b, as a function of depth in the material, y, calculated according to Eq. (1) for the first (top) and second (bottom) modes at
four different wave-vectors: q¼ 0:25 mm�1 (continuous line), q¼ 0:35 mm�1 (dashed line), q¼ 0:50 mm�1 (dotted line), q¼ 0:628 mm�1 (dashed-dot line).
I. Malfanti et al. / J. Mech. Phys. Solids 59 (2011) 2370–2381 2379
highest wave vector is under the cut-off and consequently the decay is analogue to that of the first mode, the two lowervectors are associated to frequencies above the cut-off and consequently they became leaky and there is motion associatedto the presence of the wave also in depth.
The fourth mode is clearly wave-vector independent as testified by its flat dispersion and its decay, shown in Fig. 10,and it is much shorter than that of both leaky-SAW and SAW. Still its displacement involves also the substrate, as it can beobserved both from Fig. 10 and its displacement field, reported in the plot (d) of Fig. 9. This mode, to our opinion, is strictlycorrelated to the eigen-mode of vibration of a single relief of the superficial square-wave structure. In fact, we performed asimulation of a single square-wave relief obtaining an eigen-value very close to the fourth mode frequency. Neverthelessthis eigen-mode then slightly varies its frequency and its displacement field when the simulation is realized over theentire sample, resulting as an eigen-mode of the whole structure.
5. Conclusions
In this work we have extensively characterized both from an experimental and numerical point of view the dispersionrelation of a flat and a phononic surface realized by a thin metal film on bulk amorphous silica. We have shown that
I. Malfanti et al. / J. Mech. Phys. Solids 59 (2011) 2370–23812380
periodically micro-patterning of the surface strongly alters the propagation of surface acoustic waves, in comparison to theflat surface, generating a complex band structures with articulated dispersion phenomena. In particular, two new acousticmodes of high frequency and two frequency gaps have been observed. The experimental results have been consolidated bycomparison with numerical results obtained by a finite element analysis. These simulations allow to compare themeasured band diagram with the calculated one but also to get deep insight in the nature of the waves: the polarizationstate and surface character of the observed waves have been discussed and compared to experimental results.
A comparison with the previously reported TRG experiments is worthwhile (Dhar and Rogers, 2000; Maznev, 2008;Maznev and Wright, 2009). Our sample is similar to that investigated in Dhar and Rogers (2000), but in this experimentalinvestigation the third and fourth modes were not detected and the second mode became not observable above the cut-offfrequency, fixed by the transverse bulk velocity of the substrate. Probably, this is due to the lower signal-to-noise ratio ofthe homodyne detection, that did not enable the showing of leaky waves. Nevertheless the partial band diagram measuredin Dhar and Rogers (2000) is in good agreement with our results. The papers by Maznev (2008) and Maznev and Wright(2009) studied a sample with some similarities (e.g. 1D symmetry, square-wave relief and micro-metric step and depthlengths) and few substantial differences (e.g. materials composing the phononic and bulk structures) if compared with thesample here investigated. These samples are structurally more complex so that the experimental investigations and thecharacterizations of the SAW could be affected by uncontrolled sample features. Nevertheless, the band diagrams showsome strong similarities as the clear bending of the two lower frequency modes and a high frequency almostq-independent mode (this particularly true for the sample investigated in Maznev, 2008, whereas in the sampleinvestigated in Maznev and Wright, 2009 the high frequency mode shows a q-dependence). These HD-TRG studies donot report the intermediate mode, the third one in our band diagram of Fig. 9, even if their data of Fig. 3 of Maznev (2008)suggest the presence of this mode. In these works the authors attempt to relate the measured band diagram to a possiblegeneral theoretical framework based on the principle of hybridization of the acoustic normal modes, taking place if theirenergy/frequency get close (Giovannini et al., 1992). In our band diagram such a theoretical scheme does not seem toapply. According to our results the third mode could be addressed simply to the bending induced by the phononicstructure on higher Sezawa mode. This mode could be non-allowed in the FS because it would lie over the longitudinalbulk velocity limit, see Fig. 4, but it would become possible in PS at high wave-vectors due the bending phenomena thatpushes its phase velocity below the longitudinal bulk velocity, see Fig. 6.
This experimental and numerical study shows the complex nature of the SAW propagation on PS that results to havearticulated frequency, polarization and confinement phenomena. Such peculiarity becomes more intriguing at the BZ bandedge. In our opinion, these experimental results show some interesting news that are asking for a careful comparison withthe present theoretical understanding of the elastic waves propagation in phononic surfaces. The main features of threelower frequency Bloch modes, measured in this experimental investigation, can fit into the general predictions of thetheoretical models (Auld et al., 1976; Glass et al., 1981; Glass and Maradudin, 1983; Giovannini et al., 1992). Nevertheless,a specific calculation of the band diagram for our sample structure (surface grating with thin-film metal coating) would benecessary in order to complete the comparison. In particular, it would be interesting to know which folding andhybridization phenomena the theories predict for our sample, as well if they predict the existence of a q-independent highfrequency Bloch mode.
Acknowledgments
This research has been performed at European Laboratory for Non-Linear Spectroscopy (LENS) and supported with ECGrant N. RII3-CT-2003-506350. Matteo Mannini, from LAboratory for Molecular Magnetism (LA.M.M.), Dipartimento diChimica Univ. di Firenze, performed the film deposition: many thanks for helpfulness and great accuracy. Gratitude goes toMichele De Regis, a new student in our group, for the help in collecting group velocities data. Finally we would like toacknowledge the people from CE.M.E. at Consiglio Nazionale delle Ricerche (CNR) for the scanning electron microscopeimages.
References
Antonelli, G.A., Maris, H.J., Malhotra, S.G., Harper, J.M.E., 2002. J. Appl. Phys. 91, 3261.Auld, B.A., 1973. Acoustic Fields and Waves in Solids. Wiley, New York.Auld, B.A., Gagnepain, J.J., Tan, M., 1976. IEEE Trans. Ultras. Ferroelect. Freq. Control 45, 935.Bonello, B., Belliard, L., Pierre, J., Vasseur, J.O., Perrin, B., Boyko, O., 2010. Phys. Rev. B 82, 104109.Comsol Multiphysics, version 4.0, Material Library.Cucini, R., Taschin, A., Bartolini, P., Torre, R., 2010. J. Mech. Phys. Solids 58, 1302.Cummer, S.A., Schurig, D., 2007. New J. Phys. 9, 45.da Cunha, M.P., Adler, E.L., 1995. IEEE Trans. Ultras. Ferroelec. Freq. Control.Dhar, L., Rogers, J.A., 2000. Appl. Phys. Lett. 77, 1402.Duggal, A.R., Rogers, J.A., Nelson, K.A., 1992. J. Appl. Phys. 72, 2823.Duhring, M.B., Laude, V., Khelif, A., 2009. J. Appl. Phys. 105, 093504.Farnell, G.W., 1978. Types and properties of surface waves. In: Acoustic surface wavesSpringer-Verlag, Berlin, Heidelberg, New York.Feng, L., Liu, X.-P., Lu, M.-H., Chen, Y.-B., Chen, Y.-F., Mao, Y.-W., Zi, J., Zhu, Y.-Y., Zhu, S.-N., Ming, N.-B., 2006. Phys. Rev. Lett. 96, 014301.Fishman, I.M., Marshall, C.D., Meth, J.S., Fayer, M.D., 1991. J. Opt. Soc. Am. B 8, 1880.
I. Malfanti et al. / J. Mech. Phys. Solids 59 (2011) 2370–2381 2381
Giovannini, L., Nizzoli, F., Marvin, A.M., 1992. Phys. Rev. Lett. 69, 1572.Glass, N.E., Maradudin, A.A., 1983. J. Appl. Phys. 54, 796.Glass, N.E., Loudon, R., Maradudin, A.A., 1981. Phys. Rev. B 24, 6843.Gulyaev, Y., 1998. IEEE Trans. Ultras. Ferroelect. Freq. Control 45, 935.Hess, P., 2002. Phys. Today March, 42.Kasinski, J.J., Gomez-Jahn, L., Leong, K.J., Gracewski, S.M., Miller, R.J.D., 1988. Opt. Lett. 13, 710.Khelif, A., Chouujaa, A., Benchabane, S., Djafari-Rouhani, B., Laude, V., 2004. Appl. Phys. Lett. 84, 4400.Kushwaha, M.S., Halevi, P., Martınez, G., Dobrzynski, L., Djafari-Rouhani, B., 1994. Phys. Rev. B 49, 2313.Landau, L.D., Lifshitz, E.M., 1959. Course of Theoretical Physics. Theory of Elasticity, vol. 7. Pergamon Press, London.Laude, V., Robert, L., Daniau, W., Khelif, A., Ballandras, S., 2006. Appl. Phys. Lett. 89, 083515.Lee, S., Giovannini, L., Dutcher, J.R., Nizzoli, F., Stegeman, G.I., Marvin, A.M., Wang, Z., Ross, J.D., Amoddeo, A., Caputi, L.S., 1994. Phys. Rev. B 49, 2273.Lu, M.-H., Feng, L., Chen, Y.-F., 2009. Mater. Today 12, 34.Maznev, A.A., 2008. Phys. Rev. B 78, 155323.Maznev, A.A., Wright, O.B., 2009. J. Appl. Phys. 105, 123530.Nardi, D., Banfi, F., Giannetti, C., Revaz, B., Ferrini, G., Parmigiani, F., 2009. Phys. Rev. B 80, 104119.Oliner, A.A. (Ed.), 1978. Surface Acoustic WavesSpringer-Verlag, Berlin.Olsson III, R.H., El-Kady, I., 2009. Meas. Sci. Technol. 20, 012002.Profunnser, D.M., Wright, O.B., Matsuda, O., 2006. Phys. Rev. Lett. 97, 055502.Rayleigh, J.W.S., 1885. Proc. London Math. Soc. 17, 4.Rayleigh, J.W.S., 1888. Philos. Mag. 26, 256.Rogers, J.A., Maznev, A.A., Banet, M.J., Nelson, K.A., 2000. Annu. Rev. Mater. Sci. 30, 117.Sawada, T., Harata, A., 1995. Appl. Phys. A 61, 263.Taschin, A., Bartolini, P., Eramo, R., Torre, R., 2006. Phys. Rev. E 74, 031502.Taschin, A., Eramo, R., Bartolini, P., Torre, R., 2008. Transient grating experiments in glass-former liquids. In: Time-resolved Spectroscopy of Complex
LiquidsSpringer, New York, pp. 129.Thomsen, C., Grahn, H.T., Maris, H.J., Tauc, J., 1986. Phys. Rev. B 34, 4129.Torre, R., Taschin, A., Sampoli, M., 2001. Phys. Rev. E 64, 061504.Victorov, I.A., 1981. Surface Acoustic Waves in Solids. Nauka, Moscow.Yang, S., Page, J.H., Liu, Z., Cowan, M.L., Chan, C.T., Sheng, P., 2004. Phys. Rev. Lett. 93, 024301.Zhang, X., Jackson, T., Lafond, E., Deymier, P., Vasseur, J., 2006. Appl. Phys. Lett. 88, 041911.Zhang, S., Yin, L., Fang, N., 2009. Phys. Rev. Lett. 102, 194301.
Copyright © 2022 FDOKUMEN