Critical temperatures in the cephalopod Sepia officinalis investigated using in vivo 31P NMR...
16
891 Introduction An oxygen limitation of thermal tolerance was proposed to be a unifying principle in ectothermic water-breathing animals (Pörtner, 2001; Pörtner, 2002a) and has been supported by the studies on several invertebrates [Arenicola marina (Sommer et al., 1997), Maja squinado (Frederich and Pörtner, 2000), Sipunculus nudus (Zielinski and Pörtner, 1996), Littorina littorea (Sokolova and Pörtner, 2003), Laternula·elliptica (Peck et al., 2002) and the fish species Rutilus rutilus (Cocking, 1959), Pachycara brachycephalum (Mark et al., 2002) and Gadus morhua (Sartoris et al., 2003; Lannig et al., 2004)]. According to this hypothesis, ectothermic animals subjected to acute temperature change first experience a loss in aerobic scope and, second, oxygen deficiency beyond low and high critical temperature thresholds (T c ), ultimately leading to a transition to an anaerobic mode of energy production and time- limited survival. It was further proposed that oxygen limitation mechanisms first set in at high levels of organismal complexity, namely the integrated function of the major convection systems of the oxygen delivery apparatus. Accordingly, previous studies have identified both ventilatory and circulatory (where present) systems in invertebrates to be limiting for oxygen transport during acute temperature change (Zielinski and Pörtner, 1996; Frederich and Pörtner, 2000), while circulatory insufficiency was suggested to be the first limiting process in fish species acutely subjected to high and low temperature extremes (Heath and Hughes, 1973; Mark et al., 2002; Lannig et al., 2004). The present study, working with the cuttlefish Sepia officinalis, will focus on an animal model that, although being an invertebrate, is characterised by several vertebrate-like features. Namely, sophisticated behaviours, a closed, high- The present study was designed to test the hypothesis of an oxygen limitation defining thermal tolerance in the European cuttlefish (Sepia officinalis). Mantle muscle organ metabolic status and pH i were monitored using in vivo 31 P NMR spectroscopy, while mantle muscle performance was determined by recording mantle cavity pressure oscillations during ventilation and spontaneous exercise. Under control conditions (15°C), changes in muscle phospho-L-arginine (PLA) and inorganic phosphate (P i ) levels could be linearly related to frequently occurring, high-pressure mantle contractions with pressure amplitudes (MMPA) of >0.2·kPa. Accordingly, mainly MMPA of >2·kPa affected muscle PLA reserves, indicating that contractions with MMPA of <2·kPa only involve the thin layers of aerobic circular mantle musculature. On average, no more than 20% of muscle PLA was depleted during spontaneous exercise under control conditions. Subjecting animals to acute thermal change at an average rate of 1·deg.·h –1 led to significant P i accumulation (equivalent to PLA breakdown) and decrements in the free energy of ATP hydrolysis (dG/d) at both ends of the temperature window, starting at mean critical temperatures (T c ) of 7.0 and 26.8°C, respectively. Frequent groups of high-pressure mantle contractions could not (in the warm) or only partially (in the cold) be related to net PLA breakdown in mantle muscle, indicating an oxygen limitation of routine metabolism rather than exercise-related phosphagen use. We hypothesize that it is mainly the constantly working radial mantle muscles that become progressively devoid of oxygen. Estimates of very low dG/d values (–44·kJ·mol –1 ) in this compartment, along with correlated stagnating ventilation pressures in the warm, support this hypothesis. In conclusion, we found evidence for an oxygen limitation of thermal tolerance in the cuttlefish Sepia officinalis, as indicated by a progressive transition of routine mantle metabolism to an anaerobic mode of energy production. Key words: anaerobic metabolism, ventilation, exercise, Cephalopoda, Mollusca, mantle muscle, mantle cavity pressure. Summary The Journal of Experimental Biology 209, 891-906 Published by The Company of Biologists 2006 doi:10.1242/jeb.02054 Critical temperatures in the cephalopod Sepia officinalis investigated using in vivo 31 P NMR spectroscopy Frank Melzner*, Christian Bock and Hans-O. Pörtner Alfred-Wegener-Institute for Marine and Polar Research, Am Handelshafen 12, 27570 Bremerhaven, Germany *Author for correspondence (e-mail: [email protected]) Accepted 20 December 2005 THE JOURNAL OF EXPERIMENTAL BIOLOGY
-
Upload
independent -
Category
Documents
-
view
0 -
download
0
Transcript of Critical temperatures in the cephalopod Sepia officinalis investigated using in vivo 31P NMR...

891
IntroductionAn oxygen limitation of thermal tolerance was proposed to
be a unifying principle in ectothermic water-breathing animals(Pörtner, 2001; Pörtner, 2002a) and has been supported by thestudies on several invertebrates [Arenicola marina (Sommer etal., 1997), Maja squinado (Frederich and Pörtner, 2000),Sipunculus nudus (Zielinski and Pörtner, 1996), Littorinalittorea (Sokolova and Pörtner, 2003), Laternula·elliptica(Peck et al., 2002) and the fish species Rutilus rutilus (Cocking,1959), Pachycara brachycephalum (Mark et al., 2002) andGadus morhua (Sartoris et al., 2003; Lannig et al., 2004)].According to this hypothesis, ectothermic animals subjected toacute temperature change first experience a loss in aerobicscope and, second, oxygen deficiency beyond low and highcritical temperature thresholds (Tc), ultimately leading to atransition to an anaerobic mode of energy production and time-
limited survival. It was further proposed that oxygen limitationmechanisms first set in at high levels of organismalcomplexity, namely the integrated function of the majorconvection systems of the oxygen delivery apparatus.
Accordingly, previous studies have identified bothventilatory and circulatory (where present) systems ininvertebrates to be limiting for oxygen transport during acutetemperature change (Zielinski and Pörtner, 1996; Frederichand Pörtner, 2000), while circulatory insufficiency wassuggested to be the first limiting process in fish species acutelysubjected to high and low temperature extremes (Heath andHughes, 1973; Mark et al., 2002; Lannig et al., 2004).
The present study, working with the cuttlefish Sepiaofficinalis, will focus on an animal model that, although beingan invertebrate, is characterised by several vertebrate-likefeatures. Namely, sophisticated behaviours, a closed, high-
The present study was designed to test the hypothesis ofan oxygen limitation defining thermal tolerance in theEuropean cuttlefish (Sepia officinalis). Mantle muscleorgan metabolic status and pHi were monitored using invivo 31P NMR spectroscopy, while mantle muscleperformance was determined by recording mantle cavitypressure oscillations during ventilation and spontaneousexercise.
Under control conditions (15°C), changes in musclephospho-L-arginine (PLA) and inorganic phosphate (Pi)levels could be linearly related to frequently occurring,high-pressure mantle contractions with pressureamplitudes (MMPA) of >0.2·kPa. Accordingly, mainlyMMPA of >2·kPa affected muscle PLA reserves,indicating that contractions with MMPA of <2·kPa onlyinvolve the thin layers of aerobic circular mantlemusculature. On average, no more than 20% of musclePLA was depleted during spontaneous exercise undercontrol conditions.
Subjecting animals to acute thermal change at anaverage rate of 1·deg.·h–1 led to significant Pi accumulation
(equivalent to PLA breakdown) and decrements in thefree energy of ATP hydrolysis (dG/d��) at both ends of thetemperature window, starting at mean criticaltemperatures (Tc) of 7.0 and 26.8°C, respectively.Frequent groups of high-pressure mantle contractionscould not (in the warm) or only partially (in the cold) berelated to net PLA breakdown in mantle muscle,indicating an oxygen limitation of routine metabolismrather than exercise-related phosphagen use. Wehypothesize that it is mainly the constantly working radialmantle muscles that become progressively devoid ofoxygen. Estimates of very low dG/d�� values (–44·kJ·mol–1)in this compartment, along with correlated stagnatingventilation pressures in the warm, support this hypothesis.In conclusion, we found evidence for an oxygen limitationof thermal tolerance in the cuttlefish Sepia officinalis, asindicated by a progressive transition of routine mantlemetabolism to an anaerobic mode of energy production.
Key words: anaerobic metabolism, ventilation, exercise,Cephalopoda, Mollusca, mantle muscle, mantle cavity pressure.
Summary
The Journal of Experimental Biology 209, 891-906Published by The Company of Biologists 2006doi:10.1242/jeb.02054
Critical temperatures in the cephalopod Sepia officinalis investigated usingin vivo 31P NMR spectroscopy
Frank Melzner*, Christian Bock and Hans-O. PörtnerAlfred-Wegener-Institute for Marine and Polar Research, Am Handelshafen 12,
27570 Bremerhaven, Germany*Author for correspondence (e-mail: [email protected])
Accepted 20 December 2005
THE JOURNAL OF EXPERIMENTAL BIOLOGY
892
pressure blood convection system with low blood volume anda highly efficient counter-current gill gas exchange systemsimilar to that of fish (Wells and Wells, 1982; Wells and Wells,1991). These features make the cuttlefish an ideal candidate totest the proposed universal character of thermal tolerancelimitation mechanisms (Pörtner, 2002a).
An obvious first step is the evaluation of whether or notcuttlefish will display oxygen-limited thermal tolerance uponacute exposure to low and high temperature extremes, asevidenced by transition to an anaerobic mode of energyproduction at rest. Advent of mitochondrial anaerobiosis inhighly aerobic liver tissue determined high Tc in fish(Pachycara brachycephalum and Zoarces viviparus), whilethe onset of anaerobic metabolism in white muscle onlyoccurred shortly before death (van Dijk et al., 1999). Choiceof tissues therefore seems to be crucial when investigatingTcs. Continuously working, aerobic organs with apermanently high oxygen demand are the first to sufferfrom oxygen deficiency and functional failure. Accordingly,we decided to monitor cephalopod mantle muscle energystatus.
Cephalopod mantle tissue is permanently active and isinvolved in ventilatory work but also in jet-propelledlocomotion: as a result, the mantle muscle evolved as acomplex organ that contains thin outer layers of aerobiccircular muscles, which aid during slow swimmingcontractions, and thick layers of anaerobic muscle fibres in thecentral part of the mantle muscle organ, which produce thehigh-pressure amplitude contractions during fast swimming(Bone et al., 1994a; Bone et al., 1994b; Bartol, 2001). Theinner and outer layers of circular fibres possess high densitiesof mitochondria (Bone et al., 1981; Mommsen et al., 1981),leading to enhanced baseline oxygen demand. Approximately30% of the mantle volume consists of radial muscle fibres thathave a key role in ventilation (Milligan et al., 1997). Bycontracting, these radial muscle fibres decrease mantle muscleorgan diameter to aid in refilling the mantle cavity with freshseawater during each ventilation cycle. Funnel collar flapmovements in combination with a passive relaxation of radialfibres aid during exhalation of the respiratory water.Contractions of circular muscle fibres are not involved inexhalation (Bone et al., 1994a).
Due to their permanent workload, muscle tissues active inventilation are probably a good indicator tissue for thedetermination of Tcs. Other organs/tissues that are less vitalduring short-term stresses (i.e. digestive system, reproductivesystem) may even be temporarily shut down while essentialfuels (nutrients, oxygen) are reallocated towards the organsthat are maintained in continuous operation. Examples for suchselective energy allocation towards certain organs andmetabolic depression within other organs/tissues during acuteenvironmental stressors are manifold in the animal kingdom[e.g. the mammalian diving response (Hochachka, 2000)associated with cellular metabolic depression (e.g. Buck et al.,1993)]. If, during thermal stress, anaerobic metabolism isneeded to fuel ventilatory muscle contractions, obviously time-
limited survival has set in and critical temperatures are beingreached.
Using in vivo 31P NMR spectroscopy, we had a techniqueavailable to continuously monitor concentrations of mantlemuscle intracellular high-energy phosphate compounds andintracellular pH (pHi) in unrestrained animals. Net utilizationof the phosphagen (phospho-L-arginine, PLA) to fuel musclecontractions is a sign of the start of anaerobiosis in molluscs.We could simultaneously monitor in vivo performance of thevery muscle fibres observed with the NMR setup by recordingmantle cavity pressure oscillations. Such pressure oscillationsin the mantle cavity are a consequence of rhythmic action ofthe mantle muscle organ’s ventilatory and locomotory muscles(Bone et al., 1994a; Bone et al., 1994b).
The complexity of mantle muscle structure and thecomplexity of various ventilatory and locomotory functionsmay be confounding factors in the analysis. It was thusnecessary to first learn more about the various mantle cavitypressure patterns present and their influence on muscle tissueenergy status under control conditions, to later use the acquiredknowledge to distinguish between (putative) effects of high-pressure mantle contractions related to spontaneous exerciseand those of ventilatory pressure cycles on tissue energy statusat thermal extremes.
We hypothesized that at both high and low temperatures,mantle muscle metabolism would need to switch to anaerobicmetabolism during resting conditions to sustain ventilatoryactivity. This report therefore concentrates on muscle energystatus and the effects of ventilatory activity on mantlemetabolism. It will, at the same time, address the possiblyinterfering effects of spontaneous, exercise-related high-pressure circular muscle contractions on muscle energystatus. In a companion study (F.M., C.B. and H.-O.P.,manuscript submitted for publication), we analyse how thepressure patterns generated during resting ventilation relateto oxygen extraction from the ventilatory stream, metabolicrate and the costs of ventilatory movements.
Materials and methodsAnimals
European cuttlefish (Sepia officinalis L.) used in the presentstudy were grown from egg clusters trawled in the Bay of Seine(France) in May 2002. The animals were raised in a closed re-circulated aquaculture system (20m3 total volume, proteinskimmers, nitrification filters, UV-disinfection units) at theAlfred–Wegener–Institute on a diet of mysids (Neomysisinteger) and brown shrimp (Crangon crangon) under aconstant dark:light cycle (12·h:12·h) and constant temperatureregime (15±0.1°C). Water quality parameters were monitoredthree times per week. Concentrations of ammonia and nitritewere kept below 0.2·mg·l–1, and nitrate concentrations below80·mg·l–1. Salinity was maintained between 32 and 35‰, andwater pH between 8.0 and 8.2. All animals were raised in thesame 3·m3 volume tank. Five animals (104.2±7.4·g wet mass,mean ± s.d.) were used for experimentation.
F. Melzner, C. Bock and H.-O. Pörtner
THE JOURNAL OF EXPERIMENTAL BIOLOGY
893Critical temperatures in cuttlefish
Experimental protocol
Experimental animals were starved for 24·h and thentransferred to the experimental set-up. Surgery was conductedon the first day, followed by an overnight acclimatizationperiod within the experimental chamber (control 1). In vivo 31PNMR spectra showed that anaesthesia during surgery resultedin a transient accumulation of inorganic phosphate (Pi), whichcould be fully reversed within 4–6·h of recovery under controlconditions. On the second day, animals were cooled fromcontrol temperature (15°C) to a lower critical temperature, thenwarmed to and kept at control temperature overnight (control2), after which they were finally warmed until an upper criticaltemperature was reached on the third day. Temperature waschanged in a stepwise procedure at an average rate of1·deg.·h–1. Specifically, a 3°C temperature change wasaccomplished during the first hour of a 3·h period, whiletemperature was kept constant for in vivo 31P NMRspectroscopy and mantle cavity pressure measurements duringthe two subsequent hours. Assay temperatures were14°C/11°C/8°C on the second day, and 17°C/20°C/23°C/26°Con the third experimental day. Temperatures were changedfurther at a rate of 1·deg.·h–1 if critical temperatures were notreached within the outlined temperature window. As theaccumulation of Pi due to phosphagen utilization indicateslimited energy production by aerobic metabolism, theappearance of significant Pi peaks in in vivo 31P NMR spectraand their persistence over an extended time period (>60·min)defined critical temperatures.
In vivo 31P NMR spectroscopy and mantle pressureoscillations
To implant a catheter for ventilatory monitoring, animalswere anaesthetized with a 0.4·mol·l–1 MgCl2 solution that wasmixed 1:1 with seawater (Messenger, 1985) at 15°C for3–3.5·min, then placed (ventral side up) on a wet leather clothto prevent skin injuries. During surgery, animals were perfusedwith aerated seawater (with 0.04·mol·l–1 MgCl2) through thefunnel aperture. A PE cannula, required to record postbranchialpressure, was connected to a 23-gauge hypodermic needle, ledthrough the entire mantle cavity and then fed through theposterior ventro-lateral section of the mantle muscle. Cannulae(Portex PE tubing, i.d. 0.58·mm, o.d. 0.96·mm, flared at theopening) were held in place by two 4·mm-diameter plasticwashers on the inside and outside, embracing the mantlemuscle in a sandwich-like fashion. PE tubes were connected toMLT-0699 disposable pressure transducers, signals wereamplified with a ML-110 bridge amplifier and were further fedinto a PowerLab/8SP data acquisition system (AD InstrumentsGmbH, Spechbach, Germany). Pressure transducers werecalibrated daily.
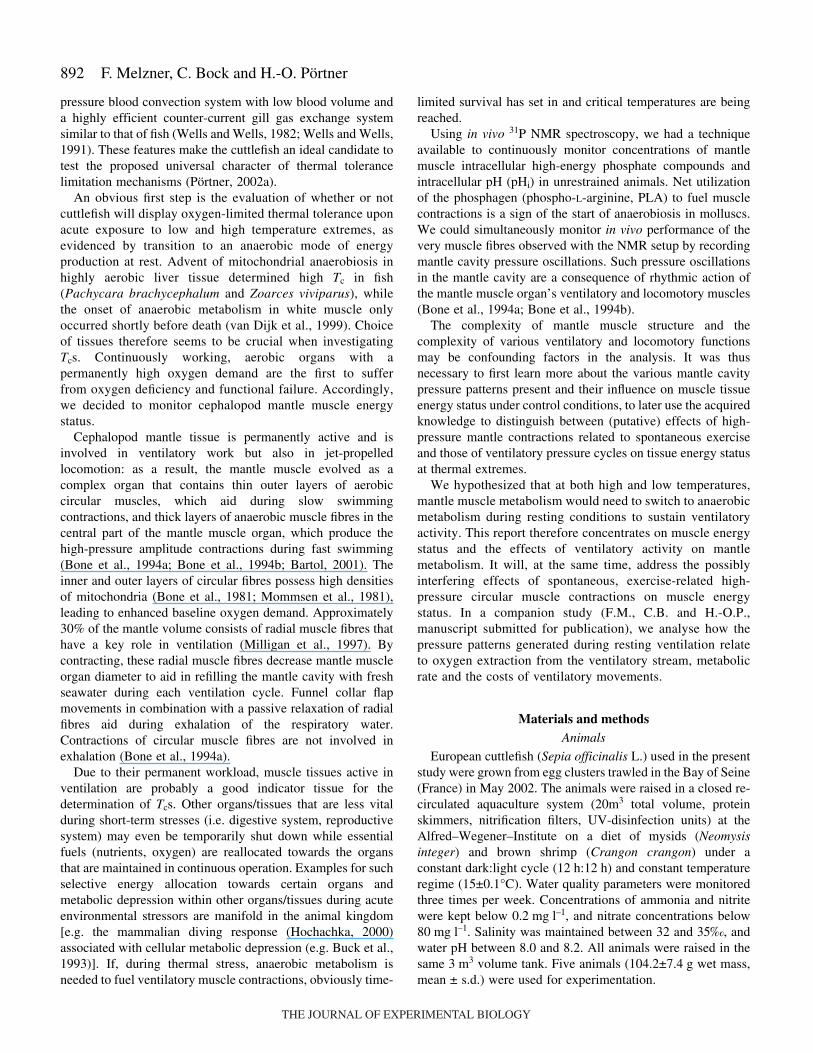
Following surgery, animals were placed in a Perspexperfusion chamber analogous to the one used by Mark et al.(Mark et al., 2002) for eelpout (Fig.·1A). Plastic sliders withinthe chamber could be adjusted to the animals’ dimensions andused to restrict the space available for roaming activity. Thechamber was connected to a closed recirculation seawater
system and placed within the magnet as described by Bock etal. (Bock et al., 2002). Water quality was maintained with aprotein skimmer (Aqua Care, Herten, Germany) and anitrification filter (Eheim Professional 2; Eheim, Deizisau,Germany). Water quality was monitored daily, and parameterswere kept within the limits indicated above.
In vivo 31P NMR spectroscopy experiments were conductedin a 47/40 Bruker Biospec DBX system with a 40·cmhorizontal wide bore and actively shielded gradient coils(50·mT·m–1). A 5·cm 1H/31P/13C surface coil was used forexcitation and signal reception. The coil was placed directlyunder the animal chamber in such a manner as to gainmaximum signal from the posterior mantle muscle section(Fig.·1B). A calculated 80–90% of sensitive coil volume wasfilled by mantle muscle tissue and ~10–20% by tissues fromthe organ sac and coelomic fluid. As Sepia officinalis mantlemuscle tissue is characterized by high phosphagen (PLA)concentration [~34·�mol·g–1 wet mass (Storey and Storey,1979)], it is quite likely that the in vivo 31P NMR spectra almostexclusively represent the adenylate pool and pHi of the mantlemusculature.
In vivo 31P NMR spectra [sweep width, 5000·Hz; flip angle,45° (pulse shape bp 32; pulse length 200·�s); repetition time(TR), 1·s; scans, 256; duration, 3·min 40·s] were acquiredevery 21.3·min to measure pHi, and changes in pHi wererepresented by the position of the Pi signal relative to theposition of the PLA signal. pHi was calculated using the PLAvs Pi shift equation obtained by Doumen and Ellington(Doumen and Ellington, 1992), using a pKa value determinedby Pörtner (Pörtner, 1990) for an ionic strength of I=0.16. pKa
values were adjusted according to temperature (Kost, 1990).31P NMR spectra were processed automatically using TopSpinV1.0 software (BrukerBioSpin MRI GmbH, Ettlingen,Germany) and a macro (written by R.-M. Wittig, AWI) tofinally yield integrals of all major peaks within the spectrum(Bock et al., 2001), as these correlate with the amount ofsubstance within the detection volume (= sensitive volume) ofthe 31P NMR coil (Fig.·1B). Flow-weighted images to examineblood flow in major blood vessels were also generated directlybefore and after the collection of 31P NMR spectra but will betreated separately. Concentrations of metabolites (ATP, PLA,Pi) were expressed as percentages of the total 31P signalintensities. This was found necessary, as animals were free tomove to some extent in the chamber both vertically andhorizontally (for a maximum of 5·mm in either direction, toassure unrestrained ventilatory movements), thus alteringoverall in vivo 31P NMR signal intensities:
[Met] = {[Met] ([PLA] + [�-ATP] + [�-ATP] + [�-ATP] + [Pi])–1} 100·, (1)
where [Met] in % is the relative concentration of metabolite(ATP, PLA, Pi), and [PLA]+[�-ATP]+[�-ATP]+[�-ATP]+[Pi]is the sum of the five major 31P NMR peak integrals thatconstituted >98% of the overall 31P signal (see Fig·5A). As aprecondition for such an approach, it is necessary that no majorphosphate export from the mantle muscle takes place. Finke et
THE JOURNAL OF EXPERIMENTAL BIOLOGY

894
al. could demonstrate that the sum of adenylates and inorganicphosphate (ATP, ADP, AMP, PLA, Pi) in squid mantle muscle(Lolliguncula brevis) was similar in control and exercisedanimals, as was the sum of all arginine-containing metabolites[PLA, octopine (Oct), L-arginine (Arg)] (Finke et al., 1996).Storey and Storey also found the sum of arginine-containingmetabolites to be relatively stable in cuttlefish mantle musclefollowing hypoxia and exhaustive exercise (decreases of lessthan 10%, minor releases of Oct in the bloodstream), but theydid not determine inorganic phosphate concentrations (Storeyand Storey, 1979). Still, both studies suggest that anaerobicmetabolites mostly remain in the mantle muscle organ incephalopods, thus giving validity to our approach. For bettervisualisation, percentages of concentrations were transformed
into molar quantities, assigning [PLA] control values found incuttlefish mantle muscle (Storey and Storey, 1979)([PLA]=33.6·�mol·g–1 wet mass) to [PLA] controls in ourstudy (see Table·1) and evaluating the other metaboliteconcentrations accordingly. Free energy change of ATPhydrolysis (dG/d�, kJ·mol–1) was estimated from NMR visiblemetabolites as described by Pörtner et al. (Pörtner et al., 1996),with apparent equilibrium constants of arginine kinase andmyokinase adjusted to changing temperatures. The identity ofenthalpies of the arginine and creatine kinase reactions wasconfirmed by the analysis of the temperature-dependentequilibrium constant of arginine kinase under cellularconditions simulated according to Pörtner et al. (Pörtner, 1990;Pörtner et al., 1990). This analysis yielded a standard apparententhalpy value (�H at pH 7.0 and 1·mmol·l–1 free Mg2+) forKappAK of –11.87·kJ·mol–1 (H.-O.P., unpublished data), whichis close to the one (–11.93·kJ·mol–1) determined by Teague andDobson for creatine kinase (Teague and Dobson, 1992).
Concentrations of Arg and Oct were estimated usingpublished values (Storey and Storey, 1979) and assuming thata decrease in 1·�mol·g–1 wet mass [PLA] results in aconcomitant 0.67·�mol·g–1 wet mass increase in [Arg] and a0.33·�mol·g–1 wet mass increase in [Oct] (Storey and Storey,1979) (as witnessed during moderate and severe hypoxia andduring exercise). Intracellular free [Mg2+] was estimated from31P NMR spectra as described by Doumen and Ellington(Doumen and Ellington, 1992).
Mantle cavity pressure analysis
Pressure oscillations in the cephalopod mantle cavity aregenerated to create both a ventilatory water stream past thegills (mainly by concerted action of the collar flap muscles ofthe funnel apparatus and radial mantle muscles) and a jetstream to elicit swimming and escape movements (mainly byaction of circular and radial mantle muscles). While the formeris associated with low-pressure amplitudes, the latter can causeamplitudes of up to 25·kPa (Wells and Wells, 1991).According to Bone et al., slow swimming in cuttlefish starts
F. Melzner, C. Bock and H.-O. Pörtner
Fig.·1. (A) Animal in chamber in front of the magnet, connected to aseawater perfusion system. Sliders restrict the space available to theanimal to a minimum. A grey box indicates the position of the 31Psurface coil below the animal’s thick ventral mantle muscle. Thepressure catheter (not visible) leaves the animal’s mantle cavity andpasses through the lid on the right towards a pressure transducer (seetext). (B) Schematic illustration of the surface coil and its sensitivevolume (grey semi-circle). Metabolite changes within radial andcircular muscles of the mantle muscle organ can be recorded. Circularmuscle consists of a central bulk of anaerobic fibres and two thinlayers of outer, aerobic fibres. (C) Schematic illustration of intervalsdefined between the acquisition of successive in vivo NMR spectra.One complete 25·min interval is illustrated (n), which is divided into12 segments (s1n–s12n). For each segment, swimming jet (SJ)pressure amplitudes and frequencies were determined, allowing us tocalculate jet indices (JIs) for variable time intervals (by summing upsegment JI within intervals a to l; e.g. interval g consists of JIs fromsegments s6n–s12n). For further explanations, see text.
THE JOURNAL OF EXPERIMENTAL BIOLOGY

895Critical temperatures in cuttlefish
with pressure amplitudes of 0.1–1·kPa, while maximumventilation pressure amplitudes (at rest) are 0.15·kPa (Bone etal., 1994). For an analysis of the interfering influence ofspontaneous activity on temperature-dependent muscleenergetics, we set a pressure threshold of 0.2·kPa as the startingpoint for non-ventilation-related mantle pressure generation.All such pressure oscillations will be termed ‘swimming jets’(SJ) hereafter. For all five animals, frequencies of SJs of>0.2·kPa amplitude were analysed at all temperatures. Inaddition, mean mantle pressure amplitudes of these SJs(MMPASJ) were recorded (and grouped into 12 amplitudeclasses, i.e. 0.2–1·kPa, 1–2·kPa, […], 11–12·kPa).
3523 randomly chosen SJs from all temperatures andanimals were used to develop a relationship of SJ duration vsmeasurement temperature to calculate the fraction ofexperimental time spent with non-ventilation pressuregeneration. Also, the relationship of swimming jet amplitude(MMPASJ) vs swimming jet mean pressure (MMPSJ = meanpressure of SJ peaks) was determined to convert MMPASJ toMMPSJ at all temperatures. Routine ventilation pressures(MMProut) were analysed in similar ways. Thus, we couldcalculate total mean mantle pressure:
MMPtot = [(�t1 MMPSJ) + (�t2 MMProut)]/60·, (2)
where �t1 is the time interval (min·h–1) spent with swimmingjets, and �t2 is the time interval (min·h–1) spent with routineventilation.
Spontaneous exercise impacts on mantle metabolism
Mantle contractions associated with high-amplitude
pressure pulses were present at all temperatures. The majorchallenge in the present study was thus to distinguish betweenthe effects of spontaneous exercise and the effects of routineventilatory mantle muscle activity (related to ventilation only)on muscle metabolic status. An extensive base of control 31PNMR spectra at 15°C was available to investigate activitypatterns and patterns of metabolite change in the mantle organ.
First, consecutive in vivo 31P NMR spectra were analysedfor changes in [PLA] and [ATP] parallel to changes in [Pi]:
� [Met] = [Met]n+1 – [Met]n·, (3)
where � [Met] is the concentration change of a givenmetabolite, [Met]n+1 is the concentration of the givenmetabolite obtained with spectrum n+1, and [Met]n is theconcentration of metabolite obtained with spectrum n. Changesin pHi were calculated in a similar fashion. A total of 282intervals from all five animals was used for such comparisons.This was done to elaborate patterns of correlated concentrationchanges between the respective metabolites and pHi and toinvestigate the degree to which phosphagen resources arecommonly used under control conditions.
As a second step, an attempt was made to correlatemetabolic changes observed within the mantle muscle withnon-ventilatory muscle contractions (of pressure amplitudes>0.2·kPa). It is known from previous work that such mantlemuscle contractions are fuelled in part by phosphagenbreakdown, as aerobic metabolism cannot provide sufficientamounts of ATP to match demand at very high ATP fluxes(e.g. Pörtner et al., 1993; Finke et al., 1996). For this, in vivo31P NMR spectra were scanned for relative increases in [Pi]
Table 1. Control parameters (15°C) of cellular high-energy phosphates and pHi as determined using in vivo 31P NMRspectroscopy
Parameter Replicate 1 Replicate 2 Replicate 3 Replicate 4 Replicate 5 Mean
[Pi]max (�mol·g–1 wet mass) 5.27 5.72 5.46 11.65 5.25 6.66 (2.79)pHi lowest 7.31 7.28 7.39 7.31 7.34 7.32pHi highest 7.56 7.52 7.69 7.56 7.58 7.58pHi range 0.25 0.24 0.3 0.25 0.24 0.256 (0.025)[H+
i]range (nmol·l–1) 21.4 22.3 20.3 21.4 19.4 20.96 (1.12)
pHi mean 7.43 (0.05) 7.38 (0.06) 7.50 (0.06) 7.43 (0.07) 7.44 (0.06) 7.45 (0.07)Sig. P<0.05 3 3 1; 2; 4; 5 3 3
[H+i] (nmol·l–1) 37.2 (4.38) 42.4 (5.9) 31.5 (4.0) 37.2 (6.1) 35.9 (4.4) 36.1 (5.3)
Sig. P<0.05 3 3 1; 2; 4; 5 3 3
[PLA] (�mol·g–1 wet mass) 33.0 (0.6) 34.5 (0.8) 33.4 (0.6) 33.8 (0.9) 33.8 (0.9) 33.6 (0.6)Sig. P<0.05 2; 5 1; 3 2 1
[ATP] (�mol·g–1 wet mass) 7.3 (0.6) 8.6 (0.6) 7.9 (0.4) 8.2 (0.9) 8.1 (0.6) 8.0 (0.8)Sig. P<0.05 2; 4; 5 1 1 1
PLA/ATP 4.6 (0.4) 4.0 (0.4) 4.2 (0.2) 4.1 (0.5) 4.2 (0.4) 4.2 (0.4)Sig. P<0.05 4; 5 1 1
Statistical comparisons between animals using ANOVA and Student–Newman–Keuls post-hoc test. Significant differences between animalsmarked (e.g. sig. P<0.05=1 means that animal differs from animal 1). All results are means (s.d.). Replicates are individual animals. [Pi]max,maximum inorganic phosphate concentration observed; pHi lowest/highest, lowest/highest pHi values observed under control conditions; PLA,phospho-L-arginine; pHi, intracellular pH. [ATP] calculated from the �-ATP peak.
THE JOURNAL OF EXPERIMENTAL BIOLOGY
896
(which is equivalent to a net phosphagen breakdown). A totalof 30 intervals from all five animals was randomly selected,and all associated mantle contractions within each intervalwere analysed. To find a (putative) causal relationship betweenspontaneous exercise and metabolite changes in the mantleorgan, it was necessary to identify those suitable time intervalsand pressure amplitudes that actually have an effect on musclephosphagen stores. In an exercise study on squid (Illexillecebrosus), it could be demonstrated that mantle phosphagenlevels returned close to control levels within 10·min afterfatiguing exercise, where PLA had decreased by–22.5·�mol·g–1 wet mass from an initial concentration of>30·�mol·g–1 wet mass (Pörtner et al., 1993). Thus, in ourcase, a major spontaneous exercise event, occurring 20·minprior to 31P NMR spectrum acquisition, might not be reflectedin the latter due to a putative rapid recovery phase of PLAstores.
Consequently, intervals (21·min 20·s between theacquisition of two 31P NMR spectra plus the acquisition timeof the second spectrum; thus, a total of 25·min) were dividedinto 11 two-minute segments and one 3·min segment (s1–s12;see Fig.·1c). Both the frequency and amplitude of SJs greaterthan 0.2·kPa were determined for each segment. Pressureamplitudes were grouped into classes with the following classmeans: 0.6·kPa (=0.2–1·kPa), 1.5·kPa (=1–2·kPa) [...] up to11.5·kPa (=11–12·kPa) and a jet index (JI, in kPa·segment–1)obtained for each segment by adding the products of classamplitude means and jet numbers within the respectiveamplitude classes. For example, five jets between 2 and 3·kPaand three jets between 5 and 6·kPa within one segment yielda JI of (5�2.5)+(3�5.5)=29·kPa. 12 variables were created byadding JIs from segments within intervals ‘a’ to ‘l’ (seeFig.·1C). Furthermore, each of these variables was split up byvarying the pressure threshold used for JI calculation (only jets>0.2·kPa or >1·kPa or >2·kPa, [>…], or >11·kPa used forcalculations). Thus, for our example above, a JI calculatedfrom jets >3·kPa would result in 3�5.5=16.5·kPa. Thisvariation in duration of the interval and in the pressureamplitudes taken for JI calculation created a total of12�12=144 different variables that could be tested in aniterative linear regression analysis to explain a maximum ofthe variability observed in [Pi] changes as obtained bysuccessive in vivo 31P NMR spectra. In a similar fashion,maximum jet density (JD) of Sjs >0.2, >1 [>...], >11·kPa withinsegments of intervals a to l (Fig.·1C) was calculated (again,144 possible variables) as a second factor that might influence[Pi] changes in mantle muscle tissue. For example, JD was 15for jets >1·kPa if we considered interval d (see Fig.·1C), andthe density of jets >1·kPa (in jets 2·min–1) in segments s9, s10,s11 and s12 were 9, 12, 15 and 3.
Statistics
Simple linear, exponential and sigmoidal regressionanalyses were performed using SigmaPlot 8.0 (SSPS Inc.,Point Richmond, CA, USA). Multiple linear regressionanalysis was also performed using Statistica (Statsoft, Tulsa,
OK, USA), as were all other statistics. Comparisons betweenvalues grouped according to temperature or animal wereconducted using one-factorial analysis of variance (ANOVA)and subsequent post-hoc testing with Student–Newman–Keuls.t-tests were used to compare SJ frequencies obtained duringthe day with those obtained at night.
ResultsControl conditions
Mantle pressure
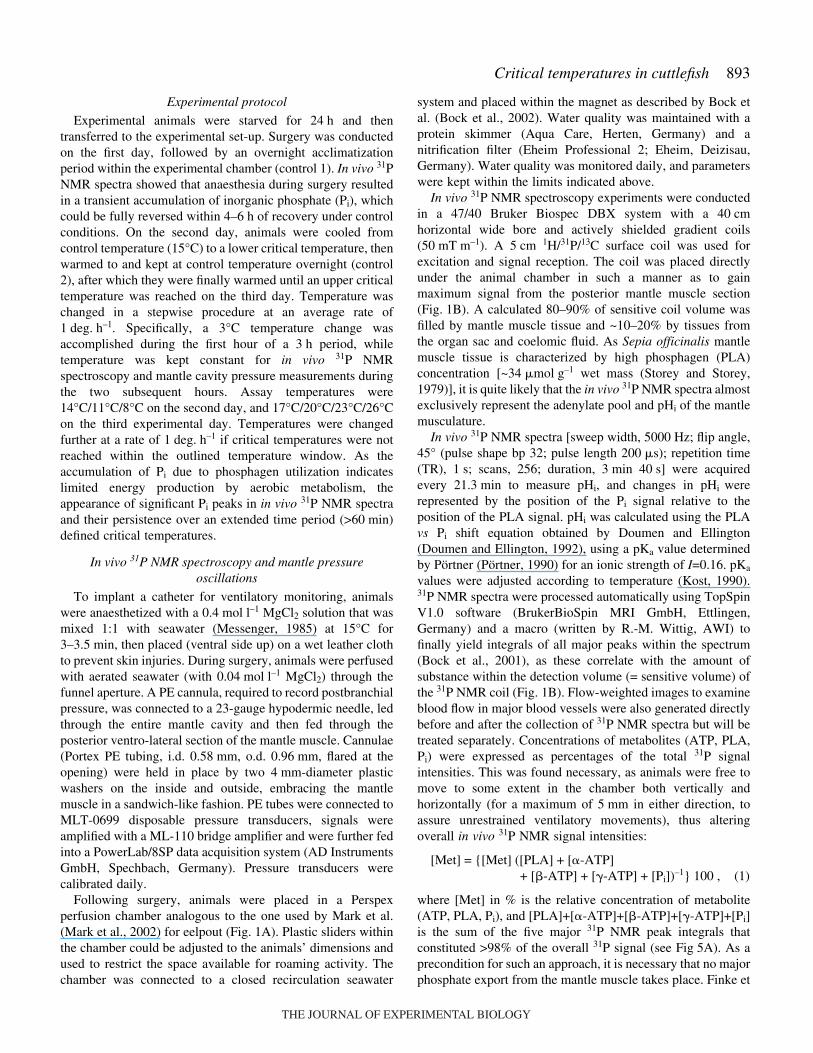
Typical ventilation pressure amplitudes in all experimentalanimals were lower than 0.1·kPa, typically occurring for57·min of each control hour. The remaining time was filledwith spontaneous high-pressure mantle contractions of>0.2·kPa. Occurrence of such SJs was observed in all animals,with pressure amplitudes distributed as shown in Fig.·2A. Itappeared that roughly 73% of all non-routine ventilationpressure cycles of >0.2·kPa were characterized by anamplitude lower than 2·kPa. Only 0.2% of all pressure cyclesof >0.2·kPa showed pressure amplitudes of 11–12·kPa.
The mean SJ pressure amplitude of all SJs >0.2·kPa wasfound to be 1.7·kPa. Frequencies of 108 (181) pressure cycles>0.2·kPa·h–1 during daily (nightly) control measurements wererecorded; these did not appear to be evenly distributed overtime but rather were found to occur in groups of 3–50 SJs. Asignificant difference in high-amplitude pressure cyclefrequency between night-time and daytime controlmeasurements was also evident, with more jets observed atnight (t=3.5, d.f.=4, P<0.03, N=5).
In vivo 31P NMR spectroscopy
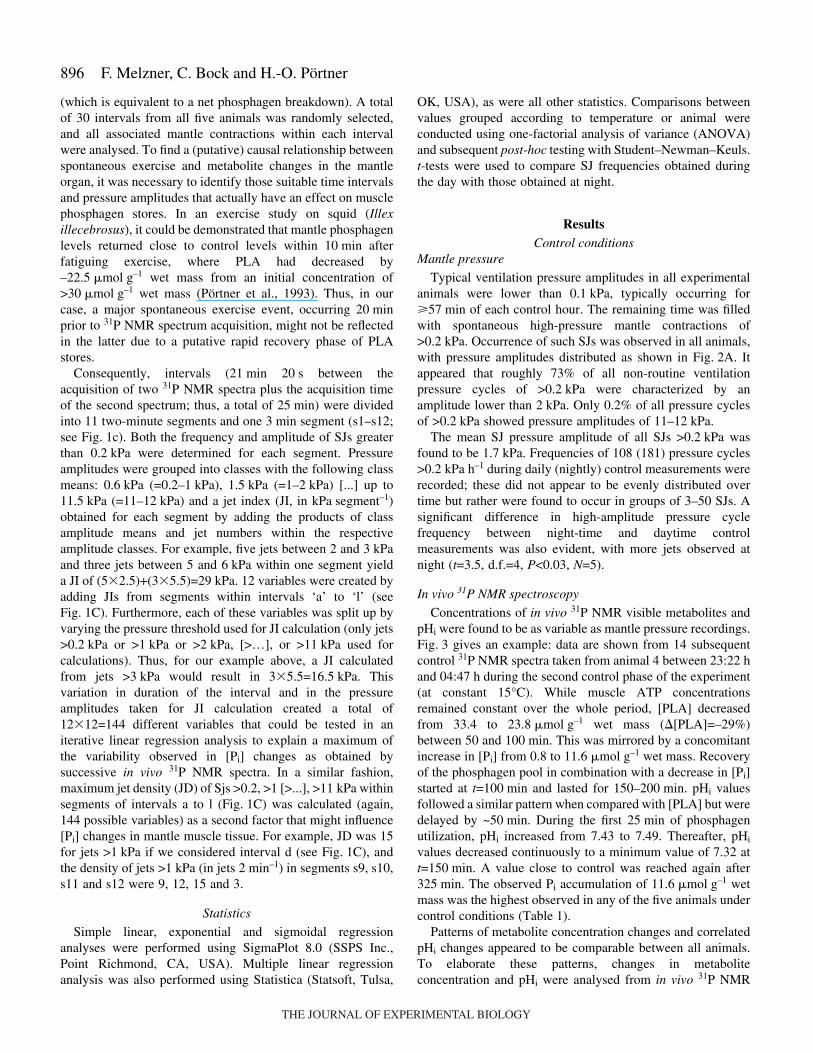
Concentrations of in vivo 31P NMR visible metabolites andpHi were found to be as variable as mantle pressure recordings.Fig.·3 gives an example: data are shown from 14 subsequentcontrol 31P NMR spectra taken from animal 4 between 23:22·hand 04:47·h during the second control phase of the experiment(at constant 15°C). While muscle ATP concentrationsremained constant over the whole period, [PLA] decreasedfrom 33.4 to 23.8·�mol·g–1 wet mass (�[PLA]=–29%)between 50 and 100·min. This was mirrored by a concomitantincrease in [Pi] from 0.8 to 11.6·�mol·g–1 wet mass. Recoveryof the phosphagen pool in combination with a decrease in [Pi]started at t=100·min and lasted for 150–200·min. pHi valuesfollowed a similar pattern when compared with [PLA] but weredelayed by ~50·min. During the first 25·min of phosphagenutilization, pHi increased from 7.43 to 7.49. Thereafter, pHi
values decreased continuously to a minimum value of 7.32 att=150·min. A value close to control was reached again after325·min. The observed Pi accumulation of 11.6·�mol·g–1 wetmass was the highest observed in any of the five animals undercontrol conditions (Table·1).
Patterns of metabolite concentration changes and correlatedpHi changes appeared to be comparable between all animals.To elaborate these patterns, changes in metaboliteconcentration and pHi were analysed from in vivo 31P NMR
F. Melzner, C. Bock and H.-O. Pörtner
THE JOURNAL OF EXPERIMENTAL BIOLOGY

897Critical temperatures in cuttlefish
spectra over time (Fig.·4). As would be expected from Fig.·3,�[PLA] changed linearly with �[Pi], with a negative slopeclose to one (Fig.·4B), while ATP concentrations remainedstable at ~7–9·�mol·g–1 wet mass (ANOVA, F7,272=1.83,P<0.07; Fig.·4D). pHi changed linearly with increasing �[Pi]between less than –3 and 3·�mol·g–1 wet mass (Fig.·4A) butdeviated significantly from this relationship once [Pi]accumulated above 3·�mol·g–1 wet mass. pHi fell back to 7.44(control pH was 7.45; see Table·1) at those higher inorganicphosphate accumulations. From 282 intervals analysed forFig.·4, only nine intervals (3%) were characterized by such ahigh increase in [Pi]. Correspondingly, intracellular �[H+]changed linearly in the respective range of �[Pi] values(Fig.·4C). Increases in [Pi] of >3·�mol·g–1 wet mass did notresult in a further proton buffering but rather led to a netincrease in [H+] by 3·nmol·l–1.
It seemed obvious that fluctuations observed in theconcentrations of high-energy phosphates and in pHi should berelated to the frequency of high-amplitude swimming jets. Ina first iterative step of univariate linear regression analysis, 36different jet index (JI) variables were identified that couldexplain significant fractions of variability in �[Pi]. Thesediffered in the length of the time interval as well as in thepressure threshold chosen for JI calculation. Twelve of theseare shown in Table·2. Intervals of 13–15·min for JI calculation(corresponding to intervals f and g in Fig.·1C) resulted inregressions with the highest r2. Omitting mantle pressure
8 11 14 17 20 23 26
MM
P (%
of
MM
P tot
al)
0102030405060708090
100
MMP M
MP r
out
SJs
>0.
2 kP
a h–1
–200
20406080
100120140160
MM
P SJ
MMPASJ (kPa)
% o
f SJ
s (M
MPA
>0.
2 kP
a)
0
0.5 1.5 2.5 3.5 4.5 5.5 6.5 7.5 8.5 9.5 10.5
11.5
10
20
30
40
50
0.2– 1.0 kPa: 36.0%0.2– 2.0 kPa: 71.7%0.2– 3.0 kPa: 86.7%0.2– 4.0 kPa: 93.5%0.2– 5.0 kPa: 96.6%
A
B
C
Temperature (deg. C)
Fig.·2. Swimming jet (SJ) amplitude distribution and frequency.(A) Pressure amplitude (MMPA) distribution of spontaneouslyoccurring high-pressure mantle cavity oscillations (SJs) of >0.2·kPaunder control conditions (15°C). Amplitudes grouped into 1·kPaclasses, frequencies expressed as percentage of total SJ frequency.The insert gives cumulative frequencies within selected intervals.(B) Frequency of SJs >0.2·kPa at all experimental temperatures,expressed in incidences per hour. N=5 animals per temperature.Error bars represent standard deviation. (C) SJ contribution tototal mantle pressure generation in % of total mean mantlepressure (MMPtot) at all experimental temperatures. See text forcalculations.
Fig.·3. Metabolite changes due to spontaneous activity under controlconditions (animal 4). In vivo 31P NMR spectra were acquired every25·min. Each data point represents concentration information for therespective metabolite obtained from a single spectrum (acquisitiontime=3·min 40·s). Pi, inorganic phosphate; pHi, intracellular pH; PLA,phospho-L-arginine.
Time (min)
0 50 100 150 200 250 300
[Pi]
or [
AT
P] o
r [P
LA
] (μ
mol
g–1
wet
mas
s)
0
5
10
15
20
25
30
35
7.15
7.20
7.25
7.30
7.35
7.40
7.45
7.50
7.55
7.60
7.65 [PLA] [Pi][ATP][pHi]
pHi
THE JOURNAL OF EXPERIMENTAL BIOLOGY

898
cycles below 2·kPa also resulted in better regressions, whileJIs exclusively calculated from SJs greater than 3·kPa failed toexplain a similar amount of variability in �[Pi] (Table·2). Thebest single variable identified was a JI constructed from mantlepressure cycles greater than 2·kPa during the last 15·min ofeach 25·min interval:
�[Pi] = 0.0387 JI·, (4)
where �[Pi] in �mol·g–1 wet mass and JI in kPa were calculatedfrom SJs >2kPa within interval g (see Fig.·1C). This regressioncould explain 84% of �[Pi] variability. Accordingly, 20 jets ofan amplitude between 2 and 3·kPa (JI=50) would result in a�[Pi] of roughly 2·�mol·g–1 wet mass, which is equivalent toa 6% decline in mantle muscle phosphagen reserves. Inclusionof a second variable, jet density (JD), into the modelsignificantly enhanced the fraction of explainable �[Pi]variability to 89%:
�[Pi] = 0.0335 JI + 0.1555 JD·, (5)
with �[Pi] in �mol·g–1 wet mass and JI calculated from SJs>2·kPa within interval g, and JD calculated from jets >5·kPawithin interval g (see Fig.·1C).
As high spontaneous SJs could be related to theaccumulation of inorganic phosphate observed in mantlemuscle, true control values for [ATP], [PLA] and pHi were
calculated only from spectra with [Pi]<1.5·�mol·g–1 wet mass,as this was the maximum [Pi] found during prolonged routineventilation sequences [Table·1; only sporadic (<10) jets ofpressure amplitudes of <1·kPa for at least 30·min]. Mean pHi
values were comparable between animals, except for animal 3,which showed a significantly higher mean muscle pHi.Variability in [H+
i] was low under control conditions, with arelative standard deviation (CV) of about ±15% at a meanconcentration of 36.1·nmol·l–1. ATP concentrations werecomparable between animals 2–5, while animal 1 had asignificantly lower muscle [ATP] than animals 2, 4 and 5.Although there were significant differences found in [PLA]between animals, it has to be considered that all meanconcentrations were found within a range of –1.6 to +2.8% ofthe mean value of 33.6·�mol·g–1 wet mass. The ratio of [PLA]over [ATP] proved to be relatively stable between animals(4.0–4.6), with ratios being comparable from animals 2–5 andonly animal 1 being characterised by a significantly higherratio (Table·1).
Acute temperature changeMantle pressure
Bouts of spontaneous mantle muscle activity (SJs >0.2·kPa)could be observed at all temperatures (Fig.·2B), with nosignificant differences between temperatures (F6,28=1.5,
F. Melzner, C. Bock and H.-O. Pörtner
–8 –6 –4 –2 0 2 4 6 8–8
–6
–2
0
4
6
8
–8 –6 –4 –2 0 2 4 6 87.2
7.3
7.4
7.5
7.6
7.7
–8 –6 –4 –2 0 2 4 6 80
2
4
6
8
10
–8 –6 –4 –2 0 2 4 6 8
–10
–5
0
5
10
A B
C D
(88)(25)
(9)
(9)
(90)(31)
(18)
(9)
Δ[H
+]
(nm
ol l–1
)
Δ[P
LA
] (μ
mol
g–1
wet
mas
s) [
AT
P] (
μmol
g–1
wet
mas
s)
pH
i
Δ[Pi] (μmol g–1 wet mass)
2
–4
Fig.·4. Metabolite changes under controlconditions. Information from N=282intervals of 25·min duration from all fiveanimals. Intervals were grouped accordingto change in inorganic phosphate betweensuccessive NMR spectra. Groups were:�[Pi]=0–0.99·�mol·g–1 wet mass (N=88cases), �[Pi]=1–1.99·�mol·g–1 wet mass(N=25 cases), �[Pi]=2–2.99·�mol·g–1 wetmass (N=9 cases) and �[Pi]=>3·�mol·g–1
wet mass (N=9 cases) on the positive side;�[Pi]=0 to –0.99·�mol·g–1 wet mass (N=90cases), �[Pi]=–1 to –1.99·�mol·g–1 wetmass (N=31 cases), �[Pi]=–2 to–2.99·�mol·g–1 wet mass (N=18 cases) and�[Pi]=<–3·�mol·g–1 wet mass (N=9 cases)on the negative side. Number of casesper group (displayed in B) are a directmeasure of the probability ofoccurrence, as all intervals were pickedrandomly. Linear regression equations:(A) pHi=7.444+0.022�[Pi]; r2=0.96,F1,5=121, P<0.001 (for the range<–3 to 3·�mol·g–1 wet mass);(B) �[PLA]i=–0.88�[Pi]; r2=0.99, F1,6=222,P<0.001; (C) �H+
i=–0.41–1.58�[Pi];r2=0.94, F1,5=88, P<0.001 (for the range<–3 to 3·�mol·g–1 wet mass); (D) ForANOVA, see text. All concentrations in�mol·g–1 wet mass (=wet mass–1).
THE JOURNAL OF EXPERIMENTAL BIOLOGY

899Critical temperatures in cuttlefish
P<0.22). A trend towards a higher frequency of spontaneousswimming jets is evident with rising temperature between 8and 23°C. Examination of SJs at all temperatures yielded alinear regression (r2=0.89, N=3523 SJs) for the duration ofindividual SJs in relation to temperature:
SJ duration = –0.0225 T + 1.3025·, (6)
with SJ duration in s and T representing temperature in °C.Mean mantle pressure (MMPSJ) and mean mantle pressureamplitude (MMPASJ) were also linearly related (r2=0.81,N=3523 SJs):
MMPSJ = 0.2723 MMPASJ·, (7)
with both MMPA and MMP in kPa. The frequency distributionof SJ amplitudes at all investigated temperatures wascomparable with the one obtained during control conditions(Fig.·2A). Between 36 and 110 SJs per hour were recorded(8–26°C range), corresponding to ~1 and 3% of the totalexperimental time spent performing high-pressure swimmingjets. With a mean SJ amplitude of 1.7·kPa (see above), theimpact of relatively few high pressure cycles constituted asignificant fraction of total mantle pressure (MMPtot); 20–36%of MMPtot were produced by high-pressure SJs (Fig.·2C) in theinvestigated temperature range. Owing to the high variabilityin SJ frequency (Fig.·2B), these differences were notsignificant, although a trend towards reduced pressuregeneration by SJs is evident between 23 and 26°C.
In vivo 31P NMR spectroscopy
In vivo 31P NMR spectra (Fig.·5A) revealed that despite thechanges in metabolic rate and ventilatory power outputobserved over the entire temperature range (F.M., C.B. and H.-
O.P., manuscript submitted for publication), muscle [ATP]remained constant (ANOVA; F6,28=0.13, P<0.99) at around8·�mol·g–1 wet mass (Fig.·5B). The situation was different forthe other metabolites. Although we could not detect significantdifferences in muscle [PLA] (ANOVA; F4,20=1.48, P<0.25)and [Pi] (ANOVA; F4,20=1.68, P<0.20; Fig.·5B,C) between 11and 23°C, there was a trend towards decreasing [PLA] valuesbetween 17 and 23°C, which was mirrored by increasing [Pi]values in this respective interval. Intracellular pH decreasedwith rising temperature in a linear fashion (r2=0.87, F1,5=33.4,P<0.007):
pHi = 7.528 – 0.0061 T·, (8)
with T in °C (Fig.·5D). All animals started accumulating [Pi](= net utilization of phosphagen reserves) in their mantlemuscle organ at some point of time in both the cold and thewarm. A huge standard deviation at 8 and 26°C indicated thatthe start point for this apparent failure of aerobic metabolismto sustain high cellular ATP fluxes differed between animals.
Therefore, grouping animals into pre-Pi accumulation(group A, means of in vivo 31P NMR spectra 60·min prior toPi accumulation) and Pi accumulation [group B, means of invivo 31P NMR spectra during Pi accumulation (60·minduration), with the start of accumulation defined as at least twosuccessive spectra with a [Pi] of >1.5·�mol·g–1 wet mass]enabled us to improve the resolution of metabolic patterns atboth ends of the temperature window (Table·3). In the cold,phase B mean temperature was 7°C. From phase A to B, [PLA]had decreased to 30.9·�mol·g–1 wet mass while [ATP]remained constant. pHi was also comparable between phasesA and B. At the warm end of the temperature spectrum, thepicture was similar. At a mean temperature of 26.8°C, [PLA]
Table 2. Selected significant linear regressions of jet index vs change in inorganic phosphate concentration
Number X Regression Analysis of variance r2�100
1 JIi; >2·kPa �[Pi]=0.0318X F1,28=73.69; P<0.001 72.462 JIh; >2·kPa �[Pi]=0.0352X F1,28=106.2; P<0.001 79.143 JIg; >2·kPa �[Pi]=0.0387X F1,28=149.9; P<0.001 84.264 JIf; >2·kPa �[Pi]=0.0422X F1,28=88.88; P<0.001 76.045 JIe; >2·kPa �[Pi]=0.0430X F1,28=44.11; P<0.001 62.226 JId; >2·kPa �[Pi]=0.0639X F1,28=35.96; P<0.001 56.227 JIl; >0,2·kPa �[Pi]=0.0159X F1,28=13.65; P<0.001 30.388 JIl; >1·kPa �[Pi]=0.0258X F1,28=27.13; P<0.001 47.399 JIl; >2·kPa �[Pi]=0.0515X F1,28=67.64; P<0.001 69.6710 JIl; >3·kPa �[Pi]=0.0909X F1,28=52.90; P<0.001 64.1511 JIl; >4·kPa �[Pi]=0.1289X F1,28=27.48; P<0.001 47.7312 JIl; >5·kPa �[Pi]=0.1635X F1,28=16.65; P<0.001 35.0513 X1=JI15·min; >2·kPa F2,27=110.7; P<0.001 89.13
X2=JD15·min; >5·kPa �[Pi]=0.0335X1+0.1555X2
Regressions 1–6: variable time intervals for jet index (JI) calculation, fixed pressure threshold (only jets of >2·kPa MMPA included).Regression 7–12: variable jet amplitudes used for JI calculation, fixed time interval (25·min, interval l, Fig.·1). Regression 13 (two-factoriallinear model): best model obtained, using a JI calculated for an interval of 15·min (interval g, Fig.·1) and exclusively with jets with a pressureamplitude of >2·kPa (variable X1), the second variable being jet density (JD) of >5·kPa amplitude within interval g (variable X2; see text forfurther explanations). r2�100 indicates the percentage of explained variance in �[Pi] (�mol·g–1 wet mass) employing the respectiveregressions.
THE JOURNAL OF EXPERIMENTAL BIOLOGY

900
decreased to 30.5·�mol·g–1 wet mass, while [ATP] and pHi didnot change from phase A to B. Looking at the last 31P NMRspectra taken at each temperature (Bextreme in Table·3)illustrates that at high temperatures, pHi is significantlydecreased compared with phase A. A trend towards decreasedpHi values is also visible at the low-temperature Bextreme,although it is not (yet) significant. Free-energy changes of ATPhydrolysis �dG/d� decreased by 3.3·kJ·mol–1 at the lowtemperature Bextreme and by 5.1·kJ·mol–1 at the high Bextreme.Mean values did not drop below 50·kJ·mol–1, if one assumesthat phosphagen utilization is distributed evenly among allmuscle fibre types [radial and circular fibres (r+c) in Table·3]present in the sensitive volume of the 31P NMR coil.
Having established that changes in [PLA] and [Pi] can becaused by SJs under control conditions, it was necessary toinvestigate whether changes at extreme temperatures were alsodue to locomotory exercise or due to routine ventilationactivity. Regression models were tested to establish a linkbetween SJs and inorganic phosphate accumulation in the
mantle muscle organ at extreme temperatures (phase B).Testing the same set of variables as for the control situation(see above), a significant regression model (r2=0.49,F2,29=14.3, P<0.001) could be established for the low extremetemperature situation
�[Pi] = 0.022 JI + 2.66 JD·, (9)
with �[Pi] in �mol·g–1 wet mass, JI calculated within intervall (Fig.·1C) from jets of >2kPa, and JD calculated in interval lfrom jets of >5·kPa. While this significant model could explainroughly half of the encountered variability in �[Pi] at lowtemperatures, we could not identify a single significantregression model at high temperatures.
In a second step, we looked at [Pi] variability during 25·minintervals with no high-pressure jets of >0.2·kPa present. Atboth low and high extreme temperatures (phase B), a mean (±s.d.) accumulation of [Pi] could be found (high temperature,�[Pi]=1.15±0.3·�mol·g–1 wet mass, N=8 intervals; lowtemperature, �[Pi]=0.53±0.43·�mol·g–1 wet mass, N=9
intervals), while during (randomly) chosen controlintervals with no high-pressure cycles present, noinorganic phosphate increases could be found at all(�[Pi]=–1.65±1.9·�mol·g–1 wet mass, N=8intervals). Rather, negative �[Pi] valuesdominated under control conditions, as periodswithout any SJs at all were found predominantlyduring recovery times from (spontaneous)exercise.
In summary, we have found significantincreases in [Pi] (= phosphagen use) in the mantlemuscle organ at both high and low temperatureextremes in all five animals investigated. At acontrol temperature of 15°C, [Pi] variability couldalmost completely (89%) be explained by theoccurrence of high-pressure SJs. At high extremetemperatures, SJs could not be related to theobserved increases in [Pi]. Inorganic phosphateaccumulation was also observed during intervalswithout any SJs present, and thus was likely to becaused by elevated levels of routine ventilationalone. At low extreme temperatures, apparentlyboth processes (routine ventilation energydemands and spontaneous exercise energydemands) contributed to [Pi] accumulation.
F. Melzner, C. Bock and H.-O. Pörtner
Temperature (°C)
8 11 14 17 20 23 26
[AT
P] a
nd [
P i]
(μm
ol g
–1 w
et m
ass)
0
1
2
3
4
5
6
7
8
9
10[Pi][ATP]
[PL
A]
(μm
ol g
–1 w
et m
ass)
25
30
35
40
8 11 14 17 20 23 26
pHi
7.2
7.3
7.4
7.5
7.6
B C
D
15105–10 –5 0 p.p.m.
5°C
11°C8°C
14°C17°C
20°C23°C
26°C
α-ATPPLAPi γ-ATP β-ATP
A
Fig.·5. Mantle organ metabolic status vs temperature.(A) A set of spectra obtained on animal 1 at differenttemperatures. Note increases in inorganic phosphate (Pi)peak area towards high and low temperatures. (B) ATPand Pi concentrations; (C) phospho-L-arginine (PLA)concentration; (D) intracellular pH (pHi). N=5 animalsper temperature. Error bars represent standard deviation.Data derived from in vivo 31P NMR spectra.Concentrations of metabolites are proportional to thearea under their respective peaks in the 31P NMRspectrum.
THE JOURNAL OF EXPERIMENTAL BIOLOGY

901Critical temperatures in cuttlefish
DiscussionUsing non-invasive in vivo 31P NMR spectroscopy, we were
able to continuously monitor key components of the S.officinalis mantle muscle energy system in unrestrainedanimals subjected to acute temperature changes. Our aim wasto identify potential threshold temperatures, below or abovewhich aerobic metabolism would insufficiently provide theenergy required for muscle maintenance, routine activity(ventilatory contraction of radial fibres) and facultativeexercise (high-pressure contractions performed by aerobic andanaerobic circular fibres). A number of invasive studies oncephalopod mantle organ tissue has provided the necessaryinformation to interpret the observed changes in NMR visiblemetabolites ([PLA], [Pi], [ATP]) and pHi, following the adventof anaerobic metabolism, both in mitochondria and the cytosol(Storey and Storey, 1979; Gaede, 1980; Finke et al., 1996;Pörtner et al., 1991; Pörtner et al., 1993; Pörtner et al., 1996;Zielinski, 1999; Zielinski et al., 2000).
Control conditions
During control conditions, we had the unique possibility tostudy the effects of facultative mantle muscle exercise on theanimals’ intracellular energy status. We could show thatanimals displayed a higher activity (as evidenced by theoccurrence of SJs with an amplitude of >0.2·kPa) during 1–3%of the total time. Similar levels of activity were recently found
for a tropical cuttlefish in its natural habitat [S. apama wasfound to be active (as estimated from elevated mantlepressures) for approximately 3% of the day (Aitken et al.,2005)].
Control mantle muscle organ adenylate levels obtained inour study, as witnessed by the ratio of [PLA] over [ATP], arecomparable with other studies that analysed metaboliteconcentrations invasively. Our ratio of 4.2 (0.4 s.d.) compareswell with a value of 3.9 for S. officinalis (Storey and Storey,1979), 4.4 for the squid Lolliguncula brevis (Finke et al., 1996)or 3.5 for the squid Loligo pealei (Pörtner et al., 1993). Wewere able to clearly demonstrate that PLA stores were beingutilized during high-pressure SJs and could establish aquantitative relationship between exercise levels and decreasesin [PLA] or increases in [Pi], respectively. The bestrelationship obtained suggests that SJs with a MMPA of>2·kPa cannot be fuelled entirely by means of aerobic energyproduction, similar to findings in the squid L. brevis (Finke etal., 1996). This fits the picture that slow-swimming (‘cruising’)mantle pressure amplitudes in S. officinalis do not seem toexceed 2·kPa (fig.·1b in Wells and Wells, 1991). Bone et al.could demonstrate that during slow swimming at pressureamplitudes between 0.1 and 1.0·kPa, (aerobic) circular fibresbecome involved in the pressure generating process (Bone etal., 1994a). Thus, it is quite likely that slow swimming at<2·kPa can be fuelled entirely by metabolism of the thin
Table 3. Cellular energy status at extreme temperatures
Low extreme temperature High extreme temperature
A (r+c) B (r+c) Bextreme (r+c) A (r+c) B (r+c) Bextreme (r+c) A (r) Bextreme (r)
pHi 7.47 (0.04) 7.48 (0.07) 7.44 (0.06) 7.38 (0.07) 7.35 (0.04) 7.29 (0.03) 7.38 7.19n.s. n.s. n.s. P<0.001
[PLA] (�mol·g–1 wet mass) 34.5 (1.2) 30.9 (2.1) 30.7 (2.3) 33.1 (1.2) 30.5 (2.1) 28.1 (3.5) 33.1 8.5P<0.006 P<0.006 P<0.04 P<0.001
[Pi] (�mol·g–1 wet mass) 1.3 (0.3) 4.5 (1.9) 4.6 (1.8) 1.2 (0.3) 4.5 (1.1) 7.5 (1.2) 1.2 25.6P<0.004 P<0.004 P<0.001 P<0.001
[ATP] (�mol·g–1 wet mass) 7.7 (1.0) 7.9 (0.5) 8.0 (1.2) 8.0 (0.4) 7.8 (1.0) 7.5 (1.2) 8.0 5.8n.s. n.s. n.s. n.s.
Temperature 9.02 (1.4) 6.97 (0.81) 6.3 (1.1) 23.1 (2.3) 26.78 (1.9) 27.2 (1.6) 23.1 27.2
[Oct] (�mol·g–1 wet mass) 0.2 1.4 1.5 0.2 1.06 1.9 0.2 8.2
[Arg] (�mol·g–1 wet mass) 30.4 32.8 32.9 29.1 30.8 32.4 29.1 45.5
[Mg2+]I (mmol·l–1) 1.2 (0.3) 1.1 (0.3) 1.1 (0.3) 1.8 (0.35) 1.8 (0.68) 1.8 (0.7) 1.8 (0.35) 1.8 (0.7)
dG/d� (kJ·mol–1) –54.7 –51.3 –51.4 –55.9 –52.3 –50.8 –55.9 –44.0
See text for definition of phases and abbreviations. Differences between phase mean values were detected using ANOVA andStudent–Newman–Keuls tests. Only results from post-hoc comparisons between group A and each other group are displayed in this table. n.s.,non-significant; (r+c), metabolite levels and pHi values assuming a homogeneous distribution over the whole mantle organ (radial and circularmuscle fibres); (r), metabolite levels and pHi values assuming a heterogeneous distribution of metabolite levels in that phosphagen depletiononly took place in radial muscle fibres; extreme, values obtained with the last in vivo 31P NMR spectrum prior to termination of cooling orheating; [Mg2+]I, intracellular, free magnesium, estimated using 31P NMR spectra according to (Doumen and Ellington, 1992); Oct, octopine;Arg, arginine; PLA, phospho-L-arginine; pHi, intracellular pH; Pi, inorganic phosphate; dG/d�, free energy change of ATP hydrolysis. [ATP]calculated from the �-ATP peak.
THE JOURNAL OF EXPERIMENTAL BIOLOGY

902
aerobic muscle layers of the mantle periphery. More extremeexercise with pressure amplitudes of >2·kPa progressivelyinvolves central anaerobic fibres (Bone et al., 1994b) thatexploit their phosphagen reserves in order to propel the animalat higher speeds. Gradual involvement of central (mainly)anaerobic fibres (rather than an all-or-nothing transition) tosupport aerobic fibres at an increasing workload has beenrecently demonstrated for swimming squid (L. brevis) (Bartol,2001).
The fact that we found a linear relationship between jetindices constructed from mantle pressure amplitudesmultiplied with jetting frequencies and phosphagen use is notsurprising, as pressure production should be a direct functionof circular mantle muscle fibre force generation. Muscle fibreforce has been found to depend on the number of crossbridgesin the force generating state per cross-sectional area (e.g.Wannenburg et al., 1997); thus, mantle cavity pressure incephalopods should be directly proportional to ATP flux ratesin working mantle muscle. This corresponds to the results ofWebber and O’Dor, who found correlated changes in mantlepressure integral and whole-animal rate of oxygenconsumption (MO2) during various levels of exercise in a squid(I. iIllecebrosus) (Webber and O’Dor, 1986).
The inclusion of a second variable into the regression model(jet density) significantly enhanced the fraction of explainablevariation in inorganic phosphate concentration changes. Thisimplies that high amplitude jets of >5·kPa pose a higher threatto cellular phosphagen reserves when they occur in quicksuccession, rather than distributed over a longer time interval.This could be due to oxygen depletion or aerobic fibre fatigueat high jet density, resulting in pressure generation exclusivelyby anaerobic fibres during high jet density, high-pressure timeintervals.
It should be emphasized that PLA stores were never usedextensively under control conditions (15°C) and duringfacultative, spontaneous exercise. Mean maximum decreasesin [PLA] (= increases in [Pi]; see Table·1) under controlconditions amounted to 6.66·�mol·g–1 wet mass, whichcorresponds to roughly 20% of phosphagen reserves, althoughone animal (replicate 4, Fig.·3) depleted 35% of its phosphagenreserves on one occasion.
Fig.·3 demonstrated that during initial phosphagentransphosphorylation and Pi accumulation, pHi can be bufferedand remains unchanged. pHi decreased only during prolongedphosphagen utilization, probably due to glycolysis andconcomitant octopine formation (Storey and Storey, 1979;Pörtner, 1987; Pörtner, 2002b). Work on in vitro preparationsof scallop (Argopecten irradians) contracting phasic adductormuscles supports this conclusion (Chih and Ellington, 1985).While, during initial exercise (40 muscle contractions), protonconsumption by phosphagen utilization exceeded protonproduction by octopine formation, resulting in a net alkalosisof about 0.09 pH units (�[H+]=–16·nmol·l–1), further exercise(40–200 contractions) led to progressively declining pHi valuesdue to glycolytic proton production outmatching protonconsumption by the phosphagen. Fig.·4 provides a more
quantitative picture and shows clearly that anaerobicmetabolism is seldom employed to the degree that net cellularacidification occurs. Only 3% of all (randomly chosen)intervals analysed for Fig.·4 showed a [Pi] accumulation of>3·�mol·g–1 wet mass. Such a degree of phosphagenutilization goes along with the onset of muscle acidosis,suggesting that glycolytic proton production outmatchesproton buffering by phosphagen use.
Apparently, cuttlefish avoid intracellular acidification byterminating exercise in most cases as soon as glycolytic protonproduction equals phosphagen proton buffering capacity. Uponremoval of inorganic phosphate during recovery, a glycolyticproton surplus, which cannot be buffered, results in a slightdecrease in pHi (Fig.·4A,B). Potentially adverse effects ofdecreased pHi values on muscle function (reviewed by Fitts,1994) are thus shifted into recovery phases. Absolute changesin intracellular proton activities are low (in the nmole range;Fig.·4B), a feature also observed by Chih and Ellington (Chihand Ellington, 1985). A recent in vivo 31P NMR spectroscopystudy on forced scallop exercise (Bailey et al., 2003) confirmedthe metabolic patterns obtained in the older in vitro study onstimulated adductor muscle preparations.
Acute temperature change
Fig.·5 depicts the changes in mantle organ metabolite levelswith temperature. Despite the dramatic changes in ventilatorypower output over the entire temperature range, [ATP] isstrictly conserved (Fig.·5A), a phenomenon commonlyencountered in studies on muscles of marine ectothermicanimals subjected to acute temperature change (i.e. Mark et al.,2002; Sartoris et al., 2003; Zielinski, 1999) and generallyreferred to as the ‘stability paradox’ (Hochachka and Somero,2002). [PLA] was also constant between 11 and 23°C.
We could not find any evidence for an alphastat pattern ofpHi regulation (Reeves, 1972; see Burton, 2002 for a review)in the investigated temperature range. Typically, changes ofaround –0.018 pH units·deg.–1 are expected to ensure constantlevels of imidazol and protein ionization. For fish species, sucha pattern could be demonstrated in white muscle (Borger et al.,1998; Van Dijk et al., 1997; Van Dijk et al., 1999; Bock et al.,2001). As for molluscs, an alphastat pattern of pHi regulationwas absent in the stenothermal marine bivalve Limopsismarionensis (Pörtner et al., 1999). Despite confounding effectsof mantle muscle exercise at all temperatures, we found adecrease in pHi with temperature by about –0.006·pHunits·deg.–1 over the full temperature range examined.Omitting pHi values at 8 and 26°C, as phosphagen utilizationwas observed to start at these temperatures, gives an evenlower rate of change of –0.004 pH units·deg.–1. Between 11and 17°C [the typical natural temperature range of thispopulation of cuttlefish in the English Channel (Boucaud-Camou and Boismery, 1991)], pHi values are nearly identical.The absolute temperature-dependent changes in pHi are <0.05units between 11 and 23°C, which is lower than the range ofchange observed during facultative exercise at controltemperature. Future studies should address the time
F. Melzner, C. Bock and H.-O. Pörtner
THE JOURNAL OF EXPERIMENTAL BIOLOGY

903Critical temperatures in cuttlefish
dependence of pHi regulation in response to temperature. Ourstudy focused on short-term temperature effects and may nothave allowed mantle pHi to fully reach new steady-state valuesafter each thermal challenge. As it stands, the question oftemperature-dependent pHi regulation in cephalopods mustremain open.
Patterns of metabolite changes observed at extremetemperatures exactly mirrored those during exercise undercontrol conditions. The start of phosphagen utilization wasobserved in all five animals at both temperature extremesduring phase B. Mean temperatures during this phase were26.8°C and 7°C.
High Tc
The analysis of mechanisms at the high end of thetemperature spectrum proved to be easier than at the low end.As no relationship between the few SJs (see Fig.·2B,C) and theuse of the phosphagen could be established and, also, since [Pi]increases could be found during periods of ventilation at rest,obviously aerobic metabolic limitation had set in independentof effects of spontaneous SJ exercise at warm temperatures.Still, the results are difficult to interpret as mantle muscle is acomplex organ that consists of different muscle fibre types withdifferent functions (Bone et al., 1981; Bone et al., 1994a; Boneet al., 1994b; Bartol, 2001). Radial muscle fibres aid in refillingthe mantle cavity during ventilation by contracting and thusenlarging mantle cavity volume. Bone et al. were the first todemonstrate (Bone et al., 1994a) that expiration in thecuttlefish under control conditions (18°C) and at rest (mantlepressure amplitudes of 0.05–0.15·kPa) is not brought about bycontraction of the outer, aerobic layers of circular fibres butrather by the movements of the collar flaps (muscular funnelappendages) (see Tompsett, 1939) that expel waterrhythmically from the mantle cavity. Maximum restingventilation MMPA recorded in our experimental animals werelower than 0.15·kPa (F.M., C.B. and H.-O.P., submitted), thuswe assume that during our entire experimental series, radialfibres had been the only constantly working myofilamentswithin the sensitive volume of our 31P NMR coil (Fig.·1B). Ourcompanion study revealed that ventilation pressures stagnateat temperatures beyond 26°C. Fig.·6A shows ventilationpressure amplitudes (at rest) at temperatures close to the upperTc for two experimental animals (the ones with the highest andthe lowest Tcs), while Fig.·6B gives correlated increases in [Pi](circles). It is quite evident from this figure that decliningventilation pressures and phosphagen use are tightly coupled(all other experimental animals showed similar patterns). Wethus conclude that an energetic limitation of radial musclefibres is responsible for the observed increases in [Pi] and thecorrelated decreases in ventilation pressures once phosphagenusage starts. Radial fibres have a mitochondrial content as lowas that of central ‘anaerobic’ circular fibres (Bone et al., 1981;Mommsen et al., 1981) and thus may be especially sensitive toenduring ventilation exercise at high intensities. Consideringthat radial fibres constitute about 30% of total mantle volumein the cuttlefish (Milligan et al., 1997), and assuming that
solely radial fibres deplete their phosphagen stores asventilation pressures increase while, on the other hand, circularfibre energy status remains constant, it is possible to estimatemetabolite changes for the radial fibre compartment. Based onsuch considerations, radial fibre �dG/d�� for animals 1 and 5would drop severely as phosphagen use proceeds (Fig.·6B).Following such a rationale, metabolite changes wererecalculated for phase B (denoted r in Table·3) for all fiveanimals. Thus, mean [PLA] reserves would decrease by 75%from 33 to 8.5·�mol·g–1 wet mass, mirrored by an increase in[Pi] in the same range and a 25% reduction in [ATP]. pHi
would be significantly decreased to 7.19 and �dG/d�� woulddrop to below 44·kJ·mol–1 in the radial fibre compartment ofthe mantle organ. These calculations correspond to similar�dG/d�� values for mantle muscle of three species of squidfollowing fatiguing exercise, which ranged from 42 to47·kJ·mol–1 (Pörtner et al., 1996), while values for two speciesof exercise-fatigued eelpout (P. brachycephalum, Z.viviparous) (Hardewig et al., 1998) white muscle ranged from46.6 to 48·kJ·mol–1. Possibly, reductions in the free energy of
Fig.·6. Mantle metabolic status and mean mantle pressure amplitude(MMPA) vs temperature. (A) MMPA maxima encountered in animals1 and 5; (B) concomitant changes in [Pi] and free energy change ofATP hydrolysis (dG/d�) in the radial muscle compartment, based onthe assumption that observed changes in in vivo 31P NMR spectrasolely represent the situation in working radial muscles (see text).Animal 1 had the lowest and animal 5 had the highest thermaltolerance of all animals investigated. Still, both show a tightcorrelation between stagnating and, eventually, decreasing, pressureamplitudes once �dG/d�� decreases (the other three animals showsimilar patterns; data not shown).
Temperature (°C)
20 21 22 23 24 25 26 27 28 29
dG/d
ξ (k
J m
ol–1
)
–60–58–56–54–52–50–48–46–44–42–40 0
5
10
15
20
25
30
35
[Pi]
MM
PA (
Pa)
5060708090
100110120130140
5060708090100110120130140Animal 1
ATP free energy
Animal 5
B
A
MM
PA (
Pa)
[P i
] (μ
mol
g–1
wet
mas
s)
THE JOURNAL OF EXPERIMENTAL BIOLOGY

904
ATP hydrolysis as calculated for cuttlefish radial muscle couldcontribute to muscle fibre fatigue in that vital muscle due tofunctional impairments of ATPase functions. Kammermeier etal. found a drop in contractile performance of perfused rathearts (38°C) below a �dG/d�� of 48·kJ·mol–1 (Kammermeieret al., 1982). They calculated threshold values of �dG/d��required for proper function of the various ATPases engagedin muscular work to range from 45 to 53·kJ·mol–1
(Kammermeier, 1987; Kammermeier, 1993). Only recently,Jansen et al. found maintenance of [Na+
i] homeostasisprevented by �dG/d�� values below 50·kJ·mol–1 due to alimitation of the sodium pump (Na+/K+-ATPase) in perfusedrat hearts (Jansen et al., 2003). Less information on critical�dG/d�� values for muscle function is available for ectothermicanimals: Combs and Ellington calculated an energyrequirement of 41 kJ mol–1 for blue mussel (Mytilus edulis)sarcolemmal Ca2+–ATPase (Combs and Ellington, 1995). Aminimum �dG/d�� value of 46·kJ·mol–1 for the sodium pump ofcrayfish abdominal muscle was calculated by the same authors(Combs and Ellington, 1997), although they found changes in[Na+
i] homeostasis well above 50·kJ·mol–1 already. Theyspeculated that global �dG/d�� might not reflect the �dG/d��close to the sodium pump.
Also, both elevated intracellular proton and inorganicphosphate concentrations have frequently been connected withmuscular fatigue independent of �dG/d�� (Allen andWesterblad, 2001; Fitts 1994). Increased [Pi] is thought toreduce muscle force by reversing the force-generating Pi
release step by mass action (Hibberd et al., 1985). Accordingto Debold et al. (rat muscle fibres), the [Pi] dependency ofmuscle fatigue is temperature related, with a more pronouncedeffect of [Pi] at low temperatures (Debold et al., 2004). Forectothermic (marine) animals such studies have, to ourknowledge, not been undertaken.
Judging from the presented results and literature data, itappears that progressive phosphagen usage is indeed causativeof the observed stagnation in ventilatory pressure generation athigh temperature extremes, although the exact mechanismsstill need to be elucidated.
Low Tc
At low temperatures, we could demonstrate that SJscontributed significantly to increases in [Pi]. 50% of variabilityin �[Pi] could be attributed to facultative exercise of circularanaerobic fibres, while the other half remained unexplained. Asneither SJ frequency nor the fraction of MMPSJ in MMPtot
increased at lower temperatures (similar frequencies/pressureswere observed between 8 and 11°C; Fig.·2B,C) and no Pi
accumulation occurred at 11°C (Fig.·5B), a major loss inaerobic scope for spontaneous activity had evidently occurredtowards low temperature extremes, resulting in the net use ofphosphagen stores for spontaneous activity. The other 50% ofvariability that could not be explained by the linear regressionis likely due to a limitation in oxygen flux towards radialmuscles, thus limiting their active role in ventilation. It seemsthat, at low temperatures, all muscle fibre types might suffer
from phosphagen breakdown. Accordingly, we calculated�dG/d�� values assuming that mantle phosphagen depletiontook place more homogeneously. In Bextreme, �dG/d�� haddropped from 55 to 51·kJ·mol–1. This does not exclude theexistence of heterogeneity or even of putative intracellular�dG/d�� gradients. Hubley et al. calculated distinct intracellularconcentration gradients of the vertebrate phosphagen, creatinephosphate (PCr), and free energy of ATP hydrolysis inworking fish white muscle, depending on the maximumdistance from the nearest mitochondrion (Hubley et al., 1997).Maximum intracellular �dG/d�� gradients of 7·kJ·mol–1 werecalculated. Interestingly, the study suggests that in fish whitemuscle such �dG/d�� gradients will be less pronounced inanimals acclimated to high temperature (25°C) and acutelyexposed to low temperature (5°C). This is mainly due todiffering temperature relationships of metabolic rates andintracellular diffusion coefficients for ATP and PCr (i.e. Q10
for DPCr was only found to be 1.28, while, typically, Q10 valuesfor metabolism are >2). If this holds true for cuttlefish muscleas well, we can expect drops in �dG/d�� to have less severeimpact on intracellular ATPase function, and thus musclefunction, during oxygen limitation developing at acuteexposure to low temperatures.
However, although oxygen limitation of thermal tolerancein the cold likely progresses at a slower pace, phosphagenusage during periods without spontaneous activity is a certainsign of a cellular energy limitation, leading to time-limitedsurvival of the organism.
Perspectives: thermal limitation in cephalopods vs fish
Van Dijk et al. found no changes in fish (P. brachycephalum,Z. viviparus) white muscle energy status at high criticaltemperatures (�dG/d�� did not drop below 60·kJ·mol–1), whilein liver, an accumulation of succinate indicated a progressiveswitch to mitochondrial anaerobiosis (Van Dijk et al., 1999).Furthermore, two recent in vivo 31P NMR studies on P.brachycephalum (Mark et al., 2002) and Gadus morhua(Sartoris et al., 2003) white muscle confirmed that onlymoribund animals displayed a drop in pH and �dG/d�� in thistissue at temperatures beyond Tc. Sartoris et al. noted that evenimmediate cooling could not reverse detrimental changes intissue energy status (Sartoris et al., 2003).
In our experiments, cuttlefish survived exposure to the highTc, when rapidly cooled to control temperatures (F.M. andC.B., personal observation), suggesting that the observed netuse of the phosphagen reflects an energetic limitation ofactively working muscle sections rather than an energeticlimitation of all muscle, including the resting bulk of circularand anaerobic (‘white’) muscle fibres. This emphasizes thatactive tissues are the first to be affected by temperature-induced oxygen deficiency. Effects in white or passive muscleset in at the end of a progressive oxygen limitation cascade andthus only occur once severe damage to other organs, especiallythose involved in driving blood circulation, has already set in,leading to ventilatory and circulatory failure as in fish (VanDijk et al., 1999; Mark et al., 2002). Accordingly, progressive
F. Melzner, C. Bock and H.-O. Pörtner
THE JOURNAL OF EXPERIMENTAL BIOLOGY

905Critical temperatures in cuttlefish
radial fibre fatigue of the cephalopod mantle characterizes anearly limitation in response to temperature. It will eventuallyaffect all other tissues, as oxygen uptake and distribution willlikely be negatively affected by decreasing ventilatorypressures (Fig.·6A,B). However, whether radial muscle fatigueobserved in our study results from limited ventilatory musclepower output per se or is caused by a progressively limitedoxygen supply through the blood circulation or by acombination of both processes remains to be established.
This study was carried out in support of the project ‘Thecellular basis of standard and active metabolic rate in the free-swimming cephalopod, Sepia officinalis’ (NERC GrantPFZA/004). The authors wish to thank Rolf Wittig and TimoHirse for their excellent technical support, Raymond andMarie-Paule Chichery (Université de Caen) for providingcuttlefish eggs in 2002 and 2003 and all student helpers thatwere engaged in raising the animals in our laboratory.
ReferencesAitken, J. P., O’Dor, R. K. and Jackson, G. D. (2005). The secret life of the
giant cuttlefish Sepia apama (Cephalopoda): behaviour and energetics innature revealed through radio acoustic positioning and telemetry (RAPT).J. Exp. Mar. Biol. Ecol. 320, 77-91.
Allen, D. G. and Westerblad, H. (2001). Role of phosphate and calciumstores in muscle fatigue. J. Physiol. 536, 657-665.
Bailey, D. M., Peck, L. S., Bock, C. and Pörtner, H. O. (2003). High-energyphosphate metabolism during exercise and recovery in temperate and antarcticscallops: an in vivo 31P-NMR study. Physiol. Biochem. Zool. 76, 622-633.
Bartol, I. K. (2001). Role of aerobic and anaerobic circular mantle musclefibers in swimming squid: Electromyography. Biol. Bull. 200, 59-66.
Bock, C., Sartoris, F., Wittig, R.-M. and Pörtner, H. O. (2001).Temperature-dependent pH regulation in stenothermal antarctic andeurythermal temperate eelpout (Zoarcidae): an in vivo NMR study. PolarBiol. 24, 869-874.
Bock, C., Sartoris, F. J. and Pörtner, H. O. (2002). In vivo MR spectroscopyand MR imaging on non-anaesthetized marine fish: techniques and firstresults. Magn. Reson. Imaging 20, 165-172.
Bone, Q., Pulsford, A. and Chubb, A. D. (1981). Squid mantle muscle. J.Mar. Biol. Assoc. UK 61, 327-342.
Bone, Q., Brown, E. R. and Travers, G. (1994a). On the respiratory flow inthe cuttlefish Sepia officinalis. J. Exp. Biol. 194, 153-165.
Bone, Q., Brown, E. R. and Usher, M. (1994b). The structure and physiologyof cephalopod muscle fibres. In Cepahlopod Neurobiology (ed. N. J. Abbot,R. Williamson and L. Maddock), pp. 301-329. Oxford: Oxford UniversityPress.
Borger, R., De Boeck, G., Van Auderke, J., Domisse, R., Blust, R. and Vanden Linden, A. (1998). Recovery of the energy metabolism after a hypoxicchallenge at different temperature conditions: a 31P nuclear magneticresonance spectroscopy study with common carp. Comp. Biochem. Physiol.120A, 143-150.
Boucaud-Camou, E. and Boismery, J. (1991). The migrations of thecuttlefish (Sepia officinalis L.) in the English Channel. In Acta of the 1stInternational Symposium on the Cuttlefish Sepia (ed. E. Boucaud-Camou),pp. 179-189. Caen: Université de Caen Publications.
Buck, L. T., Hochachka, P. W., Schon, A. and Gnaiger, E. (1993).Microcalorimetric measurement of reversible metabolic suppression inducedby anoxia in isolated hepatocytes. Am. J. Physiol. 265, R1014-R1019.
Burton, R. F. (2002). Temperature and acid–base balance in ectothermicvertebrates: the imidazole alphastat hypothesis and beyond. J. Exp. Biol.205, 3587-3600.
Chih, C. P. and Ellington, W. R. (1985). Metabolic correlates of intracellularpH change during rapid contractile activity in a molluscan muscle. J. Exp.Zool. 236, 27-34.
Cocking, A. W. (1959). The effects of high temperature on roach (Rutilusrutilus). 1. The effects of temperature increasing at a known constant rate.J. Exp. Biol. 36, 217-226.
Combs, C. A. and Ellington, W. R. (1995). Graded intracellular acidosisproduces extensive and reversible reductions in the effetive free energychanges of ATP hydrolysis in a molluscan muscle. J. Comp. Physiol. B 165,203-212.
Combs, C. A. and Ellington, W. R. (1997). Intracellular sodium homeostasisin reaction to the effective free-energy change of ATP hydrolysis: studiesof crayfish muscle fibers. J. Comp. Physiol. B 167, 563-569.
Debold, E. P., Dave, H. and Fitts, R. H. (2004). Fiber type and temperaturedependence of inorganic phosphate: imlications for fatigue. Am. J. Physiol.287, C673-C681.
Doumen, C. and Ellington, W. R. (1992). Intracellular free magnesium inthe muscle of an osmoconforming marine invertebrate: measurement andeffect of metabolic and acid–base pertubations. J. Exp. Zool. 261, 394-405.
Finke, E., Pörtner, H. O., Lee, P. G. and Webber, D. M. (1996). Squid(Lolliguncula brevis) life in shallow waters: oxygen limitation ofmetabolism and swimming performance. J. Exp. Biol. 199, 911-921.
Fitts, E. (1994). Cellular mechanisms of muscle fatigue. Physiol. Rev. 74, 49-94.
Frederich, M. and Pörtner, H. O. (2000). Oxygen limitation of thermaltolerance defined by cardiac and ventilatory performance in spider crab,Maja squinado. Am. J. Physiol. 279, R1531-R1538.
Gaede, G. (1980). Biological role of octopine formation in marine molluscs.Mar. Biol. Lett. 1, 121-135.
Hardewig, I., Van Dijk, P. L. M. and Pörtner, H. O. (1998). High energyturnover at low temperatures: recovery from exhaustive exercise inAntarctic and temperate eelpouts. Am. J. Physiol. 274, R1789-R1796.
Heath, A, G. and Hughes, G. M. (1973). Cardiovascular and respiratorychanges during heat stress in the rainbow trout (Salmo gairdneri). J. Exp.Biol. 59, 323-338.
Hibberd, M. G., Dantzig, J. A., Trentham, D. R. and Goldman, Y. E.(1985). Phosphate release and force generation in skeletal muscle fibres.Science 228, 1317-1319.
Hochachka, P. W. (2000). Pinniped diving response mechanisms andevolution: A window on the paradigm of comparative biochemistry andphysiology. Comp. Physiol. Biochem. 126A, 435-458.
Hochachka, P. W. and Somero, G. N. (2002). Biochemical Adaptation.Oxford: Oxford University Press.
Hubley, M. J., Locke, B. R. and Moerland, T. S. (1997). Reaction-diffusionanalysis of the effects of temperature on high-energy phosphate dynamicsin goldfish skeletal muscle. J. Exp. Biol. 200, 975-988.
Jansen, M. A., Shen, H., Zhang, L., Wolkowicz, P. E. and Balschi, J. A.(2003). Energy requirements for the Na+ gradient in the oxygenated isolatedheart: effect of changing the free energy of ATP hydrolysis. Am. J. Physiol.285, H2437-H2445.
Kammermeier, H. (1987). High energy phosphate of the myocardium:concentration versus free energy change. Basic Res. Cardiol. 82, S31-S36.
Kammermeier, H. (1993). Efficiency of energy conversion from metabolicsubstrates to ATP and mechanical and chemiosmotic energy. Basic Res.Cardiol. 88, 15-20.
Kammermeier, H., Schmidt, P. and Jüngling, E. (1982). Free energy changeof ATP-hydrolysis: a causal factor of early hypoxic failure of themyocardium? J. Mol. Cell. Cardiol. 14, 267-277.
Kost, G. J. (1990). PH standardization for phosphorus – 31 magneticresonance heart spectroscopy at different temperatures. Magn. Res. Med. 14,496-506.
Lannig, G., Bock, C., Sartoris, F. J. and Pörtner, H. O. (2004). Oxygenlimitation of thermal tolerance in cod, Gadus morhua L. studied by magneticresonance imaging (MRI) and on-line venous oxygen monitoring. Am. J.Physiol. 287, R902-R910.
Mark, F. C., Bock, C. and Pörtner, H. O. (2002). Oxygen – limited thermaltolerance in Antarctic fish investigated by MRI and 31P – MRS. Am. J.Physiol. 283, R1254-R1262.
Messenger, J. B., Nixon, M. and Ryan, K. P. (1985). Magnesium chlorideas an anaesthetic for cephalopods. Comp. Biochem. Physiol. 82C, 203-205.
Mommsen, T. P., Ballantyne, J., Macdonald, D, Gosline, J. andHochachka, P. W. (1981). Analogues of red and white muscle in squidmantle. Proc. Natl. Acad. Sci. USA 78, 3274-3278.
Milligan, B. J., Curtin, N. A. and Bone, Q. (1997). Contractile properties ofobliquely striated muscle from the mantle of squid (Alloteuthis subulata)and cuttlefish (Sepia officinalis). J. Exp. Biol. 200, 2425-2436.
Peck, L. S., Pörtner, H. O., Hardewig, I. (2002). Metabolic demand, oxygensupply and critical temperatures in the Antarctic bivalve, Laternula elliptica.Physiol. Biochem. Zool. 75, 123-133.
THE JOURNAL OF EXPERIMENTAL BIOLOGY

906
Pörtner, H. O. (1987). Contributions of anaerobic metabolism to pHregulation in animal tissues: theory. J. Exp. Biol. 131, 69-87.
Pörtner, H. O. (1990). Determination of intracellular buffer values aftermetabolic inhibition by fluoride and nitrilotriacetic acid. Respir. Physiol. 81,275-288.
Pörtner, H. O. (1994). Coordination of metabolism, acid-base regulation, andhaemocyanin function in cephalopods. Physiology of Cephalopod Molluscs– Lifestyle and Performance Adaptations (ed. H. O. Pörtner, R. K. O’Dorand D. MacMillan), pp. 131-148. Basel: Gordon and Breach.
Pörtner, H. O. (2001). Climate change and temperature dependentbiogeography: oxygen limitation of thermal tolerance in animals.Naturwissenschaften 88, 137-146.
Pörtner, H. O. (2002a). Climate change and temperature dependentbiogeography: systemic to molecular hierarchies of thermal tolerance inanimals. Comp. Biochem. Physiol. 132A, 739-761.
Pörtner, H. O. (2002b). Environmental and functional limits to musclularexercise and body size in marine invertebrate athletes. Comp. Biochem.Physiol. 133A, 303-321.
Pörtner, H. O., Boutilier, R. G., Tang, Y. and Toews, D. P. (1990).Determination of intracellular pH and PCO2 after metabolic inhibition byfluoride and nitrilotriacetic acid. Respir. Physiol. 81, 255-274.
Pörtner, H. O., Webber, D. M., Boutilier, R. G. and O’Dor, R. K. (1991).Acid–base regulation in exercising squid (Illex illecebrosus, Loligo paelei).Am. J. Physiol. 261, R239-R246.
Pörtner, H. O., Webber, D. M., O’Dor, R. K. and Boutilier, R. G. (1993).Metabolism and energetics in squid (Illex illecebrosus, Loligo pealei) duringmuscular fatigue and recovery. Am. J. Physiol. 265, R157-R165.
Pörtner, H. O., Finke, E. and Lee, P. G. (1996). Metabolic and energycorrelates of intracellular pH in progressive fatigue of squid (L. brevis)mantle muscle. Am. J. Physiol. 271, R1403-R1414.
Pörtner, H. O., Peck, L., Zielinski, S. and Conway, L. Z. (1999).Intracellular pH and energy metabolism in the highly stenothermal antarcticbivalve Limopsis marionensis as a function of ambient temperature. PolarBiol. 22, 17-30.
Reeves, R. B. (1972). An imidazole alphastat hypothesis for vertebrateacid–base regulation: tissue carbon dioxide content and body temperaturein bullfrogs. Respir. Physiol. 14, 219-236.
Sartoris, F. J., Bock, C., Serendero, I., Lannig, G. and Pörtner, H. O.(2003). Temperature-dependent changes in energy metabolism, intracellular
pH and blood oxygen tension in the Atlantic cod. J. Fish. Biol. 62, 1239-1253.
Sokolova, I. M. and Pörtner, H. O. (2003). Metabolic plasticity and criticaltemperatures for aerobic scope in a eurythermal marine invertebrate(Littorina saxatilis, Gastropoda: Littorinidae) from different latitudes. J.Exp. Biol. 206, 195-207.
Sommer, A., Klein, B. and Pörtner, H. O. (1997). Temperature inducedanaerobiosis in two populations of the polychaete worm Arenicola marina(L.). J. Comp. Physiol. B 167, 25-35.
Storey, K. B. and Storey, J. M. (1979). Octopine metabolism in the cuttlefish,Sepia officinalis: octopine production by muscle and ist role as an aerobicsubstrate for non-muscular tissues. J. Comp. Physiol. 131, 311-319.
Teague, W. E. and Dobson, G. P. (1992). Effect of temperature on thecreatine kinase equilibrium. J. Biol. Chem. 267, 14084-14093.
Tompsett, D. H. (1939). Sepia. Liverpool: LMBC Memoirs, LiverpoolUniversity Press.
Van Dijk, P. L. M., Hardewig, I. and Pörtner, H. O. (1997). Temperaturedependent shift of pHi in fish white muscle: contributions of passive andactive processes. Am. J. Physiol. 272, R84-R89.
Van Dijk, P. L. M., Tesch, C., Hardewig, I. and Pörtner, H. O. (1999).Physiological disturbances at critically high temperatures: a comparisonbetween stenothermal Antarctic and eurythermal temperate eelpouts(Zoarcidae). J. Exp. Biol. 202, 3611-3621.
Wannenburg, T., Janssen, P. M. L., Fan, D. and De Tombe, P. P. (1997).The Frank Starling mechanism is not mediated by changes in rate of cross-bridge detachment. Am. J. Physiol. 273, H2428-H2435.
Webber, D. M. and O’Dor, R. K. (1986). Monitoring the metabolic rate andactivity of free-swimming squid with telemetered jet pressure. J. Exp. Biol.126, 205-224.
Wells, M. J. and Wells, J. (1982). Ventilatory currents in the mantle ofcephalopods. J. Exp. Biol. 99, 315-330.
Wells, M. J. and Wells, J. (1991). Is Sepia really an octopus? In Acta of the1st International Symposium on the Cuttlefish Sepia (ed. E. Boucaud-Camou), pp. 77-92. Caen: Université de Caen Publications.
Zielinski, S. (1999). Consequences of high metabolic rates in cephalopodsfrom different geographical latitudes. Berl. Polarforsch. 338, 198.
Zielinski, S. and Pörtner, H. O. (1996). Energy metabolism and ATP free-energy change of the intertidal worm Sipunculus nudus below a criticaltemperature. J. Comp. Physiol. B 166, 492-500.
F. Melzner, C. Bock and H.-O. Pörtner
THE JOURNAL OF EXPERIMENTAL BIOLOGY