The multi-drug resistance phenotype: 31P NMR characterization and 2-deoxyglucose toxicity (Cancer...
8
1991;51:1638-1644. Cancer Res Ofer Kaplan, Jerzy W. Jaroszewski, Robert Clarke, et al. Resonance Characterization and 2-Deoxyglucose Toxicity P Nuclear Magnetic 31 The Multidrug Resistance Phenotype: Updated version http://cancerres.aacrjournals.org/content/51/6/1638 Access the most recent version of this article at: E-mail alerts related to this article or journal. Sign up to receive free email-alerts Subscriptions Reprints and . [email protected] Department at To order reprints of this article or to subscribe to the journal, contact the AACR Publications Permissions . [email protected] Department at To request permission to re-use all or part of this article, contact the AACR Publications Research. on August 18, 2014. © 1991 American Association for Cancer cancerres.aacrjournals.org Downloaded from Research. on August 18, 2014. © 1991 American Association for Cancer cancerres.aacrjournals.org Downloaded from
Transcript of The multi-drug resistance phenotype: 31P NMR characterization and 2-deoxyglucose toxicity (Cancer...
1991;51:1638-1644. Cancer Res Ofer Kaplan, Jerzy W. Jaroszewski, Robert Clarke, et al. Resonance Characterization and 2-Deoxyglucose Toxicity
P Nuclear Magnetic31The Multidrug Resistance Phenotype:
Updated version
http://cancerres.aacrjournals.org/content/51/6/1638
Access the most recent version of this article at:
E-mail alerts related to this article or journal.Sign up to receive free email-alerts
Subscriptions
Reprints and
To order reprints of this article or to subscribe to the journal, contact the AACR Publications
Permissions
To request permission to re-use all or part of this article, contact the AACR Publications
Research. on August 18, 2014. © 1991 American Association for Cancercancerres.aacrjournals.org Downloaded from
Research. on August 18, 2014. © 1991 American Association for Cancercancerres.aacrjournals.org Downloaded from
[CANCER RESEARCH 51, 1638-1644. March 15, 1991]
The Multidrug Resistance Phenotype: 31PNuclear Magnetic Resonance
Characterization and 2-Deoxyglucose ToxicityOfer Kaplan, Jerzy W. Jaroszewski,1 Robert Clarke, Craig R. Fairchild,2 Patricia Schoenlein, Sarah Goldenberg,Michael M. Gottesman, and Jack S. Cohen3
Medicine Branch [O. K., J. W. J., C. R. F., J. S. C.J, and Laboratory of Cell Biology [P. S., S. G., M. M. G.J, National Cancer Institute, NIH, Belhesda, Maryland20892, and Lombardi Cancer Research Center, Georgetown University Medical Center, Washington, DC 20007 [R. C.]
ABSTRACT
In order to identify changes in 3IP nuclear magnetic resonance (NMR)
spectra associated with multiple drug resistance (MDR), a number ofwild type and drug-resistant cancer cell lines were studied. The resistantcells included cells selected with various drugs, mainly Adriamycin, aswell as cells transfected with the human multidrug resistance gene(MDR1 gene), which encodes P-glycoprotein. In most cases, 3IP NMRspectra were significantly different from those of parental, drug-sensitivelines. The spectra of resistant cells generally indicated increased levelsof ATP and phosphocreatine in the cytoplasm. These changes are compatible with the increased glucose utilization rate previously describedfor resistant cells. Major changes were also observed in the levels ofglycerophosphocholine and glycerophosphoethanolamine. Changes incellular metabolism reflected by "!' NMR spectra depend on the drug
used to select the cells for MDR. The direction of these changes was notconsistent for all cell lines studied and could not be directly attributed toexpression of P-glycoprotein, suggesting that the changes may be relatedto alterations in metabolism and membrane function associated withother mechanisms of MDR. The results demonstrate the suitability of31PNMR for studies of biochemical changes associated with MDR. Thetoxicity of 2-deoxyglucose, a glucose antimetabolite, was investigated inaddition to the NMR studies and was found to be consistently higher inmultidrug-resistant cells than in the parental drug-sensitive lines. ForMCF-7 breast cancer cells, where several sublines with different levelsof resistance were available, the toxicity was highest for the most resistantlines.
INTRODUCTION"P NMR4 spectroscopy is a valuable means of noninvasive
observation of high-energy phosphate-containing compoundsand phospholipid metabolites in intact cells (I, 2). Previously,it has been demonstrated that in cultured MCF-7 human breastcancer cells induction of MDR with Adriamycin was followedby striking -"P NMR spectral changes, notably elevated levels
of PCr and ATP, and decreased levels of phospholipid metabolites (3, 4). Similar findings were reported for a murine mammary adenocarcinoma in vivo (5). In the MCF-7 cells, theresistance is associated with a 3-fold increase in the rate ofglycolysis (6).
Although there appear to be several mechanisms involved inMDR (7-10), MDR is usually associated with expression of a
Received 8/30/90; accepted 1/8/91.The costs of publication of this article were defrayed in part by the payment
of page charges. This article must therefore be hereby marked advertisement inaccordance with 18 U.S.C. Section 1734 solely to indicate this fact.
' Permanent address: Department of Organic Chemistry and PharmaBiotecResearch Center, Royal Danish School of Pharmacy, Universitetsparken 2, DK-2100 Copenhagen, Denmark. Financial support from the Alfred Benzon Foundation, NATO Science Fellowships Programme, and Danish Medical ResearchCouncil to J. W. J. is gratefully acknowledged.
1Present address: Bristol-Myers Squibb Company, Experimental Therapeu
tics. 5 Research Parkway. Wallingford, CT 06492.3 Present address: Department of Pharmacology, Georgetown University,
Georgetown Laboratories, 4 Research Court, Rockville, M D 20850.4The abbreviations used are: NMR. nuclear magnetic resonance; MDR. mul
tidrug resistance: Adr", Adriamycin-resistant cell line: WT. wild type cell line: 2-DG. 2-deoxyglucose; PDE, phosphodiester; GPC, glycerol 3-phosphorylcholine;PCr, phosphocreatine; MTT, 3-(4,5-dimethylthiazo-2-yl)-2.5-diphenyltetrazo-lium bromide.
M, 170,000 plasma membrane glycoprotein, referred to as P-glycoprotein, Pgp, or p 170 (7, 8). p 170 is an energy-dependenttransporter which mediates drug efflux from the cells. Thus, alimitation in ATP supply could make MDR cells more susceptible to the toxic effects of drugs. The increased glucose metabolism, previously described in the resistant MCF-7 cells, whichoccurs even in the absence of a drug (6) suggests that additionalenergy is required to maintain the MDR phenotype. Interference with energy supply could thus provide a means to overcomeMDR.
In this work, we describe 3IP NMR data associated with the
MDR phenotype in a number of cell lines and compare thesedata according to the method of induction of MDR, in orderto establish whether there are consistent changes in the spectra,typical for MDR. Cells with the MDR phenotype resultingfrom selection with drugs, as well as obtained by transfectionwith the MDR1 gene, are included. In addition to the NMRstudies, the toxicity of 2-DG on the MDR cells was assessed.2-DG inhibits early steps of glycolysis, the main energy-producing pathway in cancer cells (11-14). Therefore, the effect of2-DG on cell growth was compared for a variety of drug-sensitive and multidrug-resistant cells, in order to establishwhether there is a general trend of increased toxicity of 2-DGin the presence of the MDR phenotype.
MATERIALS AND METHODS
Cell Lines. All cells were grown in 150-crn2 flasks (Costar, Cambridge, MA), containing 30 ml of medium, at 37°Cin a humidified
atmosphere containing 5% carbon dioxide. Prior to all experiments thecells were grown for several passages in drug-free media.
The wild type (WT) MCF-7 human breast cancer cell line wasestablished from the pleural effusion of a patient with metastaticmammary carcinoma (15). AdrR cells were selected in stepwise increased concentrations of Adriamycin (16). Three AdrR lines withdifferent resistance levels were used (9-, 108- and 144-fold resistant),as well as an 88-fold resistant revenant line, with resistance reducedfrom 144-fold after drug-free passage for 1 year (16). The cells weregrown in improved minimal Eagle's medium (NIH Media Unit) sup
plemented with 5% fetal calf serum and penicillin and streptomycin.BCAdr-19 cells are a population of MCF-7 WT cells transfected
with pBCAdr, an expression vector containing a cytomegalovirus promoter sequence and a full-length MDR1 complementary DNA isolatedfrom the MCF-7 ADr" cells. Sublines were selected for expression of
p 170 by growing in 100 nivi Adriamycin for 3 weeks, as describedpreviously (17). These cells have 150% of the level of MDR] mRNA ascompared with the MCF-7 AdrR cells. Transfection of the MCF-7 WTcells with a pSVNeo vector and selection of a G418-resistant subclonewas carried out and used as a control for the transfection procedure(17).
For specific MDR] transfection, MCF-7 WT cells were cloned anda single clone was infected with the pHaMDRl/A retrovirus (18) asdescribed elsewhere.5 Clones of drug resistant infectant populationswere isolated in the presence of continuous exposure to 25 nM colchi-cine. Four colchicine-resistant clones were expanded (designated CL
! R. Clarke et al., manuscript in preparation.
1638
Research. on August 18, 2014. © 1991 American Association for Cancercancerres.aacrjournals.org Downloaded from
MULTIDRUG RESISTANCE PHENOTVPE
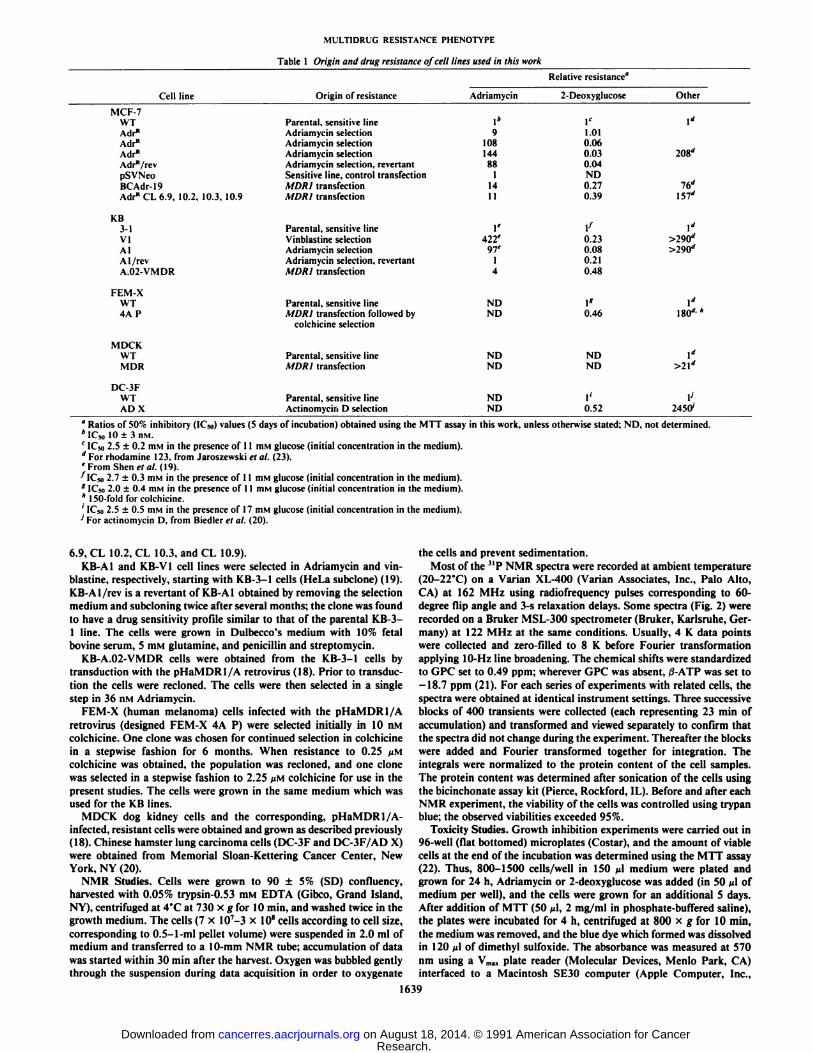
Table 1 Origin and drug resistance of cell lines used in this work
CelllineMCF-7WTAdrRAdr*Adr"Adr*/revpSVNeoBCAdr-19Adr"
CL 6.9. 10.2, 10.3,10.9KB3-1VIAlAl
/revA.02-VMDRFEM-XWT4A
PMDCKWTMDRDC-3FWTADXOrigin
ofresistanceParental,
sensitivelineAdriamycinselectionAdriamycinselectionAdriamvcinselectionAdriamycin
selection,revenantSensitiveline, controltransfectionMDRI
transfectionMDRItransfectionParental,
sensitivelineVinblastineselectionAdriamycinselectionAdriamycin
selection,revenantMDRItransfectionParental,
sensitivelineMDRltransfection followedbycolchicine
selectionParental,
sensitivelineMDRItransfectionParental,
sensitivelineActinomyciiiD selectionAdriamycin1»910814488114111'422'97'14NDNDNDN
DNDNDRelative
resistance02-DeoxyglucoscIe1.010.060.030.04ND0.270.39V0.230.080.210.481*0.46NDNDr0.52Other\d208"It?157"1">290d>290"1"ISO**\">21"V245V
" Ratios of SO^c inhibitory (IC»)values (5 days of incubation) obtained using the MTT assay in this work, unless otherwise stated: ND. not determined.*IC50 10 ±3 n\i.c 1C502.5 ±0.2 mM in the presence of 11 mM glucose (initial concentration in the medium).äFor rhodamine 123. from Jaroszewski et al. (23).'From Shenetal. (19).^IC50 2.7 ±0.3 mM in the presence of 11 mM glucose (initial concentration in the medium).* ICso 2.0 ±0.4 mM in the presence of 11 mM glucose (initial concentration in the medium).* 150-fold for colchicine.' ICso 2.5 ±0.5 mM in the presence of 17 mM glucose (initial concentration in the medium).' For actinomycin D, from Biedler et al. (20).
6.9, CL 10.2, CL 10.3, and CL 10.9).KB-AI and KB-Vl cell lines were selected in Adriamycin and vin-
blastine, respectively, starting with KB-3-1 cells (HeLa subclone) (19).KB-AI/rev is a revenant of KB-AI obtained by removing the selectionmedium and subcloning twice after several months; the clone was foundto have a drug sensitivity profile similar to that of the parental KB-3-1 line. The cells were grown in Dulbecco's medium with 10% fetal
bovine serum, 5 mM glutamine, and penicillin and streptomycin.KB-A.02-VMDR cells were obtained from the KB-3-1 cells by
transduction with the pHaMDRl/A retrovirus (18). Prior to transduc-tion the cells were recloned. The cells were then selected in a singlestep in 36 nvi Adriamycin.
FEM-X (human melanoma) cells infected with the pHaMDRl/Aretrovirus (designed FEM-X 4A P) were selected initially in 10 n.Mcolchicine. One clone was chosen for continued selection in colchicinein a stepwise fashion for 6 months. When resistance to 0.25 ß\\colchicine was obtained, the population was recloned, and one clonewas selected in a stepwise fashion to 2.25 MMcolchicine for use in thepresent studies. The cells were grown in the same medium which wasused for the KB lines.
MDCK dog kidney cells and the corresponding, pHaMDRl/A-infected, resistant cells were obtained and grown as described previously(18). Chinese hamster lung carcinoma cells (DC-3F and DC-3F/AD X)were obtained from Memorial Sloan-Kettering Cancer Center, NewYork, NY (20).
NMR Studies. Cells were grown to 90 ±5% (SD) confluency,harvested with 0.05% trypsin-0.53 m\i EDTA (Gibco, Grand Island,NY), centrifuged at 4°Cat 730 x g for 10 min, and washed twice in thegrowth medium. The cells (7 x 10⁷-3 x 10*cells according to cell size,
corresponding to 0.5-1-ml pellet volume) were suspended in 2.0 ml ofmedium and transferred to a 10-mm NMR tube; accumulation of datawas started within 30 min after the harvest. Oxygen was bubbled gentlythrough the suspension during data acquisition in order to oxygenate
the cells and prevent sedimentation.Most of the "P NMR spectra were recorded at ambient temperature
(20-22T) on a Varian XL-400 (Varian Associates, Inc., Palo Alto,CA) at 162 MHz using radiofrequency pulses corresponding to 60-degree flip angle and 3-s relaxation delays. Some spectra (Fig. 2) wererecorded on a Bruker MSL-300 spectrometer (Bruker, Karlsruhe, Germany) at 122 MHz at the same conditions. Usually. 4 K data pointswere collected and zero-filled to 8 K before Fourier transformationapplying 10-Hz line broadening. The chemical shifts were standardizedto GPC set to 0.49 ppm; wherever GPC was absent, 0-ATP was set to—18.7 ppm (21). For each series of experiments with related cells, thespectra were obtained at identical instrument settings. Three successiveblocks of 400 transients were collected (each representing 23 min ofaccumulation) and transformed and viewed separately to confirm thatthe spectra did not change during the experiment. Thereafter the blockswere added and Fourier transformed together for integration. Theintegrals were normalized to the protein content of the cell samples.The protein content was determined after sonication of the cells usingthe bicinchonate assay kit (Pierce, Rockford, IL). Before and after eachNMR experiment, the viability of the cells was controlled using trypanblue; the observed viabilities exceeded 95%.
Toxicity Studies. Growth inhibition experiments were carried out in96-well (flat bottomed) microplates (Costar), and the amount of viablecells at the end of the incubation was determined using the MTT assay(22). Thus, 800-1500 cells/well in 150 ^' medium were plated andgrown for 24 h, Adriamycin or 2-deoxyglucose was added (in 50 ¡Aofmedium per well), and the cells were grown for an additional 5 days.After addition of MTT (50 ¡A.2 mg/ml in phosphate-buffered saline),the plates were incubated for 4 h, centrifuged at 800 x g for 10 min,the medium was removed, and the blue dye which formed was dissolvedin 120 ^1 of dimethyl sulfoxide. The absorbance was measured at 570nm using a Vma, plate reader (Molecular Devices, Menlo Park, CA)interfaced to a Macintosh SE30 computer (Apple Computer, Inc.,
1639
Research. on August 18, 2014. © 1991 American Association for Cancercancerres.aacrjournals.org Downloaded from
MULTIDRUG RESISTANCE PHENOTYPE
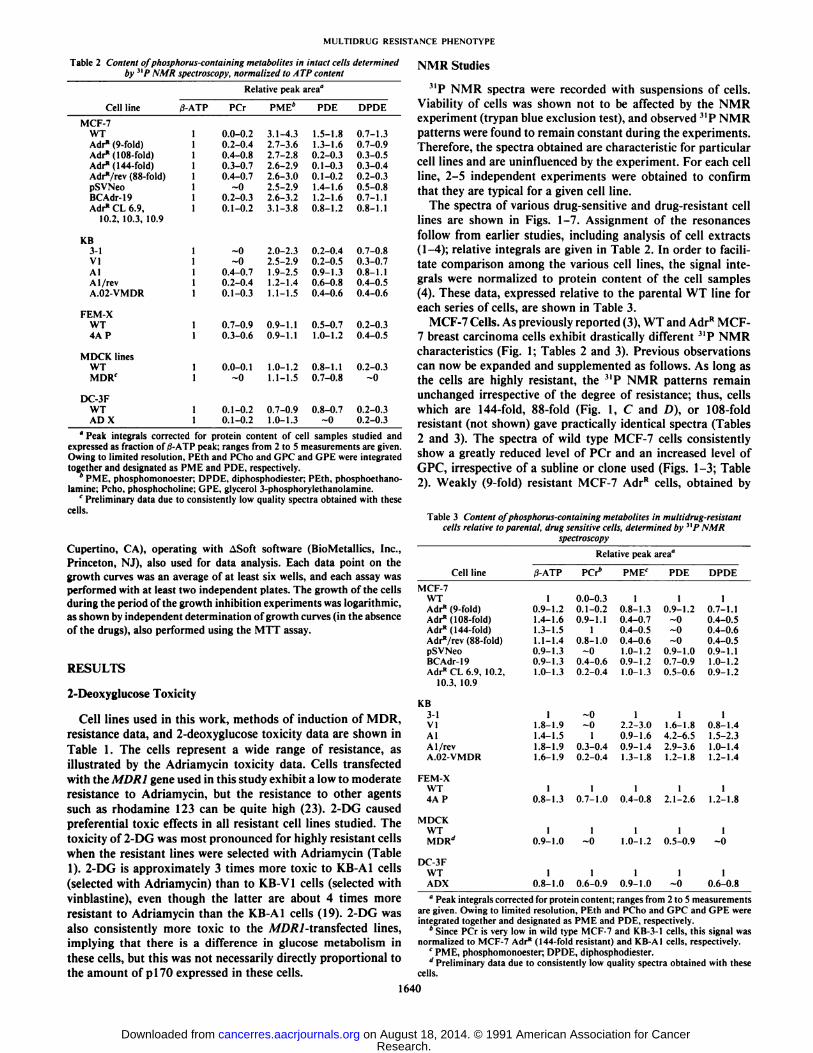
Table 2 Content of phosphorus-containing metabolites in intact cells determinedby 3>PNMR spectroscopy, normalized to ATP content
Relative peakarea"Cell
lineMCF-7WTAdr"
(9-fold)AdrR(108-fold)AdrR(144-fold)Adr"/rev(88-fold)pSVNeoBCAdr-19Adr"
CL6.9,10.2,
10.3,10.9KB3-1VIAlAl
/revA.02-VMDRFEM-XWT4APMDCK
linesWTMDRCDC-3FWTAD
X(j-ATP
PCr1
0.0-0.210.2-0.410.4-0.810.3-0.710.4-0.71~010.2-0.310.1-0.21
~01~010.4-0.710.2-0.410.1-0.31
0.7-0.910.3-0.61
0.0-0.11~01
0.1-0.2I0.1-0.2PME*3.1-4.32.7-3.62.7-2.82.6-2.92.6-3.02.5-2.92.6-3.23.1-3.82.0-2.32.5-2.91.9-2.51.2-1.41.1-1.50.9-1.10.9-1.11.0-1.21.1-1.50.7-0.91.0-1.3PDE1.5-1.81.3-1.60.2-0.30.1-0.30.1-0.21.4-1.61.2-1.60.8-1.20.2-0.40.2-0.50.9-1.30.6-0.80.4-0.60.5-0.71.0-1.20.8-1.10.7-0.80.8-0.7~0DPDE0.7-1.30.7-0.90.3-0.50.3-0.40.2-0.30.5-0.80.7-1.10.8-1.10.7-0.80.3-0.70.8-1.10.4-0.50.4-0.60.2-0.30.4-0.50.2-0.3~00.2-0.30.2-0.3
°Peak integrals corrected for protein content of cell samples studied andexpressed as fraction of ß-ATPpeak; ranges from 2 to 5 measurements are given.Owing to limited resolution. PEth and PCho and GPC and GPE were integratedtogether and designated as PME and PDE. respectively.
PME. phosphomonoester; DPDE, diphosphodiester: PEth. phosphoethano-lamine; Pcho, phosphocholine: GPE, glycerol 3-phosphorylethanolamine.
c Preliminary data due to consistently low quality spectra obtained with these
cells.
Cupertino, CA), operating with ASoft software (BioMetallics, Inc.,Princeton, NJ), also used for data analysis. Each data point on thegrowth curves was an average of at least six wells, and each assay wasperformed with at least two independent plates. The growth of the cellsduring the period of the growth inhibition experiments was logarithmic,as shown by independent determination of growth curves (in the absenceof the drugs), also performed using the MTT assay.
RESULTS
2-Deoxyglucose Toxicity
Cell lines used in this work, methods of induction of MDR,resistance data, and 2-deoxyglucose toxicity data are shown in
Table 1. The cells represent a wide range of resistance, asillustrated by the Adriamycin toxicity data. Cells transfectedwith the MDR] gene used in this study exhibit a low to moderateresistance to Adriamycin, but the resistance to other agentssuch as rhodamine 123 can be quite high (23). 2-DG causedpreferential toxic effects in all resistant cell lines studied. Thetoxicity of 2-DG was most pronounced for highly resistant cellswhen the resistant lines were selected with Adriamycin (Table1). 2-DG is approximately 3 times more toxic to KB-AI cells(selected with Adriamycin) than to KB-VI cells (selected withvinblastine), even though the latter are about 4 times moreresistant to Adriamycin than the KB-AI cells (19). 2-DG wasalso consistently more toxic to the A/D/?7-transfected lines,implying that there is a difference in glucose metabolism inthese cells, but this was not necessarily directly proportional tothe amount of p 170 expressed in these cells.
NMR Studies
"P NMR spectra were recorded with suspensions of cells.
Viability of cells was shown not to be affected by the NMRexperiment (trypan blue exclusion test), and observed 3IP NMR
patterns were found to remain constant during the experiments.Therefore, the spectra obtained are characteristic for particularcell lines and are uninfluenced by the experiment. For each cellline, 2-5 independent experiments were obtained to confirmthat they are typical for a given cell line.
The spectra of various drug-sensitive and drug-resistant celllines are shown in Figs. 1-7. Assignment of the resonances
follow from earlier studies, including analysis of cell extracts(1-4); relative integrals are given in Table 2. In order to facilitate comparison among the various cell lines, the signal integrals were normalized to protein content of the cell samples(4). These data, expressed relative to the parental WT line foreach series of cells, are shown in Table 3.
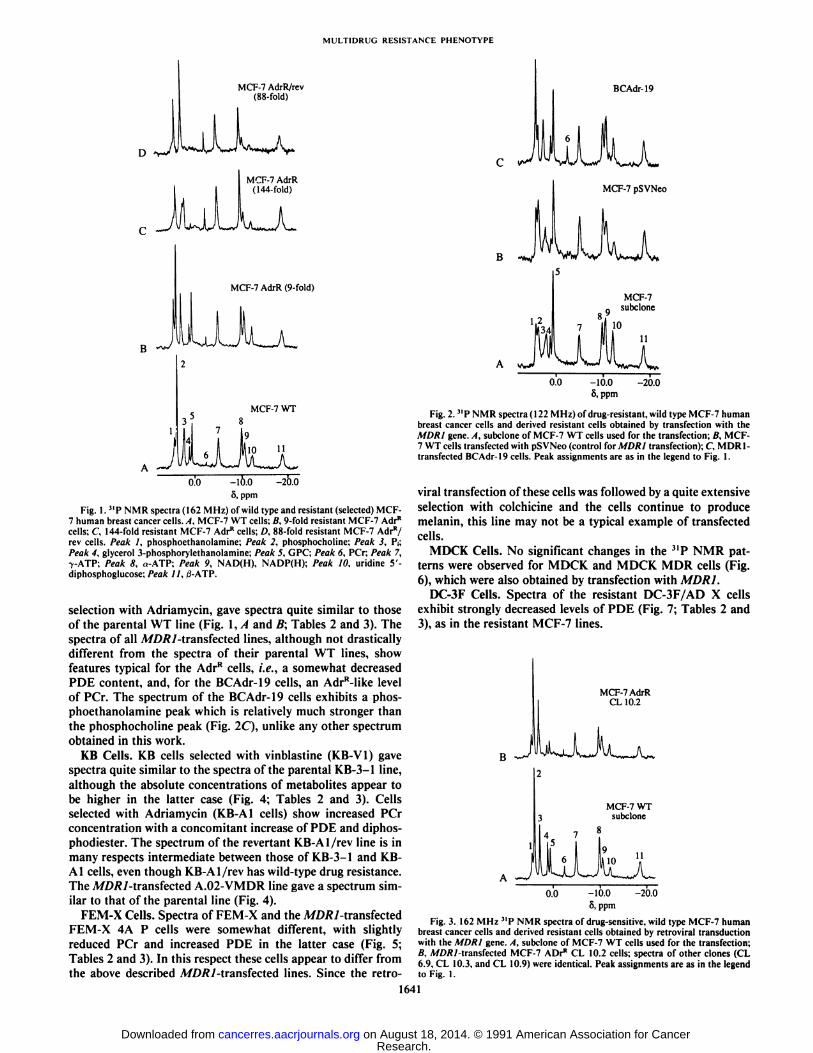
MCF-7 Cells. As previously reported (3), WT and AdrR MCF-7 breast carcinoma cells exhibit drastically different 3IP NMR
characteristics (Fig. 1; Tables 2 and 3). Previous observationscan now be expanded and supplemented as follows. As long asthe cells are highly resistant, the MP NMR patterns remain
unchanged irrespective of the degree of resistance; thus, cellswhich are 144-fold, 88-fold (Fig. 1, C and /)), or 108-foldresistant (not shown) gave practically identical spectra (Tables2 and 3). The spectra of wild type MCF-7 cells consistentlyshow a greatly reduced level of PCr and an increased level ofGPC, irrespective of a subline or clone used (Figs. 1-3; Table2). Weakly (9-fold) resistant MCF-7 AdrR cells, obtained by
Table 3 Content of phosphorus-containing metabolites in multidrug-resistantcells relative to parental, drug sensitive cells, determined by "P NMR
spectroscopyRelative peakarea"Cell
lineMCF-7WTAdr"
(9-fold)Adr"(108-fold)Adr"(144-fold)Adr"/rev(88-fold)pSVNeoBCAdr-19Adr"
CL 6.9,10.2,10.3,
10.9KB3-1VIAlAl
/revA.02-VMDRFEM
XWT4APMDCKWTMDRdDC-3FWTADX/3-ATP10.9-1.21.4-1.61.3-1.51.1-1.40.9-1.30.9-1.31.0-1.311.8-1.91.4-1.51.8-1.91.6-1.910.8-1.310.9-1.010.8-1.0PCr*0.0-0.30.1-0.20.9-1.110.8-1.0~00.4-0.60.2-0.4~0~010.3-0.40.2-0.410.7-1.01~010.6-0.9PMEf10.8-1.30.4-0.70.4-0.50.4-0.61.0-1.20.9-1.21.0-1.312.2-3.00.9-1.60.9-1.41.3-1.810.4-0.811.0-1.210.9-1.0PDE10.9-1.2~0~0~00.9-1.00.7-0.90.5-0.611.6-1.84.2-6.52.9-3.61.2-1.812.1-2.610.5-0.91~0DPDE10.7-1.10.4-0.50.4-0.60.4-0.50.9-1.11.0-1.20.9-1.210.8-1.41.5-2.31.0-1.41.2-1.411.2-1.81~010.6-0.8
" Peak integrals corrected for protein content; ranges from 2 to 5 measurements
are given. Owing to limited resolution, PEth and PCho and GPC and GPE wereintegrated together and designated as PME and PDE, respectively.
* Since PCr is very low in wild type MCF-7 and KB-3-1 cells, this signal wasnormalized to MCF-7 AdrR (144-fold resistant) and KB-AI cells, respectively.
' PME, phosphomonoester; DPDE, diphosphodiester.**Preliminary data due to consistently low quality spectra obtained with these
cells.
1640
Research. on August 18, 2014. © 1991 American Association for Cancercancerres.aacrjournals.org Downloaded from
ML'LTIDRl G RESISTANCE PHENOTYPE
MCF-7 AdrR/rev(88-fold)
MCF-7 AdrR(144-fold)
MCF-7 AdrR (9-fold)
MCF-7 WT
0.0 -10.0
8, ppm
-20.0
Fig. 1.31P NMR spectra (162 MHz) of wild type and resistant (selected) MCF-7 human breast cancer cells. A, MCF-7 WT cells; B. 9-fold resistant MCF-7 Adr"cells; C 144-fold resistant MCF-7 Adr" cells; D. 88-fold resistant MCF-7 Adr"/
rev cells. Peak I, phosphoethanolamine; Peak 2, phosphocholine; Peak 3, P¡;Peak 4, glycerol 3-phosphorylethanolamine; Peak 5, GPC; Peak 6, PCr; Peak 7,7-ATP; Peak 8. «-ATP:Peak 9, NAD(H), NADP(H); Peak 10, uridine 5'-diphosphoglucose; Peak II, 0-ATP.
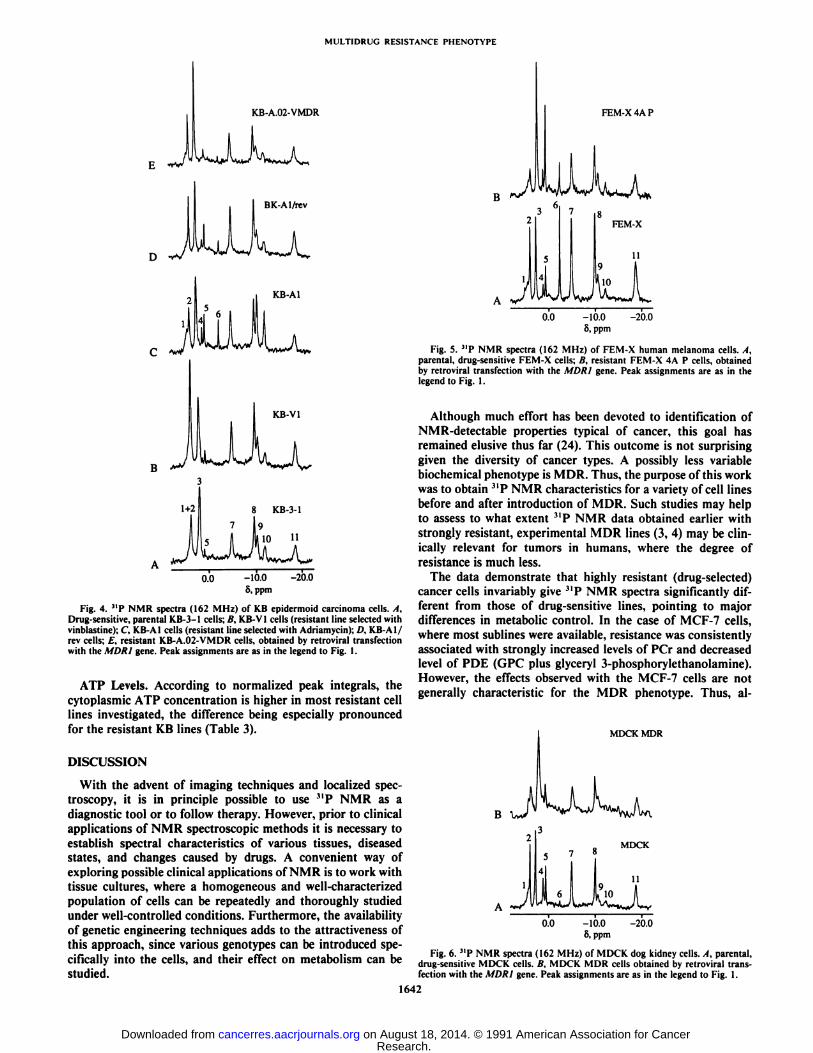
selection with Adriamycin, gave spectra quite similar to thoseof the parental WT line (Fig. 1, A and B; Tables 2 and 3). Thespectra of all A/D/?/-transfected lines, although not drasticallydifferent from the spectra of their parental WT lines, showfeatures typical for the AdrR cells, i.e., a somewhat decreasedPDE content, and, for the BCAdr-19 cells, an AdrR-like levelof PCr. The spectrum of the BCAdr-19 cells exhibits a phosphoethanolamine peak which is relatively much stronger thanthe phosphocholine peak (Fig. 2C), unlike any other spectrumobtained in this work.
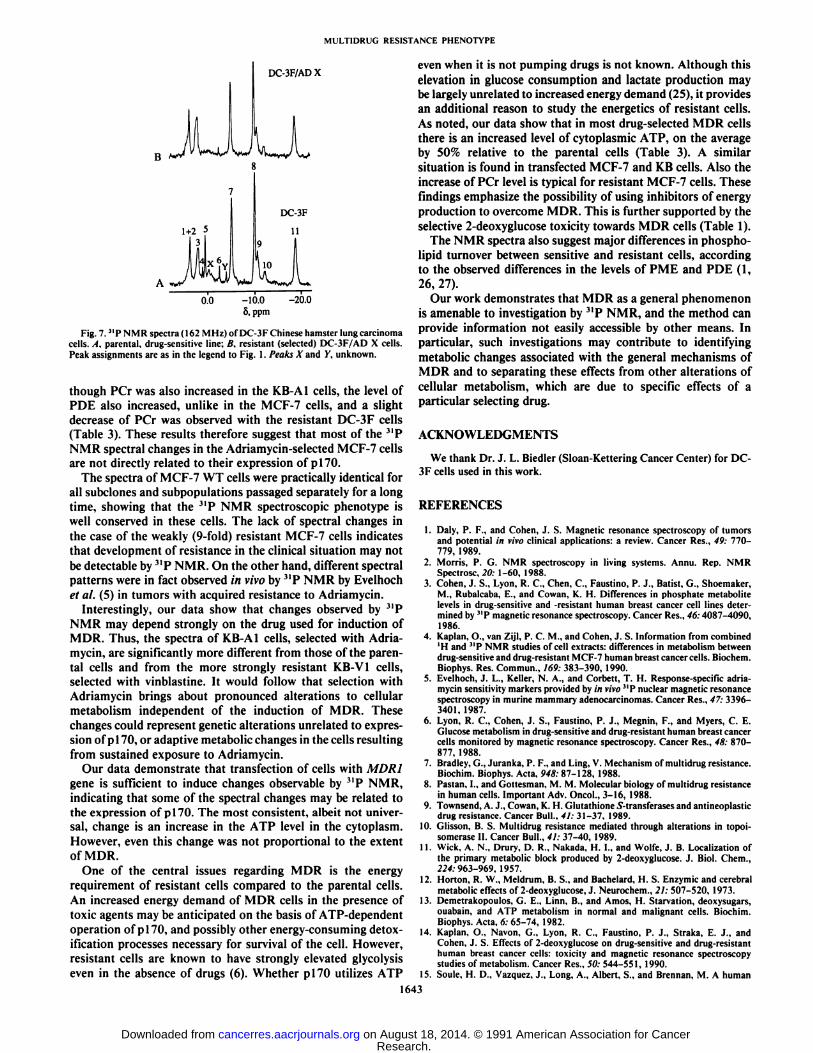
KB Cells. KB cells selected with vinblastine (KB-V1) gavespectra quite similar to the spectra of the parental KB-3-1 line,
although the absolute concentrations of metabolites appear tobe higher in the latter case (Fig. 4; Tables 2 and 3). Cellsselected with Adriamycin (KB-AI cells) show increased PCrconcentration with a concomitant increase of PDE and diphos-phodiester. The spectrum of the revenant KB-AI/rev line is inmany respects intermediate between those of KB-3-1 and KB-Al cells, even though KB-Al/rev has wild-type drug resistance.The A//)/?/-transfected A.02-VMDR line gave a spectrum similar to that of the parental line (Fig. 4).
FEM-X Cells. Spectra of FEM-X and the A/DÄ/-transfectedFEM-X 4A P cells were somewhat different, with slightlyreduced PCr and increased PDE in the latter case (Fig. 5;Tables 2 and 3). In this respect these cells appear to differ fromthe above described A//)/v7-transfected lines. Since the retro-
BCAdr-19
J
MCF-7 pSVNeo
0.0 -10.05, ppm
-20.0
Fig. 2."P NMR spectra (122 MHz) of drug-resistant, wild type MCF-7 humanbreast cancer cells and derived resistant cells obtained by transfection with theMORI gene. A, subclone of MCF-7 WT cells used for the transfection; B, MCF-7 WT cells transfected with pSVNeo (control for MDR1 transfection); C MDR1-transfected BCAdr-19 cells. Peak assignments are as in the legend to Fig. 1.
viral transfection of these cells was followed by a quite extensiveselection with colchicine and the cells continue to producemelanin, this line may not be a typical example of transfectedcells.
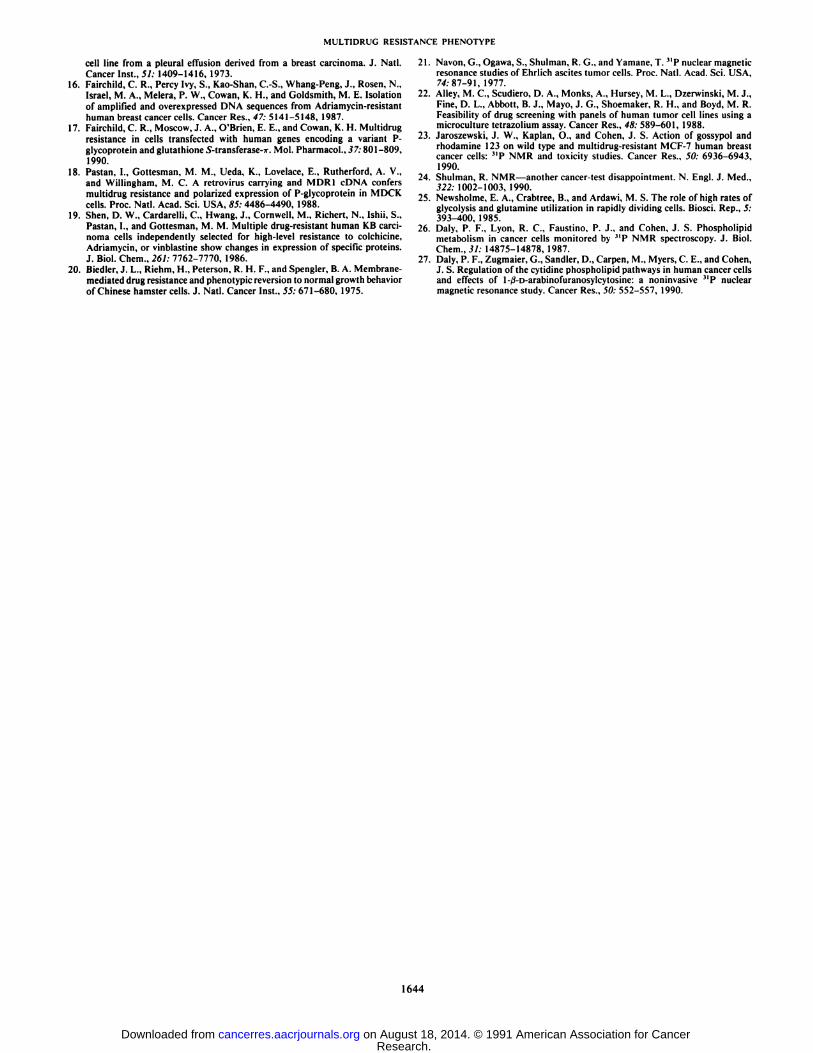
MDCK Cells. No significant changes in the "P NMR pat
terns were observed for MDCK and MDCK M DR cells (Fig.6), which were also obtained by transfection with MDR1.
DC-3F Cells. Spectra of the resistant DC-3F/AD X cellsexhibit strongly decreased levels of PDE (Fig. 7; Tables 2 and3), as in the resistant MCF-7 lines.
MCF-7 AdrRCL 10.2
0.0 -10.0
5, ppm
-20.0
Fig. 3. 162 MHz "P NMR spectra of drug-sensitive, wild type MCF-7 humanbreast cancer cells and derived resistant cells obtained by retroviral transductionwith the MORI gene. A, subclone of MCF-7 WT cells used for the transfection;B. .WßÄMransfected MCF-7 ADrR CL 10.2 cells; spectra of other clones (CL
6.9. CL 10.3. and CL 10.9| were identical. Peak assignments are as in the legendto Fig. I.
1641
Research. on August 18, 2014. © 1991 American Association for Cancercancerres.aacrjournals.org Downloaded from
MULTIDRUG RESISTANCE PHENOTVPE
J
KB-A.02-VMDR
O J
BK-Al/rev
KB-AI
KB-V1
0.0 -10.05, ppm
-20.0
Fig. 4. "P NMR spectra (162 MHz) of KB epidermoid carcinoma cells. A,Drug-sensitive, parental KB-3-1 cells; B, KB-V1 cells (resistant line selected withvinblastine): C, KB-AI cells (resistant line selected with Adriamycin); D, KB-AI/rev cells; E, resistant KB-A.02-VMDR cells, obtained by retroviral transfectionwith the MDR1 gene. Peak assignments are as in the legend to Fig. 1.
ATP Levels. According to normalized peak integrals, thecytoplasmic ATP concentration is higher in most resistant celllines investigated, the difference being especially pronouncedfor the resistant KB lines (Table 3).
DISCUSSION
With the advent of imaging techniques and localized spec-troscopy, it is in principle possible to use 3IP NMR as a
diagnostic tool or to follow therapy. However, prior to clinicalapplications of NMR spectroscopic methods it is necessary toestablish spectral characteristics of various tissues, diseasedstates, and changes caused by drugs. A convenient way ofexploring possible clinical applications of NMR is to work withtissue cultures, where a homogeneous and well-characterizedpopulation of cells can be repeatedly and thoroughly studiedunder well-controlled conditions. Furthermore, the availabilityof genetic engineering techniques adds to the attractiveness ofthis approach, since various genotypes can be introduced specifically into the cells, and their effect on metabolism can bestudied.
FEM-X 4A P
J
FEM-X
0.0 -10.0 -20.06, ppm
Fig. 5. 31P NMR spectra (162 MHz) of FEM-X human melanoma cells. A,parental, drug-sensitive FEM-X cells; B, resistant FEM-X 4A P cells, obtainedby retroviral transfection with the MORÃŒgene. Peak assignments are as in thelegend to Fig. 1.
Although much effort has been devoted to identification ofNMR-detectable properties typical of cancer, this goal hasremained elusive thus far (24). This outcome is not surprisinggiven the diversity of cancer types. A possibly less variablebiochemical phenotype is MDR. Thus, the purpose of this workwas to obtain "P NMR characteristics for a variety of cell lines
before and after introduction of MDR. Such studies may helpto assess to what extent 3IP NMR data obtained earlier with
strongly resistant, experimental MDR lines (3, 4) may be clinically relevant for tumors in humans, where the degree ofresistance is much less.
The data demonstrate that highly resistant (drug-selected)cancer cells invariably give "P NMR spectra significantly different from those of drug-sensitive lines, pointing to majordifferences in metabolic control. In the case of MCF-7 cells,where most sublines were available, resistance was consistentlyassociated with strongly increased levels of PCr and decreasedlevel of PDE (GPC plus glyceryl 3-phosphorylethanolamine).However, the effects observed with the MCF-7 cells are notgenerally characteristic for the MDR phenotype. Thus, al-
MDCK MDR
J0.0 -10.0
6, ppm-20.0
Fig. 6. "P NMR spectra (162 MHz) of MDCK dog kidney cells. A, parental,drug-sensitive MDCK cells. B, MDCK MDR cells obtained by retroviral transfection with the MDRI gene. Peak assignments are as in the legend to Fig. I.
1642
Research. on August 18, 2014. © 1991 American Association for Cancercancerres.aacrjournals.org Downloaded from
MULTIDRUG RESISTANCE PHENOTYPE
DC-3F/AD X
0.0 -10.0 -20.08, ppm
Fig. 7.3IP NMR spectra (162 MHz) of DC-3F Chinese hamster lung carcinomacells. A. parental, drug-sensitive line; B, resistant (selected) DC-3F/AD X cells.Peak assignments are as in the legend to Fig. 1. Peaks X and Y, unknown.
though PCr was also increased in the KB-AI cells, the level ofPDE also increased, unlike in the MCF-7 cells, and a slightdecrease of PCr was observed with the resistant DC-3F cells(Table 3). These results therefore suggest that most of the 3IPNMR spectral changes in the Adriamycin-selected MCF-7 cellsare not directly related to their expression of p 170.
The spectra of MCF-7 WT cells were practically identical forall subclones and subpopulations passaged separately for a longtime, showing that the "P NMR spectroscopic phenotype is
well conserved in these cells. The lack of spectral changes inthe case of the weakly (9-fold) resistant MCF-7 cells indicatesthat development of resistance in the clinical situation may notbe detectable by "P NMR. On the other hand, different spectralpatterns were in fact observed in vivo by "P NMR by Evelhoch
et al. (5) in tumors with acquired resistance to Adriamycin.Interestingly, our data show that changes observed by 3IP
NMR may depend strongly on the drug used for induction ofMDR. Thus, the spectra of KB-AI cells, selected with Adriamycin, are significantly more different from those of the parental cells and from the more strongly resistant KB-VI cells,selected with vinblastine. It would follow that selection withAdriamycin brings about pronounced alterations to cellularmetabolism independent of the induction of MDR. Thesechanges could represent genetic alterations unrelated to expression of pi 70, or adaptive metabolic changes in the cells resultingfrom sustained exposure to Adriamycin.
Our data demonstrate that transfection of cells with MDR1gene is sufficient to induce changes observable by 3IP NMR,
indicating that some of the spectral changes may be related tothe expression of p 170. The most consistent, albeit not universal, change is an increase in the ATP level in the cytoplasm.However, even this change was not proportional to the extentof MDR.
One of the central issues regarding MDR is the energyrequirement of resistant cells compared to the parental cells.An increased energy demand of MDR cells in the presence oftoxic agents may be anticipated on the basis of ATP-dependentoperation of p 170, and possibly other energy-consuming detoxification processes necessary for survival of the cell. However,resistant cells are known to have strongly elevated glycolysiseven in the absence of drugs (6). Whether p 170 utilizes ATP
even when it is not pumping drugs is not known. Although thiselevation in glucose consumption and láclateproduction maybe largely unrelated to increased energy demand (25), it providesan additional reason to study the energetics of resistant cells.As noted, our data show that in most drug-selected MDR cellsthere is an increased level of cytoplasmic ATP, on the averageby 50% relative to the parental cells (Table 3). A similarsituation is found in transfected MCF-7 and KB cells. Also theincrease of PCr level is typical for resistant MCF-7 cells. Thesefindings emphasize the possibility of using inhibitors of energyproduction to overcome MDR. This is further supported by theselective 2-deoxyglucose toxicity towards MDR cells (Table 1).
The NMR spectra also suggest major differences in phospho-lipid turnover between sensitive and resistant cells, accordingto the observed differences in the levels of PME and PDE (1,26, 27).
Our work demonstrates that MDR as a general phenomenonis amenable to investigation by "P NMR, and the method can
provide information not easily accessible by other means. Inparticular, such investigations may contribute to identifyingmetabolic changes associated with the general mechanisms ofMDR and to separating these effects from other alterations ofcellular metabolism, which are due to specific effects of aparticular selecting drug.
ACKNOWLEDGMENTS
We thank Dr. J. L. Biedler (Sloan-Kettering Cancer Center) for DC-3F cells used in this work.
REFERENCES
Daly, P. F., and Cohen, J. S. Magnetic resonance spectroscopy of tumorsand potential in vivo clinical applications: a review. Cancer Res., 49: 770-779, 1989.Morris, P. G. NMR spectroscopy in living systems. Annu. Rep. NMRSpectrosc, 20: 1-60, 1988.Cohen, J. S., Lyon, R. C., Chen, C., Faustino, P. J., Batist, G., Shoemaker.M.. Rubalcaba, E., and Cowan, K. H. Differences in phosphate metabolitelevels in drug-sensitive and -resistant human breast cancer cell lines determined by "P magnetic resonance spectroscopy. Cancer Res., 46:4087-4090,
1986.Kaplan. O.. van Zijl, P. C. M., and Cohen, J. S. Information from combined'H and 3IP NMR studies of cell extracts: differences in metabolism betweendrug-sensitive and drug-resistant MCF-7 human breast cancer cells. Biochem.Biophys. Res. Commun.. 169: 383-390. 1990.Evelhoch, J. L., Keller, N. A., and Corbett, T. H. Response-specific adria-mycin sensitivity markers provided by in vivo31Pnuclear magnetic resonancespectroscopy in murine mammary adenocarcinomas. Cancer Res., 47: 3396-3401, 1987.Lyon, R. C., Cohen, J. S.. Faustino, P. J., Megnin, F., and Myers, C. E.Glucose metabolism in drug-sensitive and drug-resistant human breast cancercells monitored by magnetic resonance spectroscopy. Cancer Res., 48: 870-877. 1988.Bradley, G., Juranka. P. F., and Ling. V. Mechanism of multidrug resistance.Biochim. Biophys. Acta, 948: 87-128, 1988.Pastan, I., and Gottesman. M. M. Molecular biology of multidrug resistancein human cells. Important Adv. Oncol., 3-16, 1988.Townsend, A. J.. Cowan, K. H. Glutathione 5-transferases and antineoplasticdrug resistance. Cancer Bull.. 41: 31-37, 1989.Glisson, B. S. Multidrug resistance mediated through alterations in topoi-somerase II. Cancer Bull., 41: 37-40, 1989.Wick, A. N., Drury. D. R.. Nakada, H. I., and Wolfe, J. B. Localization ofthe primary metabolic block produced by 2-deoxyglucose. J. Biol. Chem.,224:963-969.1957.Horton. R. W.. Meldrum, B. S., and Bachelard, H. S. Enzymic and cerebralmetabolic effects of 2-deoxyglucose. J. Neurochem., 21: 507-520. 1973.Demetrakopoulos, G. E.. Linn. B., and Amos, H. Starvation, deoxysugars,ouabain, and ATP metabolism in normal and malignant cells. Biochim.Biophys. Acta, 6: 65-74, 1982.Kaplan, O., Navon, G.. Lyon. R. C., Faustino, P. J., Straka, E. J., andCohen. J. S. Effects of 2-deoxyglucose on drug-sensitive and drug-resistanthuman breast cancer cells: toxicity and magnetic resonance spectroscopystudies of metabolism. Cancer Res., 50: 544-551, 1990.Soule, H. D.. Vazquez. J.. Long, A., Albert, S., and Brennan, M. A human
9.
10.
11.
12.
13.
14.
15.
1643
Research. on August 18, 2014. © 1991 American Association for Cancercancerres.aacrjournals.org Downloaded from
MULTIDRUG RESISTANCE PHENOTVPE
cell line from a pleural effusion derived from a breast carcinoma. J. Nati.Cancer Inst., 51: 1409-1416, 1973.
16. Fairchild, C. R., Percy Ivy, S., Kao-Shan. C.-S., Whang-Peng, J., Rosen, N.,Israel, M. A., Melera, P. W., Cowan, K. H., and Goldsmith, M. E. Isolationof amplified and overexpressed DNA sequences from Adriamycin-resistanthuman breast cancer cells. Cancer Res., 47: 5141-5148, 1987.
17. Fairchild. C. R., Moscow, J. A., O'Brien, E. E., and Cowan, K. H. Multidrugresistance in cells transfected with human genes encoding a variant P-glycoprotein and glutathione S-transferase-r. Mol. Pharmacol., 37:801 -809,1990.
18. Pastan, I.. Gottesman, M. M., Ueda, K., Lovelace, E., Rutherford, A. V.,and Willingham. M. C. A retrovirus carrying and MDR1 cDNA confersumiliili m.' resistance and polarized expression of P-glycoprotein in MDCKcells. Proc. Nati. Acad. Sci. USA, 85: 4486-4490, 1988.
19. Shen, D. W., Cardarelli, C, Hwang, J., Cornwell, M., Richer!, N., Ishii, S.,Pastan, I., and Gottesman, M. M. Multiple drug-resistant human KB carcinoma cells independently selected for high-level resistance to colchicine,Adriamycin, or vinblastine show changes in expression of specific proteins.J. Biol. Chem., 261: 7762-7770, 1986.
20. Biedler, J. L., Riehm, H., Peterson. R. H. F., and Spengler, B. A. Membrane-mediated drug resistance and phenotypic reversion to normal growth behaviorof Chinese hamster cells. J. Nati. Cancer Inst., 55: 671-680, 1975.
21. Navon,G.,Ogawa, S., Shulman, R. G., and Yamane, T. "P nuclear magnetic
resonance studies of Ehrlich ascites tumor cells. Proc. Nati. Acad. Sci. USA,74:87-91, 1977.
22. Alley, M. C., Scudiero, D. A., Monks, A., Hursey, M. L., Dzerwinski, M. J.,Fine, D. L., Abbott, B. J., Mayo, J. G., Shoemaker, R. H., and Boyd, M. R.Feasibility of drug screening with panels of human tumor cell lines using amicroculture tetrazolium assay. Cancer Res., 48: 589-601, 1988.
23. Jaroszewski, J. W., Kaplan, O., and Cohen. J. S. Action of gossypol andrhodamine 123 on wild type and multidrug-resistant MCF-7 human breastcancer cells: "P NMR and toxicity studies. Cancer Res., 50: 6936-6943,
1990.24. Shulman, R. NMR—another cancer-test disappointment. N. Engl. J. Med.,
322: 1002-1003, 1990.25. Newsholme, E. A., Crabtree, B., and Ardawi, M. S. The role of high rates of
glycolysis and glutamine utilization in rapidly dividing cells. Biosci. Rep., 5:393-400, 1985.
26. Daly. P. F., Lyon, R. C.. Faustino. P. J.. and Cohen, J. S. Phospholipidmetabolism in cancer cells monitored by '"P NMR spectroscopy. J. Biol.Chem., 31: 14875-14878, 1987.
27. Daly, P. F., Zugmaier, G., Sandier, D., Carpen, M.. Myers. C. E., and Cohen,J. S. Regulation of the cytidine phospholipid pathways in human cancer cellsand effects of l-/i-D-arabinofuranosylcytosine: a noninvasive "P nuclearmagnetic resonance study. Cancer Res., 50: 552-557. 1990.
1644
Research. on August 18, 2014. © 1991 American Association for Cancercancerres.aacrjournals.org Downloaded from