de lo invisible a lo posible - Repositorio Institucional UPN
Upload
independentCategory
view
0download
0
WORLDDRUG REPORT2010

UNITED NATIONSNew York, 2010
World Drug Report2010
UNITED NATIONS OFFICE ON DRUGS AND CRIME Vienna

Copyright © 2010, United Nations Office on Drugs and Crime (UNODC)ISBN: 978-92-1-148256-0United Nations Publication Sales No. E.10.XI.13
This publication may be reproduced in whole or in part and in any formfor educational or non-profit purposes without special permission fromthe copyright holder, provided acknowledgement of the source is made.UNODC would appreciate receiving a copy of any publication that uses this publication as a source.
Suggested citation: UNODC, World Drug Report 2010 (United NationsPublication, Sales No. E.10.XI.13).
No use of this publication may be made for resale or any other commercialpurpose whatsoever without prior permission in writing from the United Nations Office on Drugs and Crime. Applications for suchpermission, with a statement of purpose and intent of the reproduction,should be addressed to UNODC, Policy Analysis and Research Branch.
DISCLAIMERS
This report has not been formally edited.
The contents of this publication do not necessarily reflect the views orpolicies of UNODC or contributory organizations and neither do theyimply any endorsement.
The designations employed and the presentation of material in this publicationdo not imply the expression of any opinion whatsoever on the part of UNODC concerning the legal status of any country, territory or city or itsauthorities, or concerning the delimitation of its frontiers or boundaries.
Comments on the report are welcome and can be sent to:
Division for Policy Analysis and Public AffairsUnited Nations Office on Drugs and CrimePO Box 5001400 Vienna AustriaTel: (+43) 1 26060 0Fax: (+43) 1 26060 5827
E-mail: [email protected]
Website: www.unodc.org

1
Editorial and production team
The 2010 World Drug Report was produced under the supervision of Sandeep Chawla, Director, Division for Policy Analysis and Public Affairs.
Core team
Laboratory and Scientific SectionJustice Tettey Beate Hammond Matthew NiceBarbara Remberg
Statistics and Surveys SectionAngela MeCoen BussinkPhil DavisKamran NiazPreethi PereraCatherine PysdenMartin RaithelhuberAnousha RennerAli SaadeddinAntoine Vella
Studies and Threat Analysis SectionThibault le PichonHakan DemirbükenRaggie JohansenAnja KorenblikSuzanne KunnenKristina KuttnigTed LeggettHayder MiliThomas Pietschmann
The 2010 World Drug Report also benefited from the work and expertise of many other UNODC staff members in Vienna and around the world.
ACKNOWLEDGEMENTS

2
Acknowledgements 1Foreword 4Introduction 7 Explanatory notes 8Executive summary 11
1. trAnsnAtIonAl drug mArkEt AnAlysIs 1.1 Introduction 31 1.2 The global heroin market 37 1.2.1 Dimensions 38 1.2.2 The ‘Northern route’ from Afghanistan to the Russian Federation 48 1.2.3 The ‘Balkan route’ from Afghanistan to West and Central Europe 53 1.2.4 The ‘Southern route’ from Afghanistan via Pakistan to the world 60 1.2.5 Implications for response 63 1.3 The global cocaine market 1.3.1 Dimensions 65 1.3.2 Cocaine from the Andean region to North America 72 1.3.3 Cocaine from the Andean region to Europe 83 1.3.4 Implications for response 93 1.4 The global amphetamine-type stimulants market 1.4.1 What are ATS? 95 1.4.2 Dimensions 96 1.4.3 The demand for ATS 100 1.4.4 Key ATS issues 107 1.4.5 Implications for response 118
2. drug stAtIstICs And trEnds 2.1 Understanding the extent and nature of drug use 123 2.2 Opium/heroin 2.2.1 Production 137 2.2.2 Seizures 141 2.2.3 Prices 149 2.2.4 Consumption 152 2.3 Coca/cocaine 2.3.1 Production 161 2.3.2 Seizures 166 2.3.3 Prices 170 2.3.4 Consumption 173 2.4 Cannabis 2.4.1 Production 183 2.4.2 Seizures 188 2.4.3 Prices 191 2.4.4 Consumption 194 2.5 Amphetamine-type stimulants 2.5.1 Manufacture 203 2.5.2 Seizures 207 2.5.3 Consumption 214
CONTENTS
3
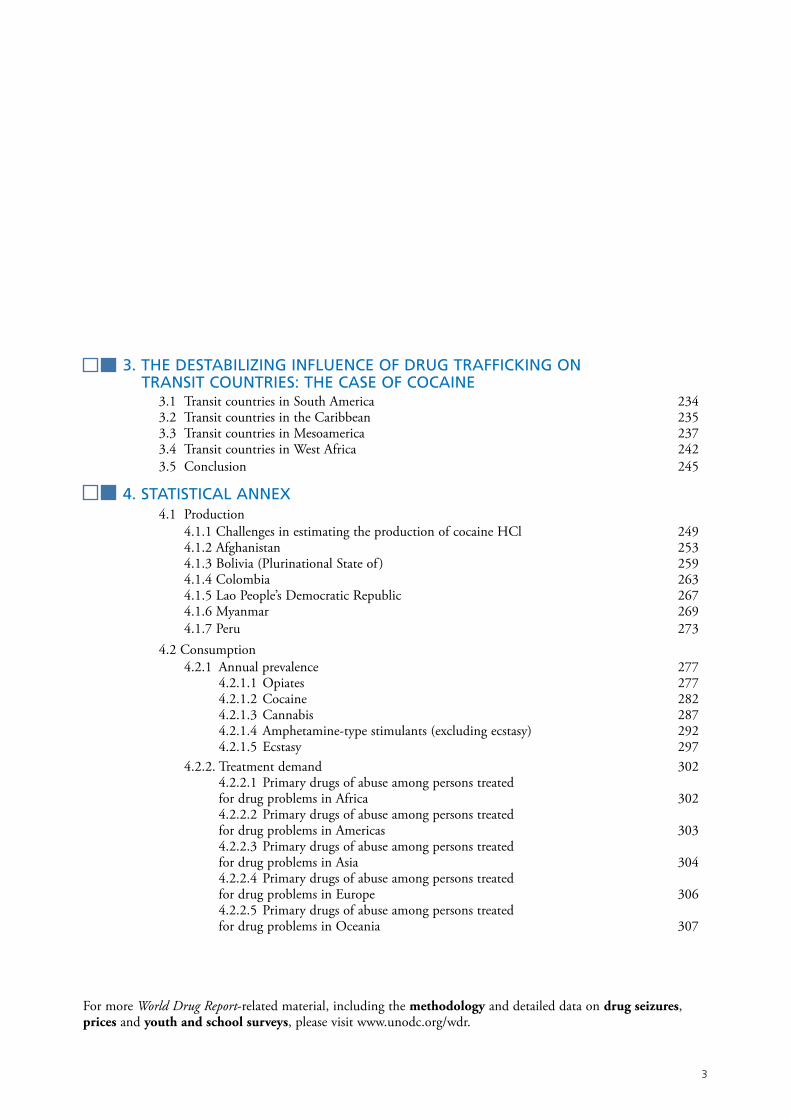
3. tHE dEstABIlIZIng InFluEnCE oF drug trAFFICkIng on trAnsIt CountrIEs: tHE CAsE oF CoCAInE 3.1 Transit countries in South America 234 3.2 Transit countries in the Caribbean 235 3.3 Transit countries in Mesoamerica 237 3.4 Transit countries in West Africa 242 3.5 Conclusion 245
4. stAtIstICAl AnnEx 4.1 Production 4.1.1 Challenges in estimating the production of cocaine HCl 249 4.1.2 Afghanistan 253 4.1.3 Bolivia (Plurinational State of ) 259 4.1.4 Colombia 263 4.1.5 Lao People’s Democratic Republic 267 4.1.6 Myanmar 269 4.1.7 Peru 273 4.2 Consumption 4.2.1 Annual prevalence 277 4.2.1.1 Opiates 277 4.2.1.2 Cocaine 282 4.2.1.3 Cannabis 287 4.2.1.4 Amphetamine-type stimulants (excluding ecstasy) 292 4.2.1.5 Ecstasy 297 4.2.2. Treatment demand 302 4.2.2.1 Primary drugs of abuse among persons treated for drug problems in Africa 302 4.2.2.2 Primary drugs of abuse among persons treated for drug problems in Americas 303 4.2.2.3 Primary drugs of abuse among persons treated for drug problems in Asia 304 4.2.2.4 Primary drugs of abuse among persons treated for drug problems in Europe 306 4.2.2.5 Primary drugs of abuse among persons treated for drug problems in Oceania 307
For more World Drug Report-related material, including the methodology and detailed data on drug seizures, prices and youth and school surveys, please visit www.unodc.org/wdr.

4
In the past decade, drug control has matured. Policy has become more responsive to the needs of those most seri-ously affected, along the whole chain of the drug indus-try – from poor farmers who cultivate it, to desperate addicts who consume it, as well as those caught in the cross-fire of the traffickers. Countries are learning from each others’ experiences, and drawing on expertise from the international community.
Drug control is also increasingly taking a more balanced approach, focussed on development, security, justice and health to reduce supply and demand, and disrupting illicit flows. There is an understanding that in regions where illicit crops are grown, it is vital to eradicate pov-erty, not just drugs. There is a realization that under-development makes countries vulnerable to drug trafficking, and other forms of organized crime: therefore development is part of drug control, and vice versa.
Most importantly, we have returned to the roots of drug control, placing health at the core of drug policy. By recognizing that drug addiction is a treatable health condition, we have developed scientific, yet compassion-ate, new ways to help those affected. Slowly, people are starting to realize that drug addicts should be sent to treatment, not to jail. And drug treatment is becoming part of mainstream healthcare.
Beware the side effects of complacency
This approach is paying off. The world’s supply of the two main problem drugs – opiates and cocaine – has been declining over the last two years. The global area under opium cultivation has dropped by almost a quar-ter (23%) in the past two years, and opium production looks set to fall steeply this year due to a blight that could wipe out a quarter of Afghanistan’s production. Coca cultivation is down by 28% in the past decade. Heroin and cocaine markets are stable in the developed world. Indeed, cocaine consumption has fallen significantly in the United States in the past few years. The retail value of the US cocaine market has declined by about two thirds in the 1990s, and by about one quarter in the past decade. One reason behind the violence in Mexico is that drug traffickers are fighting over a shrinking market.
Shifting the problem to the developing world
Most worrisome are recent developments in the third world. Market forces have already shaped the asymmet-
ric dimensions of the drug economy; the world’s biggest consumers of the poison (the rich countries) have imposed upon the poor (the main locations of supply and trafficking) the greatest damage.
But poor countries have other priorities and fewer resources. They are not in a position to absorb the con-sequences of increased drug use. As a result, there is now the risk of a public health disaster in developing coun-tries that would enslave masses of humanity to the misery of drug dependence – another drama in lands already ravaged by so many tragedies. The warning lights are already flashing. Look at the boom in heroin consumption in Eastern Africa, or the explosion of cocaine use in West Africa or South America, or the surge in the production and abuse of synthetic drugs in the Middle East and South East Asia. We will not solve the world drugs problem by shifting consumption from the developed to the developing world.
Changing to other drugs
Furthermore, stabilization of the cocaine and heroin markets masks a growing problem of the misuse of pre-scription drugs in many parts of the world. And the global number of people using amphetamine-type stim-ulants (ATS) is likely to exceed the number of opiate and cocaine users combined. The ATS market is harder to track because of short trafficking routes (manufacturing usually takes place close to main consumer markets), and the fact that many of the raw materials are both legal and readily available. Furthermore, manufacturers are quick to market new products (like ketamine, Mephedrone and Spice) and exploit new markets. We will not solve the world drugs problem if addiction simply shifts from cocaine and heroin to other addictive substances.
What do we propose, at UNODC? We champion plac-ing drug policy at the intersection of health, security, development and justice. Let me explain.
The right to health
a.) Universal access to drug therapy. At the United Nations, we are working with the World Health Organ-ization, and advocate universal access to drug treatment. We work with UNAIDS to prevent an HIV epidemic among injecting addicts. I appreciate the support that is coming from the community level for these initiatives.
FOrEWOrD
5
(b.) Universal access to therapy by means of drugs. We should not only stop the harm caused by drugs: we should unleash the capacity of drugs to do good. What do I mean? Recall that the Preamble of the Single Con-vention (from 1961) recognizes that “… the medical use of narcotic drugs is indispensible for the relief of pain, ….and adequate provision must be made to ensure their avail-ability …” Although there is an over-supply of opium in the world, many people who suffer major illnesses have no access to palliative care. Why should a Nigerian con-sumed by AIDS or a Mexican cancer patient, be denied medication offered to their Swedish or American coun-terparts? Help us overcome cultural, professional, administrative and socio-economic factors that conspire to deny people the opium-based relief (morphine) they need.
The right to development
While the pendulum of drug control is swinging back towards the right to health and human rights, we must not neglect development.
As illustrated in various recent UNODC reports, includ-ing this one, drug production and trafficking are both causes and consequences of poverty. Indeed, 22 of the 34 countries least likely to achieve the Millennium Development Goals are in the midst – or emerging from – conflicts, located in regions that are magnets for drug cultivation and trafficking. More development means less crime and less conflict. That is why UNODC is working with governments, regional organizations and development banks to promote drug control policy as ways to foster development, and vice-versa – for example in the Balkans, Central and West Asia, Mesoamerica, West and East Africa.
The right to security
Yet, the stakes are high and getting higher. Drug-traffick-ing has become the main source of revenue for organized crime, as well as to terrorists and insurgents: in other words, drug-related illegality has become a threat to nations in so many theatres around the world. Recent developments in West Africa, the Sahel, and parts of Central America show the very real dangers of narco-trafficking to security, even the sovereignty of states.
So grave is the danger that the issue is now periodically on the agenda of the Security Council. Unless we deal
effectively with the threat posed by organized crime, our societies will be held hostage – and drug control will be jeopardized, by renewed calls to dump the three UN drug conventions that critics say are the cause of crime and instability. This would undo the progress that has been made in drug control over the past decade, and unleash a public health disaster.
Human rights
Above all, we must move human rights into the main-stream of drug control. Around the world, millions of people (including children) caught taking drugs are sent to jail, not to treatment. In some countries, what is sup-posed to be drug treatment amounts to cruel, inhuman or degrading punishment – the equivalent of torture. In several Member States, people are executed for drug-re-lated offences. In others, drug traffickers are gunned down by extra-judicial hit squads. As human beings, we have a shared responsibility to ensure that this comes to an end. Just because people take drugs, or are behind bars, this doesn’t abolish their right to be a person pro-tected by the law – domestic and international.
The global perspective offered by the World Drug Report 2010
In conclusion, this World Drug Report shows the various components of the drug market, and explains the dynamics that drive them. It confirms that drug policy must stay the course we have promoted at UNODC over the past years, focussed on the four basic rights of health, development, security and human rights.
Antonio Maria Costa Executive Director
United Nations Office on Drugs and Crime


INTrODUCTION
7
Drug control has been on the global agenda for more than a century. As documented in the World Drug Report 2008, the Chinese opium epidemic in the early twenti-eth century spurred concerted international action, chiefly in the form of a series of treaties passed over several decades. These treaties, in particular the 1961 Single Convention on Narcotic Drugs, the 1971 Con-vention on Psychotropic Substances, and the 1988 Con-vention against the Illicit Traffic in Narcotic Drugs and Psychotropic Substances, continue to define the interna-tional drug control system. The United Nations Office on Drugs and Crime (UNODC) is the guardian of these treaties and the United Nations lead agency on drug control.
In March 2009, Member States committed to elimina-tion or significant reduction in the global illicit drug supply and demand by 2019 and emphasized that research, data collection and analysis were essential to support and monitor the efforts required to reach that objective. UNODC has provided comprehensive assess-ments of the global drug problems and their evolution annually since 1999, and will continue to fulfil its man-date this year with the publication of the World Drug Report 2010.
In order to prepare the World Drug Report, UNODC relies on Member States to provide data, primarily through the Annual Reports Questionnaire (ARQ). The ARQ was distributed to 192 Member States, and UNODC received 110 replies to the drug abuse section and 114 replies to the illicit supply of drugs section from Member States (and territories). In general, most coun-tries’ ability to provide information on illicit drug supply is significantly better than their ability to provide demand-related data. Despite commendable progress, for example in the area of prevalence estimates, far more remains to be done to provide a solid, reliable basis for trend and policy analysis.
The report includes in-depth and cross-sectoral analyses of transnational drug markets (chapter 1) as well as the latest statistical data and trends regarding the world drug situation (chapter 2). This year, the report also discusses the impact of transnational drug trafficking on transit countries (chapter 3).

8
Types of drugs:
ATS – Amphetamine-type stimulants (ATS) are a group of substances comprised of synthetic stimulants from the amphetamines-group of substances, including amphetamine, methamphetamine, methcathinone and the ecstasy-group substances (MDMA and its ana-logues). In cases where countries report to UNODC without indicating the specific ATS they are referring to, the term non-specified amphetamines is used. In cases where ecstasy is referred to in enclosed brackets (‘ecstasy’), the drug represents cases where the drug is sold as ecstasy (MDMA) but which may contain a substitute chemical and not MDMA.
Coca paste (or coca base) - An extract of the leaves of the coca bush. Purification of coca paste yields cocaine (base and hydrochloride). The term ‘cocaine (base and salts)’ is used to refer to all three products in the aggregate.
Crack (cocaine) - Cocaine base obtained from cocaine hydrochloride through conversion processes to make it suitable for smoking.
Heroin HCl (heroin hydrochloride) – Injectable form of heroin, sometimes referred to as ‘Heroin no. 4’.
Heroin no. 3 – A less refined form of heroin suitable for smoking.
Poppy straw - All parts (except the seeds) of the opium poppy, after mowing.
Terms: Since there is some scientific and legal ambiguity about the distinctions between drug 'use', 'misuse' and 'abuse', this report uses the neutral terms, drug 'use' or 'consumption'.
Annual prevalence refers to the total number of people of a given age range who have used a given drug a least once in the past year, divided by the number of people of a given age.
Maps: The boundaries and names shown and the desig-nations used on maps do not imply official endorsement or acceptance by the United Nations. A dotted line rep-resents approximately the line of control in Jammu and Kashmir agreed upon by India and Pakistan. The final status of Jammu and Kashmir has not yet been agreed upon by the parties. Disputed boundaries (China/India) are represented by cross hatch due to the difficulty of showing sufficient detail.
Population data: The data on population used in this report comes from: United Nations, Department of Eco-nomic and Social Affairs, Population Division, World Population Prospects: The 2008 Revision, 2009.
Regions: In various sections, this report uses a number of regional designations. These are not official designa-tions. They are defined as follows:
East Africa: Burundi, Comoros, Djibouti, Eritrea, •Ethiopia, Kenya, Madagascar, Mauritius, Rwanda, Seychelles, Somalia, Tanzania (United Republic of ) and Uganda.
North Africa: Algeria, Egypt, Libyan Arab Jamahiri- •ya, Morocco, Sudan and Tunisia.
Southern Africa: Angola, Botswana, Lesotho, Ma- •lawi, Mozambique, Namibia, South Africa, Swazi-land, Zambia and Zimbabwe.
West and Central Africa: Benin, Burkina Faso, Cam- •eroon, Cape Verde, Central African Republic, Chad, Congo (Democratic Republic of ), Congo (Republic of ), Côte d’Ivoire, Equatorial Guinea, Gabon, Gam-bia, Ghana, Guinea, Guinea-Bissau, Liberia, Mali, Mauritania, Niger, Nigeria, Sao Tome and Principe, Senegal, Sierra Leone and Togo.
Caribbean: Antigua and Barbuda, Bahamas, Barba- •dos, Cuba, Dominica, Dominican Republic, Gre-nada, Haiti, Jamaica, Saint Kitts and Nevis, Saint Lucia, Saint Vincent and the Grenadines and Trini-dad and Tobago.
Central America: Belize, Costa Rica, El Salvador, •Guatemala, Honduras, Nicaragua and Panama.
North America: Canada, Mexico and the United •States of America.
EXPLANATOrY NOTES

9
South America: Argentina, Bolivia (Plurinational •State of ), Brazil, Chile, Colombia, Ecuador, Guy-ana, Paraguay, Peru, Suriname, Uruguay and Ven-ezuela (Bolivarian Republic of ).
Central Asia and Transcaucasia: Armenia, Azerbai- •jan, Georgia, Kazakhstan, Kyrgyzstan, Tajikistan, Turkmenistan and Uzbekistan.
East and South-East Asia: Brunei Darussalam, Cam- •bodia, China (including Hong Kong, Macao, and Taiwan Province of China), Indonesia, Japan, Korea (Democratic People’s Republic of ), Korea (Republic of ), Lao People’s Democratic Republic, Malaysia, Mongolia, Myanmar, Philippines, Singapore, Thai-land, Timor-Leste and Viet Nam. The Greater Me-kong Subregion (GMS) comprises Cambodia, the Lao People’s Democratic Republic, Myanmar, Thai-land, Viet Nam and Yunnan and Guangxi provinces in China.
Near and Middle East/South-West Asia: Afghani- •stan, Bahrain, Iran (Islamic Republic of ), Iraq, Is-rael, Jordan, Kuwait, Lebanon, Oman, Pakistan, Qatar, Saudi Arabia, Syrian Arab Republic, United Arab Emirates and Yemen. The Near and Middle East refers to a subregion which includes Bahrain, Israel, Jordan, Kuwait, Lebanon, Oman, Qatar, Saudi Arabia, the Syrian Arab Republic, the United Arab Emirates and Yemen.
South Asia: Bangladesh, Bhutan, India, Maldives, •Nepal and Sri Lanka.
East Europe: Belarus, Moldova (Republic of ), Rus- •sian Federation and Ukraine.
South-East Europe: Albania, Bosnia and Herzegovi- •na, Bulgaria, Croatia, the former Yugoslav Republic of Macedonia, Montenegro, Romania, Serbia and Turkey.
West and Central Europe: Andorra, Austria, Bel- •gium, Cyprus, Czech Republic, Denmark, Estonia, Finland, France, Germany, Greece, Hungary, Ice-land, Ireland, Italy, Latvia, Liechtenstein, Lithuania, Luxembourg, Malta, Monaco, Netherlands, Nor-way, Poland, Portugal, San Marino, Slovakia, Slov-enia, Spain, Sweden, Switzerland and the United Kingdom.
Oceania: Australia, Fiji, Kiribati, Marshall Islands, •Micronesia, Nauru, New Zealand, Palau, Papua New Guinea, Samoa, Solomon Islands, Tonga, Tu-valu, Vanuatu and other small island territories.
10
EXPLANATOrY NOTES
AIDS Acquired Immune-Deficiency Syndrome
ARQ UNODC annual reports questionnaireATS amphetamine-type stimulants
CICAD Inter-American Drug Abuse Control Commission
CIS Commonwealth of Independent StatesCOP Colombian peso
DAINAP Drug Abuse Information Network for Asia and the Pacific
DEA United States, Drug Enforcement Administration
DELTA UNODC Database on Estimates and Long Term Trend Analysis
DIRAN Colombian National Police – Antinarcotics Directorate
DUMA Drug Use Monitoring in AustraliaEMCDDA European Monitoring Centre for
Drugs and Drug AddictionESPAD European School Survey Project
on Alcohol and other DrugsEUROPOL European Police Office
F.O. UNODC Field OfficeGAP UNODC Global Assessment
Programme on Drug AbuseGovt. GovernmentHIV Human Immunodeficiency Virus
HONLEA Heads of National Drug Law Enforcement Agencies
IDS UNODC individual drug seizures database
IDU injecting drug useINCB International Narcotics Control Board
INCSR International Narcotics Control Strat-egy Report (United States Department of State)
INTERPOL/ICPO
International Criminal Police Organization
LSD lysergic acid diethylamideMDA 3,4-methylenedioxyamphetamine
(tenamfetamine)MDE 3,4-methylenedioxyethylamphetamine
MDMA 3,4-methylenedioxymethamphetamineNGO Non-governmental organizationNIDA National Institute of Drug Abuse
(USA)OECD Organization for Economic
Co-operation and Development ONDCP Office of National Drug Control
Policy (USA)P-2-P 1-phenyl-2-propanone (BMK)
SACENDU South African Community Epidemiology Network on Drug Use
SAMHSA Substance Abuse and Mental Health Services Administration (USA)
SRO safrole-rich oils
THC tetrahydrocannabinolUNAIDS Joint United Nations Programme on
HIV/AIDSUNODC United Nations Office on Drugs and
CrimeWCO World Customs OrganizationWDR
WHO
World Drug Report
World Health Organization3,4-MDP-2-P 3,4-methylenedioxyphenyl-2-pro-
panone (PMK)
Weights and measurements:l litreg gram
mg milligramkg kilogrammt metric ton
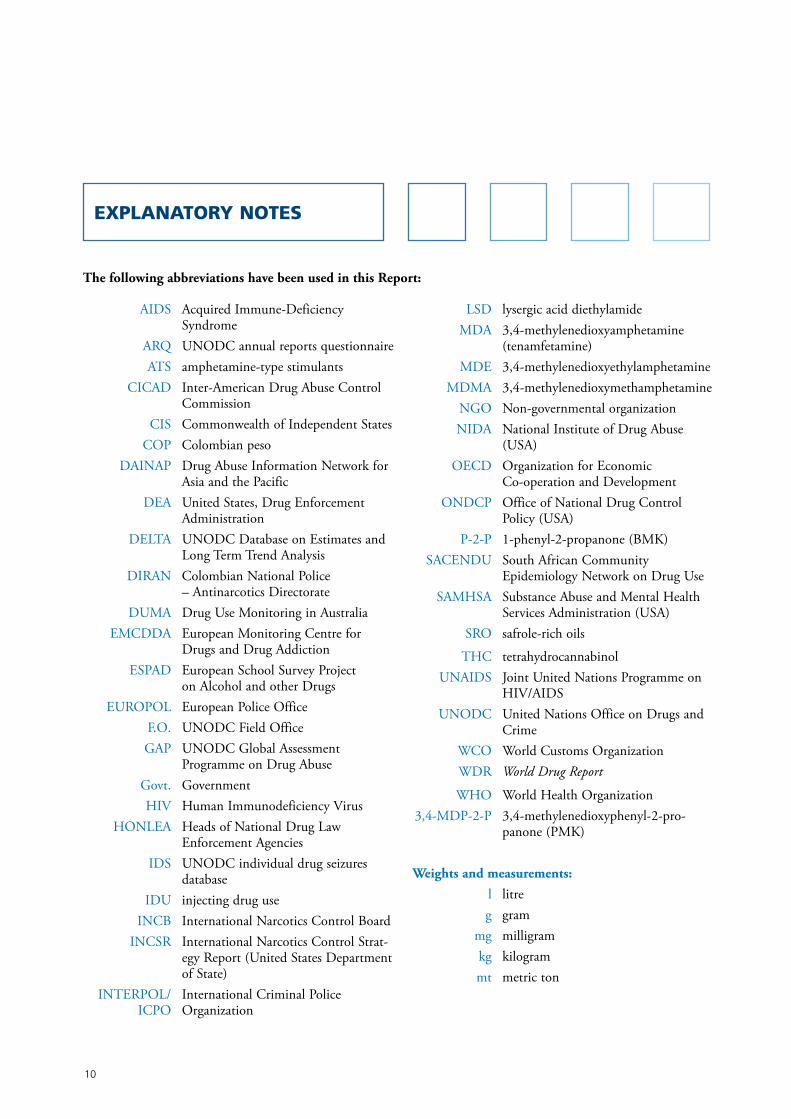
The following abbreviations have been used in this Report:

EXECUTIVE SUMMARY
11
In 1998, a special session of the UN General Assembly decided to work towards the “elimination or significant reduction” of illicit drug production and abuse by 2008, and adopted a series of sectoral plans to reach that objec-tive.1 Gathered at the end of the 10-year period, Member States were not satisfied with the results and declared that they were still “gravely concerned about the grow-ing threat posed by the world drug problem.”2 The deci-sion was taken to continue the effort over the following decade.
Can overall drug supply and demand be “eliminated or significantly reduced” by 2019, as called for by the Member States? At the national level, one can hope that many countries will be able to significantly improve their drug control situation within a decade. Will these local successes translate into an overall improvement at the global level?
A clear lesson from the history of drug control is that the mere sum of uncoordinated national and sectoral efforts, even successful ones, cannot result in a global success. Another lesson is that countries with limited means cannot resist, and counter the impact of, powerful trans-national trafficking flows on their own.
To achieve the 2019 objectives, the international com-munity needs to interweave drug supply and demand reduction interventions and integrate national efforts in the framework of renewed international strategies on the scale of the drug markets. To do so, it is urgent to improve our understanding of how illicit transnational drug economies operate. This World Drug Report is a contribution toward this objective.
This year’s World Drug Report opens with an analytical discussion of three key transnational drug markets: the markets for heroin, cocaine and amphetamine-type stimulants (ATS). Cannabis is not covered here because it is increasingly produced within the country of con-sumption and often dealt informally through social
1 United Nations General Assembly Special Session on the World Drug Problem (UNGASS), New York, 8-10 June, 1998 (A/S-20/4, chapter V, section A).
2 High-level Segment to the 2009 United Nations Commission on Narcotic Drugs, Political Declaration and Plan of Action on Inter-national Cooperation towards an Integrated and Balanced Strategy to Counter the World Drug Problem, March 2009 (E/2009/28 - E/CN.7/2009/12).
channels. Though cannabis is the world’s most popular illicit drug, it is less subject to a transnational market analysis than the other three drug classes.
The market discussion is followed by a presentation of statistical trends for all four major drug classes, includ-ing cannabis. The latest information on drug produc-tion, seizures and consumption is presented and the limitations of this knowledge are clearly articulated. While also drawing on other sources where relevant, the statistics presented were mainly gathered through the Annual Reports Questionnaire and the illicit crop sur-veys that UNODC produces in cooperation with Member States.
Finally, there is a chapter on a topic of growing concern for the international community: the relationship between drug trafficking and instability. This chapter focuses on the impact that the drug trade has on levels of violence and corruption in transit countries, particu-larly in Latin America, the Caribbean and West Africa.
This executive summary does not parallel the report, however. For the purpose of clarity, a global overview of changes in the world drug markets is presented first. This is followed by an integrated discussion of the world drug markets, including both the market analysis and the trend data. In closing, the discussion on the impact of drug trafficking on transit countries is summarized.
Global developments in illicit drug production, trafficking and consumption
Production
There have been a number of encouraging develop-ments in global cocaine and heroin markets recently:
The global area under opium poppy cultivation de- clined to 181,400 hectares (ha) in 2009 (15%) or by 23% since 2007.
In line with declines in the area under cultivation, global opium production fell from 8,890 metric tons (mt) in 2007 to 7,754 mt in 2009 (-13%), and poten-tial heroin production declined from 757 mt in 2007 to 657 mt in 2009.
The global area under coca cultivation declined to 158,800 ha in 2009 (5%), by 13% since 2007 or by 28% since 2000.

12
World Drug Report 2010
The estimated global cocaine production fell from 1,024 mt in 2007 to 865 mt in 2008 (-16%). Global fresh coca leaf production fell by 4% in 2009 (by 14% between 2007 and 2009).
The recent successes, however, must be considered in the context of the long-term challenge. Since 1998, the year of the last UN General Assembly Special Session (UNGASS) devoted to the drug problem, global poten-tial opium production has increased by 78%, from 4,346 mt to 7,754 mt in 2009. Fortunately, these production increases do not correspond to consumption increases, as it appears that large amounts of opium have been stockpiled in recent years. This means, however, that even if production were completely eliminated today, existing stocks could supply users for at least two years.
The increase in global potential cocaine production over the 1998-2008 period seems to have been more moder-ate (5%), from 825 mt to 865 mt, although there remain uncertainties around coca yields and production effi-ciency. Nonetheless, available data are sufficiently robust to state that global cocaine production has declined significantly in recent years (2004-2009).
In contrast to heroin and cocaine, only very broad pro-duction estimates can be given for cannabis and amphet-amine-type stimulants (ATS). Due to the decentralization of production, it is difficult to track global trends in either of these markets. Between 13,000 and 66,100 mt of herbal cannabis were produced in 2008, as were 2,200 to 9,900 mt of cannabis resin. Manufacture of the amphetamines-group of ATS (amphetamine, metham-phetamine, methcathinone and related substances) was in the range of 161 to 588 mt in 2008. Manufacture of drugs marketed as ‘ecstasy’ ranged from 55 to 133 mt.
Trafficking
Most of the long-distance trafficking involves cocaine and heroin, although some cannabis resin and ecstasy are also smuggled between regions. Much of the canna-bis herb, methamphetamine and amphetamine con-sumed in the world is produced locally.
Global cocaine seizures have stabilized over the last few years. Seizures have declined in North America and Europe, but have risen in South and Central America. Trafficking through West Africa, which increased rap-idly between 2004 and 2007, appears to have declined in 2008 and 2009, but this situation may change and needs to be monitored carefully.
Opiate seizures continue to increase. This applies to both opium and heroin seizures. Morphine3 seizures, in contrast, declined in 2008. The largest seizures continue
3 Morphine represents an intermediate step in the processing of opium to heroin, and is rarely consumed as a drug in its own right.
to be reported from the countries neighbouring Afghani-stan, notably the Islamic Republic of Iran and Paki-stan.
Tracking global ATS seizures is more complicated, because there are several products involved that appeal to different markets, including amphetamine, metham-phetamine and ‘ecstasy’. After tripling in the early years of this decade, ATS seizures have remained stable since 2006. Ecstasy seizures showed a marked decline in 2008 compared to a year earlier. Global seizures of ampheta-mine and methamphetamine remained largely stable at very high levels in 2008.
Global cannabis herb seizures increased over the 2006-2008 period (+23%), especially in South America, reaching levels last reported in 2004. Global cannabis resin seizures increased markedly over the 2006-2008 period (+62%) and clearly exceeded the previous peak of 2004. Large increases in cannabis resin seizures in 2008 were reported from the Near and Middle East region, as well as from Europe and Africa.
Consumption
Globally, UNODC estimates that between 155 and 250 million people (3.5 to 5.7% of the population aged 15-64) used illicit substances at least once in 2008. Glo-bally, cannabis users comprise the largest number of illicit drug users (129 - 190 million people). Ampheta-mine-group substances rank as the second most com-monly used drug, followed by cocaine and opiates.
At the core of drug consumption lie the ‘problem drug users’: those who inject drugs and/or are considered dependent, facing serious social and health consequences as a result. Based on the global estimates of the number of cannabis, opiate, cocaine and ATS users, it is esti-mated that there were between 16 and 38 million prob-lem drug users in the world in 2008. This represents 10% to 15% of all people who used drugs that year. It can be estimated that in 2008, globally, between 12% and 30% of problem drug users had received treatment in the past year, which means that between 11 and 33.5 million problem drug users did not receive treatment that year.
The lack of data in many countries still limits the under-standing of the drug use problem in many countries, particularly in Africa, some parts of Asia and the Pacific Islands. The broad range of the estimates reflects the uncertainties in the available global data.
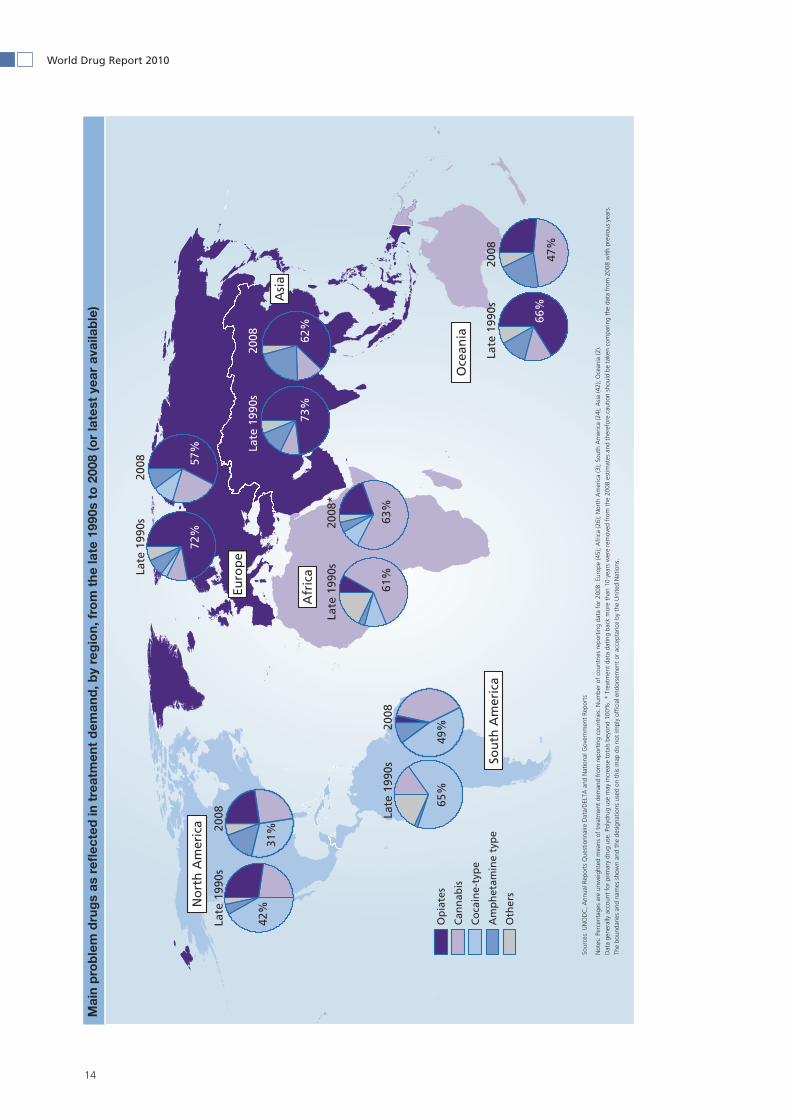
Data on the delivery of treatment services for problem drug users can provide valuable information on varia-tions in drug use problems across regions. The share of treatment services delivered to users of different drugs varies markedly in different regions of the world. In Europe and Asia, most of the treatment demand is for

13
Executive Summary
opiates. In the Americas, it is cocaine, and in Africa and Oceania, it is cannabis. These ratios have changed over time. As compared to a decade ago, treatments related to cannabis have increased in Europe, South America and Oceania, suggesting that an increased proportion of cannabis use can become problematic. Over the same period of time, cocaine treatment demand has been declining in the Americas, especially in North America, while it has increased in Europe. The relative impor-tance of opiates for drug treatment, on the other hand, has declined in Europe, Asia and (in particular) Ocea-nia, while it rose in Africa. ATS are commanding a growing share of treatment services globally.
Estimates of the sizes of the user populations in various parts of the world are derived from household and school surveys and indirect methods. Unfortunately, popula-tion-based surveys are conducted very irregularly in most countries, so there remain significant gaps in the knowledge of the extent of drug use in some parts of the world.
Cannabis remains the most widely consumed drug worldwide. Global annual cannabis use prevalence is estimated between 2.9% and 4.3% of the population aged 15-64. The highest is in Oceania (9.3% to 14.8%), followed by the Americas (6.3% to 6.6%). There are an estimated 15 – 19.3 million annual cocaine users (annual prevalence of 0.3% to 0.4%) in the world. North Amer-ica (2%), Oceania (1.4% to 1.7%) and West Europe (1.5%) are the regions with the highest prevalence rates. Between 12.8 and 21.8 million people (0.3% to 0.5% of the world population aged 15-64) used opiates in 2008. More than half of the world’s opiate users are in Asia. UNODC estimates that between 13.7 and 52.9 million people aged 15 to 64 had used an amphetamine-type substance in the past year (0.3% to 1.2% of the
population), including 10.5 to 25.8 million ecstasy users (0.2% to 0.6% of the population). Oceania, East and South-East Asia, North America, and West and Central Europe are the regions with the highest prevalence rates of ATS use.
In addition to the drugs mentioned above, the misuse of prescription drugs, such as synthetic opioids, benzodiaz-epines or synthetic prescription stimulants, is a growing health problem in a number of developed and develop-ing countries.
Illicit drug use at the global level, 2008
Number of people who inject drugsaged 15-64 years : 11-21 million persons
Number of "problem drug users" aged 15-64 years : 16-38 million persons
Number of people who have used drugsat least once in the past year aged 15-64 years : 155-250 million persons
Total number of people aged 15-64 yearsin 2008: 4,396 million persons
14
World Drug Report 2010
Mai
n p
rob
lem
dru
gs
as r
eflec
ted
in t
reat
men
t d
eman
d, b
y re
gio
n, f
rom
th
e la
te 1
990s
to
200
8 (o
r la
test
yea
r av
aila
ble
)
49%
Late
199
0s
20
08
Late
199
0s
20
08
Late
199
0s
200
8
Late
199
0s
200
8*
Late
199
0s
2
008
Late
199
0s
200
8
65%
31%
42%
72%
73%
62%
61%
63%
57%
47%
66%
Sour
ces:
UN
OD
C, A
nnua
l Rep
orts
Que
stio
nnai
re D
ata/
DEL
TA a
nd N
atio
nal G
over
nmen
t Re
port
s
Not
es: P
erce
ntag
es a
re u
nwei
ghte
d m
eans
of
trea
tmen
t de
man
d fr
om r
epor
ting
coun
trie
s. N
umbe
r of
cou
ntrie
s re
port
ing
data
for
200
8: E
urop
e (4
5); A
fric
a (2
6); N
orth
Am
eric
a (3
); So
uth
Am
eric
a (2
4); A
sia
(42)
; Oce
ania
(2).
Dat
a ge
nera
lly a
ccou
nt f
or p
rimar
y dr
ug u
se. P
olyd
rug
use
may
incr
ease
tot
als
beyo
nd 1
00%
. * T
reat
men
t da
ta d
atin
g ba
ck m
ore
than
10
year
s w
ere
rem
oved
fro
m t
he 2
008
estim
ates
and
the
refo
re c
autio
n sh
ould
be
take
n co
mpa
ring
the
data
fro
m 2
008
with
pre
viou
s ye
ars.
The
boun
darie
s an
d na
mes
sho
wn
and
the
desi
gnat
ions
use
d on
thi
s m
ap d
o no
t im
ply
offic
ial e
ndor
sem
ent
or a
ccep
tanc
e by
the
Uni
ted
Nat
ions
.
Op
iate
s
Can
nab
is
Co
cain
e-ty
pe
Am
ph
etam
ine
typ
e
Oth
ers
Sou
th A
mer
ica
No
rth
Am
eric
a
Euro
pe
Asi
a
Oce
ania
Afr
ica

15
Executive Summary
Est
imat
ed n
um
ber
of
illic
it d
rug
use
rs in
th
e p
ast
year
ag
ed 1
5-64
yea
rs, b
y re
gio
n a
nd
su
bre
gio
n: 2
008
Can
nab
is u
sers
in
th
e p
ast
year
O
pia
te u
sers
in
th
e p
ast
year
Co
cain
e u
sers
in
th
e p
ast
year
Am
ph
etam
ines
-gro
up
u
sers
in t
he
pas
t ye
arEc
stas
y u
sers
in
th
e p
ast
year
Reg
ion
/su
bre
gio
nN
um
ber
(l
ow
er)
Nu
mb
er
(up
per
)N
um
ber
(l
ow
er)
Nu
mb
er
(up
per
)N
um
ber
(l
ow
er)
Nu
mb
er
(up
per
)N
um
ber
(l
ow
er)
Nu
mb
er
(up
per
)N
um
ber
(l
ow
er)
Nu
mb
er
(up
per
)
Afr
ica
27,6
80,0
0052
,790
,000
680,
000
2,93
0,00
01,
020,
000
2,67
0,00
01,
550,
000
5,20
0,00
035
0,00
01,
930,
000
Nor
th A
fric
a4,
680,
000
10,3
90,0
0013
0,00
054
0,00
030
,000
50,0
0026
0,00
054
0,00
0es
timat
e ca
nnot
be
calc
ulat
ed
Wes
t an
d C
entr
al A
fric
a14
,050
,000
22,0
40,0
0016
0,00
034
0,00
064
0,00
083
0,00
0es
timat
e ca
nnot
be
calc
ulat
edes
timat
e ca
nnot
be
calc
ulat
ed
East
ern
Afr
ica
4,49
0,00
09,
190,
000
150,
000
1,73
0,00
0es
timat
e ca
nnot
be
calc
ulat
edes
timat
e ca
nnot
be
calc
ulat
edes
timat
e ca
nnot
be
calc
ulat
ed
Sout
hern
Afr
ica
4,45
0,00
011
,170
,000
240,
000
320,
000
290,
000
900,
000
310,
000
1,09
0,00
022
0,00
042
0,00
0
Am
eric
as38
,210
,000
40,0
30,0
002,
290,
000
2,44
0,00
08,
720,
000
9,08
0,00
04,
760,
000
5,89
0,00
03,
040,
000
3,28
0,00
0
Nor
th A
mer
ica
29,9
50,0
0029
,950
,000
1,29
0,00
01,
380,
000
6,17
0,00
06,
170,
000
3,09
0,00
03,
200,
000
2,49
0,00
02,
490,
000
Cen
tral
Am
eric
a58
0,00
060
0,00
010
0,00
011
0,00
012
0,00
014
0,00
032
0,00
032
0,00
020
,000
30,0
00
The
Car
ibbe
an43
0,00
0-1
,730
,000
60,0
0090
,000
110,
000
320,
000
30,0
0051
0,00
010
,000
240,
000
Sout
h A
mer
ica
7,30
0,00
07,
530,
000
840,
000
870,
000
2,33
0,00
02,
450,
000
1,32
0,00
01,
860,
000
510,
000
530,
000
Asi
a31
,510
,000
64,5
80,0
006,
460,
000
12,5
40,0
0043
0,00
02,
270,
000
4,43
0,00
037
,990
,000
2,37
0,00
015
,620
,000
East
/Sou
th-E
ast
Asi
a5,
370,
000
23,9
40,0
002,
830,
000
5,06
0,00
039
0,00
01,
070,
000
3,43
0,00
020
,680
,000
1,46
0,00
06,
850,
000
Sout
h A
sia
16,4
90,0
0027
,550
,000
1,39
0,00
03,
310,
000
estim
ate
cann
ot b
e ca
lcul
ated
estim
ate
cann
ot b
e ca
lcul
ated
estim
ate
cann
ot b
e ca
lcul
ated
Cen
tral
Asi
a1,
890,
000
2,14
0,00
034
0,00
034
0,00
0es
timat
e ca
nnot
be
calc
ulat
edes
timat
e ca
nnot
be
calc
ulat
edes
timat
e ca
nnot
be
calc
ulat
ed
Nea
r an
d M
iddl
e Ea
st7,
790,
000
10,9
50,0
001,
890,
000
3,82
0,00
0es
timat
e ca
nnot
be
calc
ulat
edes
timat
e ca
nnot
be
calc
ulat
edes
timat
e ca
nnot
be
calc
ulat
ed
Euro
pe
29,3
70,0
0029
,990
,000
3,29
0,00
03,
820,
000
4,57
0,00
04,
970,
000
2,50
0,00
03,
190,
000
3,85
0,00
04,
080,
000
Wes
t/C
entr
al E
urop
e20
,850
,000
20,9
90,0
001,
090,
000
1,37
0,00
04,
110,
000
4,13
0,00
01,
600,
000
1,71
0,00
02,
180,
000
2,19
0,00
0
East
/Sou
th-E
ast
Euro
pe8,
520,
000
9,01
0,00
02,
210,
000
2,46
0,00
047
0,00
084
0,00
090
0,00
01,
480,
000
1,68
0,00
01,
890,
000
Oce
ania
2,14
0,00
03,
410,
000
120,
000
150,
000
330,
000
390,
000
470,
000
630,
000
840,
000
910,
000
GLO
BA
L ES
TIM
ATE
128,
910,
000
190,
750,
000
12,8
40,0
00
21,8
80,0
00
15,0
70,0
0019
,380
,000
13,7
10,0
0052
,900
,000
10,4
50,0
0025
,820
,000
16
World Drug Report 2010
The main drug markets
The global illicit opiate and cocaine markets represent two of the biggest transnational drugs and crime threats of our time. They appear at the same time as persistent problems from a previous era of drug control, priorities for interventions due to the severity of their impacts on affected societies and good candidates for a global solu-tion within a reasonable time frame. Since they are both sourced from relatively concentrated production areas, most of their components are directly or indirectly linked to one another.
In addition, ATS have gained a large share of the global drug market over the last two decades and have come to represent a major and evolving threat for present and future drug control efforts. Since 1990, there has been a spread in ATS manufacture with more than a third of Member States having reported ATS-related manufac-ture activity to date. Moreover, the global number of ATS users is likely to exceed the number of opiate and cocaine users combined.
Cocaine
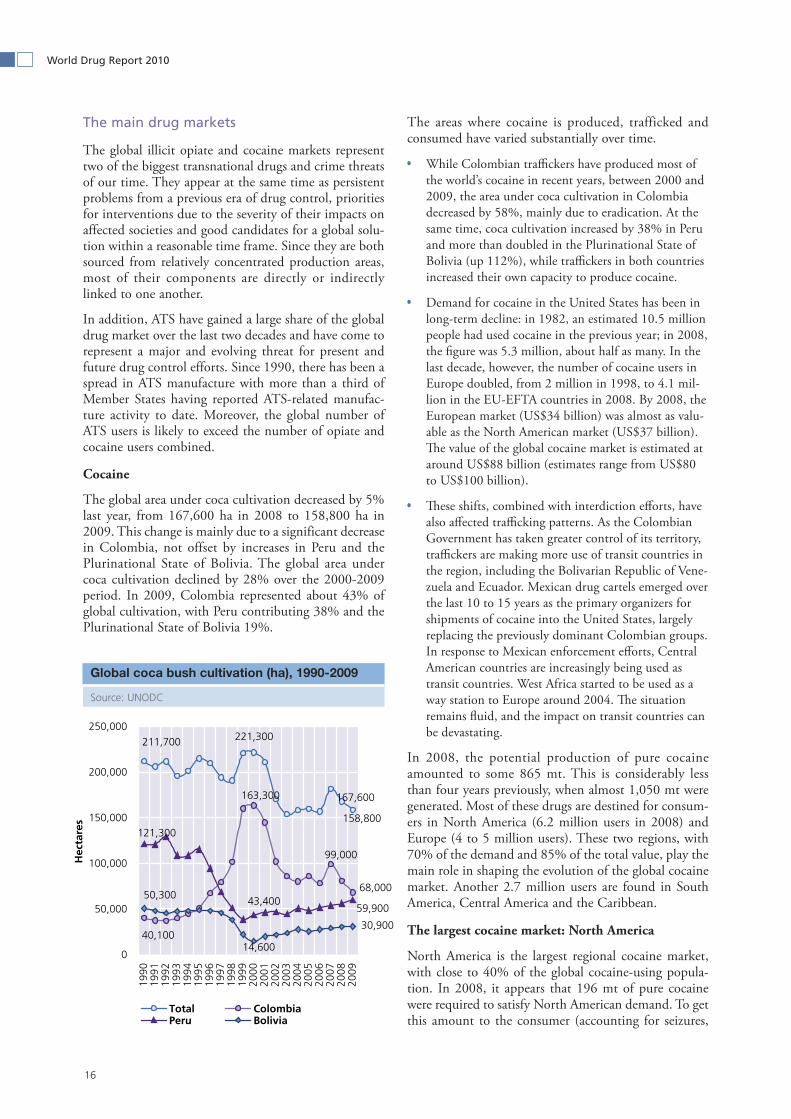
The global area under coca cultivation decreased by 5% last year, from 167,600 ha in 2008 to 158,800 ha in 2009. This change is mainly due to a significant decrease in Colombia, not offset by increases in Peru and the Plurinational State of Bolivia. The global area under coca cultivation declined by 28% over the 2000-2009 period. In 2009, Colombia represented about 43% of global cultivation, with Peru contributing 38% and the Plurinational State of Bolivia 19%.
The areas where cocaine is produced, trafficked and consumed have varied substantially over time.
While Colombian traffickers have produced most of the world’s cocaine in recent years, between 2000 and 2009, the area under coca cultivation in Colombia decreased by 58%, mainly due to eradication. At the same time, coca cultivation increased by 38% in Peru and more than doubled in the Plurinational State of Bolivia (up 112%), while traffickers in both countries increased their own capacity to produce cocaine.
Demand for cocaine in the United States has been in long-term decline: in 1982, an estimated 10.5 million people had used cocaine in the previous year; in 2008, the figure was 5.3 million, about half as many. In the last decade, however, the number of cocaine users in Europe doubled, from 2 million in 1998, to 4.1 mil-lion in the EU-EFTA countries in 2008. By 2008, the European market (US$34 billion) was almost as valu-able as the North American market (US$37 billion). The value of the global cocaine market is estimated at around US$88 billion (estimates range from US$80 to US$100 billion).
These shifts, combined with interdiction efforts, have also affected trafficking patterns. As the Colombian Government has taken greater control of its territory, traffickers are making more use of transit countries in the region, including the Bolivarian Republic of Vene-zuela and Ecuador. Mexican drug cartels emerged over the last 10 to 15 years as the primary organizers for shipments of cocaine into the United States, largely replacing the previously dominant Colombian groups. In response to Mexican enforcement efforts, Central American countries are increasingly being used as transit countries. West Africa started to be used as a way station to Europe around 2004. The situation remains fluid, and the impact on transit countries can be devastating.
In 2008, the potential production of pure cocaine amounted to some 865 mt. This is considerably less than four years previously, when almost 1,050 mt were generated. Most of these drugs are destined for consum-ers in North America (6.2 million users in 2008) and Europe (4 to 5 million users). These two regions, with 70% of the demand and 85% of the total value, play the main role in shaping the evolution of the global cocaine market. Another 2.7 million users are found in South America, Central America and the Caribbean.
The largest cocaine market: North America
North America is the largest regional cocaine market, with close to 40% of the global cocaine-using popula-tion. In 2008, it appears that 196 mt of pure cocaine were required to satisfy North American demand. To get this amount to the consumer (accounting for seizures,
Global coca bush cultivation (ha), 1990-2009
Source: UNODC
158,800
167,600
211,700 221,300
68,000
99,000
163,300
40,100
59,90043,400
121,300
30,900
14,600
50,300
0
50,000
100,000
150,000
200,000
250,000
1990
1991
1992
1993
1994
1995
1996
1997
1998
1999
2000
2001
2002
2003
2004
2005
2006
2007
2008
2009
Hec
tare
s
Total ColombiaPeru Bolivia


18
World Drug Report 2010
As a whole, the retail value of the United States cocaine market declined by about two thirds in the 1990s, and by about another quarter in the last decade. About 70% of the profits made off the cocaine trade in the United States accrue between mid-level dealers and the con-sumer. Farmers and traffickers in Colombia keep less than 3% of the retail sales value of the cocaine they produce.
The second largest cocaine market: Europe
The world’s second largest flow of cocaine is directed towards Europe, and this flow has been growing rapidly. The largest national cocaine market within Europe is the United Kingdom, followed by Spain, Italy, Germany
and France. Cocaine use prevalence levels are higher in the United Kingdom and Spain than in the United States.
Recent data suggest that the rapid growth of the Euro-pean cocaine market is beginning to level off in some of the biggest national markets such as Italy, Spain and Germany. Consumption is still growing in the United Kingdom and in some of the smaller European markets, however. In 2008, an estimated 124 mt of cocaine were consumed in Europe. To supply this demand, an esti-mated 212 mt departed South America toward Europe, about one quarter of total production. A greater share of this quantity comes from Peru and the Plurinational State of Bolivia than in the case of the United States.
Average of all cocaine purchase prices in the United States, January 2006-September 2009
Source: US Drug Enforcement Agency
Distribution of gross profits (in %) of the US$35 billion US cocaine market, 2008
Source: UNODC
National share of the cocaine user population in Europe in 2007/2008
Sources: UNODC ARQ; Government reports; UNODC, 2009 World Drug Report; EMCDDA, Statistical Bulletin 2009
50
100
150
200Pr
ices
in U
S$ p
er g
ram
-
25
50
75
Puri
ty in
%
Purity adjusted prices 95.1 95.4 95.1 90.6 99.5 119.4 130.9 115.7 123.2 125.1 184.3 199.5 174.4 173.2 174.0
Unadjusted prices 65.2 65.7 64.8 63.2 67.0 70.9 74.8 70.9 71.1 71.9 85.7 89.2 83.9 84.2 80.4
Purity (in %) 68.6 68.9 68.1 69.8 67.4 59.4 57.2 61.3 57.7 57.5 46.5 44.7 48.1 48.6 46.2
1 Qtr 2 Qtr 3 Qtr 4 Qtr 1 Qtr 2 Qtr 3 Qtr 4 Qtr 1 Qtr 2 Qtr 3 Qtr 4 Qtr 1 Qtr 2 Qtr 3 Qtr
2006 2007 2008 2009
Farmers in the Andean countries,1.5%
(US$0.5 bn)
Traffickers in the Andean countries,1%
(US$0.4 bn)
International traffickers, Colombia to the
US,13%(US$4.6 bn)
US-wholesalers to US-mid-level dealers,15%
(US$5.3 bn)
US-mid-level dealers to US-consumers, 70%
(US$24.2 bn)EFTA countries, 2%
Other European countries, 8%
UK, 23%
Spain, 21%
Italy, 19%
Germany, 9%
France, 5%
Other EU countries, 13%

19
Executive Summary
The primary countries of entry to the European market are Spain and the Netherlands. Most of the trafficking is maritime. Significant transit routes flow from former colonies or overseas territories of the European nations to their counterparts on the continent. Flows through West Africa appear to have declined since 2007, but could resume in the near future.
While the volumes are lower, the value of the European cocaine market (US$34 billion) is almost as high as in the case of the North American market (US$37 billion), because purity-adjusted cocaine retail prices are higher in Europe. European street prices in 2008 are about half what they were in 1990, but purity has declined and the dollar has weakened against the euro. In dollar terms,
the purity-adjusted price of cocaine in Europe has increased since 2002.
As in the North American market, only a fraction of the retail value goes to those who produce the drug. The intercontinental traffickers receive a larger share than in the North American case, but more than half of the retail value still accrues to wholesalers and retailers within Europe.
Heroin
Heroin is the most widely consumed illicit opiate in the world. It is derived from opium, which itself can have an illicit use. Of the opium that is not converted into heroin, two thirds is consumed in just five countries: the
Annual prevalence of cocaine use among the adult population in selected European countries
Sources: UNODC ARQ and EMCDDA, Statistical Bulletin 2009
Annual prevalence of cocaine use in the EU and EFTA countries, 1998-2008
Sources: UNODC ARQ; Government reports; UNODC, 2009 World Drug Report; EMCDDA, Statistical Bulletin 2009
1.41.6
2.52.7
3.0
1.3
2.62.4
1.1 1.0
1.4
0.2
0.7 0.60.9
0.60.3
0.6 0.60.4
0.2 0.2 0.10.0
2.22.22.5
0.2
0.6
0.9 0.91.0
3.0
1.2
3.0
3.73.7
0.60.6
0.0
0.5
1.0
1.5
2.0
2.5
3.0
3.5
4.0
Scot
land
'03
Scot
land
'05
Scot
land
'09
Spai
n '9
9Sp
ain
'01
Spai
n '0
3Sp
ain
'05
Spai
n '0
8
Engl
and
'98
Engl
and
'04
Engl
and
'07
Engl
and
'08
Engl
and
'09
Italy
'01
Italy
'03
Italy
'05
Italy
'08
Den
mar
k '0
5D
enm
ark
'08
Cze
ch R
ep. '
04C
zech
Rep
. '08
Slov
akia
'02
Slov
akia
'08
Ger
man
y '9
7G
erm
any
'00
Ger
man
y '0
3G
erm
any
'06
Aus
tria
'04
Aus
tria
'08
Port
ugal
'01
Port
ugal
'07
Esto
nia
'03
Esto
nia
'08
Hun
gary
'03
Hun
gary
'07
Lith
uani
a '0
3Li
thua
nia
'08
Rom
ania
'03
Rom
ania
'07
An
nu
al p
reva
len
ce in
%
0.6% 0.7%0.8% 0.9% 0.9% 1.0% 1.1% 1.1% 1.2% 1.2% 1.2%
0.0%
0.2%
0.4%
0.6%
0.8%
1.0%
1.2%
1.4%
1.6%
An
nu
al p
reva
len
ce
in %
of
po
pu
atio
n a
ge
15-6
5
EU and EFTA 0.6% 0.7% 0.8% 0.9% 0.9% 1.0% 1.1% 1.1% 1.2% 1.2% 1.2%
EU-27 0.6% 0.7% 0.8% 0.9% 0.9% 1.0% 1.1% 1.1% 1.2% 1.2% 1.2%
EU-15 0.8% 0.8% 1.0% 1.1% 1.1% 1.2% 1.3% 1.4% 1.5% 1.5% 1.5%
1998 1999 2000 2001 2002 2003 2004 2005 2006 2007 2008
20
World Drug Report 2010
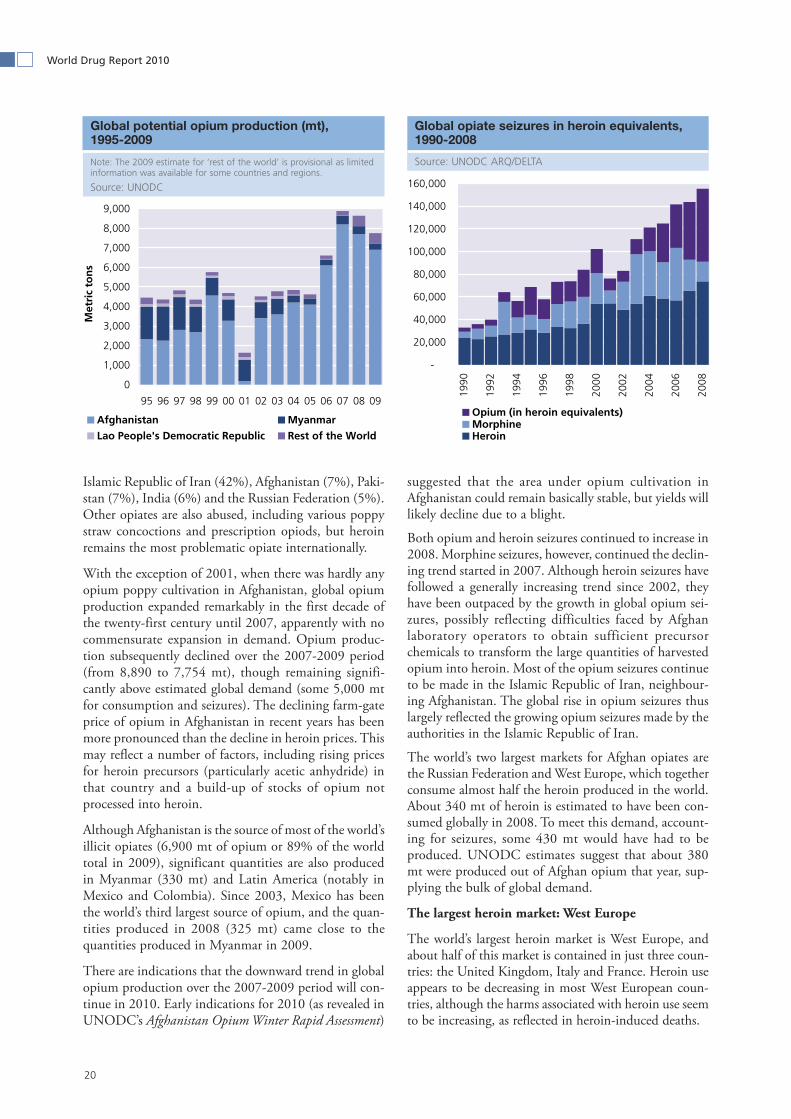
Islamic Republic of Iran (42%), Afghanistan (7%), Paki-stan (7%), India (6%) and the Russian Federation (5%). Other opiates are also abused, including various poppy straw concoctions and prescription opiods, but heroin remains the most problematic opiate internationally.
With the exception of 2001, when there was hardly any opium poppy cultivation in Afghanistan, global opium production expanded remarkably in the first decade of the twenty-first century until 2007, apparently with no commensurate expansion in demand. Opium produc-tion subsequently declined over the 2007-2009 period (from 8,890 to 7,754 mt), though remaining signifi-cantly above estimated global demand (some 5,000 mt for consumption and seizures). The declining farm-gate price of opium in Afghanistan in recent years has been more pronounced than the decline in heroin prices. This may reflect a number of factors, including rising prices for heroin precursors (particularly acetic anhydride) in that country and a build-up of stocks of opium not processed into heroin.
Although Afghanistan is the source of most of the world’s illicit opiates (6,900 mt of opium or 89% of the world total in 2009), significant quantities are also produced in Myanmar (330 mt) and Latin America (notably in Mexico and Colombia). Since 2003, Mexico has been the world’s third largest source of opium, and the quan-tities produced in 2008 (325 mt) came close to the quantities produced in Myanmar in 2009.
There are indications that the downward trend in global opium production over the 2007-2009 period will con-tinue in 2010. Early indications for 2010 (as revealed in UNODC’s Afghanistan Opium Winter Rapid Assessment)
suggested that the area under opium cultivation in Afghanistan could remain basically stable, but yields will likely decline due to a blight.
Both opium and heroin seizures continued to increase in 2008. Morphine seizures, however, continued the declin-ing trend started in 2007. Although heroin seizures have followed a generally increasing trend since 2002, they have been outpaced by the growth in global opium sei-zures, possibly reflecting difficulties faced by Afghan laboratory operators to obtain sufficient precursor chemicals to transform the large quantities of harvested opium into heroin. Most of the opium seizures continue to be made in the Islamic Republic of Iran, neighbour-ing Afghanistan. The global rise in opium seizures thus largely reflected the growing opium seizures made by the authorities in the Islamic Republic of Iran.
The world’s two largest markets for Afghan opiates are the Russian Federation and West Europe, which together consume almost half the heroin produced in the world. About 340 mt of heroin is estimated to have been con-sumed globally in 2008. To meet this demand, account-ing for seizures, some 430 mt would have had to be produced. UNODC estimates suggest that about 380 mt were produced out of Afghan opium that year, sup-plying the bulk of global demand.
The largest heroin market: West Europe
The world’s largest heroin market is West Europe, and about half of this market is contained in just three coun-tries: the United Kingdom, Italy and France. Heroin use appears to be decreasing in most West European coun-tries, although the harms associated with heroin use seem to be increasing, as reflected in heroin-induced deaths.
Global potential opium production (mt), 1995-2009
Note: The 2009 estimate for ‘rest of the world’ is provisional as limited information was available for some countries and regions.
Source: UNODC
Global opiate seizures in heroin equivalents, 1990-2008
Source: UNODC ARQ/DELTA
0
1,000
2,000
3,000
4,000
5,000
6,000
7,000
8,000
9,000
95 96 97 98 99 00 01 02 03 04 05 06 07 08 09
Met
ric
ton
s
Afghanistan Myanmar
Lao People's Democratic Republic Rest of the World
-
20,000
40,000
60,000
80,000
100,000
120,000
140,000
160,000
1990
1992
1994
1996
1998
2000
2002
2004
2006
2008
Opium (in heroin equivalents)MorphineHeroin


22
World Drug Report 2010
Republic of Macedonia (26 kg), Hungary (28 kg), Alba-nia (75 kg), Austria (104 kg), Slovenia (136 kg), Croatia (153 kg) and Serbia (207 kg).
Wholesale prices of heroin (not adjusted for purity) increase along the trafficking route from South-West Asia to Europe. In 2008, wholesale prices ranged from less than US$3,000 per kg in Afghanistan to US$10,300-US$11,800 per kg in Turkey and an average of US$44,300 per kg in West and Central Europe.
The second largest heroin market: the Russian Federation
Some 25% of all Afghan heroin (95 mt) is trafficked each year from Afghanistan into Central Asia to meet a demand of some 70 mt in the Russian Federation, along the ‘Northern Route’. The number of opiate users in the Russian Federation is estimated at between 1.6 and 1.8 million people, equivalent to a prevalence rate of 1.6% of the population aged 15-64. There is a very high prevalence of HIV among drug users (some 37%).
To exit Afghanistan on the way to the Russian Federa-tion traffickers can choose between three countries: Tajikistan, Uzbekistan and Turkmenistan. Most of the flow appears to proceed through Tajikistan to Osh in Kyrgyzstan, before transiting Kazakhstan to the Russian Federation. Trafficking is conducted mostly in private and commercial vehicles, often in relatively small amounts. Of 45 heroin seizures above 500 grams (a commercial quantity) made in Tajikistan between 2005 and 2007, 80% amounted to 10 kg or less, and of these, the average size was 2.6 kg. This is a rather small amount per seizure when compared to other regions, suggesting that small-scale trafficking operations are the rule rather than the exception.
While total seizures remained essentially stable in
Tajikistan in 2008 (1.6 mt), seizures in Uzbekistan and Kazakhstan reached the highest levels on record, at 1.5 mt and 1.6 mt, respectively. In the Russian Federation, seizures have followed an upward trend, from 2.5 mt in 2006, to 2.9 mt in 2007 and to 3.4 mt in 2008.
Trafficking through Pakistan
Some 150 mt (40%) of Afghan heroin/morphine are trafficked to Pakistan, particularly to Balochistan prov-ince and the Federally Administered Tribal Areas, which both share long borders with Afghanistan. While some of the drugs are consumed or seized in Pakistan, most are trafficked to other countries. Major destinations for heroin trafficked through Pakistan include the Islamic Republic of Iran (35 mt, most for onward shipment to Europe), various countries in Asia (25 mt), Africa (some 20 mt) and the United Arab Emirates (11 mt for onward shipment to China and East/Southern Africa). Pakistani traffickers also operate numerous air (and sea) traffick-ing routes to Europe, mostly to the United Kingdom and the Netherlands, shipping an estimated 5 mt annu-ally via these direct connections.
Amphetamine-type stimulants
Amphetamine-type stimulants (ATS) refer to a group of synthetic substances comprised of amphetamine-group (primarily amphetamine, methamphetamine and meth-cathinone) and ecstasy-group substances (MDMA and its analogues). ATS can be made anywhere the precur-sors can be found, so manufacturing tends to happen close to the main consumer markets. More than one third of the countries reporting to UNODC have detected ATS manufacture in their territories.
The number of ATS-related clandestine laboratories reported increased by 20% in 2008, and, for the first
Distribution of the heroin market on the Northern route, 2000-2008
Source: UNODC
Opiate consumption, seizures and trafficking (mt)
Heroin trafficking from Russia to Europe per year, 4 tons
Annual heroin consumption in Central Asia, 11 tons
Average annual heroin seizure in the Russian Federation,
3 tons
Average annual heroin seizure in Central Asia, 5 tons
Heroin trafficking from Central Asia to Caucasus & China per
year, 3 tons
Annual heroin consumption in the Russian Federation,
70 tons

23
Executive Summary
time, revealed the existence of laboratories in Argentina, Brazil, Guatemala, the Islamic Republic of Iran and Sri Lanka. Information on the 8,432 detected laboratories came from 31 countries, with the largest numbers reported from the United States, the Czech Republic, Australia, China,4 Slovakia, New Zealand, the Nether-lands, Canada and Mexico. However, the number of laboratories is not representative of their output, as many countries with lower total counts report only laboratories with large-scale outputs.
Traditionally, different regions have had problems with different ATS. ‘Ecstasy’ has been associated with the dance club scene, initially located primarily in the Anglophone countries, but later expanding throughout Europe, the Americas, the Oceania region and many parts of East and South-East Asia. Methamphetamine has been problematic in East Asia and South-East Asia over the last decade, as well as in North America and Oceania. Amphetamine was found primarily in Europe, though in recent years, the Middle East has emerged as a major new market, with demand for pills called Capta-gon. This was a brand-name for a discontinued product that contained fenethylline, but these pills today mostly consist of amphetamine and caffeine. Pharmaceutical stimulants are widely misused in South America and in Africa.
Trends and associations with these substances are also changing:
North America struggled with a rash of methampheta- mine use, gradually moving from the west towards the east coast. Successes in precursor control, however,
4 In 2008, China reported 244 unspecified clandestine laboratories. However, this figure is also known to included some opium dens and was therefore not included in the ATS totals.
seem to have reduced this threat, though seizures in-creased in 2009.
‘Ecstasy’ is becoming important in many parts of the developing world, including Asia, while it seems to be levelling off or declining in Europe. The situation remains dynamic with illicit ecstasy manufacturing emerging in new locations around the world, while European and other markets are increasingly discover-ing synthetic substitution psychotropic substances in tablets sold as ecstasy. Piperazines, ketamine and other substitutes, either marketed as ‘ecstasy’ or under their own name, have grown in popularity as club drugs. With these changes in demand, the location of manu-facturing operations has changed. In the past, most of the pills sold as ‘ecstasy’ were manufactured in Eu-rope, but this does not seem to be the case any longer. Manufacture of ‘ecstasy’ has increased in North Amer-ica (notably in Canada) and in several parts of Asia. In line with the increases in manufacture in Canada, there are now also early signs that the strong down-ward trend in ecstasy use in North America after the year 2000 could be reversed.
ATS are seized in a wider range of countries and greater volumes than ever before. A key component of the volume increase is the growth in the seizures of pills branded as Captagon. In the more mature markets, how-ever, ATS use appears to have stabilized or declined, and seizures of tablets containing ecstasy-group substances in Europe have plummeted since 2006.
These broad trends mask a number of important regional developments. Manufacture of methamphetamine for the United States market, for example, underwent a dra-matic transformation in response to domestic precursor controls implemented in 2005. Manufacturing was dis-placed over the border to Mexico. This displacement was
ATS laboratories (all sizes) reported to UNODC, by type, 1999-2008
Source: UNODC ARQ
0
5,000
10,000
15,000
20,000
ATS
lab
ora
tory
-rel
ated
in
cid
ents
(#)
ATS lab total 7,412 7,028 8,598 9,782 11,258 18,874 13,467 8,271 7,002 8,408Other synthetic stimulants 68 19 5 24 70 282 92 51 35 1Ecstasy group 62 64 70 59 49 87 63 56 72 53Combined ATS 204 221 272 244 314 330 370 361 344 15Amphetamine 59 115 85 132 161 322 159 154 102 44Methamphetamine 7,019 6,609 8,166 9,323 10,664 17,853 12,783 7,649 6,449 8,295
1999 2000 2001 2002 2003 2004 2005 2006 2007 2008


26
World Drug Report 2010
the two, with total seizures reaching 6,587 mt, whereas the resin seizure total was 1,637 mt in 2008. Cannabis herb seizures appear to be growing most strongly in South America; in particular in the Plurinational State of Bolivia. For resin, the growth is strongest in South-West Asia. The year 2008 saw what may be the single largest drug seizure in history: 236.8 mt of cannabis resin seized by the Afghan authorities in Kandahar prov-ince in June.
Prices of cannabis herb vary noticeably across different countries and regions, even when adjusted for purchas-ing power parity. Some regions revealed intra-regional consistency, although comparisons across countries should be considered with caution since prices may relate to different product types. Very high retail prices were reported by Japan, Singapore and two territories in Eastern Asia (Hong Kong and Macao, China). The high price in Japan may be due to the fact that cannabis herb is mainly imported, which is contrary to the prevalent pattern in most other countries. Cannabis herb prices in Europe were also relatively high. The lower end of the scale was occupied mainly by countries in Africa, South America and East, South-East and South Asia.
Cannabis remains the most widely used illicit substance in the world. Globally, the number of people who had used cannabis at least once in 2008 is estimated between 129 and 191 million, or 2.9% to 4.3% of the world population aged 15 to 64. Cannabis use appears to be in long-term decline in some of its highest value markets, including North America and parts of West Europe. Increasing use has been reported in South America, although annual prevalence rates remain far lower than
in North America. Although there is a lack of scientifi-cally valid data on cannabis use for both Africa and Asia, national experts in both continents perceive an increas-ing trend.
Drug trafficking and instability in transit countries
There are two ways that drug trafficking can pose a threat to political stability. The first involves countries where insurgents and illegal armed groups draw funds from taxing, or even managing, drug production and traffick-ing. The second concerns countries that do not face such a situation, but where the drug traffickers become power-ful enough to take on the state through violent confron-tation or high-level corruption. This chapter focuses on the second category, and discusses the impact of cocaine trafficking on transit countries.
Between 2006 and 2008, over half the maritime ship-ments of cocaine to Europe detected came from the Bolivarian Republic of Venezuela. Ecuador has also been affected by an increase in transit trafficking, and both countries are experiencing increasing problems with violence.
The decline of the US cocaine market and the rise of the European one have also contributed to violence in the Caribbean. In some cases, this is due to new cocaine flows, in others, to the loss of cocaine trafficking as a revenue source for local criminals. It appears that any dramatic changes in trafficking can have a destabilizing effect, resulting in violence.
The region worst affected at present is the Northern Triangle of Central America: Guatemala, Honduras and El Salvador. Here, intense drug-related violence has posed a serious challenge to governance. While all these countries have had problems with violence in the past,
Global cannabis herb seizures (mt), 1999-2008
Source: UNODC ARQ
0
1,000
2,000
3,000
4,000
5,000
6,000
7,000
1999
2000
2001
2002
2003
2004
2005
2006
2007
2008
North America South AmericaAfrica Rest of the worldMexico United States
Departure locations of identified drug trafficking shipments by sea from South America to Europe, 2006-2008
Source: Maritime Analysis Operation Centre
Venezuela51%
Caribbean11%
Colombia5%
West Africa11%
Other12%
Brazil10%
mt
27
Executive Summary
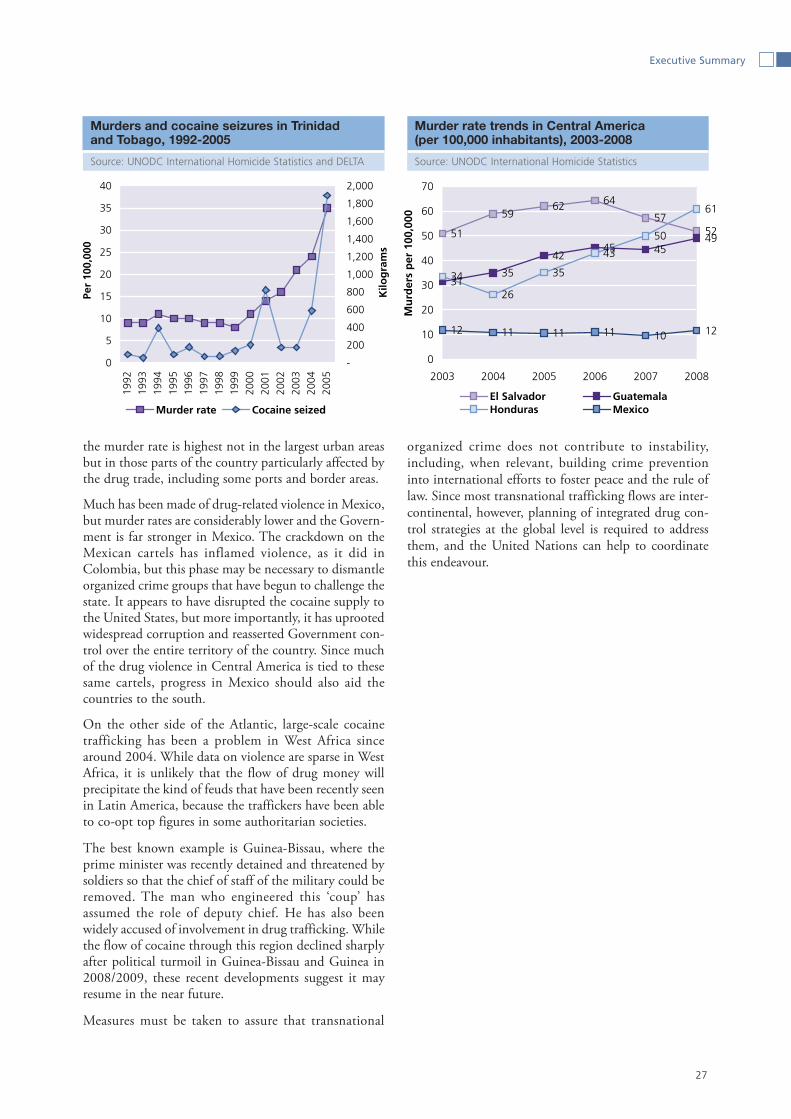
the murder rate is highest not in the largest urban areas but in those parts of the country particularly affected by the drug trade, including some ports and border areas.
Much has been made of drug-related violence in Mexico, but murder rates are considerably lower and the Govern-ment is far stronger in Mexico. The crackdown on the Mexican cartels has inflamed violence, as it did in Colombia, but this phase may be necessary to dismantle organized crime groups that have begun to challenge the state. It appears to have disrupted the cocaine supply to the United States, but more importantly, it has uprooted widespread corruption and reasserted Government con-trol over the entire territory of the country. Since much of the drug violence in Central America is tied to these same cartels, progress in Mexico should also aid the countries to the south.
On the other side of the Atlantic, large-scale cocaine trafficking has been a problem in West Africa since around 2004. While data on violence are sparse in West Africa, it is unlikely that the flow of drug money will precipitate the kind of feuds that have been recently seen in Latin America, because the traffickers have been able to co-opt top figures in some authoritarian societies.
The best known example is Guinea-Bissau, where the prime minister was recently detained and threatened by soldiers so that the chief of staff of the military could be removed. The man who engineered this ‘coup’ has assumed the role of deputy chief. He has also been widely accused of involvement in drug trafficking. While the flow of cocaine through this region declined sharply after political turmoil in Guinea-Bissau and Guinea in 2008/2009, these recent developments suggest it may resume in the near future.
Measures must be taken to assure that transnational
organized crime does not contribute to instability, including, when relevant, building crime prevention into international efforts to foster peace and the rule of law. Since most transnational trafficking flows are inter-continental, however, planning of integrated drug con-trol strategies at the global level is required to address them, and the United Nations can help to coordinate this endeavour.
Murders and cocaine seizures in Trinidad and Tobago, 1992-2005
Source: UNODC International Homicide Statistics and DELTA
Murder rate trends in Central America (per 100,000 inhabitants), 2003-2008
Source: UNODC International Homicide Statistics
0
5
10
15
20
25
30
35
40
1992
1993
1994
1995
1996
1997
1998
1999
2000
2001
2002
2003
2004
2005
Per
100,
000
-
200
400
600
800
1,000
1,200
1,400
1,600
1,800
2,000
Kilo
gra
ms
Murder rate Cocaine seized
51
5962 64
5752
3135
4245 45
49
34
26
35
43
50
61
12 11 11 11 10 12
0
10
20
30
40
50
60
70
2003 2004 2005 2006 2007 2008
Mu
rder
s p
er 1
00,0
00El Salvador GuatemalaHonduras Mexico


1. TRANSNATIONAL DRUG MARKET ANALYSIS


1.1 Introduction
31
Since the 1960s, and in a context of rapid and deep socioeconomic changes throughout the world, the inter-national drug control system has succeeded in contain-ing the spread of annual illicit drug use to around 200 million people, or 5% of the world population aged 15-64. This compares very favourably with the much higher prevalence of tobacco use, which causes 5.4 mil-lion deaths per year.1
The system was set up to restrict the use of controlled drugs to medical and scientific purposes and, while con-tainment of illicit use to relatively low levels is already a remarkable achievement, Member States have always had a more ambitious goal in mind.
In 1998, 37 years after the 1961 Single Convention, a special session of the UN General Assembly (UNGASS) decided to work towards the “elimination or significant reduction” of illicit drug production and abuse by 2008,2 and adopted a series of sectoral plans to reach that objec-tive. Gathered at the end of the 10-year period, Member States were not satisfied with the results and declared that they were still “gravely concerned about the grow-
1 WHO, Tobacco key facts (see: http://www.who.int/topics/tobacco/facts/en/index.html).
2 United Nations General Assembly Special Session on the World Drug Problem (UNGASS), New York, 8-10 June, 1998 (A/S-20/4, chapter V, section A).
ing threat posed by the world drug problem.”3 There is no single measure of the year-on-year evolution of the world drug problem. There is not even a clear definition of what is meant by the expression the ‘world drug prob-lem’. Since public health is at the heart of the interna-tional drug control system, the prevalence of illicit drug use is generally considered a central, though imperfect, indicator of the status of the problem. Illicit drug use is a multifaceted issue, however. In particular, different drugs produce different effects and present different risks to users. At the international level, annual preva-lence of drug use, by drug category, has thus become the most standardized indicator to monitor the evolution of illicit drug use. Unfortunately, only a minority of coun-tries have adequate national prevalence monitoring sys-tems in place. Producing a precise, reliable and sensitive measure of the evolution of the world drug problem over the last decade on that basis is therefore very diffi-cult. Data on illicit drug supply can help fill the infor-mation gap, at least for some drugs. The bulk of cocaine and opium production is concentrated in a few locations and successful efforts to develop annual surveys in the
3 High-level Segment to the 2009 United Nations Commission on Narcotic Drugs, Political Declaration and Plan of Action on Inter-national Cooperation towards an Integrated and Balanced Strategy to Counter the World Drug Problem, March 2009 (E/2009/28 - E/CN.7/2009/12).
Global potential opium production, 1980-2009Fig. 1:
Source: UNODC
-
1,000
2,000
3,000
4,000
5,000
6,000
7,000
8,000
9,000
10,000
1980
1981
1982
1983
1984
1985
1986
1987
1988
1989
1990
1991
1992
1993
1994
1995
1996
1997
1998
1999
2000
2001
2002
2003
2004
2005
2006
2007
2008
2009
Ton
s
Other countries
Afghanistan
1998-2009:+ 78% in the world
1998-2009:+156%
in Afghanistan

32
World Drug Report 2010
context of the 1998 Plan of Action have provided a coverage that is systematic enough to closely follow the evolution of the global opiate and cocaine markets from the supply side.
Data on illicit opiates supply, arguably the most prob-lematic drug category and always a core preoccupation of the international drug control regime, show that global opium production increased by close to 80% between 1998 and 2009. Increases in Afghanistan more than offset remarkable declines in South-East Asia during that period. There were encouraging declines in the last three years, but Afghan production was still more than 150% higher in 2009 than in 1998. With strong increases after 2005, production seems to have well exceeded world demand and led to the creation of large stockpiles, but it is clear that the global opiate market has not been eliminated, or significantly reduced, since 1998.
The evolution of cocaine production has not been as dramatic as in the case of opium during the same decade. Contrasting trends were recorded in various locations, including a long-term decline of use in North America but an increase in Europe, reductions in production in Colombia and increases in Peru or the Plurinational State of Bolivia. At the global level, these changes essen-tially amounted to geographical shifts and displacements in supply and demand. As a whole, the market has not been eliminated or significantly reduced over the last decade.
Data on cannabis and amphetamine-type stimulants are too patchy to allow year-on-year monitoring of the global market, but there were no indications of large reductions at the global level for these substances either.
Member States have decided to continue their efforts to achieve the initial UNGASS objective. Accordingly, illicit drug supply and demand should be “eliminated or significantly reduced” by 2019. Their decision was made in a context of renewed criticism from some parts of civil society against the international drug control system and its perceived inefficacy, but governments were remarkably unanimous in their perception of the world drug problem, in the renewal of their political commit-ment to the international policy framework, and in their resolve to address shortcomings and obtain better results.
Can overall drug supply and demand be “eliminated or significantly reduced” by 2019, as called for by the Member States? At the national level, one can hope that many countries will be able to significantly improve their drug control situation within a decade. There are a number of encouraging developments in this respect. Will these local successes translate into an overall improvement at the global level?
The increase in world population alone (by some 0.8 billion people, or 11%) during the next decade should automatically increase the size of world drug markets, even if drug use prevalence rates remain constant. The potential impact of other risk factors such as urbaniza-tion (+20% during the next decade) and the growth of mega-cities in the developing world could make matters worse, as drug use is typically higher in urban than in rural areas.
As regards cannabis, there is no global market per se to control and monitor. The global picture is made up of a patchwork of multiple and distinct submarkets, typically national or regional in nature. Monitoring their evolu-tion and addressing them as a whole may thus neither be the easiest, nor necessarily the most useful, thing to
Global potential cocaine production (mt), 1990-2008Fig. 2:
Source: UNODC
695 630660680
435
92
450
290280270
141
240
492
302
1049498
43150
189
113774
825
950879
1,048 1,0341,024
865
0
200
400
600
800
1,000
1,200
1990
1991
1992
1993
1994
1995
1996
1997
1998
1999
2000
2001
2002
2003
2004
2005
2006
2007
2008
Met
ric
ton
s
Bolivia
Peru
Colombia
Total

33
1. Transnational drug market analysis Introduction
do. Monitoring systems are largely missing, and current methods used to estimate the size and evolution of the global cannabis problems are not sensitive. That creates a serious technical problem for any attempt to closely monitor, guide and measure a global elimination approach. There are additional obstacles. Cannabis pro-duction and -consumption are found everywhere and there is no longer a clear consensus among national authorities on how to tackle the issue. Under these con-ditions, a significant reduction of the aggregate cannabis problem at the global level by 2019 would more likely be a matter of coincidence than the result of internatio- nally concerted action. Even if such a reduction were to occur, it would be difficult to detect and reliably meas-ure it, given the lack of a clear baseline and persistent data gaps.
Unlike for cannabis, there is a clear political consensus on heroin, cocaine and, to a large extent, amphetamine-
type stimulants (ATS). In the case of ATS, because of the existence of independent, mostly regional or even national, supply and demand markets, as well as the ease, discretion and changing nature of synthetic drugs manufacture, the problem also tends to defy a global approach and overall predictions over the period consid-ered. Nevertheless, ATS have gained a large share of the global drug market over the last two decades and have come to represent a major and evolving threat for present and future drug control efforts. Since 1990, ATS manu-facture has spread, with more than a third of Member States reporting this activity on their territory. Moreover, the global number of ATS users is likely to exceed the number of opiate and cocaine users combined. These drugs require international vigilance, the adoption or strengthening of specific regulations and control meas-ures at the global level, and the development of strong regional strategies.
TokyoNew York
Mexico City
Cities with more than 10 million inhabitants in 1975 (left) and 2025 (right)Fig. 3:
Source: UN DESA
!(!(!(!(!(
!(!(
!(!(
!(
!(!(
!(
!(
!(
!(
!(
!(
!(
!(
!(
!(
!(
!(
!(
!(Los Angeles New York
Mexico City
Rio de Janeiro
Buenos Aires
Lagos Kinshasa Cairo
Mumbai
Chennai
Jakarta
Manila
Guangzhou
Shanghai
Tokyo
Osaka-Kobe
BeijingDhakaKolkataDelhiKarachiLahoreMoscowIstanbulParis
Cannabisis - by far - the most widely produced, seized and consumed drug worldwide, causing increased health problems in many countries, linked to its spread and rising potency in several (mostly developed) coun-tries over the last decade. Deaths related to cannabis use are rare, however, and dependency tends to emerge only after long periods of use. As cannabis production is widespread, most of its production is intended for local or regional consumption. Over-seas trafficking in cannabis is less frequent and appears to have further lost importance with the development of high-potency cannabis production in greenhouses in the industrialized countries. The role of transnational organized crime groups in the cannabis market is thus more limited than for other drugs, and so are the security threats related to its production, trafficking and consumption.
Estimated annual value of some global Fig. 4: criminal markets in the 2000s
Source: UNODC
1
32
65
88
0
10
20
30
40
50
60
70
80
90
100
Firearms Trafficking inpersons
Opiates(retail)
Cocaine(retail)
Bill
ion
US$

34
World Drug Report 2010
The impact of illicit opiates, cocaine and ATSOpiates are the most severe problem drugs worldwide, notably in Asia and Europe. Their use can lead to severe dependence and is often associated with IDU-related HIV/AIDS and hepatitis B and C, as well as high mortality rates. The mortality rate for dependent heroin users is between 6 and 20 times that expected for those in the general population of the same age and gender, as the difference between a ‘recreational dose’ and a ‘fatal’ one is small, and variations in street drug purity can result in overdoses. Thus, in most countries, opiates consumption constitutes the main cause of drug-related deaths. In addition, the processing and trafficking of opiates constitute significant sources of income for insurgents in some opium-producing countries such as Afghanistan and Myanmar. In Afghanistan, a conservative estimate suggests that Taliban insurgents generated some US$125 million per year in profits from the local opiate trade alone in the past several years. In Pakistan, Taliban allies such as al-Qaida and other like-minded groups have bases along the main heroin/opium trafficking routes and are well located to benefit from trafficking. Elsewere in the world, other militant groups also seem to be financing themselves at least partly from the illicit opiate trade.
Similarly, cocaine use constitutes, first of all, a major health problem. Almost a fifth (18%) of the persons who used cocaine in the previous year at least once were found to be dependent on it in the world’s largest cocaine market (United States), a higher proportion than for any other drug, except heroin. Cocaine use also results in tens of thousands of deaths each year worldwide. While cocaine was involved in close to 40% of all drug deaths in the United States in 2008, the proportion is still far smaller in Europe (8% in the EU/EFTA countries). After the opi-ates, cocaine is the most problematic drug worldwide, notably in the Americas. While the share has declined, almost half (46%) of all people entering drug treatment in the Americas do so due to cocaine. The share in Europe increased from 3% in 1997/1998 to 10% in 2008, rising to almost 15% in West Europe. Proportions are far lower in Africa (6%), Oceania (0.5%) and Asia (0.5%), possibly due to the high availability of amphetamine-type stimulants in these regions. There is also a clear link between cocaine use (notably crack-cocaine use) and crime. While 11% of arrestees in the United Kingdom in 2005/2006 were found to have used crack-cocaine in the month prior to their arrest, the proportion of crack-cocaine use in the general population was far lower (0.1% in that year). Similarly, between 29% and 35% of the male arrestees in the United States were found to have used cocaine in the previous month in recent years (29% in 2008), far more than the corresponding rates among males in the general US popu-lation (1% in 2008). With cocaine use falling strongly since the late 1980s (-56% in past month prevalence rates between 1988 and 2008), overall crime also saw a marked decline in the United States, ranging from -29% for property crime rates to -43% for murder rates over the 2000-2008 period. Cocaine trafficking is also linked to cor-ruption. Trafficking of cocaine has contributed to increasing corruption in transit countries, including in West Africa. Moreover, cocaine trafficking constitutes a major security threat, financing organized crime and insurgencies in a number of countries, including the FARC in Colombia and the Shining Path in Peru.
Like for the other drugs, the impact of ATS use is primarily on the health side. The proportion of people requiring treatment for ATS abuse is 5% of all drug-related treatment demand in Africa, 10% in Europe and 12% in the Americas. It is particularly high in Oceania (20%) and Asia (21%), reaching 36% in East and South-East Asia with proportions exceeding 50% in Japan, the Republic of Korea, Thailand, Cambodia and the Philippines, as well as in Saudi Arabia in the Near and Middle East. In particular, methamphetamine use constitutes a major health risk where it occurs. Data for the United States suggest that the use of methamphetamine may constitute similar threats to health as the abuse of crack-cocaine, exceeding for the individuals concerned even the risks related to the consump-tion of cocaine HCl. Organized crime is involved in the diversion of precursor chemicals, and in the manufacture of ATS, as well as its distribution. ATS manufacture has a major negative impact on the environment, which is reflected in the difficulties to dismantle clandestine ATS labs. There is clearly involvement of organized crime groups in ATS production, particularly in East and South-East Asia, as well as in North America. Less is known with regard to financing of insurgencies (this seems to occur mainly in Myanmar) and violence related to its trafficking.
35
1. Transnational drug market analysis Introduction
The global illicit opiate and cocaine markets represent two of the biggest transnational drugs and crime threats of our time. Tens of thousands of the millions of opiate users worldwide die every year. Opiates are at the origin of two thirds of all drug treatment demand in Europe and Asia. The opiate market generates an annual turn- over of up to US$65 billion, of which some US$ 55 billion for heroin alone. Moreover, the opiate market is interlinked with severe national and international secu-rity problems, particularly in Afghanistan and Pakistan. In terms of health impact, cocaine comes next, and rep-resents as big a transnational organized crime threat as heroin. Estimates suggest that the global retail sales figure (some US$88 billion) is even higher than for opi-ates, and the impact of the cocaine trade on stability can also be severe in some places.
The global heroin and cocaine markets appear simulta-neously as persistent problems from a previous era of drug control, priorities for interventions due to the severity of their impacts on affected societies and good candidates for a global solution within a reasonable time-frame. Since they are both sourced from relatively concentrated production areas, most of their compo-nents are directly or indirectly linked. The resulting transnational drug economies they form, from produc-tion to trafficking and consumption, can thus be addressed as a whole and be affected by shocks and ripple effects. Not only are holistic market control approaches possible in these two cases, but, as shown by history, they are also a necessity. Local successes against illicit cultivation in the past – there were many – have always been offset by displacements to other locations, and closed trafficking routes replaced by new ones.
Illicit production is presently largely entrenched in rural areas that are difficult to control. On the demand side, increases in cocaine consumption in Europe have ten-eded to compensate reductions in North America, and the stabilization of heroin use in West Europe has been offset by a deterioration of the situation in the Russian Federation. Meanwhile, the size and concentration of the trafficking flows to these main destination markets have often created havoc in vulnerable production and transit areas by overwhelming local law enforcement capacities, generating corruption, fuelling violence and instability, and spreading addiction.
A clear lesson from the history of cocaine and heroin control is that the mere sum of uncoordinated national and sectoral efforts, even successful ones, cannot result in global success. Another lesson is that countries with limited means cannot resist, and counter the impact of, powerful transnational trafficking flows on their own.
With the benefit of experience, success against these two markets appears to be within reach and would result in the removal of a large chunk of the world drug problem
and many of its associated ills. As regards the availability of tools and data to guide interventions and monitor their impact, the situation is much better than in the case of other drugs. Production is already measured on a yearly basis and national data on trafficking is well reported by Member States. There is relatively good demand data from OECD countries, and gaps in other important consuming countries, particularly for heroin, could relatively easily be remedied by prevalence surveys for cocaine or by indirect measures, such as treatment multiplier methods, for heroin.
Global opium production and global coca production have grown by a factor of 6 (cocaine) and 7 (opium) during the last three decades. Eliminating or signifi-cantly reducing the world heroin and cocaine markets will thus require more effective approaches than in the past. What can be done? The first thing is to remedy the biggest shortcomings of previous approaches. Member States have recognized an essential one: a lack of integra-tion. In the 2009 Political Declaration,4 Member States acknowledged “the importance of promoting, in order to enhance the effectiveness of drug control measures, an integrated approach in drug policies” (art. 31). This call is echoed in the new Plan of Action, notably in its Art. 27, under the title “Addressing supply and demand reduction together”: “While drug trafficking is a multi-faceted issue than can be effectively tackled only by reducing both supply and demand, this interlinkage is often not taken into account.”
To achieve the 2019 objectives, the international com-munity needs to interweave drug supply and demand reduction interventions and integrate national efforts into the framework of renewed international strategies on the scale of the cocaine, heroin and ATS markets. To do so, it is urgent to improve our understanding of how these illicit transnational drug economies operate. UNODC has intensified research efforts on the topic. Preliminary results are presented in this chapter.
4 High-level Segment to the 2009 United Nations Commission on Narcotic Drugs, Political Declaration and Plan of Action on Inter-national Cooperation towards an Integrated and Balanced Strategy to Counter the World Drug Problem, March 2009 (E/2009/28 - E/CN.7/2009/12).


1.2 The global heroin market
37
Worldwide, more than 15 million people consume illicit opiates1 (opium, morphine and heroin). The large majority use heroin, the most lethal form. More users die each year from problems related to heroin use, and more are forced to seek treatment for addiction, than for any other illicit drug. Among illicit narcotics, opiates are also the most costly in terms of treatment, medical care and, arguably, drug-related violence. In addition, heroin is the drug most associated with injection, which brings about a host of acute and chronic health problems, including the transmission of blood-borne diseases such as HIV/AIDS and Hepatitis C. In Central Asia, Ukraine and the Russian Federation, injecting opiates is linked to nearly 60-70% of all HIV infections.2
Beyond its health impact, the illicit opiate industry also has a detrimental effect on stability and security in a number of places, including through the funding it pro-vides for insurgents in production areas, particularly in Afghanistan. In 1998, the United Nations General Assembly Special Session on drugs already expressed ‘deep concern about links between illicit drug produc-tion, trafficking and involvement of terrorist groups, criminals and transnational organized crime.’3 In some
1 Opiates are a group of psychoactive substances derived from the poppy plant, which includes opium, morphine, codeine and some others. The term ‘opiate’ is also used for the semi-synthetic drug heroin that is produced from poppy compounds.
2 Mathers B., Degenhardt L., Phillips B., Wiessing L., Hickman M., Strathdee A., Wodak A., Panda S., Tyndall M., Toufik A. and Mattick R, on behalf of the Reference Group to the United Nations on HIV and Injecting Drug Use, “Global epidemiology of injecting drug use and HIV among people who inject drugs: a systematic review,” The Lancet, 2008; 372:1733-1745.
3 United Nations General Assembly Special Session on the World Drug Problem (UNGASS), New York, June 8-10, 1998.
regions, the nexus of illicit drugs, organized crime and instability has taken the form of growing infiltration of state institutions by drug trafficking groups.
Getting opiates from producer to consumers worldwide is a well-organized and, most importantly, profitable activity. The most lucrative of illicit opiates, heroin, presently commands an estimated annual market value of US$55 billion. When all opiates are considered, the number may reach up to US$65 billion. Traffickers, essential to the transportation of drugs from production areas to lucrative end-user markets, pocket most of the profits of this trade. A rough estimate of the number of traffickers involved in moving this illegal commodity across countries and regions would likely stand at well above 1 million people.4
The problem is not new and tremendous efforts have been made by governments over the past decades to stem the flow of illicit opiates. Many successes have been obtained. Most of them have been local, however, and over the long term, global illicit opiate production has increased.
The supply source for this huge underground economy is now concentrated in three areas: Afghanistan, South-East Asia (mostly Myanmar) and Latin America (Mexico and Colombia). Together, they supply nearly all the world’s illicit opium and heroin, but Afghanistan stands out among this group, accounting for around 90% of global illicit opium production in recent years.
4 Based on the annual number of arrests for heroin trafficking reported and a tentative, but very high, arrest ratio of 20% (1 in 5 traffickers arrested, which is most certainly well above the real number).
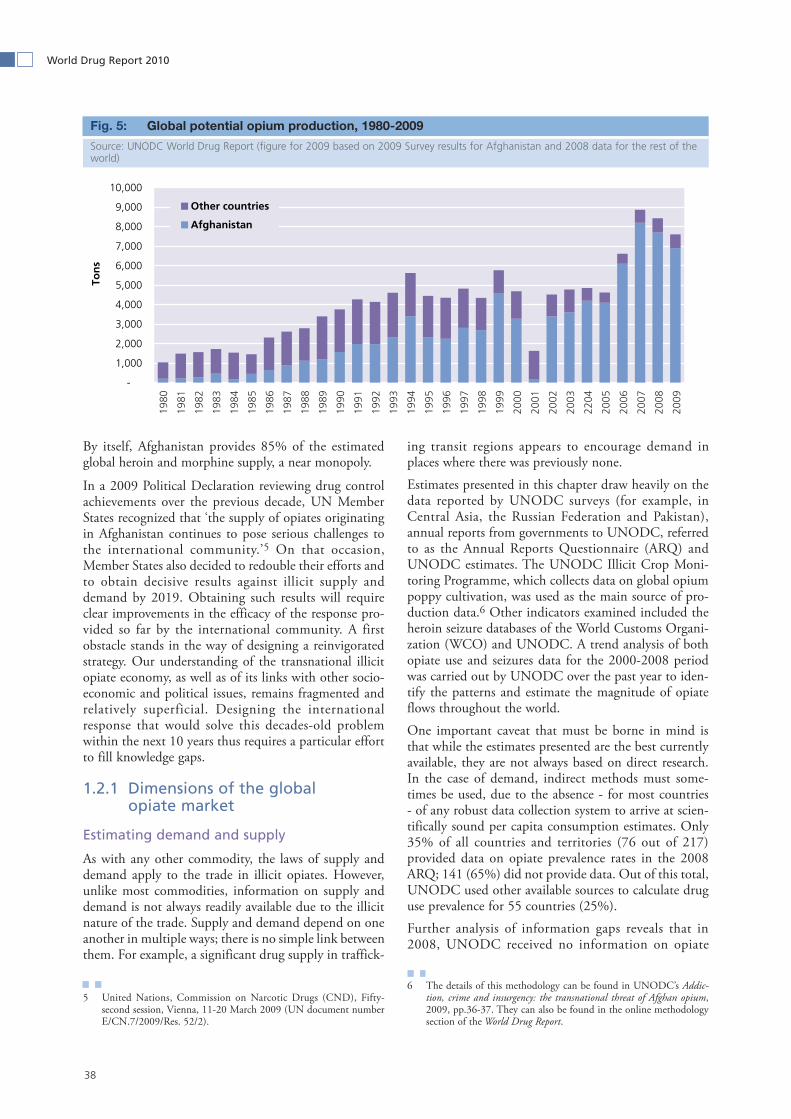
38
World Drug Report 2010
By itself, Afghanistan provides 85% of the estimated global heroin and morphine supply, a near monopoly.
In a 2009 Political Declaration reviewing drug control achievements over the previous decade, UN Member States recognized that ‘the supply of opiates originating in Afghanistan continues to pose serious challenges to the international community.’5 On that occasion, Member States also decided to redouble their efforts and to obtain decisive results against illicit supply and demand by 2019. Obtaining such results will require clear improvements in the efficacy of the response pro-vided so far by the international community. A first obstacle stands in the way of designing a reinvigorated strategy. Our understanding of the transnational illicit opiate economy, as well as of its links with other socio-economic and political issues, remains fragmented and relatively superficial. Designing the international response that would solve this decades-old problem within the next 10 years thus requires a particular effort to fill knowledge gaps.
Dimensions of the global 1.2.1 opiate market
Estimating demand and supply
As with any other commodity, the laws of supply and demand apply to the trade in illicit opiates. However, unlike most commodities, information on supply and demand is not always readily available due to the illicit nature of the trade. Supply and demand depend on one another in multiple ways; there is no simple link between them. For example, a significant drug supply in traffick-
5 United Nations, Commission on Narcotic Drugs (CND), Fifty-second session, Vienna, 11-20 March 2009 (UN document number E/CN.7/2009/Res. 52/2).
ing transit regions appears to encourage demand in places where there was previously none.
Estimates presented in this chapter draw heavily on the data reported by UNODC surveys (for example, in Central Asia, the Russian Federation and Pakistan), annual reports from governments to UNODC, referred to as the Annual Reports Questionnaire (ARQ) and UNODC estimates. The UNODC Illicit Crop Moni-toring Programme, which collects data on global opium poppy cultivation, was used as the main source of pro-duction data.6 Other indicators examined included the heroin seizure databases of the World Customs Organi-zation (WCO) and UNODC. A trend analysis of both opiate use and seizures data for the 2000-2008 period was carried out by UNODC over the past year to iden-tify the patterns and estimate the magnitude of opiate flows throughout the world.
One important caveat that must be borne in mind is that while the estimates presented are the best currently available, they are not always based on direct research. In the case of demand, indirect methods must some-times be used, due to the absence - for most countries - of any robust data collection system to arrive at scien-tifically sound per capita consumption estimates. Only 35% of all countries and territories (76 out of 217) provided data on opiate prevalence rates in the 2008 ARQ; 141 (65%) did not provide data. Out of this total, UNODC used other available sources to calculate drug use prevalence for 55 countries (25%).
Further analysis of information gaps reveals that in 2008, UNODC received no information on opiate
6 The details of this methodology can be found in UNODC’s Addic-tion, crime and insurgency: the transnational threat of Afghan opium, 2009, pp.36-37. They can also be found in the online methodology section of the World Drug Report.
Global potential opium production, 1980-2009Fig. 5:
Source: UNODC World Drug Report (figure for 2009 based on 2009 Survey results for Afghanistan and 2008 data for the rest of the world)
-
1,000
2,000
3,000
4,000
5,000
6,000
7,000
8,000
9,000
10,000
1980
1982
1984
1986
1988
1990
1992
1994
1996
1998
2000
2002
2004
2006
2008
Ton
s
Other countries
Afghanistan
1980
1981
1982
1983
1984
1985
1986
1987
1988
1989
1990
1991
1992
1993
1994
1995
1996
1997
1998
1999
2000
2001
2002
2003
2204
2005
2006
2007
2008
2009
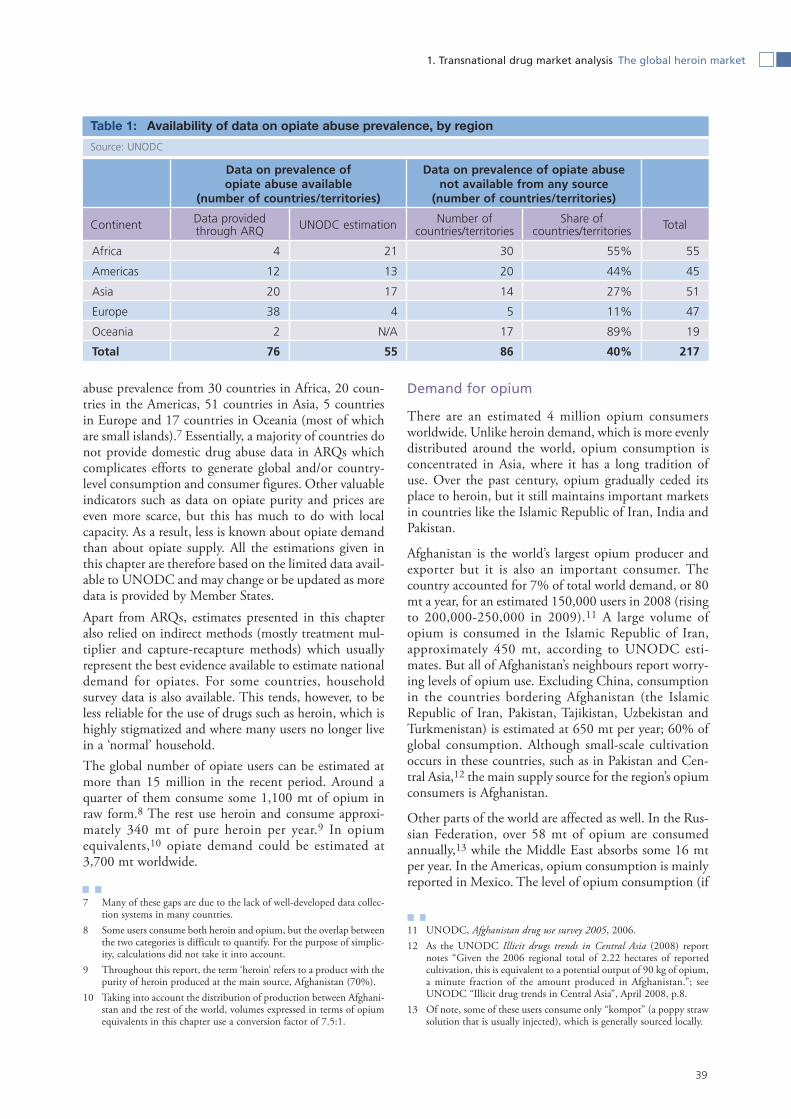
39
1. Transnational drug market analysis The global heroin market
abuse prevalence from 30 countries in Africa, 20 coun-tries in the Americas, 51 countries in Asia, 5 countries in Europe and 17 countries in Oceania (most of which are small islands).7 Essentially, a majority of countries do not provide domestic drug abuse data in ARQs which complicates efforts to generate global and/or country-level consumption and consumer figures. Other valuable indicators such as data on opiate purity and prices are even more scarce, but this has much to do with local capacity. As a result, less is known about opiate demand than about opiate supply. All the estimations given in this chapter are therefore based on the limited data avail-able to UNODC and may change or be updated as more data is provided by Member States. Apart from ARQs, estimates presented in this chapter also relied on indirect methods (mostly treatment mul-tiplier and capture-recapture methods) which usually represent the best evidence available to estimate national demand for opiates. For some countries, household survey data is also available. This tends, however, to be less reliable for the use of drugs such as heroin, which is highly stigmatized and where many users no longer live in a ‘normal’ household. The global number of opiate users can be estimated at more than 15 million in the recent period. Around a quarter of them consume some 1,100 mt of opium in raw form.8 The rest use heroin and consume approxi-mately 340 mt of pure heroin per year.9 In opium equivalents,10 opiate demand could be estimated at 3,700 mt worldwide.
7 Many of these gaps are due to the lack of well-developed data collec-tion systems in many countries.
8 Some users consume both heroin and opium, but the overlap between the two categories is difficult to quantify. For the purpose of simplic-ity, calculations did not take it into account.
9 Throughout this report, the term ‘heroin’ refers to a product with the purity of heroin produced at the main source, Afghanistan (70%).
10 Taking into account the distribution of production between Afghani-stan and the rest of the world, volumes expressed in terms of opium equivalents in this chapter use a conversion factor of 7.5:1.
Demand for opium
There are an estimated 4 million opium consumers worldwide. Unlike heroin demand, which is more evenly distributed around the world, opium consumption is concentrated in Asia, where it has a long tradition of use. Over the past century, opium gradually ceded its place to heroin, but it still maintains important markets in countries like the Islamic Republic of Iran, India and Pakistan.
Afghanistan is the world’s largest opium producer and exporter but it is also an important consumer. The country accounted for 7% of total world demand, or 80 mt a year, for an estimated 150,000 users in 2008 (rising to 200,000-250,000 in 2009).11 A large volume of opium is consumed in the Islamic Republic of Iran, approximately 450 mt, according to UNODC esti-mates. But all of Afghanistan’s neighbours report worry-ing levels of opium use. Excluding China, consumption in the countries bordering Afghanistan (the Islamic Republic of Iran, Pakistan, Tajikistan, Uzbekistan and Turkmenistan) is estimated at 650 mt per year; 60% of global consumption. Although small-scale cultivation occurs in these countries, such as in Pakistan and Cen-tral Asia,12 the main supply source for the region’s opium consumers is Afghanistan.
Other parts of the world are affected as well. In the Rus-sian Federation, over 58 mt of opium are consumed annually,13 while the Middle East absorbs some 16 mt per year. In the Americas, opium consumption is mainly reported in Mexico. The level of opium consumption (if
11 UNODC, Afghanistan drug use survey 2005, 2006.12 As the UNODC Illicit drugs trends in Central Asia (2008) report
notes “Given the 2006 regional total of 2.22 hectares of reported cultivation, this is equivalent to a potential output of 90 kg of opium, a minute fraction of the amount produced in Afghanistan.”; see UNODC “Illicit drug trends in Central Asia”, April 2008, p.8.
13 Of note, some of these users consume only “kompot” (a poppy straw solution that is usually injected), which is generally sourced locally.
Data on prevalence of opiate abuse available
(number of countries/territories)
Data on prevalence of opiate abuse not available from any source
(number of countries/territories)
Continent Data provided through ARQ UNODC estimation Number of
countries/territoriesShare of
countries/territories Total
Africa 4 21 30 55% 55
Americas 12 13 20 44% 45
Asia 20 17 14 27% 51
Europe 38 4 5 11% 47
Oceania 2 N/A 17 89% 19
Total 76 55 86 40% 217
Availability of data on opiate abuse prevalence, by regionTable 1:
Source: UNODC
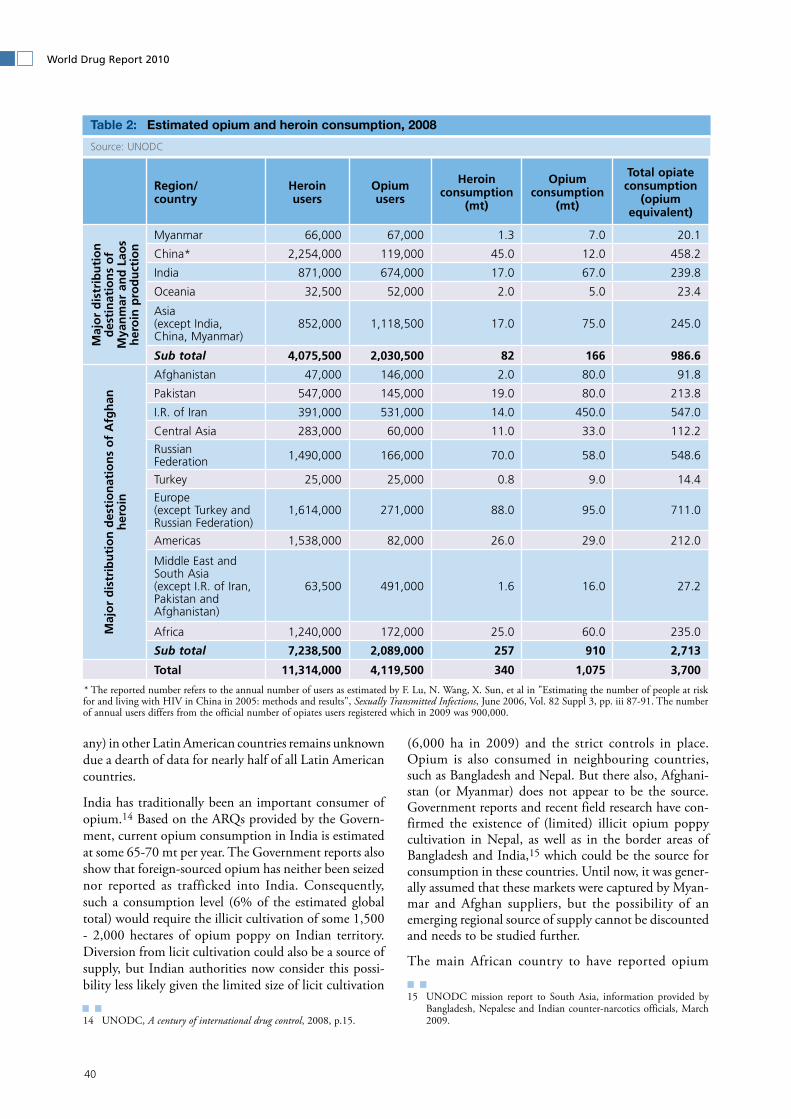
40
World Drug Report 2010
any) in other Latin American countries remains unknown due a dearth of data for nearly half of all Latin American countries.
India has traditionally been an important consumer of opium.14 Based on the ARQs provided by the Govern-ment, current opium consumption in India is estimated at some 65-70 mt per year. The Government reports also show that foreign-sourced opium has neither been seized nor reported as trafficked into India. Consequently, such a consumption level (6% of the estimated global total) would require the illicit cultivation of some 1,500 - 2,000 hectares of opium poppy on Indian territory. Diversion from licit cultivation could also be a source of supply, but Indian authorities now consider this possi-bility less likely given the limited size of licit cultivation
14 UNODC, A century of international drug control, 2008, p.15.
(6,000 ha in 2009) and the strict controls in place. Opium is also consumed in neighbouring countries, such as Bangladesh and Nepal. But there also, Afghani-stan (or Myanmar) does not appear to be the source. Government reports and recent field research have con-firmed the existence of (limited) illicit opium poppy cultivation in Nepal, as well as in the border areas of Bangladesh and India,15 which could be the source for consumption in these countries. Until now, it was gener-ally assumed that these markets were captured by Myan-mar and Afghan suppliers, but the possibility of an emerging regional source of supply cannot be discounted and needs to be studied further.
The main African country to have reported opium
15 UNODC mission report to South Asia, information provided by Bangladesh, Nepalese and Indian counter-narcotics officials, March 2009.
Estimated opium and heroin consumption, 2008Table 2:
Source: UNODC
Region/ country
Heroin users
Opium users
Heroin consumption
(mt)
Opium consumption
(mt)
Total opiate consumption
(opium equivalent)
Maj
or
dis
trib
uti
on
d
esti
nat
ion
s o
f
Mya
nm
ar a
nd
Lao
s h
ero
in p
rod
uct
ion
Myanmar 66,000 67,000 1.3 7.0 20.1
China* 2,254,000 119,000 45.0 12.0 458.2
India 871,000 674,000 17.0 67.0 239.8
Oceania 32,500 52,000 2.0 5.0 23.4
Asia (except India, China, Myanmar)
852,000 1,118,500 17.0 75.0 245.0
Sub total 4,075,500 2,030,500 82 166 986.6
Maj
or
dis
trib
uti
on
des
tio
nat
ion
s o
f A
fgh
an
her
oin
Afghanistan 47,000 146,000 2.0 80.0 91.8
Pakistan 547,000 145,000 19.0 80.0 213.8
I.R. of Iran 391,000 531,000 14.0 450.0 547.0
Central Asia 283,000 60,000 11.0 33.0 112.2
Russian Federation 1,490,000 166,000 70.0 58.0 548.6
Turkey 25,000 25,000 0.8 9.0 14.4
Europe (except Turkey and Russian Federation)
1,614,000 271,000 88.0 95.0 711.0
Americas 1,538,000 82,000 26.0 29.0 212.0
Middle East and South Asia (except I.R. of Iran, Pakistan and Afghanistan)
63,500 491,000 1.6 16.0 27.2
Africa 1,240,000 172,000 25.0 60.0 235.0
Sub total 7,238,500 2,089,000 257 910 2,713
Total 11,314,000 4,119,500 340 1,075 3,700
* The reported number refers to the annual number of users as estimated by F. Lu, N. Wang, X. Sun, et al in "Estimating the number of people at risk for and living with HIV in China in 2005: methods and results", Sexually Transmitted Infections, June 2006, Vol. 82 Suppl 3, pp. iii 87-91. The number of annual users differs from the official number of opiates users registered which in 2009 was 900,000.

41
1. Transnational drug market analysis The global heroin market
consumption is Egypt. As in India, there are no reports or data to indicate that the opium consumed in Egypt (estimated at 60 mt)16 is trafficked from another coun-try. This may suggest the existence of illicit cultivation of some 1,000 ha of opium poppy in Egypt. Raw opium may also be consumed in other African countries, but until comprehensive drug use surveys are conducted or other data is made available to UNODC, much uncer-tainty will remain in this area.
Although it reportedly consumed an extraordinary 26,690 mt of opium a century ago,17 consumption in China now appears to be limited to some 12 mt annual-ly.18 The opium consumed in South–East and East Asia originates mainly in Myanmar and to a much lesser extent in the Lao People’s Democratic Republic. There may be some local production in other East and South-East Asian countries, since the amount of opium seized there (0.3 mt in 2008) is not proportional, compared with other regions, to the estimated level of consump-tion (75 mt). Moreover, there is little evidence of opium trafficking from Myanmar or the Lao People’s Demo-cratic Republic to these countries.
Demand for heroin
Heroin is a more potent and addictive derivative of opium. It may be smoked or injected. In recent years, it is estimated that some 340 mt of the substance have been consumed worldwide each year.
16 UNODC, Addiction, crime and insurgency: the transnational threat of Afghan opium, 2009.
17 UNODC, A century of international drug control, 2008, p.91.18 UNODC, Addiction, crime and insurgency: the transnational threat of
Afghan opium, 2009, p.27.
Two markets, Europe19 and the Russian Federation, cur-rently account for nearly half of global heroin consump-tion. With 70 mt of heroin consumed per year, the Russian Federation is estimated to be the country with the highest national level of consumption. The com-bined level of heroin consumption in European coun-tries is estimated at around 85-90 mt.20 Within Europe, four countries dominate, namely the United Kingdom (some 19 mt), Italy (about 18 mt), France (an estimated 10 mt) and Germany (approximately 7 mt). Afghan opium is now the only known source of heroin con-sumed in Europe and the Russian Federation.
In 2008, available data suggest that around 20 mt of heroin were consumed in the United States of America, 1.3 mt in Canada and 5 mt in Latin America. According to US Government reports, the majority of the heroin consumed in the country comes from Latin America and Mexico. The rest is trafficked from Afghanistan via Europe and Africa. Opium production in Mexico was reported to have sharply increased that year (by 120%), amounting to 325 mt of raw opium, from which 30-40 mt of heroin could potentially be produced.
In contrast to its high opium consumption levels and despite its proximity to the world’s largest heroin pro-ducer, official reports indicate that heroin consumption is relatively low in the Islamic Republic of Iran (14 mt for an estimated 391,000 users). Afghanistan’s other neighbour, Pakistan, has approximately 500,000 heroin users, estimated to have consumed around 19 mt of heroin in 2008. At the source, in Afghanistan, domestic consumption is estimated at around 2 mt per year (2008)
19 For the purpose of analysis in this chapter, "Europe" excludes Turkey and the Russian Federation.
20 Ibid.
Estimated global opium consumption Fig. 6: in 2008
Source: UNODC
Global heroin consumption (340 mt), Fig. 7: 2008
Source: UNODC
Europe (except Russia & Turkey),
95 tons, 9%
Other, 92 tons, 9%
India, 67 tons, 6%E,S&SE Asia, 87 tons,
8%
Myanmar, 7 tons, 1%
Afghanistan, 80 tons, 7%
Pakistan, 80 tons,7%
Africa, 60 tons, 6%
Russian Federation, 58 tons, 5%
Islamic Republic of Iran,
452 tons, 42%
Others,24 tons, 7%
Africa, 24 tons, 7%
USA & Canada, 22 tons, 6%
Europe (except Russia & Turkey),
88 tons, 26%
Russian Federation,
70 tons, 21%
S&SE Asia, 17 tons, 5%
India, 17 tons, 5%
China,45 tons, 13%
Pakistan, 19 tons, 6%
Islamic Republic of Iran, 17 tons, 5%

42
World Drug Report 2010
among 50,000 users (this increased to 100,000-135,000 in 2009.
At an estimated 17 mt in 2008, India has the highest level of heroin consumption in South Asia. The estimated amount of heroin consumed in neighbouring Bangladesh was also considerable, amounting to 4 mt in the same year. In Nepal, heroin consumption appears to have increased in recent years and is currently estimated at around 800 kg. As already noted, there appears to be a certain level of heroin production – and illicit opium poppy cultivation- in India. According to official reports from the Governments of Nepal and Bangladesh, almost all the heroin consumed in those countries originates in India.
China’s 2.2 million heroin users, the largest population in absolute terms, were estimated to consume some 45 mt of heroin in 2008. Most of the supply for China is sourced in Myanmar, although Afghan heroin appears to be gaining market shares. In other South-East and East Asian countries, heroin consumption was estimated at around 18 mt. The main sources of the heroin con-sumed in this region are Myanmar and the Lao People’s Democratic Republic, followed by processed Afghan opium. In Australia and New Zealand, the annual heroin consumption was estimated at 1.8 mt, sourced from both Afghanistan and Myanmar.
Nearly all of Africa’s opiate users are reportedly consum-ing heroin.21 Although estimates for that region are not very reliable, approximately 25 mt of heroin would be needed to supply Africa’s addict population,22 tenta-tively estimated at 1.2 million individuals. Most of this
21 UNODC, 2006 World Drug Report, p. 74.22 UNODC, Addiction, crime and insurgency: the transnational threat of
Afghan opium, 2009, p. 13.
market appears to be supplied by Afghan heroin traf-ficked via Pakistan, India and a number of countries along the Arabian peninsula.
Value of the trade
At retail level, the total value of the heroin market is substantial at an estimated US$55 billion. The size of the annual opium market is a more ‘modest’ US$7-10 billion. Consequently, the combined total opiates (heroin/opium) market could be worth up to US$65 billion per year. This amount is higher than the GDPs of many countries. In economic terms, nearly half of the overall opiate market value is accounted for by Europe (some US$20 billion) and the Russian Federation (US$13 billion). Other lucrative markets include China (US$9 billion) and the United States and Canada (US$8 billion). Most profits are generated downstream, leaving Afghan producers with only a fraction of the profits. The farm-gate value to the farmer for cultivation and imme-diate sale of opium was estimated at US$0.4 billion in 2009. When adjusted to include the profits derived from trafficking of opium and the conversion of opium to morphine and/or heroin, the value to the Afghan opium economy was estimated at US$2.4 billion (2009) or only about 3.5% of the total value of the opiate industry.
Global volume and distribution
To estimate the quantity of opiates required to supply world illicit demand, one must add reported seizures to estimated levels of consumption. Some 646 mt of opium and 91 mt of heroin/morphine were seized in 2008. Around 5,000 mt of opiates (heroin, morphine and opium combined and expressed in opium equivalents) would have needed to enter the market to satisfy global demand in 2008.
For heroin only, world consumption (some 340 mt in 2008) combined with reported seizures (91 mt in 2008), would indicate an annual flow of about 430 mt of heroin into the global market.
The distribution of opium production
Production in Afghanistan increased from around 200 mt in 1980 to 3,300 mt in 2000, reaching a peak of 8,200 mt in 2007, before dropping slightly to 7,700 mt in 2008 and again to 6,900 in 2009. Expressed as a pro-portion of the global illicit opium production, Afghani-stan’s share rose from around 20% in 1980 to 70% in 2000, and to more than 90% since 2006. This is directly related to decreased output in the ‘Golden Triangle’, encompassing Thailand, the Lao People’s Democratic Republic and Myanmar, the world’s leading opium pro-ducer in the 1970s and 1980s. Between 2003 and 2008, opium production in Myanmar fell by 59%, from 810 to 410 mt. Production in the neighbouring Lao People’s
Global heroin/opium market Fig. 8: distribution (US$ 65 billion) in 2008
Source: UNODC
USA & Canada,13%
Africa,6%
Other,8%
China,12%
S&SE Asia,5%
India,5%
Russian Federation,
22%
Islamic Republic of Iran, 3%
Europe (except Russia),
26%

43
1. Transnational drug market analysis The global heroin market
Democratic Republic also declined dramatically, from more than 120 mt in the 1990s to around 10 mt in recent years. Thailand’s production is negligible; it has not reported any significant cultivation since 2003.
Although Afghanistan’s potential opium production decreased by 10% from 2008 to 2009, it is still well above the average annual production recorded during the 1990-2006 period. Data do not show a correspond-ing increase in world demand and UNODC has not registered any unusual price declines or dramatic increases in the purity of the heroin seized worldwide. On that basis, and taking into account uncertainties as regards the exact level of world demand, a potential over-production of some 12,000 mt during that period presents a supply-demand riddle that deserves atten-tion.
Turning to the Americas, the average amount of opium estimated to be produced in Latin America and Mexico was around 130 mt per year until 2006. In 2008, a reported 120% increase in opium production in Mexico made it the third biggest opium producing country after Myanmar with 325 mt potentially produced in 2008.
Heroin and morphine
(mt)
Heroin and morphine in
opium equivalent (mt)
Opium (mt)Total opium equivalents
(mt)
Maj
or
dis
trib
uti
on
ro
ute
s o
f M
yan
mar
an
d L
aos
her
oin
p
rod
uct
ion
Myanmar 0.3 3.0 3.9 7
China 4.3 43.0 1.4 44
India 1.1 11.0 2.0 13
Oceania 0.1 0.8 0.0 1
Asia (except India, China, Myanmar) 1.0 10.0 0.3 10
Sub total (rounded) 7 68 8 76
Maj
or
dis
trib
uti
on
ro
ute
s o
f A
fgh
an
her
oin
Afghanistan 3.3 23.1 43.0 66
Pakistan 9.2 64.4 27.0 91
I. R. of Iran 32.0 224.0 561.0 785
Central Asia 5.3 37.1 4.8 42
Russian Federation 3.4 23.8 0.4 24
Turkey 15.5 108.5 0.5 109
Europe (except Turkey and Russian Federation) 10.4 72.8 0.3 73
Americas 3.6 25.2 0.8 26
Middle East and South Asia (except I. R. of Iran, Pakistan and Afghanistan)
0.8 5.6 0.1 6
Africa 0.3 2.2 0.1 2
Sub total (rounded) 84 587 638 1,225
World total (rounded) 91 655 646 1,301
Opiate (opium, heroin and morphine) seizures, 2008Table 3:
Source: UNODC
0
1,000
2,000
3,000
4,000
5,000
6,000
7,000
8,000
9,000
10,000
1990
1992
1994
1996
1998
2000
2002
2004
2006
2008
Op
ium
pro
du
ctio
n (
ton
s)
Afghanistan
South-East Asia
Other
World Total
Global opium production, 1990-2009Fig. 9:
Source: UNODC
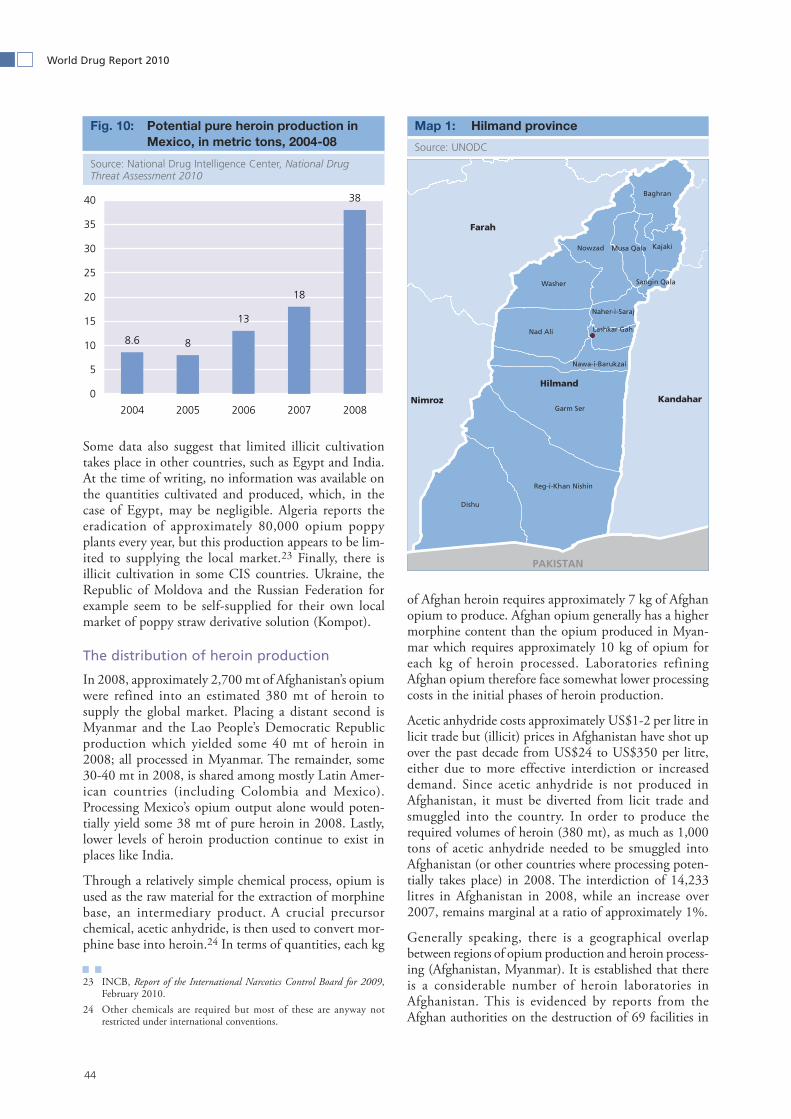
44
World Drug Report 2010
Some data also suggest that limited illicit cultivation takes place in other countries, such as Egypt and India. At the time of writing, no information was available on the quantities cultivated and produced, which, in the case of Egypt, may be negligible. Algeria reports the eradication of approximately 80,000 opium poppy plants every year, but this production appears to be lim-ited to supplying the local market.23 Finally, there is illicit cultivation in some CIS countries. Ukraine, the Republic of Moldova and the Russian Federation for example seem to be self-supplied for their own local market of poppy straw derivative solution (Kompot).
The distribution of heroin production
In 2008, approximately 2,700 mt of Afghanistan’s opium were refined into an estimated 380 mt of heroin to supply the global market. Placing a distant second is Myanmar and the Lao People’s Democratic Republic production which yielded some 40 mt of heroin in 2008; all processed in Myanmar. The remainder, some 30-40 mt in 2008, is shared among mostly Latin Amer-ican countries (including Colombia and Mexico). Processing Mexico’s opium output alone would poten-tially yield some 38 mt of pure heroin in 2008. Lastly, lower levels of heroin production continue to exist in places like India.
Through a relatively simple chemical process, opium is used as the raw material for the extraction of morphine base, an intermediary product. A crucial precursor chemical, acetic anhydride, is then used to convert mor-phine base into heroin.24 In terms of quantities, each kg
23 INCB, Report of the International Narcotics Control Board for 2009, February 2010.
24 Other chemicals are required but most of these are anyway not restricted under international conventions.
of Afghan heroin requires approximately 7 kg of Afghan opium to produce. Afghan opium generally has a higher morphine content than the opium produced in Myan-mar which requires approximately 10 kg of opium for each kg of heroin processed. Laboratories refining Afghan opium therefore face somewhat lower processing costs in the initial phases of heroin production.
Acetic anhydride costs approximately US$1-2 per litre in licit trade but (illicit) prices in Afghanistan have shot up over the past decade from US$24 to US$350 per litre, either due to more effective interdiction or increased demand. Since acetic anhydride is not produced in Afghanistan, it must be diverted from licit trade and smuggled into the country. In order to produce the required volumes of heroin (380 mt), as much as 1,000 tons of acetic anhydride needed to be smuggled into Afghanistan (or other countries where processing poten-tially takes place) in 2008. The interdiction of 14,233 litres in Afghanistan in 2008, while an increase over 2007, remains marginal at a ratio of approximately 1%.
Generally speaking, there is a geographical overlap between regions of opium production and heroin process-ing (Afghanistan, Myanmar). It is established that there is a considerable number of heroin laboratories in Afghanistan. This is evidenced by reports from the Afghan authorities on the destruction of 69 facilities in
Potential pure heroin production in Fig. 10: Mexico, in metric tons, 2004-08
Source: National Drug Intelligence Center, National Drug Threat Assessment 2010
8.6 8
13
18
38
0
5
10
15
20
25
30
35
40
2004 2005 2006 2007 2008
Hilmand
Farah
KandaharNimroz
Dishu
Garm Ser
Reg-i-Khan Nishin
Nad Ali
Washer
Nowzad
Baghran
Kajaki
Nawa-i-Barukzai
Naher-i-Saraj
Musa Qala
Sangin Qala
PAKISTAN
Lashkar Gah
Hilmand provinceMap 1:
Source: UNODC

45
1. Transnational drug market analysis The global heroin market
200825 (against 57 in 2007) while UNODC surveyors identified 97 laboratories that same year. By way of com-parison, Myanmar authorities dismantled 24 heroin laboratories over the 2006-2008 period.26
In Afghanistan, processing (and cultivation) are concen-trated in the southern provinces, such as Hilmand, Kan-dahar and Nimroz, where the insurgency and lack of government control provide the ideal cover. Notably, Kandahar’s Spin Boldak district was the location of the largest acetic anhydride seizure in 2008, with 7,500 litres (enough for over 3.5 mt of heroin) confiscated in a single incident. But Hilmand province is at the core of the global trade in Afghan opiates. As well as its vast produc-tion of opium, it is also the location of large, fixed heroin processing facilities. In 2008, Hilmand province alone accounted for almost 50% of Afghanistan’s opium sei-zures.27 Of the known district locations, Dishu in the south and Nad Ali in the centre saw the greatest seizure
25 UNODC Afghanistan country office, Analysis of Opiate and Precur-sor Seizures in Afghanistan in 2008, 2009, p.13; see UNODC 2009 World Drug Report, p.37.
26 UNODC, Patterns and Trends of Amphetamine-Type Stimulants and Other Drugs in East and South-East Asia (and neighbouring regions), November 2009, pp 86-91.
27 UNODC Afghanistan country office, Analysis of Opiate and Precur-sor Seizures in Afghanistan in 2008, 2009, p.13; see UNODC 2009 World Drug Report, p.37.
volumes. The latter district is a major opium poppy cul-tivation area on the Hilmand river, while Dishu is a processing district and a hub for trafficking into Pakistan. However, all of the laboratories dismantled in Hilmand in 2008 were in central and northern districts. Well-known opiate bazaars in places such as Lashkar Gah, Baramcha and Girishk continue to operate, although they were the scene of several seizures in 2008.
At the same time, there is also the possibility that not all Afghan opium is processed into heroin in Afghanistan. If this is the case, Afghanistan needs to export opium (and/or morphine) for this purpose, which, in the case of opium, increases the chance of detection. There are no reports, however, of Afghan opium being trafficked to the Americas, Africa, South Asia (except Pakistan) and South-East Asia. Only a trivial amount is thought to be shipped to Gulf countries and is limited to local consumption. Between 2000 and 2008, seizure data provided to UNODC indicated negligible opium and morphine seizures in European countries (including Turkey). There were, however, sizeable opium seizures reported by countries north of Afghanistan. In 2008, approximately 4.5 mt of opium were seized in Central Asian countries but the regional market (34 mt) likely absorbed most of the flow. Moreover, there is a general absence of morphine seizures in this region.
Oceania
Africa
USA,Canada
Gulf area,Middle East
South-East Europe Caucasus
West, Central,East Europe
South-East Asia
CentralAsia
RussianFederation
China
India Myanmar
Pakistan
IslamicRepublicof Iran
Afghanistan
Turkey
Flows of heroin (in metric tons)(not actual trafficking routes)
Opium production(in metric tons)
6-10
11
1-5
38 5,300
500
450
2,700
MyanmarAfghanistan
Opium
Transformedinto heroin
UN
OD
C /
SCIE
NC
ES P
O
105 051
95
82
88
95
77
Global heroin flows of Asian originsMap 2:
Source: UNODC

46
World Drug Report 2010
The highest volumes of morphine and opium seizures were reported by Pakistan and the Islamic Republic of Iran, Afghanistan’s immediate neighbours. In 2008, Pakistan (7.3 mt) and the Islamic Republic of Iran (9 mt) seized a combined 16.3 mt of morphine, a stagger-ing 95% of global morphine seizures. In contrast, Afghanistan only seized 479 kg that same year. Most Iranian and Pakistani morphine seizures occurred close to the Afghan border, perhaps suggesting that if large-scale processing is taking place outside Afghanistan, it is staying close to the source. Both Pakistan (27 mt) and the Islamic Republic of Iran (573 mt) effected more than 90% of global opium seizures, but demand for the substance is high in both countries while that of mor-phine is negligible. Referring to these numbers, the 2008 World Drug Report concluded that such high mor-phine and opium seizures indicated that ‘important amounts of heroin might be produced outside Afghani-stan, as morphine does not have a large user base.’ This possibility needs to be further researched.
Distribution of trafficking flows
As mentioned earlier, there is no strict division between regions of supply and demand. The same caution is war-ranted in examining ‘transit’ regions, which very often are also regions of consumption and possibly add to supply. The following estimate of global opiate flows uses a methodology combining both supply-side and demand-side analyses from production, consumption and seizure data.28
At first sight, there are distinct patterns of distribution, as production in Latin America and Myanmar is mostly dedicated to the US and Chinese markets, respectively. Altogether, these two regions constitute around 15% of total heroin flows in the world. Afghanistan accounts for an estimated 85% of global heroin and morphine exports, often overlapping with both Latin America and Myanmar, including in the case of the United States and Chinese markets, respectively.
From Afghanistan
Of the estimated 380 mt of heroin produced in Afghan-istan, approximately 5 mt stay in the country for local consumption or is seized by local law enforcement.29 The remaining 375 mt are exported to the world via routes flowing into and through the neighbouring coun-tries of Pakistan (150 mt), the Islamic Republic of Iran (105 mt) and the Central Asian countries of Tajikistan, Uzbekistan and Turkmenistan (95 mt) towards their
28 Available demand data was the key variable used to estimate the size of the heroin/opium flows. Total heroin consumption was estimated for each country, then combined with official seizure data and bal-anced against total production.
29 The country seized less than three mt of heroin in 2008, a seizure rate of less than 1%.
final destinations in Europe, the Russian Federation and Asia.30
About a third of the heroin produced in Afghanistan travels to Europe (110 mt) while a quarter goes north to Central Asia and the Russian Federation. Afghan heroin is also increasingly meeting a rapidly growing share of Asian, mainly Chinese, demand. Approximately 15-20 mt are estimated to be trafficked to China while another 35 mt are trafficked to other South and South-East Asian countries. 31 Perhaps 35 mt are shipped to Africa, while the remainder supplies markets in other parts of Asia, North America and Oceania.
In addition to heroin, Afghanistan also exports some 1,000 mt of opium annually to its immediate neigh-bours (the Islamic Republic of Iran, Pakistan and Cen-tral Asia) and further to a global market of some 4 million opium consumers - most of which are in Asia.32 With the exception of South and Central America, Afghan opiates are now trafficked and sold in virtually every corner of the globe.
From Myanmar
More than three quarters of Myanmar’s production (some 40 mt of heroin) supplies the local and regional markets, primarily Chinese. The remainder goes to other South-East Asian countries and Oceania.
From Latin America (Colombia and Mexico)
In 2008, it is estimated that some 30-40 mt of heroin were potentially produced in Latin America (mainly Mexico and Colombia). Producers in Colombia and Mexico supply all of the Americas, although the major-ity goes to the north.
Flow interception (seizures)
Interception rates vary widely between regions; however, estimated global interception rates are approximately 20% of the total heroin flow worldwide in 2008. The Islamic Republic of Iran leads all countries with 23% of all heroin interceptions. Turkey comes next with 16%, followed by the United States and China, which come in third and fourth with 9 and 8% respectively. Heroin seizures decreased sharply in Pakistan compared to the average level observed between 2000 and 2006 (26 mt).
30 The destination of the remaining 20 mt is unknown. It might be sourced from Afghanistan via Pakistan and/or other routes and/or be produced in India (diverted from the licit to the illicit market). In order to clarify this, an in-depth heroin consumption and trafficking study should be carried out in India.
31 There are approximately 20 mt of heroin unaccounted for which can potentially be trafficked to India (see UNODC, Addiction, crime and insurgency: the transnational threat of Afghan opium, 2009) but this remains a hypothesis until further evidence is produced.
32 See UNODC, Addiction, crime and insurgency: the transnational threat of Afghan opium, 2009, p. 11.

47
1. Transnational drug market analysis The global heroin market
Interdiction rates continued to remain very low in the main production centres of Afghanistan (1%) and Myanmar (1%), in African countries (1%), the Balkans (3%) and India (3%). In 2008, there were also substan-tial decreases in heroin seizure volumes in Western and Central Europe (7.6 mt), compared to the level observed between 2000 and 2006 (9 mt).
Global impact
The opium economy is deeply entrenched and its reach extends far beyond the borders of the few source coun-tries. Whether one looks at the damages to the health of communities, the rise in criminal activity, the loss of economic productivity, the impact on global security or the more insidious corruption of government institu-tions, it is fair to say that illicit opiates leave very few nations untouched.
The cost of opiate use to individual users and to society as a whole is high. Studies indicate that more users die each year from problems related to heroin use and more are forced to seek treatment for addiction than for any other illicit drug. Users develop both tolerance and physical dependence, which means that their bodies adjust to the presence of heroin over time, requiring
more to produce the same effect and inducing severe withdrawal symptoms if the drug is not taken in suffi-cient quantities. The difference between a recreational dose and a fatal one is small, and variations in street drug purity result in many overdoses. The mortality rate for dependent heroin users is between 6 and 20 times that expected for those in the general population of the same age and gender.33 In addition, heroin is the drug most associated with injection, which brings about a host of acute and chronic heath problems including the trans-mission of blood-borne diseases such as HIV/AIDS and hepatitis C.
The largest national market for Afghan heroin is the Russian Federation; a market which has rapidly expanded since the dissolution of the Soviet Union. It is there that heroin is currently doing some of its worst damage, including through the spread of HIV. In neighbouring Central Asia, the past 10 years have witnessed both the highest increase in prevalence of drug abuse worldwide and similarly alarming levels of HIV/AIDS. Both these regions are good examples of the speed and extent of the
33 WHO/UNODC/UNAIDS position paper: “Substitution mainte-nance therapy in the management of opioid dependence and HIV/AIDS prevention”.
Country/regionEstimated amount of
heroin + morphine flow (mt)
Average heroin + morphine
seizures (mt)
Percent of estimated flow intercepted
Afghanistan 380 3.30 1%
Pakistan 150 9.20 6%
I. R. of Iran 140 32.00 23%
Turkey 95 15.50 16%
South-East Europe (Bulgaria, Greece, Albania, Romania, Serbia, FYR Macedonia, Bosnia, Croatia, Montenegro)
90 2.8 3%
Rest of Europe (except Russian Federation) 105 7.60 7%
Midde East& Gulf countries (except I. R. of Iran) 14 0.80 6%
Central Asia 95 5.30 6%
Russian Federatioin 77 3.40 4%
Africa 35 0.31 1%
Myanmar 60 0.30 1%
India 37 1.10 3%
China 55 4.30 8%
Rest of S, E & SE Asia 30 1.00 3%
Oceania 2 0.08 4%
USA and Canada 24 2.1 9%
Heroin flow and interdiction, 2008Table 4:
Source: UNODC

48
World Drug Report 2010
damage a sudden increase in heroin transit can do. On the Balkan route, the ravages of opiate consumption in the Islamic Republic of Iran have been well documented, that country having one of the largest opium user popu-lations in the world. In Africa, an emerging destination for Afghan heroin, a rise in injecting drug use34 could worsen an already severe HIV/AIDS epidemic.35 In Afghanistan itself, while most of the lethal crop is exported, enough is left behind to create addiction. In 2005, UNODC estimated the entire opiate-using popu-lation to be 200,000. Since then, recurring anecdotal information appears to indicate increased addiction rates, sometimes affecting and debilitating entire villages.
In 2008, 285,000-360,000 opiate users were found in Afghanistan. In addition to creating health problems, the opiate trade has implications for global security. Previous UNODC research highlighted the role of drugs (including opiates) as precursors or perpetuators of instability worldwide.36 One early example was the Soviet invasion in 1979, which triggered the mass pro-duction of opiates in Afghanistan. Global drug produc-tion is increasingly being concentrated in a few unstable areas and conflict zones. In the case of opiates, insurgent groups operating in various theatres are thought to par-tially fund their operations from the taxing of produc-tion and trafficking. In Afghanistan, a conservative estimate placed the figure at US$125 million/year in profits for Taliban insurgents. Across the border, in Paki-stan’s tribal areas, Taliban allies such as al-Qaida and other like-minded groups (for example, the Islamic Movement of Turkestan and the Tehrik-e-Taliban Paki-stan) have bases along the main heroin/opium traffick-ing routes and are ideally located to benefit from trafficking. In other parts of the world, militant groups such as the Kurdistan Workers’ Party (PKK) or rebels in India’s north-east may also be benefiting from the illicit opiate trade. Illicit opiates thus potentially feed a chain of insecurity stretching across Asia and Europe.
Transnational crime generates money and power. This power is not sufficient to threaten the stability of devel-oped states, but in Afghanistan, and some vulnerable countries on the Balkan and Northern routes, money generated from opiates compares well with GDPs. The amount of money that the trade brings to bear on these countries’ political systems and societies poses a threat to their development and some nations may be at risk of ‘drug dependence’. Countries like Afghanistan (48% of
34 One of the indicators of that trend is the rise in the number of heroin users, which appears to have increased by 54% between 2004 and 2008 in Africa.
35 Sub-Saharan Africa, is home to two-thirds (67%) of people living with HIV/AIDS or 22 million people; see UNAIDS, Report on the Global AIDS epidemic 2008, August 2008.
36 UNODC, Addiction, crime and insurgency: the transnational threat of Afghan opium, 2009; see also UNODC, Crime and instability: case studies of transnational threats, February 2010.
GDP in 2007, 33% in 2008 and 26% in 2009), are in a sense dependent on the illicit opiates industry. In the case of Tajikistan, the industry may amount to as much as 30% of the recorded GDP.37 This situation is exploited by powerful criminal organizations, which have in some cases infiltrated the highest levels of government. These groups, which generate vast profits through drug traf-ficking and other illicit activities, are able to corrupt governmental officials, reduce the effectiveness of law enforcement and derail the march towards instituting the rule of law in newly-formed states in the Balkans, transition states in Central Asia and vulnerable states in Africa. Of course, corruption can emerge at any part of the chain, which means that corruption is not limited to transit (or source) countries.
Northern route1.2.2
Unlike other major routes out of Afghanistan which have existed for decades, the Northern route through Central Asia and into the Russian Federation is a rela-tively recent phenomenon, only taking shape in the mid-1990s. In this region, both the nature and extent of drug trafficking have been strongly shaped by the dis-solution of the USSR, whereby newly-formed states had to suddenly police borders previously administered cen-trally. These new borders remained virtually open until new national customs services were created in 1993–1994.38
Routes and volumes
UNODC estimates that 25% of all Afghan heroin -or 95 mt- are trafficked each year from Afghanistan into the Central Asian Republics (CARs) towards the Rus-sian Federation.39 This total includes heroin that is consumed en route or at destination, seized by law enforcement or to a limited extent, trafficked onward to Europe. The Russian market is estimated to consume approximately 70 mt of heroin annually while Central Asian demand stands at 11 mt; the rest is either seized or continues onwards.
In addition to heroin, some 120-130 mt of opium are smuggled into the region each year, mostly for con-sumption in the CARs and the Russian Federation. There is no evidence of morphine being shipped in large quantities through this route. Transformed into opium equivalents, approximately 780-800 mt of opiates are trafficked annually along this route.
37 Letizia Paoli et al., “Tajikistan: the rise of a narco-state”, The Journal of Drug Issues, 2007, p.951.
38 Martha Brill Olcott et al.; “Drug trafficking on the great Silk road: the security environment in Central Asia”, Carnegie Endowment working papers, 2000.
39 UNODC, Addiction, crime and insurgency: the transnational threat of Afghan opium, 2009.

49
1. Transnational drug market analysis The global heroin market
From Afghanistan to the north, traffickers are offered a choice of three countries: Tajikistan, Uzbekistan and Turkmenistan. These northern borders span a length of some 2,600 km. The Uzbek and Tajik borders are marked by the Amu Darya River, while the Turkmen border is mostly desert. Although there is no shortage of possibilities for clandestine crossings, it appears that most of the trafficking occurs along established trade and transit routes. There are nine official crossings between Afghanistan and Central Asia, including two river ports, one on the Uzbek border and one on the Tajik border. These river ports are the primary conduit for legitimate trade, and also, it appears, for trafficking. They are:
Hayraton (Afghanistan’s Balkh province - Sukhandaraya province of Uzbekistan);
Ninji Pianj (Afghanistan’s Kunduz province - Khatlon Province, Tajikistan).
Uzbekistan’s border with Afghanistan is short (137 km) and well-policed. While armed attempts at night cross-ings still occur, traffickers generally prefer to avoid this border in favour of easier alternatives such as the Tajik border. It appears instead that most opiates that do enter Uzbekistan first transit Tajikistan and to a lesser extent Kyrgyzstan. What cannot be excluded, however, is that larger, long-distance shipments by well-protected net-works may find it convenient to use the better-developed infrastructure of Hayraton when aiming for the Russian market, or even to import precursor chemicals, as evi-denced by a 2008 seizure of 1.5 mt of acetic acid.40
Afghanistan’s border with Turkmenistan is lengthy (744 km) and mostly desert. There is some lab activity in the border areas of adjoining Afghan provinces (such as Badghis), which is of concern since traffickers generally export opiates over the closest border. The Turkmen route is facilitated by the presence of approximately 1 million ethnic Turkmens in Hirat, Badghis and Faryab provinces. Turkmenistan also shares a 992 km border with the Islamic Republic of Iran where an equal number of Turkmens reside, mainly in the Mazanderan and Khorassan provinces, close to the border. Turkmenistan borders the Caspian Sea for a length of 1,768 km and its coastal port of Turkmenbashi was long viewed as an important heroin route across the Caspian to Azerbaijan and further to Europe. Although the Caspian is undoubt-edly used for opiate trafficking, recent UNODC field research suggests that trafficking through this particular seaport may have fallen into disuse. Seizure data also appears to indicate limited direct trafficking from Afghanistan into Turkmenistan. Other routes may how-ever be used. Recent data from the Central Asia Regional Information and Coordination Centre (CARICC) indi-
40 Acetic acid is not a controlled substance but as been cited as a possible alternative to acetic anhydride in processing.
cates the emergence of a new route through Turkmeni-stan: From Afghanistan to the Islamic Republic of Iran-Turkmenistan-Kazakhstan-Russian Federation/CIS countries-Europe.41 Not enough information is availa-ble on this route to estimate its importance, however. Turkmenistan was a leading country in precursor chem-ical seizures in the late 1990s,42 but no movements have been detected in the past decade.
From a law enforcement perspective, control of the Tajik-Afghan border (1,387 km) is becoming more and more elusive. Outside fixed border points, traffickers continue to swim, wade or cross the Amu Darya river by boat, with the majority reportedly crossing undetected. Once in Tajikistan, the loads are then broken down into smaller quantities to be shipped across the border by land, rail and air. The larger portion of opiates travels north through Kyrgyzstan toward Kazakhstan. In Kyr-gyzstan, the southern city of Osh has consistently been identified as a regional hub of trafficking activity. As noted, a smaller flow veers east into Uzbekistan and further to Kazakhstan.
The building of new bridges across the Amu Darya river, while crucial for the development of regional trade, is misused by traffickers. According to law enforcement sources, opiate traffickers, in collusion with corrupt officials, reportedly use the cover provided by legitimate cross-border commerce to traffic growing quantities of heroin into Tajikistan.43 These developing corridors can also be potentially misused for precursor conveyance destined for laboratories in north-eastern Afghanistan.44 In 2007, a seizure of 10 mt of acetic anhydride in the Russian Federation was to be shipped by truck to Afghanistan, by way of Tajikistan.45
In all, 95 mt of heroin are estimated to be trafficked across these three borders. Estimates suggest that the largest proportion of the Central Asian flow runs through Tajikistan. Once in Central Asia, traffickers have access to a number of transportation options, including a well-developed road and rail network. Based on seizure fig-ures, most trafficking appears to be conducted in private and commercial vehicles, often in relatively small amounts. Of 45 heroin seizures above 500 grams (a commercial quantity) made in Tajikistan between 2005
41 UNODC Regional office for Central Asia, “Compendium 2010”.42 In 1997-1998, 78% of heroin seized in Central Asia was apprehended
in Turkmenistan while in 1995-2000, more than 198 mt of precursor chemicals were seized in the country, mostly acetic anhydride; see UNODC ROCA, “The Drug and Crime Situation in Central Asia: Compendium”, 2003.
43 Interview, Tajikistan, November 2009.44 UNODC surveyors identified 24 laboratories (13 morphine, 11
heroin) in north-eastern Afghanistan, see UNODC Afghanistan country office, Analysis of Opiate and Precursor Seizures in Afghanistan in 2008, p 13.
45 UNODC, Addiction, crime and insurgency: the transnational threat of Afghan opium, 2009, p.73.

50
World Drug Report 2010
and 2007, 80% amounted to 10 kg or less, and of these, the average size was 2.6 kg. The largest seizure, made in 2005, was 119 kg. This is a large seizure, but it would take hundreds of similar shipments to accommodate the 95 mt estimated to be trafficked through the region.46
There appears to be a recent trend toward larger seizures, however, suggesting increasingly well-resourced organi-zations. While it was rare to find a seizure of over 100 kg of heroin in Central Asia (or the Russian Federation) prior to 2008, at least 14 such seizures have been made since that time, including in Kazakhstan (537 kg), Tajikistan (100 kg twice), Uzbekistan (133 kg and 568 kg) and the Russian Federation (330 kg). A similar trend was observed with opium, where larger than usual con-signments were seized in Tajikistan (400 kg), Turkmeni-stan (200 kg) and Uzbekistan (155 kg and 190 kg) in 2008. Of course, it remains unclear whether these trends reflect changes in the nature of the trafficking or in the nature of enforcement.
Reversing a previous downward trend that started in 2005, heroin seizures sharply increased in 2008 and made up the largest proportion of opiates seized in Cen-tral Asia. In all, 5.3 mt of heroin (60% more than in 2007) and 4.5 mt of opium (28% less than in 2007) were seized in Central Asia in 2008. Tajikistan has tra-ditionally led Central Asia in heroin seizures, and on a per capita basis, probably leads the world in opiate sei-zures.47 Turkmenistan’s seizures are dominated by opium
46 In contrast, large cocaine seizures are typically multiple mt, and the wholesale value of these drugs is about the same in their primary destination markets.
47 According to UNODC data, three of the Central Asian countries were listed among the top 25 opium seizing countries in 2007. In terms of global heroin seizures, Tajikistan ranked 7th; Kazakhstan – 19th; and Uzbekistan – 21st.
while other Central Asia countries appear more bal-anced. In 2008, Uzbekistan’s heroin seizures (1,472 kg) more than tripled compared to 2007 (480 kg).
Although most opiates are reported trafficked by road, traffickers can also move their product by air, including via direct routes into the Russian Federation. A common method involves internal body carry or 'swallowers'; most start their journey in Tajikistan. Air routes from Central Asia carry smaller shipments of opiates than land routes, but on aggregate, they likely amount to significant quantities with higher profit margins. Accord-ing to official reports from the Russian Federation, more than 20% of seized heroin enters the Russian Federation through commercial airliner.48 A smaller proportion, approximately 12%, is reportedly trafficked northward by passenger train. Here again, internal body carry appears to be a common method. UNODC estimates that approximately 25 mt of heroin are trafficked by air/rail, while the bulk, some 50-55 mt, is trafficked using the regional road network, mainly via Kazakhstan.49
Although Kazakhstan is the inescapable heroin gateway to the Russian Federation if travelling by land, it seized only about 3% of the heroin flow estimated to cross its territory in 2008, despite a three-fold increase in heroin seizures over previous years. Kazakhstan is also last in regional opium seizures despite an annual consumption estimated at 18 mt. This anomaly is difficult to explain. It is true that due to their length, Kazakhstan’s borders are the most challenging of all the CARs. A country roughly the size of Western Europe, Kazakhstan must police some 12,000 km of land borders (including the 7,000 km border with the Russian Federation) and 1,900 km of Caspian Sea coastline. Conversely, Kaza-khstan is probably the best equipped Central Asian state to handle the drug threat as it has the largest financial resources. A 2008 report from the Central Asian Regional Information and Coordination Centre (CARICC) starkly concluded: “If drugs reach the territory of Kaza-khstan then the probability of safe shipping to the Rus-sian Federation can be around 95%.” Once the heroin reaches Kazakhstan, most passes through the north-western borders into the populated areas of south-west-ern Russia and western Siberia.
In addition to losses en route such as seizures and local consumption, not all heroin is destined for the Russian Federation. One small stream (approximately 1 mt) veers east towards China’s Xinjiang province to supply the Chinese market. Based on anecdotal reports, this route may have grown in significance although it is unclear if one or all of Central Asia’s borders with China
48 ARQ, Russian Federation 2008. 49 UNODC, Addiction, crime and insurgency: the transnational threat of
Afghan opium, 2009, p.50.
2.11.1 1.4
3.25.1 5.1
6.8 6.33.8 3.7 3.3
5.3
9.9
5.0
9.5
10.74.7
3.0
2.9 4.0
2.7
5.7 6.24.5
1997
1998
1999
2000
2001
2002
2003
2004
2005
2006
2007
2008
OpiumHeroin
Opiate seizures in Central Asia, Fig. 11: 1997-2008 (mt)
Source: UNODC Regional Office for Central Asia
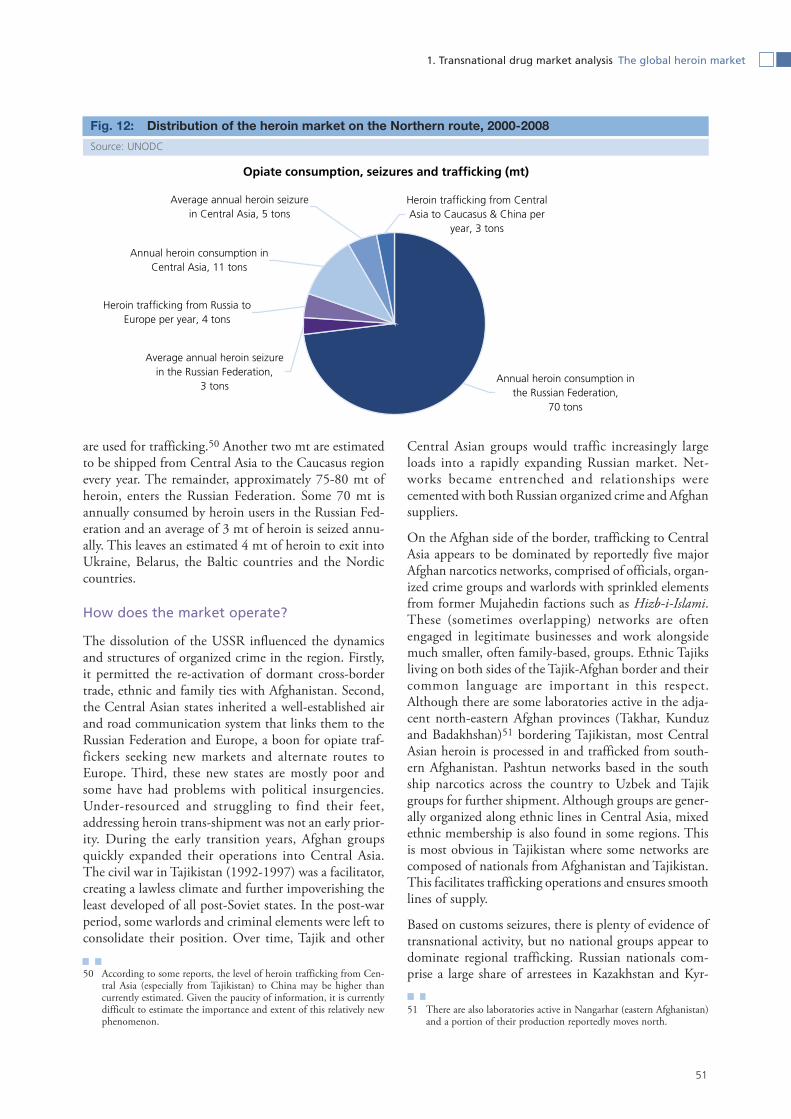
51
1. Transnational drug market analysis The global heroin market
are used for trafficking.50 Another two mt are estimated to be shipped from Central Asia to the Caucasus region every year. The remainder, approximately 75-80 mt of heroin, enters the Russian Federation. Some 70 mt is annually consumed by heroin users in the Russian Fed-eration and an average of 3 mt of heroin is seized annu-ally. This leaves an estimated 4 mt of heroin to exit into Ukraine, Belarus, the Baltic countries and the Nordic countries.
How does the market operate?
The dissolution of the USSR influenced the dynamics and structures of organized crime in the region. Firstly, it permitted the re-activation of dormant cross-border trade, ethnic and family ties with Afghanistan. Second, the Central Asian states inherited a well-established air and road communication system that links them to the Russian Federation and Europe, a boon for opiate traf-fickers seeking new markets and alternate routes to Europe. Third, these new states are mostly poor and some have had problems with political insurgencies. Under-resourced and struggling to find their feet, addressing heroin trans-shipment was not an early prior-ity. During the early transition years, Afghan groups quickly expanded their operations into Central Asia. The civil war in Tajikistan (1992-1997) was a facilitator, creating a lawless climate and further impoverishing the least developed of all post-Soviet states. In the post-war period, some warlords and criminal elements were left to consolidate their position. Over time, Tajik and other
50 According to some reports, the level of heroin trafficking from Cen-tral Asia (especially from Tajikistan) to China may be higher than currently estimated. Given the paucity of information, it is currently difficult to estimate the importance and extent of this relatively new phenomenon.
Central Asian groups would traffic increasingly large loads into a rapidly expanding Russian market. Net-works became entrenched and relationships were cemented with both Russian organized crime and Afghan suppliers.
On the Afghan side of the border, trafficking to Central Asia appears to be dominated by reportedly five major Afghan narcotics networks, comprised of officials, organ-ized crime groups and warlords with sprinkled elements from former Mujahedin factions such as Hizb-i-Islami. These (sometimes overlapping) networks are often engaged in legitimate businesses and work alongside much smaller, often family-based, groups. Ethnic Tajiks living on both sides of the Tajik-Afghan border and their common language are important in this respect. Although there are some laboratories active in the adja-cent north-eastern Afghan provinces (Takhar, Kunduz and Badakhshan)51 bordering Tajikistan, most Central Asian heroin is processed in and trafficked from south-ern Afghanistan. Pashtun networks based in the south ship narcotics across the country to Uzbek and Tajik groups for further shipment. Although groups are gener-ally organized along ethnic lines in Central Asia, mixed ethnic membership is also found in some regions. This is most obvious in Tajikistan where some networks are composed of nationals from Afghanistan and Tajikistan. This facilitates trafficking operations and ensures smooth lines of supply.
Based on customs seizures, there is plenty of evidence of transnational activity, but no national groups appear to dominate regional trafficking. Russian nationals com-prise a large share of arrestees in Kazakhstan and Kyr-
51 There are also laboratories active in Nangarhar (eastern Afghanistan) and a portion of their production reportedly moves north.
Distribution of the heroin market on the Northern route, 2000-2008Fig. 12:
Source: UNODC
Opiate consumption, seizures and trafficking (mt)
Heroin trafficking from Russia to Europe per year, 4 tons
Annual heroin consumption in Central Asia, 11 tons
Average annual heroin seizure in the Russian Federation,
3 tons
Average annual heroin seizure in Central Asia, 5 tons
Heroin trafficking from Central Asia to Caucasus & China per
year, 3 tons
Annual heroin consumption in the Russian Federation,
70 tons

52
World Drug Report 2010
gyzstan, but a much smaller share among countries that span the Afghan border. Conversely, a small number of Afghans are arrested in Tajikistan, but usually not fur-ther afield. Tajiks appear to be major players in a number of countries, including the Russian Federation, but are detected in much smaller numbers in Kazakhstan. According to Western law enforcement sources in the region, Russian-based organized crime groups generally place orders with Tajik-based groups who arrange for trans-shipment of the drugs from Afghanistan through Tajikistan. The drugs are then moved through the region and into the Russian Federation. It is possible that the Tajik groups who source the drugs then pass the con-signments on to Russian groups in Kazakhstan but it seems more likely that the drugs change hands several times before reaching the consumer.
Outside these ‘regional’ nationalities, West Africans, especially Nigerians, have also been reported, particu-larly in Tajikistan. In some instances, they may act as simple couriers, as demonstrated with the 2006 attempt by a Nigerian group to have one of their own cross the Kazakh-Chinese border with heroin. There is a distinct possibility that firmer ties across borders will occur between Central Asian groups and networks that origi-nate outside the region. Increased cross-border commer-cial ties and a re-establishment of ethno-cultural linkages with the western Chinese province of Xinjiang could facilitate supply to a growing heroin market in that part of China.
Heroin trafficking in some Central Asian countries also appears increasingly complex and professional. Large seizures in recent years may indicate an organized traf-ficking business, while arrest statistics seem to suggest a trend towards regionalization. Although they are still numerically important, individual entrepreneurs and
smaller groups united by family ties or kinship may have become fewer in number. There is also evidence that traffickers are increasingly resorting to violence in order to protect shipments. Armed clashes used to occur mostly on the Tajik-Afghan border, but Uzbek and Turkmen border guards are reporting incidents as well.52
Heroin increases in value as it distances itself from the source. The estimated value of opiates (at the borders) trafficked through the Afghanistan/Central Asia border area is US$350-400 million53 annually. The portion that eventually reaches the Russian Federation will be worth 30 times this amount. In the Russian Federation, retail distribution of heroin and other drugs is carried out by a variety of criminal groups typically organized along ethnic lines with Central Asian, Caucasian, Rus-sian/Slavic and Roma groups all active in drug traffick-ing.54
Impact of this flow
In terms of absolute numbers, the Russian Federation is particularly affected with its 1.5 million addict popula-tion. The hugely damaging threat of HIV/AIDS is directly related to heroin injection. To date, there are over a quarter of a million registered HIV cases (although the number of unregistered cases is estimated to be much higher than this) in the Russian Federation. Of these, over 80% are intravenous drug users. In the CARs, nearly 15 years of continuous heroin transit has created
52 Interview Uzbek Chief of Border Guards, Tashkent, Uzbekistan, November 2009; Interview Deputy Chief Turkmen border guards, Ashghabat, Turkmenistan, November 2009.
53 UNODC, Addiction, crime and insurgency: the transnational threat of Afghan opium, 2009.
54 International Narcotics Control Strategy Report - 2007.
Distribution of nationalities of arrested heroin traffickers at customs, 2000-2008Fig. 13:
Source: World Customs Organization
0%
20%
40%
60%
80%
100%
RussianFederation
Kazakhstan Tajikistan Uzbekistan Kyrgyzstan
Other
Afghan
Turkmen
Kyrgyz
Uzbek
Tajik
Kazakh
Russian

53
1. Transnational drug market analysis The global heroin market
a local market of 282,000 heroin users, consuming approximately 11 mt of heroin annually. Local opium consumption is estimated at approximately 34 mt (although demand in Turkmenistan may be underesti-mated). This puts some Central Asian states on par with countries with the highest global opiate abuse preva-lence.55 As in the Russian Federation, heroin use in Central Asia has led to a jump in HIV cases, spreading predominantly among male injecting drug users of the most productive age (20 to 49 years).56 Another statistic completes this grim picture: the total number of offi-cially registered HIV cases in Central Asia has increased 19-fold in the last decade: from 1,641 cases in 2000 to 30,993 cases57 in late 2008.58
The total value of the opiate market is estimated to be around US$13-15 billion per year in both Central Asia and the Russian Federation.59 By virtue of this financial weight alone, organized crime in the region contributes substantially to problems of corruption and undermines governance. Drug traffickers are able to offer substantial bribes to poorly paid local police, border guards and customs to turn a blind eye to suspicious shipments. In Central Asia, both Tajikistan and Kyrgyzstan are par-ticularly vulnerable, and both have very high levels of corruption.
55 Current annual prevalence of opiate abuse is estimated to be around 1% of the adult population (between 15 – 64 years) in the region.
56 UNODC Regional Office for Central Asia, Compendium of Drug Related Statistics. 1997-2009, 2009, p.7.
57 In 2008, 6,664 officially registered persons with HIV/AIDS were identified in Central Asia.
58 UNODC Regional Office for Central Asia, Compendium of Drug Related Statistics. 1997-2009, 2009, p.7.
59 These figures are necessarily imprecise, particularly due to the lack of data on heroin purity levels in Central Asia and lack of certainty regarding the size of the Russian heroin using population.
Balkan route1.2.3
The Balkan route to West and Central Europe runs from Afghanistan via the Islamic Republic of Iran, Turkey and south-east European countries. This route and its vari-ous branches form the artery that carries high purity Afghan heroin into every important market in Europe. UNODC estimates that 37% of all Afghan heroin or 140 mt is annually trafficked into the Islamic Republic of Iran, from Afghanistan and Pakistan, towards the European market.
Routes and volumes
The Islamic Republic of Iran’s eastern border with Afghanistan and Pakistan is 1,845 km long and consists of mainly mountainous or harsh desert terrain. There are obvious challenges to achieving even partial control over this area, although 12,000 anti-narcotics police and border guards are reportedly deployed at these long bor-ders.60 The Balkan route begins in Afghanistan’s south-ern and western provinces, with shipments destined for both the Afghan-Iran border and the Afghan-Pakistan border.
Most of the heroin flow moves through the Iran-Afghan border. Every year, approximately 105 mt of heroin are smuggled from the Afghan provinces of Nimroz, Hirat and Farah into eastern Islamic Republic of Iran. Possibly due to increased law enforcement efforts at that border, Afghan traffickers are thought to increasingly rely on the Afghanistan-Pakistan-Iran route, estimated to handle an additional 35 mt of heroin. To do this, they must first cross into the Pakistani province of Balochistan and veer
60 UNODC project document, “Integrated Border Control in the I.R. of Iran (IRNI50).
CountryNumber of
estimated heroin users
Estimated level of heroin
consumption (mt)
Number of estimated raw opium users
Estimated level of opium
consumption (mt)
Tajikistan 20,300 1 4,700 3
Turkmenistan 31,200 1 1,400 1
Uzbekistan 118,600 5 13,800 8
Kyrgyzstan 25,900 1 9,600 5
Kazakhstan 86,000 3 33,000 18
Total (rounded) 282,000 11 62,500 34
Russian Federation 1,500,000 70 160,000 58
Heroin users and consumption in the Russian Federation and Central AsiaTable 5:
Source: UNODC
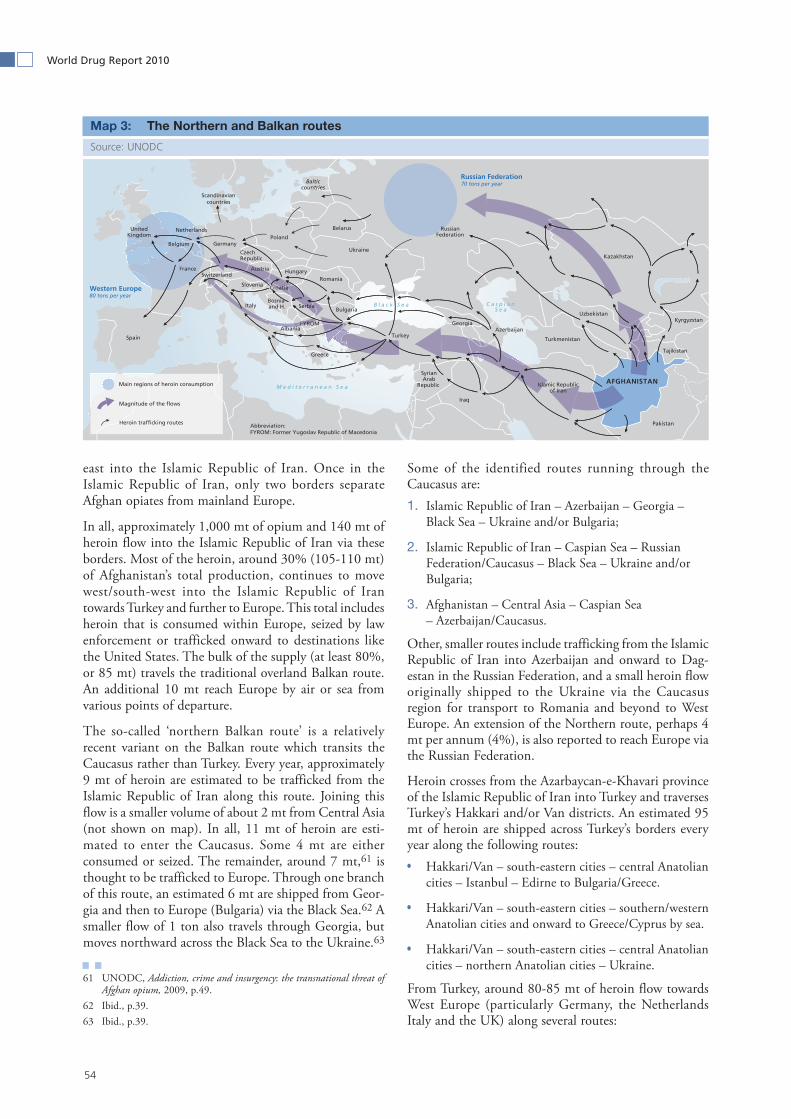
54
World Drug Report 2010
east into the Islamic Republic of Iran. Once in the Islamic Republic of Iran, only two borders separate Afghan opiates from mainland Europe.
In all, approximately 1,000 mt of opium and 140 mt of heroin flow into the Islamic Republic of Iran via these borders. Most of the heroin, around 30% (105-110 mt) of Afghanistan’s total production, continues to move west/south-west into the Islamic Republic of Iran towards Turkey and further to Europe. This total includes heroin that is consumed within Europe, seized by law enforcement or trafficked onward to destinations like the United States. The bulk of the supply (at least 80%, or 85 mt) travels the traditional overland Balkan route. An additional 10 mt reach Europe by air or sea from various points of departure.
The so-called ‘northern Balkan route’ is a relatively recent variant on the Balkan route which transits the Caucasus rather than Turkey. Every year, approximately 9 mt of heroin are estimated to be trafficked from the Islamic Republic of Iran along this route. Joining this flow is a smaller volume of about 2 mt from Central Asia (not shown on map). In all, 11 mt of heroin are esti-mated to enter the Caucasus. Some 4 mt are either consumed or seized. The remainder, around 7 mt,61 is thought to be trafficked to Europe. Through one branch of this route, an estimated 6 mt are shipped from Geor-gia and then to Europe (Bulgaria) via the Black Sea.62 A smaller flow of 1 ton also travels through Georgia, but moves northward across the Black Sea to the Ukraine.63
61 UNODC, Addiction, crime and insurgency: the transnational threat of Afghan opium, 2009, p.49.
62 Ibid., p.39.63 Ibid., p.39.
Some of the identified routes running through the Caucasus are:
Islamic Republic of Iran – Azerbaijan – Georgia – 1. Black Sea – Ukraine and/or Bulgaria;
Islamic Republic of Iran – Caspian Sea – Russian 2. Federation/Caucasus – Black Sea – Ukraine and/or Bulgaria;
Afghanistan – Central Asia – Caspian Sea 3. – Azerbaijan/Caucasus.
Other, smaller routes include trafficking from the Islamic Republic of Iran into Azerbaijan and onward to Dag-estan in the Russian Federation, and a small heroin flow originally shipped to the Ukraine via the Caucasus region for transport to Romania and beyond to West Europe. An extension of the Northern route, perhaps 4 mt per annum (4%), is also reported to reach Europe via the Russian Federation.
Heroin crosses from the Azarbaycan-e-Khavari province of the Islamic Republic of Iran into Turkey and traverses Turkey’s Hakkari and/or Van districts. An estimated 95 mt of heroin are shipped across Turkey’s borders every year along the following routes:
Hakkari/Van – south-eastern cities – central Anatolian cities – Istanbul – Edirne to Bulgaria/Greece.
Hakkari/Van – south-eastern cities – southern/western Anatolian cities and onward to Greece/Cyprus by sea.
Hakkari/Van – south-eastern cities – central Anatolian cities – northern Anatolian cities – Ukraine.
From Turkey, around 80-85 mt of heroin flow towards West Europe (particularly Germany, the Netherlands Italy and the UK) along several routes:
The Northern and Balkan routesMap 3:
Source: UNODC
Western Europe80 tons per year
Russian Federation70 tons per year
RussianFederation
Islamic Republicof Iran
AFGHANISTAN
Tajikistan
Kyrgyzstan Uzbekistan
Turkmenistan
Pakistan
Kazakhstan
Turkey
SyrianArab
Republic
Iraq
GeorgiaAzerbaijan
Bulgaria
Romania
Ukraine
Belarus
Balticcountries
Hungary
Italy
France
UnitedKingdom
Spain
Switzerland
Germany
Scandinaviancountries
Poland
Austria
Czech Republic
Netherlands
Belgium
Greece
Albania
Slovenia
FYROM
Croatia
SerbiaBosnia and H. B l a c k S e a C a s p i a n
S e a
M e d i t e r r a n e a n S e a
Abbreviation:FYROM: Former Yugoslav Republic of Macedonia
Main regions of heroin consumption
Magnitude of the flows
Heroin trafficking routes
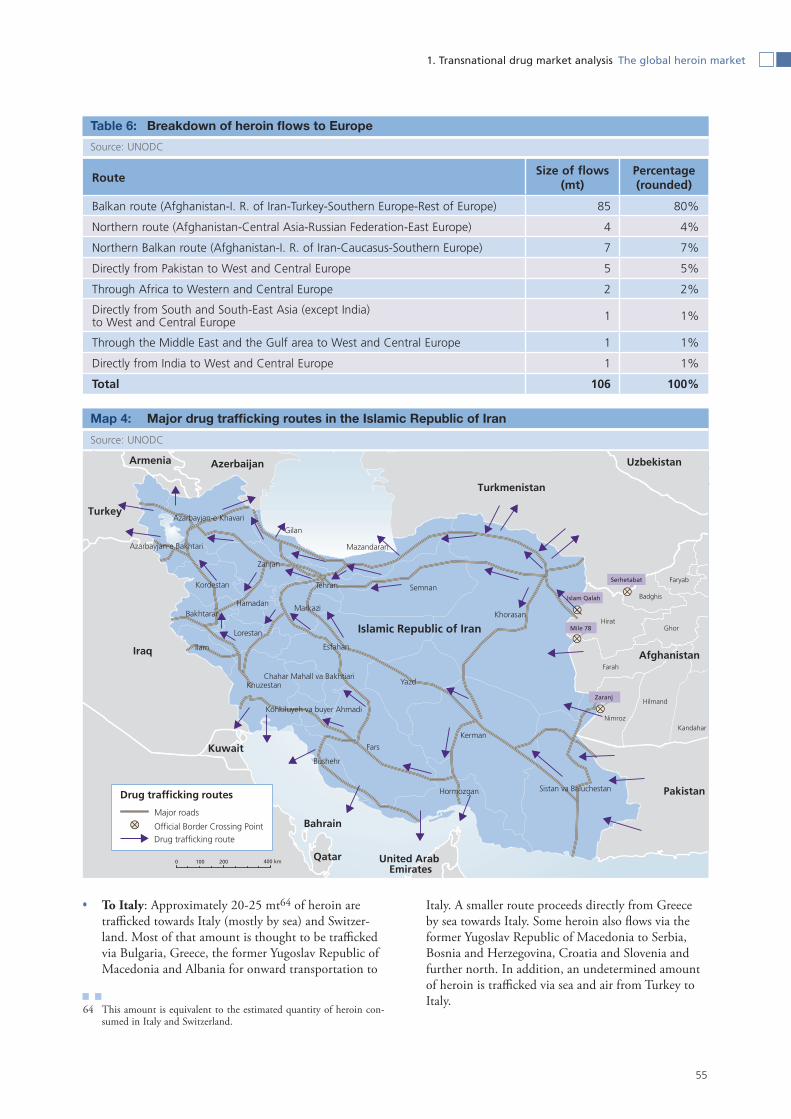
55
1. Transnational drug market analysis The global heroin market
To Italy : Approximately 20-25 mt64 of heroin are trafficked towards Italy (mostly by sea) and Switzer-land. Most of that amount is thought to be trafficked via Bulgaria, Greece, the former Yugoslav Republic of Macedonia and Albania for onward transportation to
64 This amount is equivalent to the estimated quantity of heroin con-sumed in Italy and Switzerland.
Italy. A smaller route proceeds directly from Greece by sea towards Italy. Some heroin also flows via the former Yugoslav Republic of Macedonia to Serbia, Bosnia and Herzegovina, Croatia and Slovenia and further north. In addition, an undetermined amount of heroin is trafficked via sea and air from Turkey to Italy.
RouteSize of flows
(mt)Percentage (rounded)
Balkan route (Afghanistan-I. R. of Iran-Turkey-Southern Europe-Rest of Europe) 85 80%
Northern route (Afghanistan-Central Asia-Russian Federation-East Europe) 4 4%
Northern Balkan route (Afghanistan-I. R. of Iran-Caucasus-Southern Europe) 7 7%
Directly from Pakistan to West and Central Europe 5 5%
Through Africa to Western and Central Europe 2 2%
Directly from South and South-East Asia (except India) to West and Central Europe 1 1%
Through the Middle East and the Gulf area to West and Central Europe 1 1%
Directly from India to West and Central Europe 1 1%
Total 106 100%
Breakdown of heroin flows to EuropeTable 6:
Source: UNODC
Serhetabat
Khorasan
Fars
Kerman
Yazd
Esfahan
Semnan
Sistan va Baluchestan
Gilan
Khuzestan
Zanjan
Hormozgan
Markazi
Ilam
Lorestan
Azarbayjan-e Khavari
TehranKordestan
Bakhtaran
Bushehr
Hamadan
Azarbayjan-e Bakhtari
Chahar Mahall va Bakhtiari
Kohkiluyeh va buyer Ahmadi
Hirat
Farah
Ghor
Hilmand
NimrozKandahar
Faryab
Badghis
Drug trafficking routes
Major roads
Official Border Crossing Point
0 200100
Mazandaran
Islam Qalah
Mile 78
Zaranj
Islamic Republic of Iran
Iraq
Turkey
Armenia Azerbaijan
Turkmenistan
Afghanistan
Pakistan
Uzbekistan
Kuwait
Bahrain
Qatar United Arab Emirates
400 km
Drug trafficking route
Major drug trafficking routes in the Islamic Republic of IranMap 4:
Source: UNODC

56
World Drug Report 2010
To the Netherlands and Germany : The bulk of the heroin trafficked along this route (approximately 55 to 60 mt) travels to Germany and the Netherlands through Bulgaria, Serbia, Hungary and Austria, or through Bulgaria, Romania, Hungary, Slovakia and Austria. From Germany and the Netherlands, heroin shipments are trafficked onwards to larger markets in France, the United Kingdom and Spain.
Because of its central position along the Balkan route, Austria plays an important transit role for much Germa-ny-bound heroin. Heroin flows to Austria through its borders with Slovenia and Hungary. However, some heroin destined for the German market is trafficked through Bulgaria, Romania, Hungary, Slovakia and the Czech Republic, thereby bypassing Austria. Controls at Schengen borders are limited or non-existent.
Other routes include:To East Europe: A limited amount of heroin is traf- ficked directly from Turkey to Ukraine by sea.
Direct shipments to West and Central Europe: An undetermined amount of heroin is trafficked directly from Turkey to Western and Central European coun-tries such as Germany, the Netherlands, Belgium, France and the United Kingdom by sea and air.
How does the market operate?
Considerable quantities of heroin are trafficked to Europe by sea and air, but the Balkan route resembles the Northern route in that the bulk of the flow proceeds by land. Most of the heroin headed for West European markets leaves Afghanistan into the Islamic Republic of Iran, Pakistan and Turkey, which collectively seize most of the heroin interdicted in the world (40% of the esti-mated flow intercepted in 2008). Despite these remark-able enforcement efforts, traffickers nevertheless succeed in getting sufficient volumes through, so that most of the heroin consumed in Europe in recent decades has passed through these countries.
Drug smuggling along the Balkan route is systematic and seems to involve groups with ample resources and consignments much larger than those found on the Northern route (in Central Asia). On the Balkan route, the average amount of heroin seized is approximately 10 kg, which is twice the average amount seized on the Northern route. Consignments very rarely travel the whole way from Afghanistan to Europe in a single unbroken journey. Normally, they will be bought and sold by different groups along the route, the mode of transport will change, and loads will be split and merged as they are moved westward. Seizures are especially large up to Turkey, at which point consignments appear to be broken down into smaller quantities.
The logistics of the trade summarized above necessitates
the involvement of well-organized trafficking groups with international connections. For such profit-driven organizations, the lure of Afghan opiates is obvious given the huge mark-ups that arise with distance from the source. One kg of heroin is worth around US$2,000-2,500 in Afghanistan, but rises to US$3,000 on the Afghanistan-Pakistan border and to US$5,000 on the Iran-Afghanistan border. It increases yet again by around 60%, to approximately US$8,000, at the Iran-Turkey border. Based on the estimated flows via this route, Ira-nian crime groups organizing heroin trafficking from the Afghanistan-Iran border to the Turkey-Iran border stand to pocket some US$450-600 million per year. In addition to heroin, raw opium (some 1,000 mt in 2008) also flows from Afghanistan to the Islamic Republic of Iran via the above-mentioned routes to feed an estab-lished Iranian market. An estimated total of 450 mt65 of opium is consumed each year in the Islamic Republic of Iran. The annual street value of opium consumed in that country is around US$900,000.
Given the huge sums involved and the serious penalties if caught,66 traffickers along the Iran-Afghanistan bor-ders are generally well-organized and well-armed. Deadly clashes between Iranian troops and traffickers are com-monplace, as demonstrated by the thousands of casual-ties sustained by the Iranian border guards in the past three decades. Depending on the border region, smug-glers may be Baluchi tribesmen or Kuchi nomads. If opiates are trafficked through Balochistan - via the largely uncontrolled borders of the Nimroz, Hilmand and Kandahar provinces of Afghanistan - Taliban insur-gents are known to provide security to drug convoys up to the border. Balochistan-based organized crime groups then transport the heroin to the Iran-Pakistan border. Once the heroin enters the Islamic Republic of Iran, drug trafficking groups based in that country facilitate onward trafficking to the Turkish border. This is sup-ported by the official statistics of the Islamic Republic of Iran which show that most traffickers are Iranian nation-als, with few Pakistanis arrested in the Islamic Republic of Iran (similar proportions are observed for Iranian arrestees in Pakistan). These numbers and other reports suggest that the involvement of Pakistani organized crime groups may not extend far inside the borders of the Islamic Republic of Iran.
Once Iranian criminal groups receive the shipments, the majority is forwarded westward towards Turkey. As pre-viously noted, a portion of the flow veers north and transits the Caucasus towards Europe. The presence of 12 to 20 million ethnic Azeris in northern Islamic Republic of Iran can facilitate direct traffic into Azerba-ijan. Also hindering drug law enforcement over Azerba-
65 UNODC, Addiction, crime and insurgency, 2009, UNODC.66 Drug control in 2009, Annual Report, Islamic Republic of Iran.

57
1. Transnational drug market analysis The global heroin market
ijan’s 132 km long border with the Islamic Republic of Iran is the existence of uncontrolled territories due to an unresolved conflict. In fact, the entire Caucasus region hosts several breakaway republics and disputed zones, over which no recognized national authority has control. The recent conflict in Georgia, for example, has report-edly led to an increase in the volume of heroin traffick-ing from that country to Europe via the Black Sea.
On the main route to Turkey, ethnic Kurdish groups, with large border populations in the Islamic Republic of Iran, Iraq and Turkey, may be responsible for border crossings. These groups may resell these drugs in Turkey or traffic them to Europe through their own networks. The United Kingdom’s Serious Organised Crime Agency argues that in 2009, 138 Turkish networks continued to control the heroin supply to Europe.67 According to WCO seizure statistics between 2000 and 2008, the majority of drug traffickers arrested in Turkey were Turkish nationals. This might suggest that Turkish groups are organizing the heroin trafficking all through Turkey up to the borders with Bulgaria and Greece where Balkan-based groups take over.
Once heroin leaves Turkish territory, interception effi-ciency drops significantly. In the Balkans, relatively little heroin is seized, suggesting that the route is exceedingly well organized and lubricated with corruption.68 In 2008, the countries and territories that comprise South-East Europe (a total of 11 countries, including Greece and Cyprus) seized 2.8 mt of heroin in 2008. This is in sharp contrast to what is seized upstream in Turkey (15.5 mt in 2008) and the Islamic Republic of Iran (32 mt in 2008) every year. In other words, for every kg seized in the South East Europe, nearly 6 are seized in Turkey and 11 in the Islamic Republic of Iran. Given that approximately 85-90 mt travel through this region, this suggests inadequate controls and poor cooperation in a region where high levels of unemployment and low salaries also create incentives for corruption.
The total quantity of heroin seized in West and Central Europe, as reported by some 45 countries, was around 7.6 mt in 2008, which again is only a fifth of the total amount seized in Turkey and the Islamic Republic of Iran in 2008. In all, three countries - the United Kingdom (18%), Italy (14%) and Bulgaria (13%) – accounted for almost half of the total amount seized in the EU and EFTA countries in 2008. Across Europe, many countries directly straddling the main heroin trafficking routes report rather low levels of heroin seizures, such as Montenegro (18 kg in 2008), Bosnia and Herzegovina (24 kg), the former Yugoslav Republic of Macedonia (26 kg), Hungary (28 kg), Alba-
67 Serious Organised Crime Agency, The United Kingdom Threat Assess-ment of Organized Crime, October 2009, p.26.
68 Interception rates in the Balkan region are very low (3%), especially when compared with Turkey (16%) and the Islamic Republic of Iran (23%).
nia (75 kg), Austria (104 kg), Slovenia (136 kg), Croatia (153 kg) and Serbia (207 kg).
Organized crime in the Balkans involves a large variety of criminal activities and as such, heroin is but one, albeit among the most lucrative, commodities illicitly trafficked through this region. The profits accrued as the opiates move downstream are substantial. Organized crime groups managing heroin trafficking between the Islamic Republic of Iran and Turkey and on to the Bal-kans are estimated to earn around US$8,000 per kg of heroin or a total of US$600-700 million per year. The routes through this region also operate in the reverse direction with cocaine, precursor chemicals and amphet-amine-type stimulants (ATS) moving eastward into Turkey and beyond. Organized crime groups controlling these corridors thus have comparatively better access to more numerous and diversified crime markets than their Northern route counterparts. Thus, many tend to be poly-drug (heroin, cannabis et cetera) and poly-crime (trafficking in human beings, weapons and stolen vehi-cles, to name but a few).
Another notable feature of the Balkan route is that some important networks have clan-based and hierarchically organized structures. Albanian groups in particular have such structures, making them particularly hard to infil-trate. This partially explains their continued involvement in several European heroin markets. Albanian networks continue to be particularly visible in Greece, Italy and Switzerland. Italy is one of the most important heroin markets in Europe, and frequently identified as a base of operation for Balkan groups who exploit the local diaspora. According to WCO seizure statistics, Albanians made up the single largest group (32%) of all arrestees for heroin trafficking in Italy between 2000 and 2008. The next identified group was Turks followed by Italians and citizens of Balkan countries (Bulgaria, Kosovo/Serbia, the former Yugoslav Republic of Macedonia and to some extent Greece). A number of Pakistani and Nige-rian traffickers were arrested in Italy as well.
Most of the Balkan heroin first passes through Bulgaria, a country which has reported some fairly large heroin seizures in the past, but where figures have been erratic, despite little evidence of fluctuation in the flows. In 2008 for example, Turkey seized some 15 mt of heroin while Bulgaria, despite being the recipient of most of the Balkan route flow, seized 1.1 mt. In Bulgaria, most of the arrested heroin traffickers are nationals of that coun-try. However, the proportion of Turkish nationals also stands out. The other main nationalities are citizens of the Balkans such as Serbs and Macedonians. Notably, Albanians are near-absent.
The Netherlands is a hub for heroin trafficking to France, the United Kingdom, Belgium, as well as Ger-many. In the Netherlands, the total number of arrests made by customs authorities is limited. Dutch, Nigerian

58
World Drug Report 2010
and Turkish nationals are nearly equally represented, while Balkan nationals are conspicuously absent.
In Germany, the number of Turks arrested for heroin trafficking outnumbers all other nationalities except Germans. Dutch citizens represent 5% of all heroin traf-ficking arrests and generally enter the trafficking chain only after the heroin has arrived in Germany or in traf-ficking the heroin from the Netherlands back into Ger-many. Balkan nationalities make up a minority of arrestees in Germany, followed by Nigerian nationals.
In the United Kingdom, British citizens predominate, but a considerable number of Dutch citizens also show up in arrest statistics. The proportion of arrested Turk-ish, German, Pakistani and Belgian nationals was con-siderably smaller than Dutch or British nationals between 2000 and 2008. Here too Balkan nationalities com-
prised a negligible percentage of all heroin trafficking arrests.
Heroin trafficking from the Turkey-Bulgaria and Tur-key-Greece borders to the main heroin markets in the United Kingdom, France, Germany and the Nether-lands is organized by multi-ethnic groups. Locally-based organized crime groups generally traffic heroin within the destination (main consumer) countries. In Germany and the United Kingdom, for example, German and British groups, respectively, operate heroin distribution networks. In transit countries, south-east European and Turkish organized crime groups cooperate. The involve-ment of local groups in transit countries varies from country to country. In Austria, for example, the number of Austrians arrested for heroin trafficking between 2000 and 2008 was negligible, with most arrestees holding Turkish, Hungarian, Nigerian or Iranian citizenship. In
Nationality of heroin traffickers Fig. 14: arrested in Italy, 2000-2008
Source: World Customs Organization
Nationality of heroin traffickers Fig. 15: arrested in Bulgaria, 2000-2008
Source: World Customs Organization
Other African nationalities,
6%
Pakistani,8%
Turkish,13%
Albanian,32%
Other Balkan nationalities, 13%
Italian,10%
Other,12%
Nigerian,6%
Other Balkan nationalities,
18%
Others,5%
Bulgarian,41%
Turkish,27%
Albanian,2%
Romanian,5%
Dutch,2%
Nationality of heroin traffickers Fig. 16: arrested in the Netherlands, 2000-2008
Source: World Customs Organization
Nationality of heroin traffickers Fig. 17: arrested in Germany, 2000-2008
Source: World Customs Organization
Other, 16%German,
2%
Cape - Verde,4%
Spanish,4%
Portugese,4%
US,5%
Brazil,5% British,
5% Turkish,16%
Nigerian,19%
Dutch,20%
Turkish,19%
German,39%
Other Balkan nationalities, 5%
Other African nations, 5%
Dutch,5%
Serbian,4%
Nigerian,3%
Albanian,3%
Other,17%

59
1. Transnational drug market analysis The global heroin market
neighbouring Hungary, by contrast, the number of Hungarian nationals arrested for heroin trafficking during the same period was comparable to that of other nationalities.
Shared ethnicity and language undoubtedly helps smug-glers to facilitate opiate trafficking from the source, through the Iran-Pakistan and Afghanistan-Pakistan borders all the way to the Turkish border and beyond. At the same time, different ethnic groups cooperate seamlessly. This includes Kurdish and Turkish groups as well as Bosnian, Serb, Albanian and Croat groups fur-ther downstream. The 2010 US International Narcotics Control Strategy Report argues, regarding trafficking in the Balkans, that ‘elements from each ethnic group and all major crime “families” are involved in the narcotics trade, often collaborating across ethnic lines.’
Impact of this flow
The first and most direct impact of opiates is on health, including heroin-related deaths. Opiates (including syn-thetics) account for 35% to almost 100% of all drug-related deaths in the 22 European countries that have provided data, and over 85% in 11 of those countries.69 In addition, heroin abuse by injection contributes to high rates of serious diseases such as hepatitis B, hepati-tis C and HIV.70 The HIV epidemic among injecting drug users continues to develop at varying rates across Europe. In the countries of the European Union, the rates of reported newly diagnosed cases of HIV infection
69 European Monitoring Center for Drugs and Drug Addiction (EMCDDA), Drug situation in Europe: Drug-related infectious diseases and drug-related deaths, November 2009.
70 Hepatitis C (HCV) is more prevalent than HIV among injecting drug users across Europe. HCV antibody levels among national samples of injecting drug users in 2006 and 2007 vary from 18% to 95%, with half of European countries reporting levels in excess of 40%.
among injecting drug users are mostly at stable and low levels, or in decline. However, in post-soviet European countries such as Ukraine, Belarus and the Republic of Moldova, those rates increased in 2007.71 Finally, the term ‘transit country’ may not adequately apply to the Islamic Republic of Iran, given the ravages of opiates in the country. There are around 1 million opiate users in the Islamic Republic of Iran and approximately 14 mt of heroin and 450 mt of opium are consumed in-country.72 The Islamic Republic of Iran appears to have one of the highest rates of heroin addiction per capita in the world: 20% of Iranians aged 15 to 60 are involved in illicit drug use, and 9% - 16% inject drugs.73 But the lethality of heroin is even more direct on the Islamic Republic of Iran’s borders where 3,500 casualties among the border guards are a reminder of the risks taken by law enforce-ment officials to stem this deadly flow.
Europe is the most important market in terms of volume and turnover for Afghan heroin, with around 250 kg of heroin (of 70% purity) consumed on a daily basis. Annually this represents some 85-90 mt of heroin and a value of some US$20 billion. Most of it, approximately 80 mt, is thought to be consumed in Western and Cen-tral European countries. The European market is far from homogenous as four main national markets, the United Kingdom (21%), Italy (20%), France (11%) and Germany (8%) together account for about 60% of con-sumption in Europe.
Opiate trafficking also fuels corruption and all countries on the Balkan route are affected. The combined GDP of Kosovo/Serbia, the former Yugoslav Republic of Mace-donia and Albania at US$20 billion is equivalent to the value of West-Europe’s heroin market. The opiate trade is a serious threat to the Balkans; particularly vulnerable
71 European Monitoring Center for Drugs and Drug Addiction (EMCDDA), Drug situation in Europe: Drug-related infectious diseases and drug-related deaths, November 2009.
72 UNODC, Addiction, crime and insurgency: the transnational threat of Afghan opium, 2009, p.25.
73 Razzaghi E, Movaghar A, Green TC, Khoshnood K. 2006. “Profiles of risk: a qualitative study of injecting drug users in Tehran, Iran.” Harm Reduct J, Vol. 3, No. 12, doi:10.1186/1477-7517-3-12 in “Mapping and Situation Assessment of High-Risk Key Populations in Three Cities of Afghanistan”, World Bank, September 2007, p.4.
Nationality of heroin traffickers arrest-Fig. 18: ed in the United Kingdom, 2000-2008
Source: World Customs Organization
Subregional distribution of heroin Table 7: consumption in Europe
Source: UNODC
Pakistani,4%
Nigerian,3%
German,4%
Belgian,5%
Turkish,5%
Dutch,14%
British,44%
Others,21%
RegionHeroin consumption
(mt)
East Europe 4.4
Southern Europe 2.4
West and Central Europe 80
Total 87

60
World Drug Report 2010
are Kosovo/Serbia, Bosnia, the former Yugoslav Repub-lic of Macedonia and Albania. A number of unresolved conflicts and/or remaining inter-ethnic tensions along sections of this route continue to prevent the emergence of effective regional counterdrug cooperation and to facilitate trafficking.
The Southern route1.2.4
Unlike the Northern or Balkan routes, which are mostly dedicated to single destination markets, the southern route serves a number of diverse destinations, primarily Europe, Africa and Asia, and even a limited quantity going to the United States and Canada. In truth, the only opiate destination market seemingly not targeted through this route is the Russian Federation. It therefore seems more accurate to talk about a vast network of routes rather than one general flow direction.
Routes and volumes
Pakistan is geographically vulnerable to opiate traffick-ing; UNODC estimates that approximately 40% of Afghanistan’s heroin/morphine (150 mt) transits or is consumed in Pakistan. More Afghan opiates pass through Pakistan than any other country bordering Afghanistan. Controlling this border is a major challenge; the long, thinly guarded boundary (2,500 km) follows a chain of mountains with long sections reaching altitudes of more than 4,000 metres gradually ceding to open plains and dunes in Balochistan province facing southern Afghani-stan. The most important points for all trade, both licit and illicit, on the Pakistan-Afghanistan border are the Torkham crossing in the Federally Administered Tribal Areas (FATA) and the Chaman checkpoint in Balo-chistan province. In addition to these, there are hun-dreds of natural passes and desert roads coursing across the entire border, most of which are unmanned and unsupervised.
In recent years, a cross-border insurgency has precluded effective law enforcement work in much of the FATA and in parts of Balochistan province. The biggest vulnerabil-ity, however, is Pakistan’s immediate proximity to heroin processing zones in Afghanistan, notably the adjoining provinces of Hilmand, Nimroz and Kandahar. Every day, finished heroin is smuggled into Pakistan using multiple methods of transportation, including the wide usage of camels and pack animals. Not only heroin but unrefined opium and semi-refined morphine are shipped across these borders, as seizure data demonstrates. In 2006, Pakistan seized approximately 32,658 mt of morphine or 72% of global seizures. This is a huge 18-fold increase over seizures in 2001, which totaled 1,825 kg.74 Since then, morphine seizures have dropped by two thirds in
74 UNODC, Addiction, crime and insurgency: the transnational threat of Afghan opium, UNODC, p.34.
2007 (10,989) and again by a third in 2008 (7,324).75 Seizures of opium nearly doubled from 2007 (15,369) to 2008 (27,242) and Pakistani users consume approxi-mately 80 mt of opium annually, most of it sourced in Afghanistan. A portion of heroin never leaves Pakistan, either due to absorption into the domestic market (esti-mated to consume approximately 20 mt of heroin annually)76 or seizures (9.2 mt of heroin in 2008).
The remaining opiates (mostly heroin) flow out of Paki-stan in multiple directions, starting with the major con-sumption markets next door in China, India and the Islamic Republic of Iran. The following are the major routes identified:
From eastern Afghanistan into the FATA, opiates are trafficked in three main directions: 1) towards China via Gilgit (northern areas) by road; 2) towards India through the NWFP-Chakwai/Rawalpindi-Sailkot-Wagha route; 3) towards Karachi via the North West-ern Frontier Province (NWFP)-Rawalpindi-Chawai-Faisabad-Mutan-Sukkur route. From Balochistan (mostly the cities of Dalbandin and Quetta) towards eastern Islamic Republic of Iran by road and rail for onward movement towards Turkey and Western Europe. Towards Gwadar port or the smaller fishing ports and open areas of the Makran coast or the main ports of Karachi and Port Qasim and further to international destinations via air or sea, mostly using cargo containers.
Although significant quantities are shipped from East-ern Afghanistan into FATA, the Pakistani province of Balochistan is the primary transit area, both for ship-ments that exit via the Pakistani coast and those which travel through Pakistan to the Islamic Republic of Iran. This is a significant flow in itself with almost a quarter of the heroin flow (or 35 mt) veering west towards the Iranian border and blending into the Balkan flow des-tined for Europe.
Europe, an especially lucrative market, is also targeted by Pakistani traffickers who operate numerous air (and sea) trafficking routes from Pakistan to Europe (mostly the United Kingdom and the Netherlands), shipping an estimated 5 mt annually via these direct connections.77
Approximately 2 mt of heroin are shipped to the United States and Canada annually, through various routes, including directly in cargo planes.78
Over the past decade, China appears to have received an increasing amount of Afghan opiates, approximately 7 mt (out of an estimated total 55 mt of heroin trafficked
75 ARQ, Pakistan, 2008.76 UNODC, Addiction, crime and insurgency, p.25.77 Ibid., p.34.78 In July 2009, the Royal Canadian Mounted Police seized over 120 kg
of heroin that had been shipped from Pakistan.

61
1. transnational drug market analysis the global heroin market
to China annually) of which were sourced from Pakistan in 2008.79 A proportion of this amount is thought to traverse Pakistan’s northern areas towards China’s Xin-jiang province.
UNODC now tentatively estimates that Pakistan is Africa’s main supplier of heroin at approximately 20 mt a year. In addition to the aforementioned direct routes into the United Kingdom/the Netherlands, Pakistani traffickers - in collusion with African crime groups - ship perhaps an additional 2-3 mt into Europe using Africa as a trans-shipment point.80
Karachi is a major sea conduit for shipments to Gulf countries and further to East and Southern Africa and various destinations in China. Approximately 11 mt are estimated to be trafficked into the United Arab Emirates (mostly Dubai) for onward shipping to these two desti-nations.81
79 UNODC, Addiction, crime and insurgency, p. 48.80 In Africa, Nigeria, South Africa and Ghana are the main African
States sourcing to Europe; see UNODC Addiction, crime and insur-gency : the transnational threat of Afghan opium, p.38.
81 Individual seizure data provided by the UAE indicates that at least 50% of the heroin seized in the UAE was headed to Africa, and the rest to China; see UNODC, Addiction, crime and insurgency: the
Pakistani traffickers also operate routes through Lahore and other northern cities into India (mainly by road). There are a large number of other air/road and sea routes servicing numerous other Asian countries for a total flow of approximately 25 mt.82 Additionally, some routes proceed in seemingly counter-intuitive directions. As an example, in June 2007, Kyrgyz authorities arrested a Nigerian who had organized trafficking from Pakistan to Tajikistan and onward to CIS countries, Europe and Australia. Another route reported by Central Asian authorities involved multiple couriers starting in Paki-stan and onward to the Islamic Republic of Iran-Azerba-ijan-Turkey towards a final destination city in China.83
transnational threat of Afghan opium, p.48.82 UNODC, Addiction, crime and insurgency: the transnational threat of
Afghan opium, 2009, p. 59.83 CARICC Information Bulletin N.48.
Drug trafficking routes in PakistanMap 5:
Source UNODC
IslamicRepublicof Iran
Jammu & Kashmir
Zaranj
Eshkeshem
Towr Kham
Serhetabat
Gulam Khan
Wesh-C
Official Border Crossing Point
0 190 38095 Km
India
Pakistan
Turkmenistan
Afghanistan
China
Drug trafficking route
Main roads
The boundaries and names shown and the designations used on maps do not imply official endorsement or acceptance by the United Nations.A dotted line represents approximately the line of control in Jammu and Kashmir agreed upon by India and Pakistan.The final status of Jammu and Kashmir has not yet been agreed upon by the parties.

62
World Drug Report 2010
How does the market operate?
The first stage of the route offers relatively few chal-lenges to experienced traffickers, many of whom belong to ethnic groups that live on both sides of the border. In Balochistan, drug trafficking convoys consist mostly of Baloch traffickers receiving from Pashtuns in Afghani-stan and delivering to the Islamic Republic of Iran, Karachi, or launches from the Balochistan coast (Gwadar and Pasni ports). These convoys are heavily militarized and intimidation/violence occurs all around their busi-ness, including in areas of Balochistan that suffer from having very low penetration of government security forces. Many important traffickers are based in Quetta (Balochistan) and some are Afghans who have relocated there following law enforcement operations in southern Afghanistan.
Trafficking from eastern Afghanistan into the FATA gen-erally involves the use of mountain trails and pack ani-mals. Violence is rarely reported during crossings (which often occur at night). The cross-border trade is under the control of several prominent cross-border Pashtun tribes, notably the Afridi and Shinwari, but also others such as members of the Mohmand and Waziri sub-tribes. To offload further in Pakistan, whether in Karachi or on the Makran coast, traffickers rely on high-level political pro-tection and connections between Afghans and powerful people in Sindh and Punjab provinces.
With the possible exception of Iran-bound opiates, Afri-can traffickers – the majority West Africans - are pivotal to the international trafficking of heroin. Groups often have a large and varied pool of couriers to employ. These may be Filipinos, Indonesians, Pakistanis and Chinese nationals but also West Africans. Among West African
groups, Nigerians are especially active as attested in arrest figures. These groups tend to be organized along tribal/ethnic lines with loose network structures.84
West African groups traffic to multiple destinations, including China, India and Africa. This type of traffick-ing usually involves the use of air routes (from the air-ports of Peshawar, Islamabad, Lahore, Karachi and Quetta) to transit points like Dubai and onward to Nigeria and other West African countries.85 The use of post parcels is also widely reported.
Africa is both a market and a staging point for other destinations. According to ANF reports, African traffick-ers “have created two networks: a supply network from Pakistan to Africa and a redistribution network from Africa to Europe and North America and elsewhere.”86 In destination markets like Europe, West African net-works rely on their respective diaspora as a base for their activity (importation and retail distribution of heroin). Recruiting European nationals as couriers to bring heroin by air to Europe has also been reported.
The use of air routes is significant; over 37% of Paki-stan’s total heroin seizures in 2006 took place at air-ports.87 Couriers typically attempt to either conceal opiates in luggage or body carry them out of Pakistan.
The extent to which African groups collaborate with Pakistani groups in smuggling ventures remains unclear. According to the US State Department INCSR 2010, drug trafficking organizations in Pakistan are still frag-mented and decentralized but there is a trend towards specialization. Clearly, the market is not closed to out-siders, as Nigerians alone account for fully 32% of drug trafficking arrests in 2008. Rather it appears that Nige-rians (and other African groups) overlap in some cases with Pakistani groups, both in Pakistan and in some destination markets (Africa and China)
Annually, UNODC estimates that the revenue gener-ated by Afghan opiate trafficking to and through Paki-stan exceeds US$1 billion, while emphasizing that this excludes the revenue from illicit trading in associated precursor chemicals. In the past few years, most large (multi-ton) seizures have occurred at the port of Karachi but chemicals may also be trafficked to Pakistan in small lots from China and/or India, two major producers. It is notable that Pakistan’s acetic anhydride seizures sur-passed Afghanistan’s in 2008.88 There is an increasing
84 Joergen Carling, Migration, Human Smuggling and Trafficking from Nigeria to Europe, International Peace Research Institute, Oslo (PRIO), 2006.
85 Anti Narcotic Force Pakistan, Analysis of domestic seizures 2006.86 Ibid., p.14.87 UNODC Pakistan country office, Illicit drug trends in Pakistan, April
2008, p.23.88 According to information provided by the UNODC Pakistan coun-
try office, in 2008, Pakistan reportedly seized over 15,000 litres of acetic anhydride in three separate seizures.
Zambia, 1%
Mali, 1%
Guinea, 2%
Kenya , 2%
Nepal, 1%
Thailand, 1%
South Africa, 3%
Zimbabwe, 1%
Ghana, 1%
Côte d'Ivoire, 1%
Spain, 1%
UK, 1%
Tanzania, 4%
Afghanistan, 1%
Nigeria, 32%
Pakistan, 32%
Others, 14%
Breakdown by nationality of arrested Fig. 19: heroin traffickers in Pakistan, 2008
Source: World Customs Organization

63
1. Transnational drug market analysis The global heroin market
information flow on precursor trafficking through Paki-stan and this is directly related to the country’s openness to observation and international cooperation. There remain, however, serious information gaps on precursor procurement networks and the illicit precursor trade in general.
Impact of this flow
As with the Islamic Republic of Iran, Pakistan’s high levels of opium and heroin use are fuelled by the easily available supply. The latest assessment of drug use in Pakistan took place in 2006 and estimates the number of chronic opiate users at 628,000, of which around 500,000 are heroin users.89 To put these numbers in perspective, this is twice the numbers found in Central Asia90 and ten times the numbers found in Afghanistan.
A 100% increase in injecting drug use was estimated between 2000 and 2006. There is currently a concen-trated, but localized, HIV epidemic among injecting drug users (IDUs) in Pakistan. Coupled with widespread risk behaviour, this could lead to an HIV epidemic among the wider population. Surveys in several cities of Pakistan have confirmed substantial epidemics of HIV among IDUs.91 One study in Karachi revealed an increase in HIV prevalence among IDUs from 1% in 2004 to 26% in March 2005,92 while a more recent study found that HIV prevalence among IDUs has reached 24% in Quetta (along the border with Afghanistan).93 The increase in the number of IDUs has complicated drug treatment and requires trained service providers.
As in neighbouring Afghanistan, drugs in Pakistan are inseparably entangled with corruption and insecurity. Currently, Pakistan’s efforts against the trafficking of Afghan opiates (and the cultivation of opium poppy) are constrained by a major cross-border insurgency and the threat of violent extremism, which has monopolized the attention of law enforcement agencies. One example is the restive Federally Administered Tribal Areas (FATA) which was opium poppy-free for several years until 2003/2004, but where there has been a re-expansion of cultivation.94
89 According to the 2008 UNODC survey Illicit drug trends in Parkistan there are 482,000 heroin users in Pakistan.
90 Prevalence was revised downwards to 0.7% of the adult population. However, this assessment was not methodologically sound and it is suspected that opiate use in Pakistan is much higher than the num-bers it returned.
91 National AIDS Control Programme of Pakistan, HIV Second Genera-tion Surveillance in Pakistan: National Report – Round 1, 2005.
92 Emmanuel F, Archibald C, Altaf A; “What Drives the HIV Epidemic among Injecting Drug Users in Pakistan: A Risk Factor Analysis”, XVI International AIDS Conference, 13-18 August 2006, Toronto, Canada.
93 Achakzai M, Kassi M, Kasi PM, “Seroprevalences and Co-infections of HIV, Hepatitis C Virus and Hepatitis B Virus in Injecting Drug Users in Quetta, Pakistan”, 2007, Tropical Doctor, 37(1):43-5.
94 According to the US Government, Pakistan cultivated 1,779 ha in
Implications for response1.2.5
Drug control in the era of globalization faces a number of challenges, from a cultural shift in consuming socie-ties - which sees some forms of drug use as increasingly acceptable - to the dismantling of barriers to global trade. The latter poses acute challenges to border con-trols, which still require substantial strengthening, par-ticularly in the Balkans, Central Asia, South Asia and along the Pakistan-Afghanistan border. The level of global sea, air and land transportation will continue to increase. As an example, according to the International Association of Ports and Harbours container traffic is expected to double by the year 2012, compared with 1999 figures. At present, more than 220 million sea containers move around the globe per year with approx-imately 90% of the world’s cargo shipped via container. Scanning or searching every single container, load and vehicle is practically impossible. Traffickers are well aware of these limitations and frequently target the busiest ports of entry. International information exchange and cooperation should therefore be the pillar of any global counter-narcotics strategy. Practically speaking, this should include increased support for regional infor-mation collection and coordination bodies such as the Joint Planning Unit (JPU) in the Islamic Republic of Iran, the Southeast European Cooperative Initiative (SECI) centre in the Balkans and the Central Asian Regional Information and Coordination Centre (CARICC) in Central Asia, which would enhance capacities for expanded cooperation in the future.
Like any other industry, the opiate market follows the laws of demand and supply, and also react to economic stimulus and pressures. The geographic concentration of opiate production in Afghanistan is unique. It is tempt-ing to think that if control could be maintained over a few provinces in one of the poorest countries on earth, one of the world’s most intractable drug problems could be solved overnight. Experience has shown, however, that markets quickly adjust, and that production soon re-emerges to meet an established demand. This perspective may also have led to a disproportionate focus on produc-tion in Afghanistan, at the cost of efforts in other parts of the market chain. It is thus imperative that the market be tackled as a whole, including both supply and demand. The international community needs to strengthen the link between supply and demand reduction measures and to better integrate national efforts in the framework of an international strategy on the scale of the market. To do both, getting a better understanding of the transna-tional heroin economy is a matter of urgency.
2009 with a potential opium production of approximately 44 mt. The majority of this cultivation occurs in the Federally Administered Tribal Areas (Khyber, Bajaur, and Mohmand); see Bureau of Inter-national Narcotics and Law Enforcement Affairs, 2010 International Narcotics Control Strategy Report (INCSR), March 2010.


1.3 The global cocaine market
65
Cocaine has been a popular recreational drug for decades, and while demand appears to be on the wane in its larg-est markets, it has gained popularity in an ever widening range of countries. ‘Cocaine’ comprises at least two dis-tinct drug products: powder cocaine on the one hand, and a range of cocaine base products, mostly falling under the heading of ‘crack’, on the other. Powder cocaine produces a more subtle effect, is more expensive to use, and has become emblematic of economic success in some circles. Demand has emerged in many develop-ing countries, particularly among elites. Crack is cheaper, more intense, and associated with prostitution and street crime. Traditionally, crack use was rare outside the United States of America and the United Kingdom, but this also appears to be changing, especially in Latin America and parts of Africa.
Starting in the 1960s and 1970s, global production, trafficking and consumption of cocaine rose strongly. Until the mid-1960s, global cocaine seizures were mea-sured in the tens of kilograms annually. In recent years, they have been in the hundreds of tons. Based on seizure figures, it appears that cocaine markets grew most dra-matically during the 1980s, when the amounts seized increased by more than 40% per year. The number of countries reporting cocaine seizures has also grown during this period, from 44 in 1980 to 87 in 1990 and 123 in 2008.1
1 UNODC ARQ.
Dimensions 1.3.1
Supply, demand and value
The extent as well as the pattern of global cocaine pro-duction have changed significantly over the last four decades. From the end of World War II until the late 1990s, almost all the world’s coca bush (the raw material for the manufacture of cocaine) was grown in Peru and the Plurinational State of Bolivia, and since the 1970s, most of this output was refined into cocaine in Colom-bia. This increased over time and, in 1997, coca cultiva-tion in Colombia exceeded that of the traditional growers for the first time.
In the twenty-first century, the pendulum has swung back again. Coca cultivation in Colombia decreased by 58% between 2000 and 2009, mainly due to large-scale eradication. At the same time, it increased by 38% in Peru and more than doubled in the Plurinational State of Bolivia (+112%), and both of these countries have acquired the ability to produce their own refined cocaine. Despite the increases in Peru and the Plurinational State of Bolivia, the net decline in the global area under coca cultivation over the 2000-2009 period was significant, amounting to 28%. A far smaller area is now under coca cultivation than in any year of the 1990s.
In 2008, an estimated 865 metric tons (mt) of pure cocaine were produced. This was the lowest level in five years and considerably less than a year earlier when over 1,000 mt were produced. A further decline on a year earlier seems to have taken place in 2009 though final figures for 2009 are not yet available. In 2008, Colom-bia appears to have been responsible for about half of

66
World Drug Report 2010
global production, with Peru contributing over one third and the Plurinational State of Bolivia making up the balance.
The process of analysing the production of cocaine is complex, though, because the amount of cocaine that can be produced out of a given plot of land varies over time and between areas. Productivity has grown in some areas due to improvements in both farming and process-ing techniques, but eradication has pushed some cultiva-tion into less suitable areas, decreasing yields. Improvements in laboratory efficiency increased again cocaine production. In the end, the hectares of cultiva-tion (determined through satellite and ground surveys) are multiplied by an average kilogram-per-hectare coca leaf yield figure and coca-leaf to cocaine transformation ratios to generate a cocaine production estimate. When
these ratios are updated, they can create misleading year-on-year trends (like those seen between 2003 and 2004). The long-term trends should be more accurate (pro-vided the coca yields and transformation ratios were accurately measured). It appears that, despite radical changes within countries, total cocaine output has been fairly stable over the last decade. This perception may still change, however, once updated and properly veri-fied information on the different ratios for the different countries (and for the various coca producing regions in these countries) becomes available.
Global cocaine seizures have grown greatly over the last decade, suggesting that a declining amount of the drug is actually reaching the markets - unless there is more production than presently accounted for. Most of the increase in seizures came from South America while
Global coca bush cultivation (ha), 1990-2009Fig. 20:
Source: UNODC
Global cocaine production, 1990-2008 Fig. 21:
Source: UNODC
221,300211,700
158,800
40,100
163,300
68,000
121,300
43,400 59,90050,300
14,600
30,900
0
50,000
100,000
150,000
200,000
250,000
1990
1991
1992
1993
1994
1995
1996
1997
1998
1999
2000
2001
2002
2003
2004
2005
2006
2007
2008
2009
Hec
tare
s
Total
Colombia
Peru
Bolivia
695 630660680
435
92
450
290280270141
240
492
302
1049498
43
150189
113774
825
950879
1,048 1,0341,024
865
0
200
400
600
800
1,000
1,200
1990
1991
1992
1993
1994
1995
1996
1997
1998
1999
2000
2001
2002
2003
2004
2005
2006
2007
2008
Met
ric
ton
s
Bolivia
Peru
Colombia
Total
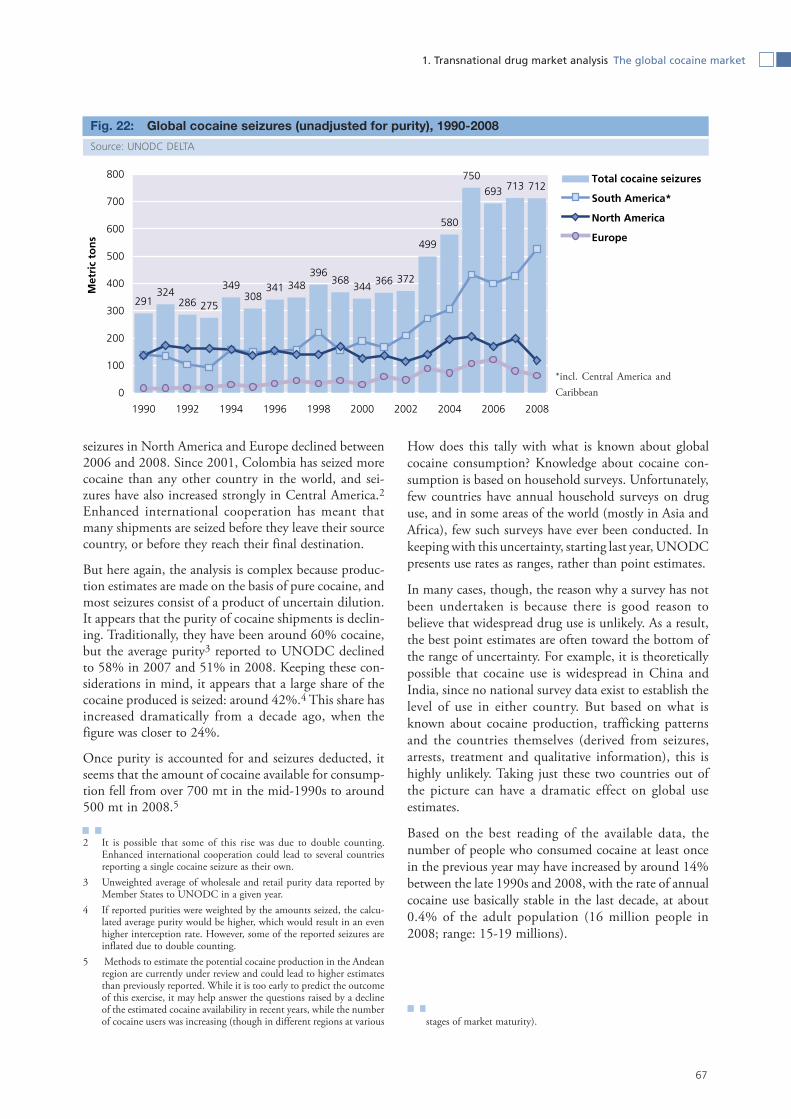
67
1. Transnational drug market analysis The global cocaine market
seizures in North America and Europe declined between 2006 and 2008. Since 2001, Colombia has seized more cocaine than any other country in the world, and sei-zures have also increased strongly in Central America.2 Enhanced international cooperation has meant that many shipments are seized before they leave their source country, or before they reach their final destination.
But here again, the analysis is complex because produc-tion estimates are made on the basis of pure cocaine, and most seizures consist of a product of uncertain dilution. It appears that the purity of cocaine shipments is declin-ing. Traditionally, they have been around 60% cocaine, but the average purity3 reported to UNODC declined to 58% in 2007 and 51% in 2008. Keeping these con-siderations in mind, it appears that a large share of the cocaine produced is seized: around 42%.4 This share has increased dramatically from a decade ago, when the figure was closer to 24%.
Once purity is accounted for and seizures deducted, it seems that the amount of cocaine available for consump-tion fell from over 700 mt in the mid-1990s to around 500 mt in 2008.5
2 It is possible that some of this rise was due to double counting. Enhanced international cooperation could lead to several countries reporting a single cocaine seizure as their own.
3 Unweighted average of wholesale and retail purity data reported by Member States to UNODC in a given year.
4 If reported purities were weighted by the amounts seized, the calcu-lated average purity would be higher, which would result in an even higher interception rate. However, some of the reported seizures are inflated due to double counting.
5 Methods to estimate the potential cocaine production in the Andean region are currently under review and could lead to higher estimates than previously reported. While it is too early to predict the outcome of this exercise, it may help answer the questions raised by a decline of the estimated cocaine availability in recent years, while the number of cocaine users was increasing (though in different regions at various
How does this tally with what is known about global cocaine consumption? Knowledge about cocaine con-sumption is based on household surveys. Unfortunately, few countries have annual household surveys on drug use, and in some areas of the world (mostly in Asia and Africa), few such surveys have ever been conducted. In keeping with this uncertainty, starting last year, UNODC presents use rates as ranges, rather than point estimates.
In many cases, though, the reason why a survey has not been undertaken is because there is good reason to believe that widespread drug use is unlikely. As a result, the best point estimates are often toward the bottom of the range of uncertainty. For example, it is theoretically possible that cocaine use is widespread in China and India, since no national survey data exist to establish the level of use in either country. But based on what is known about cocaine production, trafficking patterns and the countries themselves (derived from seizures, arrests, treatment and qualitative information), this is highly unlikely. Taking just these two countries out of the picture can have a dramatic effect on global use estimates.
Based on the best reading of the available data, the number of people who consumed cocaine at least once in the previous year may have increased by around 14% between the late 1990s and 2008, with the rate of annual cocaine use basically stable in the last decade, at about 0.4% of the adult population (16 million people in 2008; range: 15-19 millions).
stages of market maturity).
Global cocaine seizures (unadjusted for purity), 1990-2008Fig. 22:
Source: UNODC DELTA
291324
286 275
349308
341 348396
368344 366 372
499
580
750
693 713 712
0
100
200
300
400
500
600
700
800
1990 1992 1994 1996 1998 2000 2002 2004 2006 2008
Met
ric
ton
s
Total cocaine seizures
South America*
North America
Europe
* incl. Central America and Caribbean*incl. Central America and Caribbean

68
World Drug Report 2010
If the amount of cocaine making it to market has declined (from more than 700 mt in the late 1990s to around 500 mt in 2008) while the number of users increased over the past 10 years, then the amount used by each consumer must have declined significantly. Alternatively, one should not exclude the possibility that laboratory efficiency may have increased stronger than is currently reflected in the cocaine production estimates so that global cocaine availability (production less sei-zures) may have remained stable or increased slightly over the last decade.
How well does all this jell with expert opinion about global drug trends? One of the questions asked in UNODC’s Annual Reports Questionnaire (ARQ) con-cerns perceptions about trends in each drug market. This allows countries who do not conduct surveys to
highlight what they see as emerging drug issues. If these responses are amalgamated to create an index,6 this index is rising, suggesting that a growing number of countries indicate that cocaine is a growing problem. If these responses are weighted by the estimated cocaine-using population, however, the global trend is down-wards in recent years, in keeping with the decline in use in the United States, the largest national cocaine market. A clear divergence can be seen between the responses of developed (OECD) and developing countries: use is perceived to be declining in the former and increasing in the latter.
6 For ‘strong increase’ 2 points are given; for ‘some increase ‘1 point; for stable: 0 points; for ‘some decline’ 1 point is deducted and for ‘strong decline’ 2 points are deducted. The average at the global level is then calculated.
Cocaine production, seizures and supply to markets, 1990-2008 Fig. 23:
Sources: UNODC World Drug Report 2009 and DELTA
Annual prevalence of cocaine use at the global level Fig. 24:
Sources: UNODC World Drug Report 2008 and updates based on ARQ
599 639 694604 681 745 746
666588
704 672 607 576 560700
567 575 582502
23%23%
20%
21%24%
20% 22%24%
29%
24% 24%27% 28% 35%
33%
44% 44% 43%42%
774833 866
769
891930 950
875825
925879
827 800859
1,0481,0201,0341,024
865
0
200
400
600
800
1000
1200
1990 1992 1994 1996 1998 2000 2002 2004 2006 2008
Met
ric
ton
s
Cocaine available for consumptionPurity adjusted seizures Cocaine production
14.0 13.3 13.7 13.414.3
16.0 16.2 15.9
0.4%
0.3% 0.3%0.4% 0.4%0.3%
0.3%
0.4%
0
5
10
15
20
25
late
199
0s
2001
/02
2003
/04
2004
/05
2005
/06
2006
/07
2007
/08
2008
/09
late
199
0s
2001
/02
2003
/04
2004
/05
2006
/06
2006
/07
2007
/08
2008
/09
Mill
ion
use
rs
0.0%
0.1%
0.2%
0.3%
0.4%
0.5%
In %
of
po
pu
lati
on
ag
e 15
-64
Number
in % of population age 15-64

69
1. Transnational drug market analysis The global cocaine market
How has this affected the value of the global cocaine market? The value is most certainly lower than it was in the mid-1990s, when prices were much higher and the US market was strong. For 1995, UNODC estimated the retail value of the global market at US$117 billion.7 Expressed in constant 2008 US dollars, this would be equivalent to US$165 billon in 2008. The correspond-ing figure for 2008 would be US$88 billion (range: US$80–US$100 bn), suggesting the value has halved in this 13-year period. The global cocaine retail sales were equivalent to 0.15% of global GDP in 2008, down from 0.4% of global GDP in 1995. Nonetheless, the value of global cocaine retail sales in 2008 were still higher than the gross domestic product (GDP) of 123 out of 184 countries for which the World Bank provided estimates for the years 2007 or 2008.
7 UNDCP, Economic and Social Consequences of Drug Abuse and Illicit Trafficking, Vienna 1997.
8 UNDCP, Economic and Social Consequences of Drug Abuse and Illicit Trafficking, Vienna 1997; World Bank, World Development Indica-tors 2009; UNODC estimates for 2008 based on UNODC ARQ; UNODC, “Estimating the value of illicit drug markets” in UNODC, 2005 World Drug Report, Volume 1: Analysis, pp. 123-143; ONDCP, What America’s Users Spend on Illegal Drugs, December 2001; United Nations Department of Economic and Social Affairs, Population Division, World Population Prospects: The 2008 Revision, 2009; SAMHSA, National Survey on Drug Use and Health, Rockville MD 2009, and previous years; FBI, Uniform Crime Reports (2002-2008); ONDCP, Arrestee Drug Abuse Monitoring Program - ADAM II 2008 Annual Report, Washington D.C, April 2009; ONDCP, “Cocaine Consumption Estimates Methodology”, September 2008 (internal paper); US State Department, International Narcotics Control Strat-egy Report, March 2010; ONDCP, The Price and Purity of Illicit
Drugs: 1981-2007, Report pared by the Institute for Defense Analy-sis for ONDCP, Washington, July 2008; US Drug Enforcement Agency analysis of STRIDE data; Health Canada, Canadian Alcohol and Drug Use Monitoring Survey 2008; Instituto Nacional de Salud Pública, Encuesta Nacional de Adicciones, 2008; EMCDDA, Statistical Bulletin 2009; European Centre for Social Welfare Policy, Two Worlds of Drug Consumption in Late Modern Societies, Vienna 2009; UK Home Office, Sizing the UK market for illicit drugs, London 2001; Home Office, Measuring different aspects of problem drug use: meth-odological developments, Home Office Online Report 16/06, London 2006; and various other Government reports.
Global trends in cocaine use as Fig. 25: perceived by government experts, 1992-2008
Source: UNODC ARQ
Global trends in cocaine use, OECD Fig. 26: versus non-OECD countries, as per-ceived by government experts (based on trends weighted by cocaine using population), 1992-2008
Source: UNODC ARQ
Global cocaine retail market in billion Fig. 27: constant 2008 US$, 1995 and 2008
Source: UNODC estimates8
105.8
107.6
103.7 103.0
98
100
102
104
106
108
110
112
114
116
118
1992
1994
1996
1998
2000
2002
2004
2006
2008
Ind
ex (
1992
= 1
00)
Memo: some increase in all countries
Unweighted trends
Trends weighted by cocaine using population
Memo: stable in all countries
105.6
104.0
102.0
103.5 103.0
103.7
98
99
100
101
102
103
104
105
106
1992
1994
1996
1998
2000
2002
2004
2006
2008
Ind
ex: 1
992
= 1
00
Developing & transformation countries
OECD countries
Global
165
88
0
50
100
150
200
1995 2008
In c
on
stan
t 20
08 b
illio
n U
S$

70
World Drug Report 2010
Global volume and distribution
Although cocaine use appears to be growing in develop-ing countries, the vast bulk of the production is destined for two major overseas markets: North America (6.2 million users in 2008) and Europe (4 to 5 million users, of which 4.1 million were in the EU and EFTA countries).9 The largest emerging market in the develop-ing world is seen in the South America, Central America and Caribbean region, with some 2.7 million users. Estimates are far less certain for use levels in Asia and Africa.
Current estimates suggest that about 500 mt of pure cocaine were available for consumption in 2008, of which around 480 mt were actually consumed. The rest was either stocked or lost in transit. Based on what is known about production, seizures, use levels and use rates, a likely global distribution of the 480 mt of cocaine consumed in 2008 is presented in a separate table. This table suggests that more than 320 mt, or around two thirds, is consumed in the mature cocaine markets of North America (41%) and West Europe (26%). Latin America is not far behind, however, suggesting that more attention should be paid to this growing market.
9 The 27 countries of the European Union (EU) and the four countries of the European Free Trade Association (EFTA).
These estimates remain tentative, with substantial uncer-tainty in Asia and Africa in particular, but they are generally in keeping with the distribution of global cocaine seizures.
Based on this distribution and what is known about prices and purities, it is possible to place a retail value on each regional market. Due to much higher purity-ad-justed retail prices, the estimated value of the market in Europe (US$34 billion) is almost as large as that of North America (US$38 billion). Surprisingly, the third largest cocaine market, in economic terms, is the Oce-ania region, worth an estimated US$6 billion, due to very high retail prices.
Global impact
The use of cocaine constitutes, first of all, a major health problem. Cocaine use results in tens of thousands of deaths each year worldwide. After the opiates, cocaine is the most problematic drug globally, and it is indisputa-bly the main problem drug in the Americas. Out of the 5.3 million people who used cocaine at least once in the United States during 2008, 1.9 million also used cocaine in the previous month, of which almost 1 million were found to have been dependent on cocaine.10 In other
10 Substance dependence was based on the definition of the 4th edi-
Main global cocaine flows, 2008Map 6:
Source: UNODC, World Drug Report 2009, and UNODC calculations, informed by US ONDCP, Cocaine Consumption Estimates Methodology, September 2008 (internal paper).
ANDEANREGION
USA
Canada
Europe
Brazil
Mexico
B.R. of Venezuela
Caribbean
Pacific
165
124
17
14
UN
OD
C /
SCIE
NC
ES P
O
WestAfrica
Southern Africa
Cocaine trafficking* (in metric tons)
140
60
15
Cocaine consumption (in metric tons)
Main cocaine producers
6

71
1. Transnational drug market analysis The global cocaine market
words, out of the people who used cocaine in the previ-ous year at least once, 18% were dependent on it. This is a higher proportion than for any other drug except heroin. Figures for the year 2007 showed that out of 1,000 people who used crack cocaine in the previous 12 months, 116 entered treatment for substance abuse, a slightly higher proportion than for methamphetamine (102) and a significantly higher proportion than for drug use in general (30) or for the use of alcohol (6).13
tion of the Diagnostic and Statistical Manual for Mental Disorders (DSM-IV).
11 Sources the same as for footnote 8, except UNDCP, Economic and Social Consequences of Drug Abuse and Illicit Trafficking, Vienna 1997; World Bank, World Development Indicators 2009; ONDCP, The Price and Purity of Illicit Drugs: 1981-2007, Report prepared by the Insti-tute for Defense Analysis for ONDCP, Washington, July 2008; US Drug Enforcement Agency, based on STRIDE data.
12 Sources the same as for footnote 8, except UNDCP, Economic and Social Consequences of Drug Abuse and Illicit Trafficking, Vienna 1997; World Bank, World Development Indicators 2009; ONDCP, The Price and Purity of Illicit Drugs: 1981-2007, Report prepared by the Insti-tute for Defense Analysis for ONDCP, Washington, July 2008; US Drug Enforcement Agency, based on STRIDE data.
13 SAMHSA, Treatment Episode Data Sets (TEDS) and SAMHSA,
While the share has declined, almost half of all people entering drug treatment in the Americas do so due to cocaine (46%), and the share in Europe increased from 3% in 1997/1998 to 10% in 2008. In West Europe, the share is almost 15%.
Trafficking in cocaine also constitutes a security threat, financing organized crime and insurgencies in a number of countries, including the FARC in Colombia and the Shining Path in Peru.
Cocaine trafficking is also linked to corruption. Traffick-ing in cocaine both thrives on corruption and breeds corruption. Rising trafficking of cocaine via countries neighbouring the cocaine production centres in the Andean region led to rising levels of corruption, while high levels of corruption in a number of West African countries have certainly been a facilitating factor for the establishment of cocaine transit traffic via this region.
National Survey on Drug Use and Health.
Estimated number of users (in millions)
Grams per user per year
Amounts of pure cocaine consumed (in mt)
In %
North America 6.2 31.6 196 41%
EU/EFTA 4.1 30.2 124 26%
South America, Central America, Caribbean 2.7 35 95 20%
Africa 1.3 20 26 5%
Asia 0.7 20 14 3%
East and South-East Europe 0.5 26 13 3%
Oceania 0.4 25 11 2%
World (rounded) 15.9 30.1 480 100%
Amounts consumed
(in mt)
Average retail price (in US$ per
gram)
Average purity at
retail level
Purity-adjusted prices
Value (in billion
US$)
North America 196 108 56% 192 38
EU/EFTA 124 101 37% 273 34
South America, Central America, Caribbean 95 11 66% 17 2
Africa 26 22 34% 65 2
Asia 14 142 73% 195 3
East and South-East Europe 13 125 48% 260 3
Oceania 11 291 53% 549 6
World – total (rounded) 480 88
Tentative distribution of global cocaine consumption (purity-adjusted), 2008 Table 8:
Source: UNODC estimates11
Tentative distribution of the global cocaine market in billion US$, 2008Table 9:
Source: UNODC estimates12

72
World Drug Report 2010
Cocaine from the Andean region 1.3.2 to North America
North America is the largest regional cocaine market, with some 6.2 million annual users, close to 40% of the global cocaine-using population. The United States remains the single largest national cocaine market in the world, but this market has declined since the early 1980s. In 1982, an estimated 10.5 million people in the United States had used cocaine in the previous year.15 In 2008, the figure was 5.3 million, about half as many. This long-term decline occurred despite falling prices and can be attributed to a number of causes, including increased prevention, treatment (complemented by the
14 Unweighted results are shown as for a number of developing coun-tries data from only a few hospitals or drug treatment centers is available. Nonetheless, for most regions, changes in the proportion of treatment demand for cocaine seem to reflect rather well underlying actual trends in the relative importance of cocaine in total drug-related treatment demand. The only exception is Africa. The alleged ‘decline’ in the proportion of cocaine-related treatment demand for Africa between 2004 and 2008 is a statistical artifact. For this year’s World Drug Report all estimates older than 10 years were removed. This did not impact much on most regions, except Africa. It reduced significantly the number of country estimates available for Africa. The ‘decline’ for Africa is thus basically due to a different and very small sample of reporting African countries, but not to any actual decline of cocaine-related treatment demand there. On the contrary, in the limited number of African countries where comparable data are available, the proportion of cocaine in total treatment demand appear to have increased.
15 US Department of Health and Human Services, Substance Abuse and Mental Health Services Administration (SAMHSA), 1995 National Household Survey on Drug Abuse, Report #18, Rockville, Maryland, 1996.
establishment of ‘drug courts’) and ‘social learning.’ Crack cocaine became a stigmatized drug in the second half of the 1980s, and powder cocaine also became less fashionable.
This long-term demand-driven decline appears to have been complemented by a recent, more dramatic, supply-driven one. The annual prevalence rate of cocaine use in the United States fell from 3% of the adult population in 2006 to 2.6% in 2008.16 Recent declines have also been reported in Canada, with adult annual use rates falling from 2.3% in 2004 to 1.9% in 2008.17 House-hold surveys in Mexico showed an increase after 2002. However, results from a survey in Mexico City in 2006 suggest that cocaine use may have actually declined between 2006 and 2008, following a strong increase between 2002 and 2006.18
16 SAMHSA, Results from the 2008 National Survey on Drug Use and Health. The data were re-adjusted to the internationally comparable age group 15-64.
17 Health Canada, Canadian Alcohol and Drug Use Monitoring Survey 2008, Ottawa 2009. The decline from 1.9% of the population age 15 and above in 2004 to 1.6% in 2008 is equivalent to a decline from 2.3% to 2.0% if the numbers are re-adjusted to the internationally comparable age group of those aged 15-64.
18 Massive increases, followed by a decline seems to be indirectly also confirmed by general population household surveys conducted in Mexico in 2002 and 2008. While lifetime prevalence of cocaine use doubled, from 1.23% in 2002 to 2.4% in 2008, annual prevalence rose by ‘just’ 25% from 0.35% in 2002 to 0.44% in 2008.In other words, lifetime prevalence rose by almost 1.2 percentage points while annual prevalence rose by ‘just’ 0.1 percentage points. Such results would be only possible if large sections of society started experiment-ing with cocaine but gave it up again at some point between 2003
Cocaine as primary drug of abuse Fig. 28: among persons treated for drug problems*
* unweighted regional averages.Sources: UNODC ARQ and World Drug Report 2006; UNODCCP, World Drug Report 2000
Annual prevalence rates of cocaine Fig. 29: use in North America among the population aged 15-64, 2002-2008
* 2006 data for Mexico: UNODC estimates, extrapolated from house-hold survey results in Mexico City.
Sources: SAMHSA, Results from the 2008 National Survey on Drug Use and Health (and previous years); CONADIC, Encuesta Nacional de Adicciones 2008; Health Canada, Cana-dian Alcohol and Drug Use Monitoring Survey 2008; UNODC, World Drug Report 2009 (and previous years)
0.0
10
3
41
65
0.2
0.3
10
7
42
54
0.5
0.5
6
10
31
49
0 10 20 30 40 50 60 70
Oceania
Asia
Africa
Europe
North America
South America
in percent of people treated for drug abuse
2010 WDR (2008)2006 WDR (2004)2000 WDR (1997/98)
3.0 3.0
2.6
2.3
1.9
0.35
0.8
0.44
0.0
0.5
1.0
1.5
2.0
2.5
3.0
3.5
2002
2006
2008
2002
2004
2008
2002
2006
*
2008
USA Canada Mexico
An
nu
al p
reva
len
ce
in %
of
po
pu
lati
on
ag
e 15
-64

73
1. Transnational drug market analysis The global cocaine market
The same recent and dramatic decline can be seen in school surveys in the United States and Canada, where student use has almost halved in three years.19 In 2009, the perceived availability of cocaine among US students reached its lowest level since 1978. A strong reduction in availability is also confirmed by US law enforcement. Despite ongoing efforts to fight the drug trade, US cocaine seizures along the border with Mexico fell by 40% between 2006 and 2008 and remained at the lower level in 2009, while heroin, marijuana and metham-phetamine seizures all increased.20
The strong drop in cocaine use is also reflected in foren-sic data. Cocaine positive hair tests among the US work-force, reflecting use over the past three months, showed a 40% drop in just two years, from 5.3% in 2007 to 3.2% over the first two quarters of 2009.21 The share of the US workforce that tested positive for cocaine, as detected by urine analysis (reflecting use over the last two to three days), showed a 58% decline between 2006 (0.72%) and the first two quarters of 2009 (0.3%).
and 2007. This in turn would suggest that the annual prevalence of cocaine use was already higher at some point between 2003 and 2007, with a peak probably around 2006, followed by a decline in the most recent years. Alternatively, more than 50% of all annual cocaine users would have had to give up their habit every year between 2002 and 2007, which is not very likely. Moreover, the proportion of cocaine in total drug treatment demand declined in recent years, from 37.1% in 2006 to 33.9% (UNODC ARQ).
19 The reduction was 40% between 2006 and 2009 in the USA and 50% in Ontario, which accounts for more than a third of Canada’s total population.
20 National Drug Intelligence Center, National Drug Threat Assessment 2010, Johnstown, February 2010.
21 Quest Diagnostics, New Hair Data Validate Sharp Downward Trend in Cocaine and Methamphetamine Positivity in General U.S. Workforce Madison, N.J, 20 November 2009 and The Medical News, Quest Diagnostics reports sharp downward trends in cocaine and methamphet-amine use, 20 November 2009.
While the forensic tests are not administered to a repre-sentative sample of the US population, some 6 million people undergo these tests, almost 100 times as many as those interviewed in household surveys (69,000 in 2008).22
The recent decline (since 2006) appears to have been mainly supply-driven, caused by a severe cocaine short-age. This shortage is also reflected in rapidly falling purity levels and a consequent rise in the cost per unit of pure cocaine. While street prices remained fairly
22 SAMHSA, Results from the 2008 National Survey on Drug Use and Health.
Annual prevalence of cocaine use among high school students in the United States and Fig. 30: Ontario (Canada), 1980-2009
Sources: NIDA, Monitoring the Future; OSDUH, Drug Use Among Ontario Students, 1977-2009
12.411.6
13.1
10.3
7.9
6.5
5.3
3.5 3.1 3.3 3.6 4.04.9
5.5 5.76.2
5.0 4.8 5.0 4.85.3 5.1
5.75.2
4.4
3.44.64.0 4.0
3.4
2.41.7 1.5
2.5 2.7
3.7 4.0
5.14.2
3.3
1.9
12.7
11.511.4
12.3
0
2
4
6
8
10
12
14
80 81 82 83 84 85 86 87 88 89 90 91 92 93 94 95 96 97 98 99 00 01 02 03 04 05 06 07 08 09
An
nu
al p
reva
len
ce in
%
USA 12th graders
Ontario, 7-11th graders
0.72 0.7 0.72
0.58
0.41
0.3
0.57 0.6 0.58
0.44
0.32
0.24
0
0.1
0.2
0.3
0.4
0.5
0.6
0.7
0.8
2004 2005 2006 2007 2008 2009*
In p
erce
nt
of
wo
rkfo
rce
General US workforceFederally mandated, safety-sensitive workforce
-58%
Positive tests for cocaine use among Fig. 31: the US workforce, 2004-2009*
* Positive tests for cocaine use among the general US workforce (5.7 million tests in 2008) and among the federally mandated, safety-sensi-tive workforce (1.6 million tests in 2008). Data for 2009 refer to the first two quarters only.
Source: Quest Diagnostics, Drug Testing Index

74
World Drug Report 2010
stable throughout this period, purity dropped dramati-cally, resulting in an effective doubling of the real price of cocaine between 2006 and 2009.
There are several reasons for this shortage. Interdiction has stiffened in Colombia, Central America and Mexico. Cartel violence in Mexico has also disrupted supply routes. Perhaps most importantly, production has declined in Colombia, the primary source of cocaine for the United States market, and production in Peru and the Plurinational State of Bolivia continue to be directed towards Europe and the Southern Cone. The fact that the US market is almost exclusively supplied by Colom-bian cocaine (rather than Peruvian or Bolivian) has been established scientifically. Forensic analyses of cocaine seized or purchased in the United States have repeatedly shown that nearly 90% of the samples originate in Colombia.23
Cocaine is typically transported from Colombia to Mexico or Central America by sea (usually by Colom-bian traffickers), and then onwards by land to the United States and Canada (usually by Mexican traffickers). The US authorities estimate that close to 90% of the cocaine entering the country crosses the US/Mexico land border, most of it entering the state of Texas and, to a lesser extent, California and Arizona, through the relative importance of Arizona seems to be increasing. Accord-ing to US estimates, some 70% of the cocaine leaves Colombia via the Pacific, 20% via the Atlantic and 10% via the Bolivarian Republic of Venezuela and the Carib-bean.24 The routes have changed over the years.
23 US State Department, Bureau for International Narcotics and Law Enforcement Affairs, International Narcotics Strategy Report, Vol. I, March 2009.
24 National Drug Intelligence Center, National Drug Threat Assessment 2009, December 2008.
Direct cocaine shipments from Colombia to Mexico have been moved by a wide variety of marine craft, recently including self-propelled semi-submersibles, often transporting several tons of cocaine (typically between 2 and 9 mt). In 2008, 29.5 mt of cocaine were seized by the Colombian navy on board semi-submersi-bles in the Pacific Ocean, equivalent to 46% of all sei-zures made at sea by the Colombian authorities in the Pacific (64.5 mt). A few semi-submersibles have been detected on the Atlantic side as well. The Colombian Government reported seizing 198 mt of cocaine in 2008; 58% in the Pacific region and 31% in the Atlantic region.25
25 UNODC and Government of Colombia, Colombia Coca Cultivation Survey, Bogota, June 2009.
Average of all cocaine purchase prices in the United States, January 2006-September 2009Fig. 32:
Source: US Drug Enforcement Agency
50
100
150
200Pr
ices
in U
S$ p
er g
ram
-
25
50
75
Puri
ty in
%
Purity adjusted prices 95.1 95.4 95.1 90.6 99.5 119.4 130.9 115.7 123.2 125.1 184.3 199.5 174.4 173.2 174.0
Unadjusted prices 65.2 65.7 64.8 63.2 67.0 70.9 74.8 70.9 71.1 71.9 85.7 89.2 83.9 84.2 80.4
Purity (in %) 68.6 68.9 68.1 69.8 67.4 59.4 57.2 61.3 57.7 57.5 46.5 44.7 48.1 48.6 46.2
1 Qtr 2 Qtr 3 Qtr 4 Qtr 1 Qtr 2 Qtr 3 Qtr 4 Qtr 1 Qtr 2 Qtr 3 Qtr 4 Qtr 1 Qtr 2 Qtr 3 Qtr
2006 2007 2008 2009
0%
25%
50%
75%
100%
1985
1986
1987
1988
1989
1990
1991
1992
1993
1994
1995
1996
1997
1998
1999
2000
2001
2002
2003
2004
2005
2006
2007
2008
Caribbean Central America Mexico
Distribution of cocaine seizures in Fig. 33: Central America, the Caribbean and Mexico, 1985-2008
Source: UNODC ARQ/DELTA

75
1. Transnational drug market analysis The global cocaine market
In addition, the Bolivarian Republic of Venezuela has emerged as a prominent trans-shipment location for cocaine destined for Europe and the United States, according to Colombian, US and European sources, reflected, inter alia, in strong increases of Colombian overland cocaine shipments to the Bolivarian Republic of Venezuela. Cocaine transiting the Bolivarian Republic of Venezuela en route to the USA frequently departs by air from locations close to the border with Colombia for destinations in the Dominican Republic, Honduras and other Caribbean and Central American countries, as well as Mexico.27
Moreover, the importance of the Central American coun-tries as trans-shipment locations has increased in recent years. Most of this cocaine is destined for Mexico and the United States, though some is also locally trafficked.
Routes and volumes
Calculating the amount of an illicit drug consumed in a country is complicated, even in a country as rich in data as the United States. In 2001, the US Government esti-mated that national cocaine consumption had declined from 660 mt in 1988 to 259 mt in 2000.28 If these
26 For data 1988-2000: ONDCP, What America’s Users Spend on Illegal Drugs, December 2001; for 2001 data: Drug Availability Steering Committee, Availability Estimates in the United States, December 2002; for 2002-2008: UNODC estimates based on SAMHSA, 2008 National Survey on Drug Use and Health, Rockville MD 2009, and previous years; FBI, Uniform Crime Reports (2002-2008); ONDCP, Arrestee Drug Abuse Monitoring Program - ADAM II 2008 Annual Report, Washington D.C, April 2009; ONDCP, Cocaine Consumption Estimates Methodology, September 2008 (internal paper).
27 US Department of State, 2010 International Narcotics Control Strat-egy Report, March 2010.
28 The last comprehensive attempt to measure the size the US cocaine market entitled What America’s Users Spend on Illegal Drugs was pub-lished by the Office of National Drug Control Policy (ONDCP) in
calculations were extended based on more recent annual prevalence data, the figure would be 231 mt for 2008.
This simple extension, however, may not capture the strong decline in recent years. A simplified model, recently proposed by the US Government,29 results in a consumption range of 140 to 164 mt in 2008.30 A third method, suggested by a think tank, would put the figure at less than 175 mt.31
2001. The report estimated the number of chronic and occasional cocaine users, and multiplied these numbers with a per capita expen-diture estimate, derived from interviews with arrested persons who had used drugs. Based on these dollar amounts, the actual amounts consumed could be calculated.
29 The simplified ONDCP model assumes that 20% of the monthly cocaine users consume 0.5 grams of cocaine per day while the remaining 80% consume 0.5 grams per week. This gives an average consumption of 57.3 grams of cocaine per month. Non-monthly annual users are assumed to consume 4 grams of cocaine per year. In the case of crack-cocaine it is assumed that 30% of the monthly users consume 0.75 grams per day and the remaining 70% consume 0.75 grams per week. This gives, on average, 109.4 grams of crack-cocaine per year for monthly users. The annual excluding monthly users are assumed to consume 6 grams of crack-cocaine per year. (ONDCP, Cocaine Consumption Estimates Methodology, September 2008, inter-nal paper). Adding cocaine HCL and crack-cocaine consumption estimates, the model results in overall per capita consumption of 31 grams of cocaine per user in the USA in 2008.
30 The problem here is that the US household survey provides estimates on overall cocaine use (that is, cocaine HCl and crack-cocaine) and then gives an estimate on the number of crack cocaine users. Assum-ing that no crack user in the US consumes cocaine HCl, the cocaine HCl users can be ‘calculated’ by subtracting crack cocaine users from all cocaine users; assuming that all crack-cocaine users also consume cocaine HCl, the cocaine HCl figure would be identical to the overall cocaine figure. Applying the first interpretation, cocaine use would have amounted to 140 tons in 2008; applying the second interpreta-tion, cocaine use would have amounted to 164 tons in 2008.
31 Institute for Defense Analyses, History of the US cocaine market (supply and consumption), presentation given to the UNODC expert group meeting: “The evidence base for drug control in Colombia: lessons learned”, Bogota, 9-10 November 2009.
Estimates of cocaine consumption in the United States, 1988-2008Fig. 34:
Sources: Multiple sources2666
0
576
447
355
346
331
323
321
301
275
267
271
259
266
252
230
232
233
248
221
165
0
100
200
300
400
500
600
700
1988
1990
1992
1994
1996
1998
2000
2002
2004
2006
2008
Met
ric
ton
s
cocaine consumed (ONDCP estimates)
update, based on chronic use, annualprevalence and trend estimates on percapita useupdate, based on annual prevalenceand 1998 per capita use
update, based on annual and pastmonth prevalence and ONDCP model
update, based on annual and pastmonth prevalence, ONDCP model andeither crack or cocaine HCL use

76
World Drug Report 2010
There is a fourth method which makes use of new data to reclassify the users and calculate the amount of cocaine a user consumes in a year.33 Applying these figures to the 2001 model suggests a total US consumption of 165 mt in 2008.34 The four methods show a range of 140 to 231 mt, with the final method (165 mt) falling within this range of values.
32 ONDCP, What America’s Users Spend on Illegal Drugs, December 2001; Drug Availability Steering Committee, Availability Estimates in the United States, December 2002; SAMHSA, National Survey on Drug Use and Health, Rockville MD 2009, and previous years; FBI, Uniform Crime Reports (2002-2008); ONDCP, Arrestee Drug Abuse Monitoring Program - ADAM II 2008 Annual Report, Washington D.C, April 2009; ONDCP, Cocaine Consumption Estimates Method-ology, September 2008 (internal paper); Health Canada, Canadian Alcohol and Drug Use Monitoring Survey 2008 and previous years; CINADIC, Encuesta Nacional de Adicciones 2002, Ciudad Mexico, Secretaria de Desarrollo, Encuesta de Hogares, 2006; CONADIC and Instituto Nacional de Salud Pública, Encuesta Nacional de Adicciones, 2008, UNODC ARQ/DELTA.
33 For example, new data are available on the number of cocaine-depen-dent people and heavy cocaine users (using cocaine more than 100 days a year) identified in the National Household Survey on Drug Use and Health (NHSDU). There are also new data on cocaine-positive tests among arrestees, provided in the Arrestee Drug Abuse Monitoring Program (ADAM II). See ONDCP, Arrestee Drug Abuse Monitoring Program, ADAM II 2008 Annual Report, Washington D.C., April 2009. This allows an updated definition and estimate of ‘chronic use.’
34 The 31 grams of pure cocaine figure is the result of a multiplication of the number of chronic users (2.3 million) with a per capita use of 55 grams per year and a multiplication of the number of occasional users (3 million) with 14 grams per year, This yields a total at 165 tons for 5.3 million users, which gives 31 grams per user in 2008, down from 44 grams per user in 1998 and 66 grams per user in 1988. The per capita use figures were derived from the results of the ONDCP study What America’s Users Spend on Illegal Drugs, published in 2001. They found average per capita consumption for chronic users to have fallen from 141 grams in 1988 to 106 grams in 1990 and 78 grams in 1998. The model used assumed that the downward trend continued as availability of treatment facilities continued to improve (67 grams in 2007). The downward trend was assumed to have accelerated in 2008, as a result of falling purity levels (55 grams). The decline in per capita consumption for occasional users was less pronounced, from 16 grams in 1988 to 15 grams in 1998, and was thus assumed to have fallen only slightly, to 14 grams in 2008.
The simplified method proposed by the United States can also be applied to the survey data available from Canada and Mexico, producing estimates of around 17 mt of cocaine for Mexico and 14 mt for Canada in 2008. Adding this to US consumption results in a total North American cocaine consumption of some 196 mt for the year 2008.
How much cocaine must be produced to satisfy this demand? Seizures along this route are substantial, although these shipments are not pure cocaine. In order to get 196 mt to the consumer, it appears that around 309 mt of cocaine was dispatched from the Andean region destined for North America in 2008. This would represent about half of all the cocaine that leaves these countries, down from around 60% in 1998.
How much is this worth, and who derives the most money out of the supply chain? Calculating the retail value of the US market is a matter of applying the esti-mated volume consumed to the price data and adjusting for purity. The 2001 US Government calculations, adjusted to constant 2008 US dollars, show a decline of the US cocaine market from almost US$134 billion in 1988 to US$44 billion in 1998. Applying the new fig-ures, it appears this value has fallen further still, to around US$35 billion by 2008.
In other words, the retail value of the US cocaine market declined by about two thirds in the 1990s, and by about another quarter in the last decade. The reason the value did not drop even further in the last 10 years is that the real price (adjusted for purity) has gone up.35
35 The calculations were based on the available price data series, pro-vided by ONDCP, ending for the year 2007. For 2008, the purity-adjusted cocaine prices per gram, as reported by the DEA, were used. However, a comparison shows that the two price data series – though both based on STRIDE data – do not correspond, neither in absolute
Cocaine demand (consumption and seizures), North America, 1998-2008Fig. 35:
Sources: Multiple sources32
287 294 284 291 277 258 263 268 288 256 196
427 422
376 386360
378
415445
474 458
309
0
100
200
300
400
500
1998 1999 2000 2001 2002 2003 2004 2005 2006 2007 2008
Met
ric
ton
s
Purity adjusted seizures inthe Caribbean
Purity adjusted cocaineseizures in Central America
Purity adjusted seizures inNorth America
Cocaine consumption inNorth America
Supply requirements formeeting total demand forcocaine in North America

77
1. Transnational drug market analysis The global cocaine market
Applying similar methods, the 2008 value of the Cana-dian cocaine market can be estimated at around US$2.4 billion. The domestic Mexican cocaine market is worth much less, due to far lower cocaine prices: around US$300 million in 2008. Adding these values, it appears that the North American cocaine market has declined in value from US$47 billion in 1998 to US$38 billion in 2008. Between 2006 and 2008, the value of the market remained basically stable.
Using price data and volumes for the various points in
values nor in trends. While the ONDCP price data are supposed to reflect exclusively the retail level, based on the analysis of purity-adjusted prices for purchases of 2 grams or less, the DEA price data series is based on the average price for all cocaine purchases, purity-adjusted and recalculated to represent the average price of cocaine per gram. Though differences in methodology can explain differences in the level, they do not really explain differences in trends. In fact, the bulk of the DEA prices concerns the retail level and the DEA prices should thus – primarily – reflect changes in these prices as well. The differences in the two data sources is not only of academic inter-est. If the growth rates in prices, as revealed in the DEA data, were applied to the ONDCP price data set, starting as of 2007, the cal-culations suggest that the overall cocaine market would have slightly increased, from US$33.5 bn in 2006 to US$35 bn in 2008, as the strong increases in prices would have more than compensated for the declines in consumption. Given the large number of reports suggest-ing that strong price increases took place over the 2006-2008 period, the latter estimates appear to have a higher level of credibility.
36 UNODC, 2009 World Drug Report, Vienna 2009; UNODC ARQ/DELTA; ONDCP, What America’s Users Spend on Illegal Drugs, December 2001; Drug Availability Steering Committee, Availability Estimates in the United States, December 2002; SAMHSA, National Survey on Drug Use and Health, Rockville MD 2009, and previ-ous years; FBI, Uniform Crime Reports (2002-2008) and ONDCP, Arrestee Drug Abuse Monitoring Program - ADAM II 2008 Annual Report, Washington D.C, April 2009 and ONDCP, Cocaine Con-sumption Estimates Methodology, September 2008 (internal paper), Health Canada, Canadian Alcohol and Drug Use Monitoring Survey 2008 and previous years, CINADIC, Encuesta Nacional de Adicciones 2002, Ciudad Mexico, Secretaria de Desarrollo, Encuesta de Hogares, 2006, CONADIC and Instituto Nacional de Salud Pública, Encuesta Nacional de Adicciones, 2008.
the trafficking chain, the value accruing to the various market players can be estimated. One study, analysing data from the late 1990s, suggested that there are typi-cally seven layers of actors between a coca farmer in the Andean countries and the final consumer in the USA:37
The farmer sells the coca leaf (or his self-produced 1. coca paste) to a cocaine base laboratory, operated by the farmers themselves or by various criminal traffick-ing groups. Sometimes these labs have the capacity to refine the drug further into cocaine hydrochloride.
The cocaine base (or the cocaine hydrochloride) is 2. sold to a local trafficking organization which trans-ports and sells the cocaine to a transnational drug traf-ficking organization.
The drug trafficking organization contracts yet an-3. other group to do the actual shipping.
The cocaine is shipped to traffickers in Mexico.4.
The Mexican traffickers transport the drugs across the 5. US border to wholesalers.
The wholesalers sell the cocaine to local mid-level 6. dealers or street dealers across the USA. The street dealers sell the cocaine to the consumer.7.
The coca farmers in the three Andean countries earned about US$1.1 billion in 2008, down from US$1.5 bil-lion in 2007.38 Since about half of the exports go to North America, about half the farmer’s income is ulti-mately derived from the North American market. But the share of the value of that market which goes to the
37 R. Anthony and A. Fries, “Empirical modelling of narcotics traffick-ing from farm gate to street”, in UNODC, Bulletin on Narcotics, Vol. LVI. Nos. 1 and 2, 2004, Illicit Drug Markets, pp. 1-48.
38 UNODC, 2009 World Drug Report, Vienna 2009.
Cocaine production and demand for cocaine, North America, 1998-2008Fig. 36:
Sources: Multiple sources36
865
1,0241,0341,0201,048
859800
827879925
825
629
830851
806869
718681751
775857
715
294 284 291 277 258 263 268 288 256287
427 422386 360 378
445 474 458
309415376
0
200
400
600
800
1,000
1,200
1998 1999 2000 2001 2002 2003 2004 2005 2006 2007 2008
Met
ric
ton
s
Andean cocaineproduction
Cocaine available forexport and domes ticcons umptionCons umption NorthAmerica
Seizures NorthAmerica
Cocaine s eizures inCentral America andCaribbean North Americandemand
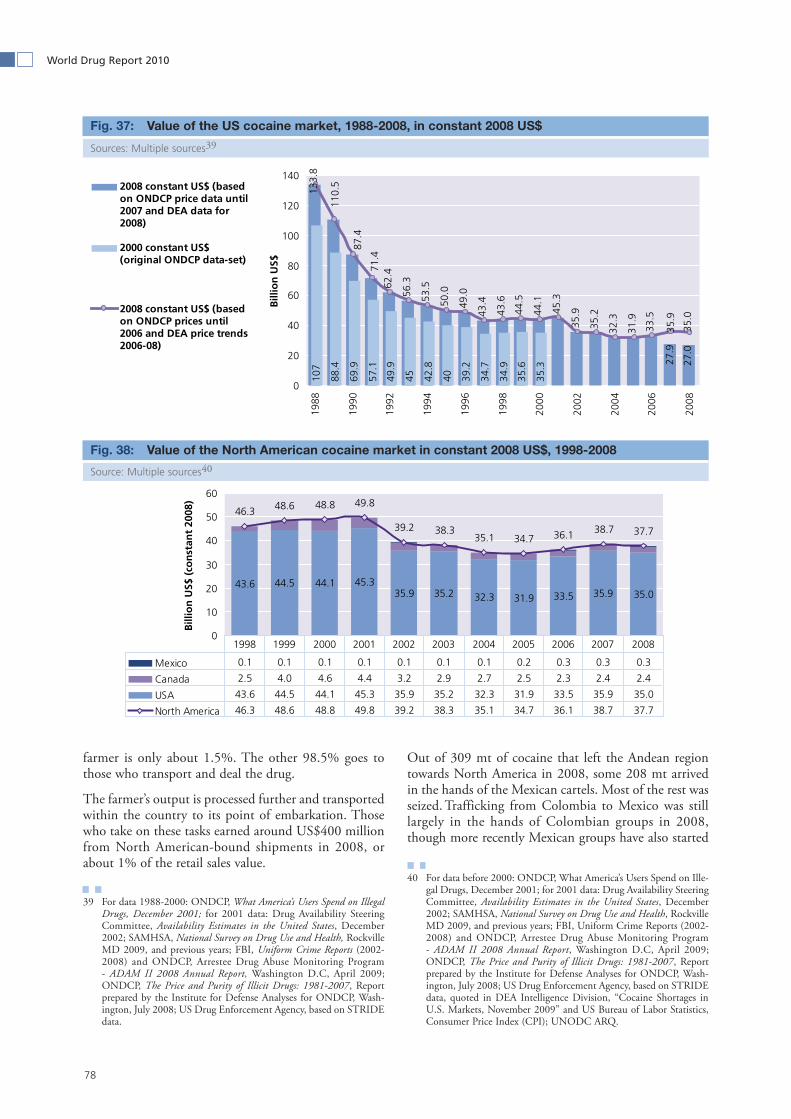
78
World Drug Report 2010
farmer is only about 1.5%. The other 98.5% goes to those who transport and deal the drug.
The farmer’s output is processed further and transported within the country to its point of embarkation. Those who take on these tasks earned around US$400 million from North American-bound shipments in 2008, or about 1% of the retail sales value.
39 For data 1988-2000: ONDCP, What America’s Users Spend on Illegal Drugs, December 2001; for 2001 data: Drug Availability Steering Committee, Availability Estimates in the United States, December 2002; SAMHSA, National Survey on Drug Use and Health, Rockville MD 2009, and previous years; FBI, Uniform Crime Reports (2002-2008) and ONDCP, Arrestee Drug Abuse Monitoring Program - ADAM II 2008 Annual Report, Washington D.C, April 2009; ONDCP, The Price and Purity of Illicit Drugs: 1981-2007, Report prepared by the Institute for Defense Analyses for ONDCP, Wash-ington, July 2008; US Drug Enforcement Agency, based on STRIDE data.
Out of 309 mt of cocaine that left the Andean region towards North America in 2008, some 208 mt arrived in the hands of the Mexican cartels. Most of the rest was seized. Trafficking from Colombia to Mexico was still largely in the hands of Colombian groups in 2008, though more recently Mexican groups have also started
40 For data before 2000: ONDCP, What America’s Users Spend on Ille-gal Drugs, December 2001; for 2001 data: Drug Availability Steering Committee, Availability Estimates in the United States, December 2002; SAMHSA, National Survey on Drug Use and Health, Rockville MD 2009, and previous years; FBI, Uniform Crime Reports (2002-2008) and ONDCP, Arrestee Drug Abuse Monitoring Program - ADAM II 2008 Annual Report, Washington D.C, April 2009; ONDCP, The Price and Purity of Illicit Drugs: 1981-2007, Report prepared by the Institute for Defense Analyses for ONDCP, Wash-ington, July 2008; US Drug Enforcement Agency, based on STRIDE data, quoted in DEA Intelligence Division, “Cocaine Shortages in U.S. Markets, November 2009” and US Bureau of Labor Statistics, Consumer Price Index (CPI); UNODC ARQ.
Value of the US cocaine market, 1988-2008, in constant 2008 US$ Fig. 37:
Sources: Multiple sources39
Value of the North American cocaine market in constant 2008 US$, 1998-2008 Fig. 38:
Source: Multiple sources40
62.4
56.3
53.5
50.0
49.0
43.4
43.6
44.5
44.1
45.3
35.9
35.2
32.3
31.9
33.5
107
88.4
69.9
57.1
49.9
45 42.8
40 39.2
34.7
34.9
35.6
35.3
133.
8
27.9
27.0
87.4
71.4
110.
5
35.9
35.0
0
20
40
60
80
100
120
140
1988
1990
1992
1994
1996
1998
2000
2002
2004
2006
2008
Bill
ion
US$
2008 constant US$ (basedon ONDCP price data until2007 and DEA data for2008)
2000 constant US$(original ONDCP data-set)
2008 constant US$ (basedon ONDCP prices until2006 and DEA price trends2006-08)
43.6 44.5 44.1 45.335.9 35.2 32.3 31.9 33.5 35.9 35.0
46.3 48.6 48.8 49.8
39.2 38.335.1 34.7 36.1 38.7 37.7
0
10
20
30
40
50
60
Bill
ion
US$
(co
nst
ant
2008
)
Mexico 0.1 0.1 0.1 0.1 0.1 0.1 0.1 0.2 0.3 0.3 0.3
Canada 2.5 4.0 4.6 4.4 3.2 2.9 2.7 2.5 2.3 2.4 2.4
USA 43.6 44.5 44.1 45.3 35.9 35.2 32.3 31.9 33.5 35.9 35.0
North America 46.3 48.6 48.8 49.8 39.2 38.3 35.1 34.7 36.1 38.7 37.7
1998 1999 2000 2001 2002 2003 2004 2005 2006 2007 2008

79
1. Transnational drug market analysis The global cocaine market
to enter this line of business. At a wholesale price of US$12,500 per kg (US$15,625 per kg if purity adjusted), the imported cocaine in Mexico was worth some US$3.3 billion in 2008. With a purchase price of just under 1 billion dollars in Colombia, the total gross profits41 accruing to those exporting the cocaine to Mexico can be estimated at around US$2.4 billion.
Shipments from Mexico into the United States are pri-marily undertaken by Mexican drug cartels. Taking domestic consumption, seizures and purity into account, Mexican cartels moved some 191 mt of pure cocaine across the border to the United States in 2008, valued at US$3 billion in Mexico. If all of this had been sold to wholesalers in the United States, it would have been worth US$6.4 billion. Border seizures reduced this value to US$5.8 billion. Deducting purchase costs, a gross profit of US$2.9 billion was generated by moving the cocaine across the border into the United States. Most of these profits were reaped by the Mexican drug cartels.
The largest profits, however, are made within the United States. The difference between the wholesale purchase price and the retail value of cocaine in the US was US$29.5 billion in 2008. Out of these gross profits, the bulk is generated between the mid-level dealers and the consumers, generating more than US$24 billion in gross profits, equivalent to 70% of total US cocaine sales. Some Mexican groups - as well as Dominican and Cuban groups - are tapping into this highly lucrative market, but most appears to go to a large number of small domestic US groups.
These figures show that US dealers as a whole make the
41 Gross profits are defined here as the difference between the sales price of the drugs and the original purchase price.
most out of the market, but there are a lot of US dealers, so individual earnings may remain relatively small. Esti-mates of the number of persons involved in cocaine trafficking in the 1990s suggested that there were some 200 cocaine wholesalers in the United States, but some 6,000 mid-level cocaine dealers.42 Beneath them, there are countless street-level dealers, many of whom are users themselves. Comparable figures are not available for the number of international traffickers, but it seems likely that, as individuals, they make more money than the thousands of dealers in the United States.
How does the market operate?
Following the dismantling of the Medellin and Cali cartels in the early 1990s, the Colombian organized crime groups got smaller, and market competition increased, pushing prices down. After the Colombian Congress amended the Constitution in 1997 to allow the extradition of citizens,43 Colombian groups were largely relegated to the front end of the market chain. Better controls, first for direct flights from Colombia to the United States (starting in the 1980s), and later improved control over shipping in the Caribbean (in the 1990s), reduced the ability of the Colombian organized crime groups to traffic cocaine directly to the United States. By 2008, Mexican organized crime groups were found in 230 US cities (up from 100 cities three years earlier) while Colombian groups controlled illicit cocaine and heroin distribution channels in only 40 cities, mostly in the north-east.
In addition, criminal groups from Caribbean countries are also involved in cocaine trafficking, notably groups with links to the Dominican Republic. Dominican groups have been identified in at least 54 US cities. They operate mainly in locations along the east coast, includ-ing Florida. In addition, US-based Cuban organized crime groups pose a threat, because of their affiliations to drug traffickers in Peru, the Bolivarian Republic of Ven-ezuela and Colombia. They are said to operate distribu-tion networks in at least 25 US cities.44
Only a quarter of those arrested for cocaine trafficking in the US are foreign, however. US citizens appear to have secured the most lucrative portion of the trafficking chain for themselves. Perhaps this is why, despite the importance of the US as a destination market, US citi-zens are rarely arrested for cocaine trafficking in the transit or production countries. Based on data from 31
42 Institute for Defense Analyses, History of the US Cocaine Market (Supply and Consumption), presentation given to the UNODC expert group meeting: “The evidence base for drug control in Colombia: lessons learned”, Bogota, 9-10 November 2009.
43 Article 35, amended in the Colombian Constitution, A.L. No. 01, 1997.
44 National Drug Intelligence Center, National Drug Threat Assessment 2009, December 2008.
Distribution of gross profits (in %) of Fig. 39: the US$ 35 billion US cocaine market, 2008
Source: Original calculations based on UNODC ARQ and Government reports
F armers in the Andean
countries ,1.5% (US $0.5 bn)
Traffickers in the Andean countries ,1%
(US $0.4 bn)
International traffickers , Colombia
to the US ,13%(US $4.6 bn)
US -wholesalers to US -mid-level dealers ,15%
(US $5.3 bn)
US -mid-level dealers to US -consumers ,
70%(US $24.2 bn)
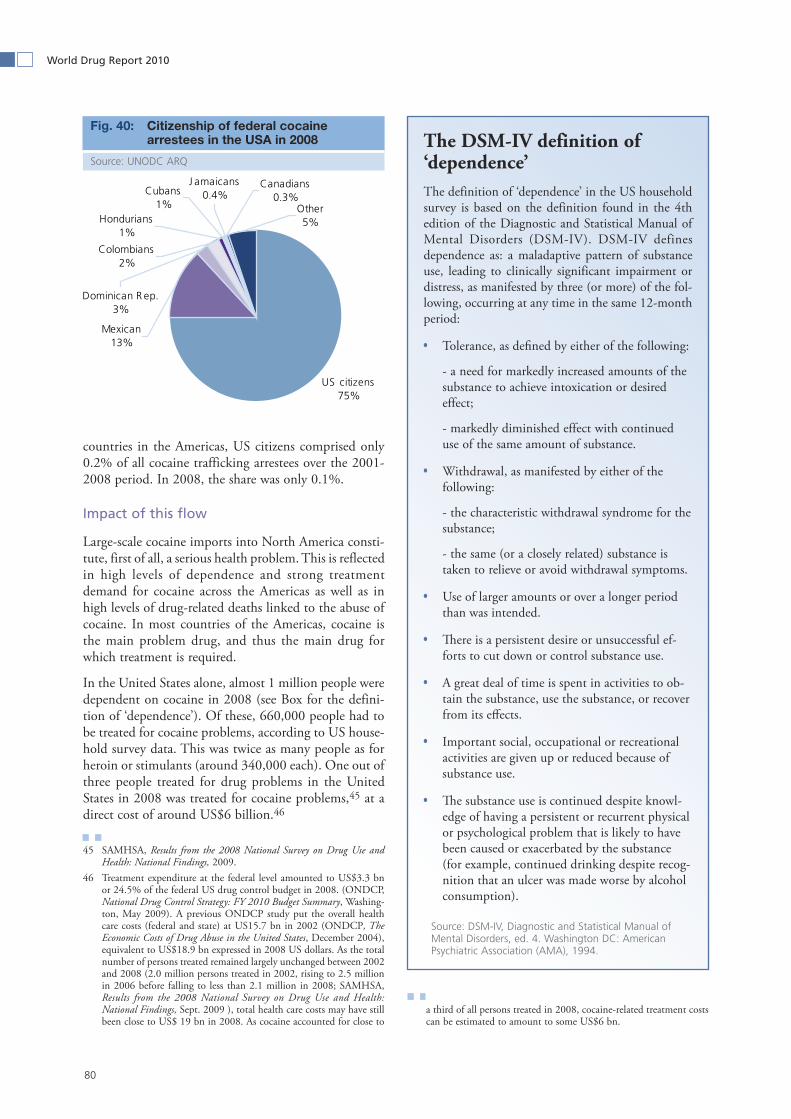
80
World Drug Report 2010
countries in the Americas, US citizens comprised only 0.2% of all cocaine trafficking arrestees over the 2001-2008 period. In 2008, the share was only 0.1%.
Impact of this flow
Large-scale cocaine imports into North America consti-tute, first of all, a serious health problem. This is reflected in high levels of dependence and strong treatment demand for cocaine across the Americas as well as in high levels of drug-related deaths linked to the abuse of cocaine. In most countries of the Americas, cocaine is the main problem drug, and thus the main drug for which treatment is required.
In the United States alone, almost 1 million people were dependent on cocaine in 2008 (see Box for the defini-tion of ‘dependence’). Of these, 660,000 people had to be treated for cocaine problems, according to US house-hold survey data. This was twice as many people as for heroin or stimulants (around 340,000 each). One out of three people treated for drug problems in the United States in 2008 was treated for cocaine problems,45 at a direct cost of around US$6 billion.46
45 SAMHSA, Results from the 2008 National Survey on Drug Use and Health: National Findings, 2009.
46 Treatment expenditure at the federal level amounted to US$3.3 bn or 24.5% of the federal US drug control budget in 2008. (ONDCP, National Drug Control Strategy: FY 2010 Budget Summary, Washing-ton, May 2009). A previous ONDCP study put the overall health care costs (federal and state) at US15.7 bn in 2002 (ONDCP, The Economic Costs of Drug Abuse in the United States, December 2004), equivalent to US$18.9 bn expressed in 2008 US dollars. As the total number of persons treated remained largely unchanged between 2002 and 2008 (2.0 million persons treated in 2002, rising to 2.5 million in 2006 before falling to less than 2.1 million in 2008; SAMHSA, Results from the 2008 National Survey on Drug Use and Health: National Findings, Sept. 2009 ), total health care costs may have still been close to US$ 19 bn in 2008. As cocaine accounted for close to
a third of all persons treated in 2008, cocaine-related treatment costs can be estimated to amount to some US$6 bn.
Citizenship of federal cocaine Fig. 40: arrestees in the USA in 2008
Source: UNODC ARQ
The DSM-IV definition of ‘dependence’The definition of ‘dependence’ in the US household survey is based on the definition found in the 4th edition of the Diagnostic and Statistical Manual of Mental Disorders (DSM-IV). DSM-IV defines dependence as: a maladaptive pattern of substance use, leading to clinically significant impairment or distress, as manifested by three (or more) of the fol-lowing, occurring at any time in the same 12-month period:
Tolerance, as defined by either of the following:
- a need for markedly increased amounts of the substance to achieve intoxication or desired effect;
- markedly diminished effect with continued use of the same amount of substance.
Withdrawal, as manifested by either of the following:
- the characteristic withdrawal syndrome for the substance;
- the same (or a closely related) substance is taken to relieve or avoid withdrawal symptoms.
Use of larger amounts or over a longer period than was intended.
There is a persistent desire or unsuccessful ef- forts to cut down or control substance use.
A great deal of time is spent in activities to ob- tain the substance, use the substance, or recover from its effects.
Important social, occupational or recreational activities are given up or reduced because of substance use.
The substance use is continued despite knowl- edge of having a persistent or recurrent physical or psychological problem that is likely to have been caused or exacerbated by the substance (for example, continued drinking despite recog-nition that an ulcer was made worse by alcohol consumption).
Source: DSM-IV, Diagnostic and Statistical Manual of Mental Disorders, ed. 4. Washington DC: American Psychiatric Association (AMA), 1994.
US citizens75%
Mexican13%
Colombians2%
Hondurians1%
Other5%
Canadians0.3%
J amaicans0.4%
Dominican R ep.3%
Cubans1%

81
1. Transnational drug market analysis The global cocaine market
Cocaine also plays a significant role in drug-related deaths. Some 31,800 people died from drug-related causes in the United States in 2007, or about 10 per 100,000 citizens.47 This is about twice the country’s murder rate. The 7,475 fatal poisonings due to cocaine in 2006 are equivalent to 2.5 deaths per 100,000 inhab-itants, or 20% of all drug-related deaths in the USA. Other studies suggest that the total proportion of ‘cocaine-related’ deaths (that is, deaths where cocaine was involved though not necessarily the only cause) is higher, at 40% of the total, equivalent to some 12,700 people in total in 2007.48 The costs of these premature cocaine deaths can be estimated at some US$13 billion, expressed in 2008 US$.49
Cocaine use is more common among arrestees than the general population. The national drug use survey indi-cated that about 1% of US men used cocaine in the previous month in 2008, but urine tests of arrestees in 10 US cities found that 28.5% of the men in custody had recently used the drug. In Chicago, the figure was 44%. The corresponding rates in the 10 US cities for opiates (7.7%) and methamphetamine (5.9%) were much lower than for cocaine.50 In line with the trends among the
47 National Vital Statistics Reports, Deaths: Preliminary Data for 2007, Vol. 58, No. 1, August 2009.
48 Ibid. 49 The overall costs related to premature deaths due to drug abuse for
US society were estimated by ONDCP at US$ 24.6 bn for the year 2002 (ONDCP, The Economic Costs of Drug Abuse in the United States, 1992-2002, Washington, November 2004), equivalent to US$ 27 bn in 2008 US dollars. As the number of drug-related premature deaths actually increased by 22% between 2002 and 2007, this figure would come close to US$33 bn, expressed in 2008 US dollars. Applying a ratio of 40% to this value (share of cocaine in all deaths in 2007), results in an estimate for cocaine-related premature death of around US$13 bn.
50 ONDCP, Arrestee Drug Abuse Monitoring Program - ADAM II, 2008 Annual Report, April 2009.
general population, however, cocaine use among arrestees has shown a clear decline in recent years.
Of course, the fact that suspected criminals use cocaine does not mean that cocaine causes their criminality. Both drug use and the likelihood of being arrested may be related to a third factor, such as social marginalization. But the same would be true for heroin or methampheta-mine, where the connection with crime is much weaker. Studies have also shown a stronger correlation between levels of cocaine use in a city and violent crime than for other drugs. Cocaine users, especially crack users, can consume an almost unlimited amount of their chosen drug, unlike heroin or methamphetamine users. Crack highs are short-lived, prompting users to find money for more by any means possible, including prostitution and violent acquisitive crime. High sales volumes have also made crack an attractive funding source for street gangs, whose wars over sales turf have been a major source of murders in the United States in the past.
This is one reason that the general decline in murders in the United States over the last two decades or so has been attributed, at least in part, to declines in cocaine use. Other crime rates have also fallen in the same period. According to national surveys, the share of people who used cocaine in the previous month fell by 56% between 1988 and 2008. Between 1990 and 2008, the murder rate fell by 43%. During the same period, the US prop-erty crime rate fell by 29% and the violent crime rate by 34%.51 There are also clear links between cocaine and violence in the production and transit countries.
51 US Department of Justice, Federal Bureau of Investigation (FBI), Crime in the United States, Preliminary Semiannual Uniform Crime Report, January to June, December 2009.
Drug related deaths – by drug Fig. 41: category – across 40 US metropolitan areas, 2007
Source: SAMHSA, Drug Abuse Warning Network, 2007: Area Profiles of Drug Related Mortality, 2009
Cocaine use among male arrestees in Fig. 42: 10 US cities* and past month preva-lence of cocaine use among males in the general US population, 2000-2008
* Unweighted average of results obtained from Atlanta, Charlotte, Chicago, Denver, Indianapolis, Minneapolis, New York, Portland, Sacra-mento and Washington DC. Source: Office of National Drug Control Policy 2009
7.6%
9.5%
15.7%
19.8%
40.1%
67.6%Heroin 13.1%
0% 20% 40% 60% 80% 100%
Stimulants
Sedatives,hypnotics &
anxiolytics
Antidepressants
Benzodiazepines
Cocaine
Opiates
34.131.5
33.5 34.732.5
1.2 1.3 1.4 1.2 1.0
28.5
0
10
20
30
40
2000 2001 2002 2003 2006 2007 2008Pe
rcen
t o
f m
ales
Males arres ted* Males age 12+Trend
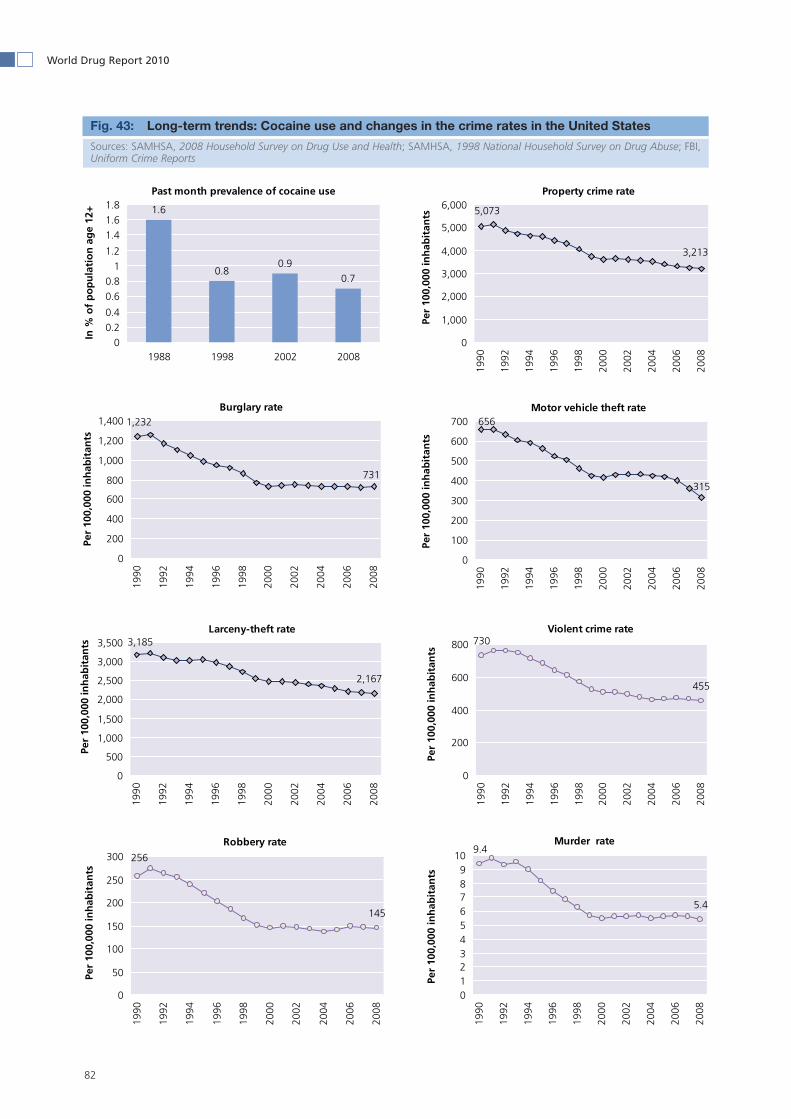
82
World Drug Report 2010
Long-term trends: Cocaine use and changes in the crime rates in the United States Fig. 43:
Sources: SAMHSA, 2008 Household Survey on Drug Use and Health; SAMHSA, 1998 National Household Survey on Drug Abuse; FBI, Uniform Crime Reports
Past month prevalence of cocaine use
1.6
0.80.9
0.7
0
0.2
0.4
0.6
0.8
1
1.2
1.4
1.6
1.8
1988 1998 2002 2008
In %
of
po
pu
lati
on
ag
e 12
+
Property crime rate
3,213
5,073
0
1,000
2,000
3,000
4,000
5,000
6,000
1990
1992
1994
1996
1998
2000
2002
2004
2006
2008
Per
100,
000
inh
abit
ants
Burglary rate
731
1,232
0
200
400
600
800
1,000
1,200
1,400
1990
1992
1994
1996
1998
2000
2002
2004
2006
2008
Per
100,
000
inh
abit
ants
Motor vehicle theft rate
315
656
0
100
200
300
400
500
600
700
1990
1992
1994
1996
1998
2000
2002
2004
2006
2008
Per
100,
000
inh
abit
ants
Larceny-theft rate
2,167
3,185
0
500
1,000
1,500
2,000
2,500
3,000
3,500
1990
1992
1994
1996
1998
2000
2002
2004
2006
2008
Per
100,
000
inh
abit
ants
Violent crime rate
455
730
0
200
400
600
800
1990
1992
1994
1996
1998
2000
2002
2004
2006
2008
Per
100,
000
inh
abit
ants
Robbery rate
145
256
0
50
100
150
200
250
300
1990
1992
1994
1996
1998
2000
2002
2004
2006
2008
Per
100,
000
inh
abit
ants
Murder rate
5.4
9.4
0123456789
10
1990
1992
1994
1996
1998
2000
2002
2004
2006
2008
Per
100,
000
inh
abit
ants

83
1. Transnational drug market analysis The global cocaine market
Cocaine from the Andean Region 1.3.3 to Europe
The world’s second largest flow of cocaine is directed towards Europe. The 27 countries of the European Union (EU) and the four countries of the European Free Trade Association (EFTA) host some 90% of Europe’s 4.5 million cocaine users. The single largest cocaine market within Europe is the United Kingdom, followed by Spain, Italy, Germany and France.
In contrast to the shrinking cocaine market in North America, the number of cocaine users in the EU/EFTA countries has doubled over the last decade, from 2 mil-
lion in 1998 to 4.1 million in 2007/2008. Recent data suggest, however, that the rapid growth of the European cocaine market is beginning to level off. The annual cocaine prevalence rate in the EU/EFTA region (1.2% of the population aged 15-64) is still far lower than in North America (2.1%), though individual countries, notably Spain (3.1% in 2007/2008) and the United Kingdom (3.7% in Scotland; 3.0% in England and Wales in 2008/2009), already have higher annual preva-lence rates than the United States (2.6% in 2008).
Routes and volumes
Trafficking of cocaine to Europe is mainly by sea (often in container shipments), although deliveries by air and by postal services also occur. The World Customs Organization reported that 69% of the total volume of cocaine seized by customs authorities en route to West Europe was detected on board boats or vessels, con-cealed in freight or in the vessels’ structure.52 Though recent years have seen a proliferation of entry points, including some in the Balkan region, most of the cocaine entering Europe does so through one of two hubs: Spain and Portugal in the south, or Netherlands and Belgium in the north. The Iberian peninsula is close to Latin America both geographically and culturally, and the Low Countries host the largest ports in Europe. Between them, Spain, Portugal, the Netherlands and Belgium accounted for close to 70% of all cocaine seized in Europe in 2008, though just a quarter of the ‘European cocaine’ was consumed in these countries.53
Despite the growth of Peruvian and Bolivian production capacity, the main source of the cocaine found in Europe
52 World Customs Organization, Customs and Drugs Report 2008, Brus-sels, June 2009.
53 EMCDDA/Europol, Cocaine: A European Union perspective in the global context, April 2010.
National shares of the cocaine user Fig. 44: population in Europe in 2007/08
UNODC ARQ; Government reports; UNODC, World Drug Report 2009; EMCDDA, Statistical Bulletin 2009
EFTA countries, 2%
Other European countries, 8%
UK, 23%
Spain, 21%
Italy, 19%
Germany, 9%
France, 5%
Other EU countries, 13%
0.6% 0.7%0.8% 0.9% 0.9% 1.0% 1.1% 1.1% 1.2% 1.2% 1.2%
0.0%
0.2%
0.4%
0.6%
0.8%
1.0%
1.2%
1.4%
1.6%
An
nu
al p
reva
len
ce
in %
of
po
pu
atio
n a
ge
15-6
5
EU and EFTA 0.6% 0.7% 0.8% 0.9% 0.9% 1.0% 1.1% 1.1% 1.2% 1.2% 1.2%
EU-27 0.6% 0.7% 0.8% 0.9% 0.9% 1.0% 1.1% 1.1% 1.2% 1.2% 1.2%
EU-15 0.8% 0.8% 1.0% 1.1% 1.1% 1.2% 1.3% 1.4% 1.5% 1.5% 1.5%
1998 1999 2000 2001 2002 2003 2004 2005 2006 2007 2008
Annual prevalence of cocaine use in the EU and EFTA countries, 1998-2008Fig. 45:
Sources: UNODC ARQ; Government reports; UNODC, World Drug Report 2009; EMCDDA, Statistical Bulletin 2009

84
World Drug Report 2010
in still Colombia. Individual drug seizures reported by Spain suggest, for instance, that 81% of the cocaine originated in Colombia and its neighbouring countries (the Bolivarian Republic of Venezuela, Ecuador and Panama) in 2008. Nonetheless, shipments from Peru and the Plurinational State of Bolivia are more common for Europe than for the United States, and the relative importance of Colombia is declining. For 2002, the UK authorities reported that 90% of the cocaine seized there originated in Colombia; by 2008, the figure fell to 65%. For some of the smaller European markets, Peru and the Plurinational State of Bolivia seem to be the primary sources of cocaine already.There have also been changes in the routes. Shipments to Europe, particularly large maritime shipments, have been increasingly transiting the Bolivarian Republic of Venezuela in recent years.54 In fact, for cocaine seized since 2004 where the origin could be determined, 41% have been traced back to the Bolivarian Republic of Venezuela.55 According to the new Maritime Analysis Operation Centre (MAOC-N), more than half (51%) of all intercepted shipments in the Atlantic over the 2006-2008 period started their journey in the Bolivarian Republic of Venezuela. Direct ship-ments from Colombia accounted for just 5% of the total.56
Sailing vessels, mostly travelling from the Caribbean to Europe, emerged in recent years as the most common source for seizures (43% of all seizure cases according to MAOC-N data), followed by freight vessels (39%) and other motor vessels (12%).57 Semi-submersibles, in contrast, do not play any significant role for traffick-ing cocaine from South America to Europe. Only one has been sighted so far, in Galicia, northern Spain in 2006.58
There are also ongoing cocaine shipments by air from various South American countries (Brazil, Argentina, Uruguay et cetera), Caribbean countries (Netherlands Antilles, Dominican Republic, Jamaica et cetera) and Central American countries (including Costa Rica) to destinations in Europe.
In addition, shipments to Africa, mostly West Africa, gained in importance between 2004 and 2007, resulting in the emergence of two key trans-shipment hubs: one centered on Guinea-Bissau and Guinea, stretching to Cape Verde, Gambia and Senegal, and one centered in the Bight of Benin, which spans from Ghana to Nigeria. Colombian traffickers often transport the cocaine by ‘mother ships’ towards the West African coast before
54 Ibid.55 UNODC, Individual Drug Seizures database. 56 Maritime Analysis Operation Centre (MAOC(N), Statistical Analysis
Report, Lisbon 2009.57 Ibid.58 MAOC-N, Semi-Submersible Briefing Paper, Lisbon 2008.
offloading it to smaller vessels. Some of it proceeds onward by sea to Spain and Portugal while some is left as payment to West Africans for their assistance – as much as 30% of the shipment.59 The West Africans then traffic this on their own behalf, often by commer-cial air couriers. Shipments are also sent in modified small aircraft from the Bolivarian Republic of Venezuela or Brazil to various West African destinations.60 Increased awareness, interdiction and political turmoil in the northern hub seem to have reduced the traffic through this region in 2008 and 2009, although it could quickly re-emerge. The decline in trafficking, affecting in par-ticular Lusophone Africa, may also be a reason why Portugal experienced a sharp fall in cocaine seizures between 2006 and 2008, following a massive upward trend over the 2003-2006 period.
European cocaine seizures as a whole increased strongly over the 1998-2006 period, from 32 to 121 mt, before declining again over the 2006-2008 period to some 63 mt. Nonetheless, overall cocaine seizures in 2008 were almost twice as high as in 1998.
The largest interceptions were reported by Spain, account-ing for 45% of all European cocaine seizures in 2008 as well as over the 1998-2008 period. The Spanish figures reflect both the strong increase and the recent decline in cocaine seizures in Europe. The trends are also confirmed in survey data on perceived cocaine availability in Spain.61
59 Serious Organized Crime Agency (SOCA), The United Kingdom Threat Assessment of Organised Crime, 2009/10, London, 2009.
60 UK Home Affairs Committee, The Cocaine Trade (see: http://www.publications.parl iament.uk/pa/cm200910/cmselect/cmhaff/74/7410.htm); SOCA, UK Threat Assessment of Organised Crime 2009/10.
61 Ministerio de Sanidad y Consumo, 2008 National Report to the EMCDDA by the Reitox National Focal Point, ‘Spain’ New Develop-ment, Trends and in-depth information on selected issues, Madrid,
Departure locations of identified drug Fig. 46: trafficking shipments by sea from South America to Europe, 2006-2008
Source: Maritime Analysis Operation Centre
Venezuela51%
Brazil10%
Other12%
West Africa11%
Caribbean11%
Colombia5%

85
1. Transnational drug market analysis The global cocaine market
Spanish cocaine seizures primarily take place in inter-national waters (two thirds of the total in 2007) and about one tenth are made from containers. A much smaller share is seized close to the country’s beaches (2%), while airports account for just 6%.62
Portuguese seizures basically mirror the patterns seen in Spain, showing increases until 2006 and declines there-after (from 34 mt in 2006 to 5 mt in 2008). The changes have been even more pronounced in Portugal, reflecting the strong links with trafficking via West Africa (via Guinea-Bissau and Cape Verde).
Dutch cocaine seizures have also sharply fallen in recent years. This is a result of the ‘100% control’ policy in the Antilles and at Schiphol airport (Amsterdam), which reduced the number of drug couriers from the Carib-bean and various South American countries,63 improved container controls as well as growing efforts to stop ship-ments before they arrive in the Netherlands. For exam-ple, in 2008, the National Crime Squad arrested several men planning to ship 2.6 mt of cocaine from a ware-house in Sao Paulo, Brazil, to the Netherlands. Large amounts of cocaine continue to be seized by the coast-guards of the Dutch Antilles and Aruba. Out of 6.8 mt seized in 2008, 4.2 mt were taken by the Dutch navy from a cargo vessel sailing under a Panamanian flag from the Bolivarian Republic of Venezuela to Europe. An additional factor may be diversions to the port of Ant-werp (Belgium).
2008.62 Ministerio del Interior, Secretaria de Estado de Seguaridad, Centro
de Inteligencia contra el Crimen Organizado, Hashish and Cocaine in Europe, presentation given to UNODC, Vienna, July 2008.
63 US Department of State, International Narcotics Control Strategy Report, March 2009.
In 2008, for the first time, France seized more cocaine than any other European country besides Spain. Most of this cocaine (6 out of 8.2 mt) was seized at sea, mainly close to the French overseas territories in the Caribbean or close to the West African coast. Cocaine seizures that could be traced back to the West African countries themselves, however, amounted to just 0.3 mt in 2008. Most of the French-seized cocaine in 2008, came from Brazil (40% of the total) or the Bolivarian Republic of Venezuela (21% of total). Cocaine trafficked from Brazil most likely originated in Peru or the Plurinational State of Bolivia, reflecting the growing importance of these producers to Europe.64
As in the US market, estimating the volume of cocaine consumed in Europe is complicated. There are good survey data on the share of the population that uses cocaine, but less information on how much they use. The subsequent analysis is based on four different esti-mation methods,65 resulting in average consumption
64 Direction Générale de la Police Nationale, Direction Générale de la Police Judiciare, Office Central pour la Répression du Trafic Illicite des Stupéfiants (O.C.R.T.I.S.), Usage et Trafic des Produits Stupéfiants en France en 2008, Paris, 2009.
65 These techniques are detailed in the following documents: United States Office of National Drug Control Policy, Cocaine Consump-tion Estimates Methodology, September 2008 (internal paper); Home Office, Sizing the UK market for illicit drugs, London 2001; Home Office, Measuring different aspects of problem drug use: methodologi-cal developments, Home Office Online Report 16/06, London 2006; UNODC, 2005 World Drug Report, Volume 1: Analysis, Vienna 2005; European Centre for Social Welfare Policy, Two Worlds of Drug Consumption in Late Modern Societies, Vienna 2009. While the first model, developed by ONDCP, seems reasonable, it is based on assumptions, not on actual empirical data from European countries. The second model is based on empirical data, but they refer to the situation in one country (UK) which is not necessarily representative for the rest of Europe. The third model refers to cocaine use in West and Central Europe, but it is again derived from a number of under-lying assumptions (such as effectiveness of law enforcement interven-
European cocaine seizures (mt; not adjusted for purity), 1998-2008Fig. 47:
*No data for 2008 received for Poland, Scotland, Ukraine and Belarus – assumed unchanged levels of seizures. Source: UNODC ARQ/DELTA
12 186
3418
4933
48 5038
28
3444
59
107
121
63
29
73
8879
47
0
20
40
60
80
100
120
140
1998 1999 2000 2001 2002 2003 2004 2005 2006 2007 2008*
Met
ric
ton
s
Other
Germany
Ireland
UK
Italy
France
Belgium
Netherlands
Portugal
Spain
Trend

86
World Drug Report 2010
rates of between 25 to 35 grams of pure cocaine per user. Multiplied by the number of users, this suggests con-sumption of some 101 to 144 mt for the EU and EFTA countries in 2008. The average is 124 mt, about double the figure a decade before.66
67
In line with the increases in the volumes of cocaine traf-ficked into Europe since the early 1990s, prices declined. Expressed in constant 2008 euros,68 cocaine retail prices, at street purity, fell from an average of €143 in 1990 to €70 per gram in 2008, essentially halving in two dec-
tions and importance of regional proximity). The fourth model is based on empirical data from six cities in Europe, but applying the use rate found among marginalized users to all past month users is likely to result in an over-estimate. At the same time, a basic problem of household surveys, based on self-reports, is that they are – most likely – showing a substantial under-estimate of the extent of drug use. It remains difficult to judge to what extent these errors offset each other in the final calculation of the amounts consumed.
66 UNODC ARQ; UNODC, 2009 World Drug Report, Vienna 2009; EMCDDA, Statistical Bulletin 2009, Lisbon 2009; United Nations, Department of Economic and Social Affairs, Population Division, World Population Prospects: The 2008 Revision, 2009; European Centre for Social Welfare Policy, Two Worlds of Drug Consumption in Late Modern Societies, Vienna 2009; ONDCP, Cocaine Consump-tion Estimates Methodology, September 2008 (internal paper); Home Office, Sizing the UK market for illicit drugs, London 2001; Home Office, Measuring different aspects of problem drug use: methodological developments, Home Office Online Report 16/06, London 2006; UNODC, 2005 World Drug Report, Volume 1: Analysis, Vienna 2005.
67 Available data suggest that the European cocaine market doubled in volume terms over the 1998-2006 period, before stabilizing over the 2006-08 period. The calculation is based on the assumption of largely stable per capita use levels. Given the lack of reliable quantitative or qualitative information, the calculations do not allow for the possibil-ity that per capita use levels increased over the 1998-2006 period due to the progression from casual to problematic use, and that they may have fallen in terms of pure cocaine equivalents after 2006 as purity declined while use may have remained stable in terms of the amounts of street level cocaine consumed.
68 Current euro values were transformed into constant euros by apply-ing the consumer price index for the euro zone.
ades. To understand the relative attractiveness of this market, however, it helps to look at these figures in con-stant 2008 US dollars.69 Here, too, cocaine prices declined over the 1990-2000 period, but they increased over the 2000-2008 period, from US$88 to US$102, as the US dollar depreciated against the euro. The increase was most acute over the 2006-2008 period.
These euro price declines took place in the context of declining purity, however.70 Taking purity into account, retail cocaine prices expressed in constant 2008 euros remained basically stable between 1998 and 2008: €183 per pure gram in 1998 and €189 per pure gram in 2008. The same was true of wholesale prices. Expressed in constant US dollars, the purity-adjusted price actually increased significantly. The euro, particularly the high-value 500 euro note, has become an important second-ary currency for drug traffickers.
If the amounts of cocaine consumed are multiplied by
69 Current US dollar values were transformed into constant US dollar values by applying the US consumer price index.
70 The unweighted averages of reported purities for countries in West and Central Europe show a decline at the retail level from 59% in 1998 (range: 25% - 75%) to 47% in 2005 and 36% in 2008 (range: 16% - 52%). At the wholesale level the decline was from 78% (range: 55% -90%) in 1998 to 55% in 2008 (range: 26% - 80%).
As some of the decline could have been simply the result of specific countries reporting in one year, and not in another, a modified cal-culation model was introduced. This model assumes that the results of non-reporting countries remained basically unchanged from the previous year (or a later year) for which data are available. This was done to avoid changes in the overall average due to the reporting or non-reporting of countries in specific years. Using this approach for missing data, changes in the overall average only reflect actual changes in country-specific purity data. Based on this model, the average cocaine purities at the retail level in West and Central Europe declined from 55% in 1998 to 43% in 2005 and 37% in 2008. The wholesale purities declined according to this model from 72% in 1998 to 60% in 2005 and 56% in 2008.
Amounts of (pure) cocaine consumed in the EU/EFTA countries, 1998-2008Fig. 48:
Sources: Multiple sources66
101
58
144
112
50
108
139
145
75
101
114 119126 127 124
9892
82
6863
0
20
40
60
80
100
120
140
160
1998 1999 2000 2001 2002 2003 2004 2005 2006 2007 2008
Met
ric
ton
s
Average of all estimates
Estimate based on annual andmonthly prevalence and multicitystudy per capita estimates
Estimate based on annualprevalence and UK per capitaestimates
Estimate based on annualprevalence and 2005 WDR percapita estimates
Estimate based on annual andpast month prevalence (ONDCPmodel)

87
1. Transnational drug market analysis The global cocaine market
the purity-adjusted retail prices, it appears that the value of the European cocaine market has more than doubled in the last decade (from US$14 billion in 1998 to US$34 billion in 2008). In 2008, it was worth almost as much as the US market (US$35 billion), even though it was still significantly smaller in terms of volume.
How much cocaine must be shipped to satisfy this grow-ing demand? Taking seizures into account,71 some 212 mt would have to have left South America to the Euro-
71 Based on the Annual Reports Questionnaire Data, about 55% of the seizures made in the Caribbean and 61% of the seizures made in South America excluding the Andean countries were linked to ship-ments towards Europe in 2008, up from 47% and 46% respectively in 2002. For seizures made in Africa it was assumed that the bulk of them was linked to shipments towards Europe.
pean market in 2008.72 The growth of the European market has meant that a growing share of the total cocaine production needs to be funneled toward the EU/EFTA countries, increasing from 13% in 1998 to 25% of total production in 2008.
Where does the money go? Out of European cocaine sales, less than 1% goes to the Andean coca farmers. Another 1% goes to the processors and traffickers within the Andean region. About 25% of the final sales value accrues to the international traffickers who ship the cocaine from the Andean region to the main entry points. Shipping the cocaine from the entry points to the wholesalers in the final destination countries across
72 Range: 189–232 tons.
Cocaine prices (not adjusted for purity) in West Europe* in constant currency units Fig. 49: per gram, 1990-2008
* Average price of 18 West European countries (accounting for the bulk of cocaine consumption in Europe), weighted by population size.
Sources: UNODC, World Drug Report 2009 (and previous years) and ARQ
Purity-adjusted cocaine prices in West Europe, in constant currency units, per gram, Fig. 50: 1998-2008
Sources: UNODC, World Drug Report 2009 (and previous years) and ARQ
0
50
100
150
200
250
300
1998 2000 2002 2004 2006 2008Pric
e p
er g
ram
in c
on
stan
t 20
08 c
urr
ency
u
nit
s
Inflation and purityadjus ted retail price in2008 US$
Inflation and purityadjus ted retail price in2008 Euro
Inflation and purityadjus ted wholes aleprice in 2008 US$
Inflation and purityadjus ted wholes aleprice in 2008 Euro
0
50
100
150
200
1990
1992
1994
1996
1998
2000
2002
2004
2006
2008Pr
ice
per
gra
m in
co
nst
ant
2008
cu
rren
cy
un
its
Inflation adjus tedretail price in 2008 US-$
Inflation adjus tedretail price in 2008Euro
Inflation adjus tedwholes ale price in2008 US$
Inflation adjus tedwholes ale price in2008 Euro

88
World Drug Report 2010
Europe generates a further 17% of the retail value. More than half (56%) of the value is, however, made within the destination countries, between the wholesalers and the consumers. As there are far more dealers at the national level, the per capita income of the dealers at the national level is (like in North America) likely lower than among the smaller group of international cocaine traffickers.
73 UNODC, Annual Reports Questionnaire Data; Government reports; UNODC, 2009 World Drug Report, Vienna 2009; EMCDDA, Sta-tistical Bulletin 2009, Lisbon 2009; United Nations, Department of Economic and Social Affairs, Population Division. World Popula-tion Prospects: The 2008 Revision, 2009; Home Office, Sizing the UK market for illicit drugs, London 2001, Home Office, Measuring different aspects of problem drug use: methodological developments, Home Office Online Report 16/06, London 2006; European Centre for Social Welfare Policy, Two Worlds of Drug Consumption in Late Modern Societies, Vienna 2009; UNODC, 2005 World Drug Report, Volume 1: Analysis, Vienna 2005.
How does the market operate?
Trafficking of cocaine to Europe is, to a significant extent, organized by Colombian organized crime groups that forge alliances with various criminal groups operat-ing in Europe, notably with groups in Spain, Italy and the Netherlands. In most European countries, the major-ity of those arrested for drug trafficking are local citi-zens, but the Colombian groups act as importers and, to a lesser extent, as wholesalers. Their involvement in retail markets is limited to Spain. Between 21% and 26% of all foreigners arrested for cocaine trafficking in Spain over the 2004-2007 period were Colombian nationals. The proportion rose to 29%, or nearly 1,000 individuals, in 2008.
In addition, groups from the Caribbean region play a role, including Dominicans in Spain, Jamaicans in the United Kingdom and Antilleans in the Netherlands. Other South Americans are also prominent, especially on the Iberian peninsula. In a number of countries in continental Europe, West Africans are active as retailers (as well as small-scale importers), including in France, Switzerland, Austria, Italy, Germany and Portugal.
The largest proportion of non-Portuguese cocaine traf-fickers arrested in Portugal in 2008 were from Cape Verde (27%) and Guinea-Bissau (19%).
North Africans are prominent in several countries with a Mediterranean coastline or a large North African diaspora, including Spain, Italy, France and the Nether-lands. A few groups from the Balkan region have also emerged as players in the international cocaine trade in recent years. In contrast, there is little concrete evidence so far to suggest that the Mexican drug cartels are play-ing a major role in Europe.
Size of the EU/EFTA cocaine market in billions of constant 2008 US$Fig. 51:
Sources: UNODC ARQ; Government reports; UNODC, World Drug Report 2009; EMCDDA, Statistical Bulletin 2009; European Centre for Social Welfare Policy, Two Worlds of Drug Consumption in Late Modern Societies
’Value-added’ of cocaine sales among Fig. 52: the EU/EFTA countries in 2008, billion US$
Sources: Multiple sources73
12.4 12.3
15.5 15.818.4
22.4 22.4 23.425.4
16.5 16.4
20.4 20.5
24.5
29.7 29.931.1
34.738.0
13.8 14.2 14.1
17.5 17.5
21.3
25.726.0 27.0
30.8
33.8
12.7
27.5
16.4
0
5
10
15
20
25
30
35
40
1998 1999 2000 2001 2002 2003 2004 2005 2006 2007 2008
Bill
ion
co
nst
ant
2008
US$
Cocaine sales in bn US$('best estimate')
Cocaine sales in bn US$based on ONDCP model
Cocaine sales in bn US$ based on multicity studyresults
Wholesale to end-users in
EU-EFTA,US$19.2 bn, 56%
Traffickers from point of entry into Europe to rest of EU/EFTA,US$5.8 bn,
17%
International traffickers: from Andean countries
to point of entry in Europe,US$8.3 bn,
25%
Andean farmers, US$0.3 bn,1%
Traffickers in Andean countries,
US$0.2 bn,1%

89
1. Transnational drug market analysis The global cocaine market
In the Netherlands, criminal groups from the ‘Dutch Caribbean’ (Aruba, Netherlands Antilles and Suriname) have long been active alongside Colombians.74 In recent years, Nigerian groups expanded in Amsterdam, work-ing inter alia through air couriers flying to the Nether-lands from the Netherlands Antilles and Suriname. As controls improved on direct flights, they also started to use other transit countries such as the Dominican Republic, Peru and Mexico.75 Some of the traffic has also been displaced to Antwerp (Belgium), following improved controls in the port of Rotterdam (Nether-lands). This traffic is still largely controlled by Colom-
74 Damian Zaitch, Trafficking Cocaine – Colombian Drug Entrepreneurs in the Netherlands (Studies of Organized Crime), The Hague 2002.
75 US Department of State, International Narcotics Control Strategy Report, March 2009.
bian groups,76 though Albanian groups, working at the port facilities, also seem to play a role in Antwerp.
Most of the cocaine needed to supply the United King-dom, Europe’s largest cocaine market, transits another European country, rather than being shipped directly. Bulk maritime shipments on merchant vessels or yachts from ports in Colombia or the Bolivarian Republic of Venezuela cross the Atlantic to the Iberian Peninsula. There, the cocaine is sold to local British criminals, who then smuggle it to the United Kingdom. To a lesser extent, cocaine is also imported by British criminals from the Netherlands. Thus, some 75% of the cocaine destined for the UK market is estimated to have been carried across the Channel, concealed in trucks, private cars or by human couriers (‘mules’).
76 Ibid.
Nationality of persons arrested in Spain for trafficking cocaine into or within the country, Fig. 53: 2008
Source: UNODC ARQ
Nationality of persons arrested in Portugal for trafficking cocaine into or within the country, Fig. 54: 2008
Source: UNODC ARQ
Angola, 4, 1%
Germany, 6, 1%
Foreigners, 290, 50% Brazil, 27, 5%
Spain, 40, 7%
Guinea-Bissau, 54, 9%
Cape Verde, 79, 14%
Portugal, 287, 50%
Other, 80, 14%
Colombia, 970, 11%
Ecuador, 113, 1%
Romania, 110, 1%
France, 26, 0.3%
UK, 37, 0.4%
Dominican Rep., 249, 3%
Foreigners, 3,324, 39%
Other, 1,308, 16%
Spain, 5,259, 61%
Portugal, 72, 1%
Morocco, 288, 3%
Nigeria, 151, 2%

90
World Drug Report 2010
In Italy, Colombian, Dominican and other Latin Amer-ican organizations are working with Italian organized crime groups (notably the ‘Ndrangheta) to import cocaine in commercial cargo or containerized ship -ments.77
78 Italy is also one of the few European countries where close links between organized Mexican groups (the Gulf Cartel) and local organized crime groups have been confirmed.79 As of 2007, the Camorra, located in
77 Sample of arrested cocaine traffickers (n = 442) for which nationality was identified; number of all arrested cocaine traffickers in France in 2006: N = 2,561.
78 Presidenza del Consiglio dei Ministri, Dipartimento Politiche Anti-droga, Relazione Annuale Al Parlamento Sullo Stato Delle Tossicodipen-denze in Italia 2008, Rome 2009.
79 US Department of State, op cit.
Naples, was reported to have begun trafficking cocaine to Italy from Spain, as well as directly from South Amer-ica. More recently, the Sicilian mafia has also become involved, getting support from the ‘Ndrangheta and the Camorra to bring cocaine into the areas it controls.80 West African and North African groups are active in retailing and small-scale import, as well as groups from the Balkans, in particular Albanians and Serbians. Sev-eral West African and Albanian groups import the cocaine from the Netherlands to northern Italy.81
The French cocaine market used to be rather small,
80 Presidenza del Consiglio dei Ministri, op cit..81 US Department of State, op cit.
Nationality of traffickers arrested in Italy for trafficking cocaine into or within the country, Fig. 55: 2008
Source: UNODC ARQ
Nationality of traffickers arrested in France for trafficking cocaine into or within the country, Fig. 56: 200677
Source: UNODC ARQ
Italy, 8,109, 62%
Foreigners 5,034, 38%
Other, 1,133, 9%
Morocco, 1,532, 11%
Albania, 1,137, 9%
Gambia, 134, 1%
Spain, 44, 0.3%
Algeria, 88, 1%
Tunisia, 399, 3%
Nigeria, 380, 3%
Egypt, 89, 1%
Romania, 98, 1%
Tunisia, 2, 0%
DR Congo, 2, 0%
Algeria, 4, 1%
France, 234, 53%
Nigeria, 70, 16%
Netherlands, 55, 12%
Italy, 31, 7%
Spain, 21, 5%
Morocco, 18, 4%
Portugal, 5, 1%
Foreigners, 208, 47%

91
1. Transnational drug market analysis The global cocaine market
though this has started to change in recent years, partly due to the growing importance of Africa as a transit loca-tion. When West Africa became a more prominent tran-sit area after 2004, West African traffickers also became more prominent. In 2008, cocaine traffickers from Togo, Benin, Ghana, Nigeria, Senegal and the Democratic Republic of the Congo were arrested. North African and European traffickers have also been arrested.82
The bulk of cocaine traffickers in Germany were not born in Germany.83 The largest group of foreign traf-
82 UNODC ARQ, 2002-2008. 83 Bundeskriminalamt, Polizeiliche Kriminalstatistik 2008, Wiesbaden
2009; Bundeskriminalamt, Organisierte Kriminalität, Bundeslagebild 2008, Wiesbaden 2009.
fickers in Germany were Turkish (22% of all foreign cocaine traffickers in 2008). This is a recent develop-ment: Turkish traffickers have traditionally been associ-ated with heroin. The second largest foreign group detected are traffickers from Italy (7%), often associated with the ‘Ndrangheta and other Italian mafia groups. Various groups from the Middle East (Lebanon and Morocco: 5%) and from West Africa (Sierra Leone, Nigeria and Guinea: 4%) were also prominent.84 Those arrested for ‘cocaine imports’ comprise a smaller and more varied group, with the top foreign nationalities being Dutch (13%) and Turkish (10%, typically acquir-
84 Bundeskriminalamt, Organisierte Kriminalität, Bundeslagebild 2008, Wiesbaden 2009.
Germany, 225, 37%
Foreigners 380, 63%
Albania, 10, 2%
Poland, 11, 2%
Morocco, 12, 2%
Jamaica, 11, 2%
Italy, 26, 4%
Nigeria, 30, 5%
Turkey, 37, 6%
Netherlands, 48, 8%
Other, 195, 32%
Nationality of those arrested for sale of cocaine in Germany, 2008Fig. 57:
Sources: UNODC ARQ and Bundeskriminalamt, Polizeiliche Kriminalstatistik 2008, Wiesbaden 2009
Nationality of ‘cocaine importers’ arrested in Germany, 2008Fig. 58:
Sources: UNODC ARQ and Bundeskriminalamt, Polizeiliche Kriminalstatistik 2008, Wiesbaden 2009
Foreigners, 2056, 48%
Guinea, 62, 1%
Serbia, 56, 1%
Netherlands, 40, 1%
Poland, 30, 1%
Nigeria, 62, 1%
Albania, 74, 2%
Sierra Leone, 76, 2%
Morocco, 76, 2%
Lebanon, 113, 3%
Italy, 142, 3%
Turkey, 450, 10%
Other, 875, 20%
Germany, 2,269, 52%

92
World Drug Report 2010
ing the cocaine from the Netherlands). Nigerian (5%) and Italian individuals (4%) also feature prominently.85
Impact of this specific flow
The social and economic impact of the flow of cocaine to Europe has been – so far at least – less severe than for North America. Though the proportion of people in need of treatment in Europe for cocaine abuse has more than tripled over the last decade (from 3% of total drug treatment demand in 1997/1998 to 10% in 2007/2008), it is still far lower than in North America (31% in 2007/2008).
The number of cocaine-related deaths is also far lower in Europe than in North America. According to the latest national data, less than 700 people in the EU/EFTA
85 Ibid.
countries died due to cocaine use, which is less than 0.2 deaths per 100,000 inhabitants, and only 8% of all drug-related deaths. As in North America, deaths from poly-drug use are common in Europe. German data show, for example, that in only 14% of all ‘cocaine-re-lated’ death cases was cocaine the only substance involved.86
Cocaine use in Europe is also less associated with vio-lence than in North America. This is most likely because powder cocaine is still dominant in Europe, and it is crack that is most associated with violent crime. There does appear to be a link with acquisitive property crime, however.
England and Wales conduct arrestee drug testing. These studies found that 13% of the arrestees in 2005/2006
86 Bundeskriminalamt, Rauschgift, Jahreskurzlage 2008, Tabellenanhang, Wiesbaden 2009.
Country YearCocaine-related deaths
Drug deaths
Cocaine in % of drug
deaths
Cocaine deaths per 100,000 inhabitants
Source Comments
Spain 2006 257 428 60.0% 0.58 EMCDDA overdose
United Kingdom 2007 246 3,359 7.3% 0.40 ARQ all deaths
Germany 2008 126 1,449 8.7% 0.15 Govt all deaths
Portugal 2007 103 314 32.8% 0.96 EMCDDA all deaths
France 2008 51 233 21.9% 0.08 ARQ all deaths
Italy 2008 37 502 7.4% 0.06 ARQ overdose
Ireland 2005 34 159 21.4% 0.77 ARQ overdose
Netherlands 2008 22 129 17.1% 0.13 ARQ overdose
Denmark 2007 5 205 2.4% 0.09 ARQ all deaths
Malta 2008 3 8 37.5% 0.74 ARQ all deaths
Finland 2007 3 229 1.3% 0.06 ARQ all deaths
Poland 2006 2 241 0.8% 0.01 ARQ all deaths
Slovenia 2005 1 85 1.2% 0.05 ARQ all deaths
Luxembourg 2002 1 35 2.9% 0.21 ARQ all deaths
Czech Republic 2006 1 212 0.5% 0.01 ARQ overdose
Sweden 2006 0 125 0.0% - ARQ all deaths
Romania 2007 0 23 0.0% - EMCDDA all deaths
Liechtenstein 2008 0 1 0.0% - ARQ all deaths
Hungary 2008 0 194 0.0% - ARQ all deaths
Bulgaria 2006 0 48 0.0% - EMCDDA All deaths
Iceland 2007 0 38 0.0% - ARQ all deaths
Cyprus 2007 0 22 0.0% - ARQ overdose
Total 635 7,611 8.3% 0.14
Reported cocaine related deaths in EU/EFTA countries in 2008 or latest year available*Table 10:
* EU/EFTA countries which provide a breakdown of drug-related mortality by drug type.Sources: UNODC ARQ; EMCDDA, Statistical Bulletin 2009; EMCDDA, National Reports

93
1. Transnational drug market analysis The global cocaine market
had used cocaine powder and 11% crack-cocaine in the previous month.87 This is less than in the United States but much more than in the general population: house-hold surveys during the same period indicate that only 1.2% of the population had used cocaine powder and 0.1% had used crack-cocaine in the previous month.88 A previous arrestee survey for England and Wales (2003/2004) found that 68% of those arrested for shop-lifting, 63% of those arrested for burglary, 41% of those arrested for ‘other theft’ and 23% of those arrested for assault had consumed either crack-cocaine, cocaine powder or heroin within the previous 12 months.89
The consequences of trafficking and cocaine consump-tion in Europe are dwarfed by the serious repercussions for the cocaine-producing countries (in terms of cocaine-generated violence and insurgencies) and for many of the transit countries in South America, Central America, the Caribbean and Africa, notably West Africa where some of the smaller countries are easy targets for cocaine trafficking organizations that operate internationally.
Implications for response1.3.4 Prevention and treatment can work. The significant decline in cocaine use in the United States over the last three decades can be linked, inter alia, to increased spending on prevention and treatment. However, not all
87 Home Office, The Arrestee Survey 2003-2006, 2nd edition, London, November 2007.
88 Home Office, “Drug Misuse Declared: Findings from the 2005/06 British Crime Survey, England and Wales”, Home Office Statistical Bulletin, October 2006.
89 Home Office, “The Arrestee Survey Annual Report: Oct. 2003-Sept. 2004”, Home Office Statistical Bulletin, November 2006.
prevention efforts are effective. Simplistic interventions can generate an interest in drugs and can lead to even higher use levels. Treatment of problem drug users, who consume the bulk of the drugs, can reduce the demand for drugs. But this requires time as relapse rates are usu-ally high. Some users may never achieve abstinence. It also seems that treating cocaine dependence is even more difficult than treating other drug addictions and some new approaches (‘cocaine vaccinations’) are being explored.
Many studies have shown that treatment is an effective investment to reduce drug demand, including demand for cocaine,90 despite its shortcomings. The fight against the drug cartels is a legitimate and necessary undertak-ing, but this may not automatically reduce the cocaine market. History has shown that break-ups of big cocaine cartels may lead to the emergence of a larger number of smaller groups. Increased competition can produce lower prices, which could even encourage higher use levels.
90 William S. Cartwright, Cost–Benefit Analysis of Drug Treatment Services: Review of the Literature, The Journal of Mental Health Policy and Economics,J. Mental Health Policy Econ. 3, 11–26 (2000); Treat-ment Research Institute at the University of Pennsylvania, Economic Benefits of Drug Treatment: A critical Review of the Evidence for Policy Makers, February 2005; Wim van den Brink, Amsterdam Institute for Addiction Research, Academic Medical Center University of Amsterdam, “Effectiveness and Cost-Effectiveness of Drug Depen-dence Treatment“, presentation given at the Donor Conference in Support of the UNODC-WHO Joint Program on Drug Dependence Treatment and Care, The Hague, 10 February 2010. Results from eleven meta studies in the USA suggested that the main economic benefits from drug treatment (all drugs; totaling, on average, some US$49,500 per patient) were in the form of avoided criminal activity: US$42,200 per patient or 85% of total economic benefits. (Kathyrin. E. Mc. Collister and Michael T. French, The relative contribution of outcome domains in the total economic benefit of addiction interventions: a review of first findings, 2003). One previous US study, based on more than 500 cocaine dependent patients in the Drug Abuse Treat-ment Outcome Study suggested that the treatment costs for outpa-tient cocaine treatment were, on average US$1,422 while the benefits from avoided crime among this group amounted to US$1,891 per patient, equivalent to a benefit to cost ratio (BCR) of 1.3. The same study found that long-term residential cocaine treatment resulted in costs of, on average, US$11,016 while average avoided crime costs amounted to US$18,461, or a BCR of 1.7. Including other economic benefits, the BCR for cocaine was found to amount to 1.6 and 1.9, respectively, for outpatient and long-term residential cocaine treatment, suggesting that for US$1 invested into cocaine treatment about US$2 can be expected to be generated in economic benefits. (Flynn, P.M., Kristiansen J.V., Porto R.L., “Costs and benefits of treatment for cocaine addiction”, Drug and Alcohol Dependence, 57 (1999), pp. 167-174). A general review of economic benefit to cost ratios in drug treatment (all drugs), reported in the literature for residential and outpatient drug treatment, found BCRs ranging from 1.3 to 6.5 (Treatment Research Institute at the University of Pennsyl-vania, 2005) with an average of 3.4, suggesting that for each dollar invested into drug treatment one should expect economic benefits of more than US$3 (and thus more than for treating cocaine dependent persons). According to a West Coast Cost-Benefit Analysis, every dollar invested by the authorities in drug treatment in this region was reported to have even saved, on average, US$7 in other costs (health care and emergency room visits, criminal justice proceedings, impris-onment, food stamps, unemployment, workers’ compensation, child welfare and other related services; Oregon Research Brief on Addiction Treatment Effectiveness, 2003).
Past month prevalence of cocaine Fig. 59: use among the general population versus cocaine use among arrestees in England and Wales, 2005/2006
Sources: Home Office, The Arrestee Survey 2003-2006, 2nd edition, London, November 2007; Home Office, “Drug Misuse Declared: Findings from the 2005/06 British Crime Survey, England and Wales,” Home Office Statistical Bulletin, October 2006
1.2%0.1%
13%
11%
0%
5%
10%
15%
Cocaine powder (cocaineHCl)
Crack-cocaine
Past
mo
nth
pre
vale
nce
General population (age 16-59) Arres tees

94
World Drug Report 2010
The concept of shared responsibility has long been adopted by UN Member States. They have also recog-nized the need for a balanced approach between supply and demand reduction efforts. Nonetheless, these gen-eral concepts still need to be better translated into oper-ational terms. Uncoordinated efforts, leading to isolated sectoral and geographical successes, have often only dis-placed the problem, leaving the global cocaine market intact. In the mid-1990s, for example, law enforcement efforts put an end to large-scale air trafficking of coca paste or cocaine base between Peru and Colombia. Coca leaf prices fell in Peru and farmers turned to other crops. The problem was, however, not really solved as this decline was offset by increases in coca cultivation in Colombia. Later, cocaine laboratories emerged in Peru, generating new demand for coca and resulting in higher coca leaf prices, thus leading to a resurgence of coca cultivation in that country in the twenty-first century. Similarly, declines in cocaine use in the United States prompted drug traffickers to seek alternative markets. Thus, reductions in North America were offset by increases in the use of cocaine in Europe and South America over the last two decades.
All of this indicates that coordination of national and sectoral efforts in the context of an internationally inte-grated strategy has been missing. Unless a more inte-grated international strategy is developed, sustainable success may remain an elusive goal. Member States rec-ognized this in their Political Declaration91 of March 2009, stressing that:“… the world drug problem remains a common and shared responsibility that requires effective and increased interna-tional cooperation and demands an integrated, multidisci-plinary, mutually reinforcing and balanced approach to supply and demand reduction strategies.”
91 “Political Declaration and Plan of Action on International Coop-eration towards an Integrated and Balanced Strategy to Counter the World Drug Problem”, in United Nations Commission on Narcotic Drugs, Report on the fifty-second session (14 March 2008 and 11-20 March 2009), E/2009/28; E/n.7/2009/12, pp. 37-77.

1.4 The global ATS market
95
What are ATS? 1.4.1
Amphetamine-type stimulants (ATS) refer to a group of synthetic substances comprised of amphetamine-group (primarily amphetamine, methamphetamine and meth-cathinone) and ecstasy-group substances (MDMA and its analogues). The amphetamine-group substances were originally synthesized in the late nineteenth century and marketed as over-the-counter nasal decongestants begin-ning in 1932. During the Second World War, the vari-ous amphetamines were used by military personnel and stockpiles were released onto the market after the war.1
The uncontrolled use of the amphetamine-group sub-stances led to widespread abuse. By the 1970s, the thera-peutic usefulness of these substances was recognized to be limited. National and international control measures appeared, as did a decline in licit pharmaceutical manu-facture. However, demand for these substances did not decline at the same rate and clandestine manufacture gradually became the primary source of supply for these substances.
The ecstasy-group substances are chemically related to the amphetamines. The major compound, MDMA and other analogues such as MDA and MDEA were first synthesized early in the 1900s. While MDMA found limited therapeutic use in the 1970s, its recreational use increased dramatically throughout the 1990s and was associated with rave culture in the developed world.
All ATS are available in diverse forms and vary in purity. Methamphetamine or amphetamine can be in powder,
1 UNDCP Technical Series Number 3, Amphetamine-type stimulants: a global review, 1996.
tablet, paste or crystalline form while ecstasy is usually available in tablet or powder form.
The spreading use of ATS can be attributed to their attractiveness to both users and the criminal organiza-tions who manufacture them alike. They appeal to the needs of today’s societies and have become part of what is perceived to be a modern lifestyle, both recreationally and occupationally. Their use is believed to enhance performance including sexual performance and their use is often initiated by mouth in ‘convenient’ and discrete pill form that avoids the dangers of injection or social stigma of smoking. They are affordable, often sold in single tablet units, which are often erroneously perceived as being less harmful than in other forms.
The popularity of ATS is also a result of a market poten-tial with continuously high profits and low risks with little initial investment. Unlike the cultivation of the coca leaf or opium poppy, ATS manufacture is not lim-ited to certain geographic locations, thus laboratories can clandestinely operate anywhere and be relocated as risk increases. One unique characteristic is that they can be synthesized from a variety of starting materials (pre-cursor chemicals) using a variety of methods. If a tradi-tional precursor becomes unavailable, replacements are easily found, often facilitated by readily available infor-mation on the Internet. New synthetic stimulants not yet under international controls can also be brought quickly to market. Additionally, large profits are not only made from the sale of the drug itself, but increas-ingly from illicit sourcing of the key precursor chemicals.

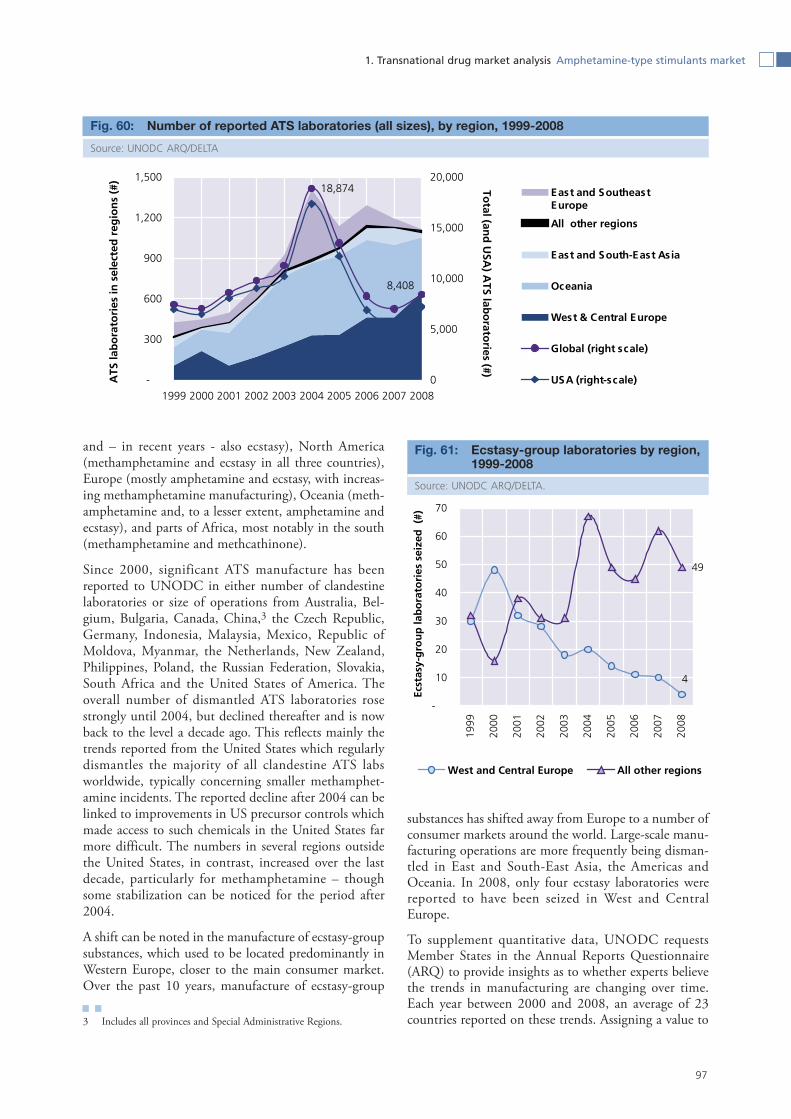
97
1. Transnational drug market analysis Amphetamine-type stimulants market
and – in recent years - also ecstasy), North America (methamphetamine and ecstasy in all three countries), Europe (mostly amphetamine and ecstasy, with increas-ing methamphetamine manufacturing), Oceania (meth-amphetamine and, to a lesser extent, amphetamine and ecstasy), and parts of Africa, most notably in the south (methamphetamine and methcathinone).
Since 2000, significant ATS manufacture has been reported to UNODC in either number of clandestine laboratories or size of operations from Australia, Bel-gium, Bulgaria, Canada, China,3 the Czech Republic, Germany, Indonesia, Malaysia, Mexico, Republic of Moldova, Myanmar, the Netherlands, New Zealand, Philippines, Poland, the Russian Federation, Slovakia, South Africa and the United States of America. The overall number of dismantled ATS laboratories rose strongly until 2004, but declined thereafter and is now back to the level a decade ago. This reflects mainly the trends reported from the United States which regularly dismantles the majority of all clandestine ATS labs worldwide, typically concerning smaller methamphet-amine incidents. The reported decline after 2004 can be linked to improvements in US precursor controls which made access to such chemicals in the United States far more difficult. The numbers in several regions outside the United States, in contrast, increased over the last decade, particularly for methamphetamine – though some stabilization can be noticed for the period after 2004.
A shift can be noted in the manufacture of ecstasy-group substances, which used to be located predominantly in Western Europe, closer to the main consumer market. Over the past 10 years, manufacture of ecstasy-group
3 Includes all provinces and Special Administrative Regions.
substances has shifted away from Europe to a number of consumer markets around the world. Large-scale manu-facturing operations are more frequently being disman-tled in East and South-East Asia, the Americas and Oceania. In 2008, only four ecstasy laboratories were reported to have been seized in West and Central Europe.
To supplement quantitative data, UNODC requests Member States in the Annual Reports Questionnaire (ARQ) to provide insights as to whether experts believe the trends in manufacturing are changing over time.Each year between 2000 and 2008, an average of 23 countries reported on these trends. Assigning a value to
Number of reported ATS laboratories (all sizes), by region, 1999-2008Fig. 60:
Source: UNODC ARQ/DELTA
18,874
8,408
-
300
600
900
1,200
1,500
1999 2000 2001 2002 2003 2004 2005 2006 2007 2008
ATS
lab
ora
tori
es in
sel
ecte
d r
egio
ns
(#)
0
5,000
10,000
15,000
20,000
Total (an
d U
SA) A
TS labo
ratories (#)
East and SoutheastEurope
All other regions
East and South-East Asia
Oceania
West & Central Europe
Global (right scale)
USA (right-scale)
Ecstasy-group laboratories by region, Fig. 61: 1999-2008
Source: UNODC ARQ/DELTA.
49
4
-
10
20
30
40
50
60
70
1999
2000
2001
2002
2003
2004
2005
2006
2007
2008
Ecst
asy-
gro
up
lab
ora
tori
es s
eize
d (
#)
West and Central Europe All other regions

98
World Drug Report 2010
the experts’ responses4 and trending them over time (indexed using the year 2000 as the baseline of 100) suggests that the trend in methamphetamine manufac-ture is perceived to be on the increase in most reporting countries, while until recently amphetamine has remained relatively unchanged. Trends in ecstasy manu-facture, on the other hand, are perceived to have stabi-lized since 2006.
The expert perception trends of increased amphetamine and methamphetamine manufacture over this period are, however, supported by several other data, including rising seizures reported throughout this period, a grow-ing proportion of countries reporting seizures of these substances, and both the volume and increasing size of dismantled laboratories.
Over the past decade, the proportion of countries which reported seizures of ATS has increased markedly, indi-cating an increase in the size and spread of the market. Whereas in 1999, only 36% of all Member States return-ing an ARQ reported seizing amphetamine-group sub-stances (34.4 mt), by 2008 that figure had increased to 50% (47.4 mt), with ecstasy-group substances following a similar pattern.
Seizures of ATS have also risen significantly. Between 1999 and 2008, seizures of ATS increased more than 30% from 39 mt to 51.3 mt. A significant amount of this increase was seen in Asia, notably the Near and Middle East with unprecedented increases in seizures of amphetamine-containing pills sold as Captagon.
Data show that the proportion of seized methampheta-
4 ARQ expert perception data is reported unweighted. The following points are allocated if experts perceive: ‘strong increase’ 2; ‘some increase’: 1; stable: 0; ‘some decline’ -1; ‘strong decline’ -2.
mine has declined, from almost 70% of total ATS sei-zures to 38%. On the other hand, the percentage of amphetamine has quintupled. However, the amount of ATS diverted from the legitimate market—a significant source of illicit use in many regions—is rarely reported. The regional breakdown of ecstasy seizures shows a shift away from West and Central Europe, the former main region of production.
The trafficking in ATS substances remains to a large extent intra-regional, as manufacture can and does occur close to the consumer markets. In 2008, significant sei-zures of methamphetamine occurred in the following regions: East and South-East Asia (56%), North Amer-
Expert perceptions (unweighted) on ATS manufacturing trends, 2000-2008Fig. 62: Note: Expert perception in manufacturing trends were not weighted by the size of the countries’ ATS manufacture as the latter is difficult to determine. Therefore, it cannot be excluded that countries with overall minor ATS manufacture may have a disproportionate influence on the global trend. Figures exclude clandestine poly-drug and other synthetic drug manufacture.Source: UNODC ARQ/DELTA
101.1
101.8
103.0
99
100
101
102
103
104
2000(9)
2001(22)
2002(23)
2003(27)
2004(23)
2005(16)
2006(21)
2007(23)
2008(20)
Year (number of countries reporting manufacturing trends)
Tren
d in
ATS
Man
ufa
ctu
re*
Ind
ex B
asel
ine:
200
0 =
100 Amphetamine group
Ecstasy group
Methamphetaminegroup
Baseline had allreported 'someincrease'
Proportion of Member States return-Fig. 63: ing an ARQ reporting ATS seizures, by type, 1999-2008
Source: UNODC ARQ/DELTA
50%
36%
55%
31%
20%
30%
40%
50%
60%
1999
2000
2001
2002
2003
2004
2005
2006
2007
2008
Mem
ber
Sta
tes
rep
ort
ing
sei
zure
s (%
)
Amphetamines-group Ecstasy-group
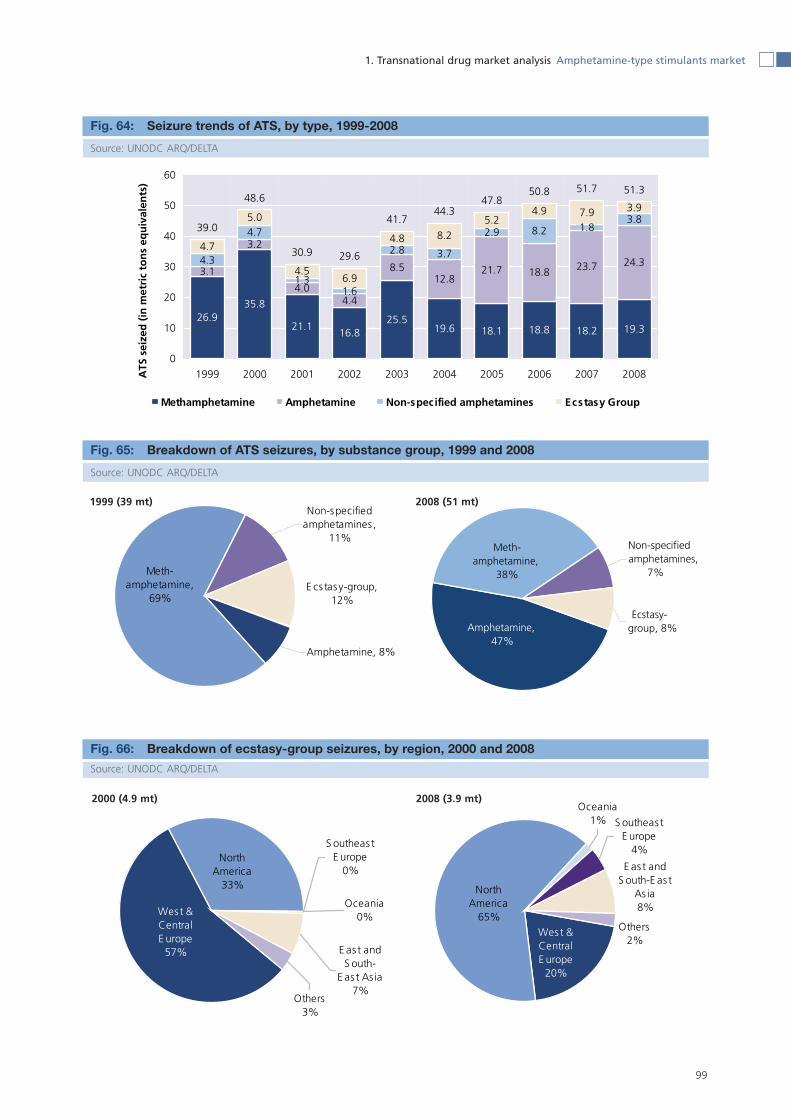
99
1. Transnational drug market analysis Amphetamine-type stimulants market
Seizure trends of ATS, by type, 1999-2008Fig. 64:
Source: UNODC ARQ/DELTA
35.8
21.116.8 18.1 18.8 19.3
3.2
4.04.4
21.7 18.824.3
4.7
1.31.6
3.7
2.9 8.23.85.0
4.56.9
8.25.2
4.9 3.9
39.0
48.6
30.9 29.6
41.744.3
47.850.8 51.7 51.3
19.625.526.9
18.2
12.88.53.1 23.7
2.84.3
1.84.8
4.7
7.9
0
10
20
30
40
50
60
1999 2000 2001 2002 2003 2004 2005 2006 2007 2008ATS
sei
zed
(in
met
ric
ton
s eq
uiv
alen
ts)
Methamphetamine Amphetamine Non-specified amphetamines Ecstasy Group
Non-specified amphetamines ,
11%
E cstasy-group, 12%
Meth-amphetamine,
69%
Amphetamine, 8%
Breakdown of ATS seizures, by substance group, 1999 and 2008Fig. 65:
Source: UNODC ARQ/DELTA
Non-specified amphetamines,
7%
Ecstasy-group, 8%
Meth-amphetamine,
38%
Amphetamine, 47%
Breakdown of ecstasy-group seizures, by region, 2000 and 2008Fig. 66:
Source: UNODC ARQ/DELTA
Others3%
West & Central E urope
57%
North America
33%
Oceania0%
E ast and S outh-
E as t As ia7%
S outheas t E urope
0%
Others2%
S outheas t E urope
4%
E ast and S outh-E as t
As ia8%
Oceania1%
North America
65%West & Central E urope
20%
1999 (39 mt) 2008 (51 mt)
2008 (3.9 mt)2000 (4.9 mt)
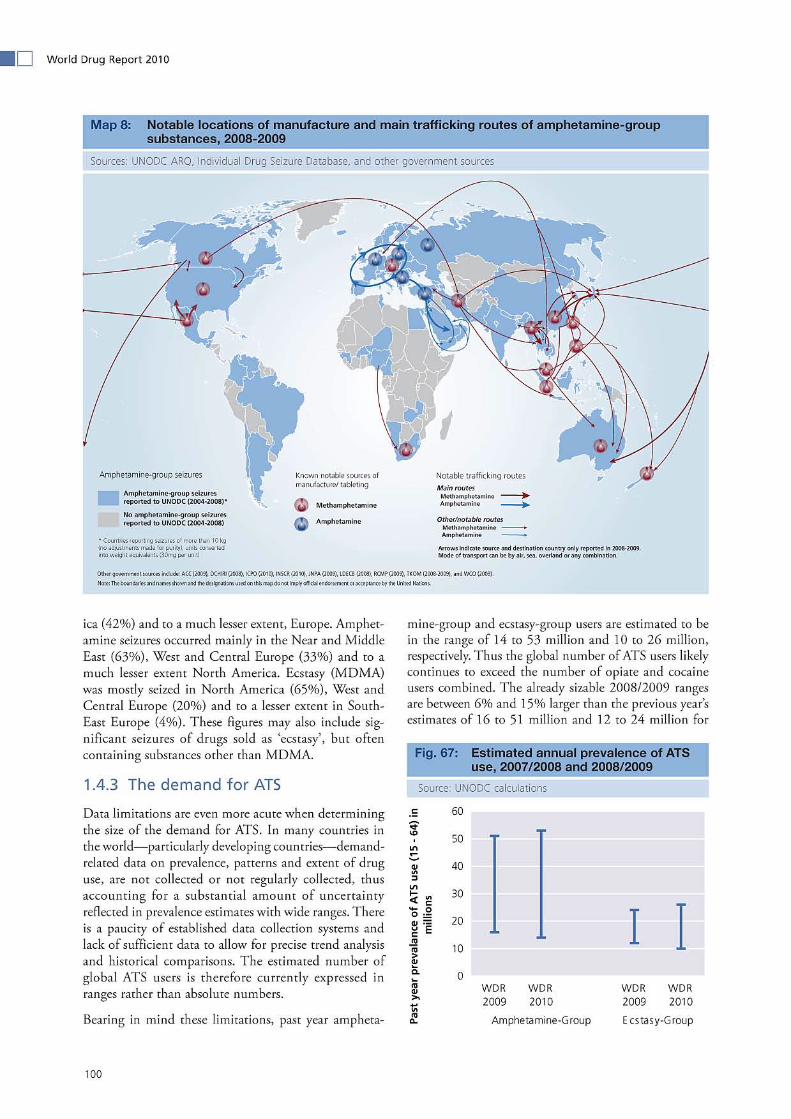

101
1. Transnational drug market analysis Amphetamine-type stimulants market
amphetamines-group and ecstasy-group substances, respectively, as little new prevalence data has become available, particularly in Africa and Asia. Indeed, the change in global prevalence may well reflect new reports from developed countries rather than actual changes at the global level.
These large ranges mask shifts in use. In developed ATS markets where regular assessments of drug use among the general population are carried out, annual preva-lence of amphetamine-group substances by the general population has actually stabilized or declined over the past several years.
5 Kershaw, C., Nicholas, S. and Walker, A., Crime in England and Wales 2008/09: Findings from the British Crime Survey and police recorded crime, Home Office Statistical Bulletin, London, 2009; Substance Abuse and Mental Health Services Administration, Results from the 2008 National Survey on Drug Use and Health: National Findings, Office of Applied Studies, Rockville, Maryland, 2009; Australian Institute of Health and Welfare, 2007 National Drug Strategy House-hold Survey: Drug statistics, 22, Canberra, 2008; Wilkins C. and Sweetsur P., Trends in population drug use in New Zealand: Findings from national household surveying of drug use in 1998, 2001, 2003 and 2006, New Zealand Medical Journal, 121, 61-71, 2008; New Zealand Ministry of Health, Drug Use in New Zealand: Key Results of the 2007/08 New Zealand Alcohol and Drug Use Survey, Wellington, 2010; Informe de la encuesta domiciliaria sobre alcohol y drogas en España (EDADES) 2007/08, Delegación del gobierno para el plan nacional sobre drogas, Madrid, 2008.
Notable locations of manufacture and main trafficking routes of ecstasy-group Map 9: substances, 2008
Source: UNODC ARQ
* Countries reporting seizures of more than 1 kg (no adjustments made for purity), units converted into weight equivalents (90mg per unit).
Notable sources and trafficking routes for ecstasy-group substances, 2008
No ecstasy seizures reported toUNODC (2004-2008)
Ecstasy seizures reported toUNODC (2004-2008)*
Note: The boundaries and names shown and the designations used on this map do not imply official endorsement or acceptance by the United Nations.
Main routes
Other/ notable routes
Arrows indicate source and destination country only reported in 2008-2009. Mode of transport can be by air, sea, overland, or any combination.
Notable trafficking routesKnown notable sources of manufacture/ tableting
Ecstasy-group
Ecstasy-group seizures
Other government sources include: ACC (2009), DCHIRI (2008), ICPO (2010), INSCR (2010), JNPA (2009), LDECB (2008), RCMP (2009), TKOM (2008-2009), and WCO (2009)
Annual prevalence in select significant Fig. 68: amphetamine-group markets, 1998-2008
Sources: Government reports5
-
1.0
2.0
3.0
4.0
5.0
1998
1999
2000
2001
2002
2003
2004
2005
2006
2007
2008
An
nu
al p
reva
len
ce (
%)
England & Wales (age 16-59)
Spain (age 15-64)
USA (age 12+)
Australia (age 14+)
New Zealand (age 15-45)*
*Data for New Zealand (2008) were adjus ted for ages 15-45 to remain comparable with previous pas t year prevalence s tudies .

102
World Drug Report 2010
As prevalence data are simply not available in many developing countries, UNODC considers expert per-ceptions as reported by Member States to help assess demand trends. These trend data6 over the 1998 to 2008 period suggest that there have been continued increases in ATS demand for developing countries. Beginning around 2000, the rate of increases perceived by experts of developed (OECD)7 and developing coun-tries (non-OECD) diverged, as a number of key indus-trialized countries showed a stabilization or decline while developing countries, particularly those in the Americas and parts of Asia reported ongoing increases in ATS use. Asia, with between a third and three quarters of esti-mated ATS users worldwide, has regionally diverse ATS user groups. This can be seen, for example, in increased treatment demand for problem amphetamine use in the Near and Middle East8 and increases in methamphet-amine use in tablet and high purity crystalline form in countries in South-East Asia in 2008.9
'Ecstasy' use as perceived by experts has steadily increased since 1998. Around 2006, developing countries began reporting more frequent and more significant increases
6 If all countries had reported ‘some increase’, the global trend line would have increased by one point each year and would have reached 110 by 2008.
7 OECD Member countries include: Australia, Austria, Belgium, Canada, Czech Republic, Denmark, Finland, France, Germany, Greece, Hungary, Iceland, Ireland, Italy, Japan, Luxembourg, Mexico, Netherlands, New Zealand, Norway, Poland, Portugal, Republic of Korea, Slovakia, Spain, Sweden, Switzerland, Turkey, United King-dom and United States of America.
8 Abu Madini M. S., Rahima S. I. A., Al-Zahrani M. A. and Al-Johi A. O., Two decades of treatment seeking for substance use disorders in Saudi Arabia: Trends and patterns in a rehabilitation facility in Dammam, Drug and Alcohol Dependence, 97(3), 2008, pp 231-236.
9 UNODC, Patterns and trends of amphetamine-type stimulants and other drugs in East and South-East Asia (and neighbouring regions) 2009, November 2009.
in ecstasy use, with their frequency outpacing that of the more mature ecstasy markets in the developed countries, which have largely appeared stable since 2004.
The use of 'ecstasy' in developing markets may be spreading particularly among youth in Latin America and East Europe. For example, between 1995 and 2007, increased lifetime prevalence of 'ecstasy' use among stu-dents aged 15 and 16 from Central and East Europe10 was reported. The unweighted average for students in East European countries in 2007 surpassed that in West
10 Students of Eastern Europe include: Bulgaria, Croatia, Czech Repub-lic, Estonia, Hungary, Latvia, Lithuania, Poland, Romania, Russian Federation (Moscow), Slovakia, Slovenia and Ukraine.
ATS use trends (unweighted) by type as perceived by experts of developed (OECD) and Fig. 69: developing (non-OECD) countries: 1998-2008 (baseline: 1998 = 100)
Note: Expert perceptions of ATS use were not weighted by the size of the countries’ population (either total or ATS drug using population), and thus, one cannot exclude the possibility that countries with only minor or emerging ATS use may have a disproportionate influence on the global trend.
Sources: UNODC ARQ, UNODC field offices, UNODC’s Drug Use Information Network for Asia and the Pacific (DAINAP)
102.6
104.8
100
101
102
103
104
105
106
1998
1999
2000
2001
2002
2003
2004
2005
2006
2007
2008
Bas
elin
e 19
98 =
100
GlobalDeveloped countries (OECD)Developing countries (non-OECD)
Unweighted average of lifetime preva-Fig. 70: lence of 'ecstasy' use among students (age 15-16) in Europe: 1995-2007
Source: Hibell, B., Guttormsson, U., Ahlström, S., Balakireva, O., Bjarnason, T., Kokkevi, A., and Kraus, L., The 2007 ESPAD Report Substance Use Among Students in 35 European Coun-tries, The Swedish Council for Information on Alcohol and other Drugs (CAN), Stockholm, 2009
103.3
104.2
100
101
102
103
104
105
1998
1999
2000
2001
2002
2003
2004
2005
2006
2007
2008
Bas
elin
e 19
98 =
100
Developed Countries (OECD)Developing Countries (non-OECD)Global
ATS trend in perception Ecstasy-group trend in perception
0.0
1.0
2.0
3.0
4.0
5.0
6.0
1995 1999 2003 2007 Stu
den
t lif
etim
e p
reva
len
ce (
%)
Europe averageEastern Europe averageWest/ Central Europe average

103
1. Transnational drug market analysis Amphetamine-type stimulants market
and Central European countries which had remained stable since 2003.
The expert perceptions in the developed countries show a stabilization or decline in ‘ecstasy’ use since 2004. This is also supported by the results of household surveys in these markets. Australia has reported relative stability, albeit at comparably high levels, in past year use by the general population since 2004 while declines have been reported for Spain, the United Kingdom (England and Wales) and the United States. 11
11 Refer to footnote 5.
ATS problem drug use represents the only class of drug use in the past decade which has increased significantly in every region of the world. Although the patterns of ATS use with respect to the specific drug type and its form vary significantly across regions, unweighted treat-ment demand increased from between 2 (Africa) and 11 (North America) percentage points in the past decade. While improvements may have been noted in the annual prevalence rates among the general population in several developed countries, problem drug use as reflected in treatment admissions can remain high. For example, treatment demand for methamphetamine use in the United States declined only slightly in 2007 while annual prevalence rates showed a marked decline since 2006.
Amounts of amphetamine-type stimulants available for consumption
Exactly how much ATS is illicitly manufactured is for the moment impossible to directly ascertain because independent calculations based on remote sensing of manufacture cannot be done, as is the case with poppy plants and coca bushes.12 Simple counts of clandestine laboratories dismantled annually fail to include stand-ardized measures of manufacture type or capacity inter alia the frequency of production cycles, amount of output, purity levels, time in operation, thus limiting their overall analytical value. Additionally, it is not known how many laboratories exist for each laboratory discovered.
Nonetheless, there is value in trying to assess the orders
12 Previous UNODC models estimated manufacture based on the tri-angulation of consumption, seized end product, and seized precursor chemicals. However, changes in the drug market, particularly related to the precursor chemical seizures, and ability to ascertain seizure rates made this model less useful.
Trends in annual prevalence of select Fig. 71: 'ecstasy' markets, 1998-2008
Sources: Government reports11
-
1.0
2.0
3.0
4.0
1998
1999
2000
2001
2002
2003
2004
2005
2006
2007
2008
An
nu
al p
reva
len
ce (
%)
England & Wales (age 16-59)Spain (age 15-64)USA (age 12+)Australia (age 14+)
Changes in unweighted regional Fig. 72: treatment demand for problem ATS drug users, as a proportion of all drug treatment
Source: UNODC 2000 World Drug Report, ARQ
0% 5% 10% 15% 20% 25%
Africa
Caribbean, Central & SouthAmerica
Europe
North America
Oceania
As ia
1997/98 2008/09
United States: Past year use of Fig. 73: methamphetamine and treatment demand, 1999-2008
Sources: Substance Abuse and Mental Health Services Admin-istration, Office of Applied Studies, Treatment Episode Data Set (TEDS) Highlights - 2007 National Admissions to Sub-stance Abuse Treatment Services, Rockville, Maryland, 2009
0
30,000
60,000
90,000
120,000
150,000
1999
2000
2001
2002
2003
2004
2005
2006
2007
2008
Trea
tmen
t A
dm
issi
on
s (#
)
0
0.2
0.4
0.6
0.8
1
Past
yea
r u
se 1
2 an
d o
lder
(%
)
Treatment admissions (methamphetamine)
Prevalence (methamphetamine)
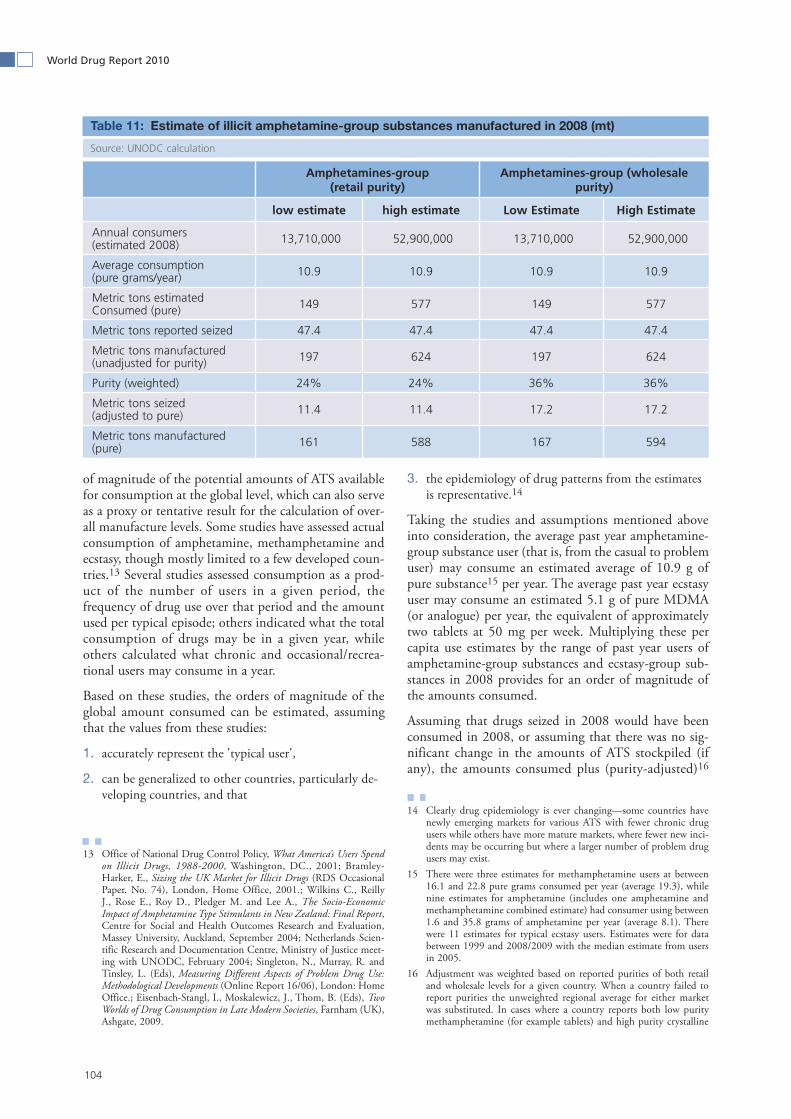
104
World Drug Report 2010
of magnitude of the potential amounts of ATS available for consumption at the global level, which can also serve as a proxy or tentative result for the calculation of over-all manufacture levels. Some studies have assessed actual consumption of amphetamine, methamphetamine and ecstasy, though mostly limited to a few developed coun-tries.13 Several studies assessed consumption as a prod-uct of the number of users in a given period, the frequency of drug use over that period and the amount used per typical episode; others indicated what the total consumption of drugs may be in a given year, while others calculated what chronic and occasional/recrea-tional users may consume in a year.
Based on these studies, the orders of magnitude of the global amount consumed can be estimated, assuming that the values from these studies:
accurately represent the 'typical user', 1.
can be generalized to other countries, particularly de-2. veloping countries, and that
13 Office of National Drug Control Policy, What America’s Users Spend on Illicit Drugs, 1988-2000, Washington, DC., 2001; Bramley-Harker, E., Sizing the UK Market for Illicit Drugs (RDS Occasional Paper. No. 74), London, Home Office, 2001.; Wilkins C., Reilly J., Rose E., Roy D., Pledger M. and Lee A., The Socio-Economic Impact of Amphetamine Type Stimulants in New Zealand: Final Report, Centre for Social and Health Outcomes Research and Evaluation, Massey University, Auckland, September 2004; Netherlands Scien-tific Research and Documentation Centre, Ministry of Justice meet-ing with UNODC, February 2004; Singleton, N., Murray, R. and Tinsley, L. (Eds), Measuring Different Aspects of Problem Drug Use: Methodological Developments (Online Report 16/06), London: Home Office.; Eisenbach-Stangl, I., Moskalewicz, J., Thom, B. (Eds), Two Worlds of Drug Consumption in Late Modern Societies, Farnham (UK), Ashgate, 2009.
the epidemiology of drug patterns from the estimates 3. is representative.14
Taking the studies and assumptions mentioned above into consideration, the average past year amphetamine-group substance user (that is, from the casual to problem user) may consume an estimated average of 10.9 g of pure substance15 per year. The average past year ecstasy user may consume an estimated 5.1 g of pure MDMA (or analogue) per year, the equivalent of approximately two tablets at 50 mg per week. Multiplying these per capita use estimates by the range of past year users of amphetamine-group substances and ecstasy-group sub-stances in 2008 provides for an order of magnitude of the amounts consumed.
Assuming that drugs seized in 2008 would have been consumed in 2008, or assuming that there was no sig-nificant change in the amounts of ATS stockpiled (if any), the amounts consumed plus (purity-adjusted)16
14 Clearly drug epidemiology is ever changing—some countries have newly emerging markets for various ATS with fewer chronic drug users while others have more mature markets, where fewer new inci-dents may be occurring but where a larger number of problem drug users may exist.
15 There were three estimates for methamphetamine users at between 16.1 and 22.8 pure grams consumed per year (average 19.3), while nine estimates for amphetamine (includes one amphetamine and methamphetamine combined estimate) had consumer using between 1.6 and 35.8 grams of amphetamine per year (average 8.1). There were 11 estimates for typical ecstasy users. Estimates were for data between 1999 and 2008/2009 with the median estimate from users in 2005.
16 Adjustment was weighted based on reported purities of both retail and wholesale levels for a given country. When a country failed to report purities the unweighted regional average for either market was substituted. In cases where a country reports both low purity methamphetamine (for example tablets) and high purity crystalline
Amphetamines-group (retail purity)
Amphetamines-group (wholesale purity)
low estimate high estimate Low Estimate High Estimate
Annual consumers (estimated 2008) 13,710,000 52,900,000 13,710,000 52,900,000
Average consumption (pure grams/year) 10.9 10.9 10.9 10.9
Metric tons estimated Consumed (pure) 149 577 149 577
Metric tons reported seized 47.4 47.4 47.4 47.4
Metric tons manufactured (unadjusted for purity) 197 624 197 624
Purity (weighted) 24% 24% 36% 36%
Metric tons seized (adjusted to pure) 11.4 11.4 17.2 17.2
Metric tons manufactured (pure) 161 588 167 594
Estimate of illicit amphetamine-group substances manufactured in 2008 (mt)Table 11:
Source: UNODC calculation

105
1. Transnational drug market analysis Amphetamine-type stimulants market
seizures provide for a proxy of the total ATS manufac-tured in 2008.17
Amphetamine-group substances available for consumption in 2008
The amounts of amphetamine-group substances poten-tially manufactured (with seizures unadjusted for purity) are estimated between 197 and 624 mt, or taking purity-adjusted seizures into account, between 161 and 594 mt. The range is larger than was reported in 2007 because the uncertainty in the annual prevalence increased as a number of older estimates (>10 years) were no longer considered to be reliable estimates for the current ATS use situation. If one assumes that the major-ity of seizures reported to UNODC best represents retail market level seizures at 24% purity,18 the production range would decline slightly (161 to 588 mt), due to the removal of adulterants and diluents.19 If reported sei-zures better represented the wholesale market (36% purity), the range would amount to between 167 and 594 mt. A significant amount of the difference between bulk and purity adjusted seizures are inter alia the mas-sive amounts of seized tablets sold as Captagon in the Near and Middle East, which recent forensic analyses suggested to have an average amphetamine content between 1% and 16%.
Given the estimates from above and the amount of drugs seized, one can derive estimates of the ampheta-mine-group substances interdicted in orders of magni-tude.20 There were 47.4 mt of bulk amphetamine-group substances reported seized in 2008, which, adjusted for purity at the retail and wholesale levels, is between 11.4 and 17.2 mt, respectively. Assuming all of the drugs seized were interdicted from the retail market, estimates would range from 2% (11.4/588) to 7% (11.4/161). If the amounts seized were from the wholesale market, the estimated range would be between 3% and 10%. Such orders of magnitude would be also in line with a few other published rates.21
methamphetamine, the purity was based on a weighted average (from seizure data). The reported seizures of 'non-specified amphetamines' were assumed to be either amphetamine or methamphetamine, and thus were given an average weighted purity of amphetamine and methamphetamine, based on total seizures.
17 This does not account for other forms of loss, such as discarding drug to avoid capture or spoilage which are assumed to be minimal.
18 Purity data are typically based on seizures which may not be repre-sentative of all drugs in the market, and given the various methods in sampling and forensic reporting (for example, as a drug base versus a salt) can impact purity estimates.
19 Unfortunately only total seizure weight by drug is reported, and not the distribution of seizure weights. Therefore, it is not possible to assign whether seizures best represented street or wholesale transac-tion amounts.
20 Annual drug seizures of drugs considerably greatly from year to year which impact the rates calculated.
21 Individual interception rates fluctuate considerably over time, place
In contrast to the apparently low interdiction rates for ATS, the calculated interception rates for purity-adjusted cocaine have been exceeding 40% in recent years, and are around 20% for the opiates.22 There are several rea-sons which lend support to the findings of far lower interception rates for the ATS as compared to cocaine and opiates. First, the source of most of the world’s cocaine and opiates are restricted to just three specific regions: parts of South America (Colombia, Peru and the Plurinational States of Bolivia), Afghanistan, and the so-called 'Golden Triangle' (mainly Myanmar). Contrast that with the number of reported ATS manufacture locations which are spreading and shifting throughout the world. Second, since manufacture of ATS typically occurs close to their consumer markets they cross far fewer borders than either cocaine or opiates, and thus have significantly less chance of being detected, Next, large-scale manufacture locations—such as in East and South-East Asia—have porous borders and thousands of kilometres of unpatrolled coastline, making transfer of products into neighbouring countries a comparatively low risk activity. Lastly, ATS awareness remains low as governments in many regions continue to remain focused on the 'traditional drugs'—namely cocaine and heroin.
Ecstasy-group substances available for consumption in 2008
Ecstasy-group substances consumed were estimated between 53 and 132 mt in 2008. Adding seizures (and assuming no significant changes in the stocks) would give an estimate of between 57 and 136 mt, or adjusting for purity from 55 to 133 mt. The low end estimate is somewhat lower than in 2007 because the uncertainty in the estimated number of annual users increased. The high end estimate of ecstasy-group substances manufac-tured remained largely unchanged because far less was reported seized in 2008 than it 2007.
There were a total of 3.9 mt of ecstasy-group substances seized (unadjusted for purity), which, depending on the estimates, gives an interdiction rate ranging from 3% to 7%.
Adjusting the seizures for purity lowers the calculated interdiction rates to between 1% and 3%. Such unusu-ally low rates—even lower than for the amphetamine-group substances—seems counter intuitive, as the countries known to be significant ecstasy manufactures,
and drug type. New Zealand (2001) amphetamines-group inter-ceptions were found to be between 2% and 7% of totals for con-sumption. Centre for Social and Health Outcomes Research and Evaluation, The Socio-Economic Impact of Amphetamine Type Stimu-lants in New Zealand, Auckland, New Zealand (2004). However, those figures changed notably in the following year.
22 World Drug Report 2009 (United Nations publication Sales No. E.09.XI.12).
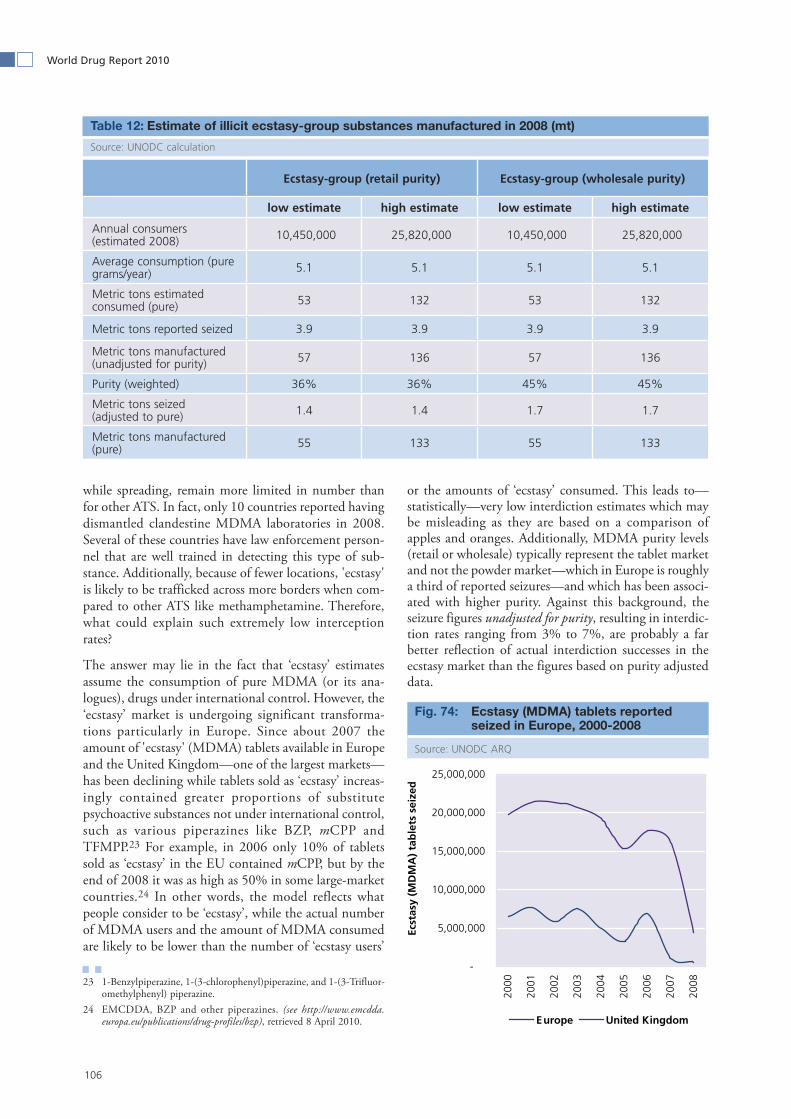
106
World Drug Report 2010
while spreading, remain more limited in number than for other ATS. In fact, only 10 countries reported having dismantled clandestine MDMA laboratories in 2008. Several of these countries have law enforcement person-nel that are well trained in detecting this type of sub-stance. Additionally, because of fewer locations, 'ecstasy' is likely to be trafficked across more borders when com-pared to other ATS like methamphetamine. Therefore, what could explain such extremely low interception rates?
The answer may lie in the fact that ‘ecstasy’ estimates assume the consumption of pure MDMA (or its ana-logues), drugs under international control. However, the ‘ecstasy’ market is undergoing significant transforma-tions particularly in Europe. Since about 2007 the amount of 'ecstasy' (MDMA) tablets available in Europe and the United Kingdom—one of the largest markets—has been declining while tablets sold as ‘ecstasy’ increas-ingly contained greater proportions of substitute psychoactive substances not under international control, such as various piperazines like BZP, mCPP and TFMPP.23 For example, in 2006 only 10% of tablets sold as ‘ecstasy’ in the EU contained mCPP, but by the end of 2008 it was as high as 50% in some large-market countries.24 In other words, the model reflects what people consider to be ‘ecstasy’, while the actual number of MDMA users and the amount of MDMA consumed are likely to be lower than the number of ‘ecstasy users’
23 1-Benzylpiperazine, 1-(3-chlorophenyl)piperazine, and 1-(3-Trifluor-omethylphenyl) piperazine.
24 EMCDDA, BZP and other piperazines. (see http://www.emcdda.europa.eu/publications/drug-profiles/bzp), retrieved 8 April 2010.
or the amounts of ‘ecstasy’ consumed. This leads to—statistically—very low interdiction estimates which may be misleading as they are based on a comparison of apples and oranges. Additionally, MDMA purity levels (retail or wholesale) typically represent the tablet market and not the powder market—which in Europe is roughly a third of reported seizures—and which has been associ-ated with higher purity. Against this background, the seizure figures unadjusted for purity, resulting in interdic-tion rates ranging from 3% to 7%, are probably a far better reflection of actual interdiction successes in the ecstasy market than the figures based on purity adjusted data.
Estimate of illicit ecstasy-group substances manufactured in 2008 (mt)Table 12:
Source: UNODC calculation
Ecstasy-group (retail purity) Ecstasy-group (wholesale purity)
low estimate high estimate low estimate high estimate
Annual consumers (estimated 2008) 10,450,000 25,820,000 10,450,000 25,820,000
Average consumption (pure grams/year) 5.1 5.1 5.1 5.1
Metric tons estimated consumed (pure) 53 132 53 132
Metric tons reported seized 3.9 3.9 3.9 3.9
Metric tons manufactured (unadjusted for purity) 57 136 57 136
Purity (weighted) 36% 36% 45% 45%
Metric tons seized (adjusted to pure) 1.4 1.4 1.7 1.7
Metric tons manufactured (pure) 55 133 55 133
Ecstasy (MDMA) tablets reported Fig. 74: seized in Europe, 2000-2008
Source: UNODC ARQ
-
5,000,000
10,000,000
15,000,000
20,000,000
25,000,000
2000
2001
2002
2003
2004
2005
2006
2007
2008
Ecst
asy
(MD
MA
) ta
ble
ts s
eize
d
Europe United Kingdom

107
1. Transnational drug market analysis Amphetamine-type stimulants market
Unfortunately, despite the efforts of some governments to improve the capacity to generate reliable data, the quality and timeliness of available data from which these estimates are derived are unlikely to improve in the very near future. This, coupled with the model’s assump-tions, suggests that the interdiction rates, derived from the tentative manufacture estimates and seizures, are not yet robust enough to be an effective indicator of annual market change, only its magnitude.
Key ATS issues 1.4.4
The significant growth seen in the ATS market over the past decade has been fueled by increased involvement by criminal organizations. Criminal groups have the ability to respond to market pressures on a corporate level. They are able to quickly retool manufacturing processes, develop new products, source new precursor chemicals and disguise their intentions by using complex supply routes for sourcing the required chemicals. Industrial-sized operations with production cycles in the hundreds and now thousands of kilograms dictate the involve-ment of organized crime, and have become more com-monplace among developing countries with examples in Fiji, Guinea, Indonesia, Malaysia, Mexico and the Phil-ippines, among others. Since manufacture often occurs in the consumer country or adjacent country, tracing trafficking flows of these drugs across regions—given the orders of magnitude of interception rates for various ATS—are far less meaningful than for either cocaine or heroin. Instead the dynamics of the market growth is better illustrated by developments in illicit manufacture seen by increases in laboratory size, sophistication, yield, precursor chemical types and sources, and the shifting location of operations into more vulnerable countries.
The importance of precursor control
Precursor chemicals are to ATS what opium is to heroin. These fundamental building blocks are diverted from legitimate trade into illicit manufacture. The United Nations 1988 Convention against the Illicit Traffic in Narcotic Drugs and Psychotropic Substances provides for measures to prevent diversion of key precursor chem-icals for purposes of illicit drug manufacture.25 In their bid to obtain these chemicals, criminal organizations have become increasingly innovative in circumventing these controls, and as such, many countries have also enacted progressively stronger domestic controls to stem their flow into illicit manufacture. Inter alia as precur-sors become more difficult and expensive to obtain, manufacturing costs to illicit operators increase which leads to a variety and combination of events, such as:
25 As of 31 October 2009, the Convention had been ratified, acceded to or approved by 183 UN Member States.
manufacture drops and the price and purity (that is, 1. value) of the drug decreases,
the source(s) and/or supply routes of precursor chemi-2. cals change(s),
the precursor chemical itself (form or type) and/or 3. manufacturing process changes,
the location of manufacture shifts to more vulnerable 4. lower cost areas, and/or
substitute psychoactive substances may appear.5.
The degree to which controls are able to stem the flow of the requisite chemicals dictates the degree to which these events may occur. How long the effect lasts depends on the criminal’s ability to circumvent these controls. The impact of regulatory controls on manufacturing dynamics is best illustrated with recent events in the largest ATS markets of North America, Europe and Asia.
North America: Relocation of methampheta-mine manufacture to neighboring regions
Significant methamphetamine manufacture based in the United States of America relocated into neighbouring Mexico after stricter controls over precursor chemicals were enacted in the United States. The United States’ methamphetamine market, the largest in North Amer-ica, is predominantly supplied from Mexican-based criminal groups and to a lesser degree from domestic manufacture. The implementation in the United States over the last 20 years of progressively stricter domestic controls over bulk precursor chemicals, primarily pseu-doephedrine and ephedrine, initially resulted in decreases in the purity of the methamphetamine.26 As illicit man-ufacturers began to identify over-the-counter pharma-ceutical preparations containing pseudoephedrine (that is, cold medicine) as a new unrestricted source of chem-icals, the number of domestic laboratories, and users, increased. In 2005, national controls for pharmaceutical preparations were enacted in the United States and resulted in a sharp decline in the vast numbers of small to medium-size laboratories, although production loss was offset by increasing large-scale manufacture in neighbouring Mexico. The number, size and sophistica-tion of laboratories in Mexico increased dramatically since then, as did the amount of methamphetamine traf-ficked back into the US.27 For example, in August 2009, Mexico dismantled the largest industrial–scale labora-tory involving the seizure of a manufacturing complex
26 Cunningham, J. K., Liu L., and Callaghan, R., “Impact of US and Canadian precursor regulation on methamphetamine purity in the United States,” Addiction, 104 (4), pp. 441–453, 2009.
27 US Department of Justice, National Drug Threat Assessment 2010, National Drug Intelligence Center.

108
World Drug Report 2010
with more than 31,000 litres of chemicals in the 22 building complex spread over 240 hectares.28
Import restrictions on pseudoephedrine and ephedrine in Mexico to address the shift in the market dramatically cut manufacturing levels in that country in 2007. Mexico embarked on a campaign against organized crime groups involved in manufacturing of methamphetamine by inter alia reducing domestic diversions of precursors through the reduction of legitimate imports of ephe-drine and pseudoephedrine, and ultimately banning the
28 La Secretaría de la Defensa Nacional informa de la localización de un complejo para el procesamiento de drogas sintéticas y mariguana, constituido con 22 instalaciones ubicadas en un terreno de 240 hec-táreas, Secretaría de la Defensa Nacional (SEDENA), 7 August 2009. Global SMART Update 2010, vol. 3, March 2010.
import, export of and trade in the substances by mid-2008. Manufacture dropped and seizures from Mexico into the United States subsequently declined nearly 40% in 2007/2008 from their peak in 2005/2006.
The decline in illicit manufacture of methamphetamine, first in the United States and then in Mexico, impacted the street economics; resulting in an increase in price and a decrease in purity. Methamphetamine price and purity data from the United States confirm that as domestic controls over precursors in the form of phar-
maceutical preparations were strengthened, the price per
United States seizures of methamphetamine reported near the Mexico border versus sei-Fig. 75: zures of large-scale USA-based clandestine methamphetamine laboratories, 2001-2009*
Source: National Drug Threat Assessment 2010 (and previous years). US Department of Justice, National Drug Intelligence Center
Change in street price and purity of methamphetamine in the United States, 2005-2009 Fig. 76:
Source: National Drug Threat Assessment 2009 and 2010, US Department of Justice, National Drug Intelligence Center
1,314
3,477
14
245
0
500
1,000
1,500
2,000
2,500
3,000
3,500
2001 2002 2003 2004 2005 2006 2007 2008 2009*
Met
ham
ph
etam
ine
bo
rder
seiz
ure
s (k
g)
-
50
100
150
200
250
300
USA
Lar
ge/
Ind
ust
rial
La
bo
rato
ries
(#)
USA - Mexico border seizures (kg)
USA based large to industrial s ized laboratories (#)* P artial year 2009
$-
$50
$100
$150
$200
$250
$300
Apr
-Jun
05
Jul
-Sep
05
Oct
-Dec
05
Jan
-Mar
06
Apr
-Jun
06
Jul
-Sep
06
Oct
-Dec
06
Jan
-Mar
07
Apr
-Jun
07
Jul
-Sep
07
Oct
-Dec
07
Jan
-Mar
08
Apr
-Jun
08
Jul
-Sep
08
Oct
-Dec
08
Jan
-Mar
09
Apr
-Jun
09
Jul
-Sep
09
Pric
e p
er p
ure
gra
m (
USD
$)
0.0%
10.0%
20.0%
30.0%
40.0%
50.0%
60.0%
70.0%
80.0%
Ave
rag
e Pu
rity
Methamphetamine street price per pure gram (avg) Methamphetamine purity (avg)
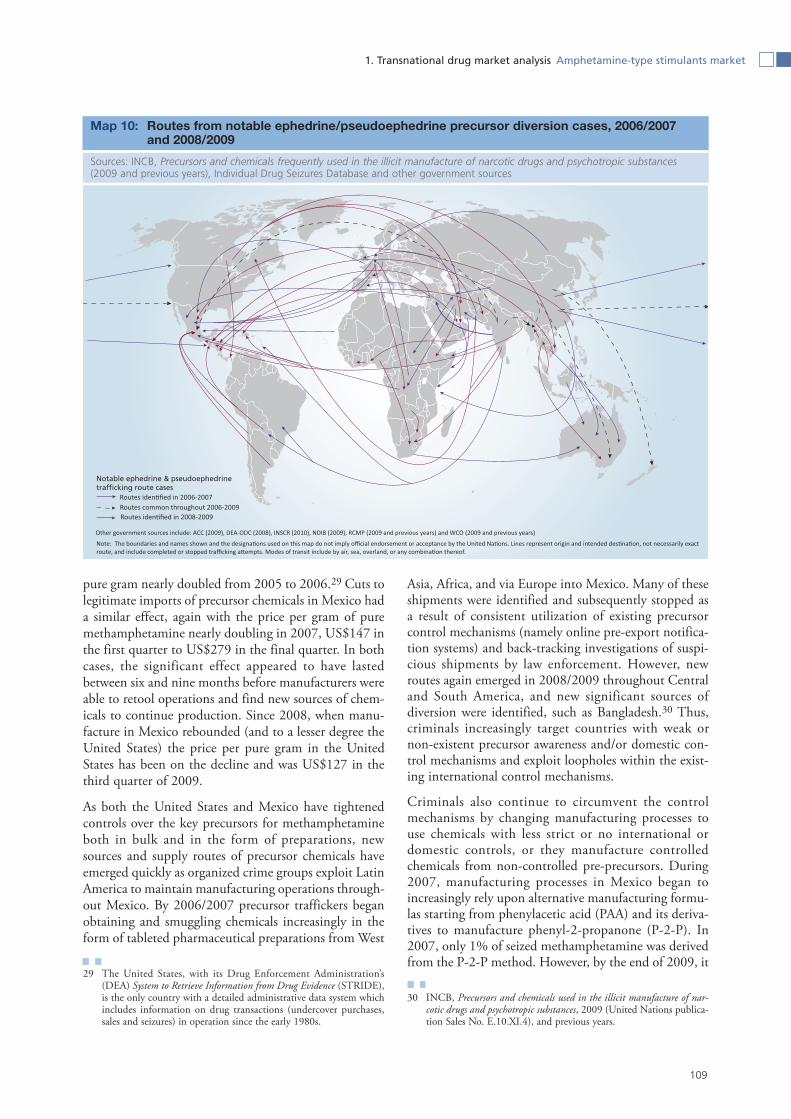
109
1. Transnational drug market analysis Amphetamine-type stimulants market
pure gram nearly doubled from 2005 to 2006.29 Cuts to legitimate imports of precursor chemicals in Mexico had a similar effect, again with the price per gram of pure methamphetamine nearly doubling in 2007, US$147 in the first quarter to US$279 in the final quarter. In both cases, the significant effect appeared to have lasted between six and nine months before manufacturers were able to retool operations and find new sources of chem-icals to continue production. Since 2008, when manu-facture in Mexico rebounded (and to a lesser degree the United States) the price per pure gram in the United States has been on the decline and was US$127 in the third quarter of 2009.
As both the United States and Mexico have tightened controls over the key precursors for methamphetamine both in bulk and in the form of preparations, new sources and supply routes of precursor chemicals have emerged quickly as organized crime groups exploit Latin America to maintain manufacturing operations through-out Mexico. By 2006/2007 precursor traffickers began obtaining and smuggling chemicals increasingly in the form of tableted pharmaceutical preparations from West
29 The United States, with its Drug Enforcement Administration’s (DEA) System to Retrieve Information from Drug Evidence (STRIDE), is the only country with a detailed administrative data system which includes information on drug transactions (undercover purchases, sales and seizures) in operation since the early 1980s.
Asia, Africa, and via Europe into Mexico. Many of these shipments were identified and subsequently stopped as a result of consistent utilization of existing precursor control mechanisms (namely online pre-export notifica-tion systems) and back-tracking investigations of suspi-cious shipments by law enforcement. However, new routes again emerged in 2008/2009 throughout Central and South America, and new significant sources of diversion were identified, such as Bangladesh.30 Thus, criminals increasingly target countries with weak or non-existent precursor awareness and/or domestic con-trol mechanisms and exploit loopholes within the exist-ing international control mechanisms.
Criminals also continue to circumvent the control mechanisms by changing manufacturing processes to use chemicals with less strict or no international or domestic controls, or they manufacture controlled chemicals from non-controlled pre-precursors. During 2007, manufacturing processes in Mexico began to increasingly rely upon alternative manufacturing formu-las starting from phenylacetic acid (PAA) and its deriva-tives to manufacture phenyl-2-propanone (P-2-P). In 2007, only 1% of seized methamphetamine was derived from the P-2-P method. However, by the end of 2009, it
30 INCB, Precursors and chemicals used in the illicit manufacture of nar-cotic drugs and psychotropic substances, 2009 (United Nations publica-tion Sales No. E.10.XI.4), and previous years.
Routes from notable ephedrine/pseudoephedrine precursor diversion cases, 2006/2007 Map 10: and 2008/2009
Sources: INCB, Precursors and chemicals frequently used in the illicit manufacture of narcotic drugs and psychotropic substances (2009 and previous years), Individual Drug Seizures Database and other government sources
Notable ephedrine & pseudoephedrine trafficking route cases

110
World Drug Report 2010
had become more prominent with 37% of methamphet-amine assumed to have been produced using this meth-od.31 During that same period there was also a decrease in the quantities of the more potent d-methamphetamine entering the United States as a result of greater reliance upon the P-2-P method.32 Since October 2009, Mexico has reported seizing nearly 120 mt of phenylacetic acid (PAA) derivatives, which are not internationally con-trolled. These alone could produce up to 30 mt of meth-amphetamine, which is almost twice the global methamphetamine seizures reported in 2008.33 PAA is under international control as a Table II substance with far fewer controls than other methamphetamine precur-sors. It was only in March 2010 that the Commission on Narcotic Drugs (CND) decided to transfer PAA to the same level of control as the other methamphetamine precursor chemicals P-2-P, ephedrine and pseudoephed-rine.34 While PAA derivatives continue to remain outside the international control regime, allowing for unfettered international trade, the Government of Mexico strength-ened domestic controls and surveillance over the use and import of PAA salts and derivatives in November 2009.
At the same time there are now indications that signifi-
31 Extraction of Methamphetamine Precursor Material from Medicinal Preparations and Methamphetamine Profiling Results, presented by the DEA Special Testing and Research Laboratory at the forty-fifth regular session of the Inter-American Drug Abuse Control Com-mission (May 2009); US Department of Justice Drug Enforcement Administration, Special Testing and Research Laboratory (Jan 2010)
32 Pseudoephedrine and ephedrine result in the more potent central nervous stimulant d-methamphetamine while P-2-P methods result in the less potent racemic d,l-methamphetamine, unless separated in an additional synthesis step.
33 Secretaría de Seguridad Pública (SSP) México, Boletín de Prensa/189 México, D.F., 8 de abril de 2010. Global SMART Update 2010, vol. 3, March 2010.
34 Member States have now six months to implement the increased control measures.
cant manufacture is yet again shifting further south. In February 2010, Nicaraguan National Police reported the seizure of its first large-scale clandestine methampheta-mine laboratory which police estimated had a produc-tion capacity of around 70 kg.35 This is reportedly the third laboratory discovered in the country but unprece-dented size. Manufacture-related activities have also been reported from Guatemala and Honduras and sig-nificant precursor chemical seizures are already being reported throughout the region, even though law enforcement and regulatory attention there continues to focus primarily on the cocaine trade.
There is currently little likelihood of methamphetamine substitutes appearing for methamphetamine on the US market, as has been observed with other ATS in Europe and parts of Asia. Manufacture in the United States shows its first signs of rebounding since 2005 with a 26% increase in laboratory incidents reported in 2009 over 2008. Greater amounts of high potency domesti-cally produced methamphetamine will likely comple-ment the somewhat less potent methamphetamine flowing from Mexico. Additionally, there may be increased flow of derivatives of PAA trafficked via Cen-tral American countries for use in retooled production operations in Mexico, as manufacturers attempt to cir-cumvent new restrictions enacted by the Government.
Europe: The changing nature of MDMA manufacture
Organized crime groups in Europe, particularly in the Netherlands and Belgium, have long been considered a major global source of ecstasy (MDMA or its analogues).36 Although ecstasy from Europe is still dom-inant on the global market, fewer countries identify Europe as the source for ecstasy seen in their markets. While more than 80% of all ARQ reporting countries have identified Europe as the source of their seized ecstasy in 2002, this share has been declining since 2004 to 73% in 2009, as a greater proportion of countries outside of Europe began reporting that the sources of their ecstasy were places other than Europe. This coin-cided with disruptions to precursor chemical supplies in Europe and emergence of MDMA manufacture in other locations closer to non-European consumer markets. At the same time, European countries continue to report that their seized ecstasy is sourced from within Europe.
There have been no seizures of 3,4-MDP-2-P (PMK), the most common MDMA precursor chemical used in Europe, since 2007, but there are indications that manu-facturers are retooling operations to make use of alterna-
35 Policía Nacional de Nicaragua, Policía detecta laboratorio de Anfetami-nas, 23 February 2010.
36 Europol Organized Crime Threat Assessment, 2009, European Police Office, The Hague.
Changes in methamphetamine Fig. 77: manufacturing methods in Mexico, 2007-2009
Source: US DEA Special Testing Laboratory
0
25
50
75
100
2007 2008 2009*
Met
ham
ph
etam
ine
fro
m P
-2-P
met
ho
d
(%)
P -2-P/ PAA sourcePotency (d-methamphetamine)
*2009 P -2-P / P AA source reflects 4th quarter

111
1. Transnational drug market analysis Amphetamine-type stimulants market
tive chemicals. Europe used to account for the majority of reported global 3,4-MDP-2-P seizures. However since 2004, there has been a decline in the amount of reported seizures of 3,4-MDP-2-P with the last reports in Europe occurring in 2007.37 The likely reasons for the signifi-cant shortages may include: an increased demand for this precursor chemical in MDMA manufacture in other parts of the world, increased law enforcement strategies to curtail manufacture, including controlling the avail-ability of key specialized equipment such as pill presses, and significant regulatory efforts to prevent illegitimate imports or diversions of precursor chemicals via more consistent utilization of pre-export notifications. In addition, China, traditionally the source of 3,4-MDP-2-P, entered into a new agreement with the European Union in 2009 to improve precursor controls and coor-dination. The country also announced tighter controls on the manufacture of 3,4-MDP-2-P. Taken together, this suggests that the trend towards retooling ecstasy manufacture in Europe will continue.38
In fact, criminals are already turning to alternative sources to manufacture MDMA to meet the demand in Europe. In 2008, 1,900 litres of safrole-rich oils (SRO) were reported seized in Europe, the first such seizure of any magnitude since 2003. Safrole-rich oils are typically sourced from South-East Asia. In 2006, there were an estimated 1,360-1,620 mt of SRO produced in East and
37 The activities of INCB’s Project Prism and the PEN on-line system have focused on preventing the smuggling of both 3,4-MDP-2-P and P-2-P into the EU for use in the illicit manufacture of MDMA and amphetamine respectively. However, seizures have been noted in other countries, such as Canada.
38 China also announced tighter controls on the manufacture of ephe-drine, P-2-P, and hydroxylamine hydrochloride (the precursor of ketamine).
South-East Asia, much of it for legitimate industry.39 In February 2009, the Government of Cambodia disposed of almost 15 mt of safrole-rich oils with an additional 5.2 mt seized in June 2009, while 45 mt of safrole was reported seized by Thailand in 2007. Given the signifi-cant volume of safrole-rich oils available, there is a high likelihood that illicit manufacturers will turn to using SRO. It is important to note that SRO-based operations are already being reported by countries in Europe and around the world.40
39 UNODC, Essential Oils Rich in Safrole, Survey of Production, Trade, and Use in East and South-East Asia, 2006.
40 SYNDEC4, Operation Counter Curse presentation by the DEA, November 2009; Two arrested and police uncover first ever clan lab used in manufacture of safrole oil precursor for MDMA, New South Wales Police Media Release 28 January 2010.
Europe as the source of seized ecstasy-group substances as mentioned by Member States, Fig. 78: 2002-2008
Source: UNODC ARQ/DELTA.
73%
82%
25%
50%
75%
100%
2002(88)
2003(95)
2004(82)
2005(69)
2006(73)
2007(77)
2008(70)
Year (Number of All Countries reporting)
Seiz
ed M
DM
A S
ou
rced
fro
m E
uro
pe
(%)
All countries
Countriesoutside Europe
Europeancountries
Seizures (in mt) of ecstasy-group Fig. 79: precursor chemicals in Europe, 2002-2008
Source: INCB
0
2
4
6
8
10
12
14
16
18
2002 2003 2004 2005 2006 2007 2008
Seiz
ure
vo
lum
e (t
ho
usa
nd
s)
Safrole (litres)Piperonal (kg)Isosafrole (litres)3,4-MDP-2-P (litres)3,4-MDP-2-P (Global total in litres)


113
1. Transnational drug market analysis Amphetamine-type stimulants market
The average street price for a tablet sold as ‘ecstasy’ in Europe does not appear to have increased, particularly in the larger West European markets,46 as the pipera-zine-containing tablets command a similar street price in Europe as MDMA, roughly €4 per tablet. However, after controlling for varying purity, the price per pure gram of a tablet of MDMA may likely increase in 2009, even though the price per tablet may not.
Illicit manufactures exploit the lack of national and international controls over piperazines and other new synthetic substances to continue ‘ecstasy’ sales. Pipera-zines are not under international control,47 and with the exception of BZP, most countries have limited or no national controls. In addition to piperazines, many new synthetic substances are also being sold as or in the ‘ecstasy’ market.48
One of those, methyl-methcathinone (mephedrone), has been related to major headlines in European news, because of its association with fatalities. Given their legal status, their street sale at a similar price as MDMA would command significantly higher profit margins, provide little chance of criminal sanctions, and likely expand the ‘ecstasy’ user market.49 It is also important
46 Estimated street price based on Member State responses for ecstasy (MDMA) tablets, weighted by population and adjusted for currency fluctuation and inflation. In cases where a price range was given, the mid-point was substituted.
47 Note though, that several piperazines have been proposed for critical review by WHO, the first step towards international controls.
48 The appearance of synthetic cannabinoid-like substances is not sub-ject of this report as they are more related to the cannabis market. However, the same considerations for legal status, profits and risks to users apply.
49 In 2006, legal piperazine party pills in New Zealand emerged as the fourth most widely tried drug type with twice as many people (aged 13-45) having tried legal party pills as the next most commonly tried drug, amphetamine. Wilkins C., et al., Trends in drug use in the
to note that the toxicity in humans of the majority of these new substitutes has never been assessed.
Until European demand for MDMA can be met by MDMA imported from other manufacturing locations, alternative MDMA precursor chemicals such as safrole can be adequately sourced, or the traditional MDMA precursor (3,4-MDP-2-P) can be obtained from alterna-tive sources, the trend in end-product substitution can be expected to continue into the foreseeable future.
population in New Zealand: Findings from national household drug sur-veying in 1998, 2001, 2003 and 2006, Centre for Social and Health Outcomes Research and Evaluation, Auckland, 2007.
The composition of ‘ecstasy’ tablets Fig. 80: seized in the United Kingdom, 2006-2009
Source: United Kingdom Forensic Science Services
Tablets sold as ‘ecstasy’ containing Fig. 81: non-controlled psychoactive sub-stances in the Netherlands, 1999-2008
Source: Vogels N., Brunt T.M., Rigter S., van Dijk P., Vervaeke H. and Niesink R.J., “Content of ecstasy in the Netherlands: 1993-2008,” Addiction 104(12): 2057-66, 2009
Street price of European Fig. 82: ‘ecstasy’ tablets, 2004-2008
*Weighted for population, currency and inflation-adjusted. Source: UNODC ARQ
0%
5%
10%
15%
20%
25%
30%
1999
2000
2001
2002
2003
2004
2005
2006
2007
2008
Cas
es o
ther
psy
cho
acti
ve s
ub
stan
ces
in
tab
lets
so
ld a
s ec
stas
y (%
)
-
200
400
600
800
1,000
1,200
1 Q
tr2
Qtr
3 Q
tr4
Qtr
1 Q
tr2
Qtr
3 Q
tr4
Qtr
1 Q
tr2
Qtr
3 Q
tr4
Qtr
1 Q
tr2
Qtr
3 Q
tr4
Qtr
2006 2007 2008 2009
Nu
mb
er o
f se
izu
res
P iperazine MDMA
0
3
6
9
12
2004 2005 2006 2007 2008
Stre
et P
rice
per
Tab
let
()
Europe Western Eastern

114
World Drug Report 2010
Asia: Vulnerable to illicit ATS manufacture
To limit the availability of precursor chemicals for illicit manufacture of synthetic drugs, there must be an inter-national regulatory control system for the substance, it must be operationally used and enforced, and it should be coupled with domestic controls and fit-for-purpose cooperation mechanisms with relevant industries. There are several examples across Asia where the lack of con-trols have made countries vulnerable to attempts by criminals to obtain precursor chemicals for and/or estab-lish illicit ATS manufacturing operations. The examples below illustrate the continuous flow of methampheta-mine tablets from areas in Myanmar outside the central Government’s control; the dramatically increasing use and availability of ketamine in parts of South-East Asia linked to the absence of international restrictions on the substance; and the unusually high annual legitimate
requirements of key precursors in the Near and Middle East and South-West Asia, which may indicate potential for diversion of chemicals for illicit manufacture of methamphetamine and amphetamine (specifically in the form of Captagon)50.
Myanmar: continuous flow of methampheta-mine tablets from areas outside the central Government’s control
Myanmar ranks fourth of the countries in East and South-East Asia that are most frequently cited as a source of methamphetamine (both crystalline methampheta-
50 Captagon was originally the trade name for a pharmaceutical prepara-tion containing fenetylline, a synthetic stimulant. Today, most tablets seized as Captagon essentially contain amphetamine, typically in combination with caffeine and sometimes with a few other adulter-ants.
More methamphetamine in East and South-East AsiaIndicators suggest increased availability and use of methamphetamine throughout East and South-East Asia. All countries in East and South-East Asia already report the use of methamphetamine with many reporting it as their primary drug of use, either in tablet form (yaba) or high purity crystalline form, with increasing use levels in 2008.1
Increases in arrests and seizures also point to a significant growth in the availability of methamphetamine tablets on the market. Since 2004, methamphetamine arrests in Thailand— one of the largest consumer markets of tableted methamphetamine—have increased four-fold to 120,000 arrests in 2008, or 86% of the regional total. The number of tablets seized in Thailand also increased, jumping by more than 50% between 2007 and 2008 to 22 million tab-lets. Preliminary data suggest that further increases in the region are expected again for 2009.2
1 UNODC, Patterns and trends of amphetamine-type stimulants and other drugs in East and South-East Asia (and neighbouring regions) 2009, November 2009.
2 Ibid.
Expert perception in the change in use of methamphetamine tablet or Fig. 83: crystalline forms from 2007 to 2008
Source: UNODC, Patterns and trends of amphetamine-type stimulants and other drugs in East and South-East Asia (and neighbouring regions) 2009, November 2009
Methamphetamine pill use trend in East and South-East Asia
IncreaseStableDecreaseNo trend reported 2008/2009
Note: The boundaries and names shown and the designations used on this map do not imply official endorsement or acceptance by the United Nations.
Crystalline methamphetamine use trend in East and South-East Asia
IncreaseStableDecreaseNo trend reported 2008/2009
Note: The boundaries and names shown and the designations used on this map do not imply official endorsement or acceptance by the United Nations.
Methamphetamine pill use trend in East and South-East Asia Crystalline methamphetamine use trend in East and South-East Asia

115
1. Transnational drug market analysis Amphetamine-type stimulants market
mine and methamphetamine tablets).51 Of the coun-tries traditionally associated with illicit methamphetamine tablets, Myanmar shares the top rank with Thailand.52 Forensic data indicate that methamphetamine tablets come primarily from Myanmar’s Shan State’s various Special Regions near the eastern border with China and Thailand, which are under the control of armed ethnic groups operating outside the control of the central Gov-ernment.53 Because laboratories in these areas operate without fear of government forces, few significant sei-zures of precursor chemicals, ATS end-products or clan-destine laboratories occur. For instance, between 1998 and 2009, the government reported seizing 39 'tablet-ing' operations of which only two were reported to be of a 'large-scale'.54 There are no reports of laboratories manufacturing methamphetamine powder (versus tab-leting laboratories). Similarly, of the 32 million tablets seized in East and South-East Asia in 2008, only about 3% (or 1.1 million) were reportedly seized in Myanmar. However the number of tablets and amount of precursor chemicals seized in Myanmar jumped in 2009, when, inter alia, the central Government entered by force parts of the North and Eastern Shan State not under their control.
Increasing amounts of precursors were seized in the form of tableted pharmaceutical preparations in 2009 which
51 Information based on 115 mentions of the source of seized meth-amphetamine (both crystalline and in tablet form). Mentions of Japan as a source country reflects the difficulty in identifying source countries and transiting countries. Japan has reported no clandestine manufacture to UNODC.
52 Note that Myanmar reports seizures of methamphetamine in the form of tablets, powder and in crystalline form.
53 Primarily the north and east Shan State however illicit manufacture of methamphetamine is also reported to occur in the Wa and Kokang autonomous regions.
54 Myanmar, Central Committee for Drug Abuse Control.
suggests that sourcing bulk precursor chemicals may have also become more difficult in Myanmar. Reports in 2009 identified the trafficking of preparations of ephe-drine in liquid form with a seizure of 240 litres of ephe-drine solution contained in more than 120,000 small nasal drop bottles, enough for about 5.5 million 30 mg methamphetamine tablets. The shift from bulk ephe-drine to tableted and now liquid forms of pharmaceuti-cal preparations containing ephedrine may be an indicator of a diversification of precursor supplies, a scenario which has also been reported in other countries with large-scale illicit drug manufacture.55
Ketamine in South-East Asia
Ketamine, while not under international control, is often found along with methamphetamine in tablets sold as ‘ecstasy’ and its use is an increasing concern in East and South-East Asia. There are also indications that it is starting to spread outside South-East Asia, reflected in the declining proportion of ketamine seizures in that region to 86% of global totals (8.2 mt or more than double global 'ecstasy' seizures) in 2008.
The growing use of ketamine is of particular concern in Hong Kong, China, as the demand for high quality MDMA ('ecstasy') appears to be decreasing. While the number of registered drug users for ecstasy-group sub-stances has seen a 40% decline since 2004, the number of ketamine users has doubled.
Part of ketamine’s growth in popularity has been its
55 In June 2009, authorities in Mexico seized 49,630 litres of a pharma-ceutical solution containing pseudoephedrine. International Narcot-ics Control Board, Precursors and chemicals frequently used in the illicit manufacture of narcotic drugs and psychotropic substances, 2009, New York, 2010.
Sources of seized methamphetamine Fig. 84: (both crystalline and in tablet form) as mentioned by East and South-East Asian countries/territories, 2002-2008
Source: UNODC ARQ
Methamphetamine tablets and precur-Fig. 85: sor seizures in Myanmar, 2003-2009
Source: INCB 2003-2009; Central Committee for Drug Abuse Control 2009
5123
223
51718
2829
0 5 10 15 20 25 30
S outh-E ast As ia (4.3%)Cambodia (0.9%)
Hong Kong, China (1.7%)Indones ia (2.6%)
J apan (1.7%)Lao P DR (1.7%)
Taiwan, P rov. of China (2.6%)Malays ia (4.3%)
Myanmar (14.8%)Thailand (15.7%)
P hilippines (24.3%)China (25.2%)
Methamphetamine mentions (#)
0
200
400
600
800
1,000
1,200
1,400
1,600
2003
2004
2005
2006
2007
2008
2009
Prec
urs
or
seiz
ed (
kg)
0
10,000,000
20,000,000
30,000,000
Met
ham
ph
etam
ine
seiz
ed (
tab
lets
)
Ephedrine seized (kg)
Methamphetamine tablets
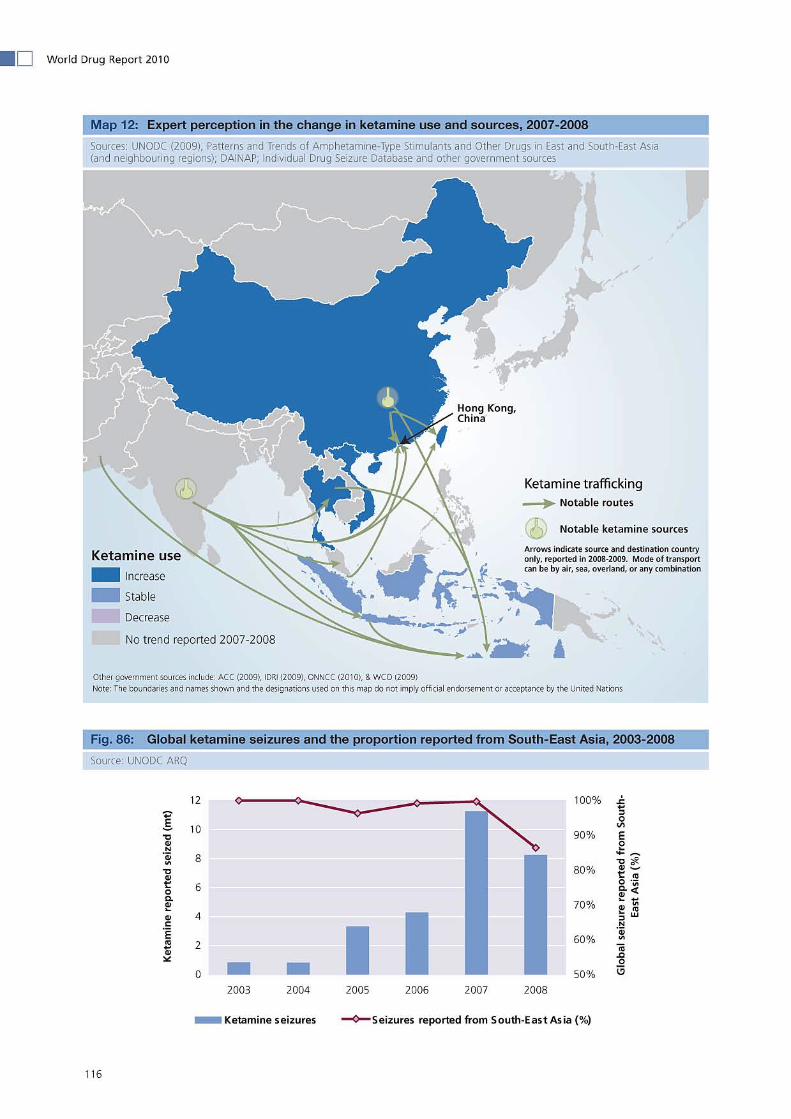

117
1. Transnational drug market analysis Amphetamine-type stimulants market
continuously low price. For example, between 2007 and 2009, the average price per pure gram in Hong Kong, China was just HK$144, making it a cheap substitute for the increasingly expensive 'ecstasy' or methampheta-mine.
Diversion from licit trade remains the primary source of ketamine with significant seizures being reported in various countries over the last couple of years. In Decem-ber 2009, customs authorities in India seized a record 440 kg of ketamine en route to Malaysia.56 However, industrial-scale illicit ketamine manufacture is also emerging. In 2009, China reported seizing two illicit laboratories processing hydroxylamine hydrochloride, the immediate precursor chemical for ketamine, and seizing 8.5 mt of this substance. In 2009, China announced tighter controls over the manufacture of hydroxylamine hydrochloride and other precursor chemicals.
Possible emerging locations for large-scale manufacture in parts of Asia
One of the most disturbing new ATS trends is the increase of methamphetamine in South-West Asia, a region already suffering from large-scale opium produc-tion and use. This specifically refers to the sudden and massive increase of reported seizures of high purity crys-talline methamphetamine ('Shisheh") from the Islamic Republic of Iran which began in 2008. In 2008, the country also seized four clandestine methamphetamine laboratories—their first reports ever—and has since reported quickly decreasing street prices and an increase
56 DRI Chennai effects single largest ever seizure of 440 kgs. of keta-mine worth RS. 44 crores at Tuticorin, Government of India, Min-istry of Finance (Department of Revenue) Directorate of Revenue Intelligence, 25 December 2009.
in methamphetamine use.57 That manufacture outpaces domestic consumption is also reflected in the notable increase in 2009 in the frequency and extent of reported methamphetamine trafficking from Islamic Republic of Iran, with much of this destined for lucrative markets in East and South-East Asia.58
The starting material used in the illicit manufacture of methamphetamine in the Islamic Republic of Iran is most likely domestically diverted pseudoephedrine. Since 2006, the first year such reporting was required by the INCB59, the Islamic Republic of Iran has reported notable increases in its annual legitimate requirement of the chemical. In just four years, the demand grew to give the Islamic Republic of Iran the fourth highest legiti-mate requirement in the world. Not only does this increase the likelihood of domestic diversion, but it also makes the country an attractive target for precursor diversion by transnational organized crime groups. That this may be more than a realistic concern is evidenced by recent reports of two stopped shipments of pseudoephe-drine totaling 11 mt, both destined for Ethiopia.
An example of how rapidly increasing annual legitimate
57 DCHQ Deputy SG, Prices of the synthetic drugs have dropped to one fourth, 6 October 2009, Islamic Republic of Iran National Drug Headquarters; UNODC World Drug Report 2009
58 737 kg of various drugs were found in airports this year, Official Islamic Republic News Agency; Global SMART Update 2009, vol. 2, October 2009.
59 Countries provide INCB with annual estimates of their legitimate requirements for various ATS precursor chemicals to prevent their diversion into illicit manufacturing. In 2009, 91 countries reported their annual legitimate requirements for pseudoephedrine (bulk and preparations), 98 for ephedrine (bulk and preparations), and 15 for P-2-P. INCB, Annual legitimate requirements reported by Governments for ephedrine, pseudoephedrine, 3,4-methylenedioxyphenyl-2-propanone, 1-phenyl-2-propanone and their preparations, 2 March 2010 and past publications.
Hong Kong, China: ketamine, meth-Fig. 87: amphetamine and ecstasy-group drug registry cases, 1999-2008
Source: Central Registry of Drug Abuse, Narcotics Division (ND), Security Bureau, Hong Kong Special Administrative Region, China.
Purity-adjusted quarterly street prices Fig. 88: for various drugs sold in the ATS mar-ket in Hong Kong, China, 2007-2009
Source: Hong Kong Police Narcotic Bureau
5,042
792
1360
0
2,000
4,000
6,000
1999
2000
2001
2002
2003
2004
2005
2006
2007
2008
Dru
g r
egis
try
per
son
s (#
)
Ketamine Ecstasy-group
Methamphetmine (Ice)
0
200
400
600
800
1000
1200
4th
Qtr
200
7
1st
Qtr
200
8
2nd
Qtr
200
8
3rd
Qtr
200
8
4th
Qtr
200
8
1st
Qtr
200
9
2nd
Qtr
200
9
3rd
Qtr
200
9
4th
Qtr
200
9
Pric
e p
er p
ure
gra
m (
HK
D$)
Methamphetamine Ketamine
Ecstasy (per gr)

118
World Drug Report 2010
requirements can be an indicator for diversion into illicit manufacture can be seen in South-Asia. Since 2006, Bangladesh’s annual legitimate requirement for pseu-doephedrine has tripled, now making it the 6th highest in the world. In 2009, Bangladesh was first identified as a source country for tableted pharmaceutical prepara-tions containing pseudoephedrine diverted into illicit drug manufacture with multi-million tablet shipments being seized in Central America, destined for Mexico. Bangladesh may also become a target for diversion of pseudoephedrine into neighboring Myanmar’s illicit methamphetamine manufacture if pressure upon Myan-mar’s precursor supply continues.
A similar situation may also be occurring in the Near and Middle East, where the diversion of phenyl-2-pro-panone (P-2-P) may be fueling the region’s expanding Captagon market. Jordan reported its annual legitimate requirement of P-2-P at 60,500 kg in 2009, accounting for more than half of the global total. The high legiti-mate need is based on the purported formulation of P-2-P into 'cleaning and disinfection' products. How-ever the volume represents a significant risk of diversion into illicit Captagon manufacture, particularly as P-2-P is not an essential ingredient in the formulation of clean-ing and disinfection products and alternative chemicals exist.
The most common way of obtaining requisite precursor chemicals and some of the common psychoactive sub-stances substituting for controlled synthetic drugs, such as ketamine, is by their diversion from legitimate trade. The few examples highlighted herein illustrate that to be effective in preventing such diversions, governments must not only have functioning regulatory controls in
place, addressing both international and domestic trade, but that they must be vigilantly re-assessed for purpose.
Implications for response1.4.5
The increasing size and complexity of illicit ATS opera-tions encountered over the past 10 years point to increased involvement of criminal organizations, from the sourcing of precursor chemicals to the manufacture and trafficking of the ATS end-products. Yet, the intrin-sic characteristics of ATS manufacture and trafficking, namely the independence from geographically defined source regions for raw materials and the geographic
Islamic Republic of Iran annual legiti-Fig. 89: mate requirement of pseudoephedrine versus crystalline methamphetamine seizures, 2005-2009
Sources: ARQ/DELTA, INCB, Annual legitimate requirements reported by Governments for ephedrine, pseudoephedrine, 3,4-methylenedioxyphenyl-2-propanone, 1-phenyl-2-pro-panone and their preparations
Bangladesh annual legitimate require-Fig. 90: ment of pseudoephedrine, 2006-2009
Sources: INCB, Annual legitimate requirements reported by Governments for ephedrine, pseudoephedrine, 3,4-methylen-edioxyphenyl-2-propanone, 1-phenyl-2-propanone and their preparations
0
10,000
20,000
30,000
40,000
50,000
60,000
2005 2006 2007 2008 2009
An
nu
al le
git
imat
e re
qu
irem
ent
(kg
)
0
20
40
60
80
100
120
140
160
Met
ham
ph
etam
ine
seiz
ed (
kg)
Annual legitimate requirements of pseudoephedrine (kg)
crystalline methamphetamine seized (kg)
0
10,000
20,000
30,000
40,000
50,000
2006 2007 2008 2009
An
nu
al le
git
imat
e p
seu
do
eph
edri
ne
req
uir
emen
t (k
g)
Global annual legitimate requirement Fig. 91: for P-2-P reported by Governments, 2009
Source: INCB, Annual legitimate requirements reported by Governments for ephedrine, pseudoephedrine, 3,4-methylen-edioxyphenyl-2-propanone, 1-phenyl-2-propanone and their preparations
Jordan54%
Hungary1%
United States ofAmerica
41%Brazil3%
All others1%

119
1. Transnational drug market analysis Amphetamine-type stimulants market
closeness of manufacturing locations and consumer markets, limit the range and effectiveness of supply-side interventions when compared to heroin and cocaine.
The discussion above indicates that control of ATS pre-cursors can be successful. In addition, evidence-based prevention and treatment have shown some cost-effec-tive results.60 Both measures work best when imple-mented in a holistic, comprehensive manner and when accompanied by the early identification of emerging developments.
The generation of a timely evidence-base is the only way in which to quickly identify the rapidly changing ATS market and respond with appropriate policies and pro-grammes. The expansion of targeted capacity building programmes, such as Global SMART, which support both forensic and synthetic drug data collection, have been shown invaluable in countries and regions with significant ATS markets. To avoid shifts from one coun-try to another, or one region to the next, there is a grow-ing need for a strategic early warning system to identify emerging synthetic drugs, new products and combina-tions, controlled and non-controlled, substitute precur-sor chemicals, diversions (including stopped, suspended and cancelled shipments), common adulterants and key equipment used in their manufacture. This information must be shared quickly at national, regional and inter-national levels so as to allow timely or even preemptive responses.
Given the widespread availability of certain ATS, the rapid emergence of new synthetic drugs and non-con-trolled substitutes, and their use in school, work and recreational settings, a holistic approach is required which looks beyond internationally controlled ATS into the recreational 'pill market' more generally and inte-grates responses into the wider concept of health promo-tion. Investments in prevention programmes that increase the awareness as to the health risk of these drugs appear to have played a role in the decline in use, par-ticularly among youth in developed countries. This has specifically proven successful where prevention and treatment services have met the needs of and been accepted by ATS users. The expansion of evidence-based treatment programmes in developed countries has also reduced the likelihood that problem ATS users return to patterns of chronic drug use. However, evidence-based ATS treatment programmes are often the exception, not the rule, especially in countries where emerging problem
60 Spoth, R. and Guyll, M., Prevention’s Cost Effectiveness Illustrative Eco-nomic Benefits of General Population Interventions, in United Nations Office on Drugs and Crime Technical Seminar on Drug Addiction Prevention and Treatment: From Research to Practice, 2008. Iowa State University (December 2008); Cost effectiveness and cost ben-efit analysis of substance abuse treatment: an annotated bibliography, National Evaluation Data Services, Center for Substance Abuse Treat-ment (SAMSHA), US Department of Health and Human Services, 2002.
ATS use is occurring and health care and treatment professionals are simply not trained or do not have the resources to identify and respond to the unique charac-teristics manifested in ATS users.
Precursor control works. It is clear that when existing regulatory controls are implemented and all counter-parts exert the necessary vigilance to identify unusual transactions, suspicious legitimate needs and fictitious end-uses of precursor chemicals, significant reductions in the availability of precursors for illicit purposes can be made. Understanding legitimate industrial requirements and monitoring the entire chain from precursor manu-facture, distribution to end-use, both domestically and internationally, are the only means to identify unusual or suspicious transactions. This also includes scrutiniz-ing annual assessments of legitimate requirements—particularly if these increase significantly year-over-year, and may initially be considered to reflect a newly devel-oping legitimate industry. Systematically checking the legitimacy of individual precursor chemical shipments should become the norm for all countries trading in these substances. The tool for this is available in form of the INCB Pre-Export Notification (PEN) online system, which has already proven successful in international precursor operations by stopping suspicious shipments before they leave the country. However, currently only 76 countries (40% of UN Member States) regularly use this real-time system.
Regulatory controls must be complemented by law enforcement action. Seizures should be the beginning of an investigation, not the end. Available specialized inves-tigative techniques include controlled deliveries and back-tracking investigations, which could be utilized more systematically for the ATS end-products, their precursors, and key manufacturing equipment such as new and used pill presses, so as to dismantle the entire criminal manufacture chain. This approach will be of increasing importance also as an element of precursor control strategies, as today diversions often occur at national level, followed by smuggling across interna-tional borders.
Better and more timely information, combined with increased awareness of the peculiarities of ATS and their precursors, can be expected to contribute to changing the prevailing low attention devoted towards ATS in some regions, especially those that have historically been associated with the cultivation and/or production of the 'traditional' drugs opium/heroin and cocaine, thus increasing interceptions. Finally, history also shows the importance of regionally and internationally coordi-nated responses to the ever-changing ATS and precursor chemical situation both in terms of regional shifts and emergence of new precursors, ATS and/or substitutes for either.


2. DRUG STATISTICS AND TRENDS

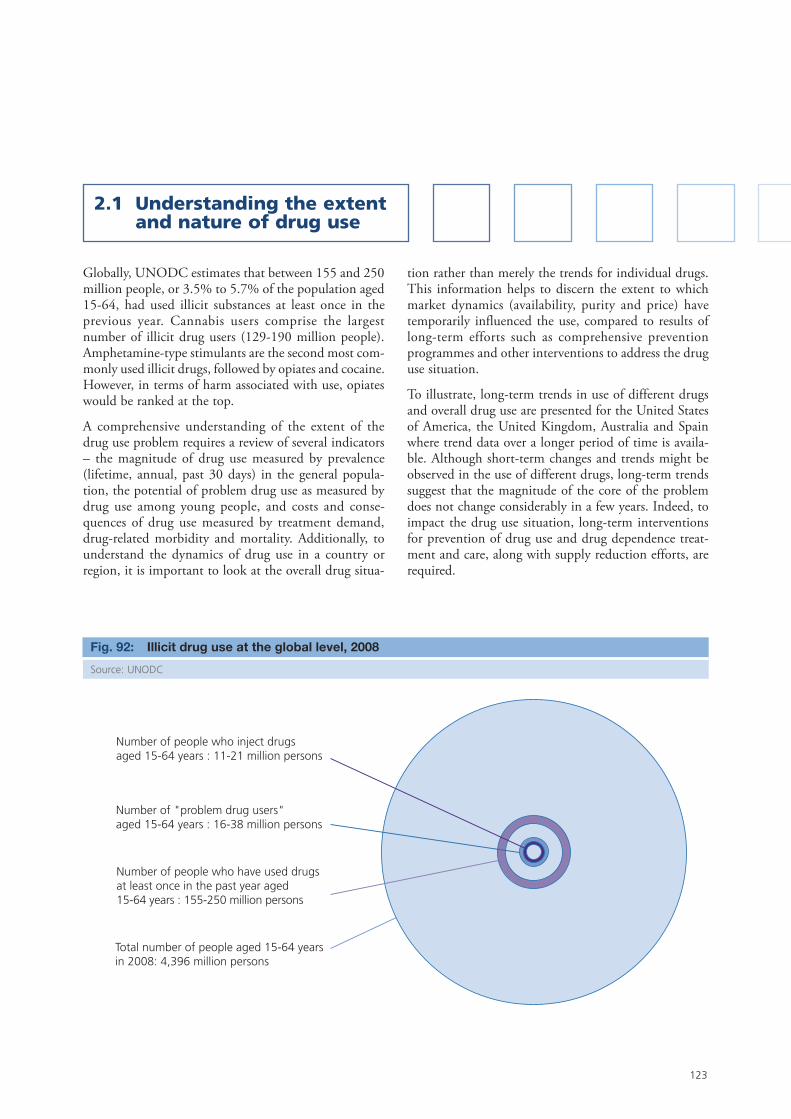
2.1 Understanding the extent and nature of drug use
123
Globally, UNODC estimates that between 155 and 250 million people, or 3.5% to 5.7% of the population aged 15-64, had used illicit substances at least once in the previous year. Cannabis users comprise the largest number of illicit drug users (129-190 million people). Amphetamine-type stimulants are the second most com-monly used illicit drugs, followed by opiates and cocaine. However, in terms of harm associated with use, opiates would be ranked at the top.
A comprehensive understanding of the extent of the drug use problem requires a review of several indicators – the magnitude of drug use measured by prevalence (lifetime, annual, past 30 days) in the general popula-tion, the potential of problem drug use as measured by drug use among young people, and costs and conse-quences of drug use measured by treatment demand, drug-related morbidity and mortality. Additionally, to understand the dynamics of drug use in a country or region, it is important to look at the overall drug situa-
tion rather than merely the trends for individual drugs. This information helps to discern the extent to which market dynamics (availability, purity and price) have temporarily influenced the use, compared to results of long-term efforts such as comprehensive prevention programmes and other interventions to address the drug use situation.
To illustrate, long-term trends in use of different drugs and overall drug use are presented for the United States of America, the United Kingdom, Australia and Spain where trend data over a longer period of time is availa-ble. Although short-term changes and trends might be observed in the use of different drugs, long-term trends suggest that the magnitude of the core of the problem does not change considerably in a few years. Indeed, to impact the drug use situation, long-term interventions for prevention of drug use and drug dependence treat-ment and care, along with supply reduction efforts, are required.
Number of people who inject drugsaged 15-64 years : 11-21 million persons
Number of "problem drug users" aged 15-64 years : 16-38 million persons
Number of people who have used drugsat least once in the past year aged 15-64 years : 155-250 million persons
Total number of people aged 15-64 yearsin 2008: 4,396 million persons
Illicit drug use at the global level, 2008Fig. 92:
Source: UNODC

124
World Drug Report 2010
United States: Dependence on or Fig. 93: abuse of drugs in the past year among persons aged 12 or older, 2002-2008*
* The difference between the estimates was only statistically significant for opioid painkillers in 2003/2004 and 2008.
Source: Substance Abuse and Mental Health Services Adminis-tration, Results from the 2000-2008 National Survey on Drug Use and Health: National Findings, Office of Applied Studies, US Department of Health and Human Services
US: Types of drug use in the past year Fig. 94: among persons aged 12 and older, 2000-2008
Source: Substance Abuse and Mental Health Services Adminis-tration, Results from the 2000-2008 National Survey on Drug Use and Health: National Findings, Office of Applied Studies, US Department of Health and Human Services
UK: drug use trends among population Fig. 95: aged 16-59, 2000-2008/2009
Source: Hoare J, Home Office Statistical Bulletin, Drug Misuse Declared: Findings from the 2008/09 British Crime Survey, England and Wales, Home Office, UK July 2009
Australia: drug use trends among Fig. 96: population aged 14 and over, 1991-2007
Source: Australia, National Campaign Against Drug Abuse Household Surveys 1991, 1993, National Drug Strategy Household Survey 1995, 1996, 2001, 2004 and 2007
+ difference between this es timate and 2008 estimate is s tatis tically s ignificant at .05 level
4.3 4.24.5
3.94.2
1.5 1.5 1.6 1.5 1.7
1.5 1.5 1.6
76.976.87.3
6.87.1
4.24.1
1.6 1.4
1.71.71.4+ 1.4+
0
1
2
3
4
5
6
7
8
2002 2003 2004 2005 2006 2007 2008
Nu
mb
ers
in m
illio
ns
Illic it drugs Marijuana
Cocaine Opioids pain relievers
0.9
14.214.414.514.414.514.714.9
12.6
11.010.310.110.310.410.610.611.0
9.38.3
1.92.5 2.5 2.4 2.3 2.5 2.3 2.1
1.5
0.20.0
0.8
4.85.05.14.94.74.94.73.7
2.9
0.0
2.0
4.0
6.0
8.0
10.0
12.0
14.0
16.0
2000 2001 2002 2003 2004 2005 2006 2007 2008
An
nu
al p
reva
len
ce (
%)
Any Illicit Drug Marijuana and Hashish
Cocaine Heroin
Ecstasy Pain Relievers
1.82.2 2 2 1.8 1.8
0.1
1.2
2.52
2.4 2.6 2.43
2.122
1.51.81.6
0.3
2.1 1.6 1.6 1.5 1.4 1.3 1.3 1
7.97.668.28.7
9.7
10.810.910.610.5
0
2
4
6
8
10
12
2000
2001
/02
2002
/03
2003
/04
2004
/05
2005
/06
2006
/07
2007
/08
2008
/09
An
nu
al p
reva
len
ce (
%)
Cocaine EcstasyOpiates AmphetamineCannabis
13.712.7 13.1
17.9
12.911.3
9.1
2.52
3.7
15.314
17
22
16.915.3
13.4
3.13.15.2
3.51.7
0.20.4
2.12.6
3.21.1
3.5
0
5
10
15
20
25
1991 1993 1995 1998 2001 2004 2007
An
nu
al p
reva
len
ce (
%)
CannabisPain killers and analgesicsHeroinMethamphetamineCocaineEcstasyAny illicit drug

125
2. Drug statistics and trends Understanding the extent and nature of drug use
Problem drug use
At the core of drug use lie the problem drug users; those that might be regular or frequent users of the substances, considered dependent or injecting and who would have faced social and health consequences as a result of their drug use. Information on problem drug users from a policy and programme planning perspective is impor-tant as this drives the need and nature of the services required to address the diverse needs for treatment and care of drug dependent persons.
Lack of a global standard definition of a problem drug user
One of the main challenges for UNODC remains the compilation of data reported by Member States and their comparability across countries and regions. The Commission on Narcotics Drugs in its forty-third ses-sion in 2000 endorsed the paper on 'Drug information systems: principles, structures and indicators'1 – also known as the 'Lisbon Consensus Document'. The docu-ment outlines the set of core epidemiological indicators to monitor the drug abuse situation, against which Member States could report their respective situations through the Annual Reports Questionnaire (ARQ). One of the core indicators in the paper was ‘high-risk drug consumption’. The assumption was that some drug-
1 Drug information systems: principles, structures and indicators (E/CN.7/2000/CRP.3).
taking behaviours were particularly associated with severe problems and as such merit the attention of poli-cymakers. The document further elaborated that high-risk consumption included information on the number of drug injectors, estimates of daily users and those who are dependent. One challenge in measuring problem drug users or high-risk drug consumption is that most of these behaviours are hidden and have low prevalence. Therefore, they are poorly covered by general popula-tion estimates. Specific methods are required to gather information on such behaviours.
Out of the 110 Member States who responded to the 2008 ARQ on the extent and pattern of drug use, only 24 reported information on problem drug use. The definitions and methods of calculation differ from coun-try to country. One country in Africa defines problem drug use as “drug users who constitute social harm and insecurity and drug users who relapse after rehabilitation.”2 In North America, the DSM-IV3 defines the criteria for illicit drug dependence or abuse, while one country in Asia only considers heroin injectors as problem drug users. The European Monitoring Centre for Drugs and Drug Addiction (EMCDDA), in its efforts to compile comparable information on problem drug use, defines it as “injecting drug use or long duration/regular use of
2 ARQ: Nigeria 2008.3 American Psychiatric Association, Diagnostic and Statistical Manual
on Mental Disorders (see Box in cocaine market chapter).
Spain: drug use trends among Fig. 97: population aged 15-64, 1995-2007/08
Source: UNODC and EMCDDA
Europe: Estimated trends in overall Fig. 98: problem drug use in selected countries from where data was available (2002-2007), rate per 1,000 population aged 15-64
Source: EMCDDA – Statistical Bulletin 2009
1.91.2
0.1
7.3
9.7
77.6
11.3 11.210.1
1.9
2.6
1.61.7
2.7 3.0 3.1
1.1
1.2
0.9
0.50.5 0.6 0.6 0.30
2
4
6
8
10
12
1995
1997
1999
2001
2003
2005
/06
2007
/08
An
nu
al p
reva
len
ce (
%)
Cannabis CocaineAmphetamine EcstasyOpiate
2.65
4
6.1
4.2
4.9
4.02
4.14 4.37
2.09
1.75
2.7
2.52.47
8.648.37.997.818.08
1.91 1.34 1.5
5.76.2
5.8
4.14
4.55.38 4.84.9
4.7
0
1
2
3
4
5
6
7
8
9
10
2002 2003 2004 2005 2006 2007
Prev
alen
ce (
rate
per
100
0 p
op
ula
tio
n)
Czech Republic GermanyGreece ItalyCyprus MaltaAustria Slovakia
126
World Drug Report 2010
opioids, cocaine and/or amphetamines.”4 The broad scope and differences in defining and understanding problem drug use in different regions signifies the need for setting common parameters, based on an already acceptable definition or criterion, for example, DSM-IV or ICD – 10 (WHO International Classification of Diseases – Revision 10), for determining, reporting and comparing the extent of harmful or high risk drug use at global level.
4 EMCDDA Guidelines for Estimating the Incidence of Problem Drug Use, February 2008.
The global number of problem drug users is stable
Based on the global estimates of cannabis, opiate, cocaine and amphetamine-type stimulant users, and using the relative risk coefficient,5 it is estimated that in 2008, there were between 16 and 38 million problem drug users (between 10%-15% of estimated drug users) in the world. The broad range of the estimate reflects the uncertainties in the available data globally.
5 The relative risk coefficient takes opiates as the index drug and cal-culates the coefficient for treatment, injecting drug use, toxicity and deaths.
Drug use – nature and typologyScientific evidence indicates that the drug use is a result of a complex multifactorial interaction between repeated exposure to drugs, and biological and environmental fac-tors. In recent years, the biopsychosocial model has rec-ognized drug dependence as a multifaceted problem requiring the expertise of many disciplines. A health sci-ences multidisciplinary approach can be applied to research, prevention and treatment of drug use.
Recreational Some forms of drug use are associated with recreational settings or specific sub-populations, for example, ecstasy use, which is found more among young people and asso-ciated with particular lifestyle and events (parties, night-clubs and dance events) seen in many affluent societies. Also among those who use drugs in recreational settings, a significant proportion could be induced to substance abuse with the purpose of coping with anxiety, poor emotional skills, poor capacity to manage stressful stim-uli and difficult environmental situations, poor engage-ment in school and lack of vocational skills.
Society, family, life experienceUse of opiates, cocaine, amphetamine and metham-phetamine, and those injecting, account for a substantial proportion of dependent or problem drug users (however defined). These drug users also tend to be more chronic users, with associated psychiatric and medical co-mor-bidities, and are either stigmatized or come from margin-alized segments of society. Many studies have shown a strong association between poverty, social exclusion and problem drug use.
Studies also suggest the possibility that childhood experi-ences of neglect and poor parent-child attachment may partially contribute to a complex neurobiological derange-ment and dopamine system dysfunctions, playing a cru-cial role in susceptibility to addictive and affective disorders.1
Different kinds of adverse childhood experiences, such as self-reported supervision neglect, physical neglect, physi-cal assault and contact sexual abuse, have been reported in association with adolescent cigarette, alcohol, cannabis and inhalant use, as well as violent behaviour.2
Epidemiological data also show a frequent association between stress-related disorders such as post traumatic stress disorder (PTSD) and substance use disorder. Stud-ies have examined the association between traumatic exposure, PTSD and substance use that have shown early onset of marijuana and heroin use, while alcohol depend-ence and opiate dependence were each associated with exposure to a traumatic event.3
Psychiatric disordersFurther studies have shown that individuals with lifetime mental disorder were three times more likely than others to be dependent on substances. Patients suffering from bipolar disorders (manic-depressive disorders) are more likely to be using psychoactive substances compared with those suffering from unipolar major depression.4 On the other hand, use of psycho-stimulants such as ampheta-mine or cocaine and cannabis can also induce psychotic-like symptoms in users.
1 Gerra G. et al., “Childhood neglect and parental care perception in cocaine addicts: Relation with psychiatric symptoms and biologi-cal correlates,” Neuroscience and Biobehavioral Reviews, 33 (2009) 601-610.
2 Hussey J.M., Chang J.J. and Kotch J.B., “Child maltreatment in the United States: prevalence, risk factors, and adolescent health consequences”, Pediatrics, September 2006, 118(3):933-942.
3 Gerra G., Somaini L., Zaimovic A., Gerra M L., Maremmani I., Amore M. and Ciccocioppo R., Developmental Traumatic Experi-ences, PTSD and Substance Abuse Vulnerability: The Neuroobiologi-cal Link, Neurobiology of Post Traumatic Stress Disorder, June 2010 ISBN: 978-1-61668-851-6.
4 World Health Organization Neuroscience of psychoactive substance use and dependence, Geneva 2004.

127
2. Drug statistics and trends Understanding the extent and nature of drug use
In Europe, the prevalence rate of problem drug users varies between 2.7 in Greece and 9.0 in UK as rate per 1,000 population aged 15-64. The United Kingdom, Italy and Spain are on the higher end of the range, whereas Greece, Germany and Hungary are countries with low rates of problem drug use.
In the United States, 7 million people - or 2.8% of the population aged 12 and older - were considered sub-stance dependent, abusing illicit substances in 2008. Cannabis was the illicit substance with the highest rate of past year dependence, followed by pain relievers (opi-oids) and cocaine.6 In Canada, 2.7% of the population aged 15 and older were reported to have experienced at least one type of harm in the past year due to illicit drug use. ‘Harm’ in the Canadian reports is classified as harm to physical health, or in the social, employment and legal spheres.7
Injecting drug users (IDU)
Among the most problematic drug users are those who inject drugs. The last available estimate of the global number of IDU remains the one developed by the UNODC/UNAIDS reference group in 2008, which estimated that there are 15.9 million people who inject drugs (between 11 – 21.2 million).8 Of these, 3 million may be living with HIV (range 0.5-5.5 million). East
6 Substance Abuse and Mental Health Services Administration, Results from the 2008 National Survey on Drug Use and Health: National Findings, US Department of Health and Health Services, Office of Applied Studies.
7 Health Canada, Canadian Alcohol and Drug Use Monitoring Survey: Summary of Results for 2008.
8 Mathers B.M., Degenhardt L., Ali H., Wiessing L., Hickman M., Mattick RP., et al. “HIV prevention, treatment and care services fro people who inject drugs a systematic review of global, regional and national coverage,”The Lancet, 2010; 375(9719:1014-28).
Europe (1.5%) and Australia and New Zealand (1.03%) have a high prevalence of injecting drug use. In absolute numbers, East Europe has one of the highest numbers of injecting drug users. In East Europe most of the injectors are using opiates, while in Australia and New Zealand, methamphetamine is the main substance being injected.
Gap in provision of services to problem drug users
The estimate of the global number of problem drug users provides the range of the number of people who need assistance to address their drug problems, includ-ing treatment of drug dependence and care. Comparing this with the number of people who are in treatment provides the magnitude of the unmet need for treatment of illicit drug use. Notwithstanding the gap in reporting and coverage of services, Member States reported that between 42% (in South America) and 5% (in Africa) of problem drug users were treated in the previous year. It can be estimated that globally, between 12% and 30% of problem drug users had received treatment in the past year, which means that between 11 million and 33.5 million problem drug users in the world have an unmet need for treatment interventions.
During the High-level Segment of the Commission on Narcotic Drugs in 2009, Member States adopted a Polit-ical Declaration and Plan of Action. The Plan of Action called for Member States to ensure that access to drug treatment is affordable, culturally appropriate and based on scientific evidence, and that drug dependence care services are included in the health care systems. It also called for the need to develop a comprehensive treat-ment system offering a wide range of integrated pharma-cological (such as detoxification and opioid agonist and antagonist maintenance) and psychosocial (such as counselling, cognitive behavioural therapy and social support) interventions based on scientific evidence and
Europe: Estimates of problem drug use (rate per 1,000 population aged 15-64)*Fig. 99:
* The methods for estimation of problem drug users differ between countries, but include capture/recapture, treatment multiplier, police multiplier, et cetera.
Source: EMCDDA, Statistical bulletin 2009: Problem drug use population, 2009
0
2
4
6
8
10
12
Gre
ece
Ger
man
y*
Hun
gary
Cyp
rus
Aus
tria
Cze
ch R
ep.
Pola
nd
Swed
en
Latv
ia*
Slov
akia
Finl
and
Mal
ta
Port
ugal
*
Fran
ce
Den
mar
k
Slov
enia
Spai
n*
Italy
UK

128
World Drug Report 2010
focused on the process of rehabilitation, recovery and social reintegration.9
The costs for the delivery of evidence-based treatment is seen to be much lower than the indirect costs caused by untreated drug dependence (prisons, unemployment, law enforcement and health consequences). Research indicates that spending on treatment produces savings in terms of a reduction in the number of crime victims, as well as reduced expenditures for the criminal justice system. At a minimum there was a 3:1 savings rate, and when a broader calculation of costs associated with crime, health and social productivity was taken into account, the rate of savings to investment rose to 13:1. These savings can improve disadvantaged situations where opportunities for education, employment and social welfare are undermined, and increase possibilities for families to recover battered economies, thus facilitat-ing social and economic development.10
9 UNODC, Political Declaration and Plan of Action on International Cooperation Towards an Integrated and Balanced Strategy to Counter the World Drug Problem, High-level segment, Commission on Narcotic Drugs, Vienna, 11-12 March 2009
10 UNODC and WHO, Principles of Drug Dependence Treatment: Discussion Paper , March 2008, also see Gossop M, Marsden J and Stewart D, The National Treatment Outcome Research Study: After 5 years – Changes in substance use, health and criminal behaviour during the five years after intake, National Addiction Centre, London 2001.
Assessment of the services provided to injecting drug users to respond to HIVThe morbidity and mortality associated with injecting drug use (IDU) is a global public health issue. Of par-ticular significance is the spread of HIV between people who inject drugs, through the sharing of injecting equip-ment, and through sexual transmission to the wider population.
Responding to IDU is an essential component of the global response to HIV. During the 2009 High-level Segment of the Commission on Narcotic Drugs and in other forums, countries and UN agencies centrally involved in the HIV response for injecting drug users - UNODC, WHO and UNAIDS - endorsed a compre-hensive package of interventions that are necessary to prevent and control HIV among IDUs.1 These include: needle and syringe programmes (NSP); opioid substitu-tion therapy (OST) and other drug treatment modali-ties; HIV testing and counselling; antiretroviral therapy for HIV (ART); targeted information and education for IDUs; prevention and treatment of viral hepatitis, sexu-ally transmitted diseases and tuberculosis; and condom distribution programmes.
NSPs provide clean injecting equipment to IDUs; a crucial way to reduce injecting risk, and a contact point for providing health information to IDUs. These exist in 82 of the 151 countries where injecting drug use is known to occur. Only 7.5% (range 5.4%-11.5%) of IDUs worldwide are estimated to have accessed an NSP in a 12-month period. Globally, 22 clean syringes are estimated to be distributed per IDU in a year, meaning most injections worldwide occur with used injecting equipment.
Long acting opioid maintenance therapy, or opioid sub-stitution programmes (OST) have been introduced in 71 countries, but remain absent in many where the prevalence of opioid injection is high. It is estimated that globally there are only 8 (range 6-12) OST recipi-ents for every 100 IDUs, suggesting coverage of only a small proportion of IDUs who might benefit from this treatment for drug dependence.
ART is important not only for treating IDUs who have contracted HIV, but also in preventing HIV transmis-sion.2 From the limited data available, it is estimated
1 WHO/UNODC,UNAIDS, WHO, UNODC, UNAIDS Techni-cal Guide for countries to set targets for universal access to HIV prevention, treatment and care for injecting drug users, Geneva, 2008.
2 Degenhardt L., Mathers B.M., Vickerman P., Hickman M., Rhodes T., Latkin C., “HIV prevention for people who inject drugs: Why individual, structural, and combination approaches
Unmet need for treatment Fig. 100: interventions, 2008
Source: UNODC
Number of people who have used drugs at least once in the past year aged 15-64 years: 155-250 million
Number of problem drug users aged 15-64: 16-38 million
Number of problem drug users aged 15-64 who did not receive treatment: 11-33.5 million


130
World Drug Report 2010
Trends in the main drugs of concern in problem drug users as indicated by treatment demand
An analysis of the number of treatment services pro-vided in a country according to the main drug for admis-sion can provide information on the drugs that are most problematic in terms of health and social consequences and need for intervention.
The treatment demand data presented here cover the 10-year period from the late 1990s to 2008. Data for all but 2008 were published in the World Drug Report 2000 (for 1997/1998, labelled as the late 1990s) and WDR 2005 through 2009 (for the years 2003 to 2007, or latest year available at the time of publication).
The data show that there is generally, in each region, a clear, and over the past 10 years consistent, drug type that dominates treatment. This suggests marked regional differences in the drugs that affect problem drug users. Indeed, in the last decade, the primary drug for treat-ment has remained cannabis in Africa, cocaine in South America and opiates in Asia and Europe. The two nota-ble exceptions are: 1) North America, where a dominant drug for treatment demand does not emerge, and rather, the percentage breakdown of drugs has become more uniform over time, and 2) Oceania, which has experi-enced over time one of the biggest changes in the pri-mary treatment drug from opiates to cannabis.
The changes observed over the last decade in the contri-bution that each drug has made to treatment admissions suggest an ongoing diversification of problem drug users
in some regions. The contribution of cannabis to treat-ment demand is increasing in Europe, South America and Oceania, while admissions for synthetic opiates in North America sharply increased in the last few years, compensating for decreased admissions for heroin. In Europe, the admissions for stimulants (cocaine and amphetamine-type stimulants) and cannabis have also increased over time, in parallel with a decline in admis-sions for opiates.
Interpreting trends in treatment demand data is chal-lenging as patterns and trends over time can reflect a mixture of factors, such as:
the development and improved coverage of drug treatment reporting systems;
statistical artefacts, for example, resulting from different countries reporting in a region in different time periods (notably in Africa);
changing patterns of consumption including prevalence, frequency of drug use and the typical amounts used on each occasion;
prevention measures and the availability, accessibility and utilization of treatment services;
response of the criminal justice system to drug offenders, such as compulsory treatment as an alternative to imprisonment.
Opiates main problem drug by far in Europe and Asia, but declining in Oceania
Opiates are clearly the main problem drug as indicated by treatment demand over the past 10 years in Europe (with at least 55% of demand) and Asia (consistently more than 60% of demand).
Opiates have also increased their contribution in Africa from 8% (late 1990s) to 20% (2008). While there has been an increase in opiate-related treatment in Africa over the last decade, the strong increase is, however, to some extent, a statistical artefact as previous treatment data (dating back more than 10 years) were removed and could not be replaced as no new data were forthcoming. Therefore, data from smaller island countries - such as Mauritius or the Seychelles, where the proportion of opiate treatment has historically been very high - con-tribute more to the treatment demand for opiates in Africa.
Opiate-related treatment has recently exhibited a large increase in North America, from 10% (2006) to 23% (2008), reflecting the rising abuse of synthetic opioids, and are possibly starting to emerge in South America. Oceania has experienced a striking decline in the contri-bution of opiates to treatment demand from 66% (late 1990s) to 26% (2008), in line with the severe heroin shortage of 2001 in Australia which convinced many heroin addicts to give up their habit.
Effective treatment for heroin and crack dependence: UK Drug Treatment Monitoring System Outcomes Study GroupIn the United Kingdom, using data from the national Drug Treatment Monitoring System, a prospective cohort study looked at treatment outcomes of 14,656 heroin and crack addicts. The effectiveness of treat-ment was assessed from changes in the days of heroin or crack cocaine use or both in the 28 days before the start of treatment and in the 28 days before the study review.
The study shows that the first six months of pharma-cological or psychosocial treatment is associated with reduced heroin and crack cocaine use, but the effec-tiveness of pharmacological treatment is less pro-nounced for users of both drugs.
Source: Marsden J, Eastwood B, et al, Effectiveness of community treatments for heroin and crack cocaine addic-tion in England: a prospective, in-treatment cohort study

131
2. Drug statistics and trends Understanding the extent and nature of drug use
Regional patterns and trends in main problem drugs as reflected in treatment demandFig. 101:
Sources: UNODC, Annual Reports Questionnaire Data/DELTA and National Government Reports
Notes: Percentages are unweighted means of treatment demand in reporting countries.
An 'Other drugs' category is not included and so totals may not add up to 100%. Alternatively, polydrug use may increase totals beyond 100%.
Number of countries reporting treatment demand data: Europe (30 to 45); Africa (15 to 41); North America (3); South America (21 to 26); Asia (27 to 43); Oceania (1 or 2).
* year specified or latest year available at time of WDR publication.
# Treatment data dating back more than 10 years were removed from the 2008 estimates and therefore caution should be taken in comparing the data from 2008 with previous years.
0%
10%
20%
30%
40%
50%
60%
70%
80%
Late 1990s(2000)
2003(2005)
2004(2006)
2005(2007)
2006(2008)
2007(2009)
2008(2010)
Year* (WDR publication)
Cocaine Cannabis Opiates ATS
Europe
0%
10%
20%
30%
40%
50%
60%
70%
80%
Late 1990s(2000)
2003(2005)
2004(2006)
2005(2007)
2006(2008)
2007(2009)
2008(2010)
Year* (WDR publication)
Cocaine Cannabis Opiates ATS
Africa
#
0%
10%
20%
30%
40%
50%
60%
70%
80%
Late 1990s(2000)
2003(2005)
2004(2006)
2005(2007)
2006(2008)
2007(2009)
2008(2010)
Year* (WDR publication)
Cocaine Cannabis Opiates ATS
North America
0%
10%
20%
30%
40%
50%
60%
70%
80%
Late 1990s(2000)
2003(2005)
2004(2006)
2005(2007)
2006(2008)
2007(2009)
2008(2010)
Year* (WDR publication)
Cocaine Cannabis Opiates ATS
South America
0%
10%
20%
30%
40%
50%
60%
70%
80%
Late 1990s(2000)
2003(2005)
2004(2006)
2005(2007)
2006(2008)
2007(2009)
2008(2010)
Year* (WDR publication)
Cocaine Cannabis Opiates ATS
Asia
0%
10%
20%
30%
40%
50%
60%
70%
80%
Late 1990s(2000)
2003(2005)
2004(2006)
2005(2007)
2006(2008)
2007(2009)
2008(2010)
Year* (WDR publication)
Cocaine Cannabis Opiates ATS
Oceania
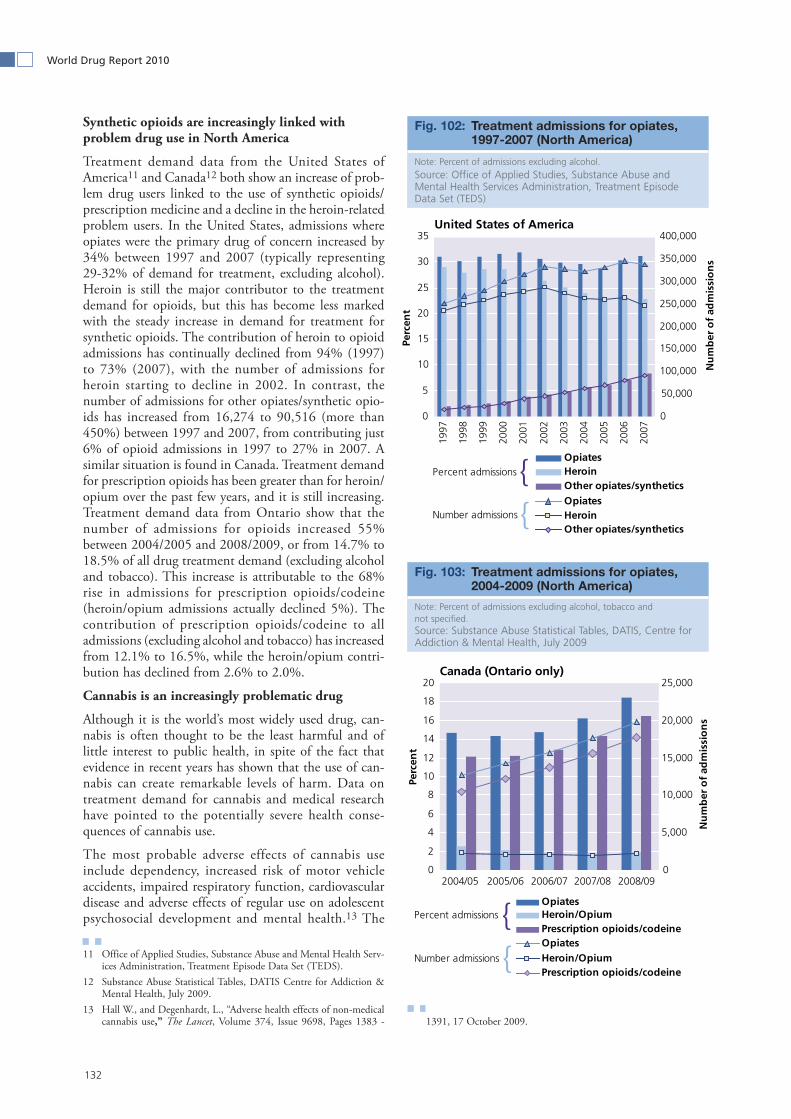
132
World Drug Report 2010
Synthetic opioids are increasingly linked with problem drug use in North America
Treatment demand data from the United States of America11 and Canada12 both show an increase of prob-lem drug users linked to the use of synthetic opioids/prescription medicine and a decline in the heroin-related problem users. In the United States, admissions where opiates were the primary drug of concern increased by 34% between 1997 and 2007 (typically representing 29-32% of demand for treatment, excluding alcohol). Heroin is still the major contributor to the treatment demand for opioids, but this has become less marked with the steady increase in demand for treatment for synthetic opioids. The contribution of heroin to opioid admissions has continually declined from 94% (1997) to 73% (2007), with the number of admissions for heroin starting to decline in 2002. In contrast, the number of admissions for other opiates/synthetic opio-ids has increased from 16,274 to 90,516 (more than 450%) between 1997 and 2007, from contributing just 6% of opioid admissions in 1997 to 27% in 2007. A similar situation is found in Canada. Treatment demand for prescription opioids has been greater than for heroin/opium over the past few years, and it is still increasing. Treatment demand data from Ontario show that the number of admissions for opioids increased 55% between 2004/2005 and 2008/2009, or from 14.7% to 18.5% of all drug treatment demand (excluding alcohol and tobacco). This increase is attributable to the 68% rise in admissions for prescription opioids/codeine (heroin/opium admissions actually declined 5%). The contribution of prescription opioids/codeine to all admissions (excluding alcohol and tobacco) has increased from 12.1% to 16.5%, while the heroin/opium contri-bution has declined from 2.6% to 2.0%.
Cannabis is an increasingly problematic drug
Although it is the world’s most widely used drug, can-nabis is often thought to be the least harmful and of little interest to public health, in spite of the fact that evidence in recent years has shown that the use of can-nabis can create remarkable levels of harm. Data on treatment demand for cannabis and medical research have pointed to the potentially severe health conse-quences of cannabis use.
The most probable adverse effects of cannabis use include dependency, increased risk of motor vehicle accidents, impaired respiratory function, cardiovascular disease and adverse effects of regular use on adolescent psychosocial development and mental health.13 The
11 Office of Applied Studies, Substance Abuse and Mental Health Serv-ices Administration, Treatment Episode Data Set (TEDS).
12 Substance Abuse Statistical Tables, DATIS Centre for Addiction & Mental Health, July 2009.
13 Hall W., and Degenhardt, L., “Adverse health effects of non-medical cannabis use,” The Lancet, Volume 374, Issue 9698, Pages 1383 - 1391, 17 October 2009.
Treatment admissions for opiates, Fig. 102: 1997-2007 (North America)
Note: Percent of admissions excluding alcohol.Source: Office of Applied Studies, Substance Abuse and Mental Health Services Administration, Treatment Episode Data Set (TEDS)
Treatment admissions for opiates, Fig. 103: 2004-2009 (North America)
Note: Percent of admissions excluding alcohol, tobacco and not specified.Source: Substance Abuse Statistical Tables, DATIS, Centre for Addiction & Mental Health, July 2009
0
5
10
15
20
25
30
35
1997
1998
1999
2000
2001
2002
2003
2004
2005
2006
2007
Perc
ent
0
50,000
100,000
150,000
200,000
250,000
300,000
350,000
400,000
Nu
mb
er o
f ad
mis
sio
ns
OpiatesHeroinOther opiates/syntheticsOpiatesHeroinOther opiates/synthetics
Percent admissions
Number admissions
United States of America
{{
0
2
4
6
8
10
12
14
16
18
20
2004/05 2005/06 2006/07 2007/08 2008/09
Perc
ent
0
5,000
10,000
15,000
20,000
25,000
Nu
mb
er o
f ad
mis
sio
ns
OpiatesHeroin/OpiumPrescription opioids/codeineOpiatesHeroin/OpiumPrescription opioids/codeine
Percent admissions
Number admissions
Canada (Ontario only)
{{
133
2. Drug statistics and trends Understanding the extent and nature of drug use
rising number of cannabis-related problem drug users is often not correlated with a similar rise in the overall number of cannabis users, suggesting that the risks asso-ciated with the use of cannabis have been increasingly recognized and diagnosed in recent years. Rising levels in cannabis potency in many parts of the world (notably in industrialized countries) have also contributed to the increased risk of cannabis use.
Cannabis is clearly the dominant drug for treatment in Africa with consistently over 60% of demand. Over the past 10 years, cannabis has been making an increasing contribution to treatment demand in Europe (more than doubling from 10% to 22%), South America (more than doubling from 15% to 40%) and Oceania (more than trebling from 13% to stabilize around 47%). Only North America has seen a reduction in the contribution of can-nabis to treatment demand compared to other drugs.
Harmful levels of cannabis use on the rise in Australia
Treatment episodes where cannabis was the primary drug of concern increased in Australia by 34%, from 23,826 to 31,864 between 2002 and 2008 alone,14 despite a sharp decline in cannabis use among the gen-eral population.
Possible explanations for the increasing trend in the problematic use of cannabis and cannabis-related harm include: increased consumption among older users reflecting dependence among those who have had a long history of use that was initiated at a relatively young age; and the increased availability of cheaper and possibly higher potency cannabis. Referrals from the criminal justice system do not seem to have had an influence on the increase in the numbers entering treatment in Australia.15
Contributing factors for increasing treatment demand for cannabis in Europe remain uncertain
Cannabis ranks second for treatment demand at the European level and its contribution to drug treatment demand has been steadily increasing. The EMCDDA has been documenting rising levels of demand for treat-ment from cannabis-related problems since 1996, but there are wide discrepancies between countries. In 2006, 21% of all European clients and 28% of new clients entered treatment with cannabis as the primary drug of concern. In Denmark, Germany, France, Hungary and Turkey the percentage of new clients seeking treatment for cannabis as the primary drug was greater than 50%.
14 Australian Institute of Health and Welfare (AIHW), Alcohol and other drug treatment services in Australia 2007–08: report on the national minimum data set, Drug treatment series no. 9, cat. no. HSE 73, Canberra, 2009.
15 Roxburgh, A., Hall, W.D., Degenhardt, L., McLaren, J., Black, E., Copeland, J., and Mattick, R.P. “The epidemiology of cannabis use and cannabis-related harm in Australia 1993–2007,” Addiction, 2010 Mar 12. Pre-publication early view.
However, reasons for the increase in demand have proved difficult to identify and EMCDDA recommends further research16 to tackle this issue.17
The effect of poly-drug use in the treatment statistics should not be disregarded. While drug treatment seekers in the past may have been registered almost automati-cally for heroin, they may now be more accurately regis-tered as having cannabis as the primary problem drug while consuming other drugs as well. Moreover, the increasing complexity of drug use makes it difficult to have a simple characterization of problem drug users according to a single drug type. In the context of drug users combining the use of different drugs to get the effect they want to achieve, the use of cannabis becomes potentially more harmful because its effect combined with other drugs can be very different from when it is used alone. Cocaine is the main problem drug in the Americas, but its contribution is declining in North America
Treatment demand for cocaine is most dominant in the Americas, where coca cultivation is concentrated. Cocaine is the main problem drug according to treat-ment demand for South America (with more than 50% of demand), and where once it appeared to be on the decline, over the last few years, the situation has stabi-lized. Although cocaine was the main drug for treatment in North America in the late 1990s, the cocaine-related treatment demand has been declining over the last decade, and was responsible for just 31% of total treat-ment demand in 2008. In Europe, the treatment demand, in contrast, increased from 3% to 10% over the same period. Cocaine-related treatment demand in Africa accounts for less than 10% of the total,18 and in Asia and Oceania demand is negligible (<1%).ATS treatment demand is relatively small but not unimportant
Asia has the highest percentage of admissions for amphetamine-type stimulants (ATS), where it ranks as the second most important drug. In Oceania and North America, treatment demand for ATS has increased to some 20% since the late 1990s. Otherwise, demand for treatment has remained below approximately 10% in other regions, with a possible recent emergence in South America. It should be noted that treatment for ATS is often administered differently than for other drugs, and can be easily under-reported.
16 EMCDDA, A cannabis reader: global issues and local experiences, Monograph series 8, Volume 2, Lisbon, 2008.
17 EMCDDA, Annual report on the state of the drugs problem in the European Union and Norway. Cannabis problems in context — under-standing the increase in European treatment demands, Lisbon, 2004.
18 In contrast to the data shown, there are no indications of any decline in cocaine-related treatment demand in Africa over the last decade. The lower demand shown is a statistical artefact resulting from the removal of treatment data dating back more than 10 years.

134
World Drug Report 2010
Gender and the illicit drug marketsThe markets for illicit drugs affect more men than women worldwide, both in terms of use and trafficking of illicit substances. Data that characterize traffickers of illicit drugs are scarce. In 2009, the Commission on Narcotic Drugs, in its resolution 52/1, stressed the importance of collecting and analysing data disaggre-gated by sex and age, and of conducting research on gender issues related to drug trafficking, especially the use of women and girls as drug couriers. The Commis-sion called for improved data collection and recom-mended the undertaking of a gender analysis based on available data. One data source that can be used to gen-erate a gender analysis of drug traffickers is the Indi-vidual Drug Seizures Database, where data submitted by a limited number of countries (between 30 and 50 from all regions) report the characteristics of traffickers associ-ated with each individual seizure.1 These data show that the great majority of drug traffickers are men. They also suggest that, irrespective of age, the percentage of female traffickers slightly decreased between 2006 and 2009, reaching between 15% and 20% of detected traffickers in 2009.
The use of illicit drugs is more balanced between males and females, but it still sees a higher number of men involved. For all drugs, the gender gap between males
1 Data on the gender composition of drug-related arrestees could also be reported by Member States in the ARQ. However, this data can hardly be utilized for a gender analysis because very few countries provide the sex-breakdown of the data on arrestees with little comparability across countries.
and females is lower among the young population than for the adults.
Male students outnumber females in the use of cocaine and cannabis in all European countries. In contrast, female students more frequently report tranquillizer use in virtually all countries and ecstasy use in some coun-tries.2
A gender gap between the young and older generations is also apparent in South America. One comparative study shows, for example, that in all six analysed coun-tries, except Argentina, the gender ratio3 of cannabis use is lower for students than the adult population, though with large variations across countries. Data from Latin America and other parts of the world suggest that the more advanced the country, the higher the proportion of females among drug users.
In general, substance dependence and abuse is also higher for males than females, although in the United States an age-specific analysis reveals that in 2008, the rate of substance dependence was higher for females (8.2%) than males (7.0%) in the population aged 12 to
2 EMCDDA, A gender perspective on drug use and responding to drug problems, Lisbon 2006.
3 Ratio of prevalence among males and females.
Trends in gender distribution of Fig. 104: drug traffickers, 2005-2009
Source: UNODC Individual Drug Seizures Database
0%
10%
20%
30%
40%
50%
60%
70%
80%
90%
100%
2005
2006
2007
2008
2009
2005
2006
2007
2008
2009
2005
2006
2007
2008
2009
Age < 25 Age 26 - 45 Age > 45
Female Male
Gender ratio in lifetime cannabis Fig. 105: use, selected South American countries
Sources: UNODC/Organization of American States (OAS), Informe subregional sobre uso de drogas en población escolarizada, segundo estudio conjunto, 2009; UNODC/OAS, Elementos orientadores para las políticas públicas sobre drogas en la subregion – primero estudio compara-tivo sobre consumo de drogas y factores asociados en población de 15 a 64 años, 2008
0
1
2
3
4
5
6
7
8
9
Arg
entin
a
Boliv
ia
Chi
le
Ecua
dor
Peru
Uru
guay
15-64Students

135
2. Drug statistics and trends Understanding the extent and nature of drug use
17, while the same rate was almost double for males (12.0%) than females (6.3%) in the population 18 years and older.4 There are few studies that analyse gender differences in accessibility of treatment serv-ices. In 2004 in Europe, there was a ratio of 4:1 between males and females in treatment. The high ratio (higher than the ratio between male and female drug users) can be explained by the higher risk of becoming problem drug users observed for males. At the same time, according to the EMCDDA, there are no studies that can provide definitive answers on the gender distribution of the unmet treatment needs of problem drug users.5 In many countries where gender roles are culturally determined and women are not empowered, gender differences can be reflected in a lack of access to treatment services which could be due to: a) higher stigma for women who use drugs than for men, and/or b) the fact that services do not cater for women (for example, they do not admit women or do not cater for the needs of safety and childcare). An illustrative example of the lack of accessibility can be found in Afghanistan, where in 2008 there were only three residential drug treat-ment facilities for women with adjacent child care and treatment facilities, despite the high level of heroin and opium use among the female popula-tion.6
4 Substance Abuse and Mental Health Services Administration, Results from the 2000 - 2008 National Survey on Drug Use and Health: National Findings, Office of Applied Studies, US Department of Health and Human Services.
5 EMCDDA, A gender perspective on drug use and responding to drug problems, Lisbon, 2006.
6 Report to the US Congress, Report on Progress Toward Security and Stability in Afghanistan, April 2010.


2.2 Opium/heroin
137
Production2.2.1
Cultivation
In 2009, the area under opium poppy cultivation decreased by 15% from 2008. Similar to the year before, this was mainly due to a large decrease in opium poppy cultivation in Afghanistan, which was not offset by increases in Myanmar and the Lao People’s Democratic Republic. In Afghanistan, where in 2009 two thirds (66%) of global opium poppy cultivation were concen-trated, cultivation continued to be concentrated mainly in the south and west of the country. Over half of the opium poppy area (57%) was located in only one prov-ince, Hilmand, although most of the decrease in cultiva-tion from 2008 took place in the same province, in the so-called food zone where farmers were supported with wheat seeds and fertilizers. Almost the entire Afghan opium poppy-cultivating area was located in provinces characterized by high levels of insecurity. In 2009, erad-ication remained at the relatively low level of 2008. A preliminary assessment indicated that opium poppy cultivation in 2010 may remain at about the 2009 lev-el.1
In Pakistan, Afghanistan’s neighbour, the 2009 opium poppy cultivation remained at about the same level of less than 2,000 ha as in previous years. Myanmar, the second largest opium poppy cultivating country (17% of global cultivation) experienced the third consecutive yearly increase in cultivation, although the level remains much lower than in the 1990s and early 2000s. Most of the cultivation area was concentrated in the eastern part
1 UNODC/Ministry of Counter Narcotics, Afghanistan Opium Survey 2010. Winter Rapid Assessment, February 2010.
of the country (Shan State). Opium poppy cultivation in the Lao People’s Democratic Republic remained at a low level of about 2,000 ha with no significant changes since 2005. Mexico remains the third largest cultivating country, showing a large increase in the area under opium poppy cultivation between 2007 and 2008.
Reports on eradication of opium poppy and seizures of poppy plant material indicate the existence of illicit opium poppy cultivation in many other countries and
Global opium poppy cultivation (ha), Fig. 106: 1995-2009
Note: The 2009 estimate for ‘Rest of the world’ is provisional as limited information was available for some countries and regions. Source: UNODC
0
50,000
100,000
150,000
200,000
250,000
300,000
95 96 97 98 99 00 01 02 03 04 05 06 07 08 09
Hec
tare
s
Rest of the WorldLao People's Democratic RepublicMyanmarAfghanistan

138
World Drug Report 2010
(a) Opium poppy harvestable after eradication.(b) Afghanistan, sources: before 2003: UNODC; since 2003: National Illicit Crop Monitoring System supported by UNODC. (c) Pakistan, sources: ARQ, Government of Pakistan, US Department of State (d) Lao PDR, sources: 1995: US Department of State; 1996-1999: UNODC; since 2000: National Illicit Crop Monitoring System supported by UNODC. (e) Myanmar, sources: before 2001: US Department of State; since 2001: National Illicit Crop Monitoring System supported by UNODC.(f ) Due to continuing low cultivation, figures for Viet Nam (as of 2000) and Thailand (as of 2003) were included in the category "Other".(g) Colombia, sources: before 2000: various sources, since 2000: Government of Colombia. Production: In Colombia, opium is produced as opium latex, which has a higher
moisture content than opium produced in other regions of the world. The figures presented refer to dry opium. For 2008 and 2009, dry opium production in Colombia was calculated based on regional yield figures and conversion ratios from US Department of State/DEA.
(h) Figures derived from US Government surveys.The Government of Mexico reported a gross opium poppy cultivation of 19,147 hectares (2006) and estimated gross opium production at 211 mt (2006), 122 mt (2007), 144 mt (2008) and 162 mt (2009). These gross figures are not directly comparable to the net figures presented in this table. The Government of Mexico is not in a position to confirm the US figures as it does not have information on the methodology used to calculate them.
(i) Reports from different sources indicate that illicit opium poppy cultivation also exists in other countries and regions, including Algeria, the Baltic countries, Balkan coun-tries, Egypt, Guatemala, Iraq, Lebanon, Peru, the Russian Federation and other C.I.S. countries, South Asia, Thailand, Ukraine, Venezuela, Viet Nam, as well as in Central Asia and the Caucasus region. Starting 2008, a new methodology was introduced to estimate opium poppy cultivation and opium/heroin production in these countries. This new series is listed unter "Other countries". The estimates are higher than the previous figures but have a similar order of magnitude. A detailed description of the estimation methodology is available in the online version of the World Drug Report 2010.
(j) Potential production refers to the amount of oven-dry opium with unknown morphine content that could be produced if all opium poppy cultivated in an area in one year was harvested in the traditional method of lancing the opium capsules and collecting the opium gum or latex.
(k) In some countries, poppy straw is used to produced acetylated opium rather than opium gum. However, for reasons of comparability, it was assumed that all opium poppy cultivation is used for opium gum production.
(l) This estimate represent the amount of opium, which remains opium and is not processed into morphine or heroin. It refers only to Afghan opium as for other countries, the amount of opium which is not processed into morphine or heroin could not be estimated. For years before 2004, no such estimate was available for Afghanistan.
(m) Since 2004: Potential heroin production available outside Afghanistan. Estimates for Afghanistan only include heroin and morphine available for export, i.e. after deducting local consumption and seizures, based on the Afghanistan Opium Surveys. The amount of Afghan opium estimated to remain available as opium is not included in this figure. For all other countries, it is assumed that all opium gets converted into heroin, disregarding the fact that some opium may be consumed as such or as morphine.
(n) This series contains all heroin potentially manufactured world-wide, including the heroin and morphine consumed and seized in Afghanistan. The amount of Afghan opium estimated to remain available as opium (potential opium, not processed) is not included in this figure.
(o) Potential manufacture refers to the amount of heroin of unknown purity that could be produced if the total potential opium production was converted into heroin, exclud-ing the opium which is consumed as such and is not processed. Key informant surveys in Afghanistan indicated that 7 kg of air-dry opium are needed to manufacture 1 kg of brown heroin base of unknow purity. Typical purities found in seized heroin base in Afghanistan range from 50% to 80%. Assuming 10%-15% moisture content in air-dry opium, 7 kg of air-dry opium correspond to 6.0 to 6.3 of oven-dry opium. With the indicated typical base purity of 50% to 80%, between 7.4 kg and 12.6 kg of oven-dry opium would be needed to produce 1 kg of 100% pure heroin base in Afghanistan. A DEA study on heroin laboratory efficiency in Colombia estimated that indeed 8 kg of oven-dry opium were needed to produce 1 kg of 100% pure heroin HCl, corresponding to an overall laboratory efficiency of 67.2% from opium (latex) to heroin HCl. This suggests that the currently used ratios for oven-dry opium to heroin 7:1 (Afghanistan), 8:1 (Colombia in recent years) and 10:1 (rest of the world) could indeed provide an estimate of pure heroin production. However, the heroin estimates provided are still considered to refer to"heroin of unknown purity" as not enough is know about the laboratory efficiency in most producing countries.
Global illicit cultivation of opium poppy and production of opiates, 1995-2009Table 14: 1995 1996 1997 1998 1999 2000 2001 2002 2003 2004 2005 2006 2007 2008 2009
SOUTH-WEST ASIA Afghanistan (b) 53,759 56,824 58,416 63,674 90,583 82,171 7,606 74,100 80,000 131,000 104,000 165,000 193,000 157,000 123,000
Pakistan (c) 5,091 873 874 950 284 260 213 622 2,500 1,500 2,438 1,545 1,701 1,909 1,779
Subtotal 58,850 57,697 59,290 64,624 90,867 82,431 7,819 74,722 82,500 132,500 106,438 166,545 194,701 158,909 124,779
SOUTH-EAST ASIA Lao PDR (d) 19,650 21,601 24,082 26,837 22,543 19,052 17,255 14,000 12,000 6,600 1,800 2,500 1,500 1,600 1,900
Myanmar (e) 154,070 163,000 155,150 130,300 89,500 108,700 105,000 81,400 62,200 44,200 32,800 21,500 27,700 28,500 31,700
Thailand (f) 168 368 352 716 702 890 820 750
Viet Nam (f) 1,880 1,743 340 442 442
Subtotal 175,768 186,712 179,924 158,295 113,187 128,642 123,075 96,150 74,200 50,800 34,600 24,000 29,200 30,100 33,600
LATIN AMERICA Colombia (g) 5,226 4,916 6,584 7,350 6,500 6,500 4,300 4,153 4,026 3,950 1,950 1,023 715 394 356
Mexico (h) 5,050 5,100 4,000 5,500 3,600 1,900 4,400 2,700 4,800 3,500 3,300 5,000 6,900 15,000 n.a.
Subtotal 10,276 10,016 10,584 12,850 10,100 8,400 8,700 6,853 8,826 7,450 5,250 6,023 7,615 15,394 15,394
OTHER (i)
Combined 5,025 3,190 2,050 2,050 2,050 2,479 2,500 2,500 3,074 5,190 5,212 4,432 4,184
Other countries 8,600 7,600
TOTAL 249,919 257,615 251,848 237,819 216,204 221,952 142,094 180,225 168,600 195,940 151,500 201,000 235,700 213,003 181,373
SOUTH-WEST ASIA Afghanistan (b) 2,335 2,248 2,804 2,693 4,565 3,276 185 3,400 3,600 4,200 4,100 6,100 8,200 7,700 6,900 Pakistan (c) 112 24 24 26 9 8 5 5 52 40 36 39 43 48 44
Subtotal 2,447 2,272 2,828 2,719 4,574 3,284 190 3,405 3,652 4,240 4,136 6,139 8,243 7,748 6,944
SOUTH-EAST ASIA Lao PDR (d) 128 140 147 124 124 167 134 112 120 43 14 20 9 10 11 Myanmar (e) 1,664 1,760 1,676 1,303 895 1,087 1,097 828 810 370 312 315 460 410 330 Thailand (f) 2 5 4 8 8 6 6 9 Viet Nam (f) 9 9 2 2 2
Subtotal 1,803 1,914 1,829 1,437 1,029 1,260 1,237 949 930 413 326 335 469 420 341
LATIN AMERICA
Colombia (g) 71 67 90 100 88 88 80 52 50 49 24 13 14 10 9
Mexico (h) 53 54 46 60 43 21 91 58 101 73 71 108 149 325 n.a.
Subtotal 124 121 136 160 131 109 171 110 151 122 95 121 163 335 335
OTHER (i)
Combined 78 48 30 30 30 38 32 56 50 75 63 16 15 Other countries (k)
139 134 TOTAL 4,452 4,355 4,823 4,346 5,764 4,691 1,630 4,520 4,783 4,850 4,620 6,610 8,890 8,641 7,754
NON-PROCESSED OPIUM (l) 1,382 1,317 2,228 3,698 3,070 2,895
AVAIL. OUTSIDE AFGH. 445 436 482 435 576 469 163 452 478 495 472 606 735 724 634TOTAL(n) 529 472 629 757 752 657
POTENTIAL OPIUM PRODUCTION IN METRIC TONS (j)
POTENTIAL MANUFACTURE OF HEROIN IN METRIC TONS (o)
CULTIVATION(a) IN HECTARES
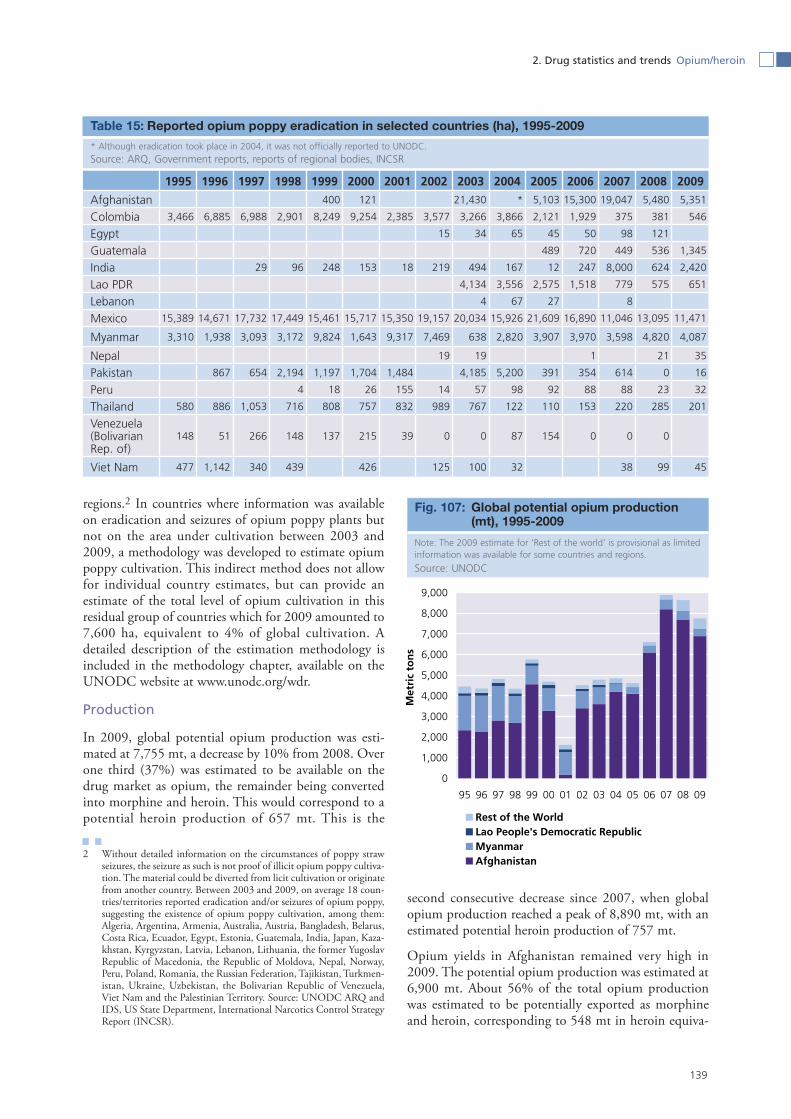
139
2. Drug statistics and trends Opium/heroin
regions.2 In countries where information was available on eradication and seizures of opium poppy plants but not on the area under cultivation between 2003 and 2009, a methodology was developed to estimate opium poppy cultivation. This indirect method does not allow for individual country estimates, but can provide an estimate of the total level of opium cultivation in this residual group of countries which for 2009 amounted to 7,600 ha, equivalent to 4% of global cultivation. A detailed description of the estimation methodology is included in the methodology chapter, available on the UNODC website at www.unodc.org/wdr.
Production
In 2009, global potential opium production was esti-mated at 7,755 mt, a decrease by 10% from 2008. Over one third (37%) was estimated to be available on the drug market as opium, the remainder being converted into morphine and heroin. This would correspond to a potential heroin production of 657 mt. This is the
2 Without detailed information on the circumstances of poppy straw seizures, the seizure as such is not proof of illicit opium poppy cultiva-tion. The material could be diverted from licit cultivation or originate from another country. Between 2003 and 2009, on average 18 coun-tries/territories reported eradication and/or seizures of opium poppy, suggesting the existence of opium poppy cultivation, among them: Algeria, Argentina, Armenia, Australia, Austria, Bangladesh, Belarus, Costa Rica, Ecuador, Egypt, Estonia, Guatemala, India, Japan, Kaza-khstan, Kyrgyzstan, Latvia, Lebanon, Lithuania, the former Yugoslav Republic of Macedonia, the Republic of Moldova, Nepal, Norway, Peru, Poland, Romania, the Russian Federation, Tajikistan, Turkmen-istan, Ukraine, Uzbekistan, the Bolivarian Republic of Venezuela, Viet Nam and the Palestinian Territory. Source: UNODC ARQ and IDS, US State Department, International Narcotics Control Strategy Report (INCSR).
second consecutive decrease since 2007, when global opium production reached a peak of 8,890 mt, with an estimated potential heroin production of 757 mt.
Opium yields in Afghanistan remained very high in 2009. The potential opium production was estimated at 6,900 mt. About 56% of the total opium production was estimated to be potentially exported as morphine and heroin, corresponding to 548 mt in heroin equiva-
Reported opium poppy eradication in selected countries (ha), 1995-2009Table 15:
* Although eradication took place in 2004, it was not officially reported to UNODC. Source: ARQ, Government reports, reports of regional bodies, INCSR
1995 1996 1997 1998 1999 2000 2001 2002 2003 2004 2005 2006 2007 2008 2009
Afghanistan 400 121 21,430 * 5,103 15,300 19,047 5,480 5,351
Colombia 3,466 6,885 6,988 2,901 8,249 9,254 2,385 3,577 3,266 3,866 2,121 1,929 375 381 546
Egypt 15 34 65 45 50 98 121
Guatemala 489 720 449 536 1,345
India 29 96 248 153 18 219 494 167 12 247 8,000 624 2,420
Lao PDR 4,134 3,556 2,575 1,518 779 575 651
Lebanon 4 67 27 8
Mexico 15,389 14,671 17,732 17,449 15,461 15,717 15,350 19,157 20,034 15,926 21,609 16,890 11,046 13,095 11,471
Myanmar 3,310 1,938 3,093 3,172 9,824 1,643 9,317 7,469 638 2,820 3,907 3,970 3,598 4,820 4,087
Nepal 19 19 1 21 35
Pakistan 867 654 2,194 1,197 1,704 1,484 4,185 5,200 391 354 614 0 16
Peru 4 18 26 155 14 57 98 92 88 88 23 32
Thailand 580 886 1,053 716 808 757 832 989 767 122 110 153 220 285 201
Venezuela (Bolivarian Rep. of)
148 51 266 148 137 215 39 0 0 87 154 0 0 0
Viet Nam 477 1,142 340 439 426 125 100 32 38 99 45
Global potential opium production Fig. 107: (mt), 1995-2009
Note: The 2009 estimate for ‘Rest of the world’ is provisional as limited information was available for some countries and regions.
Source: UNODC
0
1,000
2,000
3,000
4,000
5,000
6,000
7,000
8,000
9,000
95 96 97 98 99 00 01 02 03 04 05 06 07 08 09
Met
ric
ton
s
Rest of the WorldLao People's Democratic RepublicMyanmarAfghanistan

140
World Drug Report 2010
lent.3 Afghanistan remained by far the largest opium-producing country, representing 89% of the global illicit opium production. Despite the increase in cultivation, opium production in Myanmar decreased by 20% to only 330 mt, due to lower yields.
Laboratories
Only eight countries reported destruction of clandestine opiate-processing laboratories in 2008. In addition to countries where opium production takes place, such as Afghanistan (69 laboratories), Myanmar (5), Mexico (1) and Peru (1), destruction of clandestine opiate process-ing laboratories were reported from Belarus (1), Greece (2), New Zealand (1) and the Russian Federation (1). Much higher numbers were reported in 2007 (639). However, most of these laboratories were small-scale kitchen laboratories reported by the Russian Federation, many of which produced acetylated opium from poppy straw, which is commonly consumed in this subregion only. It can be assumed that most heroin production still occurs in countries where opium poppy is cultivated or in their close proximity.
Precursor chemicals
Illicit morphine and heroin production requires large quantities of precursor chemicals such as acetic anhy-dride, a substance which is essential in the refinement of morphine to heroin. All acetic anhydride used for heroin production in Afghanistan has to be smuggled into the country as no known production facilities of the sub-stance exist in the country nor is there any reported legitimate use of this chemical.4
Large amounts of acetic anhydride seizures were reported in 2008, mainly from European and Western Asian countries (Afghanistan, Pakistan, the Syrian Arab Republic and Turkey), totalling 199,344 litres (57,308 l in 2007).5 Large amounts were also seized in East and South-East Asia (China, the Republic of Korea and Myanmar). In South America, Colombia regularly reports seizures of acetic anhydride. Increased interna-tional control and cooperation helped to prevent the diversion of large amounts of precursors. The seizures and related information confirmed that large-scale traf-ficking of morphine and heroin precursors to Afghani-stan and neighbouring countries occurred but also to
3 A detailed description of the methodology of the Afghanistan opium and heroin estimates can be found in UNODC/Government of Afghanistan (Ministry of Counter Narcotics), Afghanistan Opium Survey 2009, December 2009.
4 Information on precursor seizures stems mainly from the Interna-tional Narcotics Control Board, E/INCB/2009/1.
5 The total reported seizure amount does not include seizures from Afghanistan, which were not officially reported to the INCB. Seizures were reported to UNODC by Afghan authorities, at 14,234 l of acetic anhydride in 2008.
other opium producing countries. The controls in place seem to have led to a high price level of acetic anhydride in Afghanistan (US$350/l – US$400/l), which is thought to have become a major cost factor in the production of heroin.6
6 UNODC/Ministry of Counter Narcotics, Afghanistan Opium Survey 2009, December 2009.
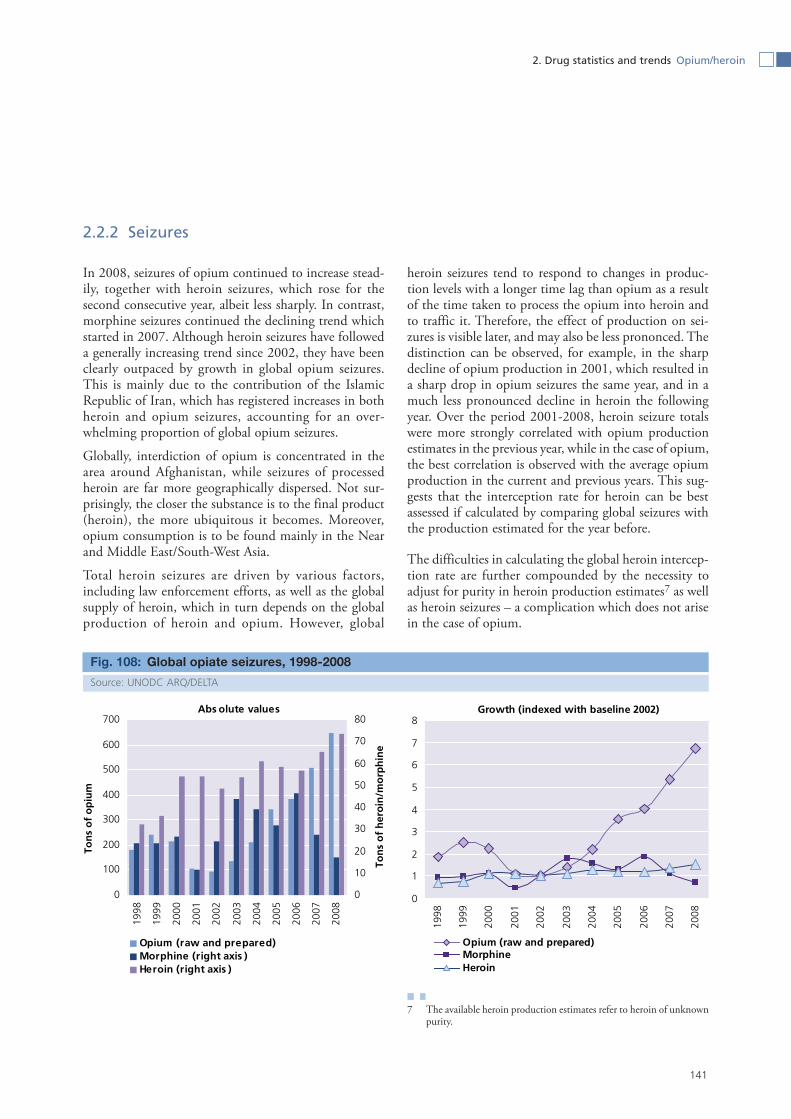
2. Drug statistics and trends Opium/heroin
141
2.2.2 Seizures
In 2008, seizures of opium continued to increase stead-ily, together with heroin seizures, which rose for the second consecutive year, albeit less sharply. In contrast, morphine seizures continued the declining trend which started in 2007. Although heroin seizures have followed a generally increasing trend since 2002, they have been clearly outpaced by growth in global opium seizures. This is mainly due to the contribution of the Islamic Republic of Iran, which has registered increases in both heroin and opium seizures, accounting for an over-whelming proportion of global opium seizures.
Globally, interdiction of opium is concentrated in the area around Afghanistan, while seizures of processed heroin are far more geographically dispersed. Not sur-prisingly, the closer the substance is to the final product (heroin), the more ubiquitous it becomes. Moreover, opium consumption is to be found mainly in the Near and Middle East/South-West Asia.
Total heroin seizures are driven by various factors, including law enforcement efforts, as well as the global supply of heroin, which in turn depends on the global production of heroin and opium. However, global
heroin seizures tend to respond to changes in produc-tion levels with a longer time lag than opium as a result of the time taken to process the opium into heroin and to traffic it. Therefore, the effect of production on sei-zures is visible later, and may also be less prononced. The distinction can be observed, for example, in the sharp decline of opium production in 2001, which resulted in a sharp drop in opium seizures the same year, and in a much less pronounced decline in heroin the following year. Over the period 2001-2008, heroin seizure totals were more strongly correlated with opium production estimates in the previous year, while in the case of opium, the best correlation is observed with the average opium production in the current and previous years. This sug-gests that the interception rate for heroin can be best assessed if calculated by comparing global seizures with the production estimated for the year before.
The difficulties in calculating the global heroin intercep-tion rate are further compounded by the necessity to adjust for purity in heroin production estimates7 as well as heroin seizures – a complication which does not arise in the case of opium.
7 The available heroin production estimates refer to heroin of unknown purity.
Global opiate seizures, 1998-2008Fig. 108:
Source: UNODC ARQ/DELTA
Abs olute values
0
100
200
300
400
500
600
700
1998
1999
2000
2001
2002
2003
2004
2005
2006
2007
2008
Ton
s o
f o
piu
m
0
10
20
30
40
50
60
70
80
Ton
s o
f h
ero
in/m
orp
hin
e
Opium (raw and prepared)Morphine (right axis )Heroin (right axis )
Growth (indexed with baseline 2002)
0
1
2
3
4
5
6
7
8
1998
1999
2000
2001
2002
2003
2004
2005
2006
2007
2008
Opium (raw and prepared)MorphineHeroin

142
World Drug Report 2010
Production in same year as seizures
0
1
2
3
4
5
6
7
8
9
10
45 55 65 75
Glo
bal
op
ium
pro
du
ctio
n
(th
ou
san
ds
of
mt)
Global heroin seizures (mt)
Production one year prior to seizures
-
1
2
3
4
5
6
7
8
9
10
45 55 65 75Glo
bal
op
ium
pro
du
ctio
n in
pre
vio
us
year
(th
ou
san
ds
of
mt)
Global heroin seizures (mt)
The interception rate for opium8 rose slightly in 2008, from 17% in 2007 to 19%. On the other hand, the ratio of the other opiate seizures (heroin and morphine) to estimated potential heroin production in the previous year dropped from 15% in 2007 to 12% in 2008.9
Opium
Global opium seizures have risen steadily for six con-secutive years, from 95.7 mt in 2002 to almost seven
8 Calculated as the ratio of global opium seizures in a given year to the estimated global supply of opium not processed into heroin or morphine. The supply is estimated by the average of production in the given year and the preceding year.
9 In previous years, UNODC estimated a single interception rate for opiates, which expressed total opiate seizures in a given year, con-verted into heroin equivalents, as a percentage of potential heroin production (excluding, since 2004, seizures and consumption in Afghanistan) in the same year.
times more - 646 mt - in 2008, equivalent to consistent annual increases of 37%. The growth has mainly been driven by the quantities seized in the Islamic Republic of Iran, which continues to report by far the largest opium seizures worldwide. Most of the remaining sei-zures happened in Afghanistan and Pakistan. These three countries together accounted for more than 97% of global seizures in 2007 and 2008.
Every year from 1996 to 2008, the Islamic Republic of Iran accounted for more than two thirds of annual global opium seizures. For six consecutive years, increas-ing quantities of opium were seized in this country (from 73 mt in 2002 to 561 mt in 2008), setting the trend for the global total. According to preliminary data, in 2009 seizures stabilized, standing at 579 mt.10
10 Islamic Republic of Iran, Drug Control Headquarters, Drug Control
Distribution of opiate seizures worldwide (percentage), 2008Fig. 109:
* The category “Other” refers to a different set of countries according to the drug type.Source: UNODC ARQ/DELTA
Correlation of global heroin seizures with total opium production, 2001-2008Fig. 110:
Source: UNODC ARQ/DELTA (seizure data), UNODC (production estimates)
Near and Middle East /
South-West Asia,39%
Near and Middle East /
South-West Asia, 97%
Near and Middle East /
South-West Asia, 98%
0%
20%
40%
60%
80%
100%
Opium Morphine Heroin
Perc
enta
ge
Other*
North America
East Europe
Central Asia andTranscaucasian countriesEast and South-East Asia
Western and CentralEuropeSouth-East Europe
Near and Middle East/South-West Asia
Correlation coefficient: 0.75
Correlation coefficient: 0.95

143
2. Drug statistics and trends Opium/heroin
Opium seizures in Afghanistan fell from 52.5 mt in 2007 to 42.8 mt11 in 2008. Given the large amounts of opium being produced in Afghanistan, these levels imply a disproportionately low seizure rate. Based on data gathered by UNODC, in 2008, opium seizures mainly took place in the provinces of Hilmand (20.8 mt), Nan-garhar (9.8 mt), Kandahar (4.1 mt) and Hirat (3.4 mt). Afghanistan reported seizures of 35.7 mt in 2009. How-
in 2009.11 UNODC Afghanistan country office.
ever, this may not include seizures made by international forces in collaboration with Afghan forces - in the first half of 2009 only, military operations seized 50 mt of opium.12
In line with the trend in the Islamic Republic of Iran, opium seizures in Pakistan rose more than tenfold over the period 2004-2008, from 2.5 mt in 2004 to 27.2 mt in 2008. Pakistan also reported seizures of 6.9 mt of opium poppy straw in 2007, and more than 10 times this quantity – 81.7 mt – in 2008.
Morphine
For the second consecutive year, in 2008, global mor-phine seizures fell by more than one third, dropping from 27.4 mt in 2007 to 17.3 mt. The decline over the 2006-2008 period was mainly due to a notable down-ward trend in Pakistan. Seizures of morphine in Pakistan fell sharply in 2007, from 32.7 mt in 2006 to 11.0 mt, and even further in 2008, to 7.3 mt – the lowest level since 2002. The downward trend was in sharp contrast with increasing opium seizures in the same country.
In 2008, the largest quantity of morphine was seized by the Islamic Republic of Iran, where seizures amounted to 9.0 mt,13 essentially stable at the 2007 level (9.7 mt). However, according to preliminary data,14 in 2009, seizures almost doubled, rising to 16.1 mt.
12 UNODC/Government of Afghanistan (Ministry of Counter Narcot-ics), Afghanistan Opium Survey 2009, December 2009.
13 Islamic Republic of Iran, Drug Control Headquarters, Drug Control in 2009.
14 Ibid.
Comparison of global opiate seizures with global production estimatesFig. 111:
Source: UNODC ARQ/DELTA (seizure data), UNODC (production estimates)
Opium
25% 22% 17% 19%
-
1,000
2,000
3,000
4,000
2005 2006 2007 2008
Ton
s
Opium production (non-processed) two-year averageTotal opium seizures
Other opiates (heroin and morphine)
12%17% 22% 15%
0
200
400
600
800
2005 2006 2007 2008
Ton
s
Global potential heroin production in previous year(excluding non-processed opium)Opiate seizures (excluding opium)
Opium seizures in Afghanistan, Fig. 112: Islamic Republic of Iran and world-wide (mt), 2000-2009
* Data for 2009 for the Islamic Republic of Iran are preliminarySource: UNODC ARQ/DELTA
0
100
200
300
400
500
600
700
2000
2001
2002
2003
2004
2005
2006
2007
2008
2009
*
GlobalIslamic Republic of IranAfghanistan


145
2. Drug statistics and trends Opium/heroin
Global morphine seizures, 2003-2009Fig. 113:
* Data for 2009 for the Islamic Republic of Iran are preliminary.Source: UNODC ARQ/DELTA
Comparison of morphine and opium Fig. 114: seizure trends in Pakistan (mt), 2004-2008
Note: Data are presented for the purposes of a comparison of trends over time, not quantities, across different drug types. In no sense should 1 ton of opium be considered equivalent to 1 ton of morphine (in particular not in terms of potential heroin manufacture).Source: UNODC ARQ/DELTA
0
5
10
15
20
25
30
35
40
45
50
2003 2004 2005 2006 2007 2008 2009*
Ton
s
Global total
Pakistan
Iran (Islamic Republic of)
Afghanistan
-
5
10
15
20
25
30
35
2004 2005 2006 2007 2008
Opium (raw and prepared) Morphine
Global heroin seizures, 1998-2008Fig. 115:
Source: UNODC ARQ/DELTA
0
10
20
30
40
50
60
70
80
1998 1999 2000 2001 2002 2003 2004 2005 2006 2007 2008
Rest of the world
South Asia
North America
East Europe
Central Asia and TranscaucasiancountriesEast and South-East Asia
West & Central Europe
Southeast Europe
Near and Middle East /South-West Asia

146
World Drug Report 2010
Heroin
In 2008, global heroin seizures reached a record level of 73.7 mt, up from 65.5 mt in 2007, registering the second consecutive year-on-year increase. Heroin sei-zures remained much less geographically concentrated than seizures of opium and morphine, with large quanti-ties of heroin being seized in the subregion of the Near and Middle East/South-West Asia (39% of the global total), South-East Europe (24%), West and Central Europe (10%), East and South-East Asia (7.3%), Cen-tral Asia and Transcaucasian countries (7.3%), East Europe (5.4%) and North America (3.1%).
The global increase in heroin seizures over the 2006-2008 period was driven mainly by continued burgeon-
ing seizures in the Islamic Republic of Iran and Turkey. In 2008, these two countries accounted for more than half of global heroin seizures, and registered, for the third consecutive year, the highest and second highest seizures worldwide, respectively. By 2008, heroin sei-zures in the Islamic Republic of Iran had climbed to 23.1 mt.15 According to preliminary data, in 2009 heroin seizures may have stabilized, amounting to 23.4 mt.16 In Turkey, seizures rose from 13.2 mt in 2007 to 15.4 mt in 2008.
15 Islamic Republic of Iran, Drug Control Headquarters, Drug Control in 2009.
16 Ibid.
Correlation of heroin seizures in Turkey with opium and heroin seizures in the Islamic Fig. 116: Republic of Iran, 2000-2004 and 2004-2008
Sources: UNODC ARQ/DELTA
3
4
5
6
7
2 3 4 5 6 7 8 9
Tons of heroin in Turkey
Ton
s o
f h
ero
in in
Iran
(Is
lam
ic R
ep. o
f)
60
80
100
120
140
160
180
200
2 3 4 5 6 7 8 9
Tons of heroin in Turkey
Ton
s o
f o
piu
m in
Iran
(Is
lam
ic R
ep. o
f)
4
9
14
19
24
8 9 10 11 12 13 14 15 16
Tons of heroin in Turkey
Ton
s o
f h
ero
in in
Iran
(Is
lam
ic R
ep. o
f)
150
200
250
300
350
400
450
500
550
600
8 9 10 11 12 13 14 15 16
Tons of heroin in Turkey
Ton
s o
f o
piu
m in
Iran
(Is
lam
ic R
ep. o
f)
2000
-200
420
04-2
008
Correlation coefficient: 0.50
Correlation coefficient: 0.90
Correlation coefficient: 0.99
Correlation coefficient: 0.98

147
2. Drug statistics and trends Opium/heroin
Turkey remained a major gateway for heroin destined for West and Central Europe. A comparison of heroin seizures in Turkey with opiate seizures in the neighbour-ing Islamic Republic of Iran reveals notable patterns. Over the 2000-2004 period, heroin seizures in Turkey were more strongly correlated with opium seizures than with heroin seizures in the Islamic Republic of Iran, sug-gesting that the supply of heroin in Turkey was sourced to a significant extent from opium transiting the Islamic Republic of Iran. In contrast, over the 2004-2008 period, the correlation was remarkably strong with both heroin and opium seizures in the Islamic Republic of Iran, and the discrepancy could no longer be observed, thus making it plausible that traffickers in the two countries were ultimately drawing from a common supply of heroin.
Following a significant decline over the 2004-2007 period, heroin seizures in China appeared to stabilize in 2008, amounting to 4.3 mt in 2008, only slightly less than the level in 2007 (4.6 mt). China reported that West African (especially Nigerian) syndicates were traf-ficking large quantities of heroin, as well as metham-phetamine, to China, especially through Guangdong province.
Heroin seizures fell both in Afghanistan, from 5.0 mt17 in 2007 to 2.8 mt15 in 2008, and in Pakistan, from 2.9 mt in 2007 to 1.9 mt in 2008 – the lowest level in Paki-stan since 1981. On the other hand, in 2008 seizures reached the highest levels on record in Uzbekistan (1.5 mt) and Kazakhstan (1.6 mt), while remaining essen-tially stable in Tajikistan (1.6 mt).
17 UNODC Afghanistan country office.
Further indications of changing trafficking patterns in Pakistan can be observed from an analysis of significant individual heroin seizures reported by this country. Among those cases in which a country other than Paki-stan was identified as the destination, the proportion of consignments intended for Malaysia had never exceeded 1% prior to 2006. In contrast, this proportion rose to 9% in 2007 and 22% in 2008. Similarly, the proportion of consignments intended for China had never exceeded 1% prior to 2005, but rose to 28% in 2006. However, this proportion then declined to 10% in 2007 and 4% in 2008.
In West and Central Europe, heroin seizures remained stable for the second year in a row, at 7.7 mt in 2008. Seizures in the Russian Federation rose in 2007, from 2.5 mt in 2006 to 2.9 mt, and again in 2008, to 3.4 mt. Seizures in the United States fell from 2.4 mt in 2007 to 2.0 mt in 2008, nevertheless remaining higher than the level in 2005 and 2006 (1.7 mt).
Destination of heroin seizure cases reported by Pakistan, 2007 and 2008Fig. 117:
Source: UNODC Individual Drug Seizures database
South Africa,9%
Nepal,2%
Thailand,4%
Malaysia,9%
United Kingdom,7%
UnitedArab Emirates,
11%
Nigeria,12%
Other,36%
China,10%
Thailand,3%
South Africa,9%
Malaysia,22%
Nigeria,8%
Other,27%
China,4%
United Kingdom,
11%
Nepal,5%
United Arab Emirates,
11%
2007 2008
Total = 363 seizures Total = 444 seizures


2. Drug statistics and trends Opium/heroin
149
Prices2.2.3
Opium farm-gate prices and opium production
Both heroin (wholesale) and opium (farm-gate) prices in Afghanistan have decreased noticeably over the last years, but not at the same speed. A comparison between the two price trends reveals that the ratio of heroin to opium prices between 2006 and 2009 has indeed increased, as opium prices were falling more rapidly than heroin prices. Without knowing the composition and purity of the heroin sold at the reported prices this trend is difficult to interpret. Potentially, a large ratio could indicate a larger profit margin for drug traffickers involved in heroin production. On the other hand, prices for precursors seemed to have reached a very high level in 2009, when acetic anhydride, a key element of the conversion process, was sold at US$350 to US$400 per litre. Thus, the high prices for inputs could (partly) be compensated by paying less for opium, as the market did not allow an increase in heroin prices. Another pos-sible explanation is that the quality of the opium (mor-phine content) is lower and more opium is needed to produce the same amount of heroin.
The declining opium prices in Afghanistan are not always mirrored by price trends in neighbouring coun-tries. As one can expect, opium price levels in neigh-bouring countries are higher than in Afghanistan, as a result of transport costs and risk premiums. The opium wholesale price in Peshawar, Pakistan, seems to best reflect price developments in Afghanistan whereas opium price trends in the Islamic Republic of Iran and Tajikistan seem to be subject to additional factors.
Farm-gate prices of opium in Afghanistan have been on the decline in recent years, reflecting production increases in Afghanistan and a high level of global opium produc-tion, to which Afghanistan is the main contributor. The price decline was steepest in years of large production increases in Afghanistan and has ebbed off since 2008, despite a decline in production, probably reflecting the still very high level of global opium production since 2006 and the existence of opium stocks.
Prices in Colombia, where prices refer to opium latex which has a higher moisture content than opium gum, are not directly comparable to prices in Afghanistan and Myanmar, where they refer to air-dried opium gum. Converted into air-dried opium equivalents, per kilo prices in Colombia would roughly be double to triple the price in Myanmar, which is already far higher than the price in Afghanistan. Two observations can be made: First, farm-gate prices of opium in Myanmar, the second largest opium producing country, and in Colombia, which has a small but regionally important production, showed constant increases over the last five years and do not reflect the strong increase in global opium produc-tion. Second, price levels differ strongly in these three regions, with Afghanistan having the lowest prices, Myanmar a price level five times higher than Afghani-stan, and Colombia (in dry opium equivalents about US$930/kg) about three times higher than Myanmar or 15 times higher than Afghanistan. The opium prices in Colombia are close to the opium price levels observed in Thailand and the Lao People’s Democratic Republic of over US$1,000/kg since 2008.
The disconnect between farm-gate prices and global production trends supports the hypothesis of the exist-ence of separate regional markets, where prices reflect the local/regional rather than global opium production levels and trends.
Afghanistan, wholesale opium and Fig. 118: heroin price, 2006-2009
Source: UNODC ARQ
0
500
1,000
1,500
2,000
2,500
3,000
3,500
4,000
Jan
06
May
06
Sep
06
Jan
07
May
07
Sep
07
Jan
08
May
08
Sep
08
Jan
09
May
09
Sep
09
Her
oin
(U
S$/k
g)
0
50
100
150
200
250
300
350
400
Op
ium
(U
S$/k
g)
Heroin (wholesale)
Dry opium (trader)
Ratio 20:1
Ratio 26:1
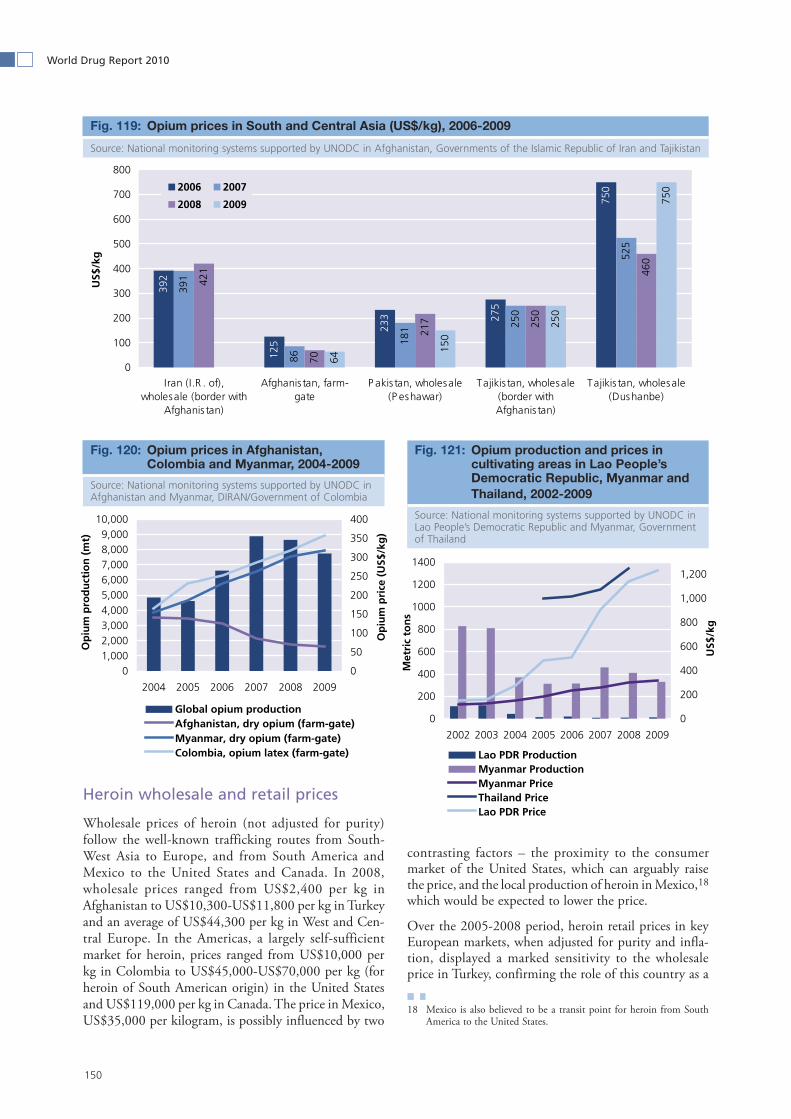
150
World Drug Report 2010
Heroin wholesale and retail prices
Wholesale prices of heroin (not adjusted for purity) follow the well-known trafficking routes from South-West Asia to Europe, and from South America and Mexico to the United States and Canada. In 2008, wholesale prices ranged from US$2,400 per kg in Afghanistan to US$10,300-US$11,800 per kg in Turkey and an average of US$44,300 per kg in West and Cen-tral Europe. In the Americas, a largely self-sufficient market for heroin, prices ranged from US$10,000 per kg in Colombia to US$45,000-US$70,000 per kg (for heroin of South American origin) in the United States and US$119,000 per kg in Canada. The price in Mexico, US$35,000 per kilogram, is possibly influenced by two
contrasting factors – the proximity to the consumer market of the United States, which can arguably raise the price, and the local production of heroin in Mexico,18 which would be expected to lower the price.
Over the 2005-2008 period, heroin retail prices in key European markets, when adjusted for purity and infla-tion, displayed a marked sensitivity to the wholesale price in Turkey, confirming the role of this country as a
18 Mexico is also believed to be a transit point for heroin from South America to the United States.
Opium prices in South and Central Asia (US$/kg), 2006-2009Fig. 119:
Source: National monitoring systems supported by UNODC in Afghanistan, Governments of the Islamic Republic of Iran and Tajikistan39
2
125
233 27
5
750
391
86
181 25
0
525
421
70
217 25
0
460
64
150
250
750
0
100
200
300
400
500
600
700
800
Iran (I.R . of),wholesale (border with
Afghanis tan)
Afghanis tan, farm-gate
P akis tan, wholesale(P eshawar)
Tajikis tan, wholesale(border withAfghanis tan)
Tajikis tan, wholesale(Dushanbe)
US$
/kg
2006 2007
2008 2009
01,0002,0003,0004,0005,0006,0007,0008,0009,000
10,000
2004 2005 2006 2007 2008 2009
Op
ium
pro
du
ctio
n (
mt)
0
50
100
150
200
250
300
350
400
Op
ium
pri
ce (
US$
/kg
)
Global opium productionAfghanistan, dry opium (farm-gate)Myanmar, dry opium (farm-gate)Colombia, opium latex (farm-gate)
Opium prices in Afghanistan, Fig. 120: Colombia and Myanmar, 2004-2009
Source: National monitoring systems supported by UNODC in Afghanistan and Myanmar, DIRAN/Government of Colombia
Opium production and prices in Fig. 121: cultivating areas in Lao People’s Democratic Republic, Myanmar and Thailand, 2002-2009
Source: National monitoring systems supported by UNODC in Lao People’s Democratic Republic and Myanmar, Government of Thailand
Met
ric
ton
s
0
200
400
600
800
1000
1200
1400
2002 2003 2004 2005 2006 2007 2008 2009
US$
/kg
0
200
400
600
800
1,000
1,200
Lao PDR ProductionMyanmar ProductionMyanmar PriceThailand PriceLao PDR Price

151
2. Drug statistics and trends Opium/heroin
major gateway for heroin entering Europe. A notable exception was the United Kingdom, where the adjusted price remained largely stable. This may reflect the differ-ent trafficking patterns for heroin reaching the United Kingdom, as opposed to continental Europe.19
In the United States, high wholesale purity and low prices, as well as other indicators, suggest that heroin remains widely available in the country, and that the availability is increasing in some areas. Moreover, the
19 The United Kingdom assessed that, in 2008, 25% of the heroin in its market was trafficked from Pakistan, as opposed to the Balkan route. Other factors may also distinguish the UK market from continental Europe.
results of the Heroin Signature Program (HSP) of the US Drug Enforcement Agency point to an increase in the availability of heroin from Mexico. The wholesale purity of heroin of Mexican origin was at its highest (40%) since 2005, while Mexican heroin represented 39% (by weight) of all heroin analysed through the HSP, the highest percentage since 1987.20
20 National Drug Intelligence Center, United States Department of Justice, National Drug Threat Assessment 2010, February 2010.
Heroin wholesale prices (not adjusted for purity) in Africa, Asia and Europe, 2008Fig. 122:
* Average of reported minimum and maximum prices. ** Simple average.Source: UNODC ARQ
2.4
3.0
3.1
3.3
7.4
11.0
11.0
15.7
16.0
16.2
18.2
19.1
24.0
26.5
30.1
35.0
45.0
45.3
45.9
49.7 70
.6 82.9
87.4
240
0
50
100
150
200
250
300
Afg
hani
stan
Tajik
ista
n
Paki
stan
Iran
(I.R.
of)
Egyp
t*
Syria
Turk
ey*
Togo
Uzb
ekis
tan
Mon
tene
gro
Jord
an
Bosn
ia a
ndH
erze
govi
na
Isra
el
Serb
ia
Gre
ece
Mol
dova
, Rep
.
Rest
of
Euro
pe**
Saud
i Ara
bia
Russ
ian
Fede
ratio
n
Hon
g K
ong
,Chi
na
Mya
nmar
Burk
ino
Faso
Indo
nesi
a
Bahr
ain
US
do
llars
per
gra
m
Heroin wholesale prices (not adjusted Fig. 123: for purity) in the Americas, 2008
* Average of reported minimum and maximum prices. ** Tar (Mexican origin). *** South American origin.
Source: UNODC ARQ
Trends in purity- and inflation-adjusted Fig. 124: heroin prices in selected European countries, 2005-2008 (indexed, base-line 2005)
* France did not register a variation in purity over the period 2005-2008. Note: purity-adjusted prices are UNODC estimates based on reported prices and purities.Source: UNODC ARQ, Europol, World Drug Report 2009
10 1321
35
53 58
119
0
40
80
120
160
Col
ombi
a
Ecua
dor
Uni
ted
Stat
es o
fA
mer
ica*
,**
Mex
ico
Gua
tem
ala
Uni
ted
Stat
es o
fA
mer
ica*
,***
Can
ada
US
do
llars
per
gra
m
0.0
0.2
0.4
0.6
0.8
1.0
1.2
2005 2006 2007 2008
Germany retail price, purity- and inflation-adjusted (Euro)France retail price, purity- and inflation-adjusted (Euro)*Turkey wholesale price, purity- and inflation-adjusted (Euro)UK retail price, purity- and inflation-adjusted (pound)
Correlation Matrix, 2005-2008Germany France Turkey UK
Germany 1.00 0.96 0.97 0.49France 0.96 1.00 0.98 0.57Turkey 0.97 0.98 1.00 0.43UK 0.49 0.57 0.43 1.00
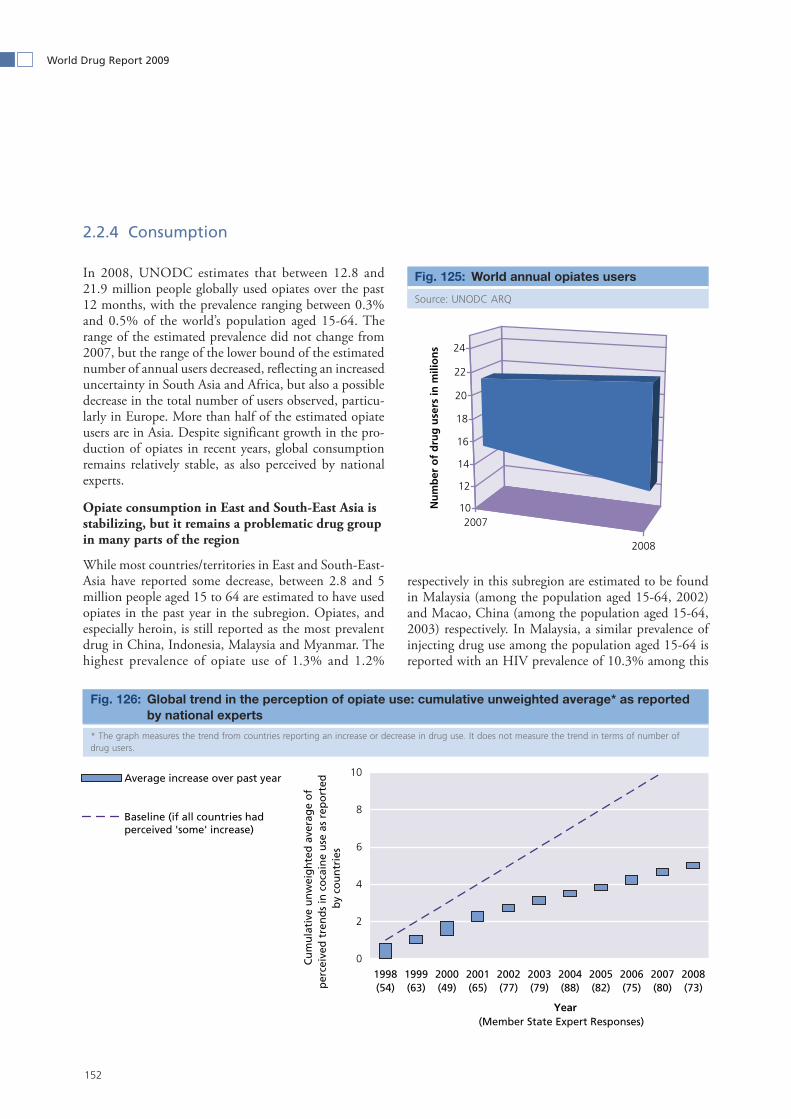
152
World Drug Report 2009
2.2.4 Consumption
In 2008, UNODC estimates that between 12.8 and 21.9 million people globally used opiates over the past 12 months, with the prevalence ranging between 0.3% and 0.5% of the world’s population aged 15-64. The range of the estimated prevalence did not change from 2007, but the range of the lower bound of the estimated number of annual users decreased, reflecting an increased uncertainty in South Asia and Africa, but also a possible decrease in the total number of users observed, particu-larly in Europe. More than half of the estimated opiate users are in Asia. Despite significant growth in the pro-duction of opiates in recent years, global consumption remains relatively stable, as also perceived by national experts.
Opiate consumption in East and South-East Asia is stabilizing, but it remains a problematic drug group in many parts of the region
While most countries/territories in East and South-East-Asia have reported some decrease, between 2.8 and 5 million people aged 15 to 64 are estimated to have used opiates in the past year in the subregion. Opiates, and especially heroin, is still reported as the most prevalent drug in China, Indonesia, Malaysia and Myanmar. The highest prevalence of opiate use of 1.3% and 1.2%
respectively in this subregion are estimated to be found in Malaysia (among the population aged 15-64, 2002) and Macao, China (among the population aged 15-64, 2003) respectively. In Malaysia, a similar prevalence of injecting drug use among the population aged 15-64 is reported with an HIV prevalence of 10.3% among this
World annual opiates usersFig. 125:
Source: UNODC ARQ
Global trend in the perception of opiate use: cumulative unweighted average* as reported Fig. 126: by national experts
* The graph measures the trend from countries reporting an increase or decrease in drug use. It does not measure the trend in terms of number of drug users.
2007
2008
10
12
14
16
18
20
22
24
Nu
mb
er o
f d
rug
use
rs in
mili
on
s
0
2
4
6
8
10
1998(54)
1999(63)
2000(49)
2001(65)
2002(77)
2003(79)
2004(88)
2005(82)
2006(75)
2007(80)
2008(73)
Year (Member State Expert Responses)
Cu
mu
lati
ve u
nw
eig
hte
d a
vera
ge
of
per
ceiv
ed t
ren
ds
in c
oca
ine
use
as
rep
ort
ed
by
cou
ntr
ies
Average increase over past year
Baseline (if all countries hadperceived 'some' increase)

153
2. Drug statistics and trends Opium/heroin
group.21 Except for Myanmar, there is no new informa-tion on opiate consumption available for 2008 in the subregion. Higher than global average prevalence of opiate use is reported in Myanmar, where opium-pro-ducing villages have a higher consumption rate than non-producing villages.22 In Myanmar, heroin use is still
21 Mathers B., Degenhardt L., Phillips B., Wiessing L., Hickman M., Strathdee A., Wodak A., Panda S., Tyndall M., Toufik A.and Mattick R., on behalf of the Reference Group to the United Nations on HIV and Injecting Drug Use, “Global epidemiology of injecting drug use and HIV among people who inject drugs: a systematic review,” The Lancet, 2008; 372:1733-1745.
22 UNODC, Opium poppy cultivation in South-East Asia, December
less widespread than opium use, but data suggest that heroin use may have increased in recent years.23 Opium use among the population aged 15 and older has decreased from 2% among men to 1.4%, and from 0.2% among women in 2008 to 0.1% in 2009. On the other hand, heroin use has increased from 0.1% in 2008 to 0.3% in 2009.24
2009.23 Ibid.24 UNODC, Opium poppy cultivation in South-East Asia, December
2008.
Estimated number of people who used opiates at least once in the past year and Table 16: prevalence of opiate use in the population aged 15-64, by region, 2008
Region/SubregionEstimated
number of users annually (lower)
-Estimated
number of users annually (upper)
Percent of population age 15-64 (lower)
-Percent of
population age 15-64 (upper)
Africa 680,000 - 2,930,000 0.1 - 0.5
Eastern Africa 150,000 - 1,730,000 0.1 - 1.3North Africa 130,000 - 540,000 0.1 - 0.4Southern Africa 240,000 - 320,000 0.2 - 0.3West and Central Africa 160,000 - 340,000 0.1 - 0.2
Americas 2,290,000 - 2,440,000 0.4 - 0.4
Caribbean 60,000 - 90,000 0.2 - 0.3Central America 100,000 - 110,000 0.4 - 0.4North America 1,290,000 - 1,380,000 0.4 - 0.5South America 840,000 - 870,000 0.3 - 0.3
Asia 6,460,000 - 12,540,000 0.2 - 0.5
Central Asia 340,000 - 340,000 0.7 - 0.7East/South-East Asia 2,830,000 - 5,060,000 0.2 - 0.3Near and Middle East 1,890,000 - 3,820,000 0.8 - 1.5South Asia 1,390,000 - 3,310,000 0.2 - 0.4
Europe 3,290,000 - 3,820,000 0.6 - 0.7
Eastern/South-East Europe 2,210,000 - 2,460,000 0.8 - 0.9Western/Central Europe 1,090,000 - 1,370,000 0.4 - 0.5
Oceania 120,000 - 150,000 0.5 - 0.6
Global 12,840,000 - 21,880,000 0.3 - 0.5
Range of estimated numbers and annual prevalence of opiate use globally and by regionFig. 127:
0
5
10
15
20
25
Glo
bal
Asi
a
Am
eric
as
Afr
ica
Euro
pe
Oce
aniaEs
tim
ated
nu
mb
er o
f o
pio
id u
sers
(r
ang
e in
Mill
ion
s)
0.0
0.1
0.2
0.3
0.4
0.5
0.6
0.7
0.8
Glo
bal
Asi
a
Oce
ania
Am
eric
as
Afr
ica
Euro
pe
Low
er/
Up
per
Pre
vale
nce
R
ang
e (%
)
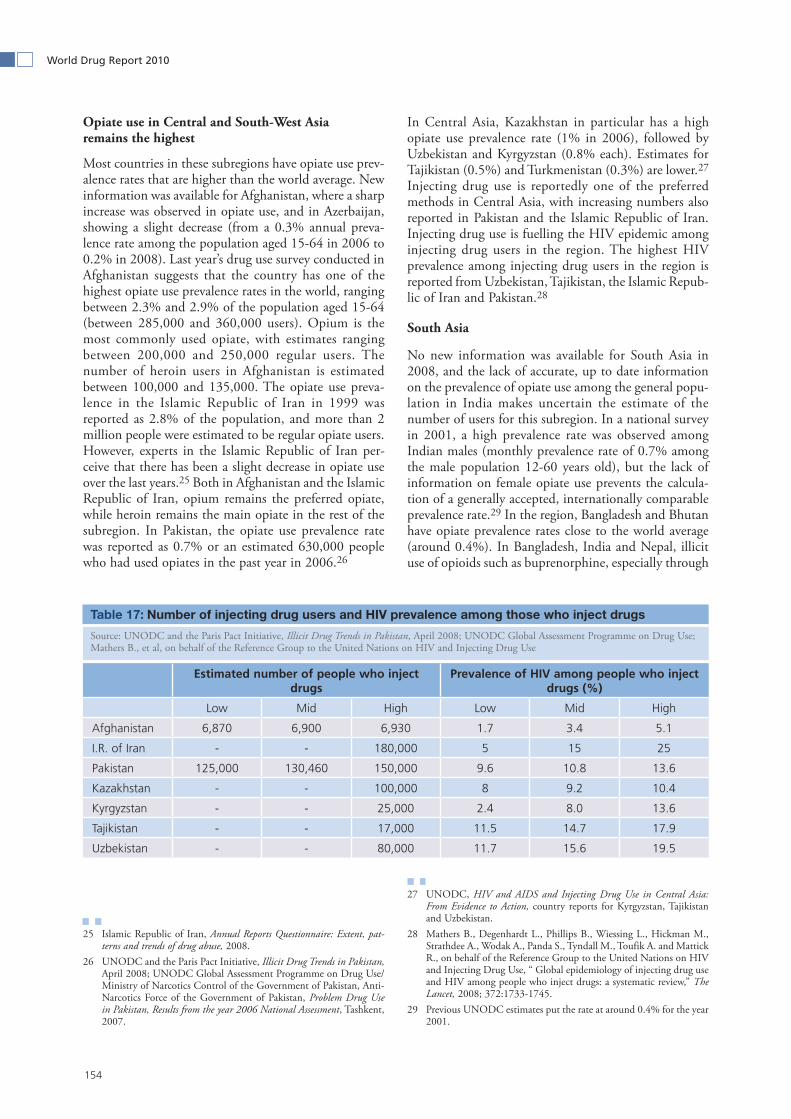
154
World Drug Report 2010
Opiate use in Central and South-West Asia remains the highest
Most countries in these subregions have opiate use prev-alence rates that are higher than the world average. New information was available for Afghanistan, where a sharp increase was observed in opiate use, and in Azerbaijan, showing a slight decrease (from a 0.3% annual preva-lence rate among the population aged 15-64 in 2006 to 0.2% in 2008). Last year’s drug use survey conducted in Afghanistan suggests that the country has one of the highest opiate use prevalence rates in the world, ranging between 2.3% and 2.9% of the population aged 15-64 (between 285,000 and 360,000 users). Opium is the most commonly used opiate, with estimates ranging between 200,000 and 250,000 regular users. The number of heroin users in Afghanistan is estimated between 100,000 and 135,000. The opiate use preva-lence in the Islamic Republic of Iran in 1999 was reported as 2.8% of the population, and more than 2 million people were estimated to be regular opiate users. However, experts in the Islamic Republic of Iran per-ceive that there has been a slight decrease in opiate use over the last years.25 Both in Afghanistan and the Islamic Republic of Iran, opium remains the preferred opiate, while heroin remains the main opiate in the rest of the subregion. In Pakistan, the opiate use prevalence rate was reported as 0.7% or an estimated 630,000 people who had used opiates in the past year in 2006.26
25 Islamic Republic of Iran, Annual Reports Questionnaire: Extent, pat-terns and trends of drug abuse, 2008.
26 UNODC and the Paris Pact Initiative, Illicit Drug Trends in Pakistan, April 2008; UNODC Global Assessment Programme on Drug Use/Ministry of Narcotics Control of the Government of Pakistan, Anti-Narcotics Force of the Government of Pakistan, Problem Drug Use in Pakistan, Results from the year 2006 National Assessment, Tashkent, 2007.
In Central Asia, Kazakhstan in particular has a high opiate use prevalence rate (1% in 2006), followed by Uzbekistan and Kyrgyzstan (0.8% each). Estimates for Tajikistan (0.5%) and Turkmenistan (0.3%) are lower.27 Injecting drug use is reportedly one of the preferred methods in Central Asia, with increasing numbers also reported in Pakistan and the Islamic Republic of Iran. Injecting drug use is fuelling the HIV epidemic among injecting drug users in the region. The highest HIV prevalence among injecting drug users in the region is reported from Uzbekistan, Tajikistan, the Islamic Repub-lic of Iran and Pakistan.28
South Asia
No new information was available for South Asia in 2008, and the lack of accurate, up to date information on the prevalence of opiate use among the general popu-lation in India makes uncertain the estimate of the number of users for this subregion. In a national survey in 2001, a high prevalence rate was observed among Indian males (monthly prevalence rate of 0.7% among the male population 12-60 years old), but the lack of information on female opiate use prevents the calcula-tion of a generally accepted, internationally comparable prevalence rate.29 In the region, Bangladesh and Bhutan have opiate prevalence rates close to the world average (around 0.4%). In Bangladesh, India and Nepal, illicit use of opioids such as buprenorphine, especially through
27 UNODC, HIV and AIDS and Injecting Drug Use in Central Asia: From Evidence to Action, country reports for Kyrgyzstan, Tajikistan and Uzbekistan.
28 Mathers B., Degenhardt L., Phillips B., Wiessing L., Hickman M., Strathdee A., Wodak A., Panda S., Tyndall M., Toufik A. and Mattick R., on behalf of the Reference Group to the United Nations on HIV and Injecting Drug Use, “ Global epidemiology of injecting drug use and HIV among people who inject drugs: a systematic review,” The Lancet, 2008; 372:1733-1745.
29 Previous UNODC estimates put the rate at around 0.4% for the year 2001.
Number of injecting drug users and HIV prevalence among those who inject drugsTable 17:
Source: UNODC and the Paris Pact Initiative, Illicit Drug Trends in Pakistan, April 2008; UNODC Global Assessment Programme on Drug Use; Mathers B., et al, on behalf of the Reference Group to the United Nations on HIV and Injecting Drug Use
Estimated number of people who inject drugs
Prevalence of HIV among people who inject drugs (%)
Low Mid High Low Mid High
Afghanistan 6,870 6,900 6,930 1.7 3.4 5.1
I.R. of Iran - - 180,000 5 15 25
Pakistan 125,000 130,460 150,000 9.6 10.8 13.6
Kazakhstan - - 100,000 8 9.2 10.4
Kyrgyzstan - - 25,000 2.4 8.0 13.6
Tajikistan - - 17,000 11.5 14.7 17.9
Uzbekistan - - 80,000 11.7 15.6 19.5

155
2. Drug statistics and trends Opium/heroin
injecting, is reportedly common.30 In Sri Lanka, smok-ing heroin remains the preferred method of use.
Other than Israel, most of the countries in Middle East have reportedly negligible opiate use. However, this is also due to the fact that there is limited data on drug use and treatment demand from the region.
East and South-East Europe as a subregion has the second highest number of opiate users, ranging between 2.2 and 2.5 million people
The subregion on the whole seems to have one of the highest prevalence rates in the world (0.8% to 0.9% of the population aged 15-64), though individual country estimates must be treated with caution. The Russian
30 UNODC, Rapid Situation and Response Assessment of drugs and HIV in Bangladesh, India, Nepal and Sri Lanka – a regional report, 2007.
Federation and Ukraine are the two countries in the subregion with the highest estimated number of opiate users. In the Russian Federation, the number of opiate users are estimated between 1.6 and 1.8 million (1.6% prevalence) and in Ukraine, between 325,000 and 425,000 (1.16% prevalence). The only country report-ing new information in 2008 was the Republic of Moldova, showing an increase from a 0.1% annual prevalence rate in 2007 to 0.15% in 2008. Both the Russian Federation and Ukraine have some of the high-est HIV prevalence rates among injecting drug users (37.2% and 41.8%, respectively).31 The other countries in the region have opiate use prevalence rates either equivalent to or lower than the world average.
European data suggest that while heroin use is decreasing its associated harm is growing
In West and Central Europe, the opiate use prevalence is estimated between 0.4% and 0.5% of the general population, with the corresponding number of opiate users between 1 and 1.4 million. The 2008 range shifted slightly down from the one estimated in 2007, when the number of opiate users was estimated between 1.2 and 1.5 million, reflecting a decrease in most of the countries which reported new estimates in 2008. Scotland and Estonia are the two countries with high prevalence of opiate use in West and Central Europe (1.5% among the population aged 15-64).
While overall heroin use may be stable or declining in West and Central Europe, problems associated with heroin abuse seem to increase. Based on a sample of 19 countries, the overall number of primary heroin users entering treatment increased between 2002 and 2007. More than half of the reporting countries recorded
31 Mathers B., Degenhardt L., Phillips B., Wiessing L., Hickman M., Strathdee A., Wodak A., Panda S., Tyndall M., Toufik A. and Mattick R, on behalf of the Reference Group to the United Nations on HIV and Injecting Drug Use, “Global epidemiology of injecting drug use and HIV among people who inject drugs: a systematic review,” The Lancet, 2008; 372:1733-1745.
Annual opiate users in Asia, 2007-2008Fig. 128:
Source: UNODC ARQ
Expert perception of the opiates us trend between 2007 and 2008Table 18:
Source: UNODC ARQ
Region
Member States
providing perception
data
Member States
perception response
rate
Use problem
increased*
Percent use
problem increased
Use problem stable
Percent use prob-lem stable
Use problem
decreased*
Percent use
problem decreased
Africa 12 23% 6 50% 2 17% 4 33%
Americas 12 34% 6 50% 5 42% 1 8%
Asia 28 62% 11 39% 11 39% 6 21%
Europe 31 69% 9 29% 19 61% 3 10%
Oceania 1 7% 0 1 0
Global 84 44% 32 38% 38 45% 14 17%
* Identifies increases/ decreases ranging from either some to strong, unweighted by population.
2007
2008
5
6
7
8
9
10
11
12
13
14
15
Nu
mb
er o
f d
rug
use
rs in
mili
on
s
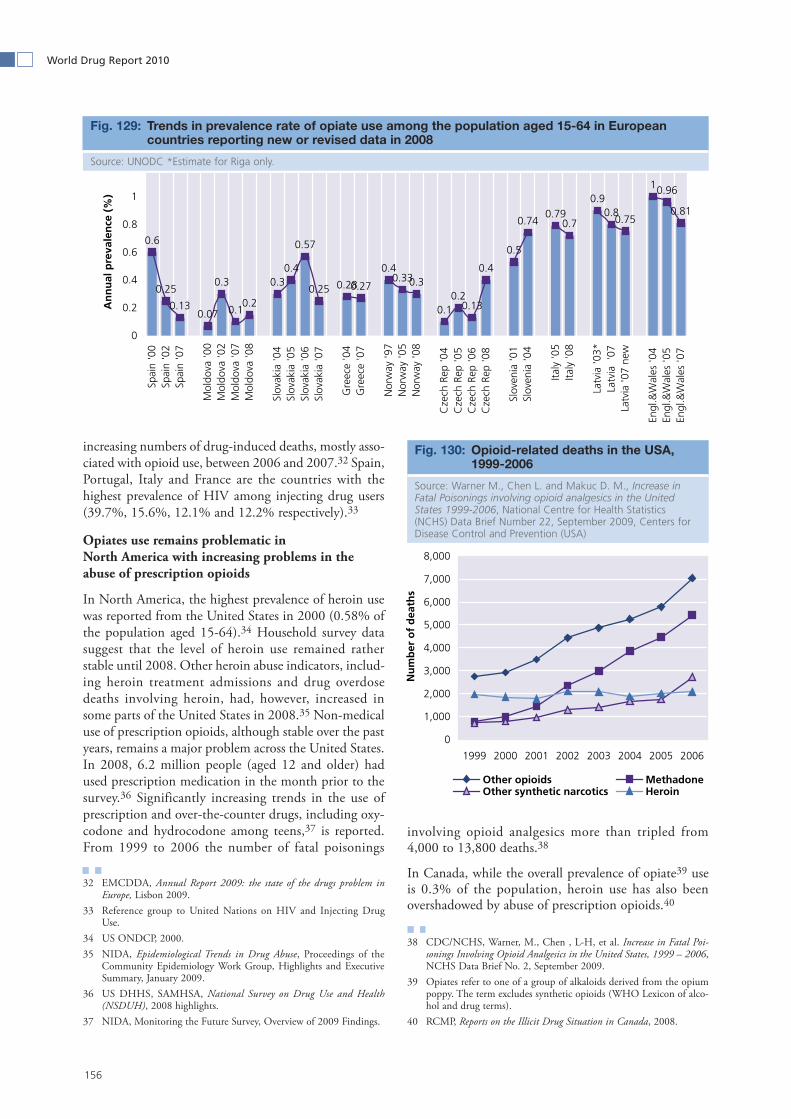
156
World Drug Report 2010
increasing numbers of drug-induced deaths, mostly asso-ciated with opioid use, between 2006 and 2007.32 Spain, Portugal, Italy and France are the countries with the highest prevalence of HIV among injecting drug users (39.7%, 15.6%, 12.1% and 12.2% respectively).33
Opiates use remains problematic in North America with increasing problems in the abuse of prescription opioids
In North America, the highest prevalence of heroin use was reported from the United States in 2000 (0.58% of the population aged 15-64).34 Household survey data suggest that the level of heroin use remained rather stable until 2008. Other heroin abuse indicators, includ-ing heroin treatment admissions and drug overdose deaths involving heroin, had, however, increased in some parts of the United States in 2008.35 Non-medical use of prescription opioids, although stable over the past years, remains a major problem across the United States. In 2008, 6.2 million people (aged 12 and older) had used prescription medication in the month prior to the survey.36 Significantly increasing trends in the use of prescription and over-the-counter drugs, including oxy-codone and hydrocodone among teens,37 is reported. From 1999 to 2006 the number of fatal poisonings
32 EMCDDA, Annual Report 2009: the state of the drugs problem in Europe, Lisbon 2009.
33 Reference group to United Nations on HIV and Injecting Drug Use.
34 US ONDCP, 2000.35 NIDA, Epidemiological Trends in Drug Abuse, Proceedings of the
Community Epidemiology Work Group, Highlights and Executive Summary, January 2009.
36 US DHHS, SAMHSA, National Survey on Drug Use and Health (NSDUH), 2008 highlights.
37 NIDA, Monitoring the Future Survey, Overview of 2009 Findings.
involving opioid analgesics more than tripled from 4,000 to 13,800 deaths.38
In Canada, while the overall prevalence of opiate39 use is 0.3% of the population, heroin use has also been overshadowed by abuse of prescription opioids.40
38 CDC/NCHS, Warner, M., Chen , L-H, et al. Increase in Fatal Poi-sonings Involving Opioid Analgesics in the United States, 1999 – 2006, NCHS Data Brief No. 2, September 2009.
39 Opiates refer to one of a group of alkaloids derived from the opium poppy. The term excludes synthetic opioids (WHO Lexicon of alco-hol and drug terms).
40 RCMP, Reports on the Illicit Drug Situation in Canada, 2008.
Trends in prevalence rate of opiate use among the population aged 15-64 in European Fig. 129: countries reporting new or revised data in 2008
Source: UNODC *Estimate for Riga only.
Opioid-related deaths in the USA, Fig. 130: 1999-2006
Source: Warner M., Chen L. and Makuc D. M., Increase in Fatal Poisonings involving opioid analgesics in the United States 1999-2006, National Centre for Health Statistics (NCHS) Data Brief Number 22, September 2009, Centers for Disease Control and Prevention (USA)
0.6
0.25
0.130.07
0.3
0.10.2
0.30.4
0.57
0.25 0.280.27
0.40.330.3
0.10.2
0.13
0.4
0.5
0.740.79
0.7
0.90.8
0.75
10.96
0.81
0
0.2
0.4
0.6
0.8
1
Spai
n '0
0Sp
ain
'02
Spai
n '0
7
Mol
dova
'00
Mol
dova
'02
Mol
dova
'07
Mol
dova
'08
Slov
akia
'04
Slov
akia
'05
Slov
akia
'06
Slov
akia
'07
Gre
ece
'04
Gre
ece
'07
Nor
way
'97
Nor
way
'05
Nor
way
'08
Cze
ch R
ep '0
4C
zech
Rep
'05
Cze
ch R
ep '0
6C
zech
Rep
'08
Slov
enia
'01
Slov
enia
'04
Italy
'05
Italy
'08
Latv
ia '0
3*La
tvia
'07
Latv
ia '0
7 ne
w
Engl
.&W
ales
'04
Engl
.&W
ales
'05
Engl
.&W
ales
'07
An
nu
al p
reva
len
ce (
%)
0
1,000
2,000
3,000
4,000
5,000
6,000
7,000
8,000
1999 2000 2001 2002 2003 2004 2005 2006
Nu
mb
er o
f d
eath
s
Other opioids MethadoneOther synthetic narcotics Heroin

157
2. Drug statistics and trends Opium/heroin
In South America, the highest prevalence of opioids41 use was reported by Brazil and Chile (0.5% of the pop-ulation between 15 and 64 years, with corresponding numbers of 640,000 and 57,000, respectively). In both cases, prescription opioids constitute the key problem while abuse of heroin is still extremely low. In Chile, the 2008 estimate (0.5%) represents an increase from the 0.3% reported in 2006. For the first time, Costa Rica reported data on prevalence of opioid users showing that in 2006, 2.7% of the population aged 12-70 used opio-ids at least once during the preceding year. However, this estimate needs to be reviewed with caution as it includes use of preparations that include all methylphenidate-type and anorexigenous stimulants prepared with codeine.42 Other countries in the region have low opiate use prevalence rates ranging from 0.1% in Ecuador to 0.3% in the Plurinational State of Bolivia. In South America, most countries report use of synthetic opioids rather than heroin.
Opioid use in Oceania increased
The number of opiate and opioid users in Oceania in 2008 ranged between 120,000 and 150,000 people, an increase from 2007 when 90,000 people were estimated
41 Opioid is the generic term applied to alkaloids from the opium poppy, and their synthetic analogues. The opium alkaloids and their semi-synthetic derivatives include morphine, diacetylmorphine, codeine and oxycodone as well as fentany, methadone, pethidine, and pentazocine, (WHO Lexicon of alcohol and drug terms).
42 Organization of American States, Inter American Drug Abuse Con-trol Commission (CICAD), Multilateral Evaluation Mechanism (MEM) Governmental Expert Group (GEG): Evaluation of Progress in Drug Control 2003-2004.
to have used the substances at least once in the previous year. The higher estimate reflects a sharp increase observed in New Zealand, where the annual prevalence among 16-64 year olds reached 1.1% in 2008 from 0.4% observed in 2006. With the new estimate, New Zealand has a much higher prevalence than Australia. In New Zealand, street morphine and street methadone are the most widely available and used opioids.43 In Aus-tralia, currently there is no indication of heroin use returning to the levels of use seen prior to the 2001 heroin shortage. Nevertheless, heroin-related overdose cases are commonly observed. Non-medical use of opio-ids including methadone, buprenorphine, morphine and oxycodone remain common, however.44
Opiate use is perceived to be increasing in Africa
There are an estimated 680,000 to 2.9 million opiate users in Africa. This wide range reflects missing data and information on opiate use from most parts of the conti-nent. Experts from half of the responding African states perceived increasing opiate use, which likely reflected, in part, the increasing role of African countries as transit areas for heroin from Afghanistan to Europe. Opiates are the second most common drug group in terms of numbers of individuals seeking treatment.45 Mauritius, Kenya and Egypt are the countries in the region with the highest prevalence of opiate use (1.9%, 0.7% and 0.4% respectively.46) Mauritius also has high prevalence of injecting drug use and a concentrated HIV epidemic among these users.47 South Africa is the only country with a drug use surveillance system based on treatment demand (the South African Community Epidemiology Network on Drug Use – SACENDU). During the first half of 2009, in South Africa, treatment admissions for heroin problems have remained stable or declined in some parts of the reporting regions; but data also show far higher levels than a decade ago.48
43 Wilkins C., Griffiths R. and Sweetsur P., Recent Trends in illegal drug use in New Zealand, 2006 – 2008, Findings from the Illicit drug monitoring system (IDMS).
44 Stafford J, Sindiicich N. et al, Australian drug trends 2008. Findings from the Illicit drug reporting system (IDRS).
45 World situation with regard to drug abuse – Report of the Secretariat (E/CN/2010/2) para. 21.
46 The estimates in Mauritius are derived from a Rapid Assessment Study and adjusted for age by UNODC, in Kenya extrapolated from the information form the data from Reference group to the UN on HIV and Injecting Drug Users, 2009 and in Egypt derived from a national household survey.
47 Abdool R., Sulliman R. and Dhannoo M., “The injecting drug use and HIV/AIDS nexus in the Republic of Mauritius,” African Journal of Drug & Alcohol Studies, 5(2), 2006.
48 Pluddemann A., Parry C., Bhana A., et al, Alcohol and Drug Abuse Trends, January – June 2009, Phase 26, South African Community Epidemiology Network on Drug Use (SACENDU) 26 November 2009.
What is known about opiate use in the Pacific Islands?While there is limited information on drug use from the smaller Pacific Islands, the United States Centers for Disease Control and Prevention has conducted surveys among high school students in the Pacific Island US territories. Within the territories, the results from the Marshall Islands are quite astonish-ing. The lifetime prevalence of injecting drugs is reported as 15.8%, while the lifetime prevalence of heroin use is reported as 11.6% among the 9th-12th grade students. These are one of the highest rates of injecting and heroin use among secondary school students in the world and would call for serious pre-vention and other interventions for the Marshall Island students.
Source: Lippe J., Brener N., et al Youth Risk Behaviour Surveillance – Pacific Island United States Territories, 2007 Surveillance Summaries November 21, 2008/55 (SS212):28-56 (Centers for Disease Control and Preven-tion, Atlanta, Georgia, USA)


2.3 Coca/cocaine
161
Production 2.3.1
Cultivation
The global area under coca cultivation decreased by 5% from 167,600 ha in 2008 to 158,800 ha in 2009, mainly due to a significant decrease in Colombia, which was not offset by increases in Peru and the Plurinational State of Bolivia. This is about the same level of cultiva-tion as during the period 2003 to 2006. Colombia remained the country with the largest area under coca cultivation but the distance to the second largest, Peru, has shrunk due to two consecutive years of decreases in Colombia and increases in Peru over the same period.
In Colombia, the area under coca cultivation decreased for a third year to 68,000 ha, a 16% decrease over 2008. Most of the reduction took place in the departments of Putumayo, Nariño and Antioquía.
In 2009, coca cultivation in Peru increased by 7% from 2008 and reached 59,900 ha. Peru remained the second largest coca cultivating country, after Colombia. This is the country’s third consecutive increase in three years. The cultivation level is 55% or 21,200 ha more than in 1999, when coca cultivation was at its lowest level in the last two decades at 38,700 ha. The area under cultiva-tion in the three main growing regions Alto Huallaga, Apurímac-Ene and La Convención-Lares, where large parts are already covered with coca plantations, increased only slightly. Most of the increase in absolute and per-centage terms took place in smaller growing regions such as Aguaytía, Inambari-Tambopata and Palcazú-Pichis-Pachitea, which have seen a considerable expansion of the area under coca cultivation since 2004.
Coca cultivation in the Plurinational State of Bolivia in 2009 remained by and large at the 2008 level with only a slight increase of 1% to 30,900 ha. The increase took place in both large growing regions, the Yungas of La Paz and Chapare.
Eradication reports from Ecuador indicated the exist-ence of small-scale coca cultivation. However, surveys implemented by UNODC in cooperation with the Government of Ecuador in 2006 and 2008 confirmed that the level of coca cultivation was insignificant.1
1 The surveys covered provinces in the north of Ecuador bordering Colombia.
Global coca bush cultivation (ha), Fig. 132: 1995-2009
Source: see Table ‘Global illicit cultivation of coca bush and production of coca leaf and cocaine, 1995-2009’
0
25,000
50,000
75,000
100,000
125,000
150,000
175,000
200,000
225,000
95 96 97 98 99 00 01 02 03 04 05 06 07 08 09
Hec
tare
s
Colombia Peru Bolivia

162
World Drug Report 2010
Global illicit cultivation of coca bush and production of coca leaf and cocaine, 1995-2009Table 19:
* Due to the ongoing review of conversion factors, no point estimate of the level of cocaine production could be provided for 2009. Because of the uncertainty on the level of total potential cocaine production, the 2009 figure was estimated as a range (842-1,111 mt). For more detailed infor-mation, see Statistical Annex (4.1.1). It should be noted that the trend estimate of cocaine production between 2008 and 2009 indicate a stable situation.
a) Potentially harvestable, after eradication.
(b) Sources: 1995-2002: CICAD and US Department of State, International Narcotics Control Strategy Report. For the region Yungas of La Paz since 2002, for all regions since 2003: National Illicit Crop Monitoring System supported by UNODC. Cocaine production: Before 2003, CICAD and US Department of State. Since 2003, own calculations based on UNODC (Yungas of La Paz) and DEA (Chapare) coca leaf yield surveys and DEA conversion factors from leaf to cocaine HCl (currently under review).
(c) Sources: 1995-1998: CICAD and US Department of State, International Narcotics Control Strategy Report; since 1999: National Illicit Crop Monitoring System supported by UNODC.
(d) Sources: 1995-1999: CICAD and US Department of State, International Narcotics Control Strategy Report; since 2000: National Illicit Crop Monitoring System supported by UNODC.
(e) Refers to the potential coca leaf production available for cocaine production, i. e. after deducting the amount, which Governments report as being used for traditional or other purposes allowed under national law. In the absence of a standard definition of "dry coca leaf" and given considerable differences in the processing of the fresh coca leaf harvested, the figures may not always be comparable across countries.
(f ) Since 2005, potential sun-dried coca leaf production available for cocaine production, estimated by the National Illicit Crop Monitoring System supported by UNODC. This figure does not include the estimated amount of coca leaf produced on 12,000 ha in the Yungas of La Paz where coca cultivation is authorized under national law.
(g) Sources: 1995-2002: CICAD and US Department of State, International Narcotics Control Strategy Report. Since 2003, potential coca leaf production available for cocaine production estimated by the National Illicit Crop Monitoring System supported by UNODC. Figures refer to oven-dried coca leaf equivalents.
(h) Since 2004, fresh coca leaf production figures are available based on coca leaf yield studies done by UNODC and the Government of Colombia. Similar to potential cocaine production, fresh coca leaf production in Colombia is calculated based on two-year area averages.
(i) Since 2003, potential sun-dried coca leaf production available for cocaine production, estimated by the National Illicit Crop Monitoring System supported by UNODC. For the calculation of coca leaf available for cocaine production, 9,000 mt of sun-dried coca leaf were deducted, which, according to Government sources, is the amount used for traditional purposes.
(j) Potential manufacture refers to the amount of 100% pure cocaine that could be produced if all coca leaves harvested from an area under coca cultivation in one year were processed into cocaine, based on the information on cocaine alkaloid content of coca leaves and efficiency of clandestine laboratories. Estimates for Bolivia and Peru take into account that not all coca leaf production is destined for cocaine production.
(k) Since 2004, cocaine manufacture is calculated based on the average area under coca cultivation of the reporting year and the previous year. This is thought to be closer to the actual amount produced than a figure solely based on the year-end cultivation. Colombian cocaine manufacture estimates for 2004 and later are based on new research and cannot be directly compared with previous years. For the calculation of the 2009 cocaine manufacture new information on coca leaf yield available for some regions was used. Estimates from 2004 to 2008 were revised in 2010 based on more detailed information on the average cocaine base purity (81%) and the cocaine base to HCl conversion ratio (1:1) available from DEA scientific studies.
(l) Figures from 2003 to 2005 were revised in 2007 based on updated information available on the amount of coca leaf necessary to produce one kilogram of cocaine HCl. Estimates based on conversion factors from leaf to cocaine HCl from DEA scientific studies (currently under review).
1995 1996 1997 1998 1999 2000 2001 2002 2003 2004 2005 2006 2007 2008 2009
Bolivia (b) 48,600 48,100 45,800 38,000 21,800 14,600 19,900 21,600 23,600 27,700 25,400 27,500 28,900
Colombia (c) 50,900 67,200 79,400 101,800 160,100 163,300 144,800 102,000 86,000 80,000 86,000 78,000 99,000
Peru (d) 115,300 94,400 68,800 51,000 38,700 43,400 46,200 46,700 44,200 50,300 48,200 51,400 53,700
Total 214,800 209,700 194,000 190,800 220,600 221,300 210,900 170,300 153,800 158,000 159,600 156,900 181,600 167,600 158,800
Bolivia (f) 85,000 75,100 70,100 52,900 22,800 13,400 20,200 19,800 27,800 38,000 28,200 33,200 36,400
Colombia (g) 80,900 108,900 129,500 165,900 261,000 266,200 236,000 222,100 186,050 164,280 164,280 154,130 154,000
Colombia (fresh coca leaf) (h) 552,800
Peru (i) 183,600 174,700 130,600 95,600 69,200 46,200 49,300 52,500 72,800 101,000 97,000 105,100 107,800
Bolivia (b) 240 215 200 150 70 43 60 60 79 98 80 94 104
Colombia (k) 230 300 350 435 680 695 617 580 550 680 680 660 630 450 410
Peru (l) 460 435 325 240 175 141 150 160 230 270 260 280 290
Total 930 950 875 825 925 879 827 800 859 1,048 1,020 1,034 1,024 865 *
CULTIVATION OF COCA BUSH IN HECTARES (a)
POTENTIAL PRODUCTION OF DRY COCA LEAF IN METRIC TONS (e)
POTENTIAL MANUFACTURE OF COCAINE IN METRIC TONS (j)

163
2. Drug statistics and trends Coca/cocaine
Production
Due to the ongoing review of conversion factors from coca leaves to 100% pure cocaine HCl used to estimate the potential cocaine production in the Plurinational State of Bolivia and Peru, no point estimate of the level of cocaine production could be provided for these coun-tries in 2009. Because of this uncertainty, global cocaine production in 2009 was estimated as a range (842-1,111 mt).2 The uncertainty concerning conversion factors from leaves to cocaine affects the level of cocaine pro-duction in 2009, but other years prior to 2009 may be affected as well. Indeed, production figures provided by UNODC between 2005 and 2009 may be revised once more precise estimates can be elaborated for the conver-sion factors, which depend on the alkaloid content of the leaves and laboratory efficiency. They do not show major changes from one year to another. Thus, in spite of the uncertainty around the level of the 2009 estimates it can be noted that the total production trend between 2008 to 2009 remained stable.
Cocaine HCl production estimates for Colombia were revised, reflecting the availability of more detailed infor-mation on specific elements of the conversion process from the DEA scientific studies. This led to a slight increase in the estimated level of potential cocaine pro-duction since 2004. However, potential cocaine produc-tion in Colombia declined by 9% from 450 mt in 2008 to 410 mt in 2009.3
In the absence of a point estimate for the level of poten-tial cocaine production in 2009, estimates of coca leaf production can provide additional information on recent illicit production trends. To be able to compare coca leaf production across countries, fresh coca leaf production estimates were used where available (Colombia) or cal-
2 For more detailed information, see Annex ‘The process of estimating the production of pure cocaine HCL.’
3 For more details, see Ibid.
culated from sun-dried leaf production (Plurinational State of Bolivia and Peru) using a conversion factor.4
Global potential production of fresh coca leaf was rela-tively stable between 2004 and 2007 at about 850,000 mt, but declined significantly between 2007 and 2008 (by 14%) and again between 2008 and 2009 (by 4%) to just over 700,000 mt. Between 2004 and 2009, Colom-bia always accounted for the largest share of coca leaf production. However, while Colombia contributed almost two thirds (63%) of total production in 2004, in 2009, it accounted for less than half (48%). Peru’s share grew from 27% in 2004 to 39% in 2009, due to a decline in coca leaf production in Colombia in absolute terms and an increase in production in Peru over the same period.
4 The average weight loss from fresh to sun-dried leaf measured in UNODC’s yield studies ranged from 52% (Bolivia, Yungas of La Paz) to 57% (average Peru). Only the amount of coca leaves estimated to be available for cocaine production was included in the estimate. More details see Table ‘Global illicit cultivation of coca bush and production of coca leaf and cocaine, 1995-2009.’
Reported spraying and manual eradication of coca bush (ha), 1995-2009Table 20:
Note: The Plurinational State of Bolivia: Since 2006, voluntary and forced eradication. Peru: includes voluntary and forced eradication. Source: UNODC ARQ, Government reports, US Department of State (INCSR)
Global potential production of fresh Fig. 133: coca leaf available for cocaine production (mt), 2004-2009
Source: National monitoring systems supported by UNODC. For more details see Table ‘Global illicit cultivation of coca bush and production of coca leaf and cocaine, 1995-2009’
1995 1996 1997 1998 1999 2000 2001 2002 2003 2004 2005 2006 2007 2008 2009
Bolivia manual 5,493 7,512 7,000 11,620 15,353 7,653 9,395 11,839 10,089 8,437 6,073 5,070 6,269 5,484 6,341
Colombia manual 1,487 4,057 2,262 3,126 1,046 3,495 1,745 2,762 4,219 6,234 31,980 43,051 66,805 95,634 60,557
spraying 23,915 18,519 41,861 66,029 43,112 58,073 94,153 130,364 132,817 136,552 138,775 172,026 153,134 133,496 104,772
Peru manual 1,259 3,462 7,834 14,733 6,208 6,436 7,134 11,312 10,399 12,237 12,688 12,072 10,143 10,025
Ecuador manual 4 18 9 12 12 6
Venezuela manual 181 18 0 0 0 38 47 0 0 118 40 0 0 0
0100,000200,000300,000400,000500,000600,000700,000800,000900,000
1,000,000
2004 2005 2006 2007 2008 2009
Met
ric
ton
s
Colombia Peru Bolivia

164
World Drug Report 2010
Measuring coca leaf yieldThree elements are needed to estimate cocaine production each year: i) number of hectares under coca leaf cultiva-tion; ii) annual coca leaf yield (quantity of leaves harvested per hectare in a year); and iii) alkaloid content of the leaves and efficiency of clandestine laboratories to extract these alkaloids, which determine the quantity of coca leaves needed to produce pure cocaine hydrochloride (HCl). Coca leaf yield is the element that probably shows the high-est variation since it is affected by unpredictable factors such as weather, plant diseases, as well as eradication activi-ties. The effect of these factors varies not only from year to year and during the course of a year but also from one cultivating region to the other. Thus, the annual coca leaf yield can be estimated with less certainty than the other elements.
Since 2004, UNODC, in cooperation with the respective Governments, undertook coca leaf yield studies in many coca growing regions in the Plurinational State of Bolivia, Colombia and Peru. The core element of these studies is the controlled harvest of mature coca fields. For this purpose, sample plots are selected randomly among a set of fields which are also randomly selected among all fields under coca leaf cultivation. All coca leaves in the sampled plots are harvested and weighed on the spot. In the Plurinational State of Bolivia and Peru, where farmers sun-dry coca leaves after the harvest, an additional weight measurement is taken after the sun-drying. The weight of the harvested coca leaves divided by the area of the sample plots is the yield per hectare of that plot (for one harvest). Yield measurements from all plots and fields are used to determine the per hectare yield in the studied area.
The coca bush allows several harvests per year, with four being a typical number. Depending on seasonal variations, such as periods with higher precipitation or variations in farming practices (application of fertilizer and/or irrigation) or counter-narcotics activities such as spraying with herbicide, the yield varies from harvest to harvest. These varia-tions have to be taken into account. Ideally, all harvests in the selected plots should be measured. However, often the security situation in coca cultivation regions does not allow for a return to sample fields for further measure-ments. Then, information from farmers’ interviews can be used to estimate the number and yield of past harvests. The annual yield is the sum of all coca leaf yields in the course of one year.
Due to the different post-harvest processing methods in the Andean countries, coca leaf yield and production figures can be expressed in fresh, sun-dry or oven-dry leaf. Fresh coca leaf is typically used in Colombia, where the leaves are processed directly after harvesting to extract the alkaloids, often by the farmers themselves. In the Plurinational State of Bolivia and Peru, farmers dry the harvested coca leaves in a process referred to as sun- or air-drying before the alkaloids are extracted. Sun-drying is also used to produce coca leaves for traditional uses such as tea preparation and mastication (chewing). Sun-drying reduces the weight of the fresh leaves by more than 50%. It makes transpor-tation easier and increases the shelf life of the coca leaves. Oven-dry weight is a standard that allows comparing coca leaf yields across countries with different post-harvest processing methods. Coca leaves are dried in an oven to extract moisture until their weight is stable. This method requires a scientific laboratory. After oven-drying, coca leaves have only about one third of their fresh weight.
Total cocaine production can be estimated by determining the cocaine alkaloid content of coca leaves and multiply-ing it with the total coca leaf production estimated from yield and cultivation surveys. As clandestine laboratories are not able to extract 100% of the cocaine alkaloids contained in the leaf, a factor representing the efficiency of these laboratories is applied. Depending on the extraction method used, clandestine laboratories can extract between 40% and 80% of the alkaloids present in the coca leaves.
Sources: United Nations International Drug Control Programme, Guidelines for yield assessment of opium gum and coca leaf from brief field visits New York, 2001; US Government, DEA Studies, 1993-2005.
Clandestine laboratories
In 2008, Governments reported the detection of 9,730 clandestine installations (‘laboratories’) involved in coca processing, compared to 7,245 in 2007. As in past years, about 4% of the total installations detected were pro-ducing cocaine HCl. Over 99% of coca processing labo-ratories were located in the three coca cultivating countries, Plurinational State of Bolivia, Colombia and
Peru. Over the last four years, there was a significant increase in coca processing laboratories reported destroyed in these countries and also worldwide.
In 2008, cocaine laboratories were also reported from other countries in South America, such as Argentina (20), the Bolivarian Republic of Venezuela (10), Chile (4) and Ecuador (3). Outside South America, Spain (25), the Netherlands (4), the Republic of Moldova (1)

165
2. Drug statistics and trends Coca/cocaine
and Greece (1) reported the detection of cocaine labora-tories. Preliminary reports from Governments of coun-tries with coca cultivation indicate that in 2009, the number of clandestine coca processing laboratories detected was almost as high as in 2008, and significantly higher than 2005-2007.
Clandestine coca processing installations, 2005-2008Table 21:
Note: Previous years’ figures were revised based on updated information received from Governments. Source: UNODC ARQ, Government reports
2005 2006 2007 2008
Cocaine paste/base producing installations 5,690 6,849 6,930 9,341
Percentage of coca processing installations detected in coca cultivating countries >99% >99% >99% >99%
Cocaine HCl producing laboratories 212 244 315 389
Cocaine HCl labs as % of total installations 4% 3% 4% 4%
Cocaine HCl labs in coca cultivating countries 166 215 308 322
Total coca processing installations detected 5,902 7,093 7,245 9,730
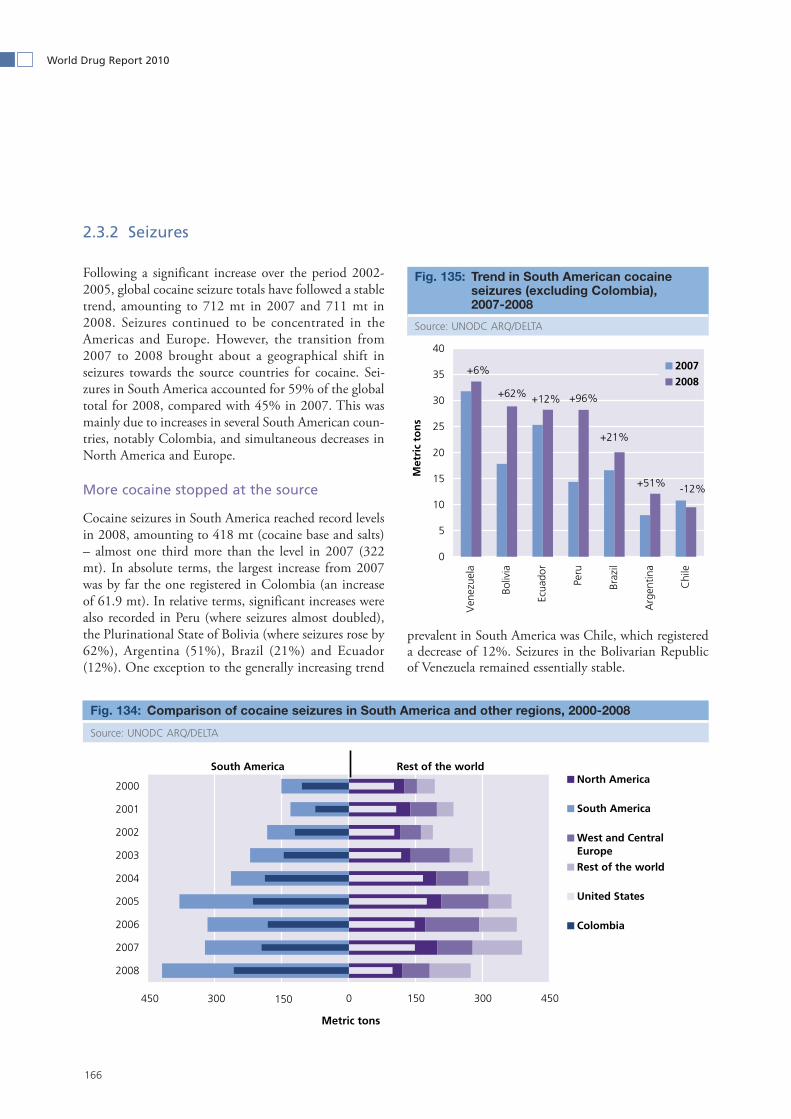
166
World Drug Report 2010
Seizures2.3.2
Following a significant increase over the period 2002-2005, global cocaine seizure totals have followed a stable trend, amounting to 712 mt in 2007 and 711 mt in 2008. Seizures continued to be concentrated in the Americas and Europe. However, the transition from 2007 to 2008 brought about a geographical shift in seizures towards the source countries for cocaine. Sei-zures in South America accounted for 59% of the global total for 2008, compared with 45% in 2007. This was mainly due to increases in several South American coun-tries, notably Colombia, and simultaneous decreases in North America and Europe.
More cocaine stopped at the source
Cocaine seizures in South America reached record levels in 2008, amounting to 418 mt (cocaine base and salts) – almost one third more than the level in 2007 (322 mt). In absolute terms, the largest increase from 2007 was by far the one registered in Colombia (an increase of 61.9 mt). In relative terms, significant increases were also recorded in Peru (where seizures almost doubled), the Plurinational State of Bolivia (where seizures rose by 62%), Argentina (51%), Brazil (21%) and Ecuador (12%). One exception to the generally increasing trend
prevalent in South America was Chile, which registered a decrease of 12%. Seizures in the Bolivarian Republic of Venezuela remained essentially stable.
Comparison of cocaine seizures in South America and other regions, 2000-2008Fig. 134:
Source: UNODC ARQ/DELTA
-450 -300 -150 0 150 300 450
2000
2001
2002
2003
2004
2005
2006
2007
2008
Metric tons
North America
South America
West and CentralEurope
Rest of the world
United States
Colombia
South America Rest of the world
Trend in South American cocaine Fig. 135: seizures (excluding Colombia), 2007-2008
Source: UNODC ARQ/DELTA
0
5
10
15
20
25
30
35
40
Ven
ezue
la
Boliv
ia
Ecua
dor
Peru
Braz
il
Arg
entin
a
Chi
le
Met
ric
ton
s
2007
2008+62% +12%
+6%
+96%
+21%
+51% -12%
150300450

167
2. Drug statistics and trends Coca/cocaine
From 2002 onwards, Colombia and the United States consistently registered the largest and second largest annual cocaine (base and salts) seizures worldwide, respectively. Over the 2002-2007 period, cocaine sei-zures in the United States, the country with the largest consumer market for cocaine, were in line with those in Colombia, the country with the largest manufacture of cocaine, to a remarkable degree (with a correlation coef-ficient of 0.96). However, the trends in the two coun-tries diverged in 2008. Seizures in Colombia reached record levels, rising from 195 mt in 2007 to 257 mt5 in 2008, while seizures in the United States fell sharply, from 148 mt in 2007 to 98 mt in 2008 (-34%).
5 Observatorio de Drogas de Colombia. Data for Colombia from the ARQ (part III) for 2008 were not available.
Mexico continued to be the key transit country for large quantities of cocaine trafficked from the Andean region to the United States. In line with the trend in the United States, cocaine seizures in Mexico fell sharply in 2008, amounting to 19.3 mt. Cocaine seizures by authorities in the United States along the border with Mexico fol-lowed a generally decreasing trend between the last quarter of 2005 and the second quarter of 2008,6 sug-gesting that the amount of cocaine reaching the United States through the border with Mexico was in decline. In fact, between 2006 and 2008, cocaine seizures along this border fell by more than 40%. Partial data suggests that the decreased level was essentially sustained into
6 National Drug Intelligence Center, United States Department of Justice, National Drug Threat Assessment 2009, December 2008.
Cocaine seizures in Colombia and the United States, 2000-2008Fig. 136:
Source: UNODC ARQ/DELTA
0
50
100
150
200
250
300
2000
2001
2002
2003
2004
2005
2006
2007
2008
Ton
s
Colombia United States
20012003
2006
2007
2005
2004
2002
20002008
90
100
110
120
130
140
150
160
170
180
70 120 170 220 270
Co
cain
e se
ized
in U
S (t
on
s)Coc aine s eized in Colombia (tons )
L ine of bes t fit(2000-2007)
Cocaine seizures in Europe, 1998-2008 Fig. 137:
Source: UNODC ARQ/DELTA
0
20
40
60
80
100
120
140
1998 1999 2000 2001 2002 2003 2004 2005 2006 2007 2008
Ton
s
Rest of Europe
Ireland
Germany
Belgium
Italy
United Kingdom
France
Portugal
Netherlands
Spain
-48%

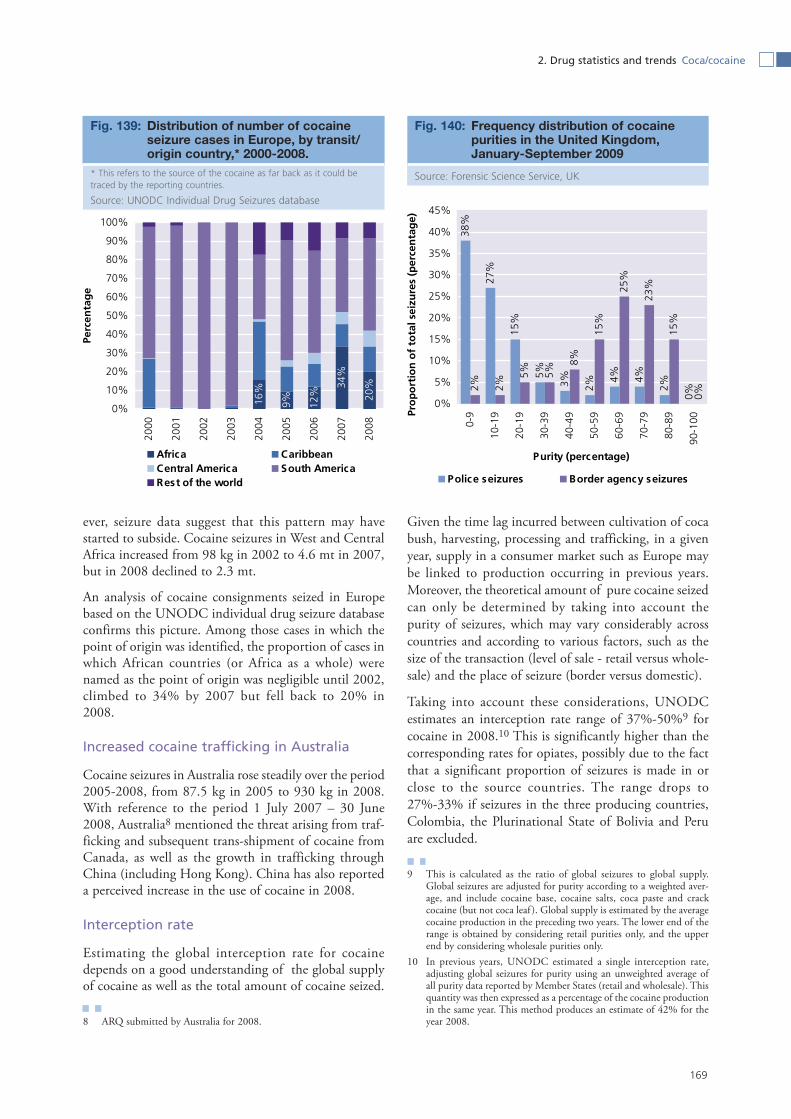
169
2. Drug statistics and trends Coca/cocaine
ever, seizure data suggest that this pattern may have started to subside. Cocaine seizures in West and Central Africa increased from 98 kg in 2002 to 4.6 mt in 2007, but in 2008 declined to 2.3 mt.
An analysis of cocaine consignments seized in Europe based on the UNODC individual drug seizure database confirms this picture. Among those cases in which the point of origin was identified, the proportion of cases in which African countries (or Africa as a whole) were named as the point of origin was negligible until 2002, climbed to 34% by 2007 but fell back to 20% in 2008.
Increased cocaine trafficking in Australia
Cocaine seizures in Australia rose steadily over the period 2005-2008, from 87.5 kg in 2005 to 930 kg in 2008. With reference to the period 1 July 2007 – 30 June 2008, Australia8 mentioned the threat arising from traf-ficking and subsequent trans-shipment of cocaine from Canada, as well as the growth in trafficking through China (including Hong Kong). China has also reported a perceived increase in the use of cocaine in 2008.
Interception rate
Estimating the global interception rate for cocaine depends on a good understanding of the global supply of cocaine as well as the total amount of cocaine seized.
8 ARQ submitted by Australia for 2008.
Given the time lag incurred between cultivation of coca bush, harvesting, processing and trafficking, in a given year, supply in a consumer market such as Europe may be linked to production occurring in previous years. Moreover, the theoretical amount of pure cocaine seized can only be determined by taking into account the purity of seizures, which may vary considerably across countries and according to various factors, such as the size of the transaction (level of sale - retail versus whole-sale) and the place of seizure (border versus domestic).
Taking into account these considerations, UNODC estimates an interception rate range of 37%-50%9 for cocaine in 2008.10 This is significantly higher than the corresponding rates for opiates, possibly due to the fact that a significant proportion of seizures is made in or close to the source countries. The range drops to 27%-33% if seizures in the three producing countries, Colombia, the Plurinational State of Bolivia and Peru are excluded.
9 This is calculated as the ratio of global seizures to global supply. Global seizures are adjusted for purity according to a weighted aver-age, and include cocaine base, cocaine salts, coca paste and crack cocaine (but not coca leaf ). Global supply is estimated by the average cocaine production in the preceding two years. The lower end of the range is obtained by considering retail purities only, and the upper end by considering wholesale purities only.
10 In previous years, UNODC estimated a single interception rate, adjusting global seizures for purity using an unweighted average of all purity data reported by Member States (retail and wholesale). This quantity was then expressed as a percentage of the cocaine production in the same year. This method produces an estimate of 42% for the year 2008.
Distribution of number of cocaine Fig. 139: seizure cases in Europe, by transit/ origin country,* 2000-2008.
* This refers to the source of the cocaine as far back as it could be traced by the reporting countries.
Source: UNODC Individual Drug Seizures database
16%
9% 12%
34%
20%
0%
10%
20%
30%
40%
50%
60%
70%
80%
90%
100%
2000
2001
2002
2003
2004
2005
2006
2007
2008
Perc
enta
ge
Africa CaribbeanCentral America South AmericaRest of the world
38%
27%
15%
5%
3% 2%
4% 4%
2%
0%
2% 2%
5% 5%
8%
15%
25%
23%
15%
0%
0%
5%
10%
15%
20%
25%
30%
35%
40%
45%
0-9
10-1
9
20-1
9
30-3
9
40-4
9
50-5
9
60-6
9
70-7
9
80-8
9
90-1
00
Purity (percentage)
Pro
po
rtio
n o
f to
tal s
eizu
res
(per
cen
tag
e)
Police seizures Border agency seizures
Frequency distribution of cocaine Fig. 140: purities in the United Kingdom, January-September 2009
Source: Forensic Science Service, UK

170
World Drug Report 2010
Prices2.3.3
Cocaine prices in 2008 reflected the well-known traf-ficking routes from South America to North America and Europe. The lowest wholesale prices were to be found in Peru, the Plurinational State of Bolivia and Colombia. Prices were, on average, noticeably higher in the rest of South America and slightly higher in Central America and the Caribbean. There was a clear markup in prices outside Latin America and the Caribbean. Wholesale prices in West Africa were significantly higher, but lower than prices in Europe. The wholesale price in Spain was significantly lower than the average in Europe, possibly reflecting Spain’s role as a major point of entry for cocaine into the European market. Very high whole-sale prices were registered in Saudi Arabia, Pakistan and the Russian Federation. The markup from wholesale to retail price can be more clearly observed when typical prices are adjusted by typical purities.
A comparison of prices in the producer countries and major consumer markets shows a markup of approxi-mately 30 times between prices of coca derivatives in the Plurinational State of Bolivia, Colombia and Peru and cocaine wholesale prices in the United States, and 60 times in the case of Europe.
In the United States, after a sharp increase in prices and decrease in purity, 2009 brought the first signs of stabilization
In the United States, price and purity data confirmed the reduced availability of cocaine. Data from the US Drug Enforcement Agency point to a distinct transition between the fourth quarter of 2007 and the fourth quar-ter of 2008, with purity dropping by 27% and the price per pure gram of cocaine rising by 72%, suggesting a shortage of cocaine in the US market. The increased price level was sustained into the third quarter of 2009,11 when it appeared to stabilize at the higher levels.
11 US Department of Justice, National Drug Threat Assessment 2010. Based on data extracted from System To Retrieve Information on Drug Evidence (STRIDE).
Cocaine wholesale prices worldwide, Fig. 141: 2008
Source: UNODC ARQ
Comparison of coca derivative prices Fig. 142: in producing countries and consumer markets, 2000-2008 (US dollars)
aWeighted average of 18 countries.Sources: National monitoring systems in the Plurinational State of Bolivia, Colombia and Peru and UNODC ARQ
100
1,000
10,000
100,000
2000
2001
2002
2003
2004
2005
2006
2007
2008
US$
/Kg
(lo
gar
ith
mic
sca
le)
Bolivia (P lurinational State of), street price of cocainebase in producing regionsColombia, farm-gate price of coca paste
Peru, farm-gate price of coca paste (PBC)
US wholesale price of cocaine
Western Europe, wholesale priceª
24 2736 39
4960
148156
171
8.16.62.32.31.30
20
40
60
80
100
120
140
160
180
200
Peru
Boliv
ia
Col
ombi
aRe
st o
f So
uth
Am
eric
a1
Cen
tral
Am
eric
a
Gha
na2
USA
2
Togo
Can
ada
Spai
n
Euro
pe1,
3
Russ
ian
Fede
ratio
n
Paki
stan
Saud
i Ara
bia
US$
/g
1 Simple average2 Average of minimum and maximum price3 Excluding Spain and the Russian Federation

171
2. Drug statistics and trends Coca/cocaine
Mixed picture in Europe
Prices per pure gram of cocaine for European countries were generally not available. On average,12 European cocaine prices, expressed in euro and adjusted for infla-tion (but not for purity), displayed a decreasing trend over the period 2006-2008, at both the retail and whole-sale levels. However, over the same period, prices increased when expressed in dollars and adjusted for inflation, suggesting that the trend has been more sensi-tive to the exchange rate between US dollar and euro than changes in the market.
A comparison of purity- and inflation-adjusted prices13 with cocaine seizures in selected European countries suggests a certain sensitivity of prices - notably at the retail level - to success in interdiction, as measured by seizure totals. In 2006, European seizures peaked, along with the purity- and inflation-adjusted retail price in France, Germany and the United Kingdom. This was due to a change in purity in some cases and a change in bulk price in other cases. Since 2006, the purity- and inflation-adjusted retail price declined, in line with sei-zure totals. One possible explanation for the correlation between the trends in price and seizures could be related to the effect of law enforcement activities: the stronger the effect of law enforcement, the higher are the amounts seized and the associated risk of trafficking which take the price to a higher level.14
12 Weighted average of 18 European countries, based on ARQ, data from Europol and UNODC estimates; see UNODC, World Drug Report 2009.
13 UNODC estimates based on reported prices and purities.14 In contrast, over the period 2000-2006, rising seizures in Europe
Purity-adjusted and non-adjusted cocaine retail and wholesale prices in US dollars, 2008 Fig. 143: (log-log scale)
Note: On a linear scale, the slope of the line of best fit (through the origin) for purity-adjusted prices is 2.94. This means that, overall, there is a markup in price of 194% from wholesale to retail level.Source: UNODC ARQ
y = 2.94x
y = x
1
10
100
1,000
1 10 100 1,000
Wholesale price, US dollars per gram (log scale)
Ret
ail p
rice
, US
do
llars
per
gra
m,
(lo
g s
cale
)
Latin America and Caribbean, unadjusted (purity not available)
Other countries, purity adjusted
Other countries, unadjusted,purity available
Other countries, unadjusted, purity not available
Line of best fit (adjusted prices)
Line of nil markup
Cocaine prices and purities in the Fig. 144: United States, 2006-2009 (STRIDE*)
*STRIDE is a database of drug exhibits maintained by the US Drug Enforcement Administration. The values reported here represent aver-ages of all cocaine purchases in the database. Although not collected as a representative sample of the US market, STRIDE data reflect the best information available available on changes in cocaine price and purity in the US market.
Source: National Drug Threat Assessment 2010, United States Department of Justice
$198
$174
$115
46%45%
61%
$0
$50
$100
$150
$200
$250
Jan-
Mar
06
Jul-S
ep 0
6
Jan-
Mar
07
Jul-S
ep 0
7
Jan-
Mar
08
Jul-S
ep 0
8
Jan-
Mar
09
Jul-S
ep 0
9
Mea
n p
rice
per
pu
re g
ram
(U
S d
olla
rs)
0
10
20
30
40
50
60
70
80
Mea
n p
uri
ty (
per
cen
tag
e)
Mean price per pure gram (left axis)
Mean purity (right axis)
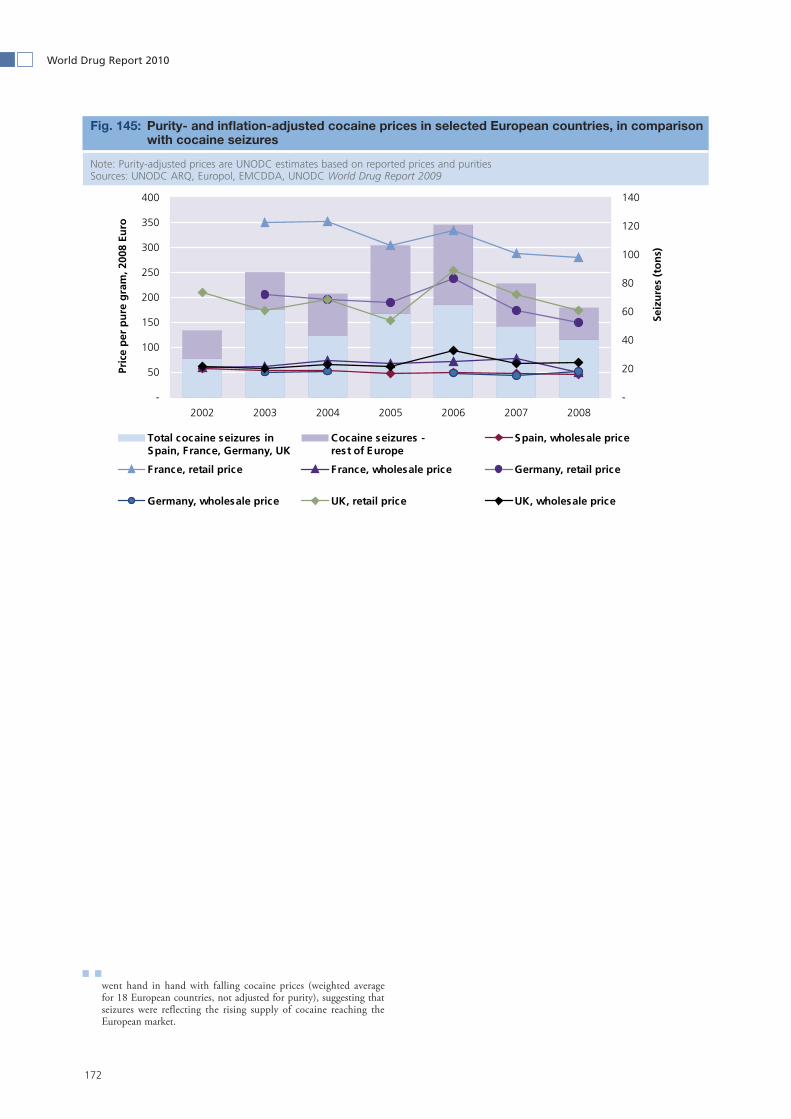
172
World Drug Report 2010
went hand in hand with falling cocaine prices (weighted average for 18 European countries, not adjusted for purity), suggesting that seizures were reflecting the rising supply of cocaine reaching the European market.
-
50
100
150
200
250
300
350
400
2002 2003 2004 2005 2006 2007 2008
Pric
e p
er p
ure
gra
m, 2
008
Euro
-
20
40
60
80
100
120
140
Seiz
ure
s (t
on
s)
Total cocaine seizures inSpain, France, Germany, UK
Cocaine seizures -rest of Europe
Spain, wholesale price
France, retail price France, wholesale price Germany, retail price
Germany, wholesale price UK, retail price UK, wholesale price
Purity- and inflation-adjusted cocaine prices in selected European countries, in comparison Fig. 145: with cocaine seizures
Note: Purity-adjusted prices are UNODC estimates based on reported prices and purities Sources: UNODC ARQ, Europol, EMCDDA, UNODC World Drug Report 2009

2. Drug statistics and trends Coca/cocaine
173
Consumption2.3.4
UNODC estimates that the prevalence of cocaine use worldwide in 2008 ranged from 0.3% to 0.4% of the adult population, or between 15 and 19 million people who had used cocaine at least once in the previous year. Compared to 2007, the range shifted to lower levels, suggesting a decrease in the global number of cocaine users. This change is due to the decrease in the number of cocaine users in North America. In addition, missing data and/or absence of recent reliable estimates affect
many regions, particularly East Africa, Central Asia, the Near and Middle East and South Asia. Available qualita-tive information suggests that the prevalence of cocaine use is low in most parts of Asia, although Chinese experts reported a recent increase of cocaine use in their country (though starting from an almost negligible level)15 and other countries have reported increasing trafficking of cocaine in Asia.
15 ARQ submitted by China for 2008.
Estimated number of people who used cocaine at least once in the past year and Table 22: prevalence among the population aged 15-64, by region, 2008
Region/subregionEstimated
number of users annually (lower)
-Estimated
number of users annually (upper)
Percent of population aged 15-64
(lower)
-
Percent of population aged 15-64
(upper)
Africa 1,020,000 - 2,670,000 0.2 - 0.5
Eastern Africa Subregional estimate cannot be calculated
North Africa 30,000 - 50,000 <0.1 - <0.1
Southern Africa 290,000 - 900,000 0.3 - 0.8
West and Central Africa 640,000 - 830,000 0.4 - 0.5
Americas 8,720,000 - 9,080,000 1.4 - 1.5
Caribbean 110,000 - 320,000 0.4 - 1.2
Central America 120,000 - 140,000 0.5 - 0.6
North America 6,170,000 - 6,170,000 2.0 - 2.0
South America 2,330,000 - 2,450,000 0.9 - 1.0
Asia 430,000 - 2,270,000 <0.1 - 0.1
Central Asia Subregional estimate cannot be calculated
East/ South-East Asia 390,000 - 1,070,000 <0.1 - 0.1
Near and Middle East Subregional estimate cannot be calculated
South Asia Subregional estimate cannot be calculated
Europe 4,570,000 - 4,970,000 0.8 - 0.9
Eastern/South-East Europe 470,000 - 840,000 0.2 - 0.3
Western/Central Europe 4,110,000 - 4,130,000 1.5 - 1.5
Oceania 330,000 - 390,000 1.4 - 1.7
Global 15,070,000 - 19,380,000 0.3 - 0.4
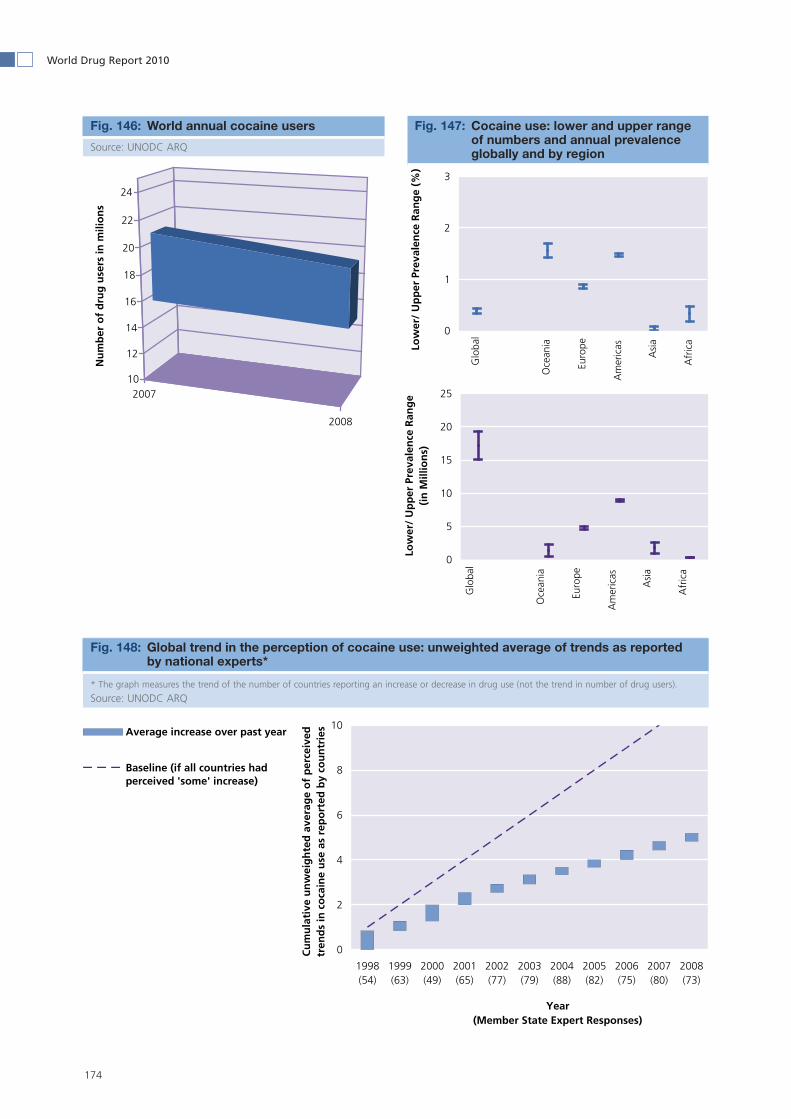
174
World Drug Report 2010
Global trend in the perception of cocaine use: unweighted average of trends as reported Fig. 148: by national experts*
* The graph measures the trend of the number of countries reporting an increase or decrease in drug use (not the trend in number of drug users).
Source: UNODC ARQ
2007
2008
10
12
14
16
18
20
22
24
Nu
mb
er o
f d
rug
use
rs in
mili
on
s
World annual cocaine usersFig. 146:
Source: UNODC ARQ
Cocaine use: lower and upper range Fig. 147: of numbers and annual prevalence globally and by region
0
1
2
3
0 0 0 0 0 0Low
er/
Up
per
Pre
vale
nce
Ran
ge
(%)
0
5
10
15
20
25
0 0 0 0 0 0
Low
er/
Up
per
Pre
vale
nce
Ran
ge
(in
Mill
ion
s)
0
2
4
6
8
10
1998(54)
1999(63)
2000(49)
2001(65)
2002(77)
2003(79)
2004(88)
2005(82)
2006(75)
2007(80)
2008(73)
Year (Member State Expert Responses)
Cu
mu
lati
ve u
nw
eig
hte
d a
vera
ge
of
per
ceiv
ed
tren
ds
in c
oca
ine
use
as
rep
ort
ed b
y co
un
trie
sAverage increase over past year
Baseline (if all countries hadperceived 'some' increase)
Glo
bal
Oce
ania
Euro
pe
Am
eric
as
Asi
a
Afr
ica
Glo
bal
Oce
ania
Euro
pe
Am
eric
as
Asi
a
Afr
ica

175
2. Drug statistics and trends Coca/cocaine
North America, the largest cocaine market, is shrinking
The highest prevalence of cocaine use remains in North America, at 2% of the adult population aged 15 to 64. In the United States, many indicators show a downward trend in cocaine use over the past years, which mirrors a decreasing trend in cocaine production in Colombia, the source country of the cocaine reaching the United States, as well as increased difficulties faced by the Mex-
ican drug cartels to have cocaine shipped from Colom-bia via Mexico into the United States. Data from 2008 confirm the decreasing trend both in the adult and young populations. There has been a significant reduc-tion in the use of cocaine and crack among the popula-tion aged 12 and older. The annual prevalence of cocaine use declined to 2.1% in 2008 from 2.3% in 2007. The perceived easy availability of cocaine among youth aged 12 to 17 also decreased significantly, from 25% in 2007 to 22.1% in 2008.16
16 Substance Abuse and Mental Health Services Administration Results from the 2008 National Survey on Drug Use and Health, National Findings, Office of Applied Studies (OAS), SAMHSA, US Depart-ment of Health and Human Services, September 2009.
United States: Annual prevalence of Fig. 149: cocaine use among the population aged 12 and older
Source: Substance Abuse and Mental Health Services Adminis-tration, Results from the 2008 National Survey on Drug Use and Health, National Findings, Office of Applied Studies (OAS), US Department of Health and Human Services
2.5 2.5 2.4 2.32.5
2.32.1
0.7 0.6 0.5 0.6 0.6 0.60.4
0
0.5
1
1.5
2
2.5
3
2002 2003 2004 2005 2006 2007 2008
An
nau
l pre
vale
nce
(%
)
Cocaine Crack
Annual cocaine users in the AmericasFig. 150:
Source: UNODC ARQ
2007
2008
8
8.2
8.4
8.6
8.8
9
9.2
9.4
9.6
9.8
10
Nu
mb
er o
f d
rug
use
rs in
mili
on
s
United States: annual prevalence of cocaine use among high school students, 1991-2009Fig. 151: Source: National Institute on Drug Abuse, Monitoring the Future, Overview of key findings in 2009, Bethesda, Maryland, USA, 2009
1.11.5
1.72.1
2.63 3.1
2.7 2.6 2.52.3 2.2
22.2
2 21.8
1.6
2.2
2.8
3.5
4.2
4.7 4.74.9
4.4
3.64
3.33.7
3.53.2
3.43
2.7
3.53.1
3.33.6
4
4.9
5.55.7
6.2
54.8
54.8
5.35.1
5.7
5.2
4.4
3.4
2.82.11.9
0
1
2
3
4
5
6
7
1991 1993 1995 1997 1999 2001 2003 2005 2007 2009
An
nu
al p
reva
len
ce o
f co
cain
e u
se (
%)
8th grade 10th grade 12th grade

176
World Drug Report 2010
Similarly, the number of positive tests for recent use of cocaine in the general workforce in the United States dropped by 29% in 2008 (a decline to 0.41% in 2008 from 0.58% in 2007 of all urine drug tests). The down-ward trend in cocaine use also continued in 2009, where it was observed in tests for cocaine use among the gen-eral work force in the first six months of 2009.17 Similar downward trends were seen in the annual prevalence of cocaine use among high school students. The annual prevalence dropped from 2.8% in 2008 to 1.6% in 2009 among the 8th graders, from 3% to 2.7% among 10th graders and from 4.4% to 3.4% among the 12th grade students.18
The prevalence of positive test results for cocaine use among arrestees appears to be stable or declining across many of the US cities where the Arrestees Drug Abuse Monitoring Programme (ADAM II) has been imple-mented. There are statistically significant declines between 2003 and 2008 in two of the 10 monitored cities: Chicago and Portland. Statistically significant declines between 2007 and 2008 were observed in Indi-anapolis and Washington DC. Nonetheless, cocaine remained in 2008 the second most common drug among arrestees. The number of problem cocaine users or those classified with substance dependence and abuse in the household survey declined from 1.5 million in 2002 to 1.4 million in 2008 among the population aged 12 or older, although none of the changes between 2008 and previous years is statistically significant. Point estimates show a more noticeable decline between 2006 (1.7 mil-lion) and 2008 (1.4 million).19
17 Quest Diagnostics, Drug Testing Index, November 2009.18 National Institute on Drug Abuse, Monitoring the Future, Overview
of Key Findings in 2009, Bethesda, Maryland, USA, 2010.19 US Department of Health and Human Services, Substance Abuse
The 2008 Canadian survey also shows a decrease in the annual prevalence of cocaine use, falling from 2.3% of the population aged 15-64 in 2004 to 1.9% in 2008.20 The school survey conducted in Ontario, Canada’s most populous province, accounting for close to 40% of Can-ada’s total population, also indicates a decline in cocaine use among school students. The annual prevalence of cocaine use, from its peak of 4.8% in 2003 has nearly halved to 2.6% in 2009. 44% of the students reported greater risk in trying cocaine and nearly half strongly disapproved of cocaine use. Cocaine was also reportedly less easily available than in 2007 or a decade ago.21
Cocaine use in Mexico increased over the 2002-2008 period. The lifetime prevalence of cocaine use among the population aged 12 to 65 doubled, from 1.2% in 2002 to 2.4% in 2008.22 The increase in the annual prevalence of cocaine use was, however, less pronounced, from 0.35% in 2002 to 0.44% in 2008.
High prevalence rates continue to be reported in West Europe
In Europe, cocaine remains the second most used illicit drug after cannabis. The annual prevalence of cocaine use in Europe ranges between 0.8% and 0.9% of the population aged 15 – 64, or around 4.5-5 million people who had used cocaine in the past year in 2008/2009, a slight upward shift from the range reported in 2007 (4.3
and Mental Health Services Administration, Results from the 2008 National Survey on Drug Use and Health: National Findings, 2009.
20 Health Canada, Canadian Alcohol and Drug Use Monitoring Survey (CADAUMS) 2008.
21 Centre for Addiction and Mental Health, Ontario Student Drug Use and Health Survey, Drug use among Ontario students, 1977 – 2009, 2009.
22 SALUD, Encuesta Nacional de Addicciones 2008, 2009.
Percent testing positive for cocaine Fig. 152: in urine drug tests of the general US workforce (percent of all such tests)
Source: Quest Diagnostics, Drug Testing Index
0.7 0.72
0.58
0.41
0.3
0
0.1
0.2
0.3
0.4
0.5
0.6
0.7
0.8
2005 2006 2007 2008 J an-J un2009
As
% o
f al
l uri
ne
test
s
Annual prevalence of cocaine use Fig. 153: among Ontario students, 1999-2009
Source: Centre for Addiction and Mental Health, Ontario Student Drug Use and Health Survey, Drug use among Ontario students, 1977-2009
3.4
4.44.8
4.4
3.4
2.6
0
1
2
3
4
5
6
1999 2001 2003 2005 2007 2009%
of
coca
ine
use
atl
east
on
ce in
pre
vio
us
year

177
2. Drug statistics and trends Coca/cocaine
- 4.6 million people). An overall increase in cocaine use has been observed in Europe in the last decade. In recent years, the trend has started to stabilize in some countries, while in others it is still increasing.
Higher cocaine use is reported in West and Central Europe (1.5%) than in East and South-East Europe (0.3%). Cocaine use appears to be concentrated in a few countries in Europe, notably in Spain, the United King-dom, Italy, Ireland and Denmark, where high cocaine use prevalence rates are observed. Use of cocaine is reportedly high among young males between 15 – 34 years old.23 Low prevalence countries in the European Union remain Romania, Greece, Hungary, Poland and the Czech Republic.
23 EMCDDA, Drug Situation in Europe, Annual Report 2009.
In Spain and Italy, the annual prevalence rates for cocaine have stabilized at 3% and 2.2% in 2007 and 2008 respectively, after reaching high levels in 2005. A stabi-lization was also reported in 2007 by Germany and several other EU countries. The only major European market showing an increase is the United Kingdom. In England and Wales, cocaine prevalence rates declined in 2007/2008, but increased to 3% of the population aged 16-59 in 2008/2009. The highest prevalence of cocaine use in Europe is found in Scotland (3.7% of the popula-tion aged 16-59 in 2008/2009), even though this rate has remained stable since 2006. The United Kingdom is thus overall Europe’s largest cocaine market in absolute numbers with some 1.2 million users in 2009. Increases
Europe: Increasing trends in annual prevalence of cocaine use among the adult population Fig. 154:
Source: British Crime Survey, Government reports and UNODC ARQ
1.3
2.0
2.5
2.0
2.4
3.0
0.81
1.4
0.1 0.2
0.7
0.30.6
2.62.4
0.0
0.5
1.0
1.5
2.0
2.5
3.0
3.5En
glan
d '9
8
Engl
and
'00
Engl
and
'04
Engl
and
'05
Engl
and
'06
Engl
and
'07
Engl
and
'08
Engl
and
'09
Den
mar
k '0
0
Den
mar
k '0
5
Den
mar
k '0
8
Cze
ch R
ep '0
3
Cze
ch R
ep '0
4
Cze
ch R
ep '0
8
Port
ugal
'01
Port
ugal
'07
An
nu
al p
reva
len
ce (
%)
Europe: Stable or declining trends in annual prevalence of cocaine use among the Fig. 155: population aged 15-64
Source: Government reports and UNODC ARQ
1.41.5
3.7
1.6
2.52.7
3.0
1.11.2
2.2
0.90.6
0.91.0
0.6 0.5 0.60.3
0.6
0.13 0.10.20.17
0
0.5
1
1.5
2
2.5
3
3.5
4
Scot
land
'03
Scot
land
'04
Scot
land
'06
Scot
land
'09
Spai
n 99
Spai
n '0
1Sp
ain
'04
Spai
n '0
5Sp
ain
'07
Italy
'01
Italy
'03
Italy
'05
Italy
'08
Aus
tria
'04
Aus
tria
'08
Ger
man
y '9
6G
erm
any
'00
Ger
man
y '0
3G
erm
any
'06
Slov
akia
'02
Slov
akia
'04
Slov
akia
'06
Esto
nia
'03
Esto
nia
'08
Lith
uani
a '0
3Li
thua
nia
'04
Lith
uani
a '0
8
Rom
ania
'03
Rom
ania
'04
Rom
ania
'07
An
nu
al p
reva
len
ce (
%)

178
World Drug Report 2010
in the annual prevalence rate were also reported in Alba-nia, the Czech Republic and Denmark over the last period. Among the six European countries that reported updated information on cocaine use for 2008, only Lithuania registered a decrease in the adult prevalence, from 0.3% in 2004 to 0.2% in 2008.
In the United Kingdom, cocaine has been a problem drug for some time. Since 2000/2001, there has been a large increase in reported episodes of non-fatal hospital admissions for cocaine poisoning in England. Since 2004, there has also been an upward trend of cocaine-related deaths, which accounted for 14% of all drug-related deaths in 2008.24
The lifetime prevalence of cocaine use among 15-16 year old school students in Europe25 was on average 3%. Cocaine use, however, remains much lower than can-nabis use. In half of the 28 reporting countries, in 2007, the prevalence rate ranged between 1% and 2%. Most of the remaining countries reported prevalence levels between 3% and 4%. France, Italy and the United King-dom reported levels around 5%. Like for most other drugs, lifetime prevalence of cocaine use among males is higher than among females.26
The number of clients entering drug treatment with cocaine as the primary drug has been increasing in Europe for several years. Between 2002 and 2007, the
24 United Kingdom, The Cocaine Trade – Home Affairs Committee, Trends in Cocaine Use, March 2010.
25 European School Survey Project on Alcohol and Other Drugs (ESPAD).
26 Hibell, B., Andersson B., et al. ESPAD: The 2007 ESPAD Report: Substance use among students in 35 European Countries, The Swed-ish Council for Information on Alcohol and other Drugs (CAN), EMCDDA, Council of Europe, Co-operation Group to Combat Drug Abuse and Illicit Trafficking in Drugs (Pompidou Group).
largest proportional increases among new clients were reported by Spain, Ireland and Italy. In those countries the number of all clients entering treatment citing cocaine as their primary drug increased as a proportion from 13% to 19%. The proportion of cocaine clients in treatment is now also increasing in other countries such as Denmark, Ireland, Greece and Portugal.27
Increasing trends of cocaine use in most countries in South America
The annual prevalence of cocaine use in South America is between 0.9% and 1% of the population aged 15-64, thus comparable to cocaine use in Europe, though far lower than in North America. The aggregate annual prevalence of cocaine use in Central America ranges between 0.5% and 0.6%, and in the Caribbean, from 0.4% to 1.2%. In contrast to North America, national experts in South America continue to report an increas-ing trend in cocaine use.
Increases in cocaine use in recent years were reported by the Bolivarian Republic of Venezuela, Ecuador, Brazil, Argentina and Uruguay, as well as countries in Central America (Guatemala and Honduras) and the Caribbean (Jamaica and Haiti). Compared to the previous year, new quantitative information for 2008 was available only from two countries: Chile, where an increase in the annual prevalence among the adult population aged 15-64 was observed (from 1.7% in 2006 to 2.4% in 208) and Suriname, where there was a decrease (from 0.5% in 2002 to 0.3% in 2007).
The highest prevalence of cocaine use in South America
27 EMCDDA, Drug Situation in Europe 2009: Problem cocaine use and treatment demand, 2009.
United Kingdom: Cocaine-related Fig. 156: poisoning episodes and deaths, 2000-2008
Source: United Kingdom, The Cocaine Trade – Home Affairs Committee, Trends in Cocaine Use
833807
641
520
360317
262
54
176 190 196235
0
100
200
300
400
500
600
700
800
900
2000
/01
2000
1/02
2002
/03
2003
/04
2004
/05
2005
/06
2006
/07
2008
Nu
mb
er o
f ep
iso
des
Non fatal admissions Deaths
South America: Prevalence of cocaine Fig. 157: and pasta base use among students aged 13-17, selected countries
Source: UNODC/CICAD, Informe subregional sobre uso de drogas en poblacion escolarizada, 2009/2010
1.41.1
1.9
3.53.2
1.09
2.7
1.32
0.620.84
1.42
2.82
0
0.5
1
1.5
2
2.5
3
3.5
4
E cuador Bolivia Chile
As
% o
f p
op
ula
tio
nCocaine Coca paste

179
2. Drug statistics and trends Coca/cocaine
was reported from Argentina (2.7%), followed by Chile (2.4%) and Uruguay 1.4%). The annual prevalence of cocaine use in Argentina and Chile are comparable to the prevalence in United States. Brazil and Argentina constitute the biggest cocaine markets in South America in terms of absolute numbers (more than 900,000 and 600,000 users, respectively). According to the school survey conducted by UNODC and CICAD in the South American countries, the highest annual preva-lence of cocaine use among students was in Chile, fol-lowed by Uruguay and Argentina.28 The pasta base or the cocaine base is also frequently abused in South America. However, both for the student and adult pop-ulations, the use of cocaine HCl is generally higher than coca paste. In Chile, the Plurinational State of Bolivia and Peru, there were comparable rates of cocaine and pasta base use among the students surveyed.
Experts are reporting rising cocaine use in Africa
For most parts of Africa, there are no recent or reliable estimates of cocaine use. Nevertheless, the annual preva-lence of cocaine use in Africa is estimated at between 0.2% and 0.5% of the population aged 15 to 64. The upper bound of the estimate fell compared to last year when it was 0.7%. The major reason for this drop is the removal of national estimates which were more than 10 years old. However, experts from Africa report that cocaine use has increased in many parts of the continent, notably West and Central Africa. In South Africa, one of the few countries that have data to substantiate the expert perceptions, treatment demand for cocaine-re-lated problems has shown a strong increase over the past
28 UNODC and CICAD Informe subregional sobre uso de drogas en poblacion escolarizada, 2009/2010.
10 years, where it has increased from 5% of treatment demand in 1998 to 8% in the first half of 2009. How-ever, there has been a declining trend in treatment demand for cocaine since 2008.29
For large parts of Asia and the Near and Middle East, there are no recent or reliable estimates available on cocaine use. In Asia, the annual prevalence of cocaine use is estimated at maximum 0.1%, or between 430,000 and 2.3 million cocaine users. Hong Kong, China is the only territory in Asia reporting new information in 2008, revealing an increase in the estimated annual adult prevalence rate from 0.003% in 2003 to 0.3% in 2008.30 In Hong Kong, China, there are indications of increasing availability and decreasing prices of cocaine since 2004.31 In the school survey conducted in Hong Kong, China in 2008/2009, the lifetime prevalence of cocaine and ‘ecstasy’ use among students was 13.8%, compared to 11.3% in 2004/2005.32
29 Pluddemann A., Parry C., Bhana A., et al, Alcohol and Drug Abuse Trends: January – June 2009 (Phase 26), South African Community Epidemiology Network on Drug Use, November 2009.
30 Data extrapolated from the results of a school survey.31 Narcotics Bureau, Hong Kong Police, Drug Situation Report – Hong
Kong Special Administrative Region of the People’s Republic of China, January 2009.
32 Narcotics Division, Security Bureau, The 2008/2009 Survey of Drug Use among Students, 2010.
South America: annual adult (aged Fig. 158: 15-64) prevalence of cocaine use in selected countries, 2006-2007
Source: UNODC/CICAD, Elementos Orientadores para las Politicas Publicas sobre Drogas en la Subregion: Primer Estudio Comparativo sobre Consumo de Drogas y Factores Asociados en Poblacion de 15 a 64 años, 2008
South Africa: Percent of all treatment Fig. 159: admissions for cocaine, 1997-2009
Source: Pluddemann A., Parry C., Bhana A., et al, Alcohol and Drug Abuse Trends: January-June 2009 (Phase 26), South Afri-can Community Epidemiology Network on Drug Use, Novem-ber 2009
2.67
1.68
1.31
0.66
0.4
0.14
0.110.
3
0.62
0.54
0.36
0.09
0
0.5
1
1.5
2
2.5
3
Arg
entin
a
Uru
guay
Chi
le
Boliv
ia
Peru
Ecua
dor
An
nu
al p
reva
len
ce (
%) Cocaine HCl
Coca Base
0
2
4
6
8
10
12
1997
a19
97b
1998
a19
98b
1999
a19
99b
2000
a20
00b
2001
a20
01b
2002
a20
02b
2003
a20
03b
2004
a20
04b
2005
a20
05b
2006
a20
06b
2007
a20
07b
2008
a20
08b
2009
a
In %
of
all t
reat
men
t
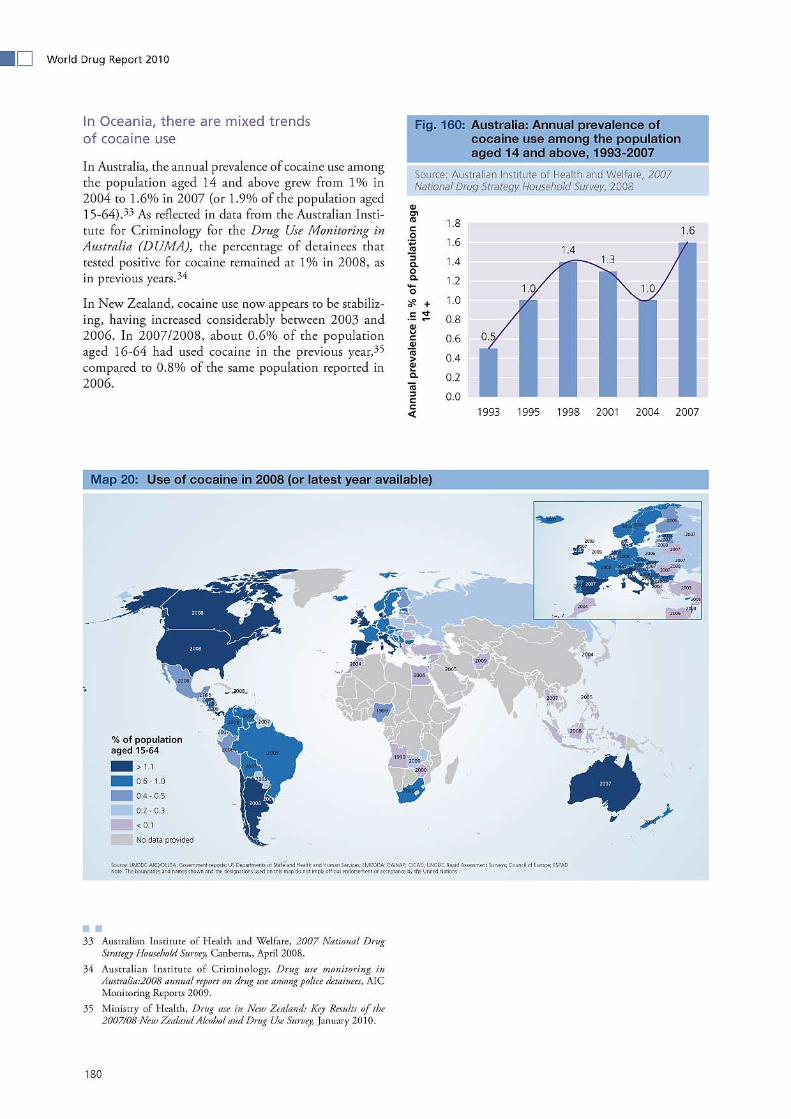


2.4 Cannabis
183
Production2.4.1
In the 2009 World Drug Report, UNODC presented an inventory of the available data on cannabis production and, based on four different methods, estimated that the cannabis herb production ranged from 13,300-66,100 mt and the cannabis resin production from 2,200-9,900 mt. The resulting total area under cannabis cultivation was estimated at 200,000-641,800 ha.1 These estimates provided the magnitude of the problem related to the illicit cannabis cultivation and production, but they also showed a large range, indicating the great uncertainty around the estimates.
In this World Drug Report, the above-mentioned esti-mates were not updated; given the high level of uncer-tainty and the remaining lack of information in many cannabis-cultivating countries, a new round of estima-tions would have offered an arithmetical exercise rather than providing policy-relevant information on the global trend of cannabis production and cultivation. The trend analysis presented here focuses on some new informa-tion obtained by UNODC in the last year, with a special focus on indoor cannabis cultivation.
Cannabis cultivation and production in Afghanistan
In 2009, the major new piece of information on can-nabis production relates to an important producer, Afghanistan, where the first joint cannabis survey was
1 The calculation was based on the minimum and maximum levels calculated from reported cultivation and production, seizures of can-nabis and user prevalence rates.
undertaken by UNODC and the Afghan Ministry of Counter Narcotics. The results of this survey gave a range of cultivated cannabis area from 10,000 to 24,000 ha, and a resin production range between 1,500 and 3,500 mt. In terms of production, Afghanistan would be the major producer of cannabis resin in the world. This is principally due to the high resin yields measured in Afghanistan (145 kg/ha), which are four times higher than in Morocco (36 kg/ha measured in 2005), where cannabis resin is also produced. However, it is not clear whether the products are directly comparable.
There is evidence of cannabis production in almost all countries in the world. The major source of information regarding production continues to be the responses that Member States provide to the Annual Reports Ques-tionnaire (ARQ). Although about 50 countries have reported in the last 10 years on the actual extent of can-nabis cultivation, more countries report seizures of plants and eradication of sites, which give another indi-cation of the presence of cannabis cultivation. Other evidence can also be found through seizure statistics, where countries provide information on where the reported seizure originated.
Due to the fragmentation and incompleteness of infor-mation, it is difficult to do a proper analysis over time and reveal patterns in cannabis cultivation. However, an increase of indoor cultivation has been reported by sev-eral sources and will be analysed more closely.
Indoor cultivation
Several national studies have indicated an increasing trend of indoor cannabis cultivation instead of, or in

184
World Drug Report 2010
addition to, outdoor growing.2 Indoor growing has the benefit of having lower chances of detection,3 high yields with several harvests per year4 with high potency cannabis5 and elevated selling prices. The equipment, knowledge and seeds for indoor growing have become very accessible, for example, from so-called ‘grow shops’
2 European Monitoring Centre for Drugs and Drug Addiction, Monograph series 8, Volume 1, Lisbon, 2008.
3 In Canada, a detection rate of 2-3% is estimated. Bouchard, M., Journal of Quantitative Criminology 23: (3): 221–241, 2007.
4 The controlled conditions often allow for up to six harvests per year.
5 The controlled conditions (often hydroponically grown) normally give higher potency of the product, for example, in the production of sinsemilla. Sinsemilla are the unfertilised buds of the female plants which contain the highest concentration of THC. Controlled condi-tions include the use of optimal varieties and plants, optimal dosage and timing of providing water, nutrients and light.
or from the internet. The costs of building an indoor growing site can be quickly recovered, which makes indoor cultivation a very lucrative business.
Based on government reports and scientific literature, UNODC could find evidence of indoor cultivation for commercial purposes in 29 countries, concentrated in the temperate zones of the world: North America, West, North and Central Europe and Oceania. There was only one report of indoor growing in South America (Argen-tina) and one in Africa (South Africa). Given the lack of a system to monitor indoor cannabis cultivation world-wide, these 29 countries represent the minimum set of indoor cannabis cultivating countries.
With the available data, it is not possible to calculate the extent of indoor growing. Often indirect indicators are used to estimate the trend, such as the number of seized
Update of available information on the extent of cannabis cultivation and production in Table 23: major producing countries, 2008*
CountryCultivated area
(ha) a) EradicationHarvestable
area (ha)Production (mt)
Resin Herb
Afghanistanb) 10,000 – 24,000 (2009)
10,000 – 24,000 (2009)
1,500 – 3,500 (2009)
Boliviac) 1,831
Canadad) 1,399-3,498 (2007)
Colombiae) 5,000 (2006) 4,000 (2006)
Mexico 18,562 hag) 12,000f ) 21,500f )
Moroccog) 64,377 4,377 60,000 877
Netherlandsh) 1,053,368 plants 323-766
Paraguay 6,000i) 1,838 haj) 16,500k)
South Africal) 1,300 1,275 ha 25
United States of America
7.6 million out-door plants / 451
000 indoor plantsm)
3,149-7,349
* Or other year, if mentioned.
a) In addition, there is some extraction from wild-grown cannabis, for example, areas of 124,000-329,627 ha were estimated in Kazakhstan (1999 UNDCP, Annual Survey reports Cannabis, Opium Poppy and Ephedra (Vienna, 1998 and 1999). In the Russian Federation, wild cannabis is estimated to be cultivated on 1 million ha (US Department of State, International Narcotics Control Strategy Report (INCSR) 2010).
b) UNODC, Afghanistan cannabis survey 2009, Vienna, 2010.
c) Government of the Plurinational State of Bolivia, quoted in INCSR, 2010
d) Governments of the United States of America and Canada, Drug Threat Assessment 2007, March 2008.
e) UNODC, Bulletin on Narcotics, “Review of the world cannabis situation”, Volume LVIII, Vienna, 2006.
f) US Department of State, INCSR, 2010
g) UNODC, ARQ 2008.
h) KLPD-IPOL, Drug seizures and drug prices in the Netherlands, Zoetermeer, The Netherlands, 2008.
i) Secretaria nacional Antidrogas (SENAD), (Asunción, 2008).
j) UNODC ARQ 2008.
k) Secretaria nacional Antidrogas (SENAD), (Asunción, 2008).
l) UNODC, ARQ 2008.
m) DEA, Domestic Cannabis Eradication/Suppression Program (DCE/SP) in National Drug Threat Assessment 2010.

185
2. Drug statistics and trends Cannabis
plants or the number of seizures of plantations. Since the way of reporting is not consistent between countries, and often not even within one country, it is challenging to compare the production levels.6
For some countries, for example, Australia, New Zea-land, the United Kingdom and the Netherlands, indoor growth is known to be the main method of cannabis production. From the Netherlands, indoor cultivation has spread to surrounding countries, for example to
6 Moreover, there is no protocol for the reporting, which makes the numbers hard to compare within countries. The number of plants often do not differentiate for the type of plant, for example, whether the numbers are full grown plants or include seedlings and cuttings. Research in the Netherlands indicate that this can give large diver-gence in the reports (see: Wouters, Korf and Kroeske, Harde aanpak, hete zomer, WODC, Amsterdam, 2007).
Belgium, where there is an increase of seized indoor plants, to East Europe (the Czech Republic, Poland, Hungary and Slovakia) and Austria, and to northern Europe (Iceland, Finland, Denmark, Norway, Sweden and Latvia). The increases in cultivation are often attrib-uted to Vietnamese organized crime groups.7 In Canada also, Vietnamese/Chinese groups - as well as Hell’s Angels - are involved in cannabis cultivation, including high-tech indoor cannabis growing. The Canadian pro-duction is for national consumption, but some is also exported to the United States. In the United States, indoor growing has become significant, but seizures of outdoor-grown plants still exceed the indoor-grown plants.
7 UNODC ARQ 2008; INCSR 2010; Europol, EU Organised crime threat assessment, 2009.
Cannabis resin processing in AfghanistanIn 2009, a first cannabis survey was carried out by UNODC and the Afghan Ministry of Counter Narcotics to estimate the extent of cannabis cultivation and production in Afghanistan. The survey covered 20 provinces where cannabis cultivation had been reported. Information was collected from satellite images and interviews with village headmen and farmers in 1,634 villages.
The complex area of cannabis resin yield was investigated with focus group interviews in more than 45 villages. The yield study included observation of the actual production of resin, which is a process of threshing and sieving the dried cannabis plants to produce a powdery substance locally called ‘garda’. Garda consists of cannabis resin as well as other plant material. Based on the quantity and quality of the resin, garda is categorized as first, second, third (and sometimes even fourth) grade.
At least two farmers are involved in the production of garda. First, they beat the dried cannabis plants on a barrel to separate the buds from the main branches. Then, the dried buds, leaves and seeds are separated, after which the farmers sift the product through a wooden sieve kept in an inclined position. After sieving, they put the product in a bag made of cloth, which is shaken for about five minutes. Most of the dust is filtered out during this process. The sieving takes place three times. The remaining powder is split and put into smaller bags. A small quantity of powder is put in a cloth pouch and beaten by hand to remove the remaining dust. This product is called first garda.
Regional differences exist in the processing techniques which give different products and quality levels varying with the amount of resin and plant rests. Generally, the north, north-east and west of the country produce higher quality garda but in smaller amounts, whereas the south and east have a larger production of the first garda but with lower quality.
Most farmers sell the garda in its powdery form, but it needs another transformation to produce consumable hash-ish, which is usually done by traders.
Potential cannabis resin garda production, 2009Table 24:
1st garda (mt) 2nd garda (mt)
3rd garda (mt) 4th garda (mt) Rounded total (mt)
Lower limit 693 471 287 19 1,500
Upper limit 1,648 1,120 683 45 3,500
As % of total garda 47% 32% 20% 1% 100%
Source: UNODC/Afghan Ministry of Counter Narcotics, Afghanistan cannabis survey 2009


188
World Drug Report 2010
Seizures2.4.2
Trafficking of cannabis derivatives continues to affect most countries worldwide. Of the 147 countries and territories for which UNODC collated records of drug seizures in 2008, 137 had seized at least one of the can-nabis derivatives: 129 had made seizures of cannabis herb, 92 of cannabis resin, and 26 of cannabis oil. Based on 2003-2008 data, approximately one half of seizure cases related to all illicit drugs worldwide involved can-nabis herb, resin or oil. Cannabis herb was the most frequently seized drug8 in Africa, the Americas and Oce-ania, while cannabis resin was the most frequently seized drug in Europe, followed by cannabis herb.
Cannabis herb
Global cannabis herb seizures rose gradually but steadily over the period 2005-2008, reaching 6,587 mt in 2008, slightly exceeding the peak level attained in 2004 (6,539 mt). The Americas continued to be the region with the highest share of global seizures, followed by Africa. Sig-nificant increases were registered in South America, Africa, Asia and Europe.
8 Frequency measured in terms of number of incidents/seizure cases.
From 2001 onwards, the largest and second largest national annual cannabis herb seizures worldwide were reported by Mexico and the United States, respectively. In Mexico, following two consecutive year-on-year increases, cannabis herb seizures fell by almost one quar-ter, amounting to 1,658 mt in 2008, the lowest level since 2002. In the United States, seizures of cannabis herb remained at the high level (1,447 mt) reached in 2007, at 1,472 mt in 2008. The drop in cannabis herb seizures in Mexico was offset by a significant increase in South America, mainly owing to the contribution of the Plurinational State of Bolivia. Seizures, as reported by the Bolivian Government, more than doubled in 2008, and increased by a further 74% in 2009, continuing a rapidly increasing trend which can be traced back to 1999. Over the period 2003-2009 in particular, canna-bis herb seizures in the Plurinational State of Bolivia rose steadily, from 8.5 mt in 2003 to 1,937 mt in 2009. This represented a 228-fold increase over a period of six years, equivalent to six consecutive year-on-year increases of 147%. The level in 2008 was the third highest reported by a single country worldwide, and the level in 2009 was
0
1,000
2,000
3,000
4,000
5,000
6,000
7,000
1999 2000 2001 2002 2003 2004 2005 2006 2007 2008
North America South America
Africa Rest of the world
Mexico United States
Breakdown of global cannabis herb Fig. 164: seizures (mt), 1999-2008
Source: UNODC ARQ/DELTA
Cannabis herb seizures in the Plurina-Fig. 165: tional State of Bolivia, Mexico and the United States, 1994-2009 (kg, logarithmic scale)
Sources: UNODC ARQ, Bolivia (Plurinational State of), United States (annual reports), Mexico (Government), UNODC field offices, INTERPOL
1
10
100
1,000
10,000
100,000
1,000,000
10,000,000
1994 1996 1998 2000 2002 2004 2006 2008
Bolivia (P lurinational State of)
Mexico
United States
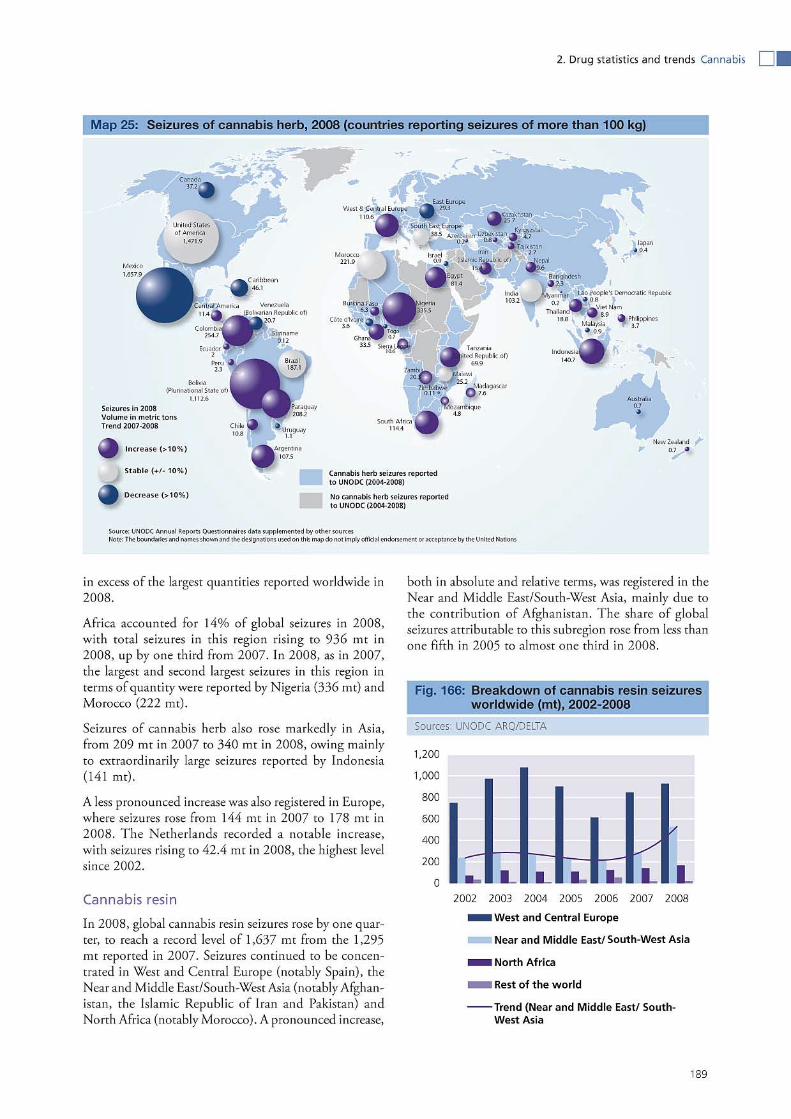

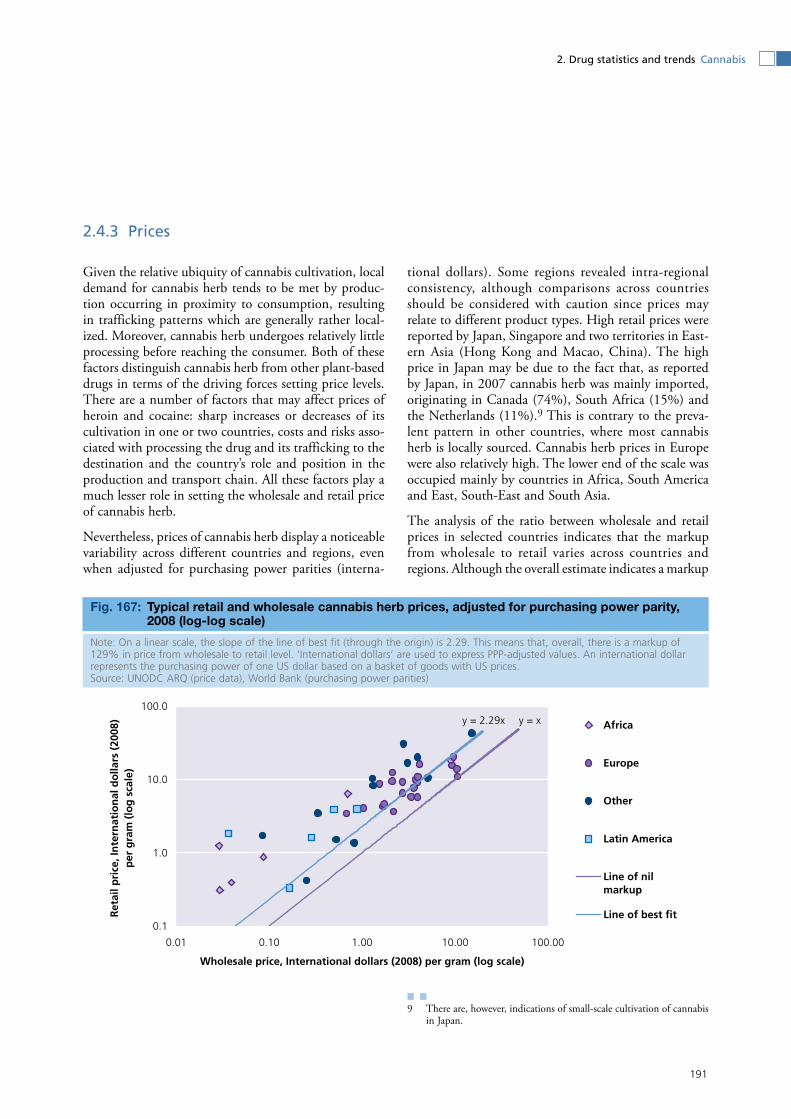
2. Drug statistics and trends Cannabis
191
Prices2.4.3
Given the relative ubiquity of cannabis cultivation, local demand for cannabis herb tends to be met by produc-tion occurring in proximity to consumption, resulting in trafficking patterns which are generally rather local-ized. Moreover, cannabis herb undergoes relatively little processing before reaching the consumer. Both of these factors distinguish cannabis herb from other plant-based drugs in terms of the driving forces setting price levels. There are a number of factors that may affect prices of heroin and cocaine: sharp increases or decreases of its cultivation in one or two countries, costs and risks asso-ciated with processing the drug and its trafficking to the destination and the country’s role and position in the production and transport chain. All these factors play a much lesser role in setting the wholesale and retail price of cannabis herb.
Nevertheless, prices of cannabis herb display a noticeable variability across different countries and regions, even when adjusted for purchasing power parities (interna-
tional dollars). Some regions revealed intra-regional consistency, although comparisons across countries should be considered with caution since prices may relate to different product types. High retail prices were reported by Japan, Singapore and two territories in East-ern Asia (Hong Kong and Macao, China). The high price in Japan may be due to the fact that, as reported by Japan, in 2007 cannabis herb was mainly imported, originating in Canada (74%), South Africa (15%) and the Netherlands (11%).9 This is contrary to the preva-lent pattern in other countries, where most cannabis herb is locally sourced. Cannabis herb prices in Europe were also relatively high. The lower end of the scale was occupied mainly by countries in Africa, South America and East, South-East and South Asia.
The analysis of the ratio between wholesale and retail prices in selected countries indicates that the markup from wholesale to retail varies across countries and regions. Although the overall estimate indicates a markup
9 There are, however, indications of small-scale cultivation of cannabis in Japan.
Typical retail and wholesale cannabis herb prices, adjusted for purchasing power parity, Fig. 167: 2008 (log-log scale)
Note: On a linear scale, the slope of the line of best fit (through the origin) is 2.29. This means that, overall, there is a markup of 129% in price from wholesale to retail level. ‘International dollars’ are used to express PPP-adjusted values. An international dollar represents the purchasing power of one US dollar based on a basket of goods with US prices. Source: UNODC ARQ (price data), World Bank (purchasing power parities)
y = xy = 2.29x
0.1
1.0
10.0
100.0
0.01 0.10 1.00 10.00 100.00
Wholesale price, International dollars (2008) per gram (log scale)
Ret
ail p
rice
, In
tern
atio
nal
do
llars
(20
08)
per
gra
m (
log
sca
le)
Africa
Europe
Other
Latin America
Line of nilmarkup
Line of best fit

192
World Drug Report 2010
of 129%, the markup tends to be higher in Africa than in Europe. One possible reason for this could be that production of cannabis herb occurs on a larger scale in Africa, resulting in a more pronounced disparity between wholesale and retail prices.
In contrast with cannabis herb, both retail and wholesale prices of cannabis resin are more dispersed when
expressed in purchasing power parities.10 This may sug-gest that factors other than the purchasing power of local consumers and traffickers are more important in driving prices. Indeed, cannabis resin is produced in a handful of countries and prices are affected by the inter-regional nature of trafficking routes.
Very low cannabis resin prices were reported in 2008 by
10 For this reason, the prices in the figure are expressed in US$.
High cannabis herb prices, adjusted Fig. 168: for purchasing power parities, 2008
Source: UNODC (ARQ price data), World Bank (purchasing power parities) Note: ‘International dollars’ are used to express PPP-adjusted values. An international dollar represents the purchasing power of one US dollar based on a basket of goods with US prices.
0
5
10
15
20
25
30
35
40
45
Japa
n
Sin
gapo
re
Lith
uani
a
Mac
ao C
hina
Mau
ritiu
s
Hon
g K
ong,
Chi
na
Hun
gary
Fin
land
Cze
ch R
ep.
Mon
tene
gro
Pol
and
Inte
rnat
ion
al D
olla
rs (
2008
)p
er g
ram
Retail
Wholesale
Low cannabis herb prices, adjusted Fig. 169: for purchasing power parities, 2008
Source: UNODC (ARQ price data), World Bank (purchasing power parities) Note: ‘International dollars’ are used to express PPP-adjusted values. An international dollar represents the purchasing power of one US dollar based on a basket of goods with US prices.
0.0
0.2
0.4
0.6
0.8
1.0
1.2
1.4
1.6
1.8
2.0
Para
guay
Phili
ppin
es
Boliv
ia
Isra
el
Indo
nesi
a
Burk
ina
Faso
Swaz
iland
Sri L
anka
Tanz
ania
, U.R
.
Gua
tem
ala
Togo
Inte
rnat
ion
al D
olla
rs (
2008
) p
er g
ram Retail
Wholesale
Typical retail and wholesale cannabis resin prices per gram in US dollars, 2008Fig. 170:
Note: The slope of the line of best fit (through the origin) is 2.10. This means that, overall, there is a markup of 110% in price from wholesale to retail level. Source: UNODC ARQ
y = x
y = 2.10x
0
5
10
15
20
25
30
0 2 4 6 8 10 12
Wholesale price (US dollars per gram)
Ret
ail P
rice
(U
S D
olla
r p
er g
ram
) As ia
Western Europe
Rest of Europe
Other
Line of nilmarkup
Line of best fit

193
2. Drug statistics and trends Cannabis
Pakistan and the Islamic Republic of Iran, reflecting their proximity to the major producing country Afghan-istan, as well as Paraguay, another country with signifi-cant production of cannabis. Countries in West Europe also reported relatively low prices, notably Spain, the main point of entry for cannabis resin into continental Europe from Morocco. High cannabis resin prices were reported by the Russian Federation and neighbouring Belarus.
High cannabis resin prices, 2008Fig. 171:
Source: UNODC ARQ/DELTA
Low cannabis resin prices, 2008Fig. 172:
Source: UNODC ARQ/DELTA
0
5
10
15
20
25
30
Russ
ian
Fede
ratio
n
Bela
rus
Can
ada
Finl
and
Slov
enia
Bulg
aria
Gre
ece
Cze
chRe
publ
ic
Mal
ta
Italy
Saud
iA
rabi
a
US
do
llars
per
gra
m
Retail
Wholesale
0
1
2
3
4
5
6
7
8
9
10
Ger
man
y
Mol
dova
, Rep
ublic
of
Fran
ce
Spai
n
Uni
ted
Kin
gdom
Isra
el
Eritr
ea
Serb
ia
Para
guay
Iran
(Isla
mic
Rep
ublic
of)
Paki
stan
US
do
llars
per
gra
m
Retail
Wholesale

194
World Drug Report 2010
Consumption2.4.4
Cannabis remains the most widely used illicit substance in the world. Globally, the number of people who had used cannabis at least once in 2008 is estimated between 129 and 191 million, or 2.9% to 4.3% of the world population aged 15 to 64. Compared to last year, the lower bound of the estimate decreased and the range widened due to the increased uncertainty of having dropped some countries’ estimates which were more than ten years old. National experts in many parts of the world perceive cannabis use to be either stabilizing or increasing, although about 15 countries reported a decrease in 2007 and 2008. In Africa, where quantita-tive information on illicit drugs use is scarce, the major-ity of national experts perceive an increase in the use of cannabis.
In North America, cannabis use has been declining or stabilizing over the past years
In North America, there are an estimated 29.5 million people who had used cannabis at least once in 2008, a decrease from the 31.2 million estimated in 2007. This decrease reflects the availability of new data for Canada, which in 2008 showed a considerably lower number of cannabis users compared to their previous 2004 survey estimates. Cannabis use in the United States and Canada has been declining or stabilizing over the past years, although a slight increase was observed in the United States in 2008 (from 12.3% of the population aged 15-64 in 2007 to 12.5% in 2008). In the United States, between 2002-2007, there was a significant decrease in
Estimated number of people who used cannabis at least once in the past year and Table 25: prevalence among population aged 15-64, by region, 2008
Region/subregionEstimated
number of users annually (lower)
-Estimated
number of users annually (upper)
Percent of population aged 15-64
(lower)
-
Percent of population aged 15-64
(upper)
Africa 27,680,000 - 52,790,000 5.0 - 9.6Eastern Africa 4,500,000 - 9,190,000 3.4 - 7.0North Africa 4,680,000 - 10,390,000 3.6 - 8.0Southern Africa 4,450,000 - 11,170,000 4.0 - 10.1West and Central Africa 14,050,000 - 22,040,000 7.8 - 12.3
Americas 38,210,000 - 40,030,000 6.3 - 6.6Caribbean 430,000 - 1,960,000 1.6 - 7.4Central America 540,000 - 600,000 2.2 - 2.5North America 29,950,000 - 29,950,000 9.9 - 9.9South America 7,300,000 - 7,530,000 2.9 - 3.0
Asia 31,510,000 - 64,580,000 1.2 - 2.4Central Asia 1,860,000 - 2,140,000 3.7 - 4.3East/South-East Asia 5,370,000 - 23,940,000 0.4 - 1.6Near and Middle East 7,790,000 - 10,950,000 3.1 - 4.4South Asia 16,490,000 - 27,550,000 1.9 - 3.1
Europe 29,370,000 - 29,990,000 5.3 - 5.4East/South-East Europe 8,520,000 - 9,010,000 3.0 - 3.2Western/Central Europe 20,850,000 - 20,990,000 7.7 - 7.8
Oceania 2,140,000 - 3,410,000 9.3 - 14.8
Global 128,910,000 - 190,750,000 2.9 - 4.3

195
2. Drug statistics and trends Cannabis
the annual prevalence of cannabis use within the popu-lation aged 12 and older, from 11% to 10.1%. In 2008, the annual prevalence of cannabis use increased for the first time after 2002, reaching the level observed in 2006 (10.3% of the population aged 12 and older).11 A simi-lar trend has been observed among secondary school students.
11 Substance Abuse and Mental Health Services Administration Results from the 2008 National Survey on Drug Use and Health, National Findings, Office of Applied Studies (OAS), SAMHSA, US Depart-ment of Health and Human Services, September 2009.
World annual cannabis usersFig. 173:
Source: UNODC ARQ/DELTA
Cannabis: lower and upper range of Fig. 175: numbers and annual prevalence, globally and by region
2007
2008
120
130
140
150
160
170
180
190
200
Nu
mb
er o
f d
rug
use
rs in
mili
on
s
0
50
100
150
200
250
Glo
bal
Asi
a
Euro
pe
Am
eric
as
Afr
ica
Oce
aniaLo
wer
/ U
pp
er P
reva
len
ce R
ang
e (
in M
illio
ns)
0
5
10
15
20
25
Glo
bal
Oce
ania
Euro
pe
Am
eric
as
Asi
a
Afr
ica
Low
er/
Up
per
Pre
vale
nce
Ran
ge
(%)
Global trend in the perception of cannabis use: unweighted average of trends as reported Fig. 174: by national experts*
* The graph measures the trend from countries reporting an increase or decrease in drug use (it does not measure the trend in number of drug users).Source: UNODC ARQ
0
2
4
6
8
10
1998(67)
2000(55)
2002(97)
2004(107)
2006(99)
2008(90)
Year (Member State Expert Responses)
Cu
mu
lati
ve u
nw
eig
hte
d a
vera
ge
of
per
ceiv
ed t
ren
ds
in c
ann
abis
use
as
rep
ort
ed b
y co
un
trie
s
Average increaseover past year
Baseline (if allcountries hadperceived 'some'increase)

196
World Drug Report 2010
Despite the large decline from 2002, cannabis remains the most commonly used illicit drug among US drug users. In 2008, cannabis was used by 75.7% of current illicit drug users and was the only drug used by 57.3% of them.12
The annual prevalence among the population aged 15 and older in Canada has also decreased significantly, from 14.1% in 2004 to 11.4% in 2008.13 In 2008, the 32.7% prevalence of cannabis use among youth aged 15 to 24 was more than four times higher than the preva-lence of 7.3% for adults 25 and older. Compared with the national average of 11.4%, the prevalence of past-year use of cannabis was fairly consistent across the provinces in Canada.14
In 2008, Mexico conducted a national representative household survey for urban and rural populations aged 12 to 65. Compared with results of the last survey in 2002, the annual prevalence of cannabis use among the general population had increased from 0.6% to 1%.15 Despite the recent increase, and Mexico’s role as an important cannabis supplier to the US market, house-hold survey results continue to show considerably lower prevalence rate for Mexico than for Canada or the United States.
12 Ibid.13 Health Canada, Canadian Centre on Substance Abuse, Canadian
Alcohol and Drug Use Monitoring Survey, summary of results for 2008.14 Ibid.15 Mexico, Secretaria de Salud Mexico, Instituto Nacional de Salud
Publica, Encuesta Nacional de Adicciones 2008, Cuernavaca, Morelos 2009.
Increase in cannabis use has been reported in South America
In contrast to North America, a perceived increase in cannabis use has been reported from almost all national experts in South America, although the annual preva-lence of cannabis use in South America remains consid-erably lower than in North America. Around 3%, or an estimated 7.3 -7.5 million people among the population aged 15 to 64, had used cannabis at least once in the past year in 2008, which is a decrease from the 8.5 million estimated for 2007. This drop does not reflect a real change in cannabis use in the region between 2007 and 2008, but rather a revision of 2005 data reported for the Bolivarian Republic of Venezuela, where the prevalence estimates were revised from 7.5% to 0.9 %. The highest prevalence of cannabis use is found in Argentina (7.2%), Chile (6.7%) and Uruguay (6%). However, compared to the general population, the highest cannabis use prev-alence among school students was reported among those in Chile (15.6%), Uruguay (14.8%) and Colombia (8.4 %).16
The comparative study on drug use and associated fac-tors conducted by CICAD and UNODC in six Latin American countries showed that among the recent can-nabis users (used in the past year) who were interviewed in the study, between 20.4% of cannabis users in Argen-tina to almost half of the recent users in Ecuador were diagnosed as dependent users,17 based on the clinical criteria of International Classification of Diseases (WHO – ICD revision 10).18
16 UNODC and CICAD, Informe Subregional sobre Uso de Drogas en Poblacion Escolarizada, 2009/2010.
17 UNODC and CICAD, First comparative Study on Drug Use and Associated Factors in the General Population aged 15-64, April 2008.
18 See: www.who.int/classifications/icd/en.
Annual prevalence of cannabis use Fig. 176: among US high school students, 2000-2009
Source: Data from the Monitoring the Future study, 2009, National Institute of Drug Abuse, USA
0
5
10
15
20
25
30
35
40
2000
2001
2002
2003
2004
2005
2006
2007
2008
2009An
nau
l pre
vale
nce
of
can
nab
is u
se
Grade 12 Grade 10 Grade 8
Proportion of recent cannabis users Fig. 177: diagnosed as ‘dependent’ in some Latin American countries
Source: UNODC and CICAD, First comparative Study on Drug Use and Associated Factors in the General Population aged 15-64
20.4 20.7
27.5
35.7
51.2
0
10
20
30
40
50
60
Uruguay Chile Argentina P eru E cuador%
am
on
g t
he
rece
nt
use
s

197
2. Drug statistics and trends Cannabis
Most of the countries in the Caribbean also have higher than world average prevalence of cannabis use, with rates such as 11.7% in Saint Kitts and Nevis and 10.8% in Dominica and Grenada. Haiti (1.4%) and the Dominican Republic (0.3%) are the two countries with low prevalence of cannabis use. Trends in cannabis use in the Caribbean are mixed. An increasing trend in
prevalence of cannabis use among the general popula-tion is registered in the Bahamas (from 4.7% in 2003 to 5.5% in 2008), Grenada (from 6.7% in 2003 to 10.8% in 2005), Saint Vincent and the Grenadines (from 6.2% in 2002 to 7.1% in 2006), Trinidad and Tobago (from 3.7% in 2002 to 4.7% in 2006). A decreasing trend, in contrast, was observed in the Dominican Republic (from
Annual prevalence of cannabis use Fig. 178: among secondary school students* in selected South American countries
Source: UNODC data based on UNODC – CICAD, Informe Subregional sobre Uso de Drogas en Pobacion Escolarizada, 2009/2010 and ARQ * The age groups are different for the countries. For Argen-tina and Uruguay, 13-17; Chile 13-18; Brazil, Colombia and Paraguay, 15-16; Peru 11-17 and Ecuador 12-17 year old students.
Annual prevalence of cannabis use Fig. 179: among the population aged 15-64 in selected South American countries
Source: UNODC data based on UNODC estimates for 2007, UNODC and CICAD, First comparative Study on Drug Use and Associated Factors in the General Population aged 15-64 and ARQ
1.9
3.1
4.2
6.3
7.6
8.4
14.8
15.6
0 5 10 15 20
P eru
P araguay
E cuador
Brazil
Argentina
Columbia
Uruguay
Chile
Annual prevalence (%)
Trends in the annual prevalence of cannabis use in the general population in Caribbean Fig. 180: countries which reported new data in 2008
Source: UNODC
0.7
0.7
1.6
2.3
2.6
4.3
6
6.7
7.2
0 2 4 6 8
E cuador
P eru
P araguay
Colombia
Brazil
Bolivia
Uruguay
Chile
Argentina
6.7
10.8
10.7
9.9
6.2
7.1
4.7
5.5
3.7
4.7
1.9
0.3
0 2 4 6 8 10 12
Grenada '03Grenada '05
Jamaica '01
Jamaica '06
St. Vincent&Grenadines '02St. Vincent&Grenadines '06
Bahamas '03
Bahamas '08
Trinidad&Tobago '02
Trinidad&Tobago '06
Dominican Republic '00Dominican Republic '08
Annual Prevalence (%)
Annual prevalence (%)

198
World Drug Report 2010
1.9% in 2000 to 0.3% in 2008) and in Jamaica (from 10.7% in 2001 to 9.9% in 2006). The 2005 estimates for Haiti were revised from 6.2% to 1.4% based on a school survey undertaken by CICAD.
Africa continues to lack quantitative informa-tion, but cannabis use is perceived to be increasing in most parts of the continent
Except for South Africa, there is no quantitative infor-mation available for Africa for 2008. The estimates provided for the continent are based on older data reported by UNODC in previous World Drug Reports. Compared to last year, the estimate for Ghana (annual prevalence 21.5%) was dropped because it was more than ten years old. Based on the available information, an estimated 27.7 to 52.8 million people, or 5.0% to 9.6% of the population aged 15 to 64, used cannabis in Africa in 2008. This wide range in the estimated number is mainly due to missing information and data from most of the African countries.
In 2008, experts from 73% of the responding states in Africa reported increases in cannabis use compared with the previous year, with decreases noted only in North Africa. Zambia (17.7%) and Nigeria (13.8%) remain the countries with high prevalence of cannabis use. The only systematic monitoring of drug use in Africa is in South Africa where it is based on treatment demand. Based on annual data from the different regions in South Africa, between 26% and 58% of patients attending specialist treatment centres had reported cannabis as their primary or secondary drug of abuse.19
19 Pluddemann A., Parry C., Bhana A., and others, Alcohol and Drug Abuse Trends: January – June 2009 (Phase 26), South African Com-munity Epidemiology Network on Drug Use (SACENDU), Novem-ber 2009.
In Europe, cannabis use has been stabilizing in the past few years, but it is still increasing in some countries
In Europe, an estimated 29.5 million people, or around 5.4% of the general population aged 15 to 64, used can-nabis in the previous year. Cannabis use is largely con-centrated among young people (15 – 34 years old). Within Europe, cannabis use differs considerably among the general population, with higher prevalence (7.7%) reported in West and Central Europe, compared to East and South-East Europe (3%). The Czech Republic (15.2% - 2008), Italy (14.6% - 2008) and Spain (10.1% - 2007) are the three countries with the highest cannabis use prevalence rates, accounting for about one third of all cannabis users in Europe (5 million only in Italy). The use of cannabis in Europe has evolved considerably over the last decade. In most countries, cannabis use increased during the 1990s and early 2000s, and this may now be moving into a new phase in some countries where data from the general population and school sur-veys point to a stabilizing or even decreasing trend. Countries that started to indicate a decrease in preva-lence over the previous years include Spain, France, Germany, Austria, Hungary and Sweden. England and Wales (the third largest European market of cannabis users after Italy and the Russian Federation) had shown a strong decline between 2003 and 2008 (from 10.8% to 7.4% of the general population), however, in 2009, the prevalence increased to 7.9%. New data for Scot-land, Finland, Romania and Bosnia and Herzegovina show a decrease. However, the majority of countries with new data in 2008 reported an increase in cannabis use from previous estimates. These are Bulgaria, the Czech Republic, Denmark, Estonia and Lithuania.
The last few years have also seen a growing understand-
Annual cannabis users in Africa Fig. 181:
Source: UNODC ARQ
2007
2008
20
25
30
35
40
45
50
55
60
Nu
mb
er o
f d
rug
use
rs in
mili
on
s
0
5
10
15
20
25
1997
a19
97b
1998
a19
98b
1999
a19
99b
2000
a20
00b
2001
a20
01b
2002
a20
02b
2003
a20
03b
2004
a20
04b
2005
a20
05b
2006
a20
06b
2007
a20
07b
2008
a20
08b
2009
a
in %
of
all t
reat
men
t
South Africa: cannabis as primary Fig. 182: drug of abuse in treatment demand, 1997-2009
Source: Source: Pluddemann A., Parry C., Bhana A., et al, Alcohol and Drug Abuse Trends, January – June 2009, Phase 26 (SACENDU reports data biannually)

199
2. Drug statistics and trends Cannabis
ing of the public health implications of long-term, wide-spread use of cannabis and rising reported levels of treatment demand for cannabis-related problems in Europe.
Increases in cannabis use among school students occurred in a number of European countries between 1995 and 2003, but in most countries, it stabilized or decreased in 2007, although different patterns can be found across Europe. Seven countries, mainly in northern and south-ern Europe (Greece, Cyprus, Malta, Romania, Finland, Sweden and Norway), have reported overall stable and low lifetime prevalence of cannabis use between 2003 and 2007. Most West European countries, as well as
Croatia and Slovenia, which had high or strongly increas-ing lifetime cannabis prevalence until 2003, saw a decrease or stabilization in 2007 – most noticeable among these countries is Ireland. In most parts of Cen-tral and East Europe, the increasing trend observed between 1995 and 2003 appears to be levelling out.20
20 EMCDDA, Statistical Bulletin 2009 and Hibell, et al, ESPAD Surveys 1995, 1999, 2003 and 2007.
Europe: Annual prevalence of cannabis use among general population in countries Fig. 183: reporting an increase in 2008
Source: UNODC
10.99.3
15.2
10.510.89.7
8.7 8.27.4 7.9
14.2
4.66
0.6
2.4 2.2
5.6 6.25.2 5.5
0.51.5
2.2 2.5
0
2
4
6
8
10
12
14
16
Cze
ch R
ep '0
2
Cze
ch R
ep '0
4
Cze
ch R
ep '0
8
Engl
and
& W
ales
'00
Engl
and
& W
ales
'03
Engl
and
& W
ales
'04
Engl
and
& W
ales
'05
Engl
and
& W
ales
'06
Engl
and
& W
ales
'08
Engl
and
& W
ales
'09
Esto
nia
'01
Esto
nia
'03
Esto
nia
'08
Lith
uani
a '0
2
Lith
uani
a '0
3
Lith
uani
a '0
4
Lith
uani
a '0
8
Den
mar
k '0
0
Den
mar
k '0
5
Den
mar
k '0
8
Bulg
aria
'01
Bulg
aria
'05
Bulg
aria
'07
Bulg
aria
'08
Europe: Annual prevalence of cannabis use among general population in countries reporting Fig. 184: a decrease in 2008
Source: UNODC
7.4
6.3
11
8.4
0.1
2.93.6
3.1 3 2.8
0.30.9
0.4
0
2
4
6
8
10
12
Scot
land
'03
Scot
land
'04
Scot
land
'06
Scot
land
'09
Finl
and
'02
Finl
and
'04
Finl
and
'06
Finl
and
'08
Bosn
ia &
Her
. '05
Bosn
ia &
Her
'08
Rom
ania
'02
Rom
ania
'04
Rom
ania
'07
An
nu
al p
reva
len
ce (
%)
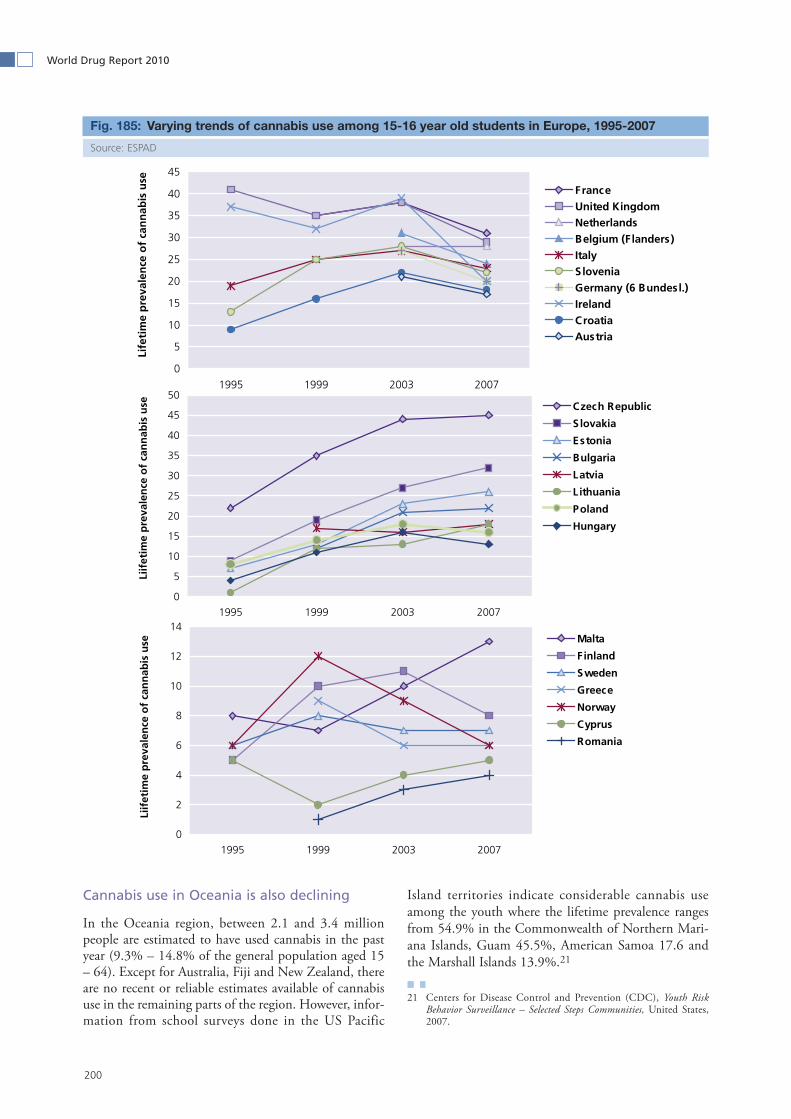
200
World Drug Report 2010
Cannabis use in Oceania is also declining
In the Oceania region, between 2.1 and 3.4 million people are estimated to have used cannabis in the past year (9.3% – 14.8% of the general population aged 15 – 64). Except for Australia, Fiji and New Zealand, there are no recent or reliable estimates available of cannabis use in the remaining parts of the region. However, infor-mation from school surveys done in the US Pacific
Island territories indicate considerable cannabis use among the youth where the lifetime prevalence ranges from 54.9% in the Commonwealth of Northern Mari-ana Islands, Guam 45.5%, American Samoa 17.6 and the Marshall Islands 13.9%.21
21 Centers for Disease Control and Prevention (CDC), Youth Risk Behavior Surveillance – Selected Steps Communities, United States, 2007.
Varying trends of cannabis use among 15-16 year old students in Europe, 1995-2007 Fig. 185:
Source: ESPAD
0
5
10
15
20
25
30
35
40
45
1995 1999 2003 2007
Life
tim
e p
reva
len
ce o
f ca
nn
abis
use
F ranceUnited KingdomNetherlandsBelgium (Flanders)ItalySloveniaGermany (6 Bundesl.)IrelandCroatiaAustria
0
5
10
15
20
25
30
35
40
45
50
1995 1999 2003 2007
Liif
etim
e p
reva
len
ce o
f ca
nn
abis
use Czech Republic
S lovakia
Estonia
Bulgaria
Latvia
Lithuania
Poland
Hungary
0
2
4
6
8
10
12
14
1995 1999 2003 2007
Liif
etim
e p
reva
len
ce o
f ca
nn
abis
use Malta
Finland
Sweden
Greece
Norway
Cyprus
Romania

201
2. Drug statistics and trends Cannabis
The 2008 range became larger, due to a higher preva-lence in New Zealand and new data for some territories in the Pacific.
In Australia, the annual prevalence of cannabis use has been declining since 1998, with an almost one fifth decline between 2004 and 2007. The major decline in cannabis use has been observed in the younger popula-tion (aged 14 to 19) from a prevalence of 34.6% in 1998 to 12.9% in 2007. In New Zealand, the annual preva-lence of cannabis use fell from 20.4% in 2003 to 13.3% in 2006, to increase again in 2008 to 14.6%. The can-nabis use prevalence was highest for men in the 18 – 24 age group and for women in the 16-17 and 18-24 year age groups.22
Limited or no recent data on cannabis use trends are available from Asia, but experts perceive an increase.
In Asia, it is estimated that between 31.5 million and 64.6 million people had used cannabis in the past year. Higher annual prevalence rates of cannabis use is reported from Central Asia (3.7% to 4.3% of the gen-eral population) and the Near and Middle East (3.1% to 4.3% of the general population). The most populated countries in Asia, China and India, do not have esti-mates of cannabis users among the general population. A survey carried out in India in 2001 estimated a monthly prevalence rate of cannabis use at 3% of the male population aged 12-60. The lack of information on cannabis use among the female population prevents the development of an accurate estimate of the preva-lence rate among the Indian population. The national drug authorities reporting to UNODC indicate a rise in cannabis use in the region over the past year. Since for many parts of the region there are no recent or reliable estimates available, the perceived trends by experts need to be treated with caution. In 2008, experts from 15 countries in Asia reported an increase in cannabis use compared to 13 in 2007 and nine in 2005. Experts from seven countries reported a stable trend and eight coun-tries in Asia reported declines in cannabis use in 2008.
22 Ministry of Health, Drug Use in New Zealand: Key results of the 2007/08, New Zealand Alcohol and Drug Use Survey, 2010.
Australia: annual prevalence of canna-Fig. 186: bis use among the population aged 14 and above, 1998-2007
Source: National Drug Strategy Household Survey, Australia, 2007
0
5
10
15
20
25
30
35
40
14-19 20-29 30-39 40-49 50-59 14+
An
nu
al p
reva
len
ce o
f ca
nn
abis
use
in
% o
f p
op
ula
tio
n
1998
2001
2004
2007


2.5 Amphetamine-type stimulants
203
Manufacture2.5.1
Synthetic drug manufacture dominated by ATS, methamphetamine
The majority (99%) of the detected clandestine syn-thetic drugs laboratories process amphetamine-type stimulants, manufacturing primarily the amphetamine-group substances methamphetamine, amphetamine, methcathinone and ecstasy-group substances. The vari-ety and easy accessibility of the starting materials needed to manufacture synthetic drugs allow production to occur virtually anywhere in the world. It is at the moment impossible to know precisely how much ATS is illicitly manufactured, as independent calculations based on remote sensing of manufacture cannot be done, as is the case with poppy plants and coca bushes.
ATS-related manufacture occurs in all parts of the world; highest concentrations in East and South-East Asia, Europe, North America, Oceania and Southern Africa
The number of reported ATS-related clandestine labora-tories increased by 20% in 2008, and for the first time revealed the existence of manufacturing laboratories in Argentina, Brazil, Guatemala, the Islamic Republic of Iran, Kazakhstan and Sri Lanka. Information on the 8,408 detected laboratories came from 32 countries, with the largest numbers reported from the United States of America, the Czech Republic, Australia, China,1
1 In 2008, China reported 244 unspecified clandestine laboratories. However, this figure is also known to included some opium dens and was therefore not included in the ATS totals.
Slovakia, New Zealand, the Netherlands, Canada and Mexico. However, the number of laboratories is not representative of their output, as many countries with lower total counts report only laboratories with large-scale outputs.2
The type and form of ATS manufactured vary across regions. For example, in East and South-East Asia, manufacture of methamphetamine is primarily in tablet form (‘yaba’) and high purity crystalline form (‘ice’), although there are increasing incidents of ecstasy (MDMA) manufacture. Tablets sold as Captagon in the Near and Middle East often contain amphetamine and are sourced from South-East Europe and from within the region. In Europe, ATS manufacture is mainly powder and tableted amphetamine and ecstasy (MDMA), with methamphetamine (‘pervitine’) manufactured pri-marily in the Czech Republic and Slovakia, and other east European countries, with evidence that manufac-ture is further spreading. South Africa-based manufac-ture is predominately methamphetamine (‘tik’) and methcathinone. Methamphetamine and ecstasy are manufactured in all countries of North America, and there are increasing incidents of methamphetamine-re-lated manufacture occurring throughout Central and South America. Methamphetamine and some ecstasy laboratories are commonly encountered in Oceania – primarily Australia and New Zealand.
2 There is no internationally accepted definition of what constitutes a clandestine synthetic drug laboratory. Therefore, figures may include accounts of ATS precursor extraction, drug synthesis, refinement, tableting and packaging, laboratory storage facilities, and chemical and equipment dumpsites as broadly defined ‘laboratories.’

204
World Drug Report 2010
Rebound in US methamphetamine laboratory incidents drives global increase
Global methamphetamine laboratory counts increased 29% in 2008 to 8,295, although the numbers are still significantly lower than their peak in 2004 (17,853). The largest numbers reflected increases reported from the United States (7,226), however, along with 3,866 synthesis laboratories, these figures also include inci-dents of laboratory storage facilities and chemical/equip-ment dumpsites. Globally, most of the seized laboratories were methamphetamine-related, due to the simplicity of its manufacture and availability of inexpensive precursor chemicals.
Over the last decade, reports of clandestine laboratory incidents have increased in several regions outside of North America, with large growth in East and South-East Asia, Europe and Oceania. Several countries report few but mostly industrial-sized operations, particularly in East Asia and parts of North America, existing for criminal profit.
Reported amphetamine laboratories in 2008 at the lowest level in a decade
In 2008, only 45 amphetamine laboratories were reported, the lowest in a decade.3 Most were reported throughout Europe, particularly in West and Central Europe. The decline in the number of laboratories comes at a time when seizures of amphetamine are at record highs, particularly throughout the Near and Middle East, where not a single laboratory was reported in 2008. Indeed, part of the decline in numbers is due simply to less reporting, such as no reports of ampheta-
3 These represent amphetamine-only laboratories and do not include combination ATS laboratories.
mine laboratories being provided from the United States in 2008. In general, there are far fewer amphetamine and ‘ecstasy’-group laboratories reported because these substances require far greater sophistication than meth-amphetamine manufacture.
ATS laboratories (all sizes) reported to UNODC, by type, 1999-2008Fig. 187:
Source: UNODC ARQ
Number of reported methamphe-Fig. 188: tamine laboratory incidents (all sizes), by notable region, 1999-2008
Source: UNODC ARQ/DELTA
0
5,000
10,000
15,000
20,000
ATS
lab
ora
tory
-rel
ated
in
cid
ents
(#)
.
ATS lab total 7412 7028 8598 9782 11258 18874 13467 8271 7002 8408
Other Synthetic Stimulant 68 19 5 24 70 282 92 51 35 1
Ecstasy Group 62 64 70 59 49 87 63 56 72 53
Combined ATS 204 221 272 244 314 330 370 361 344 15
Amphetamine 59 115 85 132 161 322 159 154 102 44
Methamphetamine 7019 6609 8166 9323 10664 17853 12783 7649 6449 8295
1999 2000 2001 2002 2003 2004 2005 2006 2007 2008
17,853
8,295
0
200
400
600
800
1000
1200
1400
1999 2001 2003 2005 2007
Met
h la
bo
rato
ries
in s
elec
ted
reg
ion
s (#
)
0
5,000
10,000
15,000
20,000 Total (an
d U
SA) M
eth lab
orato
ries (#)
Oceania West & Central Europe
Southern Africa East Europe
East and South-East Asia USA (right-scale)
Global (right scale)
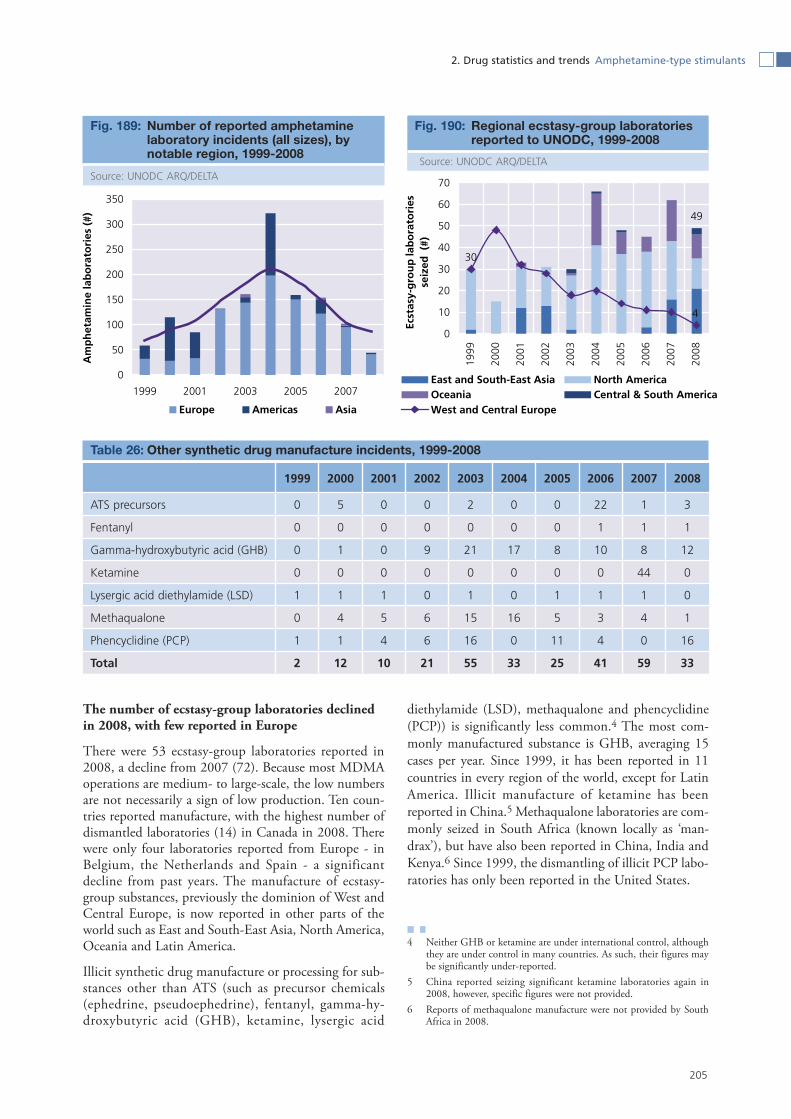
205
2. Drug statistics and trends Amphetamine-type stimulants
The number of ecstasy-group laboratories declined in 2008, with few reported in Europe
There were 53 ecstasy-group laboratories reported in 2008, a decline from 2007 (72). Because most MDMA operations are medium- to large-scale, the low numbers are not necessarily a sign of low production. Ten coun-tries reported manufacture, with the highest number of dismantled laboratories (14) in Canada in 2008. There were only four laboratories reported from Europe - in Belgium, the Netherlands and Spain - a significant decline from past years. The manufacture of ecstasy-group substances, previously the dominion of West and Central Europe, is now reported in other parts of the world such as East and South-East Asia, North America, Oceania and Latin America.
Illicit synthetic drug manufacture or processing for sub-stances other than ATS (such as precursor chemicals (ephedrine, pseudoephedrine), fentanyl, gamma-hy-droxybutyric acid (GHB), ketamine, lysergic acid
diethylamide (LSD), methaqualone and phencyclidine (PCP)) is significantly less common.4 The most com-monly manufactured substance is GHB, averaging 15 cases per year. Since 1999, it has been reported in 11 countries in every region of the world, except for Latin America. Illicit manufacture of ketamine has been reported in China.5 Methaqualone laboratories are com-monly seized in South Africa (known locally as ‘man-drax’), but have also been reported in China, India and Kenya.6 Since 1999, the dismantling of illicit PCP labo-ratories has only been reported in the United States.
4 Neither GHB or ketamine are under international control, although they are under control in many countries. As such, their figures may be significantly under-reported.
5 China reported seizing significant ketamine laboratories again in 2008, however, specific figures were not provided.
6 Reports of methaqualone manufacture were not provided by South Africa in 2008.
Number of reported amphetamine Fig. 189: laboratory incidents (all sizes), by notable region, 1999-2008
Source: UNODC ARQ/DELTA
Regional ecstasy-group laboratories Fig. 190: reported to UNODC, 1999-2008
Source: UNODC ARQ/DELTA
1999 2000 2001 2002 2003 2004 2005 2006 2007 2008
ATS precursors 0 5 0 0 2 0 0 22 1 3
Fentanyl 0 0 0 0 0 0 0 1 1 1
Gamma-hydroxybutyric acid (GHB) 0 1 0 9 21 17 8 10 8 12
Ketamine 0 0 0 0 0 0 0 0 44 0
Lysergic acid diethylamide (LSD) 1 1 1 0 1 0 1 1 1 0
Methaqualone 0 4 5 6 15 16 5 3 4 1
Phencyclidine (PCP) 1 1 4 6 16 0 11 4 0 16
Total 2 12 10 21 55 33 25 41 59 33
Other synthetic drug manufacture incidents, 1999-2008Table 26:
0
50
100
150
200
250
300
350
1999 2001 2003 2005 2007
Am
ph
etam
ine
lab
ora
tori
es (
#)
Europe Americas Asia
30
49
4
0
10
20
30
40
50
60
70
1999
2000
2001
2002
2003
2004
2005
2006
2007
2008
Ecst
asy-
gro
up
lab
ora
tori
es
seiz
ed (
#)
East and South-East Asia North AmericaOceania Central & South AmericaWest and Central Europe
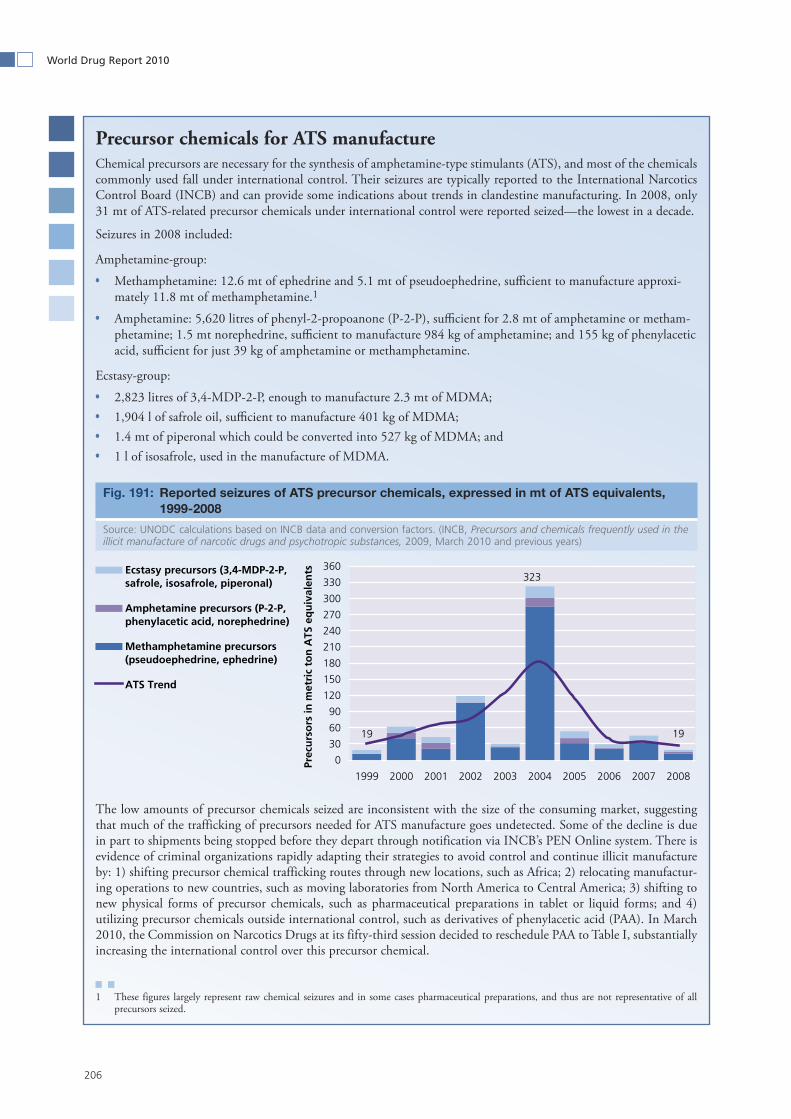
206
World Drug Report 2010
Precursor chemicals for ATS manufactureChemical precursors are necessary for the synthesis of amphetamine-type stimulants (ATS), and most of the chemicals commonly used fall under international control. Their seizures are typically reported to the International Narcotics Control Board (INCB) and can provide some indications about trends in clandestine manufacturing. In 2008, only 31 mt of ATS-related precursor chemicals under international control were reported seized—the lowest in a decade.
Seizures in 2008 included:
Amphetamine-group:
Methamphetamine: 12.6 mt of ephedrine and 5.1 mt of pseudoephedrine, sufficient to manufacture approxi- mately 11.8 mt of methamphetamine.1
Amphetamine: 5,620 litres of phenyl-2-propoanone (P-2-P), sufficient for 2.8 mt of amphetamine or metham- phetamine; 1.5 mt norephedrine, sufficient to manufacture 984 kg of amphetamine; and 155 kg of phenylacetic acid, sufficient for just 39 kg of amphetamine or methamphetamine.
Ecstasy-group:
2,823 litres of 3,4-MDP-2-P, enough to manufacture 2.3 mt of MDMA;
1,904 l of safrole oil, sufficient to manufacture 401 kg of MDMA;
1.4 mt of piperonal which could be converted into 527 kg of MDMA; and
1 l of isosafrole, used in the manufacture of MDMA.
The low amounts of precursor chemicals seized are inconsistent with the size of the consuming market, suggesting that much of the trafficking of precursors needed for ATS manufacture goes undetected. Some of the decline is due in part to shipments being stopped before they depart through notification via INCB’s PEN Online system. There is evidence of criminal organizations rapidly adapting their strategies to avoid control and continue illicit manufacture by: 1) shifting precursor chemical trafficking routes through new locations, such as Africa; 2) relocating manufactur-ing operations to new countries, such as moving laboratories from North America to Central America; 3) shifting to new physical forms of precursor chemicals, such as pharmaceutical preparations in tablet or liquid forms; and 4) utilizing precursor chemicals outside international control, such as derivatives of phenylacetic acid (PAA). In March 2010, the Commission on Narcotics Drugs at its fifty-third session decided to reschedule PAA to Table I, substantially increasing the international control over this precursor chemical.
1 These figures largely represent raw chemical seizures and in some cases pharmaceutical preparations, and thus are not representative of all precursors seized.
Reported seizures of ATS precursor chemicals, expressed in mt of ATS equivalents, Fig. 191: 1999-2008
Source: UNODC calculations based on INCB data and conversion factors. (INCB, Precursors and chemicals frequently used in the illicit manufacture of narcotic drugs and psychotropic substances, 2009, March 2010 and previous years)
19 19
323
0
30
60
90
120
150
180
210
240
270
300
330
360
1999 2000 2001 2002 2003 2004 2005 2006 2007 2008
Pre
curs
ors
in m
etri
c to
n A
TS e
qu
ival
ents
Ecstasy precursors (3,4-MDP-2-P,safrole, isosafrole, piperonal)
Amphetamine precursors (P-2-P,phenylacetic acid, norephedrine)
Methamphetamine precursors(pseudoephedrine, ephedrine)
ATS Trend

2. Drug statistics and trends Amphetamine-type stimulants
207
Seizures2.5.2
Trafficking of amphetamine-type stimulants (ATS), along with their production, has come to affect the entire globe. Seizure data, however, point to different types of ATS prevailing in different parts of the world, and different trends can be observed in global and regional seizure totals for the different types of ATS.
Amphetamine-type stimulants are broadly categorized into two groups: the amphetamines group, comprised of amphetamine, methamphetamine and non-specified amphetamines, and the ‘ecstasy’ group. Total seizures in the amphetamines group reached 47.4 mt7 in 2008, slightly exceeding the level in 2007 (43.8 mt), as well as the previous record level registered in 2006 (45.9 mt). On the other hand, ‘ecstasy’ seizures fell markedly in 2008, dropping to 3.86 mt7 – the lowest level since 1999. Over the period 2000-2008, seizures of ‘ecstasy’ fluctuated considerably, while methamphetamine sei-zures were less erratic; in both cases, seizure totals stayed within the same order of magnitude. The most pro-nounced expansion over this period was observed in seizures of amphetamine, which grew almost eight-fold over a time span of eight years, mainly due to increases in the Near and Middle East.
While seizures of amphetamine in the Near and Middle East/South-West Asia represented almost two thirds of the global total in 2008, a majority of methampheta-mine seizures were attributable to countries in East and South-East Asia. North America accounted for most of the remaining seizures of methamphetamine, as well as – for the first time – more than one half of global ‘ecstasy’ seizures. The significant increase in the North American share of global ‘ecstasy’ seizures was partly due to an increase in ‘ecstasy’ seizures in the United States, but also to decreases in other regions, notably West and Central Europe. On the other hand, West and Central Europe continued to account for approximately one third of global seizures of amphetamine. Almost 90% of seizures of non-specified amphetamines were recorded in West
7 Amphetamine-type stimulants are seized in various forms, including liquid and tablet form, and may be reported by weight, volume, number of tablets or other units. In specific cases, seizure amounts may be reproduced as reported by countries, but aggregate quantities are expressed by weight. For the purposes of the aggregation, one tablet is assumed to contain 30 mg of active ingredient, with the exception of ‘ecstasy’ tablets, which are assumed to contain 100 mg of active ingredient. Moreover, one litre of liquid is assumed to cor-respond to one kilogram.
and Central Africa, which remains a priority area in terms of responding to the drug problem, starting with a better understanding of the nature of drugs in the illicit market.
Amphetamine
Global seizures of amphetamine amounted to a record 24.3 mt in 2008, essentially sustaining the high level of 2007 (23.7 mt). The Near and Middle East/South-West Asia and Europe together accounted for 97% of seizures in 2008. Since the year 2000, amphetamine seizures have grown considerably in both these regions, but the growth rate in the Near and Middle East/South-West Asia clearly outpaced that in Europe.
One caveat, however, needs to be made. Most of the seizures in the Near and Middle East/South-West Asia are in tablet form, and there are indications that – when converted into weight terms – the weight of the entire tablet is used, and not only the weight of the active ingredient (amphetamine). This could inflate the sei-zures in this part of the world by a factor of ten or more.8 It does not seriously impact the growth rates, but possibly the absolute levels of seizures reported from the countries in the Near and Middle East/South-West Asia.
Reports of amphetamine seizures from countries in the Middle East continue to refer predominantly to tablets bearing the Captagon logo. The nature of the psychoac-tive ingredients in such tablets is not always clear, but reports suggest that amphetamine trafficked from South-East Europe is the main ingredient in Captagon tablets found in the consumer markets of the Middle East (notably Saudi Arabia), frequently alongside caffeine. Laboratories may also exist in countries along this route, possibly carrying out the conversion into tablet form. Jordan, Lebanon, Turkey and the Syrian Arab Republic serve as important transit points.
8 A recent forensic analysis of some 9,400 Captagon tablets seized in Iraq in the border region with Jordan, Saudi Arabia and the Syrian Arab Republic in 2009 revealed that the tablets had a weight between 163 and 170 mg and contained between 7 and 20 mg of amphetamine (in addition to 30-65 mg of caffeine and 8-39 mg of theophylline). (UNODC, Global Smart Update, Volume 2, October 2009, p. 8.) Taking the mid-points, there would be a factor of 12 between reporting the amphetamine contained in a tablet and the whole weight of the tablet.
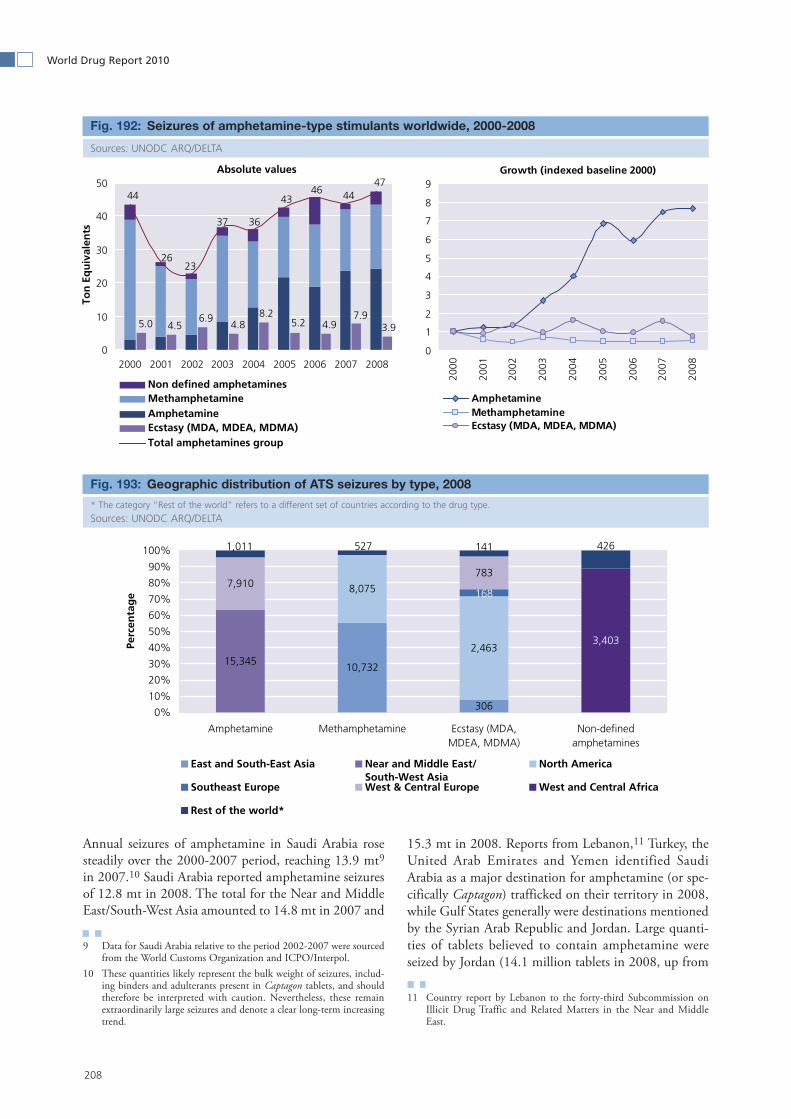
208
World Drug Report 2010
Annual seizures of amphetamine in Saudi Arabia rose steadily over the 2000-2007 period, reaching 13.9 mt9 in 2007.10 Saudi Arabia reported amphetamine seizures of 12.8 mt in 2008. The total for the Near and Middle East/South-West Asia amounted to 14.8 mt in 2007 and
9 Data for Saudi Arabia relative to the period 2002-2007 were sourced from the World Customs Organization and ICPO/Interpol.
10 These quantities likely represent the bulk weight of seizures, includ-ing binders and adulterants present in Captagon tablets, and should therefore be interpreted with caution. Nevertheless, these remain extraordinarily large seizures and denote a clear long-term increasing trend.
15.3 mt in 2008. Reports from Lebanon,11 Turkey, the United Arab Emirates and Yemen identified Saudi Arabia as a major destination for amphetamine (or spe-cifically Captagon) trafficked on their territory in 2008, while Gulf States generally were destinations mentioned by the Syrian Arab Republic and Jordan. Large quanti-ties of tablets believed to contain amphetamine were seized by Jordan (14.1 million tablets in 2008, up from
11 Country report by Lebanon to the forty-third Subcommission on Illicit Drug Traffic and Related Matters in the Near and Middle East.
Seizures of amphetamine-type stimulants worldwide, 2000-2008Fig. 192:
Sources: UNODC ARQ/DELTA
Geographic distribution of ATS seizures by type, 2008Fig. 193:
* The category “Rest of the world” refers to a different set of countries according to the drug type.
Sources: UNODC ARQ/DELTA
Absolute values
3.97.9
4.95.28.2
4.86.9
4.55.0
474446
43
3637
2326
44
0
10
20
30
40
50
2000 2001 2002 2003 2004 2005 2006 2007 2008
Ton
Eq
uiv
alen
ts
Non defined amphetaminesMethamphetamineAmphetamineEcstasy (MDA, MDEA, MDMA)Total amphetamines group
Growth (indexed baseline 2000)
0
1
2
3
4
5
6
7
8
9
2000
2001
2002
2003
2004
2005
2006
2007
2008
AmphetamineMethamphetamineEcstasy (MDA, MDEA, MDMA)
306
10,73215,345
8,075
2,463
1687,910
783
3,403
4261415271,011
0%
10%
20%
30%
40%
50%
60%
70%
80%
90%
100%
Amphetamine Methamphetamine Ecstasy (MDA,MDEA, MDMA)
Non-definedamphetamines
Perc
enta
ge
East and South-East Asia Near and Middle East/South-West Asia
North America
Southeast Europe West & Central Europe West and Central Africa
Rest of the world*

209
2. Drug statistics and trends Amphetamine-type stimulants
10.6 million in 2007), Yemen (13.4 million in 2008) and the Syrian Arab Republic (11.8 million tablets in 2008 and 12.0 million in 2007).
Amphetamine seizures in Europe amounted to 8.37 mt, sustaining the record level of 2007 (8.70 mt). A notable increase was registered in United Kingdom: the total for England, Wales and Northern Ireland rose by 65%, from 1.78 mt in the 2007/2008 financial year to 2.94 mt12 in 2008/2009. Seizures also rose in Germany, from 810 kg in 2007 to 1.28 mt in 2008. These increases were offset by a decline in seizures in the Netherlands, which dropped to 1.16 mt in 2008 (from 2.81 mt in 2007). Significant quantities were also seized by Belgium (411 kg), Sweden (362 kg), Poland (342 kg), Norway (260 kg), Bulgaria (187 kg) and Turkey (163 kg).
Mexico, which historically has been linked with signifi-cant manufacture of methamphetamine, reported 251 kg of amphetamine seizures in 2008 – nine times the level in 2007 (27.1 kg).
Methamphetamine
Global methamphetamine seizures remained stable for the fourth year in a row, amounting to 18.2 mt in 2007 and 19.3 mt in 2008. East and South-East Asia (notably China) and North America (notably the United States) continued to account for the vast majority of metham-phetamine seizures.
In 2008, total methamphetamine seizures in East and South-East Asia remained stable (10.7 mt). In China, seizures amounted to 6.09 mt in 2007 (the largest world-wide for that year) and 6.15 mt in 2008. According to
12 The total for the United Kingdom was not available. UNODC esti-mates total seizures of amphetamine in the UK at 3.55 mt.
Chinese authorities,13 large amounts of amphetamine-type stimulants entered Yunnan province through the border with Myanmar. Seizures of amphetamine-type stimulants from Europe and South America also increased. China reported 460 arrests of foreign nation-als for trafficking of amphetamine-type stimulants in 2007; of these, 397 involved nationals of Myanmar.
Seizures in Thailand rose to 1.98 mt in 2008, returning to a level comparable to that registered in 2004 (2.12 mt). The World Customs Organization reported14 that, in 2008, Thailand was the most frequent destination country in the Asia-Pacific region among methampheta-mine seizure cases recorded in the Customs Enforce-ment Network database. In particular, 157 seizures were made on the route from the Lao People’s Democratic Republic to Thailand.
Significant increases in methamphetamine seizures were also registered by the Philippines and Malaysia. The Philippines also reported 10 clandestine laboratories manufacturing methamphetamine in 2008, and a con-current increase in the price of methamphetamine hydrochloride.
North America accounted for total methamphetamine seizures of 8.08 mt in 2008. Seizures in the United States rose markedly, from 4.89 mt in 2007 to 7.37 mt in 2008 (the largest worldwide for that year). The increase was offset by the portion of the North American total seized by Canada, which reported extraordinarily large seizures in 2007 (1.54 mt) but only 360 kg in
13 China National Narcotics Control Commission. Quoted in country presentation by China, Global SMART Programme Meeting for East Asia, 29-31 July 2009, Bangkok, Thailand.
14 World Customs Organization Regional Intelligence Liaison Office for Asia and the Pacific, Analysis Report 2009.1.
Regional breakdown of global amphetamine seizures, 2000-2008 (ton equivalents) Fig. 194:
Source: UNODC ARQ/DELTA
8.4
15
0
3
6
9
12
15
18
2000 2001 2002 2003 2004 2005 2006 2007 2008
Europe
Near and Middle East/South-West Asia
Rest of the world
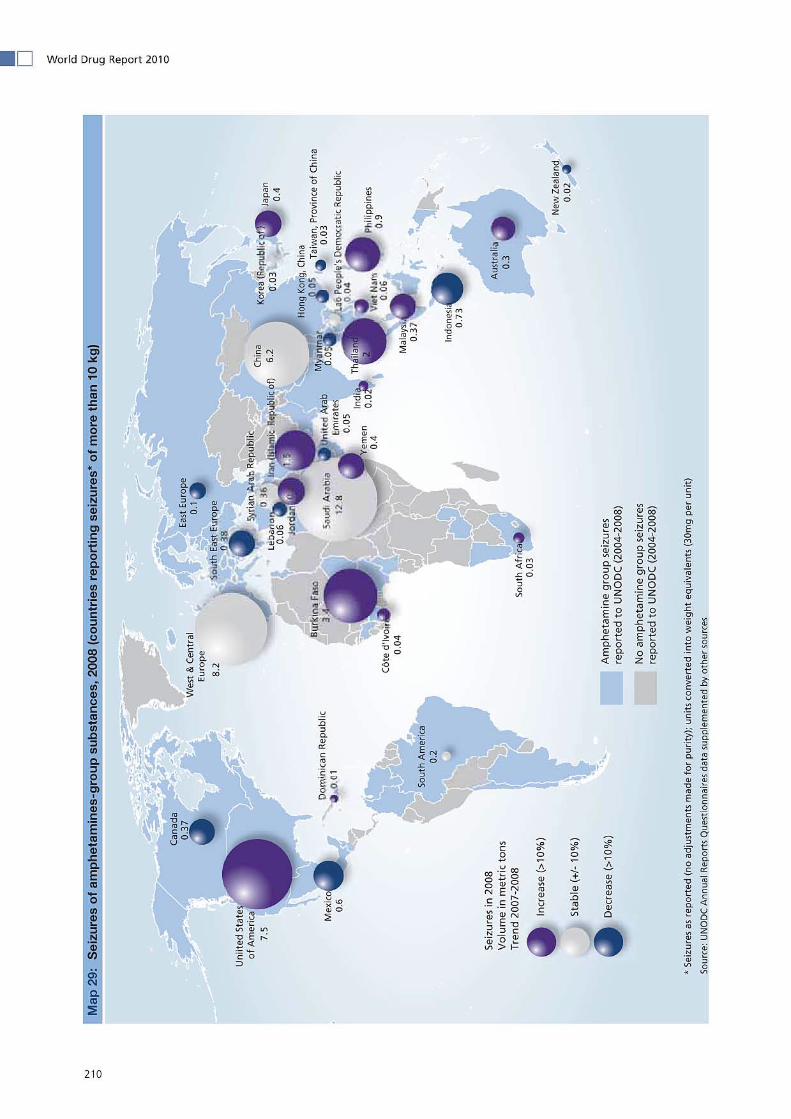

211
2. Drug statistics and trends Amphetamine-type stimulants
2008. In Mexico, seizures fell from 920 kg in 2007 to 341 kg in 2008 – the lowest level since 1998.
According to the United States Department of Justice,15 available data indicated that methamphetamine availa-bility in the United States was directly related to meth-amphetamine manufacture trends in Mexico. Following declines in domestic methamphetamine manufacture registered after 2004 in the United States — which also impacted on the domestic availability of this substance — methamphetamine seizures on the south-west border of the country rose significantly between 2008 and 2009. Moreover, price and purity data from the US Drug Enforcement Agency indicated an increase in the availability of methamphetamine in the United States. Between the fourth quarter of 2007 and the third quar-ter of 2009, the average purity of methamphetamine followed a generally increasing trend, rising from 41% to 69%, while the price per pure gram followed a gener-ally decreasing trend, from US$279 to US$127.16 How-ever, the increased availability of methamphetamine in the United States does not appear to have led to increased use of this drug.
Although global methamphetamine seizure totals have remained stable, seizure data point to illicit trade in methamphetamine in countries which have traditionally not been linked with this drug. Starting in 2005, the Islamic Republic of Iran has seized increasing quantities of methamphetamine. The country’s combined seizures of amphetamine and methamphetamine amounted to 1.47 mt in 2008 and 2.43 mt in 2009.17 The results of
15 US Department of Justice, National Drug Threat Assessment 2010.16 Ibid. Based on data extracted from System To Retrieve Information on
Drug Evidence (STRIDE).17 Islamic Republic of Iran, Drug Control Headquarters, Drug Control
in 2009.
research undertaken in the Islamic Republic of Iran, as reported18 by its Drug Control Headquarters, indicate that the use of methamphetamine has increased. In Afghanistan, the first confirmed seizure of metham-phetamine was made in January 2009, in the city of Lashkar Gah (Hilmand province), although a survey undertaken in 2009 indicates a very low level of ATS use. In Europe, while seizures of ATS continue to consist predominantly of amphetamine and ‘ecstasy’, seizures of methamphetamine have also increased in a number of countries, notably the Nordic countries.
'Ecstasy"
Global seizures of ‘ecstasy’ fell from a record level of 7.94 mt in 2007 to 3.86 mt in 2008, the lowest level since 1999. The low level was partly due to significantly reduced seizures in the Netherlands and Australia. On the other hand, seizures increased markedly in the United States. North America, Europe and East and South-East Asia collectively accounted for 98% of global ‘ecstasy’ seizures in 2008.
Over the period 2004-2008, seizures of ‘ecstasy’-type substances in the United States followed a generally
18 Drug control in 2008, Annual Report and Rapid Situation Assessment, Drug Control Headquarters, Islamic Republic of Iran.
Methamphetamine seizures worldwide Fig. 195: (ton equivalents), 2001-2008
Source: UNODC ARQ/DELTA
Methamphetamine prices and puri-Fig. 196: ties in the United States, 2006-2009 (STRIDE*)
*STRIDE is a database of drug exhibits maintained by the US Drug Enforcement Administration. The values reported here represent aver-ages of all methamphetamine purchases in the database. Although not collected as a representative sample of the US market, STRIDE data reflect the best information available available on changes in metham-phetamine price and purity in the US market.
Source: US Department of Justice, National Drug Threat Assessment 2010
0
5
10
15
20
2001 2002 2003 2004 2005 2006 2007 2008
Ton
eq
uiv
alen
ts
East and South-East AsiaNorth AmericaRest of the world
$279
$127
41%
69%
$0
$50
$100
$150
$200
$250
$300
Jan-
Mar
06
Apr
-Jun
06
Jul-S
ep 0
6O
ct-D
ec 0
6Ja
n-M
ar 0
7A
pr-J
un 0
7Ju
l-Sep
07
Oct
-Dec
07
Jan-
Mar
08
Apr
-Jun
08
Jul-S
ep 0
8O
ct-D
ec 0
8Ja
n-M
ar 0
9A
pr-J
un 0
9Ju
l-Sep
09
Mea
n p
rice
per
pu
re g
ram
(U
S d
olla
rs)
0
10
20
30
40
50
60
70
80
Mea
n p
uri
ty (
per
cen
tag
e)
Mean price per pure gram (left axis)Mean purity (right axis)
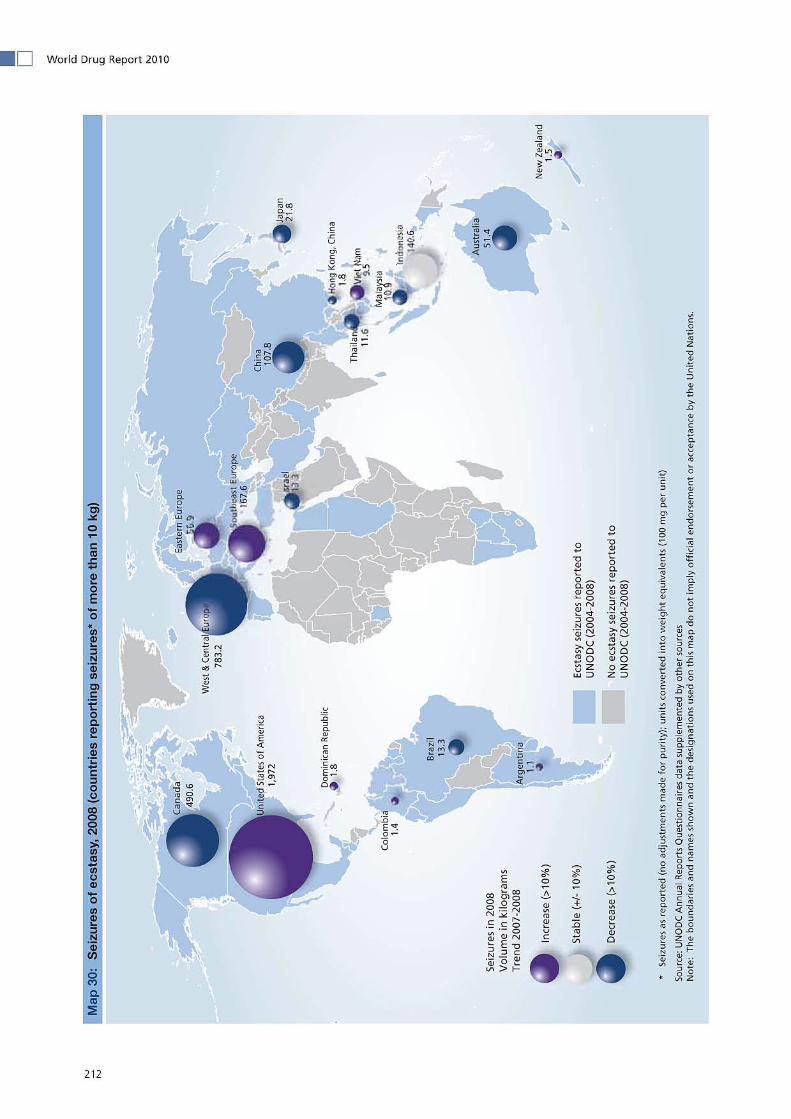

213
2. Drug statistics and trends Amphetamine-type stimulants
increasing trend. This came after declines between 2000 and 2003 (in line with reports of reduced availability and reduced trafficking of ‘ecstasy’ from the Netherlands to the United States). In 2008, seizures almost doubled to reach a record level, rising from 1 mt in 2007 to nearly 2 mt. According to the United States Department of Justice,19 the resurgence of MDMA availability in the United States was fuelled by manufacture in Canada and smuggling into the US across the northern border. MDMA seizures at the northern border (measured in dosage units) more than doubled between 2008 and 2009. However, availability appeared to be stabilizing.
In Europe, seizures of ‘ecstasy’ fell sharply, from 3.07 mt in 2007 to 1.01 mt in 2008. The drop was mainly due to smaller seizures reported by the Netherlands, which fell from 2.16 mt to 409 kg. Seizures of ‘ecstasy’ tablets in particular by the Netherlands fell from 8.43 million tablets in 2007 to 249,000 tablets in 2008. A downward trend in ‘ecstasy’ seizures was observed across West and Central Europe: of 31 countries and territories for which UNODC had collated seizures of ‘ecstasy’ in 2007, 26 registered a decrease in 2008. There are indications that improved precursor controls may have made access to the needed chemicals more difficult, thus reducing man-ufacture and trafficking of MDMA.
Australian ‘ecstasy’ seizures fell drastically, from the record level of 2007 (1.97 mt) to 51.4 kg in 2008. The figure for 2007 includes a single extraordinarily large seizure of approximately 15 million tablets.20 However,
19 National Drug Intelligence Center, United States Department of Justice, National Drug Threat Assessment 2010, February 2010.
20 This was reported by the Australian Crime Commission in Illicit Drug Data Report 2006-07, Revised Edition. This seizure, which was part of a year-long controlled delivery operation, was also confirmed separately to UNODC by the Australian Federal Police. In the reply
the level in 2008 is low also in comparison with previous years. Over the period 2003-2006, ‘ecstasy’ seizures in Australia averaged 1.10 mt. Seizures also fell in East and South-East Asia, from 740 kg in 2007 to 306 kg in 2008.
to the annual reports questionnaire for 2007, Australia reported seizures amounting to 470 kg.
European methamphetamine seizures Fig. 197: 2005-2008
Source: UNODC ARQ/DELTA
‘Ecstasy’ seizures worldwide, Fig. 198: 2000-2008 (ton equivalents)
Source: UNODC ARQ/DELTA
Major ‘ecstasy’ seizures in West and Fig. 199: Central Europe (excluding the Nether-lands), 2007-2008
* Figures for the United Kingdom are UNODC estimates based on reported totals for England, Wales and Northern Ireland.
Source: UNODC ARQ/DELTA
0
30
60
90
120
150
180
Nor
way
Swed
en
Lith
uani
a
Esto
nia
Latv
ia
Belg
ium
Finl
and
Bela
rus
Pola
nd
Irela
nd
Kilo
gra
m e
qu
ival
ents
2005200620072008
0
1
2
3
4
5
6
7
8
9
2000 2001 2002 2003 2004 2005 2006 2007 2008
Ton
eq
uiv
alen
ts
North America EuropeOceania East and South-East AsiaRest of the world United States
0
20
40
60
80
100
120
140
160
Fran
ce
Uni
ted
Kin
gdom
*
Ger
man
y
Pola
nd
Belg
ium
Italy
Spai
n
Hun
gary
Irela
nd
Icel
and
Esto
nia
Swed
en
Latv
ia
Kilo
gra
m E
qu
ival
ents
20072008
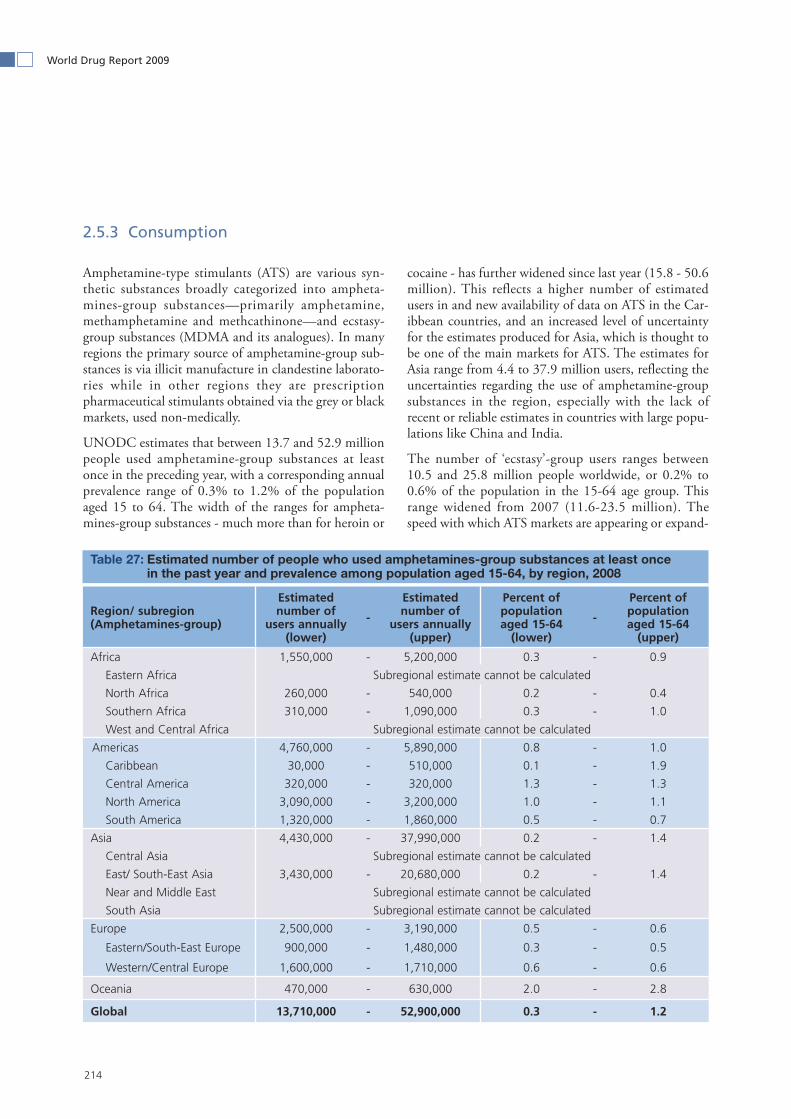
214
World Drug Report 2009
Consumption 2.5.3
Amphetamine-type stimulants (ATS) are various syn-thetic substances broadly categorized into ampheta-mines-group substances—primarily amphetamine, methamphetamine and methcathinone—and ecstasy-group substances (MDMA and its analogues). In many regions the primary source of amphetamine-group sub-stances is via illicit manufacture in clandestine laborato-ries while in other regions they are prescription pharmaceutical stimulants obtained via the grey or black markets, used non-medically.
UNODC estimates that between 13.7 and 52.9 million people used amphetamine-group substances at least once in the preceding year, with a corresponding annual prevalence range of 0.3% to 1.2% of the population aged 15 to 64. The width of the ranges for ampheta-mines-group substances - much more than for heroin or
cocaine - has further widened since last year (15.8 - 50.6 million). This reflects a higher number of estimated users in and new availability of data on ATS in the Car-ibbean countries, and an increased level of uncertainty for the estimates produced for Asia, which is thought to be one of the main markets for ATS. The estimates for Asia range from 4.4 to 37.9 million users, reflecting the uncertainties regarding the use of amphetamine-group substances in the region, especially with the lack of recent or reliable estimates in countries with large popu-lations like China and India.
The number of ‘ecstasy’-group users ranges between 10.5 and 25.8 million people worldwide, or 0.2% to 0.6% of the population in the 15-64 age group. This range widened from 2007 (11.6-23.5 million). The speed with which ATS markets are appearing or expand-
Region/ subregion (Amphetamines-group)
Estimated number of
users annually (lower)
-
Estimated number of
users annually (upper)
Percent of population aged 15-64
(lower)
-
Percent of population aged 15-64
(upper)
Africa 1,550,000 - 5,200,000 0.3 - 0.9
Eastern Africa Subregional estimate cannot be calculated
North Africa 260,000 - 540,000 0.2 - 0.4
Southern Africa 310,000 - 1,090,000 0.3 - 1.0
West and Central Africa Subregional estimate cannot be calculated
Americas 4,760,000 - 5,890,000 0.8 - 1.0
Caribbean 30,000 - 510,000 0.1 - 1.9
Central America 320,000 - 320,000 1.3 - 1.3
North America 3,090,000 - 3,200,000 1.0 - 1.1
South America 1,320,000 - 1,860,000 0.5 - 0.7
Asia 4,430,000 - 37,990,000 0.2 - 1.4
Central Asia Subregional estimate cannot be calculated
East/ South-East Asia 3,430,000 - 20,680,000 0.2 - 1.4
Near and Middle East Subregional estimate cannot be calculated
South Asia Subregional estimate cannot be calculated
Europe 2,500,000 - 3,190,000 0.5 - 0.6
Eastern/South-East Europe 900,000 - 1,480,000 0.3 - 0.5
Western/Central Europe 1,600,000 - 1,710,000 0.6 - 0.6
Oceania 470,000 - 630,000 2.0 - 2.8
Global 13,710,000 - 52,900,000 0.3 - 1.2
Estimated number of people who used amphetamines-group substances at least once Table 27: in the past year and prevalence among population aged 15-64, by region, 2008
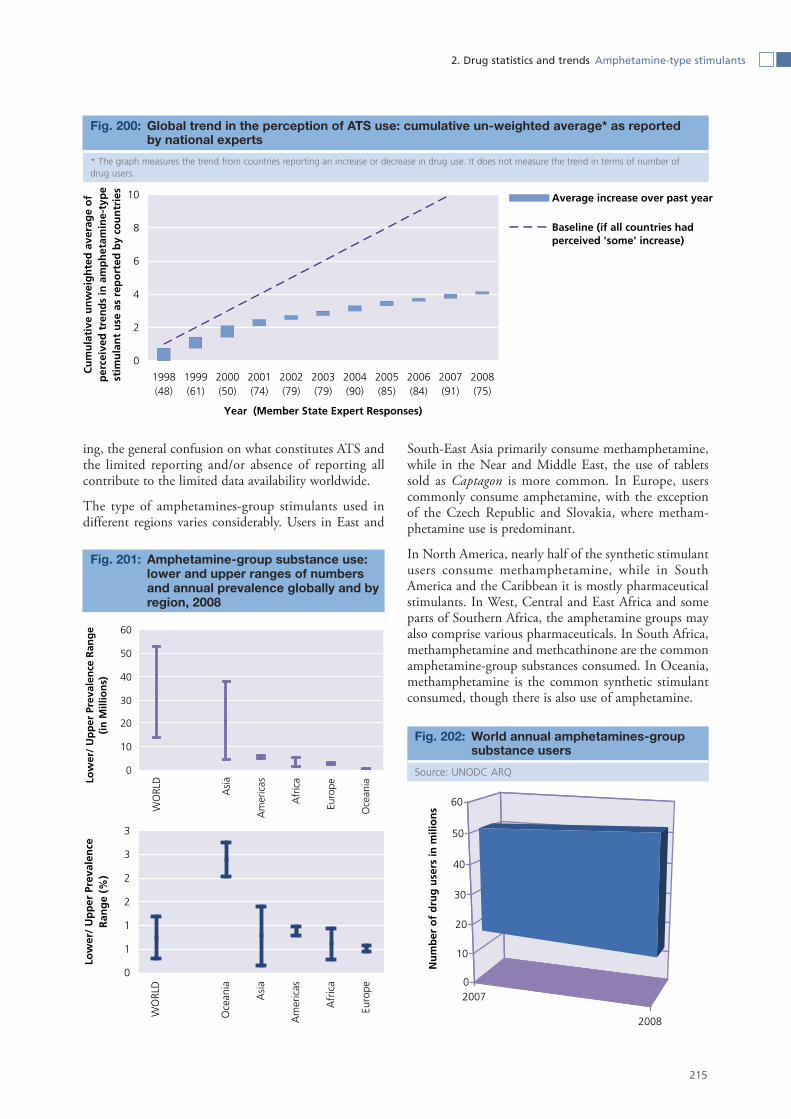
215
2. Drug statistics and trends Amphetamine-type stimulants
ing, the general confusion on what constitutes ATS and the limited reporting and/or absence of reporting all contribute to the limited data availability worldwide.
The type of amphetamines-group stimulants used in different regions varies considerably. Users in East and
South-East Asia primarily consume methamphetamine, while in the Near and Middle East, the use of tablets sold as Captagon is more common. In Europe, users commonly consume amphetamine, with the exception of the Czech Republic and Slovakia, where metham-phetamine use is predominant.
In North America, nearly half of the synthetic stimulant users consume methamphetamine, while in South America and the Caribbean it is mostly pharmaceutical stimulants. In West, Central and East Africa and some parts of Southern Africa, the amphetamine groups may also comprise various pharmaceuticals. In South Africa, methamphetamine and methcathinone are the common amphetamine-group substances consumed. In Oceania, methamphetamine is the common synthetic stimulant consumed, though there is also use of amphetamine.
Global trend in the perception of ATS use: cumulative un-weighted average* as reported Fig. 200: by national experts
* The graph measures the trend from countries reporting an increase or decrease in drug use. It does not measure the trend in terms of number of drug users.
Amphetamine-group substance use: Fig. 201: lower and upper ranges of numbers and annual prevalence globally and by region, 2008
0
10
20
30
40
50
60
WO
RLD
Asi
a
Am
eric
as
Afr
ica
Euro
pe
Oce
aniaLo
wer
/ U
pp
er P
reva
len
ce R
ang
e (i
n M
illio
ns)
0
1
1
2
2
3
3
WO
RLD
Oce
ania
Asi
a
Am
eric
as
Afr
ica
Euro
pe
Low
er/
Up
per
Pre
vale
nce
R
ang
e (%
)
2007
2008
0
10
20
30
40
50
60
Nu
mb
er o
f d
rug
use
rs in
mili
on
s
World annual amphetamines-group Fig. 202: substance users
Source: UNODC ARQ
0
2
4
6
8
10
1998(48)
1999(61)
2000(50)
2001(74)
2002(79)
2003(79)
2004(90)
2005(85)
2006(84)
2007(91)
2008(75)
Year (Member State Expert Responses)
Cu
mu
lati
ve u
nw
eig
hte
d a
vera
ge
of
per
ceiv
ed t
ren
ds
in a
mp
het
amin
e-ty
pe
stim
ula
nt
use
as
rep
ort
ed b
y co
un
trie
s
Average increase over past year
Baseline (if all countries hadperceived 'some' increase)

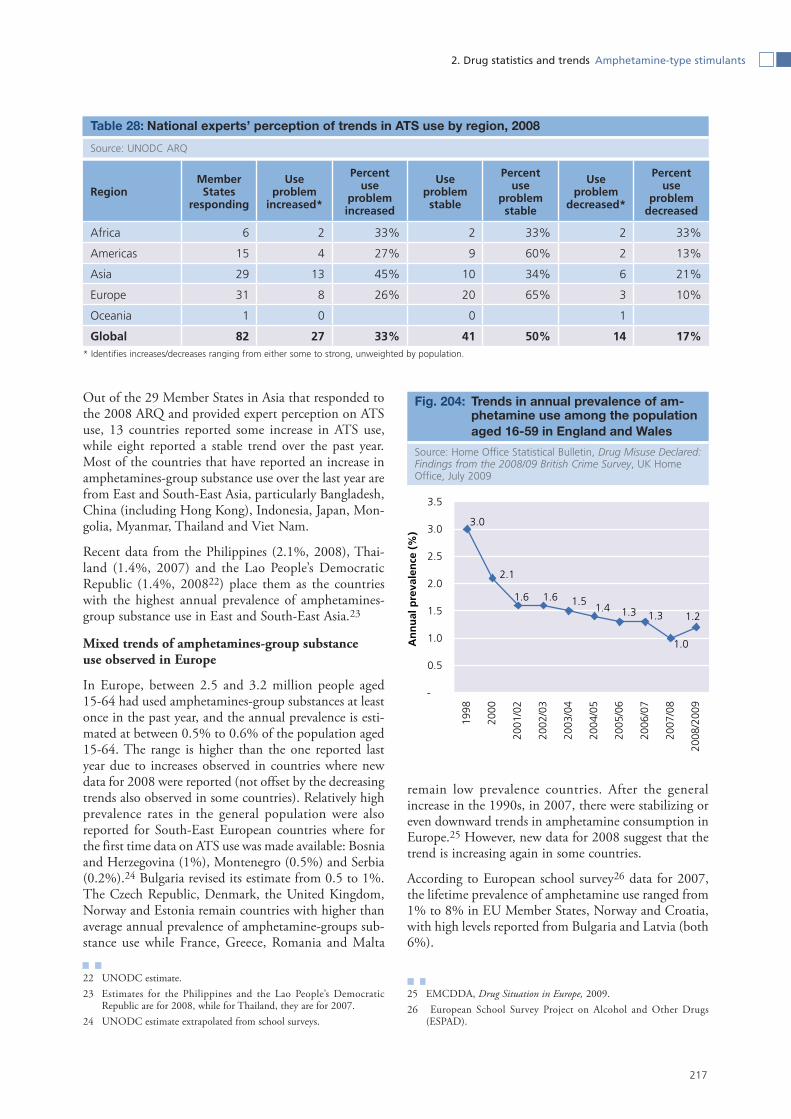
217
2. Drug statistics and trends Amphetamine-type stimulants
Out of the 29 Member States in Asia that responded to the 2008 ARQ and provided expert perception on ATS use, 13 countries reported some increase in ATS use, while eight reported a stable trend over the past year. Most of the countries that have reported an increase in amphetamines-group substance use over the last year are from East and South-East Asia, particularly Bangladesh, China (including Hong Kong), Indonesia, Japan, Mon-golia, Myanmar, Thailand and Viet Nam.
Recent data from the Philippines (2.1%, 2008), Thai-land (1.4%, 2007) and the Lao People’s Democratic Republic (1.4%, 200822) place them as the countries with the highest annual prevalence of amphetamines-group substance use in East and South-East Asia.23
Mixed trends of amphetamines-group substance use observed in Europe
In Europe, between 2.5 and 3.2 million people aged 15-64 had used amphetamines-group substances at least once in the past year, and the annual prevalence is esti-mated at between 0.5% to 0.6% of the population aged 15-64. The range is higher than the one reported last year due to increases observed in countries where new data for 2008 were reported (not offset by the decreasing trends also observed in some countries). Relatively high prevalence rates in the general population were also reported for South-East European countries where for the first time data on ATS use was made available: Bosnia and Herzegovina (1%), Montenegro (0.5%) and Serbia (0.2%).24 Bulgaria revised its estimate from 0.5 to 1%. The Czech Republic, Denmark, the United Kingdom, Norway and Estonia remain countries with higher than average annual prevalence of amphetamine-groups sub-stance use while France, Greece, Romania and Malta
22 UNODC estimate.23 Estimates for the Philippines and the Lao People’s Democratic
Republic are for 2008, while for Thailand, they are for 2007.24 UNODC estimate extrapolated from school surveys.
remain low prevalence countries. After the general increase in the 1990s, in 2007, there were stabilizing or even downward trends in amphetamine consumption in Europe.25 However, new data for 2008 suggest that the trend is increasing again in some countries.
According to European school survey26 data for 2007, the lifetime prevalence of amphetamine use ranged from 1% to 8% in EU Member States, Norway and Croatia, with high levels reported from Bulgaria and Latvia (both 6%).
25 EMCDDA, Drug Situation in Europe, 2009.26 European School Survey Project on Alcohol and Other Drugs
(ESPAD).
National experts’ perception of trends in ATS use by region, 2008Table 28:
Source: UNODC ARQ
Trends in annual prevalence of am-Fig. 204: phetamine use among the population aged 16-59 in England and Wales
Source: Home Office Statistical Bulletin, Drug Misuse Declared: Findings from the 2008/09 British Crime Survey, UK Home Office, July 2009
1.2
1.0
1.31.31.41.51.61.6
2.1
3.0
-
0.5
1.0
1.5
2.0
2.5
3.0
3.5
1998
2000
2001
/02
2002
/03
2003
/04
2004
/05
2005
/06
2006
/07
2007
/08
2008
/200
9
An
nu
al p
reva
len
ce (
%)
RegionMember States
responding
Use problem
increased*
Percent use
problem increased
Use problem stable
Percent use
problem stable
Use problem
decreased*
Percent use
problem decreased
Africa 6 2 33% 2 33% 2 33%
Americas 15 4 27% 9 60% 2 13%
Asia 29 13 45% 10 34% 6 21%
Europe 31 8 26% 20 65% 3 10%
Oceania 1 0 0 1
Global 82 27 33% 41 50% 14 17%* Identifies increases/decreases ranging from either some to strong, unweighted by population.


220
World Drug Report 2010
While the treatment demand for amphetamine-group substances is generally low in Europe, it is particularly high (64% of all treatments in 2008) in the Czech Republic. This reflects the country’s high prevalence of methamphetamine use (1.7% among the general popu-lation in 2008), the highest in Europe. In Slovakia, the percentage of treatment admissions for methampheta-mine is also high (32%), suggesting that despite the relatively low prevalence of methamphetamine use reported in 2006 (0.3% of the population aged 15-64), problem drug use related to it is sizable. In these two countries, injection is the most commonly reported route of administration for methamphetamine.27
27 EMCDDA, Drug Situation in Europe, 2009.
In South Africa, amphetamine-group substances use is increasing, while there is little information from most other parts of the African region
In Africa, between 1.5 and 5.2 million people are esti-mated to have used amphetamine-group substances in the past year, an increase from the 1.4 - 4 million people estimated for 2007. The wide range in the estimates is due to the lack of recent or reliable estimates in West, Central and East Africa. Recent annual prevalence esti-mates in Africa are available from South Africa (0.7%-1.4%, 2008), Egypt (0.4%-0.5%, 2006) and Zambia (0.1%, 2003). The higher range level in 2008 is mainly due to an increase observed in South Africa, where the annual prevalence increased from a range of 0.5%-0.8% in 2006 to 0.7%-1.4% in 2008. Within South Africa, the use of methamphetamine remains particularly high in Cape Town, where methamphetamine remained the
Trends in amphetamines-group substance use among the population aged 15-64 Fig. 205: in European countries where new information was reported in 2008 or 2009
Source: UNODC (for Scotland the age group is 16-64)
ESPAD 2007: Lifetime prevalence of amphetamines use among students (aged 15-16) Fig. 206:
1
0.3
0.7
1.3
0.7
1.21.3
1
1.4
1
2.2
1.4
1.1
0.7
1.7
0
0.5
1
1.5
2
2.5
Lith
uani
a '0
3
Lith
uani
a '0
4
Lith
uani
a '0
8
Den
mar
k "0
0
Den
mar
k '0
5
Den
mar
k '0
8
Esto
nia
'03
Esto
nia
'08
Scot
land
'03
Scot
land
'04
Scot
land
'06
Scot
land
'09
Cze
ch R
epub
lic '0
2
Cze
ch R
epub
lic '0
4
Cze
ch R
epub
lic '0
8
An
nau
l pre
vale
nce
(%
)
6 6
5 5 5 5
4 4 4 4 4
3 3 3 3 3 3
2 2 2 2 2 2 2
1 1 1
0
1
2
3
4
5
6
7
Bulg
aria
Latv
ia
Ger
man
y
Mal
ta
Belg
ium
Den
mar
k
Italy
Fran
ce
Pola
nd
Hun
gary
Esto
nia
Gre
ece
Cyp
rus
Lith
uani
a
Spai
n
Irela
nd
Cze
ch R
epub
lic
Cro
atia
Port
ugal
Swed
en
Slov
enia
Net
herla
nds
Uni
ted
Kin
gdom
Slov
akia
Nor
way
Rom
ania
Finl
and
lifet
ime
pre
vale
nce
of
amp
het
amin
e u
se (
%)

221
2. Drug statistics and trends Amphetamine-type stimulants
most common primary drug reported by treatment patients in the first half of 2009.28
Decreasing trends in North America
Amphetamine-group substance use remains high in North America, though recent survey data suggest a decline in the use of amphetamines. The annual preva-lence of all stimulants use in the United States among the population aged 12 years and older was reported as 1.1% in 2008; a further decline from 1.2% in 2007 and 1.5% in 2006.29
28 Pluddemann A., Parry C., Bhana A., Dada S., and Fourie D., Alcohol and Drug Abuse Trends: January – June 2009, Phase 26 South Afri-can Community Epidemiology Network on Drug Use (November 2009).
29 Substance Abuse and Mental Health Services Administration, Results from the 2008 National Survey on Drug Use and Health: National
A decrease in the annual prevalence of methampheta-mine use was also observed among young adults aged 18-25, from 0.6% in 2002 to 0.2% in 2008.30 While methamphetamine use in the general US workforce also dropped from 0.14% in 2007 to 0.11% in 2008, the proportion of positive urine test for amphetamine increased from 0.40% to 0.45% in the same period.31
Findings,,US Department of Health and Human Services, Office of Applied Studies, 2009.
30 Ibid.31 Quest Diagnostics, Drug Testing Index, May 2009.
Treatment demand for methampheta-Fig. 207: mine in the Czech Republic, 2002-2008
Source: Czech National Monitoring Centre for Drugs and Drug Addiction, Annual Report: The Czech Republic, 2008 Drug Sit-uation, September 2009
Annual amphetamine-group users in Fig. 208: Africa
Source: UNODC ARQUnited States: Annual prevalence of Fig. 210: stimulants and methamphetamine use in the population aged 12 and older, 2002-2008
Source: Substance Abuse and Mental Health Services Adminis-tration. Results from the 2008 National Survey on Drug Use and Health: National Findings
51.6%55.9%
59.0% 60.3% 62.4% 64.1% 63.7%
0%
10%
20%
30%
40%
50%
60%
70%
2002 2003 2004 2005 2006 2007 2008
% o
f m
eth
amp
het
amin
e o
f to
tal
in t
reat
men
t
2007
2008
0
1
2
3
4
5
6
Nu
mb
er o
f d
rug
use
rsin
mili
on
s
0
5
10
15
20
25
30
35
40
45
2001
a20
01 b
2002
a20
02b
2003
a20
03b
2004
a20
04b
2005
a20
05b
2006
a20
06b
2007
a20
07b
2008
a20
08b
2009
a% o
f m
eth
amp
het
amin
e as
pri
mar
yd
rug
in t
reat
men
t
South Africa: trends in treatment Fig. 209: demand in Cape Town with metham-phetamine as the primary substance, % of all drug treatment, 2001-2009
Source: South Africa Community Epidemiology Network on Drug Use (data are reported bi-annually – (a) represents the first half and; (b) the second half of the year)
1.41.3
1.41.3
1.5
1.21.1
0.7 0.70.8
0.70.8
0.5
0.3
0
0.2
0.4
0.6
0.8
1
1.2
1.4
1.6
2002 2003 2004 2005 2006 2007 2008
An
nu
al p
reva
len
ce (
%)
Stimulants (all types) Methamphetamine
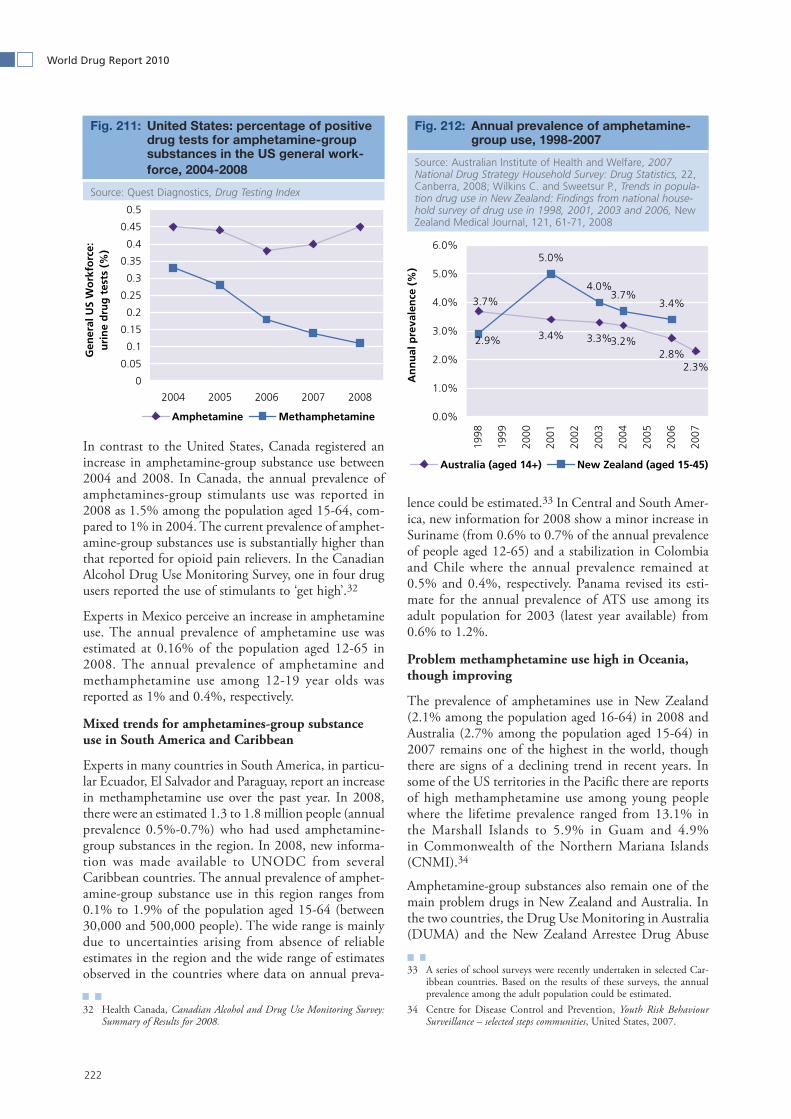
222
World Drug Report 2010
In contrast to the United States, Canada registered an increase in amphetamine-group substance use between 2004 and 2008. In Canada, the annual prevalence of amphetamines-group stimulants use was reported in 2008 as 1.5% among the population aged 15-64, com-pared to 1% in 2004. The current prevalence of amphet-amine-group substances use is substantially higher than that reported for opioid pain relievers. In the Canadian Alcohol Drug Use Monitoring Survey, one in four drug users reported the use of stimulants to ‘get high’.32
Experts in Mexico perceive an increase in amphetamine use. The annual prevalence of amphetamine use was estimated at 0.16% of the population aged 12-65 in 2008. The annual prevalence of amphetamine and methamphetamine use among 12-19 year olds was reported as 1% and 0.4%, respectively.
Mixed trends for amphetamines-group substance use in South America and Caribbean
Experts in many countries in South America, in particu-lar Ecuador, El Salvador and Paraguay, report an increase in methamphetamine use over the past year. In 2008, there were an estimated 1.3 to 1.8 million people (annual prevalence 0.5%-0.7%) who had used amphetamine-group substances in the region. In 2008, new informa-tion was made available to UNODC from several Caribbean countries. The annual prevalence of amphet-amine-group substance use in this region ranges from 0.1% to 1.9% of the population aged 15-64 (between 30,000 and 500,000 people). The wide range is mainly due to uncertainties arising from absence of reliable estimates in the region and the wide range of estimates observed in the countries where data on annual preva-
32 Health Canada, Canadian Alcohol and Drug Use Monitoring Survey: Summary of Results for 2008.
lence could be estimated.33 In Central and South Amer-ica, new information for 2008 show a minor increase in Suriname (from 0.6% to 0.7% of the annual prevalence of people aged 12-65) and a stabilization in Colombia and Chile where the annual prevalence remained at 0.5% and 0.4%, respectively. Panama revised its esti-mate for the annual prevalence of ATS use among its adult population for 2003 (latest year available) from 0.6% to 1.2%.
Problem methamphetamine use high in Oceania, though improving
The prevalence of amphetamines use in New Zealand (2.1% among the population aged 16-64) in 2008 and Australia (2.7% among the population aged 15-64) in 2007 remains one of the highest in the world, though there are signs of a declining trend in recent years. In some of the US territories in the Pacific there are reports of high methamphetamine use among young people where the lifetime prevalence ranged from 13.1% in the Marshall Islands to 5.9% in Guam and 4.9% in Commonwealth of the Northern Mariana Islands (CNMI).34
Amphetamine-group substances also remain one of the main problem drugs in New Zealand and Australia. In the two countries, the Drug Use Monitoring in Australia (DUMA) and the New Zealand Arrestee Drug Abuse
33 A series of school surveys were recently undertaken in selected Car-ibbean countries. Based on the results of these surveys, the annual prevalence among the adult population could be estimated.
34 Centre for Disease Control and Prevention, Youth Risk Behaviour Surveillance – selected steps communities, United States, 2007.
United States: percentage of positive Fig. 211: drug tests for amphetamine-group substances in the US general work-force, 2004-2008
Source: Quest Diagnostics, Drug Testing Index
Annual prevalence of amphetamine-Fig. 212: group use, 1998-2007
Source: Australian Institute of Health and Welfare, 2007 National Drug Strategy Household Survey: Drug Statistics, 22, Canberra, 2008; Wilkins C. and Sweetsur P., Trends in popula-tion drug use in New Zealand: Findings from national house-hold survey of drug use in 1998, 2001, 2003 and 2006, New Zealand Medical Journal, 121, 61-71, 2008
0
0.05
0.1
0.15
0.2
0.25
0.3
0.35
0.4
0.45
0.5
2004 2005 2006 2007 2008
Gen
eral
US
Wo
rkfo
rce:
u
rin
e d
rug
tes
ts (
%)
Amphetamine Methamphetamine
3.4% 3.3%3.2%2.8%
2.3%
3.7%3.7%
3.4%
4.0%
5.0%
2.9%
0.0%
1.0%
2.0%
3.0%
4.0%
5.0%
6.0%
1998
1999
2000
2001
2002
2003
2004
2005
2006
2007
An
nu
al p
reva
len
ce (
%)
Australia (aged 14+) New Zealand (aged 15-45)

223
2. Drug statistics and trends Amphetamine-type stimulants
Monitoring (NZ-ADAM) programmes measure drug and alcohol use among people who have recently been detained by police. In 2008, 21% of detainees across Australia had tested positive for methamphetamine – although this shows a decline from the previous year (27% in 2007) and the lowest positive test rate for methamphetamine since 1999.35 Similarly in New Zea-land, among the police detainees who were tested for drugs, methamphetamine and amphetamine were the second and third most commonly detected drugs (10% and 9%, respectively).36 In Australia, the most com-monly injected substances were also amphetamines-group substances, where 67% of the injecting drug users interviewed had injected some form of methampheta-mine in the preceding six months.37
‘Ecstasy’-group consumption
Globally, between 10.5 and 25.8 million people were estimated to have used ‘ecstasy’ group38 substances (pri-marily MDMA and its analogues) in the previous year. This range compares with a range of 11.6 - 23.5 million reported for 2007. The highest prevalence of ‘ecstasy’ use remains in Oceania (3.6%-4%) while in absolute terms, Europe had the highest number of users in 2008,
35 Gaffney A., Jones W., Sweeney J. and Payne J., Drug use Monitoring in Australia: 2008 annual report on drug use among police detainees, AIC Monitoring Reports 2009.
36 Hales J. and Manser J., Annual Report 2008, New Zealand Police ADAM, Health Outcomes International Pvt. Ltd, October 2008.
37 National Alcohol and Drugs Research Centre, Australian drug trends 2009: Findings from the Illicit Drug Reporting System (IDRS), Univer-sity of New South Wales.
38 Reports show that unbeknown to many ‘ecstasy’ users, what is sold to them as ‘ecstasy’ (MDMA) is often a combination of many psychoac-tive substances, such as methamphetamine and ketamine. Ampheta-mines and Ecstasy: 2008 Global ATS Assessment (United Nations publication, Sales No. E.08.XI.12).
with some 3.9 - 4.1 million people aged 15-64 estimated to have used ‘ecstasy’ at least once in the previous year. For most parts of Asia as well as Africa, information on ‘ecstasy’ use is missing, which introduces a high level of uncertainty in the global estimates.
Many countries in Asia report an increase in ‘ecstasy’ use
In 2008, 56 Member States provided information on experts’ perception on trends in ‘ecstasy’ use. Experts in half of these countries thought that ‘ecstasy’ use had been stable in 2008, while one third considered that it had increased. Most of the countries/territories report-ing an increase were in Asia – in particular Bangladesh, China including Macao, Indonesia, Mongolia, Pakistan and Viet Nam. New estimates provided by Indonesia on the annual prevalence of ‘ecstasy’ use among the popula-tion aged 15-64, however, showed a slight decrease from 0.3% in 2005 to 0.2% in 2008.
Mixed trends for ‘ecstasy’ use reported in Europe
In Europe the annual prevalence of ‘ecstasy’ use is esti-mated at 0.7% of the population aged 15-64. A higher prevalence rate as well as a higher total number of ‘ecstasy’ users are reported from West and Central Europe as compared to East and South-East Europe. The high prevalence countries remain the Czech Repub-lic, Slovakia, Estonia, the United Kingdom and Latvia, while Romania, Greece and Poland have negligible or quite low ‘ecstasy’ use. In those countries where data on annual prevalence in the adult population was available for 2008, the picture is mixed. Some registered an increase (the Czech Republic, Denmark, England and Wales, the former Yugoslav Republic of Macedonia and Slovakia) and others a decrease (Estonia, Lithuania and Scotland).
Australia: percentage of injecting drug users who reported use of any form of Fig. 213: methamphetamine in the preceding six months, 2003-2009
Source: National Alcohol and Drugs Research Centre, Australian drug trends 2009: Findings from the Illicit Drug Reporting System (IDRS) University of New South Wales
76 75 7579
7469 67
55 5360
56 5548 48
3538 39 38
32
2228
575254
46 4943
37
0
10
20
30
40
50
60
70
80
90
2003 2004 2005 2006 2007 2008 2009
IDU
wh
o r
epo
rted
use
(%
)
Methamphetamine
Speed powder
Base
Crystal methamphetamine

224
World Drug Report 2010
Compared to methamphetamine and amphetamine, use of ‘ecstasy’ is much more common among young adults aged 15-34 (national estimates ranging between 0.1% – 3.1% of past year amphetamine prevalence, compared to 0.2% – 7.7% for ‘ecstacy’ use). Most of the countries, though, have reported a decreasing or stabilizing trend of ‘ecstasy’ use among young adults.39
The school survey conducted under the European
39 EMCDDA, Annual report 2008: the state of the drug problems in Europe, Lisbon 2008.
School Survey Project on Alcohol and Other Drugs (ESPAD) and other school surveys conducted in 2007 suggest, overall, little change in the levels of ‘ecstasy’ use among students aged 15 to 16. Compared to 2003, overall increases in ‘ecstasy’ use was observed in 12 coun-tries, with Latvia, Bulgaria, Slovakia, Denmark, Hun-gary and Malta showing marked increases over this period. The Czech Republic, Portugal and Croatia reported substantial decreases, while ‘ecstasy’ use remained stable in the remaining countries.40
40 Hibel B., Adersson B., Bjarnason T., Ahlstrom S., Balakireva O.,
Estimated number of people who used ‘ecstasy’ at least once in the past year and Table 29: prevalence among the population aged 15-64, by region, 2008
‘Ecstasy’ use: lower and upper ranges of numbers and annual prevalence globally and Fig. 214: by region, 2008
Region/ Subregion (Ecstasy-group)
Estimated number of
users annually (lower)
-
Estimated number of
users annually (upper)
Percent of population age 15-64
(lower)
-
Percent of population age 15-64
(upper)
Africa 350,000 - 1,930,000 0.1 - 0.4
Eastern Africa Subregional estimate cannot be calculatedNorth Africa Subregional estimate cannot be calculatedSouthern Africa 220,000 - 420,000 0.2 - 0.4West and Central Africa Subregional estimate cannot be calculated
Americas 3,040,000 - 3,280,000 0.5 - 0.5
Caribbean 10,000 - 240,000 0.1 - 0.9Central America 20,000 - 30,000 0.1 - 0.1North America 2,490,000 - 2,490,000 0.8 - 0.8South America 510,000 - 530,000 0.2 - 0.2
Asia 2,370,000 - 15,620,000 0.1 - 0.6
Central Asia Subregional estimate cannot be calculatedEast/ South-East Asia 1,460,000 - 6,850,000 0.1 - 0.5Near and Middle East Subregional estimate cannot be calculatedSouth Asia Subregional estimate cannot be calculated
Europe 3,850,000 - 4,080,000 0.7 - 0.7
Eastern/ South-East Europe 1,680,000 - 1,890,000 0.6 - 0.6Western/ Central Europe 2,180,000 - 2,190,000 0.8 - 0.8
Oceania 840,000 - 910,000 3.6 - 4.0
Global 10,450,000 - 25,820,000 0.2 - 0.6
0
5
10
15
20
25
30
WO
RLD
Asi
a
Euro
pe
Am
eric
as
Afr
ica
Oce
ania
Low
er/U
pp
er P
reva
len
ce R
ang
e (i
n M
illio
ns)
0
1
2
3
4
WO
RLD
Oce
ania
Euro
pe
Am
eric
as
Asi
a
Afr
ica
Low
er/U
pp
er P
reva
len
ce
Ran
ge
(%)

225
2. Drug statistics and trends Amphetamine-type stimulants
‘Ecstasy’ use declined in North America after 2001, but there are early signs that it may recover
In the United States, after a decline in the annual preva-lence of ‘ecstasy’ use from 1.3% in 2002 to 0.9% in 2003 among the population aged 12 and older, the trends have remained stable over the past five years. However, there are signs of a possible resurgence. The annual prevalence of ‘ecstasy’ use among 10th grade students in the United States fell from 6.2% in 2001 to 2.4% in 2004, and has been increasing since then. The annual prevalence among 8th and 12th grade students, though, remains stable. It is considered that diminishing perceived risks and disapproval among the students in US may cause a rebound in ecstasy use.41 In Canada, the annual prevalence of ‘ecstasy’ use has increased from 1.3% in 2004 to 1.7% in 2008.
Kokkevei A. and Morgan M., The ESPAD Report: Alcohol and other Drug Use Among Students in 35 European countries, 2003, 2007.
41 National Institute on Drug Abuse Monitoring the Future, Overview of Key Findings 2008 (Bethesda, Maryland, USA, 2009).
National experts’ perception of trends in ‘ecstasy’ use by region, 2008Table 30:
Source: UNODC ARQ
Region
Member States
providing perception
data
Member States
perception response
rate
Use problem
increased*
Percent use
problem increased
Use problem stable
Percent use
problem stable
Use problem
decreased*
Percent use
problem decreased
Africa 4 8% 1 25% 3 75% 0 0%
Americas 12 34% 1 8% 11 92% 0 0%
Asia 15 33% 8 53% 4 27% 3 20%
Europe 24 53% 7 29% 12 50% 5 21%
Oceania 1 7% 1 0 0
Global 56 29% 18 32% 30 54% 8 14%
* Identifies increases/ decreases ranging from either some to strong, unweighted by population.
Trends in annual prevalence of ‘ecstasy’ use among young adults (aged 15-34)Fig. 215:
Source: EMCDDA, Annual report 2008: the state of the drug problems in Europe, Lisbon 2008
0.30.7 0.7
0.91.2
0.91.1
1.61.9
1.2
3.8
2.92.5
2.32.6
2.0
3.12.7
4.14.5
4.34.1
3.73.4
3.9
3.1
0.4 0.5 0.6 0.5 0.3 0.4 0.7 0.8 0.4
1.9
1.41.2 1.2 1.2
0.9
1.6 1.61.8
2.22.0 2.0
1.81.6
1.81.5
0.20.0
0.5
1.0
1.5
2.0
2.5
3.0
3.5
4.0
4.5
5.0
Italy
'01
Italy
'03
Italy
'05
Italy
'07
Den
mar
k '0
0
Den
mar
k '0
5
Den
mar
k '0
8
Ger
man
y '0
0
Ger
man
y '0
3
Ger
man
y '0
6
Spai
n '0
1
Spai
n '0
3
Spai
n '0
6
Spai
n '0
8
Slov
akia
'00
Slov
akia
'02
Slov
akia
'04
Slov
akia
'06
Engl
and
'00
Engl
and
'02
Engl
and
'03
Engl
and
'04
Engl
and
'05
Engl
and
'06
Engl
and
'07
Engl
and
'08
An
nu
al p
reva
len
ce (
%)
Age 15-34Age 15-64
0 2 4 6 8
Latvia
Bulgaria
Estonia
Slovakia
Belgium
Denmark
Hungary
France
Malta
Cyprus
Lithuania
Finland
Annual prevalence (%)
20072003
European countries with an increase Fig. 216: in ‘ecstasy’ use among students aged 15-16
Source: ESPAD
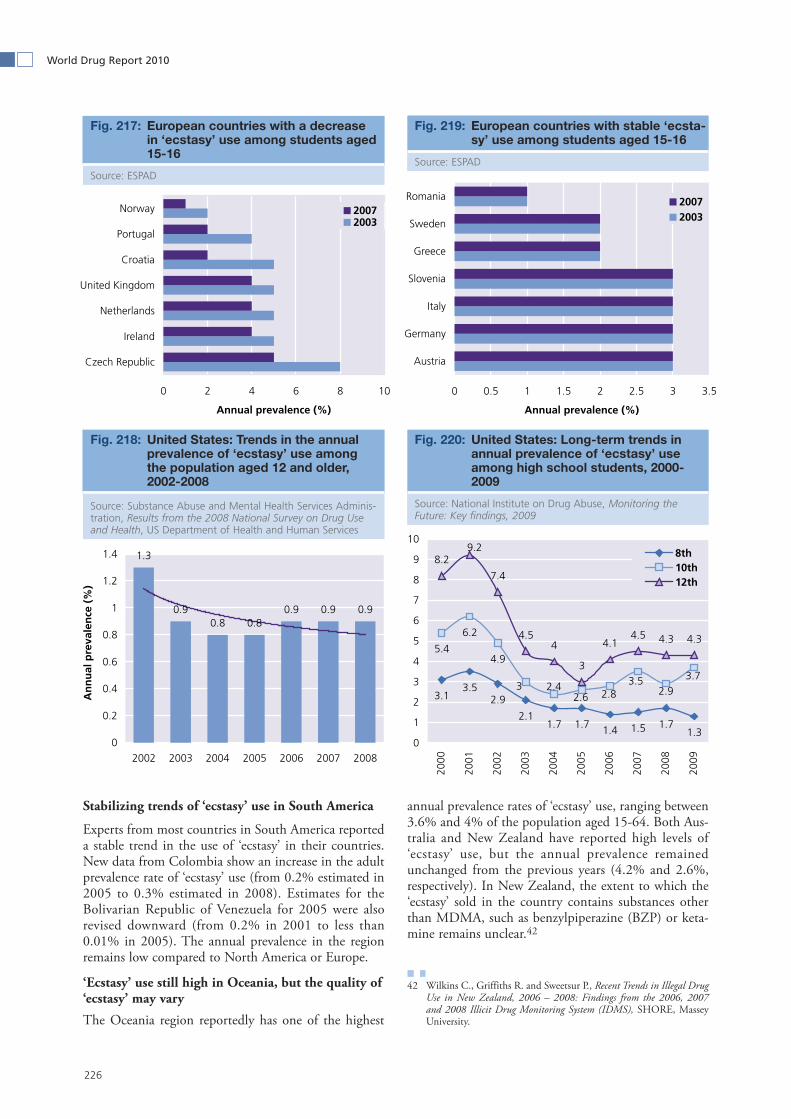
226
World Drug Report 2010
Stabilizing trends of ‘ecstasy’ use in South America
Experts from most countries in South America reported a stable trend in the use of ‘ecstasy’ in their countries. New data from Colombia show an increase in the adult prevalence rate of ‘ecstasy’ use (from 0.2% estimated in 2005 to 0.3% estimated in 2008). Estimates for the Bolivarian Republic of Venezuela for 2005 were also revised downward (from 0.2% in 2001 to less than 0.01% in 2005). The annual prevalence in the region remains low compared to North America or Europe.
‘Ecstasy’ use still high in Oceania, but the quality of ‘ecstasy’ may vary
The Oceania region reportedly has one of the highest
annual prevalence rates of ‘ecstasy’ use, ranging between 3.6% and 4% of the population aged 15-64. Both Aus-tralia and New Zealand have reported high levels of ‘ecstasy’ use, but the annual prevalence remained unchanged from the previous years (4.2% and 2.6%, respectively). In New Zealand, the extent to which the ‘ecstasy’ sold in the country contains substances other than MDMA, such as benzylpiperazine (BZP) or keta-mine remains unclear.42
42 Wilkins C., Griffiths R. and Sweetsur P., Recent Trends in Illegal Drug Use in New Zealand, 2006 – 2008: Findings from the 2006, 2007 and 2008 Illicit Drug Monitoring System (IDMS), SHORE, Massey University.
European countries with a decrease Fig. 217: in ‘ecstasy’ use among students aged 15-16
Source: ESPAD
United States: Trends in the annual Fig. 218: prevalence of ‘ecstasy’ use among the population aged 12 and older, 2002-2008
Source: Substance Abuse and Mental Health Services Adminis-tration, Results from the 2008 National Survey on Drug Use and Health, US Department of Health and Human Services
0 2 4 6 8 10
Czech Republic
Ireland
Netherlands
United Kingdom
Croatia
Portugal
Norway
Annual prevalence (%)
20072003
0 0.5 1 1.5 2 2.5 3 3.5
Austria
Germany
Italy
Slovenia
Greece
Sweden
Romania
Annual prevalence (%)
20072003
European countries with stable ‘ecsta-Fig. 219: sy’ use among students aged 15-16
Source: ESPAD
0.90.8 0.8
0.9 0.9 0.9
1.3
0
0.2
0.4
0.6
0.8
1
1.2
1.4
2002 2003 2004 2005 2006 2007 2008
An
nu
al p
reva
len
ce (
%)
3.13.5
2.9
2.11.7 1.7 1.4 1.5 1.7
1.3
5.4
6.2
4.9
8.2
7.4
4.54
3
4.14.5 4.3 4.3
3.72.9
3.52.82.6
2.43
9.2
0
1
2
3
4
5
6
7
8
9
10
2000
2001
2002
2003
2004
2005
2006
2007
2008
2009
8th10th12th
United States: Long-term trends in Fig. 220: annual prevalence of ‘ecstasy’ use among high school students, 2000-2009
Source: National Institute on Drug Abuse, Monitoring the Future: Key findings, 2009
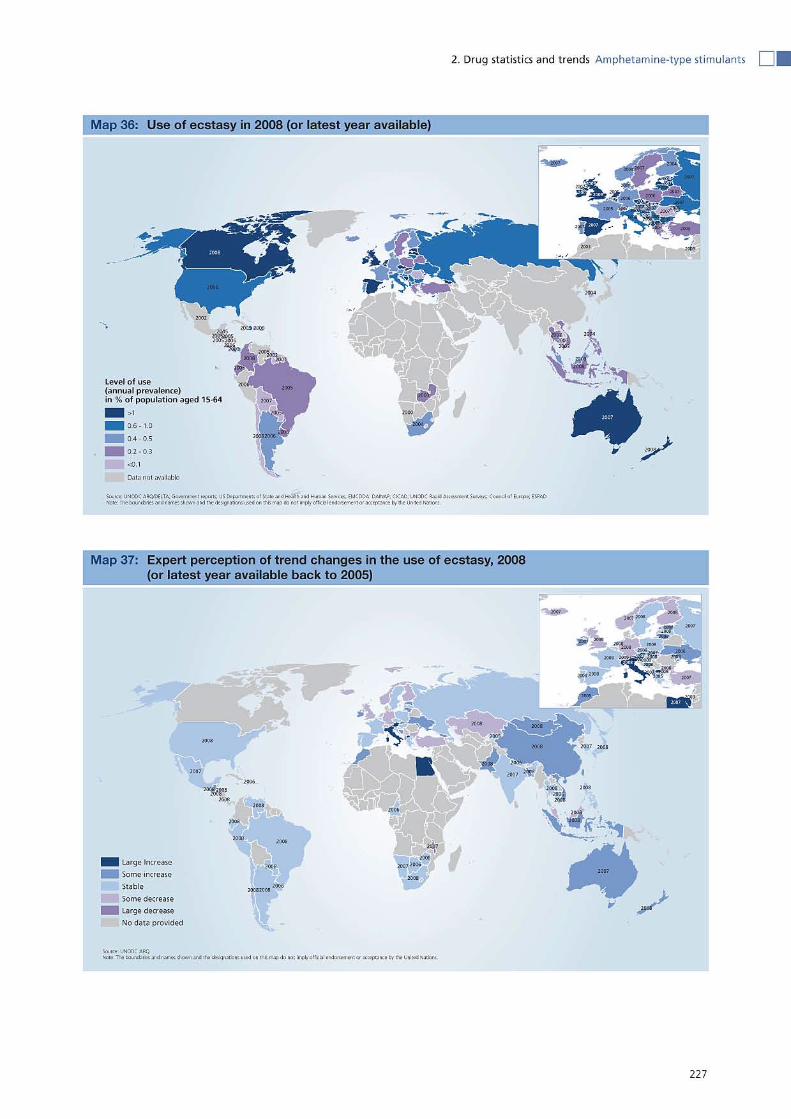

3. The destabilizing influence of drug trafficking on transit countries: The case of cocaine

231
3.0 The destabilizing influence of drug trafficking on transit countries: The case of cocaine
In the past decade, the United Nations has come to recognize the relationship between political instability and organized crime, particularly drug trafficking. The United Nations Convention against Transnational Organized Crime came into effect in late 2003. In 2004, the High-level Panel on Threats, Challenges and Change argued:
One of the core activities of organized criminal groups - drug trafficking – has major security implications… In some regions, the huge profits generated through this activity even rivals some countries’ GDP, thus threaten-ing State authority, economic development and the rule of law.1
This report was followed by the Secretary-General’s report In Larger Freedom, which concludes:
Organized crime contributes to State weakness, impedes economic growth, fuels many civil wars, regularly undermines United Nations peacebuilding efforts and provides financing mechanisms to terrorist groups.2
More recently, in December 2009, the Security Council issued a Presidential Statement on Peace and Security in Africa, which urged the Secretary-General to consider:
…mainstreaming the issue of drug trafficking as a factor in conflict prevention strategies, conflict analysis, integrated missions’ assessment and planning and peacebuilding support.3
Taking up this challenge, Secretary-General Ban Ki-moon, speaking at the African Union summit in January 2010, concluded, “Drug trafficking is … a rising threat to international peace and security in Africa.”4 And in February 2010, the Security Council noted with con-cern “the serious threats posed in some cases by drug trafficking and transnational organized crime to interna-tional security in different regions of the world.”5
1 High-level Panel on Threats, Challenges and Change, A more secure world: Our shared responsibility. United Nations, 2004, p.53.
2 Report of the Secretary-General, In larger freedom: towards develop-ment, security and human rights for all. United Nations General Assembly, Fifty-ninth session (A/59/2005), 21 March 2005, p. 27.
3 S/PRST/2009/32.4 Secretary-General Ban Ki-moon, Remarks to the Summit of the
African Union – “An Agenda for Prosperity and Peace,” Addis Ababa, 31 January 2010.
5 S/PRST/2010/4.
Two types of impact
What is behind these assertions? How, exactly, can drug trafficking pose a threat to stability? There are at least two ways. The first involves countries where insurgents and illegal armed groups draw funds from taxing, or even managing, drug production and trafficking. The second concerns countries that do not do not face such a situation, but where the drug traffickers become pow-erful enough to take on the state through violent con-frontation, high-level corruption, or (usually) both.
Not every country is equally vulnerable to this threat. Drug trafficking is problematic for any country it touches, but it can become particularly destabilizing where there are pre-existing governance issues. The small size of the local economy relative to the value of the drug flow, as the High-level Panel suggested, is also relevant. The two are often related: governments in countries with small economies may have trouble asserting authority over their sovereign territory or developing remote areas of the country; prolonged instability can also keep economies from growing. This is why the focus has increasingly been on Africa, a continent where there are many poor and unstable countries, but where, for a variety of rea-sons, the worst effects of drug trafficking have not yet been experienced. When drug routes pass though African soil, like the recent flow of cocaine though West Africa, the international community is rightly concerned.
Of course, drug trafficking is not unique in this respect. The money gained through all forms of organized crime can cause trouble, and smuggling of contraband (such as cigarettes, diamonds, timber or oil) has been a mainstay of rebel financing for decades. But the drug markets are simply worth more money than those of other contra-band goods, and since they are illicit, drugs remain unambiguously the domain of organized criminals.
It is also true that certain types of drugs are more rele-vant than others. Cannabis and synthetic drugs are produced almost everywhere, so there is limited need for trans-regional trafficking. Cannabis has been suggested as a source of funding for rebel movements in regions as diverse as Casamance (Senegal), Aceh (Indonesia) and southern Nepal. Methamphetamine has been key to funding the ethnic militias in Myanmar. But the most lucrative drug flows originate in poor and unstable areas and end in the richest nations on earth. Cocaine and

232
World Drug Report 2010
heroin are strongly associated with specific sources of supply in poor areas and specific rich consumer coun-tries. The value of these flows and the concentration of production and trafficking intensifies the destabilizing effect.
Almost all the world’s heroin and the vast bulk of the world’s cocaine is produced in countries that have expe-rienced insurgency problems. While both opium poppy and coca bush are optimally productive under particular climatic conditions, they could be grown in a much wider range of countries than is currently the case (and they have been, historically). The production of these drugs is reliant on crops that require large cultivation areas, however, and the international control system has compelled national governments to take strong action against any such cultivation that occurs within their borders. As a result, wide-scale cocaine or heroin pro-duction is only possible in countries where there are stretches of rural area that the state is struggling to fully service and control. These conditions also happen to favour the growth of guerrilla armies.
In the absence of the sort of outside funding found during the Cold War, insurgents and illegal armed groups are often compelled to derive their sustenance from the regions they dominate, and these unstable areas are often already enmeshed in drug trafficking. The money associated with organized crime can be so great that militants may forget about their grievances and focus on satisfying their greed. Even where this is not true, drugs pay for bullets and provide a lifestyle to com-batants that makes them less likely to come to the nego-tiating table. It becomes entirely feasible to make a career out of militancy, and this prolongs civil conflict.
The best examples of this phenomenon are the primary cultivation areas for opium poppy, the crop from which heroin is derived: Afghanistan and Myanmar. In both countries, rebel armies are at least partly funded by the drug trade. Large-scale opium poppy cultivation requires large land areas, and is a highly labour-intensive activity. To generate the heroin needed to satisfy global demand, thousands of hectares and hundreds of thousands of workers must be employed without state interference, and the best deterrent for state interference with this process is a rebel army. Without an active conflict, heroin production can be eliminated, as has been done in a series of countries where insurgency was either absent or had less territorial control, including Turkey, the Islamic Republic of Iran, Pakistan, Thailand, the Lao People’s Democratic Republic, China and Lebanon.
Today, heroin production is strongly associated with insurgent activity: in 2009, Afghanistan was responsible for 90% of global opium production, and 99% of all opium produced there came from just seven provinces in southern and western Afghanistan, where the rebel groups are strongest. But the insurgents do not control
the trafficking activity. Forces aligned to the Taliban garnered at least an estimated US$125 million per year through taxation of cultivation, production and traf-ficking.6 This is about 7% of the value of the trade in Afghanistan. While the drug trade provides some funds for the conflict, more significant is the cover the conflict provides for the drug trade. Those who profit most from heroin trafficking are professional criminals and their network of corrupt officials.
Conflict zones are not the only places where transna-tional organized crime can pose a threat to the state, however. There are a number of areas around the world where criminals have become so powerful that, rather than seeking to evade the government, they begin to directly confront it (though violence) or usurp it (through high-level corruption). The ideal case for traffickers is an authoritarian state where the authority is in their pocket. Under these circumstances, there is little violence and the trafficking may remain completely invisible at the national level, only becoming exposed when interna-tional evidence is brought to bear. Democracies are typ-ically more challenging, requiring both violence and corruption to achieve the traffickers’ objectives.
The violence can assume many forms. Investigators, prosecutors and judges who pursue organized criminals are threatened and killed. Journalists and activists may also be targeted. Portions of the country may effectively drift beyond state control, particularly those that were under-served by the state in the first place. The effect can be very similar to an insurgency, but the two phe-nomena remain distinct, for reasons discussed below.
Efforts to stop trafficking can temporarily exacerbate this violence, particularly where the groups involved have begun to command trafficking turf and achieved some sort of an institutional identity of their own. Under pres-sure, groups may inform on one another, using the state enforcement apparatus to achieve their commercial objec-tives and divert attention from themselves. This typically results in reprisal attacks. Decapitating trafficking groups can trigger succession struggles and the fragmented organizations that result can become prey for rivals. Organized crime becomes disorganized, releasing vio-lence as the structures decompose. This violence can fuel public demands that enforcement be suspended, but this difficult period must be weathered. The smaller groups that result will no longer have the same capacity to chal-lenge the state, and the violence will ultimately decline.
Violence is a visible manifestation of states under stress, but even more damaging is the insidious effect of cor-ruption. Most traffickers seek to pay local officials to
6 It is estimated that the Taliban pocketed around $350-650 million from the opiate trade between 2005 and 2008 through direct taxa-tion of farmers and traffickers, see Addiction, crime and insurgency: the transnational threat of Afghan opium, Vienna: UNODC, 2009, p. 111.

233
The destabilizing influence of drug trafficking on transit countries: The case of cocaine
look the other way. Destabilization is only really a threat when the corruption reaches the top, and those charged with stopping the trafficking begin to actively promote it. This can cause the entire law enforcement mechanism to seize up, as authorities become paralysed by mistrust. The effect on public confidence in government can be devastating, and democratic governments that seek to expose the rot may be penalized at the polls. All the incentives are in place for a downward spiral in govern-ance that can be extremely challenging to reverse.
Organized criminals generally do not seek to topple the state. They mostly want to be left alone to pursue their illicit profits. But they can provoke a reaction that can also threaten long-term prospects for democratic stabil-ity. A clear sign that crime has become a national security threat comes when exceptional legal and security meas-ures are taken, including calling on the military to help re-establish the government’s authority. It is sometimes necessary for states to, in effect, reacquire territory lost to criminal groups, and, in some countries, the military is both more disciplined and less corrupt than the civil-ian police. In a world where international conflicts are becoming less common, using the armed forces to pro-mote internal stability may be seen as cost effective.
Such a move may have popular support in countries where people fear for their safety and are frustrated with the appearance of impunity. This must remain an option of last resort, however: the long-term use of regular military forces to police civilian populations presents risks for the rule of law and civil liberties. Particularly in countries where the military has played an important role in past authoritarian regimes, putting soldiers on the streets can be the first phase in a long-term roll-back of democratic values.
Growing popular discontent with the slow pace of civil-ian enforcement may also trigger a less formal erosion of civic values and the rule of law. Military and police offi-cials may become frustrated with a corrupt or ineffective criminal justice system and begin to engage in extrajudi-cial executions. The public may form civilian “self-pro-tection” groups as well, and these groups may even attract state recognition and support.
Civilian patrols are the normal reaction of citizens who feel they cannot rely on the state to protect them, but they can become the basis for something more sinister. Initially, volunteers may receive ad hoc contributions from the people and businesses they protect, but over time these fees may become mandatory. In unstable areas, a neighbourhood watch can become a protection racket, and, once its absolute authority is established, it can even become a predatory gang. Over time, these paramilitary vigilantes can become as big a security chal-lenge as the criminals they were formed to combat.
These effects can be seen, to some extent, in many
countries where cocaine trafficking is an issue. Of the countries with the highest murder rates in the world today, almost all lie along the key cocaine trafficking routes.
In the past, nearly all of the cocaine produced in the Andean region was consumed in the United States of America, but this has changed. The value of the cocaine market has fallen dramatically in the United States in the last decade, while it has grown remarkably in Europe and the Southern Cone of South America. Today, cocaine flows into three main destination markets: the United States (responsible for about 40% of the cocaine consumed in 2008), Europe (about 25%), and the Southern Cone of South America (10%-20%). Of course, the trafficking routes are also dynamic. Increas-ingly, transit countries are used, including the Bolivarian Republic of Venezuela and Ecuador. In the 1970s and 1980s, the Caribbean was the primary conduit for South American drugs destined for the United States; today, it
Global cocaine flows, 1998 and 2008Map 1:
Source: UNODC Word Drug Report, 2009 and UNODC calculations, informed by US ONDCP, Cocaine Consumption Estimates Methodology, September 2008 (internal paper)
ANDEANREGION
ANDEANREGION
USA
CanadaEurope
Mexico
USA
CanadaEurope
Brazil
Mexico
B.R. of Venezuela
Caribbean
Atlantic andWestern Caribbean
267
63
9
12
165
124
17
14
Cocaine trafficking* (in metric tons)
*main routes
140
60
15
Cocaine consumption (in metric tons)
Main cocaine producers
6
1998
2008
UN
OD
C /
SCIE
NC
ES P
O
WestAfrica
Southern Africa
PacificCaribbean
Pacific
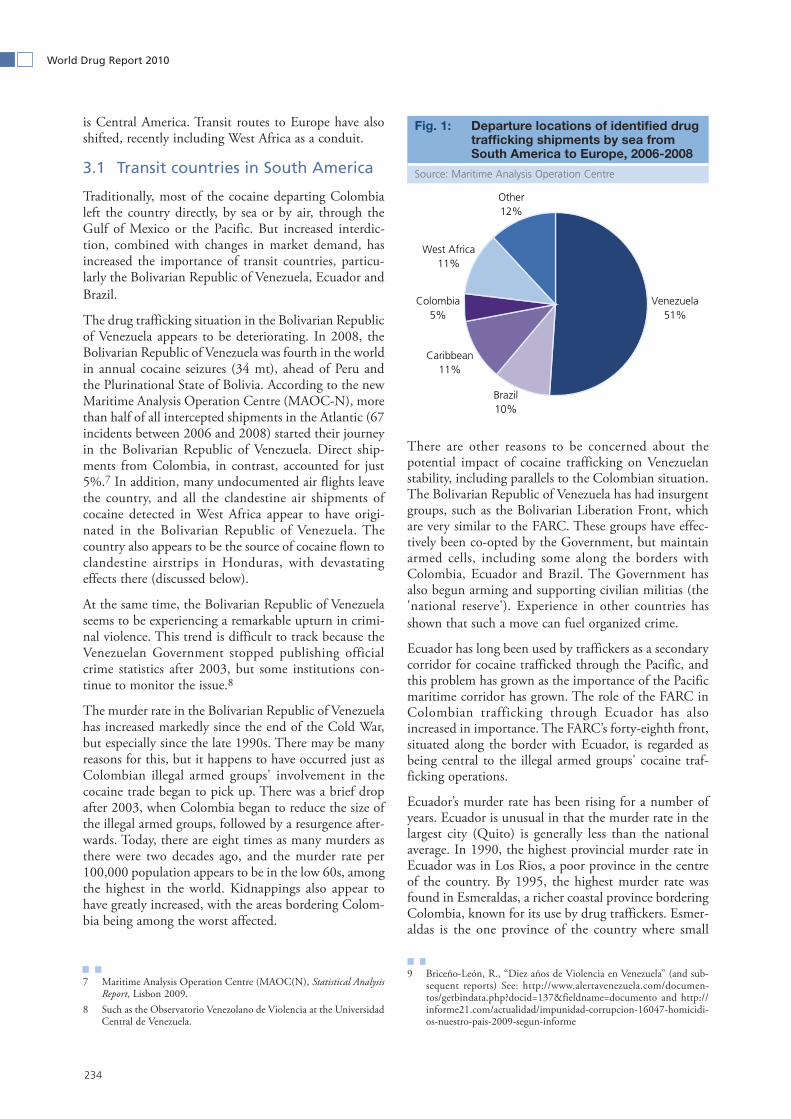
234
World Drug Report 2010
is Central America. Transit routes to Europe have also shifted, recently including West Africa as a conduit.
Transit countries in South America3.1
Traditionally, most of the cocaine departing Colombia left the country directly, by sea or by air, through the Gulf of Mexico or the Pacific. But increased interdic-tion, combined with changes in market demand, has increased the importance of transit countries, particu-larly the Bolivarian Republic of Venezuela, Ecuador and Brazil.
The drug trafficking situation in the Bolivarian Republic of Venezuela appears to be deteriorating. In 2008, the Bolivarian Republic of Venezuela was fourth in the world in annual cocaine seizures (34 mt), ahead of Peru and the Plurinational State of Bolivia. According to the new Maritime Analysis Operation Centre (MAOC-N), more than half of all intercepted shipments in the Atlantic (67 incidents between 2006 and 2008) started their journey in the Bolivarian Republic of Venezuela. Direct ship-ments from Colombia, in contrast, accounted for just 5%.7 In addition, many undocumented air flights leave the country, and all the clandestine air shipments of cocaine detected in West Africa appear to have origi-nated in the Bolivarian Republic of Venezuela. The country also appears to be the source of cocaine flown to clandestine airstrips in Honduras, with devastating effects there (discussed below).
At the same time, the Bolivarian Republic of Venezuela seems to be experiencing a remarkable upturn in crimi-nal violence. This trend is difficult to track because the Venezuelan Government stopped publishing official crime statistics after 2003, but some institutions con-tinue to monitor the issue.8
The murder rate in the Bolivarian Republic of Venezuela has increased markedly since the end of the Cold War, but especially since the late 1990s. There may be many reasons for this, but it happens to have occurred just as Colombian illegal armed groups' involvement in the cocaine trade began to pick up. There was a brief drop after 2003, when Colombia began to reduce the size of the illegal armed groups, followed by a resurgence after-wards. Today, there are eight times as many murders as there were two decades ago, and the murder rate per 100,000 population appears to be in the low 60s, among the highest in the world. Kidnappings also appear to have greatly increased, with the areas bordering Colom-bia being among the worst affected.
7 Maritime Analysis Operation Centre (MAOC(N), Statistical Analysis Report, Lisbon 2009.
8 Such as the Observatorio Venezolano de Violencia at the Universidad Central de Venezuela.
There are other reasons to be concerned about the potential impact of cocaine trafficking on Venezuelan stability, including parallels to the Colombian situation. The Bolivarian Republic of Venezuela has had insurgent groups, such as the Bolivarian Liberation Front, which are very similar to the FARC. These groups have effec-tively been co-opted by the Government, but maintain armed cells, including some along the borders with Colombia, Ecuador and Brazil. The Government has also begun arming and supporting civilian militias (the 'national reserve'). Experience in other countries has shown that such a move can fuel organized crime.
Ecuador has long been used by traffickers as a secondary corridor for cocaine trafficked through the Pacific, and this problem has grown as the importance of the Pacific maritime corridor has grown. The role of the FARC in Colombian trafficking through Ecuador has also increased in importance. The FARC’s forty-eighth front, situated along the border with Ecuador, is regarded as being central to the illegal armed groups' cocaine traf-ficking operations.
Ecuador’s murder rate has been rising for a number of years. Ecuador is unusual in that the murder rate in the largest city (Quito) is generally less than the national average. In 1990, the highest provincial murder rate in Ecuador was in Los Rios, a poor province in the centre of the country. By 1995, the highest murder rate was found in Esmeraldas, a richer coastal province bordering Colombia, known for its use by drug traffickers. Esmer-aldas is the one province of the country where small
9 Briceño-León, R., “Diez años de Violencia en Venezuela” (and sub-sequent reports) See: http://www.alertavenezuela.com/documen-tos/getbindata.php?docid=137&fieldname=documento and http://informe21.com/actualidad/impunidad-corrupcion-16047-homicidi-os-nuestro-pais-2009-segun-informe
Departure locations of identified drug Fig. 1: trafficking shipments by sea from South America to Europe, 2006-2008
Source: Maritime Analysis Operation Centre
Venezuela51%
Caribbean11%
Colombia5%
West Africa11%
Other12%
Brazil10%

235
The destabilizing influence of drug trafficking on transit countries: The case of cocaine
scale coca cultivation has been detected. By 1999, the murder rate in Esmeraldas was more than twice the national average, at 34 per 100,000,10 comparable to Colombia today.
Transit countries in the Caribbean 3.2
As a conduit for cocaine imported into the United States, the Caribbean has greatly diminished in impor-tance over the past 15 years. During the early days of the trade, traffickers preferred the Caribbean corridor and it was used preferentially from the late 1970s.11 In the 1980s, most of the cocaine entering the United States came through the Caribbean into the southern part of the state of Florida.12 But interdiction successes, tied to the use of radars, caused the traffickers to reassess their routes. As a growing share of cocaine transited the south-west border of the United States, Mexican groups wrested control from their Colombian suppliers, further direct-ing the flow through Central America and Mexico.
Unfortunately, this decline has not necessarily led to increased stability or lowered violence in the transit countries. On the contrary, it seems that once the drug is introduced, instability in the market can drive vio-lence. Jamaica provides a case in point. Estimates of the cocaine flow through Jamaica dropped from 11% of the
10 Interamerican Development Bank, “Magnitud y Tendencias de la Violencia en Ecuador, 1990-1999” in Violencia y seguridad ciuda-dana. Quito: IADB, 2001.
11 Statement of James Milford, Acting Deputy Administrator, United States Drug Enforcement Administration, before the Senate Sub-committee on National Security, International Affairs, and Criminal Justice, 17 July 1997.
12 Statement of Thomas A. Constantine, head of the United States Drug Enforcement Administration, before the House of Representa-tives Judiciary Committee, Subcommittee on Crime, 3 April 1997.
US supply in 200013 to 2% in 2005,14 and 1% in 2007.15 This is reflected in declining seizures in Jamaica and declining arrests and convictions of Jamaican drug traffickers in the United States.16 It is also negatively reflected in the murder rate, which rose from 34 per 100,000 in 2000 to 59 per 100,000 in 2008.
13 Statement of the Donnie Marshall, Administrator, US Drug Enforce-ment Administration before the United States Senate Caucus on International Narcotics Control, 15 May 2001.
14 National Drug Intelligence Centre, National Drug Threat Assessment 2006. Washington, D.C.: Department of Justice, 2006. National Drug Intelligence Centre, National Drug Threat Assessment 2007 Washington, D.C.: Department of Justice, 2007.
15 National Drug Intelligence Centre, National Drug Threat Assessment 2009. Washington, D.C.: Department of Justice, 2009.
16 In 2000, the US federal authorities convicted 79 Jamaicans for cocaine trafficking. In 2008, they arrested just 35.
Murder count in the Bolivarian Fig. 2: Republic of Venezuela, 1990-2009
Source: Observatorio Venezolano de Violencia24
Murders per 100,000 citizens in Fig. 3: Ecuador, 1990-2008
Source: IADB, UNODC CTS
0
2,000
4,000
6,000
8,000
10,000
12,000
14,000
16,000
18,000
1990
1992
1994
1996
1998
2000
2002
2004
2006
2008
Mu
rder
s
0
5
10
15
20
25
1990
1992
1994
1996
1998
2000
2002
2004
2006
2008
Mu
rder
s p
er 1
00,0
00
Distribution of cocaine flows to the Fig. 4: US market, 1998-2007
Source: National Drug Intelligence Center
59 5466 72 72 77
90 88 90 90
30 4333 26 27 22
10 12 10 101121311
0%
10%
20%
30%
40%
50%
60%
70%
80%
90%
100%
1998
1999
2000
2001
2002
2003
2004
2005
2006
2007
Central America/Mexico Caribbean Direct
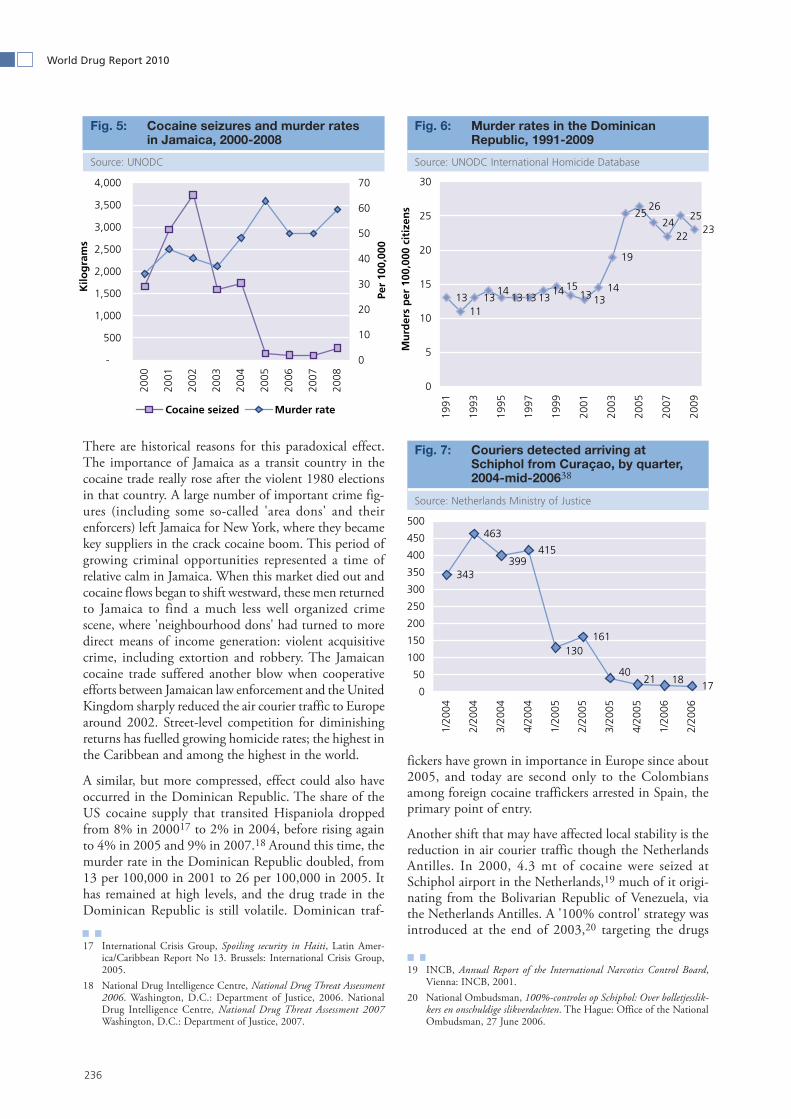
236
World Drug Report 2010
There are historical reasons for this paradoxical effect. The importance of Jamaica as a transit country in the cocaine trade really rose after the violent 1980 elections in that country. A large number of important crime fig-ures (including some so-called 'area dons' and their enforcers) left Jamaica for New York, where they became key suppliers in the crack cocaine boom. This period of growing criminal opportunities represented a time of relative calm in Jamaica. When this market died out and cocaine flows began to shift westward, these men returned to Jamaica to find a much less well organized crime scene, where 'neighbourhood dons' had turned to more direct means of income generation: violent acquisitive crime, including extortion and robbery. The Jamaican cocaine trade suffered another blow when cooperative efforts between Jamaican law enforcement and the United Kingdom sharply reduced the air courier traffic to Europe around 2002. Street-level competition for diminishing returns has fuelled growing homicide rates; the highest in the Caribbean and among the highest in the world.
A similar, but more compressed, effect could also have occurred in the Dominican Republic. The share of the US cocaine supply that transited Hispaniola dropped from 8% in 200017 to 2% in 2004, before rising again to 4% in 2005 and 9% in 2007.18 Around this time, the murder rate in the Dominican Republic doubled, from 13 per 100,000 in 2001 to 26 per 100,000 in 2005. It has remained at high levels, and the drug trade in the Dominican Republic is still volatile. Dominican traf-
17 International Crisis Group, Spoiling security in Haiti, Latin Amer-ica/Caribbean Report No 13. Brussels: International Crisis Group, 2005.
18 National Drug Intelligence Centre, National Drug Threat Assessment 2006. Washington, D.C.: Department of Justice, 2006. National Drug Intelligence Centre, National Drug Threat Assessment 2007 Washington, D.C.: Department of Justice, 2007.
fickers have grown in importance in Europe since about 2005, and today are second only to the Colombians among foreign cocaine traffickers arrested in Spain, the primary point of entry.
Another shift that may have affected local stability is the reduction in air courier traffic though the Netherlands Antilles. In 2000, 4.3 mt of cocaine were seized at Schiphol airport in the Netherlands,19 much of it origi-nating from the Bolivarian Republic of Venezuela, via the Netherlands Antilles. A '100% control' strategy was introduced at the end of 2003,20 targeting the drugs
19 INCB, Annual Report of the International Narcotics Control Board, Vienna: INCB, 2001.
20 National Ombudsman, 100%-controles op Schiphol: Over bolletjesslik-kers en onschuldige slikverdachten. The Hague: Office of the National Ombudsman, 27 June 2006.
Cocaine seizures and murder rates Fig. 5: in Jamaica, 2000-2008
Source: UNODC
Murder rates in the Dominican Fig. 6: Republic, 1991-2009
Source: UNODC International Homicide Database
-
500
1,000
1,500
2,000
2,500
3,000
3,500
4,000
2000
2001
2002
2003
2004
2005
2006
2007
2008
Kilo
gra
ms
0
10
20
30
40
50
60
70
Per
100,
000
Cocaine seized Murder rate
1311
1314
13 13 1314 15
13 1314
19
2526
2422
2523
0
5
10
15
20
25
30
1991
1993
1995
1997
1999
2001
2003
2005
2007
2009
Mu
rder
s p
er 1
00,0
00 c
itiz
ens
Couriers detected arriving at Fig. 7: Schiphol from Curaçao, by quarter, 2004-mid-200638
Source: Netherlands Ministry of Justice
343
463
415
161
17
130
1840
21
399
0
50
100
150
200
250
300
350
400
450
500
1/20
04
2/20
04
3/20
04
4/20
04
1/20
05
2/20
05
3/20
05
4/20
05
1/20
06
2/20
06

237
The destabilizing influence of drug trafficking on transit countries: The case of cocaine
rather than the couriers.21 As a result, this flow was almost entirely eliminated by 2006.
These interventions may have displaced some of the flow coming from the Bolivarian Republic of Venezuela through the Caribbean to Trinidad and Tobago, which saw a remarkable surge in seizures from 2000 to 2005. At the same time, that country’s murder rate tripled. Seizures have declined today, but the murder rate has remained high: 40 per 100,000 in 2008.
In addition, a number of other Caribbean countries have very high murder rates that are difficult to explain except in terms of the drug trade, particularly given relatively low rates in neighbouring countries.23
Transit countries in Mesoamerica3.3
As Mexican traffickers wrested control of the most valu-able portions of the trafficking chain from the Colom-bians, Mexico itself has become by far the most important conduit for cocaine entering the United States. Today, some 200 mt of cocaine transits Central America and Mexico annually, bringing some US$6 billion to the regional 'cartels'. As a result, those who control the por-tions of the Mexican border through which the bulk of the drug passes have gained wealth and power compara-ble to that commanded by the Colombian cartels in their heyday. These groups command manpower and weaponry sufficient to challenge the state when threat-ened, including access to military arms and explosives.
21 Europol, European Union Situation Report on Drug Production and Drug Trafficking 2003 – 2004, The Hague: Europol, 2005, p. 4.
22 The final quarter (2/2006) is short by two weeks, as current data only extends to week 24 of 2006.
23 Due to their small population size, murder rates in the smaller islands tend to be highly volatile, so trend data are not presented. Some of these rates were higher in the recent past.
They also have the funds to sow widespread and high-level corruption.
Fortunately, the Mexican Government has several advan-tages the Colombian Government did not have, includ-ing much greater resources. Further, the violence, while formidable in some areas, comes nowhere close to that experienced in Colombia, even when comparing the two countries today. It is highly likely that law enforcement pressure will have a similar effect in Mexico as in Colom-bia, and the cartels, however powerful, will be disman-tled. And, unlike Colombia, there are no comparable illegal armed groups around to pick up the pieces after-wards.
Over 40,000 drug 'cartel' members have been arrested in Mexico in recent years, including many of the heads of
Murders and cocaine seizures in Fig. 8: Trinidad and Tobago, 1992-2005
Source: UNODC International Homicide Database
Caribbean murder rates Fig. 9: (most recent data available)
Source: UNODC International Homicide Database
0
5
10
15
20
25
30
35
40
1992
1993
1994
1995
1996
1997
1998
1999
2000
2001
2002
2003
2004
2005
Per
100,
000
-
200
400
600
800
1,000
1,200
1,400
1,600
1,800
2,000
Kilo
gra
ms
Murder rate Cocaine seized
0
5
10
15
20
25
30
35
40
Gre
nada
(200
4)
Dom
inic
a (2
004)
Ant
igua
and
Barb
uda
(200
4)
Barb
ados
(200
4)
Baha
mas
(200
4)
St V
ince
nt a
nd t
heG
rena
dine
s (2
004)
Puer
to R
ico
(200
8)
Hai
ti (2
004)
St L
ucia
(200
7)
Ang
uilla
(200
7)
St K
itts
and
Nev
is (2
008)
Mu
rder
s p
er 1
00,0
00 c
itiz
ens
Cartel members and others arrested Fig. 10: for offences against public safety (drug charges) between 1 December 2006 and 15 February 2009
Source: Attorney General of Mexico
18,827
14,410
6,633
9,895 10,417
02,0004,0006,0008,000
10,00012,00014,00016,00018,00020,000
Tiju
ana
Car
tel
Juar
ezC
arte
l
Gul
f C
arte
l
Sina
loa
Fede
ratio
n
Oth
ers
Arr
ests

238
World Drug Report 2010
these organizations. In 2009, 107 criminals were extra-dited from Mexico to the United States, including key cartel figures, a technique that was pivotal in bringing down the big cartels in Colombia. Decapitating the Mexican cartels has spurred intra- and inter-cartel vio-lence, as the survivors jockey for position and try to take advantage of rival weaknesses. The murder count has shot up, but the rate (about 12 per 100,000 in 2008) remains relatively low, and is about the same as in the mid-1990s. Most of the victims appear to be cartel mem-bers, and this violence has further reduced the cocaine supply to the United States, creating a downward spiral from which the cartels will have difficulty escaping.
In Mexico, the cocaine trade is now dominated by a number of these cartels who compete to control border crossings and transportation routes. The leadership, turf and structure of these groups has shifted over time as conflicts both within and between the cartels, as well as enforcement efforts, force realignments. As of early 2010, the dominant cartels were the following:
The Sinaloa Federation , led by billionaire, and Mexi-co’s most wanted man, Joaquin “El Chapo” Guzman;
The Gulf Cartel , once the most powerful criminal organization in Mexico, now greatly weakened by the defection of Los Zetas;
Los Zetas , founded when a group of special forces sol-diers defected to the Gulf Cartel and now operating as a trafficking organization in its own right;
The Juarez Cartel , also know as the Carrillo Fuentes Organization, which is struggling to maintain control
24 Online database of the Mexican National Institute of Statistics and Geography (see: http://www.inegi.org.mx/est/contenidos/espa-nol/proyectos/continuas/vitales/bd/mortalidad/MortalidadGeneral.asp?s=est&c=11144).
over its plaza (smuggling turf ) in Ciudad Juarez, the city most affected by cartel violence;
The Tijuana Cartel , also known as the Arellano Felix Organization, which is similarly struggling to main-tain control over the Tijuana plaza;
The Beltran Leyva Organization , a breakaway from the Sinaloa cartel, now weakened by the recent arrests or killings of three of the five Beltran Leyva brothers; and
La Familia Michoacana , a Zetas breakaway based in Michoacan but expanding, renowned for its penchant for beheadings, quasi-religious ideology and domina-tion of methamphetamine production.
Perhaps due to the recent slump in the cocaine trade, these groups are progressively engaging in a number of other organized crime activities, including migrant smuggling, kidnapping and extortion – all crimes that were prevalent in Mexico before cartel involvement. La Familia, which espouses a bizarre ideology combining aspects of evangelical Christianity with revolutionary populism, provides the most extreme example, 'taxing' businesses in the areas they control and engaging in very public displays of violence to soften resistance.
The most violent city in Mexico has been the plaza of Juaréz, where murder rates are among the highest in the region. As in Jamaica, murders in Juaréz increased when the enhanced security presence stopped the flow of cocaine through the city. Street gang members who had been stringing for the cartels found themselves without an income, and resorted to violent acquisitive crime.
Mexico’s struggle has attracted a lot of attention, with much less falling on an area far more threatened: Central America. As maritime interdiction has increased and Mexico itself has become far more contested, a growing
Number of homicides in Mexico Fig. 11: (public health data), 1990-2008
Source: Instituto Nacional de Estadística y Geografía40
Comparative regional murder rates Fig. 12: in 2008, selected countries in the Americas
Source: UNODC International Homicide Statistics
0
2,000
4,000
6,000
8,000
10,000
12,000
14,000
16,000
18,000
1990
1992
1994
1996
1998
2000
2002
2004
2006
2008
Nu
mb
er o
f m
urd
ers
60.9
51.8
11.65.2
1.7
49
0
10
20
30
40
50
60
70
Hon
dura
s
El S
alva
dor
Gua
tem
ala
Mex
ico
USA
Can
ada
Mu
rder
s p
er 1
00,0
00

239
The destabilizing influence of drug trafficking on transit countries: The case of cocaine
share of cocaine headed northward is passing through northern Central America, including El Salvador, Hon-duras, Guatemala and Belize. The murder rates in these four countries are three to five times higher than in Mexico, and both the economy and the state are far less robust and resilient.
The Northern Triangle of Central America is still reeling from the brutal civil wars in Guatemala (1960-1996) and El Salvador (1980-1992). The region suffers from having one of the most unequal distributions of income in the world, comparable only to southern Africa or the Andean countries. Small elites working with strong militaries have long dominated countries in this region, exporting agricultural commodities, as well as engaging in other labour-intensive enterprises. The threat of renewed insta-bility and conflict remains. Guatemala has long had a problem with vigilante justice; a response to a lack of police presence in much of the country. Honduras expe-rienced a coup d’état in 2009, when the serving president attempted to attain public support for an extended term of office.
As a result of this legacy of violence, instability and inequality, the Northern Triangle of Central America has the highest murder rate of any region in the world, and very high rates of other forms of violent crime. It has also experienced political violence, and at times the dis-tinction between criminal and political violence can be difficult to discern. The southern countries in Central America do not appear to be as affected by drug traffick-ing as those in the north, and do not have comparable murder rates, despite a history of political violence in countries like Nicaragua.25
25 There are exceptions in areas highly affected by drug trafficking. For example, the murder rate in Panama in 2006 was only 11 per 100,000, but the rate in Panama City was 30 per 100,000.
Contrary to what would be expected, in none of these countries is the highest murder rate found in the largest cities. Rather, it is found in provinces that have strategic value to rival drug traffickers. For example, Guatemala’s Petén province is rural and largely indigenous, two vari-ables that negatively correlate with violence elsewhere in the country. But it is also a major drug trafficking zone, where jungle landing strips provide easy access to the Mexican border. It may also be a contested area, where Los Zetas and the Sinaloa Federation both have an inter-est. These are likely the reasons it has the highest murder rates in the country.
Other provinces have the misfortune of containing key ports for traffickers, such as the provinces of Atlántida in Honduras, Sonsonate in El Salvador, Escuintla in Guatemala and Michoacán in Mexico. The death count has risen over time as a growing share of cocaine traffick-ing is conducted through this region. It also appears that Mexican cartels are settling their differences further up the trafficking chain, employing local killers to disrupt the operations of their rivals.
Honduras has the unfortunate distinction of having the fastest-growing murder rate in the region, which may be associated with increased use of the country as a landing site for cocaine-laden aircraft from Colombia and the Bolivarian Republic of Venezuela. It also hosts the prov-ince with the highest murder rate in the region: Atlánt-ida, where one out of every 1,000 people was murdered last year. The capital of Atlántida is La Ceiba, a port well known for its use by cocaine traffickers, and the site of clandestine landing strips.26 In December 2009, Gen-eral Aristides Gonzalez, director general of the national office for combating drug trafficking, was murdered. The General had embarked on a campaign against the unauthorized airports found across the country, some of which are said to be linked to the Sinaloa Federation. Just before his murder, he had seized a major strip, and threatened to take action against all property owners on whose land the strips were found.
The groups involved in this region are less well-defined than in Mexico. For most forms of crime in the region, the blame often falls on two street gang confederations founded by deportees from the USA: Mara Salvatrucha (MS13) and Calle 18 (M18). But there is little evidence that these groups, comprised of street youth intensely focused on neighbourhood issues, are widely engaged in large-scale transnational drug trafficking. Most are based in inland cities, far from the maritime routes along which most cocaine flows before arriving in Mexico. They are certainly culpable in street sales in the areas they control, but their capacity to engage in bulk trans-
26 La Ceiba was regarded as a major drug trafficking port by the US Drug Enforcement Administration as early as 2001. (See: http://www.hawaii.edu/hivandaids/Honduras_Country_Brief__Drug_Sit-uation_Report.pdf ).
Murder rate trends in Mesoamerica Fig. 13: (per 100,000 inhabitants), 2003-2008
Source: UNODC International Homicide Statistics
51
5962 64
5752
3135
4245 45
49
34
26
35
43
50
61
12 11 11 11 10 12
0
10
20
30
40
50
60
70
2003 2004 2005 2006 2007 2008
Mu
rder
s p
er 1
00,0
00
El Salvador GuatemalaHonduras Mexico

240
World Drug Report 2010
national smuggling is questionable. Some may be recruited as hit men by the Mexican organizations. They frequently tattoo their faces as a sign of their commit-ment to the gang, however, so they are ill-suited for any operation involving possible contact with the public or the authorities. The maras have engaged in demonstra-tive violence in the past, including the random killing of civilians, but there is little to indicate they have any kind of political agenda, aside from avoiding police interfer-ence with their affairs.
The repeated arrests of high-level officials in the police and the military, in contrast, suggest that the main traf-fickers in Central America are far more sophisticated than street gangsters, and are tied to some members of the ruling elites, rather than the underclass. There is also growing evidence of Mexican cartel penetration into Central America, particularly regarding Los Zetas in Guatemala and the Sinaloa Federation in Honduras.
In both Mexico and Central America, trafficking groups have gone on the offensive, murdering a number of
prominent law enforcement officials who dared to oppose them. For example, in December 2009, the head of the Honduran anti-drug agency was murdered, as was Mexico’s federal police chief in 2008. Organized crimi-nals also target rank-and-file police officers for retalia-tory killings. In June 2009, 12 federal police agents were tortured and killed, and their bodies dumped, when the Mexican police arrested a high ranking member of La Familia Michoacana. Civilians have also been targeted for demonstrative attacks, such as the 2008 Indepen-dence Day grenade attacks in Morelia.
In all of these countries, cocaine-related corruption at the highest levels, on occasion including the national heads of police and drug enforcement agencies, has been detected. For example, the Guatemalan police have been through a long series of purges and reformations. In August 2009, President Colom fired the director general of the national police, his deputy, his operations head and his investigations head after large amounts of cocaine and cash went missing. Before this, in 2005, the country suffered the indignity of having its top drug officials
Murder rates in Mesoamerica, 2009Map 2:
Source: Official sources
N I C A R A G U A
M E X I C O
U N I T E D S T A T E S
O F A M E R I C A
G U AT E M A L A
E L S A LVA D O R
H O N D U R A S
B E L I Z E
F O C U S
C U B A
G u l f
o f M e x i c o
P a c i f i c
O c e a n
Chihuahua
BajaCalifornia
Guerrero
Sinaloa
Durango
Hermosillo
Oaxaca
Michoacán
Nayarit
Morelos
QuintanaRoo
Distrito FederalColima
Jalisco
Tijuana
La Paz
Mazatlán
Juarez
Manzanillo
LázaroCardenas
México
500 km
200 km
Nogales
Mexicali
San Salvador
Guatemala
Tegucigalpa
Atlantida 108.4
Petén98
Cortés 92.1
Izabal 91
N i c a r a g u a
B e l i z e
G u a t e m a l a
E l S a l v a d o r
H o n d u r a s
Murder rate(per 100 000 inhabitants)
20 503 10 70 90 109
UN
OD
C /
SCIE
NC
ES P
O
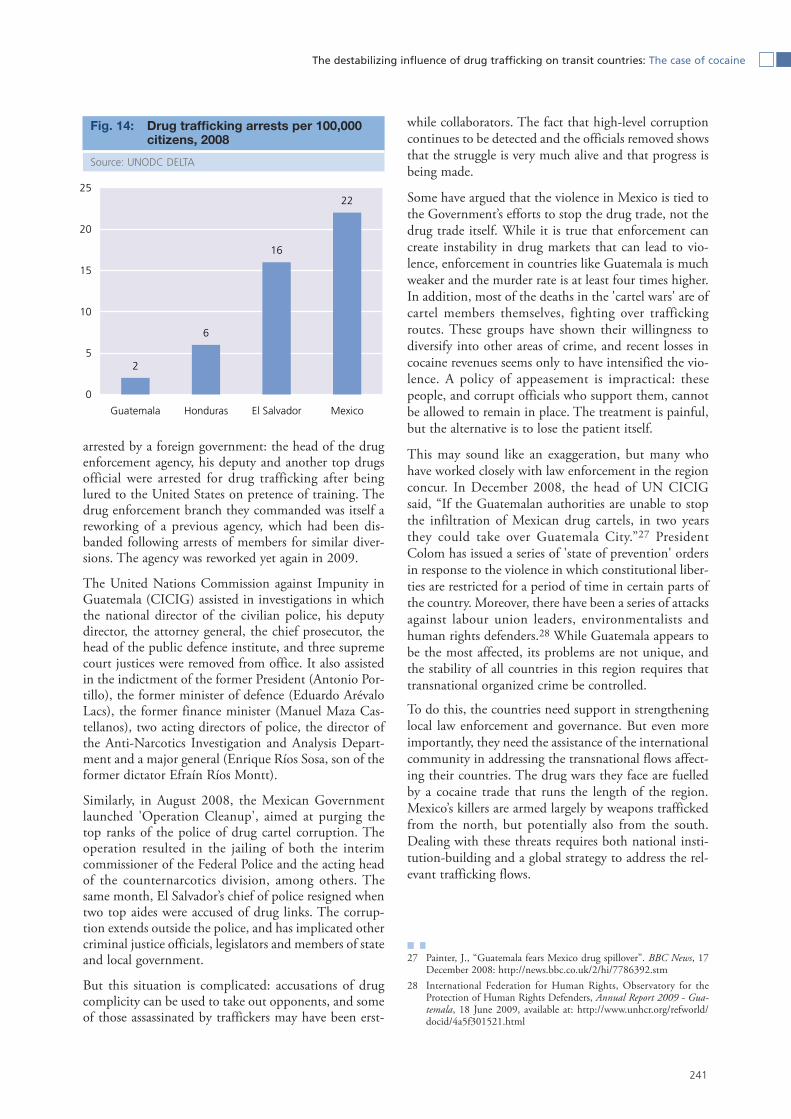
241
The destabilizing influence of drug trafficking on transit countries: The case of cocaine
arrested by a foreign government: the head of the drug enforcement agency, his deputy and another top drugs official were arrested for drug trafficking after being lured to the United States on pretence of training. The drug enforcement branch they commanded was itself a reworking of a previous agency, which had been dis-banded following arrests of members for similar diver-sions. The agency was reworked yet again in 2009.
The United Nations Commission against Impunity in Guatemala (CICIG) assisted in investigations in which the national director of the civilian police, his deputy director, the attorney general, the chief prosecutor, the head of the public defence institute, and three supreme court justices were removed from office. It also assisted in the indictment of the former President (Antonio Por-tillo), the former minister of defence (Eduardo Arévalo Lacs), the former finance minister (Manuel Maza Cas-tellanos), two acting directors of police, the director of the Anti-Narcotics Investigation and Analysis Depart-ment and a major general (Enrique Ríos Sosa, son of the former dictator Efraín Ríos Montt).
Similarly, in August 2008, the Mexican Government launched 'Operation Cleanup', aimed at purging the top ranks of the police of drug cartel corruption. The operation resulted in the jailing of both the interim commissioner of the Federal Police and the acting head of the counternarcotics division, among others. The same month, El Salvador’s chief of police resigned when two top aides were accused of drug links. The corrup-tion extends outside the police, and has implicated other criminal justice officials, legislators and members of state and local government.
But this situation is complicated: accusations of drug complicity can be used to take out opponents, and some of those assassinated by traffickers may have been erst-
while collaborators. The fact that high-level corruption continues to be detected and the officials removed shows that the struggle is very much alive and that progress is being made.
Some have argued that the violence in Mexico is tied to the Government’s efforts to stop the drug trade, not the drug trade itself. While it is true that enforcement can create instability in drug markets that can lead to vio-lence, enforcement in countries like Guatemala is much weaker and the murder rate is at least four times higher. In addition, most of the deaths in the 'cartel wars' are of cartel members themselves, fighting over trafficking routes. These groups have shown their willingness to diversify into other areas of crime, and recent losses in cocaine revenues seems only to have intensified the vio-lence. A policy of appeasement is impractical: these people, and corrupt officials who support them, cannot be allowed to remain in place. The treatment is painful, but the alternative is to lose the patient itself.
This may sound like an exaggeration, but many who have worked closely with law enforcement in the region concur. In December 2008, the head of UN CICIG said, “If the Guatemalan authorities are unable to stop the infiltration of Mexican drug cartels, in two years they could take over Guatemala City.”27 President Colom has issued a series of 'state of prevention' orders in response to the violence in which constitutional liber-ties are restricted for a period of time in certain parts of the country. Moreover, there have been a series of attacks against labour union leaders, environmentalists and human rights defenders.28 While Guatemala appears to be the most affected, its problems are not unique, and the stability of all countries in this region requires that transnational organized crime be controlled.
To do this, the countries need support in strengthening local law enforcement and governance. But even more importantly, they need the assistance of the international community in addressing the transnational flows affect-ing their countries. The drug wars they face are fuelled by a cocaine trade that runs the length of the region. Mexico’s killers are armed largely by weapons trafficked from the north, but potentially also from the south. Dealing with these threats requires both national insti-tution-building and a global strategy to address the rel-evant trafficking flows.
27 Painter, J., “Guatemala fears Mexico drug spillover”. BBC News, 17 December 2008: http://news.bbc.co.uk/2/hi/7786392.stm
28 International Federation for Human Rights, Observatory for the Protection of Human Rights Defenders, Annual Report 2009 - Gua-temala, 18 June 2009, available at: http://www.unhcr.org/refworld/docid/4a5f301521.html
Drug trafficking arrests per 100,000 Fig. 14: citizens, 2008
Source: UNODC DELTA
2
6
16
22
0
5
10
15
20
25
Guatemala Honduras El Salvador Mexico

242
World Drug Report 2010
Transit countries in West Africa3.4
West Africa is one of the poorest and least stable regions on earth. All but three of the 16 countries in this region29 are on the United Nations list of 'least developed coun-tries', including the five countries with the very lowest levels of human development. West Africa has experi-enced at least 58 coups and attempted coups, including some in just the last year. There remain many active rebel groups in the region.
At present, of the 15 nations of the Economic Com-munity of West African States (ECOWAS), about half are experiencing some form of instability. Long-standing insurgencies are found in Côte d’Ivoire, Senegal, Mali, Niger and, arguably, Nigeria. Both Sierra Leone and Liberia are recovering from brutal civil wars. According to one recent rating of the 25 countries with the highest risks of instability globally, nine were in West Africa: Niger, Mali, Sierra Leone, Liberia, Mauritania, Guinea-Bissau, Côte d’Ivoire and Benin.30
Large-scale cocaine trafficking through West Africa was first detected around 2004, symptomatic of a shift in the centre of gravity of the global market from the United States to Europe. West African traffickers had long been active in small-scale import and marketing of cocaine in Europe, as they have been in many other parts of the world. But around this time, individuals based in West Africa began to provide logistic assistance to South American traffickers in organizing their maritime ship-ments to Europe from at least two hubs: one centred on Guinea-Bissau and Guinea in the north, and one cen-tred on the Bight of Benin in the south; both involving Nigerian traffickers.
Mother ships from South America could unload cargoes to smaller craft from the coast, and the cocaine could be stored, repackaged and redirected to European buyers from this vantage. In exchange for their services, it is believed that the West Africans were paid in kind: they were allowed to retain up to one third of the shipment to traffic on their own behalf, which they did mainly via commercial air couriers.
By 2008, the situation began to change. Heightened international awareness of the threat made trafficking via West Africa more difficult. In addition, a series of events shifted the political terrain in the northern hub:
In August 2008, the head of the navy of Guinea- Bissau fled the country under allegations that he was orchestrating a coup d’état.
29 For the purposes of this discussion, ECOWAS plus Mauritania, a former ECOWAS member.
30 Hewitt, J., J. Wilkenfeld and T. Gurr, Peace and Conflict 2010 . Center for International Development and Conflict Management, University of Maryland, 2010.
In December 2008, the man who had ruled Guinea for 24 years died, and a military cabal took control, later arresting two of his sons and several prominent officials for their involvement in drug trafficking.
In March 2009, the head of the army of Guinea- Bissau was murdered, and, shortly afterward, in an apparent reprisal attack, so was the president.
Whatever the cause, both maritime seizures and airport seizures on flights originating in West Africa virtually disappeared at the end of 2008. Some trans-Atlantic traffic may have shifted to private aircraft, however. In November 2009, a Boeing 727 jet was found alight in Central Mali. It is believed that the plane departed from the Bolivarian Republic of Venezuela and that it was carrying cocaine. Some may be trafficked by means as yet undiscovered. The cocaine trade through West Africa continues, but apparently at a reduced rate of perhaps 25 tons per year, with a retail market value of US$6.8 billion at destination in 2008. However, there is anecdo-tal information from law enforcement circles that cocaine trafficking via West Africa may have started to increase again in late 2009.
The greatest danger posed by cocaine is its enormous value compared to that of local economies. This allows traffickers to penetrate to the very highest levels of gov-ernment and the military. Law enforcement officials can be offered more than they could earn in a lifetime simply to look the other way. This extreme leverage has allowed traffickers to operate with very little resistance from the state, and therefore, there is little need to resort to violence. There appears to have been some violence in elite circles as rivals compete for access to these profits, however.
Guinea-Bissau provides an example. The country was one of the first to be affected by the cocaine trade in the region, and, due to the small size of its economy (its GDP was US$400 million in 2008), one of the worst affected. The drug trade seemed to be quickly monopo-lized by the military, controlled by top-ranking military officials. These officials have threatened all who dare to discuss their involvement.
From 2007 onwards, high-level officials have accused the military of running the drug trade, including the Interior Minister and the head of the Judicial Police. Drugs have been detected arriving on military air strips, military officers have been arrested in possession of hun-dreds of kilograms of cocaine, and there have been sev-eral armed stand-offs between police and military forces concerning drug shipments. Drugs seized by the police have been confiscated by the military and have subse-quently disappeared. Accused soldiers, as well as foreign traffickers, have been simply released from custody. In July 2008, both the Attorney General and the Minister of Justice said they had received death threats related to
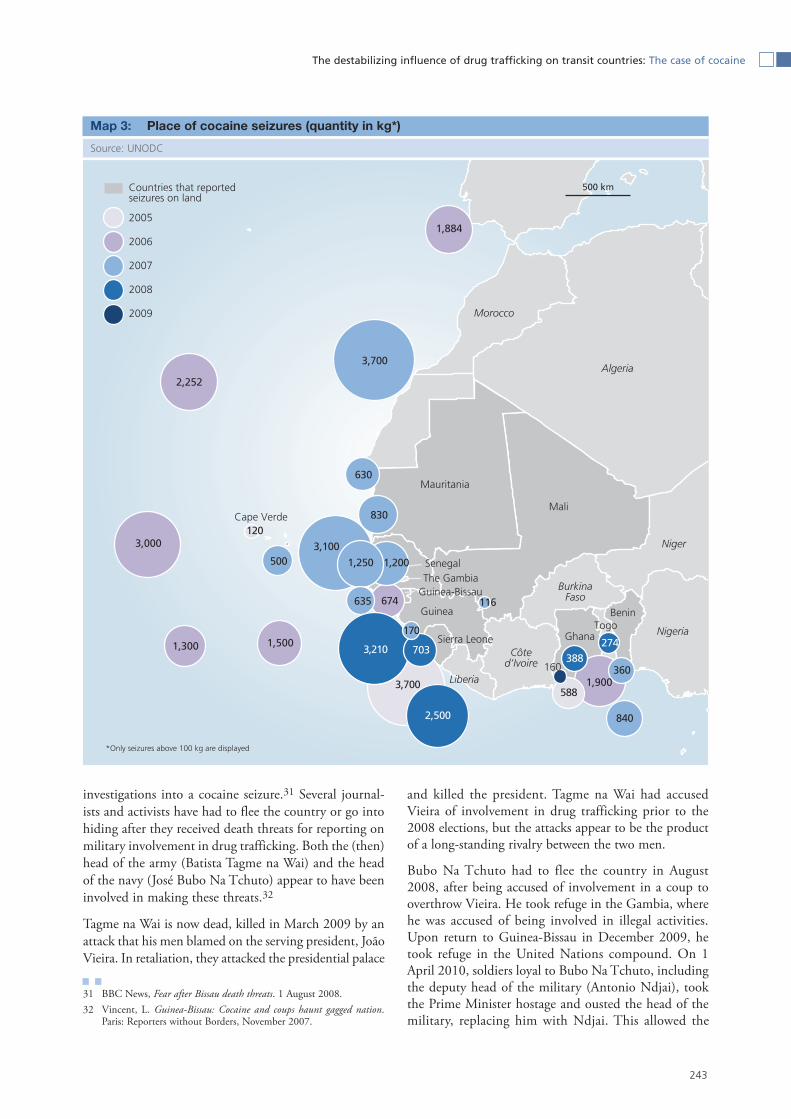
243
The destabilizing influence of drug trafficking on transit countries: The case of cocaine
investigations into a cocaine seizure.31 Several journal-ists and activists have had to flee the country or go into hiding after they received death threats for reporting on military involvement in drug trafficking. Both the (then) head of the army (Batista Tagme na Wai) and the head of the navy (José Bubo Na Tchuto) appear to have been involved in making these threats.32
Tagme na Wai is now dead, killed in March 2009 by an attack that his men blamed on the serving president, João Vieira. In retaliation, they attacked the presidential palace
31 BBC News, Fear after Bissau death threats. 1 August 2008.32 Vincent, L. Guinea-Bissau: Cocaine and coups haunt gagged nation.
Paris: Reporters without Borders, November 2007.
and killed the president. Tagme na Wai had accused Vieira of involvement in drug trafficking prior to the 2008 elections, but the attacks appear to be the product of a long-standing rivalry between the two men.
Bubo Na Tchuto had to flee the country in August 2008, after being accused of involvement in a coup to overthrow Vieira. He took refuge in the Gambia, where he was accused of being involved in illegal activities. Upon return to Guinea-Bissau in December 2009, he took refuge in the United Nations compound. On 1 April 2010, soldiers loyal to Bubo Na Tchuto, including the deputy head of the military (Antonio Ndjai), took the Prime Minister hostage and ousted the head of the military, replacing him with Ndjai. This allowed the
E
1,900
2,252
1,300 1,500
3,000
840
830
360
630
5003,100
588
120
1,250
674635
1,200
3,700
3,700
2,500
388
116
3,210
Countries that reported seizures on land
*Only seizures above 100 kg are displayed
2005
2006
2007
2008
2009 Morocco
Algeria
Mali
Mauritania
BurkinaFaso
Togo
Niger
Benin
Côted’Ivoire
Ghana
Liberia
Sierra Leone
Guinea
Guinea-BissauThe GambiaSenegal
Cape Verde
Nigeria
703
170274
160
1,884
500 km
Place of cocaine seizures (quantity in kg*)Map 3:
Source: UNODC
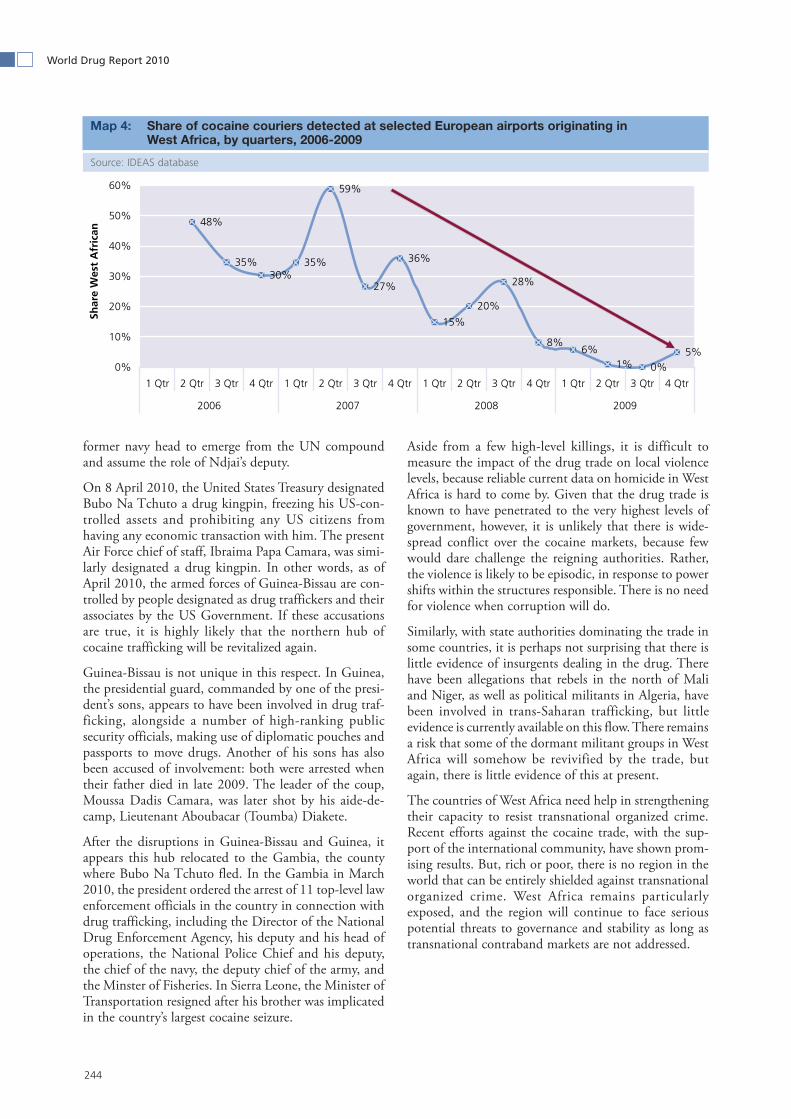
244
World Drug Report 2010
former navy head to emerge from the UN compound and assume the role of Ndjai’s deputy.
On 8 April 2010, the United States Treasury designated Bubo Na Tchuto a drug kingpin, freezing his US-con-trolled assets and prohibiting any US citizens from having any economic transaction with him. The present Air Force chief of staff, Ibraima Papa Camara, was simi-larly designated a drug kingpin. In other words, as of April 2010, the armed forces of Guinea-Bissau are con-trolled by people designated as drug traffickers and their associates by the US Government. If these accusations are true, it is highly likely that the northern hub of cocaine trafficking will be revitalized again.
Guinea-Bissau is not unique in this respect. In Guinea, the presidential guard, commanded by one of the presi-dent’s sons, appears to have been involved in drug traf-ficking, alongside a number of high-ranking public security officials, making use of diplomatic pouches and passports to move drugs. Another of his sons has also been accused of involvement: both were arrested when their father died in late 2009. The leader of the coup, Moussa Dadis Camara, was later shot by his aide-de-camp, Lieutenant Aboubacar (Toumba) Diakete.
After the disruptions in Guinea-Bissau and Guinea, it appears this hub relocated to the Gambia, the county where Bubo Na Tchuto fled. In the Gambia in March 2010, the president ordered the arrest of 11 top-level law enforcement officials in the country in connection with drug trafficking, including the Director of the National Drug Enforcement Agency, his deputy and his head of operations, the National Police Chief and his deputy, the chief of the navy, the deputy chief of the army, and the Minster of Fisheries. In Sierra Leone, the Minister of Transportation resigned after his brother was implicated in the country’s largest cocaine seizure.
Aside from a few high-level killings, it is difficult to measure the impact of the drug trade on local violence levels, because reliable current data on homicide in West Africa is hard to come by. Given that the drug trade is known to have penetrated to the very highest levels of government, however, it is unlikely that there is wide-spread conflict over the cocaine markets, because few would dare challenge the reigning authorities. Rather, the violence is likely to be episodic, in response to power shifts within the structures responsible. There is no need for violence when corruption will do.
Similarly, with state authorities dominating the trade in some countries, it is perhaps not surprising that there is little evidence of insurgents dealing in the drug. There have been allegations that rebels in the north of Mali and Niger, as well as political militants in Algeria, have been involved in trans-Saharan trafficking, but little evidence is currently available on this flow. There remains a risk that some of the dormant militant groups in West Africa will somehow be revivified by the trade, but again, there is little evidence of this at present.
The countries of West Africa need help in strengthening their capacity to resist transnational organized crime. Recent efforts against the cocaine trade, with the sup-port of the international community, have shown prom-ising results. But, rich or poor, there is no region in the world that can be entirely shielded against transnational organized crime. West Africa remains particularly exposed, and the region will continue to face serious potential threats to governance and stability as long as transnational contraband markets are not addressed.
Share of cocaine couriers detected at selected European airports originating in Map 4: West Africa, by quarters, 2006-2009
Source: IDEAS database
48%
35%30%
35%
59%
36%
15%
20%
28%
8%6%
1% 0%5%
27%
0%
10%
20%
30%
40%
50%
60%
1 Qtr 2 Qtr 3 Qtr 4 Qtr 1 Qtr 2 Qtr 3 Qtr 4 Qtr 1 Qtr 2 Qtr 3 Qtr 4 Qtr 1 Qtr 2 Qtr 3 Qtr 4 Qtr
2006 2007 2008 2009
Shar
e W
est
Afr
ican

245
The destabilizing influence of drug trafficking on transit countries: The case of cocaine
Conclusion3.5 This chapter has illustrated the ways that drug traffick-ing can be both a symptom of, and a factor in, instability in transit regions around the world. Both drug traffick-ing and conflict undermine the rule of law and, in com-bination, they can have long-term impact on the prospects for peace and prosperity. The violence associ-ated with the cocaine trade can be tantamount to civil war in the worst affected areas. Left unaddressed, drug-derived riches can buy the arms and the influence to affect the course of political events, particularly in poorer regions.
The precise effect cocaine trafficking has on an area depends on the circumstances of that area, however. In Colombia, powerful traffickers posed a direct threat to the state, and once defeated, drug-fuelled illegal armed groups continued the attack. Dedicated enforcement and international cooperation appear to have completely turned the tide, but the struggle is far from over. Mexico appears to be engaged in an earlier stage of the same struggle, but without the illegal armed groups to worry about.
The growth of drug money flows can generate violence, as has been the case in Guatemala, but so can their with-drawal, as appears to have been the case in Jamaica. Any sudden change, whether it be in volumes or players, seems to have the potential to set off a violent competi-tion for opportunity. A far more insidious effect is seen in West Africa, where the drug trade appears to be con-trolled by national figures so powerful that little opposi-tion is possible, but where disputes over markets can lead to the toppling of governments.
One area where immediate progress can be made is to fully integrate crime prevention into United Nations peace operations. A large number of UN peace missions are operating in regions affected by drug trafficking, including West Africa (UNOCI in Côte d’Ivoire, UNMIL in Liberia, UNOGBIS in Guinea-Bissau, UNI-PSIL in Sierra Leone and UNOWA for West Africa as a whole), South-West and Central Asia (UNAMA in Afghanistan and UNRCCA in Central Asia) and South-East Europe (UNMIK in Kosovo). The United Nations Police would be in a good position to coordinate the international actors engaged in promoting peace to ensure that crime prevention measures are built into development planning.
Drug money flows can have devastating local effects, but their dynamics are almost always international. Target-ing these international linkages can provide a point of insertion for those interested in reducing the potential for conflict. Strategies aimed at addressing drug flows, executed in areas with stronger governance, could play a pivotal role in addressing civil conflict, by removing the profit motive that keeps many antagonists armed and in
the field. Put simply, reducing drug trafficking can help foster peace.
The problem is that most efforts against drugs are national, or, at best, bilateral, when the scale of the traf-ficking is global. Without a strategy scaled to fit the size of the problem, successful national efforts run the risk of simply displacing contraband flows. When opposed, the drug markets have consistently adapted, finding new cultivation areas, transit zones and consumer markets. In many cases, they have settled in the areas of least resist-ance, which are precisely the areas least equipped to deal with the challenge. And it is here that organized crime can escalate to the level of being a threat to stability.
The world does have a framework for dealing with these drugs internationally, in the form of the Single Conven-tion on Narcotic Drugs of 1961 (as amended by the 1972 Protocol); the Convention on Psychotropic Sub-stances of 1971; the Convention against Illicit Traffic in Narcotic Drugs and Psychotropic Substances of 1988; the Convention against Transnational Organized Crime of 2000 (and the protocols thereto) and the Convention against Corruption. A great deal of successful collabora-tion has occurred under this aegis, but more could be done. Too often, work under the Conventions has been limited to law enforcement, while transnational organ-ized crime cannot be reduced to a criminal justice issue. The Conventions provide a bedrock, but they do not constitute a global strategy.
To deal comprehensively with these intractable and interlinked issues, there can be no substitute for coordi-nated international action. The United Nations is well suited to provide the coordination needed to address these global issues at the level required.


4. STATISTICAL ANNEX

4.1 Production
249
Challenges in estimating the 4.1.1 production of pure cocaine HCl
For many years, UNODC has estimated the potential production of cocaine for each producing country with the purpose of providing information on the global supply of cocaine. Potential production refers to the amount of cocaine that would be produced if all the leaves harvested from the area under coca cultivation in one year would be converted into 100% pure cocaine hydrochloride (HCl).1 The reference to ‘potential’ pro-duction underscores the fact that the recovery of cocaine from the leaves may not be absolute (that is, 100% recovery). The term laboratory efficiency is therefore employed as a measure of how efficient a particular process is. Coca paste and cocaine base (intermediate products of the transformation process from leaves to cocaine HCl) can also be marketed and consumed. In addition, these intermediate products and leaves may be seized before they are processed into cocaine.
Traditionally, the production of cocaine HCl includes three steps. The first is the conversion of the coca leaf into coca paste; this is almost always done very close to the coca fields to cut down on the transport of the coca leaves. The second phase is the conversion of coca paste into cocaine base. The final stage is conversion of base to HCl. In recent years, this process has been cut into two stages, where leaves are converted directly to cocaine base.
In order to estimate the total potential production of pure cocaine HCl, the following elements need to be measured:
Cultivation Quantity of leaves per ha per year (yield) Quantity of leaves needed to produce 1 kg of 100% pure cocaine HCl. This includes the following elements:
Alkaloid content of leaves Laboratory efficiency (the percentage of alkaloid content that can be extracted in the laboratory process)
1 In Peru and the Plurinational State of Bolivia, a certain amount of coca leaves (leaves harvested from 12,000 ha of coca bush grown under law 1008 in Bolivia and 9,000 mt of coca leaves in Peru are estimated to be used for traditional purposes) is subtracted from the calculation of potential cocaine production.
Over the years, UNODC has undertaken studies in the three producing countries of the Plurinational State of Bolivia, Colombia and Peru.2 Of the three components needed to estimate the potential production of cocaine HCl, UNODC regularly measures cultivation and yield,3 but does not undertake any study to measure alkaloid content and laboratory efficiency. For this last step, it relies on an external source, the US Drug Enforce-ment Administration (DEA). The DEA is the only organization that has undertaken scientific studies to measure the alkaloid content of the coca leaves and laboratory efficiency in the Andean countries. In Colom-bia, the estimation process followed by UNODC differs from that used in the other two Andean countries. Using farmers’ interviews, UNODC can estimate the quantity of cocaine base produced from the leaves, although it cannot estimate its quality.4 Furthermore, it needs to estimate the average purity of the cocaine base produced and the conversion factor between cocaine base and cocaine HCl.
There is a certain level of uncertainty in each of the three stages necessary to estimate potential cocaine production.
Estimating cultivation
Since 1999-2002,5 UNODC’s Illicit Crop Monitoring Programme (ICMP) has been monitoring coca cultiva-tion in three Andean countries, the Plurinational State of Bolivia, Colombia and Peru. The cultivation esti-mates provide the situation at the end of each year. All coca surveys use remotely sensed images, that is, satellite images or aerial photographs,6 which is the best means
2 In each country, UNODC has project teams to conduct the surveys with assistance from a team of experts at UNODC headquarters in Vienna.
3 Yield studies are carried out by UNODC in Colombia (provinces are covered every five years on a rotating basis), the Plurinational State of Bolivia (Yungas of La Paz, 2005) and Peru (three major growing regions in 2003). No yield studies have been so far carried out by UNODC in Chapare/Bolivia where DEA yield estimates are used.
4 Through farmers’ interviews, UNODC can only estimate the quan-tity of cocaine base produced, not its purity, since farmers are una-ware of the level of purity of what they produce.
5 Since 1999 in Colombia, 2000 in Peru and 2002 in the Plurinational State of Bolivia. Since 2006, ICMP has been monitoring coca in Ecuador as well; however the extent of coca cultivation found there is negligible.
6 There are differences between satellite images, for example, in the

250
World Drug Report 2010
to undertake a systematic monitoring of the insecure and often inaccessible cultivation areas.
Every year, UNODC purchases satellite images from commercial image providers of all the areas where coca is grown. It is often a challenge to get images that are cloud-free, and therefore, the images are acquired over a period of several months, tasking the satellites or search-ing in recent archives. After acquiring suitable images, a team of experts systematically digitizes all the fields with coca bushes.7 Identification of the crops can be challeng-ing. Satellite images are taken at a height of hundreds of kilometres above ground and do not give the same detailed image as a snapshot taken from the ground. On the other hand, satellite images contain more informa-tion than a normal photo, since the satellites have extra sensors to register infrared colours. Precisely these infra-red colours help to distinguish vegetation types.8
In the classification process, additional geographical information is used to judge whether the fields appear-ing in the satellite image are really coca fields. For exam-ple, information on the places that were eradicated or sprayed is used as well as information from former sur-veys or contextual information, such as typical shapes, sizes and locations of coca fields. The interpretation of this diverse set of criteria is difficult to automate and is mostly done by human interpreters. All interpreters have extensive experience in working with satellite images and they are all familiar with the coca cultivation areas. The interpreters follow so-called interpretation keys to avoid systematic errors or differences between the inter-preters.9
Monitoring with satellite images should always be accompanied by ground control. Ideally these controls are performed by field visits throughout the monitored area. Since access to the ground in coca growing regions is often dangerous and difficult, UNODC performs ground ‘truthing’ by overflights with helicopters or small aeroplanes. Moreover, the results of the satellite interpre-tations are subject to independent quality controls with detailed aerial photos.
detail (‘spatial resolution’ or ‘pixel size’) of the images. The more detailed, the more expensive the images. However, the area to be monitored in Colombia is about 20 times larger than the areas in Peru or the Plurinational State of Bolivia, and therefore, the type of images is not the same in the three countries.
7 The full coverage of all the areas helps the governments to have local information on changes and target specific crop reduction pro-grammes.
8 Coca is a bush and the leaves can be harvested throughout the year. Therefore, the crop stage can vary by field but also within a field. At the time a satellite image is taken, a field can contain different crops in different growing stages, which gives a different appearance in the satellite images.
9 The keys were developed with the assistance of the University of Natural Resources and Applied Life Sciences in Vienna.
Estimating yield
Coca leaf yield is affected by unpredictable factors such as weather and plant diseases, as well as by eradication activities. The effect of these factors varies not only from year to year and during the course of a year but also from one cultivating region to the other. Since 2004, UNODC, in cooperation with the respective govern-ments, has undertaken coca leaf yield studies in many coca growing regions in the Plurinational State of Bolivia, Colombia and Peru. In the Plurinational State of Bolivia, a yield study was carried out in 2005 in the Yungas region, where the annual yield was estimated at 1.3 mt of sun-dried leaves per hectare. In Chapare, the other cultivating region, UNODC relies on DEA esti-mates, which report a yield of 2.7 mt/ha. In Peru, UNODC undertook a yield study in 2003, estimating the annual average yield to 2.2 mt/ha of sun-dried leaves. In Colombia, starting in 2004-2005, UNODC/SIMCI fields a yearly yield study which covers one or two regions on a rotating basis. The core element of these studies is the controlled harvest of mature coca fields.
The challenges related to the estimation of the annual yield relate to the difficulties of measuring the different harvests occurring in one year (four on average) and capturing the variation that the yield may have from one year to another. Ideally, the yield should be measured every year, in order to consider the climatic and environ-mental changes. However, yield studies need substantial resources, and not all areas under coca cultivation are accessible to field researchers for security reasons.
Country, region
Year of study
Yield (mt/ha)
Bolivia, Yungas 2005 1.3 mt/ha sun-dried
Bolivia, Chapare 2006 (Source: DEA)
2.7 mt/ha sun-dried
Peru 2003 2.2 mt/ha sun-dried
Colombia, Meta-Guaviare 2008 5.1 mt/ha fresh leaf
Colombia, Sur de Bolívar 2007 5.7 mt/ha fresh leaf
Colombia, Putumayo-Caquetá 2008 4.1 mt/ha
fresh leaf
Colombia, Orinoco 2005 7.1 mt/ha fresh leaf
Colombia, Pacífico 2009 3.8 mt/ha fresh leaf
Colombia, Catatumbo 2007 4.2 mt/ha fresh leaf
Colombia, Sierra Nevada 2007 2.9 mt/ha
fresh leaf
Latest coca yield estimates
Source: UNODC studies

251
4. Statistical Annex Production
Conversion factor from coca leaves to cocaine
Estimating the conversion factor from coca leaves to cocaine requires two steps: i) measuring the alkaloid content of the leaves, and ii) calculating the efficiency used by traffickers in the laboratory conversion process where cocaine base is converted into cocaine HCl. The alkaloid content of the leaves can be measured by analys-ing the chemical composition of a sample of coca leaves from the field. Studies have shown that it varies across geographical regions, but it does not significantly change over time. Alkaloid content is highest in Peru and the Plurinational State of Bolivia, where it is about 0.7%, and lowest in Colombia, where it is about 0.53%.10
Laboratory efficiency is more difficult to measure as there are different influencing factors: quality of the raw material and precursor chemicals used, the technical processing method employed, the size and sophistica-tion of laboratories, and the skill and experience of local workers and chemists. Studies to measure the efficiency are carried out by trying to simulate the real environ-ment where traffickers process cocaine in a laboratory. According to these studies, there are two main methods to produce cocaine: the solvent extraction method and the acid extraction method. The solvent method is thought to be the most efficient; however, traffickers are making the acid extraction method very efficient in Peru, where this method is most used.11
10 Although these numbers represent a national average, they can not be used to calculate cocaine production at the national level since they hide very diversified alkaloid contents measured in different regions of the same country.
11 Taking into consideration the alkaloid content of leaves and the laboratory efficiency.
The impact of conversion factors in the production estimates for the three Andean countries
According to the scientific studies conducted by the DEA, in the last decade, there has been an increase in the efficiency of the clandestine laboratories employed in the three Andean countries, which has resulted in different conversion factors from leaves to cocaine. These changes are mainly due to the higher percentage of traf-fickers using more efficient methods to extract the cocaine.
Until 2009, UNODC used the conversion factors obtained by the DEA in its previous round of studies dated 1994 in Peru and 1993 in the Plurinational State of Bolivia. In recent years, the DEA obtained new con-version factors which lead to a higher estimate of cocaine production (showing the need for a lower amount of leaves to produce pure cocaine).
In Colombia as well, more recent information obtained by UNODC shows that the conversion from cocaine base to cocaine HCL requires updated parameters:
Country Year of DEA studyConversion factor11 (quantity of leaves needed
to produce 1 kg of 100% pure cocaine HCL)
Plurinational State of Bolivia 1993 370 kg sun-dried (Chapare) 315 kg sun-dried (Yungas)
Plurinational State of Bolivia 2007-2008 256 kg sun-dried (Chapare)244 kg sun-dried (Yungas)
Peru 1994 400 kg sun-dried
Peru 2005 220 kg sun-dried
Conversion factors from coca leaves to cocaine HCl
Source: DEA scientific studies
Process used by UNODC to estimate 100% pure cocaine HCl from cocaine base of unknown purity
Source: DEA scientific studies
Cocaine base to cocaine HCl
1:0.9 (1 kg of base needed to produce 0.9 kg cocaine HCl)
Cocaine HCl 85% purity
Revised process to estimate pure cocaine HCl from cocaine base of unknown purity
Source: DEA scientific studies
Average purity of cocaine base 81%
Cocaine base to cocaine HCl
1:1 (1 kg of base needed to produce 1 kg cocaine HCL)

252
World Drug Report 2010
Applying the results of the more recent DEA studies has an effect on the level of cocaine production estimated for the three Andean countries, as shown in the graph. UNODC is currently analysing in more detail these new conversion factors.
Impact of conversion factors on global estimates of potential cocaine HCl production (mt)*
* Assuming that all other parameters remain unchanged.
1,0481,020 1,034 1,024
865842
1,1111,121
1,2641,2321,201
1,008980 984
822845
994
600
700
800
900
1000
1100
1200
1300
2004 2005 2006 2007 2008 2009
Co
cain
e, 1
00%
pu
re (
mt)
Applying the newconversion factors to allthree countries
Applying the newconversion factors only toColombia
Without changingconversion factors

Afghanistan4.1.2
4. Statistical Annex Production
253
1 The information in this section comes from the Afghanistan Opium Survey 2009 (UNODC/Ministry of Counter Narcotics) and can also be found at http://www.unodc.org/unodc/en/crop-monitoring/index.html. Source unless otherwise indicated: National Monitoring System supported by UNODC.
2 Figures in brackets represent the upper and lower limits of the 90% (for 2008) and 95% (for 2009) confidence interval.
3 Poppy-free provinces are those which are estimated to have less than 100 ha of opium cultivation.
4 Garda is the local term used in Afghanistan for the powder obtained by threshing and sieving the harvested and dried cannabis plants. This process is repeated several times and results in different quality of garda (first, second, …). Garda is further processed into hashish, which is the traded product.
5 Estimates are based on a population of 25.5 million and an average household size of 6.5 persons for 2009 (Afghan year 1387) and a popu-lation of 24.5 million for 2008 (Afghan year 1386). Source: Gov. of Afghanistan, Central Statistical Office.
6 In 2008, the fresh and dry opium prices at harvest time were based on farmers responses collected through the Annual Opium Survey. In 2009, prices at harvest time were derived from the opium price monitoring system and refer to the month when opium harvest actually took place in different regions of the country.
7 Nominal GDP estimates, without the drug economy. For 2008: US$ 10.2 billion (Afghan fiscal year 2007/08), for 2009: US$ 10.7 billion (Afghan fiscal year 2008/2009): Source: Gov. of Afghanistan, Central Statistical Office.
Fact sheet – Afghanistan Opium and Cannabis Surveys 20091
2008 Change on 2008 2009
Net opium cultivation (after eradication)2 157,000 ha(130,000-190,000 ha) -22% 123,000 ha
(102,000-137,000 ha)
Cannabis cultivation No data 10,000-24,000 ha
No. of poppy-free provinces3 No. of provinces affected by opium cultivation
1816
+2 prov.-2 prov.
2014
No. of provinces affected by cannabis cultivation No data 17
Opium poppy eradication 5,480 ha -2% 5,351
Weighted average opium yield 48.8 kg/ha +15% 56.1 kg/ha
Average cannabis resin (garda) yield No data 143 kg/ha
Potential production of opium in % of global potential opium production
7,700 mt89%
-10% 6,900 mt89%
Potential production of cannabis resin (garda)4 No data 1,500-3,500 mt
No. of household involved in opium cultivation5 in % of total population
366,5009.8%
-33% 245,2006.4%
No. of households involved in cannabis cultivation No data 40,000 (25,000-60,000)
Average farm-gate price (weighted by production) of dry opium at harvest time6 US$95/kg -34% US$64/kg
Average farm-gate price of cannabis resin (best quality) at the time of resin processing US$51/kg +14% US$58/kg
Total farm-gate value of opium production in % of GDP7
US$730 million7%
-40% US$438 million4%
Total farm-gate value of cannabis resin (garda) production No data US$39-94 million
Potential gross export value of opiates in % of GDP7
US$3.4 billion33%
-18% US$2.8 billion26%
Potential net export value of opiates in % of GDP7 n.a. US$2.3 billion
21%
Average yearly gross income from opium of opium grow-ing households US$1,997 -10% US$1,786
Average yearly gross income from cannabis of cannabis growing households No data US$1,553
Income from opium per ha (gross/net) US$4,700 / 2,585 -23% US$3,600 / 2,005
Income from cannabis per ha (gross/net) No data US$3,900 / 3,341
Income from wheat per ha (gross/net) US$1,600 / 1,280 -25% US$1,200 / 960
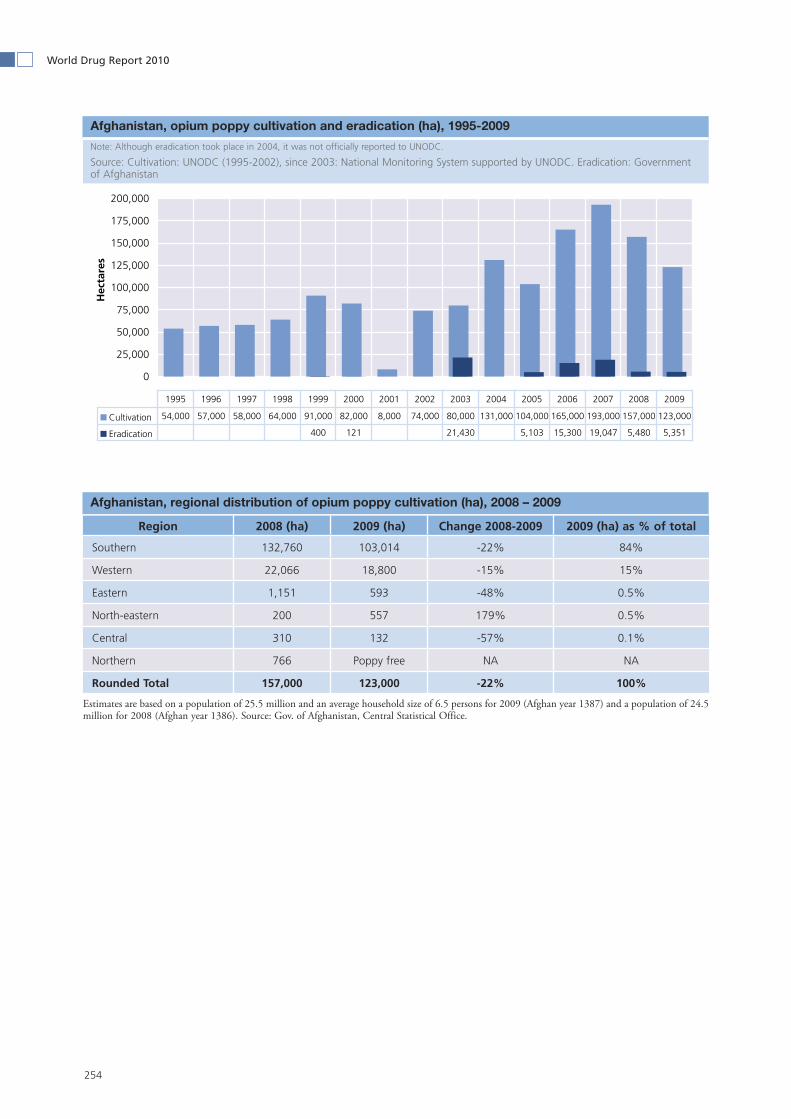
254
World Drug Report 2010
Afghanistan, opium poppy cultivation and eradication (ha), 1995-2009
Note: Although eradication took place in 2004, it was not officially reported to UNODC.
Source: Cultivation: UNODC (1995-2002), since 2003: National Monitoring System supported by UNODC. Eradication: Government of Afghanistan
Afghanistan, regional distribution of opium poppy cultivation (ha), 2008 – 2009
Region 2008 (ha) 2009 (ha) Change 2008-2009 2009 (ha) as % of total
Southern 132,760 103,014 -22% 84%
Western 22,066 18,800 -15% 15%
Eastern 1,151 593 -48% 0.5%
North-eastern 200 557 179% 0.5%
Central 310 132 -57% 0.1%
Northern 766 Poppy free NA NA
Rounded Total 157,000 123,000 -22% 100%
Estimates are based on a population of 25.5 million and an average household size of 6.5 persons for 2009 (Afghan year 1387) and a population of 24.5 million for 2008 (Afghan year 1386). Source: Gov. of Afghanistan, Central Statistical Office.
0
25,000
50,000
75,000
100,000
125,000
150,000
175,000
200,000
Hec
tare
s
Cultivation 54,000 57,000 58,000 64,000 91,000 82,000 8,000 74,000 80,000 131,000 104,000 165,000 193,000 157,000 123,000
Eradication 400 121 21,430 5,103 15,300 19,047 5,480 5,351
1995 1996 1997 1998 1999 2000 2001 2002 2003 2004 2005 2006 2007 2008 2009


256
World Drug Report 2010
Afghanistan, potential opium production (mt), 1995-2009
Source: Cultivation: UNODC (1995-2002), since 2003: National Monitoring System supported by UNODC. Eradication: Government of Afghanistan
Afghanistan, monthly farm-gate prices of dry opium (US$/kg), November 2002 to March 2009
0
1,000
2,000
3,000
4,000
5,000
6,000
7,000
8,000
9,000
Met
ric
ton
s
Opium production 2,335 2,248 2,804 2,693 4,565 3,276 185 3,400 3,600 4,200 4,100 6,100 8,200 7,700 6,900
1995 1996 1997 1998 1999 2000 2001 2002 2003 2004 2005 2006 2007 2008 2009
0
100
200
300
400
500
600
Nov
-02
Feb-
03
May
-03
Aug
-03
Nov
-03
Feb-
04
May
-04
Aug
-04
Nov
-04
Feb-
05
May
-05
Aug
-05
Nov
-05
Feb-
06
May
-06
Aug
-06
Nov
-06
Feb-
07
May
-07
Aug
-07
Nov
-07
Feb-
08
May
-08
Aug
-08
Nov
-08
Feb-
09
May
-09
Aug
-09
Nov
-09
Feb-
10
US$
/kg
no data

257
4. Statistical Annex Production
Afg
han
ista
n, m
on
thly
tra
der
pri
ces
of
dry
op
ium
(US
$/kg
), A
ug
ust
199
7 to
Mar
ch 2
010
0
100
200
300
400
500
600
700
Aug-97
Dec-97
Apr-98
Aug-98
Dec-98
Apr-99
Aug-99
Dec-99
Apr-00
Aug-00
Dec-00
Apr-01
Aug-01
Oct-01
Nov-01
Feb-02
May-02
Jun-02
Sep-02
Dec-02
Mar-03
Apr-03
Jun-03
Aug-03
Oct-03
Feb-04
Jun-04
Oct-04
Feb-05
Jun-05
Oct-05
Feb-06
Jun-06
Oct-06
Feb-07
Jun-07
Oct-07
Feb-08
Jun-08
Oct-08
Feb-09
Jun-09
Oct-09
Feb-10
US$/kg
Nan
gar
har
(Ea
ster
n A
fgh
anis
tan
)K
and
ahar
(So
uth
ern
Afg
han
ista
n)
Un
wei
gh
ted
ave
rag
e


4. Statistical Annex Production
259
4.1.3 Bolivia (Plurinational State of)
1 The information in this section comes from the report on Coca Cul-tivation in Bolivia (UNODC/Government of Bolivia, June 2010), and can also be found on the internet (http://www.unodc.org/unodc/en/crop-monitoring/index.html). Source unless otherwise indicated: National Monitoring System supported by UNODC.
2 Source: Instituto Nacional de Estadística de Bolivia (INE).3 Including installations producing cocaine base, HCl or “recycling”
precursors. Excluding coca leaf maceration pits.
Fact sheet – Bolivia Coca Survey 20091
2008 Change on 2008 2009
Coca cultivation Of which in the Yungas of La Paz in Chapare in ApoloOf which permitted by Bolivian law 1008
30,500 ha20,700 ha9,500 ha300 ha
12,000 ha
+1%+1%+2%0%
30,900 ha20,900 ha9,700 ha300 ha
12,000 ha
Production of sun-dried coca leafPotential production of cocaine HCl
54,000 mt113 mt
+1% 54,800 mtn.a.**
National weighted average farm-gate price of coca leaf (outside state market) US$5.4/kg -9% US$4.9/kg
Total farm-gate value of coca leaf productionGDP2 Farm-gate value of coca leaf production in %of GDP Farm-gate value of coca leaf production in % of GDP of agricultural sector
US$293 millionUS$9.7 billion
3.0%
21%
-10% US$265 millionUS$13.0 billion
2%
14%
Reported eradication of coca bush* 5,484 ha +16% 6,341 ha
Reported seizure of sun-dried coca leaves* 2,095 mt -22% 1,624 mt
Reported seizure of cocaine base* 21,641 kg +2% 21,970 kg
Reported seizure of cocaine HCl* 7,246 kg -32% 4,922 kg
Reported destruction of coca laboratories3* 4,999 kg -2% 4,888 kg
Reported seizure of cannabis herb* 1,112,588 kg +74% 1,937,412 kg
* As reported by the Government of the Plurinational State of Bolivia. ** Conversion rates from coca leaf to cocaine are currently being reviewed. This may lead to a revision of the 2008 figure (and of previous years). An estimate of the 2009 potential cocaine production was not available at the time of printing of this report.
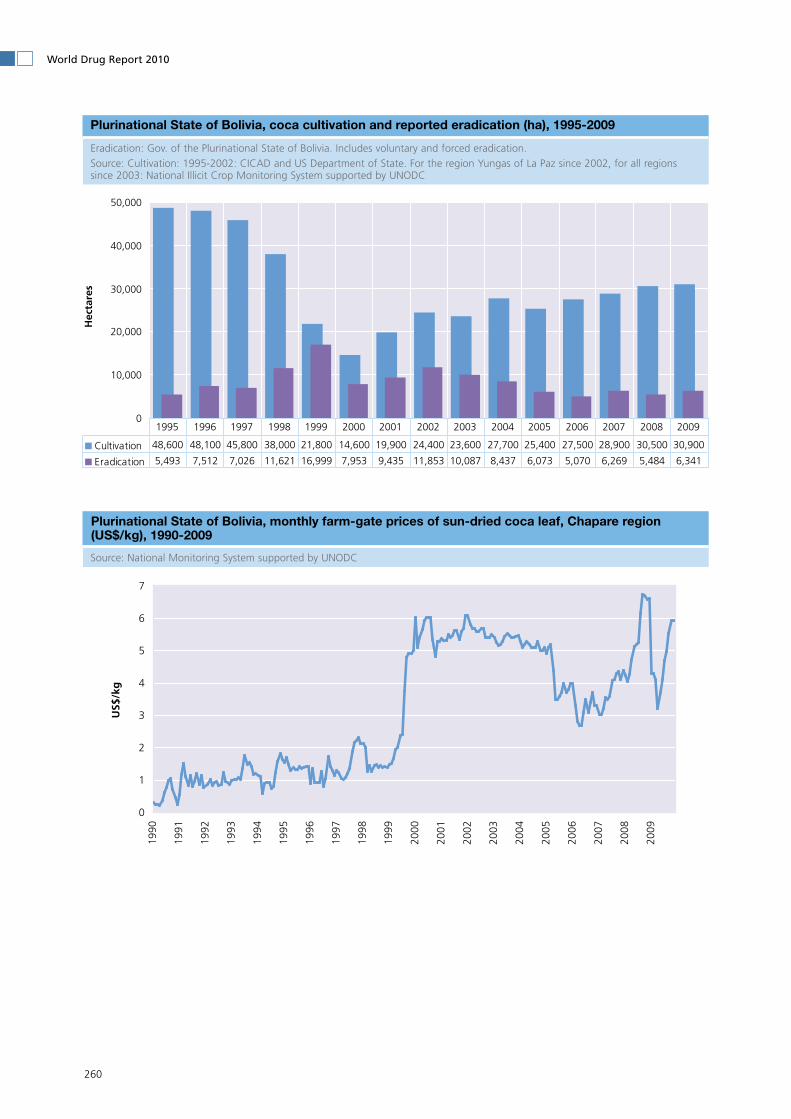
260
World Drug Report 2010
Plurinational State of Bolivia, coca cultivation and reported eradication (ha), 1995-2009
Eradication: Gov. of the Plurinational State of Bolivia. Includes voluntary and forced eradication.
Source: Cultivation: 1995-2002: CICAD and US Department of State. For the region Yungas of La Paz since 2002, for all regions since 2003: National Illicit Crop Monitoring System supported by UNODC
Plurinational State of Bolivia, monthly farm-gate prices of sun-dried coca leaf, Chapare region (US$/kg), 1990-2009
Source: National Monitoring System supported by UNODC
0
10,000
20,000
30,000
40,000
50,000
Hec
tare
s
Cultivation 48,600 48,100 45,800 38,000 21,800 14,600 19,900 24,400 23,600 27,700 25,400 27,500 28,900 30,500 30,900
Eradication 5,493 7,512 7,026 11,621 16,999 7,953 9,435 11,853 10,087 8,437 6,073 5,070 6,269 5,484 6,341
1995 1996 1997 1998 1999 2000 2001 2002 2003 2004 2005 2006 2007 2008 2009
0
1
2
3
4
5
6
7
1990
1991
1992
1993
1994
1995
1996
1997
1998
1999
2000
2001
2002
2003
2004
2005
2006
2007
2008
2009
US$
/kg


4. Statistical Annex Production
263
4.1.4 Colombia
1 The information in this section comes from the report on Coca Cultivation in Colombia (UNODC/Government of Colombia, June 2010), and can also be found on the internet (http://www.unodc.org/unodc/en/crop-monitoring/index.html). Source unless otherwise indicated: National monitoring system supported by UNODC.
2 The 2008 estimate of 430 mt was revised based on more detailed information on the average cocaine base purity (81%) and the cocaine base to HCl conversion ratio (1:1) available from the US Government/DEA.
3 GDP of the respective year as reported by the Government.
Fact sheet – Colombia Coca Survey 20091
2008Change on
20082009
Net coca cultivation (rounded total)
Of which Pacific region
Central region
Putumayo-Caquetá region
Meta-Guaviare region
Elsewhere
81,000 ha
29,920 ha
18,730 ha
13,960 ha
12,150 ha
6,200 ha
-16%
-16%
-14%
-35%
+4%
-19%
68,000 ha
25,170 ha
16,130 ha
9,070 ha
12,620 ha
5,010 ha
Potential production of cocaine2 450 mt -9% 410 mt
Average farm-gate price of coca paste
Average wholesale price of cocaine* (of unknown purity in major cities)
US$963/kgCOP 1,887,855/kg
US$2,348/kgCOP 4,580,000/kg
-1%+8%
-9%0%
US$956/kgCOP 2,047,970/kg
US$2,147/kgCOP 4,587,413/kg
Total farm-gate value of the production of coca leaf and its derivatives US$623 million -21% US$494 million
in per cent of GDP3
in per cent of agricultural sector0.3%3%
0.2%3%
Reported aerial spraying of coca bush*
Reported manual eradication of coca bush*
Reported seizure of cocaine*
Reported destruction of coca processing laboratories*
Of which cocaine HCl processing lab.
133,496 ha
95,634 ha
198 mt
3,443
296
-22%
-37%
+3%
-16%
-7%
104,772 ha
60,557 ha
203 mt
2,888
278
Reported opium poppy cultivation* 394 ha -40% 356 ha
Potential opium latex production**Potential heroin production (rounded) **
31 mt1.3 mt
-16%-16%
26 mt1.1 mt
Average farm-gate price of opium latex* US$318/kg +13% US$358/kg
Average wholesale heroin price* US$9,950/kg +0.4% US$9,993/kg
Reported seizure of heroin* 646 kg +13% 732 kg
* As reported by the Government of Colombia. ** Own calculations based on regional yield figures and conversion ratios from US Government/DEA.

264
World Drug Report 2010
Potential manufacture of cocaine in Colombia4
4 In past years, UNODC published a single graph with production data up to the latest year available emphasizing the break in series between 2003 and 2004. This year three graphs are published empha-sizing the non-comparability of the data presented for three sets of years.
5 Over the period 1999-2003 UNODC monitored the coca cultiva-tion in Colombia, but it did not carry out yield studies and therefore production figures comparable with the data after 2004 can not be calculated. Different figures for the years 1999-2003 can be calcu-lated using different assumptions on the level of yield during these years. Utilizing UNODC cultivation data and a cocaine yield calcu-lated from US estimates of coca cultivation and cocaine production produces the line labelled “Constructed with UNODC cultivation
and US yield”. The line labelled “US Government estimate” simply reports the cocaine production figures published by the United States, which are based on their own cultivation and yield estimates for Colombia. The line labelled “Constructed with UNODC culti-vation and UNODC 2005 yield” was calculated utilizing UNODC cultivation data and a cocaine yield calculated through a linear interpolation of the cocaine yield reported by the Government of Colombia for 2000 (5.8 kg/ha) and the cocaine yield estimated by UNODC for 2005 (8.2 kg/ha). Although these estimates are not comparable with UNODC estimates for 2004 and later, the decrease over the period 2001-2003 was additional to the further decrease over the period 2004-2009.
Colombia, coca cultivation and reported eradication/spraying (ha), 1995-2009
Sources: Cultivation: 1995-1998: CICAD and US Department of State, International Narcotics Control Strategy Report; since 1999: National Illicit Crop Monitoring System supported by UNODC; eradication/spraying: Government of Colombia
0
20,000
40,000
60,000
80,000
100,000
120,000
140,000
160,000
180,000
200,00019
95
1996
1997
1998
1999
2000
2001
2002
2003
2004
2005
2006
2007
2008
2009
Hec
tare
s
Spraying (cumul.) Manual eradication Coca cultivation (after eradication)
Potential manufacture of cocaine in Colombia (mt), 1995-1998*
* Data sourced from US government estimates. UNODC did not have monitoring systems in place during the period 1995-1998.
0
50
100
150
200
250
300
350
400
450
500
1995 1996 1997 1998
Met
ric
ton
s
Potential manufacture of cocaine in Colombia (mt), 1999-20035
0
200
400
600
800
1,000
1999 2000 2001 2002 2003
Met
ric
ton
s
Constructed with UNODC cultivation andUS yieldConstructed with UNODC cultivation andUNODC 2005 yieldUS Govt. Estimate

265
4. Statistical Annex Production
Potential manufacture of cocaine in Colombia (mt), 2004-2009
Data estimated on the basis of the cultivation census and the yield measurements regularly implemented by UNODC since 2004, as well as information on cocaine base purity and cocaine base to HCI conver-sion ratio from DEA.
Colombia, monthly farm-gate price of coca paste, Jan. 2000 to Dec. 2009 (‘000 COP/kg)
Source: National monitoring system supported by UNODC
Colombia, annual average wholesale prices for cocaine HCl (US$/kg and ‘000 COP/kg), 1991-2009
Note: Nominal prices of cocaine of unknown purity in major cities of Colombia. Source: DIRAN
Colombia, annual farm-gate prices for opium latex, 2002-2009
Note: Nominal prices. Source: DIRAN
Colombia, annual wholesale price of heroin, 2002-2009
Note: Nominal prices for heroin of unknown purity. Source: DIRAN.
0100200300400500600700800900
1,000
2004 2005 2006 2007 2008 2009
Met
ric
ton
s
UNODC estimate
1,000
1,200
1,400
1,600
1,800
2,000
2,200
2,400
2,600
Jan-
00
Jan-
01
Jan-
02
Jan-
03
Jan-
04
Jan-
05
Jan-
06
Jan-
07
Jan-
08
Jan-
09
'000
Co
lom
bia
n p
eso
s/kg
No dataNational average price ('000 COP/kg)
0500
1,0001,5002,0002,5003,0003,5004,0004,5005,000
1991
1992
1993
1994
1995
1996
1997
1998
1999
2000
2001
2002
2003
2004
2005
2006
2007
2008
2009
Pric
e p
er k
g
'000 COP/kg US$/kg
0
100
200
300
400
500
600
700
800
Op
ium
late
x/kg
Opium latex ('000 COP/kg)
Opium latex (US$/kg)
Opium latex ('000 COP/kg)
529 444 433 534 593 591 612 754
Opium latex (US$/kg)
211 154 164 230 251 286 318 358
2002
2003
2004
2005
2006
2007
2008
2009
0
5,000
10,000
15,000
20,000
25,000
Her
oin
/kg
Heroin ('000 COP/kg) Heroin (US$/kg)
Heroin('000 COP/kg) 21,370 16,561 20,067 21,051 23,822 22,294 19,560 21,422
Heroin(US$/kg) 8,520 5,740 7,635 9,070 10,103 10,780 9,950 9,993
2002 2003 2004 2005 2006 2007 2008 2009


4. Statistical Annex Production
267
4.1.5 Lao People’s Democratic Republic
1 The information in this section comes from the report on Opium Poppy Cultivation in South-East Asia (UNODC/Governments of Lao PDR and Myanmar December 2009), and can also be found on the internet (http://www.unodc.org/unodc/en/crop-monitoring/index.html). Source unless otherwise indicated: National monitoring system supported by UNODC. Figures in brackets represent the upper and lower limits of the 90% confidence interval.
2 In the absence of a yield survey in2008 and 2009, the yield per hec-tare for 2007 was used.
3 Source: LCDC, Provincial authorities survey. Due to the limited market for opium, a clear distinction between farm gate, wholesale and retail prices could not be established.
4 Source: LCDC. Since 2008, eradication campaigns were conducted during and after the survey.
2008 Change on 2008 2009
Opium poppy cultivation 1,600 ha(600-2,700 ha ) +18.8% 1,900 ha
(900-3,000 ha)
Average dry opium yield2 6 kg/ha - 6 kg/ha
Potential production of dry opium 9.6 mt(4.3-16.1 mt) +18.8% 11.4 mt
(5.4-18 mt)
Average retail/wholesale price of opium3 US$1,227/kg +8% US$1,327
Eradication4 575 ha +13% 651 ha
Number of new opium addicts 4,906 - n/a
Average drug prevalence rate (based on 7 northern provinces in 2008) 0.19% n/a
Fact sheet – Lao People’s Democratic Republic Opium Survey 20091
Lao People’s Democratic Republic, opium poppy cultivation* and eradication (ha), 2003-2009
* After eradication. Source: Cultivation: National monitoring system supported by UNODC; eradication: Government of Lao PDR
0
2,000
4,000
6,000
8,000
10,000
12,000
14,000
Hec
tare
s
Cultivation 12,000 6,600 1,800 2,500 1,500 1,600 1,900
Eradication 4,134 3,556 2,575 1,518 779 575 651
2003 2004 2005 2006 2007 2008 2009

268
World Drug Report 2010
Lao People’s Democratic Republic, potential opium production (mt), 1995-2009
Source: National monitoring system supported by UNODC
Lao People’s Democratic Republic, annual opium prices (US$/kg), 2002-2009
Source: LCDC, Provincial authorities survey
0
20
40
60
80
100
120
140
160
180
Met
ric
ton
s
Production 128 140 147 124 124 167 134 112 120 43 14 20 9.0 9.6 11.4
1995 1996 1997 1998 1999 2000 2001 2002 2003 2004 2005 2006 2007 2008 2009
160 172218
521 550
974
1,227
1,327
0
200
400
600
800
1,000
1,200
1,400
2002 2003 2004 2005 2006 2007 2008 2009
US$
/kg

4. Statistical Annex Production
269
4.1.6 Myanmar
Fact sheet – Myanmar Opium Survey 20091
1 The information in this section comes from the report on Opium Poppy Cultivation in South East Asia (UNODC/Governments of Lao PDR and Myanmar, December 2009), and can also be found on the internet (http://www.unodc.org/unodc/en/crop-monitoring/index.html). Figures in bracket refer to the upper and lower limits of the 95% confidence interval.
2 Source: CCDAC.
3 For 2008: yearly average price. For 2009: price at harvest time.4 The farm-gate value should calculated with the price of dry opium.
However, the price of dry opium is difficult to establish in Myanmar because of the selling and storing practices of the farmers. The farm-gate value here is calculated with the price of fresh opium. This result in a lower estimate.
2008 Change on 2008 2009
Opium poppy cultivation in Myanmar
Of which in East Shan State North Shan State South Shan State Elsewhere
28,500 ha(17,900 to 37,000 ha)
9,300 ha800 ha
15,500 ha3,200 ha
+11%
+25%+100%+10%-16%
31,700 ha(24,00 to 42,900 ha)
11,900 ha1,600 ha
16,500 ha1,700 ha
Opium poppy cultivation in Shan State 25,300 ha +19% 30,000 ha(24,000 to 40,000)
Average opium yield (weighted by area) 14.4 kg/ha -27.8% 10.4 kg/ha
Potential production of dry opium in Myanmar (including the Shan State) 410 mt -19.5% 330 mt
(214 to 447)
Opium poppy eradication in Myanmar2 4,820 ha -15.2% 4,087 ha
Average farm-gate price of opium3 US$301/kg +5% US$317/kg
Total potential farm-gate value of opium production4 US$123 million -15% US$105 million
(68 to 142)
Estimated number of households involved in opium poppy cultivation in Myanmar 168,000 +14% 192,000
(160,000 to 225,000)
Number of persons involved in opium poppy cultivation in Myanmar 840,000 +27% 1,066,000
(890,000 to 1,250,000)
Estimated number of households involved in opium poppy cultivation in the Shan State 148,900 19% 176,500
(141,200 to 235,300)
Average yearly household income in opium producing households (Shan State) Of which from opium salesPer capita income in opium producing households (Shan State)
US$687
US$253US$137
+2%
-37%-9%
US$700
US$160US$125
Household average yearly income in non-opium poppy producing households (Shan State)Per capita income in non-opium producing households (Shan State)
US$721
US$144
+4%
-8%
US$750
US$133
Addiction prevalence rate in Shan State and Kachin (population aged 15 and above) 1.1% +36% 1.5%
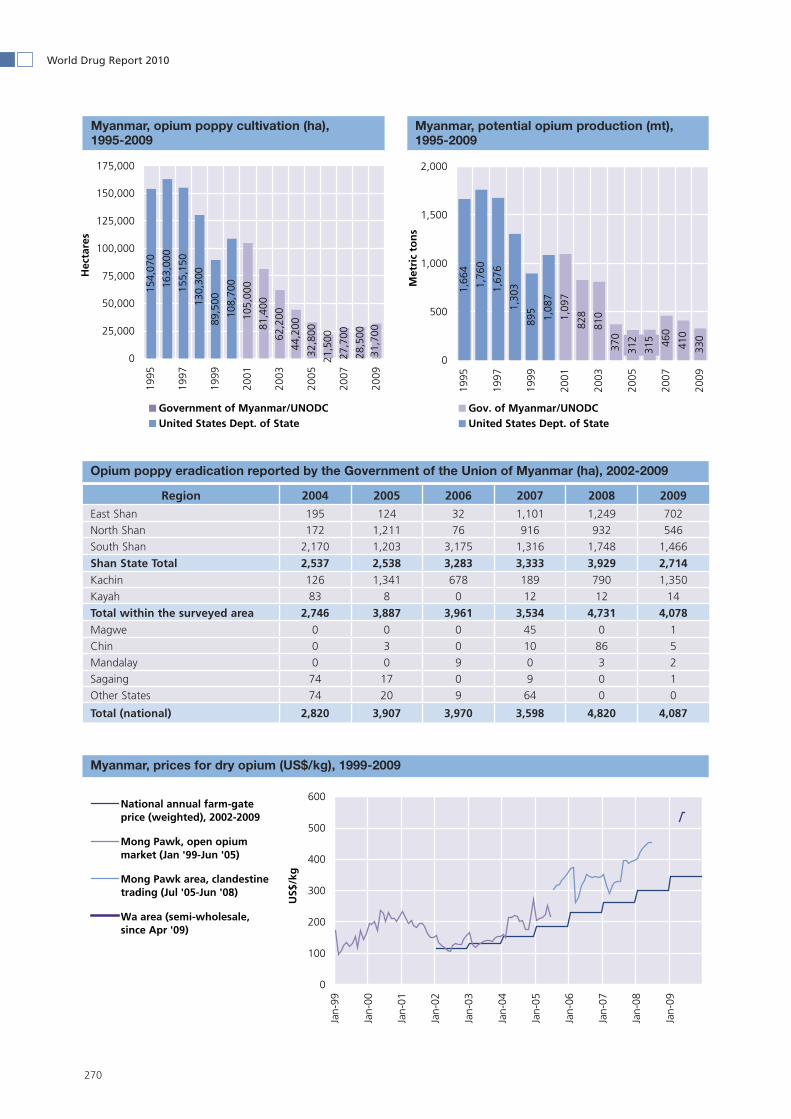
270
World Drug Report 2010
Myanmar, opium poppy cultivation (ha), 1995-2009
Opium poppy eradication reported by the Government of the Union of Myanmar (ha), 2002-2009
Region 2004 2005 2006 2007 2008 2009
East Shan 195 124 32 1,101 1,249 702North Shan 172 1,211 76 916 932 546South Shan 2,170 1,203 3,175 1,316 1,748 1,466
Shan State Total 2,537 2,538 3,283 3,333 3,929 2,714Kachin 126 1,341 678 189 790 1,350Kayah 83 8 0 12 12 14
Total within the surveyed area 2,746 3,887 3,961 3,534 4,731 4,078Magwe 0 0 0 45 0 1Chin 0 3 0 10 86 5Mandalay 0 0 9 0 3 2Sagaing 74 17 0 9 0 1Other States 74 20 9 64 0 0
Total (national) 2,820 3,907 3,970 3,598 4,820 4,087
154,
070
163,
000
155,
150
130,
300
89,5
00
108,
700
105,
000
81,4
00
62,2
00
44,2
00
32,8
00
27,7
00
28,5
0031
,700
21,5
00
0
25,000
50,000
75,000
100,000
125,000
150,000
175,000
1995
1997
1999
2001
2003
2005
2007
2009
Hec
tare
s
Government of Myanmar/UNODCUnited States Dept. of State
Myanmar, potential opium production (mt), 1995-2009
Myanmar, prices for dry opium (US$/kg), 1999-2009
1,66
4
1,76
0
1,67
6
1,30
3
895
1,08
7
1,09
7
828
810
370
460
410
330
312
315
0
500
1,000
1,500
2,000
1995
1997
1999
2001
2003
2005
2007
2009
Met
ric
ton
sGov. of Myanmar/UNODCUnited States Dept. of State
0
100
200
300
400
500
600
Jan-
99
Jan-
00
Jan-
01
Jan-
02
Jan-
03
Jan-
04
Jan-
05
Jan-
06
Jan-
07
Jan-
08
Jan-
09
US$
/kg
National annual farm-gateprice (weighted), 2002-2009
Mong Pawk, open opiummarket (Jan '99-Jun '05)
Mong Pawk area, clandestinetrading (Jul '05-Jun '08)
Wa area (semi-wholesale,since Apr '09)
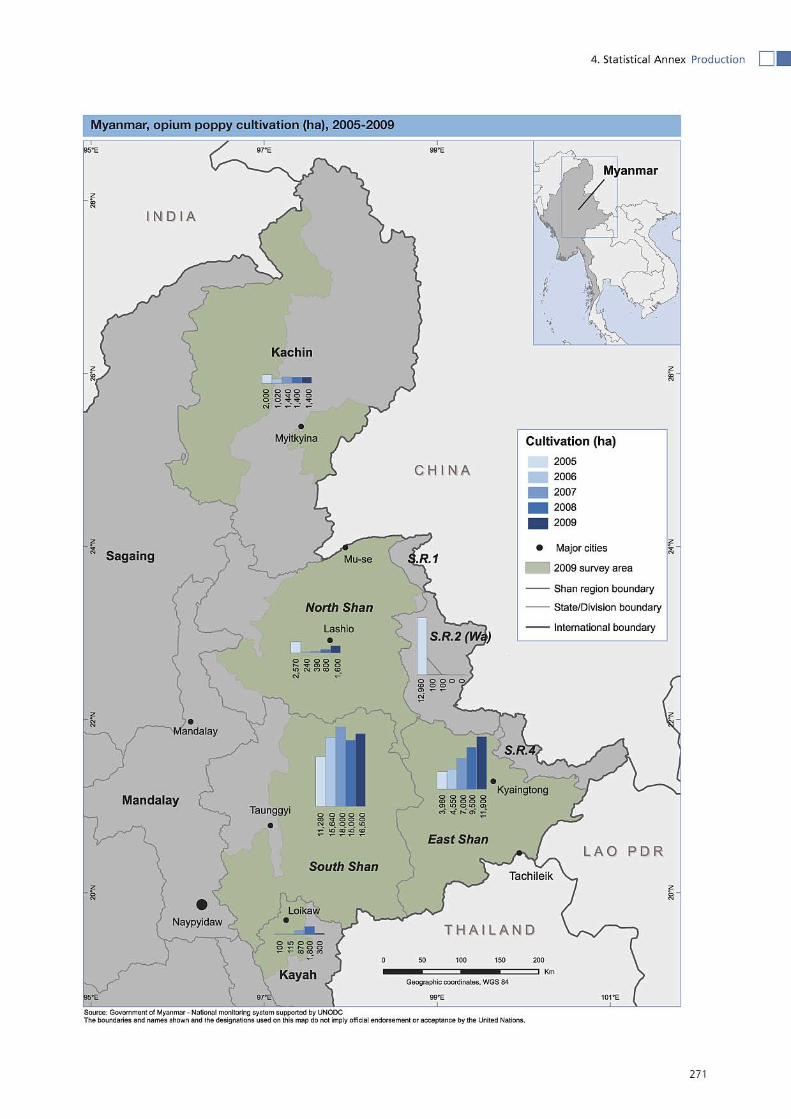


4. Statistical Annex Production
273
4.1.7 Peru
Fact sheet – Peru Coca Survey 20091
1 The information in this section comes from the report on Coca Cultivation in Peru (UNODC/Government of Peru, June 2010), and can also be found on the Internet (http://www.unodc.org/unodc/en/crop-monitoring/index.html). Source unless otherwise indicated: National monitoring system supported by UNODC.
2 Includes all coca leaf potentially produced. For the calculation of coca leaf available for cocaine production, 9,000 mt of sun-dried coca leaf were deducted from this figure, which, according to Government sources, is the amount used for traditional purposes.
3 The weighted average price takes into account that different amounts of coca leaf are sold in different regions at different price levels.
4 Takes into account all coca leaf produced, irrespective of its use. For the calculation, the weighted average coca leaf price was used.
5 Excluding coca leaf macerations pits.
2008 Change on 2008 2009
Coca cultivation Of which in Alto Huallaga Apurímac-Ene La Convención-Lares Elsewhere
56,100 ha17,800 ha16,700 ha13,100 ha8,500 ha
+7%-2%+5%+1%
+38%
59,900 ha17,500 ha17,500 ha13,200 ha11,700 ha
Weighted average sun-dried coca leaf yield 2,200 kg/ha -5% 2,100 kg/ha
Potential production of sun-dried coca leaf2
Potential production of sun-dried coca leaf available for cocaine productionPotential production of cocaine HCl
122,300 mt113,300 mt
302 mt
+5%+5%
128,000 mt119,000 mt
n.a.**
Average farm-gate price of sun-dried coca leafAverage farm-gate price of sun-dried coca leaf (weighted)3
Average farm-gate price of coca pasteAverage price of cocaine HCl in coca cultivating regions
US$3.4/kgUS$3.1/kgUS$723/kgUS$940/kg
-6%-3%+7%+9%
US$3.2/kgUS$3.0/kgUS$778/kg
US$1,021/kg
Potential farm-gate value of sun-dried coca leaf4 US$379 million +1% US$384 million
Reported eradication of coca cultivation*Reported seizure of sun-dried coca leaves*Reported seizure of coca paste*Reported seizure of cocaine HCl*Reported destruction of coca laboratories5* Of which cocaine HCl processing laboratories
10,143 ha2,132 mt11,374 kg16,203 kg
1,22419
-1%-52%-16%-34%+1%+32%
10,025 ha1,031 mt9,914 kg
10,744 kg1,242
25
Reported seizure of opium latex* 128 kg n.a.
* As reported by the Government of Peru. ** Conversion rates from coca leaf to cocaine are currently being reviewed. This may lead to a revision of the 2008 figure (and of previous years). An estimate of the 2009 potential cocaine production in Peru was not available at the time of printing of this report.
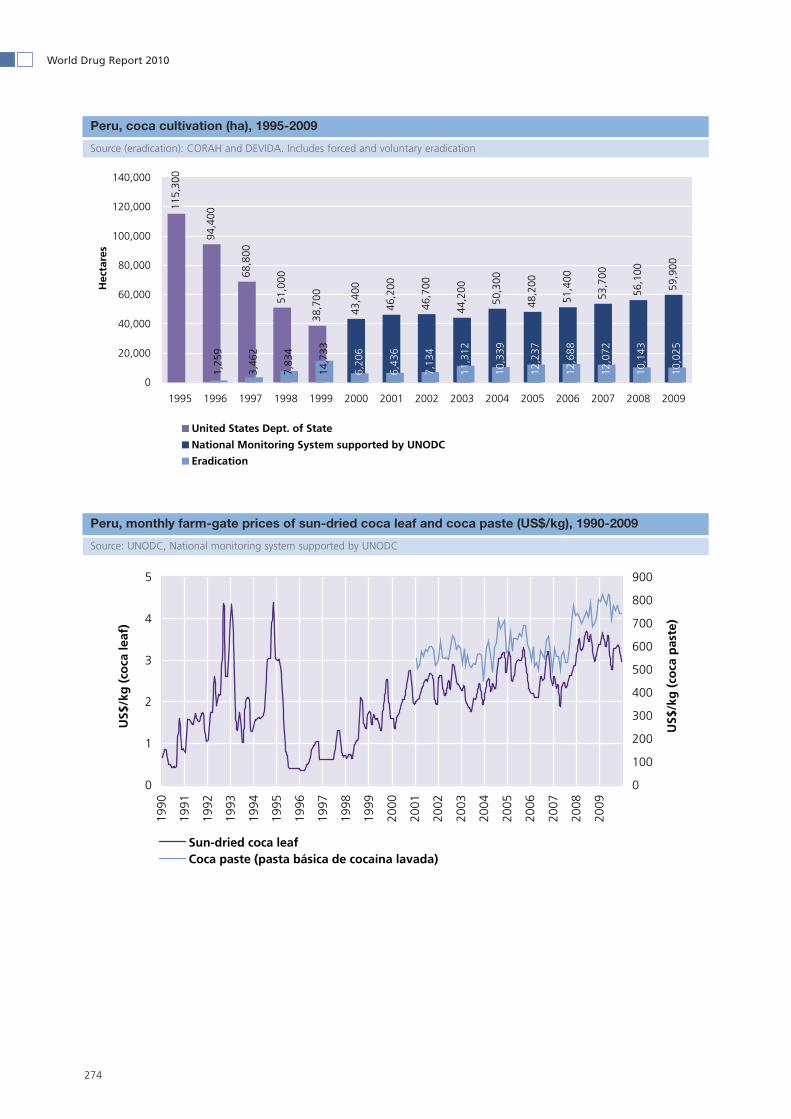
274
World Drug Report 2010
Peru, coca cultivation (ha), 1995-2009
Source (eradication): CORAH and DEVIDA. Includes forced and voluntary eradication
Peru, monthly farm-gate prices of sun-dried coca leaf and coca paste (US$/kg), 1990-2009
Source: UNODC, National monitoring system supported by UNODC
115,
300
94,4
00
68,8
00
51,0
00
38,7
00
43,4
00
46,2
00
46,7
00
44,2
00
50,3
00
48,2
00
51,4
00
53,7
00
56,1
00
59,9
00
6,20
6
6,43
6
7,13
4
11,3
12
10,3
39
12,2
37
12,6
88
12,0
72
10,1
43
10,0
25
14,7
33
1,25
9
3,46
2
7,83
4
0
20,000
40,000
60,000
80,000
100,000
120,000
140,000
1995 1996 1997 1998 1999 2000 2001 2002 2003 2004 2005 2006 2007 2008 2009
Hec
tare
s
United States Dept. of State
National Monitoring System supported by UNODC
Eradication
0
1
2
3
4
5
1990
1991
1992
1993
1994
1995
1996
1997
1998
1999
2000
2001
2002
2003
2004
2005
2006
2007
2008
2009
US$
/kg
(co
ca le
af)
0
100
200
300
400
500
600
700
800
900
US$
/kg
(co
ca p
aste
)
Sun-dried coca leafCoca paste (pasta básica de cocaína lavada)


4.2 Consumption
277
Annual Prevalence of Use as a percentage of the population aged 15-64 (unless otherwise indicated)
OPIATES
Country or TerritoryUncertainty
Range Ages Year Source (original) Method
UNODC Adjusted
UNODC Best
Estimate
AFRICAEast Africa
Burundi No recent, reliable estimate locatedComoros No recent, reliable estimate locatedDjibouti No recent, reliable estimate locatedEritrea No recent, reliable estimate locatedEthiopia No recent, reliable estimate located
2004 c, i0.16 - 1.30 15 - 64Kenya Reference Group to the UN on HIV I0.73Madagascar No recent, reliable estimate located
200715 - 54Mauritius ARQ I1.95200415 - 64Rwanda Cure Research estimate0.14
Seychelles No recent, reliable estimate located200415 - 64Somalia Cure Research estimate0.16
Tanzania (United Republic of) No recent, reliable estimate located200415 - 64Uganda Cure Research estimate0.05
North Africa200415 - 64Algeria UNODC Estimate0.122006 a, d0.14 - 0.73 15 - 64Egypt Govt; Academic Research HHS, SS0.44200415 - 64Libyan Arab Jamahiriya UNODC Estimate0.14200315 - 64Morocco ARQ0.02
Sudan No recent, reliable estimate located200615 - 64Tunisia UNODC Estimate0.09
Southern Africa200115 - 64Angola UNODC Estimate0.25
Botswana No recent, reliable estimate locatedLesotho No recent, reliable estimate locatedMalawi No recent, reliable estimate locatedMozambique No recent, reliable estimate locatedNamibia No recent, reliable estimate located
2005 d,e,g,i0.35 - 0.39 15 - 64South Africa ARQ/ Reference Group to the UN on SS, I0.38200415 - 64Swaziland Cure Research estimate0.17200315 - 64Zambia UNODC Estimate0.37200415 - 64Zimbabwe Cure Research estimate0.04
West and Central AfricaBenin No recent, reliable estimate locatedBurkina Faso No recent, reliable estimate locatedCameroon No recent, reliable estimate located
200415 - 64Cape Verde UNODC Estimate0.18200415 - 64Central African Republic Cure Research estimate0.05200415 - 64Chad Cure Research estimate0.22200415 - 64Congo Cure Research estimate0.17200415 - 64Congo (Dem. Rep. of the) Cure Research estimate0.13
Côte d'Ivoire No recent, reliable estimate locatedEquatorial Guinea No recent, reliable estimate locatedGabon No recent, reliable estimate locatedGambia No recent, reliable estimate located
200415 - 65Ghana Cure Research estimate0.14Guinea No recent, reliable estimate locatedGuinea-Bissau No recent, reliable estimate located
200415 - 64Liberia Cure Research estimate0.17Mali No recent, reliable estimate locatedMauritania No recent, reliable estimate located
200415 - 64Niger Reference Group to the UN on HIV I0.20Nigeria No recent, reliable estimate locatedSaint Helena No recent, reliable estimate locatedSao Tome and Principe No recent, reliable estimate located
2006 a, d, e 15 - 64Senegal UNODC Estimate SS0.08
Method: HHS=Household survey, SS=School survey, A=Adjusted from other sources, I=Indirect estimates, R=Registry. * approximate estimates
UNODC Adjustments: a=adjusted for age (15-64), b=population-based/household-type study/survey, c=adjusted from a limited geographic population-based study/survey, d=adjusted from school/youth survey, e=adjusted from lifetime/monthly prevalence adjusted to annual prevalence, f=adjusted from specialized population surveys (including Rapid Assessments), g=adjusted from treatment data, h=adjusted from drug registries, i=adjusted from HIV, problematic drug users (only for heroin), j=lifetime prevalence reported,x=figure may include non-medical use of prescription opioids, z=figures may also include other non-ATS stimulants
Annual prevalence4.2.1
Opiates4.2.1.1

278
World Drug Report 2010
Annual Prevalence of Use as a percentage of the population aged 15-64 (unless otherwise indicated)
OPIATES
Country or TerritoryUncertainty
Range Ages Year Source (original) Method
UNODC Adjusted
UNODC Best
Estimate
200415 - 64Sierra Leone Cure Research estimate0.17Togo No recent, reliable estimate located
AMERICASCaribbean
Anguilla No recent, reliable estimate located200015 - 64Antigua and Barbuda ARQ0.05200315 - 64Bahamas UNODC Estimate0.22200615 - 64Barbados UNODC Estimate0.13
Bermuda No recent, reliable estimate locatedBritish Virgin Islands No recent, reliable estimate locatedCayman Islands No recent, reliable estimate locatedCuba No recent, reliable estimate locatedDominica No recent, reliable estimate located
200115 - 64Dominican Republic UNODC Estimate0.14Grenada No recent, reliable estimate located
2006 a, d, e0.19 - 0.22 15 - 64Haiti ARQ SS0.20200115 - 64Jamaica UNODC Estimate0.10
Montserrat No recent, reliable estimate locatedNetherlands Antilles No recent, reliable estimate located
200215 - 64Puerto Rico Reference Group to the UN on HIV I1.15Saint Kitts and Nevis No recent, reliable estimate locatedSaint Lucia No recent, reliable estimate locatedSaint Vincent and the Grenadines No recent, reliable estimate located
200215 - 64Trinidad and Tobago UNODC Estimate0.09200215 - 64Turks and Caicos Islands UNODC Estimate0.07
United States Virgin Islands No recent, reliable estimate located
Central AmericaBelize No recent, reliable estimate located
200612 - 70Costa Rica ARQ HHS2.702005 e15 - 64El Salvador UNODC Estimate HHS0.14200515 - 64Guatemala ARQ0.042005 e15 - 64Honduras UNODC Estimate HHS0.15
Nicaragua No recent, reliable estimate locatedPanama No recent, reliable estimate located
North America200815 - 64Canada Govt. source (CADUMS) HHS, x0.5020080.04 - 0.10 15 - 64Mexico ARQ HHS0.08
Saint Pierre and Miquelon No recent, reliable estimate located200015 - 64United States of America Govt. source (ONDCP) I0.58
South America2005 e15 - 64Argentina UNODC Estimate0.162007 e12 - 65Bolivia (Plurinational State of) ARQ HHS0.302005 e15 - 64Brazil ARQ HHS0.50200815 - 64Chile HHS HHS0.50200415 - 64Colombia UNODC Estimate0.102005 e15 - 64Ecuador UNODC Estimate0.12
Falkland Islands (Malvinas) No recent, reliable estimate located200215 - 64Guyana UNODC Estimate0.252003 e12 - 65Paraguay ARQ HHS0.03200512 - 64Peru UNODC Estimate0.182002 e15 - 64Suriname UNODC Estimate0.082006 e15 - 64Uruguay ARQ HHS0.082003 a, d, e0.03 - 0.16 15 - 64Venezuela (Bolivarian Republic of) ARQ SS0.10
ASIACentral Asia and Transcaucasian countries
200515 - 64Armenia ARQ HHS0.302008 i15 - 64Azerbaijan ARQ0.20
Method: HHS=Household survey, SS=School survey, A=Adjusted from other sources, I=Indirect estimates, R=Registry. * approximate estimates
UNODC Adjustments: a=adjusted for age (15-64), b=population-based/household-type study/survey, c=adjusted from a limited geographic population-based study/survey, d=adjusted from school/youth survey, e=adjusted from lifetime/monthly prevalence adjusted to annual prevalence, f=adjusted from specialized population surveys (including Rapid Assessments), g=adjusted from treatment data, h=adjusted from drug registries, i=adjusted from HIV, problematic drug users (only for heroin), j=lifetime prevalence reported,
The 'Method' and 'UNODC Adj.' columns have been completed only for more recent data included in previous and present issues of the World Drug Report.
x=figure may include non-medical use of prescription opioids, z=figures may also include other non-ATS stimulants
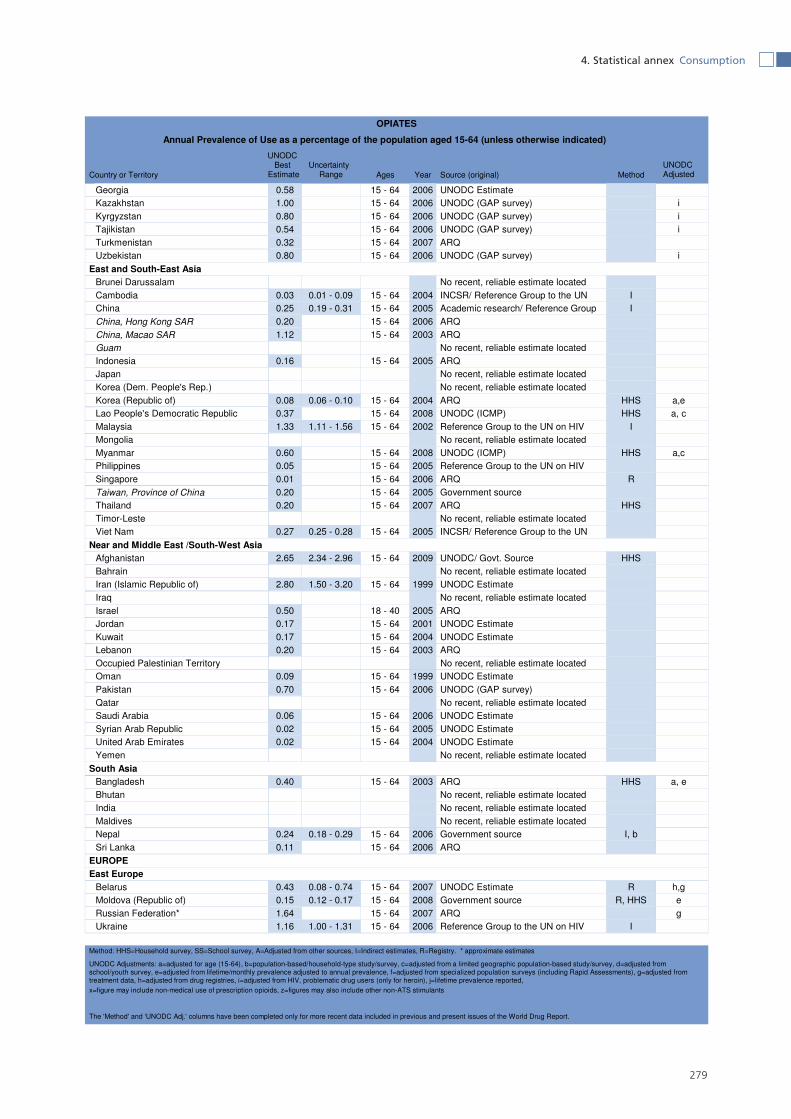
279
4. Statistical annex Consumption
Annual Prevalence of Use as a percentage of the population aged 15-64 (unless otherwise indicated)
OPIATES
Country or TerritoryUncertainty
Range Ages Year Source (original) Method
UNODC Adjusted
UNODC Best
Estimate
200615 - 64Georgia UNODC Estimate0.582006 i15 - 64Kazakhstan UNODC (GAP survey)1.002006 i15 - 64Kyrgyzstan UNODC (GAP survey)0.802006 i15 - 64Tajikistan UNODC (GAP survey)0.54200715 - 64Turkmenistan ARQ0.322006 i15 - 64Uzbekistan UNODC (GAP survey)0.80
East and South-East AsiaBrunei Darussalam No recent, reliable estimate located
20040.01 - 0.09 15 - 64Cambodia INCSR/ Reference Group to the UN I0.0320050.19 - 0.31 15 - 64China Academic research/ Reference Group I0.25200615 - 64China, Hong Kong SAR ARQ0.20200315 - 64China, Macao SAR ARQ1.12
Guam No recent, reliable estimate located200515 - 64Indonesia ARQ0.16
Japan No recent, reliable estimate locatedKorea (Dem. People's Rep.) No recent, reliable estimate located
2004 a,e0.06 - 0.10 15 - 64Korea (Republic of) ARQ HHS0.082008 a, c15 - 64Lao People's Democratic Republic UNODC (ICMP) HHS0.3720021.11 - 1.56 15 - 64Malaysia Reference Group to the UN on HIV I1.33
Mongolia No recent, reliable estimate located2008 a,c15 - 64Myanmar UNODC (ICMP) HHS0.60200515 - 64Philippines Reference Group to the UN on HIV 0.05200615 - 64Singapore ARQ R0.01200515 - 64Taiwan, Province of China Government source0.20200715 - 64Thailand ARQ HHS0.20
Timor-Leste No recent, reliable estimate located20050.25 - 0.28 15 - 64Viet Nam INCSR/ Reference Group to the UN 0.27
Near and Middle East /South-West Asia20092.34 - 2.96 15 - 64Afghanistan UNODC/ Govt. Source HHS2.65
Bahrain No recent, reliable estimate located19991.50 - 3.20 15 - 64Iran (Islamic Republic of) UNODC Estimate2.80
Iraq No recent, reliable estimate located200518 - 40Israel ARQ0.50200115 - 64Jordan UNODC Estimate0.17200415 - 64Kuwait UNODC Estimate0.17200315 - 64Lebanon ARQ0.20
Occupied Palestinian Territory No recent, reliable estimate located199915 - 64Oman UNODC Estimate0.09200615 - 64Pakistan UNODC (GAP survey)0.70
Qatar No recent, reliable estimate located200615 - 64Saudi Arabia UNODC Estimate0.06200515 - 64Syrian Arab Republic UNODC Estimate0.02200415 - 64United Arab Emirates UNODC Estimate0.02
Yemen No recent, reliable estimate located
South Asia2003 a, e15 - 64Bangladesh ARQ HHS0.40
Bhutan No recent, reliable estimate locatedIndia No recent, reliable estimate locatedMaldives No recent, reliable estimate located
20060.18 - 0.29 15 - 64Nepal Government source I, b0.24200615 - 64Sri Lanka ARQ0.11
EUROPEEast Europe
2007 h,g0.08 - 0.74 15 - 64Belarus UNODC Estimate R0.432008 e0.12 - 0.17 15 - 64Moldova (Republic of) Government source R, HHS0.152007 g15 - 64Russian Federation* ARQ1.6420061.00 - 1.31 15 - 64Ukraine Reference Group to the UN on HIV I1.16
Method: HHS=Household survey, SS=School survey, A=Adjusted from other sources, I=Indirect estimates, R=Registry. * approximate estimates
UNODC Adjustments: a=adjusted for age (15-64), b=population-based/household-type study/survey, c=adjusted from a limited geographic population-based study/survey, d=adjusted from school/youth survey, e=adjusted from lifetime/monthly prevalence adjusted to annual prevalence, f=adjusted from specialized population surveys (including Rapid Assessments), g=adjusted from treatment data, h=adjusted from drug registries, i=adjusted from HIV, problematic drug users (only for heroin), j=lifetime prevalence reported,
The 'Method' and 'UNODC Adj.' columns have been completed only for more recent data included in previous and present issues of the World Drug Report.
x=figure may include non-medical use of prescription opioids, z=figures may also include other non-ATS stimulants

280
World Drug Report 2010
Annual Prevalence of Use as a percentage of the population aged 15-64 (unless otherwise indicated)
OPIATES
Country or TerritoryUncertainty
Range Ages Year Source (original) Method
UNODC Adjusted
UNODC Best
Estimate
Southeast Europe2007 h,g15 - 64Albania ARQ R0.45200515 - 64Bosnia and Herzegovina Reference Group to the UN on HIV I0.3020070.38 - 0.60 15 - 64Bulgaria ARQ I0.49200615 - 64Croatia ARQ I0.36200515 - 64Macedonia (TFYR) ARQ0.50
Montenegro No recent, reliable estimate located20040.11 - 0.21 15 - 64Romania ARQ I0.1620080.18 - 0.38 15 - 64Serbia ARQ I0.28200315 - 64Turkey Government source0.05
West & Central EuropeAndorra No recent, reliable estimate located
200715 - 64Austria ARQ I0.43Belgium No recent, reliable estimate located
20070.21 - 0.36 15 - 64Cyprus ARQ I0.27200815 - 64Czech Republic Government source HHS0.40200515 - 64Denmark ARQ I0.6020040.89 - 3.79 15 - 64Estonia ARQ I1.52200515 - 64Finland UNODC Estimate I0.2320070.42 - 0.51 15 - 64France Government source I0.4720070.15 - 0.27 15 - 64Germany EMCDDA I0.2120070.24 - 0.31 15 - 64Greece EMCDDA I0.272007 g0.04 - 0.20 18 - 64Hungary Government source HHS0.10200515 - 64Iceland ARQ0.40200115 - 64Ireland ARQ I0.5020080.63 - 0.81 15 - 64Italy ARQ I0.7220070.70 - 0.80 15 - 64Latvia ARQ HHS0.75200515 - 64Liechtenstein ARQ SS0.20200815 - 64Lithuania Government source HHS0.10200015 - 64Luxembourg EMCDDA I0.9320070.54 - 0.59 15 - 64Malta ARQ I0.57
Monaco No recent, reliable estimate located200515 - 64Netherlands ARQ0.3120080.21 - 0.39 15 - 64Norway Government source I0.3020050.09 - 0.11 15 - 64Poland ARQ I0.1020050.43 - 0.50 15 - 64Portugal ARQ I0.46
San Marino No recent, reliable estimate located20070.18 - 0.49 15 - 64Slovakia EMCDDA I0.252004 g0.66 - 0.92 15 - 64Slovenia ARQ I0.7420070.12 - 0.14 15 - 64Spain Government source I0.13200415 - 64Sweden ARQ I0.1720000.51 - 0.78 15 - 64Switzerland Government source I0.61
United Kingdom No recent, reliable estimate located20070.79 - 0.84 15 - 64United Kingdom (England and Wales) EMCDDA I0.81200616 - 59United Kingdom (Northern Ireland) Government source0.1020041.54 - 1.68 15 - 64United Kingdom (Scotland) EMCDDA I1.54
OCEANIAOceania
American Samoa No recent, reliable estimate located2007 a15 - 64Australia ARQ HHS0.40
Christmas Islands No recent, reliable estimate locatedCocos (Keeling) Islands No recent, reliable estimate locatedCook Islands No recent, reliable estimate locatedFiji No recent, reliable estimate locatedFrench Polynesia No recent, reliable estimate locatedKiribati No recent, reliable estimate locatedMarshall Islands No recent, reliable estimate located
Method: HHS=Household survey, SS=School survey, A=Adjusted from other sources, I=Indirect estimates, R=Registry. * approximate estimates
UNODC Adjustments: a=adjusted for age (15-64), b=population-based/household-type study/survey, c=adjusted from a limited geographic population-based study/survey, d=adjusted from school/youth survey, e=adjusted from lifetime/monthly prevalence adjusted to annual prevalence, f=adjusted from specialized population surveys (including Rapid Assessments), g=adjusted from treatment data, h=adjusted from drug registries, i=adjusted from HIV, problematic drug users (only for heroin), j=lifetime prevalence reported,
The 'Method' and 'UNODC Adj.' columns have been completed only for more recent data included in previous and present issues of the World Drug Report.
x=figure may include non-medical use of prescription opioids, z=figures may also include other non-ATS stimulants
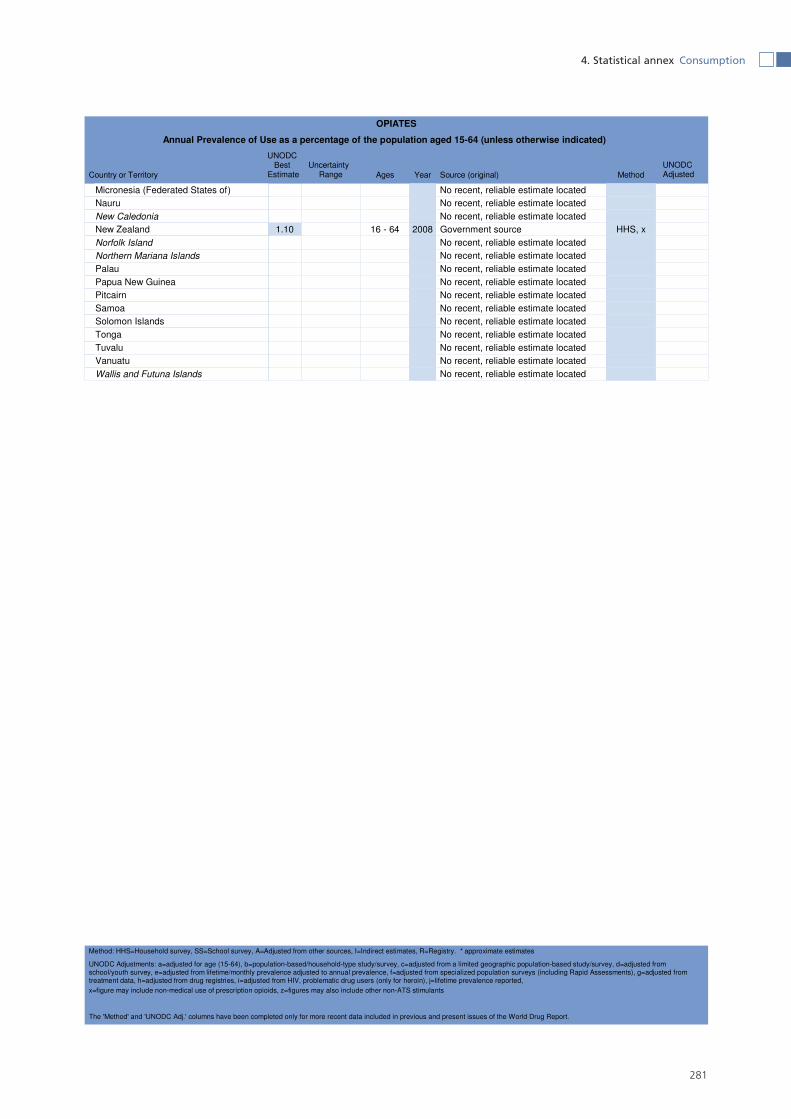
281
4. Statistical annex Consumption
Annual Prevalence of Use as a percentage of the population aged 15-64 (unless otherwise indicated)
OPIATES
Country or TerritoryUncertainty
Range Ages Year Source (original) Method
UNODC Adjusted
UNODC Best
Estimate
Micronesia (Federated States of) No recent, reliable estimate locatedNauru No recent, reliable estimate locatedNew Caledonia No recent, reliable estimate located
200816 - 64New Zealand Government source HHS, x1.10Norfolk Island No recent, reliable estimate locatedNorthern Mariana Islands No recent, reliable estimate locatedPalau No recent, reliable estimate locatedPapua New Guinea No recent, reliable estimate locatedPitcairn No recent, reliable estimate locatedSamoa No recent, reliable estimate locatedSolomon Islands No recent, reliable estimate locatedTonga No recent, reliable estimate locatedTuvalu No recent, reliable estimate locatedVanuatu No recent, reliable estimate locatedWallis and Futuna Islands No recent, reliable estimate located
Method: HHS=Household survey, SS=School survey, A=Adjusted from other sources, I=Indirect estimates, R=Registry. * approximate estimates
UNODC Adjustments: a=adjusted for age (15-64), b=population-based/household-type study/survey, c=adjusted from a limited geographic population-based study/survey, d=adjusted from school/youth survey, e=adjusted from lifetime/monthly prevalence adjusted to annual prevalence, f=adjusted from specialized population surveys (including Rapid Assessments), g=adjusted from treatment data, h=adjusted from drug registries, i=adjusted from HIV, problematic drug users (only for heroin), j=lifetime prevalence reported,
The 'Method' and 'UNODC Adj.' columns have been completed only for more recent data included in previous and present issues of the World Drug Report.
x=figure may include non-medical use of prescription opioids, z=figures may also include other non-ATS stimulants
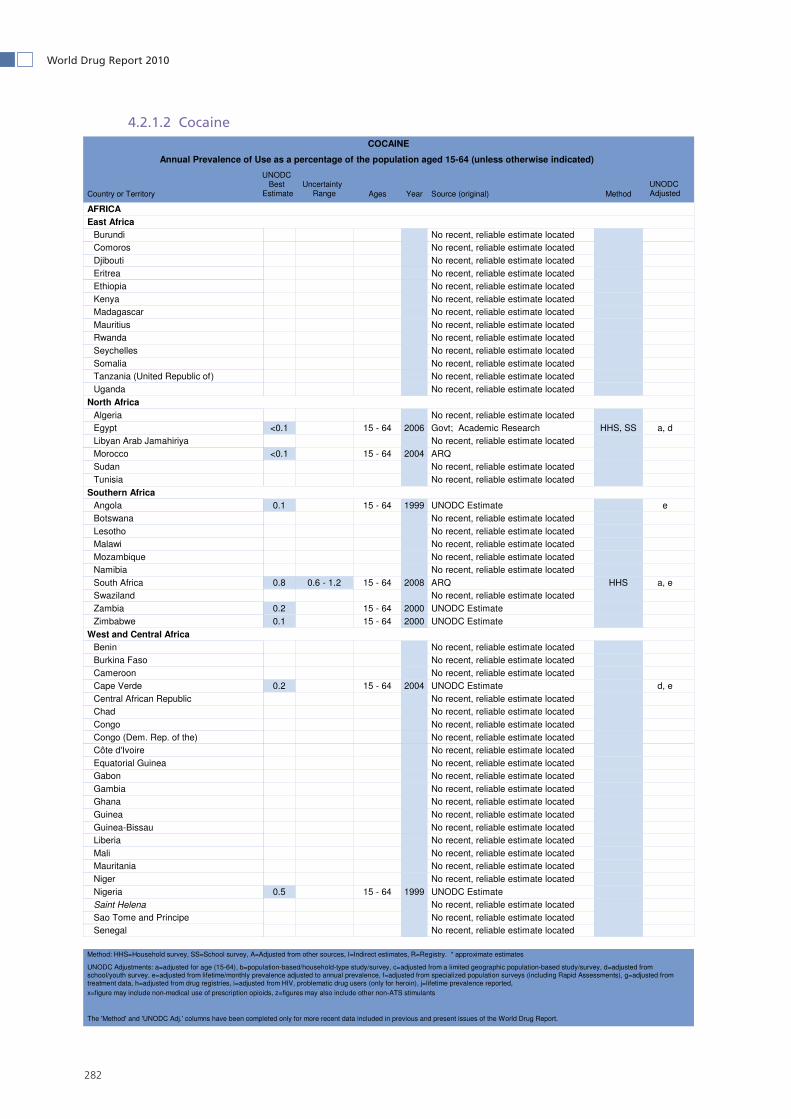
282
World Drug Report 2010
Cocaine4.2.1.2
Annual Prevalence of Use as a percentage of the population aged 15-64 (unless otherwise indicated)
COCAINE
Country or TerritoryUncertainty
Range Ages Year Source (original) Method
UNODC Adjusted
UNODC Best
Estimate
AFRICAEast Africa
Burundi No recent, reliable estimate locatedComoros No recent, reliable estimate locatedDjibouti No recent, reliable estimate locatedEritrea No recent, reliable estimate locatedEthiopia No recent, reliable estimate locatedKenya No recent, reliable estimate locatedMadagascar No recent, reliable estimate locatedMauritius No recent, reliable estimate locatedRwanda No recent, reliable estimate locatedSeychelles No recent, reliable estimate locatedSomalia No recent, reliable estimate locatedTanzania (United Republic of) No recent, reliable estimate locatedUganda No recent, reliable estimate located
North AfricaAlgeria No recent, reliable estimate located
2006 a, d15 - 64Egypt Govt; Academic Research HHS, SS<0.1Libyan Arab Jamahiriya No recent, reliable estimate located
200415 - 64Morocco ARQ<0.1Sudan No recent, reliable estimate locatedTunisia No recent, reliable estimate located
Southern Africa1999 e15 - 64Angola UNODC Estimate0.1
Botswana No recent, reliable estimate locatedLesotho No recent, reliable estimate locatedMalawi No recent, reliable estimate locatedMozambique No recent, reliable estimate locatedNamibia No recent, reliable estimate located
2008 a, e0.6 - 1.2 15 - 64South Africa ARQ HHS0.8Swaziland No recent, reliable estimate located
200015 - 64Zambia UNODC Estimate0.2200015 - 64Zimbabwe UNODC Estimate0.1
West and Central AfricaBenin No recent, reliable estimate locatedBurkina Faso No recent, reliable estimate locatedCameroon No recent, reliable estimate located
2004 d, e15 - 64Cape Verde UNODC Estimate0.2Central African Republic No recent, reliable estimate locatedChad No recent, reliable estimate locatedCongo No recent, reliable estimate locatedCongo (Dem. Rep. of the) No recent, reliable estimate locatedCôte d'Ivoire No recent, reliable estimate locatedEquatorial Guinea No recent, reliable estimate locatedGabon No recent, reliable estimate locatedGambia No recent, reliable estimate locatedGhana No recent, reliable estimate locatedGuinea No recent, reliable estimate locatedGuinea-Bissau No recent, reliable estimate locatedLiberia No recent, reliable estimate locatedMali No recent, reliable estimate locatedMauritania No recent, reliable estimate locatedNiger No recent, reliable estimate located
199915 - 64Nigeria UNODC Estimate0.5Saint Helena No recent, reliable estimate locatedSao Tome and Principe No recent, reliable estimate locatedSenegal No recent, reliable estimate located
Method: HHS=Household survey, SS=School survey, A=Adjusted from other sources, I=Indirect estimates, R=Registry. * approximate estimates
UNODC Adjustments: a=adjusted for age (15-64), b=population-based/household-type study/survey, c=adjusted from a limited geographic population-based study/survey, d=adjusted from school/youth survey, e=adjusted from lifetime/monthly prevalence adjusted to annual prevalence, f=adjusted from specialized population surveys (including Rapid Assessments), g=adjusted from treatment data, h=adjusted from drug registries, i=adjusted from HIV, problematic drug users (only for heroin), j=lifetime prevalence reported,
The 'Method' and 'UNODC Adj.' columns have been completed only for more recent data included in previous and present issues of the World Drug Report.
x=figure may include non-medical use of prescription opioids, z=figures may also include other non-ATS stimulants

283
4. Statistical annex Consumption
Annual Prevalence of Use as a percentage of the population aged 15-64 (unless otherwise indicated)
COCAINE
Country or TerritoryUncertainty
Range Ages Year Source (original) Method
UNODC Adjusted
UNODC Best
Estimate
Sierra Leone No recent, reliable estimate locatedTogo No recent, reliable estimate located
AMERICASCaribbean
Anguilla No recent, reliable estimate located2005 d, e0.3 - 1.6 15 - 64Antigua and Barbuda Government source SS0.92008 d, e<0.1 - 0.3 15 - 64Bahamas ARQ SS0.2200615 - 64Barbados CICAD HHS0.4
Bermuda No recent, reliable estimate locatedBritish Virgin Islands No recent, reliable estimate located
200015 - 64Cayman Islands UNODC Estimate0.6Cuba No recent, reliable estimate locatedDominica No recent, reliable estimate located
2008 d, e0.1 - 0.6 15 - 64Dominican Republic ARQ SS0.32005 d, e0.2 - 1.9 15 - 64Grenada CICAD SS0.9200515 - 64Haiti UNODC Estimate0.92006 a, d15 - 64Jamaica UNODC Estimate SS1.1
Montserrat No recent, reliable estimate locatedNetherlands Antilles No recent, reliable estimate located
2005 d, e0.3 - 1.4 15 - 64Puerto Rico Government source SS0.82006 d, e0.4 - 3.2 15 - 64Saint Kitts and Nevis Government source SS1.7200215 - 64Saint Lucia UNODC Estimate1.0200215 - 64Saint Vincent and the Grenadines UNODC Estimate SS0.7
Trinidad and Tobago No recent, reliable estimate located200215 - 64Turks and Caicos Islands UNODC Estimate0.7
United States Virgin Islands No recent, reliable estimate located
Central America200512 - 65Belize CICAD HHS0.9200612 - 70Costa Rica ARQ HHS0.420050.2 - 0.5 12 - 65El Salvador CICAD HHS0.4200515 - 64Guatemala ARQ HHS0.2200512 - 35Honduras ARQ0.920060.5 - 0.9 12 - 65Nicaragua CICAD HHS, c0.7200312 - 65Panama Government source HHS1.2
North America200815 - 64Canada ARQ HHS1.9200812 - 65Mexico Govt. source (ENA) HHS0.4
Saint Pierre and Miquelon No recent, reliable estimate located200815 - 64United States of America Govt. source (SAMSHA) HHS2.6
South America200615 - 64Argentina UNODC/ CICAD HHS, a, c2.6200715 - 64Bolivia (Plurinational State of) UNODC/ CICAD HHS, a, c0.8200512 - 65Brazil Government source HHS, c0.7200815 - 64Chile ARQ HHS2.420080.7 - 0.9 12 - 65Colombia Government source HHS, c0.8200715 - 64Ecuador UNODC/ CICAD HHS, a, c0.3
Falkland Islands (Malvinas) No recent, reliable estimate locatedGuyana No recent, reliable estimate located
20030.2 - 0.3 12 - 64Paraguay CICAD HHS0.320060.3 - 0.6 12 - 64Peru ARQ HHS, c0.5200712 - 65Suriname Government source HHS0.3200612 - 65Uruguay UNODC/ CICAD HHS, a, c1.4200515 - 64Venezuela (Bolivarian Republic of) Government source HHS0.6
ASIACentral Asia and Transcaucasian countries
200515 - 64Armenia UNODC Estimate HHS0.1Azerbaijan No recent, reliable estimate located
Method: HHS=Household survey, SS=School survey, A=Adjusted from other sources, I=Indirect estimates, R=Registry. * approximate estimates
UNODC Adjustments: a=adjusted for age (15-64), b=population-based/household-type study/survey, c=adjusted from a limited geographic population-based study/survey, d=adjusted from school/youth survey, e=adjusted from lifetime/monthly prevalence adjusted to annual prevalence, f=adjusted from specialized population surveys (including Rapid Assessments), g=adjusted from treatment data, h=adjusted from drug registries, i=adjusted from HIV, problematic drug users (only for heroin), j=lifetime prevalence reported,
The 'Method' and 'UNODC Adj.' columns have been completed only for more recent data included in previous and present issues of the World Drug Report.
x=figure may include non-medical use of prescription opioids, z=figures may also include other non-ATS stimulants
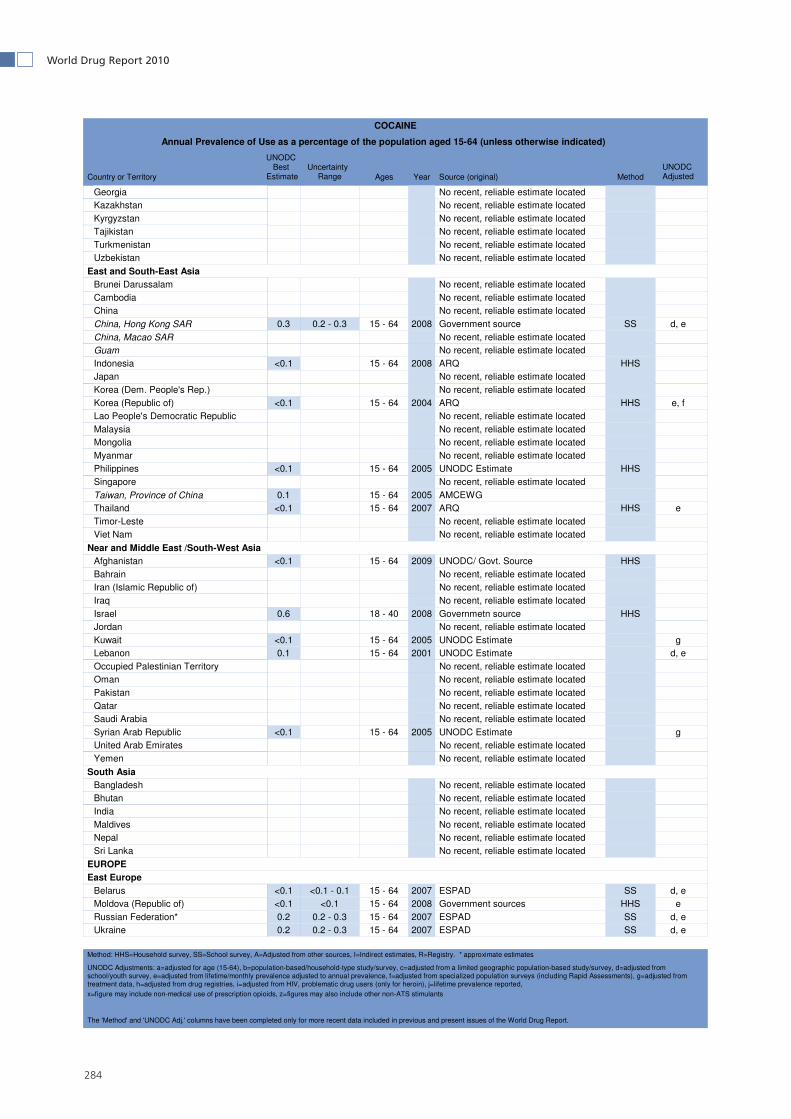
284
World Drug Report 2010
Annual Prevalence of Use as a percentage of the population aged 15-64 (unless otherwise indicated)
COCAINE
Country or TerritoryUncertainty
Range Ages Year Source (original) Method
UNODC Adjusted
UNODC Best
Estimate
Georgia No recent, reliable estimate locatedKazakhstan No recent, reliable estimate locatedKyrgyzstan No recent, reliable estimate locatedTajikistan No recent, reliable estimate locatedTurkmenistan No recent, reliable estimate locatedUzbekistan No recent, reliable estimate located
East and South-East AsiaBrunei Darussalam No recent, reliable estimate locatedCambodia No recent, reliable estimate locatedChina No recent, reliable estimate located
2008 d, e0.2 - 0.3 15 - 64China, Hong Kong SAR Government source SS0.3China, Macao SAR No recent, reliable estimate locatedGuam No recent, reliable estimate located
200815 - 64Indonesia ARQ HHS<0.1Japan No recent, reliable estimate locatedKorea (Dem. People's Rep.) No recent, reliable estimate located
2004 e, f15 - 64Korea (Republic of) ARQ HHS<0.1Lao People's Democratic Republic No recent, reliable estimate locatedMalaysia No recent, reliable estimate locatedMongolia No recent, reliable estimate locatedMyanmar No recent, reliable estimate located
200515 - 64Philippines UNODC Estimate HHS<0.1Singapore No recent, reliable estimate located
200515 - 64Taiwan, Province of China AMCEWG0.12007 e15 - 64Thailand ARQ HHS<0.1
Timor-Leste No recent, reliable estimate locatedViet Nam No recent, reliable estimate located
Near and Middle East /South-West Asia200915 - 64Afghanistan UNODC/ Govt. Source HHS<0.1
Bahrain No recent, reliable estimate locatedIran (Islamic Republic of) No recent, reliable estimate locatedIraq No recent, reliable estimate located
200818 - 40Israel Governmetn source HHS0.6Jordan No recent, reliable estimate located
2005 g15 - 64Kuwait UNODC Estimate<0.12001 d, e15 - 64Lebanon UNODC Estimate0.1
Occupied Palestinian Territory No recent, reliable estimate locatedOman No recent, reliable estimate locatedPakistan No recent, reliable estimate locatedQatar No recent, reliable estimate locatedSaudi Arabia No recent, reliable estimate located
2005 g15 - 64Syrian Arab Republic UNODC Estimate<0.1United Arab Emirates No recent, reliable estimate locatedYemen No recent, reliable estimate located
South AsiaBangladesh No recent, reliable estimate locatedBhutan No recent, reliable estimate locatedIndia No recent, reliable estimate locatedMaldives No recent, reliable estimate locatedNepal No recent, reliable estimate locatedSri Lanka No recent, reliable estimate located
EUROPEEast Europe
2007 d, e<0.1 - 0.1 15 - 64Belarus ESPAD SS<0.12008 e<0.1 15 - 64Moldova (Republic of) Government sources HHS<0.12007 d, e0.2 - 0.3 15 - 64Russian Federation* ESPAD SS0.22007 d, e0.2 - 0.3 15 - 64Ukraine ESPAD SS0.2
Method: HHS=Household survey, SS=School survey, A=Adjusted from other sources, I=Indirect estimates, R=Registry. * approximate estimates
UNODC Adjustments: a=adjusted for age (15-64), b=population-based/household-type study/survey, c=adjusted from a limited geographic population-based study/survey, d=adjusted from school/youth survey, e=adjusted from lifetime/monthly prevalence adjusted to annual prevalence, f=adjusted from specialized population surveys (including Rapid Assessments), g=adjusted from treatment data, h=adjusted from drug registries, i=adjusted from HIV, problematic drug users (only for heroin), j=lifetime prevalence reported,
The 'Method' and 'UNODC Adj.' columns have been completed only for more recent data included in previous and present issues of the World Drug Report.
x=figure may include non-medical use of prescription opioids, z=figures may also include other non-ATS stimulants

285
4. Statistical annex Consumption
Annual Prevalence of Use as a percentage of the population aged 15-64 (unless otherwise indicated)
COCAINE
Country or TerritoryUncertainty
Range Ages Year Source (original) Method
UNODC Adjusted
UNODC Best
Estimate
Southeast Europe2006 d, e<0.1 - 1.6 15 - 64Albania Government source SS0.82008 d, e<0.1 - 1.9 15 - 64Bosnia and Herzegovina ESPAD SS0.6200715 - 64Bulgaria ARQ HHS0.62007 d, e15 - 64Croatia ESPAD SS0.9200715 - 64Macedonia (TFYR) INCSR<0.12008 d, e<0.1 - 1.7 15 - 64Montenegro ESPAD SS0.82007 e<0.1 15 - 64Romania ARQ HHS<0.12008 a, d, e0.1 - 1.2 15 - 64Serbia Government sources HHS0.5200315 - 64Turkey UNODC Estimate<0.1
West & Central EuropeAndorra No recent, reliable estimate located
200815 - 64Austria Govt. HHS0.92007 c, d, e1.2 - 1.3 15 - 64Belgium ESPAD SS1.2200615 - 65Cyprus ARQ0.6200815 - 64Czech Republic Government sources HHS0.7200816 - 64Denmark ARQ HHS1.4200815 - 64Estonia Government sources HHS0.6200615 - 64Finland ARQ0.5200515 - 64France ARQ0.6200618 - 64Germany Government source HHS0.7200415 - 64Greece ARQ0.12007<0.1 - 0.4 18 - 64Hungary ARQ HHS0.22007 d, e15 - 64Iceland ESPAD SS0.9200715 - 64Ireland Government source HHS1.7200815 - 64Italy Government source HHS2.2200715 - 64Latvia ARQ HHS0.5200515 - 64Liechtenstein UNODC Estimate0.8200815 - 64Lithuania ARQ HHS0.2200315 - 64Luxembourg UNODC Estimate0.92007 d, e1.1 - 1.2 18 - 65Malta ESPAD SS1.12007 d, e1.7 - 2.0 18 - 66Monaco ESPAD SS1.9200515 - 64Netherlands ARQ0.6200415 - 64Norway ARQ0.8200616 - 64Poland ARQ0.2200715 - 64Portugal ARQ HHS0.6
San Marino No recent, reliable estimate located200615 - 64Slovakia ARQ HHS0.62007 d, e15 - 64Slovenia ESPAD SS0.9200715 - 64Spain Government source HHS3.02007 d,e0.5 - 0.6 15 - 64Sweden ESPAD SS0.62007 d, e15 - 64Switzerland ESPAD SS0.8
United Kingdom No recent, reliable estimate located200916 - 59United Kingdom (England and Wales) Government source HHS3.0200715 - 64United Kingdom (Northern Ireland) Government source HHS1.920093.7 - 4.0 16 - 59United Kingdom (Scotland) Government source HHS3.9
OCEANIAOceania
American Samoa No recent, reliable estimate located200715 - 64Australia Government Source HHS1.9
Christmas Islands No recent, reliable estimate locatedCocos (Keeling) Is lands No recent, reliable estimate locatedCook Islands No recent, reliable estimate locatedFiji No recent, reliable estimate locatedFrench Polynesia No recent, reliable estimate locatedKiribati No recent, reliable estimate locatedMarshall Islands No recent, reliable estimate located
Method: HHS=Household survey, SS=School survey, A=Adjusted from other sources, I=Indirect estimates, R=Registry. * approximate estimates
UNODC Adjustments: a=adjusted for age (15-64), b=population-based/household-type study/survey, c=adjusted from a limited geographic population-based study/survey, d=adjusted from school/youth survey, e=adjusted from lifetime/monthly prevalence adjusted to annual prevalence, f=adjusted from specialized population surveys (including Rapid Assessments), g=adjusted from treatment data, h=adjusted from drug registries, i=adjusted from HIV, problematic drug users (only for heroin), j=lifetime prevalence reported,
The 'Method' and 'UNODC Adj.' columns have been completed only for more recent data included in previous and present issues of the World Drug Report.
x=figure may include non-medical use of prescription opioids, z=figures may also include other non-ATS stimulants

286
World Drug Report 2010
Annual Prevalence of Use as a percentage of the population aged 15-64 (unless otherwise indicated)
COCAINE
Country or TerritoryUncertainty
Range Ages Year Source (original) Method
UNODC Adjusted
UNODC Best
Estimate
Micronesia (Federated States of) No recent, reliable estimate locatedNauru No recent, reliable estimate locatedNew Caledonia No recent, reliable estimate located
200816 - 64New Zealand Government source HHS0.6Norfolk Island No recent, reliable estimate locatedNorthern Mariana Islands No recent, reliable estimate locatedPalau No recent, reliable estimate locatedPapua New Guinea No recent, reliable estimate locatedPitcairn No recent, reliable estimate locatedSamoa No recent, reliable estimate locatedSolomon Islands No recent, reliable estimate locatedTonga No recent, reliable estimate locatedTuvalu No recent, reliable estimate locatedVanuatu No recent, reliable estimate locatedWallis and Futuna Islands No recent, reliable estimate located
Method: HHS=Household survey, SS=School survey, A=Adjusted from other sources, I=Indirect estimates, R=Registry. * approximate estimates
UNODC Adjustments: a=adjusted for age (15-64), b=population-based/household-type study/survey, c=adjusted from a limited geographic population-based study/survey, d=adjusted from school/youth survey, e=adjusted from lifetime/monthly prevalence adjusted to annual prevalence, f=adjusted from specialized population surveys (including Rapid Assessments), g=adjusted from treatment data, h=adjusted from drug registries, i=adjusted from HIV, problematic drug users (only for heroin), j=lifetime prevalence reported,
The 'Method' and 'UNODC Adj.' columns have been completed only for more recent data included in previous and present issues of the World Drug Report.
x=figure may include non-medical use of prescription opioids, z=figures may also include other non-ATS stimulants

287
4. Statistical annex Consumption
Cannabis4.2.1.3
Annual Prevalence of Use as a percentage of the population aged 15-64 (unless otherwise indicated)
CANNABIS
Country or TerritoryUncertainty
Range Ages Year Source (original) Method
UNODC Adjusted
UNODC Best
Estimate
AFRICAEast Africa
Burundi No recent, reliable estimate located200215 - 64Comoros UNODC Estimate2.9
Djibouti No recent, reliable estimate locatedEritrea No recent, reliable estimate located
199915 - 64Ethiopia EADIS2.62004 c, d, e, f4.7 - 10.0 15 - 64Kenya ARQ, NGO, Council of Europe SS, A7.12004 d, e15 - 64Madagascar ARQ SS, A9.1200415 - 54Mauritius ARQ3.9
Rwanda No recent, reliable estimate locatedSeychelles No recent, reliable estimate located
200215 - 64Somalia UNODC Estimate2.5Tanzania (United Republic of) No recent, reliable estimate locatedUganda No recent, reliable estimate located
North Africa2006 d5.2 - 6.4 15 - 64Algeria Council of Europe SS, A5.72006 a, d2.9 - 9.6 15 - 64Egypt Govt; Academic Research HHS, SS6.2
Libyan Arab Jamahiriya No recent, reliable estimate located200415 - 64Morocco ARQ HHS 4.2
Sudan No recent, reliable estimate locatedTunisia No recent, reliable estimate located
Southern Africa1999 e15 - 64Angola ARQ2.1
Botswana No recent, reliable estimate locatedLesotho No recent, reliable estimate locatedMalawi No recent, reliable estimate locatedMozambique No recent, reliable estimate located
200015 - 64Namibia ARQ3.92008 a, e3.5 - 6.2 15 - 64South Africa ARQ HHS4.3
Swaziland No recent, reliable estimate located200315 - 64Zambia UNODC Estimate17.7200015 - 64Zimbabwe UNODC Estimate6.9
West and Central AfricaBenin No recent, reliable estimate located
2006 d, e15 - 64Burkina Faso UNODC Estimate2.9Cameroon No recent, reliable estimate located
2004 d, e15 - 64Cape Verde UNODC Estimate8.1Central African Republic No recent, reliable estimate locatedChad No recent, reliable estimate locatedCongo No recent, reliable estimate locatedCongo (Dem. Rep. of the) No recent, reliable estimate locatedCôte d'Ivoire No recent, reliable estimate locatedEquatorial Guinea No recent, reliable estimate locatedGabon No recent, reliable estimate locatedGambia No recent, reliable estimate locatedGhana No recent, reliable estimate locatedGuinea No recent, reliable estimate locatedGuinea-Bissau No recent, reliable estimate locatedLiberia No recent, reliable estimate locatedMali No recent, reliable estimate locatedMauritania No recent, reliable estimate locatedNiger No recent, reliable estimate located
2000 h15 - 64Nigeria ARQ R13.8Saint Helena No recent, reliable estimate locatedSao Tome and Principe No recent, reliable estimate locatedSenegal No recent, reliable estimate located
Method: HHS=Household survey, SS=School survey, A=Adjusted from other sources, I=Indirect estimates, R=Registry. * approximate estimates
UNODC Adjustments: a=adjusted for age (15-64), b=population-based/household-type study/survey, c=adjusted from a limited geographic population-based study/survey, d=adjusted from school/youth survey, e=adjusted from lifetime/monthly prevalence adjusted to annual prevalence, f=adjusted from specialized population surveys (including Rapid Assessments), g=adjusted from treatment data, h=adjusted from drug registries, i=adjusted from HIV, problematic drug users (only for heroin), j=lifetime prevalence reported,
The 'Method' and 'UNODC Adj.' columns have been completed only for more recent data included in previous and present issues of the World Drug Report.
x=figure may include non-medical use of prescription opioids, z=figures may also include other non-ATS stimulants

288
World Drug Report 2010
Annual Prevalence of Use as a percentage of the population aged 15-64 (unless otherwise indicated)
CANNABIS
Country or TerritoryUncertainty
Range Ages Year Source (original) Method
UNODC Adjusted
UNODC Best
Estimate
Sierra Leone No recent, reliable estimate located2006 d, e15 - 64Togo ARQ SS2.7
AMERICASCaribbean
Anguilla No recent, reliable estimate located2005 d, e7.8 - 13.4 15 - 64Antigua and Barbuda Government source SS10.62008 d, e3.2 - 7.9 15 - 64Bahamas ARQ SS5.5200615 - 64Barbados CICAD HHS8.3
Bermuda No recent, reliable estimate locatedBritish Virgin Islands No recent, reliable estimate locatedCayman Islands No recent, reliable estimate locatedCuba No recent, reliable estimate located
2006 d, e6.1 - 15.5 15 - 64Dominica Government source SS10.82008 d, e0.3 - 1.4 15 - 64Dominican Republic ARQ SS0.32005 d, e7.3 - 14.4 15 - 64Grenada Government source SS10.82005 d, e0.4 - 2.2 15 - 64Haiti CICAD SS1.42006 d, e7.5 - 12.2 15 - 64Jamaica Government source SS9.9
Montserrat No recent, reliable estimate locatedNetherlands Antilles No recent, reliable estimate located
2005 d, e3.1 - 6.7 15 - 64Puerto Rico Government source SS4.92006 d, e8.3 - 15.1 15 - 64Saint Kitts and Nevis Government source SS11.72006 d, e15 - 64Saint Lucia UNODC Estimate SS9.02006 d, e5.1 - 9.1 15 - 64Saint Vincent and the Grenadines Government source SS7.12006 d, e2.9 - 6.4 15 - 64Trinidad and Tobago Government source SS4.7200215 - 64Turks and Caicos Islands UNODC Estimate5.4
United States Virgin Islands No recent, reliable estimate located
Central America200512 - 65Belize CICAD HHS8.5200612 - 70Costa Rica ARQ HHS1.0200512 - 65El Salvador CICAD HHS0.42005 c, d15 - 64Guatemala UNODC Estimate HHS, SS4.82005 d, e0.4 - 1.6 12 - 35Honduras CICAD SS0.8200612 - 65Nicaragua CICAD HHS, c1.12003 d, e3.4 - 3.7 12 - 65Panama CICAD HHS3.6
North America200815 - 64Canada ARQ HHS13.6200812 - 65Mexico Govt. source (ENA) HHS1.0
Saint Pierre and Miquelon No recent, reliable estimate located200815 - 64United States of America Govt. source (SAMSHA) HHS12.5
South America200615 - 64Argentina UNODC/ CICAD HHS, a, c7.2200715 - 64Bolivia (Plurinational State of) UNODC/ CICAD HHS, a, c4.3200512 - 65Brazil Government source HHS, c2.6200815 - 64Chile ARQ HHS6.7200812 - 65Colombia Government source HHS2.3200715 - 64Ecuador UNODC/ CICAD HHS, a, c0.7
Falkland Islands (Malvinas) No recent, reliable estimate located200215 - 64Guyana UNODC Estimate2.6200515 - 64Paraguay UNODC Estimate1.6200612 - 64Peru ARQ HHS, c0.720073.8 - 4.7 12 - 65Suriname Government source HHS4.3200612 - 65Uruguay UNODC/ CICAD HHS, a, c6.02005 a, e0.2 - 1.4 15 - 64Venezuela (Bolivarian Republic of) Government source HHS0.9
ASIACentral Asia and Transcaucasian countries
200315 - 64Armenia UNODC Estimate3.5200415 - 64Azerbaijan UNODC Estimate3.5
Method: HHS=Household survey, SS=School survey, A=Adjusted from other sources, I=Indirect estimates, R=Registry. * approximate estimates
UNODC Adjustments: a=adjusted for age (15-64), b=population-based/household-type study/survey, c=adjusted from a limited geographic population-based study/survey, d=adjusted from school/youth survey, e=adjusted from lifetime/monthly prevalence adjusted to annual prevalence, f=adjusted from specialized population surveys (including Rapid Assessments), g=adjusted from treatment data, h=adjusted from drug registries, i=adjusted from HIV, problematic drug users (only for heroin), j=lifetime prevalence reported,
The 'Method' and 'UNODC Adj.' columns have been completed only for more recent data included in previous and present issues of the World Drug Report.
x=figure may include non-medical use of prescription opioids, z=figures may also include other non-ATS stimulants

289
4. Statistical annex Consumption
Annual Prevalence of Use as a percentage of the population aged 15-64 (unless otherwise indicated)
CANNABIS
Country or TerritoryUncertainty
Range Ages Year Source (original) Method
UNODC Adjusted
UNODC Best
Estimate
2005 a, d, e0.5 - 1.7 15 - 64Georgia ARQ SS1.1200315 - 64Kazakhstan INCSR4.2200115 - 64Kyrgyzstan ARQ6.4
Tajikistan No recent, reliable estimate locatedTurkmenistan No recent, reliable estimate located
2003 e15 - 64Uzbekistan UNODC Estimate4.2
East and South-East AsiaBrunei Darussalam No recent, reliable estimate located
200315 - 64Cambodia UNODC Estimate3.5China No recent, reliable estimate located
2008 d, e0.2 - 2.0 15 - 64China, Hong Kong SAR Government source SS0.42003 d, e15 - 64China, Macao SAR UNODC Estimate R0.72007 d, e14.7 - 22.0 15 - 64Guam Government source SS18.4200815 - 64Indonesia ARQ HHS0.4
Japan No recent, reliable estimate locatedKorea (Dem. People's Rep.) No recent, reliable estimate located
2004 c, e<0.1 - 0.6 15 - 64Korea (Republic of) ARQ HHS0.32008 c, d0.7 - 1.1 15 - 64Lao People's Democratic Republic UNODC report SS0.9200315 - 64Malaysia UNODC Estimate1.6
Mongolia No recent, reliable estimate located2005 d, e15 - 64Myanmar UNODC Estimate0.92008 c, e0.7 - 0.9 15 - 64Philippines Government source HHS0.8
Singapore No recent, reliable estimate located200515 - 64Taiwan, Province of China AMCEWG0.3200715 - 64Thailand ARQ HHS1.2
Timor-Leste No recent, reliable estimate located200215 - 64Viet Nam UNODC Estimate0.3
Near and Middle East /South-West Asia20093.4 - 5.2 15 - 64Afghanistan UNODC/ Govt. Source HHS4.3
Bahrain No recent, reliable estimate located199915 - 64Iran (Islamic Republic of) ARQ4.2
Iraq No recent, reliable estimate located200818 - 40Israel Government source HHS8.92001 a15 - 64Jordan ARQ2.1200515 - 64Kuwait UNODC Estimate3.12001 d15 - 64Lebanon ARQ6.4
Occupied Palestinian Territory No recent, reliable estimate located199915 - 64Oman 0.1200015 - 64Pakistan INCSR3.9
Qatar No recent, reliable estimate located200615 - 64Saudi Arabia Government source/ NGO/Academic R0.3
Syrian Arab Republic No recent, reliable estimate located200615 - 64United Arab Emirates UNODC Estimate5.4
Yemen No recent, reliable estimate located
South Asia2004 a, e,f15 - 54Bangladesh Academic research HHS3.3
Bhutan No recent, reliable estimate locatedIndia No recent, reliable estimate locatedMaldives No recent, reliable estimate locatedNepal No recent, reliable estimate located
200015 - 64Sri Lanka UNODC Estimate1.5EUROPEEast Europe
2007 c, d, e0.9 - 1.3 15 - 64Belarus ESPAD SS1.1200815 - 64Moldova (Republic of) Government source HHS0.92007 d, e15 - 64Russian Federation* ESPAD SS3.52007 d, e2.4 - 2.6 15 - 64Ukraine ESPAD SS2.5
Method: HHS=Household survey, SS=School survey, A=Adjusted from other sources, I=Indirect estimates, R=Registry. * approximate estimates
UNODC Adjustments: a=adjusted for age (15-64), b=population-based/household-type study/survey, c=adjusted from a limited geographic population-based study/survey, d=adjusted from school/youth survey, e=adjusted from lifetime/monthly prevalence adjusted to annual prevalence, f=adjusted from specialized population surveys (including Rapid Assessments), g=adjusted from treatment data, h=adjusted from drug registries, i=adjusted from HIV, problematic drug users (only for heroin), j=lifetime prevalence reported,
The 'Method' and 'UNODC Adj.' columns have been completed only for more recent data included in previous and present issues of the World Drug Report.
x=figure may include non-medical use of prescription opioids, z=figures may also include other non-ATS stimulants
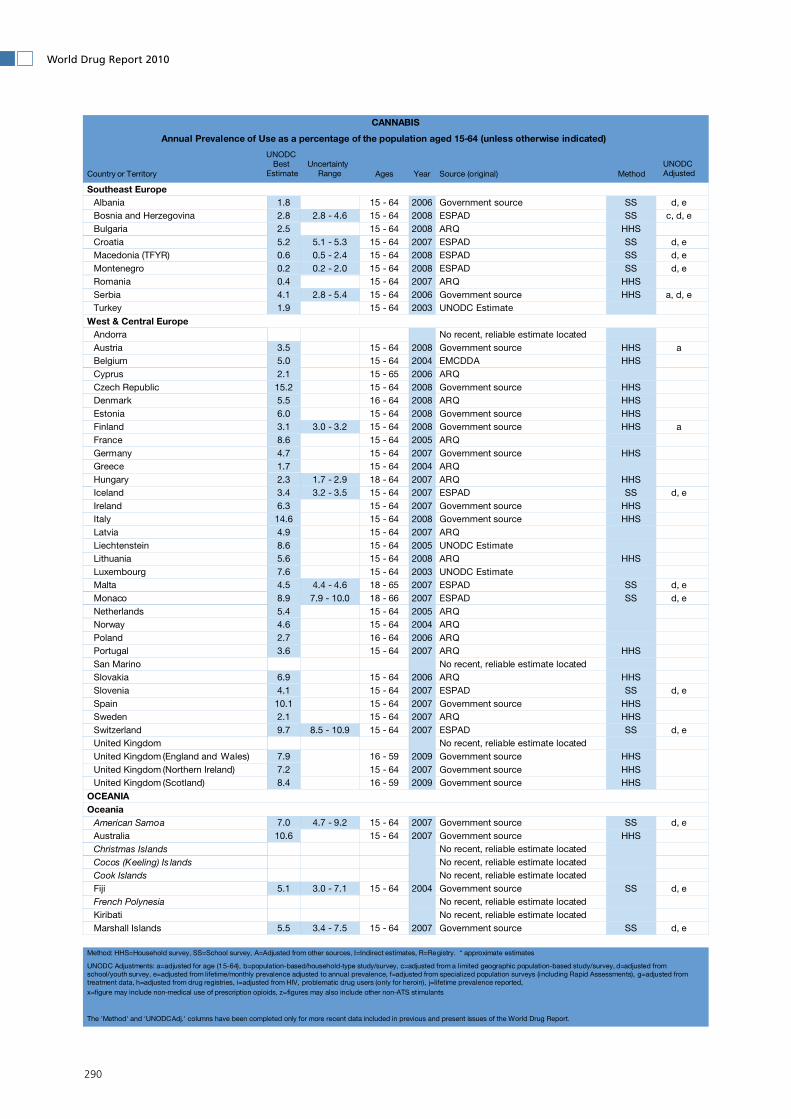
290
World Drug Report 2010
Annual Prevalence of Use as a percentage of the population aged 15-64 (unless otherwise indicated)
CANNABIS
Country or TerritoryUncertainty
Range Ages Year Source (original) Method
UNODC Adjusted
UNODC Best
Estimate
Southeast Europe2006 d, e15 - 64Albania Government source SS1.82008 c, d, e2.8 - 4.6 15 - 64Bosnia and Herzegovina ESPAD SS2.8200815 - 64Bulgaria ARQ HHS2.52007 d, e5.1 - 5.3 15 - 64Croatia ESPAD SS5.22008 d, e0.5 - 2.4 15 - 64Macedonia (TFYR) ESPAD SS0.62008 d, e0.2 - 2.0 15 - 64Montenegro ESPAD SS0.2200715 - 64Romania ARQ HHS0.42006 a, d, e2.8 - 5.4 15 - 64Serbia Government source HHS4.1200315 - 64Turkey UNODC Estimate1.9
West & Central EuropeAndorra No recent, reliable estimate located
2008 a15 - 64Austria Government source HHS3.5200415 - 64Belgium EMCDDA HHS5.0200615 - 65Cyprus ARQ2.1200815 - 64Czech Republic Government source HHS15.2200816 - 64Denmark ARQ HHS5.5200815 - 64Estonia Government source HHS6.02008 a3.0 - 3.2 15 - 64Finland Government source HHS3.1200515 - 64France ARQ8.6200715 - 64Germany Government source HHS4.7200415 - 64Greece ARQ1.720071.7 - 2.9 18 - 64Hungary ARQ HHS2.32007 d, e3.2 - 3.5 15 - 64Iceland ESPAD SS3.4200715 - 64Ireland Government source HHS6.3200815 - 64Italy Government source HHS14.6200715 - 64Latvia ARQ4.9200515 - 64Liechtenstein UNODC Estimate8.6200815 - 64Lithuania ARQ HHS5.6200315 - 64Luxembourg UNODC Estimate7.62007 d, e4.4 - 4.6 18 - 65Malta ESPAD SS4.52007 d, e7.9 - 10.0 18 - 66Monaco ESPAD SS8.9200515 - 64Netherlands ARQ5.4200415 - 64Norway ARQ4.6200616 - 64Poland ARQ2.7200715 - 64Portugal ARQ HHS3.6
San Marino No recent, reliable estimate located200615 - 64Slovakia ARQ HHS6.92007 d, e15 - 64Slovenia ESPAD SS4.1200715 - 64Spain Government source HHS10.1200715 - 64Sweden ARQ HHS2.12007 d, e8.5 - 10.9 15 - 64Switzerland ESPAD SS9.7
United Kingdom No recent, reliable estimate located200916 - 59United Kingdom (England and Wales) Government source HHS7.9200715 - 64United Kingdom (Northern Ireland) Government source HHS7.2200916 - 59United Kingdom (Scotland) Government source HHS8.4
OCEANIAOceania
2007 d, e4.7 - 9.2 15 - 64American Samoa Government source SS7.0200715 - 64Australia Government source HHS10.6
Christmas Islands No recent, reliable estimate locatedCocos (Keeling) Is lands No recent, reliable estimate locatedCook Islands No recent, reliable estimate located
2004 d, e3.0 - 7.1 15 - 64Fiji Government source SS5.1French Polynesia No recent, reliable estimate locatedKiribati No recent, reliable estimate located
2007 d, e3.4 - 7.5 15 - 64Marshall Islands Government source SS5.5
Method: HHS=Household survey, SS=School survey, A=Adjusted from other sources, I=Indirect estimates, R=Registry. * approximate estimates
UNODC Adjustments: a=adjusted for age (15-64), b=population-based/household-type study/survey, c=adjusted from a limited geographic population-based study/survey, d=adjusted from school/youth survey, e=adjusted from lifetime/monthly prevalence adjusted to annual prevalence, f=adjusted from specialized population surveys (including Rapid Assessments), g=adjusted from treatment data, h=adjusted from drug registries, i=adjusted from HIV, problematic drug users (only for heroin), j=lifetime prevalence reported,
The 'Method' and 'UNODC Adj.' columns have been completed only for more recent data included in previous and present issues of the World Drug Report.
x=figure may include non-medical use of prescription opioids, z=figures may also include other non-ATS stimulants

291
4. Statistical annex Consumption
Annual Prevalence of Use as a percentage of the population aged 15-64 (unless otherwise indicated)
CANNABIS
Country or TerritoryUncertainty
Range Ages Year Source (original) Method
UNODC Adjusted
UNODC Best
Estimate
Micronesia (Federated States of) No recent, reliable estimate locatedNauru No recent, reliable estimate locatedNew Caledonia No recent, reliable estimate located
200816 - 64New Zealand Government source HHS14.6Norfolk Island No recent, reliable estimate located
2007 d, e18.1 - 26.4 15 - 64Northern Mariana Islands Government source SS22.22007 d, e19.8 - 28.6 15 - 64Palau Government source SS24.2
Papua New Guinea No recent, reliable estimate locatedPitcairn No recent, reliable estimate locatedSamoa No recent, reliable estimate locatedSolomon Islands No recent, reliable estimate locatedTonga No recent, reliable estimate locatedTuvalu No recent, reliable estimate locatedVanuatu No recent, reliable estimate locatedWallis and Futuna Islands No recent, reliable estimate located
Method: HHS=Household survey, SS=School survey, A=Adjusted from other sources, I=Indirect estimates, R=Registry. * approximate estimates
UNODC Adjustments: a=adjusted for age (15-64), b=population-based/household-type study/survey, c=adjusted from a limited geographic population-based study/survey, d=adjusted from school/youth survey, e=adjusted from lifetime/monthly prevalence adjusted to annual prevalence, f=adjusted from specialized population surveys (including Rapid Assessments), g=adjusted from treatment data, h=adjusted from drug registries, i=adjusted from HIV, problematic drug users (only for heroin), j=lifetime prevalence reported,
The 'Method' and 'UNODC Adj.' columns have been completed only for more recent data included in previous and present issues of the World Drug Report.
x=figure may include non-medical use of prescription opioids, z=figures may also include other non-ATS stimulants

292
World Drug Report 2010
Amphetamine-type stimulants4.2.1.4
Annual Prevalence of Use as a percentage of the population aged 15-64 (unless otherwise indicated)
AMPHETAMINES
Country or TerritoryUncertainty
Range Ages Year Source (original) Method
UNODC Adjusted
UNODC Best
Estimate
AFRICAEast Africa
Burundi No recent, reliable estimate locatedComoros No recent, reliable estimate locatedDjibouti No recent, reliable estimate locatedEritrea No recent, reliable estimate locatedEthiopia No recent, reliable estimate locatedKenya No recent, reliable estimate locatedMadagascar No recent, reliable estimate locatedMauritius No recent, reliable estimate locatedRwanda No recent, reliable estimate locatedSeychelles No recent, reliable estimate locatedSomalia No recent, reliable estimate locatedTanzania (United Republic of) No recent, reliable estimate locatedUganda No recent, reliable estimate located
North AfricaAlgeria No recent, reliable estimate located
2006 a, b, d0.4 - 0.5 15 - 64Egypt Govt; Academic Research HHS, SS0.5Libyan Arab Jamahiriya No recent, reliable estimate located
199915 - 64Morocco ARQ<0.1Sudan No recent, reliable estimate locatedTunisia No recent, reliable estimate located
Southern AfricaAngola No recent, reliable estimate locatedBotswana No recent, reliable estimate locatedLesotho No recent, reliable estimate locatedMalawi No recent, reliable estimate locatedMozambique No recent, reliable estimate located
200015 - 64Namibia ARQ<0.12008 a, e0.8 - 1.4 15 - 64South Africa ARQ HHS1.0
Swaziland No recent, reliable estimate located200315 - 64Zambia UNODC Estimate0.1200015 - 64Zimbabwe ARQ0.1
West and Central AfricaBenin No recent, reliable estimate locatedBurkina Faso No recent, reliable estimate locatedCameroon No recent, reliable estimate locatedCape Verde No recent, reliable estimate locatedCentral African Republic No recent, reliable estimate locatedChad No recent, reliable estimate locatedCongo No recent, reliable estimate locatedCongo (Dem. Rep. of the) No recent, reliable estimate locatedCôte d'Ivoire No recent, reliable estimate locatedEquatorial Guinea No recent, reliable estimate locatedGabon No recent, reliable estimate locatedGambia No recent, reliable estimate locatedGhana No recent, reliable estimate locatedGuinea No recent, reliable estimate locatedGuinea-Bissau No recent, reliable estimate locatedLiberia No recent, reliable estimate locatedMali No recent, reliable estimate locatedMauritania No recent, reliable estimate locatedNiger No recent, reliable estimate located
199915 - 64Nigeria UNODC Estimate1.1Saint Helena No recent, reliable estimate locatedSao Tome and Principe No recent, reliable estimate locatedSenegal No recent, reliable estimate located
Method: HHS=Household survey, SS=School survey, A=Adjusted from other sources, I=Indirect estimates, R=Registry. * approximate estimates
UNODC Adjustments: a=adjusted for age (15-64), b=population-based/household-type study/survey, c=adjusted from a limited geographic population-based study/survey, d=adjusted from school/youth survey, e=adjusted from lifetime/monthly prevalence adjusted to annual prevalence, f=adjusted from specialized population surveys (including Rapid Assessments), g=adjusted from treatment data, h=adjusted from drug registries, i=adjusted from HIV, problematic drug users (only for heroin), j=lifetime prevalence reported,
The 'Method' and 'UNODC Adj.' columns have been completed only for more recent data included in previous and present issues of the World Drug Report.
x=figure may include non-medical use of prescription opioids, z=figures may also include other non-ATS stimulants

293
4. Statistical annex Consumption
Annual Prevalence of Use as a percentage of the population aged 15-64 (unless otherwise indicated)
AMPHETAMINES
Country or TerritoryUncertainty
Range Ages Year Source (original) Method
UNODC Adjusted
UNODC Best
Estimate
Sierra Leone No recent, reliable estimate locatedTogo No recent, reliable estimate located
AMERICASCaribbean
Anguilla No recent, reliable estimate located2005 d, e0.2 - 1.2 15 - 64Antigua and Barbuda Government source SS0.62008 d, e0.1 - 1.1 15 - 64Bahamas ARQ SS0.4200612 - 65Barbados CICAD HHS, z0.2
Bermuda No recent, reliable estimate locatedBritish Virgin Islands No recent, reliable estimate locatedCayman Islands No recent, reliable estimate locatedCuba No recent, reliable estimate located
2006 d, e0.3 - 1.6 15 - 64Dominica Government source SS0.92008 d, e<0.1 - 2.6 15 - 64Dominican Republic ARQ SS, z1.0200515 - 64Grenada ARQ0.7
Haiti No recent, reliable estimate located2006 d, e0.4 - 1.9 15 - 64Jamaica Government source SS1.1
Montserrat No recent, reliable estimate locatedNetherlands Antilles No recent, reliable estimate located
2005 d, e0.1 - 1.1 15 - 64Puerto Rico Government source SS0.42006 d, e0.1 - 0.6 15 - 64Saint Kitts and Nevis Government source SS, z0.22005 d, e0.4 - 1.9 15 - 64Saint Lucia CICAD SS, z1.22006 d, e0.2 - 1.3 15 - 64Saint Vincent and the Grenadines CICAD SS, z0.62006 d, e0.2 - 1.4 15 - 64Trinidad and Tobago CICAD SS, z0.72003 d, e15 - 64Turks and Caicos Islands UNODC Estimate0.3
United States Virgin Islands No recent, reliable estimate located
Central America200512 - 65Belize CICAD HHS, z1.4200612 - 70Costa Rica ARQ1.3200512 - 65El Salvador CICAD HHS, z3.32005 d, e15 - 64Guatemala UNODC Estimate0.92005 d,e15 - 64Honduras UNODC Estimate0.82003 d15 - 64Nicaragua UNODC Estimate0.8200312 - 65Panama CICAD HHS, z1.2
North America200815 - 64Canada CADUMS HHS1.520080.1 - 0.2 12 - 65Mexico Govt. source (ENA) HHS0.2
Saint Pierre and Miquelon No recent, reliable estimate located200815 - 64United States of America Govt. source (SAMHSA) HHS1.3
South America2005 d, e15 - 64Argentina UNODC Estimate SS, z0.6200712 - 65Bolivia (Plurinational State of) ARQ HHS0.5200512 - 65Brazil Government source HHS, c0.7200815 - 64Chile ARQ HHS0.42008 a, c, d, e<0.1 - 1.9 12 - 65Colombia Government source HHS, SS0.52005 d, e15 - 64Ecuador UNODC Estimate SS, z0.2
Falkland Islands (Malvinas) No recent, reliable estimate located2002 d, e0.1 - 1.1 15 - 64Guyana CICAD SS, z0.52005 d, e15 - 64Paraguay UNODC Estimate SS, z0.5200612 - 64Peru Govt. HHS0.2200712 - 65Suriname Government source HHS, z0.7200612 - 65Uruguay ARQ0.12002 d, e15 - 64Venezuela (Bolivarian Republic of) UNODC Estimate0.6
ASIACentral Asia and Transcaucasian countries
200515 - 64Armenia UNODC Estimate HHS<0.1Azerbaijan No recent, reliable estimate located
Method: HHS=Household survey, SS=School survey, A=Adjusted from other sources, I=Indirect estimates, R=Registry. * approximate estimates
UNODC Adjustments: a=adjusted for age (15-64), b=population-based/household-type study/survey, c=adjusted from a limited geographic population-based study/survey, d=adjusted from school/youth survey, e=adjusted from lifetime/monthly prevalence adjusted to annual prevalence, f=adjusted from specialized population surveys (including Rapid Assessments), g=adjusted from treatment data, h=adjusted from drug registries, i=adjusted from HIV, problematic drug users (only for heroin), j=lifetime prevalence reported,
The 'Method' and 'UNODC Adj.' columns have been completed only for more recent data included in previous and present issues of the World Drug Report.
x=figure may include non-medical use of prescription opioids, z=figures may also include other non-ATS stimulants

294
World Drug Report 2010
Annual Prevalence of Use as a percentage of the population aged 15-64 (unless otherwise indicated)
AMPHETAMINES
Country or TerritoryUncertainty
Range Ages Year Source (original) Method
UNODC Adjusted
UNODC Best
Estimate
Georgia No recent, reliable estimate locatedKazakhstan No recent, reliable estimate locatedKyrgyzstan No recent, reliable estimate locatedTajikistan No recent, reliable estimate locatedTurkmenistan No recent, reliable estimate locatedUzbekistan No recent, reliable estimate located
East and South-East Asia2006 g15 - 64Brunei Darussalam UNODC Estimate0.32004 d, e15 - 64Cambodia UNODC Estimate0.6
China No recent, reliable estimate located2008 d, e<0.1 - 1.1 15 - 64China, Hong Kong SAR Government source SS 0.4
China, Macao SAR No recent, reliable estimate located2007 d, e0.5 - 2.3 15 - 64Guam Government source SS1.4200815 - 64Indonesia ARQ HHS0.2
Japan No recent, reliable estimate locatedKorea (Dem. People's Rep.) No recent, reliable estimate located
2004 b, c, e<0.1 - 0.2 15 - 64Korea (Republic of) ARQ HHS0.12008 a, c, d, e1.1 - 1.7 15 - 64Lao People's Democratic Republic Academic research SS1.42005 d, g, h15 - 64Malaysia UNODC Estimate0.6
Mongolia No recent, reliable estimate located2005 d, f15 - 64Myanmar UNODC Estimate0.22008 c, e1.9 - 2.4 15 - 64Philippines Government source HHS2.1
Singapore No recent, reliable estimate located200512 - 64Taiwan, Province of China AMCEWG0.6200712 - 65Thailand ARQ HHS1.4
Timor-Leste No recent, reliable estimate located2003 h15 - 64Viet Nam UNODC Estimate0.2
Near and Middle East /South-West Asia200915 - 64Afghanistan UNODC/ Govt. Source HHS<0.1
Bahrain No recent, reliable estimate locatedIran (Islamic Republic of) No recent, reliable estimate locatedIraq No recent, reliable estimate located
200818 - 40Israel Government source HHS4.5200115 - 64Jordan UNODC Estimate0.42005 g15 - 64Kuwait UNODC Estimate0.32001 d, e15 - 64Lebanon UNODC Estimate0.4
Occupied Palestinian Territory No recent, reliable estimate locatedOman No recent, reliable estimate locatedPakistan No recent, reliable estimate locatedQatar No recent, reliable estimate located
2006 g15 - 64Saudi Arabia UNODC Estimate0.4Syrian Arab Republic No recent, reliable estimate locatedUnited Arab Emirates No recent, reliable estimate locatedYemen No recent, reliable estimate located
South AsiaBangladesh No recent, reliable estimate locatedBhutan No recent, reliable estimate locatedIndia No recent, reliable estimate locatedMaldives No recent, reliable estimate locatedNepal No recent, reliable estimate locatedSri Lanka No recent, reliable estimate located
EUROPEEast Europe
2006 g15 - 64Belarus UNODC Estimate0.42008 e15 - 64Moldova (Republic of) Government source HHS<0.12007 d, e0.2 - 0.6 15 - 64Russian Federation* ESPAD SS0.42007 d, e0.2 - 0.6 15 - 64Ukraine ESPAD SS0.4
Method: HHS=Household survey, SS=School survey, A=Adjusted from other sources, I=Indirect estimates, R=Registry. * approximate estimates
UNODC Adjustments: a=adjusted for age (15-64), b=population-based/household-type study/survey, c=adjusted from a limited geographic population-based study/survey, d=adjusted from school/youth survey, e=adjusted from lifetime/monthly prevalence adjusted to annual prevalence, f=adjusted from specialized population surveys (including Rapid Assessments), g=adjusted from treatment data, h=adjusted from drug registries, i=adjusted from HIV, problematic drug users (only for heroin), j=lifetime prevalence reported,
The 'Method' and 'UNODC Adj.' columns have been completed only for more recent data included in previous and present issues of the World Drug Report.
x=figure may include non-medical use of prescription opioids, z=figures may also include other non-ATS stimulants

295
4. Statistical annex Consumption
Annual Prevalence of Use as a percentage of the population aged 15-64 (unless otherwise indicated)
AMPHETAMINES
Country or TerritoryUncertainty
Range Ages Year Source (original) Method
UNODC Adjusted
UNODC Best
Estimate
Southeast Europe200415 - 64Albania ARQ<0.12008 c, d, e0.4 - 1.7 15 - 64Bosnia and Herzegovina ESPAD SS1.0200815 - 64Bulgaria ARQ HHS1.02007 d, e0.6 - 0.8 15 - 64Croatia ESPAD SS0.7
Macedonia (TFYR) No recent, reliable estimate located2008 d, e<0.1 - 0.9 15 - 64Montenegro ESPAD SS0.52007 e15 - 64Romania Government source HHS<0.12006 a, e0.1 - 0.5 15 - 64Serbia Government sources HHS0.2200315 - 64Turkey UNODC Estimate0.2
West & Central EuropeAndorra No recent, reliable estimate located
2008 a15 - 64Austria Government source HHS0.52007 c, d, e0.6 - 1.1 15 - 64Belgium ESPAD SS0.9200615 - 64Cyprus ARQ0.4200815 - 64Czech Republic Government source HHS1.7200816 - 64Denmark ARQ HHS1.2200815 - 64Estonia Government source HHS1.0200615 - 64Finland ARQ0.6200515 - 64France ARQ0.2200618 - 64Germany Government source HHS0.5200415 - 64Greece ARQ0.220070.2 - 0.8 18 - 64Hungary ARQ HHS0.520030.6 - 0.9 15 - 64Iceland ESPAD SS0.7200715 - 64Ireland Government source HHS0.42007 d, e0.6 - 0.7 15 - 64Italy Government source/ ESPAD HHS, SS0.6200715 - 64Latvia ARQ0.92005 d15 - 64Liechtenstein UNODC Estimate0.2200815 - 64Lithuania ARQ HHS0.7199915 - 64Luxembourg UNODC Estimate0.42007 d, e0.6 - 1.2 15 - 64Malta ESPAD SS0.92007 d, e0.5 - 0.6 15 - 64Monaco ESPAD SS0.5200515 - 64Netherlands ARQ HHS0.3200415 - 64Norway ARQ HHS1.1200615 - 64Poland ARQ0.7200715 - 64Portugal ARQ HHS0.2
San Marino No recent, reliable estimate located200615 - 64Slovakia EMCDDA HHS0.32007 d, e0.5 - 0.6 15 - 64Slovenia ESPAD SS0.5200715 - 64Spain Government source HHS0.92007 d, e0.2 - 0.6 15 - 64Sweden ESPAD SS0.42007 d, e0.6 - 0.7 15 - 64Switzerland ESPAD SS0.6
United Kingdom No recent, reliable estimate located2009 a16 - 64United Kingdom (England and Wales) Government source HHS1.1200716 - 59United Kingdom (Northern Ireland) Government source HHS1.02009 a16 - 64United Kingdom (Scotland) Government source HHS1.4
OCEANIAOceania
2007 d, e0.5 - 2.3 15 - 64American Samoa Government source SS1.3200715 - 64Australia Government source HHS2.7
Christmas Islands No recent, reliable estimate locatedCocos (Keeling) Islands No recent, reliable estimate locatedCook Islands No recent, reliable estimate locatedFiji No recent, reliable estimate locatedFrench Polynesia No recent, reliable estimate locatedKiribati No recent, reliable estimate located
2007 d, e1.4 - 4.0 15 - 64Marshall Islands Government source SS2.7
Method: HHS=Household survey, SS=School survey, A=Adjusted from other sources, I=Indirect estimates, R=Registry. * approximate estimates
UNODC Adjustments: a=adjusted for age (15-64), b=population-based/household-type study/survey, c=adjusted from a limited geographic population-based study/survey, d=adjusted from school/youth survey, e=adjusted from lifetime/monthly prevalence adjusted to annual prevalence, f=adjusted from specialized population surveys (including Rapid Assessments), g=adjusted from treatment data, h=adjusted from drug registries, i=adjusted from HIV, problematic drug users (only for heroin), j=lifetime prevalence reported,
The 'Method' and 'UNODC Adj.' columns have been completed only for more recent data included in previous and present issues of the World Drug Report.
x=figure may include non-medical use of prescription opioids, z=figures may also include other non-ATS stimulants

296
World Drug Report 2010
Annual Prevalence of Use as a percentage of the population aged 15-64 (unless otherwise indicated)
AMPHETAMINES
Country or TerritoryUncertainty
Range Ages Year Source (original) Method
UNODC Adjusted
UNODC Best
Estimate
Micronesia (Federated States of) No recent, reliable estimate locatedNauru No recent, reliable estimate locatedNew Caledonia No recent, reliable estimate located
200816 - 64New Zealand Government source HHS2.1Norfolk Island No recent, reliable estimate located
2007 d, e0.4 - 2.1 15 - 64Northern Mariana Islands Government source SS1.22007 d, e0.6 - 2.6 15 - 64Palau Government source SS1.6
Papua New Guinea No recent, reliable estimate locatedPitcairn No recent, reliable estimate locatedSamoa No recent, reliable estimate locatedSolomon Islands No recent, reliable estimate locatedTonga No recent, reliable estimate locatedTuvalu No recent, reliable estimate locatedVanuatu No recent, reliable estimate locatedWallis and Futuna Islands No recent, reliable estimate located
Method: HHS=Household survey, SS=School survey, A=Adjusted from other sources, I=Indirect estimates, R=Registry. * approximate estimates
UNODC Adjustments: a=adjusted for age (15-64), b=population-based/household-type study/survey, c=adjusted from a limited geographic population-based study/survey, d=adjusted from school/youth survey, e=adjusted from lifetime/monthly prevalence adjusted to annual prevalence, f=adjusted from specialized population surveys (including Rapid Assessments), g=adjusted from treatment data, h=adjusted from drug registries, i=adjusted from HIV, problematic drug users (only for heroin), j=lifetime prevalence reported,
The 'Method' and 'UNODC Adj.' columns have been completed only for more recent data included in previous and present issues of the World Drug Report.
x=figure may include non-medical use of prescription opioids, z=figures may also include other non-ATS stimulants

297
4. Statistical annex Consumption
Ecstasy4.2.1.5
Annual Prevalence of Use as a percentage of the population aged 15-64 (unless otherwise indicated)
ECSTASY
Country or TerritoryUncertainty
Range Ages Year Source (original) Method
UNODC Adjusted
UNODC Best
Estimate
AFRICAEast Africa
Burundi No recent, reliable estimate locatedComoros No recent, reliable estimate locatedDjibouti No recent, reliable estimate locatedEritrea No recent, reliable estimate locatedEthiopia No recent, reliable estimate locatedKenya No recent, reliable estimate locatedMadagascar No recent, reliable estimate locatedMauritius No recent, reliable estimate locatedRwanda No recent, reliable estimate locatedSeychelles No recent, reliable estimate locatedSomalia No recent, reliable estimate locatedTanzania (United Republic of) No recent, reliable estimate locatedUganda No recent, reliable estimate located
North AfricaAlgeria No recent, reliable estimate locatedEgypt No recent, reliable estimate locatedLibyan Arab Jamahiriya No recent, reliable estimate located
200315 - 64Morocco ARQ<0.1Sudan No recent, reliable estimate locatedTunisia No recent, reliable estimate located
Southern AfricaAngola No recent, reliable estimate locatedBotswana No recent, reliable estimate locatedLesotho No recent, reliable estimate locatedMalawi No recent, reliable estimate locatedMozambique No recent, reliable estimate located
200015 - 64Namibia ARQ<0.12004 d, e15 - 64South Africa UNODC Estimate0.4
Swaziland No recent, reliable estimate located2003 e, f15 - 64Zambia UNODC Estimate0.3
Zimbabwe No recent, reliable estimate locatedWest and Central Africa
Benin No recent, reliable estimate locatedBurkina Faso No recent, reliable estimate locatedCameroon No recent, reliable estimate located
2004 d15 - 64Cape Verde UNODC Estimate<0.1Central African Republic No recent, reliable estimate locatedChad No recent, reliable estimate locatedCongo No recent, reliable estimate locatedCongo (Dem. Rep. of the) No recent, reliable estimate locatedCôte d'Ivoire No recent, reliable estimate locatedEquatorial Guinea No recent, reliable estimate locatedGabon No recent, reliable estimate locatedGambia No recent, reliable estimate locatedGhana No recent, reliable estimate locatedGuinea No recent, reliable estimate locatedGuinea-Bissau No recent, reliable estimate locatedLiberia No recent, reliable estimate locatedMali No recent, reliable estimate locatedMauritania No recent, reliable estimate locatedNiger No recent, reliable estimate locatedNigeria No recent, reliable estimate locatedSaint Helena No recent, reliable estimate locatedSao Tome and Principe No recent, reliable estimate locatedSenegal No recent, reliable estimate located
Method: HHS=Household survey, SS=School survey, A=Adjusted from other sources, I=Indirect estimates, R=Registry. * approximate estimates
UNODC Adjustments: a=adjusted for age (15-64), b=population-based/household-type study/survey, c=adjusted from a limited geographic population-based study/survey, d=adjusted from school/youth survey, e=adjusted from lifetime/monthly prevalence adjusted to annual prevalence, f=adjusted from specialized population surveys (including Rapid Assessments), g=adjusted from treatment data, h=adjusted from drug registries, i=adjusted from HIV, problematic drug users (only for heroin), j=lifetime prevalence reported,
The 'Method' and 'UNODC Adj.' columns have been completed only for more recent data included in previous and present issues of the World Drug Report.
x=figure may include non-medical use of prescription opioids, z=figures may also include other non-ATS stimulants

298
World Drug Report 2010
Annual Prevalence of Use as a percentage of the population aged 15-64 (unless otherwise indicated)
ECSTASY
Country or TerritoryUncertainty
Range Ages Year Source (original) Method
UNODC Adjusted
UNODC Best
Estimate
Sierra Leone No recent, reliable estimate locatedTogo No recent, reliable estimate located
AMERICASCaribbean
Anguilla No recent, reliable estimate located2005 d, e<0.1 - 0.7 15 - 64Antigua and Barbuda Government source SS0.22008 d, e<0.1 - 0.6 15 - 64Bahamas Government source SS0.1200615 - 64Barbados CICAD HHS0.5
Bermuda No recent, reliable estimate locatedBritish Virgin Islands No recent, reliable estimate locatedCayman Islands No recent, reliable estimate locatedCuba No recent, reliable estimate located
2006 d, e<0.1 - 0.5 15 - 64Dominica Government source SS<0.12008 d, e<0.1 - 0.5 15 - 64Dominican Republic Government source SS<0.12005 d, e<0.1 - 0.7 15 - 64Grenada Government source SS0.22005 d, e0.1 - 1.2 15 - 64Haiti CICAD SS0.6
Jamaica No recent, reliable estimate locatedMontserrat No recent, reliable estimate locatedNetherlands Antilles No recent, reliable estimate located
2005<0.1 - 1.0 15 - 64Puerto Rico Government source SS0.42006 d, e<0.1 - 1.0 15 - 64Saint Kitts and Nevis Government source SS0.4
Saint Lucia No recent, reliable estimate located2006 d, e<0.1 - 0.5 15 - 64Saint Vincent and the Grenadines CICAD SS<0.12006 d, e<0.1 - 0.6 15 - 64Trinidad and Tobago CICAD SS0.12003 d, e15 - 64Turks and Caicos Islands UNODC Estimate0.7
United States Virgin Islands No recent, reliable estimate located
Central America200512 - 65Belize Government source HHS0.32006 d, e0.1 - 0.4 12 - 70Costa Rica ARQ SS0.22005 a, e15 - 64El Salvador CICAD HHS<0.1200515 - 64Guatemala UNODC Estimate<0.12005 d15 - 64Honduras UNODC Estimate<0.12006 e12 - 65Nicaragua CICAD HHS, c<0.12003 d15 - 64Panama UNODC Estimate0.4
North America200815 - 64Canada ARQ HHS1.7200215 - 64Mexico Govt. source (CONADIC)<0.1
Saint Pierre and Miquelon No recent, reliable estimate located200815 - 64United States of America Govt. source (SAMHSA) HHS1.0
South America200612 - 65Argentina Government source0.5200712 - 65Bolivia (Plurinational State of) ARQ HHS, c0.1200515 - 64Brazil UNODC Estimate0.2200815 - 64Chile ARQ HHS0.1200812 - 65Colombia Government source HHS, c0.3200515 - 64Ecuador UNODC Estimate0.2
Falkland Islands (Malvinas) No recent, reliable estimate located200215 - 64Guyana UNODC Estimate0.1200515 - 64Paraguay UNODC Estimate<0.1200612 - 64Peru ARQ HHS, c<0.12007 e<0.1 - 0.2 12 - 65Suriname Government source HHS, c0.12006 c, e15 - 64Uruguay Government source HHS, a, c0.22005 a, e<0.1 15 - 64Venezuela (Bolivarian Republic of) Government source HHS<0.1
ASIACentral Asia and Transcaucasian countries
200515 - 64Armenia UNODC Estimate HHS0.1Azerbaijan No recent, reliable estimate located
Method: HHS=Household survey, SS=School survey, A=Adjusted from other sources, I=Indirect estimates, R=Registry. * approximate estimates
UNODC Adjustments: a=adjusted for age (15-64), b=population-based/household-type study/survey, c=adjusted from a limited geographic population-based study/survey, d=adjusted from school/youth survey, e=adjusted from lifetime/monthly prevalence adjusted to annual prevalence, f=adjusted from specialized population surveys (including Rapid Assessments), g=adjusted from treatment data, h=adjusted from drug registries, i=adjusted from HIV, problematic drug users (only for heroin), j=lifetime prevalence reported,
The 'Method' and 'UNODC Adj.' columns have been completed only for more recent data included in previous and present issues of the World Drug Report.
x=figure may include non-medical use of prescription opioids, z=figures may also include other non-ATS stimulants

299
4. Statistical annex Consumption
Annual Prevalence of Use as a percentage of the population aged 15-64 (unless otherwise indicated)
ECSTASY
Country or TerritoryUncertainty
Range Ages Year Source (original) Method
UNODC Adjusted
UNODC Best
Estimate
2005 d, e0.7 - 2.4 15 - 64Georgia ARQ SS1.7Kazakhstan No recent, reliable estimate locatedKyrgyzstan No recent, reliable estimate locatedTajikistan No recent, reliable estimate locatedTurkmenistan No recent, reliable estimate locatedUzbekistan No recent, reliable estimate located
East and South-East AsiaBrunei Darussalam No recent, reliable estimate located
200315 - 64Cambodia UNODC Estimate0.1China No recent, reliable estimate located
2008 d, e<0.1 - 0.8 15 - 64China, Hong Kong SAR Government source SS0.22002 c, e15 - 64China, Macao SAR UNODC Estimate0.3
Guam No recent, reliable estimate located200815 - 64Indonesia ARQ HHS0.2
Japan No recent, reliable estimate locatedKorea (Dem. People's Rep.) No recent, reliable estimate located
2004 c, e<0.1 15 - 64Korea (Republic of) ARQ HHS<0.1Lao People's Democratic Republic No recent, reliable estimate located
2003 e, g15 - 64Malaysia UNODC Estimate0.4Mongolia No recent, reliable estimate locatedMyanmar No recent, reliable estimate located
200415 - 64Philippines Government source HHS0.2Singapore No recent, reliable estimate located
2005 a15 - 64Taiwan, Province of China AMCEWG0.5200715 - 64Thailand ARQ HHS0.3
Timor-Leste No recent, reliable estimate located200315 - 64Viet Nam UNODC Estimate0.2
Near and Middle East /South-West AsiaAfghanistan No recent, reliable estimate locatedBahrain No recent, reliable estimate locatedIran (Islamic Republic of) No recent, reliable estimate locatedIraq No recent, reliable estimate located
200818 - 40Israel Government source HHS0.7Jordan No recent, reliable estimate locatedKuwait No recent, reliable estimate located
2001 d, e15 - 64Lebanon UNODC Estimate0.5Occupied Palestinian Territory No recent, reliable estimate locatedOman No recent, reliable estimate locatedPakistan No recent, reliable estimate locatedQatar No recent, reliable estimate locatedSaudi Arabia No recent, reliable estimate locatedSyrian Arab Republic No recent, reliable estimate locatedUnited Arab Emirates No recent, reliable estimate locatedYemen No recent, reliable estimate located
South AsiaBangladesh No recent, reliable estimate locatedBhutan No recent, reliable estimate locatedIndia No recent, reliable estimate locatedMaldives No recent, reliable estimate locatedNepal No recent, reliable estimate locatedSri Lanka No recent, reliable estimate located
EUROPEEast Europe
2007 c, d, e15 - 64Belarus ESPAD SS0.3200815 - 64Moldova (Republic of) Government sources HHS0.32007 d, e15 - 64Russian Federation* ESPAD SS0.72007 d, e15 - 64Ukraine ESPAD SS0.7
Method: HHS=Household survey, SS=School survey, A=Adjusted from other sources, I=Indirect estimates, R=Registry. * approximate estimates
UNODC Adjustments: a=adjusted for age (15-64), b=population-based/household-type study/survey, c=adjusted from a limited geographic population-based study/survey, d=adjusted from school/youth survey, e=adjusted from lifetime/monthly prevalence adjusted to annual prevalence, f=adjusted from specialized population surveys (including Rapid Assessments), g=adjusted from treatment data, h=adjusted from drug registries, i=adjusted from HIV, problematic drug users (only for heroin), j=lifetime prevalence reported,
The 'Method' and 'UNODC Adj.' columns have been completed only for more recent data included in previous and present issues of the World Drug Report.
x=figure may include non-medical use of prescription opioids, z=figures may also include other non-ATS stimulants
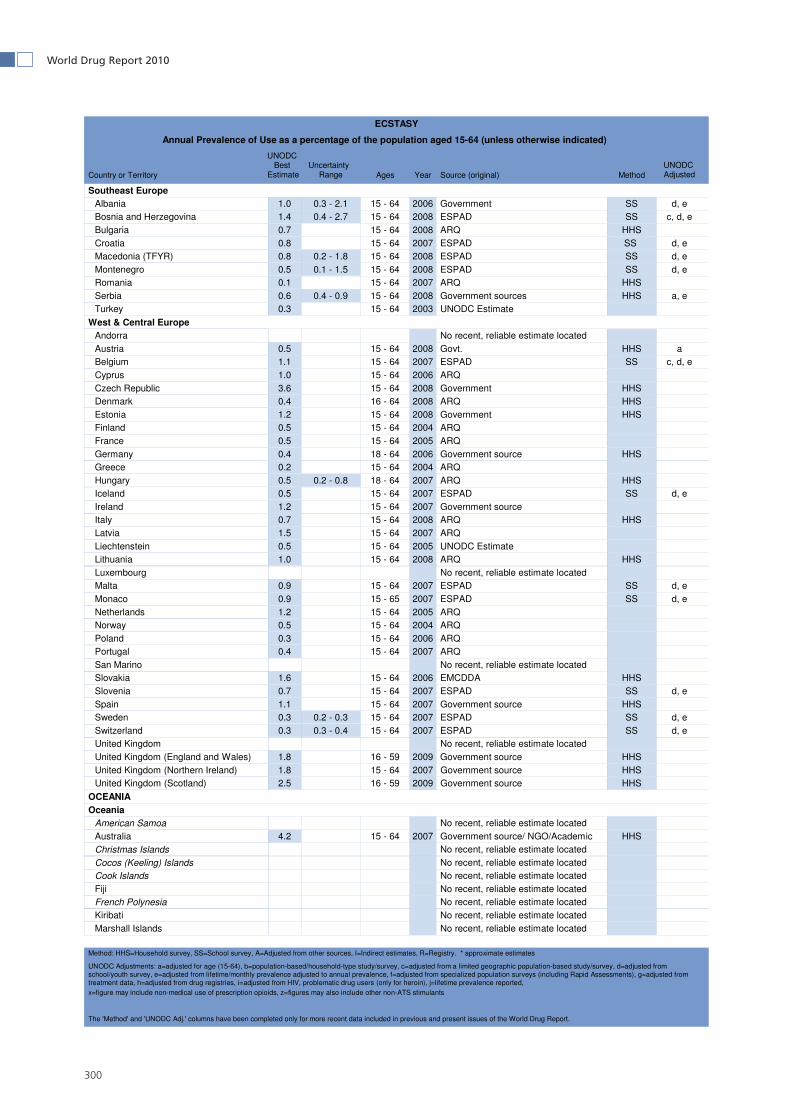
300
World Drug Report 2010
Annual Prevalence of Use as a percentage of the population aged 15-64 (unless otherwise indicated)
ECSTASY
Country or TerritoryUncertainty
Range Ages Year Source (original) Method
UNODC Adjusted
UNODC Best
Estimate
Southeast Europe2006 d, e0.3 - 2.1 15 - 64Albania Government SS1.02008 c, d, e0.4 - 2.7 15 - 64Bosnia and Herzegovina ESPAD SS1.4200815 - 64Bulgaria ARQ HHS0.72007 d, e15 - 64Croatia ESPAD SS 0.82008 d, e0.2 - 1.8 15 - 64Macedonia (TFYR) ESPAD SS0.82008 d, e0.1 - 1.5 15 - 64Montenegro ESPAD SS0.5200715 - 64Romania ARQ HHS0.12008 a, e0.4 - 0.9 15 - 64Serbia Government sources HHS0.6200315 - 64Turkey UNODC Estimate0.3
West & Central EuropeAndorra No recent, reliable estimate located
2008 a15 - 64Austria Govt. HHS0.52007 c, d, e15 - 64Belgium ESPAD SS1.1200615 - 64Cyprus ARQ1.0200815 - 64Czech Republic Government HHS3.6200816 - 64Denmark ARQ HHS0.4200815 - 64Estonia Government HHS1.2200415 - 64Finland ARQ0.5200515 - 64France ARQ0.5200618 - 64Germany Government source HHS0.4200415 - 64Greece ARQ0.220070.2 - 0.8 18 - 64Hungary ARQ HHS0.52007 d, e15 - 64Iceland ESPAD SS0.5200715 - 64Ireland Government source1.2200815 - 64Italy ARQ HHS0.7200715 - 64Latvia ARQ1.5200515 - 64Liechtenstein UNODC Estimate0.5200815 - 64Lithuania ARQ HHS1.0
Luxembourg No recent, reliable estimate located2007 d, e15 - 64Malta ESPAD SS0.92007 d, e15 - 65Monaco ESPAD SS0.9200515 - 64Netherlands ARQ1.2200415 - 64Norway ARQ0.5200615 - 64Poland ARQ0.3200715 - 64Portugal ARQ0.4
San Marino No recent, reliable estimate located200615 - 64Slovakia EMCDDA HHS1.62007 d, e15 - 64Slovenia ESPAD SS0.7200715 - 64Spain Government source HHS1.12007 d, e0.2 - 0.3 15 - 64Sweden ESPAD SS0.32007 d, e0.3 - 0.4 15 - 64Switzerland ESPAD SS0.3
United Kingdom No recent, reliable estimate located200916 - 59United Kingdom (England and Wales) Government source HHS1.8200715 - 64United Kingdom (Northern Ireland) Government source HHS1.8200916 - 59United Kingdom (Scotland) Government source HHS2.5
OCEANIAOceania
American Samoa No recent, reliable estimate located200715 - 64Australia Government source/ NGO/Academic HHS4.2
Christmas Islands No recent, reliable estimate locatedCocos (Keeling) Islands No recent, reliable estimate locatedCook Islands No recent, reliable estimate locatedFiji No recent, reliable estimate locatedFrench Polynesia No recent, reliable estimate locatedKiribati No recent, reliable estimate locatedMarshall Islands No recent, reliable estimate located
Method: HHS=Household survey, SS=School survey, A=Adjusted from other sources, I=Indirect estimates, R=Registry. * approximate estimates
UNODC Adjustments: a=adjusted for age (15-64), b=population-based/household-type study/survey, c=adjusted from a limited geographic population-based study/survey, d=adjusted from school/youth survey, e=adjusted from lifetime/monthly prevalence adjusted to annual prevalence, f=adjusted from specialized population surveys (including Rapid Assessments), g=adjusted from treatment data, h=adjusted from drug registries, i=adjusted from HIV, problematic drug users (only for heroin), j=lifetime prevalence reported,
The 'Method' and 'UNODC Adj.' columns have been completed only for more recent data included in previous and present issues of the World Drug Report.
x=figure may include non-medical use of prescription opioids, z=figures may also include other non-ATS stimulants

301
4. Statistical annex Consumption
Annual Prevalence of Use as a percentage of the population aged 15-64 (unless otherwise indicated)
ECSTASY
Country or TerritoryUncertainty
Range Ages Year Source (original) Method
UNODC Adjusted
UNODC Best
Estimate
Micronesia (Federated States of) No recent, reliable estimate locatedNauru No recent, reliable estimate locatedNew Caledonia No recent, reliable estimate located
200816 - 64New Zealand Government source HHS2.6Norfolk Island No recent, reliable estimate locatedNorthern Mariana Islands No recent, reliable estimate locatedPalau No recent, reliable estimate locatedPapua New Guinea No recent, reliable estimate locatedPitcairn No recent, reliable estimate locatedSamoa No recent, reliable estimate locatedSolomon Islands No recent, reliable estimate locatedTonga No recent, reliable estimate locatedTuvalu No recent, reliable estimate locatedVanuatu No recent, reliable estimate locatedWallis and Futuna Islands No recent, reliable estimate located
Method: HHS=Household survey, SS=School survey, A=Adjusted from other sources, I=Indirect estimates, R=Registry. * approximate estimates
UNODC Adjustments: a=adjusted for age (15-64), b=population-based/household-type study/survey, c=adjusted from a limited geographic population-based study/survey, d=adjusted from school/youth survey, e=adjusted from lifetime/monthly prevalence adjusted to annual prevalence, f=adjusted from specialized population surveys (including Rapid Assessments), g=adjusted from treatment data, h=adjusted from drug registries, i=adjusted from HIV, problematic drug users (only for heroin), j=lifetime prevalence reported,
The 'Method' and 'UNODC Adj.' columns have been completed only for more recent data included in previous and present issues of the World Drug Report.
x=figure may include non-medical use of prescription opioids, z=figures may also include other non-ATS stimulants

302
World Drug Report 2010
Trea
tmen
t d
eman
d4.
2.2
Prim
ary
dru
gs
of
abu
se a
mo
ng
per
son
s tr
eate
d f
or
dru
g p
rob
lem
s in
Afr
ica
4.2.
2.1
���
����
���
� ���
���
����
����
����
���
���
����
� �
��
����
���
� ��
��
����
�� �
��
����
�� �
����
���
����
����
���
���
����
����
����
����
��
���
����
����
�!�
�" #
�#$$
���
�!�
���
��
%�&
����
��'
�� �
��
���
����
��
����
� �
���
��
�
��
������
������
������
������
��
������
������
������
������
����
������
������
������
������
� �
��
������
������
���
��
*��
�+��
��
��
��
����
�
��
��
����
���
�
*��
/ ��
:��
��
��
�
���
��
����
������
������
��
�
��
�
��
������
������
������
������
����
������
������
������
������
����
������
������
��
������
������
���
����
���
�;�
�#�
��
�
���
���
����
�&�
���
%��
��� �
��
�
���
���
<'��
��
��
�
��
��
��
��
��
��
������
������
������
������
����
������
������
������
������
����
������
������
��
������
������
��
����
�
<� ��
���
��
�
���
��
���
��
�� �
��
������
������
������
������
��
������
������
������
������
����
������
������
������
������
��
��
����
������
����
��
<��
�� �
��
�
���
� �
���
� �
��
������
������
������
������
��
������
������
������
������
����
������
������
������
������
����
������
������
���
�
���
�=
����
��
�
���
� �
��
��
� �
��
������
������
������
������
��
������
������
������
������
����
������
������
������
������
����
������
������
��
������
������
���
��
����
���
���
��!
�"�#
�
���
��
���
��
�� �
��
��
����
������
������
������
������
� �
���
�
���
��
�
>���
���
��
��
�
���
���
��
�#�'
����
��
��
�
��
��
����
������
������
��
������
������
������
������
��
������
������
������
������
�����
�
��
������
������
����
����
������
����
���
��
���+
�
��
��
�
��
�
���
���
� � �
��
��
�
���
�
���
��
����
������
������
������
����
����
������
������
������
������
����
������
������
������
����
������
������
��
�
$��%
��?
���
���
��
��
�
���
� �
���
� �
���
� �
��
������
������
������
������
��
������
������
������
������
����
������
������
������
������
����
������
������
��
������
������
���
�
@��
� �
��
�
���
��
���
��
� �
��
� �
���
��
���
�
����
������
������
������
����
������
������
����
����
������
����
��
@ '
���
��
�
���
�
����
������
������
���
�
��
������
������
������
������
����
������
������
������
������
����
������
������
��
������
������
���
�@
'��
�&
'!*
�
���
��
��
��
��
�
��
������
������
������
������
�����
��
�� �
��
������
������
��
���
��'�
�&
�+
�
���
�
��
��
�
��
��
������
������
������
������
����
������
������
������
������
���
�
����
������
����
���
����
����
��
�
���
�
���
�
��
������
������
������
������
��
������
������
������
������
����
������
������
������
������
����
������
������
��
������
������
���
���
����
���
�&�
��
��
�
���
� �
��
� �
���
� �
��
� �
���
�
����
������
������
������
����
������
������
����
����
������
����
���
��+
�? ��
�#�
��
��
�
��
�
� �
��
��
����
������
������
������
����
�� �
��
��
����
������
������
��
������
������
��
���
�?��
��
��
��
�
��
��
��
��
����
������
������
������
����
����
������
������
������
������
����
������
������
������
����
������
������
����
����
������
����
��
��'�
��
�
���
� �
���
��
��
��
����
������
������
������
����
����
������
������
������
������
����
������
������
������
����
��
���
� �
��
�
��
/
J��
� �
��
�
��
���
���
KQX[
Q\]
�"�
��'�
^��+
� '�
��#_
Q\`
df
Kk`
Qf
m`]
fd
`kf
\`Q
fp
`\f
\`X
fd
`Kf
��*
��;<
�=�<
�>?�<@
/>@$*
�"$'�
@F#
�����
��'*
@�*�
�*�*<
@�*=
@�*��
@/��
�*�'�
F���
��<@
;'<*�
�%��
�//@<
�/<'=
�$'Q
�*<?
�*'�$
'Q�*
<?X�*
'*�>
F�[
��$�
�@\$
@@��
��
�<@;<
@F@�
*�;'>
?��<
Q%�Q
F@�<@
;'<*�
�%
�&
@'%<
�;��
$�>>?
�>�=
�*@��
<@;'
<*��%
�"@%�
*�@�
]�;
�*�>�$
�*?#
�����
^�%Q
<@F�
=�?
�<@/>@
$*��
Q=_@
<�'/�;
@<F'
�F�'
<�*<@
�*=
@�*�@
;�F'
�@F�
�@;@
����
%�'�
�`@=
_@<��
*�*@
X�/�%
Q<@F
�@\$
>Q�@
��>$
'�'>
����
���$
'*��
@ _
+Q_
>�$>?
�/Q��
@��*<
@�*=
@�*
����
��{�@
�F@$
'���
?@�<
�F;@
$�/�@
���F
�/'<�*
�@��
Q=_@
<�'/�;
@';>
@�*<@
�*@�
�">�F
*�$'>
Q=�#
$
�&
|��;
<�!�*
@>?�
/Q��
@��*<
@�*=
@�*
"�# ���
�+<'
\?}�$
'�'<
*�'/��
_QF@
<F���
@�*�/
�@��
/<'=
�<@��
_�>�*
�*�'
��$@
�*<@
F��*<
@�*=
@�*�$
@�*<@
F���
'F;�
*�>F
��F*<@
@*F�
����
��<Q
%��@
�F�[
�*���
���Q
<_��
��<@
�F�
~�;�
*�@�*
���'F
;�*�
>���*
�'��
='�
�>�*?
@|
Q*;�
*�@�*
�='�
�>�*?
�'Q
<$@F
}���
�|
�]
�����
Q�>��
@;'<
*F��
Q@F*
�'��
��<@
F�"�
��
#����
��^�
@>��
|//�
$@�"^
|#��
�*��
��'Q
*�@<
���
/<�$�
���
@!@>
';=
@�*�
/��
=�*@
��FQ
_;';
Q>�*
�'��
"@%�
;<�F
'���?
'Q*�
��@*$
#]
'==
Q��*?
��;�
�@=
�'>'
%?��
@*[
'<��
'���
<Q%�
�F@
�"��
��
�#��
~�*@
<��*
�'��
>�+F?
$�'>
'%?�
�@;
'<*@
<��%
|;�
'���
FQ_F
*�*Q*
�'��
*<@�*
=@�
*�"@%
�=@*
���'
�@#
��
|�
]�&
>'_�
>��FF
@FF=
@�*�+
<'%<
�==
@�'�
��<Q
%��
_QF@
�"&�
+#
�^�
<F*�*
�=@�
*<@�*
=@�
*�@�*
<��*
F�"�
'*�<@
*Q<�
��%�
$>�@
�*F#
�{<@
�*=
@�*��
�=�F
F�'�
F�"�
'*�;
@<F'
�F#
� �
�� �
�� �
��&
��
�#�
�'�
��
����
���'
��$

303
4. Statistical annex Consumption
Prim
ary
dru
gs
of
abu
se a
mo
ng
per
son
s tr
eate
d f
or
dru
g p
rob
lem
s in
th
e A
mer
icas
4.2.
2.2
���
����
���
� ���
���
����
���
����
���
����
���
���
��
� ��
����
��
&���
���
� ��
�
���
��*
����
��
���/
��
����
�� �
���
=��
��<�
����
��=
����
����
����
���
����
� ?�
����
����
���
!��"
#�#
$$
���
�!�
���
��
%�&
����
��'
��� �
��
��
�
��
�
�
����
�
��
������
��
��
� ��
���
��
*��
����
��
�
���
��
� �
��
��
���
_���
��@
*��
��#�
��
��
�
���
*��
" �
^!��
� ���
���
����
���
&_�
��
�
����
��*
��?
��
��
�
��
���
���
�#�
]�
`�
����
{~�
�"|
�*�<
�'#
�
�� �
���
��
�� �
���
��
�� �
�
��
��
���
���
����
��"|
�*�<
�'#
��
���
��
�
� �
�
��
�� �
���
�
� �
�
�
��
� ��
� �
����
��
�@�
����
% �
��
��
�
�
�
���
��
� �
���
���
��
�� �
���
%��
��� �
��
�
��
����
��
�� �
���
��
��
��
��
��
�<�
��#�
��
��
�
�� �
��
���
��
�� �
�
����
��
���@
<��
��"�
#��
��
�
��
��
����
��
�� �
���
�
�� �
��
���
����
�@=
����
#��
��
�
�
��
�
�
��
�
=��
���
���
��
�
��
��
����
��
�� �
��
��
� �
���
�
���@
q�
� �
��
��&'!
*
�
��
����
��
��
�� �
���
��
��
���
q��
#���
��
��
�
���
s�
��
���
��
�
� �
���
��
�� �
��
��
��
�w �
��
��
�
��
���
��
�� �
���
��
�
��
���
���
_@
���
�'��
&'!
* ��
�
���
��
�@!�
���
�&
'!* �
�
���
��
�@!�
��'�
��&
'!*
�
��
��
����
�
�
���
���
��
��
����
��
��
!���
&'!
*
���
��
� ��
�� �
��
���
����
���
�� �
�>��
��
��
�
�� �
��
��
� �
��
���
��;
���
���
�#��
�=
����
# ��
��
��
��&'!
*
��
��
����
��
� �
��
��
���
���
� #
�#�
�#�
���'
��
��
��&'!
*
��
��
����
��
�� �
���
��
���
���
�@x
��'�
���
��
�
����
��
x�
��#
����
���
&��
�� �
�&
'!* �
"{�
��
#
��
��
�� �
��
��
� �
���
��
��
��
����
����
�_
;���
?���
�^*
�� "
�� �
�%
����
� ��
&_&
'!*
�
�� �
�
���
�
�� �
��
���
��
��
�
�
�����
������
��
�����
������
������
����
���
���_
��$
����
�p[
dXQ[
KQz
����
�@��
���
���
��
� �
�
��
�� �
��
��
��
� �
��
����
����
�
����
����
���
���
��
�� �
��
����
��
� ��
� ��
� ��
� ��
����
���
�"�
��'�
^��+
� '�
��#_
\]`d
fm`
XfdQ
`df
m`df
\`Qf
d`\f
X`zf
��*
��;<
�=�<
�>?�<@
/>@$*
�"$'�
@F#
�����
��'*
@�*�
�*�*<
@�*=
@�*��
@/��
�*�'�
F���
��<@
;'<*�
�%��
�//@<
�/<'=
�$'Q
�*<?
�*'�$
'Q�*
<?X�*
'*�>
F�[
��$�
�@\$
@@��
��
�<@;<
@F@�
*�;'>
?��<
Q%�Q
F@�<@
;'<*�
�%�
&@'
%<�;
��$�
>>?�>�
=�*@
��<@
;'<*�
�%�"@
%�*�
@�]
�;�*�
>�$�*?
#��
���^�
%Q<@
F�=
�?�<@
/>@$*
��Q=
_@<�'
/�;@<
F'�F
�'<�*
<@�*
=@�
*�@;�
F'�@
F��@
;@��
��%�
'��`
@=_@
<��*�
*@X�/
�%Q<
@F�@
\$>Q
�@��
>$'�
'>��
����
�$'*
��@
_+
Q_>�$
>?�/Q
��@�
�*<@�
*=@�
*��
����{
�@�F
@$'�
��?@
�<�F
;@$�
/�@��
�F�/'
<�*�@
��Q=
_@<�'
/�;@'
;>@�
*<@�*
@��">
�F*�$
'>Q=
�#
$�
&|
��;<�!
�*@>
?�/Q
��@�
�*<@�
*=@�
*�
~�;�
*�@�*
���'F
;�*�
>���*
�'��
='�
�>�*?
�'Q
<$@F
}���
|�
]��
��Q�
>��@;
'<*F
��Q@
F*�'
����
<@F�
��*�
�"��
�#X�
@|
Q*;�
*�@�*
�='�
�>�*?
�Q_
F*��
$@��
_QF@
����
�`@�
*�>��
@�>*�
��@<
!�$@
F��
�=��
�F*<�
*�'��
"��
`�
��
#��{<
@�*=
@�*�@
;�F'
�@��
�*�F
@*�{
��
����
��
X/
��=
�*@��
FQ_;
';Q>
�*�'
��"@
%�;<
�F'�
��?'Q
*���@
*$#
]@�
*<@�/'
<����
�$*�'
����
��`
@�*�
>��@�
>*��"]
�`
�#��
�<Q
%���
���
>$'�
'>�{
<@�*
=@�
*�~�/
'<=
�*�'
���
?F*@
=�"�
�{~
�#��
]��
���
%|
;�'�
��FQ
_F*�*
Q*�'
��*<@
�*=
@�*�"
@%�=
@*��
�'�@
#�
^�<F
*�*�=
@�*<@
�*=
@�*�@
�*<�
�*F�
"�'*
�<@*Q
<���
%�$>
�@�*
F#�{
<@�*
=@�
*���=
�FF�
'�F�
"�'*
�;@<
F'�F
#
���
� ��
=��
���
���
����
���
����
�� �
����
��
� �
�� �
�� �
��&
��
�#�
�' �
���
����
�'��
$

304
World Drug Report 2010
Prim
ary
dru
gs
of
abu
se a
mo
ng
per
son
s tr
eate
d f
or
dru
g p
rob
lem
s in
Asi
a4.
2.2.
3
���
����
���
� ���
���
����
����
����
���
���
����
� �
��
����
���
� ��
��
����
�� �
���
=��
��<�
����
��=
����
����
����
���
#�� "
���
����
�&'
���
����
��
�
���
��
�
���
�� �
��
�
���
��
���
������
������
������
�� �
����
�����
� ��
������
����
������
������
������
������
������
����
������
������
����
������
������
������
����
������
������
����
�
��
�?�
���
{��
��
����
��
|�
]��
F*
�
����
������
��
����
�����
����
������
������
��
������
������
������
������
������
����
������
������
����
����
������
���
������
������
������
�
*��
'��#
���
��
�
���
��
������
�����
��
������
���
������
������
����
����
������
������
������
������
����
������
������
������
����
������
������
����
������
������
������
��
��
���_
*��
�� �
����
����
��
�|
�]
�^|
�"��
~��
+#
�
����
������
������
����
������
������
�����
����
������
������
��
�
������
������
������
��
������
������
������
����
������
������
����
������
������
������
���
��
��&
'!*
�
����
������
������
�����
��
������
���
������
������
����
�� �
����
������
������
������
����
������
������
����
����
�����
���
���
��#
�&
'!* �
���
|�
]
�
�����
������
��
�����
������
��
������
������
����
��
����
������
������
������
��
������
�����
� ��
������
�����
��
������
������
����
�/
=��
�' �
��
�
�
�����
������
����
��
������
����
���
���
����
���
��
�� �
�&
'!*
�
� �
������
�����
�� �
����
�����
� ��
������
������
������
�����
� �
����
�����
���
/
��#
��
��
�
� �
����
������
�
����
�����
��
������
���
�����
������
������
������
��
�����
������
���
�
_���
��#�
���
��
�|
�]
�^|
�"��
~��
+#
�
�
����
������
�
����
�����
� ��
������
�����
��
������
������
������
����
�
������
�����
�
������
����
����
�
����
^����
� �
%��
��� �
�&_
&'!
*
��
�����
������
����
��
������
��
����
������
��
������
������
������
�����
��
������
�����
����
������
������
����
������
������
������
���
���
�
����
���
��
�
���
s���
�&
'!*
�
��
������
���� �
����
������
������
���
������
������
����
�� �
����
������
������
������
����
������
������
�����
��
������
����
������
������
������
���
��
s��#
���
��
����
����
������
������
����
��
������
���
������
������
����
��
����
������
������
������
����
������
������
����
����
������
���
������
������
������
���
��?
�/��
���
��
�
��
�����
������
����
��
������
���
������
������
����
����
������
������
����
������
������
������
���
��
���@
��+
� �
��
�
��
��
������
�����
��
������
���
����
������
�� �
����
������
������
������
� �
������
�����
��
����
������
��
���
�/
���
'�?�
���
��
�
���
��
������
�����
��
������
���
������
������
����
����
������
������
������
������
����
������
������
������
����
������
������
����
������
������
������
���
���
�@
>��
!���
��|�
���
����
� �%
����
� ��
��
�
�
����
�����
����
������
������
��
�����
������
������
������
���
������
������
������
����
������
������
����
������
������
������
��
��
>���
���
��
����
��
|�
]��
F*
�
��
����
�
����
������
��
����
�����
� �
������
���
�����
������
������
������
���
������
������
������
� �
������
������
����
�/
���
�����
���
� �
��
��
�
��
������
�����
�
����
�����
��
������
������
������
�����
�� �
����
������
���
���
�@
���
���
��
�|
�]
�^|
�"��
~��
+#
�
�� �
����
������
��
����
�����
����
������
������
��
�
������
������
������
����
������
������
������
����
������
������
����
������
������
������
���
���
���
# "�
��
��
�
��
����
������
��
����
�����
����
������
������
��
������
������
������
������
������
����
������
������
����
������
������
������
����
������
������
����
��
���@
���
'�� �
��
�
��
��
������
�����
��
������
���
������
������
����
����
������
������
������
������
����
������
������
������
����
������
������
����
������
������
������
��
���
����
��
|�
]�^
|�"�
�~�
�+
#
�
�����
������
����
��
������
���
������
������
����
�
������
������
������
�����
����
������
������
����
������
������
������
����
������
������
����
���
_��/
@��
���
��
�
�
�
��
���
��
����
������
������
����
�
������
����
������
������
��
������
������
������
������
������
����
������
������
����
������
������
������
����
������
������
����
�/
� �
�� �
�� �
��&
��
�#�
�' �
���
����
�'��
$�
���
����
���
����
�� �
����
����
����
���
!��"
#�#
$$
���
�!�
���
��
%�&
����

305
4. Statistical annex Consumption
!�/
����
��
�
���
��
������
����
�
������
����
�
�
!� �
�� �
���
�|
�]
�^|
�"��
~��
+#
�
�� �
����
������
����
������
������
���
�����
������
�� �
����
������
������
������
� ��
������
�����
����
������
������
���
�����
������
�����
��
}��
���
��
�
��
����
���
��^%
����
� ��
&_�
��
�
� �
������
�����
�
������
����
�� �
����
������
������
������
���
���#
���
� �
&'!
* ���
��!
�
��
�� �
����
������
� ��
������
����
����
������
������
��
��
������
������
������
����
������
������
������
��
������
�����
� ��
������
������
���
���
��
� �'
����
��
��
�
� ��
������
�����
�� �
����
�����
����
������
������
���
��
������
������
������
����
�����
������
���
������
������
������
�� �
����
������
���
���
�@
��� �
��
���
%��
��� �
��
�
�
����
������
����
��
������
��
�����
������
����
������
������
������
������
����
������
������
������
����
������
������
����
�����
������
�����
�
�� >
��/�
��
�
��
������
������
������
�
����
����
������
������
����
����
������
������
������
������
����
������
������
������
����
������
������
����
������
������
������
��
��
/
����
�����
���
����
���
����
��
]�
�{��
[��
�"+|
]#��
@�>*�
�
��
������
�����
�� �
����
�����
��
������
����
��
������
������
������
���
�����
������
��
�����
������
��
�����
������
�����
����
�
��{ /
���
��
��
�
��
����
����
������
������
�����
�
������
���
������
������
����
����
������
������
������
������
����
������
������
������
����
������
������
����
������
������
������
���
���
��
���
���#
��
�
��
����
������
���
�����
������
�
�
������
���
��
������
������
������
���
����
������
���
����
������
����
���
���/
���
���
��
��
�
� ��
������
�����
�� �
����
�����
����
������
������
��
������
������
������
������
������
����
������
������
����
������
������
������
����
������
������
����
���
��
�@
x�
��#
���
�<�
����
��
��
�
�� �
����
������
�� �
����
�����
��
x?�
�/ �
���
��
�
���
��
����
��
������
�����
��
������
���
������
������
����
����
������
������
������
������
����
������
������
������
��
������
�����
��
������
������
����
_
; ��
@��
��
|�
]�^
|�"�
�~�
�+
#
�
�����
������
����
�
������
���
������
������
����
��
������
������
������
�����
����
������
������
����
������
������
������
����
������
������
����
���
��
����
�K[
KKm[
]dX
�"�
��'�
^��+
� '�
��#_
Kp`p
f
QK`m
f
z`Xf
pK
`\f
z`\f
\`df
p`]f
�
�*��
;<�=
�<�>?
�<@/>@
$*�"$
'�@F
#
�����
��'*
@�*�
�*�*<
@�*=
@�*��
@/��
�*�'�
F���
��<@
;'<*�
�%��
�//@<
�/<'=
�$'Q
�*<?
�*'�$
'Q�*
<?X�*
'*�>
F�[
��$�
�@\$
@@��
��
�<@;<
@F@�
*�;'>
?��<
Q%�Q
F@�<@
;'<*�
�%
�&
@'%<
�;��
$�>>?
�>�=
�*@��
<@;'
<*��%
�"@%�
*�@�
]�;
�*�>�$
�*?#
�����
^�%Q
<@F�
=�?
�<@/>@
$*��
Q=_@
<�'/�;
@<F'
�F�'
<�*<@
�*=
@�*�@
;�F'
�@F�
�@;@
����
%�'�
�`@=
_@<��
*�*@
X�/�%
Q<@F
�@\$
>Q�@
��>$
'�'>
����
���$
'*��
@ _
+Q_
>�$>?
�/Q��
@��*<
@�*=
@�*
����
��{�@
�F@$
'���
?@�<
�F;@
$�/�@
���F
�/'<�*
�@��
Q=_@
<�'/�;
@';>
@�*<@
�*@�
�">�F
*�$'>
Q=�#
$
�&
|��;
<�!�*
@>?�
/Q��
@��*<
@�*=
@�*
�'Q
<$@F
}���
|�
]���
��Q�
>��@;
'<*F
��Q@
F*�'
����
<@�"�
��
#����
�^�@
>��|
//�$@
�"^|
#���*
�X�
~�;�
*�@�*
���'F
;�*�
>���*
�'��
='�
�>�*?
��
|�
]��
<Q%�
�_Q
F@�~�
/'<=
�*�'
���
@*[
'<��
/'<��
F���
����
*�@�
+�$
�/�$�
"��
~��
+#
@|
Q*;�
*�@�*
�='�
�>�*?
/��=
�*@��
FQ_;
';Q>
�*�'
��"@
%�;<
�F'�
��?'Q
*���@
*$#
%|
;�'�
��FQ
_F*�*
Q*�'
��*<@
�*=
@�*�"
@%�=
@*��
�'�@
#�
^�<F
*�*�=
@�*<@
�*=
@�*�@
�*<�
�*F�
"�'*
�<@*Q
<���
%�$>
�@�*
F#�{
<@�*
=@�
*���=
�FF�
'�F�
"�'*
�;@<
F'�F
#

306
World Drug Report 2010
Prim
ary
dru
gs
of
abu
se a
mo
ng
per
son
s tr
eate
d f
or
dru
g p
rob
lem
s in
Eu
rop
e4.
2.2.
4
���
����
���
� ���
���
����
����
����
���
���
����
� �
��
����
���
� ��
��
����
�� �
���
'���
�<�
����
��'�
���
q��
���
��'�
����
����
���
��
�"��
���
����
����
����
�!�
�" #
�#$$
���
�� �
��
�
���
��
� �
��
���
��
���@
��#
����
��
�
��
���
��
���
����
��
`]
��
�
��
�
�� �
��
��
� ��
��
��
��
��
����
*��
����
��
�
��
��
����
�
��
�
��
� ��
� �
� �
� �
���
���
����
�����@
*��
' ��
��
�
���
�
��
���
��
� �
�
����
��
*��
� �
��#
q��
?�'�
" ��
��
�
��
��
����
��
�� �
�
���
���
���
��
*��
'�� �
��
�
��
��
�� �
�
�
���
�
���
��
���
�� �
��
�
���
� �
��
��
��
��
��
� �
���
��
$���
��@�
����
��
��
�
��
�
�� �
���
� �
��
��
�
��
��
�
���
�_
�?�
��%
����
� ��
��
�
��
��
� �
�
����
� �
��
��
� �
���
��
����
��
���
��/
��
�
���
��
�� �
��
��
���
�
���
�
��
���
�@�
<���
� �
�`
]�
��
�
�
��
����
���
: ��
��#
�`
]�
��
����
�
��
��
�� �
�
�
��
��
��
��
��
�
�:�
����
�`
]�
��
�
�� �
���
��
� ��
��
��
��
�� �
��
���
���@
=��
���
��
��
�
�� �
���
�
�� �
��
���
���
���
��
���
��@�
���
�����
��
��
�
� �
��
����
��
�� �
���
�=
����
��
`]
��
�
��
���
�
� ��
��
��
�� �
���
���
���
�#��
�^�
:�%
_�
��
�
� ��
�� �
��
��
����@
q��
'���
��
�
��
� �
���
��
� ��
� �
�� �
���
�
���
�
���
����
���@
����
��#
��
�
���
� �
�
����
��
���
��
���
��
���
�
�����
�#�
`]
��
�
���
��
�� �
���
��
��
�
�� �
���
���
�����
��
�
��
����
��
�� �
�
��
���
��
����
��
_>�
�" �
��
�
���
� �
��
��
���
��
� �
���
��
� �
��
�_�
��>
����
����
� �
��
�
���
� �
���
��
�� �
��
> ��
���
��
��
�
� �
���
�
�
��
���
��
���@
>�w�
���
��'
�`
]�
��
�
� ��
�� �
���
��
��
��
� ��
�� �
���
��
����
�`
]�
��
�
���
��
��
��
���
��
� �
��
��
���
���
#�"�
^%��
��� �
�&_
��
����
�|
�]
�
��
����
���
� �
���
��
�� �
���
��
���
���
��
�
���
�
@��
�����
�#�
��
�
��
��
��
��
��
� ��
��
����
��x
� ��
#�
�'#
��^@
����
���
�����
�#_
&'!
*
��
���
�
� �
��
��
���
���
�@
��+
��&
'!*
�
���
��
� �
���
��
���
��
��
��
����
���
�@���
!���
�#�
`]
��
�
��
��
�� �
�
����
��
� �
���
���
��
��
��
����
���
!���
�'��
��
�
��
���
�
� �
� �
��
�
�
���
���
_��@
%��
�� �
��
�
���
�
�� �
�
���
�
� �
���
��
����
�%
���
��:
�#��
�� �
��
��
�
��
���
��
���
�
����
�
x�
��#
� �
'#��
^���
����#
_&
'!*
�
��
���
��
�� �
��
��
��
� �
���
��
���
��
���
�!�
���
��
%�&
����
� �
�� �
�� �
��&
��
�#�
�' �
���
����
�'��
$
��
����
�� �
����
���
� ���
����
q��
��� �
���
#��
#�� "
��

307
4. Statistical annex Consumption
���"
�/ �
��
�
��
�
���
��
��
��
�
�
���
���
���"
�� �
��
�
��
��
� �
�
��
��
� �
��
��
����
�@
���
�&
'!*
�
�� �
���
��
�� �
�
��
��
����
��
���
��@
�+�#
��
��
�
���
��
�� �
�
����
��
��
��
��
����
���
�@�+
�?��
���#
��
�
��
�
���
��
�� �
��
��
� �
���
�
���/
���
��
�
���
��
��
��
��
�
���
��
�
���
�
���
�
x/�
� ��
��
�
��
�
���
�x
� ��
#�
�'#
��^<
�'��
�#�
�#~
����
_�
��
�
��
�� �
���
��
� �
��
��
����
��
���
�
���@
����
�<��
���
K[z\
K[Xd
Q��
���<
���<
����
���
����
���
���~
���<
����
���
����
�
"���
'�^�
�+�
'���
#_<
����
�pp
`df
XQ`X
fk`
mfk`
zfK`
Xfz`
]fQ`
pf\`
df�
"���
'�^�
�+�
'���
#_<
���<
����
���
��
�� �
��
���
���
��
���
���
���
"���
'�^�
�+�
'���
#_~
���<
����
��
��
�� �
���
��
� ��
� ��
��
� �
��
��*
��;<
�=�<
�>?�<@
/>@$*
�"$'�
@F#
�����
��'*
@�*�
�*�*<
@�*=
@�*��
@/��
�*�'�
F���
��<@
;'<*�
�%��
�//@<
�/<'=
�$'Q
�*<?
�*'�$
'Q�*
<?X�*
'*�>
F�[
��$�
�@\$
@@��
��
�<@;<
@F@�
*�;'>
?��<
Q%�Q
F@�<@
;'<*�
�%
�&
@'%<
�;��
$�>>?
�>�=
�*@��
<@;'
<*��%
�"@%�
*�@�
]�;
�*�>�$
�*?#
�����
^�%Q
<@F�
=�?
�<@/>@
$*��
Q=_@
<�'/�;
@<F'
�F�'
<�*<@
�*=
@�*�@
;�F'
�@F�
�@;@
����
%�'�
�`@=
_@<��
*�*@
X�/�%
Q<@F
�@\$
>Q�@
��>$
'�'>
����
���$
'*��
@ _
+Q_
>�$>?
�/Q��
@��*<
@�*=
@�*
����
��{�@
�F@$
'���
?@�<
�F;@
$�/�@
���F
�/'<�*
�@��
Q=_@
<�'/�;
@';>
@�*<@
�*@�
�">�F
*�$'>
Q=�#
$
�&
|��;
<�!�*
@>?�
/Q��
@��*<
@�*=
@�*
�~�
;�*�@
�*���
'F;�
*�>��
�*�'
��=
'��>
�*?�
'Q<$
@F}��
��
|�
]���
��Q�
>��@;
'<*F
��Q@
F*�'
����
<@F�
"��
�#��
%'!@
<�=
*�@*
�<@;'
<*F���
����
`]
��
���^
'$�>
�+'�
�*F
@|
Q*;�
*�@�*
�='�
�>�*?
/��=
�*@�
FQ_;
';Q>
�*�'
�"@
%;<
�F'�
?'Q*
�@*
$#
���
����
���
� ���
���
����
����
����
����
��
����
� �
��
����
���
� ��
��
����
�� �
���'
����
<���
����
'���
�q
����
� ��
'���
��#�
� "��
���
����
�&
'!*
�
��
� �
�
��
��
�
��
��
���
���
����
_
@�+
J��
���#
��
~��
+���
��
�
�
����
� �
��
��
��
�� �
��
��
��
_���
����
�Kz
p[kd
m�
"���
'�^�
�+�
'���
#_dQ
`Xf
pQ`K
fz`
XfKm
`Xf
K`]f
z`]f
\`pf
��*
��;<
�=�<
�>?�<@
/>@$*
�"$'�
@F#
�����
��'*
@�*�
�*�*<
@�*=
@�*��
@/��
�*�'�
F���
��<@
;'<*�
�%��
�//@<
�/<'=
�$'Q
�*<?
�*'�$
'Q�*
<?X�*
'*�>
F�[
��$�
�@\$
@@��
��
�<@;<
@F@�
*�;'>
?��<
Q%�Q
F@�<@
;'<*�
�%
�&
@'%<
�;��
$�>>?
�>�=
�*@��
<@;'
<*��%
�"@%�
*�@�
]�;
�*�>�$
�*?#
�����
^�%Q
<@F�
=�?
�<@/>@
$*��
Q=_@
<�'/�;
@<F'
�F�'
<�*<@
�*=
@�*�@
;�F'
�@F�
�@;@
����
%�'�
�`@=
_@<��
*�*@
X�/�%
Q<@F
�@\$
>Q�@
��>$
'�'>
����
���$
'*��
@ _
+Q_
>�$>?
�/Q��
@��*<
@�*=
@�*
����
��{�@
�F@$
'���
?@�<
�F;@
$�/�@
���F
�/'<�*
�@��
Q=_@
<�'/�;
@';>
@�*<@
�*@�
�">�F
*�$'>
Q=�#
$
�&
|��;
<�!�*
@>?�
/Q��
@��*<
@�*=
@�*
�~�
;�*�@
�*���
'F;�
*�>��
�*�'
��=
'��>
�*?�
'Q<$
@}��
�|
�]
�����
Q�>��
@;'<
*F��
Q@F*
�'��
��<@
�"��
�#��
�*�
@|
Q*;�
*�@�*
�='�
�>�*?
��
|�
]��
<Q%�
�_Q
F@�~�
/'<=
�*�'
���
@*[
'<��
/'<��
F���
����
*�@�
+�$
�/�$�
"��
~��
+#
/��
=�*@
��FQ
_;';
Q>�*
�'��
"@%�
;<�F
'���?
'Q*�
��@*$
#%
|;�
'���
FQ_F
*�*Q*
�'��
*<@�*
=@�
*�"@%
�=@*
���'
�@#
�^�
<F*�*
�=@�
*<@�*
=@�
*�@�*
<��*
F�"�
'*�<@
*Q<�
��%�
$>�@
�*F#
�{<@
�*=
@�*��
�=�F
F�'�
F�"�
'*�;
@<F'
�F#
��
����
�� �
����
���
� ���
����
����
����
�!�
�" #
�#$$
���
�!�
���
��
%�&
����
� �
�� �
�� �
��&
��
�#�
�'�
��
����
���'
��$
Prim
ary
dru
gs
of
abu
se a
mo
ng
per
son
s tr
eate
d f
or
dru
g p
rob
lem
s in
Oce
ania
4.2.
2.5

Printed in Malta June 2010–1,700
United Nations publication Sales No. E.10.XI.13
ISBN: 978-92-1-148256-0

WORLDDRUG REPORT2010
Vienna International Centre, PO Box 500, 1400 Vienna, AustriaTel: +(43) (1) 26060-0, Fax: +(43) (1) 26060-5866, www.unodc.org
In 2009, the UN Member States decided to make further and decisive progress, within a decade, in controlling illicit drug supply and demand. Many illicit drug markets have reached global dimen-sions and require control strategies on a compa-rable scale. In that context, there is a need to better understand these transnational markets and the manner in which they operate. This year’s World Drug Report is a contribution towards that objective. It opens with an analytical discussion of three key transnational drug markets: the markets for heroin, cocaine and amphetamine-type stimu-lants. The market discussion is followed by a pres-entation of statistical trends for all major drug categories. The latest information on drug pro-duction, seizures and consumption is presented. Finally, there is a discussion on the relationship between drug trafficking and instability.
Copyright © 2022 FDOKUMEN