Migration as a source of bias in the measurement of cephalopod growth
6
Antarctic Science 6 (2): 179-184 (1994) Migration as a source of bias in the measurement of cephalopod growth EMMA M.C. HATFIELD' and PAUL G. RODHOUSE British Antarctic Survey, Natural Environment Research Council, High Cross, Madingley Road, Cambridge, CB3 OET, UK 'To whom off-print requests should be sent Abstract Theory predicts that, in a closed exploited population showing no sampling or other bias, the mean age of fish or squid between one sampling date and the next should increaseby the time intervalbetween samples. Age data, derived from statoliths, have been used to test the hypothesis that the effectof migrationthrough an areawhere a population of Loligo gahi is sampled would be apparent as an increase in mean age per modal group of less than one day per daily time interval between samples. The data show that, in both females and males, the relationship between mean statolith increment number and elapsed time between samples is positive in some months and negative in others. The months in which the relationship between mean increment number and elapsed time is negative are similar to thosemonths in which recruitment has previously been demonstratedto occur, in February, April/May and September for both females and males. Cohorts of squid remain available to the fishery from JuneSeptember (females) and February-May and June-July (males) thus allowing mean monthly growth rates of 0.4 mm d-lfor females and 0.7 mm d-lfor males to be calculated. The present study shows that putative age data derived from statoliths apparently demonstrate some sampling biases within a fishery and their effects on the measurement ofgrowth. Migration through thesampledpopulation ismanifested by anincreaseinmeanincrement number of less than one per day between samples, and growth can only be assessed where the increase in mean increment number is not significantly different from the time elapsed between samples. Received 1 June 1993, accepted 1 November 1993 Key words: age data, cephalopod, growth assessment, migration, statoliths Introduction Length-frequency data are easy to collect, easily analysed and give rapid results in the analysisof growth and stock assessment of fish (Caddy 1991). In recent years a number of software packages havebeendevelopedto facilitatedataanalysis, e.g. MIX (Macdonald & Green 1985), ELEFAN (Gayanilo et al. 1989), LFSA (Sparre 1987) and MULTIFAN (Fournier et al. 1990). However, there are now some doubts that length based methods of analysis alone are appropriate for the assessment of squid stocks as they are subject to many sourcesof variability and bias (Caddy 1991, Dawe & Beck 1992). Essentially there are four apparentproblems which can confuselength-frequency analyses of squid populations if used without supplementary age data: 1) highly variablegrowthrates; 2) thepresenceofseveralbroods within a population,each with its own characteristicgrowthand survival rates; 3) the presence of microcohorts within the population, which may not show up as modes in a modal analysis; and 4) the fact that many squid species are migratory, which could introduce errors if two separate groups mixed within the population (and the assumption was made that they were successive modes from the same stock). Recent advancesin theuse of squidstatolithsto determineage structure(see reviews in Rodhouse & Hatfield 1990,Jereb et al. 1991) have allowed for growth rates of squid to be estimated independentlyoflength-frequencybaed methods. However,in the analysis of growth and mortality, sampling and other biases need to be fully elucidated before accurate growth rates can be predicted. It is axiomatic that, in a closed population with no sampling or other bias, the mean age of squid between one sampling date and the next should increase by the time interval between samples (Caddy 1991). This gives the potential to calculate growth rates for the population with confidence. However, a lack of any bias, sampling or otherwise, is rare. Caddy (1991) discusses the possible outcome of a number of biases on the assessment of growth of a sampled population. The effect of migration on Caddy's (1991) model shows that this is a major source of bias that results in a consistent underestimation of growth. Fig. 1 demonstratesa theoretical fishery which always samples squid at a particular age, in this example 1201 days. Migration into the fishery is assured by an influx of younger individuals from the nursery grounds in shallow water, arising from an extended spawningor hatching season,in this example, of several weeks. As themean age ofsquid sampled will always be 120days, irrespective of samplingdateor samplingfrequency, if successive samples are taken at given intervals and age determined, there will be no perceived increase in age between samples. Thus, the mean increase in age per day between samplingperiodswillbe negative. Growth canonly becalculated for the population if the mean increase in age per day between 179
-
Upload
independent -
Category
Documents
-
view
0 -
download
0
Transcript of Migration as a source of bias in the measurement of cephalopod growth
http://journals.cambridge.org Downloaded: 11 Dec 2013 IP address: 222.89.154.2
Antarctic Science 6 (2): 179-184 (1994)
Migration as a source of bias in the measurement of cephalopod growth
EMMA M.C. HATFIELD' and PAUL G. RODHOUSE British Antarctic Survey, Natural Environment Research Council, High Cross, Madingley Road, Cambridge, CB3 OET, UK
'To whom off-print requests should be sent
Abstract Theory predicts that, in a closed exploited population showing no sampling or other bias, the mean age of fish or squid between one sampling date and the next should increase by the time interval between samples. Age data, derived from statoliths, have been used to test the hypothesis that the effect of migration through an areawhere a population of Loligo gahi is sampled would be apparent as an increase in mean age per modal group of less than one day per daily time interval between samples. The data show that, in both females and males, the relationship between mean statolith increment number and elapsed time between samples is positive in some months and negative in others. The months in which the relationship between mean increment number and elapsed time is negative are similar to thosemonths in which recruitment has previously been demonstrated to occur, in February, April/May and September for both females and males. Cohorts of squid remain available to the fishery from JuneSeptember (females) and February-May and June-July (males) thus allowing mean monthly growth rates of 0.4 mm d-l for females and 0.7 mm d-l for males to be calculated. The present study shows that putative age data derived from statoliths apparently demonstrate some sampling biases within a fishery and their effects on the measurement ofgrowth. Migration through thesampledpopulation ismanifested by anincreaseinmeanincrement number of less than one per day between samples, and growth can only be assessed where the increase in mean increment number is not significantly different from the time elapsed between samples.
Received 1 June 1993, accepted 1 November 1993
Key words: age data, cephalopod, growth assessment, migration, statoliths
Introduction
Length-frequency data are easy to collect, easily analysed and give rapid results in the analysis of growth and stock assessment of fish (Caddy 1991). In recent years a number of software packages havebeendeveloped to facilitatedataanalysis, e.g. MIX (Macdonald & Green 1985), ELEFAN (Gayanilo et al. 1989), LFSA (Sparre 1987) and MULTIFAN (Fournier et al. 1990). However, there are now some doubts that length based methods of analysis alone are appropriate for the assessment of squid stocks as they are subject to many sourcesof variability and bias (Caddy 1991, Dawe & Beck 1992). Essentially there are four apparent problems which can confuselength-frequency analyses of squid populations if used without supplementary age data: 1) highly variablegrowthrates; 2) thepresence ofseveralbroods within a population, each with its own characteristicgrowth and survival rates; 3) the presence of microcohorts within the population, which may not show up as modes in a modal analysis; and 4) the fact that many squid species are migratory, which could introduce errors if two separate groups mixed within the population (and the assumption was made that they were successive modes from the same stock).
Recent advancesin theuse of squidstatoliths to determine age structure (see reviews in Rodhouse & Hatfield 1990, Jereb et al. 1991) have allowed for growth rates of squid to be estimated independently oflength-frequencybaed methods. However, in
the analysis of growth and mortality, sampling and other biases need to be fully elucidated before accurate growth rates can be predicted.
It is axiomatic that, in a closed population with no sampling or other bias, the mean age of squid between one sampling date and the next should increase by the time interval between samples (Caddy 1991). This gives the potential to calculate growth rates for the population with confidence. However, a lack of any bias, sampling or otherwise, is rare. Caddy (1991) discusses the possible outcome of a number of biases on the assessment of growth of a sampled population. The effect of migration on Caddy's (1991) model shows that this is a major source of bias that results in a consistent underestimation of growth. Fig. 1 demonstrates a theoretical fishery which always samples squid at a particular age, in this example 1201 days. Migration into the fishery is assured by an influx of younger individuals from the nursery grounds in shallow water, arising from an extended spawning or hatching season, in this example, of several weeks. As themean age ofsquid sampled will always be 120 days, irrespective of sampling date or sampling frequency, if successive samples are taken at given intervals and age determined, there will be no perceived increase in age between samples. Thus, the mean increase in age per day between sampling periodswillbe negative. Growth canonly becalculated for the population if the mean increase in age per day between
179

http://journals.cambridge.org Downloaded: 11 Dec 2013 IP address: 222.89.154.2
180 E.M.C. HATFIELD and P.G. RODHOUSE
Table I. Position, date and depth of capture ofLoligo gahi samples used in the modal progression analysis.
Fig. 1. Diagram to demonstrate the effects of migration on a theoretical fishery. Squid are always sampled at the same age (120 days in this example) irrespective of elapsed time between samples, a result of migration into and out of the fishery, assured by an influx of younger individuals from the nursery grounds in shallow water, arising from an extended spawning or hatching season.
samples equals the elapsed time between those samples, that is when the fishery is sampling a closed population.
The commercial fishery for the loliginid squid, Loligo gahi (d'orbigny), operates over a relatively narrow part of the species' lifetime depth range. L. gahi is known to migrate from shallow coastal waters, down through the restricted depths at which the fishery operates, into thedeeperwatersoftheshelf and slope as it grows and matures (Hatfield et al. 1990). Growth studies on L. gahi, using statolith increment data, have demonstrated a close correlation between a predicted life-span of about one year, deduced from maturity data and availability of the squid to the fishery, and maximum number of statolith increments (some 370) in the most mature specimens (Hatfield 1991). Experimentalvalidation of the periodicity of increment formation has not been possible forL. gahi but direct validation of a daily rate of statolith increment formation has been carried out for several other species of loliginid squid (Lipinski 1986, Yangetal. 1986, Jackson 1990a,b, Jacksonetal. 1993). L. gahi thus provides anopportunity to test the ideasproposedby Caddy (1991), and expounded above, onthe possible effects ofmigration as a source ofbias in the assessment of growth of acommercially exploited squid.
Materials and methods
Samples of L. gahi were taken at approximately monthly intervals from the commercial fishery and research trawls in the
Date of capture Position Depth (4 11 February 1988 14 March 1988 13 April 1988 06 May 1988 03 June 1988 12 July 1988 19 August 1988 29 September 1988 29 October 1988
52"58'S 59"13'W 52"47'S 59"37'W 52"43'S 59"42'W 52"49'S 59"49'W 52"49'S 59"24'W 52"53'S 58Y5'W 52"48'S 59"54'W 52'38's 59"35'W 52"42'S 58"43'W
155 180* 157-180 156 142-169 200 158-166 195 148
* Depth taken from British Admiralty chart no. 2512
Falkland Islands Interim Conservation and Management Zone (FICZ) during the 1988 fishing season. Samples were frozen aboard ship and returned to the U.K. for examination. The July and October samples were taken as part of the Falkland Island Fishery Department's research fishing programme, using trawling gear similar to that employed on the commercial fishing boats. All samples were collected from daylight hauls.
Dorsal mantle length (ML) of squid was measured to the nearest 1 mm. Squid were dissected, sexed and assigned a maturity stage I-V (after Lipinski 1979). Stem and leaf diagrams (Tukey 1977) were constructed from the length- frequency distribution of each sample and modal lengths identified for each sex separately. The paired statoliths were dissected (Rodhouse & Hatfield 1990) from five female and five malesquid from themodeof eachsample and stored temporarily in analytical grade glycerol. Where two modes were present in the samples and the second mode comprised >lo% of the sample, statoliths were taken from each mode. The methods adopted to elucidate daily growth increments are described fully in Hatfield (1991).
Catch datawere provided from fisheriesdata collected aspart of theFalklandIslandFishery Department Observerprogramme.
Results
Catch data
Position, dateanddepthofl. gahi samplestakenfromtheFICZ are given in Table I. Where commercial fishery data on depth of catch were absent, depths were estimated from British Admiralty chart 2512 (this is justified because the majority of fishing is by bottom trawl or near-bottom trawl). All samples of L. gahi were caught in the narrow depth range 142-200 m.
Modal progression analysis
Length-frequency data for female and male L. gahi are presented in Fig. 2. Shading from white to black shows cumulative plots of maturity stage per month. There is a unimodal distribution in most months, except in May and June when the distribution is bimodal.

http://journals.cambridge.org Downloaded: 11 Dec 2013 IP address: 222.89.154.2
BIAS IN CEPHALOPOD GROWTH MEASUREMENT 181
Fig. 2. Length-frequency and maturity of the exploited Loligo guhi population taken as monthly samples from the commercial fishery in the FICZ 1988.
The relationship between change in mean statolith increment number for squid from the mode of each monthly sample and elapsed time between catch dates is given in Table II. The change in mean statolith increment number is approximately equal to, or not significantly different from (calculated from a t-test comparing the observedwith the expected change inmean incrementnumber) thenumberofdayselapsedbetweensamples takeninthe following months: June, July, August and September for females, February, March and April for the first brood of males, and Juneand July for thesecond malebrood. Malesshow an increase of approximately two increments per elapsed day from April-May. At all other times the increase in statolith increment number is significantly less thanone per elapsed day. The relationship between increment number and mantle length (ML) for both females and males is shown in Fig. 3.
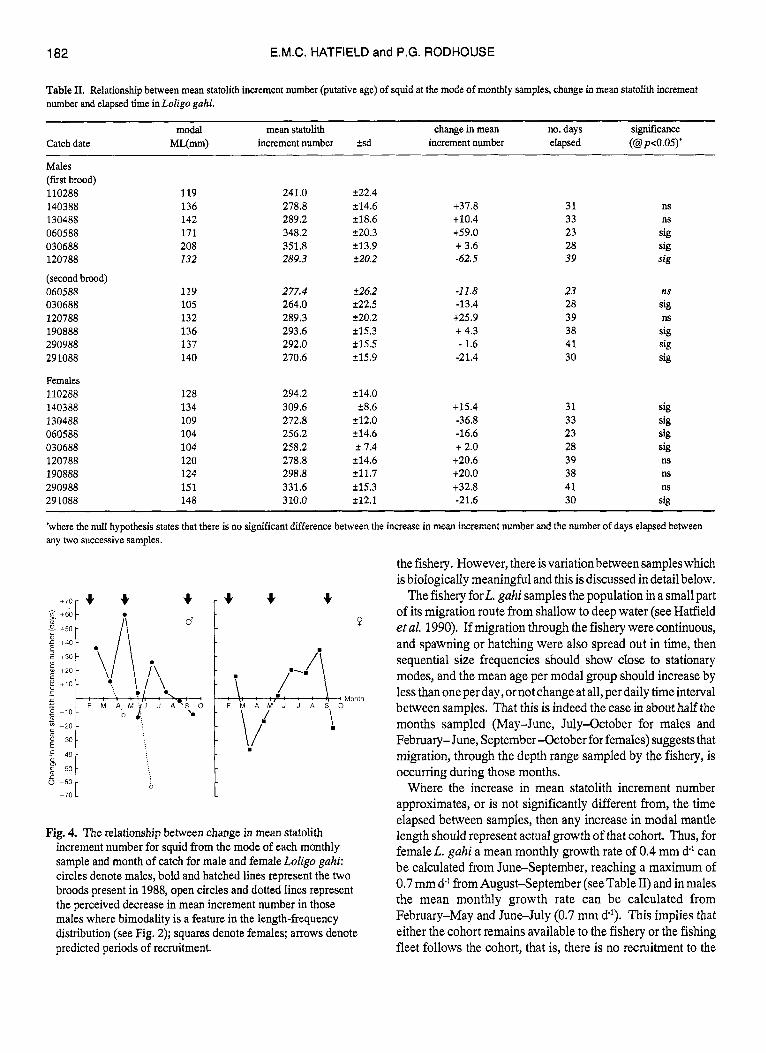
Therelationshipbetween change inmeanstatolithincrement number for squid from the mode of each monthly sample and month of catch is shown in Fig. 4, with the predicted periods of
200 c " ' A A A A
t L..! 150 s
O O M O 0
I 100
I I 1 I L 150 200 250 300 350
Number of increments (days)
Fig. 3. Relationship between the number of putative daily growth increments in the statolith and mantle length in Loligo gahi, in statoliths taken from the mode of monthly fishery samples in 1988.
recruitment indicated. This figure represents the change in mean increment number between monthly samples taken from the fishery, data from column four in Table 11. In females, the known periods ofrecruitment areinFebruary, May and September (Hatfield 1992). The results here show that the relationship between mean statolith increment number and elapsed time is negative between the months March-April, April-Miay and September-October. Thus, the decrease in mean statolith increment numberbetween monthly samples in the present data corresponds to two of the known periods of recruitment, May and September. In males, the known recruitment periods are similar, occurring in February, April-May and September (Hatfield 1992). The results here show an evident negative relationship between mean statolith increment numbler and elapsed time between the months of April-May, May-June, June-July and September-October. Thus, as in females, the periods of a decrease in mean statolith increment number between monthly samples correspond to two of the Imown periods of recruitment, May and September.
Discussion
Caddy's (1991) proposal that in a migratory population the mean age of squid in a sample between two successive sampling dates should not increase between samplings has been tested here. It is shown in Table I1 that this may be the case for both female and male squid in the population ofL. gahi sampled by
http://journals.cambridge.org Downloaded: 11 Dec 2013 IP address: 222.89.154.2
182 E.M.C. HATFIELD and P.G. RODHOUSE
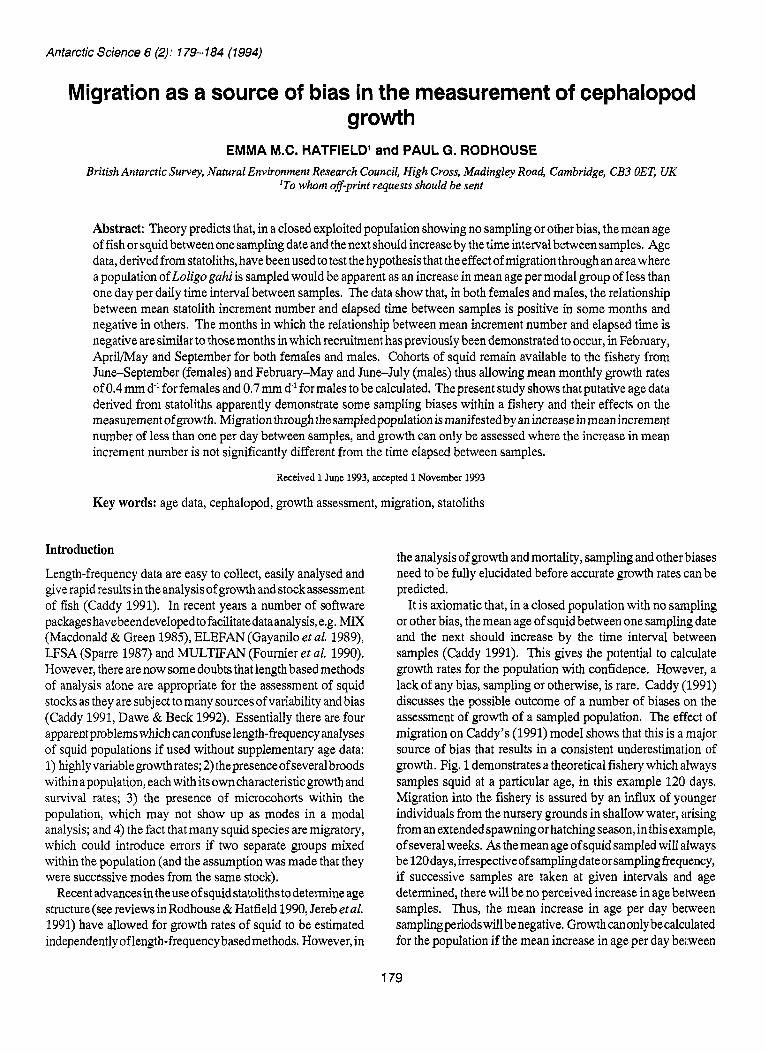
Table 11. Relationship between mean statolith increment number (putative age) of squid at the mode of monthly samples, change in mean statolith increment number and elapsed time inLoligo gahi.
modal mean statolith change in mean no. days significance Catch date MVmm) increment number 2sd increment number elapsed (@p<O.O5)'
Males (first brood) 110288 140388 130488 060588 030688 120788
(second brood) 060588 030688 120788 190888 290988 291088
Females 110288 140388 130488 060588 030688 120788 190888 290988 291088
119 136 142 171 208 132
119 105 132 136 137 140
128 134 109 104 104 120 124 15 1 148
241.0 278.8 289.2 348.2 351.8 289.3
2 77.4 264.0 289.3 293.6 292.0 270.6
294.2 309.6 272.8 256.2 258.2 278.8 298.8 331.6 310.0
222.4 214.6 218.6 220.3 213.9 220.2
226.2 222.5 T20.2 215.3 215.5 215.9
214.0 28.6
212.0 214.6 T 7.4 214.6 ~ 1 1 . 7 215.3 212.1
+37.8 +10.4 +59.0 + 3.6 -62.5
-11.8 -13.4 t25.9 + 4.3 - 1.6 -21.4
+15.4 -36.8 -16.6 + 2.0
+20.6 +20.0 +32.8 -21.6
31 33 23 28 39
23 28 39 38 41 30
31 33 23 28 39 38 41 30
ns ns
sip sip sig
ns sip
sip sig sig
ns
sig sig sig sig
ns
sig
ns
ns
~~
'where the null hypothesis states that there is no significant difference between the increase in mean increment number and the number of days elapsed between any two successive samples.
150 0
Fig. 4. The relationship between change in mean statolith increment number for squid from the mode of each monthly sample and month of catch for male and female Loligu p h i : circles denote males, bold and hatched lines represent the two broods present in 1988, open circles and dotted lines represent the perceived decrease in mean increment number in those males where bimodality is a feature in the length-frequency distribution (see Fig. 2); squares denote females; arrows denote predicted periods of recruitment.
the fishery. However, there is variation between samples which is biologically meaningful and this is discussed in detail below.
The fishery forL. gahi samples the population in a small part of its migration route from shallow to deep water (see Hatfield et al. 1990). If migration through the fishery were continuous, and spawning or hatching were also spread out in time, then sequential size frequencies should show close to stationary modes, and the mean age per modal group should increase by less than one per day, or not change at all, per daily time interval between samples. That this is indeed the case in about half the months sampled (May-June, July-October for males and February- June, September -October for females) suggests that migration, through the depth range sampled by the fishery, is occurring during those months.
Where the increase in mean statolith increment number approximates, or is not significantly different from, the time elapsed between samples, then any increase in modal mantle length should represent actual growth of that cohort. Thus, for femaleL. gahi a mean monthly growth rate of 0.4 mm d' can be calculated from June-September, reaching a maximum of 0.7 mm d l from August-September (see Table II) and in males the mean monthly growth rate can be calculated from February-May and June-July (0.7 mm dl). This implies that either the cohort remains available to the fishery or the fishing fleet follows the cohort, that is, there is no recruitment to the
http://journals.cambridge.org Downloaded: 11 Dec 2013 IP address: 222.89.154.2
BIAS IN CEPHALOPOD GROWTH MEASUREMENT 183
fished part of the cohort. The increase in mean statolith increment number in males from April-May is more than two per elapsed day between samples, suggesting that some bias, other than migration, is affecting the male population in these months. Some of this increase may be due to an over-estimate of the mantle length (and hence age) of the second mode (see Fig. 2). Caddy (199l)suggests thatthis effectwillbemanifested if size selective natural mortality predominates in the population. The minimum mesh size of fishing nets remains constant between months so one would not expect fishing mortality to differ. However, ifnaturalmortality were higherinsmaller, and hence younger, males, the perceived effect in the population would be an increase in the mean age of males sampled. Size selective natural mortality may be operating on the male populationto give the effect ofmorethanoneincrementper day. This type of natural mortality is not uncommon in squid where cannibalism of smaller squid by larger individuals has been demonstrated in, for example, Illex illecebrosus (Amaratunga 1980, O’Dor et al. 1980) and possibly in L. pealei (Summers 1983).
Where the change in mean statolith increment number between samples is negative, this must indicate recruitment into the population. Recruitment is manifested by an influx of younger (or smaller) individuals. If recruitment occurs into a population between two sampling dates, then the mean age of that population will be seen to have decreased at the time of the second sample. On the basis of this argument it is apparent from Fig. 4 that recruitment of females occurs between March and May and September and October. On the same basis male recruitment apparently occurs between April and June and August and October. From April-May, as well as the apparent recruitment into the male population, manifested by a decrease in mean statolith increment number between sampling dates, there is also apparent growth of one part of themale population, manifested by more than one increment per elapsed day. Both growth and recruitment are observed in the male population at this time as more than one cohort of squid is present. This is highlighted by the presence of two modal peaks of male squid in May and June (see Fig. 2) From May-June, that cohort which had remained available to the fishery from April-May has migrated away from the fishery, but the population still exhibits bimodality. By July, the length-frequency distribution is again unimodal. This bimodality is also apparent in female squid during 1988 (see Fig. 2) but samples were not taken from May and June as the smaller mode comprised <lo% of the sample in each month.
The recruitment periods apparent from age data in this study mirror the recruitment periods derived from analysis of five years of fishery data, discussed in Hatfield (1992) and indicated in Fig. 4. That study, using a combination of length-frequency and maturity data, showed recruitment in females in February, May and September, and in males in February, ApriVMay and September. The first period of recruitment cannot be demonstrated in the present study, as no data are available prior to February. The apparent discrepancy in the May recruitment,
March-May in the present data, reflects the fact that low level recruitment occurs year-round, although three major pulses appear to occur annually. The present study, using putative age data, shows periods of the year when the mean age of squid between successive samples both increases and decreases. The periods of increase, of both more or less than one increment per day, concurwith Caddy’s(l99l)proposal thatmigrationcan act as a bias on the interpretation of growth. The periods of a decrease inmeanagebetween sampling datesmirror the periods of recruitment previously discussed.
The confounding effects of migration on the interpretation of modal progression analyses have also been demonstrated in I. illecebrosus (Dawe et al. 1985). Two populations of these squid were examined, one inshore, the other offshore. ,4 good agreement w as found between thenumber of st atolith increments and elapsed time in the inshore population, but not in the offshore population. The discrepancy in the offshore population couldnotbeexplainedbycountingerrorsbutwaslikely tobedue to the immigration of younger individuals to the offshore areas sampled. Conversely, a study, using samples of Nototcdmus sloanii collected from a restricted area, has shown that if the same cohort is consistently sampled then agreement between number of statolith increments and elapsed time between samplesisgood (UozomiLkOhara 1993). Similarly acomparison of growth rates derived from linear growth models and monthly modal length data in I. argentinus show close agreement (Rodhouse et aZ. in press), demonstrating that growth can be analysed from either length-frequency or age data if the: same cohort is consistently sampled through time within a fishery which follows the migration route.
Where sampling of a population takes place along itsmigration route, caremust therefore be taken in interpreting size-frequency data from that population. Many of the growth data available for squid are based on the analysis of length-frequencies using such software programs as ELEFAN (Gayanilo et al. 1gI89) or on older techniques such as those of Cassie (1954). In li,ght of these data for L. gahi, growth rate data for species known to migrate, such asL.peaZei(Summers 1968,1971, Mesnill977, Hixon et al. 198l), L. forbesi (Holme 1974) and L. vulgaris (Worms 1983), must be viewed with caution.
Acknowledgements
We thank the staff of the Falkland Islands Fisheries Department for their collection of the samplesused in this analysis, especially Mr.J.Barton, Mr. C. JonesandMissE.Marrow. Wethankprof. R.J.H. Beverton and Drs. J.F. Caddy, A. Guerra and C.P. Nolan for their constructive reviews of the manuscript, and Dr. E.J. Murphy for his statistical advice.
Research at the British Antarctic Survey on the life cycles of commercial squid species in the FICZ is funded by the FalkJand Islands Government.
http://journals.cambridge.org Downloaded: 11 Dec 2013 IP address: 222.89.154.2
184 E.M.C. HATFIELD and P.G. RODHOUSE
References AMAFNWNOA, T. 1980. Preliminary estimates of predation by the short-finned
squid (Illex illecebrosus) on the Scotian shelf. NAFO Scient$c Research Document No. 80/II131 Serial No. N063,13 pp.
CADDY, J.F. 1991. Dailyringsonsquidstatoliths: anopportunity totest standard populationmodels? InJmm,P.,RAwNrm, S&BOLETSKY, S.VON, eds.Squid age determination using statoliths. Mazara del Vallo, Italy: N.T.R. - I.T.P.P. Special Publications, No. 1, 53-66.
CASSIE, R.M. 1954. Some uses of probability paper in the analysis of size frequency distributions. Australian Journal of Marine and Freshwater Research, 5,513-522.
DAWE, E.G. & BECK, P.C. 1992. Population structure, growth and sexual maturation ofshort-finned squid at Newfoundland, Canada, based onstatolith analysis. ICES C.M. 19921K:33,23 pp.
DAM, E.G., O’DOR,R.K,, ODENSE,P.H. & H u m , G . V . 1985. Validationand application of an ageing technique for short-finned squid (Illexillecebrosus). Journal of Northwest Atlantic Fishery Science, 6, 107-1 16.
a likelihood-based method for estimating growth parameters and age composition from multiple length-frequency data sets, illustrated using data for Southern Bluefin Tuna (Thunnus maccoyit). Canadian Journal of Fisheries and Aquatic Science, 41, 301-317.
GAYANUO, F.C., SORIANO, M. & PALLY, D. 1989. A draft guide to compleat ELEFAN. ICLARMSoffware 2,70. Manila: International Center for Living Aquatic Resources Management, 70 pp.
HAmm, E.M.C. 1991. Post-recruit growth of the Patagonian squid Loligo gahi (d’orbigny). Bulletin of Marine Science, 49, 349-361.
HAmm, E.M.C. 1992. Recruifment, demography and growth of the Patagonian squid Loligo gahi (d’orbigny, 1835) in Falkland Islands waters. Ph.D thesis, Council for National Academic Awards, London, 146 pp. [Unpublished.]
HAnm, E.M.C., RODHOUSE, P.G. & P o m s ~ , J. 1990. Demography and distribution of the Patagonian squid (Loligo gahi, d’orbigny) during the austral winter. Journal du Conseil, 46,306-312.
HIXON, R.F., HANLON, R.T. & Hum, W.H. 1981. Growth and maximal size of thesquidLoligopealeiinthenorthwest Gulfof Mexico. Journal ofshellfish Research, 1,181-185.
HOLME, N.A. 1974. The biology of Loligo forbesi Steenstrup (Mollusca: Cephalopoda) in the Plymouth area. Journal of the Marine Biological Association of the United Kingdom, 54,481-503.
JACKSON, G.D. 1990a. Age and growth of the tropical nearshore loliginid squid Sepioteuthis lessoniana determined from statolith growth ring analysis. Fishery Bulletin, U.S., 88, 113-118.
JACKSON, G.D. 1990b. The use of tetracycline staining techniques to determine statolith growth ring periodicity in the tropical loliginid squids Loliolus noctiluca and Loligo chinensis. The Veliger, 33, 309-393.
FouRNIER,D.A.,SIBERT, J.R., MAJKOWSKI , J .&HN,J . 1990. MULTIFAN:
JACKSON.G.D.,ARKHIPKIN,A.I.,BEIKOV,V.A.&HANLON, R.T. 1993. Laboratory and field corroboration of age and growth from statoliths and gladii of the loliginid squid Sepioteuthis lessoniana (Mollusca: Cephalopoda). In OKUTANI, T., O’DOR, R.K. & KUEODERA, T., eds. Recent Advances in Fisheries Biology. Tokyo: Tokai University Press, 189-199.
JEREB,~., R A ~ N E S E , S. &BOUTSKY, S.VON, eds. 1991. Squid age determination using statoliths. Mazara del Vallo, Italy: N.T.R - I.T.P.P. Special Publications, No. 1, 128 pp.
LIPINSKI, M. 1979. Universal maturity scale for the commercially important squids. The results of maturity classification of the Illex illecebrosus population for the years 1973-1977. ICNAFResearch Document, 7912.38, Serial 5364, 40 pp.
LIPINSKI, M. 1986. Methods for the validation of squid age from statoliths. Journal of the Marine BiologicalAssociation of the United Kingdom, 66,
MACDONO, P.D.M. & G m , P.E.J. 1985. User’sguide toprogramMIX: an interactive program for fitting mivtures of distributions. Icthus Data Systems, 59 Arkell Street, Hamilton, Ontario, Canada, U S 1N6, 60 pp.
MESNIL, B. 1977. Growth and life cycle of squid, Loligo pealei and Illex illecebrosus, from the northwest Atlantic. ICNAF Selected Papers, No. 2,
O’DOR,R.K,DURWARD,R.D.,VESSEY,E. &AMAFATVNOA,T. 1980. Feeding and growth in captive squid, Illex illecebrosus, and the influence of food availability on growth in the natural population. ICNAFSelected Papers,
RODHOUSE, P.G., BARTON, J., f i m m , E.M.C. & SYMON, C. In press. Illex argentinus (Cephalopoda: Ommastrephidae): life cycle, population structure and fishery, Rapport etproces-verbaux des reunions.
RODHOUSE, P.G. & HATFIELD, E.M.C. 1990. Age determination in squid using statolith growth increments. Fisheries Research, 8,323-334.
SPARRE, P. 1987. Computer programmes for fish stock assessment. Length- based fish stock assessment (LFSA) for Apple11 computers. FA0 Fisheries Technical Paper, No. 101 (Suppl. 2), 217 pp.
SUMMERS, W.C. 1968. The growth and size distribution of current year class Loligo pealei. Biological Bulletin, 135, 366-377.
SUMMERS, W.C. 1971. Age and growthofLoligopealei, a populationstudy of the common Atlantic coast squid. Biological Bulletin, 141, 189-201.
SUMMERS, W.C. 1983. Loligo pealei. In BOYLE, P.R., ed. Cephalopod Life Cycles Vol I. Species Accounts. London: Academic Press, 115-142.
TUKEY, J.W. 1977. Exploratory data analysis. Reading, Massachusetts: Addison-Wesley, 688 pp.
UOZOMI, Y. & O m , H. 1993. Growth and age composition ofNototodarus sloanii (Cephalopoda: Oegopsida) based on daily increment counts in statoliths. Nippon Suisan Gakkaishi, 59, 1469-1477.
WORMS, J. 1983. Loligo vulgaris. InBonx, P.R.,ed. CephalopodLifeCycles Vol I. Species Accounts. London: Academic Press, 143-157.
YANG, W.T., HIXON, R.F., TURK, P.E., KRua, ME., Hum, W.H. & HANLON, R.T. 1986. Growth, behaviour and sexual maturation of the market squid, Loligo opalescens, cultured through the life cycle. Fishery Bulletin, U.S.,
505-526.
55-69.
NO. 6,15-21.
84,771-798.