Exposure to Diesel Exhaust Particle Extracts (DEPe) Impairs ...

NAVAL
POSTGRADUATE
SCHOOL
MONTEREY, CALIFORNIA
THESIS
Approved for public release; distribution is unlimited
PERFORMANCE AND RELIABILITY OF EXHAUST GAS WASTE HEAT RECOVERY UNITS
by
Chuan Heng Erik Koh
September 2014
Thesis Advisor: Sanjeev B. Sathe Co-Advisor: Knox T. Millsaps

THIS PAGE INTENTIONALLY LEFT BLANK

REPORT DOCUMENTATION PAGE Form Approved OMB No. 0704–0188 Public reporting burden for this collection of information is estimated to average 1 hour per response, including the time for reviewing instruction, searching existing data sources, gathering and maintaining the data needed, and completing and reviewing the collection of information. Send comments regarding this burden estimate or any other aspect of this collection of information, including suggestions for reducing this burden, to Washington headquarters Services, Directorate for Information Operations and Reports, 1215 Jefferson Davis Highway, Suite 1204, Arlington, VA 22202-4302, and to the Office of Management and Budget, Paperwork Reduction Project (0704-0188) Washington, DC 20503. 1. AGENCY USE ONLY (Leave blank)
2. REPORT DATE September 2014
3. REPORT TYPE AND DATES COVERED Master’s Thesis
4. TITLE AND SUBTITLE PERFORMANCE AND RELIABILITY OF EXHAUST GAS WASTE HEAT RECOVERY UNITS
5. FUNDING NUMBERS
6. AUTHOR(S) Chuan Heng Erik Koh 7. PERFORMING ORGANIZATION NAME(S) AND ADDRESS(ES)
Naval Postgraduate School Monterey, CA 93943-5000
8. PERFORMING ORGANIZATION REPORT NUMBER
9. SPONSORING /MONITORING AGENCY NAME(S) AND ADDRESS(ES) N/A
10. SPONSORING/MONITORING AGENCY REPORT NUMBER
11. SUPPLEMENTARY NOTES The views expressed in this thesis are those of the author and do not reflect the official policy or position of the Department of Defense or the U.S. Government. IRB Protocol number ____N/A____.
12a. DISTRIBUTION / AVAILABILITY STATEMENT Approved for public release; distribution is unlimited
12b. DISTRIBUTION CODE
13. ABSTRACT (maximum 200 words) This thesis presents the effect of exhaust tube length-to-diameter (L/d) ratio, jacket-to-tube diameter (D/d) ratio, coolant inlet and outlet placements, exhaust gas swirling conditions, and tube materials (steel, copper, Inconel, and ceramic) on heat recovery performance, exhaust side pressure drop, and temperature profile in the exhaust gas Waste Heat Recovery Unit (WHRU). Non-dimensional parametric studies of a selected counter-flow “Water Jacket” WHRU was conducted using analytical and Computational Fluid Dynamic (CFD) models. Exhaust gas Reynolds numbers between 20,000 and 400,000, representative of exhaust gas flow in the exhaust stacks of U.S. Marine Corps’ MEP803A diesel generators and the U.S. Navy’s 501-K17 gas turbine generators, were used. Results indicate heat recovery increases with higher L/d, D/d, and swirling exhaust gases conditions but with a severe pressure drop penalty. Addition of a solid heat spreader at the exhaust gas inlet and the use of suitable tube materials were also found to influence temperature profiles in the WHRU and mitigate adverse temperature gradients to some extent without any additional pressure drop penalty. Optimal laterally shifted placement of coolant inlet and outlet was found to improve heat recovery by up to 19% and was very effective at mitigating adverse temperature profiles, which improves the reliability of exhaust gas WHRU. 14. SUBJECT TERMS waste heat recovery, heat recovery performance, swirling flow, pressure drop penalty, temperature profiles, thermal stresses
15. NUMBER OF PAGES
161 16. PRICE CODE
17. SECURITY CLASSIFICATION OF REPORT
Unclassified
18. SECURITY CLASSIFICATION OF THIS PAGE
Unclassified
19. SECURITY CLASSIFICATION OF ABSTRACT
Unclassified
20. LIMITATION OF ABSTRACT
UU NSN 7540–01-280-5500 Standard Form 298 (Rev. 2–89) Prescribed by ANSI Std. 239–18
i

THIS PAGE INTENTIONALLY LEFT BLANK
ii

Approved for public release; distribution is unlimited
PERFORMANCE AND RELIABILITY OF EXHAUST GAS WASTE HEAT RECOVERY UNITS
Chuan Heng Erik Koh Military Expert 5, Republic of Singapore Navy
M. Eng., Newcastle University, 2008
Submitted in partial fulfillment of the requirements for the degree of
MASTER OF SCIENCE IN MECHANICAL ENGINEERING
from the
NAVAL POSTGRADUATE SCHOOL September 2014
Author: Chuan Heng Erik Koh
Approved by: Sanjeev B. Sathe Thesis Advisor
Knox T. Millsaps Co-Advisor
Garth V. Hobson Chairman, Department of Mechanical and Aerospace Engineering
iii

THIS PAGE INTENTIONALLY LEFT BLANK
iv

ABSTRACT
This thesis presents the effect of exhaust tube length-to-diameter (L/d) ratio, jacket-to-
tube diameter (D/d) ratio, coolant inlet and outlet placements, exhaust gas swirling
conditions, and tube materials (steel, copper, Inconel, and ceramic) on heat recovery
performance, exhaust side pressure drop, and temperature profile in the exhaust gas
Waste Heat Recovery Unit (WHRU). Non-dimensional parametric studies of a selected
counter-flow “Water Jacket” WHRU was conducted using analytical and Computational
Fluid Dynamic (CFD) models. Exhaust gas Reynolds numbers between 20,000 and
400,000, representative of exhaust gas flow in the exhaust stacks of U.S. Marine Corps’
MEP803A diesel generators and the U.S. Navy’s 501-K17 gas turbine generators, were
used.
Results indicate heat recovery increases with higher L/d, D/d, and swirling
exhaust gases conditions but with a severe pressure drop penalty. Addition of a solid heat
spreader at the exhaust gas inlet and the use of suitable tube materials were also found to
influence temperature profiles in the WHRU and mitigate adverse temperature gradients
to some extent without any additional pressure drop penalty. Optimal laterally shifted
placement of coolant inlet and outlet was found to improve heat recovery by up to 19%
and was very effective at mitigating adverse temperature profiles, which improves the
reliability of exhaust gas WHRU.
v

THIS PAGE INTENTIONALLY LEFT BLANK
vi

TABLE OF CONTENTS
I. INTRODUCTION AND BACKGROUND ...............................................................1
II. LITERATURE REVIEW ...........................................................................................5 A. PAST EXPERIENCE WITH SHIPBOARD WHRS ....................................5 B. EFFECT OF DESIGN FEATURES ON WHRU PERFORMANCE
AND RELIABILITY .......................................................................................6 1. Cascading Waste Heat Recovery ........................................................6 2. Heat Recovery Enhancement Techniques .........................................7 3. Effect of WHRU Exhaust Gas Back Pressure on Power Plants ......8 4. Effect of Differential Temperature on Reliability of Exhaust
Gas WHRUs .........................................................................................9
III. OBJECTIVES AND APPROACH ...........................................................................11 A. SELECTION OF WHRU CONFIGURATION FOR STUDY ..................13
1. Exhaust Jacket WHRU Configuration ............................................15 2. Water Jacket WHRU Configuration ...............................................16
B. CFD MODEL SETUP AND GEOMETRY .................................................19
IV. GOVERNING EQUATIONS, NON-DIMENSIONAL ANALYSIS AND CORRELATIONS .....................................................................................................25 A. GOVERNING EQUATIONS .......................................................................25 B. NON-DIMENSIONAL ANALYSIS .............................................................26
1. Non-dimensional Exhaust Gas Side Pressure Drop ........................27 2. Non-Dimensional Heat Recovery (Based on Exhaust Gas Side) ...29
C. NON–DIMENSIONAL PARAMETERS.....................................................31 D. NUSSELT NUMBER CORRELATION .....................................................35 E. PRESSURE LOSS ESTIMATION ..............................................................36 F. HEAT RECOVERY ESTIMATION (USING EFFECTIVENESS-
NTU METHOD).............................................................................................37
V. ANALYTICAL STUDY ............................................................................................39 A. ASSUMPTIONS AND IDEALIZATIONS FOR ANALYTICAL
STUDY ............................................................................................................40 B. EFFECT OF GEOMETRY ON WHRU PERFORMANCE .....................41
1. Effect on Non-dimensional Heat Recovery (q*) ..............................41 2. Effect on Non-dimensional Pressure Drop (ΔP*) Performance.....45 3. Limitations of Analytical Study ........................................................46 4. Range of L/d Ratio, D/d Ratio and Exhaust Reynolds Number
for CFD Study ....................................................................................47
VI. COMPUTATIONAL FLUID DYNAMICS (CFD) MODEL ANALYSIS ...........49 A. ANSYS-CFX RUNS .......................................................................................49
1. Model Meshing ...................................................................................51 2. Heat Transfer Model .........................................................................53 3. Turbulence Model ..............................................................................53
vii

B. MODEL VALIDATION AND SENSITIVITY ANALYSIS ......................54 1. Effect of WHRU Length to Tube Diameter Ratio on Non-
dimensional Heat Recovery ...............................................................56 2. Effect of WHRU Length to Tube Diameter Ratio on Non-
Dimensional Pressure Drop (ΔP*) ....................................................57 C. EFFECT OF L/D ON WHRU TUBE TEMPERATURE PROFILE ........59 D. TEMPERATURE PROFILE AT 6 O’CLOCK AND 12 O’CLOCK .......66 E. EFFECTS OF EXHAUST SWIRL ..............................................................69
1. Effect of Exhaust Swirl on Non-dimensional Heat Recovery (q*) .......................................................................................................70
2. Effect of Exhaust Swirl on Non-dimensional Pressure Drop (∆P*) ....................................................................................................72
3. Effect of Exhaust Swirl on Tube Temperature Profile...................73 F. EFFECT OF DIFFERENT TUBE MATERIAL ........................................77
1. Effect on Non-dimensional Heat Recovery (q*) ..............................78 2. Effect on Non-dimensional Pressure Drop (ΔP*) ............................79 3. Effect on WHRU Tube Temperature Profile ..................................80
a. Inconel 625 Tube ....................................................................80 b. Copper Tube ............................................................................81 c. “Pyroceram” Ceramic Tube ...................................................82 d. Comparison of Tube Wall Temperature Profile at 6
o’clock......................................................................................83 G. EFFECT OF SOLID HEAT SPREADER FEATURE ...............................84
1. Effect on Non-dimensional Tube Temperature Profile ..................87 2. Effect on Non-dimensional Heat Recovery (q*) ..............................88 3. Effect on Non-dimensional Pressure Drop (ΔP*) ............................89
H. EFFECT OF WATER INLET AND OUTLET PLACEMENTS .............90 1. Placement Type 1 (Baseline): Centerline Water Inlet and
Outlet on Same Side of WHRU.........................................................92 2. Placement Type 2: Centerline Inlet and Outlet on Opposite
Sides of WHRU ..................................................................................94 3. Placement Type 3: Inlet and Outlet on Same Side of WRU,
Shifted by x*= + 0.8............................................................................95 4. Effect of Water Inlet and Outlet Placements on Non-
dimensional Heat Recovery (q*) .......................................................98 5. Effect on Non-dimensional Exhaust Side Pressure Drop (∆P*) ....99 6. Effect on Non-dimensional Temperature Profiles ........................100
VII. CONCLUSION ........................................................................................................109
APPENDIX A .......................................................................................................................113
APPENDIX B .......................................................................................................................129
LIST OF REFERENCES ....................................................................................................133
INITIAL DISTRIBUTION LIST .......................................................................................137
viii

LIST OF FIGURES
Figure 1. Energy balance of a typical modern turbocharged intercooled diesel engine (from Woodyard, 2004). .........................................................................1
Figure 2. Layout of an typical exhaust gas WHRS used for combined heat and power (from CHP Focus, 2014) .........................................................................2
Figure 3. NPS, USN, and USMC Waste Heat Recovery System Roadmap (from Sathe & Millsaps, 2014). .................................................................................12
Figure 4. Comparison of typical temperature profiles for parallel flow (top) versus counter flow (bottom) heat exchange (after Longwin at http://www.longwin.com/). ..............................................................................14
Figure 5. Schematic view of the counter-flow exhaust jacket WHRU configuration. ....15 Figure 6. Schematic view of the counter-flow water jacket WHRU configuration. .......17 Figure 7. Isometric view of the CFD model used in the study. .......................................19 Figure 8. Top view of CFD model defining radial orientation of measurements
locations. ..........................................................................................................20 Figure 9. A 6 o’clock view of CFD model showing WHRU length (L) and locations
of water inlet and outlet. ..................................................................................21 Figure 10. Top view of CFD model defining the water jacket diameter (D), jacket
radius (R), exhaust tube diameter (d), and water inlet and outlet diameter (dwater). ..............................................................................................................22
Figure 11. A 3 o’clock view of CFD model defining locations of water inlet and outlet. ...............................................................................................................23
Figure 12. Water jacket WHRU configuration used for non-dimensional analysis. .........27 Figure 13. “Filonerko Fanning friction factor” versus Reynolds number (applicable
for both water or exhaust gas flow). ................................................................36 Figure 14. Comparison of non-dimensional heat transfer (q*) at exhaust gas Reynolds
number = 20,000 for D/d from 1.3 to 3.3 and L/d from 5 to 1,000. ................42 Figure 15. Comparison of non-dimensional heat transfer (q*) at exhaust gas Reynolds
number = 200,000 for D/d from 1.3 to 3.3, and L/d from 5 to 1,000. .............43 Figure 16. Comparison of non-dimensional heat transfer (q*) at exhaust gas Reynolds
number = 400,000 for D/d from 1.3 to 3.3, and L/d from 5 to 1,000. .............43 Figure 17. Comparison of non-dimensional heat transfer (q*) at D/d= 2 for L/d from
5 to 1000, Reexh from 20,000 to 400,000. ........................................................44 Figure 18. Comparison of non-dimensional heat transfer (q*) at D/d= 1.54 for L/d
from 5 to 1,000, and Reexh from 20,000 to 400,000. ........................................44 Figure 19. Comparison of non-dimensional heat transfer (q*) at D/d= 1.25 for L/d
from 5 to 1,000, and Reexh from 20,000 to 400,000. ........................................45 Figure 20. Comparison of non-dimensional heat transfer (q*) at D/d= 1.25, L/d from
5 to 1,000, and Exhaust Gas Reynolds Number from 20,000 to 400,000. ......46 Figure 21. Screen shot of completed meshing in CFX-Meshing for “Baseline” model
using automatic meshing method and program controlled inflation settings. ............................................................................................................52
ix

Figure 22. Comparison of non-dimensional heat recovery (q*) between analytical and CFD models of L/d = 5, 10 and 20 with Reexh from 20,000 to 400,000. D/d=1.25, t*=0.0625; no exhaust swirl, centerline water inlet and outlet placement with Rewater = 8,300. ........................................................................56
Figure 23. Comparison of non-dimensional pressure drop (ΔP*) between analytical and CFD models of L/d = 5, 10, 20; Reexh from 20,000 to 400,000; D/d=1.25, t*=0.0625, no exhaust swirl, centerline water inlet/outlet placement, Rewater = 8,300. ...............................................................................58
Figure 24. Isometric view showing locations where temperature measurements are made on WHRU tube with reference to inlets and outlets of exhaust and water flow. .......................................................................................................59
Figure 25. Tube temperature profile for WHRU of L/d= 5 at Reexh = 20,000 and 400,000, D/d=1.25, t*=0.0625, no exhaust swirl, centerline water inlet/outlet placement, Re water = 8,300. ...........................................................61
Figure 26. Tube temperature contours from 9 o’clock for WHRU with L/d = 5, D/d=1.25, t*=0.0625 at Reexh = 20,000 and 400,000 with no exhaust swirl and centerline water inlet/outlet placement. Re water = 8,300. ..........................62
Figure 27. Tube temperature profile for WHRU with L/d = 10, D/d=1.25, t*=0.0625 at Reexh = 20,000 and 400,000 with no exhaust swirl and centerline water inlet/outlet placement. Re water = 8,300. ...........................................................63
Figure 28. Tube temperature contours from 9 o’clock for WHRU with L/d = 10, D/d=1.25, t*=0.0625 at Reexh = 20,000 and 400,000 with no exhaust swirl and centerline water inlet/outlet placement. Re water = 8,300. ..........................64
Figure 29. Tube temperature profile for WHRU with L/d = 20, D/d=1.25, t*=0.0625 at Reexh = 20,000 and 400,000 with no exhaust swirl and centerline water inlet/outlet placement. Re water = 8,300. ...........................................................65
Figure 30. Tube temperature contours from 9 o’clock for WHRU with L/d = 20, D/d=1.25, t*=0.0625 at Reexh = 20,000 and 400,000 with no exhaust swirl and centerline water inlet/outlet placement. Re water = 8,300 showing temperature contours of the WHRU tube from different angles. .....................66
Figure 31. Water streamlines depicting non-uniformity of water flow inside water jacket of a WHRU of L/d =10, D/d=1.25 with centerline water Inlet/outlet placements at Rewater = 8,300. ..........................................................................67
Figure 32. Comparison of temperature profile at 6 o’clock and 12 o’clock at Reexh = 400,000 for WHRU of L/d = 5, 10, and 20. .....................................................68
Figure 33. Comparison of non-dimensional heat recovery (q*) at exhaust swirl conditions specified in Table 6. L/d = 10; Reexh = 400,000; Re water = 8,300.................................................................................................................71
Figure 34. Effect of three different exhaust swirl conditions (specified in Table 6) on exhaust side non-dimensional pressure drop for WHRU of L/d = 10, D/d=1.25 with centerline water inlet/outlet placements. .................................72
Figure 35. Comparison of tube temperature profiles between WHRU with swirl condition A (axial plus tangential velocity components) with a WHRU with no exhaust swirl (axial velocity component only). WHRU has L/d =
x

10, D/d=1.25, t*=0.0625, and centerline water inlet and outlet placement, Reexh = 400,000, Rewater = 8,300. ......................................................................74
Figure 36. Streamline depicting the helical exhaust gas stream associated with swirl condition B (axial + tangential + radial velocity components) in a WHRU of L/d = 10. D/d=1.25, t*=0.0625 at Reexh = 400,000. ....................................75
Figure 37. Comparison of tube temperature profile between WHRU with swirl condition B (axial, tangential, and radial velocity components) with a WHRU with only axial velocity component swirl at L/d = 10, D/d=1.25, t*=0.0625, centerline water inlet and outlet placement, Reexh = 400,000, Rewater = 8,300. .................................................................................................76
Figure 38. Comparison of non-dimensional heat recovery (q*) for WHRU with tubes made of copper, steel, inconel625 and “Pyroceram”/. L/d = 10, D/d=1.25, t*=0.0625. Reexh from 20,000 to 400,000 with no exhaust swirl, centerline water inlet and outlet placement at Rewater = 8,300. .........................................78
Figure 39. Comparison of non-dimensional pressure drop (ΔP*) for WHRU with tubes made of copper, steel, inconel625 and “Pyroceram”/. L/d = 10, D/d=1.25, t*=0.0625. Reexh from 20,000 to 400,000 with no exhaust swirl, centerline water inlet and outlet placement at Rewater = 8,300. ........................79
Figure 40. Comparison of tube temperature profile between Inconel 625 and steel WHRU of L /d =10, D/d=1.25, t* = 0.0625 with centerline inlet and outlet placement, no exhaust swirl, Reexh = 400,000, Rewater = 8,300. .......................80
Figure 41. Comparison of tube temperature profile between copper and steel WHRU of L /d =10, D/d=1.25, t* = 0.0625 with centerline inlet and outlet placement, no exhaust swirl, Reexh = 400,000, Rewater = 8,300. .......................81
Figure 42. Comparison of tube temperature profile between Pyroceram and steel WHRU of L /d =10, D/d=1.25, t* = 0.0625 with centerline inlet and outlet placement, no exhaust swirl, Reexh = 400,000, Rewater = 8,300. .......................82
Figure 43. Comparison of 6 o’clock tube wall temperature profiles for WHRU tube made of copper, steel, “Pyroceram” and Inconel 625. .....................................84
Figure 44. The 3 o’clock view of adverse temperature profiles due to non-uniform flow of water stream (shown by water streamlines) at the exhaust inlet section of a WHRU without the heat spreader feature. ...................................85
Figure 45. The 3 o’clock view of steel heat spreader feature near the exhaust inlet of the water jacket WHRU. ..................................................................................86
Figure 46. Isometric view of water jacket WHRU with steel heat spreader feature. ........87 Figure 47. Comparison of tube temperature profile between WHRU with and without
heat spreader feature at Reexh = 20,000 and 400,000. For WHRU of L/d =10, D/d=1.25, t* = 0.0625, centerline water inlet and outlet placement with no exhaust swirl condition, Rewater = 8,300. ............................................88
Figure 48. Effect of 0.1y* heat spreader on non-dimensional heat recovery (q*) for WHRU with L/d = 10, D/d=1.25, t*=0.0625, no exhaust swirl, centerline water inlet/outlet placement, Reexh between 20,000 and 400,000; Rewater = 8,300.................................................................................................................89
Figure 49. Effect of 0.1y* heat spreader on non-dimensional pressure drop (∆P*) for WHRU with L/d = 10, D/d=1.25, t*=0.0625, no exhaust swirl, centerline
xi

water inlet/outlet placement, Reexh between 20,000 and 400,000; Re water = 8,300.................................................................................................................90
Figure 50. Isometric and top view of WHRU with water placement Type 1 (centerline water inlet and outlets on 6 o’clock side at y/L = 0.1 from the top and bottom edges of WHRU). ...................................................................92
Figure 51. View from 3 o’clock of WHRU with water placement Type 1 (centerline water inlet and outlets on 6 o’clock side at y/L = 0.1 from the top and bottom edges of WHRU). ................................................................................93
Figure 52. Isometric view and top view of water placement Type 2 (centerline water inlet on 6 o’clock side and water outlet on 12 o’clock side at y/L = 0.1 from the top and bottom edges of WHRU). .....................................................94
Figure 53. Isometric view (and top view) of CFD model with water placement Type 3 (water inlet and outlet located at x*= +0.8 from centerline and y/L = 0.1 from the top and bottom edges of WHRU). .....................................................95
Figure 54. Top view of CFD model with water placement Type 3 (water inlet and outlet located shifted x*= +0.8 from centerline). .............................................96
Figure 55. The 6 o’clock view of WHRU with water placement Type 3 showing (water inlet and outlet located y/L = 0.1 from top and bottom edges of the WHRU). ...........................................................................................................97
Figure 56. Comparison of non-dimensional heat recovery (q*) from three water inlet and outlet placement types based on water jacket WHRU of L/d=10, D/d=1.25 with steel tube of t* = 0.0625. Reexh from 20,000 to 400,000 with no exhaust swirl with Rewater = 8,300. .....................................................98
Figure 57. Comparison of non-dimensional pressure drop (∆P*) of three water inlet and outlet placement types based on water jacket WHRU of L/d=10, D/d=1.25 with steel tube of t* = 0.0625; Reexh from 20,000 to 400,000 with no exhaust swirl; Rewater = 8,300. ............................................................99
Figure 58. Comparison of WHRU tube temperature profiles between placement Type 1 (centerline water inlet and outlet on the same side) and Type 2 (centerline water inlet and outlet on opposite sides) for WHRU of L/d=10, D/d=1.25, t*=0.0625. ReExh of 20,000 to 400,000 with no exhaust swirl. Rewater = 8,300. ...............................................................................................100
Figure 59. Water streamlines and tube temperature contours for WHRU with water placement Type 1 (centerline water inlet and outlet placement on same side), L/d = 10; D/d=1.25, t*=0.0625 at Reexh = 400,000; Rewater = 8,300, and no exhaust swirl.......................................................................................101
Figure 60. Water velocity vectors of WHRU with water placement Type 1 (centerline water inlet and outlet placement on same side), for L/d =10, D/d=1.25, t*=0.0625 at Reexh=400,000, Rewater =8,300 with no exhaust swirl. ..............102
Figure 61. Water streamlines and tube temperatures for WHRU with water placement Type 2 (centerline water inlet and outlet placement on opposite sides), L/d = 10. D/d=1.25, t*=0.0625, No Exhaust Swirl, Reexh = 400,000, Rewater = 8,300...............................................................................................................103
xii

Figure 62. Water velocity vectors of WHRU with water placement Type 2 (centerline water inlet and outlet placement on opposite sides), L/d = 10. D/d=1.25, t*=0.0625, no exhaust swirl, Reexh = 400,000, Rewater = 8,300. .....................104
Figure 63. Comparison of tube temperature profile between WHRU with water inlet and outlet shifted laterally by x*=0.8 (placement Type 3) and WHRU with centerline water inlet and outlet on the same side (placement Type 1). L/d=10, D/d=1.25, t*=0.0625. Reexh of 20,000 to 400,000 with no exhaust swirl; Rewater = 8,300. .....................................................................................105
Figure 64. Water streamlines and temperature contour for WHRU with water inlet and outlet shifted laterally by x*=0.8 (placement Type 3) with L/d = 10; D/d=1.25, t*=0.0625, no exhaust swirl at Reexh = 400,000, Re water = 8,300. 106
Figure 65. Velocity vectors depicting uniform flow in the water jacket of a WHRU with water inlet and outlet shifted laterally by x*=0.8 (placement Type 3) with L/d = 10, D/d=1.25, t*=0.0625, no exhaust swirl at Reexh = 400,000, Rewater = 8,300. ...............................................................................................108
xiii

THIS PAGE INTENTIONALLY LEFT BLANK
xiv

LIST OF TABLES
Table 1. Summary of parameters used for non-dimensional pressure loss analysis. .....27 Table 2. Summary of parameters used for non-dimensional heat transfer (q*). ............29 Table 3. Overview of CFD runs conducted in ANSYS-CFX (D/d=1.25, t* =
0.0625) .............................................................................................................50 Table 4. Meshing details of various ANSYS-CFX models. ..........................................53 Table 5. Comparison of non-dimensional heat recovery (q*) between analytical and
CFD models of L/d = 5, 10, 20; Reexh = 20,000, 200,000 to 400,000; D/d=1.25, t*=0.0625; no Exhaust swirl, centerline water inlet/outlet placement, Rewater = 8,300. ...............................................................................55
Table 6. Summary of exhaust swirl conditions in the study. .........................................70 Table 7. Comparison of thermal conductivity for carbon steel, Inconiel625, copper,
and “Pyroceram.” .............................................................................................77 Table 8. Inlet and outlet temperatures and energy balance from ANSYS CFX
model runs. .....................................................................................................129
xv

THIS PAGE INTENTIONALLY LEFT BLANK
xvi

LIST OF ACRONYMS AND ABBREVIATIONS
A Heat transfer area [m2]
Acsa Cross sectional area [m2]
Cp Constant pressure specific heat capacity [J/kg-K]
Cr Ratio of minimum heat capacity to maximum heat capacity [1]
CFD Computational Fluid Dynamics
d Inner diameter of exhaust tube [m]
* Ddd
= Jacket diameter-to-tube diameter ratio [1]
dwater Inner diameter of water inlet and outlet pipe [m]
D Inner diameter of water jacket [m]
Deff Effective diameter [m]
DG Diesel Generator
ε Heat transfer effectiveness [1]
f Fanning friction factor [1]
g Acceleration due to gravity [m/s2]
h Enthalpy [J/kg], Heat transfer coefficient [W/m2K]
k Thermal conductivity [W/m-K]
*
air
kkk
= Non-dimensional thermal conductivity [1]
K Kelvin
L Length [m]
* LLd
= Length-to-tube diameter ratio [1]
m Mass flow rate [kg/s]
c eff
c
h DNu
k= Nusselt number [1]
NTU Number of Transfer Unit
P Pressure [Pa]
xvii

Pr pCKµ υ
α= = Prandtl number [1]
2* PPUρ∆
∆ = Non-dimensional pressure drop [1]
** effPDP
Uµ∆
∆ = Non-dimensional pressure drop [1]
q Amount of heat recovered [W]
, , ,
*( )
exh
exh p exh exh in water in
qqm C T T−
=
Non-dimensional heat recovery as a fraction of maximum
recoverable heat) [1]
Q Volumetric flow rate [m3/s]
4Re eff
eff
UD mD
ρµ πµ
= =
Reynolds number [1]
Reexh Reynolds number of exhaust gas flow [1]
Rewater Reynolds number of water flow [1]
SE Energy source
SM Momentum source
SSGTG Ship Service Gas Turbine Generator
t Thickness [m]
t* Non-dimensional thickness
T Temperature [K]
,*
, ,
water in
exh in water in
T TT
T T−
=−
Non-dimensional temperature as fraction of the maximum
temperature range [1]
T∆ Temperature difference / change [K] *T∆ Non-dimensional temperature difference [1]
u Velocity in x-axis [m/s]
uaxial Velocity in the axial axis [m/s]
uθ Angular velocity [radians /s]
ur Radial velocity [m/s]
U Average velocity [m/s]
xviii

U
Velocity matrix
overallU Overall heat transfer coefficient [J/kg]
USN United States Navy
USMC United States Marine Corp
v Velocity in y-axis [m/s]
w Velocity in z-axis [m/s]
WHR Waste Heat Recovery
WHRS Waste Heat Recovery System
WHRU Waste Heat Recovery Unit
x Displacement in the x-axis [m]
* xxR
= Non-dimensional x displacement [1]
y Displacement in the y-axis [m]
* yyL
= Non-dimensional y displacement [1]
z Displacement in the z-axis [m]
* zzR
= Non-dimensional z displacement [1]
α Thermal diffusivity [m2/s]
µ Dynamic viscosity [Pa-s]
ρ Density [kg/m3]
υ Momentum diffusivity [m2/s]
ϕ Arbitrary function
Subscripts eff Effective
exh Exhaust gas
water Water
in Inlet conditions
out Outlet conditions
xix

THIS PAGE INTENTIONALLY LEFT BLANK
xx

ACKNOWLEDGMENTS
First, praise and thanks be with God for His daily providence and opportunity to
do good work. I also thank the Singapore Navy for allowing me to pursue my preferred
course of studies at NPS.
I would also like to express my gratitude towards my thesis advisor, Professor
Sathe, for being a wonderful mentor and coach. In addition to his deep engineering
knowledge, his wisdom and ability to resolve and simplify complex issues with clarity is
an attribute that I will constantly try to emulate. Thank you, sir.
I also thank my thesis group team mates, Chris, Ryan, and Bob, for their valuable
inputs during my thesis preparation.
Last but not least, my most wonderful wife, Rosita, for being my unwavering
pillar of support and love during our time in Monterey.
xxi

THIS PAGE INTENTIONALLY LEFT BLANK
xxii

I. INTRODUCTION AND BACKGROUND
Heat engines that run on fossil fuel, such as diesel engines and gas turbines, are
widely employed for propulsion and power generation. Despite technological advances,
approximately 60% of the chemical energy released during fuel combustion is lost to the
atmosphere as waste heat. A typical energy balance of a modern diesel engine shown in
Figure 1 shows that almost 40% of the fuel energy is lost in exhaust gases (Woodyard,
2004).
Figure 1. Energy balance of a typical modern turbocharged intercooled diesel
engine (from Woodyard, 2004).
Exhaust gas Waste Heat Recovery (WHR) is the recovery of energy from waste
heat in the exhaust gases for useful purposes such as heating, refrigeration, power
generation, propulsion, etc. Benefits of WHR include reduced fuel consumption, reduced
operating costs, and lower emissions (BCS, 2008). WHR can be achieved through
bottoming, topping, and combined cycles as described by Paanu, Niemi, and Rantanen,
Majority of waste heat is lost in exhaust gases (exiting turbocharger turbine)
1

(2012). The waste heat recovered from exhaust gases is commonly used for heating
purposes or alternatively used to generate steam which is then passed through a turbine
generator in a Rankine cycle to produce electricity. A typical layout of the Combined
Heat and Power (CHP) Waste Heat Recovery System (WHRS) is shown in Figure 2.
Figure 2. Layout of an typical exhaust gas WHRS used for combined heat and power (from CHP Focus, 2014)
A WHR report commissioned by U.S. Department of Energy’s Industrial
Technologies Program identified WHR as a proven and effective technology with the
potential to improve energy efficiency by 10% to 50% (BCS, 2008). Exhaust gas WHR
have also been increasingly utilized by merchant ships to improve the overall efficiency
2

of their propulsion and shipboard power plants so as to reduce emissions and fuel
consumption (www.greenship.org, 2014).
A paper by Bailey (1985) compared exhaust gas WHR using three alternative
bottoming power cycles on heavy duty truck diesel engines to supplement power
generation. The systems were found to improve the specific fuel consumption of the
power plants significantly. A maximum improvement of 12% was achieved by using a
Rankine cycle heat-recovery system in series with turbo-compounding. A 9%
improvement in specific fuel consumption was achieved when no turbo-compounding
was used. Modern gas turbines equipped with optimized WHRS have been reported by
Carapellucci and Giordano (2012) to achieve overall combined-cycle thermal efficiencies
of up to 55%.
WHR can be used to support the U.S. Navy’s (USN) energy program to increase
its energy security and pursue energy independence through the increased use of
alternative energy, energy conservation, higher energy efficient technologies, and energy
supply management innovations (Deputy Assistant Secretary of the Navy (DASN)
Energy Office, 2010). With the large number of diesel engines and gas turbines in
operation, in both onshore installations and onboard ships, the USN and U.S. Marine
Corps (USMC) recognize the potential of WHR applications and are putting in significant
effort to develop WHR technology.
One area of development is to improve the performance and reliability of the
exhaust gas waste heat recovery units (WHRUs). A WHRU is essentially a gas-to-gas or
gas-to-liquid heat exchanger where energy from the hot exhaust gases is transferred into a
cooler working fluid (liquid or gas) through heat exchanger surfaces such as tubes or
plates. The WHRU is one of the most crucial, and the most vulnerable, components in
any exhaust gas WHRS as it is subjected to harsh operating conditions such as adverse
temperature gradients, fouling, and corrosive gases. Dooley, Paterson, and Pearson
(2005) stated adverse temperature gradients to be one of the most common causes of
WHRU tube failures. Adverse temperature results in differential expansions and thermal
stresses within and between components in the WHRU. The induced thermal stresses can
3

also contribute towards stress corrosion cracking and fatigue, which cause premature
failures of WHRUs.
The USN had limited success during the implementation of exhaust gas waste
heat recovery on the DD-963s in the 1970s; availability of the WHRS was low due to
issues such as poor WHRU reliability and reduction of gas turbine performance due to
exhaust gas back pressure. The WHRS were subsequently removed from operation
(Mastronarde, 1982).
In order to ensure a successful implementation of the next generation of WHRUs
onto USN and USMC power plants, WHRU performance and reliability are crucial and
are related to the temperature profiles within a WHRU. In view of this requirement, this
thesis investigated how WHRU reliability and performance are affected by WHRU
geometry, exhaust gas flow streams, and WHRU design features such as tube material
and profile, and location of water inlet/outlet placements. Findings from this study can be
applied directly to improve the performance and reliability of future WHRU designs.
4

II. LITERATURE REVIEW
A literature review was performed to understand the challenges faced by WHR
programs in areas related to performance and reliability. The review looked at how heat
recovery and exhaust side pressure drop performance as well as reliability of exhaust gas
WHRUs are affected by various features related to design, construction and operations.
A. PAST EXPERIENCE WITH SHIPBOARD WHRS
In the 1970s, the USN employed WHR to produce steam for heating and auxiliary
demands of the DD-963 (SPRUANCE) class destroyers. Each of the three Ship Service
Gas Turbine Generators (SSGTGs) was equipped with a WHRU.
Although the WHRS was able to fulfill the steam production requirements, Rains,
et al. (1976) and Mastronarde (1982) highlighted numerous problems with the first
generation of WHRS. These include excessive exhaust gas side pressure drop which
resulted in degradation of engine performance. The WHRUs also suffered from frequent
exhaust gas leakages due to differential expansion and contraction at the casings and
connecting points. As the SSGTGs and the WHRUs which have limited capability to
operate in dry conditions) are interlinked, a defect on the WHRU could curtail the
availability of the entire SSGTG system.
The lesson learned was the importance for power plants to be able to operate
independent of their WHRU. Alternatively, WHRUs must be designed with the ability to
run in dry conditions when no coolant is supplied into the WHRU. The WHRU must be
able to withstand the high exhaust gas temperature during this condition. Dry operations
may be required to prevent ingress of coolant from a leaking WHRU, placed within the
exhaust tube from flowing into the power plant to cause damage. This capability thus
became an important design criterion for subsequent generations of WHRS.
Similar issues were also faced by the Canadian Navy’s WHRS which were
installed on the DDH 280 class destroyers (Breaux & Davies, 1978). High spot
temperatures and cracking of the heat exchanger diaphragm were experienced during
operation. In addition, the WHRUs were not designed with access for maintenance in 5

mind. Due to improper design, fin corrosion and soot accumulation were also major
problems that plagued the program. In order to address these issues, significant redesign
incorporating changes in material, layout, heat exchanger tubes and fins and exhaust gas
system had to be made.
B. EFFECT OF DESIGN FEATURES ON WHRU PERFORMANCE AND RELIABILITY
Heat recovery enhancement can be achieved by passive, active, or a combination
of both enhancement techniques (Akpinar, 2006). Active enhancement techniques are
achieved through the provision of additional flow energy to the fluid, by increasing the
mass flow rate or increasing the temperature of heat source. Passive enhancements are
achieved without additional input of energy but through the enhancement features, such
as optimized geometries, configuration, shapes or devices such fins, materials to increase
the overall heat transfer coefficients.
1. Cascading Waste Heat Recovery
In order to maximize recovery, WHRS can be made up of numerous sections of
WHRUs which have been optimized to recover heat energy at specific temperature and
flow profiles. Heat Recovery Steam Generators (HRSGs) are an example of such
WHRUs. They have been specifically designed to generate a large quantity of steam
which is subsequently used for heating or power generation via a Rankine cycle.
Macdonald (2014) highlighted that typical combined-cycle HRSGs use 15 to 20 different
heat-transfer sections, namely super-heaters, re-heaters, evaporators, and economizers to
produce steam in three pressure levels. These sections are placed in series at different
locations along the exhaust-gas path so as to recover waste heat over a wide range of
temperatures. Similarly a cascading system of optimized WHRUs can be applied to
maximize the performance of WHR from the exhaust tubes of power plants both on board
ships and ashore.
6

2. Heat Recovery Enhancement Techniques
Passive heat enhancement techniques using extended surfaces such as placing fins
inside the exhaust gas flow are well-established and researched. Correlations and
relations of extended surfaces with heat transfers can be found in heat transfer textbooks,
design handbooks, journals articles, and proceedings. The main issues with the use of
extended surfaces are increased capital cost and more important the high pressure drops.
Heat transfer was found to increase when internal fins were added to a tube
undergoing laminar flow (Masliyah & Nandakumar, 1976). Agrawal and Sengupta
(1993) numerically studied the heat transfer and pressure drop in the annulus of a double
pipe heat exchanger with fins and found that both heat transfer and pressure drop increase
as compared a similar heat exchanger without fins under the same flow conditions.
Pressure drop increase was due to increased friction factor as well as blockage effect
from the extended surfaces. An interesting heat transfer enhancement is the use of helical
inserts to induce swirling flow where an increased heat transfer coefficient is desired.
Experiments were performed by Akpinar (2006) to investigate heat transfer and pressure
drop performance in both parallel and counter current flow configurations with Reynolds
numbers ranging from 6,500 to 13,000. A 2.64 times increase in heat transfer rate was
achieved when the helical inserts were used. However, the use of these devices also
increased the friction factor considerable by up to 2.74 times as compared to a tube
without the insert. Pardhi and Baredar (2012) reported a 61% to 78% increase in heat
coefficient over a smooth tube without inserts. However, pressure drop increased by a
greater amount. Patel, Parmar, and Soni (2014) reviewed the works of various researchers
and reported similar findings of higher pressure losses compared to heat transfer gains
whenever helical inserts were used to induce swirling flow as a passive heat enhancement
technique. It is thus apparent that the use of extended surfaces and placement of intrusive
devices such as helical inserts introduce blockages and the increased pressure losses
across heat transfer tubes. In order to mitigate this, Khalil, Zohir, and Farid (2010)
investigated heat transfer related to swirling and non-swirling flows through sudden pipe
expansions at constant pumping power. They highlighted that the use of swirling flow
7

coupled with sudden expansion allowed heat transfer increase to be greater than pressure
losses when compared to an equivalent sudden expanded pipe without helical inserts.
Alternatively, Durmus (2002) used a snail entrance to generate swirl in air flow in
a tube for a concentric double-pipe heat exchanger. The use of a snail entrance feature
increased the Nusselt number in the heat exchanger from 85% to 200% with a pressure
drop increase of 110%. Albadr, Tayal, and Alasadi (2013) conducted experiments to
study turbulent counter flow heat transfer and flow characteristics using a coolant that is
made up of water and Al2O3 nanofluid of concentrations of between 0.3–2% in shell and
tube heat exchanger. They found heat transfer to increase with higher concentration of
Al2O3 nanofluid. However, friction factor also increased due to the increased viscosity
due to the nanofluid.
Overall, heat transfer enhancement features such as fins and helical inserts
increase pressure losses which could offset the gain achieved in heat transfer. In the
context of exhaust gas WHRUs, these increased pressure drop caused by the heat
enhancement features induces back pressure into the exhaust system of the diesel engine
or gas turbine upstream. This adversely affects their performance. A system level
approach is required during new designs or the retrofitting of existing power plants with
WHR so as to achieve a net improvement in thermal efficiency and specific fuel
consumption.
3. Effect of WHRU Exhaust Gas Back Pressure on Power Plants
As discussed earlier, pressure drop increase adversely affects the fuel efficiency
of the power plant up stream. The placement of a WHRU in the exhaust tube creates back
pressure and increases specific fuel consumption. Careful design and arrangement of
WHRUs must be made in order to minimize excessive back pressure to achieve an actual
increase in thermal efficiency and improve specific fuel consumption. Boyce (2012)
highlighted in a typical gas turbine exhaust gas WHRS that every 25 mm of water (245
Pascal) increase in turbine back pressure reduces the power output and heat rate by
0.25% and 0.08%, respectively. Hield (2011) concluded that exhaust back pressure in
diesel engines resulted in increased specific fuel consumption, fluctuation in engine 8

speed, and higher exhaust temperatures. These induce thermal cycling which causes
increased wear, overheating, and thermal failures of engine components, severely
affecting WHRU reliability.
4. Effect of Differential Temperature on Reliability of Exhaust Gas WHRUs
Dooley, Paterson, and Pearson (2005) highlighted that more than 80% of pressure
parts (i.e., tubes) failures in WHRUs are caused by damaging thermal effects or poor
cycle chemistry. The root causes of thermal induced failures are primarily caused by
adverse temperature differences within the WHRU during startup, operation, and
shutdown. Adverse differential temperatures were commonly found in WHRU
components such as heat exchange tubes, tube to header joints, welds, and tube bends
(Daniels, 2014; Zamanzadeh, Larkin, Bayer, & Linhart, 2007). Differential temperatures
result in differential expansion of these components. Expansion of these components is
influenced by their geometry and dimension, the materials’ thermal conductivity and
thermal expansion coefficient, and the surrounding flow field. Differential expansions
cause thermal-mechanical stresses both globally and locally, and contribute significantly
to thermal fatigue as well as chemical fatigue factors such as stress corrosion cracking
(SCC). Although startup and shutdown operating procedures could be established to
mitigate thermal-mechanical damage (EPRI, 2009), the best prevention is to understand
and incorporate features into the WHRU design to prevent or minimize such adverse
differential temperature profiles. As discussed earlier in Breaux and Davies (1978) and
Mastronarde (1982), failure to resolve the reliability problem was one of primary reasons
for the limited success in the WHR programs.
9

THIS PAGE INTENTIONALLY LEFT BLANK
10

III. OBJECTIVES AND APPROACH
This study aimed to investigate and gain insight into how heat recovery
performance, exhaust side pressure drop, and temperature profile of WHRUs are
impacted by features related to WHRU design and construction, as well as and WHR
operation. This thesis study was part of the USN, Naval Postgraduate School (NPS)
WHR capability roadmap (see Figure 3), which aims to build up WHR subject matter
expertise and provide solutions for issues relating to WHRS reliability and performance
in support of the strategic goals of the USN Energy Program.
Specifically, the effect of WHRU geometry (tube length-to-tube diameter ratio
and shell diameter-to-tube diameter ratio), water inlet and outlet placements, exhaust gas
swirl, tube materials of different thermal conductivity (steel, copper, Inconel 625, and
“Pyroceram” ceramic), and the use of heat spreader features were investigated and
contribute toward in the buildup of WHR knowledge. In particular, knowledge on
exhaust side pressure drop, heat recovery performance, and adverse temperature profiles
were sought.
The study was achieved using analytical and Computational Fluid Dynamic
(CFD) models based on a counter flow Water Jacket WHRU. Exhaust gas parameters for
the study were based on USN’s Rolls Royce 501K SSGTG and USMC’s MEP803A
Diesel Engine Generator (DG) at steady state operating conditions. The rationale for the
choice of the Water Jacket WHRU configuration, as well as the model setup is discussed
later in this chapter.
In order to cover the wide range of exhaust parameters found in both power
plants, non-dimensional parameters and analysis were used in both analytic and CFD
models. Definition and derivation of non-dimensional parameters, governing equations
and analytical correlations used are covered in Chapter IV.
11

US Navy & NPS WHR Capability RoadmapSathe, Millsaps (2014)
Unclassified7
US Navy & NPS Capability Sathe/Millsaps
2014 2015 2016 2017 2018
Turbulence/Fluids/Thermal Models- Ducts- Vanes- Filters- Infrared Radiation- Closure Methods- Convergence- Pulsatile Flow- Swirling Flow- Mass Transfer/Particle Deposition
- IR Signature Reduction- Thermal Radiation in Scattering, Absorbing and Emitting
Media- Pressure Drop Mitigation- Waste Heat Recovery (COTS) Technology Evaluation
Infrastructure- Computational Heat Transfer Laboratory- Ultra High Reliability (UHX) Heat Exchanger Laboratory- Measurement Methods
- IR- Thermal Contact Resistance- Thermo-Mechanical Fatigue
2019
Design/Maintenance- Heat Exchanger Designs- System Level Considerations (Bypass/Novel Methods)
Heat Exchanger Models- Local & Global (System) Integration- Thermal Stresses- Temperature and Flow Distribution- Transient Effects
Thermal Properties New Material Evaluation for Suitability
Figure 3. NPS, USN, and USMC Waste Heat Recovery System Roadmap
(from Sathe & Millsaps, 2014).
Chapter V presents the results of analytical models that were evaluated over a
wide range of WHRU length-to-tube diameter (L/d) ratios and water jacket diameter-to-
tube diameter (D/d) to understand the effect of geometry on WHRU heat recovery and
exhaust pressure drop performance. Evaluations of the models were made based on the ε-
NTU method and correlations obtained from open sources such as heat transfer textbooks
and handbooks.
Subsequently, Chapter VI presents the analysis and results from CFD models
constructed using the ANSYS-CFX CFD package. CFD models were used in order to
overcome the limitations of analytical models to investigate effects of water inlet and
outlet placements, exhaust gas swirl, different tube materials and heat spreader feature.
The parameters inspected were heat recovery rate, exhaust gas side pressure drop,
12

temperature profile, contours, as well as velocity vectors field in the exhaust gas and
water domains.
Chapter VII discusses the findings and conclusions of this study. The chapter also
includes recommendations and suggests future work to advance understanding on this
topic. Finally, settings and results of ANSYS-CFX models used in this study are collated
and provided in the Appendices.
A. SELECTION OF WHRU CONFIGURATION FOR STUDY
In order to understand the complex interactions and relationships between heat
recovery, pressure drop, and temperature profile in exhaust gas WHRUs, two simple
counter-flow WHRU configurations (exhaust jacket and water jacket) were initially
considered to be used as the model to study the effect various features on performance
and reliability.
A counter flow configuration was chosen over a parallel one due to higher heat
transfer effectiveness and, more importantly, the smaller range of temperature differences
between the hot and cold fluids throughout the WHRU length. The importance of gradual
temperature profiles and gradients towards minimization of differential expansion and
WHRU reliability was discussed in Chapter II. Comparison of the typical temperature
profiles of counter flow versus parallel flow heat exchange is shown in Figure 4.
13

Figure 4. Comparison of typical temperature profiles for parallel flow (top)
versus counter flow (bottom) heat exchange (after Longwin at http://www.longwin.com/).
The following considerations were used as criteria for the selection of the final
counter flow WHRU configuration:
1. Ability to avoid adverse temperature profiles and gradients in order to improve WHRU reliability
2. Minimum impact on the performance of existing power plant in event of WHRU failure.
3. Ease of access for inspections and maintenance
4. Ease of retrofit onto exhaust stacks of existing power plants with minimum modifications or redesign
Texh,out Twater,out Twater,in Texh,in
Texh,out Twater,out
Texh,in Twater,out Texh,out
Twater,in
Texh,in
Twater,in
Twater,in Twater,out
Texh,out Texh,in
14

The water jacket was eventually chosen over the exhaust jacket configuration due
to merits that are discussed in the following sections.
1. Exhaust Jacket WHRU Configuration
The exhaust jacket WHRU shown in Figure 5 is representative of how many
WHRU are being configured. In the exhaust jacket configuration, the WHRU is placed
inside the exhaust tube, with water inlet and outlet being the only connections going
through the exhaust tube.
Figure 5. Schematic view of the counter-flow exhaust jacket WHRU
configuration.
WHRUs used in the first generation WHRS of the USN and Canadian Navy was
similarly placed within the exhaust gas stream (Breaux & Davies, 1978; Mastronarde,
1982). The Rankine Cycle Energy Recovery (or RACER); a WHRS explored by the USN
for use onboard USN gas turbine powered ships also designed for its WHRU to be placed
15

within the exhaust tube (Halkola, Campbell, & Jung, 1983) in order to maximize its heat
recovery.
The exhaust jacket configuration also allows several WHRUs to be placed inside
the exhaust tube to increase heat recovery. However, doing this causes blockages and
restricts the flow of exhaust stream through the exhaust tube. This increases the exhaust
gas side pressure drop and back pressure which adversely impact the efficiency and
operation of the power plant upstream as discussed in previously.
For a new WHRS system, allowance for this additional pressure drop can be
incorporated into the design of the exhaust system. However, in the case of retrofit, a
redesign of the engine intake and exhaust system might be required in order to mitigate
the increased exhaust pressure drop. This would increase the capital cost, affecting the
life time savings of the WHRS.
Adverse temperature profiles are also expected at the locations where the water
inlet and outlet enter or exit the exhaust stack due to large temperature differences
between water and exhaust gas. Thermal stresses arising from localized differential
thermal expansions between the water pipes and exhaust stack could eventually result in
cracks and leakages. In the event of a failure, a WHRU placed inside the exhaust tube of
a power plant may also render the entire power plant to be non-operational. This is
unacceptable in view of system readiness and availability requirements. This WHRU
configuration also posed significant challenges when access for inspection, maintenance,
or replacements is required. Based on these considerations, the exhaust jacket
configuration was not selected.
2. Water Jacket WHRU Configuration
The water jacket WHRU configuration shown in Figure 6 is a simple layout in
which a water jacket surrounds the exhaust tube of a power plant. Water is introduced
into the jacket using an inlet pipe situated on top of the WHRU. Water flows down the
jacket in a direction opposite to the exhaust gas flow, and exits the jacket through an
outlet pipe situated at the bottom. Heat energy from the exhaust gas is transferred to the
water through the exhaust tube. 16

One advantage of the water jacket configuration is the relative ease with which it
can be retrofitted on the existing exhaust tube. The water jacket configuration allows
existing exhaust tube dimensions to remain the same. There are also very little
requirements for redesign or modification of the exhaust gas system. Heat energy from
the exhaust gases is transferred to the heat transfer fluid in the water jacket through the
exhaust tube section. This WHRU configuration has the potential to be scalable or can be
constructed in a standard WHRU module and installed onto the required length of the
exhaust tube. Potentially, lesser modifications should be required to implement this due
to its simple design.
Figure 6. Schematic view of the counter-flow water jacket WHRU
configuration.
The water jacket configuration also provides easy access to the WHRU for
inspection and maintenance. In addition, no components were placed within the exhaust
17

tube. This avoided additional blockage or back pressure which could affect engine
performance and operation.
The water jacket configuration allows the layout and configuration of the existing
exhaust gas system to remain unchanged, avoiding the need for any redesign of the
engine intake and exhaust system which could add cost and complexity to the WHR
implementation on existing systems. Based on these merits, the water jacket WHRU
configuration was eventually used for follow-on analytical and CFD modeling to
investigate the effect of exhaust tube L/d ratio, D/d ratio, coolant inlet and outlet
placements, exhaust gas swirling conditions, and tube materials (steel, copper, Inconel,
and ceramic) on heat recovery performance
The literature review conducted found numerous researches on how recovery
performance of concentric heat exchangers can be improved by adding swirl to the flow
within the tube. Swirls within the tube were generated using swirl generators, such as
helical inserts and fins within the flow, or snail entrance features as discussed earlier in
Durmus (2002); Akpinar (2006); Agrawal and Sengupta (1993); Khalil, Zohir, and Farid,
(2010); Kreith and Margolis (1959), Pardhi and Baredar (2012); Patel, Parmar, and Soni
(2014); Sane, Taji, and Pachegaonkar (2014); and Masliyah and Nandakumar (1976).
These enhancement techniques generally result in a pressure drop penalty that is higher
than the heat recovery improvements. Based on the background information, this thesis
proceeds to study how heat recovery, pressure drop, and temperature distributions within
water jacket exhaust gas WHRU are affected by water jacket inlet and outlet placements,
WHRU tube materials, or heat spreader features. Results from this study provide insight
into how problems affecting the performance and reliability of WHRUs can be resolved.
18

B. CFD MODEL SETUP AND GEOMETRY
The model used for the CFD studies is shown in Figure 7 through Figure 11.
Locations of inlets, outlets, and key parameters used to describe the WHRU geometry are
included in these figures. In order to facilitate wider application of the results, non-
dimensional analysis and non-dimensioned parameters were utilized and are discussed in
Chapter IV.
Figure 7. Isometric view of the CFD model used in the study.
Exhaust gas outlet
Water inlet
Water outlet
Exhaust gas inlet
19

Figure 8. Top view of CFD model defining radial orientation of measurements
locations.
3 o’clock (Right) 9 o’clock (Left)
6 o’clock (Front) Water inlet and outlet placement
12 o’clock (Back)
20

Figure 9. A 6 o’clock view of CFD model showing WHRU length (L) and
locations of water inlet and outlet.
Water outlet
Water inlet
L
y/L= 0.1
y/L= 0.1
21

Figure 10. Top view of CFD model defining the water jacket diameter (D),
jacket radius (R), exhaust tube diameter (d), and water inlet and outlet diameter (dwater).
dwater
d
D
x* = x/R
R
22

Figure 11. A 3 o’clock view of CFD model defining locations of water inlet and
outlet.
Water inlet
Water outlet
L
23

THIS PAGE INTENTIONALLY LEFT BLANK
24

IV. GOVERNING EQUATIONS, NON-DIMENSIONAL ANALYSIS AND CORRELATIONS
The governing equations for continuity, momentum, and energy transport and
conservation used for the CFD modeling are stated in this chapter. These equations are
built into the algorithm of ANSYS-CFX. Additional information on the governing
equation can be obtained from (ANSYS, 2013). Subsequently, non-dimensional analysis
was conducted using the Buckingham Pi Theorem in order to reduce and identify the
important parameters affecting heat recovery and pressure drop. In order for the studies to
be applicable over a wider range of variables, parameters in this study have been non-
dimensioned. Finally, the correlations used for the estimation of heat recovery and
pressure in the water jacket WHRU are discussed.
A. GOVERNING EQUATIONS
The governing equations for mass, momentum, and energy transport used by
ANSYS-CFX are shown here (ANSYS, 2013).
Continuity Equation
.( ) 0U
tρ ρ∂+∇ =
∂
(1)
Momentum Equations
( ) ( ) . M
U U U p Stρ
ρ τ∂
+∇ ⊗ = −∇ +∇ +∂
(2)
Thermal Energy Equation
( ) .( ) .( ) : Eh Uh k T U p U S
t tρ ρ ρ τ∂ ∂
+ +∇ = ∇ ∇ + ∇ + ∇ +∂ ∂
(3)
where:
25

SE and SM are energy and momentum sources. For this study, no sources were
present.
U
is the velocity vector and is defined as:
x
y
z
uU u
u
=
(4)
τ is the stress tensor related to the strain rate by the following:
2( ( ) )3
TU U Uτ µ δ= ∇ + ∇ − ∇
(5)
and in equation (2)
( ) ( ) ( )
( ) ( ) ( ) ( )
( ) ( ) ( )
x x y x z x
x y y y z y
x z y z z z
U U U U U Ux y z
U U U U U U U Ux y z
U U U U U Ux y z
ρ ρ ρ
ρ ρ ρ ρ
ρ ρ ρ
∂ ∂ ∂+ + ∂ ∂ ∂
∂ ∂ ∂∇ ⊗ = + + ∂ ∂ ∂
∂ ∂ ∂+ + ∂ ∂ ∂
(6)
where : Uτ ∇
is the viscous dissipation which models the internal heating caused by
viscosity in the fluid.
B. NON-DIMENSIONAL ANALYSIS
Numerous parameters affect heat recovery and exhaust gas side pressure drop. In
order to reduce and identify the important parameters to the study, non-dimensional
analysis was conducted using the Buckingham Pi Theorem. The geometry of the water
jacket WHRU configuration was simplified using the layout shown in Figure 12 and was
used as the basis for non-dimensional analysis.
26

Figure 12. Water jacket WHRU configuration used for non-dimensional
analysis.
1. Non-dimensional Exhaust Gas Side Pressure Drop
An estimation of pressure drop in the exhaust gas side is crucial as it translates
directly to exhaust back pressure to the heat engine upstream. The pressure drop for the
constant diameter exhaust tube was estimated using existing correlations for fluid flow in
a pipe. Pressure loss (∆P) in the exhaust tube for steady state flow is a function (ϕ) of the
following parameters:
( , , , , , )P D d U Lφ µ ρ∆ = (7)
The dimensions of the aforementioned parameters are expressed in three basic
dimensions, Force (F), Length (L) and Time (T), as shown in Table 1.
Table 1. Summary of parameters used for non-dimensional pressure loss analysis.
Parameters Symbols Dimensions Pressure loss ∆P FL-2 Jacket diameter D L Tube diameter d L Length of WHRU L L Average fluid velocity U L T-1 Fluid dynamic viscosity µ FL-2T Fluid density ρ FL-4T2
Exhaust gas in Heated water out
Exhaust gas out Heated water in
27

The Buckingham Pi Theorem, the seven parameters in Equation (7), and three
basic dimensions are used to generate four Pi numbers.
*1 2
P PU
πρ∆
= = ∆ (8)
2Dd
π = (9)
3Ld
π = (10)
4
1ReeffUD
µπρ
= = (11)
where effD for the exhaust tube is d, and (D – d) for the water jacket.
The non-dimensional pressure drop ( *P∆ ) is a function (ϕ) of the parameters
shown here:
*2
1( , , )Re
P D LPU d d
φρ∆
∆ = = (12)
This also happens to be the reciprocal of the Euler number which characterizes
the ratio of local pressure drop to dynamic pressure due to fluid friction in conduits
(Yarin, 2012). A Euler number of 1 corresponds to a perfect frictionless flow. As such,
lower *P∆ values correspond to lower pressure drops and are influenced by D/d, L/d, and
the Reynolds number of the flow.
Another useful form of non-dimensional pressure drop given by Munson, Young,
Okiishi, and Huebsch (2009) is shown in Equation (13). It is a ratio of pressure to viscous
force and is useful during the investigation of flows at features which involve abrupt
changes in geometries such as inlets and outlets.
** effPDP
Uµ∆
∆ = (13)
28

2. Non-Dimensional Heat Recovery (Based on Exhaust Gas Side)
The steady state heat recovery rate (qexh) at the gas side for the water jacket
WHRU is a function (φ) of the following parameters:
,( , , , , , , k , , , )exh exh exh p exh exh exh exh waterq D d L C U T Tφ ρ µ= (14)
The dimensions of the above parameters expressed in four basic dimensions,
Mass (M), Length (L), Time (T) and Temperature (θ) are shown in Table 2.
Table 2. Summary of parameters used for non-dimensional heat transfer (q*).
Parameters Symbols Dimensions Heat transfer qexh ML2T-3 Density of exhaust gases ρexh ML-3 Water jacket diameter D L Exhaust tube diameter d L Length of heat exchanger L L Dynamic viscosity of exhaust gases
µexh ML-1T-1
Constant pressure specific heat capacity of exhaust gas
Cp,exh L2T-2 θ -1
Thermal conductivity of exhaust gas
kexh MT-3L θ -1
Mean velocity of exhaust gas flow
exhU L T-1
Temperature of exhaust gas Texh θ Temperature of water Twater θ
29

Using the 11 parameters listed in Equation (14) and four basic dimensions, seven
Pi numbers were generated and are shown here:
1 2 3exh
exh exh
qd U
πρ
= (15)
2Ld
π = (16)
3Dd
π = (17)
41
Reexh
exh exh exhdUµπ
ρ= = (18)
,5 2
p exh exh
exh
C TU
π = (19)
6 3
exh exh
exh exh
k TdU
πρ
= (20)
7 3exh water
exh exh
k TdU
πρ
= (21)
Therefore, the non-dimensional heat transfer equation is expressed as follows:
,2 3 2 3 3( , , , , , )p exh exhexh exh exh exh exh water
exh exh exh exh exh exh exh exh exh
C Tq k T k TL DfD U d d dU U dU dU
µρ ρ ρ ρ
= (22)
2
6 35 , , ,
1 1 1Pr Re
exh exh exh exh exh exh
exh exh p exh exh p exh exh exh p exh exh exh exh exh exh
k T U k kdU C T C dU C dU
µππ ρ ρ µ ρ
= = = = (23)
Multiplying 6π with the reciprocal of 5π gives a combination of the reciprocal of
the Prandtl number and Reynolds number. The Prandtl number compares the momentum
and thermal diffusivity of the fluid, while the Reynolds number compares inertia force to
the friction forces of the fluid. 30

Multiplying 1π with the reciprocal of 5π results in the non-dimensional heat
transfer rate, q*:
2
*1 2 3 2
25 , , ,,
1 4 4
4
exh
exh exh exh exh exh exh exh exh exhexh exh exh exh
exh p p g pp
q qUq qqD U C T D U C T m C TD U C T
π π
π ππ ρ ρ ρ= = = = =
(24)
The non-dimensional heat recovery is a function of the following parameters
shown as follows:
*
,
14 ( , , , Pr )Re exh
exh p exh exh exh
q L Dq fm C T d d
π
= =
(25)
I subsequently expressed the non-dimensional heat recovery as a percentage of
maximum recoverable heat energy for the given temperature based effectiveness - NTU
method in Incropera, Bergman, Lavine, and Dewitt (2011) for better insight into the heat
recovery performance. The equation is defined as:
, , ,
*( )
exh
exh p exh exh in water in
qqm C T T−
=
(26)
C. NON–DIMENSIONAL PARAMETERS
In order to allow results of the study to be applicable for a wide range of geometry
and parameters of corresponding models, parameters and variables are non-dimensioned.
This also allows the number of experimental runs or analyses to be reduced through
application of similitude without the restrictions of physical units. In addition, non-
dimensioned parameters provide insights into the relative significance of one parameter
over another.
31

In order to define horizontal positions with respect to radius (R) of the WHRU
jacket along the X coordinate, the following non-dimensional parameter was used.
* xxR
= (27)
Similarly, to define horizontal positions with respect to radius (R) of the WHRU
jacket on the Z-coordinate, the following non-dimensional parameter was used.
* zzR
= (28)
In order to define the vertical position with respect to the WHRU length (L), the
following non-dimensional parameter was used.
* yyL
= (29)
Thickness (t) of the materials such as the tube wall is also non-dimensioned with
respect to the tube diameter (d) via the following expression:
* ttd
= (30)
The following is the non-dimensional parameter of the jacket diameter (D) with
respect to the exhaust tube (d) which is kept unchanged throughout the study. This
parameter is used to study the effect of geometry on heat recovery and pressure losses.
* Ddd
= (31)
32

Another non-dimensional parameter used in this research to study the effect of
geometry is the WHRU length to the tube diameter ratio.
* LLd
= (32)
Temperature is non-dimensioned against the difference between the inlet
temperatures of the exhaust gas (Texh,in) and water (Twater,in), and is defined as:
,*
, ,
water in
exh in water in
T TT
T T−
=−
(33)
Therefore T* = 1 at the exhaust gas inlet, and T* = 0 at water inlet.
The thermal conductivity of fluids and solids used in the study was non-
dimensioned against the thermal conductivity of air; kc,air = 0.0261 W/mK and is obtained
from the ANSYS material model used for CFD modeling. The non-dimensional thermal
conductivity is defined in Equation (34).
*
air
kkk
= (34)
The Reynolds number gives the ratio of inertia to viscous forces. For a circular
tube, it is defined as:
4Re eff
eff
UD mD
ρµ πµ
= =
(35)
where effD for the exhaust tube is the diameter (d). For the water jacket, effD is the
difference (D - d) between the jacket diameter (D) and exhaust tube diameter (d) for the
water jacket.
33

The ratio of Reynolds number of water to exhaust gas flow is shown here:
ReReRe
water
exh
R = (36)
The Prandtl number (Pr) of a fluid compares the momentum to thermal
diffusivities, relating the momentum and thermal boundary layers, and is defined as:
Pr pCk
µ υα
= = (37)
where υ = momentum diffusivity [m2/s] and α = Thermal diffusivity [m2/s].
In heat transfer, the Prandtl number of the fluid represents the relative thickness of
the momentum and thermal boundary layers. A fluid with a Prandtl number less than one
is thermal diffusivity dominant. Heat is diffused faster compared to the velocity
(momentum) of the fluid. Air and exhaust gases values around 0.7 to 0.8. Momentum
diffusivity dominates when the Prandtl number is higher than one. This is the case in
liquid such as water or oil. At 300K degrees Celsius, water has a Prandtl number of
around 5.8. As a reference, commercial heat transfer fluids such as Paratherm HR™
(Paratherm, n.d.) have a Prandtl number of about 450.
34

D. NUSSELT NUMBER CORRELATION
The Nusselt number (Nu) is the ratio of convection to pure conduction heat
transfer and is defined in Equation (38).
effhDNu
k= (38)
Different Nusselt number correlations exist for different flow regimes and shape
of conduits. The flow for this study involves turbulent flow in circular tubes and circular
annulus. The Gnielinski correlation which is valid for 0.5 < Pr < 2,000 and 3,000 < ReD <
5x10⁶ was used to estimate the turbulent flow Nusselt number for both water and exhaust
gas flow in this study. The correlation is defined as:
1/2 2/3
( / 2)(Re 1000) Pr1 12.7( / 2) (Pr 1)
bfNuf
−=
+ − (39)
where f is the “Filonerko Fanning friction factor” from page 133 of Kakac and Liu
(2002). It is used to estimate the friction factor for turbulent flow for circular conduits.
The correlation is valid for 3,000 < Re <106 and is defined as:
2[1.58 (Re) 3.28]f Ln −= − (40)
where f decreases with increasing Reynolds number as plotted in Figure 13.
35

Figure 13. “Filonerko Fanning friction factor” versus Reynolds number
(applicable for both water or exhaust gas flow).
E. PRESSURE LOSS ESTIMATION
The study assumed the surfaces in the WHRU to be smooth. The smooth line
correlation shown in Equation 41 is used to estimate the pressure drop in the circular
pipes and annulus; f is obtained using the “Filonerko fanning friction factor” discussed
earlier. During actual operation, roughness increases the friction factor and needs to be
taken into account.
22 m
eff
fL UPDρ
∆ = (41)
00.0010.0020.0030.0040.0050.0060.0070.0080.009
1.E+03 1.E+05 1.E+07 1.E+09 1.E+11 1.E+13
Fann
ing
Fric
tion
Fact
or (f
)
Reynolds Number
Fanning Friction Factor Versus Reynolds Number
36

F. HEAT RECOVERY ESTIMATION (USING EFFECTIVENESS-NTU METHOD)
The effectiveness- NTU (ε-NTU) method was used to estimate the heat recovery
in analytic models (Incropera, Bergman, Lavine, & Dewitt, 2011). In the study, the heat
capacity of the exhaust gas (Cexh) is smaller than the water (Cwater) and is assigned as the
minimum heat capacity (Cmin). The maximum possible heat recovery rate in the WHRU
is estimated using Equation (42).
max min , ,( )exh in water inq C T T= − (42)
The effectiveness (ε) of the heat recovery is defined as:
, ,out , ,
max min , ,in min , ,in
( ) ( )( ) ( )
h exh in exh h water out water in
exh in water exh in water
C T T C T Tqq C T T C T T
ε− −
= = =− −
(43)
The effectiveness relationship for counter flow and parallel flow is a function of
the NTU and Cr and is shown in Equation (44) and Equation (45). Cr is ratio of minimum
heat capacity to maximum heat capacity.
1 exp[ NTU(1 C )][1 exp[ NTU(1 C )]
rcounterflow
r rCε − − −
=− − −
(44)
1 exp[ NTU(1 C )][1 ]
rparallel
rCε − − +
=+
(45)
NTU is calculated based on the overall heat transfer coefficient ( overallU ),
minimum heat capacity, and heat exchange area.
min
overallU ANTUC
=
(46)
where the overall heat transfer coefficient is estimated using the heat transfer coefficient
equation shown in Equation (47). In order to simplify the calculations, no thermal
resistance from fouling was considered. The contribution from the thermal conductivity
37

of the tube wall was also neglected due to the relatively small contribution (Incropera,
Bergman, Lavine, & Dewitt, 2011).
The overall heat transfer coefficient is influenced primarily by the exhaust gas
heat transfer coefficient.
tube
1 1 1
overall exh water
tU A h A k A h A
= + +
(47)
Once the NTU is obtained, the effectiveness is calculated and the actual heat
recovery for each case is then calculated using Equation (48).
min , ,( )exh in water inq C T Tε= − (48)
38

V. ANALYTICAL STUDY
An analytical study was used to estimate of the amount of heat recovery and
pressure drop for the water jacket WHRU using correlations and methods discussed in
Chapter IV. The estimates were calculated based on exhaust tube dimensions and exhaust
gas flow conditions of the USMC’s MEP803A DG and USN’s 501-K17 SSTG over a
range water jacket to exhaust tube diameter ratio (D/d), Length to exhaust tube ratio
(L/d), and Exhaust Reynolds number. Results from the estimates provide insight into the
effects of WHRU geometry on heat recovery and pressure loss performance.
Calculations were made over a D/d range from 1.3 to 3.3 with exhaust tube
diameter (d) kept constant while the water jacket diameter was varied. This is equivalent
to retrofitting an existing exhaust tube with water jacket WHRUs of different diameters.
WHRU L/d was varied from 5 to 1000. Similarly, WHRU length was varied while the
tube diameter was held constant.
Calculations were made using an exhaust gas Reynolds number of 20,000 to
400,000 which covers the range expected from USMC’s MEP803A DGs and USN’s
501K SSGTGs. Constant exhaust gas and water inlet temperatures of 773K and 300K
were used and are representative of parameters that would be expected during operations.
Non-dimensional parameters such as heat recovery (q*) and exhaust pressure drop (ΔP*)
were used to present the results.
39

A. ASSUMPTIONS AND IDEALIZATIONS FOR ANALYTICAL STUDY
In order to facilitate the analytical study, the following assumptions and
idealizations were used (Shah & Sekulic, 2002):
• steady state
• negligible heat losses to the surrounding
• no heat sinks or sources in the WHRU tube wall or fluids
• fluid temperature is uniform over every flow cross section
• no phase changes of the heat transfer fluid flowing through the WHRU
• fluid properties of each fluid are constant throughout the WHRU
• entry velocity and temperature to the WHRU on the fluid side are uniform
• fluid and overall heat transfer coefficients are constant (independent of temperature, time, and position) throughout the WHRU
• heat transfer surface area is distributed uniformly on each fluid side
• the fluid flow rate is uniformly distributed through the WHRU on each fluid side. No uneven flow, flow stratification, flow bypassing, or flow leakages occur in either the exhaust or water stream. The flow condition of either fluid domain is characterized by the mean velocity at any cross section.
• longitudinal heat conduction in the fluid and in the wall is negligible only 1-D heat conduction
The analytical model was not able to account for the effects due to water inlet and
outlet locations, tube thermal conductivity, exhaust swirl, or other design features such as
heat spreaders.
40

B. EFFECT OF GEOMETRY ON WHRU PERFORMANCE
This section investigates how heat recovery and pressure drop were affected by
the geometry of the water jacket WHRU. Two non-dimensional geometric variables were
varied to achieve this. The variables were the water jacket-to-exhaust tube diameter ratio
(D/d) and WHRU length-to-exhaust tube diameter ratio (L/d). Exhaust tube diameter (d)
was held constant while the D and L were varied.
1. Effect on Non-dimensional Heat Recovery (q*)
The effects of L/d, D/d, and exhaust Reynolds number on heat recovery are
presented in Figure 14 through Figure 19. Non-dimensional heat recovery (q*) from D/d
= 1.11 to 3.33 and L/d ratios from 5 to 1,000 were evaluated at exhaust Reynolds number
of 2,000, 200,000, and 400,000. This allowed a study on the effect of geometry on heat
recovery at exhaust flow corresponding to USMC DG at rated condition, USN SSGTG at
50% rated condition, and 100% rated condition. These results are plotted in Figure 14
through Figure 16.
The heat recovery results were also presented from another perspective in Figure
17 through Figure 19. Heat recovery results from L/d ratios ranging from 5 to 1,000, and
exhaust gas Reynolds numbers ranging from 20,000 to 400,000 were calculated at D/d
ratios of 1.25, 1.54, and 2.0. This allowed the effect of L/d and exhaust Reynolds number
to D/d ratios to be compared.
Generally heat recovery increases with higher L/d ratio due to greater area
available for heat transfer. Figure 17 through Figure 19 presents the effect of L/d on heat
recovery performance over the range of exhaust gas Reynolds number at three different
D/d ratios. Highest heat recovery (q*) was achieved for a WHRU with the highest L/d
ratios. The maximum possible heat recovery was achieved if the length of the WHRU
was long enough, i.e., L/d=1,000. However, once the maximum heat recovery is achieved
(q*=1), further increase of WHRU length did not improve the heat recovery. On the
contrary, additional pressure drop at the exhaust gas side was incurred. This causes back
pressure, negatively impacting the performance and fuel consumption of the power plant
upstream.
41

In addition, water jacket WHRU with high L/d ratios may not be feasible due to
space constraints onboard ships or out in the battlefield. Similarly a D/d ratio which is too
low would also result in excessively high pressure drop in the water side.
In general, smaller D/d ratios improve heat recovery. This is shown in Figure 14
through Figure 16. The WHRU with a smaller D/d ratio has smaller spaces in the water
jacket, which results in better heat transfer between the exhaust tube wall and the water.
An interesting trend observed is that heat recovery at Reexh = 20,000 shown in
Figure 14 shows that L/d ratio improved heat recovery more quickly compared to a
decrease in D/d ratios. This result is applicable to circumstances pertaining to USMC’s
DG. However, at the high exhaust Reynolds number of 400,000 shown in Figure 16 heat
recovery improvement due to D/d reduction increased more rapidly. As such, a low D/d
ratio would result in better heat recovery improvement in a WHRU for the USN SSGTG
than for the USMC DG. It was also observed that q* increased more sharply at D/d less
than two.
Figure 14. Comparison of non-dimensional heat transfer (q*) at exhaust gas
Reynolds number = 20,000 for D/d from 1.3 to 3.3 and L/d from 5 to 1,000.
0.0
0.2
0.4
0.6
0.8
1.0
1.2
1.0 1.5 2.0 2.5 3.0 3.5
Non
Dim
ensi
onal
Hea
t Tra
nsfe
r(q*
)
D/d
L/d = 1000
L/d = 100
L/d = 20
L/d = 10
L/d = 5
42

Figure 15. Comparison of non-dimensional heat transfer (q*) at exhaust gas
Reynolds number = 200,000 for D/d from 1.3 to 3.3, and L/d from 5 to 1,000.
Figure 16. Comparison of non-dimensional heat transfer (q*) at exhaust gas
Reynolds number = 400,000 for D/d from 1.3 to 3.3, and L/d from 5 to 1,000.
0.0
0.2
0.4
0.6
0.8
1.0
1.2
1.0 1.5 2.0 2.5 3.0 3.5Non
Dim
ensi
onal
Hea
t Tra
nsfe
r(q*
)
D/d
L/d = 1000
L/d = 100
L/d = 20
L/d = 10
L/d = 5
0.0
0.2
0.4
0.6
0.8
1.0
1.2
1.0 1.5 2.0 2.5 3.0 3.5Non
Dim
ensi
onal
Hea
t Tra
nsfe
r (q*
)
D/d
L/d = 1000
L/d = 100
L/d = 20
L/d = 10
L/d = 5
43

Figure 17. Comparison of non-dimensional heat transfer (q*) at D/d= 2 for L/d
from 5 to 1000, Reexh from 20,000 to 400,000.
Figure 18. Comparison of non-dimensional heat transfer (q*) at D/d= 1.54 for
L/d from 5 to 1,000, and Reexh from 20,000 to 400,000.
0.0
0.2
0.4
0.6
0.8
1.0
1.2
10,000 100,000 1,000,000
Non
Dim
ensi
onal
Hea
t Tra
nsfe
r (q*
)
Exhaust Reynolds Number
L/d = 1000
L/d = 100
L/d = 20
L/d = 10
L/d = 5
0.0
0.2
0.4
0.6
0.8
1.0
1.2
10,000 100,000 1,000,000
Non
Dim
ensi
onal
Hea
t Tra
nsfe
r (q*
)
Exhaust Reynolds Number
L/d = 1000
L/d = 100
L/d = 20
L/d = 10
L/d = 5
44

Figure 19. Comparison of non-dimensional heat transfer (q*) at D/d= 1.25 for
L/d from 5 to 1,000, and Reexh from 20,000 to 400,000.
2. Effect on Non-dimensional Pressure Drop (ΔP*) Performance
With the exhaust tube diameter (d) being held constant, the exhaust gas side
pressure drop is only dependent on L/d ratio and exhaust gas Reynolds number. The
results of the analytical calculations are shown in Figure 20. The non-dimensional
pressure drop, exhaust Reynolds number, and L/d ratios exhibit a linear relationship when
plotted on a log-log scale.
0.0
0.2
0.4
0.6
0.8
1.0
1.2
10,000 100,000 1,000,000
Non
Dim
ensi
onal
Hea
t Tra
nsfe
r (q*
)
Exhaust Reynolds Number
L/d = 1000
L/d = 100
L/d = 20
L/d = 10
L/d = 5
45

Figure 20. Comparison of non-dimensional heat transfer (q*) at D/d= 1.25, L/d
from 5 to 1,000, and Exhaust Gas Reynolds Number from 20,000 to 400,000.
3. Limitations of Analytical Study
The analytical study was able to generate heat recovery and pressure drop results
over a wide range of WHRU L/d, D/d ratios, and exhaust gas Reynolds numbers. These
results provided an understanding of how WHRU performance (heat recovery and
exhaust side pressure drop) are affected by changes in WHRU geometry and exhaust
Reynolds number. However, the analytical study was unable to provide any resolution of
the temperature profiles within the WHRU. The analytical model was also unable to
account for the effects due to water inlet and outlet locations, tube thermal conductivity,
exhaust swirl, or other design features such as a heat spreader. These limitations were
resolved by the use of CFD modeling and will be discussed in Chapter VI.
0.01
0.10
1.00
10.00
100.00
10,000 100,000 1,000,000
Non
-dim
ensi
onal
Pre
ssur
e Dr
op (∆
P*)
Exhaust Reynolds Number
Effect of L/d on Exhaust ∆P* (L/d = 5 to 1000)
L/d =1000
L/d =100
L/d =20
L/d =10
L/d = 5
46

4. Range of L/d Ratio, D/d Ratio and Exhaust Reynolds Number for CFD Study
Given the space constraints onboard ships and dimensions of exhaust tubes,
WHRUs with L/d of 100 or 1,000 may not be feasible. As such, more realistic L/d ratios
of 5, 10, and 20 were used in this study using CFD. The CFD models were based on a
D/d ratio of 1.25. The exhaust gas Reynolds number of 20,000 to 400,000, reflective of
the exhaust flow in the USN SSGTG and USMC DG, was used.
47

THIS PAGE INTENTIONALLY LEFT BLANK
48

VI. COMPUTATIONAL FLUID DYNAMICS (CFD) MODEL ANALYSIS
The ANSYS-CFX CFD package was used for the CFD study. CFD models for
WHRU with D/d = 1.25 and tube thickness of t* = 0.0625 were constructed and used to
investigate the effects of L/d and other WHRU features on heat recovery, pressure drop
performance, and temperature profiles within the WHRU. The exhaust Reynolds number
and water Reynolds number for the runs ranged from 20,000 to 400,000. The water
Reynolds number was held constant at 8,300. Inlet exhaust temperature and inlet water
temperature were kept constant at Texh,in = 773K and Twater,in = 300K, respectively. The
corresponding non-dimensional temperatures were T* = 1 and T*= 0, respectively, and
represented the maximum and minimum temperatures in the study.
A. ANSYS-CFX RUNS
An overview of the ANSYS-CFX runs is tabulated in 0A sample of setup, inputs,
and outputs for the CFD model run 4 are provided in Appendix A.
49

Table 3. Overview of CFD runs conducted in ANSYS-CFX (D/d=1.25, t* = 0.0625)
Run No. L/d
Exhaust Swirl
condition
Water inlet/outlet placement
Reexh Rewater Tube
Material Added Feature
1 2 3 4
10 No Swirl Center line
20,000 100,000 200,000 400,000
8,300 Steel Nil
5 6 7 8
5 No Swirl Center line
20,000 100,000 200,000 400,000
8,300 Steel Nil
9 10 11 12
20 No Swirl Center line
20,000 100,000 200,000 400,000
8,300 Steel Nil
13 14 15 16
10 Axial +
Tangential Velocity
Center line
20,000 100,000 200,000 400,000
8,300 Steel Nil
17 18 19 20
10
Axial + Tangential +
Radial Velocity
Center line
20,000 100,000 200,000 400,000
8,300 Steel Nil
21 22 23 24
10 No Swirl Center line
20,000 100,000 200,000 400,000
8,300 Steel
Steel heat spreader of
y/L=0.1 placed at
exhaust gas inlet
25 26 27 28
10 No Swirl Center line
20,000 100,000 200,000 400,000
8300 Inconel 625 Nil
29 30 31 32
10 No Swirl Center line
20,000 100,000 200,000 400,000
8300 Copper Nil
33 34 35 36
10 No Swirl Center line
20,000 100,000 200,000 400,000
8300 Pyroceram Nil
37 38 39 40
10 No Swirl
Inlet at x/R=0.8,
Outlet at x/R= -0.8
20,000 100,000 200,000 400,000
8,300 Steel Nil
41 42 43 44
10 No Swirl
Inlet and outlet on opposite
sides of Center line
20,000 100,000 200,000 400,000
8,300 Steel Nil
50

Each ANSYS model is made up of three domains. Two fluids domains were used
to model the exhaust gas flow in the tube and the water flow in the water jacket
respectively. A solid domain was used to model the exhaust tube section between the
water and exhaust gas.
The domains were first created using SOLIDWORKS and then imported into
ANSYS-CFX as “Parasolids” for assembly, meshing, and pre-solver setup using different
modules within ANSYS-CFX. Details of specific domains and boundary conditions were
defined in the pre-solver module through the assignment of different material models,
and fluid and thermal properties. The “Ideal Air model” sub-model was used to model the
exhaust gas, while the “water at 25o C” sub-model was used to model the water domain.
The “Steel” material model was used for the solid WHRU tube. After setup, the CFD
models were sent to the CFX-Solver for solution.
Upon successful solution (achieving target residual), parameters such as
temperatures, velocity, and pressures were generated using the CFX-Post’s function
calculator. Sampling points were also assigned to specific locations or a specific profile,
i.e., along the tube length at the “3 o’clock” position, to obtain local measurements of
parameters such as temperature. Parameters such as fluid inlet and outlet temperatures
and pressure were also exported to MS EXCEL for follow-on calculation and plotting of
heat transfer, pressure loss, and pumping power.
1. Model Meshing
The models were meshed using ‘Automatic Meshing method’ and ‘Program
Controlled Inflation’ options with nine inflation layers. Figure 21 shows a screen shot of
the settings in CFX-Meshing. The summary of the mesh sizes for the various models is
shown in 0
51

Figure 21. Screen shot of completed meshing in CFX-Meshing for “Baseline”
model using automatic meshing method and program controlled inflation settings.
52

Table 4. Meshing details of various ANSYS-CFX models.
Model Name
Total Nodes
Total elements
Water Domain Nodes
Water Domain
Elements
Tube Domain Nodes
Tube Domain
Elements
Exhaust Domain Nodes
Exhaust Domain
Elements Baseline
531,790 1,206,992 386,297 981,704 34,733 121,110 110,760 104,178
Swirl_A
Swirl_B
Baseline_I
nconel625
Baseline_
Copper
Baseline_
Pyrocera
m
LD_5 436,251 1,018,979 347,791 887,850 18,978 65,363 69,482 65,766
LD_20 572,162 1,317,430 306,322 886,254 68,208 245,991 197,632 185,185
Shift 561,818 128,515 416,325 105,986 34,733 121,110 110,760 104,178
Baseline_
Slug 544,070 1,233,127 386,190 981,969 45,316 145,723 112,564 105,435
Opposite 523,936 1,187,963 378,453 962,667 34,723 121,118 110,760 104,178
2. Heat Transfer Model
Heat transfer is modeled between the exhaust, water, and the WHRU tube domain
using the ANSYS-CFX’s “Thermal Energy” model, which models the transport of
enthalpy through the fluid domain using conduction and convection. The Total Energy
model was not selected because viscous heating was not expected to be significant in this
study.
3. Turbulence Model
The standard K-epsilon (K-ε) model in ANSYS-CFX was used to model the
turbulence for all the runs. This model is based on the Reynolds Averaged Navier-Stokes
(RANS) and is widely accepted and implemented for turbulence modeling (Patankar,
1980). The K-ε model is known to be stable, accurate, and numerically robust, and is 53

considered to be the standard model in the CFD industry. The K-ε model in CFX also
uses the scalable wall-function approach which allows solutions on arbitrarily fine near-
wall grids to be made. This increased robustness and accuracy of the solutions over
standard wall functions (ANSYS, 2013).
B. MODEL VALIDATION AND SENSITIVITY ANALYSIS
All models were validated by ensuring the overall mass and the energy entering
and leaving the controlled surfaces (inlets and outlets) were balanced. In all the cases,
energy balances better than 0.019% were achieved. The worst case had an energy
imbalance of less than 0.045%. The details of the energy balance of the all the CFD
model runs are collated in Appendix B.
Mass averaged values of inlet and outlet temperatures, specific heat capacity, and
mass flow rates were used to verify conservation of mass within the controlled volume. A
sensitivity analysis was conducted to find out the effect of different meshing size and
solver target residual error value on the result accuracy of energy balance and the
resolution. Runs using three meshing levels (250,000, 500,000, and 1,500,000 nodes) and
three levels of CFX solver target residual error values (1E-4, 1E-5, and 1E-6) were
conducted using a model with L/d =10, D/d= 1.25, t/d=0.0625 subjected to the same fluid
flow conditions. No significant improvement in accuracy for output parameters and
energy balance were found when the higher residual error values of 1E-6 were used over
1E-5. Models using a meshing size of 1,500,000 nodes provided slightly better resolution
in temperatures contours and profiles than models with 500,000 nodes. The model with
250,000 nodes provided the least resolution in terms of contours but took the least
amount of time to achieve solution convergence. The models with increasing mesh sizes
took increasing amounts of time run. CFD models with a meshing size of 500,000 nodes
and solver residual target error value of 1E-6 offered optimum balance of accuracy,
resolution, and processing time.
In addition to validation using mass and energy balance, the results from the CFD
models were validated using the corresponding results from the analytical models. The
results are compared in Table 5 and plotted in Figure 22. Generally, the heat recovery
54

results from the CFD and analytical models agree. They exhibited the same trend and are
within the same orders of magnitude. Higher q* is achieved at higher L/d and a lower
exhaust Reynolds number. At higher Reynolds numbers of 400,000, q* from the CFD
models is 6% to 26% lower than the results obtained from analytical models. At lower
Reynolds numbers of 20,000, q* from the CFD models are 6% to 24% higher than in
analytical models.
As a whole, a difference of up to 26% exists between the results from the CFD
and analytical model. The difference increased with higher L/d ratio and Reynolds
numbers. However, it is not unreasonable to expect some differences between the CFD
and analytical models, considering the simplifications and assumptions associated with
the analytical model. The difference between the water inlet and outlet placements of the
CFD and analytical models could also contribute toward the difference. One also needs to
keep in mind that uncertainty of approximately +10% also exists in the analytical
correlations used in Incropera, Bergman, Lavine, and Dewitt (2011), and Kakac and Liu
(2002). The range of uncertainty is also included in Figure 22 for reference.
Table 5. Comparison of non-dimensional heat recovery (q*) between analytical and CFD models of L/d = 5, 10, 20; Reexh = 20,000, 200,000 to 400,000; D/d=1.25, t*=0.0625; no Exhaust swirl,
centerline water inlet/outlet placement, Rewater = 8,300.
L/d 5 10 20
Reexh CFD Analytical % Difference CFD Analytical %
Difference CFD Analytical % Difference
20,000 0.089 0.071 24% 0.154 0.138 12% 0.272 0.256 6%
200,000 0.041 0.040 2% 0.070 0.078 -10% 0.126 0.149 -16%
400,000 0.030 0.032 -6% 0.050 0.063 -21% 0.090 0.122 -26%
55

Figure 22. Comparison of non-dimensional heat recovery (q*) between
analytical and CFD models of L/d = 5, 10 and 20 with Reexh from 20,000 to 400,000. D/d=1.25, t*=0.0625; no exhaust swirl, centerline
water inlet and outlet placement with Rewater = 8,300.
1. Effect of WHRU Length to Tube Diameter Ratio on Non-dimensional Heat Recovery
The effects of WHRU length on non-dimensional heat recovery (q*), pressure
drop (ΔP*), and WHRU tube temperatures were investigated using CFD models with L/d
ratios of 5, 10, and 20. A constant D/d ratio of 1.25 was maintained. The model runs were
conducted at exhaust gas Reynolds numbers ranging from 20,000 to 400,000. This range
was used as it covered the type of exhaust flow regime expected in USMC MEP 803A
DG and USN 501K SSGTG. Figure 22 illustrates the effect of the three L/d ratios on q*
with all other parameters kept similar. Higher q* was achieved at higher L/d for the same
0
0.05
0.1
0.15
0.2
0.25
0.3
- 50,000 100,000 150,000 200,000 250,000 300,000 350,000 400,000
Non
-dim
ensi
onal
Hea
t Tra
nsfe
r (q*
)
Exhaust Gas Reynolds Number
Analytical CFD
L/d = 20
L/d =10
L/d = 5
+10% range of uncertainty associated with analytical models
56

Reynolds number. This was expected as more available area for heat transfer is available
with higher L/d. Using the model with L/d = 10 as benchmark, increasing L/d to 20
increased q* from 68% to 81%. Reducing L/d to 5 decreased q* from 41% to 46%.
2. Effect of WHRU Length to Tube Diameter Ratio on Non-Dimensional Pressure Drop (ΔP*)
Figure 23 illustrates the effect of different L/d on ΔP* with all other parameters
kept the same. For the same exhaust Reynolds number, higher ΔP* were encountered
with a WHRU with higher L/d. Using a WHRU with L/d = 10 as the baseline for
comparison, increasing L/d to 20 increased the ΔP* by 96%. A reduction of L/d to 5,
decreased ΔP* by 45%. This result was expected as frictional loss is proportional to
WHRU length.
It was also observed that ΔP* decreases as the exhaust Reynolds number
increases. For the all CFD models, ΔP* leveled off at Reynolds numbers of 150,000 to
200,000. This result was expected since the flow was modeled over smooth surfaces. This
trend can be explained by an inspection of the pressure loss equation in Chapter IV.E,
and the relationship between the Fanning friction factor and Reynolds number shown in
Figure 13.
57

Figure 23. Comparison of non-dimensional pressure drop (ΔP*) between
analytical and CFD models of L/d = 5, 10, 20; Reexh from 20,000 to 400,000; D/d=1.25, t*=0.0625, no exhaust swirl, centerline water
inlet/outlet placement, Rewater = 8,300.
0.01
0.10
1.00
10,000 100,000 1,000,000
Non
-dim
ensi
onal
Pre
ssur
e Dr
op (∆
P*)
Exhaust Reynolds Number
CFD Analytical
L/d= 20
L/d=5
L/d = 10
58

C. EFFECT OF L/D ON WHRU TUBE TEMPERATURE PROFILE
CFD models allowed temperature profiles in the WHRU to be examined. The
temperature profiles within WHRU models of L/d ratios of 5, 10, and 20 were compared
at exhaust Reynolds numbers ranging from 20,000 and 400,000, which correspond to the
flow regime expected in the exhaust stack of the USMC MEP801A DG and USN 501K
SSGTG. Temperatures were measured along the length of the WHRU tube at 3, 6, 9, and
12 o’clock positions as shown in Figure 24.
Figure 24. Isometric view showing locations where temperature measurements
are made on WHRU tube with reference to inlets and outlets of exhaust and water flow.
3 o clock
9 o clock
6 o clock (Water inlet and outlet side)
12 o clock
Exhaust gas in
Exhaust gas out
Water in
Water out
59

The temperatures were non-dimensionalized and normalized using the difference
of inlet temperatures of exhaust gas and water found in Equation (33). The non-
dimensionalized temperatures were plotted to gain insights into the longitudinal and
radial temperature distributions. The temperature profiles for L/d of 5, 10, and 20 are
shown in Figures 25, 27, and 29, respectively. The corresponding temperature contours
are shown in Figures 26, 28, and 30.
Figures 25, 27, and 29 show that the shape of the temperature profile is affected
by L/d ratios and exhaust Reynolds number. Generally higher exhaust gas Reynolds
numbers increase tube temperatures and amplify temperature differences. At Reexh of
400,000, the sharpest temperature gradients were observed.
For a WHRU with L/d = 5 (shown in Figure 25), the largest difference occurs at
the lower half of the WHRU where the exhaust inlet and water outlet are situated. The
tube temperature contours for model with L /d = 5 evaluated at Reexh = 400,000 are
shown in Figure 26. The adverse temperature profile between the 6 o’clock and 12
o’clock is clearly shown.
When L/d is increased to 10 (shown in Figure 27), this difference is most
prominent in the middle of the tube. The large temperature difference within the WHRU
is also shown in the plots in Figure 28.
For WHRU with L/d = 20 (shown in Figure 29), the most prominent temperature
differences occur at the upper end of the exhaust tube near the location of the exhaust
outlet and the water inlet. Temperature contours of a model with L/d=20 evaluated at
Reexh = 400,000 is shown in Figure 30. Once again adverse temperature profiles can be
seen in the temperature contours plots.
60

Figure 25. Tube temperature profile for WHRU of L/d= 5 at Reexh = 20,000 and
400,000, D/d=1.25, t*=0.0625, no exhaust swirl, centerline water inlet/outlet placement, Re water = 8,300.
0
0.1
0.2
0.3
0.4
0.5
0.6
-1.50 -1.00 -0.50 0.00 0.50 1.00 1.50
Non
-dim
ensi
onal
Tub
e Te
mpe
ratu
re (T
*)
Non-dimensional Position along Tube Length (y*)
Re exh = 400,000
Reexh = 20,000
6 o'clock (Water Inlet and Outlet)
6 o'clock (Water Inlet and Outlet)
12 o'clock
12 o'clock
Exhaust in Exhaust out
61

Figure 26. Tube temperature contours from 9 o’clock for WHRU with L/d = 5,
D/d=1.25, t*=0.0625 at Reexh = 20,000 and 400,000 with no exhaust swirl and centerline water inlet/outlet placement. Re water = 8,300.
Temperature contours showing adverse temperature differences in the WHRU tube
0.6 0.5 0.4 0.3 0.2 0.1
Water in
Water out
62

Figure 27. Tube temperature profile for WHRU with L/d = 10, D/d=1.25,
t*=0.0625 at Reexh = 20,000 and 400,000 with no exhaust swirl and centerline water inlet/outlet placement. Re water = 8,300.
0
0.1
0.2
0.3
0.4
0.5
0.6
0.7
-1.50 -1.00 -0.50 0.00 0.50 1.00 1.50
Non
-dim
ensi
onal
Tub
e Te
mpe
ratu
re (T
*)
Non-dimensional Position along Tube Length (y*)
Exhaust In Exhaust Out
6 o'clock (Water Inlet and Outlet)
6 o'clock (Water Inlet and Outlet)
12 o'clock
12 o'clock
63

Figure 28. Tube temperature contours from 9 o’clock for WHRU with L/d = 10,
D/d=1.25, t*=0.0625 at Reexh = 20,000 and 400,000 with no exhaust swirl and centerline water inlet/outlet placement. Re water = 8,300.
0.6 0.5 0.4 0.3 0.2 0.1
Temperature contours showing adverse temperature differences in the WHRU tube
Water in
Water out
64

Figure 29. Tube temperature profile for WHRU with L/d = 20, D/d=1.25,
t*=0.0625 at Reexh = 20,000 and 400,000 with no exhaust swirl and centerline water inlet/outlet placement. Re water = 8,300.
0
0.1
0.2
0.3
0.4
0.5
0.6
0.7
-1.50 -1.00 -0.50 0.00 0.50 1.00 1.50
Non
-dim
ensi
onal
Tub
e Te
mpe
ratu
re (T
*)
Non-dimensional Position along Tube Length (y*)
Reexh = 400,000
Reexh = 20,000
6 o'clock (Water Inlet and Outlet)
12 o'clock
12 o'clock
6 o'clock (Water Inlet and Outlet)
Exhaust Out Exhaust In
65

Figure 30. Tube temperature contours from 9 o’clock for WHRU with L/d = 20,
D/d=1.25, t*=0.0625 at Reexh = 20,000 and 400,000 with no exhaust swirl and centerline water inlet/outlet placement. Re water = 8,300
showing temperature contours of the WHRU tube from different angles.
D. TEMPERATURE PROFILE AT 6 O’CLOCK AND 12 O’CLOCK
One of the key findings of this study was revealed when the water streamline in
the water jacket was examined. The water streamlines shown in Figure 31 revealed the
flow within the water jacket to be highly uneven. Most of the water entering the water
jacket was channeled towards the 12 o’clock location, while minimum amount of water
was channeled to the 6 o’clock profiles. This caused uneven heat transfer and the adverse
temperature profile between the 6 o’clock and 12 o’clock profiles. Water flow along the 3
o’clock and 9 o’clock profiles were almost equal.
Temperature contours showing adverse temperature differences in the WHRU tube
0.6 0.5 0.4 0.3 0.2 0.1
Water in
Water out
66

Figure 31. Water streamlines depicting non-uniformity of water flow inside
water jacket of a WHRU of L/d =10, D/d=1.25 with centerline water Inlet/outlet placements at Rewater = 8,300.
The large temperature differences between the 6 o’clock and 12 o’clock profiles
were also observed for all three L/d ratios. This difference was the most pronounced at
Reexh=400,000. The 6 o’clock profile is also the side where the water inlet and outlet
were located. In order to facilitate comparison, the 6 o’clock and 12 o’clock temperature
profiles WHRU of for L/d = 5, 10, and 20 at Reexh of 400,000 are plotted in Figure 32.
Temperature contours showing adverse temperature differences due to uneven water flow distribution
Streamlines showing due to uneven water flow distribution between 6 and 12 o'clock profiles
67

Figure 32. Comparison of temperature profile at 6 o’clock and 12 o’clock at
Reexh = 400,000 for WHRU of L/d = 5, 10, and 20.
Adverse temperature profiles can give rise to localized thermal stresses due to
differential expansions in the tube. This has been identified to be a main reason for
WHRU failures. In Figure 31, large temperature variations are observed both axially and
radially. Differential stresses are produced both longitudinally as well as radially along
the tube and could severely impact the reliability of WHRUs. During transient loadings
such as startups, shutdowns, or load changes, these stresses could potentially be amplified
due to transient and unsteady temperature differences.
0
0.1
0.2
0.3
0.4
0.5
0.6
0.7
-1.5 -1.0 -0.5 0.0 0.5 1.0 1.5
Non
-dim
ensi
onal
Tub
e Te
mpe
ratu
re (T
*)
Non-dimensional Position along Tube Length (y*)
L/d = 5
L/d=5
L/d=10
L/d=10
L/d=20
L/d = 20
(Exhaust Out)
Sharp temperature differences between 6 and 12 o'clock.
(Exhaust Out)
Sharp temperature gradient
6 o' clock 12 o' clock
68

E. EFFECTS OF EXHAUST SWIRL
In actual operation, exhaust gases are naturally non-uniform and swirling. As
opposed to conditioning to produce uniform exhaust streams into the WHRU, swirl in the
exhaust gas stream could increase heat transfer or starve regions due to flow
recirculation.
Intrusive swirl generators such as helical inserts were used to increase heat
transfer through the production of swirl in the flow stream (Patel, Parmar, & Soni, 2014).
However, the placement of such devices inside an existing exhaust tube also introduces
blockage resulting in a pressure drop that is higher than the heat recovery improvement.
In order to mitigate this, the study explored the idea of using “non-intrusive” swirl
generators such as guide vanes to induce swirl in the exhaust stream. These devices could
be positioned at suitable positions upstream of the WHRU.
In order to investigate this effect using CFD models, a model of L/d = 10, D/d=
1.25, t*=0.0625 with a centerline placement of water inlet and outlet was used. Different
axial, tangential, and radial velocity components were introduced to the inlet exhaust
flow of the models to simulate the swirl that would have been induced by the “non-
intrusive” swirl generators. Three exhaust swirl conditions were investigated in this thesis
over exhaust Reynolds numbers ranging from 20,000 to 400,000 while the water
Reynolds number was held constant at 8,300. The total mass flow rate was kept constant
for the three swirl conditions. The details of the swirl conditions are tabulated in Table 6.
69

Table 6. Summary of exhaust swirl conditions in the study.
Swirl Condition Unit Vector magnitude of Axial Velocity Component (Uy)
Unit Vector magnitude of Tangential Velocity Component (Uϴ)
Unit Vector Magnitude of Radial Velocity Component (Ur)
No Swirl Condition 1 0 0 Swirl Condition A 1 1 0 Swirl Condition B 1 1 1
1. Effect of Exhaust Swirl on Non-dimensional Heat Recovery (q*)
As shown in results plotted in Figure 33, a WHRU with exhaust flow
incorporating axial and tangential velocity components of equal magnitude (swirl
condition A) increased heat recovery by 22% to 36% compared to an exhaust flow with
only an axial velocity component (no swirl condition). Subsequent increase of swirl
through the introduction of equivalent magnitude axial, tangential, and radial velocity
component (swirl condition B) increased heat recovery by 40% to 52%. This amounted to
a 10% to 17% increase over “swirl condition A.” The highest heat recovery
improvements were obtained at low Reynolds numbers of 20,000 for all three cases.
70

Figure 33. Comparison of non-dimensional heat recovery (q*) at exhaust swirl
conditions specified in Table 6. L/d = 10; Reexh = 400,000; Re water = 8,300.
0.00
0.05
0.10
0.15
0.20
0.25
- 100,000 200,000 300,000 400,000
Non
-Dim
ensi
onal
Hea
t Rec
over
y (q
*)
Exhaust Gas Reynolds Number
Condition A: + 22% to 36% Condition B : + 40% to 52%
Swirl Condition B (Axial + Tangential + Radial Velocity Components)
Swirl Condition A (Axial + Tangential + Velocity Components)
No Swirl Condition (Axial Velocity Components only)
71

2. Effect of Exhaust Swirl on Non-dimensional Pressure Drop (∆P*)
Despite the improvement in heat recovery, the introduction of swirl into the
exhaust flow stream increased pressure drop at a higher proportion. The pressure drop
results are shown in Figure 34. Flow with axial and tangential velocity components of
equal magnitude (swirl condition A) increased non-dimensional pressure drop by 137%
to 148%. An increase in the exhaust swirl (swirl condition B) resulted in an exhaust side
pressure drop that is 540% to 740% higher than an exhaust flow with swirl.
Figure 34. Effect of three different exhaust swirl conditions (specified in Table
6) on exhaust side non-dimensional pressure drop for WHRU of L/d = 10, D/d=1.25 with centerline water inlet/outlet placements.
0.00
0.10
0.20
0.30
0.40
0.50
0.60
0.70
- 100,000 200,000 300,000 400,000
Non
-Dim
ensi
onal
Pre
ssur
e Dr
op (Δ
P*)
Exhaust Gas Reynolds Number
Condition A: + 137% to 148% Condition B: +540% to 740%
Swirl Condition A (Axial + Tangential + Velocity Components)
Swirl Condition B (Axial + Tangential + Radial Velocity Components)
No Swirl Condition (Axial Velocity Components only)
72

3. Effect of Exhaust Swirl on Tube Temperature Profile
The tube wall temperature profiles of a WHRU (L/d = 10, D/d = 1.25, t*=0.0625,
Reexh = 400,000) with exhaust swirl condition A (axial and tangential velocity
components) and exhaust swirl condition B (axial, tangential, and radial velocity
components) were plotted against the temperature profile of an equivalent WHRU
without exhaust swirl in Figure 35 and Figure 37, respectively.
The results from the CFD models showed that the shape of the temperature profile
remained relatively unchanged with increased exhaust swirl. However, the higher average
temperatures of WHRU were recorded when more swirl was imparted to the exhaust gas
flow within the exhaust tube. Swirl condition B, the exhaust flow condition with the most
amount of swirl, produced the highest increase in temperatures. Temperature increase of
up to 41%, 36%, 41%, and 47% were recorded in 3, 6, 9, and 12 o’clock positions,
respectively. Swirl condition A, which had relatively moderate swirl conditions,
increased temperatures by 29%, 34%, 33%, and 27% in the 3, 6, 9, and 12 o’clock
positions, respectively.
The increase in tube temperature can be attributed to the effectively longer path
taken by the exhaust stream. In swirling flows, the exhaust streams undertake a helical
path shown in Figure 36 instead of a straight axial path through the exhaust tube. In
addition, the centrifugal forces and the secondary motion induced by the swirl of the
exhaust gases reduced the thickness of the exhaust gas boundary layers in the tube
resulting in higher tube temperatures and better heat recovery (Sane, Taji, &
Pachegaonkar, 2014). For the three flow conditions studied, the greatest temperature
differences occurred between measurements at 6 o’clock and 12 o’clock throughout the
entire WHRU length. In addition to the global difference, adverse temperature gradients
were also observed locally at y/L = from 0.5 to 1. This trend of temperature profiles is
present in WHRU with or without swirling exhaust gas flows.
73

Figure 35. Comparison of tube temperature profiles between WHRU with swirl
condition A (axial plus tangential velocity components) with a WHRU with no exhaust swirl (axial velocity component only). WHRU has L/d
= 10, D/d=1.25, t*=0.0625, and centerline water inlet and outlet placement, Reexh = 400,000, Rewater = 8,300.
0
0.1
0.2
0.3
0.4
0.5
0.6
0.7
-1.5 -1.0 -0.5 0.0 0.5 1.0 1.5
Non
-dim
ensi
onal
al T
ube
Tem
pera
ture
(T*)
Non-dimensional Position along Tube Length (y*)
(Exhaust Inlet) (Exhaust Outlet)
No Swirl Swirl Condition A
3 o'clock 6 o'clock 9 o'clock 12 o'clock
Adverse temperature profiles between 6 and 12 o'clock for both conditions
Sharp temperature gradients
74

Figure 36. Streamline depicting the helical exhaust gas stream associated with
swirl condition B (axial + tangential + radial velocity components) in a WHRU of L/d = 10. D/d=1.25, t*=0.0625 at Reexh = 400,000.
1.00 0.96 0.93 0.89 0.86
Streamline depicting swirling exhaust gas flow in the exhaust tube flow
75

Figure 37. Comparison of tube temperature profile between WHRU with swirl
condition B (axial, tangential, and radial velocity components) with a WHRU with only axial velocity component swirl at L/d = 10,
D/d=1.25, t*=0.0625, centerline water inlet and outlet placement, Reexh = 400,000, Rewater = 8,300.
The results from this section signify that swirling of the exhaust gas flow in the
exhaust tube have minimum effects on the shape of the temperature profiles. The addition
of swirl in the exhaust flow stream increased the average temperatures and did not
mitigate the adverse temperature profiles within the WHRU. As such, swirling of exhaust
gases does not contribute toward the improvement of WHRU reliability.
Additionally, the increase in heat recovery achieved through the swirling of
exhaust gases comes at a higher pressure drop penalty. As discussed earlier, additional
pressure drop in the exhaust gas system negatively impacts the performance and fuel
consumption of the heat engine upstream.
0
0.1
0.2
0.3
0.4
0.5
0.6
0.7
0.8
-1.50 -1.00 -0.50 0.00 0.50 1.00 1.50
Non
-dim
ensi
onal
Tub
e Te
mpe
ratu
re (T
*)
Non-dimensional Position along Tube Length (y*)
(Exhaust outlet)
No Swirl Swirl Condition B
(Exhaust inlet)
v
Sharp temperature gradients observed on 3, 6 and 9 o'clock positions
Adverse temperature profiles between 6 and 12 o'clock for both flow conditions
76

F. EFFECT OF DIFFERENT TUBE MATERIAL
The effect of material thermal conductivity on tube temperature profile, heat
recovery, and exhaust side pressure drop were studied. Four materials (steel, Inconel625,
copper, and “Pyroceram” ceramic) of varying thermal conductivity were used in this
study. The intention was to find out if high thermal conductivity can be used to mitigate
high temperature gradients within the WHRU.
Steel is one of the most common materials used for construction. It has been used
as the baseline material for the CFD models in this study. Inconel 625 was also chosen to
be studied as it is a material used for the fabrication of WHRU tubes or engine
components constantly in contact with exhaust gas. “Pyroceram” is a ceramic that has the
lowest thermal conductivity among the four materials studied. “Pyroceram” is used in
high temperature applications such as industrial plants. Copper, on the other hand, has the
highest thermal conductivity and provides insights as to whether materials with high
thermal conductivity can be used to mitigate adverse temperature and improve waste heat
recovery at the same time. The dimensional and non-dimensional thermal conductivity
(kc*) of the four materials is tabulated in Table 7. Thermal conductivity of exhaust gas is
assumed to be the same as air at 0.0261 W/mK. Thermal conductivity of air was obtained
from the ANSYS material model used for CFD modeling.
Table 7. Comparison of thermal conductivity for carbon steel, Inconiel625, copper, and “Pyroceram.”
Material Name Thermal Conductivity [W/mK]
Non-dimensional Thermal Conductivity (k* = k / kair)
Carbon Steel (Used as benchmark for comparison) (ANSYS, 2013)
60 2,299
Inconel 625 (Special Metals Corporation, 2013) 17 651
Copper (ANSYS, 2013) 400 15,326 “Pyroceram” (Incropera, Bergman, Lavine, & Dewitt, 2011)
3 115
77

A CFD model of L/d=10, D/d=1.25, t*=0.0625 and centerline water inlet and
outlet placement with purely axial exhaust gas flow was used for the study. The
corresponding properties were set up in ANSYS-Pre for the corresponding runs.
1. Effect on Non-dimensional Heat Recovery (q*)
Using steel WHRU tubes as the benchmark for comparison and using copper as
the tube material increased heat recovery marginally by 1% to 5%. Inconel 625 resulted
in a 1% to 8% reduction in heat recovery, while the use of “Pyroceram” reduced heat
recovery by 8% to 35%. With the exception of “Pyroceram,” the use of copper or Inconel
625 as material for the WHRU tube had a relatively small impact on heat recovery. The
heat recovery results from the CFD modeling are plotted in Figure 38.
Figure 38. Comparison of non-dimensional heat recovery (q*) for WHRU with
tubes made of copper, steel, inconel625 and “Pyroceram”/. L/d = 10, D/d=1.25, t*=0.0625. Reexh from 20,000 to 400,000 with no exhaust swirl, centerline water inlet and outlet placement at Rewater = 8,300.
0.00
0.02
0.04
0.06
0.08
0.10
0.12
0.14
0.16
0.18
- 50,000 100,000 150,000 200,000 250,000 300,000 350,000 400,000 450,000
Non
-Dim
ensi
onal
Hea
t Rec
over
y (q
*)
Exhaust Gas Reynolds Number
Copper
Steel
Inconel625
Pyroceram
78

2. Effect on Non-dimensional Pressure Drop (ΔP*)
As shown in Figure 39, the use of the different tube materials had no significant
impact on the exhaust gas pressure drop. The results are also reflective of the type of
behavior expected in fluid undergoing force convection, as opposed to natural convection
where thermal conductivity of the tube material will play a bigger role in the pressure
drop. The results are additional indicators of the correct working of the CFD model.
Figure 39. Comparison of non-dimensional pressure drop (ΔP*) for WHRU
with tubes made of copper, steel, inconel625 and “Pyroceram”/. L/d = 10, D/d=1.25, t*=0.0625. Reexh from 20,000 to 400,000 with no exhaust
swirl, centerline water inlet and outlet placement at Rewater = 8,300.
0.00
0.02
0.04
0.06
0.08
0.10
0.12
- 100,000 200,000 300,000 400,000
Non
-Dim
ensi
onal
Pre
ssur
e Dr
op(Δ
P*)
Exhaust Gas Reynolds Number
Steel
Pyroceram
Copper
Inconel625
79

3. Effect on WHRU Tube Temperature Profile
The temperature profiles of CFD models with steel, Inconel 625, copper, and
“Pyroceram” are plotted in Figure 40, Figure 41, and Figure 42. These results shown
were from CFD models which were evaluated at Reexh = 400,000. The highest
temperature gradients and differences were obtained during those run and were
representative of exhaust conditions in USN’s SSGTG.
a. Inconel 625 Tube
Figure 40. Comparison of tube temperature profile between Inconel 625 and
steel WHRU of L /d =10, D/d=1.25, t* = 0.0625 with centerline inlet and outlet placement, no exhaust swirl, Reexh = 400,000, Rewater =
8,300.
As illustrated in Figure 40, the temperature profiles of the Inconel 625 and steel
WHRUs are similar, with the biggest temperature differences between the 6 o’clock and
0
0.1
0.2
0.3
0.4
0.5
0.6
0.7
-1.5 -1.0 -0.5 0.0 0.5 1.0 1.5
Non
-dim
ensi
onal
Tub
e Te
mpe
ratu
re (T
*)
Non-dimensional Position along Tube length (y*)
(Exhaust inlet) (Exhaust outlet)
3 o'clock 6 o'clock 9 o'clock 12 o'clock
Inconel 625 Steel
Similar sharp temperature gradients observed on 3, 6, and 9 o’clock positions for both materials
80

12 o’clock positions. However, the Inconel 625 WHRU exhibited higher local
temperature differences at y/L = -1.0 to -0.8 and y* = 0.8 to 1.0. The average temperature
of the Inconel 625 WHRU was also higher than the steel WHRU. Adverse temperature
profiles and sharp temperature gradients were not mitigated by the use of Inconel 625.
b. Copper Tube
Figure 41. Comparison of tube temperature profile between copper and steel
WHRU of L /d =10, D/d=1.25, t* = 0.0625 with centerline inlet and outlet placement, no exhaust swirl, Reexh = 400,000, Rewater = 8,300.
Figure 41 compares the temperature profile of the copper WHRU against the steel
WHRU. Results show copper WHRU to have temperature profiles which are relatively
more favorable towards the improvement of WHRU reliability.
The use of copper contributes toward the mitigation of adverse temperature
profiles within the WHRU. The familiar temperature difference between the 6 and 12
0
0.1
0.2
0.3
0.4
0.5
0.6
0.7
-1.50 -1.00 -0.50 0.00 0.50 1.00 1.50
Non
-dim
ensi
onal
Tub
e Te
mpe
ratu
re (T
*)
Non-dimensional Position along Tube Length (y*) (Exhaust inlet) (Exhaust
outlet)
3 o'clock 6 o'clock 9 o'clock 12 o'clock
Copper Steel
Relatively smaller temperature between 6 and 12 o’clock positions in copper WHRU
Improved temperature gradients in copper WHRU
81

o’clock positions of the steel and Inconel 625 WHRU were reduced. Steel WHRU has a
temperature difference up to 22% of maximum temperature range in the WHRU, while
the maximum temperature difference for copper WHRU is 13% of the maximum range
constituting to a 41% reduction of temperature difference. The sharp temperature
gradients at y*=0.5 and 1.0 observed in steel and Inconel 625 were reduced by 25%.
The results indicate shows that material with high thermal conductivity can be
used to mitigation adverse temperature profiles and gradients and improve WHRU
reliability. Heat recovery performance is also increased marginally with no exhaust gas
side pressure drop penalty.
c. “Pyroceram” Ceramic Tube
Figure 42. Comparison of tube temperature profile between Pyroceram and
steel WHRU of L /d =10, D/d=1.25, t* = 0.0625 with centerline inlet and outlet placement, no exhaust swirl, Reexh = 400,000, Rewater =
8,300.
0
0.1
0.2
0.3
0.4
0.5
0.6
0.7
0.8
-1.50 -1.00 -0.50 0.00 0.50 1.00 1.50
Non
-dim
ensi
onal
Tub
e Te
mpe
ratu
re (T
*)
Non-dimensional Position along Tube Length (y*) (Exhaust inlet) (Exhaust outlet)
3 o’clock 6 o’clock 9 o’clock 12 o’clock
Pyroceram Steel
Reduced temperature gradients from the use of a “Pyroceram” WHRU
82

“Pyroceram” being a ceramic possesses the lowest thermal conductivity among
the four materials studied and is commonly used in ultra-high temperature applications.
The results plotted in Figure 42 shows “Pyroceram” WHRU to have a smaller
temperature gradient present between y* = 0.5 to 1.0 as compared to a steel WHRU.
However, the highest average tube temperatures were recorded for the “Pyroceram”
WHRU. The adverse temperature profile, especially between 6 o’clock and 12 o’clock
positions of the WHRU, still remains as shown in Figure 42. The use of “Pyroceram” or
materials with equivalently low thermal conductivity may be able to contribute
marginally towards the mitigation of adverse temperature profiles and gradients.
d. Comparison of Tube Wall Temperature Profile at 6 o’clock
The 6 o’clock tube wall temperature profiles of all four materials were plotted in
Figure 44 in order to better compare the effect of material on temperature profiles and
gradients. The average wall temperature of the copper WHRU tube was found to be
lowest. The temperature gradient near the exhaust outlet (y*=0.5 to 1.0) was also more
gradual compared to WHRU tube made of steel and Inconel 625. Interestingly, the
temperature gradient for “Pyroceram” was also found to be more gradual compared to
WHRU tubes made of steel and Inconel 625, despite having the highest average
temperature. Based on the results, material with either very high or very low thermal
conductivity seems to be more beneficial toward the mitigation of adverse temperature
profiles and improvement of WHRU reliability.
83
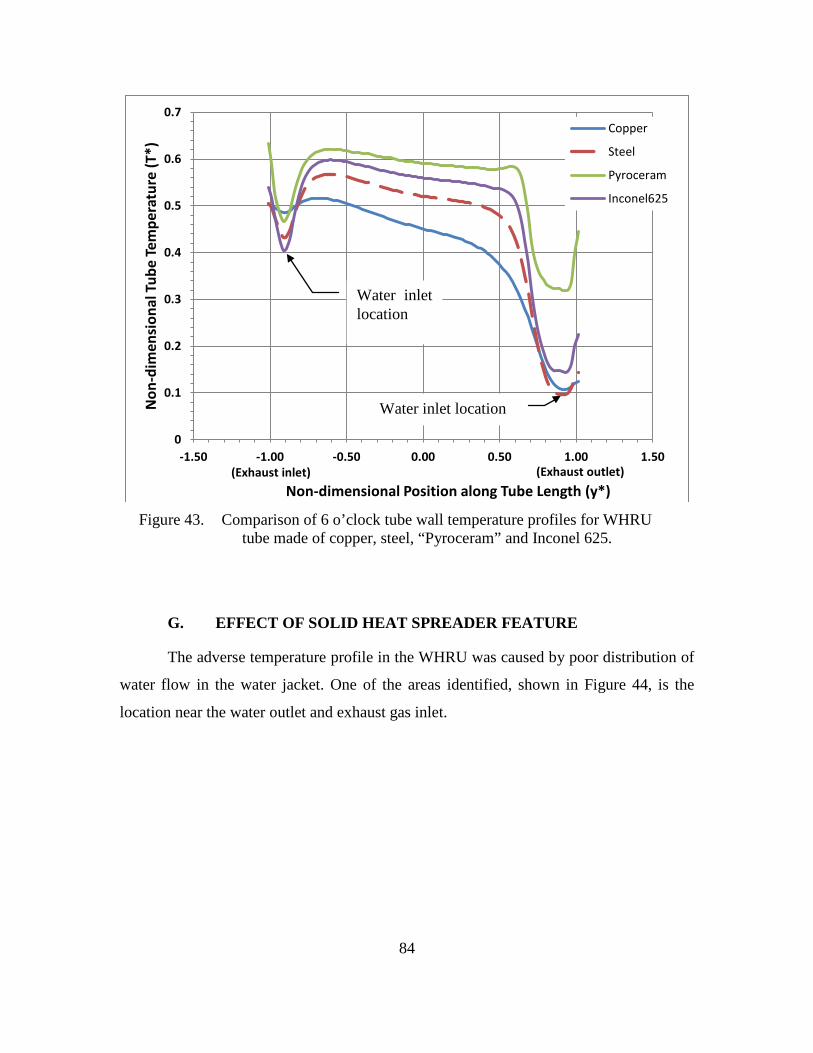
Figure 43. Comparison of 6 o’clock tube wall temperature profiles for WHRU
tube made of copper, steel, “Pyroceram” and Inconel 625.
G. EFFECT OF SOLID HEAT SPREADER FEATURE
The adverse temperature profile in the WHRU was caused by poor distribution of
water flow in the water jacket. One of the areas identified, shown in Figure 44, is the
location near the water outlet and exhaust gas inlet.
0
0.1
0.2
0.3
0.4
0.5
0.6
0.7
-1.50 -1.00 -0.50 0.00 0.50 1.00 1.50
Non
-dim
ensi
onal
Tub
e Te
mpe
ratu
re (T
*)
Non-dimensional Position along Tube Length (y*)
Copper
Steel
Pyroceram
Inconel625
(Exhaust inlet) (Exhaust outlet)
Water inlet location
Water inlet location
84

Figure 44. The 3 o’clock view of adverse temperature profiles due to non-
uniform flow of water stream (shown by water streamlines) at the exhaust inlet section of a WHRU without the heat spreader feature.
In order to improve the temperature profile, the idea of a “heat spreader” feature
was conceived. The intent was to use the additional conductive heat transfer associated
with a solid section to achieve a more uniform heat transfer so as to improve the
temperature profile. The heat spreader feature that was added is an additional solid
annulus section placed in the water jacket of the WHRU at the exhaust gas inlet of the
WHRU. These are shown in Figure 45 and Figure 46. The heat spreader thickness is 10%
of the WHRU length (y*=0.1) and can potentially be fabricated from different materials.
In this study, steel was used as the baseline material. Materials with either very high
thermal conductivity such as copper or very low thermal conductivity such as
“Pyroceram” could be used in future studies. A WHRU model of L/d=10, D/d=1.25,
t*=0.0625 with centerline water inlet and outlet placements at Reexh=400,000 with no
exhaust swirl condition was used for this study.
Exhaust gas in
Water out
Adverse temperature profiles due to non-uniform water stream in this section
Water streamlines
85

Figure 45. The 3 o’clock view of steel heat spreader feature near the exhaust
inlet of the water jacket WHRU.
Heat spreader feature
WHRU tube Exhaust flow
Water flow in water jacket
Exhaust gas in
Water out
86

Figure 46. Isometric view of water jacket WHRU with steel heat spreader
feature.
1. Effect on Non-dimensional Tube Temperature Profile
The temperature profiles of the WHRU with and without the heat spreader feature
are shown in Figure 47. The results show that the use of a heat spreader actually had a
detrimental effect on the temperature profile instead. The temperature gradients at the
exhaust inlet section increased sharply for both Reexh of 20,000 and 400,000 as
highlighted by the red-dotted rectangle in Figure 47. This adverse temperature profile
would result in increased thermal stresses and decrease reliability of the WHRU.
Heat spreader feature of y/L=0.1
Exhaust gas in
Water out
Water in
Exhaust gas out
87

Figure 47. Comparison of tube temperature profile between WHRU with and
without heat spreader feature at Reexh = 20,000 and 400,000. For WHRU of L/d =10, D/d=1.25, t* = 0.0625, centerline water inlet and
outlet placement with no exhaust swirl condition, Rewater = 8,300.
2. Effect on Non-dimensional Heat Recovery (q*)
The use of a heat spreader improved heat recovery marginally by 3% to 7% when
compared to a similar model without the heat spreader. The highest improvement was
seven percent when the exhaust Reynolds number was at 20,000 in Figure 48. The
marginal improvement diminishes with increasing exhaust Reynolds number.
0
0.1
0.2
0.3
0.4
0.5
0.6
0.7
0.8
0.9
1
-1.50 -1.00 -0.50 0.00 0.50 1.00 1.50
Non
-dim
ensi
onal
Tub
e Te
mpe
ratu
re (T
*)
Non-dimensional Position along Tube Length (y*)
(Exhaust inlet) (Exhaust outlet)
With heat Spreader No heat spreader
3 o'clock 6 o'clock 9 o'clock 12 o'clock
Additional temperature gradients as a result of the heat spreader feature
88

Figure 48. Effect of 0.1y* heat spreader on non-dimensional heat recovery (q*)
for WHRU with L/d = 10, D/d=1.25, t*=0.0625, no exhaust swirl, centerline water inlet/outlet placement, Reexh between 20,000 and
400,000; Rewater = 8,300.
3. Effect on Non-dimensional Pressure Drop (ΔP*)
A 12% increase in exhaust side pressure drop was registered with the WHRU
fitted with a heat spreader shown in Figure 49. As there was no significant change to the
exhaust flow stream throughout the majority of the WHRU length, the increase in
pressure drop can be attributed to the additional length of y* = 0.1 from the heat spreader
section.
0.00
0.02
0.04
0.06
0.08
0.10
0.12
0.14
0.16
0.18
10,000 110,000 210,000 310,000 410,000
Non
-Dim
ensi
onal
Hea
t Rec
over
y (q
*)
Exhaust Gas Reynolds Number
Without heat spreader
With heat spreader
89

Figure 49. Effect of 0.1y* heat spreader on non-dimensional pressure drop
(∆P*) for WHRU with L/d = 10, D/d=1.25, t*=0.0625, no exhaust swirl, centerline water inlet/outlet placement, Reexh between 20,000 and
400,000; Re water = 8,300.
Although the heat spreader feature was able to demonstrate some potential to
improve heat recovery performances, the adverse effect on the temperature profile near
the exhaust inlet location would have resulted in increased thermal stresses within the
WHRU. This has a significant negative impact on the reliability on the WHRU.
H. EFFECT OF WATER INLET AND OUTLET PLACEMENTS
In addition to studying the features related to WHRU geometry, exhaust gas flow,
and tube material, the effect of three types of water inlet and outlet placements on heat
recovery, exhaust pressure drop, and tube temperature profiles were also investigated.
The CFD models used for the analysis were based on L/d = 10, D/d = 1.25 and t* =
0.0625. No swirls were introduced in the exhaust flow stream. The Reynolds number of
exhaust gas flow was varied from 20,000 to 400,000 in order to reflect the exhaust flow
expected in the USMC DG and USN SSGTG. The water Reynolds number was held
0.00
0.02
0.04
0.06
0.08
0.10
0.12
- 100,000 200,000 300,000 400,000
Non
-Dim
ensi
onal
Pre
ssur
e Dr
op
(ΔP*
)
Exhaust Gas Reynolds Number
With heat spreader
Without heat spreader
90

constant at 8,300. The diameter of the water inlet and outlet was held constant for all
models used in this study.
The first type of water inlet and outlet placement (placement Type 1) is shown in
Figure 50 and Figure 51. This is the default water placement used by previous CFD
models in this study. Water inlet and outlet are located on the centerline on the 6 o’clock
side. Water inlet is located y*= -0.1 from the end of the exhaust outlet, while the water
outlet is located y*=0.1 from the exhaust inlet’s end. WHRU with this placement option
can be easily manufactured and could be one of the reasons why this type of inlet and
outlet placement is commonly used in the industry.
The second type of placement (placement Type 2) is shown in Figure 52. Water
inlet is located on the centerline of the 6 o’clock side, while water outlet is located on the
centerline of the 12 o’clock side of the WHRU. Water placement Type 2 aims to improve
the water flow in the water jacket so as to mitigate adverse tube temperature gradients
and improve reliability. Similar to placement Type 1, this placement option is also
prevalent in the industry.
The third type of placement, placement Type 3, is shown in Figure 53 through
Figure 55. It was created with the water inlet and outlet laterally shifted by x*= +0.8 from
the centerline. This simple shift of water inlet and outlet improved the water flow in the
water jacket, which in turn mitigated the temperature profile and improved WHRU
performance. Placement Type 3 is not as common, possibly due to the increased
complexity in manufacturing.
91

1. Placement Type 1 (Baseline): Centerline Water Inlet and Outlet on Same Side of WHRU
Figure 50. Isometric and top view of WHRU with water placement Type 1
(centerline water inlet and outlets on 6 o’clock side at y/L = 0.1 from the top and bottom edges of WHRU).
Exhaust gas out
Water in
Water outlet
Exhaust gas in
(Top view of WHRU)
92

Figure 51. View from 3 o’clock of WHRU with water placement Type 1
(centerline water inlet and outlets on 6 o’clock side at y/L = 0.1 from the top and bottom edges of WHRU).
y/L =0.1
y/L =0.1
L
93

2. Placement Type 2: Centerline Inlet and Outlet on Opposite Sides of WHRU
Figure 52. Isometric view and top view of water placement Type 2 (centerline
water inlet on 6 o’clock side and water outlet on 12 o’clock side at y/L = 0.1 from the top and bottom edges of WHRU).
Exhaust gas out
Water in
Water vut
Exhaust gas in
(Top view of WHRU)
94

3. Placement Type 3: Inlet and Outlet on Same Side of WRU, Shifted by x*= + 0.8
Figure 53. Isometric view (and top view) of CFD model with water placement
Type 3 (water inlet and outlet located at x*= +0.8 from centerline and y/L = 0.1 from the top and bottom edges of WHRU).
Water inlet
Water outlet
Exhaust gas outlet
Exhaust gas in
(Top View of WHRU)
95

Figure 54. Top view of CFD model with water placement Type 3 (water inlet
and outlet located shifted x*= +0.8 from centerline).
6 o'clock (Water inlet and outlet side)
3 o'clock 9 o'clock
12 o'clock
x*= 0.8 x*= - 0.8
Water outlet pipe
Water inlet pipe
96

Figure 55. The 6 o’clock view of WHRU with water placement Type 3 showing
(water inlet and outlet located y/L = 0.1 from top and bottom edges of the WHRU).
L
y/L= 0.1
Water outlet Water inlet
Exhaust gas outlet
Exhaust gas inlet
y/L = 0.1
97

4. Effect of Water Inlet and Outlet Placements on Non-dimensional Heat Recovery (q*)
A comparison of heat recovery from the water placement types are plotted in
Figure 56. When water inlet and outlets are placed on opposite sides (placement Type 2)
compared to being on the same side (placement Type 1), the heat recovery performance
was reduced marginally by 0.1% to 0.7%.
Figure 56. Comparison of non-dimensional heat recovery (q*) from three water
inlet and outlet placement types based on water jacket WHRU of L/d=10, D/d=1.25 with steel tube of t* = 0.0625. Reexh from 20,000 to
400,000 with no exhaust swirl with Rewater = 8,300.
However, when the water inlet and outlet were shifted laterally by x*=+0.1 from
the centerline in placement Type 3, a 3% to 19% improvement in heat recovery was
achieved. The shift in the water inlets and outlets caused water in the jacket to flow
around the WHRU tube which in turn improved the heat recovery. Plots in Figure 56
0.00
0.02
0.04
0.06
0.08
0.10
0.12
0.14
0.16
0.18
10,000 110,000 210,000 310,000 410,000
Non
-Dim
ensi
onal
Hea
t Rec
over
y (q
*)
Exhaust Gas Reynolds Number
Type3 (LateralShift by x/R=0.8)
Type 1 (Same Sideson Centerline)
Type 2 (Centerlinesame side)
98

showed a greater heat recovery improvement at higher exhaust Reynolds number, making
this finding applicable toward the waste heat recovery for the USN 501K SSGTG.
5. Effect on Non-dimensional Exhaust Side Pressure Drop (∆P*)
Based on the results from the CFD models in Figure 57, it can be concluded that
water placement did not have any significant impact on the exhaust side pressure drop. A
lateral shift of water inlet and outlet (placement Type 3) reduced the exhaust side
pressure drop marginally by 1% to 3% compared to a WHRU with centerline water inlet
and outlets on the same side (placement Type 1). With the water inlet and outlet placed
on opposite sides (placement Type 2), exhaust side pressure drop was increased by
0.15%.
Figure 57. Comparison of non-dimensional pressure drop (∆P*) of three water
inlet and outlet placement types based on water jacket WHRU of L/d=10, D/d=1.25 with steel tube of t* = 0.0625; Reexh from 20,000 to
400,000 with no exhaust swirl; Rewater = 8,300.
0.04
0.05
0.06
0.07
0.08
0.09
0.10
0.11
- 100,000 200,000 300,000 400,000
Non
-dim
ensi
onal
Pre
ssur
e Dr
op (Δ
P*)
Exhaust Gas Reynolds Number
Type 1 (Centerlinesame side)
Type 2 (Centerlineopposite sides)
Type 3 (Lateralshift by x/R=0.8)
99

6. Effect on Non-dimensional Temperature Profiles
The effect of the three water placements types on tube temperature profile were
compared at Reexh = 400,000. Figure 58 compares the temperature profiles between
placement Type 1 (centerline water inlet and outlet on the same side) and Type 2
(centerline water inlet and outlet on opposite sides). In both placement Type 1 and Type
2, adverse temperature profiles occurred between the 6 o’clock and 12 o’clock positions
nearly throughout the length of the WHRU tube. Results from Figure 58 also show that
placing the water inlet and outlet opposite each other in placement Type 2 caused the
temperature profiles between the 6 o’clock and 12 o’clock positions to be worsened.
Figure 58. Comparison of WHRU tube temperature profiles between placement
Type 1 (centerline water inlet and outlet on the same side) and Type 2 (centerline water inlet and outlet on opposite sides) for WHRU of L/d=10, D/d=1.25, t*=0.0625. ReExh of 20,000 to 400,000 with no
exhaust swirl. Rewater = 8,300.
0
0.1
0.2
0.3
0.4
0.5
0.6
0.7
-1.50 -1.00 -0.50 0.00 0.50 1.00 1.50
Non
-dim
ensi
onal
Tub
e Te
mpe
ratu
re (T
*)
Non-dimensional Position along Tube Length (y*)
(Exhaust oulet)
Sharp temperature gradients
(Exhaust inlet)
Type 1 (Same side placement) Type 2 (Opposite placement)
100

Sharp temperature gradients were also observed at the upper 25% of the WHRU
between y* = 0.5 and y*=1. The adverse tube temperature profiles of placement Type 1
and placement Type 2 can be attributed to uneven water flow distribution in their water
jacket depicted by streamlines and water velocity vector plots. Figure 59 and Figure 60
depict the streamlines and water velocity vector plots for water placement Type 1 while
Figure 61 and Figure 62 depict the streamlines and water velocity vector plots for water
placement Type 2.
Figure 59. Water streamlines and tube temperature contours for WHRU with
water placement Type 1 (centerline water inlet and outlet placement on same side), L/d = 10; D/d=1.25, t*=0.0625 at Reexh = 400,000; Rewater =
8,300, and no exhaust swirl.
0.070 0.050 0.035 0.015 0.000
0.6 0.5 0.4 0.3 0.2
Regions with poor water flow distribution
101

Figure 60. Water velocity vectors of WHRU with water placement Type 1
(centerline water inlet and outlet placement on same side), for L/d =10, D/d=1.25, t*=0.0625 at Reexh=400,000, Rewater =8,300 with no exhaust
swirl.
Regions with poor water flow distribution
Regions with poor water flow
Regions with poor water flow
102

Figure 61. Water streamlines and tube temperatures for WHRU with water
placement Type 2 (centerline water inlet and outlet placement on opposite sides), L/d = 10. D/d=1.25, t*=0.0625, No Exhaust Swirl,
Reexh = 400,000, Rewater = 8,300.
0.15 0.09 0.06 0.04 0.02 0.00
0.65 0.55 0.45 0.35 0.25 0.15 0.05
Regions with poor water flow distribution
103

Figure 62. Water velocity vectors of WHRU with water placement Type 2
(centerline water inlet and outlet placement on opposite sides), L/d = 10. D/d=1.25, t*=0.0625, no exhaust swirl, Reexh = 400,000, Rewater =
8,300.
Instead of improving the temperature profiles, the placement of the inlet and
outlets on opposite sides of the WHRU resulted in temperature profiles which were more
adverse, negatively impacting the WHRUs’ reliability. This finding is interesting
considering these two types of water placement are very prevalent in the heat exchanger
industry. The adverse temperature profiles could have contributed toward premature
failure of similar configurations.
Regions with poor water flow distribution
104

The comparison of tube temperature profiles between water placement Type 3
and water placement Type 1 is shown in Figure 63. The results from the CFD models
showed that temperature profiles from the WHRU with placement Type 3 to be gradual.
The adverse 6 o’clock and 12 o’clock temperature difference that was characteristic of
the centerline water placement types was not observed. The sharp temperature gradients
between y* = 0.5 and y*=1 were also effectively mitigated by the lateral shifting of water
inlet and outlet from centerline.
Figure 63. Comparison of tube temperature profile between WHRU with water
inlet and outlet shifted laterally by x*=0.8 (placement Type 3) and WHRU with centerline water inlet and outlet on the same side
(placement Type 1). L/d=10, D/d=1.25, t*=0.0625. Reexh of 20,000 to 400,000 with no exhaust swirl; Rewater = 8,300.
0
0.1
0.2
0.3
0.4
0.5
0.6
0.7
-1.50 -1.00 -0.50 0.00 0.50 1.00 1.50
Non
-dim
ensi
onal
Tub
e Te
mpe
ratu
re (T
*)
Non-dimensional Position along Tube Length (y*)
(Exhaust inlet) (Exhaust outlet)
Water placement Type 1
Water placement Type 3
105

The shift of the water inlet and outlet caused water to flow uniformly around
WHRU tube as shown in Figure 64. The improved flow stream improved heat transfer
throughout the tube, increasing heat recovery and mitigating the adverse temperature
profile. The maximum local temperature fluctuation occurs around y* = +0.95m where
the water inlet and outlet are located.
Figure 64. Water streamlines and temperature contour for WHRU with water
inlet and outlet shifted laterally by x*=0.8 (placement Type 3) with L/d = 10; D/d=1.25, t*=0.0625, no exhaust swirl at Reexh = 400,000, Re water
= 8,300.
0.08 0.06 0.04 0.02 0.00
0.5 0.4 0.3 0.2 0.1
106

In comparison, water streamlines in the water jacket shown in Figure 59 and
Figure 61 depict that a WHRU with centerline water inlet and outlet placements has flow
profiles which are highly uneven and non-uniform.
Water velocities were observed to be higher at the 12 o’clock position and lower
at the 6 o’clock position. This resulted in uneven heat transfer, which translates to an
adverse temperature profile. In contrast, the water streamlines for water placement Type
3 shown in Figure 64 are evenly distributed. The velocity vectors shown in Figure 65 also
illustrate uniform flow distribution in the water jacket. This contributes toward even heat
transfer throughout the WHRU. As such, gradual temperature profiles are achieved,
reducing differential expansions and thermal stresses. This contributes toward
improvement of WHRU reliability.
107

Figure 65. Velocity vectors depicting uniform flow in the water jacket of a
WHRU with water inlet and outlet shifted laterally by x*=0.8 (placement Type 3) with L/d = 10, D/d=1.25, t*=0.0625, no exhaust
swirl at Reexh = 400,000, Rewater = 8,300.
Uniform water flow distribution throughout water jacket
108

VII. CONCLUSION
The thesis achieved the intended objectives of gaining insight on how reliability
and performance of an exhaust gas water jacket WHRU are affected by features
associated with design, construction, and operating conditions. These contribute toward
the build-up of subject matter expertise in the USN-NPS WHR Capability Roadmap so as
to formulate solutions to overcome the reliability and performance challenges that have
limited the success of the USN’s WHR program.
The features that were varied include exhaust tube diameter ratio (D/d), length-to-
tube diameter ratio (L/d), exhaust flow conditions, tube materials, heat spreader feature,
and placement of water inlet and outlet. The impact of these features was parametrically
studied using analytical and CFD models based on USMC’s MEP803A DG and USN’s
501K SSGTG. Non-dimensional variables and parameters were used in the models in
order for the results to be applied over a wider range of values. Due to its simplicity and
the relative ease with which it can be retrofitted onto existing exhaust tubes with
minimum impact on the associated power plants, a water jacket configuration was chosen
as the baseline design for this study.
The analytical models were able to quickly provide estimates of heat recovery and
pressure drop over a wide range of L/d and D/d ratios but faced limitations when studies
involving more complex features such as swirling exhaust gas flows or water inlet and
outlet placements were involved. CFD models were used to overcome these limitations,
and to produce information on temperature profiles and flow fields within the WHRU.
This information is crucial in the study to mitigate adverse temperature gradients and
reduce thermal stresses in order to improve the reliability of the WHRU.
While large temperature gradients may be favorable to heat recovery, they also
cause differential expansions and thermal stresses, which are detrimental to the WHRU
reliability. Both analytical and CFD models verified that optimal non-dimensional heat
recovery performance is achieved with the highest at L/d ratios, small D/d ratio, and low
exhaust gas Reynolds number. It was also ascertained that an increase in the L/d ratio is
109

more effective in increasing heat recovery compared to reduction of D/d ratios. This is
due to the increase in heat transfer area when length is increased. However, once the
maximum possible heat recovery is achieved, further increase in L/d only increases the
exhaust side pressure drop, which in turn increases the exhaust gas back pressure of the
power plant upstream. Excessive back pressure is detrimental to the performance and
reliability of the power plant. During design, attention must be given to this detail in
order to optimize heat recovery with minimum pressure drop.
With the exhaust tube diameter (d) being fixed, varying the water jacket diameter
(D) to get small D/d ratios was also found to complement heat recovery without any
increase in the exhaust side pressure losses. At higher exhaust Reynolds numbers, heat
recovery performance was found to be sensitive to changes in D/d; an inflection point
was observed at a D/d ratio of 2. As such, a small D/d ratio of 1.25 was chosen for
subsequent CFD models. As the exhaust tube diameter was held constant, reduction of
D/d ratio did not increase the exhaust gas pressure drop.
Swirling exhaust gas flows were found to increase heat recovery by up to 52%.
However, severe exhaust side pressure drops as high as 740% were induced as a
consequence. This increase was induced even when non-intrusive swirl generators were
used. The pressure drop increase would result in an exhaust back pressure in the power
plant upstream of the WHRU, negatively impacting its performance and fuel
consumption, defeating the purpose of WHR in the first place. It was also ascertained that
swirling of the exhaust gas flow in the exhaust tube has minimal effects on the shape of
the temperature profiles. Addition of swirl in the exhaust flow stream increased the
average temperatures and did not mitigate the adverse temperature profiles within the
WHRU. As such, swirling of exhaust gases does not contribute toward the improvement
of WHRU performance or reliability.
110

Different tube materials were found to have some impact on heat recovery
performance. A WHRU with exhaust tube constructed of “Pyroceram,” a ceramic
material with thermal conductivity 20 times lower than steel, reduced heat recovery by
8% to 35%. Copper, whose thermal conductivity is seven times higher than steel,
improved heat recovery by up to 5%.
Results from this also showed that copper was able to contribute toward the
mitigation of adverse temperature profiles and gradients in the WHRU. A WHRU
constructed with copper tube mitigated the temperature profile difference by 41% and
temperature gradient by 25% when compared to a WHRU with steel tube. Material with
very low thermal conductivity, such as “Pyroceram,” was also able to reduce temperature
gradients in the WHRU. It can be concluded that materials with either very high or very
low thermal conductivity could be beneficial toward the mitigation of adverse
temperature profiles and improvement of WHRU reliability.
One of the most important findings in this study is the importance of proper water
inlet and outlet placement toward the control of the temperature profile in the WHRU.
WHRUs with water inlets and outlets located in the centerline of the WHRU (placement
Type 1 and Type 2) experienced poor and uneven distribution of flow in the water jacket.
Such placements are prevalent in available heat exchanger technologies.
The finding related to centerline water inlet and outlet placement was consistently
found in WHRUs with different geometric ratios, tube materials, heat spreader features,
or presence of swirl in exhaust gas flows. The poor distribution of water flow resulted in
adverse temperature profiles between the 6 o’clock and 12 o’clock positions and sharp
temperature gradients at the upper section of the WHRU where the exhaust outlet and
water inlet are located (y/L=0.5 to y/L =1.0). This adverse temperature profile produces
differential expansions and thermal stress, initiating failure mechanisms such as fatigue
and stress corrosion cracking that increase probability of premature failure in WHRUs.
The poor distribution of water flow also reduced the heat recovery potential of the
affected WHRU. This finding is crucial as centerline water inlet and outlet placements
are very prevalent in cylindrical-shaped WHRUs or heat exchangers.
111

The problem was subsequently resolved by shifting the water inlet and outlet from
the centerline by a lateral distance of x*= +0.8. This change in the water placement
improved the flow in the water jacket and eradicated the adverse temperature profiles.
Heat recovery performance of the WHRU also increased as much as 19% with no
increase in exhaust side pressure loss.
Results from this study provide insights into the complex relationships involved
in the design of a WHRU that is both reliable and high performing. Designers or program
managers of waste heat recovery projects need to consider performance and reliability
from a total system point of view. The increase in heat recovery is often linked to an
increased exhaust side pressure drop, which in turn impacts the power plant upstream in a
detrimental manner. In order to optimize reliability and performance further, follow-on
study of the water inlet and outlet of water jacket WHRUs could be conducted looking at
the effects of shapes, vertical or horizontal locations, and sizes of the water inlet and
outlet.
112

APPENDIX A
A sample of the CFX solver report and results are included in this appendix. The
data were generated from Run 4 which models a WHRU with L/d=10, D/d=1.25, Steel
tube of t* = 0.0625, Reexh=400,000, Rewater = 8,300 with centerline water placement
without any exhaust swirl in the flow.
REPORT FOR CFX MODEL (FOR RUN 4)
1. File Report Table 1. File Information for CFX.
Case CFX
File Path C:\SCRATCH\Erik_K\Baseline_4_files\dp0\CFX\CFX\Fluid Flow CFX_005.res
File Date 22 August 2014
File Time 08:21:10 PM
File Type CFX5
File Version 15.0
2. Physics Report Table 2. Domain Physics for CFX.
Domain - Exhaust
Type Fluid
Location B10
Materials
Air Ideal Gas
Fluid Definition Material Library
Morphology Continuous Fluid
Settings
Buoyancy Model Non Buoyant
113

Domain Motion Stationary
Reference Pressure 1.0000e+00 [atm]
Heat Transfer Model Thermal Energy
Turbulence Model k epsilon
Turbulent Wall Functions Scalable
Domain - Tube
Type Solid
Location B22
Settings
Domain Motion Stationary
Domain - Water
Type Fluid
Location B39
Materials
Water
Fluid Definition Material Library
Morphology Continuous Fluid
Settings
Buoyancy Model Non Buoyant
Domain Motion Stationary
Reference Pressure 1.0000e+00 [atm]
Heat Transfer Model Thermal Energy
Turbulence Model k epsilon
Turbulent Wall Functions Scalable
Domain Interface - Exhaust to Tube
Boundary List1 Default Fluid Solid Interface Side 1 1
Boundary List2 Default Fluid Solid Interface Side 1
Interface Type Fluid Solid
Settings
114

Interface Models General Connection
Heat Transfer Conservative Interface Flux
Material Steel
Heat Transfer Interface Model Thin Material
Thickness 5.0000e+00 [mm]
Mesh Connection GGI
Domain Interface - Water to Tube
Boundary List1 Water to Tube Side 1
Boundary List2 Water to Tube Side 2
Interface Type Fluid Solid
Settings
Interface Models General Connection
Heat Transfer Conservative Interface Flux
Material Steel
Heat Transfer Interface Model Thin Material
Thickness 5.0000e+00 [mm]
Mesh Connection GGI
Table 3. Boundary Physics for CFX.
Domain Boundaries
Exhaust
Boundary - Exhaust_in
Type INLET
Location Exh_in
Settings
Flow Direction Normal to Boundary Condition
Flow Regime Subsonic
Heat Transfer Static Temperature
Static Temperature 7.7300e+02 [K]
Mass And Momentum Mass Flow Rate
115

Mass Flow Rate 4.6120e-01 [kg s^-1]
Turbulence Medium Intensity and Eddy Viscosity Ratio
Boundary - Default Fluid Solid Interface Side 1 1
Type INTERFACE
Location F11.10
Settings
Heat Transfer Conservative Interface Flux
Mass And Momentum No Slip Wall
Wall Roughness Smooth Wall
Boundary - Exhaust_out
Type OUTLET
Location Exh_out
Settings
Flow Regime Subsonic
Mass And Momentum Average Static Pressure
Pressure Profile Blend 5.0000e-02
Relative Pressure 0.0000e+00 [Pa]
Pressure Averaging Average Over Whole Outlet
Tube
Boundary - Default Fluid Solid Interface Side 1
Type INTERFACE
Location F23.22
Settings
Heat Transfer Conservative Interface Flux
Boundary - Water to Tube Side 2
Type INTERFACE
Location F29.22
Settings
Heat Transfer Conservative Interface Flux
116

Boundary - Tube Default
Type WALL
Location F24.22, F25.22, F26.22, F27.22, F28.22, F30.22
Settings
Heat Transfer Adiabatic
Water
Boundary - water_in
Type INLET
Location Water_in
Settings
Flow Direction Normal to Boundary Condition
Flow Regime Subsonic
Heat Transfer Static Temperature
Static Temperature 3.0000e+02 [K]
Mass And Momentum Mass Flow Rate
Mass Flow Rate 1.1560e-01 [kg s^-1]
Turbulence Medium Intensity and Eddy Viscosity Ratio
Boundary - Water to Tube Side 1
Type INTERFACE
Location F46.39
Settings
Heat Transfer Conservative Interface Flux
Mass And Momentum No Slip Wall
Wall Roughness Smooth Wall
Boundary - Water_out
Type OUTLET
Location Water_out
Settings
Flow Regime Subsonic
117

Mass And Momentum Average Static Pressure
Pressure Profile Blend 5.0000e-02
Relative Pressure 0.0000e+00 [Pa]
Pressure Averaging Average Over Whole Outlet
Boundary - Water Default
Type WALL
Location F40.39, F41.39, F42.39, F43.39, F44.39
Settings
Heat Transfer Adiabatic
Mass And Momentum No Slip Wall
Wall Roughness Smooth Wall
CFX SOLVER RESULTS (FOR RUN 4)
===================================================================== Termination and Interrupt Condition Summary ====================================================================== CFD Solver: All target criteria reached (Equation residuals) ====================================================================== Boundary Flow and Total Source Term Summary ====================================================================== +--------------------------------------------------------------------+
118

| U-Mom-Exhaust | +--------------------------------------------------------------------+ Boundary : Default Fluid Solid Interface Side 1 1 2.1472E-03 Boundary : Exhaust_in -2.8443E-07 Boundary : Exhaust_out -2.1500E-03 ----------- Domain Imbalance: -3.0103E-06 +--------------------------------------------------------------------+ | V-Mom-Exhaust | +--------------------------------------------------------------------+ Boundary : Default Fluid Solid Interface Side 1 1 -6.8980E+00 Boundary : Exhaust_in 9.7651E+01 Boundary : Exhaust_out -9.0756E+01 ----------- Domain Imbalance: -2.6734E-03 +--------------------------------------------------------------------+ | W-Mom-Exhaust | +--------------------------------------------------------------------+ Boundary : Default Fluid Solid Interface Side 1 1 2.2887E-02 Boundary : Exhaust_in -1.3690E-07 Boundary : Exhaust_out -2.2886E-02 ----------- Domain Imbalance: 4.6084E-07 +--------------------------------------------------------------------+ | P-Mass-Exhaust | +--------------------------------------------------------------------+ Boundary : Exhaust_in 4.6120E-01 Boundary : Exhaust_out -4.6120E-01 ----------- Domain Imbalance: -7.6188E-07 +--------------------------------------------------------------------+ | U-Mom-Water | +--------------------------------------------------------------------+ Boundary : Water Default -1.3544E-03 Boundary : Water to Tube Side 1 1.3440E-03 Boundary : Water_out 1.0420E-05 Boundary : water_in -1.2582E-09 ----------- Domain Imbalance: 6.5064E-09 +--------------------------------------------------------------------+
119

| V-Mom-Water | +--------------------------------------------------------------------+ Boundary : Water Default -2.2156E-03 Boundary : Water to Tube Side 1 2.2756E-03 Boundary : Water_out -6.0035E-05 Boundary : water_in -3.7131E-10 ----------- Domain Imbalance: -7.8595E-10 +--------------------------------------------------------------------+ | W-Mom-Water | +--------------------------------------------------------------------+ Boundary : Water Default 2.1828E-01 Boundary : Water to Tube Side 1 -8.5256E-02 Boundary : Water_out -4.3420E-02 Boundary : water_in -8.9606E-02 ----------- Domain Imbalance: -2.4253E-09 +--------------------------------------------------------------------+ | P-Mass-Water | +--------------------------------------------------------------------+ Boundary : Water_out -1.1560E-01 Boundary : water_in 1.1560E-01 ----------- Domain Imbalance: 3.1625E-11 +--------------------------------------------------------------------+ | H-Energy-Exhaust | +--------------------------------------------------------------------+ Boundary : Exhaust_in 2.1996E+05 Boundary : Exhaust_out -2.0887E+05 Domain Interface: Exhaust to Tube (Side 1) -1.1099E+04 ----------- Domain Imbalance: -3.7569E-01 +--------------------------------------------------------------------+ | T-Energy-Tube | +--------------------------------------------------------------------+ Domain Interface: Exhaust to Tube (Side 2) 1.1099E+04 Domain Interface: Water to Tube (Side 2) -1.1099E+04 ----------- Domain Imbalance: -2.2368E-02 +--------------------------------------------------------------------+
120

| H-Energy-Water | +--------------------------------------------------------------------+ Boundary : Water_out -1.1993E+04 Boundary : water_in 8.9430E+02 Domain Interface: Water to Tube (Side 1) 1.1099E+04 ----------- Domain Imbalance: -1.6096E-02 +--------------------------------------------------------------------+ | Normalised Imbalance Summary | +--------------------------------------------------------------------+ | Equation | Maximum Flow | Imbalance (%) | +--------------------------------------------------------------------+ | U-Mom-Exhaust | 9.7651E+01 | 0.0000 | | V-Mom-Exhaust | 9.7651E+01 | -0.0027 | | W-Mom-Exhaust | 9.7651E+01 | 0.0000 | | P-Mass-Exhaust | 4.6120E-01 | -0.0002 | +----------------------+-----------------------+---------------------+ | U-Mom-Water | 2.1828E-01 | 0.0000 | | V-Mom-Water | 2.1828E-01 | 0.0000 | | W-Mom-Water | 2.1828E-01 | 0.0000 | | P-Mass-Water | 1.1560E-01 | 0.0000 | +----------------------+-----------------------+---------------------+ | H-Energy-Exhaust | 2.1996E+05 | -0.0002 | | T-Energy-Tube | 2.1996E+05 | 0.0000 | | H-Energy-Water | 2.1996E+05 | 0.0000 | +----------------------+-----------------------+---------------------+ ====================================================================== Wall Force and Moment Summary ====================================================================== Notes: 1. Pressure integrals exclude the reference pressure. To include it, set the expert parameter 'include pref in forces = t'. +--------------------------------------------------------------------+ | Pressure Force On Walls | +--------------------------------------------------------------------+
121

X-Comp. Y-Comp. Z-Comp. Domain Group: Exhaust Default Fluid Solid Interface Si-2.2406E-03 1.4194E-15 -2.2824E-02 ----------- ----------- ----------- Domain Group Totals: -2.2406E-03 1.4194E-15 -2.2824E-02 +--------------------------------------------------------------------+ | Viscous Force On Walls | +--------------------------------------------------------------------+ X-Comp. Y-Comp. Z-Comp. Domain Group: Exhaust Default Fluid Solid Interface Si 9.3384E-05 6.8980E+00 -6.3044E-05 ----------- ----------- ----------- Domain Group Totals: 9.3384E-05 6.8980E+00 -6.3044E-05 +--------------------------------------------------------------------+ | Pressure Moment On Walls | +--------------------------------------------------------------------+ X-Comp. Y-Comp. Z-Comp. Domain Group: Exhaust Default Fluid Solid Interface Si-1.2082E-02 -5.8540E-10 -3.4594E-04 ----------- ----------- ----------- Domain Group Totals: -1.2082E-02 -5.8540E-10 -3.4594E-04 +--------------------------------------------------------------------+ | Viscous Moment On Walls | +--------------------------------------------------------------------+ X-Comp. Y-Comp. Z-Comp. Domain Group: Exhaust Default Fluid Solid Interface Si 1.4405E-03 7.4118E-08 -1.0289E-03 ----------- ----------- ----------- Domain Group Totals: 1.4405E-03 7.4118E-08 -1.0289E-03
122

+--------------------------------------------------------------------+ | Pressure Force On Walls | +--------------------------------------------------------------------+ X-Comp. Y-Comp. Z-Comp. Domain Group: Water Water Default 1.3479E-03 5.0214E-03 -2.1922E-01 Water to Tube Side 1 -1.3396E-03 -5.0283E-06 8.7648E-02 ----------- ----------- ----------- Domain Group Totals: 8.3710E-06 5.0164E-03 -1.3158E-01 +--------------------------------------------------------------------+ | Viscous Force On Walls | +--------------------------------------------------------------------+ X-Comp. Y-Comp. Z-Comp. Domain Group: Water Water Default 6.4302E-06 -2.8058E-03 9.4114E-04 Water to Tube Side 1 -4.3889E-06 -2.2706E-03 -2.3912E-03 ----------- ----------- ----------- Domain Group Totals: 2.0413E-06 -5.0764E-03 -1.4501E-03 +--------------------------------------------------------------------+ | Pressure Moment On Walls | +--------------------------------------------------------------------+ X-Comp. Y-Comp. Z-Comp. Domain Group: Water Water Default -2.3176E-02 7.7241E-06 -7.3817E-04 Water to Tube Side 1 1.2201E-02 -1.0676E-07 7.5017E-04 ----------- ----------- ----------- Domain Group Totals: -1.0975E-02 7.6174E-06 1.2001E-05 +--------------------------------------------------------------------+ | Viscous Moment On Walls | +--------------------------------------------------------------------+ X-Comp. Y-Comp. Z-Comp. Domain Group: Water
123

Water Default -4.6298E-03 -4.1961E-06 -6.6378E-06 Water to Tube Side 1 -9.8439E-04 -1.2941E-08 -1.0003E-06 ----------- ----------- ----------- Domain Group Totals: -5.6142E-03 -4.2090E-06 -7.6381E-06 +--------------------------------------------------------------------+ | Locations of Maximum Residuals | +--------------------------------------------------------------------+ | Equation | Domain Name | Node Number | +--------------------------------------------------------------------+ | U-Mom-Exhaust | Exhaust | 99162 | | V-Mom-Exhaust | Exhaust | 99097 | | W-Mom-Exhaust | Exhaust | 99174 | | P-Mass-Exhaust | Exhaust | 2028 | +----------------------+-----------------------+---------------------+ | U-Mom-Water | Water | 339770 | | V-Mom-Water | Water | 331149 | | W-Mom-Water | Water | 329475 | | P-Mass-Water | Water | 348641 | +----------------------+-----------------------+---------------------+ | H-Energy-Exhaust | Exhaust | 106668 | | T-Energy | Tube | 24001 | | H-Energy-Water | Water | 329462 | +----------------------+-----------------------+---------------------+ | K-TurbKE-Exhaust | Exhaust | 40054 | | E-Diss.K-Exhaust | Exhaust | 107997 | +----------------------+-----------------------+---------------------+ | K-TurbKE-Water | Water | 329466 | | E-Diss.K-Water | Water | 348702 | +----------------------+-----------------------+---------------------+ ====================================================================== | False Transient Information | +--------------------------------------------------------------------+ | Equation | Type | Elapsed Pseudo-Time | +--------------------------------------------------------------------+ | U-Mom-Exhaust | Auto Timescale | 1.96018E+01 | | V-Mom-Exhaust | Auto Timescale | 1.96018E+01 | | W-Mom-Exhaust | Auto Timescale | 1.96018E+01 | | P-Mass-Exhaust | Auto Timescale | 1.96018E+01 | +----------------------+-----------------------+---------------------+
124

| U-Mom-Water | Auto Timescale | 2.78180E+03 | | V-Mom-Water | Auto Timescale | 2.78180E+03 | | W-Mom-Water | Auto Timescale | 2.78180E+03 | +----------------------+-----------------------+---------------------+ | H-Energy-Exhaust | Auto Timescale | 3.92036E+03 | | T-Energy-Tube | Auto Timescale | 2.99902E+06 | | H-Energy-Water | Auto Timescale | 5.56360E+05 | +----------------------+-----------------------+---------------------+ | K-TurbKE-Exhaust | Auto Timescale | 1.96018E+01 | | E-Diss.K-Exhaust | Auto Timescale | 1.96018E+01 | +----------------------+-----------------------+---------------------+ | K-TurbKE-Water | Auto Timescale | 2.12037E+03 | | E-Diss.K-Water | Auto Timescale | 2.12037E+03 | +----------------------+-----------------------+---------------------+ +--------------------------------------------------------------------+ | Average Scale Information | +--------------------------------------------------------------------+ Domain Name: Exhaust Global Length = 1.5958E-01 Minimum Extent = 8.0000E-02 Maximum Extent = 8.1000E-01 Density = 4.6641E-01 Dynamic Viscosity = 1.8310E-05 Velocity = 1.9867E+02 Advection Time = 8.0326E-04 Reynolds Number = 8.0760E+05 Speed of Sound = 5.5280E+02 Mach Number = 3.5938E-01 Thermal Conductivity = 2.6100E-02 Specific Heat Capacity at Constant Pressure = 1.0044E+03 Specific Heat Capacity at Constant Volume = 7.1730E+02 Specific Heat Ratio = 1.4003E+00 Prandtl Number = 7.0462E-01 Temperature Range = 1.2196E+02 Domain Name: Water Global Length = 1.3814E-01 Minimum Extent = 1.1000E-01 Maximum Extent = 8.0000E-01 Density = 9.9700E+02 Dynamic Viscosity = 8.8990E-04 Velocity = 3.1145E-01 Advection Time = 4.4354E-01
125

Reynolds Number = 4.8202E+04 Thermal Conductivity = 6.0690E-01 Specific Heat Capacity at Constant Pressure = 4.1817E+03 Prandtl Number = 6.1316E+00 Temperature Range = 4.1571E+01 Domain Name: Tube Global Length = 1.0360E-01 Minimum Extent = 1.0996E-01 Maximum Extent = 8.1000E-01 Density = 7.8540E+03 Thermal Conductivity = 6.0500E+01 Specific Heat Capacity at Constant Pressure = 4.3400E+02 Thermal Diffusivity = 1.7749E-05 Average Diffusion Timescale = 6.0476E+02 Minimum Diffusion Timescale = 6.8125E+02 Maximum Diffusion Timescale = 3.6965E+04 Temperature Range = 2.4236E+02 +--------------------------------------------------------------------+ | Variable Range Information | +--------------------------------------------------------------------+ Domain Name: Exhaust +--------------------------------------------------------------------+ | Variable Name | min | max | +--------------------------------------------------------------------+ | Density | 4.57E-01 | 5.42E-01 | | Specific Heat Capacity at Constant Pressure| 1.00E+03 | 1.00E+03 | | Dynamic Viscosity | 1.83E-05 | 1.83E-05 | | Thermal Conductivity | 2.61E-02 | 2.61E-02 | | Isothermal Compressibility | 9.75E-06 | 9.87E-06 | | Static Entropy | 7.84E+02 | 9.57E+02 | | Velocity u | -3.89E-01 | 4.24E-01 | | Velocity v | 1.34E+02 | 2.11E+02 | | Velocity w | -4.07E-01 | 3.93E-01 | | Pressure | -8.53E+00 | 1.23E+03 | | Turbulence Kinetic Energy | 4.85E-01 | 3.25E+02 | | Turbulence Eddy Dissipation | 1.40E+02 | 3.21E+06 | | Eddy Viscosity | 6.84E-05 | 6.43E-03 | | Temperature | 6.51E+02 | 7.73E+02 | | Static Enthalpy | 3.55E+05 | 4.77E+05 | +--------------------------------------------------------------------+ Domain Name: Water
126

+--------------------------------------------------------------------+ | Variable Name | min | max | +--------------------------------------------------------------------+ | Density | 9.97E+02 | 9.97E+02 | | Specific Heat Capacity at Constant Pressure| 4.18E+03 | 4.18E+03 | | Dynamic Viscosity | 8.90E-04 | 8.90E-04 | | Thermal Conductivity | 6.07E-01 | 6.07E-01 | | Static Entropy | 2.57E+01 | 5.68E+02 | | Velocity u | -3.97E-01 | 4.01E-01 | | Velocity v | -3.98E-01 | 3.86E-01 | | Velocity w | -4.23E-01 | 5.00E-01 | | Pressure | -1.20E+02 | 2.23E+02 | | Turbulence Kinetic Energy | 3.80E-06 | 1.48E-02 | | Turbulence Eddy Dissipation | 3.15E-07 | 1.46E+00 | | Eddy Viscosity | 1.85E-03 | 3.77E-02 | | Temperature | 3.00E+02 | 3.42E+02 | | Static Enthalpy | 7.70E+03 | 1.82E+05 | +--------------------------------------------------------------------+ Domain Name: Tube +--------------------------------------------------------------------+ | Variable Name | min | max | +--------------------------------------------------------------------+ | Density | 7.85E+03 | 7.85E+03 | | Specific Heat Capacity at Constant Pressure| 4.34E+02 | 4.34E+02 | | Thermal Conductivity | 6.05E+01 | 6.05E+01 | | Static Entropy | 5.37E+01 | 2.89E+02 | | Temperature | 3.37E+02 | 5.80E+02 | | Static Enthalpy | 1.71E+04 | 1.22E+05 | +--------------------------------------------------------------------+ +--------------------------------------------------------------------+ | CPU Requirements of Numerical Solution - Total | +--------------------------------------------------------------------+ Subsystem Name Discretization Linear Solution (secs. %total) (secs. %total) ---------------------------------------------------------------------- Momentum and Mass - 1 2.82E+02 6.5 % 6.73E+01 1.5 % Momentum and Mass - 2 1.18E+03 27.0 % 3.04E+02 7.0 % Heat Transfer 6.91E+02 15.9 % 2.57E+02 5.9 % TurbKE and Diss.K - 1 6.90E+01 1.6 % 2.88E+01 0.7 % TurbKE and Diss.K - 2 3.49E+02 8.0 % 2.03E+02 4.7 % -------- ------- -------- ------ Subsystem Summary 2.57E+03 59.0 % 8.60E+02 19.8 %
127

Variable Updates 2.45E+02 5.6 % GGI Intersection 4.00E-01 0.0 % File Reading 1.34E+01 0.3 % File Writing 2.68E+01 0.6 % Miscellaneous 6.37E+02 14.7 % -------- Total 4.35E+03 +--------------------------------------------------------------------+ | Job Information at End of Run | +--------------------------------------------------------------------+ +---------------------------+------+----------+----------+-----------+ | Host | Mesh | Job Finished | CPU | | | Part | DD/MM/YY | hh:mm:ss | seconds | +---------------------------+------+----------+----------+-----------+ | ETL-WA138-026 | 1 | 22/08/14 | 20:13:33 | 1.087E+03 | | | 2 | 22/08/14 | 20:13:33 | 1.087E+03 | | | 3 | 22/08/14 | 20:13:33 | 1.087E+03 | | | 4 | 22/08/14 | 20:13:33 | 1.088E+03 | +---------------------------+------+----------+----------+-----------+ Total wall clock time: 1.087E+03 seconds or: ( 0: 0: 18: 7.422 ) ( Days: Hours: Minutes: Seconds ) --> Final synchronization point reached by all partitions. End of solution stage. +--------------------------------------------------------------------+ | The results from this run of the ANSYS CFX Solver have been | | written to | | C:/SCRATCH/Erik_K/Baseline_4_pending_tasks/dp0_CFX_Solution/Fluid | | Flow CFX_005.res | +--------------------------------------------------------------------+ This run of the ANSYS CFX Solver has finished.
128

APPENDIX B
Table 8. Inlet and outlet temperatures and energy balance from ANSYS CFX model runs. Exhaust (Cp,exh = 1004.4 W/Kg.K) Water (Cp,exh = 4181.7 W/Kg.K)
Run mexh [Kg/s] Reexh Texh,in [K] Texh,out [K] mwater
[Kg/s] Rewater Twater,in
[K] Twater,out
[K] Energy In
[W] Energy Out
[W]
Energy Balance
(%) 1 0.023
19,992 772.776 700.14 0.1156 8,270 300 303.509 162873.409 162891.697 0.011%
2 0.1156 100,482 772.87 729.349 0.1156
8,270 300 310.539 234758.241 234799.677 0.018%
3 0.23 199,922 772.908 739.887 0.1156
8,270 300 315.921 323572.379 323640.415 0.021%
4 0.4612 400,886 772.94 749.221 0.1156
8,270 300 322.949 503069.796 503176.111 0.021%
5 0.023 19,992 772.756 730.868 0.1156
8,270 300 302.021 162872.947 162882.244 0.006%
6 0.1156 100,482 772.848 747.659 0.1156
8,270 300 306.131 234755.686 234794.779 0.017%
7 0.23 199,922 772.89 753.712 0.1156
8,270 300 309.302 323568.221 323634.501 0.020%
8 0.4612 400,886 772.925 758.576 0.1156
8,270 300 313.666 503062.847 503022.176 -0.008%
9 0.023 19,992 772.778 643.97 0.1156
8,270 300 306.167 162873.455 162878.991 0.003%
10 0.1156 100,482 772.875 694.289 0.1156
8,270 300 318.913 234758.821 234776.937 0.008%
1 0.23 199,922 772.914 713.271 0.1156
8,270 300 328.56 323573.765 323601.549 0.009%
12 0.4612 400,886 772.945 730.396 0.1156
8,270 300 340.857 503072.112 503112.628 0.008%
13 0.023 19,992 772.684 677.979 0.1156
8,270 300 304.563 162871.284 162889.259 0.011%
129

14 0.1156 100,482 772.838 718.498 0.1156
8,270 300 313.187 234754.525 234819.837 0.028%
15 0.23 199,922 772.889 732.729 0.1156
8,270 300 319.417 323567.990 323676.813 0.034%
16 0.4612 400,886 772.93 744.732 0.1156
8,270 300 327.348 503065.163 503223.171 0.031%
17 0.023 19,992 772.762 663.377 0.1156
8,270 300 305.258 162873.086 162887.902 0.009%
18 0.1156 100,482 772.885 709.093 0.1156
8,270 300 315.435 234759.982 234814.529 0.023%
19 0.23 199,922 772.922 726.433 0.1156
8,270 300 322.393 323575.613 323660.974 0.026%
20 0.4612 400,886 772.948 741.283 0.1156
8,270 300 330.603 503073.502 503198.975 0.025%
2 0.023 19,992 772.823 695.369 0.1156
8,270 300 303.714 162874.495 162880.579 0.004%
22 0.1156 100,482 772.931 727.371 0.1156
8,270 300 310.984 234765.323 234785.129 0.008%
23 0.23 199,922 772.964 738.716 0.1156
8,270 300 316.43 323585.316 323615.953 0.009%
24 0.4612 400,886 772.983 748.594 0.1156
8,270 300 323.469 503089.715 503137.036 0.009%
25 0.023 19,992 772.782 701.102 0.1156
8,270 300 303.447 162873.548 162883.949 0.006%
26 0.1156 100,482 772.881 731.062 0.1156
8,270 300 310.124 234759.518 234797.958 0.016%
27 0.23 199,922 772.919 741.754 0.1156
8,270 300 315.021 323574.920 323636.650 0.019%
28 0.4612 400,886 772.949 751.065 0.1156
8,270 300 321.166 503073.965 503168.395 0.019%
29 0.023 19,992 772.771 699.445 0.1156
8,270 300 303.528 162873.293 162884.826 0.007%
30 0.1156 100,482 772.863 728.327 0.1156
8,270 300 310.788 234757.428 234801.381 0.019%
3 0.23 199,922 772.901 738.468 0.1156
8,270 300 316.461 323570.762 323573.647 0.001%
130

32 0.4612 400,886 772.933 748.121 0.1156
8,270 300 324.013 503066.553 503180.901 0.023%
33 0.023 19,992 772.806 706.07 0.1156
8,270 300 303.209 162874.102 162883.665 0.006%
34 0.1156 100,482 772.912 738.26 0.1156
8,270 300 308.385 234763.117 234793.067 0.013%
35 0.23 199,922 772.946 749.005 0.1156
8,270 300 311.533 323581.157 323625.603 0.014%
36 0.4612 400,886 772.97 757.573 0.1156
8,270 300 314.882 503083.693 503145.377 0.012%
37 0.023 19,992 772.767 697.886 0.1156
8,270 300 303.604 162873.201 162885.550 0.008%
38 0.1156 100,482 772.857 725.499 0.1156
8,270 300 311.476 234756.731 234805.608 0.021%
39 0.23 199,922 772.817 735.494 0.1156
8,270 300 318.045 323551.357 323652.330 0.031%
40 0.4612 400,886 772.925 744.679 0.1156
8,270 300 327.351 503062.847 503200.070 0.027%
4 0.023 19,992 772.777 700.227 0.1156
8,270 300 303.489 162873.432 162884.038 0.007%
42 0.1156 100,482 772.872 729.58 0.1156
8,270 300 310.482 234758.473 234798.944 0.017%
43 0.23 199,922 772.909 740.098 0.1156
8,270 300 315.816 323572.610 323638.401 0.020%
44 0.4612 400,886 772.939 749.378 0.1156
8,270 300 322.749 503069.332 503152.157 0.016%
131

THIS PAGE INTENTIONALLY LEFT BLANK
132

LIST OF REFERENCES
Agrawal, A. K., & Sengupta, S. (1993). Laminar fluid flow and heat transfer in an annulus with an externally enhanced inner tube. International Journal of Heat and Fluid Flow, 14(1), 54‒63.
Akpinar, E. K. (2006). Evaluation of heat transfer and exergy loss in a concentric double pipe exchanger equipped with helical wires. Energy Conversion and Management, 47, 3473‒3486.
Albadr, J., Tayal, S., & Alasadi, M. (2013). Heat transfer through heat exchanger using Al2O3 nanofluid at different concentrations. Case Studies in Thermal Engineering 1, 38–44.
ANSYS. (2013, November). ANSYS CFX-Solver theory guide. Canonsburg, PA: ANSYS, Inc.
Bailey, M. M. (1985). Comparative evaluation of three alternative power cycles for waste heat recovery from the exhaust of adiabatic diesel engines. Washington, DC: U.S. Department of Energy.
BCS. (2008). Waste heat recovery: Technology and opportunities in U.S. industry. Washington, DC: U.S. Department of Energy.
Boyce, M. P. (2012). Effect of controllable losses to the output and heat rate. In Gas turbine engineering handbook (4th ed., p. 801). Houston, TX: Gulf Professional Publishing.
Breaux, D., & Davies, K. (1978, April). Design and service of a marine waste heat boiler. Naval Engineers Journal, 165‒178.
Carapellucci, R., & Giordano, L. (2012, April). The Recovery of Exhaust Heat from Gas Turbines. In V. Konstantin (Ed.), Efficiency, performance and robustness of gas turbines (pp. 165‒190). InTech. doi:10.5772/37920.
CHP Focus. (2014). Gas turbine performance. Retrieved August 10, 2014, from http://chp.decc.gov.uk/cms/gas-turbine-performance/
Daniels, D. G. (2014, Feb). How to identify, prevent waterside failure mechansims in your HRSG. Retrieved February 8, 2014, from CCJ Online Combined Cycle Journal website: http://www.ccj-online.com/3q-2005/grsg-waterside-failure/
Deputy Assistant Secretary of the Navy (DASN) Energy Office. (2010, October). Department of the Navy’s Energy Program for Security and Independence. Retrieved August 9, 2014, from http://www.navy.mil/secnav/
133

Dooley, R., Paterson, S., & Pearson, M. (2005). Diagnostic/troubleshooting monitoring to identify damaging cycle chemistry or thermal transients in heat recovery steam generator pressure parts. Palo Alto, CA: Electrical Power Research Institute.
Durmus, A. (2002). Heat transfer and energy loss in a concentric heat exchanger with snail entrance. International Communication Heat Mass Transfer, 29(3), 303‒312.
EPRI. (2005). Heat exchanger thermal performance margin guideline. Palo Alto, CA: Electrical Power Research Institute.
———. (2009). HRSG startup and shutdown guidelines for avoiding heat recovery steam generator pressure part failure. Palo Alto, CA: Electric Power Research Institute.
Greenship.org. (2014). Green ship of the future. Retrieved July 31, 2014, from Greenship website: http://www.greenship.org/fpublic/greenship/dokumenter /GSF%20brochure%20-%20maga/Green%20Shipping%20is% 20the%20future.pdf
Halkola, J. T., Campbell, A., & Jung, D. (1983, July). RACER conceptual design. Journal of Engineering for Power, 105, 621‒626.
Hield, P. (2011). The effect of back pressure on the operations of a diesel engine. Victoria, Australia: Maritime Platforms Division, Defense Science and Technology Organization.
Incropera, F. P., Bergman, T. L., Lavine, A. S., & Dewitt, D. P. (2011). Introduction to heat transfer (6th ed.). Hoboken, NJ: John Wiley & Sons, Inc.
Kakac, S., & Liu, H. (2002). Heat Exchangers Selection, Rating and Thermal design (2nd ed.). Danvers, MA: CRC Press.
Khalil, A., Zohir, A., & Farid, A. (2010). Heat transfer characteristics and friction of turbulent swirling air flow through abrupt expansion. American Journal of Scientific and Industrial Research, 1(2), 364‒374.
Kreith, F., & Margolis, D. (1959). Heat transfer and friction in turbulent vortex flow. Applied Scientific Research Section A, 8(1), 457‒473.
Macdonald, J. A. (2014, May). Energy-tech. Retrieved August 4, 2014, from http://www.energy-tech.com/article.cfm?id=17567
Masliyah, J., & Nandakumar, K. (1976). Heat transfer in internally finned tubes. Journal of Heat Transfer, 257‒261.
Mastronarde, T. P. (1982, April). Energy conservation utilizing waste heat boilers - The challenges, problems and solutions. Naval Engineers Journal, 277‒285.
134

Munson, B. R., Young, D. F., Okiishi, T. H., & Huebsch, W. W. (2009). Fundamentals of fluid mechanics (6th ed.). Hoboken, NJ: John Wiley & Sons, Inc.
Paanu, T., Niemi, S., & Rantanen, P. (2012). Waste heat recovery – Bottoming cycle alternatives. Vaasa, Finland: University of Vaasa.
Paratherm. (n.d.). High temperature heat transfer fluids. Retrieved July 10, 2014, from http://www.paratherm.com/heat-transfer-fluids/high-temperature-heat-transfer-fluids/paratherm-hr/
Pardhi, C., & Baredar, P. (2012). Performance improvement of double pipe heat exchanger by using turbulator. International Journal of Engineering Science & Advanced Technology, 2(4), 881‒885.
Patankar, S. V. (1980). The turbulence-kinetic-energy equation. New York: Hemisphere Publishing Corporation.
Patel, M., Parmar, K., & Soni, U. R. (2014). Enhance the performance of heat exchangers with twisted tape insert: A review. International Journal on Recent and InnovationTrends in Computering and Communication, 2(2), 202‒207.
Rains, D. A., Beyer, K. M., Keene, W., Lindgren, J. J., Mogil, E., Page, T., . . . Youngworth, J. (1976, October). Design appraisal - DD-963. Naval Engineers Journal, 43‒61.
Sane, N., Taji, S. G., & Pachegaonkar, S. S. (2014). Performance analysis of double pipe heat exchnager with annular twisted tape insert. International Journal of Engineering and Advanced Technology, 3(3), 402‒406.
Sathe, S. B., & Millsaps, K. (2014). U.S. Navy WHR Capability Roadmap. Monterey, CA: Mechanical and Aerospace Engineering Department, Naval Postgraduguate School.
Shah, R. K., & Sekulic, D. P. (2002). Fundamentals of heat exchanger design. Hoboken, NJ: John Wiley & Sons.
Shu, H.-T., & Kuo, S. (1982). Flow distribution control characteristics in marine gas turbine waste heat steam generators. East Hartford, CT: United Technologies Research Center.
Special Metals Corporation. (2013, August 13). Special metals. Retrieved July 5, 2014, from www.specialmetals.com
Woodyard, D. (2004). Pounder’s marine diesel engines and gas turbine (8th ed.). Oxford, UK: Elsevier Ltd.
135

Yarin, L. (2012). The Pi-Theorem: Applications to fluid mechanics and heat and mass transfer. New York: Springer.
Zamanzadeh, M., Larkin, E. S., Bayer, G. T., & Linhart, W. J. (2007). Failure analysis and investigation methods for boiler tube failures. Paper presented at the Waterside Boiler Tube Failure Symposium, Pittsburgh, PA.
136

INITIAL DISTRIBUTION LIST
1. Defense Technical Information Center Ft. Belvoir, Virginia 2. Dudley Knox Library Naval Postgraduate School Monterey, California
137
Copyright © 2022 FDOKUMEN