
Real-Time Measurements of Jet Aircraft Engine Exhaust
11
Real-Time Measurements of Jet Aircraft Engine Exhaust Fred Rogers, Pat Arnott, Barbara Zielinska, and John Sagebiel Division of Atmospheric Sciences, Desert Research Institute, Reno, NV Kerry E. Kelly, David Wagner, JoAnn S. Lighty, and Adel F. Sarofim Institute for Combustion & Energy Studies, University of Utah, Salt Lake City, UT ABSTRACT Particulate-phase exhaust properties from two different types of ground-based jet aircraft engines— high-thrust and turboshaft—were studied with real-time instruments on a portable pallet and additional time-integrated sam- pling devices. The real-time instruments successfully characterized rapidly changing particulate mass, light ab- sorption, and polycyclic aromatic hydrocarbon (PAH) content. The integrated measurements included particu- late-size distributions, PAH, and carbon concentrations for an entire test run (i.e., “run-integrated” measure- ments). In all cases, the particle-size distributions showed single modes peaking at 20 – 40nm diameter. Measure- ments of exhaust from high-thrust F404 engines showed relatively low-light absorption compared with exhaust from a turboshaft engine. Particulate-phase PAH measure- ments generally varied in phase with both net particulate mass and with light-absorbing particulate concentrations. Unexplained response behavior sometimes occurred with the real-time PAH analyzer, although on average the real- time and integrated PAH methods agreed within the same order of magnitude found in earlier investigations. INTRODUCTION Aircraft emissions account for 6% of mobile source par- ticulate matter emissions, with military aircraft emissions composing 13% of those emissions. 1,2 Aircraft can be one of the major emission sources of either a civilian or mil- itary airport. The relative importance of emission sources is quantified by means of emission factors that give the amount of a given exhaust constituent generated per unit of fuel (or, alternatively, per unit of distance traveled, in the case of motor vehicles). For motor vehicles, measure- ment approaches including highway tunnel studies and constant-velocity sampling systems have led to a wide range of emission factor measurements pertaining to both gas and particle phase exhaust species. Factors inherent in jet engines—whether they operate on a reaction or on a turboshaft principle—include high exhaust temperatures and velocities. These factors render jet engine emission factors difficult to measure by “traditional” methods such as exposure of filter media, and there is no analog to the use of highway tunnels for isolating jet aircraft exhaust from other sources. Real-time particulate matter measurement methods offer some advantages in jet exhaust measurements be- cause of their potential ability to obtain data in a short period of time (e.g., compared with filter-based methods) and to track and quantify rapid changes in exhaust prop- erties. This study examined the performance of three rel- atively new real-time particulate measurement methods applied to jet aircraft exhaust in realistically difficult field conditions involving extremely high acoustic noise and other hazards. We report tests conducted at the North Island Navy Base, San Diego, CA, in January and February, 2002, fo- cusing on Navy jet engine exhaust emissions both from tethered aircraft and from engine maintenance test cells. The main objective of the North Island experiment was to develop and evaluate a portable instrument pallet capable of providing fundamental particulate characterizations in real time. The instrument pallet included a photoelectric aerosol sensor (PAS) 3 to provide real-time measurements IMPLICATIONS Aircraft engines can be a significant source of particulate emissions, especially in terms of health effects for individ- uals who work at airports and flight-support facilities. In contrast to motor vehicle engine exhaust, jet engine emis- sion measurements usually involve much more difficult lo- gistics. This study describes progress with a portable, real- time instrument pallet that characterizes particulate mass, light absorption, and PAH content. This approach allows jet engine emissions to be quantified rapidly with minimum interference with aircraft operations. Overall, success with this method also marks one more sign of progress away from costly, non-real-time methods and towards real-time particulate sensors. TECHNICAL PAPER ISSN 1047-3289 J. Air & Waste Manage. Assoc. 55:583–593 Copyright 2005 Air & Waste Management Association Volume 55 May 2005 Journal of the Air & Waste Management Association 583
-
Upload
independent -
Category
Documents
-
view
3 -
download
0
Transcript of Real-Time Measurements of Jet Aircraft Engine Exhaust

Real-Time Measurements of Jet Aircraft Engine Exhaust
Fred Rogers, Pat Arnott, Barbara Zielinska, and John SagebielDivision of Atmospheric Sciences, Desert Research Institute, Reno, NV
Kerry E. Kelly, David Wagner, JoAnn S. Lighty, and Adel F. SarofimInstitute for Combustion & Energy Studies, University of Utah, Salt Lake City, UT
ABSTRACTParticulate-phase exhaust properties from two differenttypes of ground-based jet aircraft engines—high-thrustand turboshaft—were studied with real-time instrumentson a portable pallet and additional time-integrated sam-pling devices. The real-time instruments successfullycharacterized rapidly changing particulate mass, light ab-sorption, and polycyclic aromatic hydrocarbon (PAH)content. The integrated measurements included particu-late-size distributions, PAH, and carbon concentrationsfor an entire test run (i.e., “run-integrated” measure-ments). In all cases, the particle-size distributions showedsingle modes peaking at 20–40nm diameter. Measure-ments of exhaust from high-thrust F404 engines showedrelatively low-light absorption compared with exhaustfrom a turboshaft engine. Particulate-phase PAH measure-ments generally varied in phase with both net particulatemass and with light-absorbing particulate concentrations.Unexplained response behavior sometimes occurred withthe real-time PAH analyzer, although on average the real-time and integrated PAH methods agreed within the sameorder of magnitude found in earlier investigations.
INTRODUCTIONAircraft emissions account for 6% of mobile source par-ticulate matter emissions, with military aircraft emissionscomposing 13% of those emissions.1,2 Aircraft can be oneof the major emission sources of either a civilian or mil-itary airport. The relative importance of emission sourcesis quantified by means of emission factors that give theamount of a given exhaust constituent generated per unitof fuel (or, alternatively, per unit of distance traveled, inthe case of motor vehicles). For motor vehicles, measure-ment approaches including highway tunnel studies andconstant-velocity sampling systems have led to a widerange of emission factor measurements pertaining to bothgas and particle phase exhaust species. Factors inherent injet engines—whether they operate on a reaction or on aturboshaft principle—include high exhaust temperaturesand velocities. These factors render jet engine emissionfactors difficult to measure by “traditional” methods suchas exposure of filter media, and there is no analog to theuse of highway tunnels for isolating jet aircraft exhaustfrom other sources.
Real-time particulate matter measurement methodsoffer some advantages in jet exhaust measurements be-cause of their potential ability to obtain data in a shortperiod of time (e.g., compared with filter-based methods)and to track and quantify rapid changes in exhaust prop-erties. This study examined the performance of three rel-atively new real-time particulate measurement methodsapplied to jet aircraft exhaust in realistically difficult fieldconditions involving extremely high acoustic noise andother hazards.
We report tests conducted at the North Island NavyBase, San Diego, CA, in January and February, 2002, fo-cusing on Navy jet engine exhaust emissions both fromtethered aircraft and from engine maintenance test cells.The main objective of the North Island experiment was todevelop and evaluate a portable instrument pallet capableof providing fundamental particulate characterizations inreal time. The instrument pallet included a photoelectricaerosol sensor (PAS)3 to provide real-time measurements
IMPLICATIONSAircraft engines can be a significant source of particulateemissions, especially in terms of health effects for individ-uals who work at airports and flight-support facilities. Incontrast to motor vehicle engine exhaust, jet engine emis-sion measurements usually involve much more difficult lo-gistics. This study describes progress with a portable, real-time instrument pallet that characterizes particulate mass,light absorption, and PAH content. This approach allows jetengine emissions to be quantified rapidly with minimuminterference with aircraft operations. Overall, success withthis method also marks one more sign of progress awayfrom costly, non-real-time methods and towards real-timeparticulate sensors.
TECHNICAL PAPER ISSN 1047-3289 J. Air & Waste Manage. Assoc. 55:583–593
Copyright 2005 Air & Waste Management Association
Volume 55 May 2005 Journal of the Air & Waste Management Association 583

of particle-phase polycyclic aromatic hydrocarbon (PAH)compounds, which are believed to be critically importantto human health. The instruments also included a DesertResearch Institute photoacoustic analyzer (PA)4,5 to pro-vide real-time measurements of light-absorbing particles(generally black carbon [BC], or “soot”) and a DustTrak([DT], TSI Inc., St. Paul, MN) particle mass monitor toprovide real-time measurements of exhaust particle massconcentrations.
To evaluate the PAS, PA, and DT, three time-inte-grated methods were employed, and we use the term“integrated” to mean that the results for each run areaggregated over the entire run. A Gundel denuder sampler(University Research Glassware Corp., Chapel Hill, NC)6
provided phase-resolved PAH data integrated over theduration of a given test; its results were compared withthe PAS results. A scanning mobility particle sizer (SMPS,TSI Inc., St. Paul, MN)7 provided near-real time particulatesize distributions. A cascade impactor (MSP Corp., Shor-eview, MN) provided run-integrated particulate mass andcarbon content; its results were compared with real-timeparticulate mass and light absorption measurements.
METHODSThe experiment objectives were addressed at two siteswithin the North Island facility. With the cooperation ofthe North Island staff, measurements were taken at a siteon the active flightline tarmac, directly from the exhaustsof tethered aircraft. The flightline tests used F404-GE-400engines in twin-engine F-18 aircraft. This site requiredthat instruments be mounted on a rolling pallet thatcould be deployed rapidly out onto the tarmac and just asrapidly rolled back to avoid any interference with theNavy’s ongoing operations (Figure 1).
Measurements were also taken at the North IslandAircraft Intermediate Maintenance Department (AIMD), afacility in which newly overhauled jet engines are sub-jected to tests at varying power levels before they arecertified for flight use. We report one AIMD test involvinga dismounted turboshaft T700-GE-401 engine, found in
Seahawk, Super Cobra, and Jayhawk helicopters; for thistest, the instruments were set up at a fixed location adja-cent to an open-air engine test stand that was equippedwith an engine dynamometer (Figure 2).
All engines burned JP-5 aviation fuel, which contains86.9% carbon by weight.8
Table 1 shows the instruments deployed at each site.The operating principles of the PAS, PA, and DT are de-scribed in detail in the references cited in Table 1. Briefsummaries of the instruments follow.
The PAS instrument responds to electrons emitted fromirradiated particles that contain surface layers of PAH com-pounds. Photoelectron emission leaves the particle in a pos-itive charge state, and the sums of the positive charges aremeasured with an electrometer. Previous work has shownthat the response of the PAS is often proportional to the sumof the concentrations of a restricted list of particle-phasePAH compounds known as the “Siegmann” sum after theresearcher who first proposed it (e.g., see McDow et al.9). Asa working hypothesis during this study, we estimated thatthe following 14 particle-phase PAH measurements consti-tuted a modified “Siegmann Sum”: phenanthrene, fluor-anthene, pyrene, benzo(b)naptho(2,1-d)thiophene, ben-zo(c)phenanthrene, benz(a)anthracene, chrysene plustriphenylene, benzo(b!j!k)fluoranthene, benzo(e)pyrene,benzo(a)pyrene, indeno(1,2,3-cd)pyrene, benzo(ghi)-perylene, dibenzo(ah!ac)anthracene, and coronene. Themain difference between the Siegmann sum and the modi-fied Siegmann sum is that we report chrysene and triph-enylene, the isomers of benzofluoranthene, and the isomersof dibenzoanthracene together because they coelute or par-tially coelute. In previous studies, researchers have foundthat a signal level of 1 femptoamp registered by PAS instru-ments corresponds to "1–3 ng/m3 of particle-bound Sieg-mann Sum PAH compounds.10-12
The PAS was equipped with an inlet heated to 150 °C,which has been found helpful in producing stable read-ings on the instrument. The heated inlet removes inter-fering volatile compounds, possibly including liquid wa-ter. However, this procedure eliminates more volatile PAHcompounds from the measurement.
Figure 1. Flightline experimental setup. Figure 2. AIMD experimental setup.
Rogers et al.
584 Journal of the Air & Waste Management Association Volume 55 May 2005

The PA directly measures the absorption of visiblelight (wavelength 1047 nm) by gases and particles. Theabsorption because of gases usually can be neglected orcorrected for by calibration, so particulate light absorp-tion is measured. For combustion particles, it is usuallypossible to establish a direct relationship between partic-ulate light absorption and particulate mass concentra-tions, by means of the specific light absorption parameter.Specific absorption parameters generally vary little for agiven source, so it is possible to compare measures of lightabsorption with measures of particulate mass concentra-tion. For the purposes of these tests, the PA’s data acqui-sition system was programmed with a specific absorptioncoefficient of 5 m2/g at an illumination wavelength of1047 nm.
The PAS and PA responses to exhaust from diesel- andgasoline-fueled motor vehicles are compared in a com-panion paper.5
The DT uses light scattering and an empirical calibra-tion to provide real-time particulate mass concentrationdata; the lower size detection limit of the DT when sam-pling non–light-absorbing particles is estimated to be"100 nm. Because of dipole moment effects, light-absorb-ing particles scatter more than non–light-absorbing par-ticles when they are much smaller than the wavelength,so scattering instruments can detect small “black” parti-cles better than “white” ones. A theoretical analysis of theDT is presented in Appendix A.
The DT was chosen for this study on the basis ofearlier experience in which it was found to be quite usefulin terms of fast time response, low signal-to-noise ratio,simplicity, and field worthiness.13 Moosmuller et al.13 alsofound that the coefficient of variation of DT measure-ments of diesel exhaust was less than the Code of FederalRegulations filter measurements on the same samples,which suggests that the precision of DT measurements isgood. The main shortcoming of the DT is that it must beempirically calibrated for the given aerosol type that it ismeasuring. The version of the DT that we used in this
study was calibrated by using test dust with a mass scat-tering efficiency of "1 m2/g.
The PAS, PA, and DT were deployed on the rollingpallet for all tests at the flightline site. The Aircraft Envi-ronmental Support Office (AESO) at North Island de-ployed an SMPS for F404 Runs 3–5, and the University ofUtah deployed an SMPS at the AIMD site. For the flight-line tests, exhaust samples were extracted from engineexhaust with a 5/8-inch, 2-m stainless-steel line leading toan eductor/dilutor system. The dilution ratio for theflightline tests was 1:2.1 (one part exhaust sample to 2.1parts particle-free, dry air).
The AIMD test also used an eductor-dilutor systemwith a dilution ratio of 4.1:1. The eductor system wasconnected to a 1-m stainless-steel sample inlet probe thatwas inserted into the helicopter engine exhaust plume.The sampling instruments were positioned close to theengine test stand, and a 2-m line conveyed diluted samplefrom the eductor to the instrument distribution tees.
The integrated instruments at the AIMD site includeda Gundel denuder sampler for the phase-resolved collec-tion of PAH compounds.6 The denuder sampler, pur-chased from the University Research Glassware Corp.(URG, Chapel Hill, NC), consisted of three stages; the firststage was an 8-channel denuder section (52-mm outerdiameter, 600-mm length) coated with polystyrene-divi-nylbenzene resin XAD-4, which strips the gas-phase spe-cies from the airstream before collection of the particleson a second stage, consisting of 47 mm Teflon-impreg-nated glass fiber (TIGF, T60 # 20) filter. The third stageconsisted of polyurethane foam plugs (1-inch diameter)in combination with the 5 g of adsorbent resin XAD-4(PUF/XAD/PUF “sandwich” cartridge) that were placeddownstream of the filter to assess “blow off” or volatiliza-tion loss of semi-volatile PAH from the particles. TheGundel denuder sampler was operated at a flow rate of 90L/m; more detail regarding this device is given in a com-panion paper.14
Table 1. Instruments deployed at AIMD and flightline sites.
Instrument Purpose Reference(s) Site
Photoelectric aerosol sensor (EcoChem Inc.) Real-time PAH detection and quantification 3,5 Flightline and AIMDPhotoacoustic analyzer Real-time detection and quantification of light-absorbing particles 4,5 Flightline and AIMDDustTrak (TSI Inc.) Real-time estimation of particulate mass concentration 13 Flightline and AIMD
Scanning Mobility Particle Sizer (TSI Inc.) Near-real time measurement of particle size distributions 7 Flightline and AIMDGundel denuder sampler Measurements of PAH and other organic compounds in both gas
and condensed phases6,14 AIMD only
MOUDI (microorifice uniform deposit impactor, MSP Corp.) Non-real time measurement of PM and carbon 15 AIMD onlyCanister sampler Measurement of CO2, CO, and CH4 integrated over each test run Built for project AIMD only
Rogers et al.
Volume 55 May 2005 Journal of the Air & Waste Management Association 585

The MOUDI15 cascade impactor (MSP Corp., Shore-view, MN) was operated for the T700 test at its design flowrate of 30 L/min. Aluminum foil substrates and quartzafterfilters exposed in the MOUDI were stored in icechests and shipped back to the Desert Research Institute forgravimetric and carbon analyses. Details of these analysismethods are given in Chow.16
Table 2 summarizes the test runs reported in this study.
RESULTSFlightline Tests
Tests 2, 3, and 4 were reasonably illustrative of the entiredata set and are considered in detail in this article. Adetailed record of the data obtained from all test runs isavailable in the Final Report to the Strategic Environmen-tal Research and Development Program.17
Figure 3 shows the real-time data time series fromF404 test 2. F404 test 2 included power-setting increasesfrom 65% to 70%, and from 70% to 80%, at 260 and 441sec of elapsed time, respectively. The DT data decreasedinversely as the power setting increased, with a step at the70–80% transition.
The PA results also decreased as the power settingsincreased, with a small spike at the 70–80% transition. At461 sec of elapsed time, the PA signal decreased to thenegative 1–16 $g/m3 range, which corresponded to thelower detectable limit of the measurement with a smallerror in the instrument’s zero setting.
The PAS data for this test exhibited regular steps thatdecreased in magnitude as the power setting increased.
Figure 4 shows the real-time data time series fromF404 test 3. F404 test 3 consisted of five segments, withpower-setting changes from 65% to 70%, 70% to 80%,80% to idle, and idle to 80%, at elapsed times of 729,1070, 1194, and 1398 sec, respectively. This test used thesame aircraft and engine as were involved in the previoustest. The PAS data exhibited roughly the same magnitudesfor the 65% and the idle segments, which is probably areflection of the fact that those two settings are nearlyidentical. The PAS output decreased from the 65% to the
70% segment, and more so for the two 80% segments. ThePAS signal levels are quite reproducible for the two 80%segments. However, the PAS signal corresponding to the70% power setting was "800 femptoamps during test 2and "1200 femptoamps for test 3.
The PA data exhibited spikes following the 1070 and1398 transitions, and signal levels were greatest for the65% and idle power settings. Again, however, the PA’sreadings of light-absorbing particle mass concentrationsare well below the mass concentration readings of the DT,indicating that much of the overall particle mass is non–light-absorbing.
The DT data varied quite widely for this run, butgenerally varied inversely with the engine power setting.The wide variation in the DT signal during the initial 65%power segment remains unexplained.
Figure 5 shows the real-time data time series fromF404 test 4. F404 test 4 consisted of two segments,beginning at 70% power and changing to a 65% powersetting at 243 sec of elapsed time. Once again, the PASand DT data indicate that particulate emission concen-trations were greater for near-idle conditions than forthe 70% power setting. The PA again recorded only verylow levels of light-absorbing particles. Overall, the threeinstruments’ signals were lower for this run than for any ofthe others.
AIMD T700 TestFigure 6 displays the data timeseries from the turboshaftT700-GE-401 engine at theAIMD test pad. Table 3 showsthe available engine power set-ting information for this test,which was provided verbally bythe test operators. The enginepower setting was raised froman idle value to 98% of maxi-mum power, and back down to
Figure 3. Flightline test 2, F404 #164037.
Table 2. North Island test summary.
TestDesignator Location
Engine PowerSetting Range (%) Comments
F404 #1 Flightline 65–80 —F404 #2 Flightline 65–80 Same aircraft and engine as test 1F404 #3 Flightline 65–80 Same aircraft and engine as test 1F404 #4 Flightline 65–70 Second aircraftF404 #5 Flightline 65–70 Same aircraft as test 1, but test used second of two
enginesT700 AIMD 67–98 Dismounted engine on dynamometer test stand
Rogers et al.
586 Journal of the Air & Waste Management Association Volume 55 May 2005

the idle value in cycles that were determined by the re-quirements of evaluating the newly refurbished engine.
The power-setting observations are fairly detailed, butthe times recorded in the field notes seemed to lag behindthe times of major signal changes by 30–60 sec. Thus,power increases noted at elapsed times of 523, 1243, 1363,1903, 2203, and 2503 sec seem to result in rising PA andDT data steps at "560, 1310, 1400, 1960, 2260, and 2560sec, respectively. Similar relationships are found betweenthe power-setting decreases and the PA and DT decreasingdata steps. For example, the decreasing power settingsnoted at 883, 2083, and 2563 sec seem to correspond todecreasing data steps at "920, 2150, and 2620 sec, respec-tively.
The PA and DT data in the 2150–2460 sec time inter-val seem to vary inversely with the power setting. Thedata traces increase in a distinct step at "2260 sec, but thefield notes indicate that the engine power was decreasedfrom 94% to 88% in that sequence.
The PAS data trace exhibits a pronounced inversevariation in the elapsed time interval from "630 sec to"840 sec, during which the field notes indicate powersettings of 94% and 97%. The PAS signals decreased tovery low values, then increased at the end of the interval.
Particle Size DistributionsSMPS instruments were used at both the flightline andAIMD sites to obtain particle size distributions in the10–500 nm diameter interval. The SMPS does not operatein real time; rather, at least 100 sec are typically requiredto complete a single size distribution. We confine ourdiscussion to SMPS scans that were completed during thetime interval of a single engine power setting. Figure 7displays distributions obtained during F404 test 3, for the70%, 80%, idle, and 80% power-setting segments.
The distributions in Figure 7 all peak at "30 nm witha single mode. The greatest particle number concentra-tions were observed for the idle period. The lowest con-centrations were observed for the 70% period and thebrief 80% period that started at 1070 sec of elapsed time.The 70%, idle, and last 80% power-setting intervals re-sulted in multiple SMPS scans; their results were averagedto create the single curves shown in Figure 7. The longer80% period that started at 1398 sec resulted in the distri-bution falling between the lowest and highest cases inFigure 7. Therefore, an inconsistency was observed in
Figure 5. Flightline test 4, F404#164257, right engine.
Figure 4. Flightline test 3, F404 #164037, right engine.
Figure 6. The AIMD site, T700 engine test.
Table 3. Engine power settings for T700 test at AIMD.
Elapsed Time (sec) Power Setting
163 Idle (!68%)403 Accelerating523 Raising to 94%643 97%883 Decreasing to 68%
1243 Raising to 87%1363 Raising to 98%1423 Decreasing to 89%1903 Raising to 96%2083 Decreasing to 88%2203 Raising to 94%2383 Decreasing to 88%2503 Raising to 96%2563 Decreasing to 67%
Rogers et al.
Volume 55 May 2005 Journal of the Air & Waste Management Association 587

terms of the different distributions for the two 80% pow-er-setting intervals. Apart from this discrepancy, Figure 7shows that idle conditions again generated relatively highemissions.
A single size distribution obtained during F404 test 5,for a power setting of 70%, displays a similar single modepeaking at "40-nm diameter.17
Figure 8 shows size distribution data from the T700test at AIMD. The data displayed in Figure 8 include a4.1:1 dilution factor, compared with 2.1:1 for the flight-line tests. The 89% power distribution peaks at just over40-nm diameter compared with "20–30 nm for the idlecases. The two idle runs for the T700 are nearly identical,indicating that similar results were obtained for similarpower settings.
Summary of Real-Time and SMPS DataThe particle size data shown in Figures 7 and 8 indicatethat the majority of the T700 and F404 engine exhaustparticles were less than 100 nm in diameter. The T700
data suggest that greater engine power settings may causethe particle mode diameter to increase, but this was notobserved for the F404 tests.
The tendency for the signals of the real-time instru-ments to vary inversely with the F404 engine power set-tings may simply reflect the fact that jet engines take inmore air as the power setting increases. Very limited in-formation for the F404 engine indicates that its air intakevaries approximately in proportion to the power setting,and this is to be expected for jet engines that operate ona reaction principle. If correct, this quantification of theexhaust dilution would not explain all the variation seenin the F404 measurements. Furthermore, the T700 datavary in direct, rather than inverse, proportion to thepower setting.
All three real-time instruments’ signals registered stepchanges associated with the known engine power-settingvariations. The PAS data sometimes varied in an unex-pected manner, as illustrated for example by the spike inthe 250–300 sec elapsed time interval in Figure 5 and themin in the 600–800 sec interval in Figure 6. The PASreadings did not always return to the same values whenthe stated engine power settings were repeated.
The PA and the DT data track each other closely forthe T700 test, but in all the F404 cases, the PA readings, onaverage, were less than 10% of the DT readings. The PAand DT data often exhibited a transient maximum whenthe engine power setting was changed.
DISCUSSIONComparisons of Real-Time Data
Further insight into the real-time data is gained by com-paring different instruments, whenever possible.
Comparison of PAS and PAArnott et al.5 found that the PAS and PA responses toexhaust aerosols are often correlated, leading to the hy-pothesis that condensed-phase PAH compounds are oftenassociated with light-absorbing carbonaceous particles.
Figure 9 displays a comparison of the PAS and PAdata, averaged over corresponding engine power settingsof each test run.
The R2 measure of correlation in this comparison is0.58, which indicates the absence of a significant relation-ship. Further analysis of the data shows that the datapoint from Run 5 (PA reading 51 $g/m3; PAS reading 1629femptoamps) occupies an outlier position compared withthe data points from Runs 1–4. If the Run 5 data areremoved from the comparison, the R2 value increases to0.73 and the slope increases to 74.1, suggesting that per-haps one source differs from another in regard to theunderlying relationship between light-absorbing particleconcentrations and particle-bound PAH content.
Figure 7. Particle size distributions for flightline test 3, F404,#164307, right engine. The “average” in the legend denotes that theparticle size distribution is the average of multiple sequential particlesize distributions at the same engine setting. The single 80% particlesize distribution came from a single SMPS scan.
Figure 8. Particle size distributions for the AIMD site, T700 enginetest. These size distributions are the average of multiple sequentialSMPS scans.
Rogers et al.
588 Journal of the Air & Waste Management Association Volume 55 May 2005

Figure 10 displays the results of a similar comparisonfor the T700 test, for which the data from the first 97%power segment have been deleted. During this segment,beginning at 643 sec of elapsed time, the PAS signal de-creased in an unexplained manner. In the absence of anyother explanation, we suspect that the PAS data are spu-rious during much of this segment. The R2 measure ofcorrelation for the data in Figure 10 is 0.67, suggestingthat a weak relationship exists between particulate PAHand light-absorbing carbon. Given the greater dynamicrange of the PA readings for the T700 test compared withthe flightline results, the findings indicated in Figure 10are probably less uncertain than those in Figure 9. If oneremoves the data point at a PA reading of 3013 $g/m3 anda PAS reading of 6362 femptoamps, the R2 increases to0.79 and the slope changes to 2.24, indicating that thispoint may be an outlier.
The slopes of the two data comparisons (PAS/PA) arevery different—33 and 1.5 for the flightline and T700cases, respectively. Arnott et al.5 found a slope of "11 fora similar PAS-to-PA comparison involving exhaust fromgasoline and diesel vehicles.
Comparison of PA and DTThe PA data, which are concentrations of light-absorbingparticles, may be compared with the DT data, which areparticle mass concentrations. The purpose of the compar-ison is to see whether or not the PA readings are correlatedwith the readings of an empirically calibrated mass con-centration measurement device. For all five F404 tests, thePA and DT data were averaged over the correspondingpower-setting intervals; the resulting five-run data set isshown in Figure 11.
The data shown in Figure 11 indicate that there is aconsistent underlying relationship between the two datasets, with an R2 value of 0.87. The slope of "0.1 indicatesthat the PA detects about one tenth of the overall particlepopulation; this is the light-absorbing fraction of the par-ticulate mass concentration (as measured by the DT) forthe flightline tests. The x-intercept of "10 $g/m3 may bea reflection of differing lower particle size cutoffs for thetwo instruments.
Given the small particle sizes indicated by the SMPSdata, it is surprising that the DT instrument’s data reachessuch significant magnitudes. The variations in the DTsignal for the F404 tests may reflect variations in bothparticle size and light absorption, because the scatteringsignal from small particles is stronger if they are light-absorbing (details of the DT response are discussed inAppendix A).
The PA and DT data were also compared for the AIMDT700 test. Figure 12 shows DT data plotted against PAdata, using all data pairs from the run except for a eightoutlier pairs that were excluded. (Outlier pairs resulted,e.g., when a sudden spike occurred in the output of oneinstrument but not the other.) The number of valid datapairs and the number of excluded outlier pairs are speci-fied in the graph.
The data shown in Figure 12 indicate that the PA andDT data are strongly correlated, with a slope of 0.8. Theparticle size ranges covered by the two instruments are
Figure 11. Comparison of PA and DT data for all flightline exper-iments.
Figure 9. Comparison of averaged PAS and PA data from flightlineruns 1–5.
Figure 10. Comparison of averaged PA and PAS data for the AIMDT700 test.
Rogers et al.
Volume 55 May 2005 Journal of the Air & Waste Management Association 589
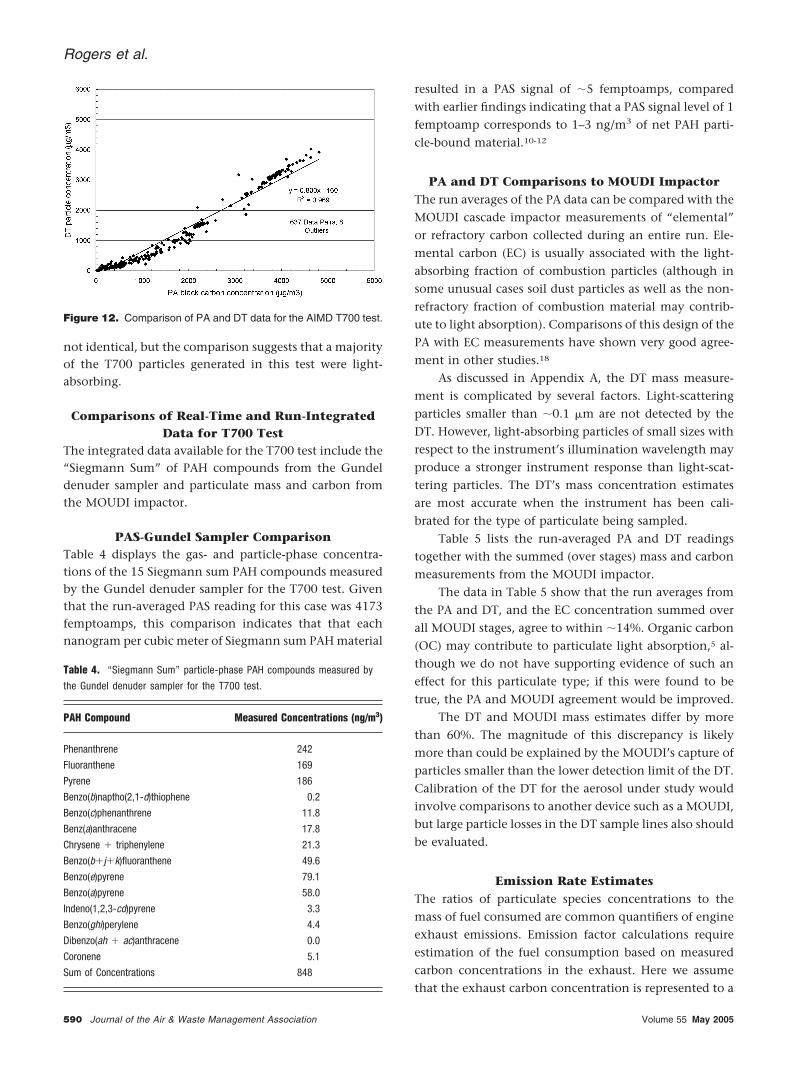
not identical, but the comparison suggests that a majorityof the T700 particles generated in this test were light-absorbing.
Comparisons of Real-Time and Run-IntegratedData for T700 Test
The integrated data available for the T700 test include the“Siegmann Sum” of PAH compounds from the Gundeldenuder sampler and particulate mass and carbon fromthe MOUDI impactor.
PAS-Gundel Sampler ComparisonTable 4 displays the gas- and particle-phase concentra-tions of the 15 Siegmann sum PAH compounds measuredby the Gundel denuder sampler for the T700 test. Giventhat the run-averaged PAS reading for this case was 4173femptoamps, this comparison indicates that that eachnanogram per cubic meter of Siegmann sum PAH material
resulted in a PAS signal of "5 femptoamps, comparedwith earlier findings indicating that a PAS signal level of 1femptoamp corresponds to 1–3 ng/m3 of net PAH parti-cle-bound material.10-12
PA and DT Comparisons to MOUDI ImpactorThe run averages of the PA data can be compared with theMOUDI cascade impactor measurements of “elemental”or refractory carbon collected during an entire run. Ele-mental carbon (EC) is usually associated with the light-absorbing fraction of combustion particles (although insome unusual cases soil dust particles as well as the non-refractory fraction of combustion material may contrib-ute to light absorption). Comparisons of this design of thePA with EC measurements have shown very good agree-ment in other studies.18
As discussed in Appendix A, the DT mass measure-ment is complicated by several factors. Light-scatteringparticles smaller than "0.1 $m are not detected by theDT. However, light-absorbing particles of small sizes withrespect to the instrument’s illumination wavelength mayproduce a stronger instrument response than light-scat-tering particles. The DT’s mass concentration estimatesare most accurate when the instrument has been cali-brated for the type of particulate being sampled.
Table 5 lists the run-averaged PA and DT readingstogether with the summed (over stages) mass and carbonmeasurements from the MOUDI impactor.
The data in Table 5 show that the run averages fromthe PA and DT, and the EC concentration summed overall MOUDI stages, agree to within "14%. Organic carbon(OC) may contribute to particulate light absorption,5 al-though we do not have supporting evidence of such aneffect for this particulate type; if this were found to betrue, the PA and MOUDI agreement would be improved.
The DT and MOUDI mass estimates differ by morethan 60%. The magnitude of this discrepancy is likelymore than could be explained by the MOUDI’s capture ofparticles smaller than the lower detection limit of the DT.Calibration of the DT for the aerosol under study wouldinvolve comparisons to another device such as a MOUDI,but large particle losses in the DT sample lines also shouldbe evaluated.
Emission Rate EstimatesThe ratios of particulate species concentrations to themass of fuel consumed are common quantifiers of engineexhaust emissions. Emission factor calculations requireestimation of the fuel consumption based on measuredcarbon concentrations in the exhaust. Here we assumethat the exhaust carbon concentration is represented to a
Figure 12. Comparison of PA and DT data for the AIMD T700 test.
Table 4. “Siegmann Sum” particle-phase PAH compounds measured bythe Gundel denuder sampler for the T700 test.
PAH Compound Measured Concentrations (ng/m3)
Phenanthrene 242Fluoranthene 169Pyrene 186Benzo(b)naptho(2,1-d)thiophene 0.2Benzo(c)phenanthrene 11.8Benz(a)anthracene 17.8Chrysene ! triphenylene 21.3Benzo(b!j!k)fluoranthene 49.6Benzo(e)pyrene 79.1Benzo(a)pyrene 58.0Indeno(1,2,3-cd)pyrene 3.3Benzo(ghi)perylene 4.4Dibenzo(ah ! ac)anthracene 0.0Coronene 5.1Sum of Concentrations 848
Rogers et al.
590 Journal of the Air & Waste Management Association Volume 55 May 2005

good approximation by the gas-phase carbon in the car-bon dioxide and monoxide emissions, which we mea-sured by filling electropolished canisters during each testrun. The contents of the canisters were analyzed after theexperiment in the Desert Research Institute’s laboratories.The MOUDI and canister samplers were subject to thesame sample dilution ratio of 4.1:1, because their sampleinlet lines were connected to the same distribution point.
Table 6 presents emission factors for particulate mass(1.8-$m aerodynamic diameter cutoff), EC, and OC, asmeasured by the MOUDI sampler.
For comparison, Petzold and Schroder19 performedtotal carbon and BC particulate measurements in the ex-haust of a Rolls Royce/SNECMA M45 Hr Mk501 turbofanengine. According to these researchers, this engine repre-sents older technology, with higher carbon emissionsthan most newer engines. The engine was operated atpower settings ranging from 11% to 71%, with both high-and low-sulfur content fuel. The carbon determinationswere obtained from a thermal filter analysis method thatis analogous but not identical to the method presented inthis article. They found BC factors ranging from 0.1 to 0.6g/kg of fuel and total carbon emission factors rangingfrom 0.3 to 0.7 g/kg of fuel.19 Higher power settings pro-duced greater emission factor values.
The total and EC emission factors found in this testcase are similar to those found by Petzold and Schroder.19
The “black” or EC factor found in this study are in the lowend of their reported range, as would be expected if the T700engine is a somewhat newer technology engine comparedwith the Rolls Royce unit tested by those investigators.
The emission factors given in Table 6 are based ononly one test run and hence do not constitute a definitivenew study. However, their general agreement with earlierinvestigators’ work supports confidence in the overall va-lidity of the results we report here.
CONCLUSIONSThis study achieved the objec-tive of developing a portable,real-time measurement systemcapable of reliable operationin extraordinarily demandingfield conditions. The PAS, PA,and DT instruments generatedreal-time data series, and aver-
ages of those data compared favorably to integrated datawhen the latter were available, as has been found in otherresearch studies involving these real-time devices.
Findings regarding the general characteristics of theexhaust from the two types of jet engines that were stud-ies included the following:
1. The inverse relationship between stated enginepower settings and measured levels of particulatePAH, light absorption, and mass concentrationswas pronounced and consistent for the F404 testsbut was not observed for the T700 test, for whichthe particulate properties more often seemed tovary in direct proportion to the power setting.
2. SMPS data showed that the particles were distrib-uted monomodally with peaks in the 20–40nmregion.
3. The relationships between the PA and DT dataindicate that light-absorbing particles were a sig-nificantly lesser proportion (10% or less) of thetotal particle population for the F404 exhaust thanfor that of the T700 engine (essentially 100%).
4. Transient maxima were observed on a numberof occasions when engine power settings werechanged.
The PAS instrument required a heated inlet to obtainstable readings. The PAS signal sometimes exhibited re-sponses inverse to those of the PA and DT, that is, itssignal occasionally fell when the DT and PA signals rose,and vice versa. In the absence of a direct comparison ofthe PAS to another real-time instrument that measuredthe same particulate properties, we do not have an expla-nation for this apparent inconsistency. The PAS readingswere not always reproducible as a function of enginepower setting. This could be a result of differing PAHconcentrations in engine exhaust although the powersettings were stated to be identical, or it could be a resultof nonreproducibility in the PAS. We recommend that thePAS receive continued research and development effortbecause of the importance of real-time PAH data.
Previous studies found that the PAS responds to somedegree to the light-absorbing fraction of the particle pop-ulation, leading to the hypothesis that the particle-boundPAH compounds are associated with that same particulate
Table 5. Comparison of averaged photoacoustic and DustTrak measurements and integrated results fromMOUDI for the T700 test.
PhotoacousticAverage(!g/m3)
DustTrak MassConcentration
(Average, !g/m3)
Summed Mass FromMOUDI Impactor
(!g/m3)
Summed EC FromMOUDI Impactor
(!g/m3)
Summed OC FromMOUDI Impactor
(!g/m3)
1065 1070 1738 938 335
Table 6. Emission factors for T700 test.
Mass EmissionFactor
EC EmissionFactor
OC EmissionFactor
Total CarbonEmission Factor
0.32 0.18 0.06 0.24
Note: All emission factors are given in g/kg of fuel consumed.
Rogers et al.
Volume 55 May 2005 Journal of the Air & Waste Management Association 591

fraction. The findings from this study are at best incon-clusive in regard to that hypothesis.
ACKNOWLEDGMENTSThis research was supported by the Strategic Environmen-tal Research and Development Program (SERDP), ProjectCP-1106, Characterization of Particulate Emissions: SizeFractionation and Chemical Speciation. The authorsthank X. Li Jones, E. Douglas, and G. Pateow with AircraftEnvironmental Support Office (AESO) and the AircraftIntermediate Maintenance Division (AIMD) of the UnitedStates Navy Base at North Island for their extensive coop-eration.
REFERENCES1. U.S. Environmental Protection Agency. Nonroad Engine and Vehicle
Emission Study; Report 460/3-91-02; EPA Office of Air and Radiation:Research Triangle Park, NC, 1991.
2. U.S. Environmental Protection Agency. Regulatory Support Document,Control of Air Pollution From Aircraft and Aircraft Engines; EPA Office ofAir and Radiation: Research Triangle Park, NC, 1997.
3. Burtscher, H. Measurement and Characteristics of Combustion Aero-sols With Special Consideration of Photoelectric Charging and Charg-ing by Flame Ions; J. Aerosol Sci. 1992, 23, 549-595.
4. Arnott, W.P.; Moosmuller, H.; Walker, J.W. Nitrogen Dioxide andKerosene-Flame Soot Calibration of Photoacoustic Instruments forMeasurement of Light Absorption by Aerosols; Rev. Sci. Instrum. 2000,71, 1-8.
5. Arnott, W.P.; Zielinska, B.; Rogers, C.F.; Sagebiel; J.; Kelly, K.; Wagner,D.; Sarofim, A.; Lighty; J. Palmer, G. Evaluation of 1047 nm Photo-acoustic Instruments and Photoelectric Aerosol Sensors in Source-Sampling of Black Carbon Aerosol and Particle Bound PAH’s fromGasoline and Diesel Powered Vehicles; Environ. Sci. Technol.
6. Gundel, L.A.; Lee, V.C;. Mahanama, K.R.R.; Stevens, R.K.; Daisey, J.M.Direct Determination of the Phase Distributions of Semi-Volatile Poly-cyclic Aromatic Hydrocarbons Using Annular Denuders; Atmos. Envi-ron. 1995, 29, 1719.
7. Wang, S.C.; Flagan, R.C. Scanning Electrical Mobility Spectrometer;Aerosol. Sci. Technol. 1990, 13, 230-240.
8. Paetow, G. North Island Naval Air Station. Personal communication,2003.
9. McDow, S.R.; Giger, W.; Burtscher, H.; Schmidt-Ott, A.; Siegmann,H.C. Polycyclic Aromatic Hydrocarbons and Combustion Aerosol Pho-toemission; Atmos. Environ. 1990, 24, 2911-2916.
10. Wilson, N.K.; Chuang, J.C.; Kuhlman, M.R. Sampling Polycyclic Aro-matic Hydrocarbons and Related Semivolatile Organic Compounds inIndoor Air; Indoor Air. 1991, 4, 513-512.
11. Wilson, N.K.; Barbour, R.K.; Chuang, J.C.; Mukund, R. Evaluation of aReal-Time Monitor for Fine Particle-Bound Pah in Air; Polycyclic Aro-matic Compounds. 1994, 5, 167-174.
12. U.S. Environmental Protection Agency. Field and Laboratory Analyses ofa Real-Time PAH Analyzer; EPA/600/R-97/034; EPA Office of Researchand Development: Research Triangle Park, NC, 1997.
13. Moosmuller, H.; Arnott, W.P.; Rogers, C.F.; Bowen, J.L.; Gillies, J.A.;Pierson, W.R.; Collins, J.F.; Durbin, T.D.; Norbeck, J.M. Time ResolvedCharacterization of Diesel Particulate Emissions. 1. Instruments forParticle Mass Measurements; Environ. Sci. Technol. 2001, 35, 781-787.
14. Zielinska, B.; Sagebiel, J.; Arnott, W.P.; Rogers, C.F.; Kelly, K.E.; Wag-ner, D.A.; Lighty, J.S.; Sarofim, A.F.; Palmer, G. Phase and Size Distri-bution of Polycyclic Aromatic Hydrocarbons in Diesel and GasolineVehicle Emissions; Environ. Sci. Technol. 2004, 38, 2557-2567.
15. Marple, V.A.; Rubow, K.L.; Behm, S.M.A. Microorifice Uniform De-posit Impactor (MOUDI): Description, Calibration, and Use; AerosolSci. Technol. 1991, 14, 434-446.
16. Chow, J.C. Measurement Methods to Determine Compliance WithAmbient Air Quality Standards for Suspended Particles; J. Air & WasteManage. Assoc. 1995, 45, 320-382.
17. Sarofim, A.F.; Lighty, J.S. Characterization of Particulate Emissions: SizeFractionation and Chemical Speciation; Final Report; Strategic Environ-mental Research and Development Program (SERDP) Project CP-1106;University of Utah: Salt Lake City, UT, 2003.
18. Moosmuller, H.; Arnott, W.P.; Rogers, C.F.; Chow, J.C.; Frazier, C.A.;Sherman, L.E.; Dietrich, D.L. Photoacoustic and Filter MeasurementsRelated to Light Absorption During the Northern Front Range AirQuality Study (Colorado 1996/1997); J. Geophys. Res. 1998, 103,28149-28157.
19. Petzold, A.; Schroder, F.P. Jet Engine Exhaust Aerosol Characteriza-tion; Aerosol Sci. Technol. 1998, 28, 62-76.
20. Bohren, C.F.: Huffman, D.R. Absorption and Sattering of Light by SmallParticles; Wiley: New York, 1980.
APPENDIX AAn ideal instrument for the measurement of total aerosolmass concentration would perfectly collect all particlesindependent of particle size and composition and mea-sure their mass with excellent precision. Optical methodssuch as light-scattering measurements as proxies for totalaerosol properties are very precise, quite sensitive, andwork over a large range of values; however, the ability toget the right answer with these methods is limited. Thetradeoff of excellent precision and questionable accuracydoes require some insightful analysis.
The TSI DT nephelometer measures particle scatter-ing at a wavelength of 780 nm in a cone of scatteringangles near 90°. For the discussion here, the basic behav-ior of the DT can be understood by considering the the-oretical scattering cross section for spherical particlessummed over all angles (0–180°). Let us suppose that wehave calibrated a nephelometer so that it provides anoutput proportional to the particle-scattering coefficientSc in dimensions of inverse distance. The mass scatteringefficiency factor is given by the variable mass scatteringefficiency (MSE) (and the vertical axis in Figure A-1), andas can be seen in Figure A-1, is a function of both particlecomposition, through the refractive index and density, aswell as particle size. If the Dustrak were an ideal mass-measuring instrument, the calibration curve in Figure A-1would be an absolutely flat horizontal line. As you can
Figure A-1. Mass scattering efficiency calculated using the Mietheory for homogeneous spherical particles,20 with sizes and wave-length relevant to the TSI Dustrak calibration.
Rogers et al.
592 Journal of the Air & Waste Management Association Volume 55 May 2005

see, it is not a flat line. If we know the particle size andcomposition, then we can use Figure A-1 to compute massconcentration M, in dimensions of aerosol mass per unitvolume, of particles that gave rise to the scattering as
M ! Sc/MSE (A1)
Why does the DT give roughly a reasonable value for themass concentration of exhaust particles even with therelatively large size dependence of MSE? The answer isthat it is calibrated with weakly absorbing dust particlesthat have a diameter of "2 $m. This corresponds to anMSE of a little greater than 1 m2/g. If we slide over to theleft to smaller particle sizes, we can see that the same MSEapplies roughly to 0.1-$m-diameter spheres as well,which are roughly the size of combustion particles. Soeven though the DT is formally calibrated for Arizonaroad dust, going over the hump, so to speak, shows thatthe calibration is actually in the ballpark for combustionparticles as well. However, there still is a danger. As theparticles get ever smaller, the D3 dependence of scatteringin the Rayleigh regime gives rise to decreasing values ofMSE and the need for recalibration based on eq 1.
Incidentally, note that not all particles are createdequal. For large diameters, weakly absorbing particleshave a mass-scattering efficiency about twice that ofstrongly absorbing particles, whereas the opposite is truefor small diameters where the ratio is "5. The dipole
moment for small strongly absorbing particles is largerthan for small weakly absorbing particles owing to theconductivity implicit in the large imaginary part of therefractive index. Therefore, for small jet engine exhaustparticles, the response from BC aerosol will be about afactor of 5 greater than for other particles that absorbweakly.
In conclusion, the DT is a sensitive instrument forscattering measurements, although one must approach itscalibration for mass measurements very cautiously.
About the AuthorsFred Rogers is an emeritus research professor at DesertResearch Institute’s Division of Atmospheric Sciences. PatArnott and Barbara Zielinska are research professors, andJohn Sagebiel is an assistant research professor at DesertResearch Institute’s Division of Atmospheric Sciences.Kerry Kelly and David Wagner are research engineers at theUniversity of Utah. JoAnn Lighty and Adel Sarofim areprofessors in the Department of Chemical Engineering, Uni-versity of Utah. In addition, JoAnn Lighty and Kerry Kellyserve as director and associate director, respectively, of theInstitute for Combustion & Energy Studies at the Universityof Utah. Address correspondence to: Kerry E. Kelly, Insti-tute for Combustion & Energy Studies, University of Utah,Salt Lake City, UT 84112.
Rogers et al.
Volume 55 May 2005 Journal of the Air & Waste Management Association 593


![Jet [Novela] Biblioteca](https://static.fdokumen.com/doc/165x107/6321c71564690856e108db2b/jet-novela-biblioteca.jpg)