Health Assessment Document For Diesel Engine Exhaust
669
United States Environmental Protection Agency Health Assessment Document For Diesel Engine Exhaust
-
Upload
khangminh22 -
Category
Documents
-
view
3 -
download
0
Transcript of Health Assessment Document For Diesel Engine Exhaust

United States Environmental Protection Agency
Health Assessment Document For Diesel Engine Exhaust
EPA/600/8-90/057F May 2002
Health Assessment Document for Diesel Engine Exhaust
National Center for Environmental Assessment Office of Research and Development
U.S. Environmental Protection Agency Washington, DC
ii
DISCLAIMER
This document has been reviewed in accordance with U.S. Environmental ProtectionAgency policy and approved for publication. Mention of trade names or commercial productsdoes not constitute endorsement or recommendation for use.
ABSTRACT
This assessment examined information regarding the possible health hazards associatedwith exposure to diesel engine exhaust (DE), which is a mixture of gases and particles. Theassessment concludes that long-term (i.e., chronic) inhalation exposure is likely to pose a lungcancer hazard to humans, as well as damage the lung in other ways depending on exposure. Short-term (i.e., acute) exposures can cause irritation and inflammatory symptoms of a transientnature, these being highly variable across the population. The assessment also indicates thatevidence for exacerbation of existing allergies and asthma symptoms is emerging. Theassessment recognizes that DE emissions, as a mixture of many constituents, also contribute toambient concentrations of several criteria air pollutants including nitrogen oxides and fineparticles, as well as other air toxics. The assessment’s health hazard conclusions are based onexposure to exhaust from diesel engines built prior to the mid-1990s. The health hazardconclusions, in general, are applicable to engines currently in use, which include many olderengines. As new diesel engines with cleaner exhaust emissions replace existing engines, theapplicability of the conclusions in this Health Assessment Document will need to be reevaluated.
Preferred citation:U.S. Environmental Protection Agency (EPA). (2002) Health assessment document for diesel engine exhaust. Prepared by the National Center for Environmental Assessment, Washington, DC, for the Office of Transportationand Air Quality; EPA/600/8-90/057F. Available from: National Technical Information Service, Springfield, VA;PB2002-107661, and <http://www.epa.gov/ncea>.

CONTENTS
LIST OF TABLES . . . . . . . . . . . . . . . . . . . . . . . . . . . . . . . . . . . . . . . . . . . . . . . . . . . . . . . . . . . viii LIST OF FIGURES . . . . . . . . . . . . . . . . . . . . . . . . . . . . . . . . . . . . . . . . . . . . . . . . . . . . . . . . . . . xi FOREWORD . . . . . . . . . . . . . . . . . . . . . . . . . . . . . . . . . . . . . . . . . . . . . . . . . . . . . . . . . . . . . . . xiv PREFACE . . . . . . . . . . . . . . . . . . . . . . . . . . . . . . . . . . . . . . . . . . . . . . . . . . . . . . . . . . . . . . . . . xvi AUTHORS, CONTRIBUTORS, AND REVIEWERS . . . . . . . . . . . . . . . . . . . . . . . . . . . . . . xvii ACKNOWLEDGMENTS . . . . . . . . . . . . . . . . . . . . . . . . . . . . . . . . . . . . . . . . . . . . . . . . . . . . xxii
1. EXECUTIVE SUMMARY . . . . . . . . . . . . . . . . . . . . . . . . . . . . . . . . . . . . . . . . . . . . . . . . . 1-1 1.1. INTRODUCTION . . . . . . . . . . . . . . . . . . . . . . . . . . . . . . . . . . . . . . . . . . . . . . . . . . . . . 1-1 1.2. COMPOSITION OF DIESEL EXHAUST . . . . . . . . . . . . . . . . . . . . . . . . . . . . . . . . . . 1-1 1.3. DIESEL EXHAUST AS A COMPONENT OF AMBIENT PARTICULATE
MATTER . . . . . . . . . . . . . . . . . . . . . . . . . . . . . . . . . . . . . . . . . . . . . . . . . . . . . . . . . . . . 1-2 1.4. ATMOSPHERIC TRANSFORMATION OF DIESEL EXHAUST . . . . . . . . . . . . . . . 1-2 1.5. EXPOSURE TO DIESEL EXHAUST . . . . . . . . . . . . . . . . . . . . . . . . . . . . . . . . . . . . . 1-3 1.6. HEALTH EFFECTS OF DIESEL EXHAUST . . . . . . . . . . . . . . . . . . . . . . . . . . . . . . . 1-3
1.6.1. Acute (Short-Term Exposure) Effects . . . . . . . . . . . . . . . . . . . . . . . . . . . . . . . . 1-4 1.6.2. Chronic (Long-Term Exposure) Noncancer Respiratory Effects . . . . . . . . . . . . 1-4 1.6.3. Chronic (Long-Term Exposure) Carcinogenic Effects . . . . . . . . . . . . . . . . . . . . 1-4
1.7. SOURCES OF UNCERTAINTY . . . . . . . . . . . . . . . . . . . . . . . . . . . . . . . . . . . . . . . . . 1-6
2. DIESEL EXHAUST EMISSIONS CHARACTERIZATION, ATMOSPHERIC TRANSFORMATION, AND EXPOSURES . . . . . . . . . . . . . . . . . . . . . . . . . . . . . . . . . . . . 2-1 2.1. INTRODUCTION . . . . . . . . . . . . . . . . . . . . . . . . . . . . . . . . . . . . . . . . . . . . . . . . . . . . . 2-1 2.2. PRIMARY DIESEL EXHAUST EMISSIONS . . . . . . . . . . . . . . . . . . . . . . . . . . . . . . 2-3
2.2.1. History of Dieselization . . . . . . . . . . . . . . . . . . . . . . . . . . . . . . . . . . . . . . . . . . . 2-3 2.2.2. Diesel Combustion and Formation of Primary Emissions . . . . . . . . . . . . . . . . . 2-9 2.2.3. Diesel Emission Standards and Emission Trends Inventory . . . . . . . . . . . . . . 2-15 2.2.4. Historical Trends in Diesel Fuel Use and Impact of Fuel
Properties on Emissions . . . . . . . . . . . . . . . . . . . . . . . . . . . . . . . . . . . . . . . . . . 2-25 2.2.5. Chronological Assessment of Emission Factors . . . . . . . . . . . . . . . . . . . . . . . . 2-29 2.2.6. Engine Technology Description and Chronology . . . . . . . . . . . . . . . . . . . . . . 2-43 2.2.7. Air Toxic Emissions . . . . . . . . . . . . . . . . . . . . . . . . . . . . . . . . . . . . . . . . . . . . . 2-53 2.2.8. Physical and Chemical Composition of Diesel Exhaust Particles . . . . . . . . . . 2-59
2.3. ATMOSPHERIC TRANSFORMATION OF DIESEL EXHAUST . . . . . . . . . . . . . . 2-84 2.3.1. Gas-Phase Diesel Exhaust . . . . . . . . . . . . . . . . . . . . . . . . . . . . . . . . . . . . . . . . 2-84 2.3.2. Particle-Phase Diesel Exhaust . . . . . . . . . . . . . . . . . . . . . . . . . . . . . . . . . . . . . 2-90 2.3.3. Diesel Exhaust Aging . . . . . . . . . . . . . . . . . . . . . . . . . . . . . . . . . . . . . . . . . . . . 2-93
2.4. AMBIENT DIESEL EXHAUST CONCENTRATIONS AND EXPOSURES . . . . . 2-94 2.4.1. Diesel Exhaust Gases in the Ambient Atmosphere . . . . . . . . . . . . . . . . . . . . . 2-94 2.4.2. Ambient Concentrations of DPM . . . . . . . . . . . . . . . . . . . . . . . . . . . . . . . . . . 2-95 2.4.3. Exposures to Diesel Exhaust . . . . . . . . . . . . . . . . . . . . . . . . . . . . . . . . . . . . . 2-106
2.5. SUMMARY AND DISCUSSION . . . . . . . . . . . . . . . . . . . . . . . . . . . . . . . . . . . . . . 2-118 2.5.1. History of Diesel Engine Use, Standards, and Technology . . . . . . . . . . . . . . 2-119 2.5.2. Physical and Chemical Composition of Diesel Exhaust . . . . . . . . . . . . . . . . 2-120
iii

CONTENTS (continued)
2.5.3. Atmospheric Transformation of Diesel Exhaust . . . . . . . . . . . . . . . . . . . . . . 2-123 2.5.4. Ambient Concentrations and Exposure to Diesel Exhaust . . . . . . . . . . . . . . 2-124
REFERENCES FOR CHAPTER 2 . . . . . . . . . . . . . . . . . . . . . . . . . . . . . . . . . . . . . . . . . . . . 2-126
3. DOSIMETRY OF DIESEL PARTICULATE MATTER . . . . . . . . . . . . . . . . . . . . . . . . . . . 3-1 3.1. INTRODUCTION . . . . . . . . . . . . . . . . . . . . . . . . . . . . . . . . . . . . . . . . . . . . . . . . . . . . . 3-1 3.2. CHARACTERISTICS OF INHALED DIESEL PARTICULATE MATTER . . . . . . . 3-2 3.3. REGIONAL DEPOSITION OF INHALED DIESEL PARTICULATE MATTER . . . 3-2
3.3.1. Deposition Mechanisms . . . . . . . . . . . . . . . . . . . . . . . . . . . . . . . . . . . . . . . . . . . 3-3 3.3.2. Particle Clearance and Translocation Mechanisms . . . . . . . . . . . . . . . . . . . . . . 3-9 3.3.3. Translocations of Particles to Extra-Alveolar Macrophage Compartment
Sites . . . . . . . . . . . . . . . . . . . . . . . . . . . . . . . . . . . . . . . . . . . . . . . . . . . . . . . . . . 3-22 3.4. PARTICLE “OVERLOAD” . . . . . . . . . . . . . . . . . . . . . . . . . . . . . . . . . . . . . . . . . . . . 3-26
3.4.1. Introduction . . . . . . . . . . . . . . . . . . . . . . . . . . . . . . . . . . . . . . . . . . . . . . . . . . . . 3-26 3.4.2. Relevance to Humans . . . . . . . . . . . . . . . . . . . . . . . . . . . . . . . . . . . . . . . . . . . . 3-28 3.4.3. Potential Mechanisms for an AM Sequestration Compartment
for Particles During Particle Overload . . . . . . . . . . . . . . . . . . . . . . . . . . . . . . . 3-30 3.5. BIOAVAILABILITY OF ORGANIC CONSTITUENTS PRESENT ON
DIESEL EXHAUST PARTICLES . . . . . . . . . . . . . . . . . . . . . . . . . . . . . . . . . . . . . . . 3-31 3.5.1. In Vivo Studies . . . . . . . . . . . . . . . . . . . . . . . . . . . . . . . . . . . . . . . . . . . . . . . . . 3-32 3.5.2. In Vitro Studies . . . . . . . . . . . . . . . . . . . . . . . . . . . . . . . . . . . . . . . . . . . . . . . . . 3-34 3.5.3. Modeling Studies . . . . . . . . . . . . . . . . . . . . . . . . . . . . . . . . . . . . . . . . . . . . . . . 3-363.5.4. Summary and Bioavailability . . . . . . . . . . . . . . . . . . . . . . . . . . . . . . . . . . . . . . 3-37
3.6. MODELING THE DEPOSITION AND CLEARANCE OF PARTICLES IN THE RESPIRATORY TRACT . . . . . . . . . . . . . . . . . . . . . . . . . . . . . . . . . . . . . . . . . . 3-38 3.6.1. Introduction . . . . . . . . . . . . . . . . . . . . . . . . . . . . . . . . . . . . . . . . . . . . . . . . . . . . 3-38 3.6.2. Dosimetry Models for DPM . . . . . . . . . . . . . . . . . . . . . . . . . . . . . . . . . . . . . . . 3-38
3.7. SUMMARY AND DISCUSSION . . . . . . . . . . . . . . . . . . . . . . . . . . . . . . . . . . . . . . . . 3-54 REFERENCES FOR CHAPTER 3 . . . . . . . . . . . . . . . . . . . . . . . . . . . . . . . . . . . . . . . . . . . . . 3-56
4. MUTAGENICITY . . . . . . . . . . . . . . . . . . . . . . . . . . . . . . . . . . . . . . . . . . . . . . . . . . . . . . . . 4-1 4.1. GENE MUTATIONS . . . . . . . . . . . . . . . . . . . . . . . . . . . . . . . . . . . . . . . . . . . . . . . . . . 4-2 4.2. CHROMOSOME EFFECTS . . . . . . . . . . . . . . . . . . . . . . . . . . . . . . . . . . . . . . . . . . . . . 4-5 4.3. OTHER GENOTOXIC EFFECTS . . . . . . . . . . . . . . . . . . . . . . . . . . . . . . . . . . . . . . . . 4-7 4.4. SUMMARY AND DISCUSSION . . . . . . . . . . . . . . . . . . . . . . . . . . . . . . . . . . . . . . . . . 4-8
REFERENCES FOR CHAPTER 4 . . . . . . . . . . . . . . . . . . . . . . . . . . . . . . . . . . . . . . . . . . . . . . 4-9
5. NONCANCER HEALTH EFFECTS OF DIESEL EXHAUST . . . . . . . . . . . . . . . . . . . . . . 5-1 5.1. HEALTH EFFECTS OF WHOLE DIESEL EXHAUST . . . . . . . . . . . . . . . . . . . . . . . 5-2
5.1.1. Human Studies . . . . . . . . . . . . . . . . . . . . . . . . . . . . . . . . . . . . . . . . . . . . . . . . . . 5-2 5.1.2. Traffic Studies . . . . . . . . . . . . . . . . . . . . . . . . . . . . . . . . . . . . . . . . . . . . . . . . . . 5-23 5.1.3. Laboratory Animal Studies . . . . . . . . . . . . . . . . . . . . . . . . . . . . . . . . . . . . . . . . 5-24
5.2. MODE OF ACTION OF DIESEL EXHAUST-INDUCED NONCANCER EFFECTS . . . . . . . . . . . . . . . . . . . . . . . . . . . . . . . . . . . . . . . . . . . . . . . . . . . . . . . . . . . 5-82 5.2.1. Comparison of Health Effects of Filtered and Unfiltered Diesel Exhaust . . . . 5-82
iv
CONTENTS (continued)
5.2.2. Mode of Action for the Noncarcinogenic Effects of DPM . . . . . . . . . . . . . . . . 5-89 5.3. INTERACTIVE EFFECTS OF DIESEL EXHAUST . . . . . . . . . . . . . . . . . . . . . . . . . 5-90 5.4. COMPARATIVE RESPONSIVENESS AMONG SPECIES TO THE
HISTOPATHOLOGIC EFFECTS OF DIESEL EXHAUST . . . . . . . . . . . . . . . . . . . 5-92 5.5. DOSE-RATE AND PARTICULATE CAUSATIVE ISSUES . . . . . . . . . . . . . . . . . . 5-93 5.6. SUMMARY AND DISCUSSION . . . . . . . . . . . . . . . . . . . . . . . . . . . . . . . . . . . . . . . . 5-97
5.6.1. Effects of Diesel Exhaust on Humans . . . . . . . . . . . . . . . . . . . . . . . . . . . . . . . 5-97 5.6.2. Effects of Diesel Exhaust on Laboratory Animals . . . . . . . . . . . . . . . . . . . . . . 5-99 5.6.3. Comparison of Filtered and Unfiltered Diesel Exhaust . . . . . . . . . . . . . . . . . . 5-102 5.6.4. Interactive Effects of Diesel Exhaust . . . . . . . . . . . . . . . . . . . . . . . . . . . . . . . 5-103 5.6.5. Conclusions . . . . . . . . . . . . . . . . . . . . . . . . . . . . . . . . . . . . . . . . . . . . . . . . . . . 5-103
REFERENCES FOR CHAPTER 5 . . . . . . . . . . . . . . . . . . . . . . . . . . . . . . . . . . . . . . . . . . . . 5-104
6. ESTIMATING HUMAN NONCANCER HEALTH RISKS OF DIESEL EXHAUST . . . 6-1 6.1. INTRODUCTION . . . . . . . . . . . . . . . . . . . . . . . . . . . . . . . . . . . . . . . . . . . . . . . . . . . . 6-1 6.2. THE INHALATION REFERENCE CONCENTRATION APPROACH . . . . . . . . . . 6-3 6.3. CHRONIC REFERENCE CONCENTRATION FOR DIESEL EXHAUST . . . . . . . . 6-5
6.3.1. Principal Studies for Dose-Response Analysis: Chronic, Multiple-Dose Level Rat Studies . . . . . . . . . . . . . . . . . . . . . . . . . . . . . . . . . . . . 6-6
6.3.2. Derivation of Human Continuous Equivalent Concentrations, HECs . . . . . . . . 6-9 6.3.3. Dose-Response Analysis—Choice of an Effect Level . . . . . . . . . . . . . . . . . . 6-11 6.3.4. Uncertainty Factors (UF) for the RFC—A Composite Factor of 30 . . . . . . . . 6-14 6.3.5. Derivation of the RfC for Diesel Exhaust . . . . . . . . . . . . . . . . . . . . . . . . . . . . 6-16
6.4. EPIDEMIOLOGICAL EVIDENCE AND NAAQS FOR FINE PM . . . . . . . . . . . . . 6-176.4.1. Epidemiological Evidence for Fine PM . . . . . . . . . . . . . . . . . . . . . . . . . . . . . . 6-186.4.2. NAAQS for Fine PM . . . . . . . . . . . . . . . . . . . . . . . . . . . . . . . . . . . . . . . . . . . . 6-256.4.3. DPM as a Component of Fine PM . . . . . . . . . . . . . . . . . . . . . . . . . . . . . . . . . . 6-30
6.5. CHARACTERIZATION OF THE NONCANCER ASSESSMENT FOR DIESEL EXHAUST . . . . . . . . . . . . . . . . . . . . . . . . . . . . . . . . . . . . . . . . . . . . . . . . . . . . . . . . . 6-30
6.6. SUMMARY . . . . . . . . . . . . . . . . . . . . . . . . . . . . . . . . . . . . . . . . . . . . . . . . . . . . . . . . 6-32 REFERENCES FOR CHAPTER 6 . . . . . . . . . . . . . . . . . . . . . . . . . . . . . . . . . . . . . . . . . . . . . 6-33
7. CARCINOGENICITY OF DIESEL EXHAUST . . . . . . . . . . . . . . . . . . . . . . . . . . . . . . . . . 7-1 7.1. INTRODUCTION . . . . . . . . . . . . . . . . . . . . . . . . . . . . . . . . . . . . . . . . . . . . . . . . . . . . 7-1
7.1.1. Overview . . . . . . . . . . . . . . . . . . . . . . . . . . . . . . . . . . . . . . . . . . . . . . . . . . . . . . 7-1 7.1.2. Ambient PM-Lung Cancer Relationships . . . . . . . . . . . . . . . . . . . . . . . . . . . . . 7-1
7.2. EPIDEMIOLOGIC STUDIES OF THE CARCINOGENICITY OF EXPOSURE TO DIESEL EXHAUST . . . . . . . . . . . . . . . . . . . . . . . . . . . . . . . . . . . . . . . . . . . . . . . . 7-3 7.2.1. Cohort Studies . . . . . . . . . . . . . . . . . . . . . . . . . . . . . . . . . . . . . . . . . . . . . . . . . . 7-6 7.2.2. Case-Control Studies of Lung Cancer . . . . . . . . . . . . . . . . . . . . . . . . . . . . . . . 7-32 7.2.3. Summaries of Studies and Meta-Analyses of Lung Cancer . . . . . . . . . . . . . . 7-61 7.2.4. Summary and Discussion . . . . . . . . . . . . . . . . . . . . . . . . . . . . . . . . . . . . . . . . . 7-66
v

CONTENTS (continued)
7.3. CARCINOGENICITY OF DIESEL EXHAUST IN LABORATORY ANIMALS . . . . . . . . . . . . . . . . . . . . . . . . . . . . . . . . . . . . . . . . . . . . . . . . . . . . . . . . . 7-83 7.3.1. Inhalation Studies (Whole Diesel Exhaust) . . . . . . . . . . . . . . . . . . . . . . . . . . . 7-84 7.3.2. Inhalation Studies (Filtered Diesel Exhaust) . . . . . . . . . . . . . . . . . . . . . . . . . 7-108 7.3.3. Inhalation Studies (DE Plus Cocarcinogens) . . . . . . . . . . . . . . . . . . . . . . . . . 7-109 7.3.4. Lung Implantation or Intratracheal Instillation Studies . . . . . . . . . . . . . . . . . 7-111 7.3.5. Subcutaneous and Intraperitoneal Injection Studies . . . . . . . . . . . . . . . . . . . 7-117 7.3.6. Dermal Studies . . . . . . . . . . . . . . . . . . . . . . . . . . . . . . . . . . . . . . . . . . . . . . . . 7-119 7.3.7. Summary and Conclusions of Laboratory Animal Carcinogenicity Studies . 7-121
7.4. MODE OF ACTION OF DIESEL EXHAUST-INDUCED CARCINOGENESIS . . . . . . . . . . . . . . . . . . . . . . . . . . . . . . . . . . . . . . . . . . . . . . . . 7-128 7.4.1. Potential Role of Organic Exhaust Components in Lung Cancer Induction . 7-129 7.4.2. Role of Inflammatory Cytokines and Proteolytic Enzymes in the
Induction of Lung Cancer in Rats by Diesel Exhaust . . . . . . . . . . . . . . . . . . 7-132 7.4.3. Role of Reactive Oxygen Species in Lung Cancer Induction by Diesel
Exhaust . . . . . . . . . . . . . . . . . . . . . . . . . . . . . . . . . . . . . . . . . . . . . . . . . . . . . 7-133 7.4.4. Relationship of Physical Characteristics of Particles to Cancer Induction . . 7-136 7.4.5. Integrative Hypothesis for Diesel-Induced Lung Cancer . . . . . . . . . . . . . . . 7-137 7.4.6. Summary . . . . . . . . . . . . . . . . . . . . . . . . . . . . . . . . . . . . . . . . . . . . . . . . . . . . 7-139
7.5. WEIGHT-OF-EVIDENCE EVALUATION FOR POTENTIAL HUMAN CARCINOGENICITY . . . . . . . . . . . . . . . . . . . . . . . . . . . . . . . . . . . . . . . 7-140 7.5.1. Human Evidence . . . . . . . . . . . . . . . . . . . . . . . . . . . . . . . . . . . . . . . . . . . . . . 7-141 7.5.2. Animal Evidence . . . . . . . . . . . . . . . . . . . . . . . . . . . . . . . . . . . . . . . . . . . . . . 7-142 7.5.3. Other Key Data . . . . . . . . . . . . . . . . . . . . . . . . . . . . . . . . . . . . . . . . . . . . . . . 7-143 7.5.4. Mode of Action . . . . . . . . . . . . . . . . . . . . . . . . . . . . . . . . . . . . . . . . . . . . . . . 7-143 7.5.5. Characterization of Overall Weight of Evidence: EPA’s 1986 Guidelines
for Carcinogen Risk Assessment . . . . . . . . . . . . . . . . . . . . . . . . . . . . . . . . . . 7-144 7.5.6. Weight-of-Evidence Hazard Narrative: EPA’s Proposed Guidelines
for Carcinogen Risk Assessment (1996b, 1999) . . . . . . . . . . . . . . . . . . . . . . 7-144 7.6. EVALUATIONS BY OTHER ORGANIZATIONS . . . . . . . . . . . . . . . . . . . . . . . . 7-146 7.7. CONCLUSION . . . . . . . . . . . . . . . . . . . . . . . . . . . . . . . . . . . . . . . . . . . . . . . . . . . . . 7-147
REFERENCES FOR CHAPTER 7 . . . . . . . . . . . . . . . . . . . . . . . . . . . . . . . . . . . . . . . . . . . . 7-148
8. DOSE-RESPONSE ASSESSMENT: CARCINOGENIC EFFECTS . . . . . . . . . . . . . . . . . 8-1 8.1. INTRODUCTION . . . . . . . . . . . . . . . . . . . . . . . . . . . . . . . . . . . . . . . . . . . . . . . . . . . . 8-1 8.2. MODE OF ACTION AND DOSE-RESPONSE APPROACH . . . . . . . . . . . . . . . . . . 8-2 8.3. USE OF EPIDEMIOLOGIC STUDIES FOR QUANTITATIVE
RISK ASSESSMENT . . . . . . . . . . . . . . . . . . . . . . . . . . . . . . . . . . . . . . . . . . . . . . . . . . 8-4 8.3.1. Sources of Uncertainty . . . . . . . . . . . . . . . . . . . . . . . . . . . . . . . . . . . . . . . . . . . . 8-4 8.3.2. Evaluation of Key Epidemiologic Studies for
Potential Use in Quantitative Risk Estimates . . . . . . . . . . . . . . . . . . . . . . . . . . 8-5 8.3.3. Conclusion . . . . . . . . . . . . . . . . . . . . . . . . . . . . . . . . . . . . . . . . . . . . . . . . . . . . 8-11
8.4. PERSPECTIVES ON CANCER RISK . . . . . . . . . . . . . . . . . . . . . . . . . . . . . . . . . . . 8-11 8.5. SUMMARY AND DISCUSSION . . . . . . . . . . . . . . . . . . . . . . . . . . . . . . . . . . . . . . . 8-16
REFERENCES FOR CHAPTER 8 . . . . . . . . . . . . . . . . . . . . . . . . . . . . . . . . . . . . . . . . . . . . . 8-17
vi

CONTENTS (continued)
9. CHARACTERIZATION OF POTENTIAL HUMAN HEALTH EFFECTS OF DIESEL EXHAUST: HAZARD AND DOSE-RESPONSE ASSESSMENTS . . . . . . 9-1 9.1. INTRODUCTION . . . . . . . . . . . . . . . . . . . . . . . . . . . . . . . . . . . . . . . . . . . . . . . . . . . . 9-1 9.2. PHYSICAL AND CHEMICAL COMPOSITION OF DIESEL EXHAUST . . . . . . . . 9-2
9.2.1. Diesel Exhaust Components of Possible Health Concern . . . . . . . . . . . . . . . . . 9-2 9.2.2. “Fresh” Versus “Aged” Diesel Exhaust . . . . . . . . . . . . . . . . . . . . . . . . . . . . . . . 9-4 9.2.3. Changes of Diesel Exhaust Emissions and Composition Over Time . . . . . . . . 9-5
9.3. AMBIENT CONCENTRATIONS AND EXPOSURE TO DIESEL EXHAUST . . . . 9-6 9.4. HAZARD CHARACTERIZATION . . . . . . . . . . . . . . . . . . . . . . . . . . . . . . . . . . . . . . 9-8
9.4.1. Acute and Short-Term Exposures . . . . . . . . . . . . . . . . . . . . . . . . . . . . . . . . . . . 9-8 9.4.2. Chronic Exposure . . . . . . . . . . . . . . . . . . . . . . . . . . . . . . . . . . . . . . . . . . . . . . . 9-10
9.5. DOSE-RESPONSE ASSESSMENT . . . . . . . . . . . . . . . . . . . . . . . . . . . . . . . . . . . . . 9-16 9.5.1. Evaluation of Risk for Noncancer Health Effects . . . . . . . . . . . . . . . . . . . . . . 9-17 9.5.2. Evaluation of Cancer Risks . . . . . . . . . . . . . . . . . . . . . . . . . . . . . . . . . . . . . . . 9-20
9.6. SUMMARY AND CONCLUSIONS . . . . . . . . . . . . . . . . . . . . . . . . . . . . . . . . . . . . . 9-24 REFERENCES FOR CHAPTER 9 . . . . . . . . . . . . . . . . . . . . . . . . . . . . . . . . . . . . . . . . . . . . . 9-27
APPENDIX A: CALCULATION OF HUMAN EQUIVALENT CONTINUOUS EXPOSURE CONCENTRATIONS (HECs) . . . . . . . . . . . . . . . . . . . . . . . A-1
APPENDIX B: BENCHMARK CONCENTRATION ANALYSIS OF DIESEL DATA . . . . . . . . . . . . . . . . . . . . . . . . . . . . . . . . . . . . . . . . . . . . . . . B-1
APPENDIX C: A SUMMARY REVIEW OF CANCER DOSE-RESPONSE ANALYSES ON DIESEL EXHAUST . . . . . . . . . . . . . . . . . . . . . . . . . . . . . C-1
vii
LIST OF TABLES
2-1. Vehicle classification and weights for on-road trucks . . . . . . . . . . . . . . . . . . . . . . . . . 2-5 2-2. Total (gas and diesel) diesel trucks in the fleet in 1992 . . . . . . . . . . . . . . . . . . . . . . . . 2-5 2-3. Typical chemical composition of fine particulate matter . . . . . . . . . . . . . . . . . . . . . . 2-14 2-4. U.S. emission standards: HD highway diesel engines . . . . . . . . . . . . . . . . . . . . . . . . 2-16 2-5. U.S. emission standards: locomotives (g/bhp-hr) . . . . . . . . . . . . . . . . . . . . . . . . . . . 2-17 2-6. U.S. emission standards for nonroad diesel equipment (g/bhp-hr) . . . . . . . . . . . . . . . 2-18 2-7. Comparison of in-use truck fleet with truck fleet tested on chassis dynamometer,
percent of total vehicles . . . . . . . . . . . . . . . . . . . . . . . . . . . . . . . . . . . . . . . . . . . . . . . 2-31 2-8. Diesel engine emissions data from engine dynamometer tests . . . . . . . . . . . . . . . . . . 2-34 2-9. HD diesel emissions results from tunnel tests . . . . . . . . . . . . . . . . . . . . . . . . . . . . . . 2-40 2-10. Remote sensing results for HD vehicles . . . . . . . . . . . . . . . . . . . . . . . . . . . . . . . . . . . 2-41 2-11. Summary of CDD/CDF emissions from diesel-fueled vehicles . . . . . . . . . . . . . . . . . 2-57 2-12. Baltimore Harbor Tunnel Study: estimated CDD/CDF emission factors for HD
vehicles . . . . . . . . . . . . . . . . . . . . . . . . . . . . . . . . . . . . . . . . . . . . . . . . . . . . . . . . . . . . 2-60 2-13. Organic and elemental carbon fractions of diesel and gasoline engine PM exhaust . 2-70 2-14. Emission rates of PAH (mg/mi) from LD and HD diesel vehicles . . . . . . . . . . . . . . . 2-73 2-15. Polycyclic aromatic hydrocarbons identified in extracts of diesel particles from
LD diesel engine exhaust . . . . . . . . . . . . . . . . . . . . . . . . . . . . . . . . . . . . . . . . . . . . . . 2-74 2-16. Emission rates of particle-bound PAH (:g/mi) from diesel and gasoline engines . . 2-76 2-17. Concentrations of nitro-PAHs identified in LD diesel particulate extracts . . . . . . . . 2-77 2-18. Average emission rates for polycyclic aromatic hydrocarbons for different fuel
types . . . . . . . . . . . . . . . . . . . . . . . . . . . . . . . . . . . . . . . . . . . . . . . . . . . . . . . . . . . . . . 2-81 2-19. Classes of compounds in diesel exhaust . . . . . . . . . . . . . . . . . . . . . . . . . . . . . . . . . . . 2-86 2-20. Calculated atmospheric lifetimes for gas-phase reactions of selected compounds
present in automotive emissions with important reactive species . . . . . . . . . . . . . . . 2-87 2-21. Major components of gas-phase diesel engine emissions, their known atmospheric
transformation products, and the biological impact of the reactants and products . . . 2-88 2-22. Major components of particle-phase diesel engine emissions, their known
atmospheric transformation products, and the biological impact of the reactants and products . . . . . . . . . . . . . . . . . . . . . . . . . . . . . . . . . . . . . . . . . . . . . . . . . . . . . . . . 2-92
2-23. Ambient DPM concentrations reported from chemical mass balance modeling . . . . 2-98 2-24. Ambient diesel particulate matter concentrations from elemental carbon
measurements in urban locations . . . . . . . . . . . . . . . . . . . . . . . . . . . . . . . . . . . . . . . 2-103 2-25. Ambient diesel particulate matter concentrations from dispersion modeling . . . . . 2-105 2-26. Nationwide ambient diesel particulate matter concentrations for 1996 from
the National Air Toxics Assessment National-Scale Assessment dispersion modeling . . . . . . . . . . . . . . . . . . . . . . . . . . . . . . . . . . . . . . . . . . . . . . . . . 2-107
2-27. Occupational exposure to DPM . . . . . . . . . . . . . . . . . . . . . . . . . . . . . . . . . . . . . . . . 2-109 2-28. Ranges of occupational exposure to DPM by job category with estimates of equivalent
environmental exposures . . . . . . . . . . . . . . . . . . . . . . . . . . . . . . . . . . . . . . . . . . . . . 2-111 2-29. Annual average nationwide DPM exposure estimates (:g/m3) from on-road sources
for rural and urban demographic groups in 1990, 1996, and 2007 using HAPEM-MS3 . . . . . . . . . . . . . . . . . . . . . . . . . . . . . . . . . . . . . . . . . . . . . . . . . . . . . . 2-114
viii

LIST OF TABLES (continued)
ix
2-30. Draft annual average, 25th, and 75th percentile nationwide DPM exposure estimates (µg/m3) from on-road and nonroad sources for rural and urban counties in 1996 using HAPEM4 . . . . . . . . . . . . . . . . . . . . . . . . . . . . . . . . . . . . . . . . . . . . . . . . . 2-113
2-31. Annual average DPM exposures for 1990 and 1996 in the general population and among the highest exposed demographic groups in nine urban areas and nationwide from on-road sources only using HAPEM-MS3 . . . . . . . . . . . . . . . . . . . . 2-114
2-32. Modeled and estimated concentrations of DPM in microenvironments for California for all sources . . . . . . . . . . . . . . . . . . . . . . . . . . . . . . . . . . . . . . . . . . . . . . . . 2-117
2-33. Estimated indoor air and total air exposures to DPM in California in 1990 . . . . . . . . . 2-118
3-1. Predicted doses of inhaled DPM per minute based on total lung volume (M), total airway surface area (M1), or surface area in alveolar region (M2) . . . . . . . . . . . . . . . . . . . 3-9
3-2. Alveolar clearance in laboratory animals exposed to DPM in whole exhaust . . . . . . . . 3-173-3. Model comparison for deposition of DPM under equivalent conditions . . . . . . . . . . . . 3-503-4. Comparative model estimates of DPM deposition in human lungs from exposure
to 5µg/m³ continuously for one year . . . . . . . . . . . . . . . . . . . . . . . . . . . . . . . . . . . . . . . . . 3-53
5-1. Human studies of exposure to diesel exhaust . . . . . . . . . . . . . . . . . . . . . . . . . . . . . . . . . 5-185-2. Short-term effects of diesel exhaust on laboratory animals . . . . . . . . . . . . . . . . . . . . . . 5-265-3. Effects of chronic exposures to diesel exhaust on survival and growth of
laboratory animals . . . . . . . . . . . . . . . . . . . . . . . . . . . . . . . . . . . . . . . . . . . . . . . . . . . . . . 5-315-4. Effects of chronic exposures to diesel exhaust on organ weights and
organ-to-body-weight ratios . . . . . . . . . . . . . . . . . . . . . . . . . . . . . . . . . . . . . . . . . . . . . . . 5-335-5. Effects of diesel exhaust on pulmonary function of laboratory animals . . . . . . . . . . . . 5-365-6. Histopathological effects of diesel exhaust in the lungs of laboratory animals . . . . . . . 5-415-7. Effects of exposure to diesel exhaust on the pulmonary defense mechanisms of laboratory
animals . . . . . . . . . . . . . . . . . . . . . . . . . . . . . . . . . . . . . . . . . . . . . . . . . . . . . . . . . . . . . . . 5-515-8. Effects of inhalation of diesel exhaust on the immune system of laboratory animals . . 5-605-9. Effects of diesel particulate matter on the immune response of laboratory animals . . . 5-645-10. Effects of exposure to diesel exhaust on the liver of laboratory animals . . . . . . . . . . . . 5-705-11. Effects of exposure to diesel exhaust on the hematological and cardiovascular
systems of laboratory animals . . . . . . . . . . . . . . . . . . . . . . . . . . . . . . . . . . . . . . . . . . . . . 5-725-12. Effects of chronic exposures to diesel exhaust on serum chemistry of laboratory
animals . . . . . . . . . . . . . . . . . . . . . . . . . . . . . . . . . . . . . . . . . . . . . . . . . . . . . . . . . . . . . . . 5-745-13. Effects of chronic exposures to diesel exhaust on microsomal enzymes of
laboratory animals . . . . . . . . . . . . . . . . . . . . . . . . . . . . . . . . . . . . . . . . . . . . . . . . . . . . . . 5-765-14. Effects of chronic exposures to diesel exhaust on behavior and neurophysiology . . . . 5-795-15. Effects of chronic exposures to diesel exhaust on reproduction and development
in laboratory animals . . . . . . . . . . . . . . . . . . . . . . . . . . . . . . . . . . . . . . . . . . . . . . . . . . . . 5-815-16. Composition of exposure atmospheres in studies comparing unfiltered and
filtered diesel exhaust . . . . . . . . . . . . . . . . . . . . . . . . . . . . . . . . . . . . . . . . . . . . . . . . . . . 5-84
6-1. Histopathological effects of diesel exhaust in the lungs of laboratory animals . . . . . . . . 6-76-2. Human equivalent continuous concentrations: 70-year HECs calculated
with the model of Yu et al. (1991) from long-term studies of rats repeatedly exposed to DPM . . . . . . . . . . . . . . . . . . . . . . . . . . . . . . . . . . . . . . . . . . . . . . . . . . . . . . . . 6-22

LIST OF TABLES (continued)
6-3. Effect estimates per 50 :g/m3 increase in 24-h PM10 concentrations from U.S. and Canadian studies . . . . . . . . . . . . . . . . . . . . . . . . . . . . . . . . . . . . . . . . . . . . . . . . . . . . . 6-20
6-4. Effect estimates per variable increments in 24-h concentrations of fine particle indicators (PM2.5, SO=
4, H+) from U.S. and Canadian studies . . . . . . . . . . . . . . . . . . 6-23 6-5. Effect estimates per increments in annual average levels of fine particle
indicators from U.S. and Canadian studies . . . . . . . . . . . . . . . . . . . . . . . . . . . . . . . . . 6-24 6-6. Decision summary for the quantitative noncancer RfC assessment for continuous
exposure to diesel particulate matter (DPM) . . . . . . . . . . . . . . . . . . . . . . . . . . . . . . . 6-33
7-1. Epidemiologic studies of the health effects of exposure to DE: cohort mortality studies . . . . . . . . . . . . . . . . . . . . . . . . . . . . . . . . . . . . . . . . . . . . . . . . . . . . . . . . . . . . . 7-27
7-2. Epidemiologic studies of the health effects of exposure to DE: case-control studies of lung cancer . . . . . . . . . . . . . . . . . . . . . . . . . . . . . . . . . . . . . . . . . . . . . . . . . 7-55
7-3. Summary of animal inhalation carcinogenicity studies . . . . . . . . . . . . . . . . . . . . . . . 7-85 7-4. Tumor incidences in rats following intratracheal instillation of DE particles (DPM),
extracted DPM, carbon black (CB), benzo[a]pyrene (B[a]P), or particles plus B[a]P . . . . . . . . . . . . . . . . . . . . . . . . . . . . . . . . . . . . . . . . . . . . . . . . . . . . . . . . . . 7-96
7-5. Tumorigenic effects of dermal application of acetone extracts of DPM . . . . . . . . . . 7-96 7-6. Tumor incidence and survival time of rats treated by surgical lung implantation
with fractions from DE condensate (35 rats/group) . . . . . . . . . . . . . . . . . . . . . . . . . 7-111 7-7. Dermal tumorigenic and carcinogenic effects of various emission extracts . . . . . . 7-120 7-8. Cumulative (concentration × time) exposure data for rats exposed to whole DE . . 7-122 7-9. Evaluations of DE as to human carcinogenic potential . . . . . . . . . . . . . . . . . . . . . . 7-144
8-1. DPM exposure margins (ratio of occupational ÷ environmental exposures) . . . . . . . 8-12
x

LIST OF FIGURES
2-1. Diesel truck sales (domestic) for the years 1939-1997 . . . . . . . . . . . . . . . . . . . . . . . . . 2-6 2-2. Diesel truck sales as a percentage of total truck sales for the years 1939-1997 . . . . . . 2-6 2-3. Percentage of truck miles attributable to diesel trucks . . . . . . . . . . . . . . . . . . . . . . . . . 2-7 2-4. Model year distribution of in-use HD truck fleet in 1997 . . . . . . . . . . . . . . . . . . . . . . 2-8 2-5. Model year distribution of vehicle miles traveled by the in-use HD truck
fleet in 1997 . . . . . . . . . . . . . . . . . . . . . . . . . . . . . . . . . . . . . . . . . . . . . . . . . . . . . . . . . 2-8 2-6. A comparison of IDI (A) and DI (B) combustion systems of high-speed HD diesel
truck engines . . . . . . . . . . . . . . . . . . . . . . . . . . . . . . . . . . . . . . . . . . . . . . . . . . . . . . . . 2-10 2-7. Schematic diagram of diesel engine exhaust particles . . . . . . . . . . . . . . . . . . . . . . . . 2-12 2-8. Typical chemical composition for diesel particulate matter (PM2.5) from new
(post-1990) HD diesel vehicle exhaust . . . . . . . . . . . . . . . . . . . . . . . . . . . . . . . . . . . . 2-14 2-9. Trends in PM10 emissions from on-road and nonroad engines combined and other
anthropogenic sources of PM10 from 1970 to 1998 (excludes miscellaneous and natural sources) . . . . . . . . . . . . . . . . . . . . . . . . . . . . . . . . . . . . . . . . . . . . . . . . . . . . . . 2-19
2-10. Trends in PM10 emissions from on-road and nonroad diesel engines from 1970 to 1998 and projections of emissions to 2007 and 2030 . . . . . . . . . . . . . . . . . . . . . . . 2-21
2-11. Trends in NOx emissions from on-road and nonroad diesel engines combined and other anthropogenic sources of NOx from 1970 to 1998 (excludes miscellaneous and natural sources) . . . . . . . . . . . . . . . . . . . . . . . . . . . . . . . . . . . . . . . . . . . . . . . . . . 2-22
2-12. Trends in NOx emissions from on-road and nonroad diesel engines from 1970 to 1998 . . . . . . . . . . . . . . . . . . . . . . . . . . . . . . . . . . . . . . . . . . . . . . . . . . . . . . . . 2-23
2-13. Trends in SO2 emissions from on-road diesel engines from 1970 to 1998 and nonroad diesel engines from 1990 to 1998 . . . . . . . . . . . . . . . . . . . . . . . . . . . . . . . . . 2-24
2-14. Trends in VOC emissions from on-road and nonroad diesel engines from 1970 to 1998 . . . . . . . . . . . . . . . . . . . . . . . . . . . . . . . . . . . . . . . . . . . . . . . . . . . . . . . . . . . . 2-24
2-15. Trends in CO emissions from on-road and nonroad diesel engines from 1970 to 1998 . . . . . . . . . . . . . . . . . . . . . . . . . . . . . . . . . . . . . . . . . . . . . . . . . . . . . . . . 2-25
2-16. Percentage of total motor fuel use that is on-road diesel fuel since 1949 . . . . . . . . . 2-26 2-17. On-highway diesel fuel consumption since 1943, values in thousands of gallons . . . 2-26 2-18. Model year trends in PM, NOx, HC, and CO emissions from HD diesel vehicles
(g/mile) . . . . . . . . . . . . . . . . . . . . . . . . . . . . . . . . . . . . . . . . . . . . . . . . . . . . . . . . . . . . 2-30 2-19. Diesel engine certification data for NOx emissions as a function of model year . . . . 2-33 2-20. Diesel engine certification data for PM emissions as a function of model year . . . . . 2-37 2-21. Emission factors from HD diesel vehicles from tunnel studies . . . . . . . . . . . . . . . . . 2-42 2-22. Line-haul and switch emissions data . . . . . . . . . . . . . . . . . . . . . . . . . . . . . . . . . . . . . 2-44 2-23. Effect of turbocharging and aftercooling on NOx and PM . . . . . . . . . . . . . . . . . . . . . 2-49 2-24. Comparison of diesel engine dynamometer PM emissions for four-stroke,
naturally aspirated, and turbocharged engines . . . . . . . . . . . . . . . . . . . . . . . . . . . . . . 2-50 2-25. An example of uniflow scavenging of a two-stroke diesel engine with a positive
displacement blower . . . . . . . . . . . . . . . . . . . . . . . . . . . . . . . . . . . . . . . . . . . . . . . . . . 2-52 2-26. Comparison of two- and four-stroke vehicle diesel PM emissions from chassis
dynamometer studies . . . . . . . . . . . . . . . . . . . . . . . . . . . . . . . . . . . . . . . . . . . . . . . . . 2-53 2-27. Comparison of two- and four-stroke engine diesel PM emissions from engine
dynamometer studies . . . . . . . . . . . . . . . . . . . . . . . . . . . . . . . . . . . . . . . . . . . . . . . . . 2-54 2-28. Diesel engine dynamometer SOF emissions from two- and four-stroke engines. . . . 2-54
xi

LIST OF FIGURES (continued)
2-29. Diesel engine aldehyde emissions measured in chassis dynamometer studies . . . . . 2-56 2-30. Diesel engine aldehyde emissions from engine dynamometer studies . . . . . . . . . . . . 2-56 2-31. Trend in SOF emissions based on chassis dynamometer testing of HD diesel
vehicles . . . . . . . . . . . . . . . . . . . . . . . . . . . . . . . . . . . . . . . . . . . . . . . . . . . . . . . . . . . . 2-66 2-32. Trend in SOF emissions for transient engine dynamometer testing of HD diesel
engines . . . . . . . . . . . . . . . . . . . . . . . . . . . . . . . . . . . . . . . . . . . . . . . . . . . . . . . . . . . . 2-66 2-33. Trend in SOF emissions as a percent of total PM based on chassis dynamometer
testing of HD diesel vehicles . . . . . . . . . . . . . . . . . . . . . . . . . . . . . . . . . . . . . . . . . . . 2-68 2-34. Trend in SOF emissions as a percentage of total PM from engine dynamometer
testing . . . . . . . . . . . . . . . . . . . . . . . . . . . . . . . . . . . . . . . . . . . . . . . . . . . . . . . . . . . . . 2-68 2-35. EC emission rates for diesel vehicles . . . . . . . . . . . . . . . . . . . . . . . . . . . . . . . . . . . . . 2-72 2-36. EC content as percent of fine PM for DPM samples obtained in chassis
dynamometer studies . . . . . . . . . . . . . . . . . . . . . . . . . . . . . . . . . . . . . . . . . . . . . . . . . 2-72 2-37. Diesel engine emissions of benzo[a]pyrene and 1-nitropyrene measured in chassis
dynamometer studies . . . . . . . . . . . . . . . . . . . . . . . . . . . . . . . . . . . . . . . . . . . . . . . . . 2-78 2-38. Diesel engine dynamometer measurements of benzo[a]pyrene and 1-nitropyrene
emissions from HD diesel engines . . . . . . . . . . . . . . . . . . . . . . . . . . . . . . . . . . . . . . . 2-79 2-39. Particle size distribution in DE . . . . . . . . . . . . . . . . . . . . . . . . . . . . . . . . . . . . . . . . . . 2-82
3-1. Schematic representation of major mechanisms, including diffusion, involved in particle deposition . . . . . . . . . . . . . . . . . . . . . . . . . . . . . . . . . . . . . . . . . . . . . . . . . . . . . 3-4
3-2. Generalized regional deposition fractions of various sized particles in the human respiratory tract . . . . . . . . . . . . . . . . . . . . . . . . . . . . . . . . . . . . . . . . . . . . . . . . . . . . . . . 3-6
3-3. Modeled deposition distribution patterns of inhaled DE particles in the airways of different species . . . . . . . . . . . . . . . . . . . . . . . . . . . . . . . . . . . . . . . . . . . . . . . . . . . . . . 3-8
3-4. Diagram of known and suspected clearance pathways for poorly soluble particles depositing in the alveolar region . . . . . . . . . . . . . . . . . . . . . . . . . . . . . . . . . . . . . . . . . 3-10
3-5. Modeled clearance of poorly soluble 4-:m particles deposited in tracheobronchial and alveolar regions in humans . . . . . . . . . . . . . . . . . . . . . . . . . . . . . . . . . . . . . . . . . . 3-12
3-6. Short-term thoracic clearance of inhaled particles as determined by model prediction and experimental measurement . . . . . . . . . . . . . . . . . . . . . . . . . . . . . . . . . . . . . . . . . . 3-13
3-7. Clearance from lungs of rats of 134Cs-FAP fused aluminosilicate tracer particles inhaled after 24 months of DE exposure at concentrations of 0 (control), 0.35 (low), 3.5 (medium), and 7.1 (high) mg DPM/m3 . . . . . . . . . . . . . . . . . . . . . . . 3-18
3-8. Lung burdens (in mg DPM soot/g lung) in rats chronically exposed to DE at 0.35 (low), 3.5 (medium), and 7.1 (high) mg ppm/m3 . . . . . . . . . . . . . . . . . . . . . . . . 3-27
3-9. Modeled estimates of lung burden in humans after a simulated lifetime exposure to DPM using the Yu et al. (1991) and ICRP66 models . . . . . . . . . . . . . . . . . . . . . . . 3-51
6-1. Flow diagram of procedure for calculating HECs . . . . . . . . . . . . . . . . . . . . . . . . . . . 6-10 6-2. Relative risk (RR) estimates for increased mortality and morbidity endpoints
associated with 50 :g/m3 increments in PM10 concentrations as derived from studies cited by numbers listed above each given type of health endpoint . . . . . . . . 6-22
6-3. Relative risks of acute mortality in Harvard Six Cities Study, for inhalable thoracic particles (PM15/PM10), fine particles (PM2.5), and coarse fraction
xii

LIST OF FIGURES (continued)
particles (PM -PM ) . . . . . . . . . . . . . . . . . . . . . . . . . . . . . . . . . . . . . . . . . . . . . . . . .2.515 6-26 6-4. Adjusted relative risks for mortality are plotted against each of seven long-term
average particle indices in the Harvard Six Cities Study, from largest range (total suspended particles) through sulfate and nonsulfate fine particle concentrations . . . 6-27
6-5. Percent of children with <85% normal FVC versus annual-average fine (PM2.1) particle concentrations and coarse fraction (PM10-2.1) levels for 22 North American cities . . . . . . . . . . . . . . . . . . . . . . . . . . . . . . . . . . . . . . . . . . . . . . . . . . . . . . 6-28
7-1. Pooled relative risk estimates and heterogeneity-adjusted 95% confidence intervals for all studies and subgroups of studies included in the meta-analysis . . . . . . . . . . . 7-62
7-2. Pooled estimates of relative risk of lung cancer in epidemiologic studies involving occupational exposure to DE (random-effects models) . . . . . . . . . . . . . . . 7-64
7-3. Pathogenesis of lung disease in rats with chronic, high-level exposures to particles . . . . . . . . . . . . . . . . . . . . . . . . . . . . . . . . . . . . . . . . . . . . . . . . . . . . . . . . . . . 7-137
xiii

FOREWORD
The diesel engine has been a vital workhorse in the United States, powering many of its large trucks, buses, and farm, railroad, marine, and construction equipment. Expectations are that diesel engine use in these areas will increase due to the superior performance characteristics of the engine. Diesel engine exhaust (DE), however, contains harmful pollutants in a complex mixture of gases and particulates. Human exposure to this exhaust comes from both highway uses (on-road) as well as nonroad uses of the diesel engine.
EPA started evaluating and regulating the gaseous emissions from the heavy-duty highway use of diesel engines in the 1970s and particle emissions in the 1980s. The reduction of harmful exhaust emissions has taken a large step forward because of standards issued in 2000 which will bring about very large reductions in exhaust emissions for model year 2007 heavy-duty engines used in trucks, buses, and other on-road uses. A draft of this assessment, along with the peer review comments of the Clean Air Scientific Advisory Committee, was part of the scientific basis for EPA’s regulation of heavy-duty highway engines completed in December 2000. The information provided by this assessment was useful in developing EPA’s understanding of the public health implications of exposure to DE and the public health benefits of taking regulatory action to control exhaust emissions. EPA anticipates developing similarly stringent regulations for other diesel engine uses, including those used in nonroad applications.
Until these regulations take effect, EPA is partnering with state and local agencies to retrofit older, dirtier, engines to make them run cleaner and to develop model programs to reduce emissions from idling engines. In addition, EPA and local authorities are working to ensure early introduction of effective technologies for particulate matter control and the availability of low- sulfur fuel where possible in advance of the 2007 requirements. Today, at least one engine manufacturer is producing new engines with particulate traps that, when coupled with low-sulfur fuel, meet 2007 particulate emission levels. The Agency expects significant environmental and public health benefits as the environmental performance of diesel engines and diesel fuels improves.
The health assessment concludes that long-term (i.e., chronic) exposure to DE is likely to pose a lung cancer hazard as well as damage the lung in other ways depending on exposure. The health assessment’s conclusions are based on exposure to exhaust from diesel engines built prior to the mid-1990s. Short-term (i.e., acute) exposures can cause transient irritation and inflammatory symptoms, although the nature and extent of these symptoms are highly variable across the population. The assessment also states that evidence is emerging that diesel exhaust
xiv

xv

PREFACE
This document is the U.S. Environmental Protection Agency’s science-based Health Assessment Document for Diesel Engine Exhaust. The assessment was prepared by the National Center for Environmental Assessment which is the health risk assessment program in EPA’s Office of Research and Development. The assessment broadly supports activities authorized in the 1990 Clean Air Act. This assessment was specifically prepared for EPA’s Office of Transportation and Air Quality which requested information regarding the potential health hazards associated with diesel engine exhaust (DE) exposure. As DE emissions also contribute to urban air toxics and ambient particulate matter, other EPA air programs also have an interest in this assessment.
This document was preceded by five earlier drafts: a Workshop Review Draft (EPA/600/8-90/057A, July 1990), an External Review Draft (EPA/600/8-90/057B, December 1994), an SAB Review Draft (EPA/600/8-90/057C, February 1998), an SAB Review Draft (EPA/600/8-90/057D, November 1999), and an SAB Review Draft (EPA/600/8-90/057E, July 2000). There was an SAB Environmental Health Committee Review in 1990 of the July 1990 draft. The Science Advisory Board’s Clean Air Scientific Advisory Committee (CASAC) reviewed the 1994 draft in public sessions in May 1995, the 1998 draft in May 1998, the 1999 draft in December 1999, and the July 2000 draft in October 2000. Public comment periods also were conducted concurrently with the CASAC reviews. In addition many reviewers, both within and outside the Agency, provided assistance at various review stages. This is the final version of the assessment which was prepared in response to CASAC advice and public comments received on the 2000 draft.
The scientific literature search for this assessment is generally current through January 2000, although a few later publications have been included.
xvi
AUTHORS, CONTRIBUTORS, AND REVIEWERS
The National Center for Environmental Assessment (NCEA) within EPA’s Office of Research and Development (ORD) was responsible for the preparation of this document.
CHAPTER 1. EXECUTIVE SUMMARY
Authors NCEA Diesel Team
CHAPTER 2. DIESEL EMISSIONS CHARACTERIZATION, ATMOSPHERIC TRANSFORMATION, AND EXPOSURES
Author Marion Hoyer, Office of Transportation and Air Quality, U.S. Environmental Protection Agency, Ann Arbor, MI.
Contributors Chad Bailey, Office of Transportation and Air Quality, U.S. Environmental Protection Agency, Ann Arbor, MI.
Tom Baines, Office of Transportation and Air Quality, U.S. Environmental Protection Agency, Ann Arbor, MI.
David Cleverly, National Center for Environmental Assessment, U.S. Environmental Protection Agency, Washington, DC.
William Ewald, National Center for Environmental Assessment, U.S. Environmental Protection Agency, Research Triangle Park, NC.
Robert McCormick, Colorado School of Mines, Golden, CO.
Joseph McDonald, Office of Transportation and Air Quality, U.S. Environmental Protection Agency, Ann Arbor, MI.
Joseph Somers, Office of Transportation and Air Quality, U.S. Environmental Protection Agency, Ann Arbor, MI.
Janet Yanowitz, Colorado School of Mines, Golden, CO.
Barbara Zielinska, Desert Research Institute, Reno, NV.
xvii

AUTHORS, CONTRIBUTORS, AND REVIEWERS (continued)
CHAPTER 3. DOSIMETRY OF DIESEL PARTICULATE MATTER
Authors Gary Foureman, National Center for Environmental Assessment, U.S. Environmental Protection Agency, Research Triangle Park, NC.
James McGrath, National Center for Environmental Assessment, U.S. Environmental Protection Agency, Research Triangle Park, NC.
William Pepelko, National Center for Environmental Assessment, U.S. Environmental Protection Agency, Washington, DC.
CHAPTER 4. MUTAGENICITY
Author Lawrence Valcovic, National Center for Environmental Assessment, U.S. Environmental Protection Agency, Washington, DC.
CHAPTER 5. NONCANCER HEALTH EFFECTS OF DIESEL EXHAUST
Author James McGrath, National Center for Environmental Assessment, U.S. Environmental Protection Agency, Research Triangle Park, NC.
Contributor Gary Foureman, National Center for Environmental Assessment, U.S. Environmental Protection Agency, Research Triangle Park, NC.
CHAPTER 6. QUANTITATIVE APPROACHES TO ESTIMATING HUMAN NONCANCER HEALTH RISKS OF DIESEL EXHAUST
Authors Gary Foureman, National Center for Environmental Assessment, U.S. Environmental Protection Agency, Research Triangle Park, NC.
Lester Grant, National Center for Environmental Assessment, U.S. Environmental Protection Agency, Research Triangle Park, NC.
Contributors Karen Martin, Office of Air Quality Planning and Standards-OAR, U.S. Environmental Protection Agency, Research Triangle Park, NC.
xviii
AUTHORS, CONTRIBUTORS, AND REVIEWERS (continued)
xix
James McGrath, National Center for Environmental Assessment, U.S. Environmental ProtectionAgency, Research Triangle Park, NC.
CHAPTER 7. CARCINOGENICITY OF DIESEL EXHAUST
AuthorsAparna Koppikar, National Center for Environmental Assessment, U.S. EnvironmentalProtection Agency, Washington, DC.
William Pepelko, National Center for Environmental Assessment, U.S. EnvironmentalProtection Agency, Washington, DC.
ContributorsDrew Levy, University of Washington, Seattle, WA.
Robert Young, Oak Ridge National Laboratory, Oak Ridge, TN.
CHAPTER 8. DOSE-RESPONSE ASSESSMENT: CARCINOGENIC EFFECTS
AuthorsChao Chen, National Center for Environmental Assessment, U.S. Environmental ProtectionAgency, Washington, DC.
William Pepelko, National Center for Environmental Assessment, U.S. EnvironmentalProtection Agency, Washington, DC.
ContributorCharles Ris, National Center for Environmental Assessment, U.S. Environmental ProtectionAgency, Washington, DC.
CHAPTER 9. CHARACTERIZATION OF POTENTIAL HUMAN HEALTH EFFECTSOF DIESEL EXHAUST: HAZARD AND DOSE-RESPONSE ASSESSMENTS
AuthorCharles Ris, National Center for Environmental Assessment, U.S. Environmental ProtectionAgency, Washington, DC.
ContributorsNCEA Diesel Team
AUTHORS, CONTRIBUTORS, AND REVIEWERS (continued)
xx
REVIEWERS The Science Advisory Board’s Clean Air Scientific Advisory Committee (CASAC)reviewed the 1994 draft in public sessions in May 1995, the 1998 draft in May 1998, the 1999draft in December 1999, and the July 2000 draft in October 2000. Public comment periods alsowere conducted concurrently with the CASAC reviews. In addition, many reviewers both withinand outside the Agency provided assistance at various review stages. This is the final version ofthe assessment which was prepared in response to the latest CASAC advice and publiccomments.
The authors wish to thank all those who sought to improve the quality of this report withtheir comments and are particularly grateful to the CASAC for its advice.
The following members of the SAB’s CASAC participated in the review of the July 2000draft.
Panel ChairDr. Joe Mauderly1, Vice President, Senior Scientist, and Director of National Environmental
Respiratory Center, Lovelace Respiratory Research Institute, Albuquerque, NM.
CASAC Members2
Mr. John Elston, Administrator, Office of Air Quality Management, State of New Jersey,Department of Environmental Protection and Energy, Trenton, NJ.
Dr. Philip K. Hopke3, R.A. Plane Professor of Chemistry, Clarkson University, Department ofChemistry, Potsdam, NY (CASAC Chair).
Dr. Eva J. Pell4, Steimer Professor of Agriculture Sciences, The Pennsylvania State University,University Park, PA.
Dr. Arthur C. Upton, M.D., Director, Independent Peer Review, UMDNJ-CRESP,Environmental and Occupational Health Sciences Institute, New Brunswick, NJ.
Dr. Sverre Vedal, M.D., University of British Columbia, Vancouver Hospital, Vancouver, BC,Canada.
Dr. Warren White5, Senior Research Associate, Washington University, ChemistryDepartment, St. Louis, MO.
CASAC Consultants6
Dr. David Diaz-Sanchez, Department of Medicine, UCLA, Los Angeles, CA.
Dr. Eric Garshick, M.D., Staff Physician, Pulmonary and Critical Care Section, West RoxburyVirginia Medical Center, West Roxbury, MA.

Dr. Roger O. McClellan, Advisor, Toxicology and Human Health Risk Analysis, and President Emeritus, Chemical Industry Institute of Toxicology (CIIT), Albuquerque, NM.
Dr. Gunter Oberdörster, University of Rochester Medical Center, Department of Environmental Medicine, Rochester, NY.
Dr. Leslie Stayner7, National Institute for Occupational Safety and Health (NIOSH), Risk Evaluation Branch, Taft Laboratories, Cincinnati, OH.
Dr. Ron Wyzga, Electric Power Research Institute (EPRI), Palo Alto, CA.
Science Advisory Board Staff Mr. Robert Flaak, Designated Federal Official (DFO) and Team Leader, Committee Operations
Staff, EPA Science Advisory Board (1400A), 1200 Pennsylvania Avenue, NW, U.S. Environmental Protection Agency, Washington, DC 20460
Ms. Diana Pozun, Management Assistant, Committee Operations Staff, and Program Specialist, Office of the Staff Director, EPA Science Advisory Board (1400A), 1200 Pennsylvania Avenue, NW, U.S. Environmental Protection Agency, Washington, DC 20460
_____________________ 1Appointment as Chair of CASAC ended on October 30, 2000. Appointed ex officio Past Chair until
September 30, 2001.2CASAC Members are experts appointed by the Administrator to two-year terms to serve on the Clean Air
Scientific Advisory Committee.3Appointed as Chair of CASAC on October 30, 2000.4Resigned from CASAC on September 28, 2000.5Appointment as Member of CASAC ended on October 30, 2000.6CASAC Consultants are experts appointed by the Science Advisory Board Staff Director to a one-year
term to serve on ad hoc Panels formed to address a particular issue; in this case, the CASAC Review of EPA’s Health Assessment Document for Diesel Exhaust.
7Federal Expert.
xxi

ACKNOWLEDGMENTS
The authors would like to acknowledge the contributions of several people who have made this report and the previous drafts possible.
Document Review Vanessa Vu National Center for Environmental Assessment U.S. Environmental Protection Agency Washington, DC
Document Production Terri Konoza Judy Theisen National Center for Environmental Assessment U.S. Environmental Protection Agency Washington, DC
Kay Marshall Joanna Taylor Eric Sorensen Clara Calderon-Laucho The CDM Group, Inc. Chevy Chase, MD
Sam Napolitano Office of Transportation and Air Quality U.S. Environmental Protection Agency Washington, DC
xxii
1. EXECUTIVE SUMMARY
1.1. INTRODUCTION This Health Assessment Document for Diesel Engine Exhaust (DE) represents EPA’s
first comprehensive review of the potential health effects from ambient exposure to exhaust from diesel engines. The assessment was developed to provide information about the potential for DE to pose environmental health hazards, information that would be useful in evaluating regulatory needs under provisions of the Clean Air Act. The assessment identifies and characterizes the potential human health hazards of DE (i.e, hazard assessment) and seeks to estimate the relationship between exposure and disease response for the key health effects (i.e., dose-response assessment). A full exposure assessment and risk characterization, the other two components of a complete risk assessment, are beyond the scope of this document.
The report has nine chapters and three appendices. Chapter 2 provides a characterization of diesel emissions, atmospheric transformation, and human exposures to provide a context for the hazard evaluation of DE. Chapters 3, 4, 5, and 7 provide a review of relevant information for the evaluation of potential health hazards of DE, including dosimetry (Chapter 3), mutagenicity (Chapter 4), noncancer effects (Chapter 5), and carcinogenic effects (Chapter 7). Chapters 6 and 8 contain dose-response analyses to provide insight about the significance of the key noncancer and cancer hazards. Chapter 9 summarizes and characterizes the overall nature of the health hazard potential in the environment and the overall confidence and/or uncertainties associated with the conclusions.
1.2. COMPOSITION OF DIESEL EXHAUST DE is a complex mixture of hundreds of constituents in either a gas or particle form.
Gaseous components of DE include carbon dioxide, oxygen, nitrogen, water vapor, carbon monoxide, nitrogen compounds, sulfur compounds, and numerous low-molecular-weight hydrocarbons. Among the gaseous hydrocarbon components of DE that are individually known to be of toxicologic relevance are the aldehydes (e.g., formaldehyde, acetaldehyde, acrolein), benzene, 1,3-butadiene, and polycyclic aromatic hydrocarbons (PAHs) and nitro-PAHs.
The particles present in DE (i.e., diesel particulate matter [DPM]) are composed of a center core of elemental carbon and adsorbed organic compounds, as well as small amounts of sulfate, nitrate, metals, and other trace elements. DPM consists of fine particles (fine particles have a diameter <2.5 :m), including a subgroup with a large number of ultrafine particles (ultrafine particles have a diameter <0.1 :m). Collectively, these particles have a large surface area which makes them an excellent medium for adsorbing organics. Also, their small size makes them highly respirable and able to reach the deep lung. A number of potentially
1-1

toxicologically relevant organic compounds are on the particles. The organics, in general, range from about 20% to 40 % of the particle weight, though higher and lower percentages are also reported. Many of the organic compounds present on the particle and in the gases are individually known to have mutagenic and carcinogenic properties. For example, PAHs, nitro-PAHs, and oxidized PAH derivatives are present on the diesel particles, with the PAHs and their derivatives comprising about 1% or less of the DPM mass.
DE emissions vary significantly in chemical composition and particle sizes between different engine types (heavy-duty, light-duty), engine operating conditions (idle, accelerate, decelerate), and fuel formulations (high/low sulfur fuel). Also, there are emission differences between on-road and nonroad engines simply because the nonroad engines to date are generally of older technology. The mass of particles emitted and the organic components on the particles from on-road diesel engines have been reduced over the years. Available data for on-road engines indicate that toxicologically relevant organic components of DE (e.g., PAHs, nitro-PAHs) emitted from older vehicle engines are still present in emissions from newer engines, though relative amounts have decreased. There is currently insufficient information to characterize the changes in the composition of DE from nonroad diesel engines over time.
1.3. DIESEL EXHAUST AS A COMPONENT OF AMBIENT PARTICULATE MATTER DE is emitted from “on-road” diesel engines (vehicle engines) or “nonroad” diesel
engines (e.g., locomotives, marine vessels, heavy-duty equipment, etc.). Nationwide, data in 1998 indicated that DE as measured by DPM made up about 6% of the total ambient PM2.5
inventory (i.e., particles with aerodynamic diameter of 2.5 micrometers or less) and about 23% of the inventory, if natural and miscellaneous sources of PM2.5 are excluded. Estimates of the DPM percentage of the total inventory in urban centers are higher. For example, estimates range from 10% to 36% in some urban areas in California, Colorado, and Arizona. Available data also indicate that over the years there have been significant reductions in DPM emissions from the exhaust of on-road diesel engines, whereas limited data suggest that exhaust emissions from nonroad engines have increased.
1.4. ATMOSPHERIC TRANSFORMATION OF DIESEL EXHAUST After emission from the tailpipe, DE undergoes dilution and chemical and physical
transformations in the atmosphere, as well as dispersion and transport in the atmosphere. The atmospheric lifetime for some compounds present in DE ranges from hours to days. DPM is directly emitted from diesel-powered engines (primary particulate matter) and can be formed from the gaseous compounds emitted by diesel engines (secondary particulate matter). Limited information is available about the physical and chemical transformation of DE in the
1-2
atmosphere. It is not clear what the overall toxicological consequences of DE’s transformations are because some compounds in the DE mixture are altered to more toxic forms while others are made less toxic.
1.5. EXPOSURE TO DIESEL EXHAUST DPM mass (expressed as :g DPM/m3) has historically been used as a surrogate measure
of exposure for whole DE. Although uncertainty exists as to whether DPM is the most appropriate parameter to correlate with human health effects, it is considered a reasonable choice until more definitive information about the mechanisms of toxicity or mode(s) of action of DE becomes available. In the ambient environment, human exposure to DE comes from both on-road and nonroad engine exhaust. A large percentage of the U.S. population also is exposed to ambient PM2.5, of which DPM is typically a significant constituent. Although this document does not provide an exposure assessment, DE exposure information is included to provide a context for the health effects information. Exposure estimates for the early to mid-1990s suggest that national annual average DE exposure from on-road engines alone was in the range of about 0.5 to 0.8 :g DPM/m3 of inhaled air in many rural and urban areas, respectively. Exposures could be higher if there is a nonroad DE source that adds to the exposure from on-road vehicles. For example, preliminary estimates show that, on a national average basis, accounting for nonroad DE emissions adds another twofold to the on-road exposure. For localized urban areas where people spend a large portion of their time outdoors, the exposures are higher and, for example, may range up to 4.0 :g DPM/m3 of inhaled air.
1.6. HEALTH EFFECTS OF DIESEL EXHAUST Available evidence indicates that there are human health hazards associated with
exposure to DE. The hazards include acute exposure-related symptoms, chronic exposure-related noncancer respiratory effects, and lung cancer. The health hazard conclusions are based on exhaust emissions from diesel engines built prior to the mid-1990s. With current engine use including some new and many more older engines (engines typically stay in service for a long time), the health hazard conclusions, in general, are applicable to engines currently in use. As new and cleaner diesel engines, together with different diesel fuels, replace a substantial number of existing engines, the general applicability of the health hazard conclusions will need to be re-evaluated. With new engine and fuel technology expected to produce significantly cleaner engine exhaust by 2007 (e.g., in response to new federal heavy duty engine regulations), significant reductions in public health hazards are expected for those engine uses affected by the regulations.
1-3

1.6.1. Acute (Short-Term Exposure) Effects Information is limited for characterizing the potential health effects associated with
acute or short-term exposure. However, on the basis of available human and animal evidence, it is concluded that acute or short-term (e.g., episodic) exposure to DE can cause acute irritation (e.g., eye, throat, bronchial), neurophysiological symptoms (e.g., lightheadedness, nausea), and respiratory symptoms (cough, phlegm). There also is evidence for an immunologic effect–the exacerbation of allergenic responses to known allergens and asthma-like symptoms. The lack of adequate exposure-response information in the acute health effect studies precludes the development of recommendations about levels of exposure that would be presumed safe for these effects.
1.6.2. Chronic (Long-Term Exposure) Noncancer Respiratory Effects Information from the available human studies is inadequate for a definitive evaluation of
possible noncancer health effects from chronic exposure to DE. However, on the basis of extensive animal evidence, DE is judged to pose a chronic respiratory hazard to humans. Chronic-exposure, animal inhalation studies show a spectrum of dose-dependent inflammation and histopathological changes in the lung in several animal species including rats, mice, hamsters, and monkeys.
This assessment provides an estimate of inhalation exposure of DE (as measured by DPM) to which humans may be exposed throughout their lifetime without being likely to experience adverse noncancer respiratory effects. This exposure level, known as the reference concentration (RfC) for DE of 5 :g/m3 of DPM was derived on the basis of dose-response data on inflammatory and histopathological changes in the lung from rat inhalation studies. In recognition of the presence of DPM in ambient PM2.5 , it also is appropriate to consider the wealth of PM2.5 human health effects data. In this regard, the 1997 National Ambient Air Quality Standard for PM2.5 of 15 :g/m3 (annual average concentration) also would be expected to provide a measure of protection from DPM, reflecting DPM’s current approximate proportion to PM2.5.
1.6.3. Chronic (Long-Term Exposure) Carcinogenic Effects This assessment concludes that DE is “likely to be carcinogenic to humans by inhalation”
and that this hazard applies to environmental exposures. This conclusion is based on the totality of evidence from human, animal, and other supporting studies. There is considerable evidence demonstrating an association between DE exposure and increased lung cancer risk among workers in varied occupations where diesel engines historically have been used. The human evidence from occupational studies is considered strongly supportive of a finding that DE
1-4

exposure is causally associated with lung cancer, though the evidence is less than that needed to definitively conclude that DE is carcinogenic to humans. There is some uncertainty about the degree to which confounders are having an influence on the observed cancer risk in the occupational studies, and there is uncertainty evolving from the lack of actual DE exposure data for the workers. In addition to the human evidence, there is supporting evidence of DPM’s carcinogenicity and associated DPM organic compound extracts in rats and mice by noninhalation routes of exposure. Other supporting evidence includes the demonstrated mutagenic and chromosomal effects of DE and its organic constituents, and the suggestive evidence for bioavailability of the DPM organics in humans and animals. Although high-exposure chronic rat inhalation studies show a significant lung cancer response, this is not thought predictive of a human hazard at lower environmental exposures. The rat response is considered to result from an overload of particles in the lung resulting from the high exposure, and such an overload is not expected to occur in humans at environmental exposures.
Although the available human evidence shows a lung cancer hazard to be present at occupational exposures that are generally higher than environmental levels, it is reasonable to presume that the hazard extends to environmental exposure levels. While there is an incomplete understanding of the mode of action for DE-induced lung cancer that may occur in humans, there is the potential for a nonthreshold mutagenic mode of action stemming from the organics in the DE mixture. A case for an environmental hazard also is shown by the simple observation that the estimated higher environmental exposure levels are close to, if not overlapping, the lower range of occupational exposures for which lung cancer increases are reported. These considerations taken together support the prudent public health choice of presuming a cancer hazard for DE at environmental levels of exposure. Overall, the evidence for a potential cancer hazard to humans resulting from chronic inhalation exposure to DE is persuasive, even though assumptions and uncertainties are involved. While the hazard evidence is persuasive, this does not lead to similar confidence in understanding the exposure/dose-response relationship.
Given a carcinogenicity hazard, EPA typically performs a dose-response assessment of the human or animal data to develop a cancer unit risk estimate that can be used with exposure information to characterize the potential cancer disease impact on an exposed population. The DE human exposure-response data are considered too uncertain to derive a confident quantitative estimate of cancer unit risk, and with the chronic rat inhalation studies not being predictive for environmental levels of exposure, EPA has not developed a quantitative estimate of cancer unit risk.
In the absence of a cancer unit risk, simple exploratory analyses were used to provide a perspective of the range of possible lung cancer risk from environmental exposure to DE. The analyses make use of reported lung cancer risk increases in occupational epidemiologic studies,
1-5
and the differences between occupational and environmental exposure. The purpose of having a risk perspective is to illustrate and have a sense of the possible significance of the lung cancer hazard from environmental exposure. The risk perspective cannot be viewed as a definitive quantitative characterization of cancer risk nor is it suitable for estimation of exposure-specific population risks.
1.7. SOURCES OF UNCERTAINTY Even though the overall evidence for potential human health effects of DE is persuasive,
many uncertainties exist because of the use of assumptions to bridge data and knowledge gaps about human exposures to DE and the general lack of understanding about underlying mechanisms by which DE causes observed toxicities in humans and animals. A notable uncertainty of this assessment is whether the health hazards identified from studies using emissions from older engines can be applied to present-day environmental emissions and related exposures, as some physical and chemical characteristics of the emissions from certain sources have changed over time. Available data are not sufficient to provide definitive answers to this question because changes in DE composition over time cannot be confidently quantified, and the relationship between the DE components and the mode(s) of action for DE toxicity is/are unclear. While recognizing the uncertainty, for this assessment a judgment is made that prior-year toxicologic and epidemiologic findings can be applied to more current exposures, both of which use DPM mass in air as the measure of DE exposure.
Other uncertainties include the assumptions that health effects observed at high doses may be applicable to low doses, and that toxicologic findings in laboratory animals generally are predictive of human responses. In the absence of a more complete understanding of how DE may cause adverse health effects in humans and laboratory animals, related assumptions (i.e., the presence of a biological threshold for chronic respiratory effects based on cumulative dosage and absence of a threshold for lung cancer stemming from subtle and irreversible effects) are considered reasonable and prudent.
Although parts of this assessment, particularly the noncancer RfC estimate, have been derived with a generic consideration of sensitive subgroups within the population, the actual spectrum of the population that may have a greater susceptibility to DE is unknown and cannot be better characterized until more information is available regarding the adverse effects of DPM in humans. Increased susceptibility, for example, could result from above-average increases in DE deposition and retention in the respiratory system or intrinsic differences in respiratory system tissue sensitivity. There is no DE-specific information that provides direct insight to the question of differential human susceptibility. Given the nature of DE’s noncancer effects on the respiratory system it would be reasonable, for example, to consider possible vulnerable
1-6
subgroups to include infants/children, the elderly, or individuals with preexisting health conditions, particularly respiratory conditions.
In developing a perspective on the possible significance of the environmental cancer hazard of DE, this assessment uses information about the differences in the magnitude of DE exposures between the occupational and environmental settings. Although an appreciation for differences in exposure is needed only at an order-of-magnitude level for this assessment, one should recognize that individual exposure is a function of both the variable concentrations in the environment and the related breathing and particle retention patterns of the individual. Because of variations in these factors across the population, different subgroups could receive lower or higher exposure to DE than those groups mentioned in this assessment.
Lastly, this assessment considers only potential heath effects from exposures to DE alone. Effects of DE exposure could be additive to or synergistic with concurrent exposures to many other air pollutants. However, in the absence of more definitive data demonstrating interactive effects (e.g., potentiation of allergenicity effects, potentiation of DPM toxicity by ambient ozone and oxides of nitrogen) from combined exposures to DE and other pollutants, it is not possible to address this issue. Further research is needed to improve the knowledge and data on DE exposures and potential human health effects, and thereby reduce uncertainties of future assessments of the DE health effects data.
1-7

2. DIESEL EXHAUST EMISSIONS CHARACTERIZATION, ATMOSPHERIC TRANSFORMATION, AND EXPOSURES
2.1. INTRODUCTION This chapter provides background information relating to the diesel engine, the pollutants
it emits, the history of its use in highway vehicles and railroad locomotives, diesel exhaust composition and emissions trends, and air pollution regulatory standards for diesel engines in the United States. The chapter also provides specific information about the physical and chemical composition of diesel exhaust, descriptions of its atmospheric transformations, observations of measured and modeled ambient concentrations (considered alone and as a component of atmospheric particles in general), some estimates of population exposures as well as a comparison of DPM with ambient fine particulate matter (PM2.5). In addition, this chapter gives background information that is used in conjunction with toxicology and epidemiology data to formulate conclusions about human health hazards that are discussed in later chapters of this document. The exposure information does not represent a formal or rigorous exposure assessment; it is intended only to provide a context for the health effects data and health hazard findings.
For the purposes of this document, carbonaceous matter, diesel exhaust, diesel particulate matter, elemental carbon, organic carbon, soluble organic fraction, and soot are defined below.
Carbonaceous matter: Carbon-containing compounds that are associated with particulate matter in diesel exhaust. In this document, the term carbonaceous matter includes all organic and elemental carbon-containing compounds that are found in the particle phase. In other documents, this term is sometimes used interchangeably to refer to the insoluble fraction of diesel particulate matter or the soot fraction.
Diesel engine exhaust (DE): Gaseous and particle-phase emissions resulting from the combustion of diesel fuel in an internal-combustion, compression-ignition engine. DE includes emissions from a diesel engine or diesel vehicle (inclusive of aftertreatment devices), but does not include emissions from brake and tire wear.
Diesel particulate matter (DPM): The particle-phase compounds emitted in DE. DPM can refer to both primary emissions and secondary particles that are formed by atmospheric processes. In this document, DPM refers to primary particles. Primary diesel particles are considered fresh after being emitted and aged after
2-1
undergoing oxidation, nitration, or other chemical and physical changes in the atmosphere. As used in this document, DPM refers to both fresh and aged DPM unless a distinction is made.
Elemental carbon (EC): Carbon that has undergone pyrolysis (i.e., has been stripped of hydrogen). In pure form, EC contains only carbon atoms, although EC as it exists in combustion particulate matter is likely to contain some hydrogen atoms.
Organic carbon (OC): Carbon- and hydrogen-containing molecules emitted in DE largely as the result of unburned diesel fuel and, to a lesser extent, from engine lubrication oil. OC compounds also can contain oxygen, nitrogen, and sulfur, as well as other elements in small quantities.
Soluble organic fraction (SOF): The organic portion of DPM that can be extracted from the particle matrix into solution. Extraction solutions and procedures vary and are described in Section 2.2.8.1.
Soot: Agglomerations of EC and OC particles. Soot also is often characterized as the insoluble portion of DPM, and is therefore considered to be mainly EC by some investigators.
This chapter begins with a history of dieselization for on-road vehicles and locomotives, followed by an introductory discussion of the formation of primary diesel emissions to assist the reader in understanding the complex factors that influence the formation of particulate matter (PM) and other DE emissions. The next section is a summary of EPA emission standards for on-road and locomotive diesel engines and a description of the national trends in emissions from on-road and nonroad diesel engine sources based on inventory modeling. The chapter continues with a discussion of diesel fuel use and the impact of fuel properties on emissions. The chronological assessment of emissions factors is presented in summaries of chassis and engine dynamometer testing and tunnel tests. This is followed by a description of engine technologies and their effect on emissions, and a description of the chemical and physical nature of emissions. The data describing the important atmospheric transformations of DE are summarized. The chapter concludes with a summary of the available literature regarding atmospheric concentrations of DPM and exposures to DE. EPA has assessed national and urban-area annual average exposure to DPM using the Hazardous Air Pollutant Exposure Model, and this assessment is presented in Section 2.4.3. A full exposure assessment would include the
2-2

distribution of ambient DE exposures in different geographic regions and among different demographic groups, the most highly exposed (90th percentile), exposures in microenvironments for short and long durations, the maximum exposure range (98th percentile), and the number of maximum-exposed individuals. However, such an assessment is not currently available. EPA is developing tools to provide a more complete exposure assessment.
2.2. PRIMARY DIESEL EXHAUST EMISSIONS 2.2.1. History of Dieselization
The diesel engine was patented in1892 by Rudolf Diesel, who conceived it as a prime mover that would provide much improved fuel efficiency compared with spark-ignition (SI) engines. To the present day, the diesel engine's excellent fuel economy remains one of its strongest selling points. In the United States, the diesel engine is used mainly in trucks, buses, agricultural and other nonroad equipment, locomotives, and ships.
The chief advantages of the diesel engine over the gasoline engine are its fuel economy and durability. Diesel engines, however, emit more PM per mile driven compared with gasoline engines of a similar weight. Over the past decade, modifications of engine components have substantially reduced particle emissions from both diesel and gasoline engines (Hammerle et al., 1994; Sawyer and Johnson, 1995).
The diesel engine compresses air to high pressure and temperature. Fuel, when injected into this compressed air, autoignites, releasing its chemical energy. The expanding combustion gases do work on the piston before being exhausted to the atmosphere. Power output is controlled by the amount of injected fuel rather than by throttling the air intake. Compared to its SI counterpart, the diesel engine's superior efficiency derives from a higher compression ratio and no part-load throttling. To ensure structural integrity for prolonged reliable operation at the higher peak pressures brought about by a higher compression ratio and autoignition, the structure of a diesel engine generally is more massive than its SI counterpart.
Diesel engines (also called compression-ignition) may be broadly identified as being either two- or four-stroke cycle, injected directly or indirectly, and naturally aspirated or supercharged. They also are classified according to service requirements such as light-duty (LD) or heavy-duty (HD) automotive/truck, small or large industrial, and rail or marine.
All diesel engines use hydraulic fuel injection in one form or another. The fuel system must meet four objectives if a diesel engine is to function properly over its entire operating range. It must: (1) meter the correct quantity of fuel, (2) distribute the fuel to the correct cylinder, (3) inject the fuel at the correct time, and (4) inject the fuel so that it is atomized and mixes well with the in-cylinder air. The first two objectives are functions of a well-designed injection pump, and the last two are mostly functions of the injection nozzle. Fuel injection
2-3
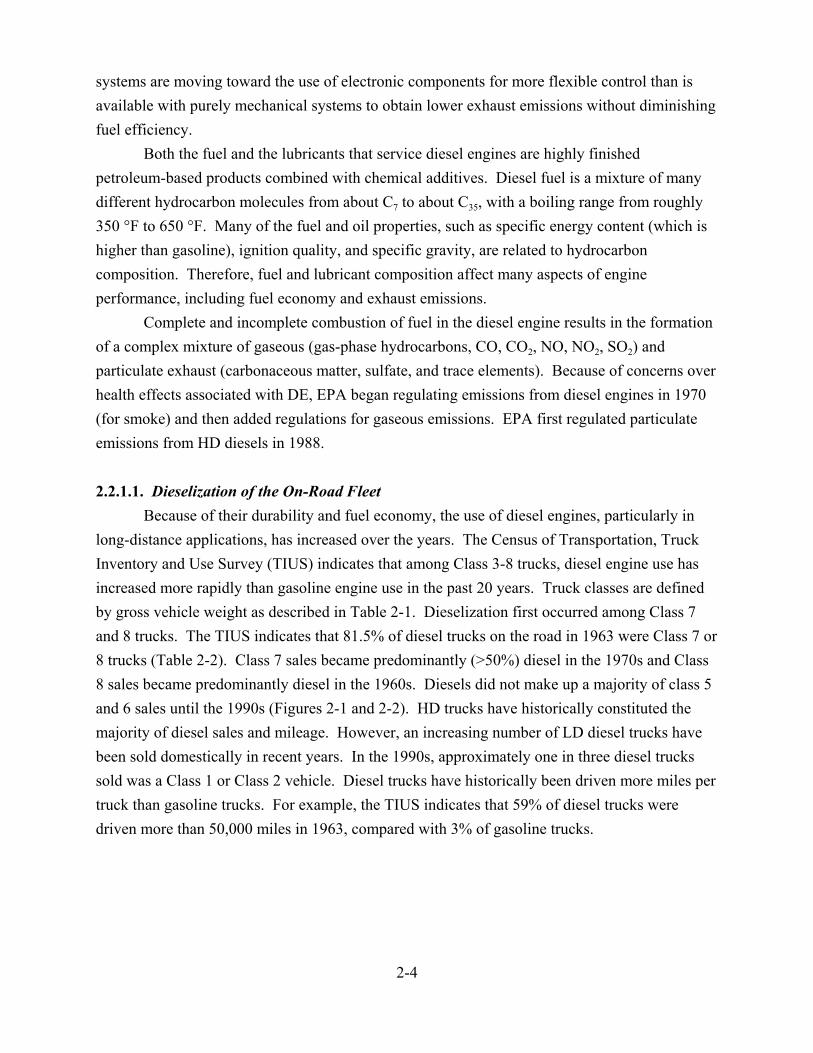
systems are moving toward the use of electronic components for more flexible control than is available with purely mechanical systems to obtain lower exhaust emissions without diminishing fuel efficiency.
Both the fuel and the lubricants that service diesel engines are highly finished petroleum-based products combined with chemical additives. Diesel fuel is a mixture of many different hydrocarbon molecules from about C7 to about C35, with a boiling range from roughly 350 °F to 650 °F. Many of the fuel and oil properties, such as specific energy content (which is higher than gasoline), ignition quality, and specific gravity, are related to hydrocarbon composition. Therefore, fuel and lubricant composition affect many aspects of engine performance, including fuel economy and exhaust emissions.
Complete and incomplete combustion of fuel in the diesel engine results in the formation of a complex mixture of gaseous (gas-phase hydrocarbons, CO, CO2, NO, NO2, SO2) and particulate exhaust (carbonaceous matter, sulfate, and trace elements). Because of concerns over health effects associated with DE, EPA began regulating emissions from diesel engines in 1970 (for smoke) and then added regulations for gaseous emissions. EPA first regulated particulate emissions from HD diesels in 1988.
2.2.1.1. Dieselization of the On-Road Fleet Because of their durability and fuel economy, the use of diesel engines, particularly in
long-distance applications, has increased over the years. The Census of Transportation, Truck Inventory and Use Survey (TIUS) indicates that among Class 3-8 trucks, diesel engine use has increased more rapidly than gasoline engine use in the past 20 years. Truck classes are defined by gross vehicle weight as described in Table 2-1. Dieselization first occurred among Class 7 and 8 trucks. The TIUS indicates that 81.5% of diesel trucks on the road in 1963 were Class 7 or 8 trucks (Table 2-2). Class 7 sales became predominantly (>50%) diesel in the 1970s and Class 8 sales became predominantly diesel in the 1960s. Diesels did not make up a majority of class 5 and 6 sales until the 1990s (Figures 2-1 and 2-2). HD trucks have historically constituted the majority of diesel sales and mileage. However, an increasing number of LD diesel trucks have been sold domestically in recent years. In the 1990s, approximately one in three diesel trucks sold was a Class 1 or Class 2 vehicle. Diesel trucks have historically been driven more miles per truck than gasoline trucks. For example, the TIUS indicates that 59% of diesel trucks were driven more than 50,000 miles in 1963, compared with 3% of gasoline trucks.
2-4

1
2
3
4
5
6
7
Table 2-1. Vehicle classification and weights for on-road trucks
Class Gross vehicle weight (lb)
<6,000
6,001–10,000
10,001–14,000
14,001–16,000
16,001–19,500
19,501–26,000
26,001–33,000
8Aa 33,001–60,000
8Ba >60,000
Medium duty (MD) 10,001–19,500 (same as Classes 3–5)
Light-heavy duty (LHD) 19,501–26,000 (same as Class 6)
Heavy-heavy duty (HHD) >26,001 (same as Class 7–8) aClass 8A and Class 8B are often considered together.
Table 2-2. Total (gas and diesel) diesel trucks in the fleet in 1992 Truck class 1992 gas and
diesel trucks 1992 diesel
trucks % Diesels
Class 1 and 2 (Light duty)
55,193,300 1,387,600 3
Class 3, 4, and 5 (Medium duty)
1,258,500 326,300 26
Class 6 (Light heavy-duty)
732,300 273,800 37
Class 7 and 8 (Heavy heavy-duty)
2,016,600 1,725,300 86
Source: Census of Transportation, 1995.
2-5
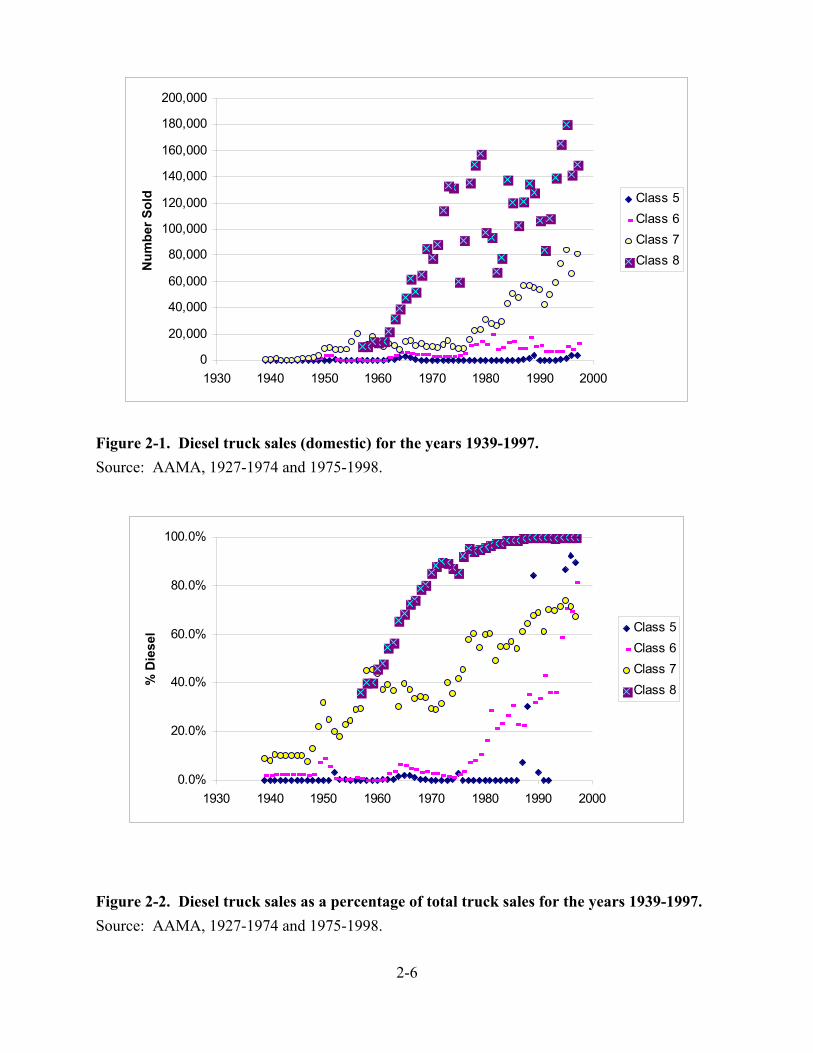
0
20,000
40,000
60,000
80,000
100,000
120,000
140,000
160,000
180,000
200,000
1930 1940 1950 1960 1970 1980 1990 2000
Num
ber S
old Class 5
Class 6 Class 7 Class 8
Figure 2-1. Diesel truck sales (domestic) for the years 1939-1997. Source: AAMA, 1927-1974 and 1975-1998.
0.0%
20.0%
40.0%
60.0%
80.0%
100.0%
1930 1940 1950 1960 1970 1980 1990 2000
% D
iese
l Class 5 Class 6 Class 7 Class 8
Figure 2-2. Diesel truck sales as a percentage of total truck sales for the years 1939-1997. Source: AAMA, 1927-1974 and 1975-1998.
2-6

Among combination trucks, consisting of tractor-trailers and single-unit trucks with trailers, diesel vehicles have driven a majority of the miles since at least 1963, the first year in which TIUS was conducted (Figure 2-3).
Figure 2-3. Percentage of truck miles attributable to diesel trucks. VMT= vehicle miles traveled. Source: U.S. Bureau of the Census, 1999b.
The longevity of diesel trucks is an important factor to understand past, current, and projected exposures to DE because older vehicles are subject to less stringent regulations and may remain in use for several decades after their manufacture. American Automobile Manufacturers Association publications (AAMA, 1927-1997) indicate that 53% of trucks from model years 1947-1956 were still on the road after 14 years. The proportion of trucks in use after 14 years was 63% for model years 1974-1983, suggesting that the lifespan of trucks built in later years is longer. According to the 1997 TIUS, vehicles older than 10 years made up 40% of Class 7 and 8 trucks and 16% of Class 7-8 vehicle miles traveled (VMT) (Figures 2-4 and 2-5). Almost all Class 7 and 8 trucks were diesel vehicles in the period 1982-1997 (93% in 1982 and 99% in 1997).
2.2.1.2. Dieselization of Railroad Locomotive Engines Early in the 20th century the political and economic pressure on the railroads to replace
steam locomotives was substantial. Railroads were losing business to other forms of transport. The diesel-electric locomotive provided 90% in-service time, compared with only 50% for steam locomotives, and had three times the thermal efficiency (Klein, 1991; Kirkland, 1983).
2-7

Figure 2-4. Model year distribution of in-use HD truck fleet in 1997. Source: U.S. Bureau of the Census, 1999b.
Figure 2-5. Model year distribution of vehicle miles traveled by the in-use HD truck fleet in 1997. Source: U.S. Bureau of Census, 1999b.
2-8

Additionally, several cities had passed laws barring steam locomotives within the city limits because the large quantities of smoke obscured visibility, creating a safety hazard. The first prototype diesel locomotive was completed in 1917. By 1924 General Electric (GE) was producing a standard line of switching locomotives on a production basis. Electro-Motive Corporation was founded the same year to produce diesel locomotives in competition with GE. This company was purchased in 1929 by General Motors (GM) and became the Electro-Motive Division. After this acquisition, GM began to develop the two-stroke engine for this application. Up to this time, all locomotive diesel engines were four-stroke. Two-strokes offered a much higher power-to-weight ratio, and GM’s strategy was to get a large increase in power by moving to the two-stroke cycle. The first true high-speed, two-stroke, diesel-electric locomotives were produced by GM in 1935. However, because of the economic climate of the Great Depression, few of these were sold until after the Second World War. At the end of the war, most locomotives were still steam-driven but were more than 15 years old, and the railroads were ready to replace the entire locomotive fleet. Few, if any, steam locomotives were sold after 1945 because the entire fleet was converted to diesel (Coifman, 1994).
The locomotive fleet has included significant percentages of both two- and four-stroke engines. The four-stroke diesel engines were naturally aspirated in the 1940s and 1950s. It is unlikely that any of the two-stroke engines used in locomotive applications were strictly naturally aspirated. Nearly all two-stroke diesel locomotive engines are uniflow scavenged, with a positive-displacement blower for scavenging assistance. In 1975, it was estimated that 75% of the locomotives in service were two-stroke, of which about one-half used one or more turbochargers in addition to the existing positive-displacement blower for additional intake boost pressure.
Almost all of the four-stroke locomotive engines were naturally aspirated in 1975. Electronic fuel injection for locomotive engines was first offered in the 1994 model year (U.S. EPA, 1998b). All locomotive engines manufactured in recent years are turbocharged, aftercooled or intercooled four-stroke engines. In part, this is because of the somewhat greater durability of four-strokes, although impending emissions regulations may have also been a factor in this shift. The typical lifespan of a locomotive has been estimated to be more than 40 years (U.S. EPA, 1998b). Many of the smaller railroads are still using engines built in the 1940s, although the engines may have been rebuilt several times since their original manufacture.
2.2.2. Diesel Combustion and Formation of Primary Emissions A basic understanding of diesel combustion processes can assist in understanding the
complex factors that influence the formation of DPM and other DE emissions. Unlike SI combustion, diesel combustion is a fairly nonhomogenous process. Fuel is sprayed at high
2-9

Figure 2-6. HD diesel truck engines. these applications by the early 1980s.
A comparison of IDI (A) and DI (B) combustion systems of high-speed DI engines almost completely replaced IDI engines for
pressure into the compressed cylinder contents (primarily air with some residual combustion products) as the piston nears the top of the compression stroke. The turbulent mixing of fuel and air that takes place is enhanced by injection pressure, the orientation of the intake ports (inducement of intake-swirl tangential to the cylinder wall), piston motion, and piston bowl shape. In some cases, fuel and air mixing is induced via injection of the fuel into a turbulence-generating pre-chamber or swirl chamber located adjacent to the main chamber (primarily in older, higher speed engines and some LD diesels). Examples of typical direct injection and indirect injection combustion systems are compared in Figure 2-6. Diesel combustion can be considered to consist of the following phases (Heywood, 1988; Watson and Janota, 1982):
Figure 2-6. A comparison of IDI (A) and DI (B) combustion systems of high-speed HD diesel truck engines. DI engines almost completely replaced IDI engines for these applications by the early 1980s. (IDI = indirect injection, DI=direct injection)
2-10
• An ignition delay period, which starts after the initial injection of fuel and continues until the initiation of combustion. The delay period is governed by the rate of fuel and air mixing, diffusion, turbulence, heat transfer, chemical kinetics, fuel vaporization, and fuel composition. Fuel cetane rating is an indication of ignition delay.
• Rapid, premixed burning of the fuel and air mixture from the ignition delay period. • Diffusion-controlled burning, where the fuel burns as it is injected and diffuses into
the cylinder. • A very small amount of rate-controlled burning during the expansion stroke, after
the end of injection.
Engine speed and load are controlled by the quantity of fuel injected. Thus, the overall fuel-to-air ratio varies greatly as engine speed and load vary. On a macro scale, the cylinder contents are always fuel-lean. Depending on the time available for combustion and the proximity of oxygen, the fuel droplets are either completely or partially oxidized. At temperatures above 1,300 K, much of the unburned fuel that is not oxidized is pyrolized (stripped of hydrogen) to form EC (Dec and Espey, 1995). In addition to EC, other carbonaceous matter is present, largely from unburned fuel. The agglomeration of elemental and OC forms particles that are frequently referred to as “soot” particles. In this document, the terms “EC” and “OC” are used to refer to the carbon-containing components of DPM, and collectively, they are referred to as the carbonaceous fraction of a diesel particle.
Carbonaceous particle formation occurs primarily during the diffusion-burn phase of combustion, and is highest during high load and other conditions consistent with high fuel-air ratios. Most of the carbonaceous matter formed (80% to 98%) is oxidized during combustion, most likely by hydroxyl radicals (Kittelson et al., 1986; Foster and Tree, 1994).
DPM is defined by the measurement procedures summarized in the Code of Federal Regulations, Title 40 CFR, Part 86, Subpart N (CFR 40:86.N). These procedures define DPM emissions as the mass of material collected on a filter at a temperature of 52 °C or less after dilution of the exhaust with air. DPM is formed by a number of physical processes acting in concert as the exhaust is cooled and diluted. These are nucleation, coagulation, condensation, and adsorption. The core DE particles are formed by nucleation and coagulation from primary spherical particles consisting of solid carbonaceous (EC) material and ash (trace metals and other elements). To these, through coagulation, adsorption, and condensation, are added organic and sulfur compounds (sulfate) combined with other condensed material (Figure 2-7). Because of
2-11

Solid Carbonaceous/Ash Particle with adsorbed hydrocarbon/sulfate layer
Sulfuric Acid Particles
Hydrocarbon/Sulfate Particles
0.2 µm Figure 2-7. Schematic diagram of diesel engine exhaust particles.
Source: Modified from Kittelson, 1998.
their size, <0.5 mm, these particles have a very large surface area per gram of mass, which makes them able to adsorb large quantities of ash, organic compounds, and sulfate. The specific surface area of the EC core has been measured to be approximately 30–50 m2/g (Frey and Corn, 1967). Pierson and Brachaczek (1976) report that after the extraction of adsorbed organic material, the surface area of the diesel particle core is approximately 90 m2/g.
The organic material associated with diesel particles originates from unburned fuel, engine lubrication oil, and small quantities of partial combustion and pyrolysis products. This is frequently quantified as the SOF, which is discussed in much more detail in Section 2.2.7. The formation of sulfate in DE depends primarily on fuel sulfur content. During combustion, sulfur compounds present in the fuel are oxidized to sulfur dioxide (SO2). Approximately 1% to 4% of fuel sulfur is oxidized to form sulfuric acid (H2SO4) (Wall et al., 1987; Khatri et al., 1978; Baranescu, 1988; Barry et al., 1985). Upon cooling, sulfuric acid and water condense into an aerosol that is nonvolatile under ambient conditions. The mass of sulfuric acid DPM is more than doubled by the mass of water associated with the sulfuric acid under typical DPM measurement conditions (50% relative humidity, 20–25 °C) (Wall et al., 1987).
2-12
Emissions from combustion engines produce oxide of nitrogen (NOx) primarily (at least initially) as of NO. High combustion temperatures cause reactions between oxygen and nitrogen to form NO and some NO2. Most NO2 formed during combustion is rapidly decomposed. NO can also decompose to N2 and O2, but the rate of decomposition is very slow (Heywood, 1988; Watson and Janota, 1982). Thus, almost all of the NOx emitted is NO.
Some organic compounds from unburned fuel and from lubricating oil consumed by the engine can be trapped in crevices or cool spots within the cylinder and thus are not sufficiently available to conditions that would lead to their oxidation or pyrolysis. These compounds are emitted from the engine and either contribute to gas-phase organic emissions or to DPM emissions, depending on their volatility. Within the exhaust system, temperatures are sufficiently high that these compounds are entirely present within the gas phase (Johnson and Kittelson, 1996). Upon cooling and mixing with ambient air in the exhaust plume, some of the less volatile organic compounds can adsorb to the surfaces of the EC agglomerate particles. Lacking sufficient EC adsorption sites, the organic compounds may condense on sulfuric acid nuclei to form a heterogeneously nucleated organic aerosol (Abdul-Khalek et al., 1999).
Although not unique to DE, the high content of EC associated with typical DPM emissions has long been used by some investigators to distinguish diesel engine sources of this particle from other combustion aerosols. Diesel particles from newer HD engines are typically composed of ~75% EC (EC can range from 33% to 90%), ~20% OC (OC can range from 7% to 49%), and small amounts of sulfate, nitrate, trace elements, water, and unidentified components (Figure 2-8). Metallic compounds from engine component wear, and from compounds in the fuel and lubricant, contribute to DPM mass. Ash from oil combustion also contributes trace amounts.
Ambient PM2.5 measured in the eastern United States is dominated by sulfate (34%), whereas ambient PM2.5 in the western United States is dominated by OC (39%) (Table 2-3) (U.S. EPA, 1999a). Many sources contribute to ambient PM2.5, and these sources and their relative contribution to ambient PM2.5 can be identified on the basis of the chemical species present. The OC fraction of DPM is increasingly being used to assist investigators in identifying the contribution of diesel engine emissions to ambient PM2.5. In particular, hopane and sterane compounds (aromatic compounds, >C30) have been used in addition to other polycyclic aromatic hydrocarbons (PAHs) and long-chain alkanes to distinguish DPM from other mobile source PM and from ambient PM (Schauer et al., 1996; Fujita et al., 1998). Although PAH compounds make up 1% or less of DPM mass, diesel emissions have been observed to have elevated concentrations of methylated naphthalenes and methylated phenanthrene isomers compared to other combustion aerosols (Benner et al., 1989; Lowenthal et al., 1994; Rogge et al., 1993). Enrichment of benzo[a]anthracene and benzo[a]pyrene (B[a]P) in DPM has also been
2-13

Figure 2-8. Typical chemical composition for diesel particulate matter (PM2.5) from new (post-1990) HD diesel vehicle exhaust.
Table 2-3. Typical chemical composition of fine particulate matter
Eastern U.S. Western U.S. Diesel PM2.5
Elemental carbon 4% 15% 75%
OC 21% 39% 19%
Sulfate, nitrate, ammonium
48% 35% 1%
Minerals 4% 15% 2%
Unknown 23% – 3% Source: U.S. EPA, 1999a.
2-14

observed under some conditions and has been used to assess the relative contribution of DE to ambient PM.
Although specific OC species are being used to help distinguish DPM aerosols from other combustion aerosols, up to 90% of the organic fraction associated with DPM is currently classified as unresolvable complex material. Ultrafine DPM (5–50 nm) accounts for the majority (50% to 90%) of the number of particles but only 1% to 20% of the mass of DPM. A study conducted by Gertler (1999) in the Tuscarora Mountain tunnel demonstrated an increase in 20 nm diameter particles as the fraction of diesel vehicles in the tunnel increased from 13% to 78%. The contribution of nuclei-mode particles from a freeway on an ambient aerosol size distribution was reported by Whitby and Sverdrup (1980).
In summary, four main characteristics of DPM are (1) the high proportion of EC, (2) the large surface area associated with the carbonaceous particles in the 0.2 :m size range, (3) enrichment of certain polycyclic organic compounds, and (4) 50%–90% of the number of DPM particles in diesel engine exhaust are in the nuclei-mode size range, with a mode of 20 nm.
2.2.3. Diesel Emission Standards and Emission Trends Inventory EPA set a smoke standard for on-road HD diesel engines beginning with the 1970 model
year and added a carbon monoxide (CO) standard and a combined hydrocarbon (HC) and NOx
standard for the 1974 model year (Table 2-4). Beginning in the 1979 model year, EPA added a HC standard while retaining the combined HC and NOx standard. All of the testing for HC, CO, and NOx was completed using a steady-state test procedure. Beginning in the 1985 model year,EPA added a NOx standard (10.7 g/bhp-hr), dropped the combined HC and NOx standard, and converted from steady-state to transient testing for HC, CO, and NOx emissions. EPA introduced a particulate standard for 1988 model year diesel engines using the transient test (0.6 g/bhp-hr). Transient testing involves running an engine on a dynamometer over a range of load and speed set points.
Since the 1985 model year, only the NOx and particulate standards have been tightened for on-road diesel engines. For truck and bus engines, the particulate standard was reduced to 0.25 g/bhp-hr in 1991, and it was reduced again in 1994 for truck engines to 0.1 g/bhp-hr. For urban bus engines, the particulate standard was reduced in 1994 to 0.07 g/bhp-hr and again in 1996 to 0.05 g/bhp-hr. The NOx standard was reduced to 4.0 g/bhp-hr in 1998 for all on-road diesel engines (bus and truck engines). The standards for nonmethane hydrocarbon (NMHC) and NOx combined were further lowered in a 1997 rulemaking, to take effect in 2004. EPA has recently finalized a regulation that will further reduce NOx, NMHC, and PM emissions from diesel engines starting in 2007.
2-15

Table 2-4. U.S. emission standards: HD highway diesel engines Model year
Pollutant (g/bhp-hr) Smokea
HC CO NOx HC + NOx Particulate (PM) t=truck, b=bus, ub=urban bus
1970 — —- —- —- — A:40%; L:20%
1974 — 40 —- 16b — A:20%; L:15%; P:50%
1979 1.5 25 —- 10b — A:20%; L:15%; P:50%
1985c 1.3 15.5 10.7 — — A:20%; L:15%; P:50%
1988 1.3 15.5 10.7 — 0.60 A:20%; L:15%; P:50%
1990 1.3 15.5 6.0 — 0.60 A:20%; L:15%; P:50%
1991 1.3 15.5 5.0 — 0.25 A:20%; L:15%; P:50%
1993 1.3 15.5 5.0 — 0.25 t, 0.10 b A:20%; L:15%; P:50%
1994 1.3 15.5 5.0 — 0.10 t, 0.07 ub A:20%; L:15%; P:50%
1996 1.3 15.5 5.0 — 0.10 t, 0.05 ub A:20%; L:15%; P:50%
1998 1.3 15.5 4.0 — 0.10 t, 0.05 ub A:20%; L:15%; P:50%
2004 1.3 15.5 — 2.4 NMHCd 0.10 t, 0.05 ub A:20%; L:15%; P:50%
2007 15.5 0.2 0.14 NMHC 0.01 A:20%; L:15%; P:50%
aEmissions measured in percent opacity during different operating modes: A=acceleration; L=lug; P=peaksduring either mode.bTotal HC.cIn 1985, test cycle changed from steady-state to transient operation for HC, CO, and NOx measurement andin 1988 for PM.dOr 2.5 plus a limit of 0.5 nonmethane hydrocarbon (NMHC).
In December 1997, EPA adopted emission standards for NOx, HC, CO, PM, and smoke for newly manufactured and remanufactured railroad locomotives and locomotive engines. The rulemaking, which took effect in the year 2000, applies to locomotives originally manufactured in 1973 or after, and any time they are manufactured or remanufactured (locomotives originally manufactured before 1973 are not regulated). Three sets of emission standards have been adopted (Tier 0, 1, and 2); they apply to locomotives and locomotive engines originally manufactured from 1973 through 2001 (Tier 0), from 2002 through 2004 (Tier 1), and in 2005 and later (Tier 2) (Table 2-5; see EPA web page at http://www.epa.gov/omswww/ or http://www.dieselnet.com/standards/ for current information on mobile source emission standards). The emissions are measured over two steady-state test cycles that represent two
2-16
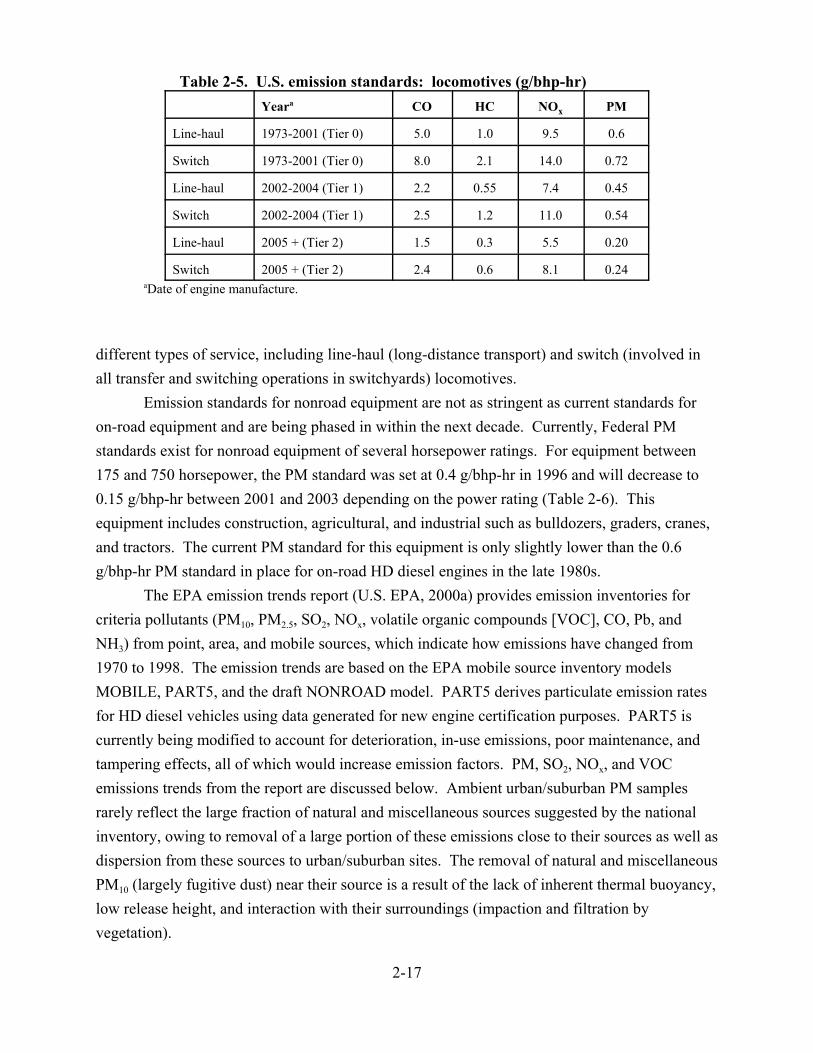
Table 2-5. U.S. emission standards: locomotives (g/bhp-hr) Yeara CO HC NOx PM
Line-haul 1973-2001 (Tier 0) 5.0 1.0 9.5 0.6
Switch 1973-2001 (Tier 0) 8.0 2.1 14.0 0.72
Line-haul 2002-2004 (Tier 1) 2.2 0.55 7.4 0.45
Switch 2002-2004 (Tier 1) 2.5 1.2 11.0 0.54
Line-haul 2005 + (Tier 2) 1.5 0.3 5.5 0.20
Switch 2005 + (Tier 2) 2.4 0.6 8.1 0.24 aDate of engine manufacture.
different types of service, including line-haul (long-distance transport) and switch (involved in all transfer and switching operations in switchyards) locomotives.
Emission standards for nonroad equipment are not as stringent as current standards for on-road equipment and are being phased in within the next decade. Currently, Federal PM standards exist for nonroad equipment of several horsepower ratings. For equipment between 175 and 750 horsepower, the PM standard was set at 0.4 g/bhp-hr in 1996 and will decrease to 0.15 g/bhp-hr between 2001 and 2003 depending on the power rating (Table 2-6). This equipment includes construction, agricultural, and industrial such as bulldozers, graders, cranes, and tractors. The current PM standard for this equipment is only slightly lower than the 0.6 g/bhp-hr PM standard in place for on-road HD diesel engines in the late 1980s.
The EPA emission trends report (U.S. EPA, 2000a) provides emission inventories for criteria pollutants (PM10, PM2.5, SO2, NOx, volatile organic compounds [VOC], CO, Pb, and NH3) from point, area, and mobile sources, which indicate how emissions have changed from 1970 to 1998. The emission trends are based on the EPA mobile source inventory models MOBILE, PART5, and the draft NONROAD model. PART5 derives particulate emission rates for HD diesel vehicles using data generated for new engine certification purposes. PART5 is currently being modified to account for deterioration, in-use emissions, poor maintenance, and tampering effects, all of which would increase emission factors. PM, SO2, NOx, and VOC emissions trends from the report are discussed below. Ambient urban/suburban PM samples rarely reflect the large fraction of natural and miscellaneous sources suggested by the national inventory, owing to removal of a large portion of these emissions close to their sources as well as dispersion from these sources to urban/suburban sites. The removal of natural and miscellaneous PM10 (largely fugitive dust) near their source is a result of the lack of inherent thermal buoyancy, low release height, and interaction with their surroundings (impaction and filtration by vegetation).
2-17

Table 2-6. U.S. emission standards for nonroad diesel equipment (g/bhp-hr)
Power rating Model year
Pollutant (g/bhp-hr) Smoke %a
HC CO NOx NMHC + NOx
PM
11 < hp 2000 — 6.0 — 7.8 (ABT) 0.74 (ABT)
2005+ — 6.0 — 5.6 (ABT) 0.60 (ABT)
11# hp < 25 2000 — 4.9 — 7.0 (ABT) 0.60 (ABT)
2005+ — 4.9 — 5.6 (ABT) 0.60 (ABT)
25# hp < 50 2000 — 4.1 — 7.0 (ABT) 0.60 (ABT)
2005+ — 4.1 — 5.6 (ABT) 0.44 (ABT)
50# hp <100 1998+ — — 6.9 (ABT) — — 20/15/50
2004 — 3.7 5.6 (ABT) 0.30 (ABT)
2008+ — 3.7 3.5 (ABT) —
100# hp <175 1997+ — — 6.9 (ABT) — — 20/15/50
2003 — 3.7 — 4.9 (ABT) 0.22 (ABT)
2007+ — 3.7 — 3.0 (ABT) —
175# hp < 750 1996+ 1.0 8.5 6.9 (ABT) — 0.4 20/15/50
175# hp < 300 2003 — 2.6 — 4.9 (ABT) 0.15 (ABT)
2006+ — 2.6 — 3.0 (ABT) —
300# hp < 600 2001 — 2.6 — 4.8 (ABT) 0.15 (ABT)
2006+ — 2.6 — 3.0 (ABT) —
600# hp < 750 2002 — 2.6 — 4.8 (ABT) 0.15 (ABT)
2006+ — 2.6 — 3.0 (ABT) —
$750 hp 2000+ 1.0 8.5 6.9 (ABT) — 0.4 20/15/50
2006+ — 2.6 — 4.8 (ABT) 0.15 (ABT) aEmissions measured in percent opacity during different operating modes: acceleration/lug/peaks during either mode. ABT=average banking and trading. Note: The standards for engines less than 50 hp also apply to diesel marine engines.
2-18

�������������������������������
�������������������������������
������������������������������� �������������������������������
�������
For the summaries presented here, natural and miscellaneous sources are excluded from the national PM and NOx inventories.
From 1970 to 1998, PM10 emissions decreased from slightly over 12,200,000 tons to just over 2,800,000 tons (Figure 2-9). PM10 emissions from on-road and nonroad diesel engines increased from 320,000 tons to more than 521,000 tons during this same period, so that in 1970 diesel engine emissions were 3% of the PM10 inventory whereas in 1998, diesel engine emissions were 18% of the PM10 inventory. Diesel engines also contribute to secondary PM formation from NOx and SO2 emissions that are converted to nitrate and sulfate. VOCs from diesel engines also contribute to secondary organic particle formation. The contribution of secondary PM is not included in the national trends inventories cited here.
Mobile sources of PM include both gasoline- and diesel-powered on-road vehicles and a variety of nonroad equipment. Nonroad diesel engine sources include construction equipment, agricultural equipment, marine vessels, locomotives, and other sources. The EPA emission trends report (U.S. EPA, 2000a) indicates that, excluding natural and miscellaneous sources, mobile sources were responsible for 25% of PM10 emissions in 1998. Diesel engines (on-road and nonroad combined) were estimated to contribute 72% of mobile-source PM10 emissions.
������������������������������� ������������������������������� ������������������������������� ������������������������������� ������������������������������� ������������������������������� ������������������������������� ������������������������������� ������������������������������� ������������������������������� ������������������������������� ������������������������������� ������������������������������� ������������������������������� ������������������������������� ������������������������������� ������������������������������� ������������������������������� ������������������������������� ������������������������������� �������������������������������
������������������������������� ������������������������������� ������������������������������� ������������������������������� ������������������������������� ������������������������������� ������������������������������� ������������������������������� ������������������������������� �������������������������������
������������������������������� ������������������������������� ������������������������������� �������������������������������
������������������������������� ������������������������������� ������������������������������� �������������������������������
0
2000
4000
6000
8000
10000
12000
14000
1970 1980 1990 1998
Calendar Year
Thou
sand
s of s
hort
tons
Diesel PM10 ������� Other Sources of PM10
Figure 2-9. Trends in PM10 emissions from on-road and nonroad engines combined and other anthropogenic sources of PM10 from 1970 to 1998 (excludes miscellaneous and natural sources).
Source: U.S. EPA, 2000a, National Air Pollutant Emission Trends, 1900-1998.
2-19
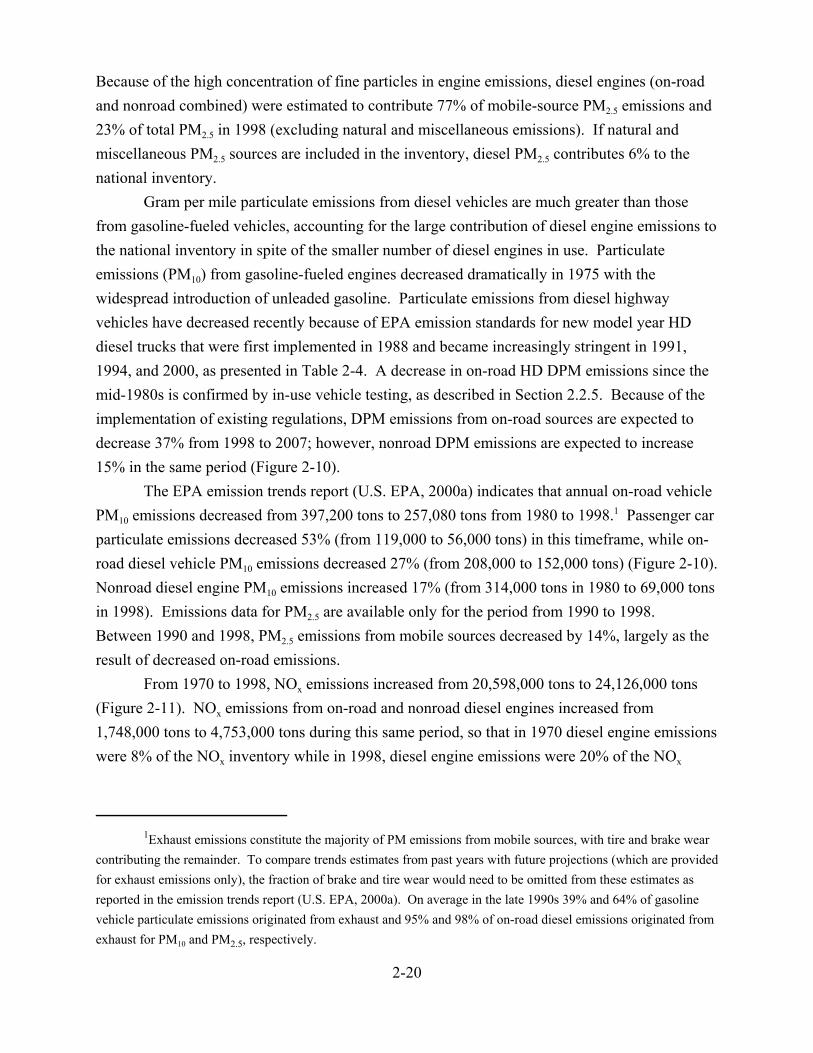
Because of the high concentration of fine particles in engine emissions, diesel engines (on-road and nonroad combined) were estimated to contribute 77% of mobile-source PM2.5 emissions and 23% of total PM2.5 in 1998 (excluding natural and miscellaneous emissions). If natural and miscellaneous PM2.5 sources are included in the inventory, diesel PM2.5 contributes 6% to the national inventory.
Gram per mile particulate emissions from diesel vehicles are much greater than those from gasoline-fueled vehicles, accounting for the large contribution of diesel engine emissions to the national inventory in spite of the smaller number of diesel engines in use. Particulate emissions (PM10) from gasoline-fueled engines decreased dramatically in 1975 with the widespread introduction of unleaded gasoline. Particulate emissions from diesel highway vehicles have decreased recently because of EPA emission standards for new model year HD diesel trucks that were first implemented in 1988 and became increasingly stringent in 1991, 1994, and 2000, as presented in Table 2-4. A decrease in on-road HD DPM emissions since the mid-1980s is confirmed by in-use vehicle testing, as described in Section 2.2.5. Because of the implementation of existing regulations, DPM emissions from on-road sources are expected to decrease 37% from 1998 to 2007; however, nonroad DPM emissions are expected to increase 15% in the same period (Figure 2-10).
The EPA emission trends report (U.S. EPA, 2000a) indicates that annual on-road vehicle PM10 emissions decreased from 397,200 tons to 257,080 tons from 1980 to 1998.1 Passenger car particulate emissions decreased 53% (from 119,000 to 56,000 tons) in this timeframe, while on-road diesel vehicle PM10 emissions decreased 27% (from 208,000 to 152,000 tons) (Figure 2-10). Nonroad diesel engine PM10 emissions increased 17% (from 314,000 tons in 1980 to 69,000 tons in 1998). Emissions data for PM2.5 are available only for the period from 1990 to 1998. Between 1990 and 1998, PM2.5 emissions from mobile sources decreased by 14%, largely as the result of decreased on-road emissions.
From 1970 to 1998, NOx emissions increased from 20,598,000 tons to 24,126,000 tons (Figure 2-11). NOx emissions from on-road and nonroad diesel engines increased from 1,748,000 tons to 4,753,000 tons during this same period, so that in 1970 diesel engine emissions were 8% of the NOx inventory while in 1998, diesel engine emissions were 20% of the NOx
1Exhaust emissions constitute the majority of PM emissions from mobile sources, with tire and brake wear contributing the remainder. To compare trends estimates from past years with future projections (which are provided for exhaust emissions only), the fraction of brake and tire wear would need to be omitted from these estimates as reported in the emission trends report (U.S. EPA, 2000a). On average in the late 1990s 39% and 64% of gasoline vehicle particulate emissions originated from exhaust and 95% and 98% of on-road diesel emissions originated from exhaust for PM10 and PM2.5, respectively.
2-20

�����������������
����������������
����������������
����������������
����������������
����������������
���������������
����������������
���������������������������������
����������������
����������������
����� ����������� On-Road ������ Nonroad
700
600
500
400
300
200
100
0 1970 1980 1990 1998 2007 2030
��������������������������������������������������������������������������������������������������������������������������������������������������������������������������
������������������������������������������������������������������������������������������������������������������������������������������������������������������������������������������������������������������������������������������������
��������������������������������������������������������������������������������������������������������������������������������������������������������������������������������������������������������������������������������������������������������������������������������
��������������������������������������������������������������������������������������������������������������������������������������������������������������������������������
����������������������������������������������������������������������������������������������������������������
��������������� ��������������� ��������������� ��������������� ��������������� ��������������� ��������������� ��������������� ��������������� ��������������� ��������������� ��������������� ��������������� ���������������
���������������� ���������������� ���������������� ���������������� ���������������� ���������������� ���������������� ���������������� ���������������� ���������������� ���������������� ���������������� ���������������� ���������������� ���������������� ���������������� ���������������� ���������������� ���������������� ���������������� ���������������� ���������������� ���������������� ����������������
���������������� ���������������� ���������������� ���������������� ���������������� ���������������� ���������������� ���������������� ���������������� ���������������� ���������������� ���������������� ���������������� ���������������� ���������������� ���������������� ���������������� ���������������� ���������������� ���������������� ���������������� ���������������� ���������������� ���������������� ���������������� ���������������� ���������������� ���������������� ����������������
����������������� ����������������� ����������������� ����������������� ����������������� ����������������� ����������������� ����������������� ����������������� ����������������� ����������������� ����������������� ����������������� ����������������� ����������������� ����������������� ����������������� ����������������� ����������������� ����������������� ����������������� ����������������� ����������������� ����������������� ����������������� ����������������� ����������������� �����������������
���������������� ���������������� ���������������� ���������������� ���������������� ���������������� ���������������� ���������������� ���������������� ���������������� ���������������� ���������������� ���������������� ���������������� ���������������� ���������������� ���������������� ���������������� ���������������� ���������������� ���������������� ���������������� ���������������� ���������������� ���������������� ���������������� ���������������� ���������������� ���������������� ���������������� ���������������� ����������������
���������������� ���������������� ���������������� ���������������� ���������������� ���������������� ���������������� ���������������� ���������������� ���������������� ���������������� ���������������� ���������������� ���������������� ���������������� ���������������� ���������������� ���������������� ���������������� ���������������� ���������������� ���������������� ���������������� ���������������� ���������������� ���������������� ���������������� ���������������� ���������������� ���������������� ���������������� ���������������� ���������������� ���������������� ���������������� ���������������� ���������������� ���������������� ���������������� ���������������� ���������������� ���������������� ���������������� ���������������� ���������������� ���������������� ����������������
Calendar Year
Figure 2-10. Trends in PM10 emissions from on-road and nonroad diesel engines from 1970 to 1998 and projections of emissions to 2007 and 2030*.
Source: U.S. EPA, 2000a, National Air Pollutant Emission Trends, 1900-1998.*Projection to 2030 includes implementation of the recently finalized regulation “Control of AirPollution from New Motor Vehicles: Heavy-Duty Engine and Vehicle Standards and HighwayDiesel Fuel Sulfur Control Requirements” U.S. EPA, 2000b.
inventory. As mentioned above, some of this NOx will be converted to particulate nitrate in the
atmosphere, and this contribution to ambient PM is not quantified in national inventories.In 1998, 53% of total emitted NOx came from mobile sources, with diesels responsible
for 57% of the mobile-source contribution. Overall, NOx emissions from mobile sources have remained relatively constant over time, increasing an estimated 7% from 1980 to 1998. Whereas
Thou
sand
s of
sho
rt to
ns
2-21
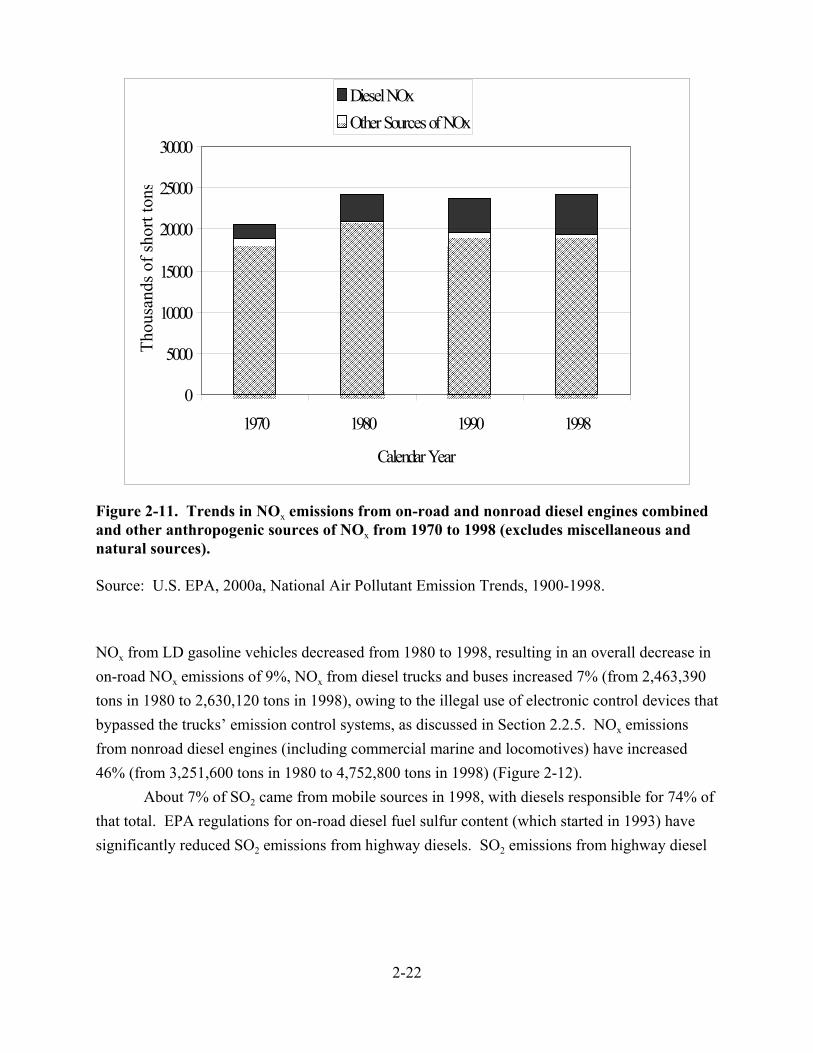
����������������������������������
�����������������������������������
���������������������������������� ����������������������������������
�������
���������������������������������� ���������������������������������� ���������������������������������� ���������������������������������� ���������������������������������� ���������������������������������� ���������������������������������� ���������������������������������� ���������������������������������� ���������������������������������� ���������������������������������� ���������������������������������� ���������������������������������� ���������������������������������� ���������������������������������� ���������������������������������� ���������������������������������� ���������������������������������� ���������������������������������� ����������������������������������
����������������������������������� ����������������������������������� ����������������������������������� ����������������������������������� ����������������������������������� ����������������������������������� ����������������������������������� ����������������������������������� ����������������������������������� ����������������������������������� ����������������������������������� ����������������������������������� ����������������������������������� ����������������������������������� ����������������������������������� ����������������������������������� ����������������������������������� ����������������������������������� ����������������������������������� ����������������������������������� ����������������������������������� ����������������������������������� �����������������������������������
���������������������������������� ���������������������������������� ���������������������������������� ���������������������������������� ���������������������������������� ���������������������������������� ���������������������������������� ���������������������������������� ���������������������������������� ���������������������������������� ���������������������������������� ���������������������������������� ���������������������������������� ���������������������������������� ���������������������������������� ���������������������������������� ���������������������������������� ���������������������������������� ���������������������������������� ���������������������������������� ����������������������������������
���������������������������������� ���������������������������������� ���������������������������������� ���������������������������������� ���������������������������������� ���������������������������������� ���������������������������������� ���������������������������������� ���������������������������������� ���������������������������������� ���������������������������������� ���������������������������������� ���������������������������������� ���������������������������������� ���������������������������������� ���������������������������������� ���������������������������������� ���������������������������������� ���������������������������������� ���������������������������������� ����������������������������������0
5000
10000
15000
20000
25000
30000
1970 1980 1990 1998
Calendar Year
Thou
sand
s of s
hort
tons
DieselNOx ������� Other Sources of NOx
Figure 2-11. Trends in NOx emissions from on-road and nonroad diesel engines combined and other anthropogenic sources of NOxnatural sources).
from 1970 to 1998 (excludes miscellaneous and
Source: U.S. EPA, 2000a, National Air Pollutant Emission Trends, 1900-1998.
NOx from LD gasoline vehicles decreased from 1980 to 1998, resulting in an overall decrease in on-road NOx emissions of 9%, NOx from diesel trucks and buses increased 7% (from 2,463,390 tons in 1980 to 2,630,120 tons in 1998), owing to the illegal use of electronic control devices that bypassed the trucks’ emission control systems, as discussed in Section 2.2.5. NOx emissions from nonroad diesel engines (including commercial marine and locomotives) have increased 46% (from 3,251,600 tons in 1980 to 4,752,800 tons in 1998) (Figure 2-12).
About 7% of SO2 came from mobile sources in 1998, with diesels responsible for 74% of that total. EPA regulations for on-road diesel fuel sulfur content (which started in 1993) have significantly reduced SO2 emissions from highway diesels. SO2 emissions from highway diesel
2-22
Figure 2-12. Trends in NOx emissions from on-road and nonroad diesel engines from 1970 to 1998.
Source: U.S. EPA, 2000a, National Air Pollutant Emission Trends, 1900-1998.
engines have decreased 72% (from 303,000 tons in 1980 to 85,000 tons in 1998) (Figure 2-13). Similar trends are not apparent for nonroad diesels, although in 1998 nonroad diesel engines, excluding commercial marine vessels, emitted 785,000 tons of SO2, accounting for 56% of mobile-source SO2 emissions in 1998.
Diesel engines are not a large source of VOC emissions compared with gasoline engines. VOC emissions from diesel engines in 1998 were estimated at 2% of the total emissions from all sources. VOC emissions from diesel mobile sources decreased 9% (from 779,000 tons in 1980 to 721,000 tons in 1998) (Figure 2-14).
Diesel engines are also not a large source of CO emissions compared with gasoline engines. In 1998, mobile sources emitted 79% of all CO, and diesel engines accounted for 4% of the mobile-source CO. CO emissions from on-road diesel vehicles increased 34% between 1980 and 1998, during which time nonroad diesel emissions of CO increased 45% (Figure 2-15).
2-23

Figure 2-13. Trends in SO2 emissions from on-road diesel engines from 1970 to 1998 and nonroad diesel engines from 1990 to 1998.
Source: U.S. EPA, 2000a, National air pollutant emission trends, 1900-1998.
Figure 2-14. Trends in VOC emissions from on-road and nonroad diesel engines from 1970to 1998.
Source: U.S. EPA, 2000a, National air pollutant emission trends, 1900-1998.
2-24

Figure 2-15. Trends in CO emissions from on-road and nonroad diesel engines from 1970 to 1998.
Source: U.S. EPA, 2000a, National Air Pollutant Emission Trends, 1900-1998.
2.2.4. Historical Trends in Diesel Fuel Use and Impact of Fuel Properties on Emissions Use of diesel fuel increased steadily in the second half of the 20th century. According to
statistics from the Federal Highway Administration (1995, 1997), in 1949 diesel fuel was approximately 1% of the total motor fuel used, and in 1995 it was about 18%. Over the same time, diesel fuel consumption in the United States increased from about 400 million gallons to 26 billion gallons per year, an increase by a factor of more than 60 (Figures 2-16 and 2-17).
The chemistry and properties of diesel fuel have a direct effect on emissions of regulated pollutants from diesel engines. Researchers have studied the NOx and DPM effect of sulfur content, total aromatic content, polyaromatic content, fuel density, oxygenate content, cetane number, and T90 on emissions of regulated pollutants. T90 is the 90% distillation point temperature. An increase in T90 has been observed to cause an increase in DPM emissions (Cunningham et al., 1990; Sienicki et al., 1990). Cetane number is a measure of the ignition quality, or ignition delay time, of a diesel fuel. The percent of cetane (less commonly referred to as hexadecane, C16H34) by volume in a blend with alpha-methylnaphthalene (C10H7CH3) defines the cetane number that provides the same ignition delay time as the fuel in use.
2-25
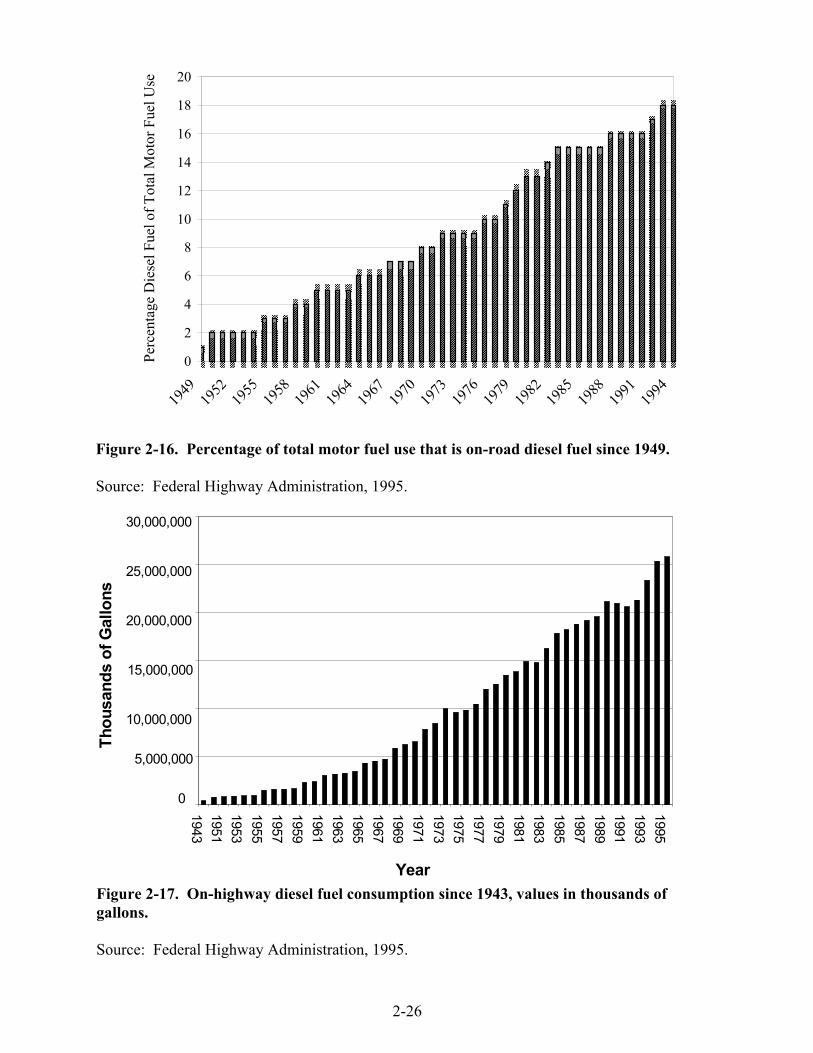
���
���� ���� ���� ���� �����
����� ���� ����
���� �����
���� ���� ���� �����
���� ���� �������� ����� �����
���� ����
���� ����� ���� ����
���� �����
����
����
���� ���������
����� ���� ���� ���� �����
���� ���� ���� �����
�����
���� ����
20
Thou
sand
s of
Gal
lons
Perc
enta
ge D
iese
l Fue
l of T
otal
Mot
or F
uel U
se
��� ���
���� ���� ���� ����
���� ���� ���� ����
���� ���� ���� ����
���� ���� ���� ����
����� ����� ����� �����
����� ����� ����� ����� ����� �����
���� ���� ���� ���� ���� ����
���� ���� ���� ���� ���� ����
���� ���� ���� ���� ���� ���� ���� ����
����� ����� ����� ����� ����� ����� ����� �����
���� ���� ���� ���� ���� ���� ���� ���� ���� ����
���� ���� ���� ���� ���� ���� ���� ���� ���� ����
���� ���� ���� ���� ���� ���� ���� ���� ���� ����
����� ����� ����� ����� ����� ����� ����� ����� ����� �����
���� ���� ���� ���� ���� ���� ���� ���� ���� ���� ���� ����
���� ���� ���� ���� ���� ���� ���� ���� ���� ���� ���� ����
���� ���� ���� ���� ���� ���� ���� ���� ���� ���� ���� ����
���� ���� ���� ���� ���� ���� ���� ���� ���� ���� ���� ���� ����
����� ����� ����� ����� ����� ����� ����� ����� ����� ����� ����� ����� �����
����� ����� ����� ����� ����� ����� ����� ����� ����� ����� ����� ����� �����
���� ���� ���� ���� ���� ���� ���� ���� ���� ���� ���� ���� ���� ���� ����
���� ���� ���� ���� ���� ���� ���� ���� ���� ���� ���� ���� ���� ���� ����
���� ���� ���� ���� ���� ���� ���� ���� ���� ���� ���� ���� ���� ���� ���� ���� ����
����� ����� ����� ����� ����� ����� ����� ����� ����� ����� ����� ����� ����� ����� ����� ����� �����
���� ���� ���� ���� ���� ���� ���� ���� ���� ���� ���� ���� ���� ���� ���� ���� ����
���� ���� ���� ���� ���� ���� ���� ���� ���� ���� ���� ���� ���� ���� ���� ���� ����
���� ���� ���� ���� ���� ���� ���� ���� ���� ���� ���� ���� ���� ���� ���� ���� ���� ���� ����
����� ����� ����� ����� ����� ����� ����� ����� ����� ����� ����� ����� ����� ����� ����� ����� ����� ����� �����
���� ���� ���� ���� ���� ���� ���� ���� ���� ���� ���� ���� ���� ���� ���� ���� ���� ���� ���� ���� ����
���� ���� ���� ���� ���� ���� ���� ���� ���� ���� ���� ���� ���� ���� ���� ���� ���� ���� ���� ���� ���� ���� ����
���� ���� ���� ���� ���� ���� ���� ���� ���� ���� ���� ���� ���� ���� ���� ���� ���� ���� ���� ���� ���� ���� ���� ���� ����
���� ���� ���� ���� ���� ���� ���� ���� ���� ���� ���� ���� ���� ���� ���� ���� ���� ���� ���� ���� ���� ���� ���� ���� ����
����� ����� ����� ����� ����� ����� ����� ����� ����� ����� ����� ����� ����� ����� ����� ����� ����� ����� ����� ����� ����� ����� ����� ����� ����� �����
����� ����� ����� ����� ����� ����� ����� ����� ����� ����� ����� ����� ����� ����� ����� ����� ����� ����� ����� ����� ����� ����� ����� ����� ����� ����� ����� �����
���� ���� ���� ���� ���� ���� ���� ���� ���� ���� ���� ���� ���� ���� ���� ���� ���� ���� ���� ���� ���� ���� ���� ���� ���� ���� ���� ����
���� ���� ���� ���� ���� ���� ���� ���� ���� ���� ���� ���� ���� ���� ���� ���� ���� ���� ���� ���� ���� ���� ���� ���� ���� ���� ���� ����
���� ���� ���� ���� ���� ���� ���� ���� ���� ���� ���� ���� ���� ���� ���� ���� ���� ���� ���� ���� ���� ���� ���� ���� ���� ���� ���� ����
����� ����� ����� ����� ����� ����� ����� ����� ����� ����� ����� ����� ����� ����� ����� ����� ����� ����� ����� ����� ����� ����� ����� ����� ����� ����� ����� �����
���� ���� ���� ���� ���� ���� ���� ���� ���� ���� ���� ���� ���� ���� ���� ���� ���� ���� ���� ���� ���� ���� ���� ���� ���� ���� ���� ���� ���� ����
���� ���� ���� ���� ���� ���� ���� ���� ���� ���� ���� ���� ���� ���� ���� ���� ���� ���� ���� ���� ���� ���� ���� ���� ���� ���� ���� ���� ���� ����
���� ���� ���� ���� ���� ���� ���� ���� ���� ���� ���� ���� ���� ���� ���� ���� ���� ���� ���� ���� ���� ���� ���� ���� ���� ���� ���� ���� ���� ����
����� ����� ����� ����� ����� ����� ����� ����� ����� ����� ����� ����� ����� ����� ����� ����� ����� ����� ����� ����� ����� ����� ����� ����� ����� ����� ����� ����� ����� �����
����� ����� ����� ����� ����� ����� ����� ����� ����� ����� ����� ����� ����� ����� ����� ����� ����� ����� ����� ����� ����� ����� ����� ����� ����� ����� ����� ����� ����� ����� ����� �����
���� ���� ���� ���� ���� ���� ���� ���� ���� ���� ���� ���� ���� ���� ���� ���� ���� ���� ���� ���� ���� ���� ���� ���� ���� ���� ���� ���� ���� ���� ���� ���� ���� ����
���� ���� ���� ���� ���� ���� ���� ���� ���� ���� ���� ���� ���� ���� ���� ���� ���� ���� ���� ���� ���� ���� ���� ���� ���� ���� ���� ���� ���� ���� ���� ���� ���� ����
18
16
14
12
10
8
6
4
2
0
1949
1952
1955
1958
1961
1964
1967
1970
1973
1976
1979
1982
1985
1988
1991
1994
Figure 2-16. Percentage of total motor fuel use that is on-road diesel fuel since 1949.
Source: Federal Highway Administration, 1995.
30,000,000
25,000,000
20,000,000
15,000,000
10,000,000
5,000,000
0
Year Figure 2-17. On-highway diesel fuel consumption since 1943, values in thousands of gallons.
Source: Federal Highway Administration, 1995.
19511943
19551953
19591957
19631961
19671965
19711969
19751973
19791977
19831981
19871985
19911989
19951993
2-26

Before 1993, diesel fuel sulfur levels were not federally regulated in the United States, although the State of California had such regulations. Industry practices that were in place (e.g., the ASTMD 975 specification for No. 2 oils) limited sulfur to 0.5%. During the years 1960 to 1986, fuel sulfur content showed no chronological increasing or decreasing trends and ranged from 0.23 to 0.28 wt% (NIPER, 1986). A maximum allowable on-road diesel fuel sulfur content in the United States was established at 0.05 mass % in 1993, in advance of the 1994 0.10 g/bhphr PM standard for HD on-highway trucks. Nationally, on-road fuels averaged 0.032% sulfur in 1994 while nonroad fuels averaged 10-fold the sulfur level of on-road fuel, or 0.32% (Dickson and Sturm, 1994). The reduction in diesel fuel sulfur reduced total DPM mass emissions through reduction of sulfate PM (primarily present as sulfuric acid).
Considerably higher sulfuric acid PM emissions are possible with DE aftertreatment systems containing precious metals (oxidation catalysts, lean NOx catalysts, catalyzed DPM traps). At temperatures over 350 °C to 500 °C (depending on device), SO2 in the exhaust can be oxidized to sulfuric acid (McClure et al., 1992; McDonald et al., 1995; Wall, 1998). Sulfur content remains at unregulated levels for off-highway diesel fuels and fuels used in railroad locomotives.
The chemical makeup of diesel fuel has changed over time, in part because of new regulations and in part because of technological developments in refinery processes. EPA currently regulates on-road diesel fuel and requires the cetane index (a surrogate for actual measurements of cetane number) to be greater than or equal to 40, or the maximum aromatic content to be 35% or less (CFR 40:80.29). EPA recently finalized a regulation that will limit the sulfur content of on-road diesel fuel to 15 ppm starting in 2006 (U.S. EPA, 2000b). California has placed additional restrictions on the aromatic content of diesel fuel (California Code of Regulations, Title 13, Sections 2281-2282) and requires a minimum cetane number of 50 and an aromatics cap of 10% by volume, with some exceptions for small refiners and alternative formulations as long as equivalent emissions are demonstrated. Diesel fuel from larger refiners is limited to 10% aromatic content, and for three small refiners (a small fraction of diesel sales) to 20% aromatic content. The refiners can also certify a fuel with higher aromatic content as being emissions-equivalent to the 10% (or 20%) aromatic content fuels by performing a 7-day engine dynamometer emissions test. This method is chosen by most, if not all, California refiners, and so a typical California diesel fuel has an aromatic content above 20%. Emissions equivalence has been obtained through use of cetane enhancers, oxygenates, and other proprietary additives. Nonroad diesel fuel is not regulated, and consequently, cetane index, aromatic content, and sulfur content vary widely with nominal values for cetane number around 43, 31% aromatics, and sulfur approximately 3,000 ppm.
2-27
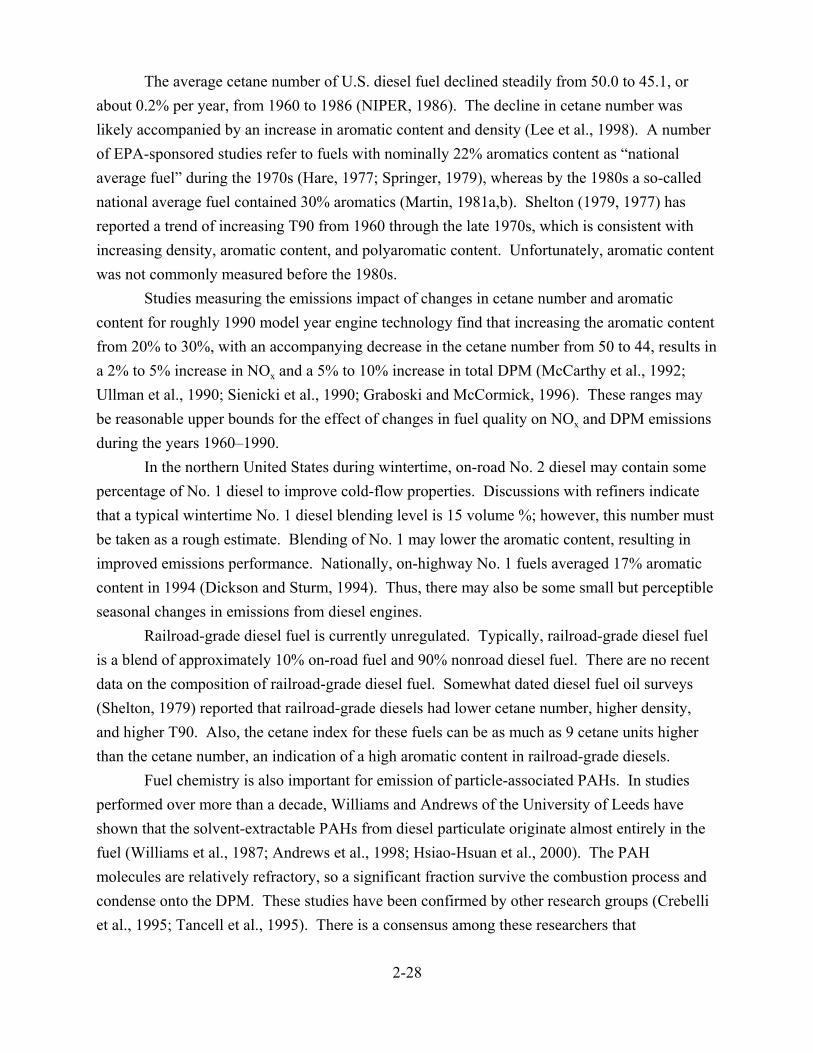
The average cetane number of U.S. diesel fuel declined steadily from 50.0 to 45.1, or about 0.2% per year, from 1960 to 1986 (NIPER, 1986). The decline in cetane number was likely accompanied by an increase in aromatic content and density (Lee et al., 1998). A number of EPA-sponsored studies refer to fuels with nominally 22% aromatics content as “national average fuel” during the 1970s (Hare, 1977; Springer, 1979), whereas by the 1980s a so-called national average fuel contained 30% aromatics (Martin, 1981a,b). Shelton (1979, 1977) has reported a trend of increasing T90 from 1960 through the late 1970s, which is consistent with increasing density, aromatic content, and polyaromatic content. Unfortunately, aromatic content was not commonly measured before the 1980s.
Studies measuring the emissions impact of changes in cetane number and aromatic content for roughly 1990 model year engine technology find that increasing the aromatic content from 20% to 30%, with an accompanying decrease in the cetane number from 50 to 44, results in a 2% to 5% increase in NOx and a 5% to 10% increase in total DPM (McCarthy et al., 1992; Ullman et al., 1990; Sienicki et al., 1990; Graboski and McCormick, 1996). These ranges may be reasonable upper bounds for the effect of changes in fuel quality on NOx and DPM emissions during the years 1960–1990.
In the northern United States during wintertime, on-road No. 2 diesel may contain some percentage of No. 1 diesel to improve cold-flow properties. Discussions with refiners indicate that a typical wintertime No. 1 diesel blending level is 15 volume %; however, this number must be taken as a rough estimate. Blending of No. 1 may lower the aromatic content, resulting in improved emissions performance. Nationally, on-highway No. 1 fuels averaged 17% aromatic content in 1994 (Dickson and Sturm, 1994). Thus, there may also be some small but perceptible seasonal changes in emissions from diesel engines.
Railroad-grade diesel fuel is currently unregulated. Typically, railroad-grade diesel fuel is a blend of approximately 10% on-road fuel and 90% nonroad diesel fuel. There are no recent data on the composition of railroad-grade diesel fuel. Somewhat dated diesel fuel oil surveys (Shelton, 1979) reported that railroad-grade diesels had lower cetane number, higher density, and higher T90. Also, the cetane index for these fuels can be as much as 9 cetane units higher than the cetane number, an indication of a high aromatic content in railroad-grade diesels.
Fuel chemistry is also important for emission of particle-associated PAHs. In studies performed over more than a decade, Williams and Andrews of the University of Leeds have shown that the solvent-extractable PAHs from diesel particulate originate almost entirely in the fuel (Williams et al., 1987; Andrews et al., 1998; Hsiao-Hsuan et al., 2000). The PAH molecules are relatively refractory, so a significant fraction survive the combustion process and condense onto the DPM. These studies have been confirmed by other research groups (Crebelli et al., 1995; Tancell et al., 1995). There is a consensus among these researchers that
2-28

pyrosynthesis of PAHs occurs only at the highest temperature operating conditions in a diesel engine. Under these conditions, most of the DPM and other pyrolysis products are ultimately burned before exiting the cylinder. These results indicate that emissions of PAHs are more a function of the PAH content of the fuel than of engine technology. For a given refinery and crude oil, diesel fuel PAH correlates with total aromatic content and T90. Representative data on aromatic content for diesel fuels in the United States do not appear to be available before the mid-1980s. However, the decreasing trend in cetane number, increasing trend in T90, and the increasing use of light cycle oil from catalytic cracking beginning in the late 1950s suggest that diesel PAH content has increased over the past 40 years. Because PAHs have been implicated as one potential contributing component to the observed toxicity of DE, changes in PAH content of diesel fuel over time, as well as differences between diesel fuels used in different applications (on-road, nonroad, locomotive), may influence the hazard observed in exposed populations from different occupations. However, such a relationship would be difficult to differentiate in an epidemiologic study because there are several other properties of DE that may be contributing to the observed toxicity. Historical trends in PAH-measured emissions are discussed in Section 2.2.8.2.
2.2.5. Chronological Assessment of Emission Factors 2.2.5.1. On-Road Vehicles
Numerous studies have been conducted on emissions from in-use on-road HD diesel vehicles. HD vehicles are defined as having a rated gross vehicle weight (GVWR) of greater than 8,500 lb, and most over-the-road trucks have a GVWR of 80,000 lb. Emissions of regulated pollutants from these studies have been reviewed (Yanowitz et al., 2000); the review findings, which encompass vehicles from model years 1976 to 1998, are summarized below. In addition, a large amount of engine dynamometer data on HD diesel engines have been published since the mid-1970s. These data are used below to confirm and expand upon the findings from in-use vehicle testing.
Figure 2-18 shows chassis dynamometer data for more than 200 different vehicles (approximately one-half of which are transit buses), reported in 20 different published studies, as well as a large amount of additional data collected by West Virginia University (Yanowitz et al., 1999; Warner-Selph and Dietzmann, 1984; Dietzmann et al., 1980; Graboski et al., 1998a,b; McCormick et al., 1999; Clark et al., 1995, 1997; Bata et al., 1992; Brown and Rideout, 1996, Brown et al., 1997; Dunlap et al., 1993; Ferguson et al., 1992; Gautam et al., 1992; Katragadda
2-29

Model Year1975 1980 1985 1990 1995 2000
PM E
miss
ions
(g/m
ile)
0.1
1
10
Model Year1975 1980 1985 1990 1995 2000
NOx
Emiss
ions
(g/m
ile)
10
100
slopelo
Model Year1975 1980 1985 1990 1995 2000
HC E
miss
ions
(g/m
ile)
0.1
1
10
Model Year1975 1980 1985 1990 1995 2000
CO E
miss
ions
(g/m
ile)
1
10
100
Figure 2-18. x, HC, and CO emissions from HD diesel vehicles (g/mile).
Source: Yanowitz et al., 2000.
2-30
Model year trends in PM, NO

et al., 1993; Rideout et al., 1994; Wang et al., 1993, 1994; Williams et al., 1989; Whitfield and Harris, 1998; West Virginia University data available on the World Wide Web at www.afdc.nrel.gov). The results from vehicles tested more than once using the same test cycle, and without any additional mileage accumulated between tests, are averaged and reported as one data point. Buses were tested using the Central Business District (CBD) cycle, while most trucks were tested using the Urban Dynamometer Driving Schedule (UDDS), also known as the Schedule 1d cycle. Some of the trucks were tested using the West Virginia 5-peak cycle, which generates considerably lower g/mi emissions than the CBD or UDDS (Yanowitz et al., 1999). Emissions results from vehicles tested under different test cycles or at different points in the engine's life cycle have been reported as separate data points. Note that all NOx mass emissions data are reported as equivalent NO2. Table 2-7 compares the make-up of the fleet of trucks that was tested with the in-use truck fleet according to the 1997 Vehicle Inventory and Use Survey (U.S. Bureau of the Census, 1999a). The tested fleet is mostly vehicles in the 33,000-60,000 lb range. Analysis of the tested fleet also shows that the model year distribution is skewed toward newer vehicles. The 1997 Vehicle Inventory and Use Survey indicates a flat distribution with roughly the same number of in-use vehicles for each of the model years in the decade preceding 1997. The 1992 Truck Inventory and Use Survey (U.S. Bureau of the Census, 1995) shows the same trend, as shown in Figure 2-1. Analysis of odometer mileage for the tested fleet shows that 45% of the vehicles had less than 50,000 miles at the time of testing. Only 10% of the vehicles had more than 250,000 miles. Although the mileage distribution of the in-use fleet is unknown, it seems unlikely to be as heavily weighted to low-mileage vehicles. Because of the relatively low mileage of most of the vehicles tested, deterioration of emissions may not be reflected in the
Table 2-7. Comparison of in-use truck fleet with truck fleet tested on chassis
dynamometer, percent of total vehicles
Class In-use trucks, 1995 census
Tested trucks
3 17.7 1
4 & 5 13.3 0
6 & 7 25.0 17
8A 20.9 52
8B 23.1 30
2-31

results. Yanowitz and co-workers (2000) report that average emissions of regulated pollutants for vehicles of the different classes listed in Table 2-7 are approximately the same. This is clearly a reflection of the small number of vehicles in the lighter weight classes for this dataset, but it also indicates no real difference in emissions for vehicles in Classes 6–8. The data are mainly for vehicles of 19,500 lb and greater GVWR (Classes 6 and 7 and heavier), and predominantly for vehicles of 33,000 lb and greater GVWR (Class 8 trucks and buses).
Figure 2-18 shows emissions trends in g/mi. Least-squares linear regressions and 95% confidence intervals are plotted on each graph and yield the following equations for predicting emissions trends (applicable to the years 1976–98):
Log NOx (g/mile) = (Model year * !0.008) + 16.519 R2 = 0.024 (2-1) Log PM (g/mile) = (Model year * !0.044) + 88.183 R2 = 0.28 (2-2) Log HC (g/mile) = (Model year * !0.055) + 109.39 R2 = 0.27 (2-3) Log CO (g/mile) = (Model Year * !0.041) + 82.876 R2 = 0.22 (2-4)
As shown in Figure 2-18, changes in NOx emissions have been relatively small, with an emission rate averaging about 26 g/mi. The data reported in Figure 2-18 are real-world, in-use emissions measurements and therefore more accurately reflect emission factors than engine test data during this period. There are two potential causes for the relative constancy of NOx
emissions as described by Figure 2-18. The first is emissions deterioration due to engine wear. Weaver and Klausmeier (1988) have shown that diesel engine deterioration results in lower NOx
emissions and higher DPM emissions, and this finding has recently been confirmed by McCormick and co-workers (2000). Wear of mechanical devices that limit smoke, fuel pumps, and fuel injectors alters the effective injection timing to decrease NOx. Because deterioration is more a function of maintenance than vehicle age or mileage, deterioration introduces a wide range in NOx emission factors measured in the chassis dynamometer studies. The lack of a decreasing trend in NOx emissions can also be attributed to the use of illegal emissions control devices that bypassed the trucks’ emission control systems under some driving conditions such as steady-state cruise. EPA has reached a settlement with the diesel engine manufacturers to discontinue use of these devices. The illegal devices produced low NOx emissions on the transient test (HD FTP) but operated in a high-NOx/high-fuel-economy mode in use under highway cruise conditions.
Figure 2-19 shows engine certification data for NOx emissions reported in the many studies that have employed the transient test over the past 25 years. The engine testing data are also listed in Table 2-8. The data compiled in Figure 2-19 show a significant decline in NOx
2-32
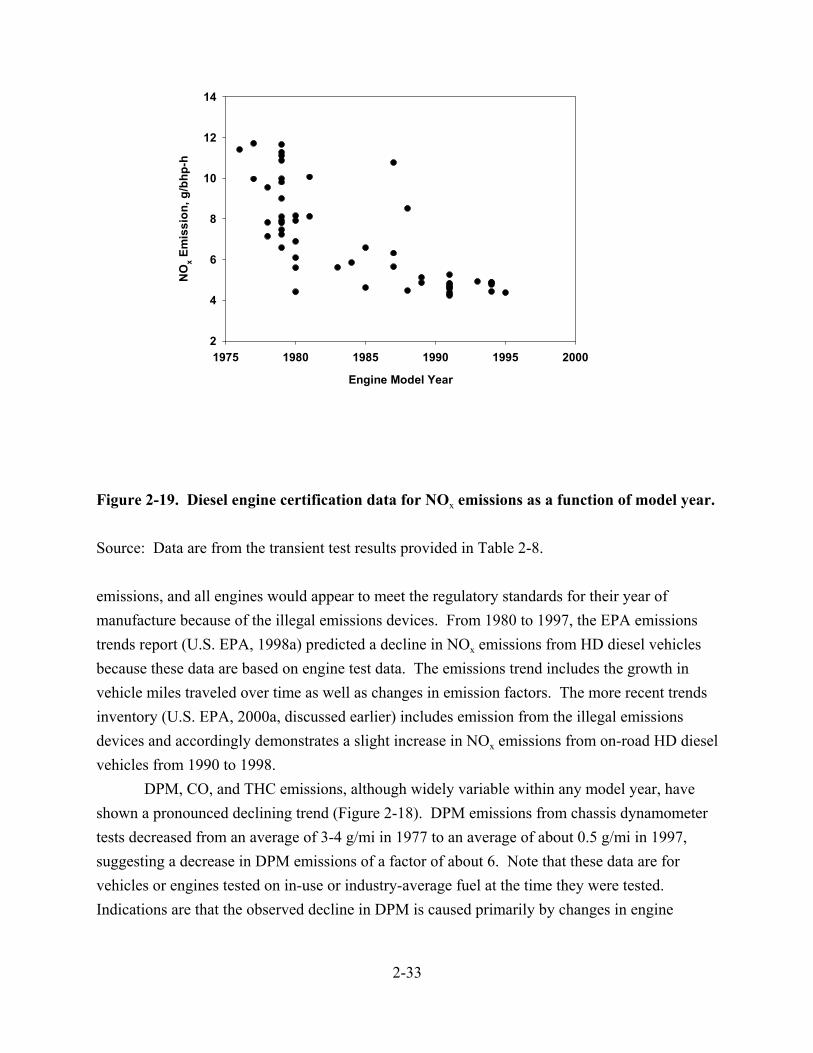
14
12
10
8
6
4
2 1975 1980 1985 1990 1995 2000
Engine Model Year
Figure 2-19. Diesel engine certification data for NOx emissions as a function of model year.
Source: Data are from the transient test results provided in Table 2-8.
emissions, and all engines would appear to meet the regulatory standards for their year of manufacture because of the illegal emissions devices. From 1980 to 1997, the EPA emissions trends report (U.S. EPA, 1998a) predicted a decline in NOx emissions from HD diesel vehicles because these data are based on engine test data. The emissions trend includes the growth in vehicle miles traveled over time as well as changes in emission factors. The more recent trends inventory (U.S. EPA, 2000a, discussed earlier) includes emission from the illegal emissions devices and accordingly demonstrates a slight increase in NOx emissions from on-road HD diesel vehicles from 1990 to 1998.
DPM, CO, and THC emissions, although widely variable within any model year, have shown a pronounced declining trend (Figure 2-18). DPM emissions from chassis dynamometer tests decreased from an average of 3-4 g/mi in 1977 to an average of about 0.5 g/mi in 1997, suggesting a decrease in DPM emissions of a factor of about 6. Note that these data are for vehicles or engines tested on in-use or industry-average fuel at the time they were tested. Indications are that the observed decline in DPM is caused primarily by changes in engine
NO
x Em
issi
on, g
/bhp
-h
2-33

----
--
Table 2-8. data from engine dynamometer tests Reference Enginea Year Testb NOx
g/bhphr
PM g/bhp
hr
CO g/bhp
hr
THC g/bhp
hr
SOF g/bhp
hr
SOF Methc
Total aldehyde,
mg/bhp-hr
B[a]P ug/bhp-hrd
1-NP (NPAH) ug/bhp-hre
Hare, 1977 Cat 3208 (NA) 1976 SS 7.98 0.871 4.04 1.11 0.103 c-hexane 0.76 DDC 6V71 (blower) 1976 SS 10.24 1.92 6.55 0.71 0.937 c-hexane 0.24
Springer, 1979 Mack ETAY(B)673A (DI, TC,AC)
1977 SS 6.613 0.61 1.588 0.476 0.098 Benz/cyc 65 2.23
Cat 3208 (EGR, NA) 1977 SS 3.747 2.21 6.200 1.163 Benz/cyc 161 1.72 Cat 3406 (DI, TC, AC) 1977 SS 9.79 0.35 2.34 0.35 0.063 Benz/cyc 73 0.15
Cat 3406 (DI, TC, AC, EGR) 1977 SS 5.49 0.93 4.81 0.17 0.181 80 0.08 Cat 3406 (IDI, TC, AC) 1977 SS 5.14 0.28 1.26 0.12 0.031 Benz/cyc 80 0.11
DB OM-352A (DI, TC, AC) 1977 SS 8.93 0.56 0.190 Benz/cyc 280 0.87 DB OM-352A (DI, NA) 1977 SS 7.46 0.99 0.287 Benz/cyc 280 1.07
Perez, 1980 Cat (DI, NA) 1978 SS 8.12 0.77 5.92 0.77 0.19 DCM 1.08 Cat (DI, EGR) 1978 SS 5.16 1.21 5.37 0.57 0.079 DCM 4.34
Cat (DI, TC, AC) 1978 SS 7.66 0.33 2.20 0.27 0.037 DCM 0.34 Martin, 1981a Cat 3208 1978 T 7.83 1.06
Cummins NTC350 1976 T 11.41 0.81 DDC 6V92T (2S) 1978 T 9.55 0.72
Cummins NTCC350 1979 T 6.58 0.52 DDC 8V71N (2S) 1978 T 7.15 0.92
DDC 6V92TA (2S) 1979 T 7.80 0.65 IH DTI466B 1979 T 7.46 0.48
Mack ETAY(B)673A 1979 T 9.01 0.77 Mack ETSX676-01 1980 T 6.90 0.85 Cummins VTB-903 1979 T 8.10 0.53
Cat 3406 1979 T 11.28 0.69 Cat 3406PCTA 1979 T 7.24 0.49
Cummins BigCam NTC350 1979 T 9.97 0.54 IH DT466 1979 T 7.91 0.71
DDC 6V92TA (2S) 1979 T 11.66 0.73 DDC 8V71TA (2S) 1979 T 9.81 0.51 Cummins NTC290 1979 T 11.10 0.78 Cummins NH-250 1979 T 10.87 0.97
Martin, 1981b Cummins VTB-903 1980 T 5.59 0.67 2.0 2.23 0.228 DCM DDC 8V71TA (2S) 1980 T 7.91 0.44 2.28 0.73 0.176 DCM
IH DTI466B 1980 T 4.41 0.62 2.35 0.87 0.186 DCM Ullman et al., 1984 DDAD 6V-71 (2S) 1980 T 6.09 0.56 3.86 1.42 0.298 DCM 23
Martin, 1984 Cummins NTC300 1981 T 8.13 0.45 2.70 1.36 Barry et al., 1985 Cat 3406B 1985 T 6.58 0.48 2.1 0.5 0.061 DCM 70 1
DDC 8V-92 TA (2S) 1980 T 8.15 0.45 2.61 0.53
Diesel engine emissions (PAH)
2-342-34
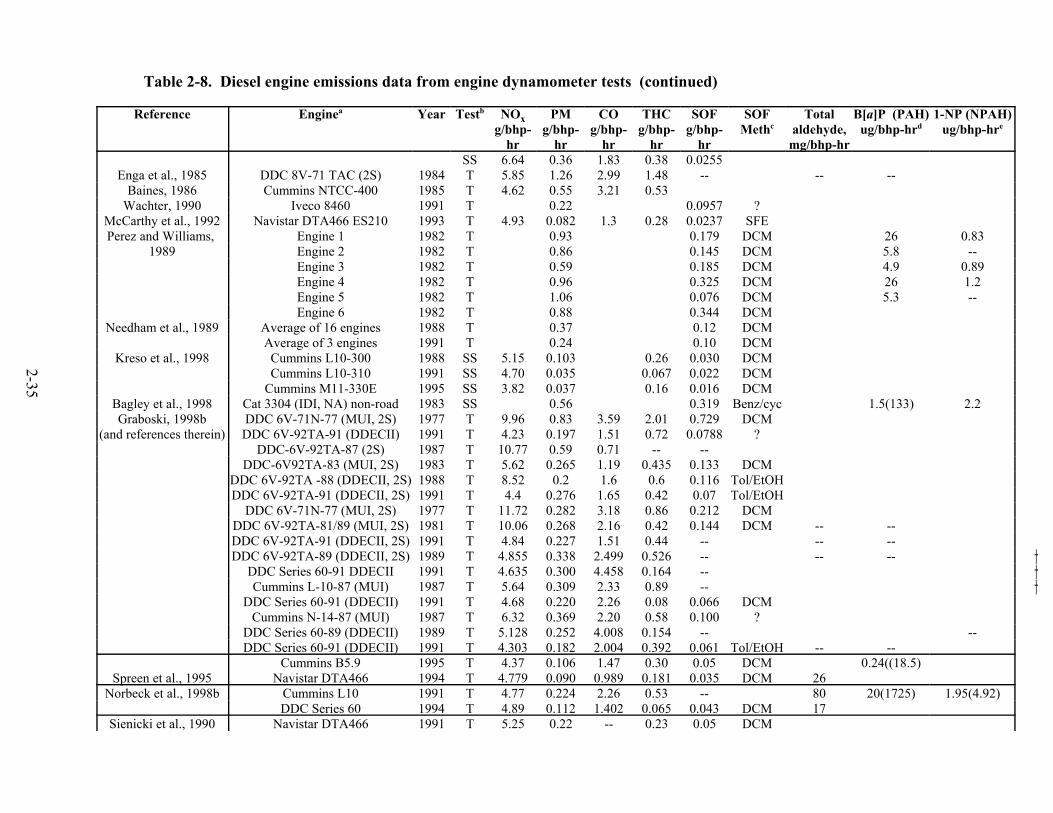
-- -- --
--
--
-- --
-- ---- -- ---- -- ------
-- ---- --
--
--
|||
Table 2-8. Diesel engine emissions data from engine dynamometer tests (continued)
Reference Enginea Year Testb NOx g/bhp
hr
PM g/bhp
hr
CO g/bhp
hr
THC g/bhp
hr
SOF g/bhp
hr
SOF Methc
Total aldehyde,
mg/bhp-hr
B[a]P ug/bhp-hrd
1-NP (NPAH) ug/bhp-hre
SS 6.64 0.36 1.83 0.38 0.0255 Enga et al., 1985 DDC 8V-71 TAC (2S) 1984 T 5.85 1.26 2.99 1.48
Baines, 1986 Cummins NTCC-400 1985 T 4.62 0.55 3.21 0.53 Wachter, 1990 Iveco 8460 1991 T 0.22 0.0957 ?
McCarthy et al., 1992 Navistar DTA466 ES210 1993 T 4.93 0.082 1.3 0.28 0.0237 SFE Perez and Williams, Engine 1 1982 T 0.93 0.179 DCM 26 0.83
1989 Engine 2 1982 T 0.86 0.145 DCM 5.8 Engine 3 1982 T 0.59 0.185 DCM 4.9 0.89 Engine 4 1982 T 0.96 0.325 DCM 26 1.2 Engine 5 1982 T 1.06 0.076 DCM 5.3 Engine 6 1982 T 0.88 0.344 DCM
Needham et al., 1989 Average of 16 engines 1988 T 0.37 0.12 DCM Average of 3 engines 1991 T 0.24 0.10 DCM
Kreso et al., 1998 Cummins L10-300 1988 SS 5.15 0.103 0.26 0.030 DCM Cummins L10-310 1991 SS 4.70 0.035 0.067 0.022 DCM
Cummins M11-330E 1995 SS 3.82 0.037 0.16 0.016 DCM Bagley et al., 1998 Cat 3304 (IDI, NA) non-road 1983 SS 0.56 0.319 Benz/cyc 1.5(133) 2.2 Graboski, 1998b DDC 6V-71N-77 (MUI, 2S) 1977 T 9.96 0.83 3.59 2.01 0.729 DCM
(and references therein) DDC 6V-92TA-91 (DDECII) 1991 T 4.23 0.197 1.51 0.72 0.0788 ? DDC-6V-92TA-87 (2S) 1987 T 10.77 0.59 0.71
DDC-6V92TA-83 (MUI, 2S) 1983 T 5.62 0.265 1.19 0.435 0.133 DCM DDC 6V-92TA -88 (DDECII, 2S) 1988 T 8.52 0.2 1.6 0.6 0.116 Tol/EtOH DDC 6V-92TA-91 (DDECII, 2S) 1991 T 4.4 0.276 1.65 0.42 0.07 Tol/EtOH
DDC 6V-71N-77 (MUI, 2S) 1977 T 11.72 0.282 3.18 0.86 0.212 DCM DDC 6V-92TA-81/89 (MUI, 2S) 1981 T 10.06 0.268 2.16 0.42 0.144 DCM DDC 6V-92TA-91 (DDECII, 2S) 1991 T 4.84 0.227 1.51 0.44 DDC 6V-92TA-89 (DDECII, 2S) 1989 T 4.855 0.338 2.499 0.526
DDC Series 60-91 DDECII 1991 T 4.635 0.300 4.458 0.164 Cummins L-10-87 (MUI) 1987 T 5.64 0.309 2.33 0.89
DDC Series 60-91 (DDECII) 1991 T 4.68 0.220 2.26 0.08 0.066 DCM Cummins N-14-87 (MUI) 1987 T 6.32 0.369 2.20 0.58 0.100 ?
DDC Series 60-89 (DDECII) 1989 T 5.128 0.252 4.008 0.154 DDC Series 60-91 (DDECII) 1991 T 4.303 0.182 2.004 0.392 0.061 Tol/EtOH
Cummins B5.9 1995 T 4.37 0.106 1.47 0.30 0.05 DCM 0.24((18.5) Spreen et al., 1995 Navistar DTA466 1994 T 4.779 0.090 0.989 0.181 0.035 DCM 26
Norbeck et al., 1998b Cummins L10 1991 T 4.77 0.224 2.26 0.53 80 20(1725) 1.95(4.92) DDC Series 60 1994 T 4.89 0.112 1.402 0.065 0.043 DCM 17
Sienicki et al., 1990 Navistar DTA466 1991 T 5.25 0.22 0.23 0.05 DCM
(PAH)
2-35

--
Table 2-8. Diesel engine emissions data from engine dynamometer tests (continued)
Enginea Year Testb NOx g/bhp
hr
PM g/bhp
hr
CO g/bhp
hr
THC g/bhp
hr
SOF g/bhp
hr
SOF Methc
Total aldehyde,
mg/bhp-hr
B[a]P (PAH) ug/bhp-hrd
1-NP (NPAH) ug/bhp-hre
DDC Series 60 1991 T 4.552 0.188 2.102 0.508 Cat 3406E 1997 T DCM 0.07(30) 0.34
Cummins NTCC400 1988 T 4.47 0.42 2.22 0.53 DDC Series 60 1994 T 4.43 0.111 2.17 0.22 0.021 DCM 34 (141) 0.04(0.12)
Navistar DTA466 1994 T 4.86 0.099 1.10 0.34 0.046 DCM 56 0.11(242) 0.3(0.6) Unknown 1994 SS 4.934 0.143 0.807 0.352 0.036 DCM .076
Scania 1990 SS 9.30 0.157 0.031 DCM Valmet 1990 SS 8.67 0.157 Volvo 1990 SS 9.87 0.262 Volvo 1995 SS 4.56 0.135
Reference
Ullman et al., 1990 Kado et al., 1998
Ullman, 1988 Mitchell et al., 1994
Tanaka et al., 1998 Rantanen et al., 1993
aNA=naturally aspirated. TC=turbocharged (engines not designated as NA or TC are turbocharged). AC=aftercooled. DI=direct injection. IDI=indirect injection. EGR=exhaust gas recirculation. 2S=two-stroke (engines not designated as 2S are four-stroke). MUI=mechanical unit injector (not electronically controlled). DDEC=Detroit Diesel Corporation’s engine control module (electronic control). bSS=various single or multimode steady-state tests. T=heavy-duty FTP (transient test). cSOF extraction method. SFE=Supercritical fluid extraction. All others by Soxhlet extraction using the indicated solvents (? for unreported). DCM=dichloromethane. Tol/EtOH=toluene/ethanol mixture. Benz/cyc=benzene/cyclohexane mixture. C-hexane=cyclohexane.dNumber in parentheses is the total PAH emission obtained by summing emissions of all PAHs reported. eNumber in parentheses is the total NPAH emission obtained by summing emissions of all NPAHs reported.

technology that often result from emission standards, as well as by the lowering of on-road diesel fuel sulfur content in 1993.
As the discussion above indicates, there is a reasonable amount of data upon which to base emission factor estimates for late 1970s and later HD vehicles. However, very little transient test data are available on engines earlier than the mid-1970s. The limited data available from six pre-1976 vehicles tested using the transient cycle suggests that PM emission rates ranged from 1.6 g/mi to 9.0 g/mi, which is a substantially greater range than in post-1976 engines (Fritz et al., 2001).
Although a substantial decreasing trend in DPM emissions from in-use chassis dynomometer testing and engine testing (Figure 2-20) is evident, these data reflect a wide range in emission factors within any given model year. For example, emission factors for model year 1996 range from less than 0.1 g/mi to more than 1 g/mi (Yanowitz et al., 2000; Graboski et al., 1998b). The high variability in DPM emissions measured in the chassis dynamometer tests is observed because of several factors, including differences in measurement methods and test conditions at the various testing facilities, deterioration, and engine-to-engine variation. Although there can be excellent agreement between chassis dynamometer testing facilities (Graboski et al., 1998a), there is no standard HD chassis dynamometer Federal test procedure, and no detailed procedures for such testing are described in any authoritative source such as the Code of Federal Regulations, which does contain such procedures for engine dynamometer
1.50
1.25
1.00
0.75
0.50
0.25
0.00 1975 1980 1985 1990 1995 2000
Engine Model Year
Figure 2-20. Diesel engine certification data for PM emissions as a function of model year.
Source: Data are from the transient test results provided in Table 2-8.
PM E
mis
sion
, g/b
hp-h
2-37

testing used for EPA emission regulations. Therefore, each facility has developed its own approach to HD testing. Clark et al. (1999) report that the test cycle can have a substantial effect on DPM emissions, with higher DPM emissions reported from test cycles that incorporate full-power accelerations. Test cycles incorporating full-power accelerations reflect urban HD vehicle driving for several types of vehicles (garbage trucks, buses) operating in urban areas. Clark et al. (1999) also report that aggressive acceleration produces higher DPM emission rates than does conservative acceleration, and Clark and co-workers suggest that real in-use driving is more likely to mimic aggressive acceleration. Although figures are currently unquantified, it is generally believed that the majority of DPM is generated under transient conditions such as heavy acceleration.
Weaver and Klausmeier (1988) have examined potential causes and frequency of DPM emissions deterioration for in-use HD diesel vehicles. Potential causes include manufacturing defects and malfunctions such as retarded timing, fuel injector malfunction, smoke-limiting mechanism problems, clogged air filter, wrong or worn turbocharger, clogged intercooler, engine mechanical failure, excess oil consumption, and electronics that have been tampered with or have failed. The recent report by McCormick and co-workers (2000) indicates that many of these malfunctions can have very large effects on DPM emissions, resulting in DPM increases of typically 50% to 100%. Although Yanowitz and co-workers (1999) found that DPM emissions were positively correlated with odometer mileage for a fleet of 21 vehicles, it is more likely that the vehicle state of maintenance will be more important than mileage for determining the degree of emissions deterioration. In fact, in a similar analysis performed on the chassis dynamometer results included in the review of Yanowitz et al. (2000), DPM emissions could not be correlated with odometer mileage. Differences in testing methods between various facilities as well as varying states of maintenance for vehicles of the same mileage and model year probably account for this lack of correlation.
It is difficult, given current information, to quantitatively assess the contribution of high-emitting or smoking diesel vehicles to ambient DPM. Emission models used to prepare diesel particulate emission inventories do not account for deterioration. The relative contribution of high-emitting diesel vehicles to the total mass and overall chemical composition of diesel particulates is being quantified. Some studies report numerous smoking diesel trucks. A study of the smoke opacity-based inspection and maintenance program in California found failure rates of 20% and higher, suggesting that high-emitting vehicles are not uncommon (CARB/EEAI, 1997). In the Northeast, smoke opacity testing conducted on 781 HD trucks found that 15% of the vehicles failed the smoke standard (40% opacity for 1991 and newer HD diesel vehicles and 50% opacity for pre-1991 HD diesel vehicles) (Cooper, 1999). Although the correlation between smoke and particulate emissions tends to be qualitative or semiquantitative (discussed
2-38

below), there is a good correlation between opacity and EC concentrations, and it is expected that high-emitting diesel vehicles may be an important part of the DPM emission inventory.
Others have attempted to determine if the effects of deterioration could be detected for in-use vehicles. In a study of 21 vehicles (Yanowitz et al., 1999), a linear multivariate regression analysis found that DPM emissions were positively correlated with odometer mileage (several other correlation factors were also identified, including model year). A similar analysis performed on the chassis dynamometer results included in the review of Yanowitz et al. (2000) found that DPM emissions could not be correlated with odometer mileage, probably because of differences in testing methods between the various facilities.
Other approaches for measuring emissions from in-use on-road diesel vehicles include tunnel tests and remote sensing, the latter of which measures gaseous, but not DPM, emissions. The literature reports of those studies are summarized in Tables 2-9 and 2-10. Several tunnel test studies have reported DPM emission factors (Pierson and Brachaczek, 1976; Japar et al., 1984; Pierson et al., 1983; Kirchstetter et al., 1999; Gertler et al., 1996, 1999).
The method for determining emission rates for vehicles traveling through a tunnel is explained in detail by Pierson et al. (1996). Briefly, the emissions of a species are determined by measuring the concentration of a pollutant entering and leaving a tunnel along with knowledge of the cross-section of the tunnel and measurements of the wind flux at the inlet and outlet of the tunnel. The emission rate is calculated by dividing the mass of the pollutant by the number of vehicles that passed through the tunnel and the length of the tunnel. The diesel and gasoline vehicle contributions to the total emission of the pollutant are separated by a simple regression analysis where the intercepts (100% HD and 100% LD) are the diesel and gasoline emission rates, respectively.
Emission factors from tunnel studies provide a snapshot of real-world emissions under driving conditions experienced in the tunnel and reflect emission factors representative of the mix of in-use vehicles and the atmospheric dilution and short-term transformation processes of DE. Emission factors derived from tunnel studies are often used as one source of information to study the impact of improved technology and fleet turnover on emissions because they allow random sampling of large numbers of vehicles, including a range of ages and maintenance conditions. However, tunnel studies are limited in that they represent driving conditions on a single roadway passing through a tunnel and represent mostly steady-state driving conditions, whereas most DPM is generated during transient modes of operation; also, tunnel studies do not include cold-start operations. Both of these factors need to be assessed to understand emission rates for DPM to which people are exposed (U.S. EPA, 1992, 1995). DPM emission factors from in-use fleets derived from tunnel studies in the 1970s and 1980s compared with the 1990s
2-39

Table 2-9. HD diesel emissions results from tunnel tests (adapted from Yanowitz et al., 1999)
aNOx reported as NO2. eSlope of tunnel unknown, so used average fuel efficiency for the UnitedbCalculated from observed CO2 emissions assuming fuel density 7.1 lb/gal States.and C is 87% of diesel fuel by weight. fPM3. cSince CO2 emissions not available, fuel efficiency assumed to be the same gPM2.5. as in slightly uphill tunnel (Fort McHenry). hUncertainty reported as ±1.0 standard deviation, except where literaturedReported as black carbon, assumed that 50% of total PM emissions are report did not specify standard deviation; in those cases uncertainty listed asBC. reported.
DPM (g/gal)
4.9-9.8 9.49±1.03 8.1 ± 0.54 7.6 ± 0.4 7.0 ± 1.0
7.5 ± 1.40 7.0 ± 0.43 6.5 ± 0.16 7.6 ± 0.19
9.0 ± 1.3d
3.5 ± 0.1f
7.7 ± 0.6g
CO (g/gal)
55 ± 95
78 ± 17
78 ± 30
39 ± 10
NMHC (g/gal)
-1 ± 7
11 ± 2
14 ± 6
4 ± 1
NOx a
(g/gal)
157 ± 34 129 ± 23
111 ± 4
122 ± 5
125 ± 5 129 ± 16
CO2 (g/mi)
1,280 ± 40
897 ± 48
1,897 ± 168
1,596 ± 78
DPM (g/mi)
.90-1.80 1.75 ± 0.19 1.5 ± 0.10 1.4 ± 0.07 1.3 ± 0.19 1.39 ± 26 1.3 ± 0.08 1.2 ± 0.03 1.4 ± 0.04
1.67 ± 0.24d
0.62 ± 0.02f
1.43 ± 0.12g
0.29
CO (g/mi)
6.79 ± 11.78
6.8 ± 1.5
14.3 ± 5.5
6.03 ± 1.61
NMHC (g/mi)
-0.16 ± 0.88
0.92 ± 0.21
2.55 ± 1.05
0.68 ± 0.20
NOx a
(g/mi)
19.50 ± 4.22 23.82 ±
4.17
9.66 ± 0.32
22.50 ± 1.00
19.46 ± 0.85 23.82 ±
2.98
Fuel efficiency (mi/gal)
5.42b
8.03b
5.42c
5.60e
11.46b
5.42b
6.44b
5.42c
Tunnel location, year of study
Allegheny, 1974 Allegheny, 1975 Allegheny, 1976 Allegheny, 1976 Tuscarora, 1976 Tuscarora, 1976 Allegheny, 1977 Allegheny, 1979 Allegheny, 1979 Cassiar Tunnel, 1995, Vancouver Caldecott Tunnel, 1996, San Francisco Gubrist Tunnel, 1993, Zurich Fort McHenry Tunnel, downhill, 1992, Baltimore Fort McHenry Tunnel, uphill, 1992, Baltimore Tuscarora Tunnel 1992, Pennsylvania Caldecott Tunnel, 1997, San Francisco Tuscarora Tunnel, 1999, Pennsylvania
Test
Pierson and Brachaczeck, 1983
Rogak et al., 1998
Miguel et al., 1998
Weingartner et al., 1997b Pierson et al., 1996
Pierson et al., 1996
Pierson et al., 1996
Kirchstetter et al., 1999 Gertler,1999
2-40

Table 2-10. Remote sensing results for HD vehicles
Reference Year study conducted
Emissions (g/gal)
NOx Jimenez et al., 1998 1997 150 a,b,c
Cohen et al., 1997 1997 108 a,b,c
Countess et al., 1999 1998 187 a,b,c
CO Bishop et al., 1996 1992 59 b
Cohen et al., 1997 1997 54 b
Countess et al., 1999 1998 85 b
THC Bishop et al., 1996 1992 0.002 HC/CO2 mole ratio d
Cohen et al., 1997 1997 0.00073 HC/CO2 mole ratio d
aRemote sensing measures NO. The reported value was corrected to a NOx (as NO2) value byassuming 90% (mole fraction) of NOx is NO.bEmissions in g/gal calculated by assuming that fuel density is 7.1 lb/gal and C is 87% by weightof fuel.cNo humidity correction factor is included.dIn order to calculate emissions in g/gal, an average molecular weight is needed.
Source: Yanowitz et al., 1999.
suggest approximately a fivefold decrease in DPM mass emission factors over that time, with the most recent data from 1999 reporting an emission factor of 0.29 g/mi for the on-highway HD diesel fleet (Figure 2-21).
Emission factors vary substantially for the various tunnels, with NOx emissions ranging from 9.7 to 23.8 g/mi in the 1990s, CO emissions ranging from 6 to 14 g/mi, and THC emissions ranging from 0.16 to 2.55 g/mi.
Remote sensing reports emission factors in terms of pollutant emissions per unit of fuel, not on a per-mile basis. Agreement between remote sensing and tunnel studies for NOx
emissions is reasonably good for the fleet as a whole, suggesting an average level for the fleet of about 130 g/gal, comparable to the average emissions factor measured in chassis dynamometer studies (remote sensing can measure emissions from an individual vehicle, whereas tunnel studies measure emissions from the fleet as a whole). Generally, chassis dynamometer tests and engine dynamometer test results are corrected for ambient humidity, in accordance with the Federal Test Procedure (CFR 40, Subpart N). Tunnel tests and remote sensing tests have typically not included corrections for humidity. Appropriate humidity corrections for NOx and DPM can be greater than 20% and 10%, respectively (or a total difference of more than 45% and 20%, respectively, between low- and high-humidity areas), under normally occurring climatic conditions. Additionally, the remote sensing literature has not addressed how to determine the
2-41
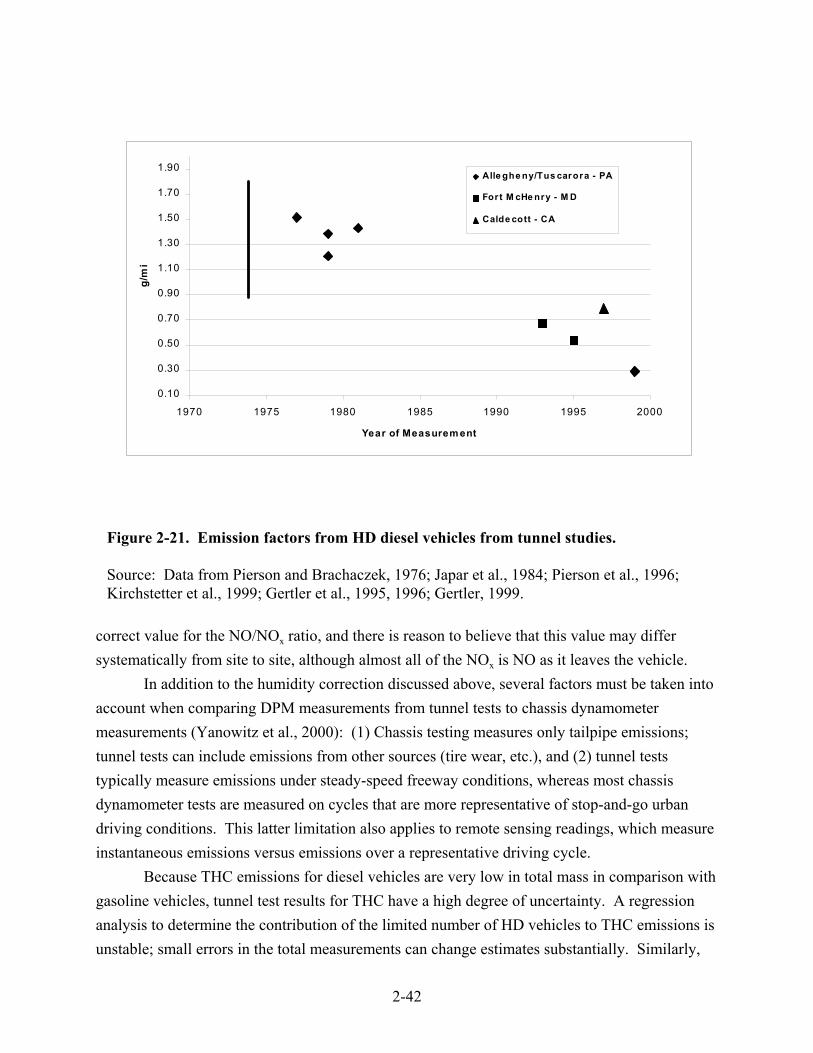
0.10
0.30
0.50
0.70
0.90
1.10
1.30
1.50
1.70
1.90
1970 1975 1980 1985 1990 1995 2000
Year of Measurem ent
g/m
i
Alle gh e n y/Tu s car or a - PA
Fo r t M cHe n r y - M D
Cald e co tt - C A
Figure 2-21. Emission factors from HD diesel vehicles from tunnel studies.
Source: Data from Pierson and Brachaczek, 1976; Japar et al., 1984; Pierson et al., 1996; Kirchstetter et al., 1999; Gertler et al., 1995, 1996; Gertler, 1999.
correct value for the NO/NOx ratio, and there is reason to believe that this value may differ systematically from site to site, although almost all of the NOx is NO as it leaves the vehicle.
In addition to the humidity correction discussed above, several factors must be taken into account when comparing DPM measurements from tunnel tests to chassis dynamometer measurements (Yanowitz et al., 2000): (1) Chassis testing measures only tailpipe emissions; tunnel tests can include emissions from other sources (tire wear, etc.), and (2) tunnel tests typically measure emissions under steady-speed freeway conditions, whereas most chassis dynamometer tests are measured on cycles that are more representative of stop-and-go urban driving conditions. This latter limitation also applies to remote sensing readings, which measure instantaneous emissions versus emissions over a representative driving cycle.
Because THC emissions for diesel vehicles are very low in total mass in comparison with gasoline vehicles, tunnel test results for THC have a high degree of uncertainty. A regression analysis to determine the contribution of the limited number of HD vehicles to THC emissions is unstable; small errors in the total measurements can change estimates substantially. Similarly,
2-42

CO emissions are comparable to automobile emissions on a per-vehicle-mile basis, but because there are generally many more automobiles than HD diesels in tunnel tests, CO measurements from diesels may also have a high degree of uncertainty.
2.2.5.2. Locomotives Locomotive engines generally range from 1,000 horsepower up to 6,000 horsepower.
Similar to the much smaller truck diesel engines, the primary pollutants of concern are NOx, DPM, CO, and HC. Unlike truck engines, most locomotive engines are not mechanically coupled to the drive wheels. Because of this decoupling, locomotive engines operate in specific steady-state modes rather than the continuous transient operation normal for trucks. Because the locomotive engines operate only at certain speeds and torques, the measurement of emissions is considerably more straightforward for locomotive engines than for truck engines. Emissions measurements made during the relatively brief transition periods from one throttle position to another indicate that transient effects are very short and thus could be neglected for the purposes of overall emissions estimates.
Emissions measurements are made at the various possible operating modes with the engine in the locomotive, and then weighting factors for typical time of operation at each throttle position are applied to estimate total emissions under one or more reasonable operating scenarios. In the studies included in this analysis, two scenarios were considered: line-haul (movement between cities or other widely separated points) and switching (the process of assembling and disassembling trains in a switchyard).
The Southwest Research Institute made emissions measurements for three different engines in locomotives in 1972 (Hare and Springer, 1972) and five more engines in locomotives using both low- and high-sulfur fuel in 1995 (Fritz, 1995). Two engine manufacturers (the Electro-Motive Division of GM, and GE Transportation Systems) tested eight different engine models and reported the results to EPA (U.S. EPA, 1998b). All available data on locomotives are summarized in the regulatory impact assessment and shown in Figure 2-22.
2.2.6. Engine Technology Description and Chronology NOx emissions, DPM emissions, and brake-specific fuel consumption (BSFC) are among
the parameters that are typically considered during the development of a diesel engine. Many engine variables that decrease NOx can also increase DPM and BSFC. One manifestation of the interplay among NOx, DPM, and BSFC is that an increase in combustion temperatures will tend to increase NO formation. Higher temperatures will also often improve thermal efficiency, can improve BSFC, and can increase the rate of DPM oxidation, thus lowering DPM emissions. One example of this is the tradeoff of DPM emissions and BSFC versus NOx emissions with fuel
2-43

2-44
0 0. 2 0. 4 0. 6 0. 8 10
10
20
30
40
P M
S w itc h C y c le E m is s io ns D a taNO x and PM ( g/bhp- hr )
Figure 2-22. itch emissions data.
Source:
Line-haul and sw
U.S. EPA, 1998a.

injection timing. Many recent advances in reducing the emissions of diesel engines without aftertreatment are combinations of technologies that provide incremental improvements in the tradeoffs among these emissions and fuel consumption. The sum total, however, can be considerable reductions in regulated emissions within acceptable levels of fuel consumption.
The majority of current HD diesel truck engines certified for use in the United States utilize:
• A four-stroke cycle • Direct-injection, high-pressure (1,200 bar to >2,000 bar) fuel injection systems with
electronic control of injection timing and, in some cases, injection rate • Centrally located multihole injection nozzles • Three or four valves per cylinder • Turbochargers • In many cases, air-to-air aftercooling • In some cases, the use of an oxidation catalyst.
These features have phased into use with HD truck engines because they offer a relatively good combination of fuel consumption, torque-rise, emissions, durability, and the ability to better “tune” the engines for specific types of applications. Fuel consumption, torque-rise, and drivability have been maintained or improved while emissions regulations have become more stringent. Many Class 8a and 8b diesel truck engines are now capable of 700,000 to 1,000,000 miles of driving before their first rebuild and can be rebuilt several times because of their heavy construction and the use of removable cylinder liners. These engines are expected to last longer and therefore have a useful life longer than the regulatory estimate of full useful life for HD engines (~1,000,000 miles) previously used by EPA (for 1980 engines that were driven less than 300,000 miles between rebuilds and were rebuilt up to three times). Current four-stroke locomotive engines use engine technology similar to on-highway diesel engines, except that electronic controls have only recently been introduced.
It is difficult to separate the components of current high-speed diesel engines for discussion of their individual effects on emissions. Most of the components interact in numerous ways that affect emissions, performance, and fuel consumption.
2.2.6.1. Indirect and Direct Injection High-Speed Diesel Engines Prior to the 1930s, diesel engine design was limited to relatively low-speed applications
because sufficiently high-pressure fuel injection equipment was not available. With the advent of high-speed and higher pressure pump-line-nozzle systems, introduced by Robert Bosch in the
2-45

1930s, it became possible to inject the fuel directly into the cylinder for the first time, although indirect injection (IDI) diesel engines continued in use for many years. As diesels were introduced into the heavy truck fleet in the 1930s through the 1950s, both IDI and direct injection (DI) naturally aspirated variants were evident. A very low-cost rotary injection pump technology was introduced by Roosa-Master in the 1950s, reducing the cost of DI systems and allowing their introduction on smaller displacement, higher speed truck engines. After this time, only a small fraction of truck engines used an IDI system.
DI diesel engines have now all but replaced IDI diesel engines for HD on-highway applications.2 IDI engines typically required much more complicated cylinder head designs but generally were capable of using less sophisticated, lower pressure injection systems with less expensive single-hole injection nozzles. IDI combustion systems are also more tolerant of lower grades of diesel fuel. Fuel injection systems are likely the single most expensive component of many diesel engines. Caterpillar continued producing both turbocharged and naturally aspirated IDI diesel engines for some on-highway applications into the 1980s. Caterpillar and Deutz still produce engines of this type, primarily for use in underground mining applications. IDI combustion systems are still used in many small-displacement (<0.5 L/cylinder), very high-speed (>3,000 rpm rated speed) diesel engines for small nonroad equipment (small imported tractors, skid-steer loaders), auxiliary engines, and small generator sets, and they were prevalent in diesel automotive engines in the 1980s; IDI designs continue to be used in automotive diesel engines.
IDI engines have practically no premixed burn combustion and thus are often quieter and have somewhat lower NOx emissions than DI engines. Electronic controls, high-pressure injection (e.g., GM 6.5), and four-valve/cylinder designs (e.g., the six-cylinder Daimler LD engine) can be equally applied to IDI diesel engines as in DI, but they negate advantages in cost over DI engines. DI diesel engines of the same power output consume 15% to 20% less fuel than IDI engines (Heywood, 1988). Considering the sensitivity of the HD truck market to fuel costs, this factor alone accounts for the demise of IDI diesel engines in these types of applications. Throttling and convective heat transfer through the chamber-connecting orifice, and heat rejection from the increased surface area of IDI combustion systems, decrease their efficiency and can cause cold-start difficulties when compared to DI designs. Most IDI diesel engine designs require considerably higher than optimum compression ratios (from an efficiency standpoint) to aid in cold-starting (19:1 to 21:1 for IDI engines vs. ~15:1 to 17:1 for DI engines).
2The GM Powertrain/AM General 6.5L electronically controlled, turbocharged IDI-swirl chamber engine, certified as a light HD diesel truck engine, is the last remaining HD on-highway IDI engine sold in the United States.
2-46

Because of the early introduction of DI technology into truck fleets, it is likely that by the end of the 1960s, only a small fraction of the HD diesel engines sold for on-highway use were IDI engines. It is unlikely that the shift from IDI to DI engine designs through the 1950s and 1960s occurred rapidly and likely that this shift had little significant impact on emissions. Springer (1979) reports a comparison of nearly identical Caterpillar 3406 engines (turbocharged and aftercooled) in DI and IDI configurations tested on an engine dynamometer under steady-state conditions, which limits the usefulness of these data. There was no significant difference in emissions of DPM, SOF, aldehydes, or DPM-associated B[a]P (Table 2-8). Note that IDI designs continue to be used in automotive diesel engines.
2.2.6.2. Injection Rate Decreasing the duration of diffusion combustion and promoting EC oxidation during the
expansion stroke can reduce formation of EC agglomerates (Stone, 1995) and reduce the particulate carbon fraction at high load (Needham et al., 1989). Both of these effects are enhanced by increasing the fuel injection rate. The primary means of accomplishing this is by increasing fuel injection pressure. In 1977 Robert Bosch introduced a new type of high-pressure pump capable of producing injection pressures of 1,700 bar at the nozzle (Voss and Vanderpoel, 1977). This increased fuel injection pressure by roughly a factor of 10. Unit injection, which combines each fuel injection nozzle with individual cam-driven fuel pumps, can achieve very high injection pressures (>2,000 bar). The first combination of unit injectors with electronically controlled solenoids for timing control was offered in the United States by Detroit Diesel Corporation in the 1988 model year (Hames et al., 1985). Replacement of the injection cam with hydraulic pressure, allowing a degree of injection rate control, was made possible with the hydraulic-electronic unit injection jointly developed by Caterpillar and Navistar, introduced on the Navistar T444E engine (and variants) in 1993.
It is widely known that high fuel injection pressures have been used to obtain compliance with the PM standards that went into effect in 1988 (Zelenka et al., 1990). Thus, it is likely that a transition to this technology began in the 1980s, with the vast majority of new engine sales employing this technology by 1991, when the 0.25 g/bhp-hr Federal PM standard went into effect.
The use of electronic control of injection rate is rapidly increasing on medium HD diesel engines. Engines are currently under development, perhaps for 2002–2004 introduction, that use common-rail fuel injection systems with even more flexible control over injection pressure and timing than previous systems.
Increased injection rate and pressure can significantly reduce EC emissions, but it can also increase combustion temperatures and cause an increase in NOx emissions (Springer, 1979;
2-47

Watson and Janota, 1982; Stone, 1995). Low NOx
brake mean engine pressure (BMEP) are possible when combined with turbocharging,aftercooling, and injection timing retard.
, low DPM, and relatively good BSFC and
2.2.6.3. Turbocharging, Charge-Air Cooling, and Electronic Controls Use of exhaust-driven turbochargers to increase intake manifold pressure has been
applied to both IDI and DI diesel engines for more than 40 years. Turbocharging can decrease fuel consumption compared with a naturally aspirated engine of the same power output. Turbocharging utilizes otherwise wasted exhaust heat and pressure to generate intake boost. The boosted intake pressure effectively increases air displacement and increases the amount of fuel that can be injected to achieve a given fuel-air ratio. Turbocharging increases the power density of an engine. Boosting intake pressure via turbocharging and reducing fuel-to-air ratio at a constant power can significantly increase both intake temperatures and NOx emissions. Increased boost pressure can significantly reduce ignition delay, which reduces VOC and DPM SOF emissions (Stone, 1995) and increases the flexibility in selection of injection timing. Injection timing on turbocharged engines can be retarded further for NOx emission control with less of an effect on DPM emissions and fuel consumption. This allows a rough parity in NOx
emissions between turbocharged (non-aftercooled) and naturally aspirated diesel engines (Watson and Janota, 1982).
Turbocharging permits the use of higher initial injection rates (higher injection pressure),
Figure 2-23. Effect of turbocharging and aftercooling on NOx and PM.
Source: Mori, 1997.
2-48

which can reduce particulate emissions. Although this may offer advantages for steady-state operation, hard accelerations can temporarily cause overly fuel-rich conditions because the turbocharger speed lags behind a rapid change in engine speed (turbo-lag). This can cause significant increases in DPM emissions during accelerations. Before the advent of electronic controls, the effect of acceleration on DPM emissions could be limited by mechanically delaying demand for maximum fuel rate with a “smoke-puff eliminator.” Because this device also limited engine response, there was considerable incentive for the end-users to remove or otherwise render the device inactive. Charge-air cooling, for example, using an air-to-air aftercooler (air-cooled heat exchanger) between the turbocharger compressor and the intake manifold, can greatly reduce intake air and peak combustion temperatures. When combined with injection timing retard, charge-air cooling allows a significant reduction in NOx emissions with acceptable BSFC and DPM emissions when compared to either non-aftercooled or naturally aspirated diesel engines (Hardenberg and Fraenkle, 1978; Pischinger and Cartellieri, 1972; Stone, 1995). The use of charge-air cooling effectively shifts the NOx-DPM tradeoff curve, as shown in Figure 2-23.
Electronic control of fuel injection timing allowed engine manufacturers to carefully tailor the start and length of the fuel injection events much more precisely than through mechanical means. Because of this, newer on-highway turbocharged truck engines have virtually no visible smoke on acceleration (although emissions of DPM are substantial during this driving mode). Electronic controls also allowed fuel injection retard under desirable conditions for NOx reduction, while still allowing timing optimization for reduced VOC emissions on start-up, acceptable cold-weather performance, and acceptable performance and durability at high altitudes. Previous mechanical unit injected engines (e.g., the 1980s Cummins L10, the Non-Electronic Control Detroit Diesel 6V92) were capable of reasonably high injection pressures, but they had fixed injection timing that only varied based on the hydraulic parameters of the fuel system. Many other engines with mechanical in-line or rotary injection pumps had only coarse injection timing control or fixed injection timing.
Precise electronic control of injection timing over differing operating conditions also allowed HD engine manufacturers to retard injection timing to obtain low NOx emissions during highly transient urban operation, similar to that found during emissions certification. HD engine manufacturers also advanced injection timing during less transient operation (such as freeway driving) for fuel consumption improvements (~3% to 5%) at the expense of greatly increased NOx emissions (approximately three to four times regulated levels). This particular situation resulted in the recent consent decree settlements between the Federal Government and most HD engine manufacturers to ensure effective NOx control in all driving conditions, including on-
2-49
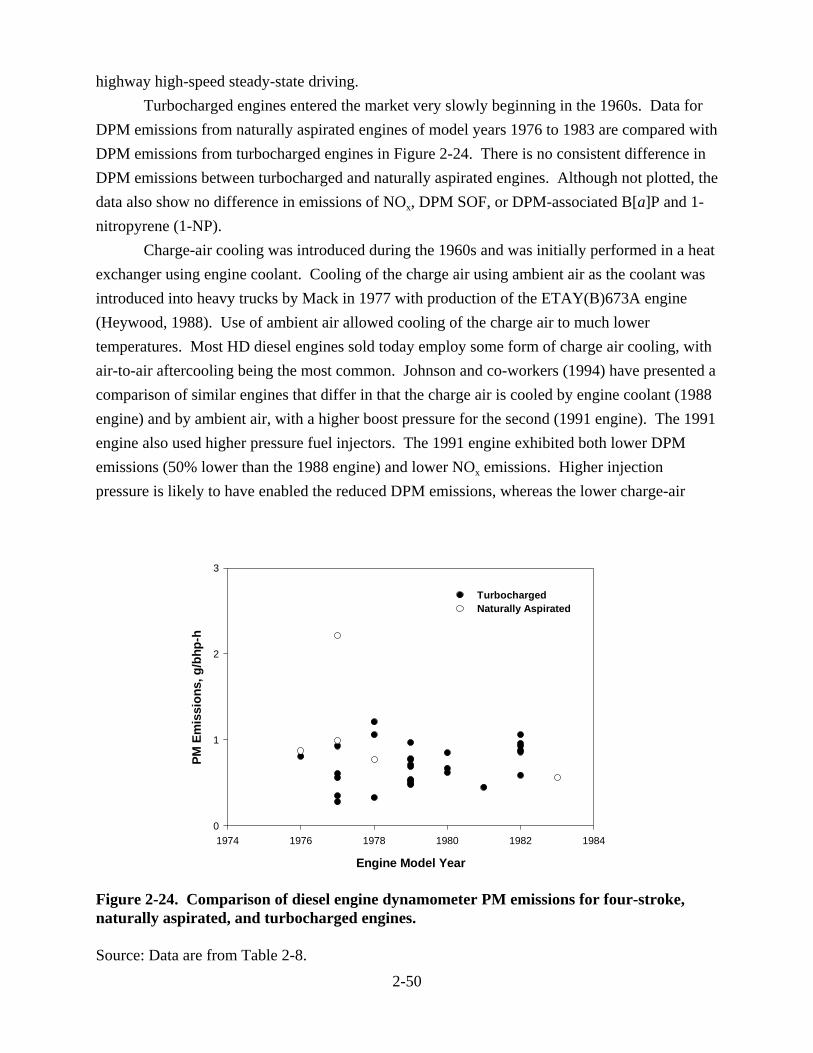
highway high-speed steady-state driving. Turbocharged engines entered the market very slowly beginning in the 1960s. Data for
DPM emissions from naturally aspirated engines of model years 1976 to 1983 are compared with DPM emissions from turbocharged engines in Figure 2-24. There is no consistent difference in DPM emissions between turbocharged and naturally aspirated engines. Although not plotted, the data also show no difference in emissions of NOx, DPM SOF, or DPM-associated B[a]P and 1-nitropyrene (1-NP).
Charge-air cooling was introduced during the 1960s and was initially performed in a heat exchanger using engine coolant. Cooling of the charge air using ambient air as the coolant was introduced into heavy trucks by Mack in 1977 with production of the ETAY(B)673A engine (Heywood, 1988). Use of ambient air allowed cooling of the charge air to much lower temperatures. Most HD diesel engines sold today employ some form of charge air cooling, with air-to-air aftercooling being the most common. Johnson and co-workers (1994) have presented a comparison of similar engines that differ in that the charge air is cooled by engine coolant (1988 engine) and by ambient air, with a higher boost pressure for the second (1991 engine). The 1991 engine also used higher pressure fuel injectors. The 1991 engine exhibited both lower DPM emissions (50% lower than the 1988 engine) and lower NOx emissions. Higher injection pressure is likely to have enabled the reduced DPM emissions, whereas the lower charge-air
3
2
1
0 1974 1976 1978 1980 1982 1984
Turbocharged Naturally Aspirated
Engine Model Year
Figure 2-24. Comparison of diesel engine dynamometer PM emissions for four-stroke, naturally aspirated, and turbocharged engines.
Source: Data are from Table 2-8.
PM E
mis
sion
s, g
/bhp
-h
2-50

temperature and the ability to electronically retard the injection timing under some conditions likely enabled the lower NOx emissions.
It is apparent on the basis of both the literature and certification data that turbochargers with aftercoolers can be used in HD engines in conjunction with other changes to produce a decrease in emissions. On the advent of a NOx standard in 1985, NOx was probably reduced on the order of 10% to 30% in turbocharged aftercooled engines with retarded injection timing. This decrease is not evident in the in-use chassis testing data because of deterioration and the use of illegal emissions devices as described above. Overall, it is expected that engines in the 1950s to mid-1970s timeframe would have similar DPM emission rates, whereas post-1970 engines would have somewhat lower DPM emission rates.
2.2.6.4. Two-Stroke and Four-Stroke High-Speed Diesel Engines A detailed discussion of the two- and four-stroke engine cycles can be found in the
literature (Heywood, 1988; Taylor, 1990; Stone, 1995). Nearly all high-speed two-stroke diesel engines utilize uniflow scavenging assisted by a positive-displacement blower (Figure 2-25). Uniflow-scavenged two-stroke diesels use poppet exhaust valves similar to those found in four-stroke engines. The intake air enters the cylinder through a pressurized port in the cylinder wall. A crankshaft-driven, positive-displacement blower (usually a roots-type) pressurizes the intake port to ensure proper scavenging. A turbocharger may be added to the system to provide additional boost upstream of the blower at higher speeds and to reduce the size and parasitic losses associated with the positive-displacement blower.
Two-stroke diesel engines can achieve efficiency comparable to four-stroke counterparts and have higher BMEP (torque per unit displacement) (Heywood, 1988). It is useful to note that two-stroke cycle fires each cylinder once every revolution, whereas the four-stroke cycle fires every other revolution. Thus, for a given engine size and weight, two-strokes can produce more power. However, two-stroke diesel engines are less durable than their four-stroke counterparts. Lubricating oil is transferred from the piston rings to the intake port, which causes relatively high oil consumption relative to four-stroke designs. Durability and low oil consumption are desirable for on-highway truck applications. This may be why four-stroke engines have been favored for these applications since the beginning of dieselization in the trucking industry, with the notable exception of urban bus applications. Although it is no longer in production, the Detroit Diesel 6V92 series of two-stroke diesel engines is still the most popular for urban bus applications, where the high power density allows the engine to be more easily packaged within limited spaces. The primary reason that two-stroke engines like the 6V92 are no longer offered for urban bus applications is excessive DPM emissions. The lubricating oil control with two-strokes tends to be lower than for four-stroke engines, and therefore, emissions have higher VOC
2-51

Figure 2-25. An example of uniflow scavenging of a two-stroke diesel engine with a positive displacement blower. Scavenging is the process of simultaneously emptying the cylinder of exhaust and refilling with fresh air.
Source: Adapted from Taylor, 1990.
and organic DPM emissions relative to four-stroke designs. This was particularly problematic for urban bus applications because urban bus engines must meet tighter Federal and California PM emissions standards. The current urban bus PM standard (0.05 g/bhp-hr) is one-half of the current on-highway HD diesel engine PM standard, although EPA is in the process of proposing more strict standards for HD diesel truck engines along with further reductions in diesel fuel sulfur levels. No two-stroke diesel engine designs have been certified to meet the most recent urban bus PM emissions standards, and Detroit Diesel Corporation has not certified a two-stroke diesel engine for on-highway truck use since 1995.
A comprehensive review of emissions from hundreds of vehicles (1976–98 model years) that had been tested on chassis dynamometers found that DPM emissions vary substantially within a given model year and that within that variation there are no discernible differences in DPM emissions between two- and four-stroke vehicles (Figure 2-26) (Yanowitz et al., 2000). DPM emission factors reported for engine tests also indicate that two- and four-stroke engines have comparable emission factors, as these engines all had to meet the same regulatory standard (Figure 2-27). In contrast to DPM emissions, evidence suggests that mid-1970s two-stroke engines exhibited very high SOF levels compared with four-stroke engines, with later model years showing similar SOF emissions for two- and four-stroke engines (Figure 2-28). For aldehydes, benzo[a]pyrene, and 1-nitropyrene, data are available for only one two-stroke engine,
2-52

5
4
3
2
1
0 1978 1980 1982 1984 1986 1988 1990 1992 1994 1996 1998
4-Stroke Engines 2-Stroke Engines
Engine Emissions Model Year
Figure 2-26. Comparison of two- and four-stroke vehicle diesel PM emissions from chassis dynamometer studies.
Source: Yanowitz et al., 2000.
but they indicate no significant difference in emissions from comparable model year four-stroke engines. Overall, regulated emissions changes attributable to changing proportions of two- and four-stroke engines in the in-use fleet do not appear to have influenced DPM emission levels, but the transition to four-stroke engines in the 1970s would have decreased the fraction of SOF associated with the DPM. It appears that the proportion of two-stroke engines in the in-use fleet was relatively constant until the late 1980s, when it began to decline.
2.2.7. Air Toxic Emissions HD diesel vehicle exhaust contains several substances that are known, likely, or possible
human or animal carcinogens, or that have serious noncancer health effects. These substances include, but are not limited to, benzene, formaldehyde, acetaldehyde, 1,3-butadiene, acrolein, dioxin, PAH, and nitro-PAH (the complete list of chemically characterized compounds present in DE is provided in Section 2.3.1). Very few historical data are available to examine changes in emission rates over time. In this section, trends in aldehyde emissions over time and a summary
PM E
mis
sion
, g/m
i
2-53

3
2
1
0 1975 1980 1985 1990 1995 2000
Engine Model Year
Figure 2-27. Comparison of two- and four-stroke engine diesel PM emissions from engine dynamometer studies.
1.00
0.75
0.50
0.25
0.00 1975 1980 1985 1990 1995 2000
4-Stroke 2-Stroke
Engine Model Year
Figure 2-28. Diesel engine dynamometer SOF emissions from two- and four-stroke engines. SOF obtained by dichloromethane extraction in most studies.
Source: Data are from Table 2-8.
SOF
Emis
sion
, g/b
hp-h
PM
Em
issi
on, g
/bhp
-h
4-Stroke 2-Stroke
2-54

of dioxin emission factors are presented. PAH and nitro-PAH emission factors are discussed in Section 2.2.8.2.
2.2.7.1. Aldehyde Emissions Among the gaseous components emitted by diesel engines, the aldehydes are particularly
important because they constitute an important fraction of the gaseous emissions and they are probable carcinogens that also produce noncancer health effects. Formaldehyde makes up the majority of the aldehyde emissions (65% to 80%), with acetaldehyde being the second most abundant aldehyde in HD diesel emissions. Total aldehyde emissions reported from chassis dynamometer testing suggest that aldehyde emissions have declined since 1980; however, only two tests reported aldehydes from engines made after 1985 (Figure 2-29). Engine dynamometer studies also suggest a downward trend in the emissions of aldehydes in the time period from 1976 to 1994 (Figure 2-30). Engine dynamometer studies report aldehyde emission levels of 150–300 mg/bhp-hr for late 1970s engines with no significant effect of turbocharging, or IDI versus DI. High-pressure fuel injection may have resulted in a marginal increase in aldehyde emissions (Springer, 1979). By comparison, 1991 model year engines (DI, turbocharged) exhibited aldehyde emissions in the 30–50 mg/bhp-hr range (Mitchell et al., 1994).
2.2.7.2. Dioxin and Furans Ballschmiter et al. (1986) reported detecting polychlorinated dibenzo-p-dioxins (CDDs)
and polychlorinated dibenzofurans (CDFs) in used motor oil and thus provided some of the first evidence that CDDs and CDFs might be emitted by the combustion process in diesel-fueled engines. Incomplete combustion and the presence of a chlorine source in the form of additives in the oil or the fuel were speculated to lead to the formation of CDDs and CDFs. Since 1986, several studies have been conducted to measure or estimate CDD/CDF concentrations in emissions from diesel-fueled vehicles. These studies can be characterized as direct measurements from the engine exhaust and indirect measurements from the sampling of air within transportation tunnels.
Table 2-11 is a summary of various CDD/CDF emission characterization studies reported in the United States and Europe for diesel-fueled cars and trucks. Hagenmaier et al. (1990) reported an emission factor for LD diesel vehicles of 24 pg TEQ per liter of diesel fuel consumed. TEQ, or the toxic equivalency factor, rates each dioxin and furan relative to that of 2,3,7,8-TCDD, which is arbitrarily assigned a TEQ of 1.0 based on animal assays. Schwind et al. (1991) and Hutzinger et al. (1992) studied emissions of CDDs/CDFs from German internal combustion engines running on commercial diesel fuels and reported a range of CDD/CDF emission rates across the test conditions (in units of pg TEQ per liter of diesel fuel consumed) of 10–130 pg TEQ/L for diesel car exhaust and 70–81 pg TEQ/L for diesel truck exhaust.
2-55

1000
800
600
400
200
0 1975 1980 1985 1990 1995 2000
Engine Model Year
4-stroke 2-stroke
Figure 2-29. Diesel engine aldehyde emissions measured in chassis dynamometer studies.
Source: Data are from Warner-Selph and Dietzmann, 1984; Schauer et al., 1999; Unnasch et al., 1993.
300
250
200
150
100
50
0 1976 1978 1980 1982 1984 1986 1988 1990 1992 1994 1996
4-stroke 2-stroke
Engine Model Year
Figure 2-30. Diesel engine aldehyde emissions from engine dynamometer studies.
Source: Data from Table 2-8.
Alde
hyde
Em
issi
on, m
g/bh
p-h
Alde
hyde
Em
issi
ons,
mg/
mile
2-56
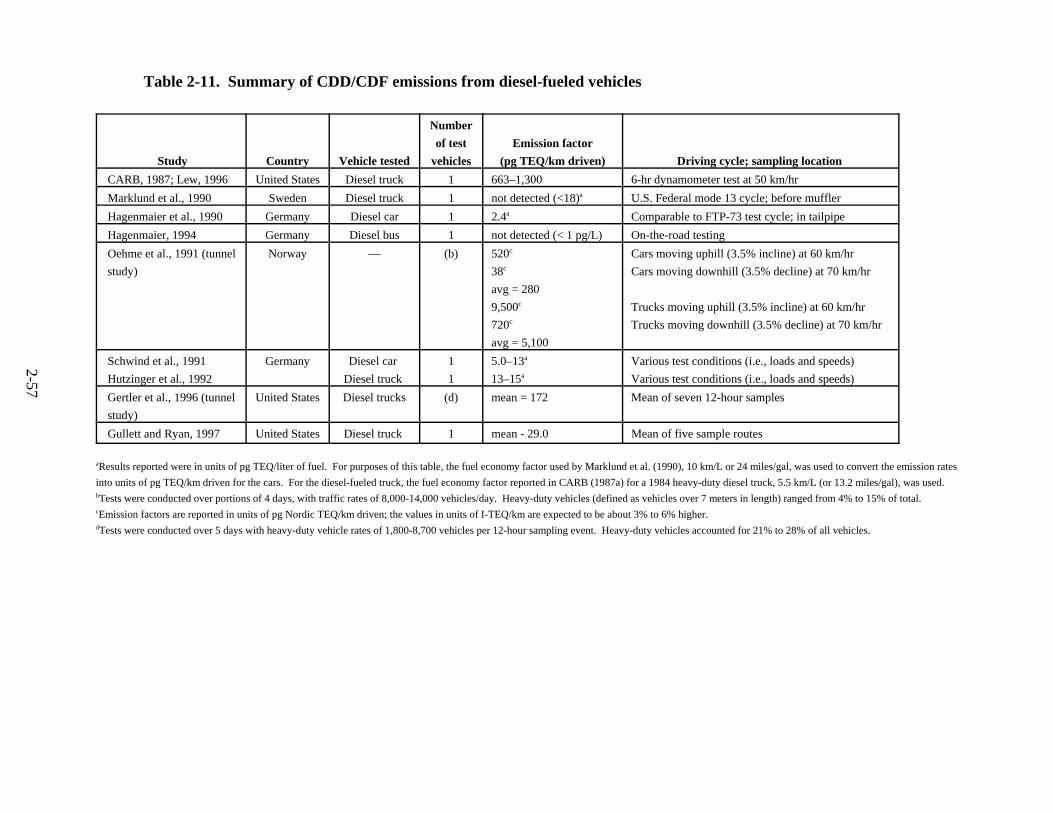
Table 2-11. Summary of CDD/CDF emissions from diesel-fueled vehicles
Study Country Vehicle tested
Number of test
vehicles Emission factor
(pg TEQ/km driven) Driving cycle; sampling location CARB, 1987; Lew, 1996 United States Diesel truck 1 663–1,300 6-hr dynamometer test at 50 km/hr Marklund et al., 1990 Sweden Diesel truck 1 not detected (<18)a U.S. Federal mode 13 cycle; before muffler Hagenmaier et al., 1990 Germany Diesel car 1 2.4a Comparable to FTP-73 test cycle; in tailpipe Hagenmaier, 1994 Germany Diesel bus 1 not detected (< 1 pg/L) On-the-road testing Oehme et al., 1991 (tunnel study)
Norway — (b) 520c
38c
avg = 280 9,500c
720c
avg = 5,100
Cars moving uphill (3.5% incline) at 60 km/hr Cars moving downhill (3.5% decline) at 70 km/hr
Trucks moving uphill (3.5% incline) at 60 km/hr Trucks moving downhill (3.5% decline) at 70 km/hr
Schwind et al., 1991 Hutzinger et al., 1992
Germany Diesel car Diesel truck
1 1
5.0–13a
13–15a
Various test conditions (i.e., loads and speeds) Various test conditions (i.e., loads and speeds)
Gertler et al., 1996 (tunnel study)
United States Diesel trucks (d) mean = 172 Mean of seven 12-hour samples
Gullett and Ryan, 1997 United States Diesel truck 1 mean - 29.0 Mean of five sample routes
2-57
aResults reported were in units of pg TEQ/liter of fuel. For purposes of this table, the fuel economy factor used by Marklund et al. (1990), 10 km/L or 24 miles/gal, was used to convert the emission rates
into units of pg TEQ/km driven for the cars. For the diesel-fueled truck, the fuel economy factor reported in CARB (1987a) for a 1984 heavy-duty diesel truck, 5.5 km/L (or 13.2 miles/gal), was used.bTests were conducted over portions of 4 days, with traffic rates of 8,000-14,000 vehicles/day. Heavy-duty vehicles (defined as vehicles over 7 meters in length) ranged from 4% to 15% of total.cEmission factors are reported in units of pg Nordic TEQ/km driven; the values in units of I-TEQ/km are expected to be about 3% to 6% higher.dTests were conducted over 5 days with heavy-duty vehicle rates of 1,800-8,700 vehicles per 12-hour sampling event. Heavy-duty vehicles accounted for 21% to 28% of all vehicles.

In 1994, Hagenmaier reported CDD/CDF emissions from a diesel-fueled bus and found no detectable levels in the exhaust (at a detection limit of 1 pg/L of fuel consumed) for individual congeners. In 1987, the California Air Resources Board (CARB) produced a draft report of a HD engine tested under steady-state conditions indicating a TEQ emission factor of 7,290 pg/L of fuel burned (or 1,300 pg/km driven) if nondetected values are treated as one-half the detection limit. Treating nondetected values as zeros yields a TEQ concentration equivalent to 3,720 pg/L of fuel burned (or 663 pg/km driven) (Lew, 1996). Norbeck et al. (1998c) reported emission factors for dioxin and furans from a Cummins L10 HD diesel engine running on pre-1993 fuel of 0.61 pg/L and 0.41 pg/L for the same engine running on reformulated fuel. The low emission factors reported by Norbeck et al. (1998c) were attributed to losses of dioxin and furan compounds to the dilution tunnel walls.
EPA has directly sampled the exhaust from a HD diesel truck for the presence and occurrence of CDDs/CDFs (Gullett and Ryan, 1997). The average of five tests (on highway and city street driving conditions) was 29.0 pg TEQ/km with a standard deviation of 38.3 pg TEQ/km; this standard deviation reflects the 30-fold variation in the two city driving route tests.
Tunnel studies are an indirect means of measuring contaminants that may be associated with emissions from cars and trucks. In these studies, scrapings of carbonaceous matter from the interior walls of the transportation tunnel or the tunnel air are sampled and analyzed for the target contaminants. Several European studies and one recent U.S. study evaluated CDD/CDF emissions from vehicles by measuring the presence of CDDs/CDFs in tunnel air. This approach has the advantage of allowing random sampling of large numbers of vehicles passing through the tunnel, including a range of ages and maintenance levels. The disadvantage of this approach is that it relies on indirect measurements (rather than tailpipe measurements), which may introduce unknown uncertainties into the interpretation of results.
Oehme et al. (1991) reported the emission rates associated with HD diesel trucks as follows: uphill = 9,500 pg TEQ/km; downhill = 720 pg TEQ/km; mean = 5,100 pg TEQ/km. The mean values are the averages of the emission rates corresponding to the two operating modes: vehicles moving uphill on a 3.5% incline at an average speed of 37 mi/hr and vehicles moving downhill on a 3.5% decline at an average speed of 42 mi/hr.
Wevers et al. (1992) measured the CDD/CDF content of air samples taken during the winter of 1991 inside a tunnel in Antwerp, Belgium. The results obtained indicated that the tunnel air had a dioxin TEQ concentration about twice as high as the outside air (80.3 fg TEQ/m3
for tunnel air vs. 35 fg TEQ/m3 for outside air for one set of measurements and 100 fg TEQ/m3
for tunnel air vs. 58 fg TEQ/m3 for outside air for a second set of measurements).
2-58

During October/November 1995, Gertler et al. (1996, 1998) measured CDDs/CDFs in the Fort McHenry Tunnel in Baltimore, Maryland. The emission factors calculated, assuming that all CDDs/CDFs emitted in the tunnel were from HD vehicles, are presented in Table 2-12. The average TEQ emission factor was reported to be 172 pg TEQ/km. The major uncertainties in the study were tunnel air volume measurement, sampler flow volume control, and analytical measurement of CDDs/CDFs (Gertler et al., 1996, 1998).
The relative strengths of the Gertler et al. (1996; 1998) study include: (1) The study is a recent study conducted in the United States and thus reflects current U.S. fuels and technology; (2) virtually no vehicle using the tunnel used leaded gasoline, which is associated with past emissions of CDDs and CDFs from gasoline-powered vehicles; (3) the tunnel walls and streets were cleaned 1 week before the start of sampling, and in addition, the study analyzed road dust and determined that resuspended road dust contributed only about 4% of the estimated emission factors; and (4) HD vehicles made up, on average 25.7% of vehicles using the tunnel.
Using the emissions factor from the Gertler et al. studies, the EPA Office of Research and Development’s dioxin source emission inventory estimates that 33.5 g of dioxin TEQ (total 2,3,7,8-TCDD equivalents) were emitted from HD U.S. trucks in 1995. This is a very small contribution (1.2%) compared with the national annual emission of 2,800 g CDDs/CDFs.
2.2.8. Physical and Chemical Composition of Diesel Exhaust Particles DPM is defined by the measurement procedures summarized in Title 40 CFR, Part 86,
subpart N. This definition and the basic characteristics of DPM have been summarized in Section 2.2.2. As described there, DE particles are aggregates of primary spherical particles that consist of solid carbonaceous material and ash and contain adsorbed organic and sulfur compounds (sulfate) combined with other condensed material. The organic material includes unburned fuel, engine lubrication oil, and low levels of partial combustion and pyrolysis products.
The organic material is absorbed to the EC core and is also found in heterogeneously nucleated aerosol. This fraction of the DPM is frequently quantified as the SOF (i.e., the fraction that can be extracted by an organic solvent). Because of the toxicological significance of the organic components associated with DPM, it is important to understand, to the extent possible, the historical changes in the composition of SOF and potential changes in the fraction of SOF associated with DPM.
Various researchers have attempted to apportion the SOF to unburned oil and fuel sources by thermogravimetric analysis and have found that the results vary with test cycle and engine (Abbass et al., 1991; Wachter, 1990). Kittelson (1998) estimates that a typical composition of SOF is about one-fourth unburned fuel and three-fourths unburned
2-59

Table 2-12. Baltimore Harbor Tunnel Study: estimated CDD/CDF emission factors for HD vehicles
Congener/congener group
Run-specific emission factors Mean
emission factors (pg/km)
Run no. 2 (pg/km)
Run no. 3 (pg/km)
Run no. 5 (pg/km)
Run no. 6 (pg/km)
Run no. 8 (pg/km)
Run no. 9 (pg/km)
Run no. 10 (pg/km)
2,3,7,8-TCDD 1,2,3,7,8-PeCDD 1,2,3,4,7,8-HxCDD 1,2,3,6,7,8-HxCDD 1,2,3,7,8,9-HxCDD 1,2,3,4,6,7,8-HpCDD OCDD
24.5 40.2 18.2 37.5 53.6
0 0
61.6 20.6 25.2 28.2 56.5 401
3,361
0.0 15.4 46.5 64.3 91.6 729
3,382
21.2 5.6 8.3
19.6 48.4 111
1,120
37.8 38.4 64.5 153 280
2,438 9,730
40.1 0.0 0.0
71.1 126 963
5,829
54.9 83.0 123 186 370
2,080 7,620
34.3 29.0 40.8 80.0 147 960
4,435 2,3,7,8-TCDF 1,2,3,7,8-PeCDF 2,3,4,7,8-PeCDF 1,2,3,4,7,8-HxCDF 1,2,3,6,7,8-HxCDF 1,2,3,7,8,9-HxCDF 2,3,4,6,7,8-HxCDF 1,2,3,4,6,7,8-HpCDF 1,2,3,4,7,8,9-HpCDF OCDF
0 0
24.5 15.4 0.3
27.7 15.2 12.6
0 0
94.3 48.9 75.7 139
75.1 14.8 82.5 280
58.5 239
67.6 72.6 131 204
73.7 75.6 152 445
60.8 401
152.8 23.6 46.6 93.8 51.0
0 55.7 154
31.1 175
155.8 53.3 85.0 124
61.3 20.6 93.0 313
25.0 416
73.4 0.0
63.9 164
54.4 37.2 86.8 354 2.3 534
61.7 43.3 108 166
95.5 63.5 111 308
34.9 370
86.5 34.5 76.4 129
58.8 34.2 85.2 267
30.4 305
Total 2,3,7,8-CDD Total 2,3,7,8-CDF Total TEQ
174 95.7 73.8
3,954 1,108
175
4,328 1,684
170
1,335 784 96
12,743 1,347
235
7,028 1,371
153
10,515 1,362
303
5,725 1,107
172 Total TCDD Total PeCDD Total HxCDD Total HpCDD Total OCDD Total TCDF Total PeCDF Total HxCDF Total HpCDF Total OCDF Total CDD/CDF
245 110 677
0 0 0
124 136
0 0
1,291
0 21.9
0 802
3361 901 119 319 223 239
5,987
140 83.3 753
1,498 3,382 1,314 1,152
852 814 401
10,390
165 35.6 54.5 142
1,120 656
78.4 67.6 144 175
2,638
311 174
2,009 5,696 9,730 2,416 1,055
444 513 416
22,766
109 0.0
1,666 1,933 5,829 1,007
282 719 354 534
12,434
97.3 165
2,971 4,377 7,620
687 626 619 637 370
18,168
152 84.2
1,162 2,064 4,435
997 491 451 384 305
10,525 HD vehicles as % of total vehicles
21.2 22.0 22.6 34.0 28.8 24.2 27.4 25.7
2-60
Notes:(1) Listed values are based on the difference between the calculated chemical mass entering the tunnel and the mass exiting the tunnel.(2) All calculated negative emission factors were set equal to zero.(3) All CDD/CDF emissions were assumed to result from heavy-duty diesel-fueled vehicles. The table presents in the last row the percent of total traffic that was heavy-duty vehicles.Source: Gertler et al., 1996.

engine oil. Partial combustion and pyrolysis products represented a very small fractionof the SOF on a mass combustion and pyrolysis products represented a very small fraction of the SOF on a mass basis (Kittelson, 1998), which is confirmed in numerous other studies.
A number of investigators have tried to separate the organic fraction into various classes of compounds. Schuetzle (1983) analyzed the dichloromethane extract of DPM from a LD diesel engine and found that approximately 57% of the extracted organic mass is contained in the nonpolar fraction. About 90% of this fraction consists of aliphatic HCs from approximately C14
to about C40 (Black and High, 1979; Pierson and Brachaczek, 1983). PAHs and alkyl-substituted PAHs account for the remainder of the nonpolar mass. The moderately polar fraction (~9% w/w of extract) consists mainly of oxygenated PAH species, substituted benzaldehydes, and nitrated PAH. The polar fraction (~32% w/w of extract) is composed mainly of n-alkanoic acids, carboxylic and dicarboxylic acids of PAH, hydroxy-PAH, hydroxynitro-PAH, and nitrated N-containing heterocyclic compounds (Schuetzle, 1983; Schuetzle et al., 1985).
Rogge et al. (1993) reported the composition of the extractable portion of fine DPM emitted from two HD diesel trucks (1987 model year). The DPM filters were extracted twice with hexane, then three times with a benzene/2-propanol mixture. The extract was analyzed by capillary gas chromatography/mass spectrometry (GC/MS) before and after derivatization to convert organic acids and other compounds having an active H atom to their methoxylated analogues. Unidentified organic compounds made up 90% of the eluted organic mass and were shown to be mainly branched and cyclic HCs. From the mass fraction that was resolved as discrete peaks by GC/MS, ~42% were identified as specific organic compounds. Most of the identified resolved organic mass (~60%) consisted of n-alkanes, followed by n-alkanoic acids (~20%). PAH accounted for ~3.5% and oxy-PAH (ketones and quinones) for another ~3.3%.
The distribution of the emissions between the gaseous and particulate phases is determined by the vapor pressure of the individual species, by the amount and type of the DPM present (adsorption surface available), and by the temperature (Ligocki and Pankow, 1989). Two-ring and smaller compounds (e.g., naphthalene) exist primarily in the gas phase, whereas five-ring and larger compounds (e.g., benzo[a]pyrene) are almost completely adsorbed on the particles. Three- and four-ring compounds are distributed between the two phases. The vapor pressures of these intermediate PAHs can be significantly reduced by their adsorption on various surfaces. Because of this phenomenon, the amount and type of DPM present play an important role, together with temperature, in the vapor-particle partitioning of semivolatile organic compounds (SOCs).
The measurements of gas/particulate phase distribution are often accomplished by using a high-volume filter followed by an adsorbent such as polyurethane foam (PUF), Tenax, or XAD-2 (Cautreels and Van Cauwenberghe, 1978; Thrane and Mikalsen, 1981; Yamasaki et al., 1982).
2-61

The pressure drop behind a high-volume filter or cascade impactor can contribute to volatilization of the three- to five-ring PAHs from the PM proportional to their vapor pressures. The magnitude of this blow-off artifact depends on a number of factors, including sampling temperature and the volume of air sampled (Van Vaeck et al., 1984; Coutant et al., 1988). Despite these problems from volatilization, measurements with the high-volume filters followed by a solid adsorbent have provided most estimates of vapor-particle partitioning of SOCs in ambient air, as well as insights into the factors influencing SOC adsorption onto aerosols. Significant fractions of phenanthrene, anthracene, and their alkylated derivatives, along with fluoranthene and pyrene, exist in the gas phase. PAHs with molecular weight greater than that of pyrene are typically not observed on PUF samples. During the collection of particulate organic compounds, adsorption of semivolatile PAHs can also occur, as well as chemical transformation of the semivolatile compounds (Schauer et al., 1999; Cantrell et al., 1988; Feilberg et al., 1999; Cautreels and Van Cauwenberghe, 1978).
Most of the sulfur in the fuel is oxidized to SO2, but a small amount (1% to 4%) is oxidized to sulfuric acid in the exhaust. Sulfate emissions are roughly proportional to sulfur in the fuel. Since the reduction of the allowable sulfur content in diesel fuel in 1993, sulfate emissions have declined from roughly 10% of the DPM mass to around 1%. Particulate emissions from numerous vehicles tested using low-sulfur fuel were found to have a sulfate content of only about 1% (Yanowitz et al., 1999). Water content is on the order of 1.3 times the amount of sulfate (Wall et al., 1987).
Metal compounds and other elements in the fuel and engine lubrication oil are exhausted as ash. Hare (1977) examined 1976 Caterpillar 3208 and Detroit Diesel Corporation 6V-71 engines and found the most abundant elements emitted from the 6V-71 engine were silicon, copper, calcium, zinc, and phosphorus. From the Caterpillar engine the most abundant elements were lead, chlorine, manganese, chromium, zinc, and calcium. Calcium, phosphorus, and zinc were present in the engine lubrication oil. The two-stroke 6V-71 engine had higher engine lubrication oil emissions and therefore emitted higher levels of zinc, calcium, and phosphorus than the Caterpillar 3208 engine. Other elements may have been products of engine wear or contaminants from the exhaust system. Springer (1979), in his study of 1977 Mack ETAY(B)673A and Caterpillar 3208 (EGR) engines, found that calcium was the most abundant metallic element in DPM samples, with levels ranging from 0.01 to 0.29 wt% of the DPM. Phosphorus and silica were the next most abundant elements reported, and sodium, iron, nickel, barium, chromium, and copper were either present at very low levels or were below detection limits. Roughly 1 wt% of the total DPM was represented by the analyzed metals. There was no consistent difference in metal emissions between the engines tested by Springer or between modes. Springer tested both engines on a 13-mode steady-state test. Dietzmann and co-workers
2-62

(1980) examined metal emission rates from four HD vehicles tested using the UDDS chassis cycle. For the single two-stroke engine tested (1977 Detroit Diesel Corporation 8V-71), calcium, phosphorus, and zinc emission rates were more than 10 times higher than metal levels observed for three 1979 model year four-stroke engines because of higher engine lubrication oil emissions. Metals accounted for 0.5% to 5% of total DPM, depending on engine model. In addition to these studies, other source profiles for HD diesel engine emissions report levels of chromium, manganese, mercury compounds, and nickel at levels above the detection limit (Cooper et al., 1987).
In more recent studies, Hildemann and co-workers (1991) examined metals in DPM from the same two 1987 trucks (four-stroke engines) studied by Rogge and co-workers (1993). Aluminum, silicon, potassium, and titanium were the only metals observed at statistically significant levels. Taken together these made up less than 0.75 wt% of total DPM mass. Lowenthal and co-workers (1994) also report metals emission rates for a composite sample of several diesel vehicles. The most abundant metals were zinc, iron, calcium, phosphorus, barium, and lanthanum. Together these represented less than 0.3% of total DPM mass, with an emissions rate of 3.3 mg/mi. Norbeck and co-workers (1998b) report engine transient test emissions of metals for a 1991 Cummins L10 engine. Silicon, iron, zinc, calcium, and phosphorus were observed and together made up about 0.5% of total DPM, with an emissions rate of 1.2 mg/bhphr.
2.2.8.1. Organic and EC Content of Particles 2.2.8.1.1. Measurement of the organic and EC fraction. Various methods have been used to quantify the organic fraction of DPM. The most common method has been Soxhlet extraction with an organic solvent. Following extraction, the solvent can be evaporated and the mass of extracted material (the SOF) determined, or alternatively the PM filter is weighed before and after extraction and the extracted material can be further analyzed to determine concentrations of individual organic compounds. Vacuum oven sublimation is used to measure a comparable quantity, the volatile organic fraction (VOF), which can be further speciated by GC with a flame ionization detector. Other methods have also been employed, including thermal methods, microwave extraction, sonication with an organic solvent, supercritical fluid extraction, thermogravimetric analysis, and thermal desorption GC. Abbass et al. (1991) compared various methods, including vacuum oven sublimation and 8 hours of Soxhlet extraction, with 4:1 benzene/methanol solvent for determination of SOF and found reasonably good agreement between the two methods. The VOF value was typically 10% higher; however, this variation was less than the coefficient of variation between measurements using the same method.
2-63

Levson (1988) reviewed literature regarding the extraction efficiency of various solvents and found contradictory results in many cases. He concluded that there is strong evidence that the most commonly used solvent, dichloromethane, leads to poor recoveries of higher molecular weight PAH. More recently, Lucas et al. (1999) reported the effect of varying dichloromethane/benzene ratios in the solvent (from 25% to 100% dichloromethane) and changing extraction times and found that the most effective extraction (i.e., the largest extracted mass) utilized a 70% dichloromethane/30% benzene mixture and extraction times several times longer than the commonly used 8-hour extraction period. Extractions of 70 hours using pure dichloromethane were found to result in about twice as much SOF as extractions of only 12 hours. Between 6 and 24 hours of extraction time (the typical range of extraction times used), the SOF recovered increased by about one-third. Using the most effective extraction conditions (Soxhlet, 70 hours, 70:30 dichloromethane:benzene ratio), Lucas et al. (1999) were able to extract more than 90% of the total particulate mass.
Other researchers have investigated the relative quantities of mass removed by sequential extraction by polar, moderately polar, and nonpolar solvents. The extracted nonpolar fraction (cyclohexane) ranged from 56% to 90% of the SOF, the moderately polar (dichloromethane) from 6% to 22%, and the polar fraction (acetonitrile) from 4% to 29% (Dietzmann et al., 1980). Water and sulfate are not soluble in cyclohexane or dichloromethane but are soluble in acetonitrile.
Although the reports on the extraction efficiencies for PAHs are in part contradictory, it appears that Soxhlet extraction and the binary solvent system composed of aromatic solvent and alcohol yield the best recovery of PAHs, as determined by C-B[a]P14 (benzo[a]pyrene) spiking experiments (Schuetzle and Perez, 1983). Limited recovery studies have shown that there is little degradation or loss of diesel POM on the HPLC column. More than 90% of the mass and 70% to 100% of the Ames S. typhimurium-active material injected onto the column has been recovered (Schuetzle et al., 1985).
Two thermal methods of organic and EC analysis include thermal optical reflectance (TOR) and thermal optical transmittance (TOT). The extractable portion of total carbon, although commonly used as a measure of organic compound content, is not equivalent to the OC fraction as measured by TOR or TOT. In addition, methodological differences between TOR and TOT also give rise to significant differences in the fraction of total carbon reported as organic and EC (Birch, 1998; Norris et al., 2000; Chow et al., 2000). Although total carbon reported using TOR or TOT provides results that are comparable (within 10%) (Norris et al., 2000) the EC content of samples analyzed by TOR is higher than that measured by TOT. This difference is primarily attributed to the temperature used to evolve carbon from the quartz filter onto which it is collected. In an analysis of urban PM2.5 samples, Norris et al. (2000) found that
2-64
the EC content of samples analyzed by TOR was a factor of two higher than the EC content of the same samples analyzed by TOT. Experiments are ongoing to test specific source materials (including DPM) because some of the difference between methods appears to depend on the type of OC present on the sample.
The analytical technique used to measure OC and EC can have a significant effect on the quantity of reported. In the discussion that follows, every effort has been made to compare only studies using comparable methods and to state the analysis method employed.
2.2.8.1.2. Trends in SOF emissions. SOF emission values are highly dependent on the test cycle used. Various studies have shown that SOF generally increases at light engine loads and high engine speeds because these conditions lead to low exhaust temperatures, where fuel and oil are not as effectively oxidized (Scholl et al., 1982; Kittelson, 1998; Springer, 1979; Schuetzle and Perez, 1983; Martin, 1981b; Shi et al., 2000). These conditions are more typically observed in LD diesel vehicle applications, and thus DPM from these vehicles typically has a higher SOF component than HD diesel vehicles (Norbeck et al., 1998c). Acceleration modes normally cause increased emission of EC and an increase in total DPM emissions, whereas organic components are more dominant when motoring (Wachter, 1990). Additionally, cold-start test emissions of SOF have been shown to be approximately 25% higher than hot-start emissions (Wachter, 1990).
The quantity of sulfur in diesel fuel has been suggested to have a role in the quantity of SOF emitted (Sienicki et al., 1990; Tanaka et al., 1998). Sienicki et al. (1990) reported an approximate 25% increase in SOF when sulfur concentrations are increased from 0.08% to 0.33%. The cause is unclear but several explanations have been put forth, including increased absorption of organic compounds from the vapor phase onto the DPM by sulfates or sorbed sulfuric acid. Alternatively, it has been proposed that the measured SOF may include some sulfate, so that the apparent increase in organic material is due instead to sulfate. Other fuel effects include an increase in SOF emissions with a higher T90 (or T95) and with an increase in aromatic content (Barry et al., 1985; Sienicki et al., 1990; Tanaka et al., 1998; Rantanen et al., 1993).
Figures 2-31 and 2-32 show SOF emissions as a function of year for transient emissions tests on chassis and engines, respectively. Both figures suggest a significant decline in SOF emissions of approximately a factor of 5 since about 1980. The highest SOF emissions are for two-stroke engines built in the 1970s (up to approximately 1.2 g/mi). These data indicate that SOF emission factors for newer model year vehicles are lower than SOF emission factors for pre-1990 model year vehicles and that this decrease is similar to that observed for emissions of total DPM by model year. In a recent test of six pre-1976 HDDVs, Fritz et al. (2001) reported
2-65

1.4
1.2
1.0
0.8
0.6
0.4
0.2
0.0 1975 1980 1985 1990 1995 2000
Warner-Selph et al., 1984 Dietzmann et al., 1980 Graboski et al., 1998 Rogge et al., 1993
Engine Model Year
Figure 2-31. Trend in SOF emissions based on chassis dynamometer testing of HD diesel vehicles. Warner-Selph and co-workers: dichloromethane for 8 hours. Dietzman and coworkers: hexane followed by dichloromethane, extraction times not reported. Graboski and co-workers: VOF by vacuum sublimation at 225B C for 2.5 to 3 hours. Rogge and coworkers: cyclohexane followed by a benzene/2-propanol mixture that may extract significantly more organic matter.
0.8
0.6
0.4
0.2
0.0 1976 1978 1980 1982 1984 1986 1988 1990 1992 1994 1996
Ullman et al., 1984 McCarthy et al., 1992 Perez and Williams, 1989 Needham et al., 1989 Graboski, 1998 Spreen et al., 1995 Sienicki et al., 1990 Martin, 1981 Mitchell et al., 1994 Barry et al., 1985
Engine Model Year
SOF
(g/b
hp-h
) SO
F or
VO
F (g
/mi)
Figure 2-32. Trend in SOF emissions for transient engine dynamometer testing of HD diesel engines. Various extraction methods used; see Table 2-8.
2-66

the volatile organic fraction (VOF) ranged from 0.4 g/mi to 4.5 g/mi. These data highlight the wide range in emission rates for of OC, as have been observed for total PM.
Steady-state testing conducted on late-1970s engines reported SOF at levels between 0.1 and 0.9 g/bhp-hr, whereas engines from the late 1980s and 1990s all emitted 0.03 g/bhp-hr or less (Table 2-8). Hori and Narusawa (1998) measured emissions from engines produced two decades apart, using identical analytical procedures, and found that SOF emission factors and the percentage contribution of SOF to DPM were lower in the new engine compared with the old engine, under all tested engine load and speed conditions and with different fuels. The authors reported that the decrease in SOF was due to lower emissions of both lubricating oil and unburned fuel. To meet the 1991 and 1994 U.S. emission standards, SOF emission rates would need to be reduced from the levels of the previous decade, although one may expect differences in SOF fractions of DPM with transient cycles used to determine compliance with emission standards verus steady-state conditions used in earlier test programs (Kawatani et al., 1993; Wachter, 1990). Finally, in the past three decades, for economic reasons engine manufacturers have made efforts to reduce oil consumption and increase the fuel efficiency of diesel engines, both of which would be expected to reduce SOF emissions. Problems in achieving SOF reductions from two-stroke engines were one factor leading to the phaseout of these engines for on-road use during the 1990s. No data are available prior to 1976 on SOF emissions from HD diesel vehicles. The engine technology changes that occurred between the mid-1950s and mid-1970s (high-pressure direct injection and turbocharging, primarily) might be expected to increase the efficiency of combustion and thereby reduce fuel-related SOF. SOF emissions levels in the mid- to late 1970s may be used as a conservative (low) estimate of SOF emissions during the preceding two decades.
The fraction of DPM attributed to SOF from chassis dynamometer studies also shows a decreasing trend over time, from SOFs that ranged up to approximately 50% in the 1980s to 20% SOF or less in the 1990s (Figure 2-33). The recent study by Fritz et al. (2001) reported the fraction of DPM attributed to VOF from 10% to 60% for HDDVs of model years 1951-1974. The wide range in SOF as a percent of DPM displayed in Figure 2-33 is suspected to result from factors such as engine deterioration and test cycle. The vehicle emissions data reported in Figure 2-33 do not overrepresent buses that are likely to emit DPM with a greater fraction of SOF than other vehicles. Figure 2-34 presents SOF as a fraction of DPM from the same engine dynamometer studies reported in Figure 2-32. These data do not reflect a downward trend in SOF as a fraction of DPM. Because similar extraction methods were used in reports of the SOF in both the chassis and engine dynamometer studies, this does not appear to be a source of the wide variability observed in the fraction of SOF reported. In some of the engine studies, improved air:fuel ratio control was tested in an attempt to lower carbonaceous DPM formation.
2-67

100
80
60
40
20
0 1975 1980 1985 1990 1995 2000
Warner-Selph, 1984 Dietzmann, et al., 1980 Graboski, et al., 1998 Rogge, et al., 1993
Engine Model Year
Figure 2-33. Trend in SOF emissions as a percent of total PM based on chassis dynamometer testing of HD diesel vehicles. Warner-Selph and co-workers: dichloromethane for 8 hours. Dietzman and co-workers: hexane followed by dichloromethane, extraction times not reported. Graboski and co-workers: VOF by vacuum sublimation at 225B C for 2.5 to 3 hours. Rogge and co-workers: cyclohexane followed by a benzene/2-propanol mixture that may extract significantly more organic matter.
100
80
60
40
20
0 1976 1978 1980 1982 1984 1986 1988 1990 1992 1994 1996
Engine Model Year
SOF,
% o
f Tot
al P
M
SOF,
% o
f Tot
al P
M
Figure 2-34. Trend in SOF emissions as a percentage of total PM from engine dynamometer testing. Data are from Table 2-8. (See Figure 2-32 for figure key.)
2-68

Therefore, substantial differences in SOF as a percent of total DPM could be the result of different engine technology or test conditions. The engine dynamometer results presented in Figures 2-32 and 2-34 are from new, or relatively new, engines, that is, engines with no deterioration, whereas the older engines tested on a chassis dynamometer may have experienced significant deterioration that would increase SOF emissions as a percent of DPM. One of the main differences suspected for the lack of a decreasing trend in the percent of SOF in the engine dynamometer studies is the test cycle used. The engine dynamometer tests typically include test modes, such as high speed and low load, or low-speed lugging modes, that produce much higher SOF relative to DPM than the driving cycles used on the chassis tests.
It appears that as a fraction of total DPM, SOF from new model year HD diesel vehicles is lower than that from older (pre-1990) HD diesel vehicles. However, as with total DPM emissions, a wide range in the fraction of SOF can be observed under different driving conditions and from vehicles with extensive engine wear. In general, DPM emissions have a lower fraction of organic matter compared to gasoline PM (Table 2-13). Recent testing of HD engines at the Desert Research Institute suggests that the OC fraction of DPM is approximately 19%, whereas earlier studies reported in the U.S. EPA SPECIATE database suggest a slightly higher organic fraction of DPM from HD diesel vehicles, ranging from 21% to 36%. The SPECIATE database represents older vehicles that, as discussed above, tend to have higher SOF emissions. The OC emissions from LD diesel vehicles recently reported by Norbeck et al. (1998c) and those reported by the U.S. EPA SPECIATE suggest that LD diesel vehicles emit DPM with a slightly higher organic content than that from HD diesel vehicles, ranging from 22% to 43%. Gasoline engine PM emissions have recently been analyzed at the Desert Research Institute by Fujita et al. (1998) and Watson et al. (1998) for hot stabilized, visibly smoking vehicles, and cold-starts. These data all indicate that LD gas vehicles emit PM with a higher fraction of organic matter than diesel vehicles, with the highest organic content measured from smoking and high-emitting gasoline vehicles (averaging 76% OC). One new finding from the data reported by Fujita et al. (1998) is the roughly equivalent emission of organic and EC from cold-start emissions of gasoline vehicles. Additional information is needed to characterize a range of OC for DPM from smoking and high-emitting diesel vehicles as well as cold-start HD diesel vehicles.
2.2.8.1.3. Trends in EC content. Because EC is a major component of the chemical source profile of DE, it is commonly used to determine the contribution of diesel vehicles to ambient PM samples (i.e., in source apportionment via chemical mass balance modeling). EC is not, strictly speaking, a regulated pollutant, and so EC emissions are not routinely measured in tests of diesel vehicles and engines. The scant data available on measured EC emissions from HD
2-69
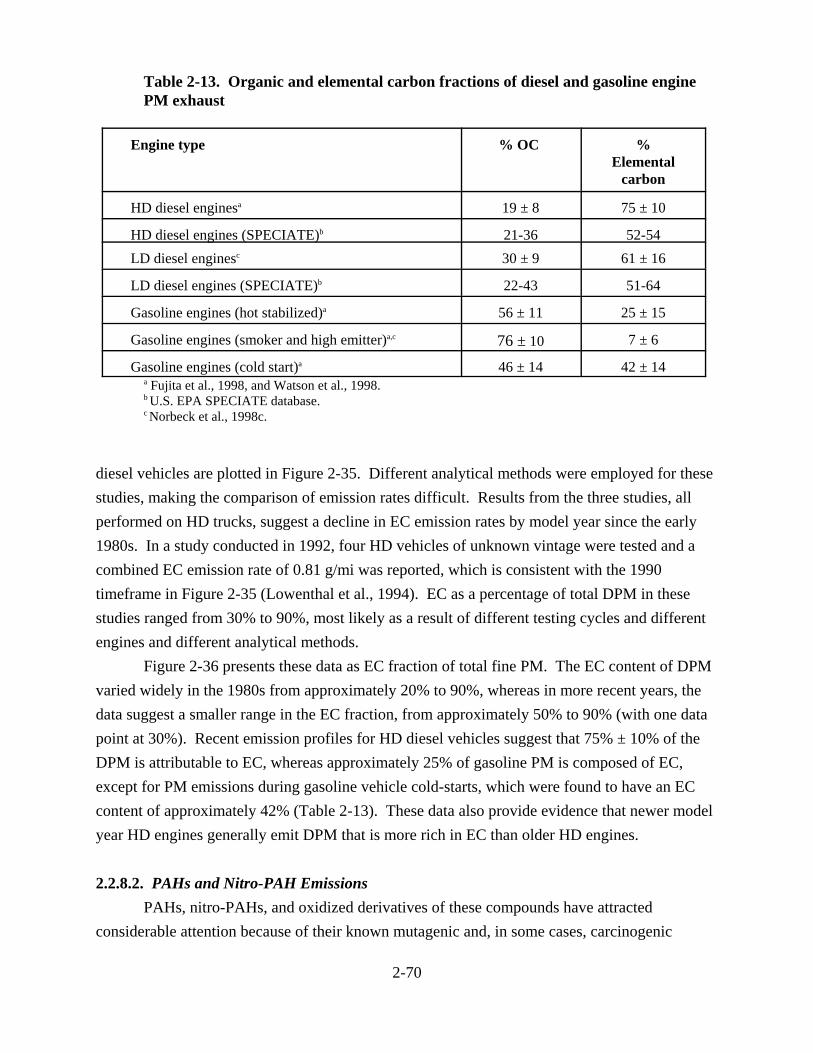
Table 2-13. Organic and elemental carbon fractions of diesel and gasoline engine PM exhaust
Engine type % OC % Elemental
carbon
HD diesel enginesa 19 ± 8 75 ± 10
HD diesel engines (SPECIATE)b 21-36 52-54 LD diesel enginesc 30 ± 9 61 ± 16
LD diesel engines (SPECIATE)b 22-43 51-64
Gasoline engines (hot stabilized)a 56 ± 11 25 ± 15
Gasoline engines (smoker and high emitter)a,c 76 ± 10 7 ± 6
Gasoline engines (cold start)a 46 ± 14 42 ± 14 a Fujita et al., 1998, and Watson et al., 1998.b U.S. EPA SPECIATE database.c Norbeck et al., 1998c.
diesel vehicles are plotted in Figure 2-35. Different analytical methods were employed for these studies, making the comparison of emission rates difficult. Results from the three studies, all performed on HD trucks, suggest a decline in EC emission rates by model year since the early 1980s. In a study conducted in 1992, four HD vehicles of unknown vintage were tested and a combined EC emission rate of 0.81 g/mi was reported, which is consistent with the 1990 timeframe in Figure 2-35 (Lowenthal et al., 1994). EC as a percentage of total DPM in these studies ranged from 30% to 90%, most likely as a result of different testing cycles and different engines and different analytical methods.
Figure 2-36 presents these data as EC fraction of total fine PM. The EC content of DPM varied widely in the 1980s from approximately 20% to 90%, whereas in more recent years, the data suggest a smaller range in the EC fraction, from approximately 50% to 90% (with one data point at 30%). Recent emission profiles for HD diesel vehicles suggest that 75% ± 10% of the DPM is attributable to EC, whereas approximately 25% of gasoline PM is composed of EC, except for PM emissions during gasoline vehicle cold-starts, which were found to have an EC content of approximately 42% (Table 2-13). These data also provide evidence that newer model year HD engines generally emit DPM that is more rich in EC than older HD engines.
2.2.8.2. PAHs and Nitro-PAH Emissions PAHs, nitro-PAHs, and oxidized derivatives of these compounds have attracted
considerable attention because of their known mutagenic and, in some cases, carcinogenic
2-70

14
12
10
8
6
4
2
0
Benzo(a)pyrene 1-Nitropyrene
1975 1980 1985 1990 1995 2000
Engine Model Year
Figure 2-35. EC emission rates for diesel vehicles.
100
90
80
70
60
50
40
30
20
10
0 82 84 86 88 90 92 94 96
Zielinska, et al., 1998 Schauer, et al., 1999 Rogge, et al., 1993
Engine Model Year
Figure 2-36. EC content as percent of fine PM for DPM samples obtained in chassis dynamometer studies.
EC, %
of T
otal
PM
1-N
P or
B(a
)P E
mis
sion
, ug/
mi
2-71

character (National Research Council, 1982). In this section, PAH and nitro-PAH concentrations and emission rates and trends in emissions over time are presented.
2.2.8.2.1. PAHs identified in DE. At least 32 PAHs have been identified in the exhaust of LD diesel vehicles and HD diesel vehicles (Table 2-14) (Watson et al., 1998; Zielinska et al., 1998). Table 2-15 lists the PAHs and thioarenes identified in three LD diesel vehicles’ DPM extracts, reported as ng/g of DPM (Tong et al., 1984). SOF fractions accounted for 11% to 15% of the total DPM mass for the LD diesel vehicles reported by Tong et al. (1984), which is lower than the LD diesel vehicles organic fraction reported by Norbeck et al. (1998c) in Table 2-13. Among the PAHs reported by Watson et al. (1998) and Zielinska et al. (1998), the higher molecular weight compounds (pyrene through coronene) that are expected to partition to the particle phase have emission rates from HD diesel vehicles ranging from below detection limits up to 0.071 mg/mi. HD diesel vehicle emission rates for the lower molecular weight PAHs ranged up to 2.96 mg/mi for dimethylnaphthalenes. In general, among the vehicles tested, PAH emission rates were higher for LD diesel vehicles compared with HD diesel vehicles. Table 2-16 presents emission rates of four representative particle-phase PAHs from HD diesel vehicles, LD diesel vehicles, and gasoline (with and without catalytic converter) engines. Emission rates for benzo[a]pyrene were higher in diesel emissions compared with gasoline emissions, except for the report by Rogge et al. (1993), who used extraction methods different from those in other studies (discussed above).
2.2.8.2.2. Nitro-PAHs identified in DE. Positive isomer identification for 16 nitro-PAHs has been made utilizing the GC retention times of authentic standards and low- and high-resolution mass spectra as identification criteria. These include 1-nitropyrene; 2-methyl-1-nitronaph-thalene; 4-nitrobiphenyl; 2-nitrofluorene; 9-nitroanthracene; 9-methyl-10- nitroanthracene; 2-nitroanthracene; 2-nitrophenanthrene; 1-methyl-9-nitroanthracene; 1-methyl-3-nitropyrene; 1-methyl-6-nitropyrene; 1-methyl-8-nitropyrene; 1,3-, 1,6-, and 1,8-dinitropyrene; and 6nitrobenzo[a]pyrene. In addition, two nitrated heterocyclic compounds were identified, 5- and 8-nitroquinoline. Forty-five additional nitro-PAHs were tentatively identified in this diesel particulate extract (Paputa-Peck et al., 1983). The concentration of nitro-PAHs adsorbed on diesel particles varies substantially from sample to sample. Usually 1-nitropyrene is the predominant component, and concentrations ranging from 7 to 165 µg/g of particles are reported (Levson, 1988).
Table 2-17 gives the approximate concentrations of several of the abundant nitro-PAHs quantified in the early 1980s LD diesel particulate extracts (with the exception of
2-72
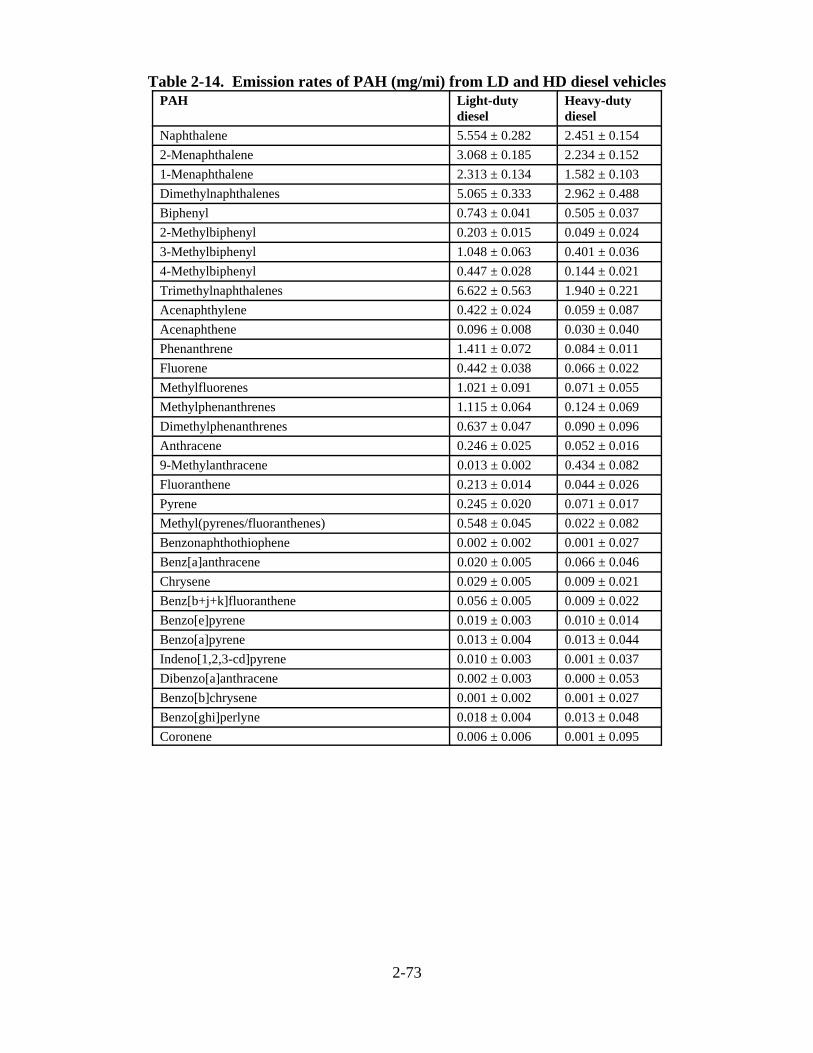
Table 2-14. Emission rates of PAH (mg/mi) from LD and HD diesel vehicles PAH Light-duty
diesel Heavy-duty diesel
Naphthalene 5.554 ± 0.282 2.451 ± 0.154 2-Menaphthalene 3.068 ± 0.185 2.234 ± 0.152 1-Menaphthalene 2.313 ± 0.134 1.582 ± 0.103 Dimethylnaphthalenes 5.065 ± 0.333 2.962 ± 0.488 Biphenyl 0.743 ± 0.041 0.505 ± 0.037 2-Methylbiphenyl 0.203 ± 0.015 0.049 ± 0.024 3-Methylbiphenyl 1.048 ± 0.063 0.401 ± 0.036 4-Methylbiphenyl 0.447 ± 0.028 0.144 ± 0.021 Trimethylnaphthalenes 6.622 ± 0.563 1.940 ± 0.221 Acenaphthylene 0.422 ± 0.024 0.059 ± 0.087 Acenaphthene 0.096 ± 0.008 0.030 ± 0.040 Phenanthrene 1.411 ± 0.072 0.084 ± 0.011 Fluorene 0.442 ± 0.038 0.066 ± 0.022 Methylfluorenes 1.021 ± 0.091 0.071 ± 0.055 Methylphenanthrenes 1.115 ± 0.064 0.124 ± 0.069 Dimethylphenanthrenes 0.637 ± 0.047 0.090 ± 0.096 Anthracene 0.246 ± 0.025 0.052 ± 0.016 9-Methylanthracene 0.013 ± 0.002 0.434 ± 0.082 Fluoranthene 0.213 ± 0.014 0.044 ± 0.026 Pyrene 0.245 ± 0.020 0.071 ± 0.017 Methyl(pyrenes/fluoranthenes) 0.548 ± 0.045 0.022 ± 0.082 Benzonaphthothiophene 0.002 ± 0.002 0.001 ± 0.027 Benz[a]anthracene 0.020 ± 0.005 0.066 ± 0.046 Chrysene 0.029 ± 0.005 0.009 ± 0.021 Benz[b+j+k]fluoranthene 0.056 ± 0.005 0.009 ± 0.022 Benzo[e]pyrene 0.019 ± 0.003 0.010 ± 0.014 Benzo[a]pyrene 0.013 ± 0.004 0.013 ± 0.044 Indeno[1,2,3-cd]pyrene 0.010 ± 0.003 0.001 ± 0.037 Dibenzo[a]anthracene 0.002 ± 0.003 0.000 ± 0.053 Benzo[b]chrysene 0.001 ± 0.002 0.001 ± 0.027 Benzo[ghi]perlyne 0.018 ± 0.004 0.013 ± 0.048 Coronene 0.006 ± 0.006 0.001 ± 0.095
2-73

Table 2-15. Polycyclic aromatic hydrocarbons identified in extracts of diesel particles from LD diesel engine exhaust
Compound Molec. wt.
Concentration ng/mg extract
Acenaphthylene 152 30 Trimethylnaphthalene 170 140–200 Fluorene 166 100–168 Dimethylbiphenyl 182 30–91 C4 -Naphthalene 184 285–351 Trimethylbiphenyl 196 50 Dibenzothiophene 184 129–246 Phenanthrene 178 2,186–4,883 Anthracene 178 155–356 Methyldibenzothiophene 198 520–772 Methylphenanthrene 192 2,028–2,768 Methylanthracene 192 517–1,522 Ethylphenanthrene 206 388–464 4H-Cyclopenta[def]phenanthrene 190 517–1,033 Ethyldibenzothiophene 212 151–179 2-Phenylnaphthalene 204 650–1,336 Dimethyl(phenanthrene/anthracene) 206 1,298–2,354 Fluoranthene 202 3,399–7,321 Benzo[def]dibenzothiophene 208 254–333 Benzacenaphthylene 202 791–1,643 Pyrene 202 3,532–8,002 Ethylmethyl (phenanthrene/anthracene)
220 590–717
Methyl(fluoranthene/pyrene) 216 1,548–2,412 Benzo[a]fluorene/benzo[b]fluorene 216 541–990 Benzo[b]naphtho[2,1-d]thiophene 234 30–53 Cyclopentapyrene 226 869–1,671 Benzo[ghi]fluoranthene 226 217–418 Benzonaphthothiophene 234 30–126 Benz[a]anthracene 228 463–1,076 Chrysene or triphenylene 228 657–1,529 1,2-Binapthyl 254 30–50 Methylbenz[a]anthracene 242 30–50 3-Methylchrysene 242 50–192 Phenyl(phenanthrene/anthracene) 254 210–559 Benzo[j]fluoranthene 252 492–1,367 Benzo[b]fluoranthene 252 421–1,090 Benzo[k]fluoranthene 252 91–289 Benzo[e]pyrene 252 487–946 Benzo[a]pyrene 252 208–558 Benzo[ah]anthracene 278 50–96 Indeno[1,2,3-[cd]pyrene 276 30–93 Benzo[ghi]perylene 276 443–1,050 Dibenzopyrene 302 136–254
Source: Tong et al., 1984.
2-74

Table 2-16. Emission rates of particle-bound PAH (µg/mi) from diesel and gasoline engines
PAH Diesel engines Gasoline engines HDD LDD Noncatalyst Catalyst
(a) (b) (c) (a) (d) (c) (e) (a) (c) Pyrene 71 17.6 36.2 245 66 49.6 45 248 4.0 Fluoranthene 44 27.2 20.8 213 50 77.3 32 196 3.6 Benzo[a]pyrene 13 <0.1 2.1 13 NA 69.6 3.2 1.0 3.0 Benzo[e]pyrene 10 0.24 4.2 19 NA 73.3 4.8 1.0 3.6
(a) Watson et al., 1998 included gas-phase PAH .(b) Westerholm et al., 1991.(c) Rogge et al., 1993.(d) Smith, 1989; 1986 Mercedes Benz.(e) Alsberg et al., 1985.
3-nitrobenzanthrone, reported recently) in µg/g of particles. Concentrations for some of the nitro-PAHs identified range from 0.3 µg/g for 1,3-dinitropyrene to 8.6 µg/g for 2,7-dinitro-9-fluorenone and 75 µg/g for 1-nitropyrene. More recent nitro-PAH and PAH data for HD diesel engines are reported in units of g/bhp-hr or mass/volume of exhaust, making it impossible to directly compare them to the older data (Norbeck et al., 1998b; Bagley et al., 1996, 1998; Baumgard and Johnson, 1992; Opris et al., 1993; Hansen et al., 1994; Harvey et al., 1994; Kantola et al., 1992; Kreso et al., 1998; McClure et al., 1992; Pataky et al., 1994).
2.2.8.2.3. PAH and nitro-PAH emission changes over time. It is difficult to compare PAH emissions from different studies because not all investigators analyze for total PAH or the same suite of PAH compounds. Most studies have reported emissions of B[a]P or 1-nitropyrene (1-NP) because of their toxicological activity. The results of chassis dynamometer studies in which B[a]P or 1-NP were measured are displayed in Figure 2-37. Dietzmann and co-workers (1980) examined four vehicles equipped with late 1970s turbocharged DI engines. Emissions of B[a]P from particle extracts ranged from 1.5 to 9 µg/mi. No relationship between engine technology (one of the engines was two-stroke) and B[a]P emissions was observed. Rogge and co-workers (1993) reported total particle-associated PAH and B[a]P emissions from two 1987 model year trucks (averaged together, four-stroke and turbocharged engines). The total particle-phase PAH emission rate was 0.43 mg/mi and the B[a]P emission rate was 2.7 µg/mi. Particle-phase PAH in the Rogge et al. (1993) study accounted for approximately 0.5% of total DPM mass. Schauer and co-workers (1999) recently reported a particle-phase PAH emission rate of 1.9 mg/mi (accounting for about 0.7% of total DPM mass) for a 1995 MD turbocharged and aftercooled truck. B[a]P emissions were not reported, but emissions of individual species of similar
2-75
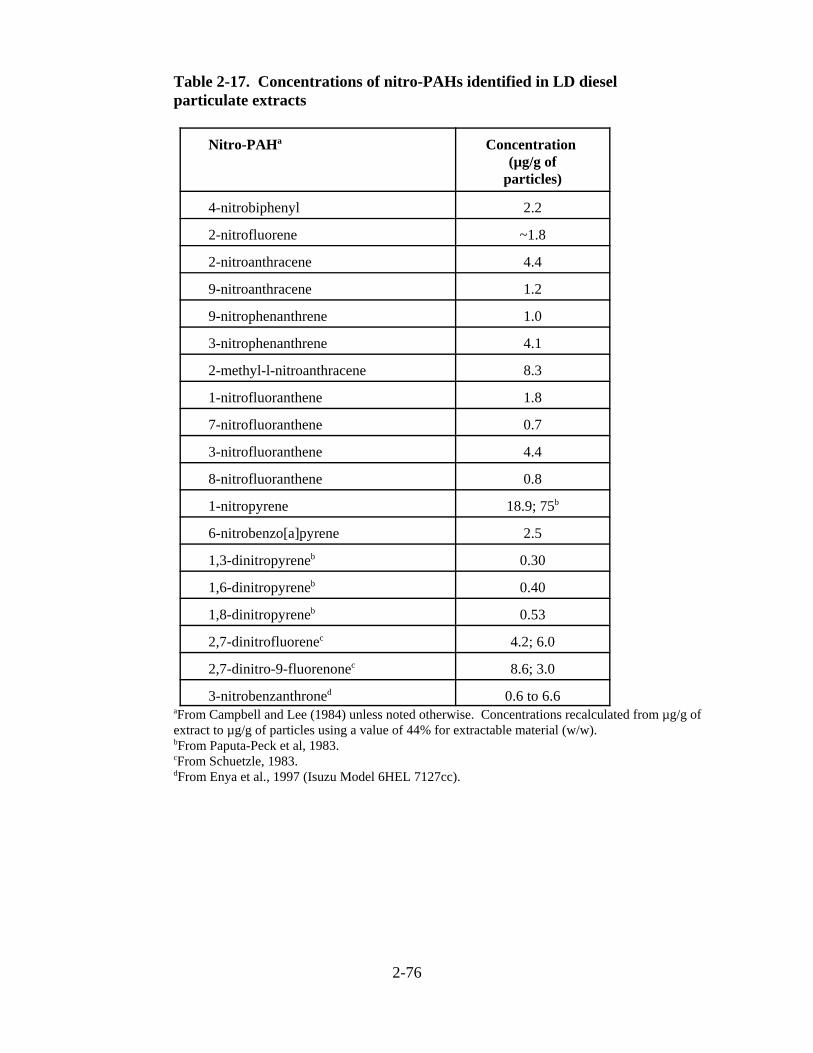
Table 2-17. Concentrations of nitro-PAHs identified in LD diesel particulate extracts
Nitro-PAHa Concentration (µg/g of
particles)
4-nitrobiphenyl 2.2
2-nitrofluorene ~1.8
2-nitroanthracene 4.4
9-nitroanthracene 1.2
9-nitrophenanthrene 1.0
3-nitrophenanthrene 4.1
2-methyl-l-nitroanthracene 8.3
1-nitrofluoranthene 1.8
7-nitrofluoranthene 0.7
3-nitrofluoranthene 4.4
8-nitrofluoranthene 0.8
1-nitropyrene 18.9; 75b
6-nitrobenzo[a]pyrene 2.5
1,3-dinitropyreneb 0.30
1,6-dinitropyreneb 0.40
1,8-dinitropyreneb 0.53
2,7-dinitrofluorenec 4.2; 6.0
2,7-dinitro-9-fluorenonec 8.6; 3.0
3-nitrobenzanthroned 0.6 to 6.6 aFrom Campbell and Lee (1984) unless noted otherwise. Concentrations recalculated from µg/g ofextract to µg/g of particles using a value of 44% for extractable material (w/w).bFrom Paputa-Peck et al, 1983.cFrom Schuetzle, 1983.dFrom Enya et al., 1997 (Isuzu Model 6HEL 7127cc).
2-76

14
12
10
8
6
4
2
0
Benzo(a)pyrene 1-Nitropyrene
1975 1980 1985 1990 1995 2000
Engine Model Year
Figure 2-37. Diesel engine emissions of benzo[a]pyrene and 1-nitropyrene measured in chassis dynamometer studies.
Source: Schuetzle and Perez, 1983; Zielinska et al., 1988; Kado et al., 1996; Dietzmann et al., 1980; Warner-Selph and Dietzmann, 1984; Rogge et al., 1993; Schauer et al., 1999.
molecular weight were approximately 10 µg/mi. Schauer et al. (1999) also reported a gas-phase PAH emission rate of 6.9 mg/mi for the same truck. Measurements of particle- and gas-phase PAHs conducted for the Northern Front Range Air Quality Study in Colorado (Zielinska et al., 1998) showed an average B[a]P emission rate of 13 µg/mi for 15 vehicles ranging from 1983 to 1993 model years. The combined gas- and particle-phase PAH emission rate reported for the NFRAQS study was 13.5 mg/mi. B[a]P emissions from chassis studies are summarized in Figure 2-37. Zielinska (1999) reports a decreasing trend in particle-associated DE PAH from 11 measurements made on vehicles from model year 1984 to 1993 with a low correlation coefficient of 0.29.
B[a]P emissions reported from diesel engine dynamometer studies are summarized in Figure 2-38. Springer (1979) compared B[a]P emissions from naturally aspirated and turbocharged engines and found that naturally aspirated engines emitted about 1 µg B[a]P/bhphr, and DI and IDI engines emitted about 0.15 µg B[a]P/bhp-hr (Table 2-8). The difference between 1 and 0.15 µg/bhp-hr could not be attributed to specific technology changes. The majority of engine test data indicate that B[a]P emissions have generally ranged from approximately 1 to 4 µg/bhp-hr over the past 25 years.
1-N
P or
B(a
)P E
mis
sion
, ug/
mi
2-77

Emissions reported for 1-NP from diesel engines tested by chassis dynamometer range from 0.1 to 12 µg/mi (Figure 2-37), and diesel engine dynamometer studies report 1-NP emission factors ranging from 1 to 4 µg/bhp-hr (Figure 2-38). Too few measurements are available to discern trends in the emission rates of these compounds.
30 B
enzo
(a)p
yren
e or
1-N
itrop
yren
e Em
issi
on, u
g/bh
p-h
25
20
15
10
5
Transient Test B(a)P Steady-State Test B(a)P Transient Test 1-NP Steady-State Test 1-NP
0
1970 1975 1980 1985 1990 1995 2000
Engine Model Year
Figure 2-38. Diesel engine dynamometer measurements of benzo[a]pyrene and 1-nitropyrene emissions from HD diesel engines.
Source: Data are from Table 2-8.
As discussed in Section 2.2.4, Williams et al. (1987) and Andrews et al. (1998) of the University of Leeds have demonstrated that the solvent-extractable PAH from diesel particulate originates primarily in the fuel. PAH molecules are relatively refractory, so a significant fraction survives the combustion process and is exhausted as DPM. These studies have been confirmed by other research groups (Crebelli et al., 1995; Tancell et al., 1995) that included the use of isotopic labeling of fuel PAH. Additionally, engine oil was found to be a reservoir for PAH that originates in the fuel. Pyrosynthesis of PAH occurs during very high temperature conditions in a diesel engine, and under these conditions many of the DPM and other pyrolysis products are ultimately oxidized before exiting the cylinder. Thus, pyrogenic formation of PAH is thought to contribute a small fraction of the total PAH in diesel engine exhaust. As discussed above, fuel
2-78

PAH content is expected to have slowly increased over a 30-year period until 1993, after which PAH content of diesel fuel is expected to have remained constant. Increasing use of catalytic cracking over time may lead to increasing proportions of PAH in distillates; however, fuel standards limit the aromaticity of fuel to 35% (Section 2.2.4).
Recently, Norbeck et al. (1998a) reported on the effect of fuel aromatic content on PAH emissions. Three diesel fuels were used in a Cummins L10 engine: pre-1993 fuel containing 33% aromatic HC and 8% PAH; low aromatic fuel containing a maximum content of 10% aromatic HC and maximum of 1.4% PAH; and a reformulated fuel containing 20% to 25% aromatic HC and 2% to 5% PAH. The investigators found that emission rates for the low-molecular-weight PAHs (PAHs with three or fewer rings) were significantly lower when the engine was tested using the low aromatic fuel compared to when the engine was run on the pre-1993 or reformulated fuel (Table 2-18). Although emission rates reported for several higher molecular weight (particle-associated) PAHs were lower (ranging from 4% to 28% lower) for the low aromatic fuel compared with the other two fuels, the differences were not statistically significant except for coronene.
On the basis of these limited data it is difficult to draw a precise, quantitative conclusion regarding how PAH, B[a]P, or 1-NP emissions have changed over time and in response to fuel and engine changes. A decrease in the emissions of PAH from post-1990 model year vehicles and engines compared with pre-1990 vehicles and engines is suggested by the data; however, the data also suggest that differences in a vehicle’s engine type and make, general engine condition, fuel composition, and test conditions can influence the emission levels of PAH.
2.2.8.3. Particle Size Figure 2-39 shows a generic size distribution for diesel particulate based on mass and
particle number. Approximately 50% to 90% of the number of particles in DE are in the ultrafine size range (nuclei-mode), with the majority of diesel particles ranging in size from 0.005-0.05 µm and the mode at about 0.02 µm. These aerosol particles are formed from exhaust constituents and consist of sulfuric acid droplets, ash particles, condensed organic material, and primary carbon spherules (Abdul-Khalek et al., 1998; Baumgard and Johnson, 1996). Although it accounts for the majority of particles, ultrafine DPM accounts for only 1% to 20% of the mass of DPM.
Approximately 80% to 95% of diesel particle mass is in the size range from 0.05 to 1.0 µm, with a mean particle diameter of about 0.2 µm. The EC core has a high specific surface area of approximately 30 to 50 m2/g (Frey and Corn, 1967), and Pierson and Brachaczek (1976) report that after the extraction of adsorbed organic material, the surface area of the diesel particle core
2-79
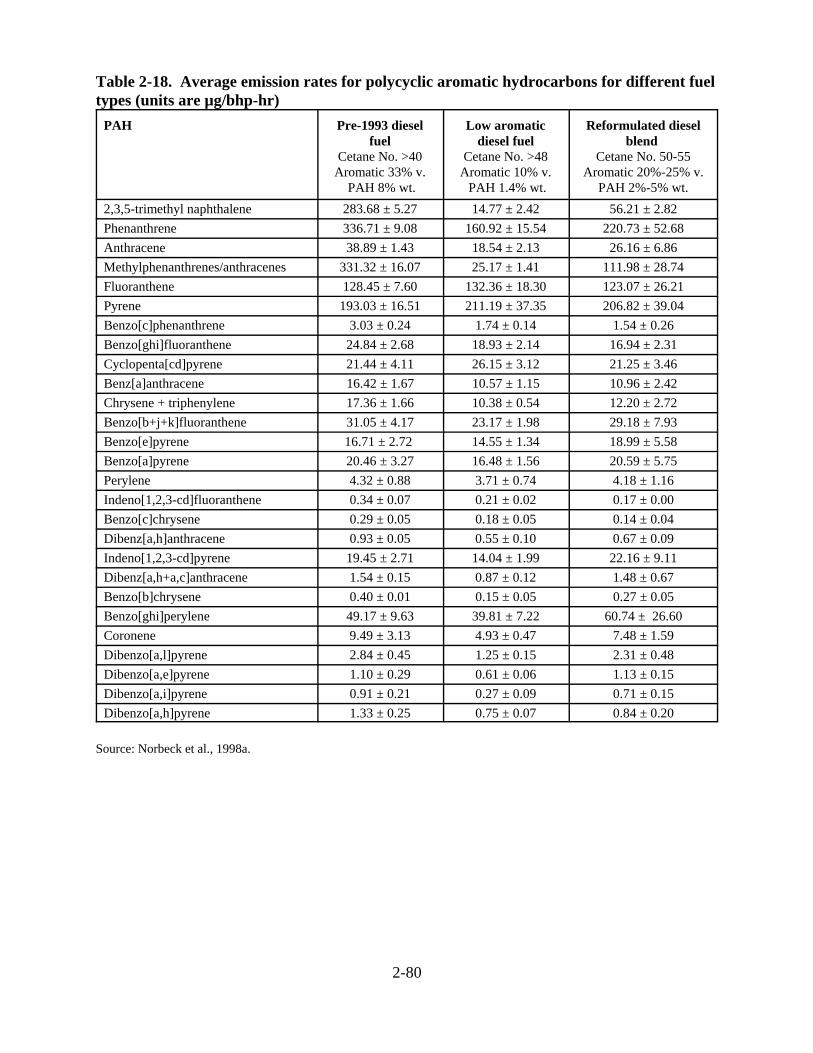
Table 2-18. Average emission rates for polycyclic aromatic hydrocarbons for different fuel types (units are µg/bhp-hr)
PAH Pre-1993 diesel fuel
Cetane No. >40 Aromatic 33% v.
PAH 8% wt.
Low aromatic diesel fuel
Cetane No. >48 Aromatic 10% v.
PAH 1.4% wt.
Reformulated diesel blend
Cetane No. 50-55 Aromatic 20%-25% v.
PAH 2%-5% wt. 2,3,5-trimethyl naphthalene 283.68 ± 5.27 14.77 ± 2.42 56.21 ± 2.82 Phenanthrene 336.71 ± 9.08 160.92 ± 15.54 220.73 ± 52.68 Anthracene 38.89 ± 1.43 18.54 ± 2.13 26.16 ± 6.86 Methylphenanthrenes/anthracenes 331.32 ± 16.07 25.17 ± 1.41 111.98 ± 28.74 Fluoranthene 128.45 ± 7.60 132.36 ± 18.30 123.07 ± 26.21 Pyrene 193.03 ± 16.51 211.19 ± 37.35 206.82 ± 39.04 Benzo[c]phenanthrene 3.03 ± 0.24 1.74 ± 0.14 1.54 ± 0.26 Benzo[ghi]fluoranthene 24.84 ± 2.68 18.93 ± 2.14 16.94 ± 2.31 Cyclopenta[cd]pyrene 21.44 ± 4.11 26.15 ± 3.12 21.25 ± 3.46 Benz[a]anthracene 16.42 ± 1.67 10.57 ± 1.15 10.96 ± 2.42 Chrysene + triphenylene 17.36 ± 1.66 10.38 ± 0.54 12.20 ± 2.72 Benzo[b+j+k]fluoranthene 31.05 ± 4.17 23.17 ± 1.98 29.18 ± 7.93 Benzo[e]pyrene 16.71 ± 2.72 14.55 ± 1.34 18.99 ± 5.58 Benzo[a]pyrene 20.46 ± 3.27 16.48 ± 1.56 20.59 ± 5.75 Perylene 4.32 ± 0.88 3.71 ± 0.74 4.18 ± 1.16 Indeno[1,2,3-cd]fluoranthene 0.34 ± 0.07 0.21 ± 0.02 0.17 ± 0.00 Benzo[c]chrysene 0.29 ± 0.05 0.18 ± 0.05 0.14 ± 0.04 Dibenz[a,h]anthracene 0.93 ± 0.05 0.55 ± 0.10 0.67 ± 0.09 Indeno[1,2,3-cd]pyrene 19.45 ± 2.71 14.04 ± 1.99 22.16 ± 9.11 Dibenz[a,h+a,c]anthracene 1.54 ± 0.15 0.87 ± 0.12 1.48 ± 0.67 Benzo[b]chrysene 0.40 ± 0.01 0.15 ± 0.05 0.27 ± 0.05 Benzo[ghi]perylene 49.17 ± 9.63 39.81 ± 7.22 60.74 ± 26.60 Coronene 9.49 ± 3.13 4.93 ± 0.47 7.48 ± 1.59 Dibenzo[a,l]pyrene 2.84 ± 0.45 1.25 ± 0.15 2.31 ± 0.48 Dibenzo[a,e]pyrene 1.10 ± 0.29 0.61 ± 0.06 1.13 ± 0.15 Dibenzo[a,i]pyrene 0.91 ± 0.21 0.27 ± 0.09 0.71 ± 0.15 Dibenzo[a,h]pyrene 1.33 ± 0.25 0.75 ± 0.07 0.84 ± 0.20
Source: Norbeck et al., 1998a.
2-80

Figure 2-39. Particle size distribution in DE.
Source: Kittelson, 1998.
is approximately 90 m2/g. Because these particles have a very large surface area per gram of mass, it makes them excellent carriers for adsorbed inorganic and organic compounds; potentially enhancing penetration of such compounds to lower portions of the respiratory tract upon inhalation. In addition, ultrafine aerosols can also reach the same areas of the lung.
Considerable caution is required when reporting particle size measurements from diesel engine exhaust because dilution conditions during the measurement process significantly affect size distributions (i.e., the size distribution is largely a function of how it was measured), and DPM size distributions obtained in dilution tunnel systems may not be relevant to size distributions resulting from the physical transformation of engine exhaust in the atmosphere. Measurements made on diluted DE typically show higher numbers of nuclei-mode particles than do measurements made on raw exhaust because of condensation to form nuclei-mode aerosol upon cooling of the exhaust. To understand particle size distributions emitted from diesel engines, investigators employ various dilution techniques, none of which have been standardized. Dilution ratio, sampling temperature, humidity, relative concentrations of carbon and volatile matter, and other sampling factors can therefore have a large impact on the number and makeup of nuclei-mode particles (Abdul-Khalek et al., 1999; Shi and Harrison, 1999; Lüders
2-81

et al., 1998; Brown et al., 2000). Dilution air temperature and humidity can have a large effect on particle number and size distribution, especially in the size range below 0.05 µm (also referred to as nanoparticles). Shi and Harrison (1999) report that a high dilution ratio and high relative humidity favor the production of ultrafine particles in diesel engine exhaust. Abdul-Khalek et al. (1998) report that an increase in the residence time of the exhaust during dilution resulted in an increase in the number of particles in exhaust. Khatri et al. (1978) report increased gas-phase HC condensation to DPM with a decrease in dilution air temperature. Some studies report no peak in diesel particles in the ultrafine size range (Kleeman et al., 2000). Kittelson (2000) reports that nanoparticle formation can be prevented by an oxidizing catalyst, which burns organic components of the exhaust, making them unavailable for nucleation or condensation to form an aerosol.
Experiments conducted in a dilution tunnel represent the atmospheric behavior of DE only under the conditions specific to the dilution tunnel and do not represent the full range of atmospheric conditions. Gertler (1999) demonstrated an increase in 0.02 µm particles as the fraction of diesel vehicles in the Tuscarora Mountain tunnel increased from 13% to 78%. These data suggest that the mode at 0.02 µm for ultrafine DPM from DE is evidenced under some real-world conditions.
Several groups have shown that decreasing sulfur content decreases the number of nuclei-mode particles measured in the exhaust, assuming temperature is low enough and residence time is long enough for nucleation and condensation of sulfate aerosol and water in the dilution tunnel (Baumgard and Johnson, 1992, 1996; Opris et al., 1993; Abdul-Khalek et al., 1999). The application of this finding to real-world conditions is difficult to predict, as the number of nuclei-mode particles formed from sulfate and water in the atmosphere will be determined by atmospheric conditions, not by dilution tunnel conditions. With all other factors held constant, it appears that reducing fuel sulfur content reduces the number of sulfate nuclei-mode particles. Thus, the reduction in on-road fuel sulfur content that occurred in 1993 reduced the amount of sulfur dioxide and sulfate available for particle formation. As discussed above, the contribution of sulfate to total DPM mass ranges from 1% to 5% and is therefore not a substantial portion of DPM mass.
More controversial is the suggestion that the DPM emission size distribution from newer technology engines (1991 and later) may be shifted to a much higher number concentration of nuclei-mode particles, independent of fuel sulfur content (Kreso et al., 1998; Abdul-Khalek et al., 1998; Baumgard and Johnson, 1996; Bagley et al., 1996). For example, Kreso and coworkers (1998) compared emissions from a 1995 model year engine with measurements made on 1991 and 1988 model year engines in earlier studies (Bagley et al., 1993, 1996). Nuclei-mode particles made up 40% to 60% of the number fraction of DPM emissions for the 1988 engine and
2-82

97%+ of the DPM from the 1991 and 1995 engines. Number concentrations were roughly two orders of magnitude higher for the newer engines. SOF made up 25% to 30% of DPM mass in the 1988 engine and 40% to 80% of DPM mass for the newer engines. Total DPM mass was significantly reduced for the newer engines. It was suggested that increased fuel injection pressure leads to improved fuel atomization and evaporation, in turn leading to smaller primary carbonaceous particles. Dilution conditions (relatively low temperature, low primary dilution ratio, long residence time of more than 3 seconds) strongly favor the formation of nucleation products. The 1991 and 1988 engines were tested with 100 ppm sulfur fuel whereas the 1995 engine was tested with 310 ppm sulfur fuel, which may confound the results to some extent.
The results of Kreso and co-workers (1998) and of Bagley and co-workers (1993, 1996) have been called into question because the high level of SOF emitted by the 1991 engine, particularly at high-load test modes, was inconsistent with SOF values measured for other engines using similar types of technology (Last et al., 1995; Ullman et al., 1995). Kittelson (1998) notes that there is far less carbonaceous DPM formed in newer engines compared with older engines. Accumulation-mode particles may have provided a high surface area for adsorption of sulfate and unburned organic compounds. In the absence of this surface area for adsorption, higher number concentrations of small particles are formed from nucleation of HCs and sulfuric acid.
A study performed at EPA by Pagan (1999) suggested that increased injection pressure can lead to the formation of more nuclei-mode particles in the exhaust. Particle size distributions were measured for diluted exhaust from an engine in which injection pressure could be varied from roughly 35 to 110 MPa (about 5,000–16,000 psi), comparable to pressures obtained with injection technology introduced in the 1980s. The dilution system and particle size measurement setup were identical in all experiments, removing some of the uncertainty in earlier studies that compared engine tests performed years apart. The results showed a clear increase in the number of nuclei-mode particles and a decrease in the number of accumulation-mode particles as injection pressure was increased. This shift did not occur, however, at high engine speeds and loads, but only at low to intermediate speeds and loads. The increase in number concentration of nuclei-mode particles was much lower than the two orders of magnitude increase reported by Kreso et al. (1998) or Bagley et al. (1996). One must use caution in applying the results of Pagan to modern high-injection pressure diesel engines with turbocharging/charge-air cooling because the engine used by Pagan was a naturally aspirated engine to which high-pressure common rail injection was applied. This would likely preclude this particular engine from meeting current on-highway PM or NOx standards. Although some studies have suggested that increased injection pressure can lead to elevated ultrafine DPM number counts, Kittelson et al.
2-83

(1999) cite a German study that reported a decrease in ultrafine DPM number and mass with increasing injection pressure.
Although the majority of particles in DE from modern on-road diesel engines are in the ultrafine size range, evidence regarding a change in the size distribution over time is unclear. To understand the size distribution of DPM to which people are exposed will require measurements under conditions that more closely resemble ambient conditions.
2.3. ATMOSPHERIC TRANSFORMATION OF DIESEL EXHAUST Primary diesel emissions are a complex mixture containing hundreds of organic and
inorganic constituents in the gas and particle phases, the most abundant of which are listed in Table 2-19. The more reactive compounds with short atmospheric lifetimes will undergo rapid transformation in the presence of the appropriate reactants, whereas more stable pollutants can be transported over greater distances. A knowledge of the atmospheric transformations of gaseous and particulate components of diesel emissions and their fate is important in assessing environmental exposures and risks. This section describes some of the major atmospheric transformation processes for gas-phase and particle-phase DE, focusing on the primary and secondary organic compounds that are of significance for human health. For a more comprehensive summary of the atmospheric transport and transformation of diesel emissions, see Winer and Busby (1995).
2.3.1. Gas-Phase Diesel Exhaust Gas-phase DE contains organic and inorganic compounds that undergo various chemical
and physical transformations in the atmosphere, depending on the abundance of reactants and meteorological factors such as wind speed and direction, solar radiation, humidity, temperature, and precipitation. Gaseous DE will react primarily with the following species (Atkinson, 1988):
• Sunlight, during daylight hours • Hydroxyl (OH) radical, during daylight hours • Ozone (O3), during daytime and nighttime • Hydroperoxyl (HO2) radical, typically during afternoon/evening hours • Gaseous nitrate (NO3) radicals or dinitrogen pentoxide (N2O5), during nighttime
hours • Gaseous nitric acid (HNO3) and other species such as nitrous acid (HONO) and
sulfuric acid (H2SO4).
2-84

Table 2-19. Classes of compounds in diesel exhaust
Particulate phase Gas phase Heterocyclics, hydrocarbons (C14-C35), and PAHs and derivatives: Acids Cycloalkanes Alcohols Esters Alkanoic acids Halogenated cmpds. n-Alkanes Ketones Anhydrides Nitrated cmpds. Aromatic acids Sulfonates
Quinones
Heterocyclics, hydrocarbons (C1-C10), and derivatives: Acids Cycloalkanes, Cycloakenes Aldehydes Dicarbonyls Alkanoic acids Ethyne n-Alkanes Halogenated cmpds. n-Alkenes Ketones Anhydrides Nitrated cmpds. Aromatic acids Sulfonates
Quinones Elemental carbon Acrolein Inorganic sulfates and nitrates Ammonia Metals Carbon dioxide, carbon monoxide Water Benzene
1,3-Butadiene Formaldehyde Formic acid Hydrogen cyanide, hydrogen sulfide Methane, methanol Nitric and nitrous acids Nitrogen oxides, nitrous oxide Sulfur dioxide Toluene Water
Sources: Mauderly, 1992, which summarized the work of Lies et al., 1986; Schuetzle and Frazier, 1986; Carey, 1987; Zaebst et al., 1988, updated from recent work by Johnson, 1993; McDonald, 1997; Schauer et al., 1999.
The major loss process for most of the DE emission constituents is oxidation, which occurs primarily by daytime reaction with OH radical (Table 2-20). For some pollutants, photolysis, reaction with O3, and reactions with NO3 radicals during nighttime hours are also important removal processes. The atmospheric lifetimes do not take into consideration the potential chemical or biological importance of the products of these various reactions. For example, the reaction of gas-phase PAHs with NO3 appears to be of minor significance as a PAH loss process, but it is more important as a route of formation of mutagenic nitro-PAHs. The reaction products for some of the major gaseous DE compounds are listed in Table 2-21 and are discussed briefly below.
2.3.1.1. Organic Compounds The organic fraction of diesel is a complex mixture of compounds, very few of which
have been characterized. The atmospheric chemistry of several organic constituents of DE (which are also produced by other combustion sources) has been studied. A few of these
2-85
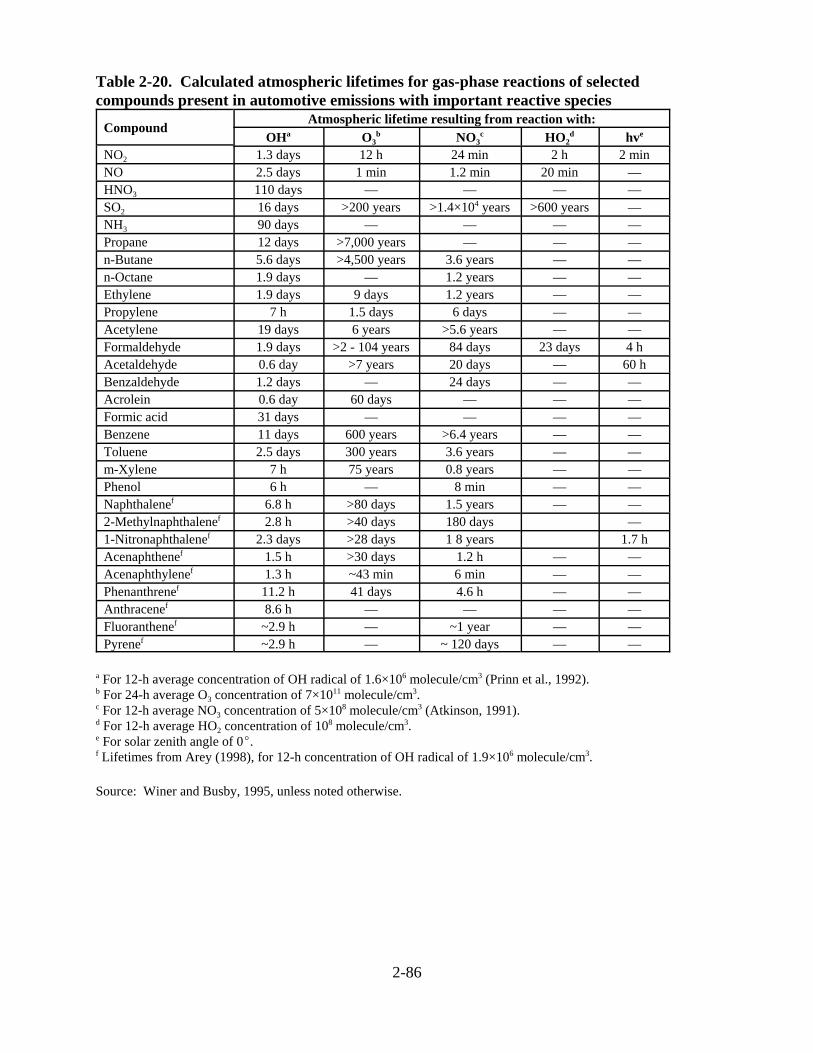
Table 2-20. Calculated atmospheric lifetimes for gas-phase reactions of selected compounds present in automotive emissions with important reactive species
Compound Atmospheric lifetime resulting from reaction with: OHa O3
b NO3 c HO2
d hve
NO2 1.3 days 12 h 24 min 2 h 2 min NO 2.5 days 1 min 1.2 min 20 min — HNO3 110 days — — — — SO2 16 days >200 years >1.4×10⁴ years >600 years — NH3 90 days — — — — Propane 12 days >7,000 years — — — n-Butane 5.6 days >4,500 years 3.6 years — — n-Octane 1.9 days — 1.2 years — — Ethylene 1.9 days 9 days 1.2 years — — Propylene 7 h 1.5 days 6 days — — Acetylene 19 days 6 years >5.6 years — — Formaldehyde 1.9 days >2 - 104 years 84 days 23 days 4 h Acetaldehyde 0.6 day >7 years 20 days — 60 h Benzaldehyde 1.2 days — 24 days — — Acrolein 0.6 day 60 days — — — Formic acid 31 days — — — — Benzene 11 days 600 years >6.4 years — — Toluene 2.5 days 300 years 3.6 years — — m-Xylene 7 h 75 years 0.8 years — — Phenol 6 h — 8 min — — Naphthalenef 6.8 h >80 days 1.5 years — — 2-Methylnaphthalenef 2.8 h >40 days 180 days — 1-Nitronaphthalenef 2.3 days >28 days 1 8 years 1.7 h Acenaphthenef 1.5 h >30 days 1.2 h — — Acenaphthylenef 1.3 h ~43 min 6 min — — Phenanthrenef 11.2 h 41 days 4.6 h — — Anthracenef 8.6 h — — — — Fluoranthenef ~2.9 h — ~1 year — — Pyrenef ~2.9 h — ~ 120 days — —
a For 12-h average concentration of OH radical of 1.6×10⁶ molecule/cm3 (Prinn et al., 1992).b For 24-h average O3 concentration of 7×10¹¹ molecule/cm3.c For 12-h average NO3 concentration of 5×10⁸ molecule/cm3 (Atkinson, 1991).d For 12-h average HO2 concentration of 108 molecule/cm3.e For solar zenith angle of 0E.f Lifetimes from Arey (1998), for 12-h concentration of OH radical of 1.9×10⁶ molecule/cm3.
Source: Winer and Busby, 1995, unless noted otherwise.
2-86

Table 2-21. Major components of gas-phase diesel engine emissions, their known atmospheric transformation products, and the biological impact of the reactants and products
Gas-phase emission component
Atmospheric reaction products
Biological impact
Carbon dioxide — Major contributor to global warming.
Carbon monoxide — Highly toxic to humans; blocks oxygen uptake.
Oxides of nitrogen Nitric acid, ozone Nitrogen dioxide is a respiratory tract irritant and major ozone precursor. Nitric acid contributes to acid rain.
Sulfur dioxide Sulfuric acid Respiratory tract irritation. Contributor to acid rain.
Hydrocarbons: Alkanes (#C18) Aldehydes, alkyl nitrates,
ketones Respiratory tract irritation. Reaction products are ozone precursors (in the presence of NOx).
Alkenes (#C4) (e.g., 1,3-butadiene)
Aldehydes, ketones Respiratory tract irritation. Some alkenes are mutagenic and carcinogenic. Reaction products are ozone precursors (in the presence of NOx).
Aldehydes: Formaldehyde Carbon monoxide,
hydroperoxyl radicals Formaldehyde is a probable human carcinogen and an ozone precursor (in the presence of NOx).
Higher aldehydes (e.g., acetaldehyde, acrolein)
Peroxyacyl nitrates Respiratory tract and eye irritation; causes plant damage.
Monocyclic aromatic compounds (e.g., benzene, toluene)
Hydroxylated and hydroxylated-nitro derivativesa
Benzene is toxic and carcinogenic in humans. Some reaction products are mutagenic in bacteria (Ames assay).
PAHs (#4 rings) (e.g., phenanthrene, fluoranthene)b
Nitro-PAHs (4 rings)c Some of these PAHs and nitro-PAHs are known mutagens and carcinogens.
Nitro-PAHs (2 and 3 rings) (e.g., nitronaphthalenes)
Quinones and hydroxylatednitro derivatives
Some reaction products are mutagenic in bacteria (Ames assay).
aSome reaction products expected to partition into the particle phase. bNitro-PAHs with more than two rings will partition into the particle phase.cPAHs containing four rings are usually present in both the vapor and particle phases.
Source: Health Effects Institute, 1995.
2-87

2.3.1.1. Organic Compounds The organic fraction of diesel is a complex mixture of compounds, very few of which
have been characterized. The atmospheric chemistry of several organic constituents of DE (which are also produced by other combustion sources) has been studied. A few of these reactions and their products are discussed below. For a complete summary of the atmospheric chemistry of organic combustion products, see Seinfeld and Pandis (1998).
Acetaldehyde forms peroxyacetyl nitrate (via formation of peroxyl radicals and reaction with NO2), which has been shown to be a direct-acting mutagen toward S. typhimurium strain TA100 (Kleindienst et al., 1985) and is phytotoxic. Benzaldehyde, the simplest aromatic aldehyde, forms peroxybenzoyl nitrate or nitrophenols following reaction with oxides of nitrogen (Table 2-21).
For those PAHs present in the gas phase, reaction with the OH radical is the major removal route, leading to atmospheric lifetimes of a few hours in daylight. The gas-phase reaction of PAHs containing a cyclopenta-fused ring such as acenaphthene, acenaphthylene, and acephenanthrylene with the nitrate radical may be an important loss process during nighttime hours. Relatively few data are available concerning the products of these gas-phase reactions. It has been shown that in the presence of NOx, the OH radical reactions with naphthalene, 1- and 2-methylnaphthalene, acenaphthylene, biphenyl, fluoranthene, pyrene, and acephenanthrylene lead to the formation of nitroarenes (Arey et al., 1986; Atkinson, 1986; Atkinson et al., 1990; Zielinska et al., 1988, 1989a; Arey, 1998). In addition, in a two-step process involving OH radical reaction and NO2 addition, 2-nitrofluoranthene and 2-nitropyrene can be formed and eventually partition to the particle phase, as will other nitro-PAHs.
The addition of the NO3 radical to the PAH aromatic ring leads to nitroarene formation (Sweetman et al., 1986; Atkinson et al., 1987, 1990; Zielinska et al., 1989a). The gas-phase reactions of NO3 radical with naphthalene, 1- and 2-methylnaphthalene, acenaphthene, phenanthrene, anthracene, fluoranthene, and pyrene produce, in general, the same nitro-PAH isomers as the OH radical reaction, but with different yields (Arey et al., 1989; Sweetman et al., 1986; Atkinson et al., 1987, 1990; Zielinska et al., 1986, 1989a). For example, the same 2-nitrofluoranthene is produced from both OH radical and NO3 gas-phase reactions, but the reaction with NO3 produces a much higher yield. The production of several nitroarene compounds has been studied in environmental chambers (Arey et al., 1989; Zielinska et al., 1990; Atkinson and Arey, 1994; Arey, 1998; Feilberg et al., 1999), and generally the same nitro-PAH isomers formed from reaction with OH and NO3 radicals are observed in ambient air samples. Secondary formation of nitroarenes through the gas-phase reactions of the 2-, 3-, and 4-ring PAHs is the major source for many of the nitroarenes observed in ambient air (Pitts et al., 1985a-c; Arey et al., 1986; Zielinska et al., 1988). Photolysis is the major removal pathway for
2-88
nitroarenes with lifetimes of approximately 2 hours (Feilberg et al., 1999; Nielsen and Ramdahl, 1986).
2.3.1.2. Inorganic Compounds SO2 and oxides of nitrogen (primarily NO) are emitted from diesel engines. SO2 is
readily oxidized by the OH radical in the atmosphere, followed by formation of the HO2 radical and HSO3, which rapidly reacts with water to form H2SO4 aerosols. Because SO2 is soluble in water, it is scavenged by fog, cloud water, and raindrops. In aqueous systems, SO2 is readily oxidized to sulfate by reaction with hydrogen peroxide (H2O2), O3, or O2 in the presence of a metal catalyst (Calvert and Stockwell, 1983). Sulfur emitted from diesel engines is predominantly (~98%) in the form of SO2, a portion of which will form sulfate aerosols by the reaction described above. Nonroad equipment, which typically uses fuel containing 3,300 ppm sulfate, emits more SO2 than on-road diesel engines, which use fuels currently containing an average of 340 ppm sulfur because of EPA regulations effective in 1993 decreasing diesel fuel sulfur levels. EPA estimates that mobile sources are responsible for about 7% of nationwide SO2
emissions, with diesel engines contributing 74% of the mobile source total (the majority of the diesel SO2 emissions originate from nonroad engines) (U.S. EPA, 1998b).
NO is also oxidized in the atmosphere to form NO2 and particulate nitrate. The fraction of motor vehicle NOx exhaust converted to particulate nitrate in a 24-hour period has been calculated using a box model to be approximately 3.5% nationwide, a portion of which can be attributed to DE (Gray and Kuklin, 1996). EPA estimates that in 1997, mobile sources were responsible for about 50% of nationwide NOx emissions, with diesel engines being responsible for approximately one-half of the mobile source total (U.S. EPA, 1998b).
2.3.1.3. Atmospheric Transport of Gas-Phase DE Gas-phase DE can be dry deposited, depending on the deposition surface, atmospheric
stability, and the solubility and other chemical properties of the compound. Dry deposition of organic species is typically on the order of weeks to months, with dry deposition velocities of approximately 10-4 cm/sec (Winer and Busby, 1995). In contrast, inorganic species such as SO2
and nitric acid have relatively fast deposition rates (0.1–2.5 cm/sec) and will remain in the atmosphere for shorter time periods compared with the organic exhaust components. Some gas-phase species will also be scavenged by aqueous aerosols and potentially deposited via precipitation. These processes can greatly reduce the atmospheric concentration of some vapor-phase species. Atmospheric lifetimes for several gas-phase components of DE are on the order of hours or days, during which time atmospheric turbulence and advection can disperse these pollutants widely.
2-89

2.3.2. Particle-Phase Diesel Exhaust Particle-associated DE is composed of primarily carbonaceous material (organic and EC)
with a very small fraction composed of inorganic compounds and metals. The OC fraction adsorbed on DPM is composed of high-molecular-weight compounds, such as PAHs, which are generally more resistant to atmospheric reactions than PAHs in the gas phase. The EC component of DE is inert to atmospheric degradation, whereas the PAH compounds are degraded by reaction with the following species:
• Sunlight, during daytime hours • O3, during daytime and nighttime • NO3 and N2O5, during nighttime hours • OH and HO2
• NO2, during nighttime and daytime hours • H2O2
• HNO3 and other species such as HONO and H2SO4.
Because many of the PAH derivatives formed by reaction with some of the reactants listed above have been found to be highly mutagenic, a brief discussion of PAH photolysis, nitration, and oxidation follows. Some of the major degradation products from particulate DE and their biological impact are listed in Table 2-22.
2.3.2.1. Particle-Associated PAH Photooxidation Laboratory studies of photolysis of PAHs adsorbed on 18 different fly ashes, carbon
black, silica gel, and alumina (Behymer and Hites, 1985, 1988) and several coal stack ashes (Yokely et al., 1986; Dunstan et al., 1989) have shown that the extent of photodegradation of PAHs depends very much on the nature of the substrate to which they are adsorbed. The dominant factor in the stabilization of PAHs adsorbed on fly ash was the color of the fly ash, which is related to the amount of carbon black present. It appears that PAHs were stabilized if the carbon black content of the fly ash was greater than approximately 5%. On black substrates, half-lives of PAHs studied were on the order of several days (Behymer and Hites, 1988). The environmental chamber studies of Kamens et al. (1988) on the daytime decay of PAHs present on residential wood smoke particles and on gasoline internal combustion emission particles showed PAH half-lives of approximately 1 hour at moderate humidities and temperatures. At very low angle sunlight, very low water vapor concentration, or very low temperatures, PAH daytime half-lives increased to a period of days. The presence and
2-90
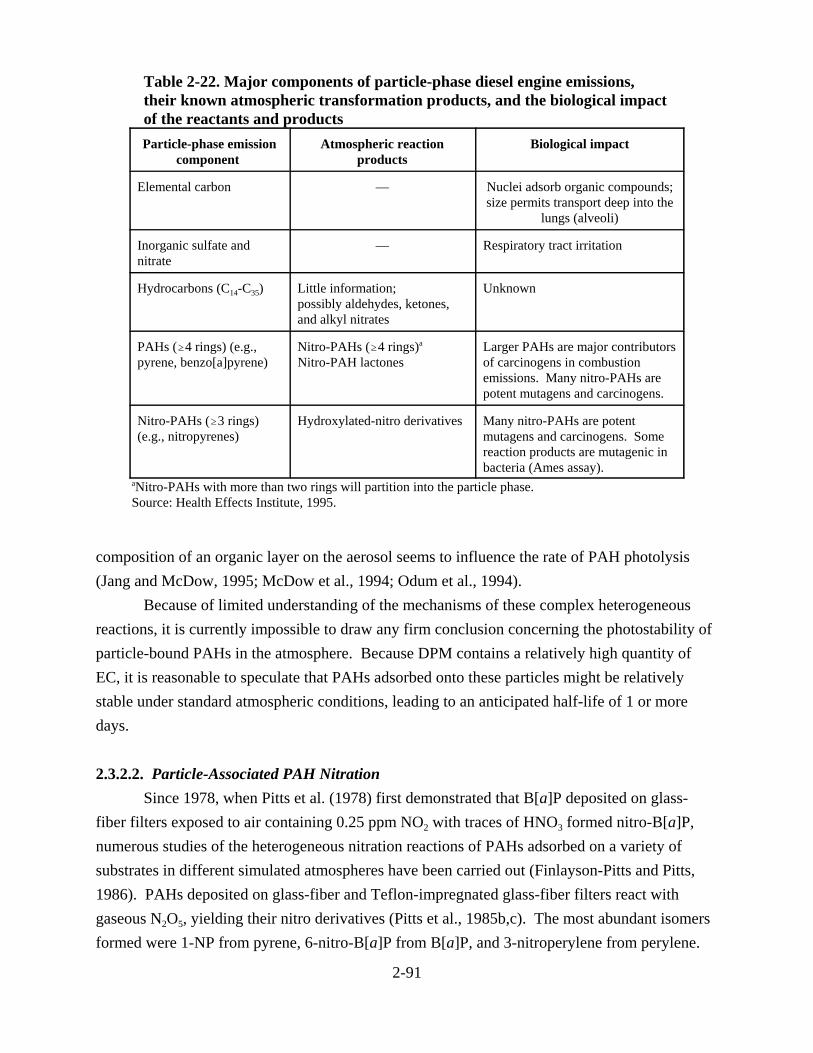
Table 2-22. Major components of particle-phase diesel engine emissions, their known atmospheric transformation products, and the biological impact of the reactants and products Particle-phase emission
component Atmospheric reaction
products Biological impact
Elemental carbon — Nuclei adsorb organic compounds; size permits transport deep into the
lungs (alveoli)
Inorganic sulfate and nitrate
— Respiratory tract irritation
Hydrocarbons (C14-C35) Little information; possibly aldehydes, ketones, and alkyl nitrates
Unknown
PAHs ($4 rings) (e.g., pyrene, benzo[a]pyrene)
Nitro-PAHs ($4 rings)a
Nitro-PAH lactones Larger PAHs are major contributors of carcinogens in combustion emissions. Many nitro-PAHs are potent mutagens and carcinogens.
Nitro-PAHs ($3 rings) (e.g., nitropyrenes)
Hydroxylated-nitro derivatives Many nitro-PAHs are potent mutagens and carcinogens. Some reaction products are mutagenic in bacteria (Ames assay).
aNitro-PAHs with more than two rings will partition into the particle phase. Source: Health Effects Institute, 1995.
composition of an organic layer on the aerosol seems to influence the rate of PAH photolysis (Jang and McDow, 1995; McDow et al., 1994; Odum et al., 1994).
Because of limited understanding of the mechanisms of these complex heterogeneous reactions, it is currently impossible to draw any firm conclusion concerning the photostability of particle-bound PAHs in the atmosphere. Because DPM contains a relatively high quantity of EC, it is reasonable to speculate that PAHs adsorbed onto these particles might be relatively stable under standard atmospheric conditions, leading to an anticipated half-life of 1 or more days.
2.3.2.2. Particle-Associated PAH Nitration Since 1978, when Pitts et al. (1978) first demonstrated that B[a]P deposited on glass-
fiber filters exposed to air containing 0.25 ppm NO2 with traces of HNO3 formed nitro-B[a]P, numerous studies of the heterogeneous nitration reactions of PAHs adsorbed on a variety of substrates in different simulated atmospheres have been carried out (Finlayson-Pitts and Pitts, 1986). PAHs deposited on glass-fiber and Teflon-impregnated glass-fiber filters react with gaseous N2O5, yielding their nitro derivatives (Pitts et al., 1985b,c). The most abundant isomers formed were 1-NP from pyrene, 6-nitro-B[a]P from B[a]P, and 3-nitroperylene from perylene.
2-91

The formation of nitro-PAHs during sampling may be an important consideration for DPM collection because of the presence of NO2 and HNO3 (Feilberg et al., 1999). However, Schuetzle (1983) concluded that the artifact formation of 1-NP was less than 10% to 20% of the 1-NP present in the diesel particles if the sampling time was less than 23 min (one FTP cycle) and if the sampling temperature was not higher than 43 oC. The formation of nitroarenes during ambient high-volume sampling conditions has been reported to be minimal, at least for the most abundant nitropyrene and nitrofluoranthene isomers (Arey et al., 1988).
DPM contains a variety of nitroarenes, with 1-NP being the most abundant among identified nitro-PAHs. The concentration of 1-NP was measured in the extract of particulate samples collected at the Allegheny Mountain Tunnel on the Pennsylvania Turnpike as 2.1 ppm and ~5 ppm by mass of the extractable material from diesel and SI vehicle PM, respectively. These values are much lower than would be predicted on the basis of laboratory measurements for either diesel or SI engines (Gorse et al., 1983). Several nitroarene measurements have been conducted in airsheds heavily affected by motor vehicle emissions (Arey et al., 1987; Atkinson et al., 1988; Zielinska et al., 1989a,b; Ciccioli et al., 1989, 1993). Ambient PM samples were collected at three sites in the Los Angeles Basin during two summertime periods and one wintertime period. Concentrations of 1-NP ranged from 3 pg/m3, to 60 pg/m3, and 3-nitrofluoranthene was also present in DPM at concentrations ranging from not detectable to 70 pg/m3.
2.3.2.3. Particle-Associated PAH Ozonolysis Numerous laboratory studies have shown that PAHs deposited on combustion-generated
fine particles and on model substrates undergo reaction with O3 (Katz et al., 1979; Pitts et al., 1980, 1986; Van Vaeck and Van Cauwenberghe, 1984; Finlayson-Pitts and Pitts, 1986). The dark reaction toward O3 of several PAHs deposited on model substrates has been shown to be relatively fast under simulated atmospheric conditions (Katz et al., 1979; Pitts et al., 1980, 1986). Half-lives on the order of 1 to several hours were reported for the more reactive PAHs, such as B[a]P, anthracene, and benz[a]anthracene (Katz et al., 1979).
The reaction of PAHs deposited on diesel particles with 1.5 ppm O3 under high-volume sampling conditions has been shown to be relatively fast, and half-lives on the order of 0.5 to 1 hour have been reported for most PAHs studied (Van Vaeck and Van Cauwenberghe, 1984). The most reactive PAHs include B[a]P, perylene, benz[a]anthracene, cyclopenta[cd]pyrene, and benzo[ghi]perylene. The benzofluoranthene isomers are the least reactive of the PAHs studied, and benzo[e]perylene is less reactive than its isomer B[a]P. The implications of this study for the high-volume sampling ambient POM are important: reaction of PAHs with O3 could possibly occur under high-volume sampling conditions during severe photochemical smog
2-92

episodes, when the ambient level of O3 is high. However, the magnitude of this artifact is difficult to assess from available data.
2.3.2.4. Atmospheric Transport of DE Particulate Matter Ultrafine particles emitted by diesel engines undergo nucleation, coagulation, and
condensation to form fine particles. DPM can be removed from the atmosphere by dry and wet deposition. Particles of small diameter (<1 µm), such as DPM, are removed less efficiently than larger particles by wet and dry deposition and thus have longer atmospheric residence times. Dry deposition rates vary depending on the particle size. Because of their small size, DE particles have residence times of several days (dry deposition velocities of approximately 0.01 cm/sec) (Winer and Busby, 1995). Diesel particulates may be removed by wet deposition if they serve as condensation nuclei for water vapor deposition or are scavenged by precipitation in- or below-cloud.
In a study designed to assess the atmospheric concentrations and transport of DE particles, Horvath et al. (1988) doped the sole source of diesel fuel in Vienna with an organometallic compound of the heavy earth element dysprosium. The authors found that in some of the more remote sampling areas, DPM composed more than 30% of the particulate mass, indicating that DPM can be dispersed widely.
2.3.3. Diesel Exhaust Aging Primary DE is considered “fresh,” whereas “aged” DE is considered to have undergone
chemical and physical transformation and dispersion over a period of a day or two. Laboratory dilution tunnel measurements represent a homogeneous environment compared to the complex and dynamic system into which real-world DE is emitted. The physical and chemical transformation of DE will vary depending on the environment into which it is emitted. In an urban or industrial environment, DE may enter an atmosphere with high concentrations of oxidizing and nitrating radicals, as well as nondiesel organic and inorganic compounds that may influence the toxicity, chemical stability, and atmospheric residence time.
In general, secondary pollutants formed in an aged aerosol mass are more oxidized, and therefore have increased polarity and water solubility (Finlayson-Pitts and Pitts, 1986). Kamens et al. (1988) reported that photooxidation of particle-bound PAH is enhanced as relative humidity is increased. Weingartner et al. (1997a) and Dua et al. (1999) have reported that unlike many other types of particles, diesel particles do not appear to undergo hygroscopic growth once emitted to the atmosphere and may even shrink in size to some extent under increasing relative humidity conditions. Weingartner et al. (1997a) evaluated the hygroscopic growth of diesel particles and found that freshly emitted diesel particles demonstrated minimal hygroscopic
2-93
growth (2.5%), whereas aged particles subjected to UV radiation and ozonolysis exhibited somewhat greater but still minimal hygroscopic growth. An increase in the sulfur content of diesel fuel has also been observed to result in somewhat greater water condensation onto diesel particles. To the extent that DE components are oxidized or nitrated in the atmosphere, they may be removed at rates different from their precursor compounds and may exhibit different biological reactivities. Data suggesting that minimal hygroscopic growth of DPM occurs also has implications for the dosimetry of these particles in the lung because the smaller particles will reach the lowest airways of the lung, whereas growth of the particle would result in deposition in the upper airways. The dosimetry of DPM is discussed in Chapter 3.
In a recent experiment, the biological activity of DPM exposed to 0.1 ppm ozone for 48 hours was compared with that of DPM not exposed to ozone (Ghio et al., 2000). Instillations of the ozonated DPM in rat lung resulted in an increase in biological activity (neutrophil influx, increased protein, and lactate dehydrogenase activity) compared with DPM that had not been treated with ozone. These data suggest that ambient levels of ozone can alter DPM constituents causing an increase in toxicity compared with nonozonated DPM.
In addition to changes in particle composition with aging, particle size distributions may vary depending on aggregation and coagulation phenomena in the aging process. People in vehicles, near roadways (e.g., cyclists, pedestrians, people in nearby buildings), and on motorcycles will be exposed to more fresh exhaust than the general population. In some settings where emissions are entrained for long periods through meteorological or other factors, exposures would be expected to include both fresh and aged DE. The complexities of transport and dispersion of emission arising from motor vehicles have been the subject of extensive modeling and experimental studies over the past decades and have been summarized by Sampson (1988); exposures to DPM are discussed in the next section of this chapter.
The major organic constituents of DE and their potential degradation pathways described above provide evidence for (1) direct emission of PAHs, (2) secondary formation of nitroarenes, and (3) secondary sulfate and nitrate formation. Because nitro-PAH products are often more mutagenic than their precursors, the formation, transport, and concentrations of these compounds in an aged aerosol mass are of significant interest.
2.4. AMBIENT DIESEL EXHAUST CONCENTRATIONS AND EXPOSURES 2.4.1. Diesel Exhaust Gases in the Ambient Atmosphere
Although emissions of several DE components have been measured, few studies have attempted to elucidate the contribution of diesel-powered engines to atmospheric concentrations of these components. The emission profile of gaseous organic compounds is different for diesel and SI vehicles; the low-molecular-weight aromatic HCs and alkanes (<C9) are more
2-94

characteristic of SI engine emissions, whereas the heavier alkanes (>C10) and aromatic HCs (such as naphthalene, methyl- and dimethyl- naphthalenes, methyl- and dimethyl-indans) are more characteristic of diesel engine emissions. These differences were the basis for apportionment of gasoline- and diesel-powered vehicle emissions to ambient nonmethane hydrocarbon (NMHC) concentrations in the Boston and Los Angeles (South Coast Air Basin) urban areas.
The chemical mass balance receptor model (described below) was applied to ambient samples collected in these areas, along with appropriate fuel, stationary, and area source profiles (Fujita et al., 1997). The average of the sum of NMHC attributed to DE, gasoline-vehicle exhaust, liquid gasoline, and gasoline vapor was 73% and 76% for Boston and the South Coast Air Basin (SoCAB), respectively. The average source contributions of DE to NMHC concentrations were 22% and 13% for Boston and the SoCAB, respectively. Diesel vehicles emit lower levels of NMHC in the exhaust compared with gasoline vehicles. The relative contribution of DE clearly depends on several factors, including fleet composition, sampling location (e.g., near a bus station vs. near a highway or other sources), and the contribution from point and area sources. The contribution of DE to ambient NMHC showed large variations among sampling sites in the Boston area. The source apportionment in the Fujita et al. (1997) study indicates that mobile vehicle-related emissions account for the majority of ambient NMHC in the two urban areas studied, and the results can likely be extrapolated to other urban areas with similar source compositions. Other source apportionment methods such as those used by Henry et al. (1994) have been applied to speciated HC data to separate the mobile source direct emission from gasoline evaporative emissions. This method uses a combination of graphical analysis (Graphical Ratio Analysis for Composition Estimates, GRACE) and multivariate receptor modeling methods (Source Apportionment by Factors with Explicit Restrictions, SAFER) and was not used to identify the diesel engine contribution to the HCs measured.
2.4.2. Ambient Concentrations of DPM Because DPM is chemically complex, an assessment of ambient DPM concentrations
relies primarily on (1) studies that collect ambient samples and adequately characterize their chemical composition, or (2) modeling studies that attempt to recreate emissions and atmospheric conditions. Ambient concentrations of DPM also have been reported from studies using surrogate species. The results of these studies are summarized below. Studies conducted in Europe and Japan were reviewed, but for the most part were not included because of questions surrounding the applicability of measurements in locations that use different diesel technology and control measures from those in the United States.
2-95

2.4.2.1. Source Apportionment Studies Receptor models are used to infer the types and relative contributions of sources to
pollutant measurements made at a receptor site. Receptor models assume that the mass is conserved between the source and receptor site and that the measured mass of each pollutant is a sum of the contributions from each source. Receptor models are referred to as “top-down” in contrast to “bottom-up” methods, which use emission inventory data, activity patterns, and dispersion modeling from the source to predict concentrations at a receptor site.
The most commonly used receptor model for quantifying concentrations of DPM at a receptor site is the chemical mass balance (CMB) model. Input to the CMB model includes measurements of PM mass and chemistry made at the receptor site as well as measurements made of each of the source types suspected to impact the site. Because of problems involving the elemental similarity between diesel and gasoline emission profiles and their co-emission in time and space, chemical molecular species that provide markers for separation of these sources have been identified (Lowenthal et al., 1992). Recent advances in chemical analytical techniques have facilitated the development of sophisticated molecular source profiles, including detailed speciation of PM-associated organic compounds that allow the apportionment of PM to gasoline and diesel sources with increased confidence. CMB analysis that uses speciation of organic compounds in the source profiles is typically referred to as extended species CMB. Older studies that made use of only EC, total OC, trace elements, and major ions in the source profiles (conventional CMB) have been published and are summarized here, but they are subject to more uncertainty. It should be noted that because receptor modeling is based on the application of source profiles to ambient measurements, estimates of DPM concentration generated by this method include the contribution from on-road and nonroad sources to the extent the source profiles are similar (which would include military sources depending on the sampling locations and fleet composition). In addition, this method identifies sources of primary emissions of DPM only, and the contribution of secondary aerosols is not attributed to sources.
The CMB model has been used to assess concentrations of DPM in areas of California, Phoenix, Denver, and Manhattan (Table 2-23). DPM concentrations reported by Schauer et al. (1996) for samples collected in California in 1982 ranged from 4.4 µg/m3 in west Los Angeles to 11.6 µg/m3 in downtown Los Angeles. The average contribution of DPM to total PM2.5 mass ranged from 13% in Rubidoux to 36% in downtown Los Angeles. As mentioned above, this model accounts for primary emissions of DPM only; the contribution of secondary aerosol formation (both acid and organic aerosols) is not included. In sites downwind from urban areas, such as Rubidoux in this study, secondary nitrate formation can account for a substantial fraction of the mass (25% of the fine mass measured in Rubidoux was attributed to secondary nitrate), a portion of which comes from DE (Gray and Kuklin, 1996).
2-96
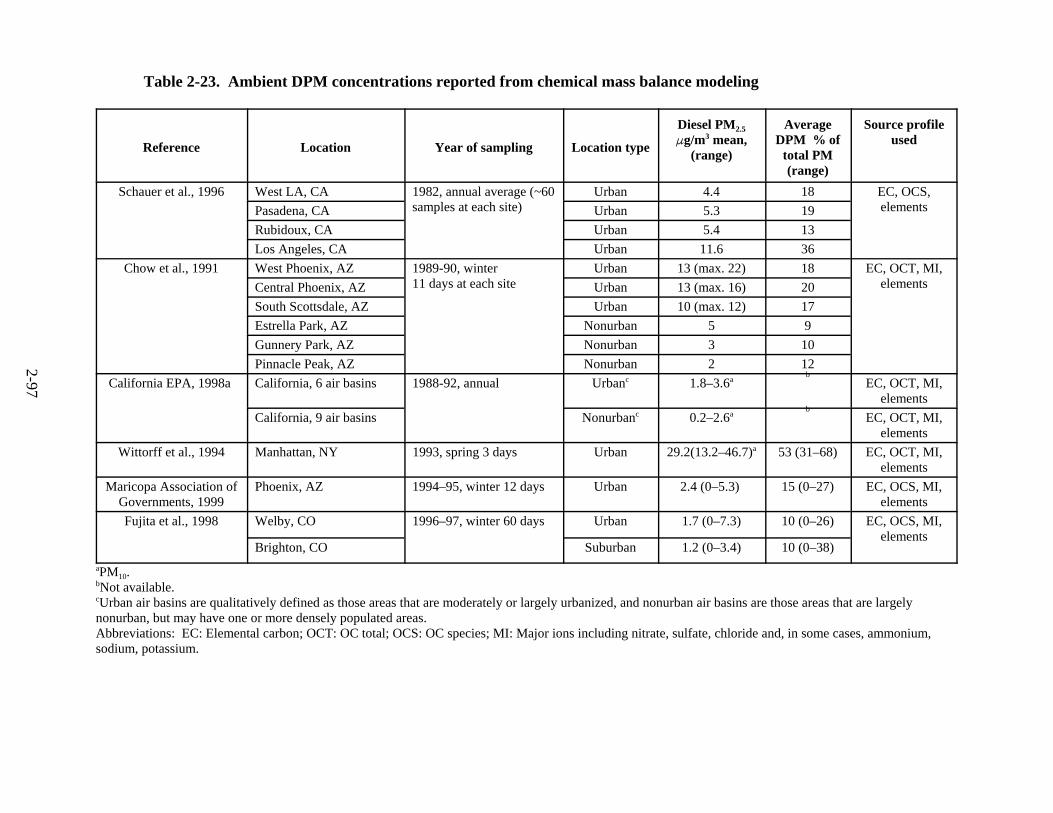
Table 2-23. Ambient DPM concentrations reported from chemical mass balance modeling
Reference Location Year of sampling Location type
Diesel PM2.5 Fg/m3 mean,
(range)
Average DPM % of
total PM (range)
Source profile used
Schauer et al., 1996 West LA, CA 1982, annual average (~60 samples at each site)
Urban 4.4 18 EC, OCS, elementsPasadena, CA Urban 5.3 19
Rubidoux, CA Urban 5.4 13 Los Angeles, CA Urban 11.6 36
Chow et al., 1991 West Phoenix, AZ 1989-90, winter 11 days at each site
Urban 13 (max. 22) 18 EC, OCT, MI, elementsCentral Phoenix, AZ Urban 13 (max. 16) 20
South Scottsdale, AZ Urban 10 (max. 12) 17 Estrella Park, AZ Nonurban 5 9 Gunnery Park, AZ Nonurban 3 10 Pinnacle Peak, AZ Nonurban 2 12
b California EPA, 1998a California, 6 air basins 1988-92, annual Urbanc 1.8–3.6a
b
EC, OCT, MI, elements
California, 9 air basins Nonurbanc 0.2–2.6a EC, OCT, MI, elements
Wittorff et al., 1994 Manhattan, NY 1993, spring 3 days Urban 29.2(13.2–46.7)a 53 (31–68) EC, OCT, MI, elements
Maricopa Association of Governments, 1999
Phoenix, AZ 1994–95, winter 12 days Urban 2.4 (0–5.3) 15 (0–27) EC, OCS, MI, elements
Fujita et al., 1998 Welby, CO 1996–97, winter 60 days Urban 1.7 (0–7.3) 10 (0–26) EC, OCS, MI, elements
Brighton, CO Suburban 1.2 (0–3.4) 10 (0–38)
2-97
aPM10.bNot available.cUrban air basins are qualitatively defined as those areas that are moderately or largely urbanized, and nonurban air basins are those areas that are largelynonurban, but may have one or more densely populated areas.Abbreviations: EC: Elemental carbon; OCT: OC total; OCS: OC species; MI: Major ions including nitrate, sulfate, chloride and, in some cases, ammonium,sodium, potassium.
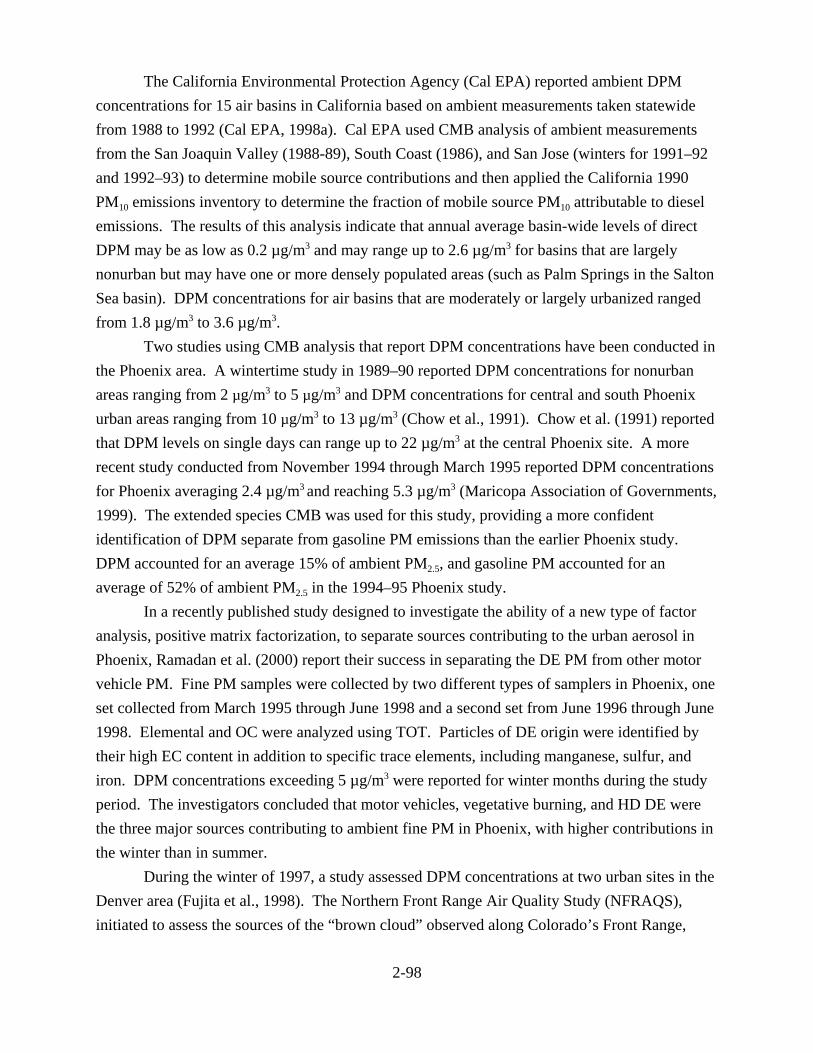
The California Environmental Protection Agency (Cal EPA) reported ambient DPM concentrations for 15 air basins in California based on ambient measurements taken statewide from 1988 to 1992 (Cal EPA, 1998a). Cal EPA used CMB analysis of ambient measurements from the San Joaquin Valley (1988-89), South Coast (1986), and San Jose (winters for 1991–92 and 1992–93) to determine mobile source contributions and then applied the California 1990 PM10 emissions inventory to determine the fraction of mobile source PM10 attributable to diesel emissions. The results of this analysis indicate that annual average basin-wide levels of direct DPM may be as low as 0.2 µg/m3 and may range up to 2.6 µg/m3 for basins that are largely nonurban but may have one or more densely populated areas (such as Palm Springs in the Salton Sea basin). DPM concentrations for air basins that are moderately or largely urbanized ranged from 1.8 µg/m3 to 3.6 µg/m3.
Two studies using CMB analysis that report DPM concentrations have been conducted in the Phoenix area. A wintertime study in 1989–90 reported DPM concentrations for nonurban areas ranging from 2 µg/m3 to 5 µg/m3 and DPM concentrations for central and south Phoenix urban areas ranging from 10 µg/m3 to 13 µg/m3 (Chow et al., 1991). Chow et al. (1991) reported that DPM levels on single days can range up to 22 µg/m3 at the central Phoenix site. A more recent study conducted from November 1994 through March 1995 reported DPM concentrations for Phoenix averaging 2.4 µg/m3 and reaching 5.3 µg/m3 (Maricopa Association of Governments, 1999). The extended species CMB was used for this study, providing a more confident identification of DPM separate from gasoline PM emissions than the earlier Phoenix study. DPM accounted for an average 15% of ambient PM2.5, and gasoline PM accounted for an average of 52% of ambient PM2.5 in the 1994–95 Phoenix study.
In a recently published study designed to investigate the ability of a new type of factor analysis, positive matrix factorization, to separate sources contributing to the urban aerosol in Phoenix, Ramadan et al. (2000) report their success in separating the DE PM from other motor vehicle PM. Fine PM samples were collected by two different types of samplers in Phoenix, one set collected from March 1995 through June 1998 and a second set from June 1996 through June 1998. Elemental and OC were analyzed using TOT. Particles of DE origin were identified by their high EC content in addition to specific trace elements, including manganese, sulfur, and iron. DPM concentrations exceeding 5 µg/m3 were reported for winter months during the study period. The investigators concluded that motor vehicles, vegetative burning, and HD DE were the three major sources contributing to ambient fine PM in Phoenix, with higher contributions in the winter than in summer.
During the winter of 1997, a study assessed DPM concentrations at two urban sites in the Denver area (Fujita et al., 1998). The Northern Front Range Air Quality Study (NFRAQS), initiated to assess the sources of the “brown cloud” observed along Colorado’s Front Range,
2-98

conducted air quality sampling during the winter of 1996, summer of 1996, and winter of 1997. For a 60-day period from December 1996 through January 1997, ambient samples collected at two urban Denver sites were analyzed for OC species for use in the extended-species CMB. The average DPM concentrations reported for the urban site at Welby, CO, and the suburban site at Brighton, CO, were 1.7 µg/m3 and 1.2 µg/m3, respectively. During the study period, DPM concentrations exceeded 5 µg/m3 on two occasions in Welby, with reported DPM concentrations of 5.7 µg/m3 and 7.3 µg/m3. DPM accounted for an average of 10% of ambient PM2.5, and gasoline PM accounted for an average of 27% of ambient PM2.5.
One of the major claims from the NFRAQS was a substantial contribution of EC from gasoline-powered vehicles, mainly from cold-start and high-emitting vehicles. At the Welby site, the contribution of diesel and gasoline emissions to EC measurements was 52% and 42%, respectively. At the Brighton site, the contribution of diesel and gasoline emissions to EC measurements was 71% and 26%, respectively. The findings from the NFRAQS are compelling and suggest the need for further investigations to quantify the contribution from cold-start and high-emitting vehicle emissions for both gasoline and diesel vehicles. Geographical, temporal, and other site-specific parameters that influence PM concentrations, such as altitude, must be considered when extrapolating the NFRAQS findings to other locations.
In addition to the need for urban and rural average DPM concentrations, an assessment of potential health effects resulting from DPM exposure includes an assessment of people in environments with potentially elevated levels of DPM. Limited data are available to allow a characterization of DPM concentrations in “hotspots” such as near heavily traveled roadways, bus stations, train stations, and marinas. Only one CMB study has attempted to apportion PM measured in an urban hotspot. Wittorff et al. (1994) reported results of conventional CMB performed on PM samples collected in the spring of 1993 over a 3-day period at a site adjacent to a major bus stop on Madison Avenue in midtown Manhattan. Buses in this area idle for as long as 10 minutes, and PM emissions are augmented by the elevated levels of DPM emitted during acceleration away from the bus stop (discussed in Section 2.2.5). DPM concentrations reported from this study ranged from 13.0 µg/m3 to 46.7 µg/m3. This study attributed, on average, 53% of the PM10 to DE. The DPM concentrations resulting from the source apportionment method used in this study require some caution because the CMB model overpredicted PM10 concentrations by an average 30%, which suggests that additional sources of the mass were not accounted for in the model. The relevance of the Manhattan bus stop concentrations and potential exposure for large urban populations provide strong motivation for further studies in the vicinity of such hotspots.
In summary, source apportionment studies of ambient samples collected before 1990 suggest that seasonal and annual average DPM concentrations for nonurban areas ranged from 2
2-99
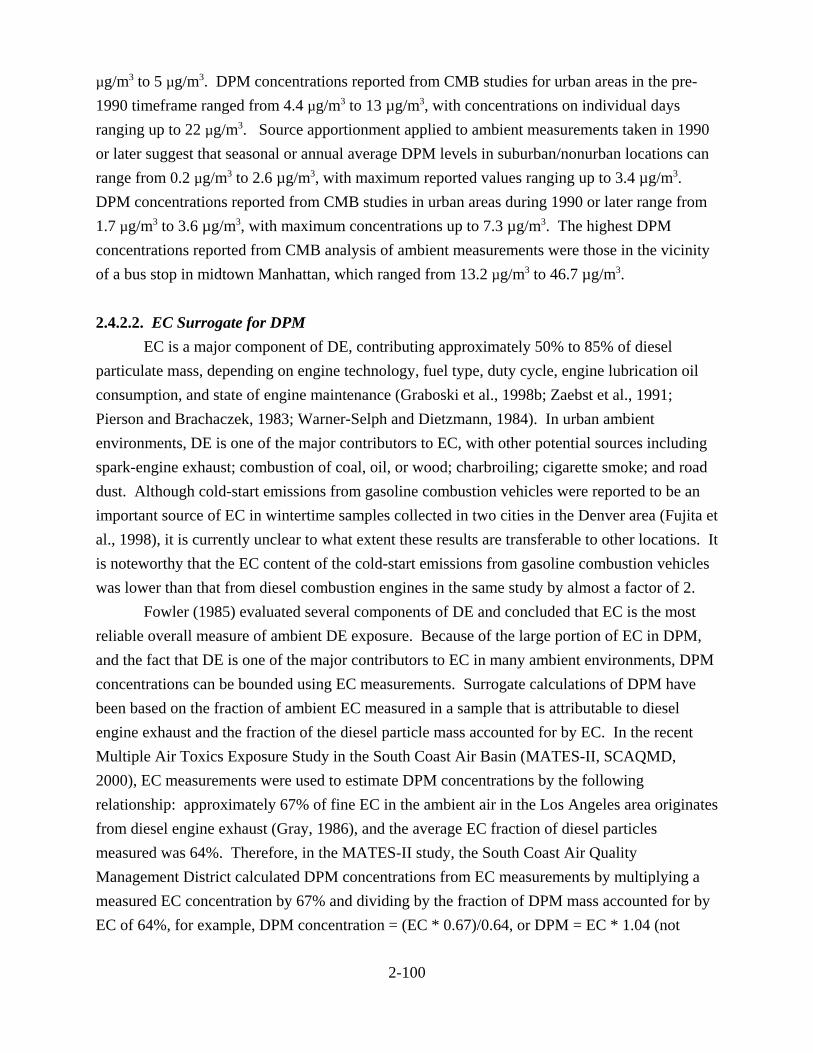
µg/m3 to 5 µg/m3. DPM concentrations reported from CMB studies for urban areas in the pre-1990 timeframe ranged from 4.4 µg/m3 to 13 µg/m3, with concentrations on individual days ranging up to 22 µg/m3. Source apportionment applied to ambient measurements taken in 1990 or later suggest that seasonal or annual average DPM levels in suburban/nonurban locations can range from 0.2 µg/m3 to 2.6 µg/m3, with maximum reported values ranging up to 3.4 µg/m3. DPM concentrations reported from CMB studies in urban areas during 1990 or later range from 1.7 µg/m3 to 3.6 µg/m3, with maximum concentrations up to 7.3 µg/m3. The highest DPM concentrations reported from CMB analysis of ambient measurements were those in the vicinity of a bus stop in midtown Manhattan, which ranged from 13.2 µg/m3 to 46.7 µg/m3.
2.4.2.2. EC Surrogate for DPM EC is a major component of DE, contributing approximately 50% to 85% of diesel
particulate mass, depending on engine technology, fuel type, duty cycle, engine lubrication oil consumption, and state of engine maintenance (Graboski et al., 1998b; Zaebst et al., 1991; Pierson and Brachaczek, 1983; Warner-Selph and Dietzmann, 1984). In urban ambient environments, DE is one of the major contributors to EC, with other potential sources including spark-engine exhaust; combustion of coal, oil, or wood; charbroiling; cigarette smoke; and road dust. Although cold-start emissions from gasoline combustion vehicles were reported to be an important source of EC in wintertime samples collected in two cities in the Denver area (Fujita et al., 1998), it is currently unclear to what extent these results are transferable to other locations. It is noteworthy that the EC content of the cold-start emissions from gasoline combustion vehicles was lower than that from diesel combustion engines in the same study by almost a factor of 2.
Fowler (1985) evaluated several components of DE and concluded that EC is the most reliable overall measure of ambient DE exposure. Because of the large portion of EC in DPM, and the fact that DE is one of the major contributors to EC in many ambient environments, DPM concentrations can be bounded using EC measurements. Surrogate calculations of DPM have been based on the fraction of ambient EC measured in a sample that is attributable to diesel engine exhaust and the fraction of the diesel particle mass accounted for by EC. In the recent Multiple Air Toxics Exposure Study in the South Coast Air Basin (MATES-II, SCAQMD, 2000), EC measurements were used to estimate DPM concentrations by the following relationship: approximately 67% of fine EC in the ambient air in the Los Angeles area originates from diesel engine exhaust (Gray, 1986), and the average EC fraction of diesel particles measured was 64%. Therefore, in the MATES-II study, the South Coast Air Quality Management District calculated DPM concentrations from EC measurements by multiplying a measured EC concentration by 67% and dividing by the fraction of DPM mass accounted for by EC of 64%, for example, DPM concentration = (EC * 0.67)/0.64, or DPM = EC * 1.04 (not
2-100

appreciably different from EC.DPM). This calculation, used in the MATES-II study, relies on data collected in the 1982 timeframe and may not accurately represent the current day contributions of diesel engines to the ambient EC inventory. Using a 1998 emissions inventory for the South Coast Air Basin, it is now estimated that a more appropriate conversion from EC to DPM is to multiply EC by 1.24 (MATES-II, SCAQMD, 2000).
An alternative calculation can be derived using data from recent studies in Colorado and Arizona (Fujita et al., 1998; Maricopa Association of Governments, 1999). The fraction of EC attributable to DE can be estimated from detailed source profiles applied to a CMB model as discussed above. The contribution of diesel engines to EC averaged 68% ± 20% for Brighton, CO, and 49% ± 26% at Welby, CO, as part of the winter 1996-1997 NFRAQS. In Phoenix, diesel engine exhaust was estimated to account for approximately 46% ± 22% of the ambient EC. For some environments, such as certain occupational settings in which diesel engines are in proximity to workers, all the EC may realistically be attributed to DE as a reasonable upper bound estimate of DPM concentrations.
As discussed in Section 2.2, the EC content of DPM can vary widely depending on engine type, load conditions, and the test cycle. However, typical profiles for HD and LD diesel engines have been determined and the typical EC fraction of DPM ranges from approximately 52% to 75%.
Ambient EC attributed to DE in the studies described above ranges from 46% to 68%. A lower-bound estimate of DPM from ambient EC measurements in areas with similar source contributions to those in the Phoenix and Denver areas can be derived using the equation:
DPM = (EC * 0.46)/0.75 or DPM = EC * 0.62
An upper-bound estimate uses the equation:
DPM = (EC * 0.68)/0.52 or DPM = EC * 1.31
Using the average of the ranges provides the equation:
DPM = EC * 0.89.
Clearly the choice of a point estimate can provide a surrogate calculation of DPM that can vary by at least a factor of two. Although a recommended surrogate DPM calculation method is not provided here, the surrogate DPM calculation is used to illustrate the usefulness of
2-101

this approach for estimating DPM in the absence of a more sophisticated receptor modeling analysis for locations where fine PM EC concentrations are available.
One source of variability in EC concentrations reported for ambient studies is the measurement method used to quantify EC. As discussed in Section 2.2.8.1, EC and OC are operationally defined. Ambient samples are typically analyzed for EC using thermal optical reflectance or thermal optical transmittance. The measurement technique used in the NFRAQS and Phoenix studies was TOR, which, as discussed in Section 2.2.8.2, often results in higher EC levels compared to TOT analyses.
Table 2-24 provides a lower- and upper-bound DPM estimate from annual average EC concentrations for three urban areas, in addition to DPM concentrations reported from EC measurements for the MATES- II (SCAQMD, 2000). Under an EPA research grant with the Northeastern States for Coordinated Air Use Management (NESCAUM), PM2.5 samples were collected every 6 days for 1 year (1995) in Boston (Kenmore Square), MA, and Rochester, NY, and were analyzed for EC using TOT (Salmon et al., 1997). DPM concentrations were estimated to be in the range from 0.8 µg/m3 to 1.7 µg/m3 in Boston, and from 0.4 µg/m3 to 0.8 µg/m³ in Rochester (Table 2-24).
Table 2-24. Ambient diesel particulate matter concentrations from elemental carbon measurements in urban locations
Reference Year of sampling Location
DPM2.5 Fg/m3 lower-upper bound
range (point estimate)a
DPM % of total
PM Salmon et al., 1997 1995, annual Boston, MA 0.8–1.7 (1.1) 6-12
Rochester, NY 0.4-0.8 (0.5) 3-6 Sisler, 1996 1992-1995,
annual Washington, DC 0.9-2.2 (1.5) 4-12
MATES II c Diesel PM2.5 Fg/m3
avg± std dev. South Coast Air Quality Management District, 1999
1995-6, annual Anaheim, CA 2.4 ± 1.8 b
Burbank, CA 3.3 ± 1.9 b
Los Angeles, CA 3.5 ± 1.9 b
Fontanta, CA 3.4 ± 2.3 b
Huntington Park, CA 4.5 ± 2.4 b
Long Beach, CA 2.5 ± 1.7 b
Pico Rivera, CA 4.4 ± 2.2 b
Rubidoux, CA 3.4 ± 2.0 b
a Lower-bound range: DPM=EC*0.62; upper-bound range: DPM=EC*1.31; point estimate: DPM=EC*0.89.b Not available.cThe Multiple Air Toxics Exposure Study in the South Coast Air Basin reported DPM calculated from ECconcentrations as DPM=EC*1.04. Standard deviations are reported.
2-102

The Interagency Monitoring of Protected Visual Environments (IMPROVE) project being conducted by the National Park Service includes an extensive aerosol monitoring network mainly in rural or remote areas of the country (national parks, national monuments, wilderness areas, national wildlife refuges, and national seashores), and also in Washington, DC (Sisler, 1996). PM2.5 samples, collected from March 1992 through February 1995 twice weekly for 24-hour duration at 43 sites (some co-located in the same rural park area), were analyzed for a suite of chemical constituents, including EC (using TOR). EC concentrations in these rural locations may have EC source contributions quite different from those in the urban areas in which the fraction of EC attributable to DE has been reported. The lack of information regarding EC sources in these rural locations makes the application of the EC surrogate highly uncertain. It is noteworthy that annual average EC concentrations in the rural and remote regions reported as part of the IMPROVE network range from 0.1 µg/m³ for Denali National Park, AK, to 0.9 µg/m³ for the Lake Tahoe, CA, area. In Washington, DC, the annual average EC concentration of 1.7 µg/m³ is estimated as an annual average DPM concentration of 1.4 µg/m³.
The annual average EC measurements in Washington, DC, suggest that the DPM concentrations are in the range from 1.0 µg/m3 to 2.2 µg/m³, accounting for 5% to 12% of ambient PM2.5. Seasonally averaged data for the Washington, DC, site indicate that EC concentrations and, by extension, DPM concentrations peak in the autumn and winter (2.0 µg/m3
and 0.9 µg/m³ EC, respectively). DPM concentrations reported recently as part of the MATES-II study at eight locations
ranged from 2.4 µg/m3 to 4.5 µg/m³. DPM concentrations at Huntington Park and Pico Rivera, CA, were higher than other DPM concentrations in the South Coast Air Basin, perhaps because of higher diesel truck traffic, proximity to nonroad diesel sources, or nondiesel sources of EC, including gasoline vehicle traffic.
In a recent study of the trends in fine particle and EC concentrations in Southern California, Christoforou et al. (2000) report that EC concentrations measured in 1993 were 29%-40% of EC concentrations measured in 1982 at four urban Los Angeles sites. The authors credit lower PM emission rates from on-road diesel engines as well as cleaner-burning diesel fuel for the observed EC decrease. The extent to which nonroad diesel equipment impacts a given site will influence the trend in ambient EC concentrations because fewer regulations have been promulgated to control the PM emissions from these engines.
2.4.2.3. Dispersion Modeling Results Dispersion models estimate ambient levels of PM at a receptor site on the basis of
emission factors for the relevant sources and parameters that simulate atmospheric processes such as the advection, mixing, deposition, and chemical transformation of compounds as they are
2-103
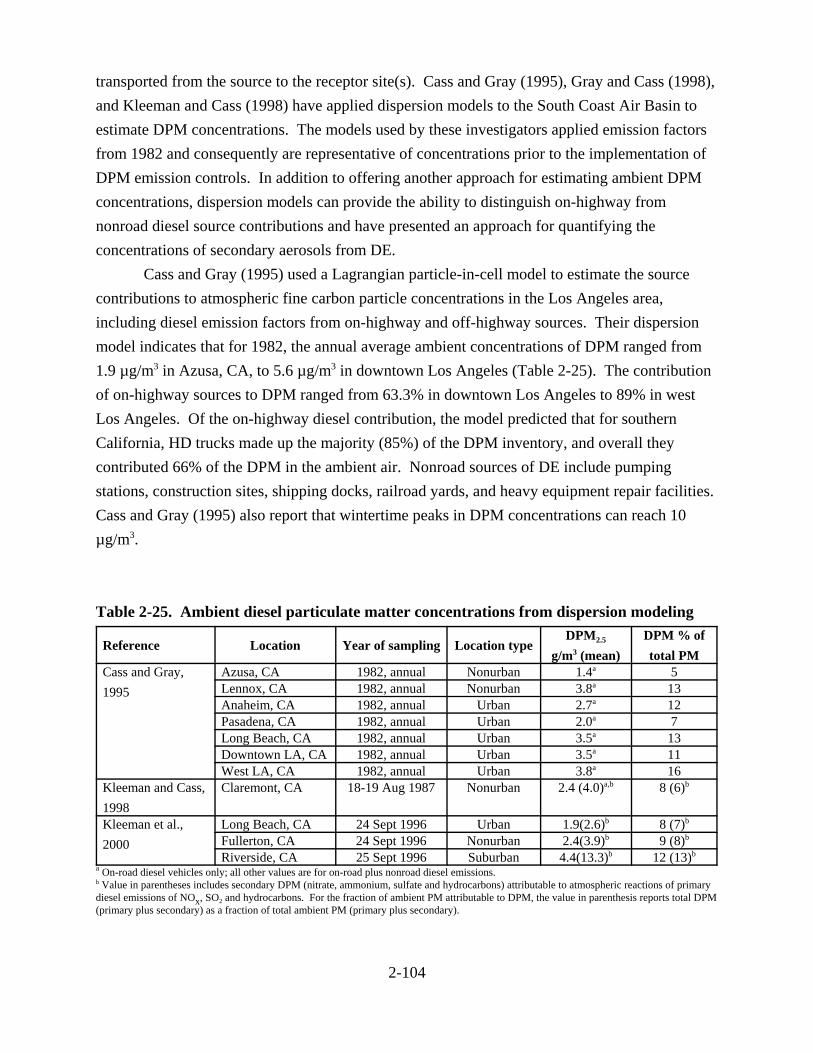
transported from the source to the receptor site(s). Cass and Gray (1995), Gray and Cass (1998), and Kleeman and Cass (1998) have applied dispersion models to the South Coast Air Basin to estimate DPM concentrations. The models used by these investigators applied emission factors from 1982 and consequently are representative of concentrations prior to the implementation of DPM emission controls. In addition to offering another approach for estimating ambient DPM concentrations, dispersion models can provide the ability to distinguish on-highway from nonroad diesel source contributions and have presented an approach for quantifying the concentrations of secondary aerosols from DE.
Cass and Gray (1995) used a Lagrangian particle-in-cell model to estimate the source contributions to atmospheric fine carbon particle concentrations in the Los Angeles area, including diesel emission factors from on-highway and off-highway sources. Their dispersion model indicates that for 1982, the annual average ambient concentrations of DPM ranged from 1.9 µg/m3 in Azusa, CA, to 5.6 µg/m3 in downtown Los Angeles (Table 2-25). The contribution of on-highway sources to DPM ranged from 63.3% in downtown Los Angeles to 89% in west Los Angeles. Of the on-highway diesel contribution, the model predicted that for southern California, HD trucks made up the majority (85%) of the DPM inventory, and overall they contributed 66% of the DPM in the ambient air. Nonroad sources of DE include pumping stations, construction sites, shipping docks, railroad yards, and heavy equipment repair facilities. Cass and Gray (1995) also report that wintertime peaks in DPM concentrations can reach 10 µg/m3.
Table 2-25. Ambient diesel particulate matter concentrations from dispersion modeling
Reference Location Year of sampling Location type DPM2.5
g/m3 (mean) DPM % of total PM
Cass and Gray, 1995
Azusa, CA 1982, annual Nonurban 1.4a 5 Lennox, CA 1982, annual Nonurban 3.8a 13 Anaheim, CA 1982, annual Urban 2.7a 12 Pasadena, CA 1982, annual Urban 2.0a 7 Long Beach, CA 1982, annual Urban 3.5a 13 Downtown LA, CA 1982, annual Urban 3.5a 11 West LA, CA 1982, annual Urban 3.8a 16
Kleeman and Cass, 1998
Claremont, CA 18-19 Aug 1987 Nonurban 2.4 (4.0)a,b 8 (6)b
Kleeman et al., 2000
Long Beach, CA 24 Sept 1996 Urban 1.9(2.6)b 8 (7)b
Fullerton, CA 24 Sept 1996 Nonurban 2.4(3.9)b 9 (8)b
Riverside, CA 25 Sept 1996 Suburban 4.4(13.3)b 12 (13)b
a On-road diesel vehicles only; all other values are for on-road plus nonroad diesel emissions. b Value in parentheses includes secondary DPM (nitrate, ammonium, sulfate and hydrocarbons) attributable to atmospheric reactions of primarydiesel emissions of NOx, SO2 and hydrocarbons. For the fraction of ambient PM attributable to DPM, the value in parenthesis reports total DPM(primary plus secondary) as a fraction of total ambient PM (primary plus secondary).
2-104

Kleeman and Cass (1998) developed a Lagrangian model that examines the size and chemical evolution of aerosols, including gas-to-particle conversion processes during transport. This model was applied to one well-characterized episode in Claremont, CA, on August 27-28, 1987. The model provided reasonable predictions of PM10 (overpredicting PM10 by 13%), EC, and OC, and it adequately reconstructed the size distribution of the aerosols. The model indicated that on August 27-28, 1987, the PM2.5 concentration was 76.7 µg/m3, 13.2% (10.1 µg/m3) of which was attributable to diesel engine emissions. This estimate includes secondary aerosol formation for sulfate, ammonium, nitrate, and organic compounds, which accounted for 4.9 µg/m3 of the total estimated DPM mass. The secondary organic aerosol was estimated to be 1.1 µg/m3, or 31% of the total secondary aerosol mass, with the remainder composed of nitrate, ammonium, and sulfate aerosols.
Dispersion modeling estimates of diesel PM concentrations from on-highway and nonroad sources have recently been developed as part of the EPA National Air Toxics Assessment (NATA) National Scale Assessment. This assessment uses the Assessment System for Population Exposure Nationwide (ASPEN) dispersion model to estimate ambient concentrations for the year 1996. The NATA national scale assessment reports concentrations of DPM and 32 additional urban air toxic compounds at the county, State, and national level (NATA, 2001).
ASPEN makes a number of simplifying assumptions in order to model concentrations on a nationwide scale. For instance, concentration estimates at the census tract level were estimated using modeling assumptions to allocate emissions from the county level, and the model is very sensitive to the assumptions used. In addition, dispersion of emissions from nonpoint sources (e.g., on-highway and nonroad vehicles) was treated simplistically. For resident tracts that have radii greater than 0.3 km, non-point-source ambient concentrations are estimated on the basis of five pseudo-point sources. The average concentration for the census tract is determined by spatially averaging the ambient concentrations associated with the receptors defined for the five pseudosources that fall within the bounds of the tract. Other limitations include the following: terrain impacts on dispersion were not included; the study relied on long-term climate summary data, and no long-range transport was included for DPM (medium-range transport for DPM, within 300 km, was included). Because of the limitations, the results are most meaningfully interpreted when viewed over large geographic areas. The 1996 results from ASPEN compare well (generally within a factor of 1.5) with estimated concentrations from EC measurements and receptor modeling, as well as data from other dispersion modeling studies. The complete results of the assessment are available at http://www.epa.gov/ttn/uatw/nata.
2-105

Table 2-26 presents 25th percentile, average, and 75th percentile nationwide concentrations from the 1996 National-Scale Assessment as well as the contribution of on-road and nonroad DE the sources to the nationwide average. The national average DPM concentration reported in the National-Scale Assessment is 2.1 µg/m3, of which nonroad sources are estimated to contribute 67% and on-road sources contribute the remainder. Less than 2% of the nationwide DE inventory is attributed to point sources, and these were not included in the modeling as part of National-Scale Assessment. A wide range in average State-specific ambient DPM concentrations was reported by the National-Scale Assessment with the lowest values for mainly rural States with few DE sources, such as Wyoming (annual average of 0.2 µg/m3), and the highest values for States with large urban centers such as New York (annual average of 5.4 µg/m3).
Table 2-26. Nationwide ambient diesel particulate matter concentrations for 1996 from the National Air Toxics Assessment National-Scale Assessment dispersion modeling
Location
25th percentile,
DPM10 mg/m3
Average, DPM10 mg/m3
75th percentile,
DPM10 mg/m3
Contribution to average from on-
road sources, DPM10 mg/m3
Contribution to average from
nonroad sources, DPM10 mg/m3
Nationwide 0.9 2.1 2.5 0.6 1.4 All urban counties
1.2 2.4 2.7 0.7 1.7
All rural counties
0.4 0.7 1.0 0.3 0.5
Source: NATA, 2001. Data available at http://www.epa.gov/ttn/uatw/nata.
2.4.3. Exposures to Diesel Exhaust Ultimately, it is personal exposure that determines health impacts. In the following
sections, modeled average exposures and some information reflecting potential exposures for those who spend a large portion of their time outdoors are presented. Occupational exposures to DPM are summarized for the variety of workplaces in which diesel engines are used. These occupational exposures are placed into context with equivalent environmental exposures to understand the potential for overlap in average occupational and average ambient exposures. Because DE is a mixture of particles and gases, one must choose a measure of exposure (i.e., dosimeter); µg/m3 of DPM has historically been used in many studies as the dosimeter for the entire DE mixture.
2-106

2.4.3.1. Occupational Exposure to DE The National Institute for Occupational Safety and Health (NIOSH, 1988) estimates that
approximately 1.35 million workers are occupationally exposed to DE emissions. Such workers emissions include mine workers, railroad workers, bus and truck drivers, truck and bus maintenance garage workers, loading dock workers, firefighters, heavy equipment operators, and farm workers.
Measurements of DPM exposure in occupational environments have included respirable particulate (<3.5 µm), smoking-corrected respirable particulate, combustible respirable particulate, and EC, among other methods. The measurement method used in each of the studies discussed below is listed in Table 2-27. Occupational exposures to DPM as well as breathing zone concentrations of DPM have been described in some detail by Watts (1995), Groves and Cain (2000), Hammond (1998), the World Health Organization (1996), and Birch and Cary (1996) and are briefly, but not comprehensively, summarized here.
The highest occupational exposures to DPM are for workers in coal mines and noncoal mines using diesel-powered equipment. These exposures, reported by several investigators, range from approximately 10 µg/m3 to 1,280 µg/m3 (Table 2-27). Rogers and Whelan (1999) report exposures to specific DPM-associated PAHs (including naphthalene, fluorene, phenanthrene, pyrene, and benz[a]anthracene) for mine workers using diesel fuels containing low and high levels of sulfur, aliphatic, and aromatic compounds. Results of this study indicate that the composition of DPM to which workers were exposed varies considerably based on engine condition, fuel, and other operating parameters. Mine worker exposures to PAH compounds were highest for naphthalene, ranging from 1,312 µg/g to 3,228 µg/g of organics, and exposures were lowest for benz[a]anthracene, ranging from less than 3 µg/g up to 18 µg/g of organics.
Other investigators have reported DPM-associated PAH concentrations that do not necessarily represent personal exposures but are a snapshot of short periods of elevated concentration that make up a portion of a worker’s daily exposure. Bagley et al. (1991, 1992) reported levels of B[a]P ranging from below the detection limit of 0.05 ng/m3 to 61 ng/m3
collected only during periods of mining activity. Watts (1995) reported DPM concentrations in four mines collected during significant diesel activity, ranging from 850 µg/m3 to 3,260 µg/m3. Heino (1978) reports DPM concentrations for locomotive engineers reaching 2,000 µg/m3.
In a study of four railroads, Woskie et al. (1988) reported concentrations of respirable dust (corrected for cigarette smoke particulate) that ranged from 39 µg/m3 for engineers/firers to 134 µg/m3 for locomotive shop workers and 191 µg/m3 for hostlers. Woskie et al. (1988) also reported smoking-corrected respirable dust for railroad clerks (17 µg/m3), who are considered to be not exposed to DE. Although these exposures may have included nondiesel PM (background
2-107

Table 2-27. Occupational exposure to DPM
Author Year of sample
Location/job type, typical work schedule of 8 hours
n Sample type
Range in DPM, µg/m3
Gangal and Dainty, 1993a
NA Noncoal mine workers ~200 RCD 100–900
Säverin, 1999 1992 Noncoal mine workers 255b RTC 38–1,280
Rogers and Whelan, 1999
1990-99 Coal mine workers >1,300 DPSMM 10–640
Haney, 1990a 1980s Coal mine workers (five mines)
NA SJI 180–1,000
Ambs, 1991aa NA Coal mine workers (four mines)
NA PDEAS 750–780
Woskie et al., 1988 3-years in mid-1980s Railroad engineer/frier 128 ARP 39–73 Railroad braker/conductor 158 ARP 52–191 Railroad shop workers 176 ARP 114–134
Groves and Cain, 2000
NA Railway repair 64 EC(U) 7-50
Froines et al., 1987 1985 Firefighters (two stations) 238 TSP 63–748
NIOSH, 1992a NA Firefighters (three stations)
18 EC(T) 6–70
Birch and Cary, 1996
NA Firefighters NA EC(U) 20–79
NA Fire station employees (four stations)
NA EC(U) 4–52
Birch and Cary, 1996
NA Airport ground crew NA EC(U) 7–15
NA Public transit workers NA EC(U) 15–98
NIOSH, 1990 1990 Diesel forklift dockworkers 24 EC(T) 12–61 Zaebst et al., 1991 1990 Dockworkers 75 EC(T) 9–20
Mechanics 80 EC(T) 5–28
Long- and short-haul truckers 128 EC(T) 2–7 Groves and Cain, 2000
NA Bus garage/repair
Forklift trucks
53
27
EC(U)
EC(U)
7-217
7-403
Kittelson et al., 2000 1999-2000 Bus drivers 39 EC(T) 1–3
Parking ramp attendants 12 EC(T) 2 ± 0.4 a Cited in Watts (1995). NA: not available.b Personal exposure and area samples were not reported separately for this study.RCD: respirable combustible dust; RTC: respirable total carbon SPM: submicrometer PM; DPSMM: dieselparticulate submicron mass (two-stage impaction sampler used to separate PM by size); EC(T): elemental carbonanalyzed by TOT; EC(R) elemental carbon analyzed by TOR; EC(U) elemental carbon analyzed by colouremetricmethod or method not reported; SJI: single-jet impactor agreed within 10% with simultaneous PDEASmeasurements; PDEAS: personal DE aerosol sampler collects DPM <0.8 Fm, SPM: particulate matter; ARP:respirable particulate adjusted to remove the influence of cigarette smoke; TSP: total suspended particulate matter.
2-108

respirable dust levels have been estimated to have contributed approximately 10 µg/m3 to 33 µg/m3 for this study), the majority of the respirable PM is believed to have originated from diesel locomotive emissions. Groves and Cain (2000) reported EC exposures among railway repair workers averaging 21 µg/m3 with a range from 7-50 µg/m3. DPM exposures reported for firefighters operating diesel engine vehicles range from 4 µg/m3 to 748 µg/m3, which also encompasses the range of DPM exposures reported for airport ground crew and public transportation system personnel (7 µg/m3 to 98 µg/m3).
Studies reporting DE exposure among fire station employees typically report particulate levels below 100 µg/m3 (ranging from 4 µg/m3 to 79 µg/m3) (NIOSH, 1992; Birch and Cary, 1996). In a study by Froines et al. (1987), DPM exposures for firefighters in two stations ranged from 39 µg/m3 to 73 µg/m3. Birch and Cary (1996) also reported DPM exposures for airport ground crew and public transit workers, ranging from 7 µg/m3 to 15 µg/m3 for airport ground crews and 15 µg/m3 to 98 µg/m3 for public transit workers. Dock workers using diesel-powered forklifts have been reported to have DPM exposures ranging from 6 µg/m3 to 403 µg/m3
(NIOSH, 1990; Zaebst et al., 1991; Groves and Cain, 2000). In studies by NIOSH (1990) and Fowler (1985), the organic material measured accounted for about one-half to almost all of the carbonaceous DPM exposures, providing evidence that some pieces of nonroad equipment (forklifts and construction equipment) emitted DPM with a significant OC fraction in the 1980s and early 1990s.
Zaebst et al. (1991) also reported DPM exposures for mechanics, road drivers, and local drivers for 8-hour shifts at each of six large hub truck terminals. Residential background and highway background samples at fixed sites were also collected during warm-weather and cold-weather periods, and the geometric mean for DPM concentrations ranged from 1 µg/m3 to 5 µg/m3. DPM exposures for road and local truckers in warm- and cold-weather periods ranged from 2 µg/m3 to 7 µg/m3, whereas exposure levels for mechanics were reported between 5 µg/m3
and 28 µg/m3 (geometric means). Kittelson et al. (2000) are measuring DPM exposures for bus drivers, parking garage
attendants, and mechanics using TOT to quantify EC. Personal exposures for bus drivers on four different routes range from 1 µg/m3 to 3 µg/m3 and exposure among parking ramp attendants averaged 2 µg/m3. These results are preliminary, and data for the mechanics have not yet been analyzed. This study will also characterize PAH compounds to which these workers are exposed.
Bus garage workers have also been assessed for exposure to DE using urinary excretion of 8-oxo-2'-deoxyguanosine (Loft et al., 1999). Other biomarkers of DE exposure in occupational workers have included measurements of urinary 1-hydroxypyrene, adducts of DNA
2-109
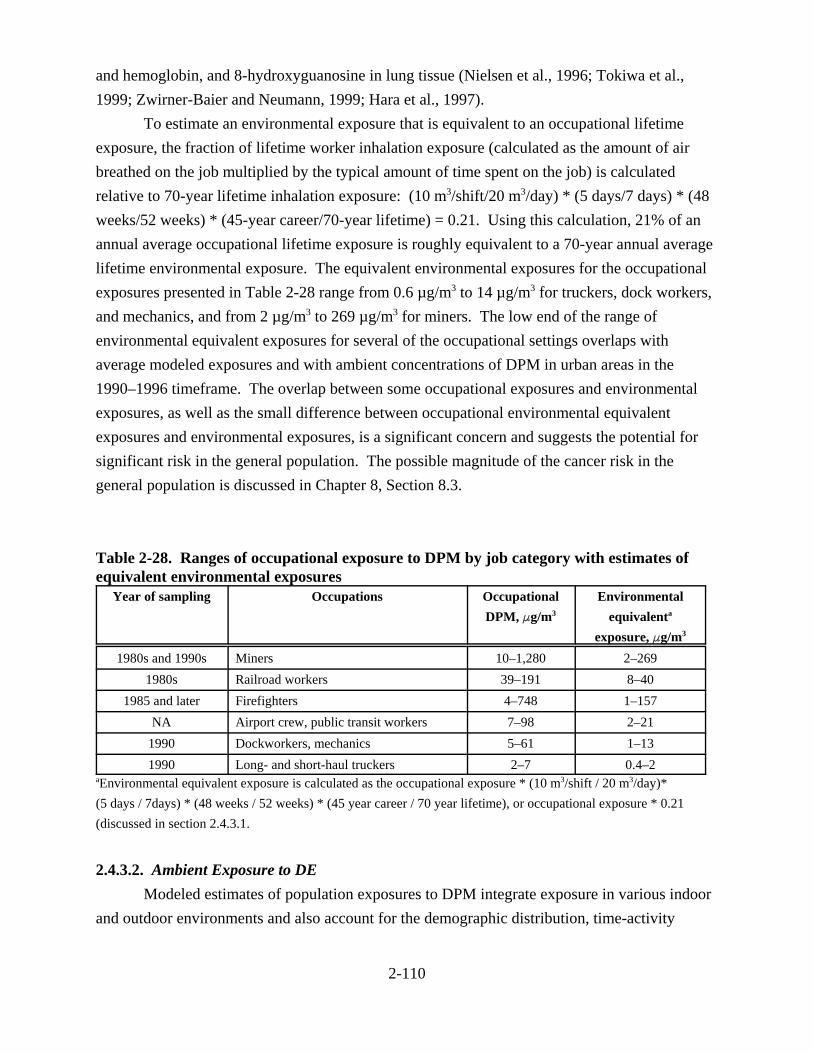
and hemoglobin, and 8-hydroxyguanosine in lung tissue (Nielsen et al., 1996; Tokiwa et al., 1999; Zwirner-Baier and Neumann, 1999; Hara et al., 1997).
To estimate an environmental exposure that is equivalent to an occupational lifetime exposure, the fraction of lifetime worker inhalation exposure (calculated as the amount of air breathed on the job multiplied by the typical amount of time spent on the job) is calculated relative to 70-year lifetime inhalation exposure: (10 m3/shift/20 m3/day) * (5 days/7 days) * (48 weeks/52 weeks) * (45-year career/70-year lifetime) = 0.21. Using this calculation, 21% of an annual average occupational lifetime exposure is roughly equivalent to a 70-year annual average lifetime environmental exposure. The equivalent environmental exposures for the occupational exposures presented in Table 2-28 range from 0.6 µg/m3 to 14 µg/m3 for truckers, dock workers, and mechanics, and from 2 µg/m3 to 269 µg/m3 for miners. The low end of the range of environmental equivalent exposures for several of the occupational settings overlaps with average modeled exposures and with ambient concentrations of DPM in urban areas in the 1990–1996 timeframe. The overlap between some occupational exposures and environmental exposures, as well as the small difference between occupational environmental equivalent exposures and environmental exposures, is a significant concern and suggests the potential for significant risk in the general population. The possible magnitude of the cancer risk in the general population is discussed in Chapter 8, Section 8.3.
Table 2-28. Ranges of occupational exposure to DPM by job category with estimates of equivalent environmental exposures
Year of sampling Occupations Occupational DPM, Fg/m3
Environmental equivalenta
exposure, Fg/m3
1980s and 1990s Miners 10–1,280 2–269 1980s Railroad workers 39–191 8–40
1985 and later Firefighters 4–748 1–157 NA Airport crew, public transit workers 7–98 2–21
1990 Dockworkers, mechanics 5–61 1–13 1990 Long- and short-haul truckers 2–7 0.4–2
aEnvironmental equivalent exposure is calculated as the occupational exposure * (10 m3/shift / 20 m3/day)* (5 days / 7days) * (48 weeks / 52 weeks) * (45 year career / 70 year lifetime), or occupational exposure * 0.21 (discussed in section 2.4.3.1.
2.4.3.2. Ambient Exposure to DE Modeled estimates of population exposures to DPM integrate exposure in various indoor
and outdoor environments and also account for the demographic distribution, time-activity
2-110
patterns, and DPM concentrations in various environments, including job-related exposures. Two modeling efforts have been developed to determine DPM exposures in the general population: the Hazardous Air Pollutant Exposure Model for Mobile Sources, version 3 (HAPEM-MS3) and the California Population Indoor Exposure Model (CPIEM). EPA has also developed version 4 of the HAPEM, which provides State-specific average exposures for DPM and 32 other urban air toxic compounds. The draft exposure assessment using HAPEM version 4 (HAPEM4) has been conducted as part of the National Air Toxics Assessment National-Scale Analysis described in Section 2.4.2.3 above and results are provided here.
2.4.3.2.1. The Hazardous Air Pollutant Exposure Model. To estimate population exposures to DPM, EPA has used HAPEM-MS3 (U.S. EPA, 1999b). This model provides national and urban-area-specific exposures to DPM from on-road sources only. HAPEM-MS3 is based on the CO probabilistic National Ambient Air Quality Standards (NAAQS) exposure model (pNEM/CO), which is used to estimate the frequency distribution of population exposure to CO and the resulting carboxyhemaglobin levels (Law et al., 1997). HAPEM simulates the CO exposure scenario of individuals in 22 demographic groups for 37 microenvironments. CO concentrations are based on ambient measurements made in 1990 and are related to exposures of individuals in a 10-km radius around the sampling site. DPM exposures are calculated as in Equation 2-5, using a ratiometric approach to CO.
DPM µg m3 = (CO µg m3 /COg mi )× DPM g /mi (2-5)
/ / /
Data provided to the model include CO monitoring data for 1990; time-activity data collected in Denver, Washington, DC, and Cincinnati from 1982 to 1985; microenvironmental data; and 1990 census population data. Motor vehicle DPM and CO emission rates reported by EPA (1999c) are used to calculate mobile-source DPM exposures, and exposures in future years are projected based on the increase in vehicle miles traveled. EPA’s PART5 model is used to estimate DPM emission rates (g/mi) for the fleet as a whole in any given calendar year. PART5 is currently being modified to account for deterioration, actual in-use emissions, poor maintenance, and tampering effects, all of which increase emission factors. As a result, HAPEM-MS3 exposure estimates based on PART5 emission factors may underestimate true exposures from on-road sources. A comparison of PART5 HD diesel vehicle emission factors with those presented earlier in this chapter suggests that PART5 may underestimate HD diesel vehicle emissions by up to 50%.
HAPEM-MS3 assumes that the highway fleet (gasoline plus diesel) emissions ratio of CO to DPM can be used as an adjustment factor to convert estimated CO personal exposure to
2-111

DPM exposure estimates. This assumption is supported by the observation that even though gasoline vehicles emit the large majority of CO, gasoline and diesel highway vehicles travel on the same roadways. DPM and CO are both relatively long-lived atmospheric species (1–3 days) except under certain conditions (Seinfeld and Pandis, 1998); therefore, the model does not account for chemical and physical differences between the DPM and CO, and the model assumes that for the average person in a modeled air district, CO and DPM are well mixed. Exposure in microscale environments in which these assumptions may not be valid were not modeled.
A validation study conducted for the pNEM/CO model on which HAPEM-MS3 is based indicates that CO exposures for the population in the 5th percentile were overestimated by approximately 33%, whereas those with exposures in the 98th percentile were underestimated by about 30%. This validation study is considered applicable to the HAPEM-MS3 model. To address the underestimate of exposures for the most highly exposed, Brodowicz (1999) used CO concentrations relevant to the most highly exposed populations to determine DPM exposures for different demographic groups within this population; the results are discussed below.
Annual average DPM exposures from on-road vehicles and nonroad sources nationwide for the general population, rural and urban population, outdoor workers, and urban children are reported in Tables 2-29 and 2-30. The modeled annual average DPM exposure nationwide (urban and rural areas) in 1996 from on-road sources only was 0.8 µg/m3. The modeled annual average exposure in urban areas for the same year was 0.8 µg/m3, and the modeled exposure for rural areas was 0.4 µg/m3. Among the demographic groups modeled, urban outdoor workers in general were found to have the highest average exposure to DPM, averaging 1.0 µg/m3 from on-road sources in 1996. DPM exposures attributable to on-road sources are projected to decrease until approximately 2007 because of fleet turnover and the full implementation of Federal regulations that are currently in place. Full implementation of the recently finalized Heavy-Duty Engine and Vehicle Standards and Highway Diesel Fuel Sulfur Control Requirements would significantly lower DPM exposures from on-road sources in the post-2007 timeframe (U.S. EPA, 2000b).
Because diesel vehicle traffic, and therefore exposure to DPM, varies for different urban areas, HAPEM-MS3 was used to estimate annual average population exposures for 10 urban areas. Modeled 1996 DPM exposures in the cities ranged from 0.6 µg/m3 in Chicago and St. Louis to 1.3 µg/m3 in Phoenix (Table 2-31). In 1996, estimated average DPM exposure from on-road sources was higher than the national average in five cities: Atlanta, Minneapolis, New York, Phoenix, and Spokane. Nationally in 1996, 97% of DPM exposure from on-road vehicles was attributable to HD diesel vehicles, and the rest was generated mainly by LD diesel trucks.
2-112

Table 2-29. Annual average nationwide DPM exposure estimates (µg/m3) from on-road sources for rural and urban demographic groups in 1990, 1996, and 2007 using HAPEM-MS3
Demographic group 1990 1996 2007
50-State population 0.8 0.8 0.4
Rural population 0.5 0.4 0.2
Urban population 0.9 0.8 0.4
Urban outdoor workers 1.1 1.0 0.5
Urban children (0-17) 0.9 0.8 0.4 Source: U.S. EPA, 1999b, adjusted to reflect HDDV VMT described in U.S. EPA, 2000b.
Table 2-30. Draft annual average, 25th, and 75th percentile nationwide DPM exposure estimates (µg/m3) from on-road and nonroad sources for rural and urban counties in 1996 using HAPEM4
Demographic group
25th Percentile, DPM10 mg/m3
Average, DPM10 mg/m3
75th Percentile, DPM10 mg/m3
Contribution to average from on-
road sources, DPM10 mg/m3
Contribution to average from
nonroad sources, DPM10 mg/m3
Nationwide 0.6 1.4 1.8 0.5 0.9
Rural population 0.3 0.6 0.7 0.2 0.3 Urban population 0.8 1.6 2.0 0.5 1.1
Source: NATA, 2001. Data available at http://www.epa.gov/ttn/uatw/nata.
Because HAPEM-MS3 is suspected to underestimate exposures in highly exposed populations, 1990 CO concentrations relevant to the most highly exposed populations were used to determine 1990 DPM exposures for different demographic groups in this population. The highest DPM exposures ranged from 0.8 µg/m3 for outdoor workers in St. Louis to 2.0 µg/m3 for outdoor workers in Spokane and up to 4.0 µg/m3 for outdoor children in New York (Table 2-31). The highest exposed demographic groups were those who spend a large portion of their time outdoors. It is important to note that these exposure estimates are lower than the total exposure to DPM because they reflect only DPM from on-road sources and not exposure to nonroad DPM emissions.
2-113
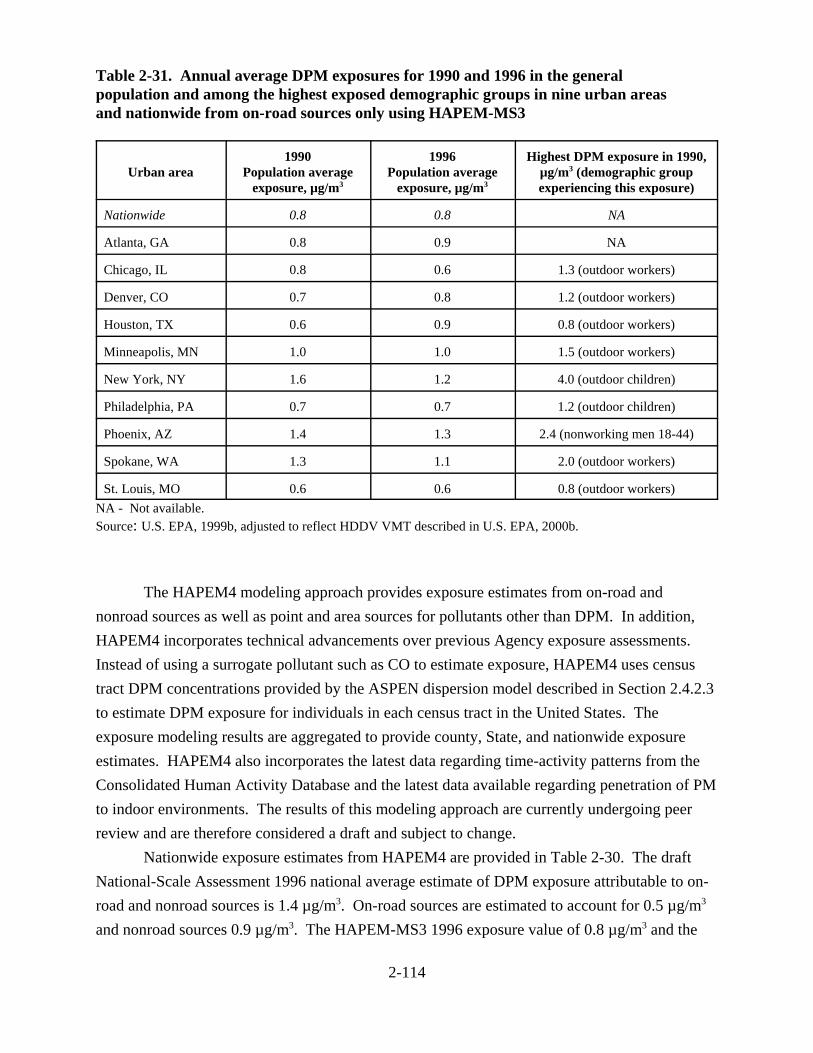
Table 2-31. Annual average DPM exposures for 1990 and 1996 in the general population and among the highest exposed demographic groups in nine urban areas and nationwide from on-road sources only using HAPEM-MS3
Urban area 1990
Population average exposure, µg/m3
1996 Population average
exposure, µg/m3
Highest DPM exposure in 1990, µg/m3 (demographic group experiencing this exposure)
Nationwide 0.8 0.8 NA
Atlanta, GA 0.8 0.9 NA
Chicago, IL 0.8 0.6 1.3 (outdoor workers)
Denver, CO 0.7 0.8 1.2 (outdoor workers)
Houston, TX 0.6 0.9 0.8 (outdoor workers)
Minneapolis, MN 1.0 1.0 1.5 (outdoor workers)
New York, NY 1.6 1.2 4.0 (outdoor children)
Philadelphia, PA 0.7 0.7 1.2 (outdoor children)
Phoenix, AZ 1.4 1.3 2.4 (nonworking men 18-44)
Spokane, WA 1.3 1.1 2.0 (outdoor workers)
St. Louis, MO 0.6 0.6 0.8 (outdoor workers) NA - Not available.Source: U.S. EPA, 1999b, adjusted to reflect HDDV VMT described in U.S. EPA, 2000b.
The HAPEM4 modeling approach provides exposure estimates from on-road and nonroad sources as well as point and area sources for pollutants other than DPM. In addition, HAPEM4 incorporates technical advancements over previous Agency exposure assessments. Instead of using a surrogate pollutant such as CO to estimate exposure, HAPEM4 uses census tract DPM concentrations provided by the ASPEN dispersion model described in Section 2.4.2.3 to estimate DPM exposure for individuals in each census tract in the United States. The exposure modeling results are aggregated to provide county, State, and nationwide exposure estimates. HAPEM4 also incorporates the latest data regarding time-activity patterns from the Consolidated Human Activity Database and the latest data available regarding penetration of PM to indoor environments. The results of this modeling approach are currently undergoing peer review and are therefore considered a draft and subject to change.
Nationwide exposure estimates from HAPEM4 are provided in Table 2-30. The draft National-Scale Assessment 1996 national average estimate of DPM exposure attributable to on-road and nonroad sources is 1.4 µg/m3. On-road sources are estimated to account for 0.5 µg/m3
and nonroad sources 0.9 µg/m3. The HAPEM-MS3 1996 exposure value of 0.8 µg/m3 and the
2-114

most recent draft National-Scale Assessment value of 0.5 µg/m3 differ slightly as a result of the different modeling approaches. Both the HAPEM-MS3 and HAPEM4 exposure results support the risk perspective provided in Chapter 8, Section 8.3.
2.4.3.2.2. Personal exposures: microenvironments/hotspots. Personal monitoring for DPM exposure has focused on occupationally exposed groups, including railroad workers, mine workers, mechanics, and truck drivers. Although some studies have measured personal exposures to ambient PM, none have conducted detailed chemical analysis to quantify the portion of PM attributable to DE (e.g., using extended species CMB, discussed above). EC concentrations have been reported for some microenvironments and are discussed in this section. Microenvironmental exposures of significant concern include in-vehicle exposures such as school buses and passenger cars as well as near highways and in urban canyons. Because DPM from mobile sources is emitted into the breathing zone of humans, this source has a greater potential for human exposure (per kg of emissions) compared to combustion particulates emitted from point sources.
Recent EC measurements reported for enclosed vehicles driving on Sacramento roadways ranged from below detection limits up to 10 µg/m3 and from 3 µg/m3 to 40 µg/m3 on Los Angeles roadways. Elevated levels of PM2.5 and EC were observed when the vehicle being followed was powered by a HD diesel truck or bus (Cal EPA, 1998b). EC is also present in the exhaust of gasoline vehicles, so these measurements are likely to include some EC from gasoline vehicles. The SHEDS (Stochastic Human Exposure and Dose Simulation) model for PM predicts that although the typical person spends only about 5% of his or her time in a vehicle, this microenvironment can contribute on average 20% and as much as 40% of a person’s total PM exposure (Burke et al., 2000).
The California Air Resources Board also collected EC near the Long Beach Freeway for 4 days in May 1993 and 3 days in December 1993 (Cal EPA, 1998a). Using emission estimates from their EMFAC7G model and EC and OC composition profiles for diesel and gasoline exhaust, tire wear, and road dust, CARB estimated the contribution of the freeway to DPM concentrations. For the 2 days of sampling in December 1993, DE from vehicles on the nearby freeway was estimated to contribute from 0.7 µg/m3 to 4.0 µg/m3 excess DPM above background concentrations, with a maximum of 7.5 µg/m3.
In 1986, EC concentrations were measured in Glendora, CA, during a carbonaceous aerosol intercomparison study (Cadle and Mulawa, 1990; Hansen and Novakov, 1990). One technique used during the study reported EC concentrations in 1-minute intervals, reflecting the impact from diesel vehicles 50 m from the study site. The diesel vehicles were estimated to contribute up to 5 µg/m3 EC above the background concentration.
2-115

In a study designed to investigate relationships between DE exposure and respiratory health of children in the Netherlands, EC measurements were collected in 23 schools located from 47 m to 377 m from a freeway and in 8 schools located at a distance greater than 400 m from a freeway (Brunekreef, 1999). EC concentrations in schools near freeways ranged from 1.1 µg/m3 to 6.3 µg/m3, with a mean of 3.4 µg/m3, and EC concentrations in schools more than 400 m from freeways ranged from 0.8 µg/m3 to 2.1 µg/m3, with a mean of 1.4 µg/m3. Brunekreef et al. (2000), using a reflectance method to report “soot” or carbonaceous particulate concentrations as a surrogate for EC, found a statistically significant increase in carbonaceous particle concentrations inside and outside of the schools with increasing truck traffic (predominantly diesel), with decreasing distance between the school and the highway, and with an increase in the percent of time the school was downwind of the highway. In additional studies in elderly subjects in Helsinki and Amsterdam, Janssen et al. (2000) reported that outdoor measurements of EC were highly correlated with indoor and personal exposure measurements of EC, supporting the position that short-term increases in outdoor EC concentrations are reflected in increased personal exposures even for those who spend much of their time indoors.
Although there is little quantitative information regarding personal exposure to DPM, certain exposure situations are expected to result in higher than average exposures. Those in the more highly exposed categories would generally include people living in urban areas in which diesel delivery trucks, buses, and garbage trucks frequent the roadways, but also included would be people living near freeways, bus stations, construction sites, train stations, marinas frequented by diesel-powered vessels, and distribution hubs using diesel truck transport. One study using the 1-hydroxypyrene biomarker of DE exposure reported exposure among most (76%) of the 26 adolescents sampled in Harlem (Northridge et al., 1999). In a follow-on study, Kinney et al. (2000) reported EC concentrations from personal monitors worn by study staff on sidewalks at four Harlem intersections that ranged from 1.5 µg/m3 to 6 µg/m3. The EC concentrations were found to be associated with diesel bus and truck counts such that spatial variations in sidewalk concentrations of EC were attributed to local diesel sources in Harlem.
In any situation in which diesel engines operate and a majority of time is spent outdoors, personal exposures to DE are expected to exceed average exposures. Because a large but currently undefined portion of DPM is emitted during acceleration, those living and working in the vicinity of sources operating in this transient mode could experience highly elevated levels of DPM. DPM enriched in soluble organic material (as opposed to EC) is emitted from LD vehicles, some nonroad equipment, on-road diesel engines during cold-start and motoring conditions, and poorly maintained vehicles. The potential health effects of acute exposures to elevated DPM levels as well as health effects resulting from chronic exposures are discussed in subsequent chapters in this document.
2-116

2.4.3.2.3. The California Population Indoor Exposure Model. CPIEM, developed under contract to the CARB, estimates Californians’ exposure to DPM using distributions of input data and a Monte Carlo approach (Cal EPA, 1998a). This model uses population-weighted outdoor DPM concentrations in a mass balance model to estimate DPM concentrations in four indoor environments: residences, office buildings, schools, and stores/retail buildings. The model takes into account air exchange rates, penetration factors, and a net loss factor for deposition/removal. In four additional environments (industrial plants, restaurants/lounges, other indoor places, and enclosed vehicles), assumptions were made about the similarity of each of these spaces to environments for which DPM exposures had been calculated. Industrial plants and enclosed vehicles were assumed to have DPM exposures similar to those in the outdoor environment; restaurants/lounges were assumed to have DPM concentrations similar to stores; and other indoor places were assumed to have DPM concentrations similar to offices. The estimated DPM concentrations in the indoor and outdoor environments range from 1.6 µg/m3 to 3.0 µg/m3 (Table 2-32).
Table 2-32. Modeled and estimated concentrations of DPM in microenvironments for California for all sources Microenvironment Estimated mean DPM
(stdev), µg/m3
Residences 1.9 (0.9)
Offices 1.6 (0.7)
Schools 1.9 (0.8)
Stores/public/retail bldgs 2.1 (0.9)
Outdoor places 3.0 (1.1)
Industrial plantsa 3.0 (1.1)
Restaurants/loungesa 2.1 (0.9)
Other indoor placesa 1.6 (0.7)
Enclosed vehiclesa 3.0 (1.1) aConcentrations assumed based on similarity with modeled environments. Source: California EPA, 1998a.
2-117

The DPM concentrations reported in Table 2-32 were used as input to CPIEM, and time-activity patterns for children and adults were used to estimate total indoor and total air exposures to DPM. Overall, total indoor exposures were estimated to be 2.0 ± 0.7 µg/m3, and total air exposures (indoor and outdoor exposures) were 2.1 ± 0.7 µg/m3 (Table 2-33). The South Coast Air Basin and the San Francisco Bay Area were also modeled using CPIEM, where total air exposures to DPM were estimated to be 2.5 ± 0.9 µg/m3 and 1.7 ± 0.9 µg/m3, respectively.
Table 2-33. Estimated indoor air and total air exposures to DPM in California in 1990
Exposed population Total indoor exposure (stdev),
µg/m3
Total air exposure, (stdev), µg/m3
All Californians 2.0 (0.7) 2.1 (0.8)
South Coast Air Basin 2.4 (0.9) 2.5 (0.9)
San Francisco Bay Area 1.7 (0.9) 1.7 (0.9) Source: California EPA, 1998a.
Exposure estimates were also made by Cal EPA (1998a) for 1995, 2000, and 2010 using a ratiometric approach to 1990 exposures. Total air exposures reported for 1995 and projected for 2000 and 2010 were 1.5 µg/m3, 1.3 µg/m3, and 1.2 µg/m3, respectively.
2.5. SUMMARY AND DISCUSSION This chapter summarizes information regarding the history of the use of diesel engines,
technological developments and their impact on emissions over time, Federal standards on DE, the chemical and physical character of DE, atmospheric transformations of DE, and ambient DE concentrations and exposures. The aspects of each of these topics that are most relevant to the discussion of health effects in later chapters of this document are summarized here. Because the majority of information regarding the chemical composition and historical changes in DE pertains to on-road diesel engines, these data are discussed in greater detail than diesel emissions from nonroad equipment. Where possible, nonroad emissions were discussed in Chapter 2 and are briefly summarized here.
2-118

2.5.1. History of Diesel Engine Use, Standards, and Technology The use of diesel engines in the trucking industry began in the 1940s, and diesel engines
slowly displaced gasoline engines among HD trucks, accounting for 36% of new HD truck sales in 1960, 85% of sales in 1970, and almost 100% of sales in 1997. It is estimated that in 2000, HD diesel vehicles will travel more than 224 billion miles (U.S. EPA, 2000b). In 1997, on-highway HD diesel engines contributed 66% of the PM2.5 emitted by on-highway vehicles.
To understand changes in emissions over time, it is important to note the difference between model year emission trends and calendar year emission trends. Emission trends by model year refer to the year in which an engine was made; the emission rate is specific to the technology and regulations in effect for that year. Emissions in a specific calendar year refer to aggregate emissions due to the mix of model year engines on the road. Because of the time required for fleet turnover, emission rates for the on-road fleet in any calendar year are not as low as the most recent model year emission rate. In 1997, 40% of the HD vehicles on the road were at least 10 years old and traveled approximately 17% of total HD vehicle miles.
EPA set a smoke standard for on-road HD diesel engines beginning with the 1970 model year. In the ensuing years, standards for PM from diesel engines for on-road applications decreased from 0.6 g/bhp-hr in 1988 to 0.1 g/bhp-hr for trucks in 1994-1995 and 0.05 g/bhp-hr for buses in 1996-1997. Calendar year emission contributions of PM from diesel engines to national PM10 inventories reflect decreases expected to result from Federal regulations, because the emission factor models (MOBILE5 and PART5) used to provide emission estimates for mobile sources largely use engine test data required for certification. The U.S. EPA Trends Report estimates that PM10 emissions attributable to on-road diesel vehicles decreased 27% between 1980 and 1998. DPM emission factors (g/mi by model year) measured from in-use vehicles decreased on average by a factor of six from the mid-1970s to the mid-1990s.
It is important to note that in spite of the decreasing trend in DPM emission factors by model year, a wide range in emission factors from in-use testing is reported, even for newer model year HD vehicles (from less than 0.1 g/mi to more than 1 g/mi for model year 1996 vehicles). The high variability in DPM emissions within one model year has been attributed to deterioration3 and differences in measurement methods and test conditions at the various testing facilities. Studies in which consistent testing methods were used suggest that deterioration (even for newer model year engines) causes some of the variability in emission factors, whereas other
3Deterioration includes increases in emission rates (g/bhp hr) due to normal wear as well as manufacturing defects and malfunctions such as retarded timing, fuel injector malfunction, smoke limiting mechanism problems, clogged air filter, wrong or worn turbocharger, clogged intercooler, engine mechanical failure, excess oil consumption, and electronics that have been tampered with or have failed.
2-119
studies clearly demonstrate the important influence of test conditions and driving protocols (e.g., aggressive driving) on DPM emission factors.
Even though significant reductions in DPM from diesel vehicle emissions for on-road applications have been realized, diesel engines (nonroad and on-road combined) are still significant contributors to 1998 inventories of particulate matter, contributing approximately 23% of PM2.5 emissions (not including the contribution from natural and miscellaneous sources).
Technology innovations that impact diesel engine emissions have occurred in the years since 1960, in particular the advent of turbocharging with charge air cooling and direct-injection engines. The use of these new technologies tends to lower emissions from on-road diesel engines; until the late 1970s, however, engines were optimized for performance rather than emissions, so the effect on emissions prior to this time was small. The limited amount of data available indicates that on-road engines in the 1950 to 1975 timeframe had DPM emissions similar to, and in some cases higher than, those of the mid-1970 engines that were not yet controlled for particulates.
Few data are available to assess the changes in emission rates from locomotive, marine, or other nonroad diesel engine sources over time. It is expected that because the typical lifespan of a locomotive engine is at least 40 years and PM regulations for these engines do not take effect until 2000, PM emission rates by model year from locomotives are not likely to have changed substantially since the introduction of the diesel engine into the railroad industry in the early 1950s.
Particulate matter regulations for nonroad diesel equipment are not as stringent as PM regulations for on-road diesel engines. Although PM emissions have declined for on-road trucks, it is estimated that PM10 emissions from nonroad diesel engines increased 17% between 1980 and 1998. DPM emissions from nonroad diesel engines are expected to continue to increase from current levels in the absence of new regulations. No information is available regarding changes in the chemical composition of nonroad engine emissions over time.
2.5.2. Physical and Chemical Composition of Diesel Exhaust Complete and incomplete combustion of fuel in the diesel engine results in the formation
of a complex mixture of hundreds of organic and inorganic compounds in the gas and particle phases. Among the gaseous components of DE, the aldehydes are particularly important because of their health effects and because they are an important fraction of the gaseous emissions. Formaldehyde makes up a majority of the aldehyde emissions (65%-80%) from diesel engines, with the next most abundant aldehydes being acetaldehyde and acrolein. Other gaseous components of DE that are notable for their health effects include benzene, 1,3-butadiene, PAH, and nitro-PAH. Dioxin compounds have also been detected in trace quantities in DE and
2-120

currently account for 1.2% of the national inventory. Dioxin compounds are known to accumulate in certain foods, such as beef, poultry, and dairy products. It is unknown whether deposition of DE emissions has an impact on food chains in local areas.
DPM contains EC, OC, and small amounts of sulfate, nitrate, metals, trace elements, water, and unidentified compounds. DPM is typically composed of more than 50% to approximately 75% EC depending on the age of the engine, deterioration, HD versus LD, fuel characteristics, and driving conditions. The OC portion of DPM originates from unburned fuel, engine lubrication oil, and low levels of partial combustion and pyrolysis products and typically ranges from approximately 19% to 43%, although the range can be broader depending on many of the same factors that influence the EC content of DPM. Polyaromatic hydrocarbons generally constitute less than 1% of the DPM mass. Metal compounds and other elements in the fuel and engine lubrication oil are exhausted as ash and typically make up 1%-5% of the DPM mass. Elements and metals detected in DE include barium, calcium, chlorine, chromium, copper, iron, lead, manganese, mercury, nickel, phosphorus, sodium, silicon, and zinc. The composition of DPM contrasts strongly with the typical chemical composition of ambient DPM2.5 that is dominated by sulfate for aerosols measured in the eastern United States and by nitrate, ammonium, and OC in the western United States.
Approximately 1% to 20% of the mass of DPM in DE is in the ultrafine size range (nuclei-mode), with the majority of particles ranging in size from 0.005 to 0.05 microns and having a mean diameter of about 0.02 microns. These particles account for 50%-90% of the number of particles. These ultrafine particles are largely composed of sulfate and/or sulfate with condensed OC.
Evidence regarding an increase in the number of ultrafine particles from new HD engines is inconclusive. The dilution conditions used to measure the size distribution of DE have a large impact on the number of ultrafine particles quantified. To understand the size distribution of DPM to which people are exposed will require measurements under conditions that more closely resemble ambient conditions.
Approximately 80%-95% of the mass of particles in DE is in the size range from 0.05-1.0 microns, with a mean particle diameter of about 0.2 microns, and therefore in the fine PM size range. Diesel particles in the 0.05-1.0 micron range are aggregates of primary spherical particles consisting of an EC core, adsorbed organic compounds, sulfate, nitrate, and trace elements. These particles have a very large surface area per gram of mass, which makes them an excellent carrier for adsorbed inorganic and organic compounds and, due to their small size, they can effectively reach the lower portions of the respiratory tract. The EC core has a high specific surface area of approximately 30-90 m2/g.
2-121
Because of the potential toxicological significance of the organic components associated with DPM, it is important to understand, to the extent possible, the historical changes in the amount and composition of the DPM-associated organic fraction. The organic component of DPM has typically been characterized by extraction with organic solvents, although other techniques such as thermogravimetric methods have also been used. Results from studies using similar extraction methods were compared to characterize historical changes in the SOF emission rates, the percentage of DPM comprised by SOF, and the composition of SOF. Data from both engine and chassis dynamometer tests suggest that SOF emission rates have decreased by model year from 1975 to 1995. When expressed as a percentage of total DPM, the contribution of SOF to total DPM demonstrates a wide range of variability that may be attributed to different test cycles, different engine types, and different deterioration rates among the vehicles tested. Currently, LD diesel engines emit DPM with a higher fraction of SOF than do HD engines.
Chassis dynamometer tests demonstrate an overall decrease in the mass percentage contribution of SOF to DPM, ranging from 10% to 60% in the 1980s and ~5% to 20% in the 1990s. In contrast, engine dynamometer tests demonstrate that typically 10%-50% of DPM mass is soluble organic matter for engines in model years 1980-1995. The higher SOF fraction of DPM from 1990s model year engine dynamometer tests is attributed primarily to the differences in the engine and chassis dynamometer driving cycles. The engine dynamometer testing includes high- speed and low-load or low-speed lugging test modes in the engine Federal Test Procedure that produce DPM with a high SOF fraction.
The chassis dynamometer data are considered to reflect real-world trends in emissions from heavy HD vehicles by model year because vehicles from different model years, with different mileage and different levels of deterioration, are represented. Thus, it is expected that the percentage of SOF from new (1990 or later) model year heavy HD diesel vehicles is lower than that from older vehicles. This expectation is supported by data demonstrating an overall increase in the fraction of EC in the carbonaceous component of DPM. The important observation from the engine test data is that some driving modes occurring in real-world applications even with new (post-1990) engines may produce DPM with a high SOF component (up to 50%).
PAH and nitro-PAH are present in DPM from both new and older engine exhaust. There is no information to suggest that the overall PAH composition profile for DPM has changed. There are too few data to speculate on the changes in emissions of total PAH, nitro-PAH, or PAH and nitro-PAH components such as BaP and 1-NP. The data suggest that differences in a vehicle’s engine type and make, general engine condition, fuel composition, and test conditions can influence the emissions levels of PAH. Some studies suggest that fuel composition is the most important determinant of PAH emissions. There is limited evidence that gas-phase PAH
2-122

emission rates increase with higher fuel PAH content and that some particle-phase PAH emission rates increase with higher fuel PAH content. These data suggest that during the period from 1960 to 1986, when the aromatic content of fuel increased, PAH emissions may have increased until the aromatic content of diesel fuel was capped in 1993. The aromatic content of nonroad diesel fuel is not federally regulated and is typically greater than 30%. PAH emissions from nonroad equipment would also be expected to vary with the PAH content of the fuel.
Currently, information regarding emission rates, chemical composition, and relative contribution of DPM from high-emitting HD diesel vehicles is not available and may significantly change the understanding of DPM composition to which people are exposed. Some studies have reported a substantial number of smoking diesel trucks in the in-use fleet. Although the correlation between smoke and particulate concentration varies with the driving cycle and measurement method, the results of smoke opacity tests suggest that high-emitting HD diesel vehicles may be important contributors to ambient DE and DPM concentrations.
The chemical composition of DPM to which people are currently exposed is determined by a combination of older and newer technology on-road and nonroad engines. Consequently, the decrease in the SOF of DPM by model year does not directly translate into a proportional decrease in DPM-associated organic material to which people are currently exposed. In addition, the impact from high-emitting and/or smoking diesel engines is not quantified at this time. Because of these uncertainties, the changes in DPM composition over time cannot presently be quantified. The data clearly indicate that toxicologically significant organic components of DE (e.g., PAHs, PAH derivatives, nitro-PAHs) were present in DPM and DE in the 1970s and are still present in DPM and DE as a whole.
Although a significant fraction of ambient DPM (over 50% is possible) is also emitted by nonroad equipment, there are no data available to characterize changes in the chemical composition of DPM from nonroad equipment over time.
Some analysts project that diesel engines will increase substantially in the LD fleet in coming years. Although LD engines currently emit DPM with higher SOF than HD engines of the same model year, recently promulgated Tier 2 standards will require control measures in the 2004-2007 timeframe that will reduce PM emissions from these vehicles. These control measures provide some assurance that even if LD diesel use increases, DPM emitted from these vehicles will likely have a smaller SOF component than such engines currently emit.
2.5.3. Atmospheric Transformation of Diesel Exhaust An understanding of the physical as well as chemical transformations of DE in the
atmosphere is necessary to fully understand the impact of this complex chemical mixture on human health. In the past two decades, data acquired from laboratory and ambient experiments
2-123
have provided information regarding the atmospheric loss processes and transformation of DE, but knowledge concerning the products of these chemical transformations is still limited. A recent study has suggested that DPM exposed to ambient levels of ozone is sufficiently altered to increase the rat lung inflammatory effect compared with DPM not exposed to ozone.
Studies investigating the chemical and physical changes of DE emissions suggest that there is little or no hygroscopic growth of primary diesel particles. This observation suggests that the small size of DPM particles might be maintained upon inhalation, particularly near the emission source, allowing these particles to reach the lower portions of the respiratory tract. Increased solubility can increase the removal efficiency of secondary diesel particles compared with their precursor compounds. Secondary aerosols from DE may also exhibit different biological reactivities from the primary particles. For example, there is evidence for nitration of some PAH compounds resulting in the formation of nitroarenes that are often more mutagenic than their precursors.
2.5.4. Ambient Concentrations and Exposure to Diesel Exhaust Because of changes in engine technology and DPM emissions over time, ambient
concentrations reported from studies before 1990 are compared here to those reported after 1990. There are no studies in which direct comparisons can be made because of different analytical and modeling tools used to assess DPM ambient levels.
DPM concentrations reported from CMB and dispersion modeling studies in the 1980s suggest that in urban and suburban areas (Phoenix, AZ, and Southern California), annual average DPM concentrations ranged from 2 to 13 µg/m3, with possible maximum daily values in Phoenix of 22 µg/m3. In these studies, the average contribution of DPM in urban areas to total ambient PM ranged from 7% in Pasadena, CA, to 36% in Los Angeles.
In the 1990 timeframe, annual or seasonal average DPM concentrations reported in CMB studies and from EC measurements for urban and suburban areas range from 1.2 to 4.5 µg/m3. The contribution of DPM to ambient PM at these sites averaged 10%-15% on a seasonal or annual basis, with contributions up to 38% on individual days (Brighton, CO). Dispersion modeling on individual days in Southern California in the 1990s predicts DPM concentrations ranging from 1.9 to 4.4 µg/m3 (8%-12% of ambient PM). On individual days at a major bus stop in New York City, DPM concentrations were reported to reach 46.7 µg/m3 and averaged 53% of ambient PM, highlighting the important influence of diesel bus traffic in an urban street canyon.
In nonurban and rural areas in the 1980s, DPM concentrations reported range from 1.4 to 5 µg/m3 and on average comprised 5%-12% of the ambient aerosol. In the 1990s, nonurban air basins in California were reported to have DPM concentrations ranging from 0.2-2.6 µg/m3.
2-124
Although estimates from emissions models suggest that DPM emissions from on-road sources decreased during the 1990s, the atmospheric data available do not provide a clear indication of trends in DPM concentrations but are likely to be more a reflection of the choice in sampling sites, source apportionment methods, and modeling techniques. In general, from the limited number of studies available it appears that DPM concentrations averaged over at least a season in the 1990s typically ranged from 1-4 µg/m3. These data can be used in model-monitor comparisons and to provide an indication of long-term average exposures in some urban areas. Additional work is needed to assess ambient DPM and DE concentrations in several urban environments, to assess microenvironments, and to evaluate the relative impact of nonroad and on-road sources on concentrations.
A comprehensive exposure assessment cannot currently be conducted because of the lack of data. Information regarding DPM in occupational environments suggests that exposure ranges up to approximately 1,280 µg/m3 for miners, with lower exposure measured for railroad workers (39-191 µg/m3), firefighters (4-748 µg/m3), public transit personnel who work with diesel equipment (7-98 µg/m3), mechanics and dockworkers (5-65 µg/m3), truck drivers (2-7 µg/m3), and bus drivers (1-3 µg/m3). Work area concentrations at fixed sites are often higher than measured exposures, especially for mining operations or other enclosed spaces. For several occupations involving DE exposure, an increased risk of lung cancer has been reported by epidemiologic studies (discussed in Chapter 7). An estimate of the 70-year lifetime environmental exposure equivalent to these occupational exposures provides one means of comparing the potential overlap between occupational exposures and exposures modeled for the general public. The estimated 70-year lifetime exposures equivalent to those for the occupational groups discussed above range from 0.4-2 µg/m3 on the low end to 2-269 µg/m3 on the high end.
The EPA has performed a national-scale exposure assessment for DPM from on-road sources. Current national exposure modeling using the HAPEM-MS3 model suggests that in 1996, annual average DPM exposure from on-road DE sources in urban areas was 0.8 µg/m3, whereas in rural areas, exposures were 0.4 µg/m3. Among 10 urban areas in which DPM exposures were modeled, 1996 annual average exposure from on-road DE sources ranged from 0.6 µg/m3 to 1.2 µg/m3. Outdoor workers and children who spent a large amount of time outdoors were estimated to have elevated DPM exposures in 1990, ranging up to 4.0 µg/m3 from on-road sources only. Based on the national inventory, nonroad emission sources could contribute at least twofold more DPM than that emitted by on-road sources. Results of the draft National-Scale Assessment for 1996 indicate that national average exposure to DPM, including nonroad sources, is 1.4 µg/m3, with 0.9 µg/m3 of that average attributed to emissions from nonroad sources.
2-125

Low-end exposures for many of the occupational groups overlap 1990 and 1996 exposures from on-road sources modeled for the general population (0.8 µg/m3) and for the more highly exposed groups. This potential overlap, or small difference between occupational and ambient exposures, presents a concern that health effects observed in occupational groups may also be evidenced in the general population. The potential magnitude of this risk is discussed in Chapter 8.
In different exposure environments, the types of diesel vehicles, their mode of operation, maintenance, atmospheric transformation, and many additional factors influence the chemical nature and quantity of DPM to which people are exposed. The potential health consequences of both short- and long-term exposures to DE are discussed in the following chapters of this document.
REFERENCES FOR CHAPTER 2
Abbass, MK; Andrews, GE; Ishaq, RB; et al. (1991) A comparison of the particulate composition between turbocharged and naturally aspirated DI diesel engines. SAE Technical Paper Ser. No. 910733.
Abdul-Khalek, IS; Kittelson, DB; Graskow, BR; et al. (1998) Diesel exhaust particle size: measurement issues and trends. SAE Technical Paper Ser. No. 980525.
Abdul-Khalek, IS; Kittelson, DB; Brear, F. (1999) The influence of dilution conditions on diesel exhaust particle size distribution measurements. SAE Technical Paper Ser. No. 1999-01-1142.
American Automobile Manufacturers Association (AAMA). (1927-1974) Motor truck facts. Motor Truck Committee. Washington, DC.
AAMA. (1975-1998) Motor vehicle facts and figures. Washington, DC.
Andrews, GE; Ishaq, RB; Farrar-Khan, JR; et al. (1998) The influence of speciated diesel fuel composition on speciated particulate SOF emissions. SAE Technical Paper Ser. No. 980527 (and references therein).
Arey, J. (1998) Atmospheric reactions of PAHs including formation of nitroarenes. In: The handbook of environmental chemistry, Vol. 3, Part I. PAHs and related compounds. Nielsen, AH, ed. Berlin/Heidelberg, Germany: Springer-Verlag, pp. 347-385.
Arey, J; Zielinska, B; Atkinson, R; et al. (1986) The formation of nitro-PAHs from the gas-phase reactions of fluoranthene and pyrene with the OH radical in the presence of NOx. Atmos Environ 20:2339-2345.
Arey, J; Zielinska, B; Atkinson, R; et al. (1987) Polycyclic aromatic hydrocarbon and nitroarene concentrations in ambient air during a wintertime high-NOx episode in the Los Angeles Basin. Atmos Environ 21:1437-1444.
Arey, J; Zielinska, B; Atkinson, R; et al. (1988) Formation of nitroarenes during ambient high-volume sampling. Environ Sci Technol 22:457-462.
Arey, J; Zielinska, B; Atkinson, R; et al. (1989) Nitroarene products from the gas-phase reactions of volatile polycyclic aromatic hydrocarbons with OH radical and N2O5. Int J Chem Kinet 21:775-799.
Atkinson, R. (1986) Kinetics and mechanisms of the gas-phase reactions of the hydroxyl radical with organic compounds under atmospheric conditions. Chem Rev 86:69-201.
2-126

Atkinson, R. (1991) Kinetics and mechanisms of the gas-phase reactions of the NO3 radical with organic compounds. J Phys Chem Ref Data 20:459-507.
Atkinson, R; Arey, J. (1994) Atmospheric chemistry of gas-phase polycyclic aromatic hydrocarbons: formation of atmospheric mutagen. Environ Health Perspect 102(Suppl. 4):117-126.
Atkinson, R; Arey, J; Zielinska, B; et al. (1987) Kinetics and products of the gas-phase reactions of OH radicals and N2O5 with naphthalene and biphenyl. Environ Sci Technol 21:1014-1022.
Atkinson, R; Arey, J; Winer, AM; et al. (1988) A survey of ambient concentrations of selected polycyclic aromatic hydrocarbons (PAH) at various locations in California. Final report prepared under contract no. A5-185-32 for California Air Resources Board, Sacramento, CA.
Atkinson, R; Arey, J; Zielinska, B; et al. (1990) Kinetics and nitro-products of the gas-phase OH and NO3 radical-initiated reactions of naphthalene-d8 fluoranthene-d10 and pyrene. Int J Chem Kinet 22:999-1014.
Bagley, ST; Baumgard, KJ; Gratz, LD. (1991) Comparison of in-min and laboratory-generated diesel particulate matter, biological activity, and polynuclear aromatic hydrocarbon levels. In: Proceedings of the Third Symposium of Respirable Dust in the Mineral Industries. Franz, RL; Ramini, RV, eds. Littleton, CO: Society for Mining, Metallurgy, and Exploration, pp. 61-70.
Bagley, ST; Baumgard, KJ; Gratz, LD. (1992) Polynuclear aromatic hydrocarbons and biological activity associated with diesel particulate matter collected in underground coal mines. IC9324. Pittsburgh, PA: Bureau of Mines, pp. 40-48.
Bagley, ST; Gratz, LD; Leddy, DG; et al. (1993) Characterization of particle and vapor phase organic fraction emissions from a HD diesel engine equipped with a particle trap and regeneration controls. Health Effects Institute, Research Report No. 56. Cambridge, MA: HEI.
Bagley, ST; Baumgard, KJ; Gratz, LD; et al. (1996) Characterization of fuel and aftertreatment effects on diesel emissions. Health Effects Institute, Research Report No. 76. Cambridge, MA: HEI.
Bagley, ST; Gratz, LD; Johnson, JH; et al. (1998) Effects of an oxidation catalytic converter and a biodiesel fuel on the chemical, mutagenic, and particle size characteristics of emissions from a diesel engine. Environ Sci Technol 32:1183-1191.
Ballschmiter, K.; Buchert, H.; Niemczyk, R.; et al. (1986) Automobile exhausts versus municipal waste incineration as sources of the polychloro-dibenzodioxins (PCDD) and -furans (PCDF) found in the environment. Chemosphere 15(7):901-915.
Baranescu, RA. (1988) Influence of fuel sulfur on diesel particulate emissions. SAE Technical Paper Ser. No. 881174.
Barry, EG; McCabe, LJ; Gerke, DH; et al. (1985) Heavy-duty diesel engine/fuels combustion performance and emissions--a cooperative research program. SAE Technical Paper Ser. No. 852078.
Bata, R; Wang, W; Gautam, M; et al. (1992) Fleet-site measurements of exhaust gas emissions from urban buses. ASME, ICE. New Dev Off-Highway Eng 18:185-196.
Baumgard, KJ; Johnson, JH. (1992) The effect of low sulfur fuel and a ceramic particle filter on diesel exhaust particle size distributions. SAE Technical Paper Ser. No. 920566.
Baumgard, KJ; Johnson, JH. (1996) The effect of fuel and engine design on diesel exhaust particle size distributions. SAE Technical Paper Ser. No. 960131.
2-127

Behymer, TD; Hites, RA. (1985) Photolysis of polycyclic aromatic hydrocarbons adsorbed on simulated atmospheric particulates. Environ Sci Technol 19:1004-1006.
Behymer, TD; Hites, RA. (1988) Photolysis of polycyclic aromatic hydrocarbons adsorbed on fly ash. Environ Sci Technol 22:1311-1319.
Benner, BA; Gordon, GE; Wise, SA. (1989) Mobile sources of atmospheric PAH: a roadway tunnel study. Environ Sci Technol 23:1269-1278.
Birch, ME. (1998) Analysis of carbonaceous aerosols: interlaboratory comparison. Analyst 123:851-857.
Birch, ME; Cary, RA. (1996) Elemental carbon-based method for monitoring occupational exposures to particulate diesel exhaust. Aerosol Sci Technol 25:221-241.
Bishop, GA; McLaren, SE; Stedman, DH; et al. (1996) Method comparisons of vehicle emissions measurements in the Fort McHenry and Tuscarora Mountain Tunnels. Atmos Environ 30:2307.
Black, F; High, L. (1979) Methodology for determining particulate and gaseous diesel hydrocarbon emissions. SAE Technical Paper Ser. No. 790422.
Brodowicz, P. (1999) Determination of the demographic groups with the highest annual average modeled diesel PM exposure. Memorandum. U.S. Environmental Protection Agency, National Fuel and Vehicle Emissions Laboratory.
Brown, DF; Rideout, GR. (1996) Urban driving cycle test results of retrofitted diesel oxidation catalysts on heavy-duty vehicles. SAE Technical Paper Ser. No. 960134.
Brown, KF; Rideout, GR; Turner, JE. (1997) Urban driving cycle results of retrofitted diesel oxidation catalysts on heavy duty vehicles: one year later. SAE Technical Paper Ser. No. 970186.
Brown, JE; Clayton, JM; Harris, DB; et al. (2000) Comparison of the particle size distribution of heavy-duty DE using a dilution tailpipe sampler and an in-plume sampler during on-road operation. J Air Waste Manage Assoc 50:1407-1416.
Brunekreef, B. (1999) Environmental diesel exhaust exposure and respiratory health of children in the Netherlands. Presented at the Health Effects Institute Diesel Workshop: Building a Research Strategy to Improve Risk Assessment. Stone Mountain, GA, March 7-9, 1999.
Brunekreef, B; Janssen, NAH; van Vliet, PHN; et al. (2000) Particulate matter concentrations in relation to degree of urbanization and proximity to highways in the Netherlands. Presented at: PM2000: Particulate Matter and Health – The Scientific Basis for Regulatory Decision-Making. Specialty Conference and Exhibition. January 24-28, 2000, Charleston, SC.
Burke, JB; Aufall, M; Ozkaynak, H; et al. (2000) Predicting population exposures to PM: the importance of microenvironmental concentrations and human activities. Presented at: PM2000: Particulate Matter and Health – The Scientific Basis for Regulatory Decision-Making. Specialty Conference and Exhibition. January 24-28, 2000, Charleston, SC.
Cadle, SH; Mulawa, PA. (1990) Atmospheric carbonaceous species measurement methods comparison study: General Motors results. Aerosol Sci Technol 12(1):128-141.
California Air Resources Board (CARB). (1987) Determination of PCDD and PCDF emissions from motor vehicles. Draft report. October 1987. Test report no. C-86-029.
2-128
California Air Resources Board and Energy and Environmental Analysis, Inc. (CARB/EEAI). (1997) Regulatory Amendments to California’s heavy-duty inspection program (HDVIP) and periodic smoke inspection program (PSIP). August 1997.
California Environmental Protection Agency (Cal-EPA). (1998a) Report to the California Air Resources Board on the proposed identification of diesel exhaust as a toxic air contaminant. Appendix III, part A: Exposure assessment. April 1998. http://www.arb.ca.gov/regact/diesltac/diesltac.htm.
Cal-EPA. (1998b) Measuring concentrations of selected air pollutants inside California vehicles. Final report.
Calvert, JG; Stockwell, WR. (1983) Acid generation in the troposphere by gas-phase chemistry. Environ Sci Technol 17:428A-443A.
Campbell, RM; Lee, ML. (1984) Capillary column gas chromatographic determination of nitro polycyclic aromatic compounds in particulate extracts. Anal Chem 56:1026-1030.
Cantrell, BK; Salas, LJ; Johnson, WB; et al. (1988) Phase distributions of low volatility organics in ambient air. Prepared for the U.S. Environmental Protection Agency, Washington, DC, under EPA contract no. 68-02-3748.
Carey, PM. (1987) Air toxics emissions from motor vehicles. U.S. Environmental Protection Agency, Washington, DC, Office of Mobile Sources, Report No. EPA/AA-TSS-PA-86-5.
Cass, GR; Gray, HA. (1995) Regional emissions and atmospheric concentrations of diesel engine particulate matter: Los Angeles as a case study. In: Diesel exhaust: a critical analysis of emissions, exposure, and health effects. A special report of the Institute’s Diesel Working Group. Cambridge, MA: Health Effects Institute, pp. 125-137.
Cautreels, W; Van Cauwenberghe, K. (1978) Experiments on the distribution of organic pollutants between airborne particulate matter and the corresponding gas phase. Atmos Environ 12:1133-1141.
Chow, JC; Watson, JG; Richards, LW; et al. (1991) The 1989-1990 Phoenix PM10 study. Volume II: source apportionment. Final report. DRI Document No. 8931.6F1. Prepared for Arizona Department of Environmental Air Quality, Phoenix, AZ, by Desert Research Institute, Reno, NV.
Chow, JC; Watson, JG; Crow, D; et al. (2000) Comparison of IMPROVE and NIOSH carbon measurements. Accepted for publication in Aerosol Sci Technol.
Christoforou, CS; Salmon, LG; Hannigan, MP; et al. (2000) Trends in fine particle concentration and chemical composition in Southern California. J Air Waste Manage Assoc 50:43-53.
Ciccioli, P; Cecinato, A; Brancaleoni, E; et al. (1989) Evaluation of nitrated PAH in anthropogenic emission and air samples: a possible means of detecting reactions of carbonaceous particles in the atmosphere. Aerosol Sci Technol 10:296-310.
Ciccioli, P; Cecinato, A; Cabella, R; et al. (1993) The contribution of gas-phase reactions to the nitroarene fraction of molecular weight 246 present in carbon particles sampled in an urban area of northern Italy. Atmos Environ 27A:1261.
Clark, N; Messer, JT; McKain, DL; et al. (1995) Use of the West Virginia University truck test cycle to evaluate emissions from Class 8 trucks. SAE Technical Paper Ser. No. 951016.
Clark, N; Gautam, M; Lyons, D; et al. (1997) Natural gas and diesel transit bus emissions: review and recent data. SAE Technical Paper Ser. No. 973203.
Clark, NN; Gautam, M; Rapp, BL; et al. (1999) Diesel and CNG transit bus emissions characterization by two chassis dynamometer laboratories: results and issues. SAE Technical Paper Ser. No. 1999-01-1469.
2-129

Cohen, LH; Countess, RJ; Countess, SJ. (1997) Advanced remote sensing technology demonstration. Mobile Sources Air Pollution Review Committee.
Coifman, B. (1994) Evolution of the diesel locomotive in the United States. http://www.cyberus.ca/~yardlimit/guide/locopaper.html
Cooper, C. (1999) Heavy-duty diesel smoke enforcement program in the Northeast. Presented at the Mobile Sources Technical Review Subcommittee, July 1999.
Cooper, JA. et al.; and NEA, Inc. (1987) PM10 source composition library for the South Coast Air Basin, volumes I and II. Prepared for the South Coast Air Quality Management District, El Monte, CA. July 15, 1987.
Countess, R; Countess, S; Cohen, R. (1999) Remote sensing of heavy duty diesel trucks revisited. 9th Coordinating Research Council On-Road Vehicle Emissions Workshop, San Diego, CA.
Coutant, RW; Grown, L; Chuang, JC; et al. (1988) Phase distribution and artifact formation in ambient air sampling for polynuclear aromatic hydrocarbons. Atmos Environ 22:403-409.
Crebelli, R; Conti, L; Crochi, B; et al. (1995) The effect of fuel composition on the mutagenicity of diesel engine exhaust. Mutat Res 346:167-172.
Cunningham, LF; Henly, TJ; Kulinowski, AM. (1990) The effects of diesel ignition improver in low-sulfur fuels on heavy-duty diesel emissions. SAE Technical Paper Ser. No. 902173.
Dec, JE; Espey, C. (1995) Ignition and early soot formation in a diesel engine using multiple 2-D imaging diagnostics. SAE Technical Paper Ser. No. 950456.
Dickson, CL; Sturm, GP. (1994) Diesel fuel oils, 1994. National Institute for Petroleum and Energy Research. NIPER-187 PPS 94/5.
Dietzmann, HE; Parness, MA; Bradow, RL. (1980) Emissions from trucks by chassis version of 1983 transient procedure. SAE Technical Paper Ser. No. 801371.
Dua, SK; Hopke, PK; Raunemaa, T. (1999) Hygroscopicity of diesel aerosols. Water Air Soil Pollut 112:247-257.
Dunlap, LS; Pellegrin, V; Ikeda, R; et al. (1993) Chassis dynamometer emissions testing results for diesel and alternative-fueled transit buses. SAE Technical Paper Ser. No. 931783.
Dunstan, TDJ; Mauldin, RF; Jinxian, Z; et al. (1989) Adsorption and photodegradation of pyrene on magnetic, carbonaceous, and mineral subfractions of coal stack ash. Environ Sci Technol 23:303-308.
Enya, T; Suzuki, H; Watanabe, T; et al. (1997) 3-Nitrobenzanthrone, a powerful bacterial mutagen and suspected human carcinogen found in diesel exhaust and airborne particles. Environ Sci Technol 31:2772-2776.
Federal Highway Administration (FHA). (1995) Motor fuel use, 1919-1995. U.S. Department of Transportation: www.fhwa.dot.gov/ohim/Summary95/section1.html; Vol. MF221.
FHA. (1997) Highway statistics summary to 1995. U.S. Department of Transportation. FHWA-PL-97-009.
Feilberg, A; Kamens, RM; Strommen, MR; et al. (1999) Modeling the formation, decay, and partitioning of semivolatile nitro-polycyclic aromatic hydrocarbons (nitronaphthalenes) in the atmosphere. Atmos Environ 33:1231-1243.
Ferguson, DH; Gautam, M; Wang, WG; et al. (1992) Exhaust emissions from in-use heavy duty vehicles tested on a transportable transient chassis dynamometer. SAE Technical Paper Ser. No. 922436.
2-130

Finlayson-Pitts, BJ; Pitts, JN, Jr. (1986) Atmospheric chemistry: fundamentals and experimental techniques. New York: John Wiley & Sons.
Foster, DE; Tree, DR. (1994) Optical measurements of soot particle size, number density and temperature in a direct injection diesel engine as a function of speed and load. SAE Technical Paper Ser. No. 940270.
Fowler, DP. (1985) Industrial hygiene/environmental sampling program to develop qualitative and quantitative data for diesel exhaust emission exposure. Final report. Coordinating Research Council-APRAC Project No. CAPM-24-78.
Frey, JW; Corn, M. (1967) Diesel exhaust particulates. Nature 216:615-616.
Friones, JR; Hinds, WC; Duffy, RM; Lafuente, EJ; Liu, WV. (1987) Exposure of firefighters to diesel emissions in fire stations. Am Ind Hyg Assoc J 48:202-207.
Fritz, SG. (1995) Emission measurements--locomotives. Prepared by Southwest Research Institute under U.S. EPA Contract no. 68-C2-0144.
Fritz, SG; Bailey, CR; Scarbro, CA; et al. (2001) Heavy-duty diesel truck in-use emission test program for model years 1950 through 1975. SAE Technical Paper Ser. No. 2001-01-1327.
Fujita, EM; Lu, Z; Sheetz, L; et al. (1997) Determination of mobile source emission source fraction using ambient field measurements. Final report. Prepared for Coordinating Research Council, Atlanta, GA, by Desert Research Institute, Reno, NV, under CRC Project No. E-5-1.
Fujita, E; Watson, JG; Chow, JC; et al. (1998) Northern Front Range Air Quality Study, volume C: source apportionment and simulation methods and evaluation. Prepared for Colorado State University, Cooperative Institute for Research in the Atmosphere, by Desert Research Institute, Reno, NV.
Gautam, M; Ferguson, D; Wang, WG; et al. (1992) In-use emissions and performance monitoring of heavy duty vehicles using a transportable transient chassis test facility. SAE Technical Paper Ser. No. 921751.
Gertler, AW. (1999) Real-world measurements of diesel particulate matter. Presentation to CASAC-Mobile Sources Technical Review Subcommittee, October 13, 1999.
Gertler, AW; Sagebiel, JC; Dippel, WA; et al. (1996) A study to quantify on-road emissions of dioxins and furans from mobile sources: phase 2. Reno, NV: Desert Research Institute.
Gertler, AW; Sagebiel, JC; Dippel, WA; et al. (1998) Measurements of dioxin and furan emission factors from HD diesel vehicles. J Air Waste Manage Assoc 48:276-278.
Ghio, AJ; Richards, JH; Dailey, LA; et al. (2000) The effects of oxidants on modifying the toxicity of ambient PM. Society of Toxicology Annual Meeting. San Francisco, CA.
Gorse, RA, Jr.; Riley, TL; Ferris, FC; et al. (1983) 1-Nitropyrene concentration and bacterial mutagenicity in on-road vehicle particulate emissions. Environ Sci Technol 17:198-202.
Graboski, MS; McCormick, RL. (1996) Effect of diesel fuel chemistry on emissions at high altitude. SAE Technical Paper Ser. No. 961947.
Graboski, MS; McCormick, RL; Alleman, T. (1998a) Testing of natural gas and diesel buses for comparison with WVU mobile dynamometer. Colorado Institute for Fuels and High Altitude Engine Research, Colorado School of Mines, Golden, CO.
2-131
Graboski, MS; McCormick, RL; Yanowitz, J; et al. (1998b) HD diesel testing for the Northern Front Range Air Quality Study. Colorado Institute for Fuels and Engine Research, Colorado School of Mines, Golden, CO. http://nfraqs.cira.colostate.edu/index2.html.
Gray, HA. (1986) Control of atmospheric fine primary carbon particle concentrations. Ph.D. thesis, California Institute of Technology.
Gray, HA; Kuklin, A. (1996) Benefits of mobile source NOx related paticulate matter reductions. Final report. Prepared by Systems Applications International for U.S. Environmental Protection Agency. SYSAPP-96/61.
Gray, HA; Cass, GR. (1998) Source contributions to atmospheric fine carbon particle concentrations. Atmos Environ 32(22):3805-3825.
Groves, J; Cain, JR. (2000) A survey of exposure to diesel engine exhaust emissions in the workplace. Ann Occup Hyg 44(6):435-447.
Gullett, BK; Ryan, JV. (1997) On-road sampling of diesel engine emissions of polychlorinated dibenzo-p-dioxin and polychlorinated dibenzofuran. Organo Comp 32:451-456.
Hagenmaier, H; Dawidowsky, V; Weber, UB; et al. (1990) Emission of polyhalogenated dibenzodioxins and dibenzofurans from combustion-engines. Organo Comp 2:329-334.
Hames, RJ; Straub, RD; Amann, RW. (1985) DDEC Detroit Diesel electronic control. SAE Technical Paper Ser. No. 850542.
Hammerle, RH; Schuetzle, D; Adams,W. (1994) A perspective on the potential development of environmentally acceptable light-duty diesel engines. Environ Health Perspect (Suppl.) 102:25-30.
Hammond, SK. (1998) Occupational exposure to diesel exhaust. Presented at the Scientific Review Panel Meeting, California Air Resources Board, March 11, 1998.
Hansen, ADA; Novakov, T. (1990) Real-time measurement of aerosol black carbon during the carbonaceous species methods comparison study. Aerosol Sci Technol 12(1):194-199.
Hansen, KF; Bak, F; Andersen, EM; et al. (1994) The influence of an oxidation catalytic converter on the chemical and biological characteristics of diesel exhaust emissions. SAE Technical Paper Ser. No. 940241.
Hara, K; Hanaoka, T; Yamano, Y; et al. (1997) Urinary 1-hydroxypyrene levels of garbage collectors with low-level exposure to polycyclic aromatic hydrocarbons. Sci Total Environ 199:159-164.
Hardenberg, H; Fraenkle, G. (1978) The effect of charge air cooling on exhaust emissions and power output of turbocharged engines. Institute of Mechanical Engineers Paper No. C71/78.
Hare, CT. (1977) Characterization of diesel gaseous and particulate emissions. Final report. Prepared by Southwest Research Institute under contract no. 68-02-1777.
Hare, CT; Springer, KJ. (1972) Exhaust emissions from uncontrolled vehicles and related equipment using internal combustion engines. Part I, locomotive diesel engines and marine counterparts. Southwest Research Institute under contract no. EHS 70-108.
Harvey, GD; Baumgard, KJ; Johnson, JH; et al. (1994) Effects of a ceramic particle trap and copper fuel additive on HD diesel emissions. SAE Technical Paper Ser. No. 942068.
Health Effects Institute. (1995) Diesel exhaust: a critical analysis of emissions, exposure, and health effects. Cambridge, MA.
2-132

Henry, RC; Lewis, CW; Collins, JF. (1994) Vehicle-related hydrocarbon source compositions from ambient data: the GRACE/SAFER method. Environ Sci Technol 28:823-832.
Heywood, JB. (1988) Internal combustion engine fundamentals. New York: McGraw-Hill, Inc.
Hildemann, LM; Markowski, GR; Cass, GR. (1991) Chemical composition of emissions from urban sources of fine organic aerosol. Environ Sci Technol 25:744-759.
Hori, S; Narusawa, K. (1998) Fuel composition effects on SOF and PAH exhaust emissions from a DI diesel engine. SAE Technical Paper Ser. No. 980507.
Horvath, H; Kreiner, I; Norek, C; et al. (1988) Diesel emissions in Vienna. Atmos Environ 22:1255-1269.
Hsiao-Hsuan, M; Wen-Jhy, L; Chung-Ban, C; et al. (2000) Effect of fuel aromatic content on PAH emission from a heavy-duty diesel engine. Chemosphere 41:1783-1790.
Hutzinger, O; Essers, U.; Hagenmaier, H. (1992) Untersuchungen zur emission halogenierter dibenzodioxine und dibenzofurane aus verbrennungsmortoren beim betrieb mit handelsüblichen betriebsstoffen. Universities of Bayreuth, Stuttgart and Tübingen, Germany. GSF-Forschungszentrum, Munich, Germany, ISSN 0937-9932.
Jang, M; McDow, SR. (1995) Benz[a]anthracene photodegradation in the presence of known organic constituents of atmospheric aerosols. Environ Sci Technol 29:2654.
Janssen, NAH; de Hartog, JJ; Hoek, G; et al., (2000) Peroanl exposure to fine particulate matter in elderly subjects: relation between personal, indoor, and outdoor concentrations. J Air Waste Manage Assoc 50:1133-1143.
Japar, SM; Szkarlat, AC; Gorse, RA; et al. (1984) Comparison of solvent extraction and thermal-optical carbon analysis methods: application to diesel vehicle exhaust aerosol. Environ Sci Technol 18:231-234.
Jimenez, J; McRae, G; Nelson, D; et al. (1998) Remote sensing of HD diesel truck NOx emissions using TILDAS. 8th Coordinating Research Council On-Road Vehicle Emissions Workshop: San Diego, CA, pp. 7-45!7-61.
Johnson, JE. (1993) Hydrocarbon oxidation in a diesel oxidation catalytic converter. MS thesis, University of Minnesota.
Johnson, JE; Kittelson, DB. (1996) Deposition, diffusion and adsorption in the diesel oxidation catalyst. Appl Catal B: Environ 10:117-137.
Johnson, JH; Bagley, ST; Gratz, LD; et al. (1994) A review of diesel particulate control technology and emissions effects--1992 Horning Memorial Award Lecture. SAE Technical Paper Ser. No. 940233.
Kado, NY; Okamoto, RA; Kuzmicky, PA. (1996) Chemical and bioassay analyses of diesel and biodiesel particulate matter: pilot study. Final report to Montana State Department of Environmental Quality and the U.S. Department of Energy by Department of Environmental Toxicology, University of California, Davis.
Kado, NY; Kuzmicky, PA; Kiefer, KL; et al. (1998) Emissions from biodiesel fuel combustion: bioassay and chemical analyses of the particle and semi-volatile emissions from hydrogenated biodiesel fuels. Final report to U.S. Department of Energy by Department of Environmental Toxicology, University of California, Davis.
Kamens, RM; Guo, Z; Fulcher, JN; et al. (1988) Influence of humidity, sunlight, and temperature on the daytime decay of polyaromatic hydrocarbons on atmospheric soot particles. Environ Sci Technol 22:103-108.
Kantola, TC; Bagley, ST; Gratz, LD; et al. (1992) The influence of a low sulfur fuel and a ceramic particle trap on the physical, chemical, and biological character of HD diesel emissions. SAE Technical Paper Ser. No. 920565.
2-133

Katragadda, S; Bata, R; Wang, WG; et al. (1993) A correlation study between two HD vehicle chassis dynamometer emissions testing facilities. SAE Technical Paper Ser. No. 931788.
Katz, M; Chan, C; Tosine, H; et al. (1979) Relative rates of photochemical and biological oxidation (in vitro) of polycyclic aromatic hydrocarbons. In: Polynuclear aromatic hydrocarbons: Third International Symposium on Chemistry and Biology–Carcinogenesis and Mutagenesis, October 1978, Columbus, OH. Jones, PW; Leber, P, eds. Ann Arbor, MI: Ann Arbor Science Publishers, Inc., pp. 171-189.
Kawatani, T; Mori, K; Fukano, I; et al. (1993) Technology for meeting the 1994 USA exhaust emission regulations on heavy-duty diesel engine. SAE Technical Paper Ser. No. 932654.
Khatri, NJ; Johnson, JH; Leddy, DG. (1978) The characterization of the hydrocarbon and sulfate fractions of diesel particulate matter. SAE Technical Paper Ser. No. 780111.
Kinney, PL; Agarwal, M; Northridge, ME; et al. (2000) Airborne concentrations of PM2.5 and DE particles on Harlem sidewalks: a community-based pilot study. Environ Health Perspect 108:213-218.
Kirchstetter, TW; Harley, RA; Kreisberg, NM; et al. (1999) On-road measurement of fine particle and nitrogen oxide emissions from light- and HD motor vehicles. Atmos Environ 33:2955-2968.
Kirkland, JF. (1983) Dawn of the diesel age. Glendale, CA: Interurban Press.
Kittelson, DB. (1998) Engines and nanoparticles: a review. J Aerosol Sci 29:575-588.
Kittelson, DB. (2000) What do we know about the nature of the nanoparticles emitted by diesel engines? Coordinating Research Council, January 2000.
Kittelson, DB; Pipho, ML; Ambs, JL; et al. (1986) Particle concentrations in a diesel cylinder: comparison of theory and experiment. SAE Technical Paper Ser. No. 861569.
Kittelson, DB; Winthrop, W; Baltensperger, R; et al. (1999) Diesel aerosol sampling methodology. University of Minnesota Center for Diesel Research. http://www.me.umn.edu/centers/cdr/Proj_EPA.html.
Kittelson, D; Watts, W; Ramachandran, G. (2000) Exposures to diesel exhaust aerosol: relationship between 6-hour time weighted average personal exposures to EC/OC and real-time variations in aerosol properties. Health Effects Institute Annual Conference 2000: exploring exposure and risk issues. April 9-11, 2000, Atlanta, GA.
Kleeman, MJ; Cass, GR. (1998) Source contributions to the size and composition distribution of urban particulate air pollution. Atmos Environ 32(16):2803-2816.
Kleeman, MJ; Schauer, JJ; Cass, GR. (2000) Size and composition distribution of fine particulate matter emitted from motor vehicles. Environ Sci Technol 34:1132-1142.
Klein, M. (1991) The diesel revolution. Am Heritage Invention Technol 6.
Kleindienst, TE; Shepson, PB; Edney, EO; et al. (1985) Peroxyacetyl nitrate: measurement of its mutagenic activity using the Salmonella/mammalian microsome reversion assay. Mutat Res 157:123-128.
Kreso, AM; Johnson, JH; Gratz, LD; et al. (1998) A study of the effects of exhaust gas recirculation on HD diesel engine emissions. SAE Technical Paper Ser. No. 981422.
Last, RJ; Krueger, M; Duernholz, M. (1995) Emissions and performance characteristics of a 4-stroke, direct injected diesel engine fueled with blends of biodiesel and low sulfur diesel fuel. SAE Technical Paper Ser. No. 950054.
Law, PL; Lioy, PJ; Zelenka, MP; et al. (1997) Evaluation of a probabilistic exposure model applied to carbon monoxide (pNEM/CO) using Denver personal exposure monitoring data. J Air Waste Manage Assoc 47:491-500.
2-134
Lee, R; Hobbs, CH; Pedley, JF. (1998) Fuel quality impact on heavy duty diesel emissions: literature review. SAE Technical Paper Ser. No. 982649.
Levson, K. (1988) The analysis of diesel particulate. Fresenius Z Anal Chem 331:467-478.
Lew, G. (1996) Letter to G. Schweer (Versar, Inc.) dated January 11, 1996. Sacramento, CA: State of California Air Resources Board, Engineering and Laboratory Branch. Available for inspection at: U.S. Environmental Protection Agency, Office of Research and Development, National Center for Environmental Assessment, Washington, DC.
Lies, KH; Hartung, A; Postulka, A; et al. (1986) Composition of diesel exhaust with particular reference to particle bound organics including formation of artifacts. In: Carcinogenic and mutagenic effects of diesel engine exhaust. London: Elsevier Science Limited, pp. 65-82.
Ligocki, MP; Pankow, JF. (1989) Measurements of the gas/particle distributions of atmospheric organic compounds. Environ Sci Technol 23:75-83.
Loft, S; Poulsen, HE; Vistisen, K; et al. (1999) Increased urinary excretion of 8-oxo-2'-deoxyguanosine, a biomarker of oxidative DNA damage, in urban bus drivers. Mutat Res 441:11-19.
Lowenthal, DH; Chow, JC; Watson, JG; et al. (1992) The effects of collinearity on the ability to determine aerosol contributions from diesel- and gasoline-powered vehicles using the chemical mass balance model. Atmos Environ 26A(13):2341-2351.
Lowenthal, DH, Zielinska, B., Chow, JC, et al. (1994) Characterization of heavy-duty diesel vehicle emissions. Atmos. Environ. 28:731-743.
Lucas, A; Duran, A; Carmona, M; et al. (1999) SAE Technical Paper Ser. No. 1999-01-3532.
Lüders, H; Kruger, M; Strommel, P; et al. (1998) The role of sampling conditions in particle size distribution measurements. SAE Technical Paper Ser. No. 981374.
Maricopa Association of Governments. (1999) The 1999 Brown Cloud Project for the Maricopa Association of Governments Area, Final Report, December 1999.
Marklund, S.; Andersson, R.; Tysklind, M.; et al. (1990) Emissions of PCDDs and PCDFs in gasoline and diesel fueled cars. Chemosphere 20(5):553-561.
Martin, S. (1981a) Emissions from heavy-duty engines using the 1984 transient test procedure. Volume II–diesel. EPA/460/3-81/031.
Martin, S. (1981b) Diesel particulate by 1986 HD transient Federal test procedure. Final report. Prepared by Southwest Research Institute under contract no. 68-03-2603.
Mauderly, J. (1992) Diesel exhaust. In: Environmental toxicants: human exposures and their health effects. Lippmann, M, ed. New York: Van Nostrand Reinhold, pp. 119-162.
McCarthy, CI; Slodowske, WJ; Sienicki, EJ; et al. (1992) Diesel fuel property effects on exhaust emissions from a heavy duty diesel engine that meets 1994 emissions requirements. SAE Technical Paper Ser. No. 922267.
McClure, BT; Bagley ST; Gratz, LD. (1992) The influence of an oxidation catalytic converter and the fuel composition on the chemical and biological characteristics of diesel exhaust emissions. SAE Technical Paper Ser. No. 920854.
McCormick, RL; Graboski, MS; Alleman, TL; et al. (1999) In-use emissions from natural gas fueled HD vehicles. SAE Technical Paper Ser. No. 1999-01-1507.
2-135
McCormick, RL; Alleman, TL; Graboski, MS; et al. (2000) Quantifying the emissions benefit of opacity testing and repair of heavy-duty diesel vehicles. Proceedings of the 10th Coordinating Research Council On-Road Vehicle Emissions Workshop, March 27-29, 2000, San Diego, CA.
McDonald, JF. (1997) The emissions and combustion characteristics of a soy-methyl-ester biodiesel fuel in a naturally aspirated indirect injection diesel engine. MS thesis, University of Minnesota.
McDonald, J; Purcell, DL; McClure, BT. (1995) Methyl ester oxygenated fuels for diesel mining applications. In: Proceedings of the 7th U.S. Mine Ventilation Symposium, Society for Mining, Metallurgy, and Exploration, Inc.
McDow, SR; Sun, Q; Vartiainen, M; et al. (1994) Effect of composition and state of organic components on polycyclic aromatic hydrocarbon decay in atmospheric aerosols. Environ Sci Technol 28:2147.
Miguel, AH; Kirchstetter, TW; Harley, RA; et al. (1998) On-road emissions of particulate polycyclic aromatic hydrocarbons and black carbon from gasoline and diesel vehicles. Environ Sci Technol 32:450-455.
Mitchell, K; Steere, DE; Taylor, JA; et al. (1994) Impact of diesel fuel aromatics on particulate, PAH, and nitro-PAH emissions. SAE Technical Paper Ser. No. 942053.
Mori, K. (1997) Worldwide trends in HD diesel engine exhaust emission legislation and compliance technologies. SAE Technical Paper Ser. No. 970753.
National Air Toxics Assessment (NATA). (2001) DPM and additional urban air toxics concentration and exposure data are available at http://www.epa.gov/ttn/uatw/nata.
National Institute for Occupational Safety and Health (NIOSH). (1988) Carcinogenic effects of exposure to diesel exhaust. Current Intelligence Bulletin 50. No. 88-116. U.S. Department of Health and Human Services, Public Health Service, Centers for Disease Control, National Institute for Occupational Safety and Health, Cincinnati, OH.
NIOSH. (1990) Health hazard evaluation report. Prepared by Yellow Freight System, Inc. HETA 90-088-2110.
NIOSH. (1992) Health hazard evaluation report: City of Lancaster, Division of Fire, Lancaster, OH. NIOSH Report No. HHE HETA 92-0160-2360, NTIA No. PB-94140142. U.S. Department of Health and Human Services, Public Health Service, Centers for Disease Control, National Institute for Occupational Safety and Health, Cincinnati, OH.
National Institute for Petroleum and Energy Research (NIPER). (1986 and earlier years) Diesel fuel oils, annual survey.
National Research Council. (1982) Diesel cars: benefits, risks and public policy. Final report of the Diesel Impacts Study Committee. Washington, DC: National Academy Press.
Needham, JR; Doyle, DM; Faulkner, SA; et al. (1989) Technology for 1994. SAE Technical Paper Ser. No. 891949.
Nielsen, T; Ramdahl, T. (1986) Discussion on determination of 2-nitrofluoranthene and 2-nitropyrene in ambient particulate matter: evidence for atmospheric reactions. Atmos Environ 20:1507.
Nielsen, PS; Andreassen, A; Farmer, PB; et al. (1996) Biomonitoring of diesel exhaust-exposed workers. DNA and hemoglobin adducts and urinary 1-hydroxypyrene as markers of exposure. Toxicol Lett 86:27-37.
Norbeck, JM; Truex, TJ; Smith, MR; et al. (1998a) Evaluation of factors that affect diesel exhaust toxicity. Final report, prepared under Contract No. 94-312, for California Air Resources Board, by the Center for Environmental Research and Technology, College of Engineering, University of California, Riverside, CA.
Norbeck, JM; Durbin, TD; Truex, TJ; et al. (1998b) Characterizing particulate emissions from medium- and light heavy-duty diesel-fueled vehicles. Final report. Prepared for South Coast Air Quality Management District by for
2-136

California Air Resources Board by the Center for Environmental Research and Technology, College of Engineering, University of California, Riverside, CA, under contract no. 97031.
Norbeck, JM; Durbin, TD; Truex, TJ. (1998c) Measurement of primary particulate matter emissions from light-duty motor vehicles. Prepared for Coordinating Research Council, Inc., and South Coast Air Quality Management District, by Center for Environmental Research and Technology, College of Engineering, University of California, Riverside, CA, 1998.
Norris, GA; Birch, ME; Tolocka, MP; et al. (2000) Comparison of particulate organic and elemental carbon measurements made with the IMPROVE and NIOSH method 5040 protocols. Aerosol Sci Technol, in press.
Northridge, ME; Yankura, J; Kinney, PL; et al. (1999) Diesel exhaust exposure among adolescents in Harlem: a community-driven study. Am J Public Health 89:998-1002.
Odum, JR; McDow, SR; Kamens, RM. (1994) Mechanistic and kinetic studies of the photodegradation of benz[a]anthracene in the presence of methoxyphenols. Environ Sci Technol 28:1285.
Oehme, M; Larssen, S; Brevik, EM. (1991) Emission factors of PCDD/CDF for road vehicles obtained by a tunnel experiment. Chemosphere 23:1699-1708.
Opris, CN; Gratz, LD; Bagley, ST; et al. (1993) The effects of fuel sulfur concentration on regulated and unregulated HD diesel emissions. SAE Technical Paper Ser. No. 930730.
Pagan, J. (1999) Study of particle size distributions emitted by a diesel engine. SAE Technical Paper Ser. No. 1999-01-1141.
Paputa-Peck, MC; Marano, RS; Schuetzle, D; et al. (1983) Determination of nitrated polynuclear aromatic hydrocarbons in particulate extracts by capillary column gas chromatography with nitrogen selective detection. Anal Chem 55:1946-1954.
Pataky, GM; Baumgard, KJ; Gratz, LD; et al. (1994) Effects of an oxidation catalytic converter on regulated and unregulated diesel emissions. SAE Technical Paper Ser. No. 940243.
Perez, JM. (1980) Measurement of unregulated emissions--some heavy-duty diesel engine results. Health Effects of Diesel Engine Emissions, EPA/600/9-80/057a.
Perez, JM; Williams, RL. (1989) A study of particulate extracts from 1980s heavy duty diesel engines run on steady-state and transient cycles. SAE Technical Paper Ser. No. 892491.
Pierson, WR; Brachaczek, WW. (1976) Particulate matter associated with vehicles on the road. SAE Trans 85:209-227.
Pierson, WR; Brachaczek, WW. (1983) Particulate matter associated with vehicles on the road. Aerosol Sci Tech 2:1-40.
Pierson, WR; Gertler, AW; Robinson, NF; et al. (1996) Real-world automotive emissions--summary of studies in the Fort McHenry and Tuscarora mountain tunnels. Atmos Environ 30:2233-2256.
Pischinger, R; Cartellieri, W. (1972) Combustion system parameters and their effect on diesel engine exhaust emissions. SAE Technical Paper Ser. No. 720756.
Pitts, JN, Jr; Van Cauwenberghe, KA; Grosjean, D; et al. (1978) Atmospheric reactions of polycyclic aromatic hydrocarbons: facile formation of mutagenic nitro derivatives. Science 202:515-519.
Pitts, JN, Jr; Lokensgard, DM; Ripley, PS; et al. (1980) Atmospheric epoxidation of benzo[a]pyrene by ozone: formation of the metabolite benzo[a]pyrene-4,5-oxide. Science 210:1347-1349.
2-137

Pitts, JN, Jr; Sweetman, JA; Zielinska, B; et al. (1985a) Determination of 2-nitrofluoranthene and 2-nitropyrene in ambient particulate matter: evidence for atmospheric reaction. Atmos Environ 19:1601-1608.
Pitts, JN, Jr; Zielinska, B; Sweetman, JA; et al. (1985b) Reaction of adsorbed pyrene and perylene with gaseous N2O5 under simulated atmospheric conditions. Atmos Environ 19:911-915.
Pitts, JN, Jr; Sweetman, JA; Zielinska, B; et al. (1985c) Formation of nitroarenes from the reaction of polycyclic aromatic hydrocarbons with dinitrogen pentoxide. Environ Sci Technol 19:1115-1121.
Pitts, JN, Jr; Paur, HR; Zielinska, B; et al. (1986) Factors influencing the reactivity of polycyclic aromatic hydrocarbons adsorbed on filters and ambient POM with ozone. Chemosphere 15:675-685.
Prinn, R; Cunnold, D; Simmonds, P; et al. (1992) Global average concentration and trend for hydroxyl radicals deduced from ALE/GAGE trichloroethane (methyl chloroform data for 1978-1990). J Geophys Res 97:2445-2461.
Ramadan, Z; Xin-Hua, S; Hopke, PK. (2000) Identification of sources of Phonix aerosol by positive matrix factorization. J. Air & Waste Manage. Assoc. 50:1308-1320.
Rantanen, L; Mikkonen, S; Nylund, L; et al. (1993) Effect of fuel on the regulated, unregulated and mutagenic emissions of DI diesel engines. SAE Technical Paper Ser. No. 932686.
Rideout, G; Kirshenblatt, M; Prakash, C. (1994) Emissions from methanol, ethanol, and diesel powered urban transit buses. SAE Technical Paper Ser. No. 942261.
Rogak, SN; Pott, U; Dann, T; et al. (1998) Gaseous emissions from vehicles in a traffic tunnel in Vancouver, British Columbia. J Air Waste Manage Assoc 48:604-615.
Rogers, A; Whelan, B. (1999) Exposures in Australian mines. Health Effects Institute Number 7. March 7-9, 1999 Stone Mountain, GA.
Rogge, WF; Hildemann, LM; Mazurek, MA; et al. (1993) Sources of fine organic aerosol. 2. Noncatalyst and catalyst-equipped automobiles and HD diesel trucks. Environ Sci Technol 27:636-651.
Salmon, LG; Cass, GR; Pedersen, DU; et al. (1997) Determination of fine particle concentration and chemical composition in the northeastern United States, 1995. Progress Report to Northeast States for Coordinated Air Use Management (NESCAUM), October 1997.
Sampson, PJ. (1988) Atmospheric transport and dispersion of air pollutants associated with vehicular emissions. In: Air pollution, the automobile and public health. Watson, AY; Bates, RR; Kennedy, D, eds. Washington, DC: National Academy Press, pp. 77-97.
Säverin, R. (1999) German potash miners: cancer mortality. Health Effects Institute Number 7. March 7-9, 1999 Stone Mountain, GA. pp. 220-229.
Sawyer, RF; Johnson, JH. (1995) Diesel emissions and control technology. In: Diesel exhaust: a critical analysis of emissions, exposure, and health effects. Cambridge, MA: Health Effects Institute, pp. 65-81.
Schauer, JJ; Rogge, WF; Hildemann, LM; et al. (1996) Source apportionment of airborne particulate matter using organic compounds as tracers. Atmos Environ 30(22):3837-3855.
Schauer, JJ; Kleeman, MJ; Cass, GR; et al. (1999) Measurement of emissions from air pollution sources. 2. C1 through C30 organic compounds from medium duty diesel trucks. Environ Sci Technol 33:1578-1587.
Scholl, JP; Bagley, ST; Leddy, DG; et al. (1982) Study of aftertreatment and fuel injection variables for particulate control in heavy-duty diesel engines. EPA-460/3-83-002.
2-138

Schuetzle, D. (1983) Sampling of vehicle emissions of chemical analysis and biological testing. Environ Health Perspect 47:65-80.
Schuetzle, D; Frazier, JA. (1986) Factors influencing the emission of vapor and particulate phase components from diesel engines. In: Carcinogenic and mutagenic effects of diesel engine exhaust. London: Elsevier Science Limited, pp. 41-63.
Schuetzle, D; Perez, JM. (1983) Factors influencing the emissions of nitrated-polynuclear aromatic hydrocarbons (nitro-PAH) from diesel engines. J Air Pollut Control Assoc 33:751-755.
Schuetzle, D; Jensen, TE; Ball, JC. (1985) Polar polynuclear aromatic hydrocarbon derivatives in extracts of particulates: biological characterization and techniques for chemical analysis. Environ Int 11:169-181.
Schwind, K-H; Thoma, H; Hutzinger, O; et al. (1991) Emission halogenierter dibenzodioxine (PXDD) und dibenzofurane (PXDF) aus verbrennungsmotoren. UWSF-Z Umweltchem Oekotox 3: 291-298. [English translation]
Seinfeld, JH; Pandis, SN. (1998) Atmospheric chemistry and physics: from air pollution to climate change. New York: John Wiley & Sons, Inc.
Shelton, EM. (1977) Diesel fuel oils. BERC/PPS-77/5.
Shelton, EM. (1979) Diesel fuel oils. BETC/PPS-79/5.
Shi, JP; Harrison, RM. (1999) Investigation of ultrafine particle formation during diesel exhaust dilution. Environ Sci Technol 33:3730-3736.
Shi, JP; Mark, D; Harrison, RM. (2000) Characterization of particles from a current technology heavy-duty diesel engine. Environ Sci Technol 34:748-755.
Sienicki, EJ; Jass, RE; Slodowske, WJ; et al. (1990) Diesel fuel aromatic and cetane number effects on combustion and emissions from a prototype 1991 diesel engine. SAE Technical Paper Ser. No. 902172.
Sisler, JF. (1996) Spatial and seasonal patterns and long term variability of the composition of the haze in the United States: an analysis of data from the IMPROVE network. Cooperative Institute for Research in the Atmosphere. Colorado State University. ISSN: 0737-5352-32.
South Coast Air Quality Management District (SCAQMD). (2000) Multiple air toxics exposure study (MATES-II). Final Report and Appendices, March 2000.
Spreen, KB; Ullman, TL; Mason, RL. (1995) Effects of fuel oxygenates, cetane number, and aromatic content on emissions from 1994 and 1998 prototype heavy-duty diesel engines. Final report. Prepared by Southwest Research Institute under Contract No. VE-10.
Springer, KJ. (1979) Characterization of sulfates, odor, smoke, POM and particulates from light and heavy duty engines--part IX. Prepared by Southwest Research Institute. EPA/460/3-79/007.
Stone, R. (1995) Introduction to internal combustion engines. Warrendale, PA: Society of Automotive Engineers.
Sweetman, JA; Zielinska, B; Atkinson, R; et al. (1986) A possible formation pathway for the 2-nitrofluoranthene observed in ambient particulate organic matter. Atmos Environ 20:235-238.
Tanaka, S; Takizawa, H; Shimizu, T; et al. (1998) Effect of fuel compositions on PAH in particulate matter from DI diesel engines. SAE Technical Paper Ser. No. 982648.
2-139
Tancell, PJ; Rhead, MM; Trier, CJ; et al. (1995) The sources of benzo[a]pyrene in diesel exhaust emissions. Sci Total Environ 162:179-186.
Taylor, CF. (1990) The internal combustion engine in theory and practice - volume 1. Cambridge, MA: MIT Press.
Thrane, KE; Mikalsen, A. (1981) High-volume sampling of airborne polycyclic aromatic hydrocarbons using glass fibre filters and polyurethane foam. Atmos Environ 15:909-918.
Tokiwa, H; Sera, N; Nakanishi, Y; et al. (1999) 8-Hydroyguanosine formed in human lung tissues and the association with diesel exhaust particles. Free Rad Biol Med 27:1251-1258.
Tong, HY; Sweetman, JA; Karasek, FW; et al. (1984) Quantitative analysis of polycyclic aromatic compounds in Diesel exhaust particulate extracts by combined chromatographic techniques. J Chromatogr 312:183-202.
Ullman, TL; Mason, RL; Montalvo, DA. (1990) Effects of fuel aromatics, cetane number, and cetane improver on emissions from a 1991 prototype heavy-duty diesel engine. SAE Technical Paper Ser. No. 902171.
Ullman, TL; Spreen, KB; Mason, RL. (1995) Effects of cetane number on emissions from a prototype 1998 HD diesel engine. SAE Technical Paper Ser. No. 950251.
U.S. Bureau of the Census. (1995) Truck inventory and use survey. 1992 Census of Transportation, TC92-T-52.
U.S. Bureau of the Census. (1999a) 1997 Economic census, vehicle inventory and use survey. EC97TV-US.
U.S. Bureau of the Census. (1999b) Truck inventory and use survey. 1997 Census of Transportation, EC97-TV-US.
U.S. Environmental Protection Agency (EPA). (1992) Highway vehicle emission estimates. Office of Mobile Sources.
U.S. EPA. (1995) Highway vehicle emissions estimates. Office of Mobile Sources.
U.S. EPA. (1998a) National air pollutant emission trends update, 1970-1997. EPA/454/E-98-007.
U.S. EPA. (1998b) Locomotive emission standards. Office of Mobile Sources Regulatory Support Document.
U.S. EPA. (1999a) Air quality criteria for particulate matter. External review draft, October 1999.
U.S. EPA. (1999b) Analysis of the Impacts of control programs on motor vehicle toxic emissions and exposure in urban areas and nationwide: volume I and II. Prepared for EPA by Sierra Research, Inc. and Radian International Corporation/Eastern Research Group, November 30, 1999. Report Nos. EPA/420/R-99/029 and EPA/420/R-99/030.
U.S. EPA. (2000a) National air pollutant emission trends, 1900-1998. EPA-454/R-00-002, March 2000.
U.S. EPA. (2000b) Control of Air Pollution From New Motor Vehicles: Heavy-Duty Engine and Vehicle Standards and Highway Diesel Fuel Sulfur Control Requirements. Final Rule. Regulatory impact analysis. Office of Transportation and Air Quality. EPA420-R-00-026. This document can also be found in the Code of Federal Regulations 40 CFR Parts 69, 80, and 86.
Unnasch, S; Lowell, D; Lonyai, F; et al. (1993) Performance and emissions of clean fuels in transit buses with Cummins L10 engines. SAE Technical Paper Ser. No. 931782.
Van Vaeck, L; Van Cauwenberghe, K. (1984) Conversion of polycyclic aromatic hydrocarbons on diesel particulate matter upon exposure to ppm levels of ozone. Atmos Environ 18:323-328.
2-140

Van Vaeck, L; Van Cauwenberghe, K; Janssens, J. (1984) The gas-particle distribution of organic aerosol constituents: measurements of the volatilisation artifact in hi-vol cascade impactor sampling. Atmos Environ 18:417-430.
Voss, JR; Vanderpoel, RE. (1977) The shuttle distributor for a diesel fuel injection pump. SAE Technical Paper Ser. No. 770083.
Wachter, WF. (1990) Analysis of transient emission data of a model year 1991 heavy duty diesel engine. SAE Technical Paper Ser. No. 900443.
Wall, JC. (1998) Diesel fuel composition for future emissions regulations. Cummins Engine Co. panel discussion, SAE International Fall Fuels and Lubricants Meeting and Exposition, October 21, 1998.
Wall, JC; Shimpi, SA; Yu, ML. (1987) Fuel sulfur reduction for control of diesel particulate emissions. SAE Technical Paper Ser. No. 872139.
Wang, W; Gautam, M; Sun, X; et al. (1993) Emissions comparisons of twenty-six heavy duty vehicles operated on conventional and alternative fuels. SAE Technical Paper Ser. No. 932952.
Wang, WG; Lyons, D; Bata, R; et al. (1994) In-use emissions tests of alternatively fueled heavy duty vehicles by a chassis dynamometer testing facility. SAE Technical Paper Ser. No. 945124.
Warner-Selph, MA; Dietzmann, HE. (1984) Characterization of heavy duty motor vehicle emissions under transient driving conditions. Prepared by Southwest Research Institute. EPA/600/3-84/104.
Watson, N; Janota, MS. (1982) Turbocharging the internal combustion engine. New York: John Wiley and Sons.
Watson, JG; Fujita, EM; Chow, JC; et al. (1998) Northern Front Range Air Quality Study final report. Prepared by Desert Research Institute for Colorado State University, Cooperative Institute for Research in the Atmosphere, 1998.
Watts, FW, Jr. (1995) Assessment of occupational exposure to diesel emissions. In: Diesel exhaust: a critical analysis of emissions, exposure, and health effects. Cambridge, MA: Health Effects Institute, pp. 107-123.
Weaver, CS; Klausmeier, RF. (1988) Heavy-duty diesel vehicle inspection and maintenance study. Final Report Vol. 1: Summary Report to California Air Resources Board, Contract No. A4-151-32.
Weingartner, E; Burtscher, H; Baltensperger, U. (1997a) Hygroscopic properties of carbon and diesel soot particles. Atmos Environ 31:2311-2327.
Weingartner, E; Keller, C; Stahel, WA; et al. (1997b) Aerosol emissions in a road tunnel. Atmos Environ 31(3):451-462.
Wevers, M; De Fre, R; Rymen, T. (1992) Dioxins and dibenzofurans in tunnel air. In: Sources of exposure. Extended Abstracts, vol. 9. Organo Comp 9:321-324.
Whitby, KT; Sverdrup, GM. (1980) California aerosols: their physical and chemical characteristics. In: Hidy, GM; Mueleeer, PD; Grosjean, D; et al., eds. The character and origins of smog aerosols: a digest of results from the California Aerosol Characterization Experiment (ACHEX). New York: John Wiley & Sons, Inc., pp. 477-517. (Advances in environmental science and technology: v.9).
Whitfield, JK; Harris, DB. (1998) Comparison of heavy duty diesel emissions from engine and chassis dynamometers and on-road testing. 8th Coordinating Research Council On-Road Vehicle Emissions Workshop: San Diego, CA.
2-141
Williams, PT; Andrews, GE; Bartle, KD. (1987) The role of lubricating oil in diesel particulate and particulate PAH emissions. SAE Technical Paper Ser. No. 872084.
Williams, DJ; Milne, JW; Quigley, SM; et al. (1989) Particulate emissions from in-use motor vehicles. II. Diesel vehicles. Atmos Environ 23(12):2647.
Winer, AM; Busby, WF, Jr. (1995) Atmospheric transport and transformation of diesel emissions. In: Diesel exhaust: a critical analysis of emissions, exposure, and health effects. Cambridge, MA: Health Effects Institute, pp. 84-105.
Wittorff, DN; Gertler, AW; Chow, JC; et al. (1994) The impact of diesel particulate emissions on ambient particulate loadings. Air & Waste Management Association 87th Annual Meeting, Cincinnati, OH, June 19-24, 1994.
World Health Organization (WHO). (1996) Diesel fuel and emissions, environmental health criteria #171, WHO, Geneva, Switzerland.
Woskie, SR; Smith, TJ; Hammond, SK; et al. (1988) Estimation of the diesel exhaust exposures of railroad workers. I. Current exposures. Am J Ind Med 13:381-394.
Yamasaki, H; Kuwata, K; Miyamoto, H. (1982) Effects of ambient temperature on aspects of airborne polycyclic aromatic hydrocarbons. Environ Sci Technol 16:189-194.
Yanowitz, J; Graboski, MS; Ryan, LBA; et al. (1999) Chassis dynamometer study of emissions from 21 in-use heavy duty diesel vehicles. Environ Sci Technol 33:209-216.
Yanowitz, J; McCormick, RL; Graboski, MS. (2000) Critical review: in-use emissions from heavy duty diesel vehicles. Environ Sci Technol 34:729-740.
Yokely, RA; Garrison, AA; Wehry, EL; et al. (1986) Photochemical transformation of pyrene and benzo[a]pyrene vapor-deposited on eight coal stack ashes. Environ Sci Technol 20:86-90.
Zaebst, DD; Blad, LM; Morris, JA; et al. (1988) Elemental carbon as a surrogate index of diesel exhaust exposure. In: Proceedings of the American Industrial Hygiene Conference, May 15-20, 1988, San Francisco, CA.
Zaebst, DD; Clapp, DE; Blake, LM; et al. (1991) Quantitative determination of trucking industry workers' exposures to diesel exhaust particles. Am Ind Hyg Assoc J 52:529-541.
Zelenka, P; Kriegler, W; Herzog, PL; et al. (1990) Ways toward the clean heavy duty diesel. SAE Technical Paper Ser. No. 900602.
Zielinska, B. (1999) Changes in diesel engine emissions over the last two decades. Diesel workshop: building a research strategy to improve risk assessment. Health Effects Institute Number 7. March 7-9, 1999, Stone Mountain, GA.
Zielinska, B; Arey, J; Atkinson, R; et al. (1986) Reaction of dinitrogen pentoxide with fluoranthene. J Am Chem Soc 108:4126-4132.
Zielinska, B; Arey, J; Atkinson, R; et al. (1988) Nitration of acephenanthrylene under simulated atmospheric conditions and in solution and the presence of nitroacephenanthrylene(s) in ambient air. Environ Sci Technol 22:1044-1048.
Zielinska, B; Arey, J; Atkinson, R; et al. (1989a) Formation of methylnitronaphthalenes from the gas-phase reactions of 1- and 2-methylnaphthalene with OH radicals and N2O5 and their occurrence in ambient air. Environ Sci Technol 23:723-729.
2-142

Zielinska, B; Arey, J; Atkinson, R; et al. (1989b) The nitroarenes of molecular weight 247 in ambient particulate samples collected in southern California. Atmos Environ 23:223-229.
Zielinska, B; Arey, J; Atkinson, R. (1990) The atmospheric formation of nitroarenes and their occurrence in ambient air. In: Proceedings of the Fourth International Conference on N-Substituted Aryl Compounds: Occurrence, Metabolism and Biological Impact of Nitroarenes. Cleveland, OH, July 1989.
Zielinska, B; McDonald, J; Hayes, T; et al. (1998) Northern Front Range Air Quality Study, volume B: source measurements. Desert Research Institute.
Zwirner-Baier, I; Neumann, H-G. (1999) Polycyclic nitroaarenes (nitro-PAHs) as biomarkers of exposure to diesel exhaust. Mutat Res 441:135-144.
2-143

3-1
3. DOSIMETRY OF DIESEL PARTICULATE MATTER
3.1. INTRODUCTIONAnimals and humans receive different internal doses when breathing the same external
concentrations of airborne materials such as diesel particulate matter (DPM) (Brain and Mensah,1983; Schlesinger, 1985). The dose received in different species differs from the aspects of thetotal amount deposited within the respiratory tract, the relative distribution of the dose to specificregions in the respiratory tract, and the residence time of these materials within the respiratorytract, i.e., clearance. Using an external concentration breathed by laboratory animals as a basisfor any guidance for human exposure to DPM would then be an inadequate approximation of thetotal and regional dose that humans may receive.
The reason for the existence of this chapter and for consideration about interspeciesdosimetry is the lack of human health effect data on DPM and the concomitant need to be able toevaluate existing animal data from the aspect of an equivalent human dose. The objective of thischapter is to evaluate and address this issue of interspecies dosimetric differences through:
• A general overview of what is known about how particles like DPM are deposited,transported to, and cleared from the respiratory tract. Information on bothlaboratory animals (mainly rodents) and humans will be considered and interspeciessimilarities and differences highlighted.
• An overview of what is known about the bioavailability of the organic compoundsadsorbed onto DPM from information in humans, animals, and in vitro studies, andfrom model predictions.
• An evaluation of the suitability of available dosimetric models and procedures forDPM to estimate interspecies extrapolations whereby an exposure scenario,conditions, and outcome in laboratory animals are adjusted to an equivalentoutcome in humans via calculation of an internal dose.
The focus in this chapter will be on the particulate fraction of diesel emissions, i.e, DPM. Although diesel engine exhaust consists of a complex mixture of typical combustion gases,vapors, low-molecular-weight hydrocarbons, and particles, it is the particle phase that isconsidered to be of major health concern. The major constituents of diesel engine exhaust (DE)and their atmospheric reaction products are described in Chapter 2.
As will be deduced in Chapter 5, pulmonary toxicity and carcinogenicity are the majorfocal points of diesel toxicity and of DPM deposition. Therefore, dosimetric considerations arelimited to the lung although DPM deposition would occur throughout the respiratory tract, from

3-2
the nares to the alveoli. Aspects of respiratory tract dosimetry to be considered in this chapterinclude the characteristics of DPM, deposition of DPM throughout the respiratory tract, theconducting airways and alveolar regions, normal DPM clearance mechanisms and rates ofclearance in both these regions, clearance rates during lung overload (in rats), elution of organicsfrom DPM, transport of DPM to extra-alveolar sites, and the interrelationships of these factors.
The overall goal in this chapter follows from the objective—to judge the feasibility andsuitability of procedures allowing for derivation of an internal dose estimate of DPM for humans,i.e., of a human equivalent concentration to exposure concentrations and conditions used inanimal studies. This goal is of significance especially in the quantitative dose-response analysisof DPM effects in laboratory animals proposed in Chapter 6.
3.2. CHARACTERISTICS OF INHALED DIESEL PARTICULATE MATTERThe formation, transport, and characteristics of DPM are among the subjects considered
in detail in Chapter 2. DPM consists of aggregates of spherical carbonaceous particles (typicallyabout 0.2 :m mass median aerodynamic diameter [MMAD] or, more appropriately, mass medianthermodynamic diameter [MMTD]) to which significant amounts of higher-molecular-weightorganic compounds are adsorbed. DPM has an extremely large surface area that allows for theadsorption of organic compounds (see Chapter 2, Section 2.2.2). The organic carbon portion ofDPM can range from at least 19% to 43% from highway diesel engines; no data are available tocharacterize the organic content of DPM from nonroad engines. The toxicologically relevantorganic chemicals include high-molecular-weight hydrocarbons such as the polycyclic aromatichydrocarbons (PAHs) and their derivatives (Chapter 2, Section 2.2.8).
3.3. REGIONAL DEPOSITION OF INHALED DIESEL PARTICULATE MATTERThis section discusses the major factors controlling the disposition of inhaled particles.
Note that disposition is defined as encompassing the processes of deposition, absorption,distribution, metabolism, and elimination. The regional deposition of particulate matter in therespiratory tract is dependent on the interaction of a number of factors, including respiratory tractanatomy (airway dimensions and branching configurations), ventilatory characteristics (breathingmode and rate, ventilatory volumes and capacities), physical processes (diffusion, sedimentation,impaction, and interception), and the physicochemical characteristics (particle size, shape,density, and electrostatic attraction) of the inhaled particles. Regional deposition of particulatematerial is usually expressed as deposition fraction of the total particles or mass inhaled and maybe represented by the ratio of the particles or mass deposited in a specific region to the number or mass of particles inspired. The factors affecting deposition in these various regions and theirimportance in understanding the fate of inhaled DPM are discussed in the following sections.

3-3
It is beyond the scope of this document to present a comprehensive account of thecomplexities of respiratory mechanics, physiology, and toxicology, and only a brief review willbe presented here. The reader is referred to publications that provide a more in-depth treatmentof these topics (Weibel, 1963; Brain and Mensah, 1983; Raabe et al., 1988; Stöber et al., 1993;U.S. EPA, 1996).
The respiratory tract in both humans and experimental mammals can be divided into threegeneral regions on the basis of structure, size, and function: the extrathoracic (ET), thetracheobronchial (TB), and the alveolar (A). In humans, inhalation can occur through the nose ormouth or both (oronasal breathing). Animal models used in respiratory toxicology studies,particularly the rat, however, are obligate nose breathers.
3.3.1. Deposition MechanismsThis section provides an overview of the basic mechanisms by which inhaled particles
deposit within the respiratory tract. Details concerning the aerosol physics that explain both howand why particle deposition occurs as well as data on total human respiratory tract deposition arepresented in detail in the earlier PM Criteria Document (U.S. EPA, 1996) and will only be brieflysummarized here. For more extensive discussions of deposition processes, refer to reviews byMorrow (1966), Raabe (1982), U.S. EPA (1982), Phalen and Oldham (1983), Lippmann andSchlesinger (1984), Raabe et al. (1988), and Stöber et al. (1993).
As pictorially represented in Figure 3-1, particles may deposit by five major mechanisms(inertial impaction, gravitational settling, Brownian diffusion, electrostatic attraction, andinterception). The relative contribution of each deposition mechanism to the fraction of inhaledparticles deposited varies for each region of the respiratory tract.
It is important to appreciate that these processes are not necessarily independent but may,in some instances, interact with one another such that total deposition in the respiratory tract maybe less than the calculated probabilities for deposition by the individual processes (Raabe, 1982). Depending on the particle size and mass, varying degrees of deposition may occur in the ET (ornasopharyngeal), TB, and A regions of the respiratory tract.
Upon inhalation of particulate matter such as that found in DE, particle deposition willoccur throughout the respiratory tract. Because of high airflow velocities and abrupt directionalchanges in the ET and TB regions, inertial impaction is a primary deposition mechanism,especially for particles $2.5 :m dae (aerodynamic equivalent diameter). Although inertialimpaction is a prominent process for deposition of larger particles in the tracheobronchial region,it is of considerably less significance as a determinant of regional deposition patterns for
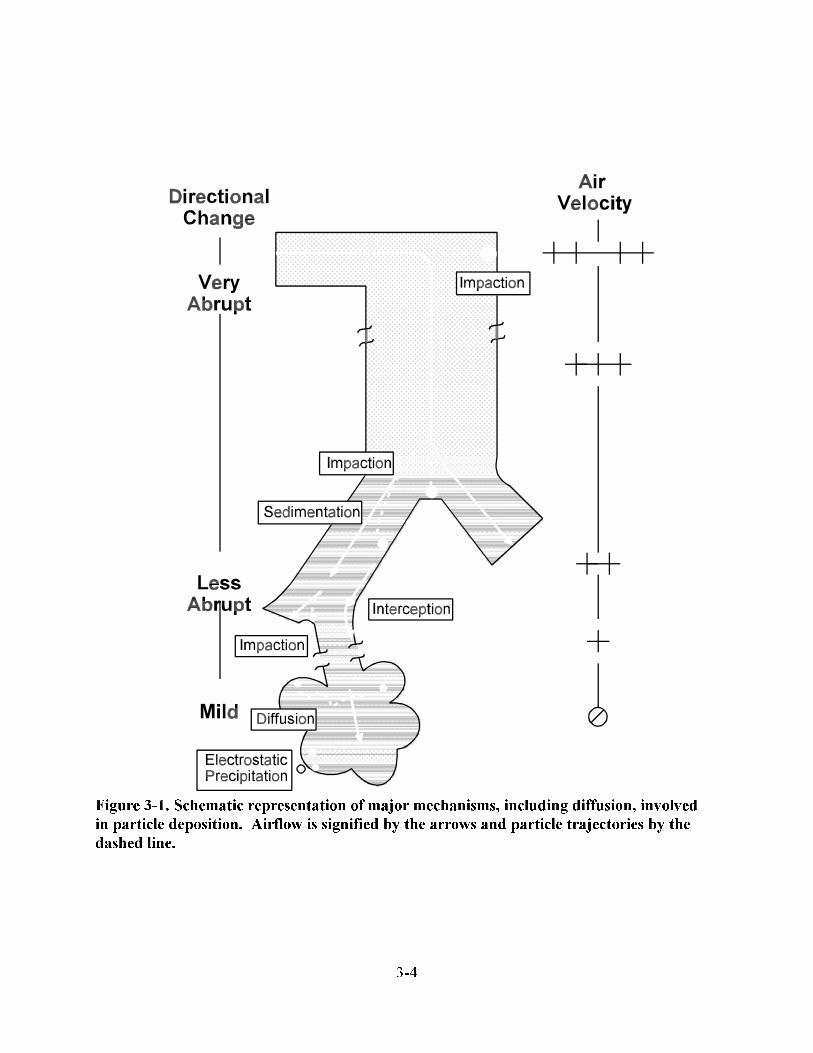
3-4
Figure 3-1. Schematic representation of major mechanisms, including diffusion, involved
in particle deposition. Airflow is signified by the arrows and particle trajectories by the
dashed line.
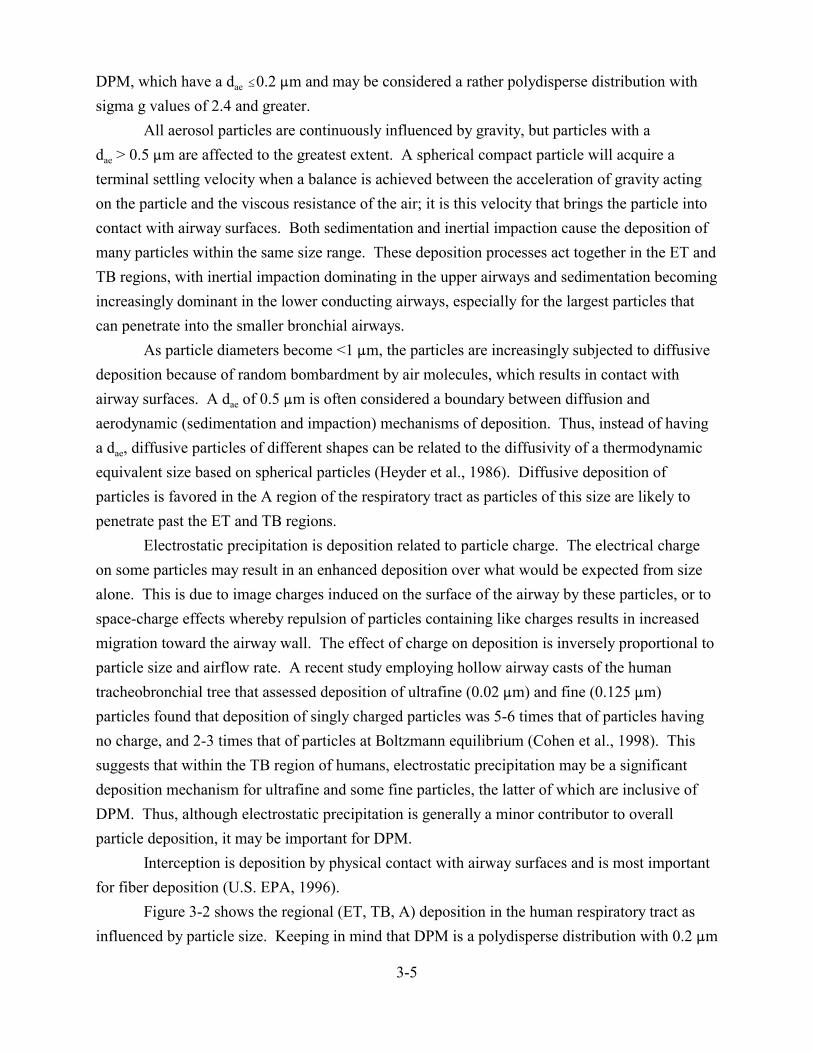
3-5
DPM, which have a dae #0.2 :m and may be considered a rather polydisperse distribution withsigma g values of 2.4 and greater.
All aerosol particles are continuously influenced by gravity, but particles with adae > 0.5 :m are affected to the greatest extent. A spherical compact particle will acquire aterminal settling velocity when a balance is achieved between the acceleration of gravity actingon the particle and the viscous resistance of the air; it is this velocity that brings the particle intocontact with airway surfaces. Both sedimentation and inertial impaction cause the deposition ofmany particles within the same size range. These deposition processes act together in the ET andTB regions, with inertial impaction dominating in the upper airways and sedimentation becomingincreasingly dominant in the lower conducting airways, especially for the largest particles thatcan penetrate into the smaller bronchial airways.
As particle diameters become <1 :m, the particles are increasingly subjected to diffusivedeposition because of random bombardment by air molecules, which results in contact withairway surfaces. A dae of 0.5 :m is often considered a boundary between diffusion andaerodynamic (sedimentation and impaction) mechanisms of deposition. Thus, instead of havinga dae, diffusive particles of different shapes can be related to the diffusivity of a thermodynamicequivalent size based on spherical particles (Heyder et al., 1986). Diffusive deposition ofparticles is favored in the A region of the respiratory tract as particles of this size are likely topenetrate past the ET and TB regions.
Electrostatic precipitation is deposition related to particle charge. The electrical chargeon some particles may result in an enhanced deposition over what would be expected from sizealone. This is due to image charges induced on the surface of the airway by these particles, or tospace-charge effects whereby repulsion of particles containing like charges results in increasedmigration toward the airway wall. The effect of charge on deposition is inversely proportional toparticle size and airflow rate. A recent study employing hollow airway casts of the humantracheobronchial tree that assessed deposition of ultrafine (0.02 :m) and fine (0.125 :m)particles found that deposition of singly charged particles was 5-6 times that of particles havingno charge, and 2-3 times that of particles at Boltzmann equilibrium (Cohen et al., 1998). Thissuggests that within the TB region of humans, electrostatic precipitation may be a significant deposition mechanism for ultrafine and some fine particles, the latter of which are inclusive ofDPM. Thus, although electrostatic precipitation is generally a minor contributor to overallparticle deposition, it may be important for DPM.
Interception is deposition by physical contact with airway surfaces and is most importantfor fiber deposition (U.S. EPA, 1996).
Figure 3-2 shows the regional (ET, TB, A) deposition in the human respiratory tract asinfluenced by particle size. Keeping in mind that DPM is a polydisperse distribution with 0.2 :m

3-6
Figure 3-2. Generalized regional deposition fractions of various sized particles in thehuman respiratory tract. (Adapted from the International Commission onRadiological Protection (ICRP) Publication 66 (1994) model. For unit density,spherical particles inhaled through the nose by an adult male with a tidal volume of1250 mL, respiratory frequency of 20 min-1, and functional residual capacity (FRC) of3300 mL.) ET, extrathoracic; TB, tracheobronchial; A, alveolar.
being only the median diameter, it can be seen that principal fraction particles sized from < 0.2down to around 0.002 :m would, as predicted based on their size and the expected mechanism ofdiffusion, deposit in the alveolar region. Particles below this size range (and above around 4 :m)tend to deposit in the ET region. Specific modeling results for deposition of DPM particlesinclusive of their distribution (i.e., Fg) are presented in Section 3.6.
3.3.1.1. Biological Factors Modifying DepositionThe available experimental deposition data in humans are commonly derived using
healthy adult Caucasian males. Various factors can act to alter deposition patterns from thoseobtained in this group. The effects of different biological factors, including gender, age, andrespiratory tract disease, on particle deposition have been reviewed previously (U.S. EPA, 1996,Section 10.4.1.6). In general, there appears to be an inverse relationship between airwayresistance and total deposition.

3-7
Differences in patterns of deposition between humans and animals have been summarized(U.S. EPA, 1996; Schlesinger, 1985) and show clearly that when exposed to the same aerosol orgas, humans and animals receive doses that may differ in both total and regional (i.e., ET, TB, orA) deposition from a number of variables including particle size, especially for larger sizedparticles, i.e. dae $ 1 :m. Such interspecies differences are important because the adverse toxiceffect is likely more related to the quantitative pattern of deposition within the respiratory tractthan to the exposure concentration; this pattern determines not only the initial respiratory tracttissue dose but also the specific pathways by which the inhaled material is cleared andredistributed (Schlesinger, 1985). Such differences in initial deposition must be considered whenrelating biological responses obtained in laboratory animal studies to effects in humans.
The deposition patterns of inhaled diesel particles in the respiratory tract of humans andmammalian species has been reviewed (Health Effects Institute, 1995). Schlesinger (1985)showed that physiological differences in the breathing mode for humans (nasal or oronasalbreathers) and laboratory rats (obligatory nose breathers), combined with different airwaygeometries, resulted in significant differences in lower respiratory tract deposition patterns forlarger sized particles (>1 :m dae) in that a much lower fraction of inhaled larger particles isdeposited in the alveolar region of the rat compared with humans. However, alveolar depositionof the much smaller DPM (around 0.2 :m dae) was not affected as much by the differencesamong species, as was demonstrated in model calculations by Xu and Yu (1987). Theseinvestigators modeled the deposition efficiency of inhaled DPM in rats, hamsters, and humans onthe basis of calculations of the models of Schum and Yeh (1980) and Weibel (1963). Thesesimulations (Figure 3-3) indicate relative deposition patterns in the lower respiratory tract(trachea = generation 1; alveoli = generation 23) and are similar among hamsters, rats, andhumans. Variations in alveolar deposition of DPM over one breathing cycle in these differentspecies were predicted to be within 30% of one another (Xu and Yu, 1987). Xu and Yu (1987)note that this similarity is concordant with the premise that deposition of the submicron dieselparticles is dominated by diffusion rather than sedimentation or impaction. Although these dataassumed nose-breathing by humans, the results would not be very different for mouth-breathingbecause of the low filtering capacity of the nose for particles in the 0.1 to 0.5 :m range (seeFigure 3-2).
The preceding discussion addresses deposition patterns and deposition efficiencies ofDPM in the respiratory tract of various species including humans. The alveolar region wasfocused upon primarily because, as shown in Chapter 5, this region is where adverse effects fromlong-term DPM exposure are typically observed. For dosimetric calculations and modeling,however, it would be of much greater importance to consider the actual deposited dose. Table 3-1 presents the analysis of Xu and Yu (1987) on prediction of the deposited doses of DPM

3-8
Figure 3-3. Modeled deposition distribution patterns ofinhaled DE particles in the airways of different species. Generation 1-18 are TB; >18 are A.
inhaled in 1 min in the lungs of humans, rats, and hamsters on three different bases: the totallung volume (M), the surface area of all lung airways (M1), or the surface area of the epitheliumof the alveolar region only (M2). According to this analysis, the deposited dose is lower inhumans than in the two rodent species regardless of how the deposited dose is expressed. Theseresults are most certainly due predominately to the greater respiratory exchange rate in rodentsand smaller size of the rodent lung. Table 3-1 also indicates that the differences (betweenhumans to animals) are less on a surface area basis (.3-fold) than on a lung volume basis (.14-fold). This is due to larger alveolar diameters and concomitant lower surface area per unit oflung volume in humans. Such differences in the deposited dose in relevant target areas such asthe alveolar region are important and have to be considered when extrapolating the results fromDPM exposure studies in animals to humans. As will be discussed elsewhere in this document,procedures for dose extrapolation from animals to humans includes considering the process ofclearance, with clearance measurements being in relation to surface area rather than to volume. Thus predicted doses of particulates would be based on surface areas, such as M1 andM2 in Table3-1, rather than on volume, M.

3-9
Table 3-1. Predicted doses of inhaled DPM per minute based on total lung volume (M),total airway surface area (M1), or surface area in alveolar region (M2)
SpeciesM
(10-3 :g/min/cm3)M1
(10-6 :g/min/cm2)M2
(10-6 :g/min/cm2)
Hamster 3.548 3.088 2.382
Fischer rat 3.434 3.463 2.608
Human 0.249 1.237 0.775
M = mass DPM deposited in lung per minutetotal lung volume
M1 = mass DPM deposited in lung per minutetotal airway surface area
M2 = mass DPM deposited on the unciliated airways per minutesurface area of the unciliated airways
Based on the following conditions: (1) mass median aerodynamic diameter (MMAD) = 0.2 :m; geometric standarddeviation (Fg) = 1.9; packing density (N) = 0.3; and particle mass density (D) = 1.5 g/cm2; (2) particle concentration =1 mg/m3; and (3) nose-breathing. For humans, total lung volume = 3200 cm2, total airway surface area = 633,000 cm2, surface area of the unciliated airways = 627,000 cm2. Corresponding values for Fisher rats are 418cm2, 412cm2,and 409cm2; for hamsters, 282cm2, 262cm2, and 261cm2. Tidal volumes (in cm2) and respiratory frequency (per min)used for humans were 500 and 14; for Fisher rats, 1.6 and 98; for hamsters, 67 and 1.0.
Source: Xu and Yu, 1987.
Particle deposition will initiate particle redistribution processes (e.g., clearancemechanisms, phagocytosis) that transfer the particles to various subcompartments, including thealveolar macrophage pool, pulmonary interstitium, and lymph nodes. Over time, therefore, onlysmall amounts of the original particle intake would be associated with the alveolar surface areas.
3.3.2. Particle Clearance and Translocation MechanismsThis section provides an overview of the mechanisms and pathways by which particles
are cleared from the respiratory tract. The mechanisms of particle clearance as well as clearanceroutes from the various regions of the respiratory tract have been considered in the PM CriteriaDocument (U.S. EPA, 1996) and reviewed by Schlesinger et al. (1997).
Particles that deposit upon airway surfaces may be cleared from the respiratory tractcompletely, or be translocated to other sites within this system, by various regionally distinctprocesses. These clearance mechanisms can be categorized as either absorptive (i.e., dissolution)or nonabsorptive (i.e., transport of intact particles) and may occur simultaneously or with
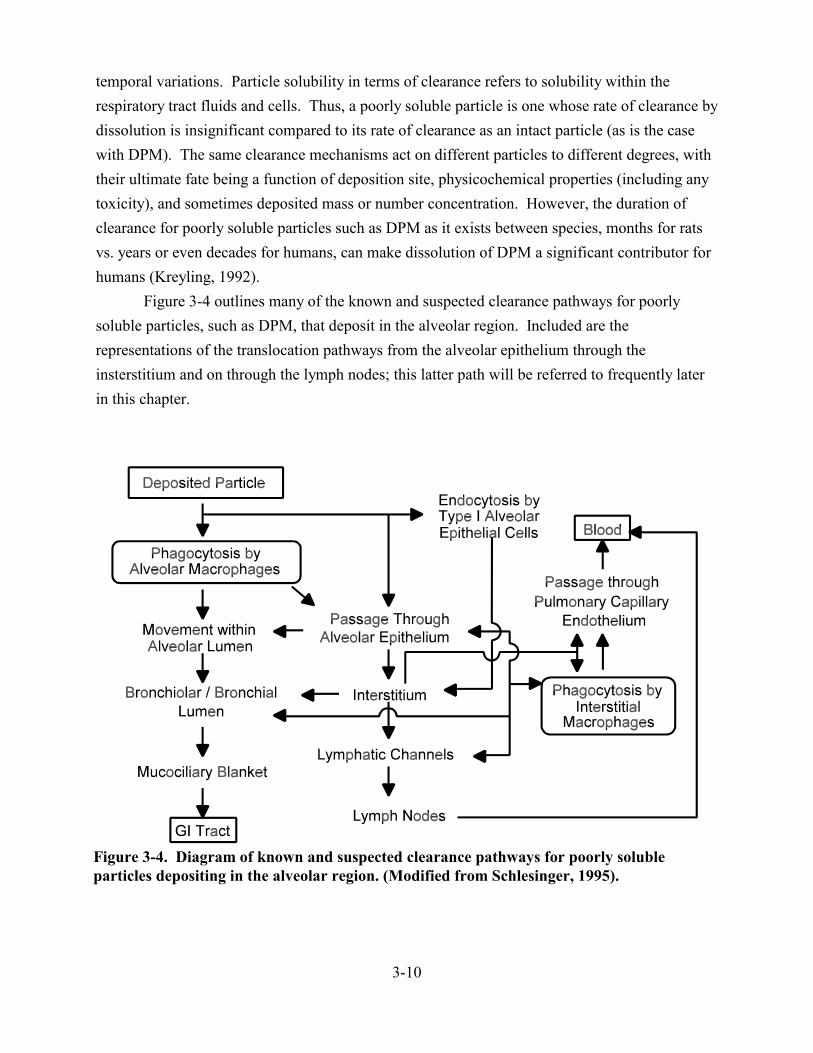
3-10
Figure 3-4. Diagram of known and suspected clearance pathways for poorly solubleparticles depositing in the alveolar region. (Modified from Schlesinger, 1995).
temporal variations. Particle solubility in terms of clearance refers to solubility within therespiratory tract fluids and cells. Thus, a poorly soluble particle is one whose rate of clearance bydissolution is insignificant compared to its rate of clearance as an intact particle (as is the casewith DPM). The same clearance mechanisms act on different particles to different degrees, withtheir ultimate fate being a function of deposition site, physicochemical properties (including anytoxicity), and sometimes deposited mass or number concentration. However, the duration ofclearance for poorly soluble particles such as DPM as it exists between species, months for ratsvs. years or even decades for humans, can make dissolution of DPM a significant contributor forhumans (Kreyling, 1992).
Figure 3-4 outlines many of the known and suspected clearance pathways for poorlysoluble particles, such as DPM, that deposit in the alveolar region. Included are therepresentations of the translocation pathways from the alveolar epithelium through theinsterstitium and on through the lymph nodes; this latter path will be referred to frequently laterin this chapter.

3-11
3.3.2.1. Extrathoracic RegionThe clearance of poorly soluble particles deposited in the nasal passages occurs via
mucociliary transport, and the general flow of mucus is backwards, i.e., towards the nasopharynx. Mucus flow in the most anterior portion of the nasal passages is forward, clearing depositedparticles to the vestibular region where removal is by sneezing, wiping, or blowing.
Soluble material deposited on the nasal epithelium is accessible to underlying cells viadiffusion through the mucus. Dissolved substances may be subsequently translocated into thebloodstream. The nasal passages have a rich vasculature, and uptake into the blood from thisregion may occur rapidly.
Clearance of poorly soluble particles deposited in the oral passages is by expectoration orby swallowing into the gastrointestinal tract.
3.3.2.2. Tracheobronchial RegionThe dynamic relationship between deposition and clearance is responsible for
determining lung burden at any point in time. Clearance of poorly soluble particles from the TBregion is mediated primarily by mucociliary transport, a more rapid process than those operatingin alveolar regions. Mucociliary transport (often referred to as the mucociliary escalator) isaccomplished by the rhythmic beating of cilia that line the respiratory tract from the tracheathrough the terminal bronchioles. This movement propels the mucous layer containing depositedparticles (or particles within alveolar macrophages [AMs]) toward the larynx. Clearance rate bythis system is determined primarily by the flow velocity of the mucus, which is greater in theproximal airways and decreases distally. These rates also exhibit interspecies and individualvariability. Considerable species-dependent variability in tracheobronchial clearance has beenreported, with dogs generally having faster clearance rates than guinea pigs, rats, or rabbits(Felicetti et al., 1981). The half-time (t1/2) values for tracheobronchial clearance of relativelyinsoluble particles are usually on the order of hours, as compared to alveolar clearance, which ison the order of hundreds of days in humans and dogs. The clearance of particulate matter fromthe tracheobronchial region is generally recognized as being biphasic or multiphasic (Raabe,1982). Some studies have shown that particles are cleared from large, intermediate, and smallairways with t1/2 of 0.5, 2.5, and 5 h, respectively. However, reports have indicated that clearancefrom airways is biphasic and that the long-term component for humans may take much longer fora significant fraction of particles deposited in this region, and may not be complete within 24 h asgenerally believed (Stahlhofen et al., 1990; ICRP, 1994).
Although most of the particulate matter will be cleared from the tracheobronchial regiontowards the larynx and ultimately swallowed, the contribution of this fraction relative tocarcinogenic potential is unclear. With the exception of conditions of impaired bronchial
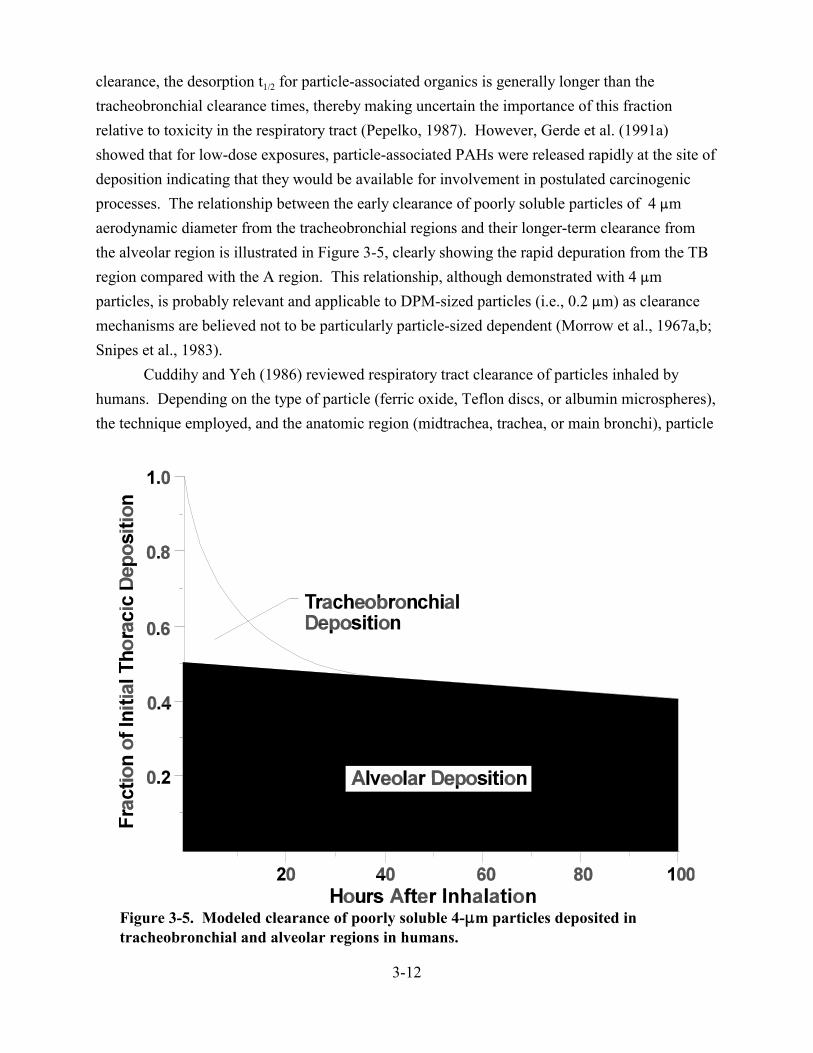
3-12
Figure 3-5. Modeled clearance of poorly soluble 4-:m particles deposited intracheobronchial and alveolar regions in humans.
clearance, the desorption t1/2 for particle-associated organics is generally longer than thetracheobronchial clearance times, thereby making uncertain the importance of this fractionrelative to toxicity in the respiratory tract (Pepelko, 1987). However, Gerde et al. (1991a)showed that for low-dose exposures, particle-associated PAHs were released rapidly at the site ofdeposition indicating that they would be available for involvement in postulated carcinogenicprocesses. The relationship between the early clearance of poorly soluble particles of 4 :maerodynamic diameter from the tracheobronchial regions and their longer-term clearance fromthe alveolar region is illustrated in Figure 3-5, clearly showing the rapid depuration from the TBregion compared with the A region. This relationship, although demonstrated with 4 :mparticles, is probably relevant and applicable to DPM-sized particles (i.e., 0.2 :m) as clearancemechanisms are believed not to be particularly particle-sized dependent (Morrow et al., 1967a,b;Snipes et al., 1983).
Cuddihy and Yeh (1986) reviewed respiratory tract clearance of particles inhaled byhumans. Depending on the type of particle (ferric oxide, Teflon discs, or albumin microspheres),the technique employed, and the anatomic region (midtrachea, trachea, or main bronchi), particle
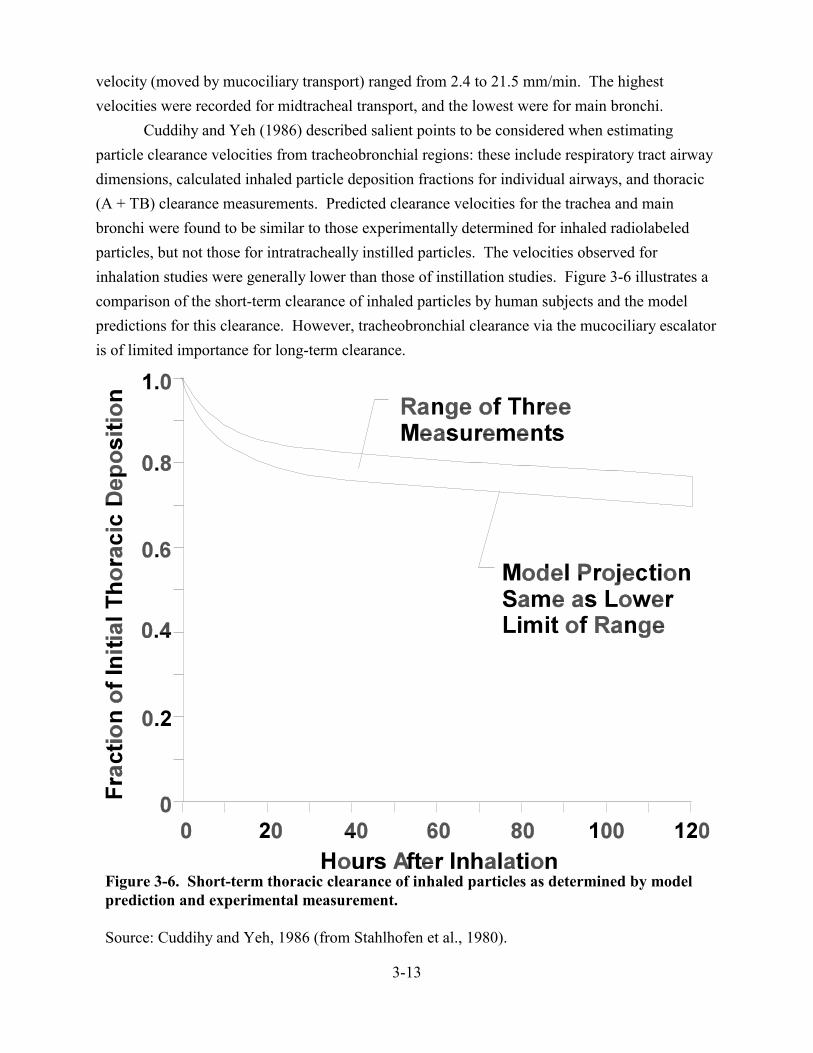
3-13
Figure 3-6. Short-term thoracic clearance of inhaled particles as determined by modelprediction and experimental measurement.
Source: Cuddihy and Yeh, 1986 (from Stahlhofen et al., 1980).
velocity (moved by mucociliary transport) ranged from 2.4 to 21.5 mm/min. The highestvelocities were recorded for midtracheal transport, and the lowest were for main bronchi.
Cuddihy and Yeh (1986) described salient points to be considered when estimatingparticle clearance velocities from tracheobronchial regions: these include respiratory tract airwaydimensions, calculated inhaled particle deposition fractions for individual airways, and thoracic(A + TB) clearance measurements. Predicted clearance velocities for the trachea and mainbronchi were found to be similar to those experimentally determined for inhaled radiolabeledparticles, but not those for intratracheally instilled particles. The velocities observed forinhalation studies were generally lower than those of instillation studies. Figure 3-6 illustrates acomparison of the short-term clearance of inhaled particles by human subjects and the modelpredictions for this clearance. However, tracheobronchial clearance via the mucociliary escalatoris of limited importance for long-term clearance.
3-14
Exposure of F344 rats to whole exhaust containing DPM at concentrations of 0.35, 3.5, or7.1 mg/m3 for up to 24 mo did not significantly alter tracheal mucociliary clearance as assessedby clearance of 99mTc-macroaggregated albumin instilled into the trachea (Wolff et al., 1987). The authors stated that measuring retention would yield estimates of clearance efficiencycomparable to measuring the velocity for transport of the markers in the trachea. The results ofthis study were in agreement with similar findings of unaltered tracheal mucociliary clearance inrats exposed to DPM (0.21, 1.0, or 4.4 mg/m3) for up to 4 mo (Wolff and Gray, 1980). However,the 1980 study by Wolff and Gray, as well as an earlier study by Battigelli et al. (1966), showedthat acute exposure to high concentrations of DE soot (1.0 and 4.4 mg/m3 in the study by Wolffand Gray [1980] and 8 to 17 mg/m3 in the study by Battigelli et al. [1966]) produced transientreductions in tracheal mucociliary clearance. Battigelli et al. (1966) also noted that thecompromised tracheal clearance was not observed following cessation of exhaust exposure.
That tracheal clearance does not appear to be significantly impaired or is impaired onlytransiently following exposure to high concentrations of DPM is consistent with the absence ofpathological effects in the tracheobronchial region of the respiratory tract in experimentalanimals exposed to DPM. The apparent retention of a fraction of the deposited dose inthe airways could be cause for some concern regarding possible effects in this region, especiallyin light of the results from simulation studies by Gerde et al. (1991b) suggesting that release ofPAHs from particles may occur within minutes and therefore at the site of initial deposition. However, the absence of effects in the TB areas in long-term DPM studies and experimentalevidence that particle-associated PAHs are released at the site of particle deposition togethersuggest that these PAHs and other organics may be of lesser importance in tumorigenic responsesof rats than originally suspected. On the other hand, the data of Nikula et al. (1997a,b) could beinterpreted to suggest that a larger fraction of particles are translocated to the interstitium of therespiratory tract in primates that are heavily exposed (and therefore presumably in humans) thanin rats that are heavily exposed, including the interstitium of the respiratory bronchioles, ananatomical site absent in rats (Section 3.6). Moreover, eluted PAHs in the TB region are retainedlonger than those in the alveoli (Gerde et al., 1999), allowing time for activation. Also, the results of Kreyling (1992) indicate that appreciable dissolution of even poorly soluble particlesmay occur as a consequence of long absolute duration of clearance, such as years or decades, inhumans. Thus PAHs may have a role in human response to DE that cannot be evaluated with therat model.
Also, impairment of mucociliary clearance function as a result of exposure tooccupational or environmental respiratory tract toxicants or to cigarette smoke may significantlyenhance the retention of particles in the TB region. For example, Vastag et al. (1986)demonstrated that not only smokers with clinical symptoms of bronchitis but also symptom-free
3-15
smokers have significantly reduced mucociliary clearance rates. Although impairedtracheobronchial clearance could conceivably have an impact on the effects of deposited DPM inthe conducting airways, it does not appear to be relevant to the epigenetic mechanism likelyresponsible for DE-induced rat pulmonary tumors as the tumors observed in these studies wereall or nearly all of A vice TB origin.
Poorly soluble particles such as DPM that are deposited within the TB region are clearedpredominantly by mucociliary transport towards the oropharynx, followed by swallowing. Poorly soluble particles may also be cleared by traversing the epithelium by endocytoticprocesses, and enter the peribronchial region. Clearance may occur following phagocytosis byairway macrophages, located on or beneath the mucous lining throughout the bronchial tree, orvia macrophages that enter the airway lumen from the bronchial or bronchiolar mucosa(Robertson, 1980).
3.3.2.3. A RegionA number of investigators have reported on the alveolar clearance kinetics of human
subjects. Bohning et al. (1980) examined alveolar clearance in eight humans who had inhaled<0.4 mg of 85Sr-labeled polystyrene particles (3.6 ± 1.6 :m diam.). A double-exponential modelbest described the clearance of the particles and provided t1/2 values of 29 ± 19 days and 298 ±114 days for short-term and long-term phases, respectively. It was noted that of the particlesdeposited in the alveolar region, 75% ± 13% were cleared via the long-term phase. Alveolar retention t1/2 values of 330 and 420 days were reported for humans who had inhaledaluminosilicate particles of MMAD 1.9 and 6.1 :m (Bailey et al., 1982). In a comprehensivestudy Bailey et al. (1985) followed the long-term retention of inhaled particles in a humanrespiratory tract. The retention of 1 and 4 :m fused aluminosilicate particles labeled withstrontium-85 and yttrium-88, respectively, was followed in male volunteers for about 533 days. Approximately 7% of the initial lung deposit of 1 :m particles and 40% of the 4 :m particleswere associated with a rapid clearance phase corresponding to the calculated tracheobronchialdeposits. Retention of the remaining material followed a two-component exponential function,with phases having half-times of the order of tens of days and several hundred days, respectively.
Quantitative data on clearance rates in humans having large lung burdens of particulatematter are lacking. Bohning et al. (1982) and Cohen et al. (1979), however, did provide evidencefor slower clearance in smokers, and Freedman and Robinson (1988) reported slower clearancerates in coal miners who had mild pneumoconiosis with presumably high lung burdens of coaldust. Although information on particle burden and particle overload relationships in humans ismuch more limited than in experimental animal models, inhibition of clearance does seem tooccur. Stöber et al. (1967) estimated a clearance t1/2 of 4.9 years in coal miners with nil or slight
3-16
silicosis, based on postmortem lung burdens. The lung burdens and estimated exposure historiesranged from 2 to 50 mg/g of lung or more, well above the value at which clearance impairment isobserved in the rat. Furthermore, impaired clearance resulting from smoking or exposure toother respiratory toxicants may increase the possibility of an enhanced particle accumulationeffect resulting from exposure to other particle sources such as DPM.
Normal alveolar clearance rates in laboratory animals exposed to DPM have beenreported by a number of investigators (Table 3-2). Because the rat is, historically, the species forwhich experimentally induced lung cancer data are available and for which most clearance dataexist, it is the species most often used for assessing human risk, and reviews of alveolar clearancestudies have been generally limited to this species.
Chan et al. (1981) subjected 24 male F344 rats to nose-only inhalation of diluted DEgenerated from a diesel engine (6 mg/m3) labeled with 131Ba or 14C for 40 to 45 min and assessedtotal lung deposition, retention, and elimination. Based on radiolabel inventory, the depositionefficiency in the respiratory tract was 15% to 17%. Measurement of 131Ba label in the fecesduring the first 4 days following exposure indicated that 40% of the deposited DPM waseliminated via mucociliary clearance. Clearance of the particles from the lower respiratory tractfollowed a two-phase elimination process consisting of a rapid (t½ of 1 day) elimination bymucociliary transport and a slower (t½ of 62 days) macrophage-mediated alveolar clearance. This study provided data for normal alveolar clearance rates of DPM not affected by prolongedexposure or particle overloading.
Several studies have investigated the effects of exposure concentration on the alveolarclearance of DPM by laboratory animals. Wolff et al. (1986, 1987) provided clearance data (t½)and lung burden values for F344 rats exposed to DE for 7 h/day, 5 days/week for 24 mo. Exposure concentrations of 0.35, 3.5, and 7.1 mg of DPM/m3 were employed in this whole body-inhalation exposure experiment. Intermediate (hours-days) clearance of 67Ga2O3 particles (30min, nose-only inhalation) was assessed after 6, 12, 18, and 24 mo of exposure at all of the DPMconcentrations. A two-component function described the clearance of the administeredradiolabel:
(3-1)F A B(t) 1 2exp(-0.693 t / exp(-0.693 t /= +τ τ) ),
where F(t) was the percentage retained throughout the respiratory tract, A and B were themagnitudes of the two components (component A included nasal, lung, and gastrointestinalclearance, while component B represented intermediate lung clearance) and J1 and J2 were the

Table 3-2. Alveolar clearance in laboratory animals exposed to DPM in whole exhaust
Species/sexExposuretechnique
Exposureduration
Particlesmg/m3 Observed effects Reference
Rats, F-344, M Nose only;Radiolabeled DPM
40-45 min 6 Four days after exposure, 40% of DPM eliminated bymucociliary clearance. Clearance from lower RT was in2 phases. Rapid mucociliary (t1/2 = 1 day); slowermacrophage-mediated (t1/2 = 62 days).
Chan et al. (1981)
Rats, F-344 Whole body;assessed effecton clearance of67Ga2O3 particles
7 h/day5 days/week
24 mo
0.353.57.1
J1 significantly higher with exposure to 7.1 mg/m3 for24 mo; J2 significantly longer after exposure to 7.1 mg/m3
for 6 mo and to 3.5 mg/m3 for 18 mo.
Wolff et al. (1986,1987)
Rats Whole body 19 h/day5 days/week
2.5 years
4 Estimated alveolar deposition = 60 mg; particle burdencaused lung overload. Estimated 6-15 mg particle-boundorganics deposited.
Heinrich et al.(1986)
Rats, F-344, MF Whole body 7 h/day5 days/week
18 mo
0.150.944.1
Long-term clearance was 87 ± 28 and 99 ± 8 days for0.15 and 0.94 mg/m3 groups, respectively; t1/2 = 165 daysfor 4.1 mg/m3 group.
Griffis et al. (1983)
Rats, F-344;
Guinea pigs,Hartley
Nose-only;Radiolabeled 14C
45 min140 min
45 min
72
7
Rats demonstrated 3 phases of clearance with t1/2 = 1, 6,and 80 days, representing tracheobronchial, respiratorybronchioles, and alveolar clearance, respectively. Guineapigs demonstrated negligible alveolar clearance fromday 10 to 432.
Lee et al. (1983)
Rats, F-344 20 h/day7 days/week7-112 days
0.256
Monitored rats for a year. Proposed two clearance models. Clearance depends on initial particle burden; t1/2 increaseswith higher exposure. Increases in t1/2 indicate increasingimpairment of AM mobility and transition into overloadcondition.
Chan et al. (1984)
RT = respiratory tract.AM = alveolar macrophage.J1 = clearance from primary, ciliated airways.J2 = clearance from nonciliated passages.
3-17

3-18
Figure 3-7. Clearance from lungs of rats of 134Cs-FAP fused aluminosilicatetracer particles inhaled after 24 months of DE exposure at concentrations of0 (control), 0.35 (low), 3.5 (medium), and 7.1 (high) mg DPM/m3.
half-times for the A and B components, respectively. The early clearance half-times (J1), weresimilar for rats in all exposure groups at all time points except in the high-exposure (7.1 mg/m3)group following 24 mo of exposure, which was faster than the controls. Significantly longer Bcomponent retention half-times, representing intermediate clearance probably from nonciliatedstructures such as alveolar ducts and alveoli, were noted after as little as 6 mo exposure to DPMat 7.1 mg/m3 and 18 mo exposure to 3.5 mg/m3.
Nose-only exposures to 134Cs fused aluminosilicate particles (FAP) were used to assesslong-term (weeks-months) clearance. Following 24-mo exposure to DPM, long-term clearanceof 134Cs-FAP was significantly (p<0.01) altered in the 3.5 (cumulative exposure [C × T] of11,760 mg@h/m3) and 7.1 mg/m3 , C × T = 23,520 mg@h/m3) exposure groups (t½ of 264 and 240days, respectively) relative to the 0.35 mg/m3 and control groups (t½ of 81 and 79 days,respectively). Long-term clearance represents the slow component of particle removal from thealveoli. The decreased clearance correlated with the greater particle burden in the lungs of the3.5 and 7.1 mg/m3 exposure groups. Based on these findings, the cumulative exposure of > 11,760 mg@h/m3 (or 3.5 mg/m3 for a lifetime exposure) represented a particle overloadcondition resulting in compromised alveolar clearance mechanisms; the clearance rate at thelowest concentration (0.35 mg/m3; cumulative exposure of 118 mg@h/m3) was not different fromcontrol rates (Figure 3-7).

3-19
Heinrich et al. (1986) exposed rats 19 h/day, 5 days/week for 2.5 years to DPM at aparticle concentration of about 4 mg/m3, equal to a “C × T” of 53,200 mg@h/m3. The depositionin the alveolar region was estimated to equal 60 mg. The lung particle burden was apparentlysufficient to result in a “particle overload” condition (Section 3.4). With respect to the organicmatter adsorbed onto the particles, the authors estimated that over the 2.5-year period, 6-15 mg ofparticle-bound organic matter had been deposited and was potentially available for biologicaleffects. This estimation was based on the analysis of the DE used in the experiments, values forrat ventilatory functions, and estimates of deposition and clearance.
Accumulated burden of DPM in the lungs following an 18-mo, 7 h/day, 5 days/weekexposure to whole DE was reported by Griffis et al. (1983). Male and female F344 rats exposedto 0.15, 0.94, or 4.1 mg DPM/m3 were sacrificed at 1 day and 1, 5, 15, 33, and 52 weeks afterexposure, and DPM was extracted from lung tissue dissolved in tetramethylammoniumhydroxide. Following centrifugation and washing of the supernatant, DPM content of the tissuewas quantitated using spectrophotometric techniques. The analytical procedure was verified bycomparing results to recovery studies using known amounts of DPM with lungs of unexposedrats. Lung burdens were 0.035, 0.220, and 1.890 mg/g lung tissue, respectively, in rats exposedto diluted whole exhaust at 0.15, 0.94, and 4.1 mg DPM/m3. Long-term retention for the 0.15and 0.94 mg/m3 groups had estimated half-times of 87 ± 28 and 99 ± 8 days, respectively. Theretention t1/2 for the 4.1-mg/m3 exposure group was 165 ± 8 days, which was significantly(p<0.0001) greater than those of the lower exposure groups. The 18-mo exposures to 0.15 or0.96 mg/m3 levels of DPM [C × T] equivalent of 378 and 2,368 mg@h/m3, respectively) did notaffect clearance rates, whereas the exposure to the 4.1 mg/m3 concentration C × T = 10,332mg@h/m3) resulted in impaired clearance.
Lee et al. (1983) described the clearance of DPM (7 mg/m3 for 45 min or 2 mg/m3 for 140min) by F344 rats (24 per group) and Hartley guinea pigs exposed by nose-only inhalation todiluted whole exhaust with no apparent particle overload in the lungs as being in three distinctphases. The exposure protocols provided comparable total doses based on a 14C radiolabel. 14CO2 resulting from combustion of 14C-labeled diesel fuel was removed by a diffusion scrubberto avoid erroneous assessment of 14C intake by the animals. Retention of the radiolabeledparticles was determined up to 335 days after exposure and resulted in a three-phase clearancewith retention t1/2 values of 1, 6, and 80 days. The three clearance phases are taken to representremoval of tracheobronchial deposits by the mucociliary escalator, removal of particles depositedin the respiratory bronchioles, and alveolar clearance, respectively. Species variability inclearance of DPM was also demonstrated because the Hartley guinea pigs exhibited negligiblealveolar clearance from day 10 to day 432 following a 45-min exposure to a DPM concentration

3-20
of 7 mg/m3. Initial deposition efficiency (20% ± 2%) and short-term clearance were, however,similar to those for rats.
Lung clearance in male F344 rats preexposed to diluted whole DE containing DPM at0.25 or 6 mg/m3 20 h/day, 7 days/week for periods lasting from 7 to 112 days was studied byChan et al. (1984). Following this preexposure protocol, rats were subjected to 45-min nose-only exposure to 14C-DE, and alveolar clearance of radiolabel was monitored for up to 1 year. Two models were proposed: a normal biphasic clearance model and a modified lung retentionmodel that included a slow-clearing residual component to account for sequestered aggregates ofmacrophages. The first model described a first-order clearance for two compartments: R(t) =Ae-u1t + Be-u2t. This yielded clearance t1/2 values of 166 and 562 days for rats preexposed to 6.0mg/m3 for 7 and 62 days, respectively. These values were significantly (p<0.05) greater than theretention t1/2 of 77 ± 17 days for control rats. The same retention values for rats of the 0.25mg/m3 groups were 90 ± 14 and 92 ± 15 days, respectively, for 52- and 112-day exposures andwere not significantly different from controls. The two-compartment model represents overallclearance of the tracer particles, even if some of the particles were sequestered in particle-ladenmacrophages with substantially slower clearance rates. For the second model, which excludedtransport of the residual fractions in sequestered macrophage aggregates, slower clearance wasobserved in the group with a lung burden of 6.5 mg (exposed to 6.0 mg/m3 for 62 days), and noclearance was observed in the 11.8 mg group (exposed to 6.0 mg/m3 for 112 days). Clearancewas shown to be dependent on the initial burden of particles, and therefore the clearance t1/2
would increase in higher exposure scenarios. This study emphasizes the importance of particleoverloading of the lung and the ramifications on clearance of particles; the significant increasesin half-times indicate an increasing impairment of the alveolar macrophage mobility andsubsequent transition into an overload condition as is discussed further in Section 3.4.
Long-term alveolar clearance rates of particles in various laboratory animals and humanshave been reviewed by Pepelko (1987). Although retention t1/2 varies both among and within species and is also dependent on the physicochemical properties of the inhaled particles, theretention t1/2 for humans is much longer (>8 mo) than the average retention t1/2 of 60 days for rats.
Clearance from the A region occurs via a number of mechanisms and pathways, but therelative importance of each is not always certain and may vary between species. Particle removalby macrophages comprises the main nonabsorptive clearance process in this region. Alveolarmacrophages reside on the epithelium, where they phagocytize and transport deposited material,which they contact by random motion or via directed migration under the influence of localchemotactic factors (Warheit et al., 1988).
Particle-laden macrophages may be cleared from the A region along a number ofpathways (U.S. EPA, 1996). Uningested particles or macrophages in the interstitium may

3-21
traverse the alveolar-capillary endothelium, directly entering the blood (Raabe, 1982; Holt,1981); endocytosis by endothelial cells followed by exocytosis into the vessel lumen seems,however, to be restricted to particles <0.1 :m diameter, and may increase with increasing lungburden (Lee et al., 1985; Oberdörster, 1988). Once in the systemic circulation, transmigratedmacrophages, as well as uningested particles, can travel to extrapulmonary organs.
Alveolar macrophages constitute an important first-line cellular defense mechanismagainst inhaled particles that deposit in the alveolar region of the lung. It is well established thata host of diverse materials, including DPM, are phagocytized by AMs shortly after deposition(White and Garg, 1981; Lehnert and Morrow, 1985) and that such cell-contained particles aregenerally rapidly sequestered from both the extracellular fluid lining in the alveolar region andthe potentially sensitive alveolar epithelial cells. In addition to this role in compartmentalizingparticles from other lung constituents, AMs are prominently involved in mediating the clearanceof relatively insoluble particles from the air spaces (Lehnert and Morrow, 1985). Although thedetails of the actual process have not been delineated, AMs with their particle burdens gain access and become coupled to the mucociliary escalator and are subsequently transported fromthe lung via the conducting airways. Although circumstantial, numerous lines of evidenceindicate that such AM-mediated particle clearance is the predominant mechanism by whichrelatively insoluble particles are removed from the alveolar region of the lungs (Gibb andMorrow, 1962; Ferin, 1982; Harmsen et al., 1985; Lehnert and Morrow, 1985; Powdrill et al.,1989).
The removal characteristics for particles deposited in the alveolar region of the lung havebeen descriptively represented by numerous investigators as a multicompartment ormulticomponent process in which each component follows simple first-order kinetics (Snipesand Clem, 1981; Snipes et al., 1988; Lee et al., 1983). Although the various compartments canbe described mathematically, the actual physiological mechanisms determining these differingclearance rates have not been well characterized.
Lehnert et al. (1988, 1989) performed studies using laboratory rats to examineparticle-AM relationships over the course of alveolar clearance of low to high lung burdens ofnoncytotoxic microspheres (2.13 :m diam.) to obtain information on potential AM-relatedmechanisms that form the underlying bases for kinetic patterns of alveolar clearance as a functionof particle lung burdens. The intratracheally instilled lung burdens varied from 1.6 × 10⁷
particles (about 85 :g) for the low lung burden to 2.0 × 10⁸ particles (about 1.06 mg) for the mid-dose and 6.8 × 10⁸ particles (about 3.6 mg) for the highest lung burden. The lungs were lavagedat various times postexposure and the numbers of spheres in each macrophage counted. Although such experiments provide information regarding the response of the lung to particulatematter, intratracheal instillation is not likely to result in the same depositional characteristics as

3-22
inhalation of particles. Therefore, it is unlikely that the response of alveolar macrophages tothese different depositional characteristics will be quantitatively similar.
The t1/2 values of both the early and later components of clearance were virtually identicalfollowing deposition of the low and medium lung burdens. For the highest lung burden,significant prolongations were found in both the early, more rapid, as well as the slowercomponent of alveolar clearance. The percentages of the particle burden associated with theearlier and later components, however, were similar to those of the lesser lung burdens. On thebasis of the data, the authors concluded that translocation of AMs from alveolar spaces by way ofthe conducting airways is fundamentally influenced by the particle burden of the cells sotranslocated. In the case of particle overload that occurred at the highest lung burden, thetranslocation of AMs with the heaviest cellular burdens of particles (i.e., greater than about100 microspheres per AM) was definitely compromised.
On the other hand, analysis of the disappearance of AMs with various numbers ofparticles indicates that the particles may not exclusively reflect the translocation of AMs from thelung. The observations are also consistent with a gradual redistribution of retained particlesamong the AMs in the lung concurrent with the removal of particle-containing AMs via theconducting airways. Experimental support suggestive of potential processes for such particleredistribution comes from a variety of investigations involving AMs and other endocytic cells(Heppleston and Young, 1973; Evans et al., 1986; Aronson, 1963; Sandusky et al., 1977;Heppleston, 1961; Riley and Dean, 1978).
3.3.3. Translocations of Particles to Extra-Alveolar Macrophage Compartment SitesAlthough the phagocytosis of particles by cells free within the lung and the mucociliary
clearance of the cells with their particulate matter burdens represent the most prominentmechanisms that govern the fate of particles deposited in the alveolar region, other mechanismsexist that can affect both the retention characteristics of relatively insoluble particles in the lungand the lung clearance pathways for the particles. One mechanism is endocytosis of particles byalveolar lining (Type I) cells (Sorokin and Brain, 1975; Adamson and Bowden, 1978, 1981) thatnormally provide >90% of the cell surface of the alveoli in the lungs of a variety of mammalianspecies (Crapo et al., 1983). This process may be related to the size of the particles that depositin the lungs and the numbers of particles that are deposited. Adamson and Bowden (1981) foundthat with increasing loads of carbon particles (0.03 :m diam.) instilled in the lungs of mice, morefree particles were observed in the alveoli within a few days; it should be noted, however, thatthis phenomenon was demonstrated with very high doses given as a bolus such that themechanism and relevance of this phenomenon at lower concentrations may be different or evenunrelated to what may happen at much lower concentrations. The relative abundance of particles

3-23
endocytosed by Type I cells also increased with increasing lung burdens of the particles, butinstillation of large particles (1.0 :m) rarely resulted in their undergoing endocytosis. A 4 mgburden of 0.1 :m diameter latex particles is equivalent to 8 × 10¹² particles, whereas a 4 mgburden of 1.0 :m particles is composed of 8 × 10⁹ particles. Regardless, DPM with volumemedian diameters between 0.05 and 0.3 :m (Frey and Corn, 1967; Kittleson et al., 1978) wouldbe expected to be within the size range for engulfment by Type I cells should suitable encountersoccur. Indeed, it has been demonstrated that DPM is endocytosed by Type I cells in vivo (Whiteand Garg, 1981).
Unfortunately, information on the kinetics of particle engulfment (endocytosis) by Type Icells relative to that by AMs is scanty. Even when relatively low burdens of particulate matterare deposited in the lungs, some fraction of the particles usually appears in the regional lymphnodes (Ferin and Feldstein, 1978; Lehnert, 1989). As will be discussed, endocytosis of particlesby Type I cells is an initial, early step in the passage of particles to the lymph nodes. Assumingparticle phagocytosis is not sufficiently rapid or perfectly efficient, increasing numbers ofparticles would be expected to gain entry into the Type I epithelial cell compartment duringchronic aerosol exposures. Additionally, if particles are released on a continual basis by AMsthat initially sequestered them after lung deposition, some fraction of the “free” particles soreleased could also undergo passage from the alveolar space into Type I cells.
The endocytosis of particles by Type I cells represents only the initial stage of a processthat can lead to the accumulation of particles in the lung’s interstitial compartment and thesubsequent translocation of particles to the regional lymph nodes. As suggested by the results of Adamson and Bowden (1981), a vesicular transport mechanism in the Type I cell can transferparticles administered at high concentrations by instillation from the air surface of the alveolarepithelium into the lung’s interstitium, where particles may be phagocytized by interstitialmacrophages or remain in a “free” state for a poorly defined period that may be dependent on thephysicochemical characteristics of the particle. The lung’s interstitial compartment accordinglyrepresents an anatomical site for the retention of particles in the lung, although the kinetics onmovement into and out of this site remain obscure for both humans and test species. Whether ornot AMs, and perhaps polymorphonuclear neutrophils (PMNs) that have gained access to thealveolar space compartment and phagocytize particles there, also contribute to the particletranslocation process into the lung’s interstitium also remains a controversial issue.
Translocation of particulate matter to the various interstitial spaces within the lung is aprominent phenomenon occurring at least at high (occupational) exposures that has beenexamined extensively for both DPM and coal dust in a species comparison between rats andprimates (Nikula et al., 1997a,b). Detailed pulmonary morphometry conducted on F344 rats andcynomolgus monkeys that had been exposed for 24 months to occupational levels of DPM (1.95
3-24
mg/m3; see Lewis et al., 1989) showed major differences in the pulmonary sites of particulatedeposition. In rats, about 73% of DPM was present in the alveolar ducts/alveoli and 27% ininterstitial compartments; for monkeys the corresponding figures were markedly different at 43%and 57%. The corresponding pulmonary histopathology confirmed that both species wereaffected, although rats are more sensitive, as incidence and severity scores for alveolar effectsranged from 15 of 15 with severity scores from 1-4 (minimal to moderate), whereas for monkeysthe corresponding values were only 4 of 15 at a range of 0-2 (not observed to minimal). Similarly, both species exhibited histopathology at the interstitial sites of deposition but witheffects in monkeys being slightly more severe (1 of 15 graded as slight, 14 of 15 graded asminimal) than those in rats (14 of 15 graded as slight, 1 of 15 graded as minimal). The basis forthis interspecies difference may be due to any number of clear contrasts that exist between ratand primate lungs, including anatomical (primates and humans have respiratory bronchioleswhereas rats do not), kinetic (primates and human clearance processes allow more residence timeof particles in the lung than do those in rats or rats may have faster interstitial to lymph nodeclearance rates than do humans and primates), or morphological (primates and humans havemore interstitial tissue, more and thicker pleura, and wider interstitial spaces than do rats). Aspects of the study itself that may obscure its interpretation include the relative lifespan theexposure represented between the tested species (lifetime for rat vs. about 10% lifetime ofprimate), that there was only the single time point at which the relative burdens were determined,and that rat lymph node burdens were not included in the analysis. The analysis of Kuempel(2000) using human occupational data clearly showed that models require an interstitializationprocess to provide adequate fits to the empirical human (miners’) lung deposition data discussedin that study. Hypotheses about possible mechanisms for the interstitialization process are scant,although Harmsen et al. (1985) provided some evidence in dogs that migration of AMs maycontribute to the passage of particles to the interstitial compartment and also may be involved inthe subsequent translocation of particles to draining lymph nodes. Translocation to theextrapulmonary regional lymph nodes apparently can involve the passage of free particles as wellas particle-containing cells via lymphatic channels in the lungs (Harmsen et al., 1985; Ferin andFeldstein, 1978; Lee et al., 1985). Further, it has been noted that particles accumulate both morerapidly and more abundantly in lymph nodes that receive lymphatic drainage from the lung (Ferinand Feldstein, 1978; Lee et al., 1985). It should be stressed that further investigation is requiredto confirm the character and even existence of the interstitialization process in the lungs ofhumans with exposures to particles at lower environmental concentrations, or to submicrometerparticles such as DPM, or to examine the kinetics and time course of the interstitializationprocess.

3-25
3.3.3.1. Clearance KineticsThe clearance kinetics of PM have been reviewed in the PM CD (U.S. EPA, 1996) and by
Schlesinger et al. (1997), the results of which indicate that clearance kinetics may be profoundlyinfluenced by several factors. The influence of time, for example, is definitively showed by thework of Bailey et al. (1985; discussed above), who showed that the rate of clearance from thepulmonary region to the GI tract decreased nearly fourfold from initial values to those noted at200 days and beyond after particle inhalation.
3.3.3.2. Interspecies Patterns of ClearanceThe inability to study the retention of certain materials in humans for direct risk
assessment requires the use of laboratory animals. Adequate toxicological assessmentnecessitates that interspecies comparisons consider aspects of dosimetry including knowledge ofclearance rates and routes. The basic mechanisms and overall patterns of clearance from therespiratory tract are similar in humans and most other mammals. Regional clearance rates,however, can show substantial variation between species, even for similar particles depositedunder comparable exposure conditions (U.S. EPA, 1996; Schlesinger et al., 1997; Snipes et al.,1989).
In general, there are species-dependent rate constants for various clearance pathways.Differences in regional and total clearance rates between some species are a reflection of differences in mechanical clearance processes. For consideration in assessing particle dosimetry,the end result of interspecies differences in clearance is that the retained doses in the lowerrespiratory tract can differ between species, which may result in differences in response to similarparticulate exposures.
3.3.3.3. Clearance Modifying Factors and Susceptible PopulationsA number of host and environmental factors may modify clearance kinetics and may
consequently make individuals exhibiting or afflicted with these factors particularly susceptibleto the effects resulting from exposure to DPM. These include age, gender, physical activity,respiratory tract disease, and inhalation of irritants (U.S. EPA, 1996, Section 10.4.2.5). Respiratory tract clearance appears to be prolonged in a number of pathophysiological conditionsin humans, including chronic sinusitis, chronic bronchitis, asthma, chronic obstructive lungdisease, and various acute respiratory infections.
3.3.3.4. Respiratory Tract DiseaseEarlier studies reviewed in the PM CD (U.S. EPA, 1996) noted that various respiratory
tract diseases are associated with alterations in overall clearance and clearance rates. Prolonged

3-26
nasal mucociliary clearance in humans is associated with chronic sinusitis or rhinitis, and cysticfibrosis. Bronchial mucus transport may be impaired in people with bronchial carcinoma,chronic bronchitis, asthma, and various acute infections. In certain of these cases, coughing mayenhance mucus clearance, but it generally is effective only if excess secretions are present.
The rates of A region particle clearance are reduced in humans with chronic obstructivelung disease and in laboratory animals with viral infections, whereas the viability and functionalactivity of macrophages are impaired in human asthmatics and in animals with viral-induced lunginfections (U.S. EPA, 1996). However, any modification of functional properties ofmacrophages appears to be injury specific, reflecting the nature and anatomic pattern of disease.
3.4. PARTICLE “OVERLOAD”3.4.1. Introduction
Some experimental studies using laboratory rodents employed high exposureconcentrations of relatively nontoxic, poorly soluble particles. These particle loads interferedwith normal clearance mechanisms, producing clearance rates different from those that would occur at lower exposure levels. Prolonged exposure to high particle concentrations is associatedwith what is termed particle overload. This is defined as the overwhelming of macrophage-mediated clearance by the deposition of particles at a rate exceeding the capacity of thatclearance pathway. Aspects and occurrence of this phenomenon have already been alluded to inearlier portions of this chapter on alveolar clearance (Section 3.3.2.3). The relevance of thisphenomenon for human risk assessment has long been the object of scientific inquiry. Amonograph on this matter and many others relevant to DPM has appeared (ILSI, 2000), and theresults, opinions, and judgments put forth therein are used extensively in this chapter and in thisassessment.
Wolff et al. (1987) used 134Cs-labeled fused aluminosilicate particles to measure alveolarclearance in rats following 24-mo exposure to low, medium, and high concentrations of DE(targeted concentrations of DPM of 0.35, 3.5 and 7.1 mg/m3). The short-term component of themulticomponent clearance curves was similar for all groups, but long-term clearance wasretarded in the medium- and high-exposure groups (Figure 3-7). The half times of the long-termclearance curves were 79, 81, 264, and 240 days, respectively, for the control, low-, medium-,and high-exposure groups. Clearance was overloaded at the high and medium but not at the lowexposure level. Lung burdens of DPM were measured after 6, 12, 18, and 24 mo of exposure. The results (Figure 3-8) indicate that the lung burden of deposited particles was appreciablyincreased or “overloaded” compared with the low level of exposure in the two highest exposurespost 6 months. Figure 3-8 also compares these observational results of lung burden withsimulated results where no overload would occur (McClellan, 2000). Comparison

3-27
Figure 3-8. Lung burdens (in mg DPM soot/g lung) in rats chronically exposed to DE at 0.35 (low) (), 3.5 (medium) (•), and 7.1 (high) mg / m3 (). The solid figuresrepresent actual data with means and standard errors from animals sacrificed at 6, 12,and 18 months after initiation of exposures. Lines are simulated model results fromthese same exposure levels, assuming no effect of exposure concentration on depositionor clearance of particles (from Wolff et al., 1987; McClellan, 2000).
of the observed and simulated results clearly shows that the two highest exposure levels resultedin lung burdens that were ever-increasing and not at all concordant with the simulated results,whereas the burdens at the low-exposure level were closely approximated by the simulation. Thus, at the two highest exposure levels, deposition processes were outpacing clearancemechanisms. Results from the low-exposure level indicate that clearance processes were notinhibited, the lung burden remaining the same throughout all time periods examined.
Morrow (1988) has proposed that the condition of particle overloading in the lungs iscaused by a loss in the mobility of particle-engorged AMs and that such an impediment is relatedto the cumulative volumetric load of particles in the AMs. Morrow (1988) has further estimatedthat the clearance function of an AM may be completely impaired when the particle burden in theAM is of a volumetric size equivalent to about 60% of the normal volume of the AM. Morrow’s
3-28
hypothesis was the initial basis for the physiology-oriented multicompartmental kinetic (POCK)model derived by Stöber et al. (1989) for estimating alveolar clearance and retention of relatively insoluble, respirable particles in rats.
A revised version of this model refines the characterization of the macrophage pool byincluding both the mobile and immobilized macrophages (Stöber et al., 1994). Application ofthe revised version of the model to experimental data suggested that lung overload does not causea dramatic increase in the total burden of the macrophage pool but results in a great increase inthe particle burden of the interstitial space, a compartment that is not available for macrophage-mediated clearance. The revised version of the POCK model is discussed in greater detail in thecontext of other dosimetry models below.
Oberdörster and co-workers (1992) assessed the alveolar clearance of smaller (3.3 :mdiam.) and larger (10.3 :m diam.) polystyrene particles, the latter of which are volumetricallyequivalent to about 60% of the average normal volume of a rat AM, after intratracheal instillationinto the lungs of rats. Even though both sizes of particles were found to be phagocytized by AMswithin a day after deposition, and the smaller particles were cleared at a normal rate, onlyminimal lung clearance of the larger particles was observed over an approximately 200-daypostinstillation period, thus supporting the volumetric AM overload hypothesis.
It has been hypothesized that when the retained lung burden approaches 1 mg particles/glung tissue, overloading will begin in the rat (Morrow, 1988); at 10 mg particles/g lung tissuemacrophage-mediated clearance of particles would effectively cease. Overloading appears to bea nonspecific effect noted in experimental studies, generally in rats, using many different kinds ofpoorly soluble particles (including TiO2, volcanic ash, DPM, carbon black, and fly ash) andresults in A region clearance slowing or stasis, with an associated inflammation and aggregationof macrophages in the lungs and increased translocation of particles into the interstitium (Muhleet al., 1990a,b; Lehnert, 1990; Morrow, 1994). Following overloading, the subsequentretardation of lung clearance, accumulation of particles, chronic inflammation, and theinteraction of inflammatory mediators with cell proliferative processes and DNA may lead to thedevelopment of fibrosis, epithelial cell mutations, and fibrosis in rats (Mauderly, 1996). Thephenomenon of overload has been discussed in greater detail in the previous PM CD (U.S. EPA,1996).
3.4.2. Relevance to HumansThe relevance of “lung overload” to humans, and even to species other than laboratory
species (rats and mice and hamsters; Muhle et al., 1990a,b), is not clear. Although likely to be oflittle relevance for most “real world” ambient exposures of humans, this phenomenon is ofconcern in interpreting some long-term experimental exposure data and perhaps for human
3-29
occupational exposure. In addition, relevance to humans is clouded by the fact thatmacrophage-mediated clearance is slower and perhaps less important in humans than in rats(Morrow, 1994).
Particle overload appears to be an important factor in the pulmonary carcinogenicityobserved in rats exposed to DPM. A study by Griffis et al. (1983) demonstrated that exposure (7h/day, 5 days/week) of rats to diluted whole DE containing DPM at concentrations of 0.15, 0.94,or 4.1 mg/m3 for 18 mo resulted in lung burdens of 0.035, 0.220, and 1.89 mg/g of lung tissue,respectively. The alveolar clearance of those rats with the highest lung burden (1.89 mg/g oflung) was impaired, as determined by a significantly greater (p<0.0001) retention t1/2 for DPM. Impaired clearance was reflected in the greater lung burden/exposure concentration ratio at thehighest exposure level. Similarly, in the study by Chan et al. (1984), rats exposed for 20 h/day, 7days/week to diluted whole DE containing DPM (6 mg/m3) for 112 days had an extraordinarilyhigh lung particle burden of 11.8 mg, with no alveolar particle clearance being detected over 1year.
Muhle et al. (1990a,b) indicated that overloading of rat lungs occurred when lung particleburdens reached 0.5 to 1.5 mg/g of lung tissue and that clearance mechanisms were totallycompromised at lung particle burdens $10 mg/g for particles with a specific density close to 1,observations that are concordant with those of Morrow (1988).
Pritchard (1989), utilizing data from a number of DE exposure studies, examined alveolarclearance in rats as a function of cumulative exposure. The resulting analysis noted a significantincrease in retention t1/2 values at exposures above 10 mg/m3@h/day and also showed that normallung clearance mechanisms appeared to be compromised as the lung DPM burden approached0.5 mg/g of lung.
Animal studies have revealed that impairment of alveolar clearance can occur followingchronic exposure to DPM (Griffis et al., 1983; Wolff et al., 1987; Vostal et al., 1982; Lee et al.,1983) or a variety of other diverse poorly soluble particles of low toxicity (Lee et al., 1986, 1988;Ferin and Feldstein, 1978; Muhle et al., 1990). Because high lung burdens of relativelyinsoluble, biochemically inert particles result in diminution of normal lung clearance kinetics orin what is now called particle overloading, this effect appears to be more related to the massand/or volume of particles in the lung than to the nature of the particles per se. Particle overloadrelates only to poorly soluble particles of low toxicity. It must be noted, however, that sometypes of particles may be cytotoxic and impair clearance at lower lung burdens (e.g., crystallinesilica may impair clearance at much lower lung burdens than DPM). Regardless, as pointed outby Morrow (1988), particle overloading in the lung modifies the dosimetry for particles in thelung and thereby can alter toxicologic responses.

3-30
Although quantitative data are limited regarding lung overload associated with impairedalveolar clearance in humans, impairment of clearance mechanisms appears to occur, and at a lung burden generally in the range reported to impair clearance in rats, i.e., approximately 1 mg/glung tissue. Stöber et al. (1967), in their study of coal miners, reported lung particle burdens of 2to 50 mg/g lung tissue, for which estimated clearance t1/2 values were very long (4.9 years). Freedman and Robinson (1988) also reported slower alveolar clearance rates in coal miners,some of whom had a mild degree of pneumoconiosis. It must be noted, however, as has beenreported even in some studies with rats exposed lifetime to overload conditions (50 mg/m3 TiO2;Lee et al., 1986) that no lung cancer was reported among those miners with apparent particleoverload.
Consideration of the above information further clarifies the human relevance ofnoncancer effects that may be elicited from overload-type conditions in rats studies. Underconditions that would be most likely to elicit overload conditions in humans, such as theexcessive dust burdens in the lungs of miners, cancer is not observed although noncancerresponses such as fibrosis and macrophage responses are documented (Freedman and Robinson,1988; Haschek and Witschi, 1991; Oberdörster, 1994). In deliberation on the matter of whetherthe rat lung nonneoplastic responses to poorly soluble particles (such as DPM) are predictive of asimilar hazard in humans, an expert panel (ILSI, 2000) opined that such responses would indeedbe a useful predictor for similar responses in humans.
3.4.3. Potential Mechanisms for an AM Sequestration Compartment for Particles DuringParticle OverloadSeveral factors may be involved in the particle-load-dependent retardations in the rate of
particle removal from the lung and the corresponding functional appearance of an abnormallyslow clearing or particle sequestration compartment. As previously mentioned, one potential sitefor particle sequestration is the containment of particles in the Type I cells. Information on theretention kinetics for particles in the Type I cells is not currently available. Also, nomorphometric analyses have been performed to date to estimate what fraction of a retained lungburden may be contained in the Type I cell population of the lung during lung overloading.
Another anatomical region in the lung that may be a slow clearing site is the interstitialcompartment (Kuempel, 2000). Little is known about the kinetics of removal of free particles orparticle-containing macrophages from the interstitial spaces, or what fraction of a retained burdenof particles is contained in the lung’s interstitium during particle overload. The gradualaccumulation of particles in the regional lymph nodes and the appearance of particles and cellswith associated particles in lymphatic channels and in the peribronchial and perivascular
3-31
lymphoid tissue (Lee et al., 1985; White and Garg, 1981) suggest that the mobilization ofparticles from interstitial sites via local lymphatics is a continual process.
Indeed, it is clear from histologic observations of the lungs of rodents chronically exposedto DPM that Type I cells, the interstitium, the lymphatic channels, and pulmonary lymphoidtissues could collectively comprise subcompartments of a more generalized slow clearingcompartment.
Although these sites must be considered potential contributors to the increased retentionof particles during particle overload, a disturbance in particle-associated AM-mediated clearanceis undoubtedly the predominant cause, inasmuch as, at least in rodents, the AMs are the primaryreservoirs of deposited particles. The factors responsible for a failure of AMs to translocate fromthe alveolar space compartment in lungs with high particulate matter burdens remain uncertain,although a hypothesis concerning the process involving volumetric AM burden has been offered(Morrow, 1988).
Other processes also may be involved in preventing particle-laden AMs from leaving thealveolar compartment under conditions of particle overload in the lung. Clusters or aggregates of particle-laden AMs in the alveoli are typically found in the lungs of laboratory animals that havereceived large lung burdens of a variety of types of particles (Lee et al., 1985), including DPM(White and Garg, 1981; McClellan et al., 1982). The aggregation of AMs may explain, in part,the reduced clearance of particle-laden AM during particle overload. The definitivemechanism(s) responsible for this clustering of AMs has not been elucidated to date. Whateverthe underlying mechanism(s) for the AM aggregation response, it is noteworthy that AMslavaged from the lungs of DE-exposed animals continue to demonstrate a propensity to aggregate(Strom, 1984). This observation could result either from the surface characteristics of AMsbeing fundamentally altered or from macrophage activation by phagocytized particles that thenrelease chemotactic factors (Bellmann et al., 1990) in a manner that promotes their adherence toone another in the alveolar region. AM aggregation may not simply be directly caused by theirabundant accumulation as a result of immobilization by large particle loads. Furthermore, eventhough overloaded macrophages may redistribute particle burden to other AMs, clearance mayremain inhibited (Lehnert, 1988). This may, in part, be because attractants from the overloadedAMs cause aggregation of those that are not carrying a particle burden.
3.5. BIOAVAILABILITY OF ORGANIC CONSTITUENTS PRESENT ON DIESELEXHAUST PARTICLES
Because it has been shown that DPM extract is not only mutagenic but also containsknown carcinogens, the organic fraction was originally considered to be the primary source ofcarcinogenicity in animal studies. Since then, evidence has been presented that carbon black,
3-32
lacking an organic component, is capable of inducing lung cancer at exposure concentrationssufficient to induce lung particle overload. This suggested that the relatively insoluble carboncore of the particle may be of greater importance for the pathogenic and carcinogenic processesobserved in the rat inhalation studies conducted at high exposure concentrations. (See Chapter 7for a discussion of this issue.) However, lung cancer reported in epidemiologic studies wasassociated with diesel exposure levels far below those inducing particle overload in lifetimestudies in rats. It is therefore suggested that compounds in the organic fraction of DPM mayhave some role in the etiology of human lung cancers. This leads to an interest in characterizingthe bioavailability of organics.
The bioavailability of toxic organic compounds adsorbed to DPM can be influenced by avariety of factors. Although the agent may be active while present on the particle, most particlesare taken up by AMs, a cell type not generally considered to be a target site. In order to reach thetarget site, elution from the particle surface is necessary followed by diffusion and uptake by thetarget cell. Metabolism to an active form by either the phagocytes or the target cells is alsorequired for activity of many of the compounds present.
This section describes only the various manner and mechanisms by which organicsadsorbed onto DPM may become bioavailable. In vivo and in vitro results involving variousbiological extraction media as well as modeled scenarios of bioavailability are presented. Actualestimates of the amount of organics from DPM to which respiratory tract tissues may be exposedare discussed and presented in Section 3.6.2.7.
3.5.1. In Vivo Studies3.5.1.1. Laboratory Investigations
Several studies reported on the retention of particle-adsorbed organics followingadministration to various rodent species. In studies reported by Sun et al. (1982, 1984) and Bondet al. (1986), labeled organics were deposited on DPM following heating to vaporize away theorganics originally present. Sun et al. (1982) compared the disposition of either pure or dieselparticle-adsorbed benzo[a]pyrene (B[a]P) following nose-only inhalation by F344 rats. About50% of particle-adsorbed B[a]P was cleared with a half-time of 1 h, predominantly bymucociliary clearance. The long-term retention of particle-adsorbed 3H-B[a]P at 18 days wasapproximately 230-fold greater than that for pure 3H-B[a]P (Sun et al., 1982). At the end ofexposure, about 15% of the 3H label was found in blood, liver, and kidney. Similar results werereported in a companion study by Bond et al. (1986), and by Sun et al. (1984) with another PAH,1-nitropyrene, except the retention half-time was 36 days.
Ball and King (1985) studied the disposition and metabolism of intratracheally instilled14C-labeled 1-NP (>99.9% purity) coated onto DPM. About 50% of the 14C was excreted within
3-33
the first 24 h; 20% to 30% of this appeared in the urine, and 40% to 60% was excreted in thefeces. Traces of radiolabel were detected in the trachea and esophagus. Five percent to 12% ofthe radiolabel in the lung co-purified with the protein fraction, indicating some protein binding.The corresponding DNA fraction contained no 14C above background levels.
Bevan and Ruggio (1991) assessed the bioavailability of B[a]P adsorbed to DPM from a5.7-L Oldsmobile diesel engine. In this study, exhaust particles containing 1.03 :g B[a]P/gparticles were supplemented with exogenous 3H-B[a]P to provide 2.62 :g B[a]P/g of exhaustparticles. In vitro analysis indicated that the supplemented B[a]P eluted from the particles at thesame rate as the original B[a]P. Twenty-four hours after intratracheal instillation in Sprague-Dawley rats, 68.5% of the radiolabel remained in the lungs. This is approximately a 3.5-foldgreater proportion than that reported by Sun et al. (1984), possibly because smaller amounts ofB[a]P adsorbed on the particles resulted in stronger binding or possibly because of differencesbetween inhalation exposure and intratracheal exposure. At 3 days following administration,more than 50% of the radioactivity remained in the lungs, nearly 30% had been excreted into thefeces, and the remainder was distributed throughout the body. Experiments using rats withcannulated bile ducts showed that approximately 10% of the administered radioactivity appearedin the bile over a 10-h period and that less than 5% of the radioactivity entered the feces viamucociliary transport. Results of these studies showed that when organics are adsorbed to DPMthe retention of organics in the lungs is increased considerably. Because retention time is veryshort following exposure to pure compounds not bound to particles, it can be concluded that theincreased retention time is primarily the result of continued binding to DPM. The detection oflabeled compounds in blood, systemic organs, urine, and bile as well as the trachea, however,provides evidence that at least some of the organics are eluted from the particles followingdeposition in the lungs and would not be available as a carcinogenic dose to the lung. Asdiscussed above, the results of Gerde (1999a,b) indicate that most of the organics eluted fromparticles deposited in the alveolar region, especially PAHs, are predicted to rapidly enter thebloodstream and thus not to contribute to potential induction of lung cancer.
3.5.1.2. Studies in Occupationally Exposed HumansDNA adducts in the lungs of experimental animals exposed to DE have been measured in
a number of animal experiments (World Health Organization, 1996). Such studies, however,provide limited information regarding bioavailability of organics, as positive results may wellhave been related to factors associated with lung particle overload, a circumstance reported byBond et al. (1990), who found carbon black, a substance virtually devoid of organics, to induceDNA adducts in rats at lung overload doses. These authors showed that levels of DNA adductspresent in pulmonary type II cells from the lungs of rats (n=15) exposed to equivalent conditions

3-34
of either carbon black or DE (each at 6.2 mg/m3) were nearly the same and 4- to 5-fold more thanair-exposed controls. This similarity was noted despite a difference of nearly three orders ofmagnitude in solvent-extractable organic content between DE (30%) and carbon black (0.04%). None of the DE or carbon black adducts comigrated with B[a]P diol epoxide.
On the other hand, DNA adduct formation and/or mutations in blood cells followingexposure to DPM, especially at levels insufficient to induce lung overload, can be presumed to bethe result of organics diffusing into the blood. Hemminki et al. (1994) reported increased levelsof DNA adducts in lymphocytes of bus maintenance and truck terminal workers. Österholmet al. (1995) studied mutations at the hprt-locus of T-lymphocytes in bus maintenance workers. Although they were unable to identify clear-cut exposure-related differences in types ofmutations, adduct formation was significantly increased in the exposed workers. Nielsen et al.(1996) reported significantly increased levels of lymphocyte DNA adducts, hydroxyvalineadducts in hemoglobin, and 1-hydroxypyrene in urine of garage workers exposed to DE.
3.5.2. In Vitro Studies3.5.2.1. Extraction of Diesel Particle-Associated Organics by Biological Fluids
In vitro extraction of mutagenic organics by biological fluids can be estimated bymeasurement of mutagenic activity in the particular fluid. Using this approach, Brooks et al.(1981) reported extraction efficiencies of only 3% to 10% that of dichloromethane followingDPM incubation in lavage fluid, serum, saline, albumin, or dipalmitoyl lecithin. Moreover,extraction efficiency did not increase with incubation time up to 120 h. Similar findings werereported by King et al. (1981), who also reported that lung lavage fluid and lung cytosol fluidextracts of DPM were not mutagenic. Serum extracts of DPM did exhibit some mutagenicactivity, but considerably less than that of organic solvent extracts. Furthermore, the mutagenicactivity of the solvent extract was significantly reduced when combined with serum or lungcytosol fluid, suggesting protein binding or biotransformation of the mutagenic components. Siak et al. (1980) assessed the mutagenicity of material extracted from DPM by bovine serumalbumin in solution, simulated lung surfactant, fetal calf serum (FCS), and physiological saline. Only FCS was found to extract some mutagenic activity from the DPM. Keane et al. (1991),however, reported positive effects for mutagenicity in salmonella and sister chromatid exchangein V79 cells exclusively in the supernatant fraction of DPM dispersed in aqueous mixtures ofdipalmitoyl phosphatidyl choline, a major component of pulmonary surfactant, indicating thatpulmonary surfactant components can extract active components of DPM and result inbioavailability.
The ability of biological fluids to extract organics in vitro and their effectiveness in vivoremains equivocal because of the character of the particular fluid. For example, extracellular

3-35
lung fluid is a complex mixture of constituents that undoubtedly have a broad range ofhydrophobicity (George and Hook, 1984; Wright and Clements, 1987), which is fundamentallydifferent from serum in terms of chemical composition (Gurley et al., 1988). Moreover,assessments of the ability of lavage fluids, which actually represent substantially dilutedextracellular lung fluid, to extract mutagenic activity from DPM clearly do not reflect the in vivocondition. Finally, except under very high exposure concentrations, few particles escapephagocytosis and possible intracellular extraction. In this respect, Hiura et al. (1999) haveshown that whole exhaust containing DPM, but not carbon black or diesel particles devoid oforganics, induces apoptosis, apparently through generation of oxygen radicals. This studyimplicates organic compounds present on DPM. It also indicates the bioavailability of organicsfor generation of radicals from reaction with particle-associated organics or following elutionfrom DPM.
3.5.2.2. Extraction of DPM-Associated Organics by Lung Cells and Cellular ComponentsA more likely means by which organics may be extracted from DPM and metabolized in
the lung is either through particle dissolution or extraction of organics from the particle surfacewithin the phagolysosomes of AMs and other lung cells. This mechanism presupposes that theparticles are internalized. Specific details about the physicochemical conditions of theintraphagolysosomal environment, where particle dissolution in AMs presumably occurs in vivo,have not been well characterized. It is known that phagolysosomes constitute an acidic (pH 4 to5) compartment in macrophages (Nilsen et al., 1988; Ohkuma and Poole, 1978). The relativelylow pH in the phagolysosomes has been associated with the dissolution of some types ofinorganic particles (some metals) by macrophages (Marafante et al., 1987; Lundborg et al.,1984), but few studies provide quantitative information concerning how organics from DPM maybe extracted in the phagolysosomes (Bond et al., 1983). Whatever the mechanism, assumingelution occurs, the end result is a prolonged exposure of the respiratory epithelium to DPMorganics, which include low concentrations of carcinogenic agents such as PAH.
Early studies by King et al. (1981) found that when pulmonary alveolar macrophageswere incubated with DPM, amounts of organic compounds and mutagenic activity decreasedmeasurably from the amount originally associated with the particles, suggesting that organicswere removed from the phagocytized particles. Leung et al. (1988) studied the ability of rat lungand liver microsomes to facilitate transfer and metabolism of B[a]P from diesel particles. 14C-B[a]P coated diesel particles, previously extracted to remove the original organics, wereincubated directly with liver or lung microsomes. About 3% of the particle-adsorbed B[a]P wastransferred to the lung microsomes within 2 h. Of this amount about 1.5% was metabolized, fora total of about 0.05% of the B[a]P originally adsorbed to the DPM. Although transformation is

3-36
slow, the long retention of particles, including DPM, in humans may cause the fraction elutedand metabolized to be considerably higher than this figure.
In analyzing phagolysosomal dissolution of various ions from particles in the lungs ofSyrian golden hamsters, however, Godleski et al. (1988) demonstrated that solubilization did notnecessarily result in clearance of the ions (and therefore general bioavailability) in that binding ofthe solubilized components to cellular and extracellular structures occurred. It is reasonable toassume that phagocytized DPM particles may be subject to similar processes and that theseprocesses would be important in determining the rate of bioavailability of the particle-boundconstituents of DPM.
Alveolar macrophages or macrophage cell lines that were exposed to high concentrationsof DPM in vitro were observed to undergo apoptosis, which was attributed to the generation ofreactive oxygen radicals (ROR) (Hiura et al. 1999). Further experimentation showed that DPMwith the organic constituents extracted was no longer able to induce apoptosis or generate ROR. The organic extracts alone, however, were able to induce apoptosis as well as the formation ofstress-activated protein kinases that play definitive roles in cellular apoptotic pathways. Theinjurious effects of nonextracted DPM or of DPM extracts were observed to be reversible by theantioxidant radical scavenger N-acetyl cysteine. These data suggest strongly that, at least at highconcentrations of DPM, the organic constituents contained on DPM play a central role in cellulartoxicity and that this toxicity may be attributable to the generation of ROR.
3.5.3. Modeling Studies Gerde et al. (1991a,b) described a model simulating the effect of particle aggregation and
PAH content on the rate of PAH release in the lung. According to this model, particleaggregation will occur with high exposure concentrations, resulting in a slow release of PAHsand prolonged exposure to surrounding tissues. However, large aggregates of particles areunlikely to form at doses typical of human exposures. Inhaled particles, at low concentrations,are more likely to deposit and react with surrounding lung medium without interference fromother particles. The model predicts that under low-dose exposure conditions, more typical in humans, particle-associated organics will be released more rapidly from the particles becausethey are not aggregated. Output from this model suggests strongly that sustained exposure oftarget tissues to PAHs will result from repeated exposures, not from increased retention due toassociation of PAHs with carrier particles. This distinction is important because at low dosesPAH exposure and lung tumor formation would be predicted to occur at sites of deposition ratherthan retention, as occurs with high doses.
The site of release of PAHs influences effective dose to the lungs because, as notedpreviously, at least some free organic compounds deposited in the lungs are rapidly absorbed into
3-37
the bloodstream. Gerde et al. (1991b) predicted PAHs would be retained in the alveoli less than1 min, whereas they may be retained in the conducting airways for hours. These predictions werebased on an average diffusion distance to capillaries of only about 0.5 :m in the alveoli, ascompared to possibly greater than 50 :m in the conducting airways such as the bronchi. Anexperimental study by Gerde et al. (1999) provided support for this prediction. Beagle dogs wereexposed to 3H-B[a]P adsorbed on the carbonaceous core of DPM at a concentration of 15 :gB[a]P/gm particles. A rapidly eluting fraction from DPM deposited in the alveoli was adsorbedinto the bloodstream and metabolized in the liver, whereas the rapidly eluting fraction from DPMdeposited in the conducting airways was to a large extent retained and metabolized in situ in theairway epithelium. Thus, organics eluting from DPM depositing in the conducting airways (i.e.,the TB region) would have a basis for a longer residence time in the tissues (and for consequentbiological activity) than would organics eluting from DPM depositing in the pulmonaryparenchyma. And, given the same overall deposited dose of DPM to the total pulmonary system,a deposited dose with a higher proportion in the TB region would incur a higher probability oftissue interactions with any eluted organics. This may be the case when comparing regionaldoses of DPM to humans as compared to rats for two reasons. First, one deposition model(Freijer et al., 1999) projects that for air concentrations of DPM at either 0.1 or 1.0 mg/m3, ahigher proportion of the total DPM dose to the pulmonary system would be deposited in the TBarea for humans at 31% (TB/Total; 0.098 / 0.318) than for rats at only 16% (0.04 / 0.205). Second, comparative morphometry data of DPM from chronically exposed rats and primatesshowed higher levels of DPM adjacent to conducting airways in primates (i.e., the interstitium ofthe respiratory bronchioles) than were present in parallel regions in the rat (interstitium of thealveolar ducts) (Nikula et al., 1997a,b). The focal nature of this deposition could give rise tolocalized high concentrations of any organics eluted.
3.5.4. Summary and BioavailabilityAt present, the available data are insufficient to accurately model the effective dose of
organics in the respiratory tract of humans or animals exposed to DPM. As mentioned above,though, the following Section (3.6.2.7) does present estimates of the actual amount of organics,including carcinogenic PAH such as B[a]P, that are deposited in the lung and could becomebioavailable. Overall, the results of studies presented in Section 3.6 provide evidence that at least someof the organic matter adsorbed to DPM deposited in the respiratory tract is eluted. Thepercentage taken up and metabolized to an active form by target cells is, however, uncertain. Organics eluted from particles deposited in alveoli are likely to rapidly enter the bloodstream viatranslocation across endothelial cells, where they may undergo metabolism by enzymes such as

3-38
cytochromes P-450 that are capable of producing reactive species. Organics eluted from particlesdeposited in the conducting airways (the bronchioles, bronchi, and trachea) may also undergometabolism in other cell types such as the Clara cells with constituent or inducible cytochrome P-450 species. Risk of harmful effects for particles deposited in the conducting airways ispredicted to be greater because solubilized organic compounds will be retained in the thickertissue longer, allowing for metabolism by epithelial cells lining the airways. Furthermore, sincesome deposition in conducting airways occurs primarily at bifurcations, localized higherconcentrations may occur.
3.6. MODELING THE DEPOSITION AND CLEARANCE OF PARTICLES IN THERESPIRATORY TRACT
3.6.1. IntroductionThe biological effects of inhaled particles are a function of their disposition, i.e., their
deposition and clearance. This, in turn, depends on their patterns of deposition (i.e., the siteswithin which particles initially come into contact with airway epithelial surfaces and the amountremoved from the inhaled air at these sites) and clearance (i.e., the rates and routes by whichdeposited materials are removed from the respiratory tract). Removal of deposited materialsinvolves the competing processes of macrophage-mediated clearance and dissolution-absorption. Over the years, mathematical models for predicting deposition, clearance and, ultimately,retention of particles in the respiratory tract have been developed. Such models help interpretexperimental data and can be used to make predictions of deposition for cases where data are notavailable. A review of various mathematical particle deposition models was given by Morrowand Yu (1993) and in U.S. EPA (1996).
Currently available data for long-term inhalation exposures to poorly soluble particles(e.g., TiO2, carbon black, and DPM) show that pulmonary retention and clearance of theseparticles are not adequately described by simple first-order kinetics and a single compartmentrepresenting the alveolar macrophage particle burden. Several investigators have developedmodels for deposition, transport, and clearance of poorly soluble particulate matter in the lungs. All of these models identify various compartments and associated transport rates, but empiricallyderived data are not available to substantiate many of the assumptions made in these models.
3.6.2. Dosimetry Models for DPM3.6.2.1. Introduction
The extrapolation of toxicological results from laboratory animals to humans, the goal ofthis chapter, requires the use of dosimetry models for both species that include, first, thedeposition of DPM in various regions of the respiratory tract, and second, the transport and
3-39
clearance of the particles, including adsorbed constituents, from their deposited sites. Thereforethe ideal model structure would incorporate both deposition and clearance in animals andhumans.
Deposition of particles in the respiratory tract, as described above, can be by impaction,sedimentation, interception, and diffusion, with the contribution from each mechanism afunction of particle size, lung structure, and size and breathing parameters. Because of the sizeof diesel particles, under normal breathing conditions most of this deposition takes place bydiffusion, and the fraction of the inhaled mass that is deposited in the thoracic region (i.e., TBplus A regions) is substantially similar for rats and humans.
Among deposition models that include aspects of lung structure and breathing dynamics,the most widely used have been typical-path or single-path models (Yu, 1978; Yu and Diu,1983). The single-path models are based on an idealized symmetric geometry of the lung,assuming regular dichotomous branching of the airways and alveolar ducts (Weibel, 1963). Theylead to modeling the deposition in an average regional sense for a given lung depth. Althoughthe lower airways of the lung may be reasonably characterized by such a symmetricrepresentation, there are major asymmetries in the upper airways of the tracheobronchial tree thatin turn lead to different apportionment of airflow and particulate burden to the different lunglobes. The rat lung structure is highly asymmetric because of its monopodial nature, leading tosignificant errors in a single-path description. This is rectified in the multiple-path model of thelung, which incorporates asymmetry and heterogeneity in lung branching structure and calculatesdeposition at the individual airway level. This model has been developed for the rat lung(Anjilvel and Asgharian, 1995; Freijer et al., 1999) and, in a limited fashion because ofinsufficient morphometric data, for the human lung (Subramaniam et al., 1998; Yeh and Schum,1980). Such models are particularly relevant for fine and ultrafine particles such as occur inDPM. However, models for clearance have not yet been implemented in conjunction with theuse of the multiple-path model.
Clearance of particles in the respiratory tract takes place (1) by mechanical processes:mucociliary transport in the ciliated conducting airways and macrophage phagocytosis andmigration in the nonciliated airways, and (2) by dissolution. The removal of material such as thecarbonaceous core of DPM is largely by mechanical clearance, whereas the clearance of theorganics adsorbed onto the carbon core is principally by dissolution.
Several models currently exist that integrate both deposition and clearance, some specificfor humans and others specific for laboratory animals. They differ significantly in the level ofphysiological detail that is captured in the model and in the uncertainties associated with thevalues of the parameters used. All of these models identify various compartments and associatedtransport rates, but empirically derived data are not available to validate many of the assumptions
3-40
made in the models. A review of the principal human and animal deposition/clearance models,including candidate models for use in animal-to-human extrapolation in this assessment, areconsidered below.
3.6.2.2. Human Models The International Commission on Radiological Protection (ICRP) recommends specific
mathematical dosimetry models as a means to calculate the mass deposition and retention bydifferent parts of the human respiratory tract and, if needed, tissues beyond the respiratory tract. The latest ICRP-recommended model, ICRP66 (1994), considers the human respiratory tract asfour general anatomical regions: the ET region, which is divided into two subregions; the TBregion, which is also subdivided into two regions; and the gas-exchange tissues, which arefurther defined as the alveolar-interstitial (AI) region but are exactly comparable to thepulmonary or A region. The fourth region is the lymph nodes. The deposition component of themodel for the ET, TB, and A regions is semi-empirical based on equations derived from fittingexperimental deposition data. The dimensional model used for the TB and A regions wasadopted from several sources (Weibel, 1963; Yeh and Schum, 1980; and Phalen et al., 1985); thephysical aspects of the individual airway generations for these regions were all averaged aftereach source was adjusted to a standard functional residual capacity. The equations for estimatingdeposition in these areas was empirical, obtained from fitting data obtained from partial humanlung casts or from theoretical calculation for these regions. Deposition in the four regions isgiven as a function of particle size with two different types of particle size parameters: activitymedian thermodynamic diameter (AMTD) for deposition of particles ranging in size from 0.0005to 1.0 :m and the activity median aerodynamic diameter (AMAD) for deposition of particlesfrom 0.1 to 100:m. Reference values of regional deposition are provided and guidance is givenfor extrapolating to specific individuals and populations under different levels of activity. Thismodel also includes consideration of particle inhalability, a measure of the degree to whichparticles can enter the respiratory tract and be available for deposition. After deposition occurs ina given region, two different intrinsic clearance processes act competitively on the depositedparticles: particle transport, including mucociliary clearance from the respiratory tract andphysical clearance of particles to the regional lymph nodes; and absorption, including movementof material to blood and both dissolution-absorption and transport of ultrafine particles. Rates ofparticle clearance derived from studies with human subjects are assumed to be the same for alltypes of particles. The ICRP model provides average concentration or average number values ona regional basis, i.e., mass or number deposited or retained in the ET, TB, or A regions. Additionally, while the ICRP66 model was developed primarily for use with airborne radioactive
3-41
particles and gases in humans, its use for describing the dosimetry of inhaled mass ofnonradioactive substances in humans is also appropriate.
The National Council on Radiation Protection (NCRP) has issued a human respiratorytract dosimetry model that was developed concurrently with the ICRP model (NCRP, 1997;Phalen et al.,1991). It addresses (1) inhalability of particles, (2) new subregions of therespiratory tract, (3) dissolution-absorption as an important aspect of the model, and (4) body size(and age). The proposed NCRP model defines the respiratory tract in terms of a naso-oro-pharyngo-laryngeal (NOPL) region, a TB region, a pulmonary (P) region, and the lung-associatedlymph nodes (LN). Like the ICRP model, the deposition component of the model for the ETregion is semi-empirical, based on equations derived from fitting experimental deposition data. The dimensional model used for the TB and A regions was that of Yeh and Schum (1980). Thedata from this model were used to estimate physical processes along a typical lung path (vice multiple-path; see MPPDep model description below) on a generation-by-generation basis. Therates of dissolution-absorption of particles and their constituents are derived from clearance datafrom humans and laboratory animals. The effect of body growth on particle deposition is alsoconsidered in the model, although particle clearance rates are assumed to be independent of age. The NCRP model currently available considers deposition only within these regions of therespiratory tract. As with the ICRP model, the NCRP model can be used for evaluatinginhalation exposures to all types of particles. Comparison of regional deposition patternsestimated by the ICRP66 and the current NCRP models have been reported (Yeh et al., 1996). One principal difference between the models is the enhanced deposition of ultrafines in thetracheobronchial region predicted by the NCRP model compared with the ICRP model. Thiseffect of enhanced deposition is claimed to be due to the entrance configuration of an airwaybifurcation.
The model of Freijer et al. (1999) is a multiple-path particle deposition model (MPPDep)for the human respiratory tract that differs fundamentally from the above two models asdescribed in the Introduction. Calculations from the model may be based on either single-path ormultiple-path methods for tracking air flow and calculating aerosol deposition in the lung. Thesingle-path method calculates deposition for a typical path, whereas the multiple-path method iscapable of incorporating the asymmetry in lung structure and providing lobar-specific andairway-specific information. Two options are provided for idealizing the geometry of the humanlung; one uses a symmetric geometry for the whole lung and the second option captures theasymmetry in the lobar structure, but treats the geometry within each lung lobe in a symmetricfashion. Both models are constructed using morphometric data compiled by Yeh and Schum(1980). Within each airway, deposition is calculated using theoretically derived efficiencies fordeposition by diffusion (most relevant to DPM), sedimentation, and impaction within the airway

3-42
or airway bifurcation. Filtration of particulate aerosols by the head is determined using empiricalefficiency functions. The model calculates deposition of monodisperse and polydisperse aerosolsin the respiratory tract of both humans (and rats) for particles ranging from ultrafine (0.01microns) to coarse (20 microns) sizes. Various breathing patterns may be simulated:endotratracheal, nasal, oral, and combined nasal and oral (oronasal). The exposure scenario maybe constant or variable. For the variable scenario, the user may specify different breathingpatterns either on an hourly basis during the day or activity patterns for variable time durations.Adjustment for inhalability of the particle is also included as an option. The software in thismodel provides results for the deposition fraction and mass deposited in the various regions ofthe respiratory tract in graphical and text formats.
The combined model of Yu et al. (1991) has a human component that will be discussedbelow.
3.6.2.3. Animal ModelsStrom et al. (1988) developed a multicompartmental model for particle retention that
partitioned the alveolar region into two compartments on the basis of the physiology of clearance. The alveolar region has a separate compartment for sequestered macrophages, corresponding tophagocytic macrophages that are heavily laden with particles and clustered, and consequentlyhave significantly lowered mobility. The model has the following compartments:(1) tracheobronchial tree, (2) free particulate on the alveolar surface, (3) mobile phagocyticalveolar macrophages, (4) sequestered particle-laden alveolar macrophages, (5) regional lymphnodes, and (6) gastrointestinal tract. The model is based on mass-dependent clearance (the ratecoefficients reflect this relationship), which dictates sequestration of particles and their eventualtransfer to the lymph nodes. The transport rates between various compartments were obtained byfitting the calculated results to lung and lymph node burden experimental data for both exposureand postexposure periods. Because the number of fitted parameters was large, the model is notlikely to provide unique solutions that would simulate experimental data from various sourcesand for different exposure scenarios. For the same reason, it is not readily possible to use thismodel for extrapolating to humans.
Stöber and co-workers have worked extensively in developing models for estimatingretention and clearance of relatively insoluble respirable particles (as DPM) in the lung. Theirmost recent work (1994), a revised version of the POCK model, is a rigorous attempt toincorporate most of the physiologically known aspects of alveolar clearance and retention ofinhaled relatively insoluble particles. Their multicompartmental kinetics model has fivesubcompartments. The transfer of particles between any of the compartments within the alveolarregion is macrophage mediated. There are two compartments that receive particles cleared from

3-43
the alveolar regions: the TB tract and the lymphatic system. The macrophage pool includes bothmobile and particle-laden immobilized macrophages. The model assumes a constant maximumvolume capacity of the macrophages for particle uptake and a material-dependent criticalmacrophage load that results in total loss of macrophage mobility. Sequestration of thosemacrophages heavily loaded with a particle burden close to a volume load capacity is treated in asophisticated manner by approximating the particle load distribution in the macrophages. Themacrophage pool is compartmentalized in terms of numbers of macrophages that are subject todiscrete particle load intervals. Upon macrophage death, the phagocytized particle is releasedback to the alveolar surface; thus phagocytic particle collection competes to some extent withthis release back to the alveolar surface. This recycled particle load is also divided into particleclusters of size intervals defining a cluster size distribution on the alveolar surface. The modelyields a time-dependent frequency distribution of loaded macrophages that is sensitive to bothexposure and recovery periods in inhalation studies.
The POCK model also emphasizes the importance of interstitial burden in the particleoverload phenomenon and indicates that particle overload (Section 3.4) is a function of a massiveincrease in particle burden of the interstitial space rather than total burden of the macrophagepool. The relevance of the increased particle burden in the interstitial space lies with the fact thatthis compartmental burden is not available for macrophage-mediated clearance and, therefore,persists even after cessation of exposure.
Although the POCK model is the most sophisticated in the physiological complexity itintroduces, it suffers from a major disadvantage. Experimental retention studies provide dataonly on total alveolar and lymph node mass burdens of the particles as a function of time. Therelative fraction of the deposition between the alveolar subcompartments in the Stöber modeltherefore cannot be obtained experimentally; the model thus uses a large number of parametersthat are simultaneously fit to experimental data. Although the model predictions are tenable,experimental data are not currently available to substantiate the proposed compartmental burdensor the transfer rates associated with these compartments. Thus, overparameterization in themodel leads to the possibility that the model may not provide a unique solution that may be usedfor a variety of exposure scenarios, and for the same reason, cannot be used for extrapolation tohumans. Stöber et al. have not developed an equivalent model for humans; therefore the use oftheir model in our risk assessment for diesel is not attempted.
3.6.2.4. Combined Models (for interspecies extrapolation)Currently available data for long-term inhalation exposures to poorly soluble particles
(e.g., TiO2, carbon black, and DPM) show that pulmonary retention and clearance of theseparticles are not adequately described by simple first-order kinetics and a single compartment

3-44
representing the alveolar macrophage particle burden. A two-compartment lung model thatcould be applied to both humans and animals was developed by Smith (1985) and includesalveolar and interstitial compartments. For uptake and clearance of particles by alveolar surfacemacrophages and interstitial encapsulation of particles (i.e., quartz dust), available experimentaldata show that the rate-controlling functions followed Michaelis-Menton type kinetics, whereasother processes affecting particle transfer are assumed to be linear. The model was used in anattempt to estimate interstitial dust and fibrosis levels among a group of 171 silicon carbideworkers; the levels were then compared with evidence of fibrosis from chest radiographs. Asignificant correlation was found between estimated fibrosis and profusion of opacities on theradiographs. This model provides as many as seven different rate constants derived by variousestimations and under various conditions from both animal and human sources. The model wasintended for estimation of generalized dust described only as respirable without any other regardto sizing for establishing the various particle-related rate constants. As most of the describedfunctions could not be validated with experimental data, the applicability of this model,especially for particulates in the size range of DPM, was unclear.
Yu et al. (1991; also reported as Yu and Yoon, 1990) have developed a three-compartment lung model that consists of tracheobronchial (T), alveolar (A), and lymph node (L)compartments (Appendix A, Figure A-1) and, in addition, considered filtration by anasopharyngeal or head (H) compartment. The tracheobronchial compartment is important forshort-term considerations, whereas long-term clearance takes place via the alveolar compartment. In contrast to the Stöber and Strom approaches, the macrophage compartment in the Yu modelcontains all of the phagocytized particles; that is, there is no separate (and hypothetical)sequestered macrophage subcompartment. Absorption by the blood (B) and gastrointestinal (G)compartments was also considered. Although the treatment of alveolar clearance isphysiologically less sophisticated than that of the Stöber et al. model, the Yu model provides amore comprehensive treatment of clearance by including systemic compartments and the head,and including the clearance of the organic components of DPM in addition to the relativelyinsoluble carbon core.
In order to progress beyond the classical human ICRP66 retention model, Yu hasaddressed the impairment of long-term clearance (the overload effect) by using a set of variabletransport rates for clearance from the alveolar region as a function of the mass of DPM in thealveolar compartment. A functional relationship for this was derived mathematically (Yu et al.,1989) based upon Morrow’s hypothesis for the macrophage overload effect discussed earlier inthe section on pulmonary overload. The extent of the impairment depends on the initial particleburden, with greater particulate concentration leading to slower clearance.

3-45
Within this model, DPM is treated as being composed of three material components: arelatively insoluble carbonaceous core, slowly cleared organics (10% particle mass), and fast-cleared organics (10% particle mass). Such a partitioning of organics was based on observationsthat the retention of particle-associated organics in lungs shows a biphasic decay curve (Sun etal., 1984; Bond et al., 1986). For any compartment, each of these components has a differenttransport rate. The total alveolar clearance rate of each material component is the sum ofclearance rates of that material from the alveolar to the tracheobronchial, lymph, and bloodcompartments. In the Strom and Stöber models discussed above, the clearance kinetics of DPMwere assumed to be entirely dictated by those of the relatively insoluble carbonaceous core. Forthose organic compounds that become dissociated from the carbon core, clearance rates are likelyto be very different, and some of these compounds may be metabolized in the pulmonary tissueor be absorbed by blood.
The transport rates for the three components were derived from experimental data for ratsusing several approximations. The transport rates for the carbonaceous core and the two organiccomponents were derived by fitting to data from separate experiments. Lung and lymph nodeburdens from the experiment of Strom et al. (1988) were used to determine the transport rate ofthe carbonaceous core. The Yu model incorporates the impairment of clearance by including amass dependency in the transport rate. This mass dependency is easily extracted because theanimals in the experiment were sacrificed over varying periods following the end of exposure.
It was assumed that the transport rates from the alveolar and lymph compartments to theblood were equal and independent of the particulate mass in the alveolar region. The clearancerates of particle-associated organics for rats were derived from the retention data of Sun et al.(1984) for B[a]P and the data of Bond et al. (1986) for nitropyrene adsorbed on diesel particles.
In their model Yu et al. (1991) make two important assumptions to carry out theextrapolation in consideration of inadequate human data. First, the transport rates of organics inthe DPM do not change across species. This is based upon lung clearance data of inhaledlipophilic compounds (Schanker et al., 1986), where the clearance was seen to be dependent onthe lipid/water partition coefficient. In contrast, the transport rate of the carbonaceous core isconsidered to be significantly species dependent (Bailey et al., 1982). DPM clearance rate isdetermined by two terms in the model (see Equation A-82 in Appendix A). The first,corresponding to macrophage-mediated clearance, is a function of the lung burden and isassumed to vary significantly across species. The second term, a constant, corresponding toclearance by dissolution, is assumed to be species independent. The mass-dependent term forhumans is assumed to vary in the same proportion as in rats under the same unit surfaceparticulate dose. The extrapolation is then achieved by using the data of Bailey et al. (1982) forthe low lung burden limit of the clearance rate. This value of 0.0017/day was lower (i.e., slower)

3-46
than the rat value by a factor of 7.6. This is elaborated further in Appendix A. Other transportrates that have lung burden dependence are extrapolated in the same manner.
It should be noted that the Bailey et al. (1982) experiment in humans used fusedmonodisperse aluminosilicate particles of 1.9 and 6.1 :m aerodynamic diameters. Yu and co-workers have used the longer of the half-times observed in this experiment to obtain an alveolarhuman clearance rate (8), of 0.00169/day. In using such data for DPM 0.2 :m in diameter, theyhave assumed the clearance of relatively insoluble particles to be independent of size over therange in diameter from 6.1 down to 0.2 :m. This assumption is consistent with observations andviews currently in the literature indicating that clearance mechanisms are not particularlyparticle-size dependent (Morrow et al., 1967a,b; Snipes et al., 1983). That the linear dimensionsof an alveolar macrophage, considered to be the principal means of clearance in the A region, aresignificantly larger, roughly 10 :m (Yu et al., 1996), and could therefore accommodateengulfment of a range of particle sizes also makes this assumption reasonable. Snipes (1979),however, has reported in rats a 8 (converted here from half-time values) of 0.0022/day for 1 and2 :m particles but a higher value of 0.0039/day for 0.4 :m particles indicating that clearancerates may indeed depend on size. In the absence of reliable data for 0.2 :m particles, the slowerclearance rate pertaining to this larger particle size, i.e., 0.00169/day, is being used. Such achoice may underestimate the actual DPM clearance rate in humans. The resulting model output(i.e., lung DPM burden) from this slower rate would predict more DPM in the alveolar spacethan may actually be present at any given time. Therefore, use of this slower 8 may beconsidered to be more protective of human health. Long-term clearance rates for particle sizesmore comparable to DPM are available, e.g., iron oxide and polystyrene spheres (Waite andRamsden, 1971; Jammet et al., 1978), but these data show a large range in the values obtainedfor half-lives or are based upon a very small number of trials, and therefore compare unfavorablywith the quality of data from the Bailey experiment.
The deposition fractions of particulate matter in the pulmonary and tracheobronchialregions of the human lung remain relatively unchanged over the particle size range between0.2 and 1.0 :m, on the basis of analysis done with the ICRP model (ICRP66, 1994). As theclearance of relatively insoluble particles is also likely to remain the same over this range, thedosimetry results in this report for the carbonaceous core component of DPM could also beextended to other particles in this size range within the PM2.5. For respirable particles withdiameters larger than this range, e.g., between 1.0 and 3.5 :m, the extent of the fraction depositedin the pulmonary region is unclear. Results from the ICRP66 (1994) model predict little changein human deposition for this diameter range, whereas the earlier model of Yu and Diu (1983)predicts a significant increase as reported in ICRP66 (1994). It is therefore unclear if eithermodel would be applicable for particles in this larger-sized range without changing the value for
3-47
the deposition fractions. As will be presented and discussed below, regional deposition fractionsof DPM-sized particles from the MPPDep, the ICRP66 (1994) and draft NCRP models comparefavorably with the human alveolar deposition in humans specific for DPM, which has beenestimated with the Yu model to be 7% to 13% (Yu and Xu, 1986).
Although there was good agreement between experimental and modeled results, thisagreement follows a circular logic (as adequately pointed out by Yu and Yoon [1990]) becausethe same experimental data that figured into the derivation of transport rates were used in themodel. Nevertheless, even though this agreement is not a validation, it provides an importantconsistency check on the model. Further experimental data and policy definitions on whatconstitutes validation would be necessary for a more formal validation.
The model showed that at low lung burdens, alveolar clearance is dominated bymucociliary transport to the tracheobronchial region, and at high lung burdens, clearance isdominated by transport to the lymphatic system. The head and tracheobronchial compartmentsshowed quick clearance of DPM by mucociliary transport and dissolution. Lung burdens of boththe carbonaceous core and organics were found to be greater in humans than in rats for similarperiods of exposure.
The Yu and Yoon (1990) version of the model provides a parametric study of thedosimetry model, examining variation over a range of exposure concentrations, breathingscenarios, and ventilation parameters; particle mass median aerodynamic diameters; andgeometric standard deviations of the aerosol size distribution. It examines how lung burdenvaries with age for exposure over a lifespan, provides dosimetry extrapolations to children, andexamines changes in lung burden with lung volume. The results showed that children wouldexhibit more diminished alveolar clearance of DPM at high lung burden than adults whenexposed to equal concentrations of DPM. These features make the model easy to use in riskassessment studies. The reader is referred to Appendix A for further details on the model and foranalyses of the sensitivity of the model to change in parameter values.
The Yu model presents some uncertainties in addition to those discussed earlier in thecontext of particle size dependence of clearance rate. The reports of Yu and Yoon (1990) as wellas Yu et al. (1991) underwent extensive peer review; we list below the most important among themodel uncertainties discussed by the review panel. The experimental data used by the Yu modelfor adsorbed organics used passively adsorbed radiolabeled compounds as surrogates forcombustion-derived organics. These compounds may adhere differently to the carbon core thando those formed during combustion. Yu has estimated that slowly cleared organics represent10% of the total particle mass; the actual figure could be substantially less; the reviewersestimate that the amount of tightly bound organics is probably only 0.1% to 0.25% of the particlemass.

3-48
The model was based upon the experimental data of Strom et al. (1988), whereFischer-344 rats were exposed to DPM at a concentration of 6.0 mg/m3 for 20 h/day and 7days/week for periods ranging from 3 to 84 days. Such exposures lead to particle overloadeffects in rats, whereas human exposure patterns are usually to much lower levels at whichoverload will not occur. Parameters obtained by fitting to data under the conditions of theexperimental scenario for rats may not be optimal for the human exposure and concentration ofinterest.
The extrapolation of retained dose from rats to humans assumed that the macrophage-mediated mechanical clearance of the DPM varies with the specific particulate dose to thealveolar surface in the same proportion in humans and in rats, whereas clearance rates bydissolution were assumed to be invariant across species. These assumptions have not beenvalidated.
It should also be noted that the Yu et al. (1991) model does not possess a formal interstitial compartment although the lymph nodes, which would be the repository of particlesfrom the interstitium, are represented. The work of Nikula et al. (1997a,b) and of Kuempel(2000) provide compelling information on the significance of an extensive interstitilizationprocess in primates and in humans. Kuempel (2000) developed a lung dosimetry model todescribe the kinetics of particle clearance and retention in coal miners' lungs. Models withoverloading of lung clearance, as observed in rodent studies, were found to be inadequate todescribe the end-of-life lung dust burdens in those miners. The model that provided the best fitto the human data included a sequestration process representing the transfer of particles to theinterstitium. These findings are consistent with a study showing reduced lung clearance ofparticles in retired coal miners (Freedman and Robinson, 1988) and with studies showingincreased retention of particles in the lung interstitium of humans and nonhuman primatescompared to rodents exposed to coal dust and/or DE (Nikula et al., 1997a,b). These findings arealso consistent with the established observation that humans and primates clear particles slowlyfrom the alveolar interstitium compared with rates in rodent species such as rats and mice (Hsiehand Yu, 1998). Because several aspects of the Yu model have not been validated on human dataand because it does not include a formal interstitial compartment, it is acknowledged that thismodel may therefore have some uncertainty concerning the lung burdens in humans exposed tooccupational levels of dust. However, it is also not known whether the model based on coalminer data (Kuempel, 2000) would also describe the clearance and retention processes in thelungs of humans with exposures to particles at lower environmental concentrations, or tosubmicrometer particles such as DE particulate. Further investigation of these issues is needed.

3-49
3.6.2.5. Use of the Yu et al. (1991) Model for Interspecies ExtrapolationIn addressing the objectives of this chapter, i.e., consideration of what is known and
applicable to DPM concerning particle disposition and the bioavailability of adsorbed organicson DPM, it is apparent that the database is considerable for both the processes involved inparticle dosimetry and for DPM. This information makes the goal of predicting a human internaldose from animal data through a model utilizing this database both feasible and appropriate.
In their charge to EPA through “Science and Judgment in Risk Assessment” (NRC,1995), the National Research Council opines that EPA should have principles for judging whenand how to depart from default options. The extensive data presented in this chapter theirscientific validity, and the limitations of the current default procedures provide a basis fordeparting from the default options currently identified by the Agency for extrapolating fromanimals to humans. The default option of assuming external concentrations of DPM in animalstudies as being representative of a human concentration (and an equivalent internal dose) isclearly not adequate given the differences in the basic processes of deposition and clearancebetween animals and humans documented by these data. Use of an alternate default option, theAgency’s dosimetric adjustment procedures for inhaled particles in animal-to-human scenarios(described in U.S. EPA, 1994), is also inadequate as only deposition is predicted and then onlydown to an MMAD of 0.5 :m, whereas the MMAD of DPM is typically 0.2 :m or smaller. Models have been described in this section that consider both deposition and retentionspecifically for DPM in both laboratory animals and in humans. These points providejustification for moving away from default options and utilizing the best scientific informationavailable (i.e., that integrated into deposition/clearance models) in performing the animal-to-human extrapolation.
Evaluation of the various models discussed in this chapter should be considered from theaspect of both the rat and the human. For rats it is fairly clear that the rat portion of the model ofYu et al. (1991) is the most appropriate because it is based on data, especially extensiveinformation on lung burdens, from actual DPM exposures. The model provides for bothdeposition and integrated clearance for DPM as well as for two classes of adsorbed organics. The transport rates in the Yu model are derived directly from experiments with DPM exposedrats.
For humans, however, several models are available and discussed above, none of which isbased on DPM-specific data. Deposition, but not clearance, modules are available for all models,and Table 3-3 is an attempt to compare deposition projections of the various models to the extentpossible for particles in the range of characteristics of size, distribution, and density of DPM. Intake parameters such as breathing rates and minute volumes were also matched among thevarious models. As alluded to above and shown in Table 3-3, DPM deposition is predicted to
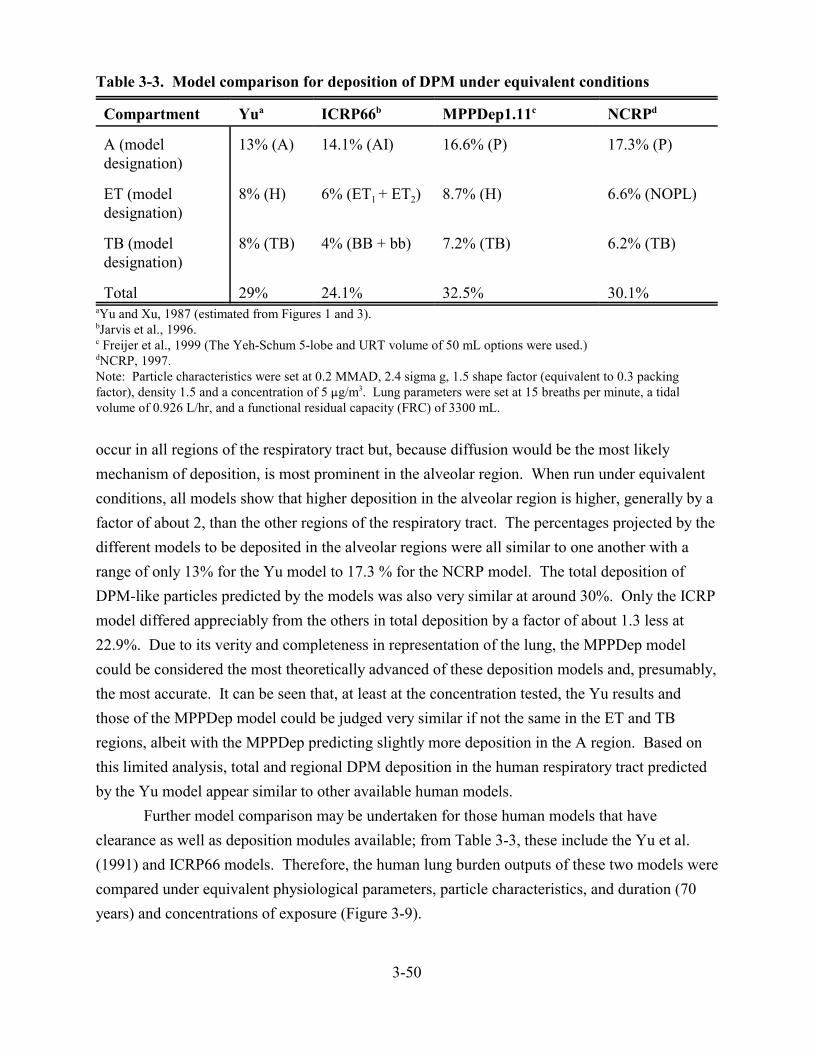
3-50
Table 3-3. Model comparison for deposition of DPM under equivalent conditions
Compartment Yua ICRP66b MPPDep1.11c NCRPd
A (modeldesignation)
13% (A) 14.1% (AI) 16.6% (P) 17.3% (P)
ET (modeldesignation)
8% (H) 6% (ET1 + ET2) 8.7% (H) 6.6% (NOPL)
TB (modeldesignation)
8% (TB) 4% (BB + bb) 7.2% (TB) 6.2% (TB)
Total 29% 24.1% 32.5% 30.1%aYu and Xu, 1987 (estimated from Figures 1 and 3).bJarvis et al., 1996.c Freijer et al., 1999 (The Yeh-Schum 5-lobe and URT volume of 50 mL options were used.)dNCRP, 1997.Note: Particle characteristics were set at 0.2 MMAD, 2.4 sigma g, 1.5 shape factor (equivalent to 0.3 packingfactor), density 1.5 and a concentration of 5 :g/m3. Lung parameters were set at 15 breaths per minute, a tidalvolume of 0.926 L/hr, and a functional residual capacity (FRC) of 3300 mL.
occur in all regions of the respiratory tract but, because diffusion would be the most likelymechanism of deposition, is most prominent in the alveolar region. When run under equivalentconditions, all models show that higher deposition in the alveolar region is higher, generally by a factor of about 2, than the other regions of the respiratory tract. The percentages projected by thedifferent models to be deposited in the alveolar regions were all similar to one another with arange of only 13% for the Yu model to 17.3 % for the NCRP model. The total deposition ofDPM-like particles predicted by the models was also very similar at around 30%. Only the ICRPmodel differed appreciably from the others in total deposition by a factor of about 1.3 less at 22.9%. Due to its verity and completeness in representation of the lung, the MPPDep modelcould be considered the most theoretically advanced of these deposition models and, presumably,the most accurate. It can be seen that, at least at the concentration tested, the Yu results andthose of the MPPDep model could be judged very similar if not the same in the ET and TBregions, albeit with the MPPDep predicting slightly more deposition in the A region. Based onthis limited analysis, total and regional DPM deposition in the human respiratory tract predictedby the Yu model appear similar to other available human models.
Further model comparison may be undertaken for those human models that haveclearance as well as deposition modules available; from Table 3-3, these include the Yu et al.(1991) and ICRP66 models. Therefore, the human lung burden outputs of these two models werecompared under equivalent physiological parameters, particle characteristics, and duration (70years) and concentrations of exposure (Figure 3-9).
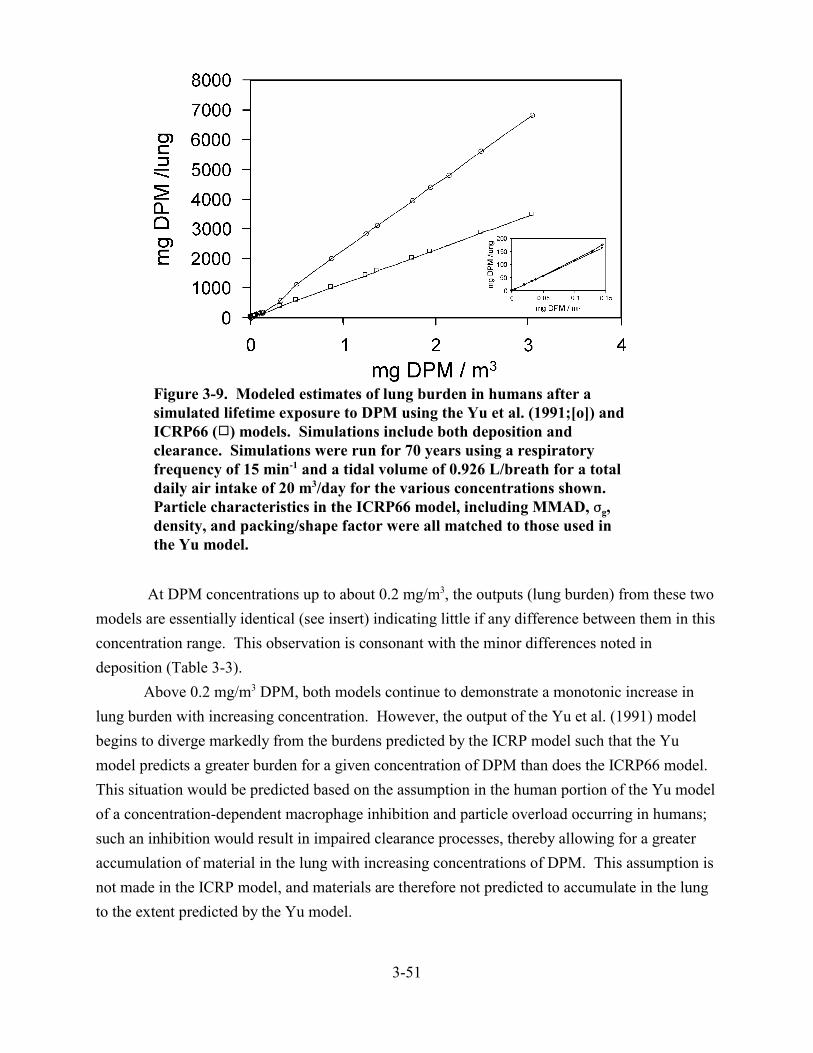
3-51
Figure 3-9. Modeled estimates of lung burden in humans after asimulated lifetime exposure to DPM using the Yu et al. (1991;[o]) andICRP66 (9) models. Simulations include both deposition andclearance. Simulations were run for 70 years using a respiratoryfrequency of 15 min-1 and a tidal volume of 0.926 L/breath for a totaldaily air intake of 20 m3/day for the various concentrations shown. Particle characteristics in the ICRP66 model, including MMAD, Fg,density, and packing/shape factor were all matched to those used inthe Yu model.
At DPM concentrations up to about 0.2 mg/m3, the outputs (lung burden) from these twomodels are essentially identical (see insert) indicating little if any difference between them in thisconcentration range. This observation is consonant with the minor differences noted indeposition (Table 3-3).
Above 0.2 mg/m3 DPM, both models continue to demonstrate a monotonic increase inlung burden with increasing concentration. However, the output of the Yu et al. (1991) modelbegins to diverge markedly from the burdens predicted by the ICRP model such that the Yumodel predicts a greater burden for a given concentration of DPM than does the ICRP66 model. This situation would be predicted based on the assumption in the human portion of the Yu modelof a concentration-dependent macrophage inhibition and particle overload occurring in humans;such an inhibition would result in impaired clearance processes, thereby allowing for a greateraccumulation of material in the lung with increasing concentrations of DPM. This assumption isnot made in the ICRP model, and materials are therefore not predicted to accumulate in the lungto the extent predicted by the Yu model.

3-52
Based on this limited analysis of models and the predictions from them for bothdeposition and clearance of DPM in humans, the model of Yu et al. (1991) can be seen toperform similarly to other available state-of-the-art models. The Yu model(s) are chosen forfurther analysis for the purposes of this document primarily because the animal portion of themodel is based on DPM-specific data and the human components of the model have bothdeposition and clearance capacities that do not appear different from other available humanrespiratory tract models.
3.6.2.6. Model VariabilityAs demonstrated in Table 3-3 and Figure 3-9, there appears to be little variability among
state-of-the-art models available for predicting disposition (both for deposition and for clearanceintegrated with deposition) of low levels of DPM (i.e., up to about 200 :g/m3) in the respiratorytracts of humans.
Intersubject variability and its relationship to model output, however, is acknowledged inthe ICRP model for deposition efficiencies (ICRP, 1994). This variability, recognized assubstantial by ICRP, is addressed through use of scaling constants derived from estimates of theupper and lower confidence bounds for regional deposition efficiencies, with the scalingconstants representing the variability in the population. It should be noted that the samephilosophy is inherent in dose-response methodologies such as the RfC, where variability in thepopulation is accommodated by a 10-fold uncertainty factor rather than by scaling constants.Inspection of data in ICRP66 (e.g., Figures D-4 through D-7 in the ICRP reference) on nasal andextrathoracic deposition in adult males shows that these upper and lower boundaries on outputdue to intersubject variability are considerably less than 10-fold different from one another. Thus, dividing model outputs by a factor of 10 such as is done in RfC derivation may well beinclusive of not only intersubject variability but also of any model-to-model variability as theyexist currently.
3.6.2.7. Model Comparison — Estimations of Deposition of Adsorbed OrganicsThe data presented in Table 3-3 may be viewed as single-breath estimates of DPM
deposition patterns in the various regions of the human lung under the breathing patterns andconditions described in the table for the different models considered in this report. From thesedata it is possible to estimate the total mass of DPM deposited in the pulmonary region under agiven set of conditions. Furthermore, if the fraction of organics present on DPM and their abilityto be desorbed or eluted from the DPM are assumed also to be the same, then these depositiondata could be used to estimate the dose of organics to pulmonary tissues. Such a comparisonwould not only yield an estimate of the amount of organics but also lend a further comparison

3-53
between the different human models. This exercise was performed for humans breathing 5 :gDPM/m3 continuously, and the results are presented in Table 3-4 below.
Table 3-4. Comparative model estimates of DPM deposition in human lungs from exposureto 5 :g/m3 continuously for one year
A B C D
Humandepositionmodel
AlveolarDepa
:g DPMdeposited/yearb
:g organicsdeposited/yearc
:g carcinogenic PAHdeposited/yeard
Yu et al. (1991) 13% 4745 598 1.82
ICRP66 14.1% 5147 649 1.98
MPPDep 16.6% 6059 763 2.33
NCRP 17.3% 6315 796 2.43
aAlveolar deposition fractions predicted for DPM (Yu et al., 1991) and for particles with DPM characteristics (fromTable 3-3). No clearance is included in this calculation.
bA total air intake of 20 m3/day is assumed. These numbers were obtained by factoring 20 m3 × 5 :g DPM/m3 ×Alveolar deposition % (column A) × 365 days/year.
cIn three samples of DPM extract, DPM-associated organics were noted as being 11.1%, 14.7%, and 12.1% wt.organics/wt. DPM (Tong and Karasek, 1984) with the average being 12.6%; column B is factored by this average togenerate column C.
dThose seven PAHs identified as being carcinogenic either to humans or to animals (U.S. EPA, 1993) were summedfrom the data of Tong and Karasek (1984), where they are reported as a concentration in extract from DPM-associated organics. In three different samples, the content of these 7 PAHs was noted as 4739, 2054, and 2360ng/mg of organic extract, with the average being 3051 ng/mg (3.051 :g/mg) organic extract. This average valuewas factored with Column C (in mg) to generate column D.
Note: Estimates from different human deposition models of the total amount of DPM-associated organics depositedin the pulmonary regions in humans breathing DPM at 5 :g/m3 continuously for 1 year.
As may be expected, the relatively minor differences (17.3 % / 13% = 1.3) in thedeposition of DPM among the different human models leads to similarly minor differences inprojections of dose of carcinogenic PAHs to the lung at a relatively low concentration of 5 :g/m3
DPM. Somewhat unexpected is the small absolute quantity of carcinogenic PAH that may bedelivered to the lung tissues under the conditions of exposure to DPM in this exercise. It shouldbe noted that exercises similar to this have been carried out by others, e.g., Valberg and Watson(1999). However, the possibility that high concentrations of DPM may result in localized areasof deposition (such as the conducting airways), the fact that human exposures may be

3-54
considerably greater than those presupposed in the exercise (e.g., 5 :g/m3), the nature of theassays (i.e., in vitro in Chapter 4 vs. actual inhalation exposures), and the findings that DNAadducts may result from other known noncarcinogens such as carbon black (Bond et al., 1990)make the interpretation of such exercises problematic and their meaning unclear.
3.7. SUMMARY AND DISCUSSIONThe most consistent historical measure of exposure for DE is DPM in units of :g or mg
particles/m3, with the underlying assumption that all components of diesel emissions (e.g.,organics in the form of volatilized liquids or gases) are present in proportion to the DPM mass. DPM is used as the basic dosimeter for effects from various scenarios such as chronic and acuteexposures as well as for different endpoints such as irritation, fibrosis, or even cancer. There is,however, little evidence currently available to prove or refute DPM as being the most appropriatedosimeter.
DPM dose to the tissue is related to the extent of the deposition and clearance of DPM. DPM may deposit throughout the respiratory tract via sedimentation or diffusion, with the latterbeing prevalent in the alveolar region. Particles that deposit upon airway surfaces may be clearedfrom the respiratory tract completely or may be translocated to other sites by regionally distinctprocesses that can be categorized as either absorptive (i.e., dissolution) or nonabsorptive (i.e.,transport of intact particles via mucociliary transport). Other mechanisms that can affectretention of DPM include endocytosis by alveolar lining cells and interstitialization, which leadto the accumulation of DPM in the interstitial compartment of the lung and subsequenttranslocation of DPM to lymph nodes; interstitialization of poorly soluble particles may beprominent in primates and humans compared with rodents, although different rates for this pathcould also explain observed results. For poorly soluble particles such as DPM, species-dependent rate constants exist for the various clearance pathways that can be modified by factorssuch as respiratory tract disease.
In rats, prolonged exposure to high concentrations of particles will result in particleoverload, a condition that is defined as the overwhelming of macrophage-mediated clearance bythe deposition of particles at a rate exceeding the capacity of that clearance pathway. Thiscondition seems to begin to occur in rats when the pulmonary dust burden exceeds about 1 mgparticles/g lung tissue. On the other hand, there is no clear evidence for particle overload inhumans. Macrophage-mediated clearance is slower in humans than in rats, and kinetics relatingto interstitialization of poorly soluble particulate matter may have a greater consequence inhumans than in rats.
The degree of bioavailability of the organic fraction of DPM is still somewhat uncertain. However, reports of DNA alterations in occupationally exposed workers, as well as results of
3-55
animal studies using radiolabeled organics deposited on DPM, indicate that at least a fraction ofthe organics present are eluted prior to particle clearance. Carcinogenic organics eluted inregions where diffusion may be a relatively long process, such as in the conducting airways vsthe alveolar region, may remain in the lung long enough to be metabolized to an active form or tointeract directly with vital cellular components. The current information suggests that DPM-associated organics could be involved in a carcinogenic process, although the quantitative dataare far from adequate to make any firm conclusions.
Use of laboratory animal data in an assessment meant to be applied to humans obligatessome form of interspecies extrapolation. Review and evaluation of the considerable, specificdatabase in humans and animals on disposition of DPM, its adsorbed organics, and other poorlysoluble particles led to the judgment that default options available for interspecies dosimetryadjustment could be set aside for more scientifically valid, DPM-specific processes. Refinementof this process led to the evaluation of several applicable dosimetry models that in turn led to theidentification and choice of the Yu et al. (1991) model to conduct interspecies extrapolation. This model has a three-compartment lung consisting of tracheobronchial, alveolar, and lymphnode compartments. It treats DPM as being composed of the insoluble carbonaceous core,slowly cleared organics, and fast-cleared organics, and considers in an integrative manner thesimultaneous processes of both deposition and clearance through empirical data derived fromboth laboratory animals and humans. Also, the model has some limited consideration of modelvariability in its outputs describing dose to the lung. Major assumptions made in this modelinclude that transport rates of organics in DPM do not change across species and that thetransport rate of the carbonaceous core is species dependent, with the clearance rate varying withthe dose to the alveolar surface in the same proportion in humans as in rats. Limitations of themodel include the lack of definitive information on variability and, quite possibly, the lack of aformal interstitial compartment that may be of consequence in humans. The basis of this modelis to derive an internal dose from an external DPM concentration by utilizing species-specificphysiological and pharmacokinetic parameters and, as such, is considered to have addressed thepharmacokinetic aspects of interspecies dosimetry. This aspect of the model addresses some ofthe critical data needs for the quantitative analysis of noncancer effects from DPM, the subjectof Chapter 6.
As parallels have been drawn between DPM and PM2.5 in other chapters, it is perhapsappropriate to compare them also from the aspect of dosimetry. Obvious comparisons includethe nature of the particle distribution, defined artificially for PM2.5 as compared with the thoroughcharacterization of DPM for both MMAD (which, at around 0.2 :m, is typically more than anorder of magnitude less than the PM2.5 cutoff and which, more properly, should be termed a massmedian thermodynamic diameter, an MMTD) and geometric standard deviation. It is clear that a

3-56
larger portion of PM2.5 particles than DPM would be above the aerodynamic equivalent diameter(dae) of 0.5 :m, which is often considered as a boundary between diffusion and aerodynamicmechanisms of deposition. This would imply that a somewhat larger portion of DPM may passon to the lower respiratory tract than would PM2.5. Alveolar deposition in humans specific forDPM has been estimated with the Yu model to be 7%-13% (Yu and Xu, 1986), a figure that isconsistent with deposition predictions of other human models (see Table 3-3). This fractionaldeposition may be compared to one calculated for PM2.5 and reported in U.S. EPA (1996a);assuming a MMAD of 2.25 :m and a geometric standard deviation of 2.4, a fractional alveolardeposition of 10.2% was reported. This value is within the range and quite comparable to thatobtained by Yu and Xu (1986), indicating that little difference may exist in alveolar depositionbetween DPM and PM2.5, at least for this assumed geometric standard deviation.
REFERENCES FOR CHAPTER 3
Adamson, IYR; Bowden, DH. (1978) Adaptive responses of the pulmonary macrophagic system to carbon: II.Morphologic studies. Lab Invest 38:430-438.
Adamson, IYR; Bowden, DH. (1981) Dose response of the pulmonary macrophagic system to various particulatesand its relationship to transepithelial passage of free particles. Exp Lung Res 2:165-175.
Anjilvel, S; Asgharian, B. (1995) A multiple-path model of particle deposition in the rat lung. Fundam Appl Toxicol28:41-50.
Aronson, M. (1963) Bridge formation and cytoplasmic flow between phagocytic cells. J Exp Med 118:1083-1088.
Bailey, MR; Fry, FA; James, AC. (1982) The long-term clearance kinetics of insoluble particles from the humanlung. Ann Occup Hyg 26:273-290.
Bailey, MR; Fry, FA; James, AC. (1985) Long-term retention of particles in the human respiratory tract. J AerosolSci 16:295-305.
Ball, LM; King, LC. (1985) Metabolism, mutagenicity, and activation of 1-nitropyrene in vivo and in vitro. EnvironInt 11:355-361.
Battigelli, MC; Hengstenberg, F; Mannela, RJ; et al. (1966) Mucociliary activity. Arch Environ Health 12:460-466.
Bellmann, B; Muhle, H; Creutzenberg, O; et al. (1990) Recovery behaviour after dust overloading of lungs in rats. JAerosol Sci 21:377-380.
Bevan, DR; Ruggio, DM. (1991) Bioavailability in vivo of benzo[a]pyrene adsorbed to diesel particulate. ToxicolInd Health 7:125-139.
Bohning, DE; Cohn, SH; Lee, HD; et al. (1980) Two-phase deep-lung clearance in man. In: Pulmonary toxicology ofrespirable particles: proceedings of the nineteenth annual Hanford life sciences symposium; October 1979; Richland,WA. Sanders, CL; Cross, FT; Dagle, GE; et al., eds. Washington, DC: U.S. Department of Energy; pp. 149-161.Available from: NTIS, Springfield, VA; CONF-791002.

3-57
Bohning, DE; Atkins, HL; Cohn, SH. (1982) Long-term particle clearance in man: normal and impaired. In: Inhaledparticles V: proceedings of an international symposium; September 1980; Cardiff, Wales. Walton, WH, ed. AnnOccup Hyg 26:259-271.
Bond, JA; Mitchell, CE; Li, AP. (1983) Metabolism and macromolecular covalent binding of benzo[a]pyrene incultured Fischer-344 rat lung type II epithelial cells. Biochem Pharmacol 32:3771-3776.
Bond, JA; Sun, JD; Medinsky, MA; et al. (1986) Deposition, metabolism, and excretion of 1-[14C]nitropyrene and1-[14C]nitropyrene coated on diesel exhaust particles as influenced by exposure concentration. Toxicol ApplPharmacol 85:102-117.
Bond, JA; Johnson, NF; Snipes, MB; et al. (1990) DNA adduct formation in rat alveolar type II cells: cellspotentially at risk for inhaled diesel exhaust. Environ Mol Mutagen 16:64-69.
Brain, JD; Mensah, GA. (1983) Comparative toxicology of the respiratory tract. Am Rev Respir Dis 128:S87-S90.
Brooks, AL; Wolff, RK; Royer, RE; et al. (1981) Deposition and biological availability of diesel particles and theirassociated mutagenic chemicals. Environ Int 5:263-267.
Chan, TL; Lee, PS; Hering, WE. (1981) Deposition and clearance of inhaled diesel exhaust particles in therespiratory tract of Fischer rats. J Appl Toxicol 1:77-82.
Chan, TL; Lee, PS; Hering, WE. (1984) Pulmonary retention of inhaled diesel particles after prolonged exposures todiesel exhaust. Fundam Appl Toxicol 4:624-631.
Cohen, D; Arai, SF; Brain, JD. (1979) Smoking impairs long-term dust clearance from the lung. Science(Washington, DC) 204:514-517.
Cohen, BS; Xiong, JQ; Fang, CP; et al. (1998) Deposition of charged particles on lung airways. Health Phys74:554-560.
Crapo, JD; Young, SL; Fram, EK; et al. (1983) Morphometric characteristics of cells in the alveolar region ofmammalian lungs. Am Rev Respir Dis 128:S42-S46.
Cuddihy, RG; Yeh, HC. (1986) Model analysis of respiratory tract clearance of particles inhaled by people. In:Annual report of the Inhalation Toxicology Research Institute. Muggenburg, BA; Sun, JD, eds. Albuquerque, NM:Lovelace Biomedical and Environmental Research Institute; report no. LMF-115; pp. 140-147.
Evans, MJ; Shami, SG; Martinez, LA. (1986) Enhanced proliferation of pulmonary alveolar macrophages aftercarbon instillation in mice depleted of blood monocytes by Strontium-89. Lab Invest 54:154-159.
Felicetti, SA; Wolff, RK; Muggenburg, BA. (1981) Comparison of tracheal mucous transport in rats, guinea pigs,rabbits, and dogs. J Appl Physiol: Respir Environ Exercise Physiol 51:1612-1617.
Ferin, J. (1982) Pulmonary alveolar pores and alveolar macrophage-mediated particle clearance. Anat Rec203:265-272.
Ferin, J; Feldstein, ML. (1978) Pulmonary clearance and hilar lymph node content in rats after particle exposure.Environ Res 16:342-352.
Freedman, AP; Robinson, SE. (1988) Noninvasive magnetopneumographic studies of lung dust retention andclearance in coal miners. In: Respirable dust in the mineral industries: health effects, characterization, and control:proceedings of the international symposium on respirable dust in the mineral industries; October 1986; UniversityPark, PA. Frantz, RL; Ramani, RV, eds. University Park, PA: Pennsylvania State University Press; pp. 181-186.

3-58
Freijer, JI; Cassee, FR; Subramaniam, R; et al. (1999) Multiple Path Particle Deposition model, a model for humanand rat airway particle deposition, MPPDep V1.11. Research for Man and Environment publication number65001019, Dutch National Institute of Public Health and the Environment, P.O. Box 1, 3720 BA Biltoven,Netherlands.
Frey, JW; Corn, M. (1967) Physical and chemical characteristics of particulates in a diesel exhaust. Am Ind HygAssoc J 28:468-478.
George, G; Hook, GER. (1984) The pulmonary extracellular lining. Environ Health Perspect 55:227-237.
Gerde, P; Medinsky, MA; Bond, JA. (1991a) Particle-associated polycyclic aromatic hydrocarbons - a reappraisal oftheir possible role in pulmonary carcinogenesis. Toxicol Appl Pharmacol 108:1-13.
Gerde, P; Medinsky, MA; Bond, JA. (1991b) The retention of polycyclic aromatic hydrocarbons in the bronchialairways and in the alveolar region - a theoretical comparison. Toxicol Appl Pharmacol 107:239-252.
Gerde, P; Muggenberg, BA; Dahl, AR. (1999) Bioavailability, absorption and metabolism of diesel soot-absorbedbenzo(a)pyrene after single-breath exposures in dogs. In: Relationships between acute and chronic effects of airpollution: 7th international inhalation symposium; February; Hannover, Federal Republic of Germany; p. 76.
Gibb, FR; Morrow, PE. (1962) Alveolar clearance in dogs after inhalation of an iron 59 oxide aerosol. J ApplPhysiol 17:429-432.
Godleski, JJ; Stearns, RC; Katler, MR; et al. (1988) Particle dissolution in alveolar macrophages assessed byelectron energy loss analysis using the Zeiss CEM902 electron microscope. J Aerosol Med 1:198-199.
Griffis, LC; Wolff, RK; Henderson, RF; et al. (1983) Clearance of diesel soot particles from rat lung after asubchronic diesel exhaust exposure. Fundam Appl Toxicol 3:99-103.
Gurley, LR; Spall, WD; Valdez, JG; et al. (1988) An HPLC procedure for the analysis of proteins in lung lavagefluid. Anal Biochem 172:465-478.
Harmsen, AG; Muggenburg, BA; Snipes, MB; et al. (1985) The role of macrophages in particle translocation fromlungs to lymph nodes. Science (Washington, DC) 230:1277-1280.
Haschek, WM; Wischi, MR. (1991) Respiratory System, Chapter 22 in Handbook of Toxicologic Pathology(Haschek, WM; Rousseaux, CG; eds.) pp 761-828. Academic Press, NY.
Health Effects Institute. (1995) Diesel exhaust: a critical analysis of emissions, exposure, and health effects: a specialreport of the Institute's Diesel Working Group. Cambridge, MA: Health Effects Institute.
Heinrich, U; Muhle, H; Takenaka, S; et al. (1986) Chronic effects on the respiratory tract of hamsters, mice, and ratsafter long-term inhalation of high concentrations of filtered and unfiltered diesel engine emissions. J Appl Toxicol6:383-395.
Hemminki, K; Söderling, J; Ericson, P; et al. (1994) DNA adducts among personnel servicing and loading dieselvehicles. Carcinogenesis 15:767-769.
Heppleston, AG. (1961) Observations on the disposal of inhaled dust by means of the double exposure technique. In:Inhaled particles and vapours: proceedings of an international symposium; March-April 1960; Oxford, UnitedKingdom. Davies, CN, ed. New York: Pergamon Press; pp. 320-326.
Heppleston, AG; Young, AE. (1973) Uptake of inert particulate matter by alveolar cells: an ultrastructural study. JPathol 111:159-164.

3-59
Heyder, J; Gebhart, J; Rudolf, G; et al. (1986) Deposition of particles in the human respiratory tract in the size range0.005-15 :m. J Aerosol Sci 17:811-825.
Hiura, TS; Kaxzubowski, MP; Li, N; et al. (1999) Chemicals in diesel exhaust particles generate oxygen radicalsand induce apoptosis in macrophages. J Immunol 163:5582-5591.
Holt, PF. (1981) Transport of inhaled dust to extrapulmonary sites. J Pathol 133:123-129.
Hsieh, TH; Yu, CP. (1998) Two-phase pulmonary clearance of insoluble particles in mammalian species. InhalToxicol 10:121-130.
International Commission on Radiological Protection (ICRP). (1994) Human respiratory tract model for radiologicalprotection: a report of a task group of the International Commission on Radiological Protection. Oxford, UnitedKingdom: Elsevier Science Ltd. (ICRP publication 66; Annals of the ICRP: v. 24, nos. 1-3).
International Life Sciences Institute (ILSI). (2000) ILSI Risk Science Institute Workshop: the relevance of the ratlung response to particle overload for human risk assessment. Gardner, DE, ed. Inhal Toxicol 12(1-2):1-148.
Jammet, H; Drutel, P; Parrot, R; et al. (1978) Étude de l'épuration pulmonaire chez l'homme après administrationd'aérosols de particules radioactives [Study of pulmonary function in man after administration of radioactiveparticulate aerosols]. Radioprotection 13:143-166.
Jarvis, NS; Birchall, A; James, AC; et al. (1996) International Commission on Radiological Protection, LUDEP(LUng DEPosition) 2.07 Personal Computer Program for Calculating Internal Doses Using the ICRP Publication 66Respiratory Tract Model. NRPB-SR287, National Radiological Protection Board, Chilton, Didcot, Oxon OX110RQ, UK.
Keane, MJ; Xing, S-G; Harrison JC; et al. (1991) Genotoxicity of diesel-exhaust particles dispersed in simulatedpulmonary surfactant. Mutat Res 260:233-238.
King, LC; Kohan, MJ; Austin, AC; et al. (1981) Evaluation of the release of mutagens from diesel particles in thepresence of physiological fluids. Environ Mutagen 3:109-121.
Kittelson, DB; Dolan, DF; Verrant, JA. (1978) Investigation of a diesel exhaust aerosol. Warrendale, PA: Society ofAutomotive Engineers, Inc.; technical paper series no. 78109.
Kreyling, WG. (1992) Intracellular particle dissolution in alveolar macrophages. Environ Health Perspect97:121-126.
Kuempel, ED. (2000). Comparison of human and rodent lung dosimetry models for particle clearance and retention. Drug Chem Toxicol 23(1):203-222.
Lee, PS; Chan, TL; Hering, WE. (1983) Long-term clearance of inhaled diesel exhaust particles in rodents. J ToxicolEnviron Health 12:801-813.
Lee, KP; Trochimowicz, HJ; Reinhardt, CF. (1985) Transmigration of titanium dioxide (TiO2) particles in rats afterinhalation exposure. Exp Mol Pathol 42:331-343.
Lee, KP; Henry, NW, III; Trochimowicz, HJ.; et al. (1986) Pulmonary response to impaired lung clearance in ratsfollowing excessive TiO2 dust deposition. Environ Res 41:144-167.
Lee, KP; Ulrich, CE; Geil, RG; et al. (1988) Effects of inhaled chromium dioxide dust on rats exposed for two years.Fundam Appl Toxicol 10:125-145.

3-60
Lehnert, BE. (1988) Distributions of particles in alveolar macrophages during lung clearance. J Aerosol Med1:206-207.
Lehnert, BE. (1989) Rates of disappearance of alveolar macrophages during lung clearance as a function ofphagocytized particulate burden [abstract]. Am Rev Respir Dis 139(suppl.):A161.
Lehnert, BE. (1990) Alveolar macrophages in a particle “overload” condition. J Aerosol Med 3(suppl. 1):S9-S30.
Lehnert, BE; Morrow, PE. (1985) Association of 59iron oxide with alveolar macrophages during alveolar clearance.Exp Lung Res 9:1-16.
Lehnert, BE; Valdez, YE; Bomalaski, SH. (1988) Analyses of particles in the lung free cell, tracheobronchial lymphnodal, and pleural space compartments following their deposition in the lung as related to lung clearancemechanisms. In: Inhaled particles VI: proceedings of an international symposium and workshop on lung dosimetry;September 1985; Cambridge, United Kingdom. Dodgson, J: McCallum, RI; Bailey, MR; et al., eds. Ann Occup Hyg32 (suppl. 1):125-140.
Lehnert, BE; Cline, A; London, JE. (1989) Kinetics of appearance of polymorphonuclear leukocytes and theirparticle burdens during the alveolar clearance of a high lung burden of particles. Toxicologist 9:77.
Leung, HW; Henderson, RF; Bond, JA; et al. (1988) Studies on the ability of rat lung and liver microsomes tofacilitate transfer and metabolism of benzo[a]pyrene from diesel particles. Toxicology 51:1-9.
Lewis, TR; Green, FHY; Moorman, WJ; et al. (1989) A chronic inhalation toxicity study of diesel engine emissionsand coal dust, alone and combined. J Am Coll Toxicol 8:345-375.
Lippmann, M; Schlesinger, RB. (1984) Interspecies comparisons of particle deposition and mucociliary clearance intracheobronchial airways. J Toxicol Environ Health 13:441-469.
Lundborg, M; Lind, B; Camner, P. (1984) Ability of rabbit alveolar macrophages to dissolve metals. Exp Lung Res7:11-22.
Marafante, E; Lundborg, M; Vahter, M; et al. (1987) Dissolution of two arsenic compounds by rabbit alveolarmacrophages in vitro. Fundam Appl Toxicol 8:382-388.
Mauderly, JL. (1996) Lung overload: the dilemma and opportunities for resolution. In: Particle overload in the ratlung and lung cancer: implications for human risk assessment. Proceedings of a conference; March 1995;Cambridge, MA. Mauderly, JL; McCunney, RJ; eds. New York: Taylor & Francis.
McClellan, RO. (2000) Particle interactions with the respiratory tract. In: Particle-lung interactions. Geber, P;Heyder, J, eds. New York: Marcel Dekker, pp. 4-63.
McClellan, RO; Brooks, AL; Cuddihy, RG; et al. (1982) Inhalation toxicology of diesel exhaust particles. In:Toxicological effects of emissions from diesel engines: proceedings of the EPA diesel emissions symposium;October 1981; Raleigh, NC. Lewtas, J, ed. New York: Elsevier Biomedical; pp. 99-120. (Developments intoxicology and environmental science: v. 10)
Morrow, PE. (1966) International Commission on Radiological Protection (ICRP) task group on lung dynamics,deposition and retention models for internal dosimetry of the human respiratory tract. Health Phys 12:173.
Morrow, PE. (1988) Possible mechanisms to explain dust overloading of the lungs. Fundam Appl Toxicol10:369-384.
Morrow, PE. (1994) Mechanisms and significance of “particle overload.” In: Toxic and carcinogenic effects of solidparticles in the respiratory tract: [proceedings of the 4th international inhalation symposium]; March 1993;

3-61
Hannover, Germany. Mohr, U; Dungworth, DL; Mauderly, JL; et al., eds. Washington, DC: International LifeSciences Institute Press; pp. 17-25.
Morrow, PE; Gibb, FR; Gazioglu, KM. (1967a) The clearance of dust from the lower respiratory tract of man. Anexperimental study. In: Inhaled particles and vapors II. Davies, CN, ed. London: Pergamon, pp. 351-359.
Morrow, PE; Gibb, FR; Gazioglu, KM. (1967b) A study of particulate clearance from the human lungs. Am RevRespir Dis 96:1209-1221.
Morrow, PE; Yu, CP. (1993) Models of aerosol behavior in airways and alveoli. In: Aerosols in medicine:principles, diagnosis and therapy. 2nd rev. ed. Moren, F; Dolovich, MB; Newhouse, MT; et al., eds. Amsterdam:Elsevier; pp. 157-193.
Muhle, H; Bellman, B; Creutzenberg, O; et al. (1990a) Dust overloading of lungs after exposure of rats to particlesof low solubility: comparative studies. J Aerosol Sci 21:374-377.
Muhle, H; Creutzenberg, O; Bellmann, B; et al. (1990b) Dust overloading of lungs: investigations of variousmaterials, species differences, and irreversibility of effects. J Aerosol Med 3(suppl. 1): S111-S128.
National Council on Radiation Protection and Measurements (NCRP). (1997) Deposition, retention, and dosimetryof inhaled radioactive substances, NCRP Report No. 125. Bethesda, MD.
National Research Council (NRC). (1995) Science and judgment in risk assessment. Washington, DC: NationalResearch Council.
Nielsen, PS; Andreassen, A; Farmer, PB; et al. (1996) Biomonitoring of diesel exhaust-exposed workers. DNA andhemoglobin adducts and urinary 1-hydroxypyrene as markers of exposure. Toxicol Lett 86:27-37.
Nikula, KJ; Avila, KJ; Griffith, WC; et al. (1997a) Sites of particle retention and lung tissue responses to chronicallyinhaled diesel exhaust and coal dust in rats and cynomolgus monkeys. In: Proceedings of the sixth internationalmeeting on the toxicology of natural and man-made fibrous and non-fibrous particles; September 1996; Lake Placid,NY. Driscoll, KE; Oberdörster, G, eds. Environ Health Perspect Suppl 105(5):1231-1234.
Nikula, KJ; Avila, KJ; Griffith, WC; et al. (1997b) Lung tissue responses and sites of particle retention differbetween rats and cynomolgus monkeys exposed chronically to diesel exhaust and coal dust. Fundam Appl Toxicol37:37-53.
Nilsen, A; Nyberg, K; Camner, P. (1988) Intraphagosomal pH in alveolar macrophages after phagocytosis in vivoand in vitro of fluorescein-labeled yeast particles. Exp Lung Res 14:197-207.
Oberdörster, G. (1988) Lung clearance of inhaled insoluble and soluble particles. J Aerosol Med 1:289-330.
Oberdörster, G. (1994) Extrapolation of results from animal inhalation studies with particles to humans In: toxic andcarcinogenic effects of solid particles in the respiratory tract: [proceedings of the 4th international inhalationsymposium]; March 1993 Hannover, Germany. Mohr, U; Dungworth, DL; Mauderly, JL; et al., eds. Washington,DC: International Life Sciences Institute Press; pp 335-353.
Oberdörster, G; Ferin, J; Morrow, PE. (1992) Volumetric loading of alveolar macrophages (AM): a possible basisfor diminished AM-mediated particle clearance. Exp Lung Res 18:87-104.
Ohkuma, S; Poole, B. (1978) Fluorescence probe measurement of the intralysosomal pH in living cells and theperturbation of pH by various agents. Proc Nat. Acad Sci U S A 75:3327-3331.

3-62
Österholm, AM; Fält, S; Lambert, B; et al. (1995) Classification of mutations at the human hprt-locus inT-lymphocytes of bus maintenance workers by multiplex-PCR and reverse transriptase-PCR analysis. Carcinogenesis16:1909-1995.
Pepelko, WE. (1987) Feasibility of dose adjustment based on differences in long-term clearance rates of inhaledparticulate matter in humans and laboratory animals. Regul Toxicol Pharmacol 7:236-252.
Phalen, RF; Oldham, MJ. (1983) Tracheobronchial airway structure as revealed by casting techniques. Am RevRespir Dis 128:S1-S4.
Phalen, RF; Oldham, MJ; Beaucage, CB.; et al. (1985) Postnatal enlargement of human tracheobronchial airwaysand implications for particle deposition. Anat. Rec. 212:368-380.
Phalen, RF; Cuddihy, RG; Fisher, GL; et al. (1991) Main features of the proposed NCRP respiratory tract model. Radiat. Prot. Dosim. 38:179-184.
Powdrill, J; Buckley, C; Valdez, YE; et al. (1989) Airway intra-luminal macrophages: origin and role in lungclearance. Toxicologist 9:77.
Pritchard, JN. (1989) Dust overloading causes impairment of pulmonary clearance: evidence from rats and humans.Exp Pathol 37:39-42.
Raabe, OG. (1982) Deposition and clearance of inhaled aerosols. In: Mechanisms in respiratory toxicology. Witschi,H, ed. Boca Raton, FL: CRC Press; pp. 27-76.
Raabe, OG; Al-Bayati, MA; Teague, SV; et al. (1988) Regional deposition of inhaled monodisperse, coarse, and fineaerosol particles in small laboratory animals. In: Inhaled particles VI: proceedings of an international symposium andworkshop on lung dosimetry; September 1985; Cambridge, United Kingdom. Dodgson, J; McCallum, RI; Bailey,MR; et al., eds. Ann Occup Hyg 32(suppl. 1):53-63.
Riley, PA; Dean, RT. (1978) Phagocytosis of latex particles in relation to the cell cycle in 3T3 cells. Exp Cell Biol46:367-373.
Robertson, B. (1980) Basic morphology of the pulmonary defence system. Eur J Respir Dis 61(suppl. 107):21-40.
Sandusky, CB; Cowden, MW; Schwartz, SL. (1977) Effect of particle size on regurgitative exocytosis by rabbitalveolar macrophages. In: Pulmonary macrophage and epithelial cells: proceedings of the sixteenth annual Hanfordbiology symposium; September 1976; Richland, WA. Sanders, CL; Schneider, RP; Dagle, GE; et al., eds.Washington, DC: Energy Research and Development Administration; pp. 85-105. (ERDA symposium series: no.43). Available from: NTIS, Springfield, VA; CONF-760927.
Schanker, LS; Mitchell, EW; Brown, RA, Jr. (1986) Species comparison of drug absorption from the lung afteraerosol inhalation or intratracheal injection. Drug Metab Dispos 14:79-88.
Schlesinger, RB. (1985) Comparative deposition of inhaled aerosols in experimental animals and humans: a review.J Toxicol Environ Health 15:197-214.
Schlesinger, R.B. (1995) Deposition and clearance of inhaled particles. In: McClellan, R.O.; Henderson, R.F.; eds.Concepts in inhalation toxicology. 2nd ed. Washington D.C., Taylor & Francis: pp. 191-224.
Schlesinger, RB; Ben-Jebria, A; Dahl, AR; et al. (1997) Disposition of inhaled toxicants. In: Handbook of humantoxicology. Massaro, EJ, ed. Boca Raton, FL: CRC Press; pp. 493-550.
Schum, M; Yeh, HC. (1980) Theoretical evaluation of aerosol deposition in anatomical models of mammalian lungairways. Bull Math Biol 42:1-15.

3-63
Siak, JS; Chan, TL; Lee, PS. (1980) Diesel particulate extracts in bacterial test systems. In: Health effects of dieselengine emissions: proceedings of an international symposium, v. 1; December 1979; Cincinnati, OH. Pepelko, WE;Danner, RM; Clarke, NA, eds. Cincinnati, OH: U.S. EPA, Health Effects Research Laboratory; pp. 245-262; EPAreport no. EPA/600/9-80/057b. Available from: NTIS, Springfield, VA; PB81-173809.
Smith, TJ. (1985) Development and application of a model for estimating alveolar and interstitial dust levels. AnnOccup Hyg 29:495-516.
Snipes, MB. (1979) Long-term retention of monodisperse and polydisperse particles inhaled by beagle dogs, rats andmice. Albuquerque, NM: Lovelace Biomedical and Environmental Research Institute; Inhalation ToxicologyResearch Institute annual report LF-69; pp. 420-423.
Snipes, MB; Clem, MF. (1981) Retention of microspheres in the rat lung after intratracheal instillation. Environ Res24:33-41.
Snipes, MB; Boecker, BB; McClellan, RO. (1983) Retention of monodisperse or polydisperse aluminosilicateparticles inhaled by dogs, rats, and mice. Toxicol Appl Pharmacol 69:345-362.
Snipes, MB; Olson, TR; Yeh, HC. (1988) Deposition and retention patterns for 3-, 9-, and 15-:m latex microspheresinhaled by rats and guinea pigs. Exp Lung Res 14:37-50.
Snipes, MB; McClellan, RO; Mauderly, JL; et al. (1989) Retention patterns for inhaled particles in the lung:comparisons between laboratory animals and humans for chronic exposures. Health Phys 57(suppl. 1):69-78.
Sorokin, SP; Brain, JD. (1975) Pathways of clearance in mouse lungs exposed to iron oxide aerosols. Anat Rec181:581-625.
Stahlhofen, W; Gebhart, J; Heyder, J. (1980) Experimental determination of the regional deposition of aerosolparticles in the human respiratory tract. Am Ind Hyg Assoc J 41:385-398a.
Stahlhofen, W; Koebrich, R; Rudolf, G; et al. (1990) Short-term and long-term clearance of particles from the upperhuman respiratory tract as function of particle size. J Aerosol Sci 21(suppl. 1):S407-S410.
Stöber, W; Einbrodt, HJ; Klosterkötter, W. (1967) Quantitative studies of dust retention in animal and human lungsafter chronic inhalation. In: Inhaled particles and vapours II: proceedings of an international symposium; September-October 1965; Cambridge, United Kingdom. Davies, CN, ed. Oxford, United Kingdom:Pergamon Press; pp. 409-418.
Stöber, W; Morrow, PE; Hoover, MD. (1989) Compartmental modeling of the long-term retention of insolubleparticles deposited in the alveolar region of the lung. Fundam Appl Toxicol 13:823-842.
Stöber, W; McClellan, RO; Morrow, PE. (1993) Approaches to modeling disposition of inhaled particles and fibersin the lung. In: Toxicology of the lung. Gardner, DE; Crapo, JD; McClellan, RO, eds. New York: Raven Press; pp.527-601.
Stöber, W; Morrow, PE; Koch, W; et al. (1994) Alveolar clearance and retention of inhaled insoluble particles inrats simulated by a model inferring macrophage particle load distributions. J Aerosol Sci 25:975-1002.
Strom, KA. (1984) Response of pulmonary cellular defenses to the inhalation of high concentrations of dieselexhaust. J Toxicol Environ Health 13:919-944.
Strom, KA; Chan, TL; Johnson, JT. (1988) Pulmonary retention of inhaled submicron particles in rats: diesel exhaustexposures and lung retention model. In: Inhaled particles VI: proceedings of an international symposium andworkshop on lung dosimetry; September 1985; Cambridge, United Kingdom. Dodgson, J; McCallum, RI; Bailey,MR; et al., eds. Ann Occup Hyg 32(suppl. 1):645-657.

3-64
Subramaniam, RP; Miller, FJ; Asgarian, B. (1998) Numerical predictions of regional deposition of fine particles inthe human lung using a multiple-path model. Proceedings of the American Association of Aerosol Research, annualmeeting; Denver, CO.
Sun, JD; Wolff, RK; Kanapilly, GM. (1982) Deposition, retention, and biological fate of inhaled benzo(a)pyreneadsorbed onto ultrafine particles and as a pure aerosol. Toxicol Appl Pharmacol 65:231-244.
Sun, JD; Wolff, RK; Kanapilly, GM; et al. (1984) Lung retention and metabolic fate of inhaled benzo(a)pyreneassociated with diesel exhaust particles. Toxicol Appl Pharmacol 73:48-59.
Tong, HY; Karasek, FW. (1984) Quantitation of polycyclic aromatic hydrocarbons in diesel exhaust particulatematter by high-performance liquid chromatography fractionation and high-resolution gas chromatography. AnalChem 56:2129-2134.
U.S. Environmental Protection Agency (U.S. EPA). (1982) Air quality criteria for particulate matter and sulfuroxides. Research Triangle Park, NC: Office of Health and Environmental Assessment, Environmental Criteria andAssessment Office; EPA report no. EPA/600/8-82-029aF-cF. 3v. Available from: NTIS, Springfield, VA;PB84-156777.
U.S. EPA. (1993) Provisional guidance for quantitative risk assessment of polycyclic aromatic hydrocarbons. Officeof Health and Environmental Assessment; EPA report no. EPA/600/R-93/089.
U.S. EPA. (1994) Methods for derivation of inhalation reference concentrations and application of inhalationdosimetry [draft final]. Research Triangle Park, NC: Office of Health and Environmental Assessment, EnvironmentalCriteria and Assessment Office; report no. EPA/600/8-88/066F.
U.S. EPA. (1996) Air quality criteria for particulate matter. Research Triangle Park, NC: National Center forEnvironmental Assessment-RTP Office; report nos. EPA/600/P-95/001aF-cF. 3v. Available from: NTIS, Springfield,VA; PB96-168224.
Valberg, PA; Watson, AY. (1999) Comparative mutagenic dose of ambient diesel engine exhaust. Inhal Toxicol 11(3):215-228.
Vastag, E; Matthys, H; Zsamboki, G; et al. (1986) Mucociliary clearance in smokers. Eur J Respir Dis 68:107-113.
Vostal, JJ; Schreck, RM; Lee, PS; et al. (1982) Deposition and clearance of diesel particles from the lung. In:Toxicological effects of emissions from diesel engines: proceedings of the 1981 EPA diesel emissions symposium;October 1981; Raleigh, NC. Lewtas, J, ed. New York: Elsevier Biomedical; pp. 143-159. (Developments intoxicology and environmental science: v. 10).
Waite, DA; Ramsden, D. (1971) The inhalation of insoluble iron oxide particles in the sub-micron range. Part I.Chromium-51 labelled aerosols. Winfrith, Dorchester, Dorset, United Kingdom: Atomic Energy Establishment;report no. AEEW-R740.
Warheit, DB; Overby, LH; George, G; et al. (1988) Pulmonary macrophages are attracted to inhaled particlesthrough complement activation. Exp Lung Res 14:51-66.
Weibel, ER. (1963) Morphometry of the human lung. New York: Academic Press, Inc.
White, HJ; Garg, BD. (1981) Early pulmonary response of the rat lung to inhalation of high concentration of dieselparticles. J Appl Toxicol 1:104-110.
Wolff, RK; Gray, RL. (1980) Tracheal clearance of particles. In: Inhalation Toxicology Research Institute annualreport: 1979-1980. Diel, JH; Bice, DE; Martinez, BS, eds. Albuquerque, NM: Lovelace Biomedical andEnvironmental Research Institute; p. 252; report no. LMF-84.

3-65
Wolff, RK; Henderson, RF; Snipes, MB; et al. (1986) Lung retention of diesel soot and associated organiccompounds. In: Carcinogenic and mutagenic effects of diesel engine exhaust: proceedings of the internationalsatellite symposium on toxicological effects of emissions from diesel engines; July; Tsukuba Science City, Japan.Ishinishi, N; Koizumi, A; McClellan, R; et al. eds. Amsterdam: Elsevier Science Publishers BV.; pp. 199-211.(Developments in toxicology and environmental science: v. 13).
Wolff, RK; Henderson, RF; Snipes, MB; et al. (1987) Alterations in particle accumulation and clearance in lungs ofrats chronically exposed to diesel exhaust. Fundam Appl Toxicol 9:154-166.
World Health Organization (WHO). (1996) Diesel fuel and exhaust emissions. Geneva, Switzerland: World HealthOrganization, International Programme on Chemical Safety. (Environmental health criteria 171).
Wright, JR; Clements, JA. (1987) Metabolism and turnover of lung surfactant. Am Rev Respir Dis 136:426-444.
Xu, GB; Yu, CP. (1987) Deposition of diesel exhaust particles in mammalian lungs: a comparison between rodentsand man. Aerosol Sci Technol 7:117-123.
Yeh, HC; Schum, GM. (1980) Models of human lung airways and their application to inhaled particle deposition.Bull Math Biol 42:461-480.
Yeh, H-S; Cuddihy, RG; Phalen, RF; et al. (1996) Comparison of calculated respiratory tract deposition of particlesbased on the proposed NCRP model and the new ICRP66 model. Aerosol Sci Technol 25:134-140.
Yu, CP. (1978) Exact analysis of aerosol deposition during steady breathing. Powder Technol 21:55-62.
Yu, CP; Diu, CK. (1983) Total and regional deposition of inhaled aerosols in humans. J Aerosol Sci 5:599-609.
Yu, CP; Xu, GB. (1986) Predictive models for deposition of DE particulates in human and rat lungs. Aerosol SciTechnol 5:337-347.
Yu, CP; Xu, GB. (1987) Predictive models for deposition of diesel exhaust particulates in human and rat lungs.Aerosol Sci Technol 5:337-347.
Yu, CP; Yoon, KJ. (1990) Retention modeling of diesel exhaust particles in rats and humans. Amherst, NY: StateUniversity of New York at Buffalo (Health Effects Institute research report no. 40).
Yu, CP; Chen, YK; Morrow, PE. (1989) An analysis of alveolar macrophage mobility kinetics at dust overloading ofthe lungs. Fundam Appl Toxicol 13:452-459.
Yu, CP; Yoon, KJ; Chen, YK. (1991) Retention modeling of diesel exhaust particles in rats and humans. J AerosolMed 4(2):79-115.
Yu, CP; Ding, YJ; Zhang, L; et al. (1996) A clearance model of refractory ceramic fibers in the rat lung includingfiber dissolution and breakage. J Aerosol Sci 27:151-160.

4. MUTAGENICITY
The application of mutagenicity data to the question of the potential carcinogenicity of diesel emissions is based on the premise that genetic alterations are found in all cancers and that several of the chemicals found in diesel emissions possess mutagenic activity in a variety of genetic assays. These genetic alterations can be produced by gene mutations, deletions, translocations, aneuploidy, or amplification of genes; hence no single genotoxicity assay should be expected to predict rodent carcinogenicity. Additionally, because of the inherent biological differences of measured endpoints, both within genotoxicity assays and between genotoxicity assays and cancer bioassays, a direct extrapolation should not be expected (see Brusick [1987] for a more detailed discussion). Indeed, most genotoxicity data are generated with in vitro assays that frequently employ concentrations of test agent that may be orders of magnitude greater than encountered in environmental situations. With diesel emissions or other mixtures, additional complications arise because of the complexity of the material being tested.
Since 1978, more than 100 publications have appeared in which genotoxicity assays were used with diesel emissions, the volatile and particulate fractions (including extracts), or individual chemicals found in diesel emissions. The Huisingh et al. (1978) report not only identified mutagenic activity in salmonella in several fractions of diesel particular mater (DPM) extracts, but also indicated that the mutagenic activity, especially quantitatively, was affected by the extraction solvent as well as method and length of storage. Much of the ensuing research employed bioassays (most commonly salmonella TA98 without S9) to evaluate (1) extraction procedures, (2) fuel modifications, (3) bioavailability of chemicals from DPM, and (4) exhaust filters or other modifications and other variables associated with diesel emissions. The interest in the contribution of mutagens to carcinogenicity was high in the early 1980s and the lack of long- term rodent carcinogenicity information on diesel emissions led to the use of semiquantitative mutagenicity (and in vitro cell transformation) data from diesel emissions and epidemiology based cancer potency estimations to derive a comparative potency estimate for diesel emissions first published by Albert et al. (1983) and more fully discussed in Appendix C of this report.
As indicated in Chapter 2, the number of chemicals in diesel emissions is very large. Many of these have been determined to exhibit mutagenic activity in a variety of assay systems (see Table II. in Claxton, 1983). Although a detailed discussion of those data is beyond the scope of this document, some of the mutagenically active compounds found in the gas phase are ethylene, benzene, 1,3-butadiene, acrolein and several PAHs (see Table 2-21). Of the particle-associated chemicals, several PAHs and nitro-PAHs have been the focus of mutagenic investigations both in bacteria and in mammalian cell systems (see Table 2-22). Several review
4-1

articles, some containing more detailed descriptions of the available studies, are available (Claxton, 1983; Pepelko and Peirano, 1983; International Agency for Research on Cancer, 1989; Shirnamé-Moré, 1995). Discussions of genotoxicity in the proceedings of several symposia on the health effects of diesel emissions (U.S. EPA, 1980; Lewtas, 1982; Ishinishi et al., 1986) are also available.
4.1. GENE MUTATIONS Huisingh et al. (1978) demonstrated that dichloromethane extracts from DPM were
mutagenic in strains TA1537, TA1538, TA98, and TA100 of S. typhimurium, both with and without rat liver S9 activation. This report contained data from several fractions as well as DPM from different vehicles and fuels. Similar results with diesel extracts from various engines and fuels have been reported by a number of investigators using the salmonella frameshift-sensitive strains TA1537, TA1538, and TA98 (Siak et al., 1981; Claxton, 1981; Dukovich et al., 1981; Brooks et al., 1984). Similarly, mutagenic activity was observed in salmonella forward mutation assays measuring 8-azaguanine resistance (Claxton and Kohan, 1981) and in E. coli mutation assays (Lewtas, 1983).
One approach to identifying significant mutagens in chemically complex environmental samples such as diesel exhaust or ambient particulate extracts is the combination of short-term bioassays with chemical fractionation (Scheutzle and Lewtas, 1986). The analysis is most frequently carried out by sequential extraction with increasingly polar or binary solvents. Fractionation by silica-column chromatography separates compounds by polarity or into acidic, basic, and neutral fractions. The resulting fractions are too complex to characterize by chemical methods, but the bioassay analysis can be used to determine fractions for further analysis. In most applications of this concept, salmonella strain TA98 without the addition of S9 has been used as the indicator for mutagenic activity. Generally, a variety of nitrated polynuclear aromatic compounds have been found that account for a substantial portion of the mutagenicity (Liberti et al., 1984; Schuetzle and Frazer, 1986; Schuetzle and Perez, 1983). However, not all bacterial mutagenicity has been identified in this way, and the identity of the remaining mutagenic compounds remains unknown. The nitrated aromatics thus far identified in diesel engine exhaust (DE) were the subject of review in the IARC monograph on DE (International Agency for Research on Cancer, 1989). In addition to the simple qualitative identification of mutagenic chemicals, several investigators have used numerical data to express mutagenic activity as activity per distance driven or mass of fuel consumed. These types of calculations have been the basis for estimates that the nitroarenes (both mono- and dinitropyrenes) contribute a significant amount of the total mutagenic activity of the whole extract (Nishioka et al., 1982; Salmeen et al., 1982; Nakagawa et al., 1983). In a 1983 review, Claxton discussed a number of
4-2

factors that affected the mutagenic response in salmonella assays. Citing the data from the Huisingh et al. (1978) study, the author noted that the mutagenic response could vary by a factor of 100 using different fuels in a single diesel engine. More recently, Crebelli et al. (1995) used salmonella to examine the effects of different fuel components. They reported that although mutagenicity was highly dependent on aromatic content, especially di- or triaromatics, there was no clear effect of sulfur content of the fuel. Later, Sjögren et al. (1996) using multivariate statistical methods with ten diesel fuels concluded that the most influential chemical factors in salmonella mutagenicity were sulfur contents, certain PAHs (1-nitropyrene) and naphthenes.
Matsushita et al. (1986) tested particle-free DE gas and a number of benzene nitro-derivatives and polycyclic aromatic hydrocarbons (PAHs) (many of which have been identified as components of DE gas). The particle-free exhaust gas was positive in both TA100 and TA98, but only without S9 activation. Of the 94 nitrobenzene derivatives tested, 61 were mutagenic, and the majority showed greatest activity in TA100 without S9. Twenty-eight of 50 PAHs tested were mutagenic, all required the addition of S9 for detection, and most appeared to show a stronger response in TA100. When 1,6-dinitropyrene was mixed with various PAHs or an extract of heavy-duty (HD) DE, the mutagenic activity in TA98 was greatly reduced when S9 was absent but was increased significantly when S9 was present. These latter results suggested that caution should be used in estimating mutagenicity (or other toxic effects) of complex mixtures from the specific activity of individual components.
Mitchell et al. (1981) reported mutagenic activity of DPM extracts of diesel emissions in the mouse lymphoma L5178Y mutation assay. Positive results were seen both with and without S9 activation in extracts from several different vehicles, with mutagenic activity only slightly lower in the presence of S9. These findings have been confirmed in a number of other mammalian cell systems using several different genetic markers. Casto et al. (1981), Chescheir et al. (1981), Li and Royer (1982), and Brooks et al. (1984) all reported positive responses at the HPRT locus in Chinese hamster ovary (CHO) cells. Morimoto et al. (1986) used the APRT and Ouar loci in CHO cells; Curren et al. (1981) used Ouar in BALB/c 3T3 cells. In all of these studies, mutagenic activity was observed without S9 activation. Liber et al. (1981) used the thymidine kinase (TK) locus in the TK6 human lymphoblast cell line and observed induced mutagenesis only in the presence of rat liver S9 when testing a methylene chloride extract of DE. Barfknecht et al. (1982) also used the TK6 assay to identify some of the chemicals responsible for this activation-dependent mutagenicity. They suggested that fluoranthene, 1-methylphenanthrene, and 9-methylphenanthrene could account for over 40% of the observed activity.
Morimoto et al. (1986) injected DPM extracts (250 to 4,000 mg/kg) into pregnant Syrian hamsters and measured mutations at the APRT locus in embryo cells cultivated 11 days after i.p.
4-3
injection. Although neutral fractions from both light-duty (LD) and HD particle extracts resulted in increased mutation frequency at 2,000 and 4,000 mg/kg, the response at 1,000 mg/kg was not different from controls. Also, because the authors did not present data on toxicity or cloning efficiency, the value of the apparent positive findings at extremely high concentrations is uncertain at best. Belisario et al. (1984) applied the Ames test to urine from Sprague-Dawley rats exposed to single applications of DPM administered by gastric intubation, i.p. injection, or s.c. gelatin capsules. In all cases, dose-related increases were seen in TA98 (without and with S9) from urine concentrates taken 24 h after particle administration. Urine from Swiss mice exposed by inhalation to filtered exhaust (particle concentration 6 to 7 mg/m3) for 7 weeks (Pereira et al., 1981a) or Fischer 344 rats exposed to DPM at a concentration of 1.9 mg/m3 for 3 months to 2 years (Ong et al., 1985) was negative in salmonella strains.
Schuler and Niemeier (1981) exposed drosophila males in a stainless steel chamber connected to the 3 m3 chamber used for the chronic animal studies at EPA (see Hinners et al., 1980 for details). Flies were exposed for 8 h and mated to untreated females 2 days later. Although the frequency of sex-linked recessive lethals from treated males was not different from that of controls, the limited sample size precluded detecting less than a threefold increase over controls. The authors noted that, because there were no signs of toxicity, the flies might tolerate exposures to higher concentrations for longer time periods.
Driscoll et al. (1996) exposed Fischer 344 male rats to aerosols of carbon black (1.1, 7.1, and 52.8 mg/m3) or air for 13 weeks (6 hr/day, 5 days/week) and measured hprt mutations in alveolar type II cells in animals immediately after exposure and at 12 and 32 weeks after the end of exposure. Both of the two higher concentrations resulted in significant increases in mutant frequency. Whereas the mutant frequency from the 7.1 mg/m3 group returned to control levels by 12 weeks, the mutant frequency of the high-exposure group was still higher than controls even after 32 weeks. Carbon black particles have very little adsorbed PAHs, hence a direct chemically induced mechanism is highly unlikely. Induction of hprt mutations were also observed in rat alveolar epithelial cells after intratracheal instillation with carbon black, "-quartz, and titanium dioxide (Driscoll et al., 1997). All three types of particles elicited an inflammatory response as shown by significant increases of neutrophils in bronchoalveolar lavage (BAL) fluid. Culturing the BAL from exposed rats with a rat lung epithelial cell line also resulted in elevation of hprt mutational response. This response was effectively eliminated when catalase was included in the incubation mixture, providing evidence for cell-derived oxidative damage. Recently, Sato et al. (2000) exposed male Big Blue transgenic F344 rats to diluted DE (1 and 6 mg/m3 suspended particle concentration) for 4 weeks. Mutant frequency in lung DNA was significantly elevated (4.8x control) at 6 mg/m3 but not at 1 mg/m3. Lung DNA adduct levels measured by 32P-postlabeling and 8-hydroxydeoxyguanosine measured by HPLC
4-4

were elevated at both particle concentrations, but to a lesser extent than mutant frequencies. Sequence analysis of mutants indicated that some, but not all, of the mutations could be explained by an oxidative damage mechanism.
Specific-locus mutations were not induced in (C3H × 101)F1 male mice exposed to DE 8 h/day, 7 days/week for either 5 or 10 weeks (Russell et al., 1980). The exhaust was a 1:18 dilution and the average particle concentration was 6 mg/m3. After exposure, males were mated to T-stock females and matings continued for the reproductive life of the males. The results were unequivocally negative; no mutants were detected in 10,635 progeny derived from postspermatogonial cells or in 27,917 progeny derived from spermatogonial cells.
Hou et al. (1995) measured DNA adducts and hprt mutations in peripheral lymphocytes of 47 bus maintenance workers and 22 control individuals. All were nonsmoking men from garages in the Stockholm area and the exposed group consisted of 16 garage workers, 25 mechanics, and 6 other garage workers. There were no exposure data, but the three groups were considered to be of higher to lower exposure to diesel engine exhaust. Levels of DNA adducts determined by 32P-postlabeling were significantly higher in workers than controls (3.2 versus 2.3 × 10⁻⁸), but hprt mutant frequencies were not different 8.6 versus 8.4 × 10⁻⁶). Although group mean mutant frequencies were not different, both adduct level and mutagenicity were highest among the 16 most exposed and mutant frequency was significantly correlated with adduct level. All individuals were genotyped for glutathione transferase GSTM1 and aromatic amino transferase NAT2 polymorphism. Neither GSTM1 nulls nor NAT2 slow acetylators exhibited effects on either DNA adducts or hprt mutant frequencies.
4.2. CHROMOSOME EFFECTS Mitchell et al. (1981) and Brooks et al. (1984) reported increases in sister chromatid
exchanges (SCE) in CHO cells exposed to DPM extracts of emissions from both LD and HD diesel engines. Morimoto et al. (1986) observed increased SCE from both LD and HD DPM extracts in PAH-stimulated human lymphocyte cultures. Tucker et al. (1986) exposed human peripheral lymphocyte cultures from four donors to direct DE for up to 3 h. Exhaust was cooled by pumping through a plastic tube about 20 feet long; airflow was 1.5 L/min. Samples were taken at 16, 48, and 160 min of exposure. Cell cycle delay was observed in all cultures; significantly increased SCE levels were reported for two of the four cultures. Structural chromosome aberrations were induced in CHO cells by DPM extracts from a Nissan diesel engine (Lewtas, 1983) but not by similar extracts from an Oldsmobile diesel engine (Brooks et al., 1984).
DPM dispersed in an aqueous mixture containing dipalmitoyl lecithin (DPL), a component of pulmonary surfactant or extracted with dichloromethane (DCM) induced similar
4-5

responses in SCE assays in Chinese hamster V79 cells (Keane et al., 1991), micronucleus tests in V79 and CHO cells (Gu et al., 1992), and unscheduled DNA synthesis (UDS) in V79 cells (Gu et al., 1994). After separating the samples into supernatant and sediment fractions, mutagenic activity was confined to the sediment fraction of the DPL sample and the supernatant of the DCM sample. These findings suggest that the mutagenic activity of DPM inhaled into the lungs could be made bioavailable through solubilization and dispersion of pulmonary surfactants. In a later study in the same laboratory, Liu et al. (1996) found increased micronuclei in V79 cells treated with crystalline quartz and a noncrystalline silica, but response was reduced after pretreatment of the particles with the simulated pulmonary surfactant.
Pereira et al. (1981a) exposed female Swiss mice to DE 8 h/day, 5 days/week for 1, 3, and 7 weeks. The incidence of micronuclei and structural aberrations was similar in bone marrow cells of both control and exposed mice. Increased incidences of micronuclei, but not SCE, were observed in bone marrow cells of male Chinese hamsters after 6 months of exposure to DE (Pereira et al., 1981b).
Guerrero et al. (1981) observed a linear concentration-related increase in SCE in lung cells cultured after intratracheal instillation of DPM at doses up to 20 mg/hamster. However, they did not observe any increase in SCE after 3 months of inhalation exposure to DE particles (6 mg/m3).
Pereira et al. (1982) measured SCE in embryonic liver cells of Syrian hamsters. Pregnant females were exposed to DE diluted with air 1:9 to contain about 12 mg/m3 particles from days 5 to 13 of gestation or injected intraperitoneally with diesel particles or particle extracts on gestational day 13 (18 h before sacrifice). Neither the incidence of SCE nor mitotic index was affected by exposure to DE. The injection of DPM extracts but not DPM resulted in a dose-related increase in SCE; however, the toxicity of the DPM was about twofold greater than the DPM extract.
In the only studies with mammalian germ cells, Russell et al. (1980) reported no increase in either dominant lethals or heritable translocations in males of T-stock mice exposed by inhalation to diesel emissions. In the dominant lethal test, T-stock males were exposed for 7.5 weeks and immediately mated to females of different genetic backgrounds (T-stock; [C3H × 101]; [C3H × C57BL/6]; [SEC × C57BL/6]). There were no differences from controls in any of the parameters measured in this assay. For heritable translocation analysis, T-stock males were exposed for 4.5 weeks and mated to (SEC × C57BL/6) females, and the F1 males were tested for the presence of heritable translocations. Although no translocations were detected among 358 progeny tested, the historical control incidence is less than 1/1,000.
4-6

4.3. OTHER GENOTOXIC EFFECTS Pereira et al. (1981b) exposed male strain A mice to DE emissions for 31 or 39 weeks
using the same exposure regimen noted in the previous section. Analyses of caudal sperm for sperm-head abnormalities were conducted independently in three separate laboratories. Although the incidence of sperm abnormalities was not significantly above controls in any of the three laboratories, there were extremely large differences in scoring among the three (control values were 9.2%, 14.9%, and 27.8% in the three laboratories). Conversely, male Chinese hamsters exposed for 6 mo (Pereira et al., 1981c) exhibited almost a threefold increase in sperm-head abnormalities. It is noted that the control incidence in the Chinese hamsters was less than 0.5%. Hence, it is not clear whether the differing responses reflect true species differences or experimental artifacts.
A number of studies measuring DNA adducts in animals exposed to DPM, carbon black or other particles have been reported and are reviewed by Shirnamé-Moré (1995). Although modest increases in DNA adducts have been observed in lung tissue of rats after inhalation of DPM (Wong et al., 1986; Bond et al., 1990), the magnitude of the increases is small in comparison with those induced by chemical carcinogens present in DE (Smith et al., 1993). While Gallagher et al. (1994) found no increases in total DNA adducts in lung tissue of rats exposed to DE, carbon black, or titanium dioxide they did observe an increase in an adduct with migration properties similar to nitrochrysene and nitro-benzo(a)pyrene adducts from diesel but not carbon black or titanium dioxide exposures. The majority of the studies used the 32P-postlabeling assay to detect adducts. Although this method is sensitive, chemical identity of adducts can only be inferred if an adduct spot migrates to the same location as a known prepared adduct.
DNA adducts have also been measured in humans occupationally exposed to DE. Distinct adduct patterns were found among garage workers occupationally exposed to DE when compared to nonexposed controls (Nielsen and Autrup, 1994). Furthermore, the findings were concordant with the adduct patterns observed in groups exposed to low concentrations of PAHs from combustion processes. Hemminki et al. (1994) also reported significantly elevated levels of DNA adducts in lymphocytes from garage workers with known DE exposure compared with unexposed mechanics. Hou et al. (1995) found elevated adduct levels in bus maintenance workers exposed to DE. Although no difference in mutant frequency was observed between the groups, the adduct levels were significantly different (3.2 vs. 2.3 × 10⁻⁸). Nielsen et al. (1996) reported significantly increased levels of three biomarkers (lymphocyte DNA adducts, hydroxyethylvaline adducts in hemoglobin, and 1-hydroxypyrene in urine) in DE-exposed bus garage workers.
4-7
The role of oxidative damage in causing mutations has received increasing focus recently. More than 50 different chemicals have been studied in rodents usually measuring the formation of 8-hydroxydeoxyguanosine (8-OH-dG), a highly mutagenic adduct (Loft et al., 1998). Increases in the mutagenic DNA adduct 8-hydroxydeoxyguanosine were found in mouse lung DNA after intratracheal instillation of diesel particles (Nagashima et al., 1995). The response was dose dependent. Mice fed on a high-fat diet showed an increased response whereas the responses were partially reduced when the antioxidant, $-carotene, was included in the diet (Ichinose et al., 1997). Oxidative damage also has been measured in rat lung tissue after intratracheal instillation of quartz (Nehls et al., 1997) and in rat alveolar macrophages after in vitro treatment with silica dust (Zhang et al., 2000). Arimoto et al. (1999) demonstrated that redissolved methanol extracts of DPM also induced the formation of 8-OH-dG adducts in L120 mouse cells. The response was dependent on both DPM concentration and P450 reductase. A detailed discussion of the potential role of oxidative damage in DE carcinogenesis is presented in Chapter 7, Section 7.4.
4.4. SUMMARY AND DISCUSSION Extensive studies with salmonella have unequivocally demonstrated mutagenic activity
in both particulate and gaseous fractions of DE. In most of the studies using salmonella, DPM extracts and individual nitropyrenes exhibited the strongest responses in strain TA98 when no exogenous activation was provided. Gaseous fractions reportedly showed greater response in TA100, whereas benzo[a]pyrene and other unsubstituted PAHs are mutagenic only in the presence of S9 fractions. The induction of gene mutations has been reported in several in vitro mammalian cell lines after exposure to extracts of DPM. Note that only the TK6 human cell line did not give a positive response to DPM extracts in the absence of S9 activation. Mutagenic activity was recovered in urine from animals treated with DPM by gastric intubation and i.p. and s.c. implants, but not by inhalation of DPM or diluted diesel exhaust. Dilutions of whole diesel exhaust did not induce sex-linked recessive lethals in drosophila or specific-locus mutations in male mouse germ cells.
Structural chromosome aberrations and SCE in mammalian cells have been induced by particles and extracts. Whole exhaust induced micronuclei but not SCE or structural aberrations in bone marrow of male Chinese hamsters exposed to whole diesel emissions for 6 mo. In a shorter exposure (7 weeks), neither micronuclei nor structural aberrations were increased in bone marrow of female Swiss mice. Likewise, whole DE did not induce dominant lethals or heritable translocations in male mice exposed for 7.5 and 4.5 weeks, respectively.
The application of mutagenicity data to the question of the potential carcinogenicity of diesel emissions is based on the premise that genetic alterations are found in all cancers and that
4-8
several of the chemicals found in diesel emissions possess mutagenic activity in a variety of genetic assays. These genetic alterations can be produce by gene mutations, deletions, translocations, aneuploidy, or amplification of genes, hence no single genotoxicity assay should be expected to either qualitatively or quantitatively predict rodent carcinogenicity. With diesel emissions or other mixtures, additional complications arise because of the complexity of the material being tested. Exercises that combined the salmonella mutagenic potency with the total concentration of mutagenic chemicals deposited in the lungs could not account for the observed tumor incidence in exposed rats (Rosenkranz, 1993; Goldstein et al., 1998). However, such calculations ignored the contribution of gaseous phase chemicals which have been estimated to contribute from less than 50% (Rannug et al., 1983) to over 90% (Matsushita et al., 1986) of the total mutagenicity. This wide range is partly reflective of the differences in material tested, semivolatile extracts in the former and whole gaseous emission in the latter. Of greater importance is that these calculations are based on a reverse mutation assay in bacteria with metabolic processes strikingly different from mammals. This is at least partly reflected in the observations that different nitro-PAHs give different responses in bacteria and in CHO cells (Li and Dutcher, 1983) or in human hepatoma-derived cells (Eddy et al., 1986).
REFERENCES FOR CHAPTER 4
Albert, RE; Lewtas, J; Nesnow, S; et al. (1983) Comparative potency method for cancer risk assessment: application to diesel particulate emissions. Risk Anal 3:101-117.
Arimoto, T; Yoshikawa, T; Takano, H; et al. (1999) Generation of reactive oxygen species and 8-hydroxy-2'-deoxyguanosine formation from diesel exhaust particle components in L1210 cells. Jpn J Pharmacol 80:49-54.
Barfknecht, TR; Hites, RA; Cavaliers, EL; et al. (1982) Human cell mutagenicity of polycyclic aromatic hydrocarbon components of diesel emissions. In: Toxicological effects of emissions from diesel engines: proceedings of the Environmental Protection Agency 1981 diesel emissions symposium; October 1981; Raleigh, NC. (Developments on toxicology and environmental science: v. 10.) Lewtas, J, ed. New York: Elsevier Biomedical; pp. 277-294.
Belisario, MA; Buonocore, V; De Marinis, E; et al. (1984) Biological availability of mutagenic compounds adsorbed onto diesel exhaust particulate. Mutat Res 135:1-9.
Bond, JA; Mauderly, JL; Wolff, RK. (1990) Concentration- and time-dependent formation of DNA adducts in lungs of rats exposed to diesel exhaust. Toxicology 60:127-135.
Brooks, A; Li, AP; Dutcher, JS; et al. (1984) A comparison of genotoxicity of automobile exhaust particles from laboratory and environmental sources. Environ Mutagen 6:651-668.
Brusick, D. (1987) Principles of genetic toxicology. New York; Plenum Press.
Casto, BC; Hatch, GG; Huang, SL; et al. (1981) Mutagenic and carcinogenic potency of extracts of diesel and related environmental emissions: in vitro mutagenesis and oncogenic transformation. Environ Int 5:403-409.
4-9

Chescheir, GM, III; Garrett, NE; Shelburne, JD; et al. (1981) Mutagenic effects of environmental particulates in the CHO/HGPRT system. In: Application of short-term bioassays in the fractionation and analysis of complex environmental mixtures. Waters, MD; Sandhu, SS; Huisingh, JL; et al., eds. New York: Plenum Press; pp. 337-350.
Claxton, LD. (1981) Mutagenic and carcinogenic potency of diesel and related environmental emissions: Salmonella bioassay. Environ Int 5:389-391.
Claxton, LD. (1983) Characterization of automotive emissions by bacterial mutagenesis bioassay: a review. Environ Mutagen 5:609-631.
Claxton, L; Kohan, M. (1981) Bacterial mutagenesis and the evaluation of mobile-source emissions. In: Short-term bioassays in the analysis of complex environmental mixtures II: proceedings of the second symposium on the application of short-term bioassays in the fractionation and analysis of complex environmental mixtures; March 1980; Williamsburg, VA. (Hollaender, A; Welch, BL; Probstein, RF, eds. Environmental science research series: v. 22.) Waters, MD; Sandhu, SS; Huisingh, JL; et al., eds. New York: Plenum Press; pp. 299-317.
Crebelli, R; Conti, L; Crochi, B; et al. (1995) The effect of fuel composition on the mutagenicity of diesel engine exhaust. Mutat Res 346:167-172.
Curren, RD; Kouri, RE; Kim, DM; et al. (1981) Mutagenic and carcinogenic potency of extracts from diesel related environmental emissions: simultaneous morphological transformation and mutagenesis in BALB/c 3T3 cells. Environ Int 5:411-415.
Driscoll, KE; Carter, JM; Howard, BW; et al. (1996) Pulmonary inflammatory, chemokine, and mutagenic responses in rats after subchronic inhalation of carbon black. Toxicol Appl Pharmacol 136:372-380.
Driscoll, KE; Deyo, KC; Carter, JM; et al. (1997) Effects of particle exposure and particle-elicited inflammatory cells on mutation in rat alveolar epithelial cells. Carcinogenesis 18:423-430.
Dukovich, M; Yasbin, RE; Lestz, SS; et al. (1981) The mutagenic and SOS-inducing potential of the soluble organic fraction collected from diesel particulate emissions. Environ Mutagen 3:253-264.
Eddy, EP; McCoy, EC; Rosenkranz, HS; et al. (1986) Dichotomy in the mutagenicity and genotoxicity of nitropyrenes: apparent effect of the number of electrons involved in nitroreduction. Mutat Res 161:109-111.
Gallagher, J; Heinrich, U; George, M; et al. (1994) Formation of DNA adducts in rat lung following chronic inhalation of diesel emissions, carbon black and titanium dioxide particles. Carcinogenesis 15:1291-1299.
Goldstein, LS; Weyand, EH; Safe, S; et al. (1998) Tumors and DNA adducts in mice exposed to benzo[a]pyrene and coal tars: implications for risk assessment. Environ Health Perspect 106 Suppl 6:1325-1330.
Gu, ZW; Zhong, BZ; Nath, B; et al. (1992) Micronucleus induction and phagocytosis in mammalian cells treated with diesel emission particles. Mutat Res 279:55-60.
Gu, ZW; Zhong, BZ; Keane, MJ; et al. (1994) Induction of unscheduled DNA synthesis in V70 cells by diesel emission particles dispersed in simulated pulmonary surfactant. Ann Occup Hyg 38:345-349.
Guerrero, RR; Rounds, DE; Orthoefer, J. (1981) Sister chromatid exchange analysis of Syrian hamster lung cells treated in vivo with diesel exhaust particulates. Environ Int 5:445-454.
Hemminki, K; Söderling, J; Ericson, P; et al. (1994) DNA adducts among personnel servicing and loading diesel vehicles. Carcinogenesis 15:767-769.
Hinners, RG; Burkart, JK; Malanchuk, M. (1980) Facilities for diesel exhaust studies. In: Health effects of diesel engine emissions: proceedings of an international symposium; December 1979. Pepelko, WE; Danner, RM; Clarke,
4-10
NA, eds. Cincinnati, OH: U.S. Environmental Protection Agency, Health Effects Research Laboratory; pp. 681-697; EPA report no. EPA-600/9-80-057b. Available from: NTIS, Springfield, VA; PB81-173817.
Hou, S; Lambert, B; Hemminki, K. (1995) Relationship between hprt mutant frequency, aromatic DNA adducts and genotypes for GSTM1 and NAT2 in bus maintenance workers. Carcinogensis 16:1913-1917.
Huisingh, J; Bradow, R; Jungers, R; et al. (1978) Application of bioassay to the characterization of diesel particle emissions. In: Application of short-term bioassays in the fractionation and analysis of complex environmental mixtures: [proceedings of a symposium; February; Williamsburg, VA]. (Hollaender, A; Probstein, F; Welch, BL, eds. Environmental science research: v. 15.) Waters, MD; Nesnow, S; Huisingh, JL; et al., eds. New York: Plenum Press; pp. 383-418.
IARC (International Agency for Research on Cancer). (1989) Diesel and gasoline engine exhausts and some nitroarenes. (IARC monographs on the evaluation of carcinogenic risks to humans: v. 46). Lyon, France: World Health Organization; pp. 41-185.
Ichinose, T; Yajima, Y; Nagashima, M; et al. (1997) Lung carcinogenesis and formation of 8-hydroxy-deoxyguanosine in mice by diesel exhaust particles. Carcinogenesis 18:185-192.
Ishinishi, N; Koizumi, A; McClellan, RO; et al., eds. (1986) Carcinogenic and mutagenic effects of diesel engine exhaust: proceedings of the international satellite symposium on toxicological effects of emissions from diesel engines; July; Tsukuba Science City, Japan. (Developments in toxicology and environmental science: v. 13.) Amsterdam: Elsevier Science Publishers BV.
Keane, MJ; Xing, SG; Harrison, JC; et al. (1991) Genotoxicity of diesel-exhaust particles dispersed in simulated pulmonary surfactant. Mutat Res 260:233-238.
Lewtas, J. (1982) Mutagenic activity of diesel emissions. In: Toxicological effects of emissions from diesel engines: proceedings of the Environmental Protection Agency 1981 diesel emissions symposium; October 1981; Raleigh, NC. (Developments in toxicology and environmental science: v. 10.) Lewtas, J, ed. New York: Elsevier Biomedical; pp. 243-264.
Lewtas, J. (1983) Evaluation of the mutagenicity and carcinogenicity of motor vehicle emissions in short-term bioassays. Environ Health Perspect 47:141-152.
Li, AP; Dutcher, JS. (1983) Mutagenicity of mono-, di-, and tri-nitropyrenes in Chinese hamster ovary cells. Mutat Res 119:387-392.
Li, AP; Royer, RE. (1982) Diesel-exhaust-particle extract enhancement of chemical-induced mutagenesis in cultured Chinese hamster ovary cells: possible interaction of diesel exhaust with environmental chemicals. Mutat Res 103:349-355.
Liber, HL; Andon, BM; Hites, RA; et al. (1981) Diesel soot: mutation measurements in bacterial and human cells. Environ Int 5:281-284.
Liberti, A; Ciccioli, P; Cecinato, A; et al. (1984) Determination of nitrated-polyaromatic hydrocarbons (nitro-PAHs) in environmental samples by high resolution chromatographic techniques. J High Resolut Chromatogr Commun 7:389-397.
Liu, X; Keane, MJ; Zong, BZ; et al. (1996) Micronucleus formation in V79 cells treated with respirable silica dispersed in medium and simulated pulmonary surfactant. Mutat Res 361:89-94.
Loft, S; Deng, XS; Tuo, J; et al. (1998) Experimental study of oxidative DNA damage. Free Radical Res 29:525-539.
4-11
Matsushita, H; Goto, S; Endo, O; et al. (1986) Mutagenicity of diesel exhaust and related chemicals. In: Carcinogenic and mutagenic effects of diesel engine exhaust: proceedings of the international satellite symposium on toxicological effects of emissions from diesel engines; July; Tsukuba Science City, Japan. (Developments on toxicology and environmental science: v. 13.) Ishinishi, N; Koizumi, A; McClellan, RO; et al., eds. Amsterdam: Elsevier Science Publishers BV; pp. 103-118.
Mitchell, AD; Evans, EL; Jotz, MM; et al. (1981) Mutagenic and carcinogenic potency of extracts of diesel and related environmental emissions: in vitro mutagenesis and DNA damage. Environ Int 5:393-401.
Morimoto, K; Kitamura, M; Kondo, H; et al. (1986) Genotoxicity of diesel exhaust emissions in a battery of in-vitro short-term bioassays. In: Carcinogenic and mutagenic effects of diesel engine exhaust: proceedings of the international satellite symposium on toxicological effects of emissions from diesel engines; July; Tsukuba Science City, Japan. (Developments in toxicology and environmental science: v. 13.) Ishinishi, N; Koizumi, A; McClellan, RO; et al., eds. Amsterdam: Elsevier Science Publishers BV; pp. 85-102.
Nakagawa, R; Kitamori, S; Horikawa, K; et al. (1983) Identification of dinitropyrenes in diesel-exhaust particles: their probable presence as the major mutagens. Mutat Res 124:201-211.
Nagashima, M; Kasai, H; Yokota, J; et al. (1995) Formation of an oxidative DNA damage, 8-hydroxydeoxyguanosine, in mouse lung DNA after intratracheal instillation of diesel exhaust particles and effects of high dietary fat and beta-carotene on this process. Carcinogenesis 16:1441-1445.
Nehls, P; Seiler, F; Rehn, B; et al. (1997) Formation and persistence of 8-oxoguanine in rat lung cells as an important determinant in tumor formation following particle exposure. Environ Health Perspect 105(5):1291-1296.
Nielsen, PS; Autrup, H. (1994) Diesel exhaust-related DNA adducts in garage workers. Clin Chem 40:1456-1458.
Nielsen, PS; Andreassen, Å; Farmer, PB; et al. (1996) Biomonitoring of diesel-exhaust exposed workers. DNA and hemoglobin adducts and urinary 1-hydroxyproline as markers of exposure. Toxicol Lett 86:27-37.
Nishioka, MG; Petersen, BA; Lewtas, J. (1982) Comparison of nitro-aromatic content and direct-acting mutagenicity of diesel emissions. In: Polynuclear aromatic hydrocarbons: physical and biological chemistry. Cooke, M; Dennis, AJ; Fisher, GL, eds. Columbus, OH: Battelle Press; pp. 603-613.
Ong, T; Whong, WZ; Xu, J; et al. (1985) Genotoxicity studies of rodents exposed to coal dust and diesel emission particulates. Environ Res 37:399-409.
Pepelko, WE; Peirano, WB. (1983) Health effects of exposure to diesel engine emissions: a summary of animal studies conducted by the U.S. Environmental Protection Agency's Health Effects Research Laboratories at Cincinnati, Ohio. J Am Coll Toxicol 2:253-306.
Pereira, MA; Connor, TH; Meyne, J; et al. (1981a) Metaphase analysis, micronucleus assay and urinary mutagenicity assay of mice exposed to diesel emissions. Environ Int 5:435-438.
Pereira, MA; Sabharwal, PS; Gordon, L; et al. (1981b) The effect of diesel exhaust on sperm-shape abnormalities in mice. Environ Int 5:459-460.
Pereira, MA; Sabharwal, PS; Kaur, P; et al. (1981c) In vivo detection of mutagenic effects of diesel exhaust by short-term mammalian bioassays. Environ Int 5:439-443.
Pereira, MA; McMillan, L; Kaur, P; et al. (1982) Effect of diesel exhaust emissions, particulates, and extract on sister chromatid exchange in transplacentally exposed fetal hamster liver. Environ Mutagen 4:215-220.
Rannug, U; Sundvall, A; Westerholm, R; et al. (1983) Some aspects of mutagenicity testing of the particulate phase and the gas phase of diluted and undiluted automobile exhaust. Environ Sci Res 27:3-16.
4-12

Rosenkranz, HS. (1993) Revisiting the role of mutagenesis in the induction of lung tumors in rats by diesel emissions. Mutat Res 303:91-95.
Russell, LB; Generoso, WM; Oakberg, EF; et al. (1980) Tests for heritable effects induced by diesel exhaust in the mouse. Martin Marietta Energy Systems, Inc., Oak Ridge National Laboratory; report no. ORNL-5685.
Sato, H; Sone, H; Sagai, M; et al. (2000) Increase in mutation frequency in lung of Big Blue(R) rat by exposure to diesel exhaust. Carcinogenesis 21:653-661.
Salmeen, I; Durisin, AM; Prater, TJ; et al. (1982) Contribution of 1-nitropyrene to direct-acting Ames assay mutagenicities of diesel particulate extracts. Mutat Res 104:17-23.
Schuetzle, D; Frazier, JA. (1986) Factors influencing the emission of vapor and particulate phase components from diesel engines. In: Carcinogenic and mutagenic effects of diesel engine exhaust: proceedings of the international satellite symposium on toxicological effects of emissions from diesel engines; July; Tsukuba Science City, Japan. (Developments in toxicology and environmental science: v. 13.) Ishinishi, N; Koizumi, A; McClellan, RO; et al., eds. Amsterdam: Elsevier Science Publishers BV; pp. 41-63.
Schuetzle, D; Lewtas, J. (1986) Bioassay-directed chemical analysis in environmental research. Anal Chem 58:1060A-1076A.
Schuetzle, D; Perez, JM. (1983) Factors influencing the emissions of nitrated-polynuclear aromatic hydrocarbons (nitro-PAH) from diesel engines. J Air Pollut Control Assoc 33:751-755.
Schuler, RL; Niemeier, RW. (1981) A study of diesel emissions on Drosophila. Environ Int 5:431-434.
Shirnamé-Moré, L. (1995) Genotoxicity of diesel emissions. Part I: Mutagenicity and other genetic effects. Diesel exhaust: a critical analysis of emissions, exposure, and health effects. A special report of the Institute's Diesel Working Group. Cambridge, MA: Health Effects Institute, pp. 222-242.
Siak, JS; Chan, TL; Lees, PS. (1981) Diesel particulate extracts in bacterial test systems. Environ Int 5:243-248.
Sjögren, M; Li, H; Banner, C; et al. (1996) Influence of physical and chemical characteristics of diesel fuels and exhaust emissions on biological effects of particle extracts: a multivariate statistical analysis of ten diesel fuels. Chem Res Toxicol 9:197-207.
Smith, BA; Fullerton, NF; Aidoo, A; et al. (1993) DNA adduct formation in relation to lymphocyte mutations and lung tumor induction in F344 rats treated with the environmental pollutant 1,6- dinitropyrene. Environ Health Perspect 99:277-280.
Tucker, JD; Xu, J; Stewart, J; et al. (1986) Detection of sister chromatid exchanges induced by volatile genotoxicants. Teratogen Carcinogen Mutagen 6:15-21.
U.S. Environmental Protection Agency (EPA). (1980) Health effects of diesel engine emissions: proceedings of an international symposium. Cincinnati, OH: Office of Research and Development; EPA 600/9-80/057b.
Wong, D; Mitchell, CE; Wolff, RK; et al. (1986) Identification of DNA damage as a result of exposure of rats to diesel engine exhaust. Carcinogenesis 7:1595-1597.
Zhang, Z; Shen, HM; Zhang, QF; et al. (2000) Involvement of oxidative stress in crystalline silica-induced cytotoxicity and genotoxicity in rat alveolar macrophages. Environ Res 82:245-252.
4-13
5-1
5. NONCANCER HEALTH EFFECTS OF DIESEL EXHAUST
The objective of this chapter is to review and evaluate potential health effects other than
cancer associated with inhalation exposure to diesel engine exhaust (DE). Data have been
obtained from diverse human, laboratory animal, and in vitro test systems. The human studies
comprise both occupational and human experimental exposures, the former consisting of
exposure to DE in the occupational environment, and the latter consisting of exposure to diluted
DE or diesel particulate matter (DPM) under controlled conditions. The laboratory animal
studies consist of both acute and chronic exposures of laboratory animals to DE or DPM.
Diverse in vitro test systems composed of human and laboratory animal cells treated with DPM
or components of DPM have also been used to investigate the effects of DPM at the cellular and
molecular levels. DPM mass (mg/m3) has been used almost exclusively as a measure of DE
exposure in human and experimental studies. The noncancer health effects of DPM have been
reviewed previously by the Health Effects Institute (HEI, 1995) and in the Air Quality for
Particulate Matter Criteria Document, the PM CD (U.S. EPA, 1996). The noncancer health
effects attributable to ambient particulate matter (PM), which is composed in part of DPM, as
well as the potential mechanisms underlying these effects have also been previously reviewed in
the PM CD (U.S. EPA, 1996) and have been summarized in this document in Chapter 6, Section
6.4.
This chapter begins with descriptions of studies that have shown various health effects
occurring as a result of exposure to DE/DPM (Section 5.1). The human studies portion of this
section (5.1.1) discusses results from both short-term and long-term studies as well as
specialized studies such as those of populations contiguous to major highways (5.1.2). Studies
using laboratory animals are ordered into various subsections under Section 5.1.3.
Investigations devoted to elucidating the possible modes of action of DE/DPM are covered in
Section 5.2; the mode-of-action issue of particle overload in animals is discussed elsewhere in
the document (Chapter 3, Section 3.4). Section 5.3 describes evidence for the various
interactions of DPM with other conditions such as disease. Other sections address issues such as
species-comparative responses to DE/DPM (Section 5.4) and influence of dose rate (Section
5.5). The summary/conclusion of this chapter, relating the totality of this information to
possible human effects of DE/DPM, is in Section 5.6.

5-2
5.1. HEALTH EFFECTS OF WHOLE DIESEL EXHAUST
5.1.1. Human Studies
5.1.1.1. Short-Term Exposures
In a controlled human study, Rudell et al. (1990, 1994) exposed eight healthy subjects in
an exposure chamber to diluted exhaust from a diesel engine for 1 h, with intermittent exercise.
Dilution of the DE was controlled to provide a median NO2 level of approximately 1.6 ppm.
Median particle number was 4.3 × 10⁶/cm3, and median levels of NO and CO were 3.7 and 27
ppm, respectively (particle size and mass concentration were not provided). There were no
effects on spirometry or on closing volume using nitrogen washout. Five of eight subjects
experienced unpleasant smell, eye irritation, and nasal irritation during exposure.
Bronchoalveolar lavage (BAL) was performed 18 hours after exposure and was compared with a
control BAL performed 3 weeks prior to exposure; there was no control air exposure. Small but
statistically significant reductions were seen in numbers of BAL mast cells, extent of AM
phagocytosis of opsonized yeast particles, and lymphocyte CD4/CD8 ratios. A small increase in
recovery of polymorphonuclear cells (PMNs) was also observed. These findings suggest that
DE may induce mild airway inflammation in the absence of spirometric changes. This study
provides an intriguing glimpse of the effect of DE exposure in humans, but only one exposure
level was used, the number of subjects was low, and a limited range of endpoints was reported,
so the data are inadequate to generalize about the human response.
Rudell et al. (1996) exposed volunteers to DE for 1 h in an exposure chamber. Light
work on a bicycle ergometer was performed during exposure. Exposures included either DE or
exhaust with particle numbers reduced 46% by a particle trap. The engine used was a new
Volvo model 1990, a six-cylinder direct-injection turbocharged diesel with an intercooler, which
was run at a steady speed of 900 rpm during the exposures. Comparison of this study with
others was difficult because neither exhaust dilution ratios nor particle concentrations were
reported. Carbon monoxide concentrations of 27-30 ppm and NO of 2.6-2.7 ppm, however,
suggested DPM concentrations may have equaled several mg/m3. The most prominent
symptoms during exposure were irritation of the eyes and nose and an unpleasant smell. Both
airway resistance and specific airway resistance increased significantly during the exposures.
Despite the 46% reduction in particle numbers by the trap, effects on symptoms and lung
function were not significantly attenuated.
Nordenhall et al. (2000) had 15 healthy human subjects (13 males, 2 females) breathe in
an exposure chamber diluted DE from an idling diesel engine to give a PM10 concentration of
300 :g/m3, which was also associated with a median steady-state NO2 concentration of 1.6 ppm.

5-3
Exposures were for 1 h, with each individual serving as their own control by being exposed to
filtered air, also for 1 h but at a different time. Sputum production was then induced and sputum
examined at 6 and 24 hr postexposure (for both air and DPM) with differential cell counts and
soluble protein counts performed. In comparing the same individual’s results after exposure to
air and after exposure to DE, increases were found in the percentage of sputum neutrophiles
(37.7% vs. 26.2%) after 6 hr, along with increases in concentrations of the soluble proteins
interleukin-6 (12.0 vs. 6.3 pg/mL) and methylhistamine (0.11 vs. 0.12 ug/L). These differences
between air and DPM were not present at 24 hr. Thus, breath exposure to DE produces early
induction of an inflammatory response in healthy humans that can be detected using sputum
analysis.
Wade and Newman (1993) describe the situation of three railroad workers who
developed persistent asthma associated with overexposure to DE from locomotives. The
overexposure was a consequence of multiple hours of high levels of diesel exposure from riding
in locomotive units trailing immediately behind the lead locomotive. Lines of evidence
supporting railroad locomotive DE inducing asthma in these individuals include, (1) all three
exhibited clear signs of asthma leading (in two of the three cases) to immediate first-time
hospitalization and treatment for asthma, (2) all three developed symptoms within a few hours of
the overexposure, and (3) all three experienced exacerbation of symptoms upon reexposure to
locomotive DE. Although this report and that of Kahn et al. (1988) described below both
provide supporting evidence for DE being able to cause asthma in humans under extreme but
uncharacterized conditions, both suffer from the same limitations, including no reliable data on
the concentration of diesel emissions and associated gaseous components, the duration of the
exposures, or information on others that were exposed under these conditions but who did not
develop asthma symptoms.
Kahn et al. (1988) reported the occurrence of 13 cases of acute overexposure to DE
among Utah and Colorado coal miners. Twelve miners had symptoms of mucous membrane
irritation, headache, and lightheadedness. Eight individuals reported nausea; four reported a
sensation of unreality; four reported heartburn; three reported weakness, numbness, and tingling
in their extremities; three reported vomiting; two reported chest tightness; and two others
reported wheezing. Each miner lost time from work because of these symptoms, which resolved
within 24 to 48 h. No air monitoring data were presented; poor work practices were described as
the predisposing conditions for overexposure. No follow-up was available for these exposed
individuals.
El Batawi and Noweir (1966) reported that among 161 workers from two garages where
diesel-powered buses were serviced and repaired, 42% complained of eye irritation, 37% of
headaches, 30% of dizziness, 19% of throat irritation, and 11% of cough and phlegm. Ranges of

5-4
mean concentrations of DE components in the two diesel bus garages were as follows: 0.4 to 1.4
ppm NO2, 0.13 to 0.81 ppm SO2, 0.6 to 44.1 ppm aldehydes, and 1.34 to 4.51 mg/m3 of DPM;
the highest concentrations were obtained close to the exhaust systems of the buses.
Eye irritation was reported by Battigelli (1965) in six subjects after 40 s of chamber
exposure to diluted DE containing 4.2 ppm NO2, 1 ppm SO2, 55 ppm CO, 3.2 ppm total
hydrocarbons, and 1 to 2 ppm total aldehydes; after 3 min and 20 s of exposure to diluted DE
containing 2.8 ppm NO2, 0.5 ppm SO2, 30 ppm CO, 2.5 ppm total hydrocarbons, and <1 to 2
ppm total aldehydes; and after 6 min of exposure to diluted DE containing 1.3 ppm NO2, 0.2
ppm SO2, <20 ppm CO, <2.0 ppm total hydrocarbons, and <1.0 ppm total aldehydes. The
concentration of DPM was not reported.
Katz et al. (1960) described the experience of 14 chemists and their assistants monitoring
the environment of a train tunnel used by diesel-powered locomotives. Although workers
complained on three occasions of minor eye and throat irritation, no correlation was established
with concentrations of any particular component of DE.
The role of radicals generated from particulate matter, including DPM, in producing
toxicity has been discussed in the literature (Valavanidis et al., 2000), as has the role of
antioxidant defenses in protecting against species such as radicals that may arise from acute DE
exposure. Blomberg et al. (1998) investigated changes in the antioxidant defense network
within the respiratory tract lining fluids of human subjects following DE exposure. Fifteen
healthy, nonsmoking, asymptomatic subjects were exposed to filtered air or DE (DPM 300
:g/m3) for 1 h on two separate occasions at least 3 weeks apart. Nasal lavage fluid and blood
samples were collected prior to, immediately after, and 5 ½ h post exposure. Bronchoscopy was
performed 6 h after the end of DE exposure. Nasal lavage ascorbic acid concentration increased
tenfold during DE exposure, but returned to basal levels 5.5 h postexposure. DE had no
significant effects on nasal lavage uric acid or GSH concentrations, and did not affect plasma,
bronchial wash, or bronchoalveolar lavage antioxidant concentrations, nor malondialdehyde or
protein carbonyl concentrations. The authors concluded that the physiological response to acute
DE exposure is an acute increase in the level of the antioxidant ascorbic acid in the nasal cavity.
5.1.1.1.1. Diesel exhaust odor. The odor of DE is considered by most people to be
objectionable; at high intensities, it may produce sufficient physiological and psychological
effects to warrant concern for public health. The intensity of the odor of DE is an exponential
function of its concentration such that a tenfold change in the concentration will alter the
intensity of the odor by one unit. Two human panel rating scales have been used to measure DE
odor intensity. In the first (Turk, 1967), combinations of odorous materials were selected to
simulate DE odor; a set of 12 mixtures, each having twice the concentration of that of the

5-5
previous mixture, is the basis of the diesel odor intensity scale (D-scale). The second method is
the TIA (total intensity of aroma) scale based on seven steps, ranging from 0 to 3, with 0 being
undetectable, ½ very slight, and 1 slight and increasing in one-half units up to 3, strong (Odor
Panel of the CRC-APRAC Program Group on Composition of Diesel Exhaust, 1979; Levins,
1981).
Surveys, utilizing volunteer panelists, have been taken to evaluate the general public’s
response to the odor of DE. Hare and Springer (1971) and Hare et al. (1974) found that at a D
rating of about 2 (TIA = 0.9, slight odor intensity), about 90% of the participants perceived the
odor, and almost 60% found it objectionable. At a D rating of 3.2 (TIA = 1.2, slight to moderate
odor intensity), about 95% perceived the odor, and 75% objected to it, and, at a D rating of 5
(TIA = 1.8, almost moderate), about 95% objected to it.
Linnell and Scott (1962) reported odor threshold measurement in six subjects and found
that the dilution factor needed to reach the threshold ranged from 140 to 475 for this small
sample of people. At these dilutions, the concentrations of formaldehyde ranged from 0.012 to
0.088 ppm.
5.1.1.1.2. Pulmonary and respiratory effects. Battigelli (1965) exposed 13 volunteers to three
dilutions of DE obtained from a one-cylinder, four-cycle, 7-hp diesel engine (fuel type
unspecified) and found that 15-min to 1-h exposures had no significant effects on pulmonary
resistance. Pulmonary resistance was measured by plethysmography utilizing the simultaneous
recording of esophageal pressure and airflow determined by electrical differentiation of the
volume signal from a spirometer. The concentrations of the constituents in the three diluted
exhausts were 1.3, 2.8, and 6.2 ppm NO2; 0.2, 0.5, and 1 ppm SO2; <20, 30, and 55 ppm CO;
and <1.0, <1 to 2, and 1 to 2 ppm total aldehydes, respectively. DPM concentrations were not
reported.
A number of studies have evaluated changes in pulmonary function occurring over a
workshift in workers occupationally exposed to DE (specific time period not always reported but
assumed to be 8 h). In a study of coal miners, Reger (1979) found that both forced expiratory
volume in 1 s (FEV1) and forced vital capacity (FVC) decreased by 0.05 L in 60 diesel-exposed
miners, an amount not substantially different from reductions seen in non-diesel-exposed miners
(0.02 and 0.04 L, respectively). Decrements in peak expiratory flow rates were similar between
diesel and non-DE-exposed miners. Although the monitoring data were not reported, the authors
stated that there was no relationship between the low concentrations of measured respirable dust
or NO2 (personal samplers) when compared with shift changes for any lung function parameter
measured for the diesel-exposed miners. In summary, this study (available as an abstract only)
states that no evidence was found for additional lung function effect over a shift for miners
5-6
exposed to diesel emissions as compared with controls, i.e., nonexposed office workers and coal
miners not exposed to diesel emissions.
Ames et al. (1982) compared the pulmonary function of 60 coal miners exposed to DE
with that of a control group of 90 coal miners not exposed to DE for evidence of acute
respiratory effects associated with exposure to DE. Changes over the workshift in FVC, FEV1,
and forced expiratory flow rate at 50% FVC (FEF50) were the indices for acute respiratory
effects. The environmental concentrations of the primary pollutants were 2.0 mg/m3 respirable
dust (<10 µm MMAD), 0.2 ppm NO2, 12 ppm CO, and 0.3 ppm formaldehyde. The
investigators reported a statistically significant decline in FVC and FEV1 over the workshift in
both the diesel-exposed and comparison groups. Current smokers had greater decrements in
FVC, FEV1, and FEF50 than did ex-smokers and nonsmokers. There was a marked disparity
between the ages and the time spent underground for the two study groups. Diesel-exposed
miners were about 15 years younger and had worked underground for 15 fewer years (4.8 versus
20.7 years) than miners not exposed to DE. The significance to the results of these differences
between the populations is difficult to ascertain.
Except for the expected differences related to age, 120 underground iron ore miners
exposed to DE had no workshift changes in FVC and FEV1 when compared with 120 matched
surface miners (Jörgensen and Svensson, 1970). Both groups had equal numbers (30) of
smokers and nonsmokers. The frequency of bronchitis was higher among underground workers,
much higher among smokers than nonsmokers, and also higher among older than younger
workers. The authors reported that the underground miners had exposures of 0.5 to 1.5 ppm
NO2 and between 3 and 9 mg/m3 particulate matter, with 20% to 30% of the particles <5 µm
MMAD. The majority of the particles were iron ore; quartz was 6% to 7% of the fraction
<5 µm MMAD.
Gamble et al. (1979) measured preshift FEV1 and FVC in 187 salt miners and obtained
peak flow forced expiratory flow rates at 25%, 50%, and 75% of FVC (FEF25, FEF50, or FEF75).
Postshift pulmonary function values were determined from total lung capacity and flows at
preshift percentages of FVC. The miners were exposed to mean NO2 levels of 1.5 ppm and
mean respirable particulate levels of 0.7 mg/m3. No statistically significant changes were found
between changes in pulmonary function and in NO2 and respirable particles combined. Slopes
of the regression of NO2 and changes in FEV1, FEF25, FEF50, and FEF75 were significantly
different from zero. The authors concluded that these small reductions in pulmonary function
were attributable to variations in NO2 within each of the five salt mines that contributed to the
cohort.
Gamble et al. (1987a) investigated the acute effects of DE in 232 workers in four diesel
bus garages using an acute respiratory questionnaire and before and after workshift spirometry.

5-7
The prevalence of burning eyes, headaches, difficult or labored breathing, nausea, and wheeze
experienced at work was higher in the diesel bus garage workers than in a comparison
population of lead/acid battery workers who had not previously shown a statistically significant
association of acute symptoms with acid exposure. Comparisons between the two groups were
made without adjustment for age and smoking. There was no detectable association of exposure
to NO2 (0.23 ppm ± 0.24 S.D.) or inhalable (less than 10 µm MMAD) particles (0.24 mg/m3 ±
0.26 S.D.) and acute reductions in FVC, FEV1, peak flows, FEF50, and FEF75. Workers who had
respiratory symptoms had slightly greater but statistically insignificant reductions in FEV1 and
FEF50.
Ulfvarson et al. (1987) evaluated workshift changes in the pulmonary function of 17 bus
garage workers, 25 crew members of two types of car ferries, and 37 workers on roll-on/roll-off
ships. The latter group was exposed primarily to DE; the first two groups were exposed to both
gasoline and DE. The diesel-only exposures that averaged 8 h consisted of 0.13 to 1.0 mg/m3
particulate matter, 0.02 to 0.8 mg/m3 (0.016 to 0.65 ppm) NO, 0.06 to 2.3 mg/m3 (0.03 to 1.2
ppm) NO2, 1.1 to 5.1 mg/m3 (0.96 to 4.45 ppm) CO, and up to 0.5 mg/m3 (0.4 ppm)
formaldehyde. The largest decrement in pulmonary function was observed during a workshift
following no exposure to DE for 10 days. Forced vital capacity and FEV1 were significantly
reduced over the workshift (0.44 L and 0.30 L, p<0.01 and p<0.001, respectively). There was
no difference between smokers and nonsmokers. Maximal midexpiratory flow, closing volume
expressed as the percentage of expiratory vital capacity, and alveolar plateau gradient (phase 3)
were not affected. Similar but less pronounced effects on FVC (!0.16 L) were found in a
second, subsequent study of stevedores (n = 24) only following 5 days of no exposure to diesel
truck exhaust. Pulmonary function returned to normal after 3 days without occupational
exposure to DE. No exposure-related correlation was found between the observed pulmonary
effects and concentrations of NO, NO2, CO, or formaldehyde; however, it was suggested that
NO2 adsorbed onto the DE particles may have contributed to the overall dose of NO2 to the
lungs. In a related study, six workers (job category not defined) were placed in an exposure
chamber and exposed to diluted DE containing 0.6 mg/m3 DPM and 3.9 mg/m3 (2.1 ppm) NO2.
The exhaust was generated by a 6-cylinder, 2.38-L diesel engine, operated for 3 h and 40 min at
constant speed, equivalent to 60 km/h, and at about one-half full engine load. No effect on
pulmonary function was observed.
In a hypothesis-generating study, Kilburn (2000) examined neurobehavioral and
pulmonary function of a small group of workers exposed to DE either as railroad workers (n=10)
over a range of 15 to 50 years or as electricians (n=6) over a range of 0.6 to 1.5 years.
Neurobehavioral and visual functions batteries showed nearly all of these individuals to be
neurobehaviorally impaired in relation to a referent population in one or more areas, including
5-8
reaction time, balance, blink reflex latency, verbal recall, and color vision confusion indices.
Pulmonary function tests also showed that 10 of the 16 had airway obstruction and another
group of 10 of the 16 had chronic bronchitis, chest pain, tightness, and hyperreactive airways.
This work implies that with sufficiently sensitive methods, noncancer effects from DPM/DE
exposure may be detectable in sufficiently exposed human populations.
5.1.1.1.3. Immunological effects. Salvi et al. (1999) exposed healthy human subjects to diluted
DE (DPM 300 µg/m3) for 1 h with intermittent exercise. Although there were no changes in
pulmonary function, there were significant increases in neutrophils and B lymphocytes as well as
histamine and fibronectin in airway lavage fluid. Bronchial biopsies obtained 6 h after DE
exposure showed a significant increase in neutrophils, mast cells, and CD4+ and CD8+ T
lymphocytes, along with upregulation of the endothelial adhesion molecules ICAM-1 and
VCAM-1 and increases in the number of LFA-1+ in the bronchial tissue. Significant increases
in neutrophils and platelets were observed in peripheral blood following exposure to DE.
In a follow-up investigation of potential mechanisms underlying the DE-induced airway
leukocyte infiltration, Salvi et al. (2000) exposed healthy human volunteers to diluted DE, on
two separate occasions for 1 h each, in an exposure chamber. Fiber-optic bronchoscopy was
performed 6 h after each exposure to obtain endobronchial biopsies and bronchial wash (BW)
cells. These workers observed that DE exposure enhanced gene transcription of IL-8 in the
bronchial tissue and BW cells and increased growth-regulated oncogene-a protein expression and
IL-8 in the bronchial epithelium; there was also a trend toward an increase in IL-5 mRNA gene
transcripts in the bronchial tissue.
In an attempt to evaluate the potential allergenic effects of DPM in humans, Diaz-
Sanchez and associates carried out a series of clinical investigations. In the first of these (Diaz-
Sanchez et al., 1994), healthy human volunteers were challenged by spraying either saline or
0.30 mg (300 µg) DPM into their nostrils. The authors considered this dose to be equivalent to
breathing the outdoor air in Los Angeles for a 24-h period on an average day. Enhanced IgE
levels were noted in nasal lavage cells in as little as 24 h, with peak production observed 4 days
after DPM challenge. The effects seemed to be somewhat isotype-specific, because in contrast
to IgE results, DPM challenge had no effect on the levels of IgG, IgA, IgM, or albumin. The
selective enhancement of local IgE production was demonstrated by a dramatic increase in IgE-
secreting cells.
Although direct effects of DPM on B-cells have been demonstrated by in vitro studies, it
was considered likely that other cells regulating the IgE response may also be affected.
Cytokine production was therefore measured in nasal lavage cells from healthy human
volunteers challenged with DPM (0 or 0.15 mg in 200 µL saline) sprayed into each nostril (Diaz-
5-9
Sanchez et al., 1996). Before challenge with DPM, most subjects’ nasal lavage cells had
detectable levels of only interferon-(, IL-2, and IL-13 mRNA. After challenge with DPM, the
cells produced readily detectable levels of mRNA for IL-2, IL-4, IL-5, IL-6, IL-10, IL-13, and
interferon-(. Although the cells in the nasal lavage before and after challenge do not necessarily
represent the same ones either in number or type, the broad increase in cytokine production was
considered by the authors not to be simply the result of an increase in T cells recovered in the
lavage fluid. On the basis of these findings, the authors concluded that the increase in nasal
cytokine expression after exposure to DPM can be predicted to contribute to enhanced local IgE
production and thus play a role in pollutant-induced airway disease.
The ability of DPM to act as an adjuvant to the ragweed allergen Amb a I was also
examined by nasal provocation in ragweed-allergic subjects using 0.3 mg (300 µg) DPM, Amb a
I, or both (Diaz-Sanchez et al., 1997). Although allergen and DPM each enhanced ragweed-
specific IgE, DPM plus allergen promoted a 16-times greater antigen-specific IgE production.
Nasal challenge with DPM also influenced cytokine production. Ragweed challenge resulted in
a weak response, DPM challenge caused a strong but nonspecific response, and allergen plus
DPM caused a significant increase in the expression of mRNA for TH0 and TH2-type cytokines
(IL-4, IL-5, IL-6, IL-10, IL-13), with a pronounced inhibitory effect on IFN-( gene expression.
The author concluded that DPM can enhance B-cell differentiation and, by initiating and
elevating IgE production, may be a factor in the increased incidence of allergic airway disease.
In a further extension of these studies, Diaz-Sanchez et al. (1999) examined the potential
for DPM to lead to primary sensitization of humans by driving a de novo mucosal IgE response
to a neoantigen, keyhole limpet hemocyanin (KLH). Ten atopic subjects were given an initial
nasal immunization of KLH followed by two biweekly nasal challenges with KLH. Fifteen
different atopic subjects were treated identically, except that DPM was administered 24 h before
each KLH exposure. Intranasal administration of KLH alone led to the generation of an anti-
KLH IgG and IgA humoral response, which was detected in nasal fluid samples. No anti-KLH
IgE was observed in any of these subjects. In contrast, when challenged with KLH preceded by
DPM, 9 of the 15 subjects produced anti-KLH-specific IgE. KLH-specific IgG and IgA at levels
similar to those seen with KLH alone were also detected. Subjects who received DPM and KLH
had significantly increased IL-4, but not IFN-gamma, levels in nasal lavage fluid, whereas these
levels were unchanged in subjects receiving KLH alone. These investigators concluded that
DPM can function as a mucosal adjuvant to a de novo IgE response and may increase allergic
sensitization among atopic individuals.
5.1.1.1.4. Human cell culture studies. The potential mechanisms by which DPM may act to
cause allergenic effects has been examined in human cell culture studies. Takenaka et al. (1995)
5-10
reported that DPM extracts enhanced IgE production from purified human B cells. IgE
production in these cells (stimulated by exogenous addition of interleukin-4 plus monoclonal
antibody) was enhanced (i.e., further stimulated) 20% to 360% by the addition of DPM extracts
(1-50 ng/mL) over a period of 10-14 days. DPM extracts in the absence of exogenously added
IL-4 and/or monoclonal antibodies did not themselves induce IgE production or synergize with
interleukin-4 alone to induce IgE from purified B cells, suggesting that the extracts were
enhancing ongoing IgE production rather than inducing germline transcription or isotype
switching. The authors concluded that enhancement of IgE production in the human airway
resulting from the organic fraction of DPM may be an important factor in the increasing
incidence of allergic airway disease.
Terada et al. (1997) examined the effects of DPM and DPM extract on eosinophil
adhesion, survival rate, and degranulation. Eosinophils, human mucosal microvascular
endothelial cells (HMMECs), and human nasal epithelial cells (HNECs) were preincubated in
the presence of DPM and DPM extract. 35S-labeled eosinophils were allowed to adhere to
monolayers of HMMECs and HNECs. Although neither DPM nor DPM extract affected the
adhesiveness of HMMECs and HNECs to eosinophils, DPM and DPM extract each significantly
increased eosinophil adhesiveness to HNECs; neither affected eosinophil adhesiveness to
HMMECs. DPM extract also induced eosinophil degranulation without changing the eosinophil
survival rate. These results indicate that DPM may play an important role in promoting the nasal
hypersensitivity induced by enhanced eosinophil infiltration of epithelium and eosinophil
degranulation. It should also be noted that eosinophils are major components of allergic
inflammatory disorders, including asthma and nasal allergy.
Terada et al. (1999) examined the effects of DPM extract on the expression of histamine
H1 receptor (H1R) mRNA in HNECs and HMMECs, and on the production of IL-8 and GM-
CSF induced by histamine. HNECs and HMMECs, isolated from human nasal mucosa
specimens, were cultured with DPM extract. DPM extract increased the expression of H1R
mRNA in both HNECs and HMMECs. The amount of IL-8 and GM-CSF induced by histamine
was also significantly higher in HNECs and HMMECs treated with DPM extract. These results
strongly suggest that DPM accelerates the inflammatory change by not only directly
upregulating H1R expression but also by increasing histamine-induced IL-8 and GM-CSF
production. Histamine is the most important chemical mediator in the pathogenesis of nasal
allergy.
Steerenberg et al. (1998) studied the effects of exposure to DPM on airway epithelial
cells, the first line of defense against inhaled pollutants. Cells from a human bronchial cell line
(BEAS-2B) were cultured in vitro and exposed to DPM (0.04-0.33 mg/mL) and the effects on
IL-6 and IL-8 production were observed. Increases in IL-6 and IL-8 production compared to the
5-11
nonexposed cells (11- and 4-fold, respectively) were found after 24 or 48 h exposure to DPM.
This increase was lower (17- and 3.3-fold) compared to silica and higher compared to titanium
dioxide, which showed no increase for either IL-6 or IL-8. The study was extended to observe
the effects of DPM on inflammation-primed cells. BEAS-2B cells were exposed to TNF-"
followed by DPM. Additive effects on IL-6 and IL-8 production by BEAS-2B cells were found
after TNF-" priming and subsequent exposure to DPM only at a low dose of DPM and TNF-"
(0.05-0.2 ng/mL). The investigators concluded that BEAS-2B phagocytized DPM and produced
an increased amount of IL-6 and IL-8, and that in TNF-"-primed BEAS-2B cells DPM
increased interleukin production only at low concentrations of DPM and TNF-".
Ohtoshi et al. (1998) studied the effect of suspended particulate matter (SPM), obtained
from high-volume air samplers, and DPM obtained from exhaust of a stationary diesel engine on
the production of IL-8 and granulocyte-colony stimulating factor (GM-CSF) by human airway
epithelial cells in vitro. Nontoxic doses of DPMs stimulated production of IL-8 and GM-CSF by
three kinds of human epithelial cells (nasal polyp-derived upper airway, normal bronchial, and
transformed bronchial epithelial cells) in a dose- and time-dependent fashion at a DPM
concentration as low as 10 µg/mL. SPM applied at 250 and 2,500 µg/mL had a stimulatory
effect on GM-CSF, but not on IL-8 production. The effects could be blocked with a protein
synthesis inhibitor, suggesting that the process required de novo protein synthesis, and appeared
to be due to an extractable component because neither charcoal nor graphite showed such
stimulatory effects. The authors concluded that SPM and DPM, a component of SPM, may be
important air pollutants in the activation of airway cells for the release of cytokines relevant to
allergic airway inflammation.
The mechanisms underlying DPM-induced injury to airway cells were investigated in
human bronchial epithelial cells (HBECs) in culture (Bayram et al., 1998a). HBECs from
bronchial explants obtained at surgery were cultured and exposed to DPM (10-100 µg/mL)
suspended in a serum-free supplemented medium (SF-medium) or to a SF-medium filtrate of
DPM. The filtrate was obtained by incubating DPM (50 µg/mL) in SF-medium for 24 h. The
effects of DPM and DPM filtrate on permeability, ciliary beat frequency (CBF), and release of
inflammatory mediators were observed. DPM and filtered solution of DPM significantly
increased the electrical resistance of the cultures but did not affect movement of bovine serum
albumin across cell cultures. DPM and filtered DPM solution significantly attenuated the CBF
of these cultures and significantly increased the release of IL-8. DPM also increased the release
by these cultures of GM-CSF and soluble intercellular adhesion molecule-1 (sICAM-1). These
authors also observed that activated charcoal was not able to induce changes in electrical
resistance, attenuate CBF, and increase the release of inflammatory mediators from HBEC, and
proposed that these effects were due most likely to the compounds adsorbed onto the DPM

5-12
rather than the size of DPM. The authors concluded that exposure of airway cells to DPM may
lead to functional changes and release of proinflammatory mediators and that these effects may
influence the development of airway disease.
Bayram et al. (1998b) investigated the sensitivity of cultured airway cells from asthmatic
patients to DPM. Incubation with DPM (10-100 µg/mL) significantly attenuated the CBF in
both the asthmatic and nonasthmatic bronchial epithelial cell cultures. Cultured airway cells
from asthmatic patients constitutively released significantly greater amounts of IL-8, GM-CSF,
and sICAM-1 than cell cultures from nonasthmatic subjects. Only cultures from asthmatic
patients additionally released RANTES. The authors concluded that cultured airway cells from
asthmatic subjects differ with regard to the amounts and types of proinflammatory mediators
they can release and that the increased sensitivity of bronchial epithelial cells of asthmatic
subjects to DPM may result in exacerbation of their disease symptoms.
Devalia et al. (1999) investigated the potential sensitivity of HBECs biopsied from atopic
mild asthmatic patients and non-atopic nonasthmatic subjects to DPM. HBECs from asthmatic
patients constitutively released significantly greater amounts of IL-8, GM-CSF, and sICAM-1
than HBECs from nonasthmatic subjects. RANTES was only released by HBECs of asthmatic
patients. Incubation of the asthmatic cultures with 10 :g/mL DPM significantly increased the
release of IL-8, GM-CSF, and sICAM-1 after 24 h. In contrast, only higher concentrations (50-
100 :g/mL DPM) significantly increased the release of IL-8 and GM-CSF from HBECs of
nonasthmatics. The authors conclude that the increased sensitivity of the airways of asthmatics
to DPM may be, at least in part, a consequence of greater constitutive and DPM-induced release
of specific pro-inflammatory mediators from bronchial epithelial cells.
Abe and co-workers have demonstrated formation of increased cytokine levels in
cultured human bronchial epithelial cells exposed to freshly generated DE, but not to filtered
DE, i.e., particle-free DE (Abe et al., 2000). Cytokine IL-8 protein as well as transforming
growth factor (TGF)-$1 mRNAs were induced in a time-dependent manner (from 0.5 to 14 h of
exposure) in BET-1A human bronchial epithelial cells in response to exposure to freshly
generated, cooled, humidified DE that was diluted to 2.9 mg DPM/m3. The gas obtained by
filtration of DE alone did not show any sustained increase in these indicators, suggesting that DE
particles play a more important role in eliciting these responses than do the accompanying gases
(10.6 ppm CO, 7.3 ppm NO2, and 3.3 ppm SO2).
To elucidate the intracellular signal transduction pathway regulating IL-8 and RANTES
production, Hashimoto et al. (2000) examined the role of p38 mitogen-activated protein (MAP)
kinase in DPM-induced (DPM = 10, 50, or 100 :g/mL) IL-8 and RANTES production by
HBECs. They also examined the effect of a thiol-reducing agent, N-acetylcysteine (NAC), on
DPM-induced p38 MAP kinase activation and cytokine production. The authors conclude that

5-13
p38 MAP kinase plays an important role in the DPM-activated signaling pathway that regulates
IL-8 and RANTES production by HBECs and that the cellular redox state is critical for DPM-
induced p38 MAP kinase activation leading to IL-8 and RANTES production.
Boland et al. (1999) compared the biological effects of carbon black and DPM (2.5
:g/cm2 culture surface) collected from catalyst- and noncatalyst-equipped diesel vehicles in
cultures of both human bronchial epithelial cells and human nasal epithelial cells. Transmission
electron microscopy indicated that DPM was phagocytosed by epithelial cells and translocated
through the epithelial cell sheet. The time and dose dependency of phagocytosis and its
nonspecificity for different particles (DPM, carbon black, and latex particles) were established
by flow cytometry. DPM also induced a time-dependent increase in interleukin-8, GM-CSF,
and interleukin-1$ release. The inflammatory response occurred later than phagocytosis and,
because carbon black had no effect on cytokine release, its extent appeared to depend on the
content of adsorbed organic compounds. Furthermore, treatment of the exhaust gas to decrease
the adsorbed organic fraction reduced the DPM-induced increase in GM-CSF factor release.
These results indicate that DPM can be phagocytosed by and induce a specific inflammatory
response in airway epithelial cells.
5.1.1.1.5. Summary. In the available exposure studies, considerable variability is reported in
DE detection threshold. The odor scales described in some of these studies have no general use
at present because they are not objectively defined; however, the studies do clearly indicate
substantial interindividual variability in the ability to detect odor and the level at which it
becomes objectionable. Much of what is known about the acute effects of DE comes from case
reports that lack clear measurements of exposure concentrations. The studies of pulmonary
function changes in exposed humans have looked for changes occurring over a workshift or after
a short-term exposure. The overall conclusion of these studies is that reversible changes in
pulmonary function in humans can occur in relation to DE exposure, although it is not possible
to relate these changes to specific exposure levels. Numerous studies described in this section,
conducted in humans and in isolated cell systems derived from humans exposed to DPM,
revealed various biochemical and pathophysiological alterations, such as IgE changes, altered
levels of cytokines/chemokines, and goblet-cell hyperplasia, with nearly all these responses
being key changes and markers of allergic inflammatory disorders of the airways such as asthma
and nasal allergies (Nel et al., 1998). Thus, a major point of significance about these findings is
that they indicate that DPM could be viewed as having the potential to elicit inflammatory and
immunological responses and responses typical of asthma, and that DPM may be a likely factor
in the increasing incidence of allergic hypersensitivity. These studies have also shown that
effects are due primarily to the organic fraction and that DPM enhances the allergic response to

5-14
known allergens. Results from these studies, including those wih laboratory animals, indicate
that DPM could be viewed as having the potential to influence the development of airway
inflammation and disease through its adjuvant properties and by causing the release of
proinflammatory mediators.
5.1.1.2. Long-Term Exposures
Several epidemiologic studies have evaluated the effects of chronic exposure to DE on
occupationally exposed workers.
Battigelli et al. (1964) measured several indices of pulmonary function, including vital
capacity, FEV1, peak flow, nitrogen washout, and diffusion capacity in 210 locomotive
repairmen exposed to DE in 3 engine houses. The average exposure of these locomotive
repairmen to DE was 9.6 years. When compared with a control group matched for age, body
size, “past extrapulmonary medical history” (no explanation given), and job status (154 railroad
yard workers), no significant clinical differences were found in pulmonary function or in the
prevalence of dyspnea, cough, or sputum between the DE-exposed and nonexposed groups.
Exposure to DE showed marked seasonal variations because the doors of the engine house were
open in the summer and closed in the winter. For the exposed group, the maximum daily
workplace concentrations of air pollutants measured were 1.8 ppm NO2, 1.7 ppm total
aldehydes, 0.15 ppm acrolein, 4.0 ppm SO2, and 5.0 ppm total hydrocarbons. The concentration
of airborne particles was not reported.
Gamble et al. (1987b) examined 283 diesel bus garage workers from four garages in two
cities to determine if there was excess chronic respiratory morbidity associated with exposure to
DE. Tenure of employment was used as a surrogate of exposure; mean tenure of the study
population was 9 years ± 10 years S.D. Exposure-effect relationships within the study
population showed no detectable associations of symptoms with tenure. Reductions in FVC,
FEV1, peak flow, and FEF50 (but not FEF75) were associated with increasing tenure. Compared
with a control population (716 nonexposed blue-collar workers) and after indirect adjustment for
age, race, and smoking, the exposed workers had a higher incidence of cough, phlegm, and
wheezing; however, there was no correlation between symptoms and length of employment.
Dyspnea showed an exposure-response trend but no apparent increase in prevalence. Mean
FEV1, FVC, FEF50, and peak flow were not reduced in the total cohort compared with the
reference population, but were reduced in workers with 10 years or more tenure.
Purdham et al. (1987) evaluated respiratory symptoms and pulmonary function in
17 stevedores employed in car ferry operations who were exposed to both diesel and gasoline
exhausts and in a control group of 11 on-site office workers. Twenty-four percent of the
exposed group and 36% of the controls were smokers. If a particular symptom was considered
5-15
to be influenced by smoking, smoking status was used as a covariate in the logistic regression
analysis; pack-years smoked was a covariate for lung function indices. The frequency of
respiratory symptoms was not significantly different between the two groups; however, baseline
pulmonary function measurements were significantly different. The latter comparisons were
measured by multiple regression analysis using the actual (not percentage predicted) results and
correcting for age, height, and pack-years smoked. The stevedores had significantly lower
FEV1, FEV1/FVC, FEF50, and FEF75 (p<0.021, p<0.023, p<0.001, and p<0.008, respectively),
but not FVC. The results from the stevedores were also compared with those obtained from a
study of the respiratory health status of Sydney, Nova Scotia, residents. These comparisons
showed that the dock workers had higher FVC, similar FEV1, but lower FEV1/FVC and flow
rates than the residents of Sydney. Based on these consistent findings, the authors concluded
that the lower baseline function measurements in the stevedores provided evidence of an
obstructive ventilatory defect, but caution in interpretation was warranted because of the small
sample size. There were no significant changes in lung function over the workshift, nor was
there a difference between the two groups. The stevedores were exposed to significantly
(p<0.04) higher concentrations of particulate matter (0.06 to 1.72 mg/m3, mean 0.50 mg/m3)
than the controls (0.13 to 0.58 mg/m3, mean not reported). Exposures of stevedores to SO2,
NO2, aldehydes, and PAHs were very low; occasional CO concentrations in the 20 to 100 ppm
range could be detected for periods up to 1 h in areas where blockers were chaining gasoline-
powered vehicles.
Additional epidemiologic studies on the health hazards posed by exposure to DE have
been conducted for mining operations. Reger et al. (1982) evaluated the respiratory health status
of 823 male coal miners from six diesel-equipped mines compared with 823 matched coal
miners not exposed to DE. The average tenure of underground work for the underground miners
and their controls was only about 5 years; on average, the underground workers in diesel mines
spent only 3 of those 5 years underground in diesel-use mines. Underground miners exposed to
DE reported a higher incidence of symptoms of cough and phlegm but proportionally fewer
symptoms of moderate to severe dyspnea than their matched counterparts. These differences in
prevalence of symptoms were not statistically significant. The diesel-exposed underground
miners, on the average, had lower FVC, FEV1, FEF50, FEF75, and FEF90 but higher peak flow
and FEF25 than their matched controls. These differences, however, were not statistically
significant. Health indicators for surface workers and their matched controls were directionally
the same as for matched underground workers. There were no consistent relationships between
the findings of increased respiratory symptoms, decreased pulmonary function, smoking history,
years of exposure, or monitored atmosphere pollutants (NOx, CO, particles, and aldehydes).
Mean concentrations of NOx at the six mines ranged from 0 to 0.6 ppm for short-term area
5-16
samples, 0.13 to 0.28 ppm for full-shift personal samples, and 0.03 to 0.80 for full-shift area
samples. Inhalable particles (less than 10 :m MMAD) averaged 0.93 to 2.73 mg/m3 for
personal samples and 0 to 16.1 mg/m3 for full-shift area samples. Ames et al. (1984), using a
portion of the miners studied by Reger, examined 280 diesel-exposed underground miners in
1977 and again in 1982. Each miner in this group had at least 1 year of underground mining
work history in 1977. The control group was 838 miners with no exposure to DE. The miners
were evaluated for prevalence of respiratory symptoms, chronic cough, phlegm, dyspnea, and
changes in FVC, FEV1, and FEF50. No air monitoring data were reported; exposure to DE gases
and mine dust particles were described as very low. These authors found no decrements in
pulmonary function or increased prevalence of respiratory symptoms attributable to exposure to
DE. In fact, the 5-year incidences of cough, phlegm, and dyspnea were greater in miners
without exposure to DE.
Attfield (1978) studied 2,659 miners from 21 mines (8 metal, 6 potash, 5 salt, and
2 trona). Diesels were employed in only 18 of the mines, but the 3 mines not using diesels were
not identified. The years of diesel usage, ranging from 8 in trona mines to 16 in potash mines,
were used as a surrogate for exposure to DE. Based on a questionnaire, an increased prevalence
of persistent cough was associated with exposure to aldehydes; this finding, however, was not
supported by the pulmonary function data. No adverse respiratory symptoms or pulmonary
function impairments were related to CO2, CO, NO2, inhalable dust, or inhalable quartz. The
author failed to comment on whether the prevalence of cough was related to the high incidence
(70%) of smokers in the cohort.
Questionnaire, chest radiograph, and spirometric data were collected by Attfield et al.
(1982) on 630 potash miners from six potash mines. These miners were exposed for an average
of 10 years (range 5 to 14 years) to 0.1 to 3.3 ppm NO2, 0.1 to 4.0 ppm aldehyde, 5 to 9 ppm
CO, and total dust concentrations of 9 to 23 mg/m3. No attempt was made to measure diesel-
derived particles separately from other dusts. The ratio of total to inhalable (<10 :m MMAD)
dust ranged from 2 to 11. An increased prevalence of respiratory symptoms was related solely
to smoking. No association was found between symptoms and tenure of employment, dust
exposure, NO2, CO, or aldehydes. A higher prevalence of symptoms of cough and phlegm was
found, but no differences in pulmonary function (FVC and FEV1) were found in these
diesel-exposed potash miners when compared with the predicted values derived from a logistics
model based on blue-collar workers working in nondusty jobs.
Gamble et al. (1983) investigated respiratory morbidity in 259 miners from 5 salt mines
in terms of increased respiratory symptoms, radiographic findings, and reduced pulmonary
function associated with exposure to NO2, inhalable particles (<10 :m MMAD), or years
worked underground. Two of the mines used diesel extensively; no diesels were used in one salt

5-17
mine. Diesels were introduced into each mine in 1956, 1957, 1963, or 1963 through 1967.
Several working populations were compared with the salt miner cohort. After adjustment for
age and smoking, the salt miners showed no increased prevalence of cough, phlegm, dyspnea, or
airway obstruction (FEV1/FVC) compared with aboveground coal miners, potash miners, or
blue-collar workers. The underground coal miners consistently had an elevated level of
symptoms. Forced expiratory volume at 1 s, FVC, FEF50, and FEF75 were uniformly lower for
salt miners in relation to all the comparison populations. There was, however, no association
between changes in pulmonary function and years worked, estimated cumulative inhalable
particles, or estimated NO2 exposure. The highest average exposure to particulate matter was
1.4 mg/m3 (particle size not reported, measurement includes NaCl). Mean NO2 exposure was
1.3 ppm, with a range of 0.17 ppm to 2.5 ppm. In a continuation of these studies, Gamble and
Jones (1983) grouped the salt miners into low-, intermediate-, and high-exposure categories
based on tenure in jobs with DE exposure. Average concentrations of inhalable particles and
NO2 were 0.40, 0.60, and 0.82 mg/m3 and 0.64, 1.77, and 2.21 ppm for the three diesel exposure
categories, respectively. A statistically significant concentration-response association was found
between the prevalence of phlegm in the salt miners and exposure to DE (p<0.0001) and a
similar, but nonsignificant, trend for cough and dyspnea. Changes in pulmonary function
showed no association with diesel tenure. In a comparison with the control group of
nonexposed, blue-collar workers, adjusted for age and smoking, the overall prevalence of cough
and phlegm (but not dyspnea) was elevated in the diesel-exposed workers. Forced expiratory
volumes at 1 s and FVC were within 4% of expected, which was considered to be within the
normal range of variation for a nonexposed population.
In a preliminary study of three subcohorts from bus company personnel (clerks [lowest
exposure], bus drivers [intermediate exposure], and bus garage workers [highest exposure])
representing different levels of exposure to DE, Edling and Axelson (1984) found a fourfold
higher risk ratio for cardiovascular mortality in bus garage workers, even after adjusting for
smoking history and allowing for at least 10 years of exposure and 15 years or more of induction
latency. Carbon monoxide was hypothesized as the etiologic agent for the increased
cardiovascular disease but was not measured. However, in a more comprehensive epidemiologic
study, Edling et al. (1987) evaluated mortality data covering a 32-year period for a cohort of 694
bus garage employees and found no significant differences between the observed and expected
number of deaths from cardiovascular disease. Information on exposure components and their
concentrations was not reported.
The absence of reported noncancerous human health effects, other than infrequently
occurring effects related to respiratory symptoms and pulmonary function changes, is notable.
Unlike studies in laboratory animals, to be described later in this chapter, studies of the impact
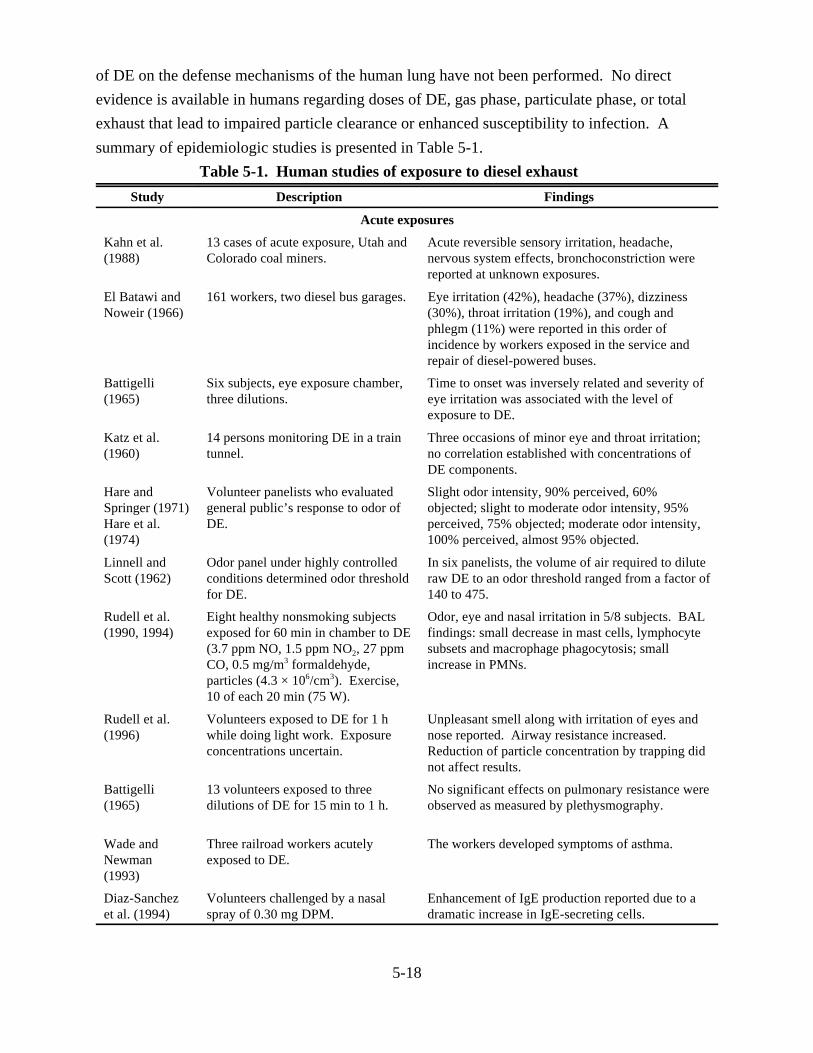
5-18
of DE on the defense mechanisms of the human lung have not been performed. No direct
evidence is available in humans regarding doses of DE, gas phase, particulate phase, or total
exhaust that lead to impaired particle clearance or enhanced susceptibility to infection. A
summary of epidemiologic studies is presented in Table 5-1.
Table 5-1. Human studies of exposure to diesel exhaust
Study Description Findings
Acute exposures
Kahn et al.(1988)
13 cases of acute exposure, Utah andColorado coal miners.
Acute reversible sensory irritation, headache,nervous system effects, bronchoconstriction werereported at unknown exposures.
El Batawi andNoweir (1966)
161 workers, two diesel bus garages. Eye irritation (42%), headache (37%), dizziness(30%), throat irritation (19%), and cough andphlegm (11%) were reported in this order ofincidence by workers exposed in the service andrepair of diesel-powered buses.
Battigelli(1965)
Six subjects, eye exposure chamber,three dilutions.
Time to onset was inversely related and severity ofeye irritation was associated with the level ofexposure to DE.
Katz et al.(1960)
14 persons monitoring DE in a traintunnel.
Three occasions of minor eye and throat irritation;no correlation established with concentrations ofDE components.
Hare andSpringer (1971)Hare et al.(1974)
Volunteer panelists who evaluatedgeneral public’s response to odor ofDE.
Slight odor intensity, 90% perceived, 60%objected; slight to moderate odor intensity, 95%perceived, 75% objected; moderate odor intensity,100% perceived, almost 95% objected.
Linnell andScott (1962)
Odor panel under highly controlledconditions determined odor thresholdfor DE.
In six panelists, the volume of air required to diluteraw DE to an odor threshold ranged from a factor of140 to 475.
Rudell et al.(1990, 1994)
Eight healthy nonsmoking subjectsexposed for 60 min in chamber to DE(3.7 ppm NO, 1.5 ppm NO2, 27 ppmCO, 0.5 mg/m3 formaldehyde,particles (4.3 × 10⁶/cm3). Exercise,10 of each 20 min (75 W).
Odor, eye and nasal irritation in 5/8 subjects. BALfindings: small decrease in mast cells, lymphocytesubsets and macrophage phagocytosis; smallincrease in PMNs.
Rudell et al.(1996)
Volunteers exposed to DE for 1 hwhile doing light work. Exposureconcentrations uncertain.
Unpleasant smell along with irritation of eyes andnose reported. Airway resistance increased. Reduction of particle concentration by trapping didnot affect results.
Battigelli(1965)
13 volunteers exposed to threedilutions of DE for 15 min to 1 h.
No significant effects on pulmonary resistance wereobserved as measured by plethysmography.
Wade andNewman(1993)
Three railroad workers acutelyexposed to DE.
The workers developed symptoms of asthma.
Diaz-Sanchezet al. (1994)
Volunteers challenged by a nasalspray of 0.30 mg DPM.
Enhancement of IgE production reported due to adramatic increase in IgE-secreting cells.

5-19
Table 5-1. Human studies of exposure to diesel exhaust (continued)
Study Description Findings
Takenaka et al.(1995)
Volunteers challenged by a nasalspray of 0.30 mg DPM.
DPM extracts enhanced interleukin-4 plusmonoclonal antibody-stimulated IgE production asmuch as 360%, suggesting an enhancement ofongoing IgE production rather than inducinggermline transcription or isotype switching.
Diaz-Sanchezet al. (1996)
Volunteers challenged by a nasalspray of 0.30 mg DPM.
A broad increase in cytokine expression predictedto contribute to enhanced local IgE production.
Diaz-Sanchezet al. (1997)
Ragweed-sensitive volunteerschallenged by a nasal spray of 0.30mg DPM alone or in combinationwith ragweed allergen.
Ragweed allergen plus DPM-stimulated ragweed-specific IgE to a much greater degree than ragweedalone, suggesting DPM may be a key feature instimulating allergen-induced respiratory allergicdisease.
Salvi et al.(1999)
Volunteers exposed to diluted DE(DPM 300 :g/m3) for 1 h withintermittent exercise.
• No changes in pulmonary function, butsignificant increases in neutrophils, Blymphocytes, histamine, and fibronectin inairway lavage fluid.
• Bronchial biopsies 6 h after exposureshowed significant increase in neutrophils,mast cells, CD4+ and CD8+ Tlymphocytes; upregulation of ICAM-1 andVCAM-1; increases in the number of LFA-1+ in bronchial tissue.
• Significant increases in neutrophils andplatelets observed in peripheral blood.
Salvi et al.(2000)
Volunteers exposed to diluted DE(DPM 300 :g/m3) for 1 h.
• DPM enhanced gene transcription of IL-8in bronchial tissue and bronchial washcells
• Increased expression of growth-regulatedoncogene-" and IL-8 in bronchialepithelium; trend towards increased IL-5mRNA gene transcripts.
Nightingale etal. (2000)
Volunteers exposed to resuspendedDPM (200 ug/m3) for 2 h at rest
• DPM increased exhaled levels of CO• DPM increased sputum neutrophils and
myeloperoxidase
Studies of cross-shift changes
Reger (1979) Five or more VC maneuvers by eachof 60 coal miners exposed to DE atthe beginning and end of a workshift.
FEV1, FVC, and PEFR were similar between dieseland non-diesel-exposed miners. Smokers had anincreased number of decrements over shift thannonsmokers.
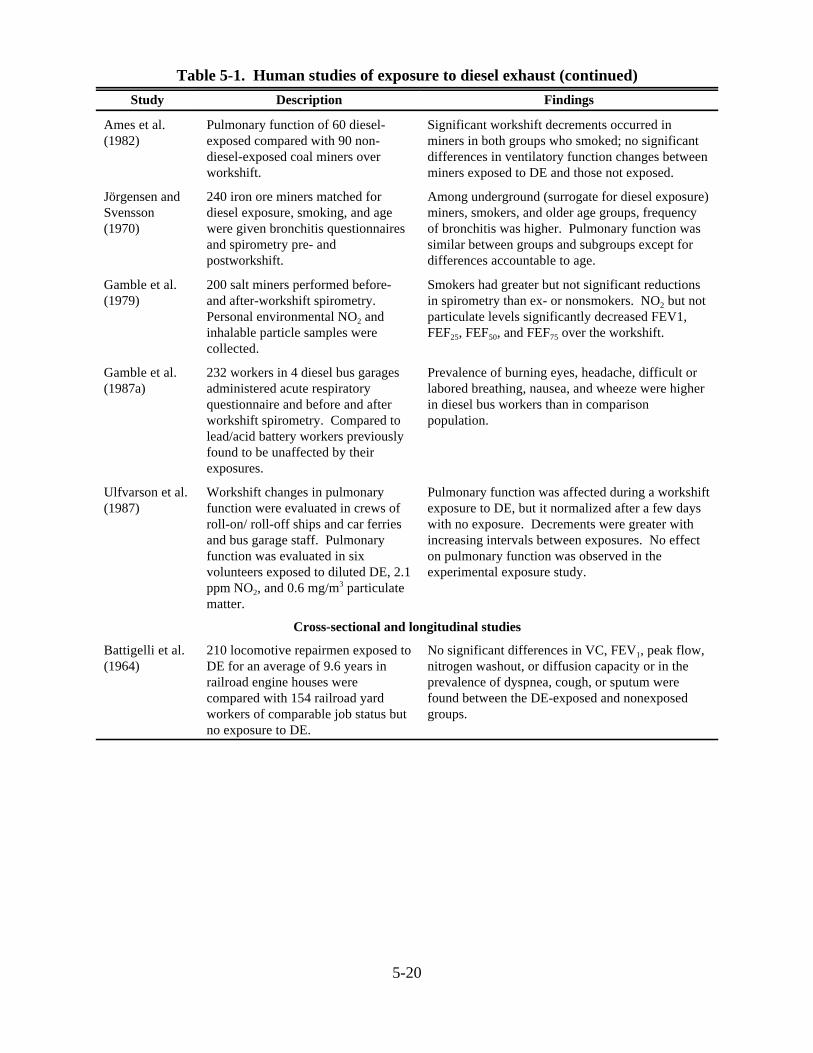
5-20
Table 5-1. Human studies of exposure to diesel exhaust (continued)
Study Description Findings
Ames et al.(1982)
Pulmonary function of 60 diesel-exposed compared with 90 non-diesel-exposed coal miners overworkshift.
Significant workshift decrements occurred inminers in both groups who smoked; no significantdifferences in ventilatory function changes betweenminers exposed to DE and those not exposed.
Jörgensen andSvensson(1970)
240 iron ore miners matched fordiesel exposure, smoking, and agewere given bronchitis questionnairesand spirometry pre- andpostworkshift.
Among underground (surrogate for diesel exposure)miners, smokers, and older age groups, frequencyof bronchitis was higher. Pulmonary function wassimilar between groups and subgroups except fordifferences accountable to age.
Gamble et al.(1979)
200 salt miners performed before-and after-workshift spirometry. Personal environmental NO2 andinhalable particle samples werecollected.
Smokers had greater but not significant reductionsin spirometry than ex- or nonsmokers. NO2 but notparticulate levels significantly decreased FEV1,FEF25, FEF50, and FEF75 over the workshift.
Gamble et al.(1987a)
232 workers in 4 diesel bus garagesadministered acute respiratoryquestionnaire and before and afterworkshift spirometry. Compared tolead/acid battery workers previouslyfound to be unaffected by theirexposures.
Prevalence of burning eyes, headache, difficult orlabored breathing, nausea, and wheeze were higherin diesel bus workers than in comparisonpopulation.
Ulfvarson et al.(1987)
Workshift changes in pulmonaryfunction were evaluated in crews ofroll-on/ roll-off ships and car ferriesand bus garage staff. Pulmonaryfunction was evaluated in sixvolunteers exposed to diluted DE, 2.1ppm NO2, and 0.6 mg/m3 particulatematter.
Pulmonary function was affected during a workshiftexposure to DE, but it normalized after a few dayswith no exposure. Decrements were greater withincreasing intervals between exposures. No effecton pulmonary function was observed in theexperimental exposure study.
Cross-sectional and longitudinal studies
Battigelli et al.(1964)
210 locomotive repairmen exposed toDE for an average of 9.6 years inrailroad engine houses werecompared with 154 railroad yardworkers of comparable job status butno exposure to DE.
No significant differences in VC, FEV1, peak flow,nitrogen washout, or diffusion capacity or in theprevalence of dyspnea, cough, or sputum werefound between the DE-exposed and nonexposedgroups.

5-21
Table 5-1. Human studies of exposure to diesel exhaust (continued)Study Description Findings
Gamble et al.(1987b)
283 male diesel bus garage workersfrom four garages in two cities wereexamined for impaired pulmonaryfunction (FVC, FEV1, and flowrates). Study population with a meantenure of 9 ± 10 years S.D. wascompared to a nonexposed blue-collar population.
Analyses within the study population showed noassociation of respiratory symptoms with tenure. Reduced FEV1 and FEF50 (but not FEF75) wereassociated with increasing tenure. The studypopulation had a higher incidence of cough,phlegm, and wheezing unrelated to tenure. Pulmonary function was not affected in the totalcohort of diesel-exposed but was reduced with 10or more years of tenure.
Purdham et al.(1987)
Respiratory symptoms andpulmonary function were evaluatedin 17 stevedores exposed to bothdiesel and gasoline exhausts in carferry operations; control group was11 on-site office workers.
No differences between the two groups for respira-tory symptoms. Stevedores had lower baseline lungfunction consistent with an obstructive ventilatorydefect compared with controls and those of Sydney,Nova Scotia, residents. Caution in interpretation iswarranted because of small sample size. Nosignificant changes in lung function over workshiftor difference between two groups.
Reger et al.(1982)
Differences in respiratory symptomsand pulmonary function wereassessed in 823 coal miners from 6diesel-equipped mines compared to823 matched coal miners not exposedto DE.
Underground miners in diesel-use mines reportedmore symptoms of cough and phlegm and hadlower pulmonary function. Similar trends werenoted for surface workers at diesel-use mines. Pattern was consistent with small airway diseasebut factors other than exposure to DE thought to beresponsible.
Ames et al.(1984)
Changes in respiratory symptoms andfunction were measured during a 5-year period in 280 diesel-exposedand 838 nonexposed U.S.underground coal miners.
No decrements in pulmonary function or increasedprevalence of respiratory symptoms were foundattributable to DE. In fact, 5-year incidences ofcough, phlegm, and dyspnea were greater in minerswithout exposure to DE than in miners exposed toDE.
Attfield (1978) Respiratory symptoms and functionwere assessed in 2,659 miners from21 underground metal mines (1,709miners) and nonmetal mines (950miners). Years of diesel usage in themines were surrogate for exposure toDE.
Questionnaire found an association between anincreased prevalence of cough and aldehydeexposure; this finding was not substantiated byspirometry data. No adverse symptoms orpulmonary function decrements were related toexposure to NO2, CO, CO2, dust, or quartz.

5-22
Table 5-1. Human studies of exposure to diesel exhaust (continued)Study Description Findings
Attfield et al.(1982)
Respiratory symptoms and functionwere assessed in 630 potash minersfrom 6 potash mines through aquestionnaire, chest radiographs, andspirometry. A thorough assessmentof the environment of each mine wasmade concurrently.
No obvious association indicative of dieselexposure was found between health indices, dustexposure, and pollutants. Higher prevalences ofcough and phlegm but no differences in FVC andFEV1 were found in these diesel-exposed potashworkers when compared with predicted values froma logistic model based on blue-collar staff workingin nondusty jobs.
Gamble et al.(1983)
Respiratory morbidity was assessedin 259 miners in 5 salt mines byrespiratory symptoms, radiographicfindings, and spirometry. Two minesused diesels extensively, two hadlimited use, and one used no dieselsin 1956, 1957, 1963, or 1963 through1967. Several working populationswere compared with the salt-minecohort.
After adjustment for age and smoking, salt minersshowed no symptoms or increased prevalence ofcough, phlegm, dyspnea, or air obstruction(FEV1/FVC) compared with aboveground coalminers, potash workers, or blue-collar workers. FEV1, FVC, FEF50, and FEF75 were uniformlylower for salt miners in comparison with all thecomparison populations. No changes in pulmonaryfunction were associated with years of exposure orcumulative exposure to inhalable particles or NO2.
Gamble andJones (1983)
Same as above. Salt miners weregrouped into low-, intermediate-, andhigh-exposure categories based ontenure in jobs with diesel exposure.
A statistically significant dose-related associationof phlegm and diesel exposure was noted. Changesin pulmonary function showed no association withdiesel tenure. Age- and smoking-adjusted rates ofcough, phlegm, and dyspnea were 145%, 169%,and 93% of an external comparison population. Predicted pulmonary function indices showed smallbut significant reductions; there was no dose-response relationship.
Edling andAxelson (1984)
Pilot study of 129 bus companyemployees classified into 3 diesel-exhaust exposure categories: clerks(0), bus drivers (1), and bus garageworkers.
The most heavily exposed group (bus garageworkers) had a fourfold increase in risk of dyingfrom cardiovascular disease, even after correctionfor smoking and allowing for 10 years of exposureand 14 years or more of induction latency time.
Edling et al.(1987)
Cohort of 694 male bus garageemployees followed from 1951through 1983 was evaluated formortality from cardiovasculardisease. Subcohorts categorized bylevels of exposure were clerks (0),bus drivers (1), and bus garageemployees (2).
No increased mortality from cardiovascular diseasewas found among the members of these five buscompanies when compared with the generalpopulation or grouped as subcohorts with differentlevels of exposure.

5-23
To date, no large-scale epidemiologic study has looked for effects of chronic exposure to
DE on pulmonary function. In the long-term longitudinal and cross-sectional studies, a
relationship was generally observed between work in a job with diesel exposure and respiratory
symptoms (such as cough and phlegm), but there was no consistent effect on pulmonary
function. The interpretation of these results is hampered by lack of measured DE exposure
levels and the short duration of exposure in these cohorts. The studies are further limited in that
only active workers were included, and it is possible that workers who have developed
symptoms or severe respiratory disease are likely to have moved away from these jobs. The
relationship between work in a job with diesel exposure and respiratory symptoms may be due to
short-term exposure.
5.1.2. Traffic Studies
The relationship between traffic density and respiratory health in children has been
examined in a series of studies in Holland in children attending schools located near major
freeways. Cough, wheeze, runny nose, and doctor-diagnosed asthma were reported more often
for children living within 100 m of freeways carrying between 80,000 and 150,000 vehicles per
day (van Vliet et al., 1997). Separate counts for truck traffic indicated a range from 8,000 to
17,500 trucks per day. Truck traffic intensity and concentration of “black smoke,” considered
by the authors to be a proxy for DPM, measured in schools were found to be significantly
associated with chronic respiratory symptoms, with the relationships being more pronounced in
girls than in boys.
Brunekreef et al. (1997) measured lung function in children in six areas located near
major motorways and assessed their exposure to traffic-related air pollution using separate traffic
counts for automobiles and trucks. They also measured air pollution in the children's schools.
Although lung function was associated with truck traffic density, there was a lesser association
with automobile traffic density. The association was stronger in those children living closest
(300 m) to the roadways. Lung function was also associated with concentration of “black
smoke” (source and constitution unclear from the study) measured inside the schools. The
associations were stronger in girls than in boys. The authors conclude that exposure to vehicular
pollution, in particular DPM, may lead to reduced lung function in children living near major
motorways.
In a follow-up study of traffic-related air pollution and its effect on the respiratory health
of children living near roadways, Brunekreef et al. (2000) showed that the intensity of truck
traffic was significantly associated with the prevalence of wheeze, phlegm, bronchitis, eye
symptoms, and allergy to dust and pets. Associations with yearly averaged PM2.5 and “soot”
concentrations measured inside and outside the schools showed similar patterns. Truck traffic

5-24
intensity was also significantly associated with a positive skin prick test or elevated IgE for
outdoor allergens. There were no associations between traffic intensity or PM2.5 and “soot”
concentrations and lung function, bronchial responsiveness, and allergic reactions to indoor
allergens. Further analysis of the data showed that the associations between traffic-related air
pollution and symptoms were almost entirely related to children with bronchial hyperreactivity
or sensitization to common allergens.
5.1.3. Laboratory Animal Studies
Because humans and laboratory animals show similar nonneoplastic responses to inhaled
particles (ILSI, 2000), animal studies have been conducted to assess the pathophysiologic effects
of DPM. Because of the large number of statistical comparisons made in the laboratory animal
studies, and to permit uniform, objective evaluations within and among studies, data will be
reported as significantly different (i.e., p<0.05) unless otherwise specified. The exposure
regimens used and the resultant exposure conditions employed in the laboratory animal
inhalation studies are summarized in Tables 5-2 through 5-16. Other than the pulmonary
function studies performed by Wiester et al. (1980) on guinea pigs during their exposure in
inhalation chambers, the pulmonary function studies performed by other investigators, although
sometimes unreported, were interpreted as being conducted on the following day or thereafter
and not immediately following exposure.
5.1.3.1. Acute Exposures
The acute toxicity of undiluted DE to rabbits, guinea pigs, and mice was assessed by
Pattle et al. (1957). Four engine operating conditions were used, and 4 rabbits, 10 guinea pigs,
and 40 mice were tested under each exposure condition for 5 h (no controls were used).
Mortality was assessed up to 7 days after exposure. With the engine operating under light load,
the exhaust was highly irritating but not lethal to the test species, and only mild tracheal and
lung damage was observed in the exposed animals. The exhaust contained 74 mg/m3 DPM
(particle size not reported), 560 ppm CO, 23 ppm NO2, and 16 ppm aldehydes. Exhaust
containing 5 mg/m3 DPM, 380 ppm CO, 43 ppm NO2, and 6.4 ppm aldehydes resulted in low
mortality rates (mostly below 10%) and moderate lung damage. Exhaust containing 122 mg/m3
DPM, 418 ppm CO, 51 ppm NO2, and 6.0 ppm aldehydes produced high mortality rates (mostly
above 50%) and severe lung damage. Exhaust containing 1,070 mg/m3 DPM, 1,700 ppm CO,
12 ppm NO2, and 154 ppm aldehydes resulted in 100% mortality in all three species. High CO
levels, which resulted in a carboxyhemoglobin value of 60% in mice and 50% in rabbits and
guinea pigs, were considered to be the main cause of death in the latter case. High NO2 levels
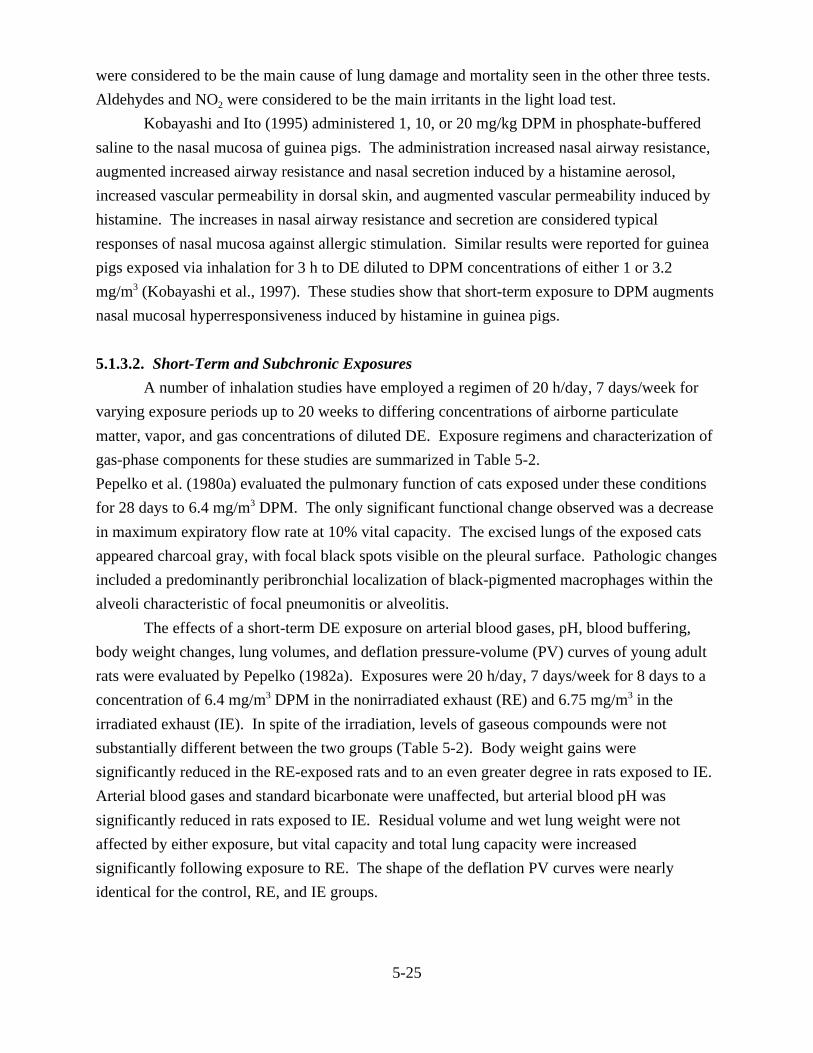
5-25
were considered to be the main cause of lung damage and mortality seen in the other three tests.
Aldehydes and NO2 were considered to be the main irritants in the light load test.
Kobayashi and Ito (1995) administered 1, 10, or 20 mg/kg DPM in phosphate-buffered
saline to the nasal mucosa of guinea pigs. The administration increased nasal airway resistance,
augmented increased airway resistance and nasal secretion induced by a histamine aerosol,
increased vascular permeability in dorsal skin, and augmented vascular permeability induced by
histamine. The increases in nasal airway resistance and secretion are considered typical
responses of nasal mucosa against allergic stimulation. Similar results were reported for guinea
pigs exposed via inhalation for 3 h to DE diluted to DPM concentrations of either 1 or 3.2
mg/m3 (Kobayashi et al., 1997). These studies show that short-term exposure to DPM augments
nasal mucosal hyperresponsiveness induced by histamine in guinea pigs.
5.1.3.2. Short-Term and Subchronic Exposures
A number of inhalation studies have employed a regimen of 20 h/day, 7 days/week for
varying exposure periods up to 20 weeks to differing concentrations of airborne particulate
matter, vapor, and gas concentrations of diluted DE. Exposure regimens and characterization of
gas-phase components for these studies are summarized in Table 5-2.
Pepelko et al. (1980a) evaluated the pulmonary function of cats exposed under these conditions
for 28 days to 6.4 mg/m3 DPM. The only significant functional change observed was a decrease
in maximum expiratory flow rate at 10% vital capacity. The excised lungs of the exposed cats
appeared charcoal gray, with focal black spots visible on the pleural surface. Pathologic changes
included a predominantly peribronchial localization of black-pigmented macrophages within the
alveoli characteristic of focal pneumonitis or alveolitis.
The effects of a short-term DE exposure on arterial blood gases, pH, blood buffering,
body weight changes, lung volumes, and deflation pressure-volume (PV) curves of young adult
rats were evaluated by Pepelko (1982a). Exposures were 20 h/day, 7 days/week for 8 days to a
concentration of 6.4 mg/m3 DPM in the nonirradiated exhaust (RE) and 6.75 mg/m3 in the
irradiated exhaust (IE). In spite of the irradiation, levels of gaseous compounds were not
substantially different between the two groups (Table 5-2). Body weight gains were
significantly reduced in the RE-exposed rats and to an even greater degree in rats exposed to IE.
Arterial blood gases and standard bicarbonate were unaffected, but arterial blood pH was
significantly reduced in rats exposed to IE. Residual volume and wet lung weight were not
affected by either exposure, but vital capacity and total lung capacity were increased
significantly following exposure to RE. The shape of the deflation PV curves were nearly
identical for the control, RE, and IE groups.
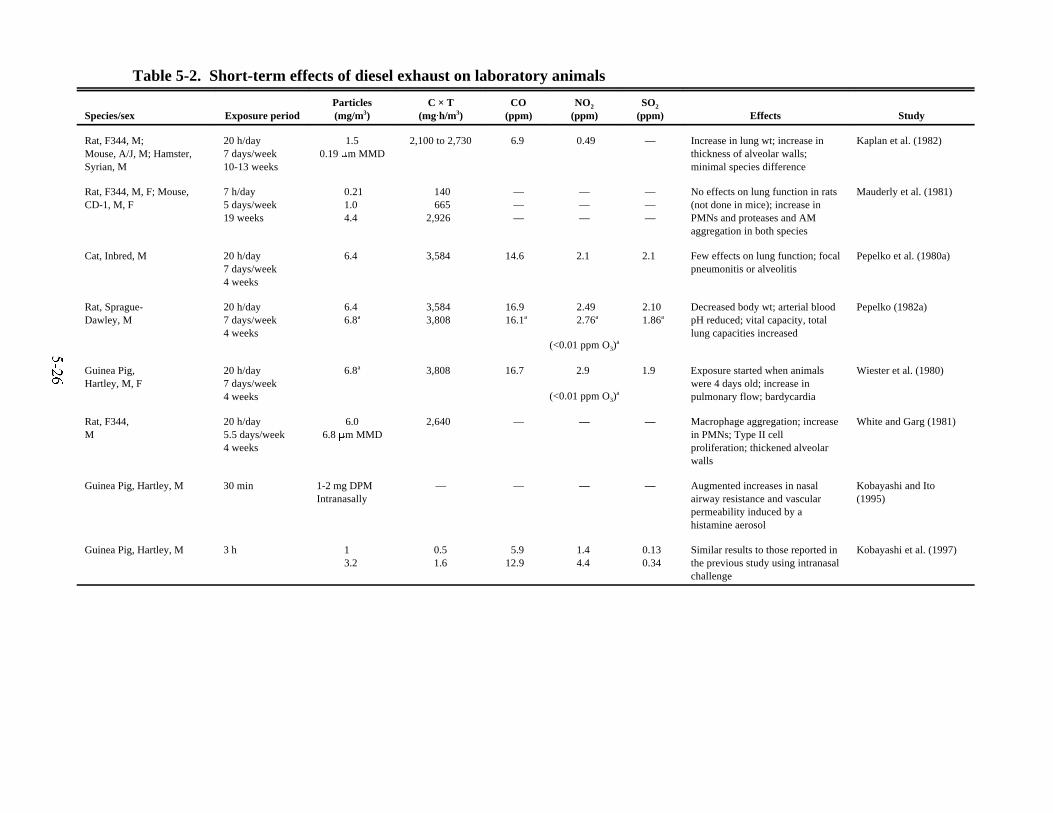
5-26
Table 5-2. Short-term effects of diesel exhaust on laboratory animals
Species/sex Exposure periodParticles(mg/m3)
C × T(mgAh/m3)
CO(ppm)
NO2
(ppm)SO2
(ppm) Effects Study
Rat, F344, M;Mouse, A/J, M; Hamster,Syrian, M
20 h/day7 days/week10-13 weeks
1.50.19 :m MMD
2,100 to 2,730 6.9 0.49 — Increase in lung wt; increase inthickness of alveolar walls;minimal species difference
Kaplan et al. (1982)
Rat, F344, M, F; Mouse,CD-1, M, F
7 h/day5 days/week19 weeks
0.211.04.4
140 665
2,926
———
———
———
No effects on lung function in rats(not done in mice); increase inPMNs and proteases and AMaggregation in both species
Mauderly et al. (1981)
Cat, Inbred, M 20 h/day7 days/week4 weeks
6.4 3,584 14.6 2.1 2.1 Few effects on lung function; focalpneumonitis or alveolitis
Pepelko et al. (1980a)
Rat, Sprague-Dawley, M
20 h/day7 days/week4 weeks
6.46.8a
3,5843,808
16.916.1a
2.492.76a
2.101.86a
Decreased body wt; arterial bloodpH reduced; vital capacity, totallung capacities increased
Pepelko (1982a)
(<0.01 ppm O3)a
Guinea Pig,Hartley, M, F
20 h/day7 days/week4 weeks
6.8a 3,808 16.7 2.9 1.9 Exposure started when animalswere 4 days old; increase inpulmonary flow; bardycardia
Wiester et al. (1980)
(<0.01 ppm O3)a
Rat, F344,M
20 h/day5.5 days/week4 weeks
6.06.8 :m MMD
2,640 — — — Macrophage aggregation; increasein PMNs; Type II cellproliferation; thickened alveolarwalls
White and Garg (1981)
Guinea Pig, Hartley, M 30 min 1-2 mg DPMIntranasally
— — — — Augmented increases in nasalairway resistance and vascularpermeability induced by ahistamine aerosol
Kobayashi and Ito(1995)
Guinea Pig, Hartley, M 3 h 13.2
0.51.6
5.912.9
1.44.4
0.130.34
Similar results to those reported inthe previous study using intranasalchallenge
Kobayashi et al. (1997)

5-27
Table 5-2. Short-term effects of diesel exhaust on laboratory animals (continued)
Species/sex Exposure periodParticles(mg/m3)
C × T(mgAh/m3)
CO(ppm)
NO2
(ppm)SO2
(ppm) Effects Study
Guinea Pig, Hartley, M, F 20 h/day7 days/week8 weeks
6.3 7,056 17.4 2.3 2.1 Increase in relative lung wt. AMaggregation; hypertrophy of gobletcells; focal hyperplasia of alveolarepithelium
Wiester et al. (1980)
Mouse ICR, M 6 weeks 100 :g DPMintranasally
— — — — DPM aggravated ovalbumin-induced airway inflammation andprovided evidence that DPM canenhance manifestations of allergicasthma
Takano et al. (1997)
Rat, Sprague-Dawley,M
24 h 5-100 :g/106
AM/mL ofDPM
— — — — Unchanged, but not organic-freeDPM enhanced production ofproinflammatory cytokines
Yang et al. (1997)
aIrradiated exhaust.PMN = Polymorphonuclear leukocyte.AM = Alveolar macrophage.

5-28
In related studies, Wiester et al. (1980) evaluated pulmonary function in 4-day-old
guinea pigs exposed for 20 h/day, 7 days/week for 28 days to IE having a concentration of 6.3
mg/m3 DPM. When housed in the exposure chamber, pulmonary flow resistance increased 35%,
and a small but significant sinus bradycardia occurred as compared with controls housed and
measured in control air chambers (p<0.002). Respiratory rate, tidal volume, minute volume, and
dynamic compliance were unaffected, as were lead-1 electrocardiograms.
A separate group of adult guinea pigs was necropsied after 56 days of exposure to IE, to
diluted RE, or to clean air (Wiester et al., 1980). Exposure resulted in a significant increase in
the ratio of lung weight to body weight (0.68% for controls, 0.78% for IE, and 0.82% for RE).
Heart/body weight ratios were not affected by exposure. Microscopically, there was a marked
accumulation of black pigment-laden AMs throughout the lung, with a slight to moderate
accumulation in bronchial and carinal lymph nodes. Hypertrophy of goblet cells in the
tracheobronchial tree was frequently observed, and focal hyperplasia of alveolar lining cells was
occasionally observed. No evidence of squamous metaplasia of the tracheobronchial tree,
emphysema, peribronchitis, or peribronchiolitis was noted.
White and Garg (1981) studied pathologic alterations in the lungs of rats (16 exposed and
8 controls) after exposure to DE containing 6 mg/m3 DPM. Two rats from the exposed group
and one rat from the control group (filtered room air) were sacrificed after each exposure
interval of 6 h and 1, 3, 7, 14, 28, 42, and 63 days; daily exposures were for 20 h and were 5.5
days/week. Evidence of AM recruitment and phagocytosis of diesel particles was found at the 6-
h sacrifice; after 24 h of exposure there was a focal, scattered increase in the number of Type II
cells. After 4 weeks of exposure, there were morphologic changes in size, content, and shape of
AM, septal thickening adjacent to clusters of AMs, and an appearance of inflammatory cells,
primarily within the septa. At 9 weeks of exposure, focal aggregations of particle-laden
macrophages developed near the terminal bronchi, along with an influx of PMNs, Type II cell
proliferation, and thickening of alveolar walls. The affected alveoli occurred in clusters that, for
the most part, were located near the terminal bronchioles, but occasionally were focally located
in the lung parenchyma. Hypertrophy of goblet cells in the tracheobronchial tree was frequently
observed, and focal hyperplasia of alveolar lining cells was occasionally observed. No evidence
of squamous metaplasia of the tracheobronchial tree, emphysema, peribronchitis, or
peribronchiolitis was noted.
Mauderly et al. (1981) exposed rats and mice by inhalation to diluted DE for 545 h over
a 19-week period on a regimen of 7 h/day, 5 days/week at concentrations of 0, 0.21, 1.02, or
4.38 mg/m3 DPM. Indices of health effects were minimal following 19 weeks of exposure.
There were no significant exposure-related differences in mortality or body weights of the rats or
mice. There also were no significant differences in respiratory function (breathing patterns,
5-29
dynamic lung mechanics, lung volumes, quasi-static PV relationships, forced expirograms, and
CO-diffusing capacity) in rats; pulmonary function was not measured in mice. No effect on
tracheal mucociliary or deep lung clearances were observed in the exposed groups. Rats, but not
mice, had elevated immune responses in lung-associated lymph nodes at the two higher exposure
levels. Inflammation in the lungs of rats exposed to 4.38 mg/m3 DPM was indicated by
increases in PMNs and lung tissue proteases. Histopathologic findings included AMs that
contained DPM, an increase in Type II cells, and the presence of particles in the interstitium and
tracheobronchial lymph nodes.
Kaplan et al. (1982) evaluated the effects of subchronic exposure to DE on rats,
hamsters, and mice. The exhaust was diluted to a concentration of 1.5 mg/m3 DPM; exposures
were 20 h/day, 7 days/week. Hamsters were exposed for 86 days, rats and mice for 90 days.
There were no significant differences in mortality or growth rates between exposed and control
animals. Lung weight relative to body weight of rats exposed for 90 days was significantly
higher than the mean for the control group. Histological examination of tissues of all three
species indicated particle accumulation in the lungs and mediastinal lymph nodes. Associated
with the larger accumulations, there was a minimal increase in the thickness of the alveolar
walls, but the vast majority of the particles elicited no response. After 6 mo of recovery,
considerable clearance of the DPM from the lungs occurred in all three species, as evaluated by
gross pathology and histopathology. However, no quantitative estimate of clearance was
provided.
Toxic effects in animals from acute exposure to DE appear to be primarily attributable to
the gaseous components (i.e., mortality from CO intoxication and lung injury caused by cellular
damage resulting from NO2 exposure). The results from short-term exposures indicate that rats
experience minimal lung function impairment even at DE levels sufficiently high to cause
histological and cytological changes in the lung. In subchronic studies of durations of 4 weeks
or more, frank adverse health effects are not readily apparent and, when found, are mild and
result from exposure to concentrations of about 6 mg/m3 DPM and durations of exposures of 20
h/day. There is ample evidence that subchronic exposure to lower levels of DE affects the lung,
as indicated by accumulation of particles, evidence of inflammatory response, AM aggregation
and accumulation near the terminal bronchioles, Type II cell proliferation, and thickening of
alveolar walls adjacent to AM aggregates. Little evidence exists, however, that subchronic
exposure to DE impairs lung function.
5.1.3.3. Chronic Exposures
5.1.3.3.1. Effects on growth and longevity. Changes in growth, body weight, absolute or
relative organ weights, and longevity can be measurable indicators of chronic toxic effects.

5-30
Such effects have been observed in some, but not all, of the long-term studies conducted on
laboratory animals exposed to DE. There was limited evidence for an effect on survival in the
published chronic animal studies; deaths occurred intermittently early in one study in female rats
exposed to 3.7 mg/m3 DPM; however, the death rate began to decrease after 15 mo, and the
survival rate after 30 mo was slightly higher than that of the control group (Ishinishi et al.,
1988). Studies of the effects of chronic exposure to DE on survival and body weight or growth
are detailed in Table 5-3.
Increased lung weights and lung-to-body weight ratios have been reported in rats, mice,
and hamsters. These data are summarized in Table 5-4. In rats exposed for up to 36 weeks to
0.25 or 1.5 mg/m3 DPM, lung wet weights (normalized to body weight) were significantly
higher in the 1.5 mg/m3 exposure group than control values after 12 weeks of exposure
(Misiorowski et al., 1980). Rats and Syrian hamsters were exposed for 2 years (five 16-h
periods per week) to DE diluted to achieve concentrations of 0.7, 2.2, and 6.6 mg/m3 DPM
(Brightwell et al., 1986). At necropsy, a significant increase in lung weight was seen in both rats
and hamsters exposed to DE compared with controls. This finding was more pronounced in the
rats in which the increase was progressive with both duration of exposure and particulate matter
level. The increase was greatest at 30 mo (after the end of a 6-mo observation period in the
high-concentration male group where the lung weight was 2.7 times the control and at 24 mo in
the high-concentration female group [3.9 times control]). Heinrich et al. (1986a,b; see also
Stöber, 1986) found a significant increase in wet and dry weights of the lungs of rats and mice
exposed at 4.24 mg/m3 DPM for 1 year in comparison with controls. After 2 years, the
difference was a factor of 2 (mice) or 3 (rats). After the same exposure periods, the hamsters
showed increases of 50% to 75%, respectively. Exposure to equivalent filtered DE (i.e., without
DPM) caused no significant effects in any of the species. Vinegar et al. (1980, 1981a,b) exposed
hamsters to two levels of DE with resultant concentrations of about 6 and 12 mg/m3 DPM for 8
h/day, 7 days/week for 6 mo. Both exposures significantly increased lung weight and lung-
weight to body-weight ratios. The difference between lung weights of exposed and control
hamsters exposed to 12 mg/m3 DPM was approximately twice that of those exposed to 6 mg/m3.
Heinrich et al. (1995) reported that rats exposed to 2.5 and 7 mg/m3 DPM for 18 h/day,
5 days/week for 24 mo showed significantly lower body weights than controls starting at day
200 in the high-concentration group and at day 440 in the low-concentration group. Body
weight in the low-concentration group was unaffected, as was mortality in any group. Lung
weight was increased in the 7 mg/m3 group starting at 3 mo and persisting throughout the study,
while the 2.5 mg/m3 group showed increased lung weight only at 22 and 24 mo of exposure.
Mice (NMRI strain) exposed to 7 mg/m3 in this study for 13.5 mo had no increase in mortality
and insignificant decreases in body weight. Lung weights were dramatically affected, with

5-31
Table 5-3. Effects of chronic exposures to diesel exhaust on survival and growth of laboratory animals
Species/sexExposure
periodParticles(mg/m3)
C × T(mgAh/m3)
CO(ppm)
NO2
(ppm)SO2
(ppm) Effects Study
Rat, F344, M, F; Monkey, Cynomolgus, M
7 h/day5 days/week104 weeks
2.00.23–0.36: m MMD
7,280 11.5 1.5 0.8 No effects on growth or survival Lewis et al.(1989)
Rat, F344, M;Guinea Pig, Hartley, M
20 h/day5 days/week106 weeks
0.250.751.5
0.19 :m MMD
2,6507,950
15,900
2.7a
4.4a
7.1a
0.1b
0.27b
0.5b
———
Reduced body weight in rats at1.5 mg/m3
Schreck et al.(1981)
Hamster, Chinese, M 8 h/day7 days/week26 weeks
6.012.0
8,73617,472
——
——
——
No effect on growth Vinegar et al.(1981a,b)
Rat, Wistar, M 6 h/day5 days/week 87 weeks
8.30.71 :m MMD
21,663 50.0 4.0–6.0 — No effect on growth or mortalityrates
Karagianeset al. (1981)
Rat, F344, M, F;Mouse, CD-1, M, F
7 h/day5 days/week130 weeks
0.353.57.1
0.25 :m MMD
1,59215,92531,850
2.916.529.7
0.050.340.68
———
No effect on growth or mortalityrates
Mauderly et al.(1984, 1987a)
Rat, Wistar, F; Mouse, MMRI, F
19 h/day5 days/week104 weeks
4.240.35 :m MMD
41,891 12.5 1.5 1.1 Reduced body wts; increasedmortality in mice
Heinrich et al.(1986a)
Rat, F344M, F
16 h/day5 days/week104 weeks
0.72.26.6
5,82418,30454,912
——32.0
———
———
Growth reduced at 2.2 and6.6 mg/m3
Brightwell et al.(1986)
Ratc
F344/Jcl.16 h/day6 days/week130 weeks
0.11d
0.41d
1.08d
2.31d
3.72e
0.2–0.3 :m MMD
1,3735,117
13,47828,82946,426
1.232.123.967.10
12.9
0.080.260.701.413.00
0.381.062.424.704.57
Concentration-dependentdecrease in body weight; earlierdeaths in females exposed to 3.72mg/m3, stabilized by 15 mo
ResearchCommittee forHERP Studies(1988)
Rat, Wistar, F;Mouse, NMRI, F(7 mg/m3 only)
18 h/day5 days/week24 mo
0.842.56.98
7,40021,80061,700
2.68.3
21.2
0.31.23.8
0.31.13.4
Reduced body weight in rats at2.5 and 6.98 mg/m3 and no effectin mice
Heinrich et al.(1995)

5-32
Table 5-3. Effects of chronic exposures to diesel exhaust on survival and growth of laboratory animals (continued)
Species/sexExposure
periodParticles(mg/m3)
C × T(mgAh/m3)
CO(ppm)
NO2
(ppm)SO2
(ppm) Effects Study
Mice, NMRI, F;C57BL/6N, F
18 h/day5 days/week13.5 mo(NMRI)24 mo(C57BL/N)
6.98 35,500 - NMRI38,300 - C57
14.2 2.3 2.8 Reduced body weight in NMRImice but not in C57BL/6N mice
Heinrich et al.(1995)
Rats, F344, M 16 h/day5 days/week23 mo
2.446.33
19,52050,640
——
——
——
Reduced survival in 6.33 mg/m3
after 300 days. Body weightsignificantly lower at 6.33 mg/m3
Nikula et al.(1995)
Mouse, CD-1,M,F
7 h/day5 days/week104 weeks
0.353.57.1
0.25 :m MDD
1,27412,74025,844
31730
0.10.30.7
———
No effect on growth or mortalityrates
Mauderly et al.(1996)
aEstimated from graphically depicted mass concentration data.bEstimated from graphically presented mass concentration data for NO2 (assuming 90% NO and 10% NO2).cData for tests with light-duty engine; similar results with heavy-duty engine.dLight-duty engine.eHeavy-duty engine.
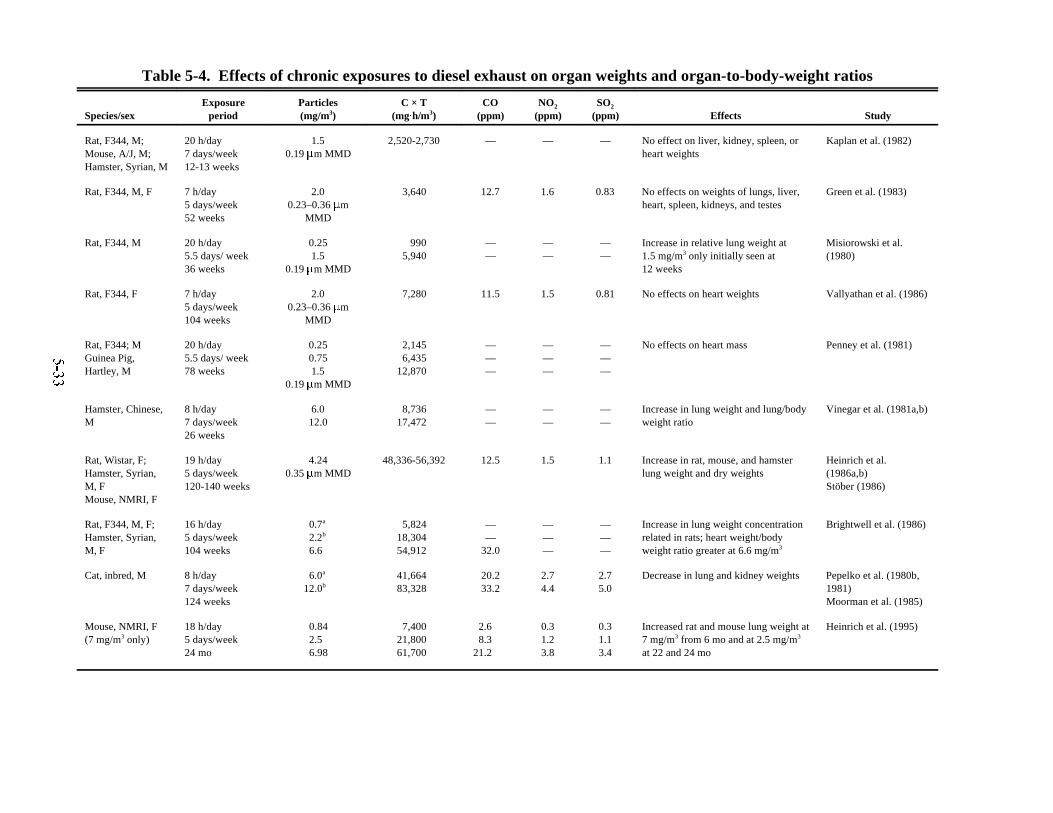
5-33
Table 5-4. Effects of chronic exposures to diesel exhaust on organ weights and organ-to-body-weight ratios
Species/sexExposure
periodParticles(mg/m3)
C × T(mgAh/m3)
CO(ppm)
NO2
(ppm)SO2
(ppm) Effects Study
Rat, F344, M;Mouse, A/J, M;Hamster, Syrian, M
20 h/day7 days/week12-13 weeks
1.50.19 :m MMD
2,520-2,730 — — — No effect on liver, kidney, spleen, orheart weights
Kaplan et al. (1982)
Rat, F344, M, F 7 h/day5 days/week52 weeks
2.00.23–0.36 :m
MMD
3,640 12.7 1.6 0.83 No effects on weights of lungs, liver,heart, spleen, kidneys, and testes
Green et al. (1983)
Rat, F344, M 20 h/day5.5 days/ week36 weeks
0.251.5
0.19 :m MMD
9905,940
——
——
——
Increase in relative lung weight at1.5 mg/m3 only initially seen at12 weeks
Misiorowski et al.(1980)
Rat, F344, F 7 h/day5 days/week104 weeks
2.00.23–0.36 :m
MMD
7,280 11.5 1.5 0.81 No effects on heart weights Vallyathan et al. (1986)
Rat, F344; MGuinea Pig,Hartley, M
20 h/day5.5 days/ week78 weeks
0.250.751.5
0.19 :m MMD
2,1456,435
12,870
———
———
———
No effects on heart mass Penney et al. (1981)
Hamster, Chinese,M
8 h/day7 days/week26 weeks
6.012.0
8,73617,472
——
——
——
Increase in lung weight and lung/bodyweight ratio
Vinegar et al. (1981a,b)
Rat, Wistar, F;Hamster, Syrian,M, FMouse, NMRI, F
19 h/day5 days/week120-140 weeks
4.240.35 :m MMD
48,336-56,392 12.5 1.5 1.1 Increase in rat, mouse, and hamsterlung weight and dry weights
Heinrich et al.(1986a,b)Stöber (1986)
Rat, F344, M, F;Hamster, Syrian,M, F
16 h/day5 days/week104 weeks
0.7a
2.2b
6.6
5,82418,30454,912
——
32.0
———
———
Increase in lung weight concentrationrelated in rats; heart weight/bodyweight ratio greater at 6.6 mg/m3
Brightwell et al. (1986)
Cat, inbred, M 8 h/day7 days/week124 weeks
6.0a
12.0b41,66483,328
20.233.2
2.74.4
2.75.0
Decrease in lung and kidney weights Pepelko et al. (1980b,1981)Moorman et al. (1985)
Mouse, NMRI, F(7 mg/m3 only)
18 h/day5 days/week24 mo
0.842.56.98
7,40021,80061,700
2.68.3
21.2
0.31.23.8
0.31.13.4
Increased rat and mouse lung weight at7 mg/m3 from 6 mo and at 2.5 mg/m3
at 22 and 24 mo
Heinrich et al. (1995)

5-34
Table 5-4. Effects of chronic exposures to diesel exhaust on organ weights and organ-to-body-weight ratios (continued)
Species/sexExposure
periodParticles(mg/m3)
C × T(mgAh/m3)
CO(ppm)
NO2
(ppm)SO2
(ppm) Effects Study
Mouse, NMRI, F;C57BL/6N, F
18 h/day5 days/week13.5 mo (NMRI)24 mo(C57BL/N)
6.98 35,500 - NMRI38,300 - C57
14.2 2.3 2.8 Increased lung weight Heinrich et al. (1995)
Rats, F344, M 16 h/day5 days/week23 mo
2.446.33
19,52050,640
——
——
——
Increase in lung weight was significantat 2 and 6 mg/m3
Nikula et al. (1995)
Rat 0.82.56.98
Increased lung weight in rats and miceat 3.5 and 7.1 mg/m3
Henderson et al.(1988a)
Mouse 6.984.5
a1 to 61 weeks of exposure.b62 to 124 weeks of exposure.

5-35
increases progressing throughout the study from 1.5-fold at 3 mo to 3-fold at 12 mo. Mice
(NMRI and C57BL/6N strains) were also exposed to 4.5 mg/m3 for 23 mo. In NMRI mice, the
body weights were reported to be significantly lower than controls, but the magnitude of the
change is not reported, so biological significance cannot be assessed. Mortality was slightly
increased, but statistical significance is not reported. The C57BL/6N mice showed minimal
effects on body weight and mortality, which were not statistically significant. Lung weights
were dramatically affected in both strains.
Nikula et al. (1995) exposed male and female F344 rats to DPM concentrations of 2.4
and 6.3 mg/m3 for 16 h/day, 5 days/week for 23 mo in a study designed to compare the effects of
DPM with those of carbon black. Significantly reduced survival was observed in males exposed
to 6.3 mg/m3 but not in females or at the lower concentration. Body weights were decreased by
exposure to 6.3 mg/m3 DPM in both male and female rats throughout the exposure period.
Significant increases in lung weight were first seen at 6 mo in the high-exposure group and at
12 to 18 mo in the low-exposure group.
No evidence was found in the published literature that chronic exposure to DE affected
the weight of body organs other than the lung and heart (e.g., liver, kidney, spleen, or testes)
(Table 5-4). Morphometric analysis of hearts from rats and guinea pigs exposed to 0.25, 0.75, or
1.5 mg/m3 DPM 20 h/day, 5.5 days/week for 78 weeks revealed no significant alteration in mass
at any exposure level or duration of exposure (Penney et al., 1981). The analysis included
relative wet weights of the right ventricle, left ventricle, combined atria, and ratio of right to left
ventricle. Vallyathan et al. (1986) found no significant differences in heart weights and the ratio
of heart weight to body weight between rats exposed to 2 mg/m3 DPM for 7 h/day, 5 days/week
for 24 mo and their respective clean-air chamber controls. No significant differences were found
in the lungs, heart, liver, spleen, kidney, and testes of rats exposed for 52 weeks, 7 h/day, 5
days/week to diluted DE containing 2 mg/m3 DPM compared with their respective controls
(Green et al., 1983).
5.1.3.3.2. Effects on pulmonary function. The effect of long-term exposure to DE on
pulmonary function has been evaluated in laboratory studies of rats, hamsters, cats, and
monkeys. These studies are summarized in Table 5-5, along with more details on the exposure
characteristics, in general order of increasing dose (C × T) of DPM. The text will be presented
using the same approach.
Lewis et al. (1989) evaluated functional residual capacity and airway resistance and
conductance in 10 control and 10 diesel-exposed rats (2 mg/m3 DPM, 7 h/day, 5 days/week for
52 or 104 weeks). At the 104-week evaluation, the rats were also examined for maximum flow
volume impairments. No evidence of impaired pulmonary function as a result of the exposure to

5-36
Table 5-5. Effects of diesel exhaust on pulmonary function of laboratory animals
Species/sexExposure
periodParticles(mg/m3)
C × T(mgAh/m3)
CO(ppm)
NO2
(ppm)SO2
(ppm) Effects Study
Rat, F344, M, F 7 h/day5 days/week104 weeks
2.00.23–0.36 :m
MMD
7,280 11.5 1.5 0.8 No effect on pulmonary function Lewis et al. (1989)
Monkey,Cynomolgus, M
7 h/day5 days/week104 weeks
2.00.23-0.36 :m
MMD
7,280 11.5 1.5 0.8 Decreased expiratory flow; no effecton vital or diffusing capacities
Lewis et al. (1989)
Rat, F344, M 20 h/day5.5 days/week87 weeks
1.50.19 :m MMD
14,355 7.0 0.5 — Increased functional residual capacity,expiratory volume, and flow
Gross (1981)
Rat, Wistar, F 7-8 h/day5 days/week104 weeks
3.90.1 :m MMD
14,196-16,224 18.5 1.2 3.1 No effect on minute volume,compliance, or resistance
Heinrich et al. (1982)
Hamster, Chinese, M 8 h/day7 days/week26 weeks
6.012.0
8,73617,472
——
——
——
Decrease in vital capacity, residualvolume, and diffusing capacity;increase in static deflation lungvolume
Vinegar et al. (1980,1981a,b)
Rat, F344, M, F
7 h/day5 days/week130 weeks
0.353.57.1
0.23–0.26 :mMMD
1,59315,92531,850
2.916.529.7
0.050.340.68
———
Diffusing capacity, lung compliancereduced at 3.5 and 7.1 mg/m3
Mauderly et al. (1988)McClellan et al. (1986)
Rat, F344, M, F;Hamster, Syrian, M, F
16 h/day5 days/week104 weeks
0.72.26.6
5,82418,30454,912
———
———
———
Large number of pulmonary functionchanges consistent with obstructiveand restrictive airway diseases at6.6 mg/m3 (no specific data provided)
Brightwell et al. (1986)
Hamster, Syrian, M, F 19 h/day5 days/week120 weeks
4.240.35 :m MMD
48,336 12.5 1.5 1.1 Significant increase in airwayresistance
Heinrich et al. (1986a)
Rat, Wistar, F 19 h/day5 days/week140 weeks
4.240.35 :m MMD
56,392 12.5 1.5 1.1 Decrease in dynamic lung compliance;increase in airway resistance
Heinrich et al. (1986a)
Cat, inbred, M 8 h/day7 days/week124 weeks
6.0a
12.0b
41,66483,328
20.233.3
2.74.4
2.15.0
Decrease in vital capacity, total lungcapacity, and diffusing capacity after2 years; no effect on expiratory flow
Pepelko et al. (1980b,1981)Moorman et al. (1985)
a1 to 61 weeks exposure.b62 to 124 weeks of exposure.

5-37
DE was found in rats. Lewis et al. (1989) exposed male cynomolgus monkeys to DE for 7
h/day, 5 days/week for 24 mo. Groups of 15 monkeys were exposed to air, DE (2 mg/m3), coal
dust, or combined coal dust and DE. Pulmonary function was evaluated prior to exposure and at
6-mo intervals during the 2-year exposure, including compliance and resistance, static and
dynamic lung volumes, distribution of ventilation, diffusing capacity, and maximum ventilatory
performance. There were no effects on lung volumes, diffusing capacity, or ventilation
distribution, so there was no evidence of restrictive disease. There was, however, evidence of
obstructive airway disease as measured by low maximal flow rates in diesel-exposed monkeys.
At 18 mo of exposure, forced expiratory flow at 25% of vital capacity and forced expiratory
flow normalized to FVC were decreased. The measurement of forced expiratory flow at 40% of
total lung capacity was significantly decreased at 12, 18, and 24 mo of exposure. The finding of
an obstructive effect in monkeys contrasts with the finding of restrictive type effects in other
laboratory animal species (Vinegar et al., 1980, 1981a; Mauderly et al., 1988; Pepelko et al.,
1980b, 1981) and suggests a possible difference in effect between primate and small animal
respiratory tracts. In these monkeys there were no specific histopathological effects reported
(see next section), although particle aggregates were reported in the distal airways, suggesting
more small airway deposition.
Gross (1981) exposed rats for 20 h/day, 5.5 days/week for 87 weeks to DE containing 1.5
mg/m3 DPM. When the data were normalized (e.g., indices expressed in units of airflow or
volume for each animal by its own forced expiratory volume), there were no apparent
functionally significant changes occurring in the lungs at 38 weeks of exposure that might be
attributable to the inhalation of DE. After 87 weeks of exposure, functional residual capacity
(FRC) and its component volumes (expiratory reserve [ER] and residual volume [RV]),
maximum expiratory flow (MEF) at 40% FVC, MEF at 20% FVC, and FEV0.1 were
significantly greater in the diesel-exposed rats. An observed increase in airflow at the end of the
forced expiratory maneuver when a decreased airflow would be expected from the increased
FRC, ER, and RV data (the typical scenario of human pulmonary disease) showed these data to
be inconsistent with known clinically significant health effects. Furthermore, although the lung
volume changes in the diesel-exposed rats could have been indicative of emphysema or chronic
obstructive lung disease, this interpretation was contradicted by the airflow data, which suggest
simultaneous lowering of the resistance of the distal airways.
Heinrich et al. (1982) evaluated the pulmonary function of rats exposed to a
concentration of 3.9 mg/m3 DPM for 7 to 8 h/day, 5 days/week for 2 years. When compared
with a control group, no significant changes in respiratory rate, minute volume, compliance, or
resistance occurred in the exposed group (number of rats per group was not stated).
Chinese hamsters (eight or nine per group) were exposed 8 h/day, 7 days/week, for 6 mo
to concentrations of either about 6 mg/m3 or about 12 mg/m3 DPM (Vinegar et al., 1980,
5-38
1981a,b). Vital capacity, vital capacity/lung weight ratio, residual lung volume by water
displacement, and CO2 diffusing capacity decreased significantly in hamsters exposed to
6 mg/m3 DPM. Static deflation volume-pressure curves showed depressed deflation volumes for
diesel-exposed hamsters when volumes were corrected for body weight and even greater
depressed volumes when volumes were corrected for lung weight. However, when volumes
were expressed as percentage of vital capacity, the diesel-exposed hamsters had higher lung
volumes at 0 and 5 cm H2O. In the absence of confirmatory histopathology, the authors
tentatively concluded that these elevated lung volumes and the significantly reduced diffusing
capacity in the same hamsters were indicative of possible emphysematous changes in the lung.
Similar lung function changes were reported in hamsters exposed at 12 mg/m3 DPM, but detailed
information was not reported. It was stated, however, that the decrease in vital capacity was
176% greater in the second experiment than in the first.
Mauderly et al. (1988; see also McClellan et al., 1986) examined the impairment of
respiratory function in rats exposed for 7 h/day, 5 days/week for 24 mo to diluted DE with 0.35,
3.5, or 7.1 mg/m3 DPM. After 12 mo of exposure to the highest concentration of DE, the
exposed rats (n = 22) had lower total lung capacity (TLC), dynamic lung compliance (Cdyn),
FVC, and CO diffusing capacity than controls (n = 23). After 24 mo of exposure to 7.1 mg/m3
DPM, mean TLC, Cdyn, quasi-static chord compliance, and CO diffusing capacity were
significantly lower than control values. Nitrogen washout and percentage of FVC expired in 0.1
s were significantly greater than control values. There was no evidence of airflow obstruction.
The functional alterations were attributed to focal fibrotic and emphysematous lesions and
thickened alveolar membranes observed by histological examination. Similar functional
alterations and histopathologic lesions were observed in the rats exposed to 3.5 mg/m3 DPM, but
such changes usually occurred later in the exposure period and were generally less pronounced.
There were no significant decrements in pulmonary function for the 0.35 mg/m3 group at any
time during the study nor were there reported histopathologic changes in this group.
Mauderly et al. (1989) examined the effects of DE on normal rats and on rats with
experimentally induced pulmonary emphysema to see if emphysematous rats have increased
susceptibility to DPM. The results from parallel lifetime exposures of these 2 groups of rats at
3.5 mg/m3 DPM showed that only possibly 1 of 65 measured parameters gave results suggesting
that rats with emphysematous lungs might be more susceptible than rats with normal lungs to the
effects of DE exposure.
Additional studies were conducted by Heinrich et al. (1986a,b; see also Stöber, 1986) on
the effects of long-term exposure to DE on the pulmonary function of hamsters and rats. The
exhaust was diluted to achieve a concentration of 4.24 mg/m3 DPM; exposures were for 19
h/day, 5 days/week for a maximum of 120 weeks (hamsters) or 140 weeks (rats). After 1 year of
exposure to the DE, the hamsters exhibited a significant increase in airway resistance and a

5-39
nonsignificant reduction in lung compliance. For the same time period, rats showed increased
lung weights, a significant decrease in Cdyn, and a significant increase in airway resistance.
These indices did not change during the second year of exposure.
Syrian hamsters and rats were exposed to 0.7, 2.2, or 6.6 mg/m3 DPM for five 16-h
periods per week for 2 years (Brightwell et al., 1986). There were no treatment-related changes
in pulmonary function in the hamster. Rats exposed to the highest concentration of DE
exhibited changes in pulmonary function (data not presented) that were reported to be consistent
with a concentration-related obstructive and restrictive disease.
Pepelko et al. (1980b; 1981; see also Pepelko, 1982b) and Moorman et al. (1985)
measured the lung function of adult cats chronically exposed to DE. The cats were exposed for
8 h/day and 7 days/week for 124 weeks. Exposures were at 6 mg/m3 for the first 61 weeks and
12 mg/m3 from weeks 62 to 124. No definitive pattern of pulmonary function changes was
observed following 61 weeks of exposure; however, a classic pattern of restrictive lung disease
was found at 124 weeks. The significantly reduced lung volumes (TLC, FVC, FRC, and
inspiratory capacity [IC]) and the significantly lower single-breath diffusing capacity, coupled
with normal values for dynamic ventilatory function (mechanics of breathing), indicate the
presence of a lesion that restricts inspiration but does not cause airway obstruction or loss of
elasticity. This pulmonary physiological syndrome is consistent with an interstitial fibrotic
response that was later verified by histopathology (Plopper et al., 1983).
Pulmonary function impairment has been reported in rats, hamsters, cats, and monkeys
chronically exposed to DE. In all species but the monkey, the pulmonary function testing results
have been consistent with restrictive lung disease. The monkeys demonstrated evidence of small
airway obstructive responses. The disparity between the findings in monkeys and those in rats,
hamsters, and cats could be in part the result of increased particle retention in the smaller species
resulting from (1) exposure to DE that has higher airborne concentrations of gases, vapors, and
particles and/or (2) longer duration of exposure. The nature of the pulmonary impairment is also
dependent on the site of deposition and routes of clearance, which are determined by the
anatomy and physiology of the test laboratory species and the exposure regimen. The data on
pulmonary function effects raise the possibility that DE produces small airway disease in
primates compared with primarily alveolar effects in small animals and that similar changes
might be expected in humans and monkeys. The findings of Nikula et al. (1997a,b) suggest that
a larger fraction of particles are translocated to the interstitium of the respiratory tract in
primates that are heavily exposed than in rats that are heavily exposed, including the interstitium
of the respiratory bronchioles, an anatomical site absent in rats. Nikula and co-workers’
pulmonary histopathological findings may have a relationship to these functional findings (see
Chapter 3 for a complete discussion). Unfortunately, the available data in primates are too
limited to draw clear conclusions.

5-40
5.1.3.3.3. Lung morphology, biochemistry, and lung lavage analysis. Several studies have
examined the morphological, histological, and histochemical changes occurring in the lungs of
laboratory animals chronically exposed to DE. The histopathological effects of diesel exposure
in the lungs of laboratory animals are summarized in Table 5-6, ranked in order of C × T. Table
5-6 also contains an expanded description of exposures.
Kaplan et al. (1982) performed macroscopic and microscopic examinations of the lungs
of rats, mice, and hamsters exposed for 20 h/day, 7 days/week for 3 mo to DE containing 1.5
mg/m3 DPM. Gross examination revealed diffuse and focal deposition of the diesel particles that
produced a grayish overall appearance of the lungs with scattered, denser black areas. There was
clearance of particles via the lymphatics to regional lymph nodes. Microscopic examination
revealed no anatomic changes in the upper respiratory tract; the mucociliary border was normal
in appearance. Most of the particles were in macrophages, but some were free as small
aggregates on alveolar and bronchiolar surfaces. The particle-laden macrophages were often in
masses near the entrances of the lymphatic drainage and respiratory ducts. Associated with these
masses was a minimal increase in the thickness of the alveolar walls; however, the vast majority
of the particles elicited no response. After 6 mo of recovery, the lungs of all three species
contained considerably less pigment, as assessed by gross pathological and histopathological
examinations.
Lewis et al. (1989; see also Green et al., 1983) performed serial histological
examinations of rat lung tissue exposed to DE containing 2 mg/m3 DPM for 7 h/day, 7
days/week for 2 years. Accumulations of black-pigmented AMs were seen in the alveolar ducts
adjacent to terminal bronchioles as early as 3 mo of exposure, and particles were seen within the
interstitium of the alveolar ducts. These macular lesions increased in size up to 12 mo of
exposure. Collagen or reticulum fibers were seen only rarely in association with deposited
particles; the vast majority of lesions showed no evidence of fibrosis. There was no evidence of
focal emphysema with the macules. Multifocal histiocytosis (24% of exposed rats) was
observed only after 24 mo of exposure. These lesions were most commonly observed
subpleurally and were composed of collections of degenerating macrophages and amorphous
granular material within alveoli, together with fibrosis and chronic inflammatory cells in the
interstitium.
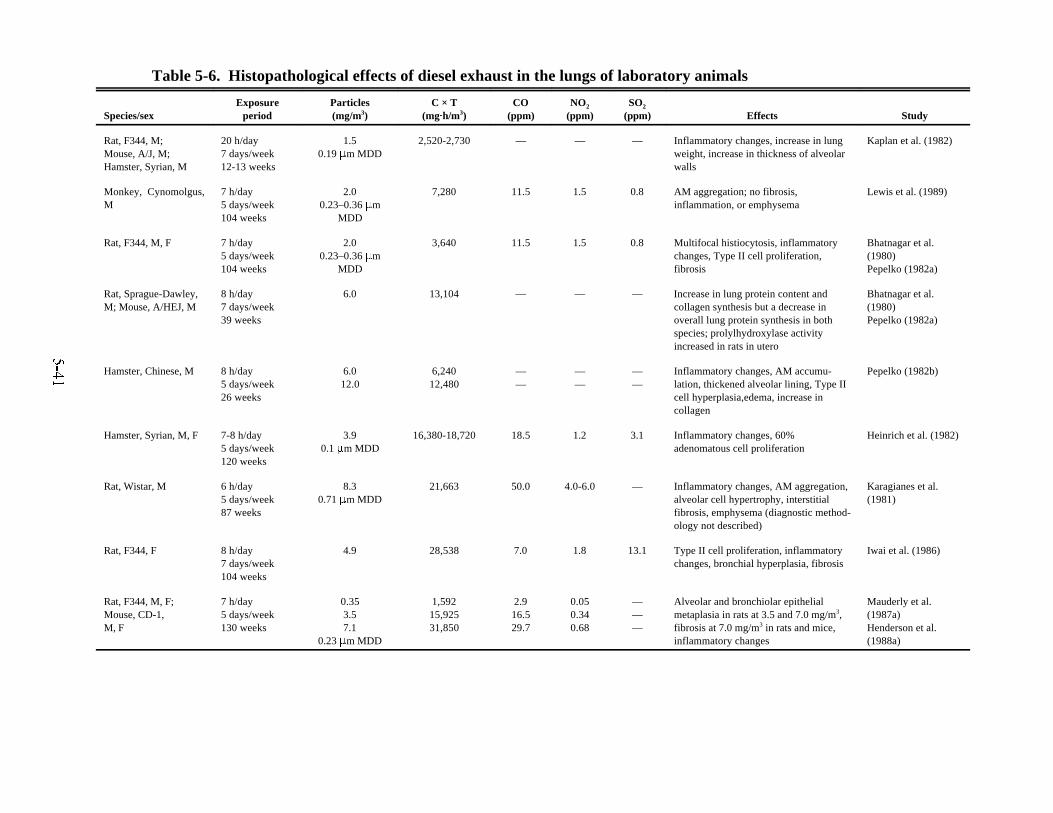
5-41
Table 5-6. Histopathological effects of diesel exhaust in the lungs of laboratory animals
Species/sexExposure
periodParticles(mg/m3)
C × T(mgAh/m3)
CO(ppm)
NO2
(ppm)SO2
(ppm) Effects Study
Rat, F344, M;Mouse, A/J, M;Hamster, Syrian, M
20 h/day7 days/week12-13 weeks
1.50.19 :m MDD
2,520-2,730 — — — Inflammatory changes, increase in lungweight, increase in thickness of alveolarwalls
Kaplan et al. (1982)
Monkey, Cynomolgus,M
7 h/day5 days/week104 weeks
2.00.23–0.36 :m
MDD
7,280 11.5 1.5 0.8 AM aggregation; no fibrosis,inflammation, or emphysema
Lewis et al. (1989)
Rat, F344, M, F 7 h/day5 days/week104 weeks
2.00.23–0.36 :m
MDD
3,640 11.5 1.5 0.8 Multifocal histiocytosis, inflammatorychanges, Type II cell proliferation,fibrosis
Bhatnagar et al.(1980) Pepelko (1982a)
Rat, Sprague-Dawley,M; Mouse, A/HEJ, M
8 h/day7 days/week39 weeks
6.0 13,104 — — — Increase in lung protein content andcollagen synthesis but a decrease inoverall lung protein synthesis in bothspecies; prolylhydroxylase activityincreased in rats in utero
Bhatnagar et al.(1980) Pepelko (1982a)
Hamster, Chinese, M 8 h/day5 days/week26 weeks
6.012.0
6,24012,480
——
——
——
Inflammatory changes, AM accumu-lation, thickened alveolar lining, Type IIcell hyperplasia,edema, increase incollagen
Pepelko (1982b)
Hamster, Syrian, M, F 7-8 h/day5 days/week120 weeks
3.90.1 :m MDD
16,380-18,720 18.5 1.2 3.1 Inflammatory changes, 60%adenomatous cell proliferation
Heinrich et al. (1982)
Rat, Wistar, M 6 h/day5 days/week87 weeks
8.30.71 :m MDD
21,663 50.0 4.0-6.0 — Inflammatory changes, AM aggregation,alveolar cell hypertrophy, interstitialfibrosis, emphysema (diagnostic method-ology not described)
Karagianes et al.(1981)
Rat, F344, F 8 h/day7 days/week104 weeks
4.9 28,538 7.0 1.8 13.1 Type II cell proliferation, inflammatorychanges, bronchial hyperplasia, fibrosis
Iwai et al. (1986)
Rat, F344, M, F;Mouse, CD-1,M, F
7 h/day5 days/week130 weeks
0.353.57.1
0.23 :m MDD
1,59215,92531,850
2.916.529.7
0.050.340.68
———
Alveolar and bronchiolar epithelialmetaplasia in rats at 3.5 and 7.0 mg/m3,fibrosis at 7.0 mg/m3 in rats and mice,inflammatory changes
Mauderly et al.(1987a) Henderson et al.(1988a)
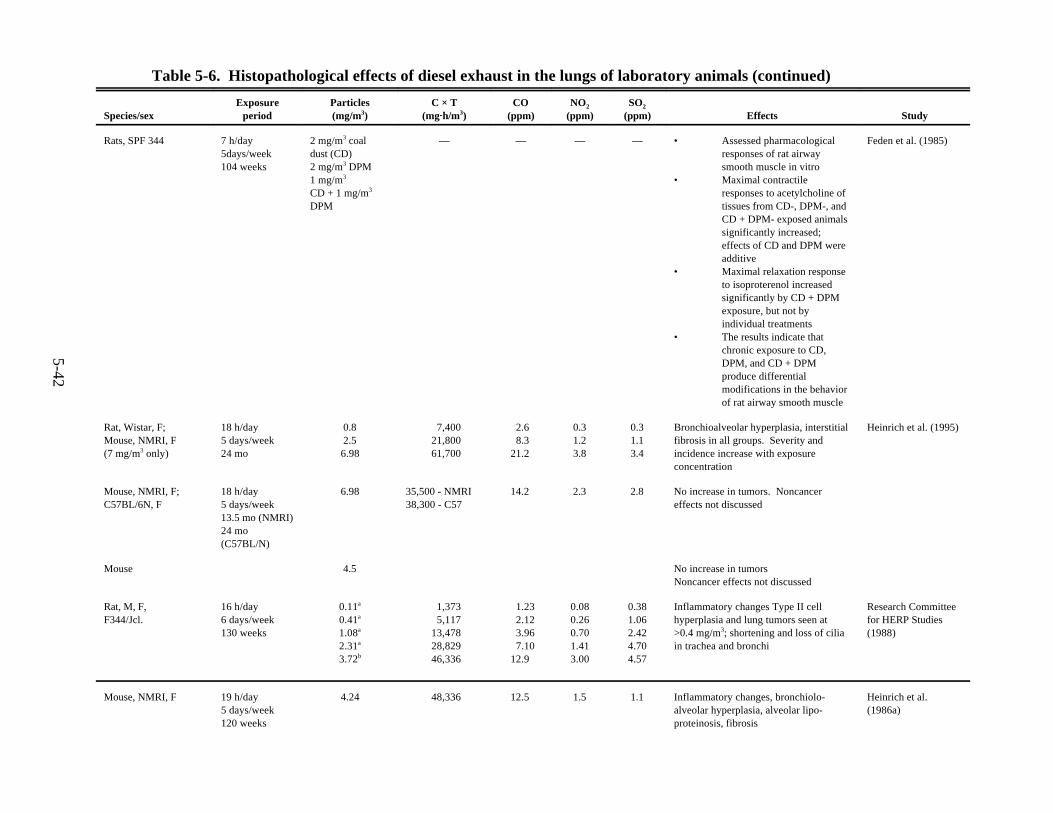
5-42
Table 5-6. Histopathological effects of diesel exhaust in the lungs of laboratory animals (continued)
Species/sexExposure
periodParticles(mg/m3)
C × T(mgAh/m3)
CO(ppm)
NO2
(ppm)SO2
(ppm) Effects Study
Rats, SPF 344 7 h/day5days/week 104 weeks
2 mg/m3 coaldust (CD) 2 mg/m3 DPM1 mg/m3 CD + 1 mg/m3
DPM
— — — — • Assessed pharmacologicalresponses of rat airwaysmooth muscle in vitro
• Maximal contractileresponses to acetylcholine oftissues from CD-, DPM-, andCD + DPM- exposed animalssignificantly increased;effects of CD and DPM wereadditive
• Maximal relaxation responseto isoproterenol increasedsignificantly by CD + DPMexposure, but not byindividual treatments
• The results indicate thatchronic exposure to CD,DPM, and CD + DPMproduce differentialmodifications in the behaviorof rat airway smooth muscle
Feden et al. (1985)
Rat, Wistar, F;Mouse, NMRI, F(7 mg/m3 only)
18 h/day5 days/week24 mo
0.82.56.98
7,40021,80061,700
2.68.3
21.2
0.31.23.8
0.31.13.4
Bronchioalveolar hyperplasia, interstitialfibrosis in all groups. Severity andincidence increase with exposureconcentration
Heinrich et al. (1995)
Mouse, NMRI, F;C57BL/6N, F
18 h/day5 days/week13.5 mo (NMRI)24 mo(C57BL/N)
6.98 35,500 - NMRI38,300 - C57
14.2 2.3 2.8 No increase in tumors. Noncancereffects not discussed
Mouse 4.5 No increase in tumorsNoncancer effects not discussed
Rat, M, F,F344/Jcl.
16 h/day6 days/week130 weeks
0.11a
0.41a
1.08a
2.31a
3.72b
1,3735,117
13,47828,82946,336
1.232.123.967.10
12.9
0.080.260.701.413.00
0.381.062.424.704.57
Inflammatory changes Type II cellhyperplasia and lung tumors seen at>0.4 mg/m3; shortening and loss of ciliain trachea and bronchi
Research Committeefor HERP Studies(1988)
Mouse, NMRI, F 19 h/day5 days/week120 weeks
4.24 48,336 12.5 1.5 1.1 Inflammatory changes, bronchiolo-alveolar hyperplasia, alveolar lipo-proteinosis, fibrosis
Heinrich et al.(1986a)

Table 5-6. Histopathological effects of diesel exhaust in the lungs of laboratory animals (continued)
Species/sexExposure
periodParticles(mg/m3)
C × T(mgAh/m3)
CO(ppm)
NO2
(ppm)SO2
(ppm) Effects Study
5-43
Rat, Wistar, F 19 h/day5 days/week140 weeks
4.24 56,392 12.5 1.5 1.1 Thickened alveolar septa; AMaggregation; inflammatory changes;hyperplasia; lung tumors
Heinrich et al.(1986a)
Guinea Pig, Hartley, M 20 h/day5.5 days/week104 weeks
0.250.751.56.0
2,8608,580
17,16068,640
————
————
————
Minimal response at 0.25 andultrastructural changes at 0.75 mg/m3;thickened alveolar membranes; cellproliferation; fibrosis at 6.0 mg/m3;increase in PMN at 0.75 mg/m3 and1.5 mg/m3
Barnhart et al. (1981,1982) Vostal et al. (1981)Wallace et al. (1987)
Cat, inbred, M 8 h/day7 days/week124 weeks
6.0c
12.0d41,66483,328
20.233.2
2.74.4
2.15.0
Inflammatory changes, AM aggregation,bronchiolar epithelial metaplasia, Type IIcell hyperplasia, peribronchiolar fibrosis
Plopper et al. (1983) Hyde et al. (1985)
Rat, F344, M 16 h/day5 days/week23 mo
2.446.33
19,52050,640
——
——
——
AM hyperplasia, epithelial hyperplasia,inflammation, septal fibrosis,bronchoalveolar metaplasia
Nikula et al. (1995)
Mouse, CD-1, M,F 7 h/day5 days/week104 weeks
0.353.57.1
0.25 :m MDD
1,27412,74025,844
31730
0.10.30.7
———
Exposure-related increase in lung soot,pigment-laden macrophages, lunglesions.Bronchiolization in alveolar ducts at7.1 mg/m3
Mauderly et al.(1996)
aLight-duty engine.bHeavy-duty engine.c1 to 61 weeks exposure.d62 to 124 weeks of exposure.
AM = Alveolar macrophage.PMN = Polymorphonuclear leukocyte.
5-44
Epithelial lining cells adjacent to collections of pigmented macrophages showed a marked
Type II cell hyperplasia; degenerative changes were not observed in Type I cells. Histological
examination of lung tissue from monkeys exposed for 24 mo in the same regimen as used
for rats revealed aggregates of black particles, principally in the distal airways of the lung.
Particles were present within the cytoplasm of macrophages in the alveolar spaces as well
as the interstitium. Fibrosis, focal emphysema, or inflammation was not observed. No specific
histopathological lesions were reported for the monkey.
Nikula et al. (1997a,b) reevaluated the lung tissue from this study. They concluded that
there were no significant differences in the amount of retained particulate matter between
monkeys and rats exposed under the same conditions. The rats, however, retained a greater
portion of the particulate matter in lumens of the alveolar ducts and alveoli than did the
monkeys. Conversely, monkeys retained a greater portion of the particulate material in the
interstitium than did rats. Aggregations of particle-laden macrophages in the alveoli were rare,
and there were few signs of particle-associated inflammation in the monkeys. Minimal
histopathologic lesions were detected in the interstitium.
Histopathological effects of DE on the lungs of rats have been investigated by the Health
Effects Research Program on Diesel Exhaust (HERP) in Japan (Ishinishi et al., 1986, 1988).
Both light-duty (LD) and heavy-duty (HD) diesel engines were used. The exhaust was diluted to
achieve nominal concentrations of 0.1 (LD only), 0.4 (LD and HD), 1 (LD and HD), 2 (LD and
HD), and 4 (HD only) mg/m3 DPM. Rats were exposed for 16 h/day, 6 days/week for 30 mo.
No histopathological changes were observed in the lungs of rats exposed to 0.4 mg/m3 DPM or
less. At concentrations above 0.4 mg/m3 DPM, severe morphological changes were observed.
These changes consisted of shortened and absent cilia in the tracheal and bronchial epithelium,
marked hyperplasia of the bronchiolar epithelium, and swelling of the Type II cellular
epithelium. These lesions appeared to increase in severity with increases in exhaust
concentration and duration of exposure. There was no difference in the degree of changes in
pulmonary pathology at the same concentrations between the LD and the HD series.
Heinrich et al. (1982) investigated histological changes occurring in the respiratory tract
of hamsters exposed to DE. Exposures were for 7 to 8 h/day, 5 days/week for 104 weeks to DE
diluted to achieve a concentration of 3.9 mg/m3 DPM. Significantly higher numbers of hamsters
in the group exposed to DE exhibited definite proliferative changes in the lungs compared with
the groups exposed to particle-free DE or clean air. Sixty percent of these changes were
described as adenomatous proliferations.
Heinrich et al. (1995) reported increased incidence and severity of bronchioloalveolar
hyperplasia in rats exposed to 0.8, 2.5, and 7 mg/m3. The lesion in the lowest concentration
group was described as very slight to moderate. Slight to moderate interstitial fibrosis also
increased in incidence and severity in all exposed groups, but incidences were not reported. This
5-45
chronic study also exposed NMRI mice to 7 mg/m3 for 13.5 mo and both NMRI and C56BL/6N
mice to 4.5 mg/m3 for 24 mo. Noncancer histological endpoints are not discussed in any detail
in the report, which is focused on the carcinogenicity of diesel as compared with titanium
dioxide and carbon black.
Iwai et al. (1986) performed serial histopathology on the lungs of rats at 1, 3, 6, 12, and
24 mo of exposure to DE. Exposures were for 8 h/day, 7 days/week for 24 mo; the exposure
atmosphere contained 4.9 mg/m3 DPM. At 1 and 3 mo of exposure, there were minimal
histological changes in the lungs of the exposed rats. After 6 mo of exposure, there were
particle-laden macrophages distributed irregularly throughout the lung and a proliferation of
Type II cells with adenomatous metaplasia in areas where the macrophages had accumulated.
After 1 year of exposure, foci of heterotrophic hyperplasia of ciliated or nonciliated bronchiolar
epithelium on the adjacent alveolar walls were more common, the quantity of deposited
particulate matter increased, and the number of degenerative AMs and proliferative lesions of
Type II or bronchiolar epithelial cells increased. After 2 years of exposure, there was a fibrous
thickening of the alveolar walls, mast-cell infiltration with epithelial hyperplasia in areas where
the macrophages had accumulated, and neoplasms.
Heinrich et al. (1986a; see also Stöber, 1986) performed histopathologic examinations of
the respiratory tract of hamsters, mice, and rats exposed to DE that had 4 mg/m3 DPM.
Exposures were for 19 h/day, 5 days/week; the maximum exposure period was 120 weeks for
hamsters and mice and 140 weeks for rats. Histological examination revealed different levels of
response among the three species. In hamsters, the exhaust produced thickened alveolar septa,
bronchioloalveolar hyperplasia, and what were termed emphysematous lesions (diagnostic
methodology not described). In mice, bronchoalveolar hyperplasia occurred in 64% of the mice
exposed to the exhaust and in 5% of the controls. Multifocal alveolar lipoproteinosis occurred in
71% and multifocal interstitial fibrosis occurred in 43% of the mice exposed to exhaust but in
only 4% of the controls. In exposed rats, there were severe inflammatory changes in the lungs,
as well as thickened septa, foci of macrophages, and hyperplastic and metaplastic lesions.
Nikula et al. (1995) reported in detail the nonneoplastic effects in male and female
F344 rats exposed to 2.4 or 6.3 mg/m3 of DPM. At 3 mo in the low-concentration group,
enlarged particle-containing macrophages were found with minimal aggregation. With higher
concentration and longer duration of exposure, the number and size of macrophages and
aggregates increased. Alveolar epithelial hyperplasia was found starting at 3 mo and in all rats
at 6 mo. These lesions progressed to chronic active inflammation, alveolar proteinosis, and
septal fibrosis at 12 mo. Other lesions observed late in the study included bronchiolar-alveolar
metaplasia, squamous metaplasia, and squamous cysts. This study reports in detail the
progression of lesions in DE exposure and finds relatively little difference between the lesions
caused by DE exposure and exposure to similar levels of carbon black particles.
5-46
The effects of DE on the lungs of rats exposed to 8.3 ± 2.0 mg/m3 DPM were
investigated by Karagianes et al. (1981). Exposures were for 6 h/day, 5 days/week, for 4, 8, 16,
or 20 mo. Histological examinations of lung tissue noted focal aggregation of particle-laden
AMs, alveolar histiocytosis, interstitial fibrosis, and alveolar emphysema (diagnostic
methodology not described). Lesion severity was related to length of exposure. No significant
differences were noted in lesion severity among the DE, the DE plus coal dust (5.8 ± 3.5
mg/m3), or the high-concentration (14.9 ± 6.2 mg/m3) coal dust exposure groups following 20
mo of exposure.
Histological changes in the lungs of guinea pigs exposed to diluted DE containing either
0.25, 0.75, 1.5, or 6.0 mg/m3 DPM were reported by Barnhart et al. (1981; 1982). Exposures at
0.75 and 1.5 mg/m3 for 2 weeks to 6 mo resulted in an uptake of exhaust particles by three
alveolar cell types (AMs, Type I cells, and interstitial macrophages) and also by granulocytic
leukocytes (eosinophils). The alveolar-capillary membrane increased in thickness as a result of
an increase in the absolute tissue volume of interstitium and Type II cells. In a continuation of
these studies, guinea pigs were exposed to DE (up to 6.0 mg/m3 DPM) for 2 years (Barnhart et
al., 1982). A minimal tissue response occurred at a concentration of 0.25 mg/m3. After 9 mo of
exposure, there was a significant increase, about 30%, in Type I and II cells, endothelial cells,
and interstitial cells over concurrent age-matched controls; by 24 mo only macrophages and
Type II cells were significantly increased. As in the earlier study, ultrastructural evaluation
showed that Type I cells, AMs, and eosinophils phagocytized the diesel particles. Exposure to
0.75 mg/m3 for 6 mo resulted in fibrosis in regions of macrophage clusters and in focal Type II
cell proliferation. No additional information was provided regarding the fibrotic changes with
increasing concentration or duration of exposure. With increasing concentration/duration of DE
exposure, Type II cell clusters occurred in some alveoli. Intraalveolar debris was particularly
prominent after exposures at 1.5 and 6.0 mg/m3 and consisted of secretory products from Type II
cells.
In studies conducted on hamsters, Pepelko (1982b) found that the lungs of hamsters
exposed for 8 h/day, 7 days/week for 6 mo to 6 or 12 mg/m3 DPM were characterized by large
numbers of black AMs in the alveolar spaces, thickening of the alveolar epithelium, hyperplasia
of Type II cells, and edema.
Lungs from rats and mice exposed to 0.35, 3.5, or 7.1 mg/m3 (0.23 to 0.26 :m mass
median diameter [MMD]) for 7 h/day and 5 days/week showed pathologic lesions (Mauderly
et al., 1987a; Henderson et al., 1988a). After 1 year of exposure at 7.1 mg/m3, the lungs of the
rats exhibited focal areas of fibrosis; fibrosis increased with increasing duration of exposure and
was observable in the 3.5-mg/m3 group of rats at 18 mo. The severity of inflammatory
responses and fibrosis was directly related to the exposure level. In the 0.35 mg/m3 group of
rats, there was no inflammation or fibrosis. Although the mouse lungs contained higher burdens

5-47
of diesel particles per gram of lung weight at each equivalent exposure concentration, there was
substantially less inflammatory reaction and fibrosis than was the case in rats. Fibrosis was
observed only in the lungs of mice exposed at 7.1 mg/m3 and consisted of fine fibrillar
thickening of occasional alveolar septa.
Histological examinations were performed on the lungs of cats initially exposed to
6 mg/m3 DPM for 61 weeks and subsequently increased to 12 mg/m3 for Weeks 62 to 124 of
exposure. Plopper et al. (1983; see also Hyde et al., 1985) concluded from the results of this
study that exposure to DE produced changes in both epithelial and interstitial tissue
compartments and that the focus of these lesions in the peripheral lung was the centriacinar
region where the alveolar ducts join the terminal conducting airways. This conclusion was based
on the following evidence. The epithelium of the terminal and respiratory bronchioles in
exposed cats consisted of three cell types (ciliated, basal, and Clara cells) compared with only
one type (Clara cells) in the controls. The proximal acinar region showed evidence of
peribronchial fibrosis and bronchiolar epithelial metaplasia. Type II cell hyperplasia was present
in the proximal interalveolar septa. The more distal alveolar ducts and the majority of the rest of
the parenchyma were unchanged from controls. Peribronchial fibrosis was greater at the end of
6 mo in clean air following exposure, whereas the bronchiolar epithelial metaplasia was most
severe at the end of exposure. Following an additional 6 mo in clean air, the bronchiolar
epithelium more closely resembled the control epithelial cell population.
Wallace et al. (1987) used transmission electron microscopy (TEM) to determine the
effect of DE on the intravascular and interstitial cellular populations of the lungs of exposed rats
and guinea pigs. Exposed animals and matched controls were exposed to 0.25, 0.75, 1.5, or 6.0
mg/m3 DPM for 2, 6, or 10 weeks or 18 mo. The results inferred the following: (1) exposure to
6.0 mg/m3 for 2 weeks was insufficient to elicit any cellular response, (2) both species
demonstrated an adaptive multicellular response to DE, (3) increased numbers of fibroblasts
were found in the interstitium from week 6 of exposure through month 18, and (4) there was no
significant difference in either cell type or number in alveolar capillaries, but there was a
significant increase at 18 mo in the mononuclear population in the interstitium of both species.
Additional means for assessing the adverse effects of DE on the lung are to examine
biochemical and cytological changes in bronchoalveolar lavage fluid (BALF) and in lung tissue.
Fedan et al. (1985) performed studies to determine whether chronic exposure of rats affected the
pharmacologic characteristics of rat airway smooth muscle. Concentration-response
relationships for tension changes induced with acetylcholine, 5-hydroxytryptamine, potassium
chloride, and isoproterenol were assessed in vitro on isolated preparations of airway smooth
muscle (trachealis). Chronic exposure to DE significantly increased the maximal contractile
responses to acetylcholine compared with control values; exposure did not alter the sensitivity

5-48
(EC50 values) of the muscles to the agonists. Exposures were to DE containing 2 mg/m3 DPM
for 7 h/day, 5 days/week for 2 years.
Biochemical studies of BALF obtained from hamsters and rats revealed that exposures to
DE caused significant increases in lactic dehydrogenase, alkaline phosphatase, glucose-6-
phosphate dehydrogenase (G6P-DH), total protein, collagen, and protease (pH 5.1) after
approximately 1 year and 2 years of exposure (Heinrich et al., 1986a). These responses were
generally much greater in rats than in hamsters. Exposures were to DE containing 4.24 mg/m3
DPM for 19 h/day, 5 days/week for 120 (hamsters) to 140 (rats) weeks.
Protein, $-glucuronidase activity, and acid phosphatase activity were significantly
elevated in BALF obtained from rats exposed to DE containing 0.75 or 1.5 mg/m3 DPM for
12 mo (Strom, 1984). Exposure for 6 mo resulted in significant increases in acid phosphatase
activity at 0.75 mg/m3 and in protein, $-glucuronidase, and acid phosphatase activity at the
1.5 mg/m3 concentration. Exposure at 0.25 mg/m3 DPM did not affect the three indices
measured at either time period. The exposures were for 20 h/day, 5.5 days/week for 52 weeks.
Additional biochemical studies (Misiorowski et al., 1980) were conducted on laboratory
animals exposed under the same conditions and at the same site as reported on by Strom (1984).
In most cases, exposures at 0.25 mg/m3 did not cause any significant changes. The DNA content
in lung tissue and the rate of collagen synthesis were significantly increased at 1.5 mg/m3 DPM
after 6 mo. Collagen deposition was not affected. Total lung collagen content increased in
proportion to the increase in lung weight. The activity of prolyl hydroxylase was significantly
increased at 12 weeks at 0.25 and 1.5 mg/m3; it then decreased with age. Lysal oxidase activity
did not change. After 9 mo of exposure, there were significant increases in lung phospholipids
in rats and guinea pigs exposed to 0.75 mg/m3 and in lung cholesterol in rats and guinea pigs
exposed to 1.5 mg/m3. Pulmonary prostaglandin dehydrogenase activity was stimulated by an
exposure at 0.25 mg/m3 but was not affected by exposure at 1.5 mg/m3 (Chaudhari et al., 1980,
1981). Exposures for 12 or 24 weeks resulted in a concentration-dependent lowering of this
enzyme activity. Exposure of male rats and guinea pigs at 0.75 mg/m3 for 12 weeks did not
cause any changes in glutathione levels of the lung, heart, or liver. Rats exposed for 2 mo at
6 mg/m3 showed a significant depletion of hepatic glutathione, whereas the lung showed an
increase of glutathione (Chaudhari and Dutta, 1982). Schneider and Felt (1981) reported that
similar exposures did not substantially change adenylate cyclase and guanylate cyclase activities
in lung or liver tissue of exposed rats and guinea pigs.
Bhatnagar et al. (1980; see also Pepelko, 1982a) evaluated changes in the biochemistry of
lung connective tissue of diesel-exposed rats and mice. The mice were exposed for 8 h/day and
7 days/week for up to 9 mo to exhaust containing 6 mg/m3 DPM. Total lung protein content was
measured, as was labeled proline and labeled leucine. Leucine incorporation is an index of total
protein synthesis, although collagen is very low in leucine. Proline incorporation reflects

5-49
collagen synthesis. Amino acid incorporation was measured in vivo in the rat and in short-term
organ culture in mice. Both rats and mice showed a large increase in total protein (41% to 47%
in rats), while leucine incorporation declined and proline incorporation was unchanged. These
data are consistent with an overall depression of protein synthesis in diesel-exposed animals and
also with a relative increase in collagen synthesis compared to other proteins. The increase in
collagen synthesis suggested proliferation of connective tissue and possible fibrosis (Pepelko,
1982a).
A number of reports (McClellan et al., 1986; Mauderly et al., 1987a, 1990a; Henderson
et al., 1988a) have addressed biochemical and cytological changes in lung tissue and BALF of
rodents exposed for 7 h/day, 5 days/week for up to 30 mo at concentrations of 0, 0.35, 3.5, or
7.1 mg/m3 DPM. At the lowest exposure level (0.35 mg/m3), no biochemical or cytological
changes occurred in the BALF or in lung tissue in either Fischer 344 rats or CD-1 mice.
Henderson et al. (1988a) provide considerable time-course information on inflammatory events
taking place throughout a chronic exposure. A chronic inflammatory response was seen at the
two higher exposure levels in both species, as evidenced by increases in inflammatory cells
(macrophages and neutrophils), cytoplasmic and lysosomal enzymes (lactate dehydrogenase,
glutathione reductase, and $-glucuronidase), and protein (hydroxyproline) in BALF. Analysis
of lung tissue indicated similar changes in enzyme levels as well as an increase in total lung
collagen content. After 18 mo of exposure, lung tissue glutathione was depleted in a
concentration-dependent fashion in rats but was slightly increased in mice. Lavage fluid levels
of glutathione and glutathione reductase activity increased in a concentration-dependent manner
and were higher in mice than in rats.
Rats exposed for up to 17 days to diluted DE (3.5 mg/m3 DPM) had a fivefold increase in
the bronchoconstrictive prostaglandin PGF2" and a twofold increase in the inflammatory
leukotriene LTB4. In similarly exposed mice, there was a twofold increase in both parameters.
These investigators (Henderson et al., 1988a,b) concluded that the release of larger amounts of
such mediators of inflammation from the alveolar phagocytic cells of rats accounted for the
greater fibrogenic response seen in that species.
Biochemical analysis of lung tissue from cats exposed for 124 weeks and held in clean
air for an additional 26 weeks indicated increases of lung collagen; this finding was confirmed
by an observed increase in total lung wet weight and in connective tissue fibers estimated
morphometrically (Hyde et al., 1985). Exposures were for 7 h/day, 5 days/week at 6 mg/m3
DPM for 61 weeks and at 12 mg/m3 for weeks 62 to 124.
Heinrich et al. (1995) reported on bronchoalveolar lavage in animals exposed for 24 mo
and found exposure-related increases in lactate dehydrogenase, $-glucuronidase, protein, and
hydroxyproline in groups exposed to 2.5 or 7 mg/m3, although detailed data are not presented.
Lavage analyses were not carried out in concurrent studies in mice.
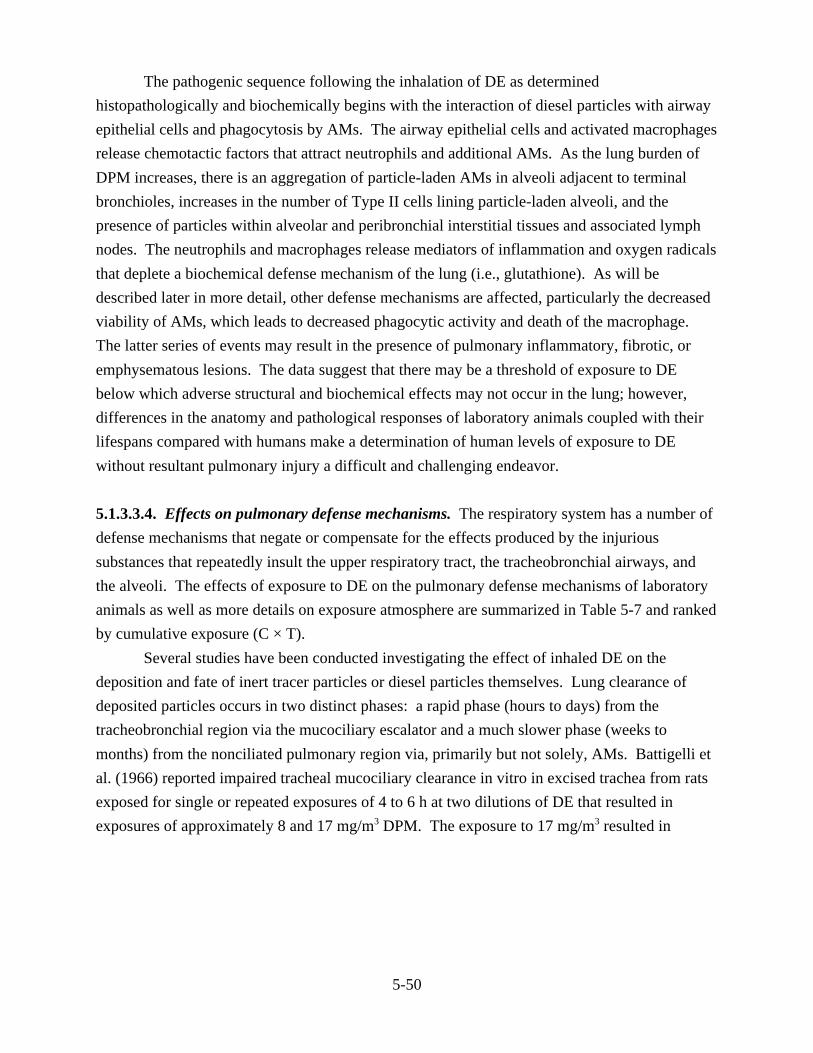
5-50
The pathogenic sequence following the inhalation of DE as determined
histopathologically and biochemically begins with the interaction of diesel particles with airway
epithelial cells and phagocytosis by AMs. The airway epithelial cells and activated macrophages
release chemotactic factors that attract neutrophils and additional AMs. As the lung burden of
DPM increases, there is an aggregation of particle-laden AMs in alveoli adjacent to terminal
bronchioles, increases in the number of Type II cells lining particle-laden alveoli, and the
presence of particles within alveolar and peribronchial interstitial tissues and associated lymph
nodes. The neutrophils and macrophages release mediators of inflammation and oxygen radicals
that deplete a biochemical defense mechanism of the lung (i.e., glutathione). As will be
described later in more detail, other defense mechanisms are affected, particularly the decreased
viability of AMs, which leads to decreased phagocytic activity and death of the macrophage.
The latter series of events may result in the presence of pulmonary inflammatory, fibrotic, or
emphysematous lesions. The data suggest that there may be a threshold of exposure to DE
below which adverse structural and biochemical effects may not occur in the lung; however,
differences in the anatomy and pathological responses of laboratory animals coupled with their
lifespans compared with humans make a determination of human levels of exposure to DE
without resultant pulmonary injury a difficult and challenging endeavor.
5.1.3.3.4. Effects on pulmonary defense mechanisms. The respiratory system has a number of
defense mechanisms that negate or compensate for the effects produced by the injurious
substances that repeatedly insult the upper respiratory tract, the tracheobronchial airways, and
the alveoli. The effects of exposure to DE on the pulmonary defense mechanisms of laboratory
animals as well as more details on exposure atmosphere are summarized in Table 5-7 and ranked
by cumulative exposure (C × T).
Several studies have been conducted investigating the effect of inhaled DE on the
deposition and fate of inert tracer particles or diesel particles themselves. Lung clearance of
deposited particles occurs in two distinct phases: a rapid phase (hours to days) from the
tracheobronchial region via the mucociliary escalator and a much slower phase (weeks to
months) from the nonciliated pulmonary region via, primarily but not solely, AMs. Battigelli et
al. (1966) reported impaired tracheal mucociliary clearance in vitro in excised trachea from rats
exposed for single or repeated exposures of 4 to 6 h at two dilutions of DE that resulted in
exposures of approximately 8 and 17 mg/m3 DPM. The exposure to 17 mg/m3 resulted in

5-51
Table 5-7. Effects of exposure to diesel exhaust on the pulmonary defense mechanisms of laboratory animals
Species/sexExposure
periodParticles(mg/m3)
C × T(mgAh/m3)
CO(ppm)
NO2
(ppm)SO2
(ppm) Effects Study
Alveolar macrophage status
Guinea Pig,Hartley
20 h/day5.5days/week8 weeks
0.251.5
0.19 :m MDD
2201,320
2.97.5
——
——
No significant changes in absolute numbersof AMs
Chen et. al. (1980)
Rat, F344, M 7 h/day5 days/week104 weeks
2.00.23–0.36 :m
MDD
7,280 11.5 1.5 0.81 Little effect on viability, cell number, oxygenconsumption, membrane integrity, lyzomalenzyme activity, or protein content of AMs;decreased cell volume and ruffling of cellmembrane and depressed luminescence ofAM
Castranova et al. (1985)
Rat, F344, M 20 h/day5.5days/week26, 48, or 52 weeks
0.25a
0.75a
1.5b
0.19 :m MDD
715-8,580 2.94.87.5
———
———
AM cell counts proportional to concentrationof DPM at 0.75 and 1.5 mg/m3; AMincreased in lungs in response to rate of DPMmass entering lung rather than total DPMburden in lung; increased PMNs wereproportional to inhaled concentrations and/orduration of exposure; PMNs affiliated withclusters of aggregated AM rather than DPM
Strom (1984)Vostal et al. (1982)
Rat F344/Crl,M, FMouse, CD, M, F
7 h/day5 days/week104 weeks(rat),78 weeks(mouse)
0.353.57.0
0.25 :m MDD
1,274c
12,740c
25,480c
2.916.529.7
0.050.340.68
———
Significant increases of AM in rats and miceexposed to 7.0 mg/m3 DPM for 24 and 18mo, respectively, but not at concentrations of3.5 or 0.35 mg/m3 DPM for the same expos-ure durations; PMNs increased in a dose-dependent fashion in both rats and miceexposed to 3.5 or 7.0 mg/m3 DPM and weregreater in mice than in rats
Henderson et al. (1988a)
Rat, Wistar, F 18 h/day5 days/week24 mo
0.82.57.1
7,40021,80061,700
2.68.321.2
0.31.13.4
———
Changes in differential cell counts in lunglavage
Heinrich et al. (1995)
Rat, F344/Crl, M 7 h/day5 days/week24 mo
3.49 12,704 9.8 1.2 — Significantly reduced AM in lavage at 24 mo Mauderly et al. (1990a)

5-52
Table 5-7. Effects of exposure to diesel exhaust on the pulmonary defense mechanisms of laboratory animals(continued)
Species/sexExposure
periodParticles(mg/m3)
C × T(mgAh/m3)
CO(ppm)
NO2
(ppm)SO2
(ppm) Effects Study
Clearance
Rat, M, F 7 h/day5 days/week12 weeks
0.21.04.5
0.25:m MDD
84420
1,890
———
———
———
Evidence of apparent speeding of trachealclearance at the 4.5 mg/m3 level after 1 weekof 99mTc macroaggregated-albumin andreduced clearance of tracer aerosol in each ofthe three exposure levels at 12 weeks; indica-tion of a lower percentage of ciliated cells atthe 1.0 and 4.5 mg/m3 levels
Wolff and Gray (1980)
Rat, Wistar, F 18 h/day5 days/week24 mo
0.82.57.1
7,40021,80061,700
2.68.3
21.2
0.31.23.8
0.31.13.4
Significant increase in clearance half-time ofinhaled labeled aerosols in all groups at 3-18mo
Heinrich et al. (1995)
Rat, F344, M, developing 0-6 mo adult 6-12 mo
7 h/day5 days/week6 mo
3.55 3,321 7.9 9.5 Clearance of 2 :m, aluminosilicate particles. Half-time significantly increased in adult, notdifferent in developing rats
Mauderly et al. (1987b)
Rat, F344, M, F 7 h/day5 days/week18 weeks
0.150.944.1
<0.5 :m MDD
94.5592
2,583
———
———
———
Lung burdens of DPM were concentration-related; clearance half-time of DPM almostdouble in 4.1 mg/m3 group compared to 0.15mg/m3 group
Griffis et al. (1983)
Rat, F344, M 7 h/day5 days/week26-104weeks
2.00.23-0.36 :m
MDD
1,820-7,280 11.5 1.5 0.8 No difference in clearance of 59Fe3O4
particles 1 day after tracer aerosoladministration; 120 days after exposuretracer aerosol clearance was enhanced; lungburden of DPM increased significantlybetween 12 and 24 mo of exposure
Lewis et al. (1989)
Rat, Sprague-Dawley, M
4-6 h/day7 days/week0.1 to 14.3weeks
0.98.017.0
2.5-10,210 ———
5.02.78.0
0.20.61.0
Impairment of tracheal mucociliary clearancein a concentration-response manner
Battigelli et al. (1966)

5-53
Table 5-7. Effects of exposure to diesel exhaust on the pulmonary defense mechanisms of laboratory animals(continued)
Species/sexExposure
periodParticles(mg/m3)
C × T(mgAh/m3)
CO(ppm)
NO2(ppm)
SO2(ppm) Effects Study
Rat, F344,M, F
7 h/day5 days/week130 weeks
0.353.57.1
0.25 :m MDD
1,59315,92531,850
2.916.529.7
0.10.30.7
———
No changes in tracheal mucociliary clearanceafter 6, 12, 18, 24, or 30 mo of exposure;increases in lung clearance half-times asearly as 6 mo at 7.0 mg/m3 level and 18 moat 3.5 mg/m3 level; no changes seen at 0.35mg/m3 level; after 24 mo of diesel exposure,long-term clearance half-times wereincreased in the 3.5 and 7.0 mg/m3 groups
Wolff et al. (1987)
Rat, F344/Crl, M 7 h/day5 days/week24 mo
3.49 12,704 9.8 1.2 — Doubling of long-term clearance half-timefor clearance of 1.0 :m aluminosilicateparticles. Less effect on clearance in animalswith experimentally induced emphysema
Mauderly et al. (1990a)
Microbial-induced mortality
Mice CD-1, F 7 h/day5 days/week4, 12, or26 weeks
2.00.23–0.36 :m
MDD
280-1,820 11.5 1.5 0.8 Mortality similar at each exposure durationwhen challenged with Ao/PR/8/34 influenzavirus; in mice exposed for 3 and 6 mo, butnot 1 mo, there were increases in thepercentages of mice having lungconsolidation, higher virus growth, depressedinterferon levels, and a fourfold reduction inhemagglutinin antibody levels
Hahon et al. (1985)
Mice, CR/CD-1, F 8 h/day7 days/week2 h up to 46 weeks
5.3 to 7.9 11-20,350 19to22
1.8to3.6
0.9to2.8
Enhanced susceptibility to lethal effects ofS. pyogenes infections at all exposuredurations (2 and 6 h; 8, 15, 16, 307, and 321days); inconclusive results withS. typhimurium because of high mortalityrates in controls; no enhanced mortalitywhen challenged with A/PR8-3 influenzavirus
Campbell et al. (1980, 1981)
aChronic exposure lasted 52 weeks.bChronic exposure lasted 48 weeks. cCalculated for 104-week exposure.DPM = Diesel particulate matter.AM = Alveolar macrophage.PMN = Polymorphonuclear leukocyte.

5-54
decreased clearance after a single exposure as well as after a cumulative exposure of 34 or 100 h.
Clearance was reduced to a lesser extent and in fewer tracheas from animals exposed to 8 mg/m3
for a cumulative exposure of 40 h. Lewis et al. (1989) found no difference in the clearance of59Fe3O4 particles (1.5 :m MMAD, Fg 1.8) 1 day after dosing control and DE-exposed rats (2
mg/m3, 7 h/day, 5 days/week for 8 weeks).
Wolff et al. (1987) and Wolff and Gray (1980) studied the effects of both subchronic and
chronic DE exposure on the tracheal clearance of particles. Tracheal clearance assessments were
made by measuring the retention of radiolabeled technetium macroaggregated-albumin
remaining 1 h after instillation in the distal trachea of rats. In the subchronic studies, rats were
exposed to 0.2, 1.0, or 4.5 mg/m3 DPM on a 7 h/day, 5 days/week schedule for up to 12 weeks.
After 1 week there was an apparent speeding of tracheal clearance at the 4.5 mg/m3 exposure
level (p=0.10), which returned toward baseline after 6 weeks and was slightly below the baseline
rate at 12 weeks. In the 1.0 mg/m3 group, there was a progressive significant reduction in the
clearance rate at 6 and 12 weeks of exposure. There was a trend toward reduced clearance in the
0.2 mg/m3 group. Scanning electron micrographs indicated minimal changes in ciliary
morphology; however, there was an indication of a lower percentage of ciliated cells at the 1.0
and 4.5 mg/m3 levels. In the chronic studies, rats were exposed to 0, 0.35, 3.5, or 7.1 mg/m3 for
7 h/day, 5 days/week for 30 mo. There were no significant differences in tracheal clearance
rates between the control group and any of the exposure groups after 6, 12, 18, 24, or 30 mo of
exposure. The preexposure measurements for all groups, however, were significantly lower than
those during the exposure period, suggesting a possible age effect. The preexposure value for
the 3.5-mg/m3 group was also significantly lower than the control group.
There is a substantial body of evidence for an impairment of particle clearance from the
bronchiole-alveolar region of rats following exposure to DE. Griffis et al. (1983) exposed rats 7
h/day, 5 days/week for 18 weeks to DE at 0.15, 0.94, or 4.1 mg/m3 DPM. Lung burdens of the
0.15, 0.94, and 4.1 mg/m3 levels were 35, 220, and 1,890 :g/g lung, respectively, 1 day after the
18-week exposure. The clearance half-time of the DPM was significantly greater, almost
double, for the 4.1 mg/m3 exposure group than for those of the lower exposure groups, 165 ± 8
days versus 99 ± 8 days (0.94 mg/m3) and 87 ± 28 days (0.15 mg/m3), respectively.
Chan et al. (1981) showed a dose-related slowing of 14C-diesel particle clearance in rats
preexposed to DE at 0.25 or 6 mg/m3 particulate matter for 20 h/day, 7 days/week for 7 to 112
days. Clearance was inhibited in the 6 mg/m3 group when compared by length of exposure or
compared with the 0.25 mg/m3 or control rats at the same time periods.
Heinrich et al. (1982) evaluated lung clearance in rats exposed for approximately 18 mo
at 3.9 mg/m3 DPM for 7 to 8 h/day, 5 days/week. Following exposure to 59Fe2O3-aerosol, the
rats were returned to the DE exposure and the radioactivity was measured over the thoracic area

5-55
at subsequent times. The biological half-life of the iron oxide deposited in the rats’ lungs was
nearly twice that of controls.
Heinrich also used labeled iron oxide aerosols to study clearance in rats exposed to 0.8,
2.5, or 7 mg/m3 diesel DPM for 24 mo (Heinrich et al., 1995). Clearance measurements were
carried out at 3, 12, and 18 mo of exposure. Half-times of clearance were increased in a
concentration- and duration-related manner in all exposed groups, with a range of a 50%
increase in the 0.8 mg/m3 group at 3 mo to an 11-fold increase in the 7 mg/m3 group at 19 mo.
The differential cell counts in these animals were stated to have shown clear effects in the 2.5
and 7 mg/m3 groups, but specific information about the changes is not reported.
Wolff et al. (1987) investigated alterations in DPM clearance from the lungs of rats
chronically exposed to DE at 0, 0.35, 3.5, or 7.1 mg/m3 DPM for 7 h/day, 5 days/week for up to
24 mo. Progressive increases in lung burdens were observed over time in all groups; levels of
DPM in terms of milligrams per lung were 0.60, 11.5, and 20.5 after 24 mo of exposure at the
0.35, 3.5, or 7.1 mg/m3 exposure levels, respectively. There were significant increases in 16-day
clearance half-times of inhaled radiolabeled particles of 67Ga2O3 (0.1 :m MMD) as early as
6 mo at the 7.1 mg/m3 level and 18 mo at the 3.5 mg/m3 level; no significant changes were seen
at the 0.35 mg/m3 level at any time point examined. Rats inhaled fused aluminosilicate particles
(2 :m MMAD) labeled with 134Cs after 24 mo of DE exposure; long-term clearance half-times
were 79, 81, 264, and 240 days for the 0, 0.35, 3.5, and 7.1 mg/m3 groups, respectively.
Differences were significant between the control and the 3.5 and 7.1 mg/m3 groups (p < 0.01),
but not between the control and the 0.35 mg/m3 group.
Mauderly et al. (1987b) compared the effects of DE in the developing lung to the adult
lung by exposing groups of male F344 rats to 3.5 mg/m3 for 7 h/day, 5 days/week for 6 mo. One
group (adult) was exposed between 6 and 12 mo of age, and the other was exposed beginning in
utero and until 6 mo of age. Clearance of an inhaled monodisperse 2 :m aluminosilicate
particle was measured after exposure for 6 mo. The clearance half-time of the slow phase was
found to be doubled in the diesel-exposed adult rats compared with age-matched controls and
was not significantly affected in developing rat lungs.
Mauderly et al. (1990a) compared the effects of DE in normal lungs with rats in which
emphysema had been induced experimentally by instillation of elastase 6 weeks before DE
exposures. The rats were exposed to 3.5 mg/m3 DPM for 7 h/day, 5 days/week for 24 mo.
Measurements included histopathology, clearance, pulmonary function, lung lavage, and
immune response. In the rats that were not pretreated with elastase, there was a significant
reduction in the number of macrophages recovered by pulmonary lavage in contrast to the
increases in macrophages reported by Strom (1984) and Henderson et al. (1988). The half-time
of the slow phase of clearance of inhaled, 1 :m, monodisperse particles was doubled in the
animals without elastase pretreatment. The elastase pretreatment did not affect clearance in

5-56
unexposed animals but significantly reduced the effect of diesel. The clearance half-time was
significantly less in elastase-pretreated, diesel-exposed animals than in diesel-exposed normal
animals. Many other effects measured in this study were also less affected by diesel exposure in
elastase-treated animals. Measurements of lung burden of DPM showed that elastase-pretreated
animals accumulated less than half as much DPM mass as normal animals exposed at the same
time, suggesting that the difference in effect could be explained by differences in dose to the
lung. The composite results of this study indicate that, at least in a murine laboratory animal
species, the presence of a pulmonary restrictive disease such as emphysema does not seem to
exacerbate the effects of chronic exposure to diesel.
Lewis et al. (1989) conducted lung burden and 59Fe3O4 tracer studies in rats exposed for
12 and 24 mo to 2 mg/m3 DPM (7 h/day, 5 days/week). The slope of the Fe3O4 clearance curve
of the DPM-exposed animals was significantly steeper than that of the controls, indicating a
more rapid alveolar clearance of the deposited 59Fe3O4. After 120 days from the inhalation of the
tracer particle, 19% and 8% of the initially deposited 59Fe3O4 were present in the lungs of control
and DE-exposed rats, respectively. The lung burden of DPM, however, increased significantly
between 12 and 24 mo of exposure (0.52 to 0.97% lung dry weight), indicating a later dose-
dependent inhibition of clearance.
Alveolar macrophages, because of their phagocytic and digestive capabilities, are one of
the prime defense mechanisms of the alveolar region of the lung against inhaled particles. Thus,
characterization of the effects of DE on various properties of AMs provides information on the
integrity or compromise of a key pulmonary defense mechanism. The physiological viability of
AMs from diesel-exposed rats was assessed after 2 years of exposure by Castranova et al.
(1985). The 7 h/day, 5 days/week exposure at 2 mg/m3 DPM had little effect on the following:
viability, cell number, oxygen consumption, membrane integrity, lysosomal enzyme activity, or
protein content of the AMs. A slight decrease in cell volume, a decrease in chemiluminescence
indicative of a decreased secretion of reactive oxygen species, and a decrease in ruffling of the
cell membrane were observed. These latter findings could be reflective of an overall reduction
in phagocytic activity.
Exposure to DE has been reported both to increase the number of recoverable AMs from
the lung (Strom, 1984; Vostal et al., 1982; Henderson et al., 1988a) or to produce no change in
numbers (Chen et al., 1980; Castranova et al., 1985). Strom (1984) found that in rats exposed to
0.25 mg/m3 DPM for 20 h/day, 5.5 days/week for 6 mo or 1 year, as well as in the controls, BAL
cells consisted entirely of AMs, with no differences in the cell counts in the lavage fluid. At the
higher concentrations, 0.75 or 1.5 mg DPM/m3, the count of AM increased proportionally with
the exposure concentration; the results were identical for AMs at both 6 and 11 or 12 mo of
exposure. The increase in AM counts was much larger after exposure to 1.5 mg/m3 DPM for
6 mo than after exposure to 0.75 mg/m3 for 1 year, although the total mass (calculated as C × T)
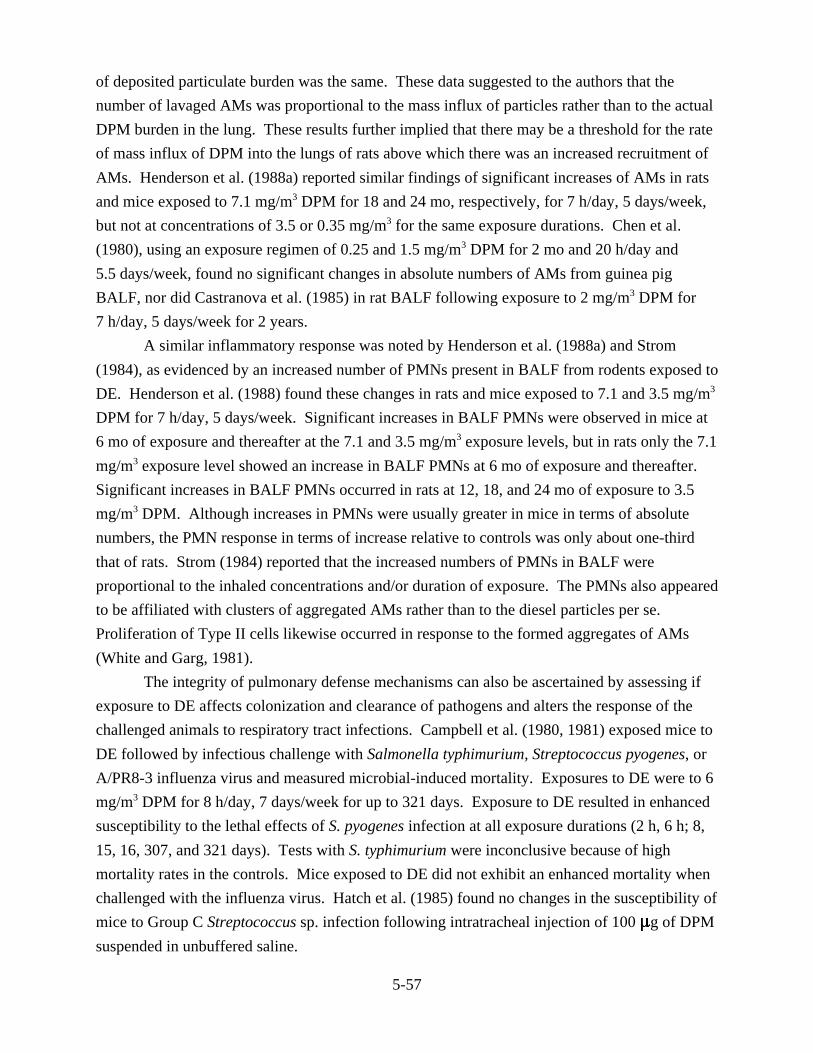
5-57
of deposited particulate burden was the same. These data suggested to the authors that the
number of lavaged AMs was proportional to the mass influx of particles rather than to the actual
DPM burden in the lung. These results further implied that there may be a threshold for the rate
of mass influx of DPM into the lungs of rats above which there was an increased recruitment of
AMs. Henderson et al. (1988a) reported similar findings of significant increases of AMs in rats
and mice exposed to 7.1 mg/m3 DPM for 18 and 24 mo, respectively, for 7 h/day, 5 days/week,
but not at concentrations of 3.5 or 0.35 mg/m3 for the same exposure durations. Chen et al.
(1980), using an exposure regimen of 0.25 and 1.5 mg/m3 DPM for 2 mo and 20 h/day and
5.5 days/week, found no significant changes in absolute numbers of AMs from guinea pig
BALF, nor did Castranova et al. (1985) in rat BALF following exposure to 2 mg/m3 DPM for
7 h/day, 5 days/week for 2 years.
A similar inflammatory response was noted by Henderson et al. (1988a) and Strom
(1984), as evidenced by an increased number of PMNs present in BALF from rodents exposed to
DE. Henderson et al. (1988) found these changes in rats and mice exposed to 7.1 and 3.5 mg/m3
DPM for 7 h/day, 5 days/week. Significant increases in BALF PMNs were observed in mice at
6 mo of exposure and thereafter at the 7.1 and 3.5 mg/m3 exposure levels, but in rats only the 7.1
mg/m3 exposure level showed an increase in BALF PMNs at 6 mo of exposure and thereafter.
Significant increases in BALF PMNs occurred in rats at 12, 18, and 24 mo of exposure to 3.5
mg/m3 DPM. Although increases in PMNs were usually greater in mice in terms of absolute
numbers, the PMN response in terms of increase relative to controls was only about one-third
that of rats. Strom (1984) reported that the increased numbers of PMNs in BALF were
proportional to the inhaled concentrations and/or duration of exposure. The PMNs also appeared
to be affiliated with clusters of aggregated AMs rather than to the diesel particles per se.
Proliferation of Type II cells likewise occurred in response to the formed aggregates of AMs
(White and Garg, 1981).
The integrity of pulmonary defense mechanisms can also be ascertained by assessing if
exposure to DE affects colonization and clearance of pathogens and alters the response of the
challenged animals to respiratory tract infections. Campbell et al. (1980, 1981) exposed mice to
DE followed by infectious challenge with Salmonella typhimurium, Streptococcus pyogenes, or
A/PR8-3 influenza virus and measured microbial-induced mortality. Exposures to DE were to 6
mg/m3 DPM for 8 h/day, 7 days/week for up to 321 days. Exposure to DE resulted in enhanced
susceptibility to the lethal effects of S. pyogenes infection at all exposure durations (2 h, 6 h; 8,
15, 16, 307, and 321 days). Tests with S. typhimurium were inconclusive because of high
mortality rates in the controls. Mice exposed to DE did not exhibit an enhanced mortality when
challenged with the influenza virus. Hatch et al. (1985) found no changes in the susceptibility of
mice to Group C Streptococcus sp. infection following intratracheal injection of 100 :g of DPM
suspended in unbuffered saline.
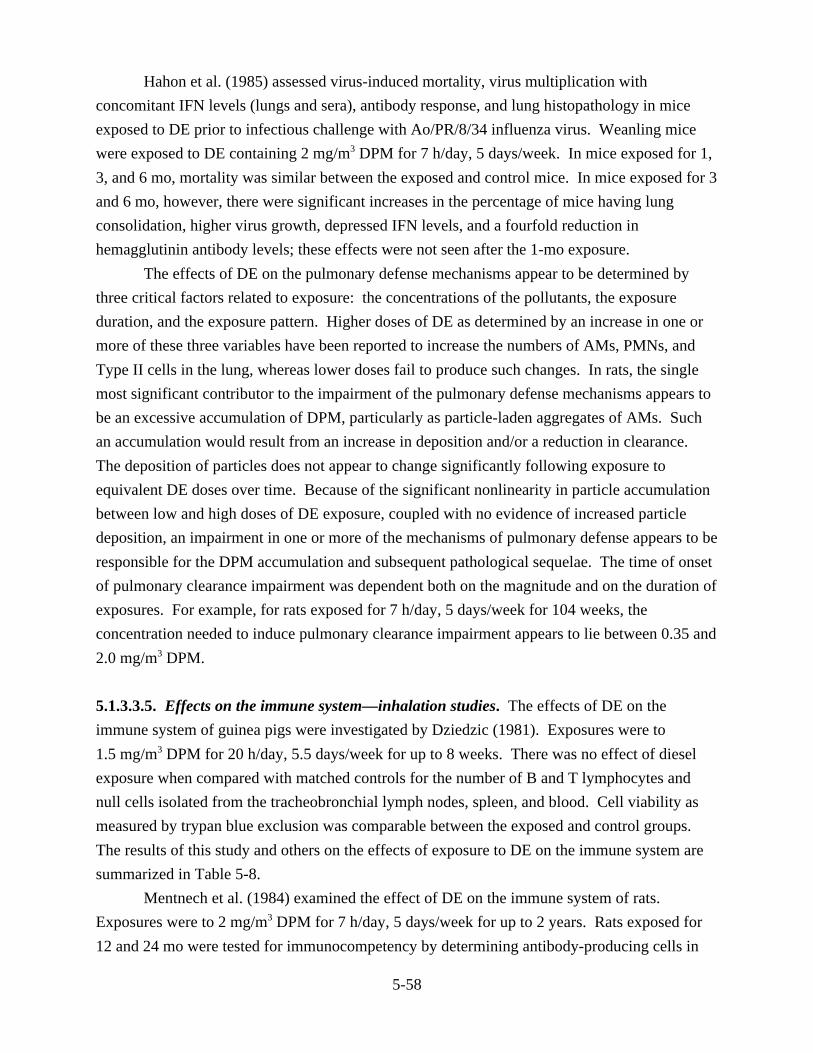
5-58
Hahon et al. (1985) assessed virus-induced mortality, virus multiplication with
concomitant IFN levels (lungs and sera), antibody response, and lung histopathology in mice
exposed to DE prior to infectious challenge with Ao/PR/8/34 influenza virus. Weanling mice
were exposed to DE containing 2 mg/m3 DPM for 7 h/day, 5 days/week. In mice exposed for 1,
3, and 6 mo, mortality was similar between the exposed and control mice. In mice exposed for 3
and 6 mo, however, there were significant increases in the percentage of mice having lung
consolidation, higher virus growth, depressed IFN levels, and a fourfold reduction in
hemagglutinin antibody levels; these effects were not seen after the 1-mo exposure.
The effects of DE on the pulmonary defense mechanisms appear to be determined by
three critical factors related to exposure: the concentrations of the pollutants, the exposure
duration, and the exposure pattern. Higher doses of DE as determined by an increase in one or
more of these three variables have been reported to increase the numbers of AMs, PMNs, and
Type II cells in the lung, whereas lower doses fail to produce such changes. In rats, the single
most significant contributor to the impairment of the pulmonary defense mechanisms appears to
be an excessive accumulation of DPM, particularly as particle-laden aggregates of AMs. Such
an accumulation would result from an increase in deposition and/or a reduction in clearance.
The deposition of particles does not appear to change significantly following exposure to
equivalent DE doses over time. Because of the significant nonlinearity in particle accumulation
between low and high doses of DE exposure, coupled with no evidence of increased particle
deposition, an impairment in one or more of the mechanisms of pulmonary defense appears to be
responsible for the DPM accumulation and subsequent pathological sequelae. The time of onset
of pulmonary clearance impairment was dependent both on the magnitude and on the duration of
exposures. For example, for rats exposed for 7 h/day, 5 days/week for 104 weeks, the
concentration needed to induce pulmonary clearance impairment appears to lie between 0.35 and
2.0 mg/m3 DPM.
5.1.3.3.5. Effects on the immune system—inhalation studies. The effects of DE on the
immune system of guinea pigs were investigated by Dziedzic (1981). Exposures were to
1.5 mg/m3 DPM for 20 h/day, 5.5 days/week for up to 8 weeks. There was no effect of diesel
exposure when compared with matched controls for the number of B and T lymphocytes and
null cells isolated from the tracheobronchial lymph nodes, spleen, and blood. Cell viability as
measured by trypan blue exclusion was comparable between the exposed and control groups.
The results of this study and others on the effects of exposure to DE on the immune system are
summarized in Table 5-8.
Mentnech et al. (1984) examined the effect of DE on the immune system of rats.
Exposures were to 2 mg/m3 DPM for 7 h/day, 5 days/week for up to 2 years. Rats exposed for
12 and 24 mo were tested for immunocompetency by determining antibody-producing cells in

5-59
the spleen 4 days after immunization with sheep erythrocytes. The proliferative response of
splenic T-lymphocytes to the mitogens concanavalin A and phytohemagglutinin was assessed in
rats exposed for 24 mo. There were no significant differences between the exposed and control
animals. Results obtained from these two assays indicate that neither humoral immunity
(assessed by enumerating antibody-producing cells) nor cellular immunity (assessed by the
lymphocyte blast transformation assay) were markedly affected by the exposures.
Bice et al. (1985) evaluated whether or not exposure to DE would alter antibody immune
responses induced after lung immunization of rats and mice. Exposures were to 0.35, 3.5, or 7.1
mg/m3 DPM for 7 h/day, 5 days/week for 24 mo. Chamber controls and exposed animals were
immunized by intratracheal instillation of SRBCs after 6, 12, 18, or 24 mo of exposure. No
suppression in the immune response occurred in either species. After 12, 18, and 24 mo of
exposure, the total number of anti-SRBC IgM antibody forming cells (AFCs) was elevated in
rats, but not in mice, exposed to 3.5 or 7.1 mg/m3 DPM; after 6 mo of exposure, only the 7.1
mg/m3 level was found to have caused this response in rats. The number of AFCs per 106
lymphoid cells in lung-associated lymph nodes and the levels of specific IgM, IgG, or IgA in rat
sera were not significantly altered. The investigators concluded that the increased cellularity and
the presence of DPM in the lung-associated lymph nodes had only a minimal effect on the
immune and antigen filtration function of these tissues.
The effects of inhaled DE and DPM have been studied in a murine model of allergic
asthma (Takano et al., 1998a,b). ICR mice were exposed for 12 h/day, 7 days/week for 40 weeks
to DE (0.3, 1.0, or 3.0 mg/m3). The mice were sensitized with ovalbumin (OA) after 16 weeks
exposure and subsequently challenged with aerosol allergen (1% OA in isotonic saline for 6
min) at 3-week intervals during the last 24 weeks of exposure. Exposure to DE enhanced
allergen-related eosinophil recruitment to the submucosal layers of the airways and to the
bronchoalveolar space, and increased protein levels of GM-CSF and IL-5 in the lung in a
dose-dependent manner. In the DE-exposed mice, increases in eosinophil recruitment and local
cytokine expression were accompanied by goblet-cell proliferation in the bronchial epithelium
and airwayhyperresponsiveness to inhaled acetylcholine. In contrast, mice exposed to clean air or
DE without allergen provocation showed no eosinophil recruitment to the submucosal layers of
the airways or to the bronchoalveolar space, and few goblet-cells in the bronchial epithelium. The

5-60
Table 5-8. Effects of inhalation of diesel exhaust on the immune system of laboratory animals
Species/sexExposure
periodParticles(mg/m3)
C × T(mgAh/m3)
CO(ppm)
NO2
(ppm)SO2
(ppm) Effects Study
Guinea Pig,Hartley, M
20 h/day5.5 days/week4 or 8 weeks
1.50.19 :m
MDD
660 or 7,280 7.5 — — No alterations in numbers of B, T, and nulllymphocytes or cell viability among lymphocytesisolated from tracheobronchial lymph nodes, spleen,or blood
Dziedzic(1981)
Rat, F344, M 7 h/day5 days/week52 or 104 weeks
2.00.23–0.36:m MDD
3,640 or7,280
11.5 1.5 0.8 Neither humoral immunity (assessed by enumeratingantibody-producing cells) nor cellular immunity(assessed by the lymphocyte blast transformationassay) were markedly affected
Mentnech etal. (1984)
Rat, F344;Mouse, CD-1
7 h/day5 days/week104 weeks
0.353.57.1
0.25 :mMDD
1,27412,74025,480
2.916.529.7
0.050.340.68
———
Total number of anti-sheep red blood cell IgM AFC inthe lung-associated lymph nodes was elevated in ratsexposed to 3.5 or 7.0 mg/m3 DPM (no such effects inmice); total number of AFC per 106 lymphoid cells inlung-associated lymph nodes and level of specificIgM, IgG, or IgA in rat sera were not altered
Bice et al.(1985)
Mouse, BALB/C, M
12 h/day,7 days/week,3 weeks Mice administered OAintranasally before,immediately after, and3 weeks after exposure
3.06.0
0.4 :m
7561,512
——
2.84.1
1.72.7
Spleen weights in mice exposed to DE (6 mg/m3)increased significantly. Serum anti-OA IgE antibodytiters in mice exposed to 6 mg/m3 significantly higherthan control. Antigen-stimulated IL-4 and IL-10production increased while IFN-g productiondecreased significantly in spleen cells from DE-exposed (6 mg/m3) mice stimulated with OA in vitro. DE inhalation may affect antigen-specific IgEantibody production through alteration of thecytokine network.
Fujimaki et al.(1997)
Mouse,C3H/Hen, M
12 h /day, for 12 weeks. Beforeexposure mice injected IPwith OA. After 3 weeksand every 3 weeksthereafter, micechallenged with OAaerosol.
1.03.0
1,0083,024
— 1.424.02
0.871.83
DE + antigen challenge induced airwayhyperresponsiveness and inflammation with increasedeosinophils, mast cells, and goblet cells. DE alone induced airway hyperresponsiveness, butnot eosinophilic infiltration or increased goblet cells.DE inhalation enhanced airway hyperresponsivenessand airway inflammation caused by OA sensitization.
Miyabara etal. (1998a)

5-61
Table 5-8. Effects of inhalation of diesel exhaust on the immune system of laboratory animals (continued)
Species/sexExposure
periodParticles(mg/m3)
C × T(mgAh/m3)
CO(ppm)
NO2
(ppm)SO2
(ppm) Effects Study
Mouse,C3H/HeN,M
12 h/day, for 5 weeks. After 7 daysmice injected IP with OA. At end of exposure micechallenged with OAaerosol for 15 minutes.
3.0 1,260 — 4.08 1.26 DE alone increased neutrophils and macrophages inBAL fluid; after DE + OA challenge eosinophilsincreased. OA alone increased eosinophils but the increase wasenhanced by DE. DE + OA, but not DE alone, increased goblet cells,respiratory resistance, production of OA-specific IgEand Ig1 in the serum, and overexpression of IL-5 inlung tissue.
Miyabara etal. (1998b)
Mouse,ICR (murine modelof allergicasthma)
12 h/day, 7days/week, 40 weeks. After 16 weeks sensitizedto OA and challengedwith OA aerosol for6 min, at 3-week intervalsduring the last 24 weeksof exposure.
0.31.03.0
1,0083,36010,080
— — — DE exposure enhanced allergen-related recruitment tothe submucosal layers of the airways and thebronchoalveolar space, and increased GM-CSF andIL-5 in the lung in a dose-dependent manner. Increases in eosinophil recruitment and local cytosineexpression accompanied by goblet cell proliferationin the bronchial epithelium and airwayhyperresponsiveness to inhaled acetylcholine. Miceexposed to clean air or DE without allergenprovocation showed no eosinophil recruitment to thesubmucosal layers of the airways nor to thebronchoalveolar space, and few goblet cells in thebronchial epithelium. Daily inhalation of DE mayenhance allergen-related respiratory diseases such asallergic asthma, and effect may be mediated by theenhanced local expression of IL-5 and GM-CSF.
Takano et al.(1998a)
DPM = Diesel particulate matter.AFC = Antibody-forming cells.

5-62
authors concluded that daily inhalation of DE can enhance allergen-related respiratory diseases
such as allergic asthma, and that this effect may be mediated by the enhanced local expression of
IL-5 and GM-CSF. The effect of DPM on a second characteristic of allergic asthma, airway
hyperresponsiveness, was examined by Takano et al. (1998b). Laboratory mice were
administered OA, DPM, or OA and DPM combined by intratracheal instillation for 6 wk.
Respiratory resistance (Rrs) after acetylcholine challenge was measured 24 h after the final
instillation. Rrs was significantly greater in the mice treated with OA and DPM than in the other
treatments. The authors concluded that DPM can enhance airway responsiveness associated with
allergen exposure.
In a series of inhalation studies following earlier instillation studies, Miyabara and
co-workers investigated whether inhalation of DE could enhance allergic reactions in laboratory
mice. C3H/HeN mice were exposed to DE (3 mg DPM/m3) by inhalation for 5 weeks (Miyabara
et al., 1998b) and, after 7 days of exposure, were sensitized to OA injected intraperitoneally. At
the end of the DE exposure, the mice were challenged with an OA aerosol for 15 min. DE
caused an increase in the numbers of neutrophils and macrophages in bronchoalveolar lavage
fluid independent of OA sensitization, whereas a significant increase in eosinophil numbers
occurred only after DE exposure was combined with antigen challenge. Even though OA alone
caused an increase in eosinophil numbers in lung tissue, this response was enhanced further by
DE. DE exposure combined with OA sensitization enhanced the number of goblet-cells in lung
tissue, respiratory resistance, production of OA-specific IgE and IgG1 in the serum, and
overexpression of IL-5 in lung tissue. In a second study, C3H/HeN mice were sensitized with
OA injected intraperitoneally and then exposed to DE by inhalation for 12 h/day for 3 mo at
either 1 or 3 mg/m3 (Miyabara et al., 1998a). After 3 weeks of DE exposure, and every 3 weeks
thereafter, the mice were challenged with an OA aerosol. Exposure to DE with antigen
challenge induced airway hyperresponsiveness and airway inflammation, which was
characterized by increased numbers of eosinophils and mast cells in lung tissue. The increase in
inflammatory cells was accompanied by an increase in goblet cells in the bronchial epithelium.
Airway hyperresponsiveness, but not eosinophilic infiltration or increased goblet cells, was
increased by DE exposure alone. These workers concluded that inhalation of DE can enhance
airway hyperresponsiveness and airway inflammation caused by OA sensitization in mice.
The effects of DE on IgE antibody production were investigated in BALB/c mice
sensitized with OA and exposed by inhalation to DE (3.0 and 6.0 mg/m3) for 3 weeks (Fujimaki
et al., 1997). The mice were sensitized by intranasal administration of OA alone before,
immediately after, and 3 weeks after DE inhalation. While body and thymus weights were
unchanged in the DE-exposed and control mice, spleen weights in mice exposed to 6 mg/m3 DE
increased significantly. Anti-OA IgE antibody titers in the sera of mice exposed to 6 mg/m3 DE
were significantly higher than control. Total IgE and anti-OA IgG in sera from DE-exposed and

5-63
control mice remained unchanged. Cytokine production was measured in vitro stimulated with
OA in spleen cells from mice exposed to DE (6 mg/m3). Antigen-stimulated interleukin-4 (IL-4)
and -10 (IL-10) production increased significantly in vitro in spleen cells from DE-exposed mice
compared with controls, while IFN-( production decreased markedly. The authors concluded
that DE inhalation in mice may affect antigen-specific IgE antibody production through
alteration of the cytokine network.
5.1.3.3.6. Effects on the immune system—noninhalation studies. The immune response of
laboratory animals to DPM has been studied in various noninhalation models, and the results of
these studies are presented in Table 5-9. Takafuji et al. (1987) evaluated the IgE antibody
response of mice inoculated intranasally at intervals of 3 weeks with either 0.5 or 25 :g of DPM
in ovalbumin per mouse. Antiovalbumin IgE antibody titers, assayed by passive cutaneous
anaphylaxis, were enhanced by doses as low as 1 :g of particles compared with immunization
with ovalbumin alone.
Muranaka et al. (1986) studied the effects of DPM on IgE antibody production in
immunized mice. A greater IgE antibody response was noted in mice immunized by ip injection
of ovalbumin (OA) mixed with DPM, either 0.02, 0.2, or 2mg per mouse, than in animals
immunized with OA alone. This effect of DPM on IgE antibody production in mice was also
demonstrated in mice immunized with repeated injections of dinitrophenylated-OA. Moreover,
a persistent IgE-antibody response to Japanese cedar pollen (JCPA), a common pollen allergen
causing allergic rhinitis in Japan, was observed in mice immunized with JCPA mixed with DPM
but not in animals immunized with JCPA alone. The results suggest an association between the
adjuvant activity of DPM and allergic rhinitis caused by JCPA.
Takano et al. (1997) designed a study to evaluate the effects of DPM on the
manifestations of allergic asthma in mice, with emphasis on antigen-induced airway
inflammation; the local expression of IL-5, GM-CSF, IL-2, and IFN-(; and the production of
antigen-specific IgE and IgG. Male ICR mice were intratracheally instilled with ovalbumin
(OVA), DPM, and DPM+OVA. DPM was obtained from a 4JB1-type, light-duty 2.74 L, four-
cylinder Isuzu diesel engine operated at a steady speed of 1,500 rpm under a load of 10 torque
(kg/m). The OVA-group mice were instilled with 1 :g OVA at 3 and 6 weeks. The mice
receiving DPM alone were instilled with 100 :g DPM weekly for 6 weeks. The OVA + DPM
group received the combined treatment in the same protocol as the OVA and the DPM groups,
respectively. Additional groups were exposed for 9 weeks. DPM aggravated OVA-induced
airway inflammation, characterized by infiltration of eosinophils and lymphocytes and an
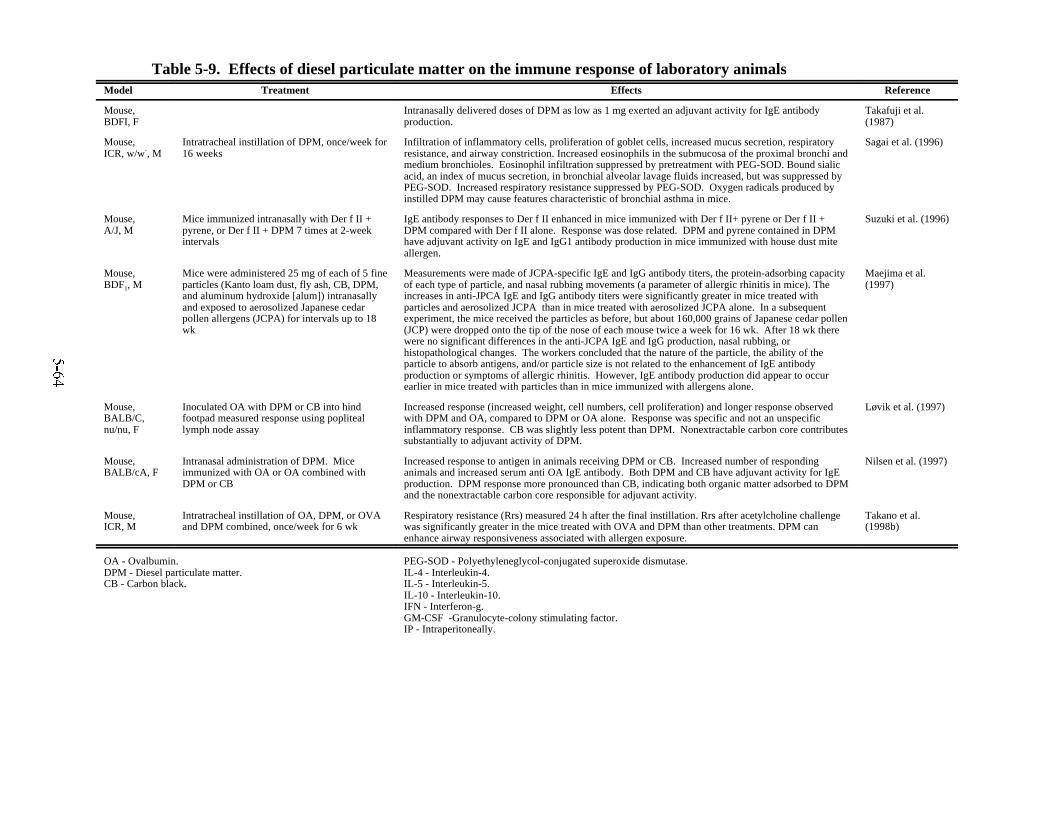
5-64
Table 5-9. Effects of diesel particulate matter on the immune response of laboratory animalsModel Treatment Effects Reference
Mouse,BDFI, F
Intranasally delivered doses of DPM as low as 1 mg exerted an adjuvant activity for IgE antibodyproduction.
Takafuji et al.(1987)
Mouse,ICR, w/w-, M
Intratracheal instillation of DPM, once/week for16 weeks
Infiltration of inflammatory cells, proliferation of goblet cells, increased mucus secretion, respiratoryresistance, and airway constriction. Increased eosinophils in the submucosa of the proximal bronchi andmedium bronchioles. Eosinophil infiltration suppressed by pretreatment with PEG-SOD. Bound sialicacid, an index of mucus secretion, in bronchial alveolar lavage fluids increased, but was suppressed byPEG-SOD. Increased respiratory resistance suppressed by PEG-SOD. Oxygen radicals produced byinstilled DPM may cause features characteristic of bronchial asthma in mice.
Sagai et al. (1996)
Mouse,A/J, M
Mice immunized intranasally with Der f II +pyrene, or Der f II + DPM 7 times at 2-weekintervals
IgE antibody responses to Der f II enhanced in mice immunized with Der f II+ pyrene or Der f II +DPM compared with Der f II alone. Response was dose related. DPM and pyrene contained in DPMhave adjuvant activity on IgE and IgG1 antibody production in mice immunized with house dust miteallergen.
Suzuki et al. (1996)
Mouse, BDF1, M
Mice were administered 25 mg of each of 5 fineparticles (Kanto loam dust, fly ash, CB, DPM,and aluminum hydroxide [alum]) intranasallyand exposed to aerosolized Japanese cedarpollen allergens (JCPA) for intervals up to 18wk
Measurements were made of JCPA-specific IgE and IgG antibody titers, the protein-adsorbing capacityof each type of particle, and nasal rubbing movements (a parameter of allergic rhinitis in mice). Theincreases in anti-JPCA IgE and IgG antibody titers were significantly greater in mice treated withparticles and aerosolized JCPA than in mice treated with aerosolized JCPA alone. In a subsequentexperiment, the mice received the particles as before, but about 160,000 grains of Japanese cedar pollen(JCP) were dropped onto the tip of the nose of each mouse twice a week for 16 wk. After 18 wk therewere no significant differences in the anti-JCPA IgE and IgG production, nasal rubbing, orhistopathological changes. The workers concluded that the nature of the particle, the ability of theparticle to absorb antigens, and/or particle size is not related to the enhancement of IgE antibodyproduction or symptoms of allergic rhinitis. However, IgE antibody production did appear to occurearlier in mice treated with particles than in mice immunized with allergens alone.
Maejima et al.(1997)
Mouse,BALB/C,nu/nu, F
Inoculated OA with DPM or CB into hindfootpad measured response using popliteallymph node assay
Increased response (increased weight, cell numbers, cell proliferation) and longer response observedwith DPM and OA, compared to DPM or OA alone. Response was specific and not an unspecificinflammatory response. CB was slightly less potent than DPM. Nonextractable carbon core contributessubstantially to adjuvant activity of DPM.
Løvik et al. (1997)
Mouse,BALB/cA, F
Intranasal administration of DPM. Miceimmunized with OA or OA combined withDPM or CB
Increased response to antigen in animals receiving DPM or CB. Increased number of respondinganimals and increased serum anti OA IgE antibody. Both DPM and CB have adjuvant activity for IgEproduction. DPM response more pronounced than CB, indicating both organic matter adsorbed to DPMand the nonextractable carbon core responsible for adjuvant activity.
Nilsen et al. (1997)
Mouse, ICR, M
Intratracheal instillation of OA, DPM, or OVAand DPM combined, once/week for 6 wk
Respiratory resistance (Rrs) measured 24 h after the final instillation. Rrs after acetylcholine challengewas significantly greater in the mice treated with OVA and DPM than other treatments. DPM canenhance airway responsiveness associated with allergen exposure.
Takano et al.(1998b)
OA - Ovalbumin.DPM - Diesel particulate matter.CB - Carbon black.
PEG-SOD - Polyethyleneglycol-conjugated superoxide dismutase.IL-4 - Interleukin-4.IL-5 - Interleukin-5.IL-10 - Interleukin-10.IFN - Interferon-g.GM-CSF -Granulocyte-colony stimulating factor.IP - Intraperitoneally.

5-65
increase in goblet cells in the bronchial epithelium. DPM in combination with antigen markedly
increased IL-5 protein levels in lung tissue and bronchoalveolar lavage supernatants compared
with either antigen or DPM alone. The combination of DPM and antigen induced significant
increases in local expression of IL-4, GM-CSF, and IL-2, whereas expression of IFN-( was not
affected. In addition, DPM exhibited adjuvant activity for the antigen-specific production of
IgG and IgE.
The potential role of oxygen radicals in injury caused by DPM was investigated by Sagai
et al. (1996). These workers reported that repeated intratracheal instillation of DPM (either 0.1
or 0.2 mg per mouse, once/week for 16 weeks) in mice caused marked infiltration of
inflammatory cells, proliferation of goblet cells, increased mucus secretion, respiratory
resistance, and airway constriction. Eosinophils in the submucosa of the proximal bronchi and
medium bronchioles increased eightfold following instillation. Eosinophil infiltration was
significantly suppressed by pretreatment with polyethyleneglycol-conjugated superoxide
dismutase (PEG-SOD), an inhibitor of oxygen radicals. Bound sialic acid concentrations in
bronchial alveolar lavage fluids, an index of mucus secretion, increased with DPM, but were
also suppressed by pretreatment with PEG-SOD. Goblet cell hyperplasia, airway narrowing, and
airway constriction also were observed with DPM.
Respiratory resistance to acetylcholine in the DPM group was 11 times higher than in
controls, and the increased resistance was significantly suppressed by PEG-SOD pretreatment.
These findings indicate that oxygen radicals caused by intratracheally instilled DPM elicit
responses characteristic of bronchial asthma.
Potential adjuvant effects of DPM on the response to the model allergen OA were
investigated in BALB/c mice using the popliteal lymph node (PLN) assay (Løvik et al., 1997).
DPM inoculated together with OA into one hind footpad (0.02 mL of a 5 mg/mL DPM
suspension) gave a significantly augmented response (increase in weight, cell numbers, and cell
proliferation) in the draining popliteal lymph node as compared to DPM or OA alone. The
duration of the local lymph node response was also longer when DPM was given with the
allergen. The lymph node response appeared to be of a specific immunologic character and not
an unspecific inflammatory reaction. The OA-specific response IgE was increased in mice
receiving OA together with DPM as compared with the response in mice receiving OA alone.
Further studies using carbon black (CB) as a surrogate for the nonextractable core of DPM found
that while CB resembled DPM in its capacity to increase the local lymph node response and
serum-specific IgE response to OA, CB appeared to be slightly less potent than DPM. The
results indicate that the nonextractable particle core contributes substantially to the adjuvant
activity of DPM.
Nilsen et al. (1997) investigated which part of the particle was responsible, the carbon
core and/or the adsorbed organic substances, for the adjuvant activity of DPM. Female
5-66
BALB/cA mice were immunized with OA alone or in combination with DPM or CB particles by
intranasal administration a total of four times, once weekly, at 25 :g/inoculation. There was an
increased response to the antigen in animals receiving OA together with DPM or CB, compared
with animals receiving OA alone. The response was seen as both an increased number of
responding animals and increased serum anti OA IgE response. The workers concluded that
both DPM and CB have an adjuvant activity for specific IgE production, but that the activity of
DPM may be more pronounced than that of CB. The results suggest that both the organic matter
adsorbed to DPM and the nonextractable carbon are responsible for the observed adjuvant effect
of DPM.
The effects of DPM and its components (extracted particles and particle extracts) on the
release of proinflammatory cytokines, interleukin-1 (IL-1), and tumor necrosis factor-" (TNF-
") by alveolar macrophages (AMs) were investigated by Yang et al. (1997). Rat AMs were
incubated with 0, 5, 10, 20, 50, or 100 :g/106 AM/mL of DPM, methanol-extracted DPM, or
equivalent concentrations of DPM at 37 oC for 24 h. At high concentrations, both DPM and
DPM extracts were shown to increase IL-1-like activity secreted by AMs, whereas extracted
particles had no effect. Neither particles, particle extracts, or extracted particles stimulated
secretion of TNF-". DPM inhibited lipid polysaccharide (LPS)-stimulated production of IL-1
and TNF-". In contrast, interferon (IFN)-(-stimulated production of TNF-" was not affected
by DPM. Results of this study indicate that the organic fraction of exhaust particles is
responsible for the effects noted. Stimulation of IL-1 but not TNF-" suggests that IL-1, but not
TNF-", may play an important role in the development of DPM-induced inflammatory and
immune responses. The cellular mechanism involved in inhibiting increased release of IL-1 and
TNF-" by LPS is unknown, but may be a contributing factor to the decreased AM phagocytic
activity and increased susceptibility to pulmonary infection after prolonged exposure to DPM.
Fujimaki et al. (1994) investigated the relationship between DPM and IgE antibody
production, interleukin 4 (IL-4) production in BALB/c mice treated with DPM mixed with
antigen OA or JCP antigen by intratracheal instillation. BALB/c mice were injected with DPM
(300 :g) plus OA or OA alone and, after the last instillation, the proliferative response and
lymphokine production by mediastinal lymph node cells (LNC) were examined in vitro. The
proliferative response to OA in mediastinal LNC from mice injected with DPM plus OA was
enhanced to 4-17 times that of control mice. IL-4 production by OA stimulation was also
enhanced in mediastinal LNC from mice injected with DPM plus OA. A significantly larger
amount of anti-OA IgE antibody was detected in sera from DPM- and OA-injected mice
compared with those from control mice. The levels of IL-4, estimated by JCP antigen in
mediastinal LNC, from mice injected with DPM plus JCP antigen were twofold higher than
those from mice injected with JCP antigen alone. These results suggest that intratracheal

5-67
instillation of DPM affects antigen-specific IgE antibody responses via local T-cell activation,
especially enhanced IL-4 production.
Suzuki et al. (1993) investigated the adjuvant activity of pyrene, one of many PAHs
contained in DPM, on IgE antibody production in mice. In the first experiment, mice were
immunized with 1 mg of OA alone, 1 mg of OA plus 1 mg of pyrene, or 1 mg of OA plus 1 mg
of DPM, respectively. The IgE antibody responses to OA in mice immunized with OA plus
pyrene or OA plus DPM were enhanced as compared to those in mice immunized with OA
alone; the highest responses were observed in mice immunized with OA plus DPM. In the
second experiment, mice were immunized with 10 mg of JCPA alone or 10 mg of JCPA plus 5
mg of pyrene. The IgE antibody responses to JCPA in mice immunized with JCPA plus pyrene
were higher than those in mice immunized with JCPA alone. The results indicate that pyrene
contained in DPM acts as an adjuvant in IgE antibody production in immunized mice.
Suzuki et al. (1996) investigated the effect of pyrene on IgE and IgG1 antibody
production in mice to clarify the relation between mite allergy and adjuvancy of the chemical
compounds in DPM. The mite allergen was Der f II, one of the major allergens of house dust
mite (Dermatophagoides farinae). Allergen mice were grouped and immunized with Der f II
(5 :g), Der f II (5 :g) plus pyrene (200 :g), and Der f II (5 :g) plus DPM (100 :g)
intranasally seven times at 2-week intervals. The separate groups of mice were also immunized
with Der f II (10 :g) plus the same dose of adjuvants in the same way. The IgE antibody
responses to Der f II in mice immunized with Der f II plus pyrene or Der f II plus DPM were
markedly enhanced compared with those immunized with Der f II alone. The anti-Der f II IgE
antibody production increased with increasing the dose of Der f II from 5 :g to 10 :g in mice
immunized with Der f II plus the same dose of adjuvants. The IgG1 antibody responses to Der f
II in mice immunized with Der f II (10 :g) plus pyrene (200 :g) or Der f II (10 :g) plus DPM
(100 :g) were greater than those immunized with 10 :g of Der f II alone. In addition, when
peritoneal macrophages obtained from normal mice were incubated with pyrene or DPM in
vitro, an enhanced IL-1a production by the macrophages was observed. When spleen
lymphocytes obtained from the mice immunized with Der f II (10 :g) plus DPM (100 :g) or
Der f II (10 :g) plus pyrene (200 :g) were stimulated with 10 :g of Der f II in vitro, an
enhanced IL-4 production of the lymphocytes was also observed compared with those
immunized with Der f II alone. This study indicates that DPM and pyrene (one of the many
PAHs adsorbed onto DPM) have an adjuvant activity on IgE and IgG1 antibody production in
mice immunized intranasally with a house dust mite allergen.
Maejima et al. (1997) examined the potential adjuvant activity of several different fine
particles. These workers administered 25 :g of each of 5 particles (Kanto loam dust, fly ash,
CB, DPM, and aluminum hydroxide [alum]) intranasally in mice and exposed them to
aerosolized JCPA for intervals up to 18 weeks. Measurements were made of JCPA-specific IgE
5-68
and IgG antibody titers, the protein-adsorbing capacity of each type of particle, and nasal
rubbing movements (a parameter of allergic rhinitis in mice). The increases in anti-JPCA IgE
and IgG antibody titers were significantly greater in mice treated with particles and plus
aerosolized JCPA than in mice treated with aerosolized JCPA alone. In a subsequent
experiment, the mice received the particles as before, but about 160,000 grains of JCP were
dropped onto the tip of the nose of each mouse twice a week for 16 weeks. After 18 weeks there
were no significant differences in the anti-JCPA IgE and IgG production, nasal rubbing, or
histopathological changes. The workers concluded that the nature of the particle, the ability of
the particle to absorb antigens, and particle size are not related to the enhancement of IgE
antibody production or symptoms of allergic rhinitis. However, IgE antibody production did
appear to occur earlier in mice treated with particles than in mice immunized with allergens
alone.
The potential for DPM to modulate cytokine production has been demonstrated in
cultured mouse bone marrow-derived mast cells (BMMC). Saneyoshi et al. (1997) examined the
production of cytokines in BMMC treated with DPM (0.8, 2 and 4 mg/mL). Production of
interleukin-4 (IL-4) and IL-6 was higher in BMMC stimulated with A23187 and treated with
low concentrations of DPM than in controls, but no increase was seen in BMMC treated with
high DPM. After pretreatment with low DPM for 24 h, IL-4 production in BMMC stimulated
with A23187 was lower than in controls. Antigen-induced IL-4 production increased
significantly in BMMC treated with 0.4 or 0.8 mg/mL DPM, but did not increase with low
DPM. Although the enhancement of IL-4 production of BMMC stimulated with A23187 plus
DPM was not completely inhibited by 2-mercaptoethanol, treatment with dexamethasone
inhibited further IL-4 production. Thus, DPM may affect the immune response via the
modulation of cytokine production in mast cells.
Ormstad et al. (1998) investigated the potential for DPM as well as other suspended
particulate matter (SPM) to act as a carrier for allergens into the airways. These investigators
found both Can f 1 (dog) and Bet v 1 (birch pollen) on the surface of SPM collected in air from
different homes. In an extension of the study, they found that DPM adhered to polycarbonate
filters had the potential of binding both of these allergens as well as Fel d 1 (cat) and Der p 1
(house mite). The authors conclude that soot particles in indoor air house dust may act as carrier
of several allergens in indoor air.
Knox et al. (1997) investigated whether free grass pollen allergen molecules, released
from pollen grains by osmotic shock (Suphioglu et al., 1992) and dispersed in microdroplets of
water in aerosols, can bind to DPM mounted on copper grids in air. Using natural highly
purified Lol p 1, immunogold labeling with specific monoclonal antibodies, and a high-voltage
transmission electron-microscopic imaging technique, these workers demonstrated binding of the
major grass pollen allergen, Lol p 1, to DPM in vitro. These workers conclude that binding of

5-69
DPM with Lol p 1 might be a mechanism by which allergens can become concentrated in air and
trigger attacks of asthma.
Murphy et al. (1999) examined the comparative toxicities to the lung of four different-
sized CB particles and DPM, in primary cultures of mouse Clara and rat type II epithelial cells.
Particle toxicity was assessed by cell attachment to an extracellular matrix substratum. The CB
particles varied in toxicity to Clara and type II cells. DPM stored for 2 weeks was equally toxic
to both cell types. DPM became progressively less toxic to type II cells with time of storage.
Both primary epithelial cell types internalized the particles in culture. These workers concluded
that bioreactivity was related to CB particle size and surface area, with the smaller particles
having the larger surface area being the more toxic. Although freshly prepared DPM was
equally toxic to type II and Clara cells, DPM became progressively less toxic to the type II cells
with time.
Exposure studies in laboratory animals and isolated cell systems derived from animals
also indicate that DPM can elicit both inflammatory and immunological changes. Moreover, the
effects appear to be due to both the nonextractable carbon core and the adsorbed organic fraction
of the diesel particle. Changes in IgE, goblet cell hyperplasia, mast cell influx, and cytokines in
various animal models and in vitro model systems are all key markers of asthma. The data
further indicate a role for oxygen radicals in DPM injury because the extent of the injury can be
reduced by treatment with antioxidants. DPM also has the capacity to bind and transport
airborne allergens.
5.1.3.3.7. Effects on the liver. Meiss et al. (1981) examined alterations in the hepatic
parenchyma of hamsters by using thin-section and freeze-fracture histological techniques.
Exposures to DE were for 7 to 8 h/day, 5 days/week, for 5 mo at about 4 or 11 mg/m3 DPM.
The livers of the hamsters exposed to both concentrations of DE exhibited moderate dilatation of
the sinusoids, with activation of the Kupffer cells and slight changes in the cell nuclei. Fatty
deposits were observed in the sinusoids, and small fat droplets were occasionally observed in the
peripheral hepatocytes. Mitochondria often had a loss of cristae and exhibited a pleomorphic
character. Giant microbodies were seen in the hepatocytes, which were moderately enlarged,
and gap junctions between hepatocytes exhibited a wide range in structural diversity. The results
of this study and others on the effect of exposure of DE on the liver of laboratory animals are
summarized in Table 5-10.

5-70
Table 5-10. Effects of exposure to diesel exhaust on the liver of laboratory animals
Species/sexExposure
periodParticles(mg/m3)
C × T(mgAh/m3)
CO(ppm)
NO2
(ppm)SO2
(ppm) Effects Study
Rat, F344, M, F 7 h/day5 days/week52 weeks
2.00.23–0.36 :m
MDD
3,640 12.7 1.6 0.83 No changes in absolute liver weight orliver/body weight ratio
Green et al. (1983)
Hamster, Syrian 7-8 h/day5 days/week22 weeks
4.08.0
11.0
3,080-9,680 12.019.025.0
0.51.01.5
3.06.07.0
Enlarged sinusoids, with activated Kupffer’scells and slight changes of nuclei; fattydeposits; mitochondria, loss of cristae andpleomorphic character; gap junctions betweenhepatocytes had wide range in structuraldiversity
Meiss et al. (1981)
Cat, inbred, M 8 h/day7 days/week124 weeks
6.0a
12.0b41,66483,328
20.233.3
2.74.4
2.15.0
No change in the absolute liver weight Plopper et al. (1983)
a1 to 61 weeks of exposure.b62 to 124 weeks of exposure.

5-71
Green et al. (1983) and Plopper et al. (1983) reported no changes in liver weights of rats
exposed to 2 mg/m3 DPM for 7 h/day, 5 days/week for 52 weeks or of cats exposed to 6 to
12 mg/m3, 8 h/day, 7 days/week for 124 weeks. The use of light and electron microscopy
revealed that long-term inhalation of varying high concentrations of DE caused numerous
alterations to the hepatic parenchyma of guinea pigs. A less sensitive index of liver toxicity,
increased liver weight, failed to detect an effect of DE on the liver of the rat and cat following
long-term exposure to DE. These results are too limited to understand potential impacts on the
liver.
5.1.3.3.8. Blood and cardiovascular systems. Several studies have evaluated the effects of DE
exposure on hematological and cardiovascular parameters of laboratory animals. These studies
are summarized in Table 5-11. Standard hematological indices of toxicological effects on red
and white blood cells failed to detect dramatic and consistent responses. Erythrocyte (RBC)
counts were reported as being unaffected in cats (Pepelko and Peirano, 1983), rats and monkeys
(Lewis et al., 1989), guinea pigs and rats (Penney et al., 1981), and rats (Karagianes et al.,
1981); lowered in rats (Heinrich et al., 1982); and elevated in rats (Ishinishi et al., 1988;
Brightwell et al., 1986). Mean corpuscular volume was significantly increased in monkeys, 69
versus 64 (Lewis et al., 1989), and hamsters (Heinrich et al., 1982), and lowered in rats
(Ishinishi et al., 1988). The only other parameters of erythrocyte status and related events were
lowered mean corpuscular hemoglobin and mean corpuscular hemoglobin concentration in1 rats
(Ishinishi et al., 1988), a 3% to 5% increase in carboxyhemoglobin saturation in rats
(Karagianes et al., 1981), and a suggestion of an increase in prothrombin time (Brightwell et al.,
1986). The biological significance of these findings regarding adverse health effects is deemed
to be inconsequential.
Three investigators (Pepelko and Peirano, 1983; Lewis et al., 1989; Brightwell et al.,
1986) reported an increase in the percentage of banded neutrophils in cats and rats. This effect
was not observed in monkeys (Lewis et al., 1989). The health implications of an increase in
abnormal maturation of circulating neutrophils are uncertain but indicate a toxic response of
leukocytes following exposures to DE. Leukocyte counts were reported to be reduced in
hamsters (Heinrich et al., 1982); increased in rats (Brightwell et al., 1986); and unaffected in
cats, rats, and monkeys (Pepelko and Peirano, 1983; Ishinishi et al., 1988; Lewis et al., 1989).
These inconsistent findings indicate that the leukocyte counts are more indicative of the clinical
status of the laboratory animals than any direct effect of exposure to DE.
No significant changes in heart mass were found in guinea pigs or rats exposed to DE
(Wiester et al., 1980; Penney et al., 1981; Lewis et al., 1989). Rats exposed to DE showed a
greater increase in the medial wall thickness of pulmonary arteries of differing diameters and
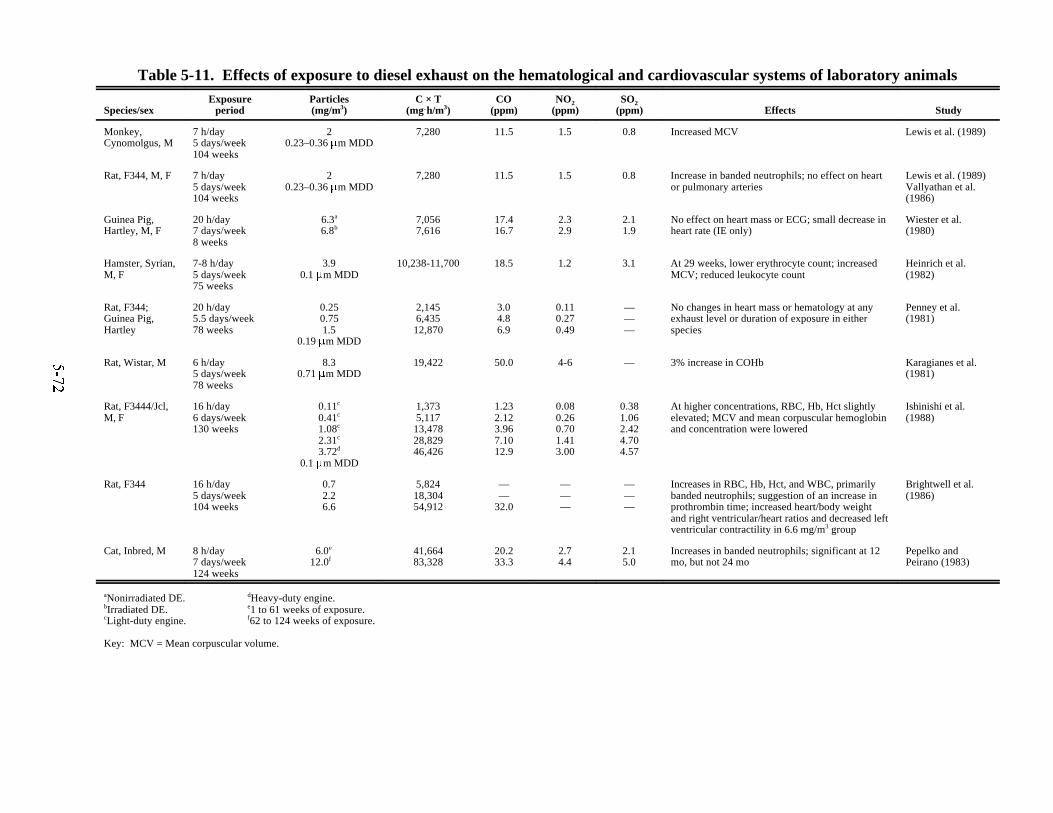
5-72
Table 5-11. Effects of exposure to diesel exhaust on the hematological and cardiovascular systems of laboratory animals
Species/sexExposure
periodParticles(mg/m3)
C × T(mgAh/m3)
CO(ppm)
NO2(ppm)
SO2(ppm) Effects Study
Monkey,Cynomolgus, M
7 h/day5 days/week104 weeks
20.23–0.36 :m MDD
7,280 11.5 1.5 0.8 Increased MCV Lewis et al. (1989)
Rat, F344, M, F 7 h/day5 days/week104 weeks
20.23–0.36 :m MDD
7,280 11.5 1.5 0.8 Increase in banded neutrophils; no effect on heartor pulmonary arteries
Lewis et al. (1989)Vallyathan et al.(1986)
Guinea Pig,Hartley, M, F
20 h/day7 days/week8 weeks
6.3a
6.8b7,0567,616
17.416.7
2.32.9
2.11.9
No effect on heart mass or ECG; small decrease inheart rate (IE only)
Wiester et al.(1980)
Hamster, Syrian,M, F
7-8 h/day5 days/week75 weeks
3.90.1 :m MDD
10,238-11,700 18.5 1.2 3.1 At 29 weeks, lower erythrocyte count; increasedMCV; reduced leukocyte count
Heinrich et al.(1982)
Rat, F344; Guinea Pig,Hartley
20 h/day5.5 days/week78 weeks
0.250.751.5
0.19 :m MDD
2,1456,43512,870
3.04.86.9
0.110.270.49
———
No changes in heart mass or hematology at anyexhaust level or duration of exposure in eitherspecies
Penney et al.(1981)
Rat, Wistar, M 6 h/day5 days/week78 weeks
8.30.71 :m MDD
19,422 50.0 4-6 — 3% increase in COHb Karagianes et al.(1981)
Rat, F3444/Jcl,M, F
16 h/day6 days/week130 weeks
0.11c
0.41c
1.08c
2.31c
3.72d
0.1 :m MDD
1,3735,11713,47828,82946,426
1.232.123.967.1012.9
0.080.260.701.413.00
0.381.062.424.704.57
At higher concentrations, RBC, Hb, Hct slightlyelevated; MCV and mean corpuscular hemoglobinand concentration were lowered
Ishinishi et al.(1988)
Rat, F344 16 h/day5 days/week104 weeks
0.72.26.6
5,82418,30454,912
——
32.0
———
———
Increases in RBC, Hb, Hct, and WBC, primarilybanded neutrophils; suggestion of an increase inprothrombin time; increased heart/body weightand right ventricular/heart ratios and decreased leftventricular contractility in 6.6 mg/m3 group
Brightwell et al.(1986)
Cat, Inbred, M 8 h/day7 days/week124 weeks
6.0e
12.0f41,66483,328
20.233.3
2.74.4
2.15.0
Increases in banded neutrophils; significant at 12mo, but not 24 mo
Pepelko andPeirano (1983)
aNonirradiated DE. dHeavy-duty engine.bIrradiated DE. e1 to 61 weeks of exposure.cLight-duty engine. f62 to 124 weeks of exposure.
Key: MCV = Mean corpuscular volume.
5-73
right ventricular wall thickness; these increases, however, did not achieve statistically significant
levels (Vallyathan et al., 1986). Brightwell et al. (1986) reported increased heart/body weight
and right ventricular/heart weight ratios and decreased left ventricular contractility in rats
exposed to 6.6 mg/m3 DPM for 16 h/day, 5 days/week for 104 weeks.
The effects of DPM on the endothelium-dependent relaxation (EDR) of vascular smooth
muscle cells have been investigated (Ikeda et al., 1995, 1998). Incubation of rat thoracic aortae
with suspensions of DPM (10-100 :g/mL) markedly attenuated acetylcholine-induced EDR.
The mechanism of this effect was studied further in cultured porcine endothelial cells (CPE).
A 10-min incubation of CPE with DPM (0.1-100 :g/mL) inhibited endothelium-dependent
relaxing factor (EDRF) or nitric oxide (NO) release. A 10-min incubation of DPM with NO
synthase inhibited formation of NO2-, a product of NO metabolism. The authors concluded that
DPM, at the concentrations tested, neither induced cell damage nor inhibited EDRF release from
CPE, but scavenged and thereby blocked the physiological action of NO.
5.1.3.3.9. Serum chemistry. A number of investigators have studied the effects of exposure to
DE on serum biochemistry, and no consistent effects have been found. Such studies are
summarized in Table 5-12.
The biological significance of changes in serum chemistry reported by Lewis et al.
(1989) in female but not male rats exposed at 2 mg/m3 DPM for 7 h/day, 5 days/week for 104
weeks is difficult to interpret. Not only were the effects noted in one sex (females) only, but the
serum enzymes, lactate dehydrogenase (LDH), serum glutamic-oxaloacetic transaminase
(SGOT), and serum glutamic-pyruvic transaminase (SGPT), were elevated in the control group,
a circumstance contrary to denoting organ damage in the exposed female rats. The elevations of
liver-related serum enzymes in the control versus the exposed female rats appear to be a random
event among these aged subjects. The incidence of age-related disease, such as mononuclear cell
leukemia, can markedly affect such enzyme levels, seriously compromising the usefulness of a
comparison to historical controls. The serum sodium values of 144 versus 148 mmol/L in
control and exposed rats, respectively, although statistically different, would have no biological
significance.
The increased serum enzyme activities, alkaline phosphatase, SGOT, SGPT,
gamma-glutamyl transpeptidase, and decreased cholinesterase activity suggest an impaired liver;
however, such an impairment was not established histopathologically (Heinrich et al., 1982;
Ishinishi et al., 1988; Brightwell et al., 1986). The increased urea nitrogen, electrolyte levels,
and gamma globulin concentration and reduction in total blood proteins are indicative of
impaired kidney function. Again, there was no histopathological confirmation of impaired
kidneys in these studies.

5-74
Table 5-12. Effects of chronic exposures to diesel exhaust on serum chemistry of laboratory animals
Species/sexExposure
periodParticles(mg/m3)
C × T(mgAh/m3)
CO(ppm)
NO2
(ppm)SO2
(ppm) Effects Study
Rat, F344, M, F 7 h/day5 days/week104 weeks
2.00.23
0.36 :m MDD
7,280 11.5 1.5 0.8 Decreased phosphate, LDH, SGOT, and SGPT;increased sodium in females but not males
Lewis et al.(1989)
Hamster, Syrian, M, F 7-8 h/day5 days/week75 weeks
3.90.1 :m MDD
10,238-11,700 18.5 1.2 3.1 After 29 weeks, increases in SGOT, LDH, alkalinephosphatase, gamma-glutamyl transferase, and BUN
Heinrich et al.(1982)
Rat, F344/JcL, M, F 16 h/day6 days/week130 weeks
0.11a
0.41a
1.08a
2.31a
3.72b
0.19–0.28 :mMDD
1,3735,11713,47828,82946,426
1.232.123.967.1012.9
0.080.263.967.103.00
0.381.062.424.704.57
Lower cholinesterase activity in males in both thelight-and heavy-duty series and elevated gammaglobulin and electrolyte levels in males and femalesin both series
ResearchCommittee forHERP Studies(1988)
Rat, F344; Hamster,Syrian
16 h/day5 days/week104 weeks
0.72.26.6
5,82418,30454,912
——
32.0
———
———
Rats, 6.6 mg/m3, reduction in blood glucose, bloodproteins, triglycerides, and cholesterol; increase inBUN, alkaline phosphate alamine, and aspartateaminotransferases (SGPT and SGOT); hamsters, 6.6mg/m3, decrease in potassium, LDH, aspartate amino-transferase; increase in albumin and gamma-glutamyltransferase
Brightwell et al.(1986)
Cat inbred, M 8 h/day7 days/week124 weeks
6.0c
12.0d41,66483,328
20.233.3
2.74.4
2.15.0
BUN unaltered; SGOT and SGPT unaffected; LHDincrease after 1 year of exposure
Pepelko andPeirano (1983)
aLight-duty engine.bHeavy-duty engine.c1 to 61 weeks of exposure.d62 to 124 weeks of exposure.
Key: LDH = Lactate dehydrogenase.SGOT = Serum glutamic-oxaloacetic transaminase.BUN = Blood urea nitrogen.SGPT = Serum glutamic-pyruvic transaminase.

5-75
Clinical chemistry studies suggest impairment of both liver and kidney functions in rats
and hamsters chronically exposed to high concentrations of DE. The absence of
histopathological confirmation, the appearance of such effects near the end of the lifespan of the
laboratory animal, and the failure to find such biochemical changes in cats exposed to a higher
dose, however, tend to discredit the probability of hepatic and renal hazards to humans exposed
at atmospheric levels of DE.
5.1.3.3.10. Effects on microsomal enzymes. Several studies have examined the effects of DE
exposure on microsomal enzymes associated with the metabolism and possible activation of
xenobiotics, especially polynuclear aromatic hydrocarbons (PAH). These studies are
summarized in Table 5-13. Lee et al. (1980) measured the activities of aryl hydrocarbon
hydroxylase (AHH) and epoxide hydrase (EH) in liver, lung, testis, and prostate gland of adult
male rats exposed to 6.32 mg/m3 DPM 20 h/day for 42 days. Maximal significant AHH
activities (pmol/min/mg microsomal protein) occurred at different times during the exposure
period, and differences between controls and exposed rats, respectively, were as follows:
prostate 0.29 versus 1.31, lung 3.67 versus 5.11, and liver 113.9 versus 164.0. There was no
difference in AHH activity in the testis between exposed and control rats. Epoxide hydrase
activity was not significantly different from control values for any of the organs tested.
Pepelko and Peirano (1983) found no statistically significant differences in liver
microsomal cytochrome P448-450 levels and liver microsomal AHH between control and diesel-
exposed mice at either 6 or 8 mo of exposure. Small differences were noted in the lung
microsomal AHH activities, but these were believed to be artifactual differences, due to
increases in nonmicrosomal lung protein present in the microsomal preparations. Exposures to 6
mg/m3 DPM were for 8 h/day, 7 days/week.
Rabovsky et al. (1984) investigated the effect of chronic exposure to DE on microsomal
cytochrome P450-associated benzo[a]pyrene (B[a]P) hydroxylase and 7-ethoxycoumarin
deethylase activities in rat lung and liver. Male rats were exposed for 7 h/day, 5 days/week for
104 weeks to 2 mg/m3 DPM. The exposure had no effect on B[a]P hydroxylase or
7-ethoxycoumarin deethylase activities in lung or liver. In related studies, Rabovsky et al.
(1986) examined the effects of DE on viral induced enzyme activity and interferon production in
female mice. The mice were exposed for 7 h/day, 5 days/week for 1 mo to DE diluted to
achieve a concentration of 2 mg/m3 DPM. After the exposure, the mice were inoculated
intranasally with influenza virus. Changes in serum levels of interferon and liver microsomal
activities of 7-ethoxycoumarin, ethylmorphine demethylase, and nicotinamide adenine dinucleotide
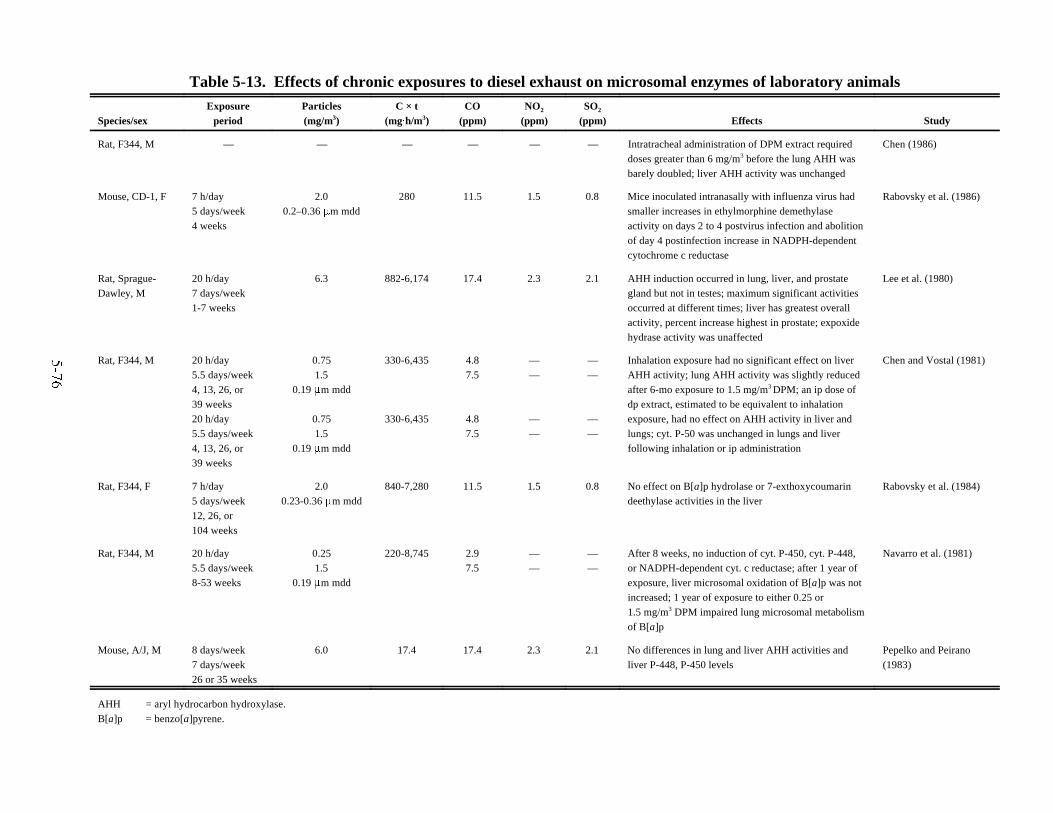
5-76
Table 5-13. Effects of chronic exposures to diesel exhaust on microsomal enzymes of laboratory animals
Species/sex Exposure
periodParticles(mg/m3)
C × t(mgAh/m3)
CO(ppm)
NO2
(ppm)SO2
(ppm) Effects Study
Rat, F344, M — — — — — — Intratracheal administration of DPM extract requireddoses greater than 6 mg/m3 before the lung AHH wasbarely doubled; liver AHH activity was unchanged
Chen (1986)
Mouse, CD-1, F 7 h/day5 days/week4 weeks
2.00.2–0.36 :m mdd
280 11.5 1.5 0.8 Mice inoculated intranasally with influenza virus hadsmaller increases in ethylmorphine demethylaseactivity on days 2 to 4 postvirus infection and abolitionof day 4 postinfection increase in NADPH-dependentcytochrome c reductase
Rabovsky et al. (1986)
Rat, Sprague-Dawley, M
20 h/day7 days/week1-7 weeks
6.3 882-6,174 17.4 2.3 2.1 AHH induction occurred in lung, liver, and prostategland but not in testes; maximum significant activitiesoccurred at different times; liver has greatest overallactivity, percent increase highest in prostate; expoxidehydrase activity was unaffected
Lee et al. (1980)
Rat, F344, M 20 h/day5.5 days/week4, 13, 26, or39 weeks 20 h/day5.5 days/week4, 13, 26, or39 weeks
0.751.5
0.19 :m mdd
0.751.5
0.19 :m mdd
330-6,435
330-6,435
4.87.5
4.87.5
——
——
——
——
Inhalation exposure had no significant effect on liverAHH activity; lung AHH activity was slightly reducedafter 6-mo exposure to 1.5 mg/m3 DPM; an ip dose ofdp extract, estimated to be equivalent to inhalationexposure, had no effect on AHH activity in liver andlungs; cyt. P-50 was unchanged in lungs and liverfollowing inhalation or ip administration
Chen and Vostal (1981)
Rat, F344, F 7 h/day5 days/week12, 26, or104 weeks
2.00.23-0.36 :m mdd
840-7,280 11.5 1.5 0.8 No effect on B[a]p hydrolase or 7-exthoxycoumarindeethylase activities in the liver
Rabovsky et al. (1984)
Rat, F344, M 20 h/day5.5 days/week8-53 weeks
0.251.5
0.19 :m mdd
220-8,745 2.97.5
——
——
After 8 weeks, no induction of cyt. P-450, cyt. P-448,or NADPH-dependent cyt. c reductase; after 1 year ofexposure, liver microsomal oxidation of B[a]p was notincreased; 1 year of exposure to either 0.25 or1.5 mg/m3 DPM impaired lung microsomal metabolismof B[a]p
Navarro et al. (1981)
Mouse, A/J, M 8 days/week7 days/week26 or 35 weeks
6.0 17.4 17.4 2.3 2.1 No differences in lung and liver AHH activities andliver P-448, P-450 levels
Pepelko and Peirano(1983)
AHH = aryl hydrocarbon hydroxylase.B[a]p = benzo[a]pyrene.

5-77
phosphate (NADPH)-dependent cytochrome c reductase were measured. In the absence of viral
inoculation, exposure to DE had no significant effects on the activity levels of the two liver
microsomal monooxygenases and NADPH-dependent cytochrome c reductase. Exposure to DE
produced smaller increases in ethylmorphine demethylase activity on days 2 to 4 postvirus
infection and also abolished the day 4 postinfection increase in NADPH-dependent cytochrome
c reductase when compared with nonexposed mice. These data suggested to the authors that the
relationship that exists between metabolic detoxification and resistance to infection in unexposed
mice was altered during a short-term exposure to DE.
Chen and Vostal (1981) measured the activity of AHH and the content of cytochrome
P450 in the lungs and livers of rats exposed by inhalation of DE or intraperitoneal (i.p.) injection
of a dichloromethane extract of DPM. In the inhalation exposures, the exhaust was diluted to
achieve concentrations of 0.75 or 1.5 mg/m3 DPM, and the exposure regimen was 20 h/day,
5.5 days/week for up to 9 mo. The concentration of total hydrocarbons and particle-phase
hydrocarbons was not reported. Parenteral administration involved repeated injections at several
dose levels for 4 days. Inhalation exposure had no significant effect on liver microsomal AHH
activity; however, lung AHH activity was slightly reduced after 6 mo exposure to 1.5 mg/m3.
An i.p. dose of DPM extract, estimated to be equivalent to the inhalation exposure, had no effect
on AHH activity in liver or lungs. No changes were observed in cytochrome P450 contents in
lungs or liver following inhalation exposure or i.p. treatment. Direct intratracheal administration
of a dichloromethane DPM extract required doses greater than 6 mg/kg body weight before the
activity of induced AHH in the lung was barely doubled; liver AHH activity remained
unchanged (Chen, 1986).
In related studies, Navarro et al. (1981) evaluated the effect of exposure to DE on rat
hepatic and pulmonary microsomal enzyme activities. The same exposure regimen was
employed (20 h/day, 5.5 days/week, for up to 1 year), and the exhaust was diluted to achieve
concentrations of 0.25 and 1.5 mg/m3 DPM (a few studies were also conducted at 0.75 mg/m3).
After 8 weeks of exposure, there was no evidence for the induction of cytochrome P450,
cytochrome P448, or NADPH-dependent cytochrome c reductase in rat liver microsomes. One
year of exposure had little, if any, effect on the hepatic metabolism of B[a]P. However, 1 year
of exposure to 0.25 and 1.5 mg/m3 significantly impaired the ability of lung microsomes to
metabolize B[a]P (0.15 and 0.02 nmole/30 min/mg protein, respectively, versus
0.32 nmole/30 min/mg protein for the controls).
There are conflicting results regarding the induction of microsomal AHH activities in the
lungs and liver of rodents exposed to DE. One study reported induction of AHH activity in the
lungs, liver, and prostate of rats exposed to DE containing 6.32 mg/m3 DPM for 20 h/day for 42
days; however, no induction of AHH was observed in the lungs of rats and mice exposed to 6
mg/m3 DPM for 8 h/day, 7 days/week for up to 8 mo or to 0.25 to 2 mg/m3 for periods up to 2
5-78
years. Exposure to DE has not been shown to produce adverse effects on microsomal
cytochrome P450 in the lungs or liver of rats or mice. The weight of evidence suggests that the
absence of enzyme induction in the rodent lung exposed to DE is caused either by the
unavailability of the adsorbed hydrocarbons or by their presence in quantities insufficient for
enzyme induction.
5.1.3.3.11. Effects on behavior and neurophysiology. Studies on the effects of exposure to DE
on the behavior and neurophysiology of laboratory animals are summarized in Table 5-14.
Laurie et al. (1978) and Laurie et al. (1980) examined behavioral alterations in adult and
neonatal rats exposed to DE. Exposure for 20 h/day, 7 days/week, for 6 weeks to exhaust
containing 6 mg/m3 DPM produced a significant reduction in adult spontaneous locomotor
activity (SLA) and in neonatal pivoting (Laurie et al., 1978). In a follow-up study, Laurie et al.
(1980) found that shorter exposure (8 h/day) to 6 mg/m3 DPM also resulted in a reduction of
SLA in adult rats. Laurie et al. (1980) conducted additional behavioral tests on adult rats
exposed during their neonatal period. For two of three exposure situations (20 h/day for 17 days
postparturition, or 8 h/day for the first 28 or 42 days postparturition), significantly lower SLA
was observed in the majority of the tests conducted on the adults after week 5 of measurement.
When compared with control rats, adult 15-month-old rats that had been exposed as neonates (20
h/day for 17 days) also exhibited a significantly slower rate of acquisition of a bar-pressing task
to obtain food. The investigators noted that the evidence was insufficient to determine whether
the differences were the result of a learning deficit or due to some other cause (e.g., motivational
or arousal differences).
These data are difficult to interpret in terms of health hazards to humans under ambient
environmental conditions because of the high concentration of DE to which the laboratory rats
were exposed. Additionally, there are no further concentration-response studies to assess at what
exposure levels these observed results persist or abate. A permanent alteration in both learning
ability and activity resulting from exposures early in life is a health hazard whose significance to
humans should be pursued further.
Neurophysiological effects from exposure to DE were investigated in rats by Laurie and
Boyes (1980, 1981). Rats were exposed to diluted DE containing 6 mg/m3 DPM for 8 h/day, 7
days/week from birth up until 28 days of age. Somatosensory evoked potential, as elicited by a
1 mA electrical pulse to the tibial nerve in the left hind limb, and visual evoked potential, as
elicited by a flash of light, were the endpoints tested. An increased pulse latency was reported
for the rats exposed to DE, and this was thought to be caused by a reduction in the degree of
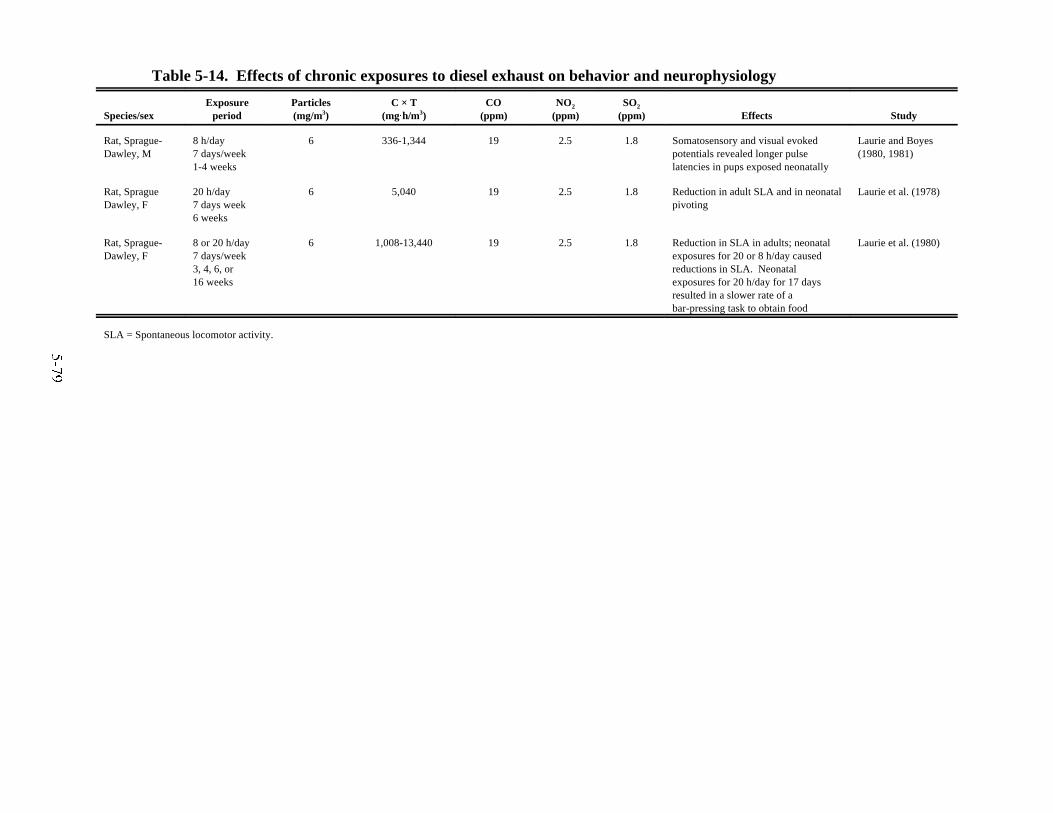
Table 5-14. Effects of chronic exposures to diesel exhaust on behavior and neurophysiology
Species/sexExposure
periodParticles(mg/m3)
C × T(mgAh/m3)
CO(ppm)
NO2
(ppm)SO2
(ppm) Effects Study
Rat, Sprague-Dawley, M
8 h/day7 days/week1-4 weeks
6 336-1,344 19 2.5 1.8 Somatosensory and visual evokedpotentials revealed longer pulselatencies in pups exposed neonatally
Laurie and Boyes(1980, 1981)
Rat, SpragueDawley, F
20 h/day7 days week6 weeks
6 5,040 19 2.5 1.8 Reduction in adult SLA and in neonatalpivoting
Laurie et al. (1978)
Rat, Sprague-Dawley, F
8 or 20 h/day7 days/week3, 4, 6, or16 weeks
6 1,008-13,440 19 2.5 1.8 Reduction in SLA in adults; neonatalexposures for 20 or 8 h/day causedreductions in SLA. Neonatalexposures for 20 h/day for 17 daysresulted in a slower rate of abar-pressing task to obtain food
Laurie et al. (1980)
SLA = Spontaneous locomotor activity.
5-79

5-80
nerve myelinization. There was no neuropathological examination, however, to confirm this
supposition.
Based on the data presented, it is not possible to specify the particular neurological
impairment(s) induced by the exposure to DE. Again, these results occurred following exposure
to a high level of DE and no additional concentration-response studies were performed.
5.1.3.3.12. Effects on reproduction and development. Studies of the effects of exposure to DE
on reproduction and development are summarized in Table 5-15. Twenty rats were exposed 8
h/day on days 6 through 15 of gestation to diluted DE containing 6 mg/m3 DPM (Werchowski et
al., 1980a,b; Pepelko and Peirano, 1983). There were no signs of maternal toxicity or decreased
fertility. No skeletal or visceral teratogenic effects were observed in 20-day-old fetuses
(Werchowski et al., 1980a). In a second study, 42 rabbits were exposed to 6 mg/m3 DPM for 8
h/day on gestation days 6 through 18. No adverse effects on body weight gain or fertility were
seen in the does exposed to DE. No visceral or skeletal developmental abnormalities were
observed in the fetuses (Werchowski et al., 1980b).
Pepelko and Peirano (1983) evaluated the potential for DE to affect reproductive
performance in mice exposed from 100 days prior to exposure throughout maturity of the F2
generation. The mice were exposed for 8 h/day, 7 days/week to 12 mg/m3 DPM. In general,
treatment-related effects were minimal. Some differences in organ and body weights were
noted, but overall fertility and survival rates were not altered by exposure to DE. The only
consistent change, an increase in lung weights, was accompanied by a gross pathological
diagnosis of anthracosis. These data denoted that exposure to DE at a concentration of 12 mg/m3
did not affect reproduction. See Section 5.3, which reports a lack of effects of exposure to DE
on rat lung development (Mauderly et al., 1987b).
Several studies have evaluated the effect of exposure to DE on sperm. Lewis et al.
(1989) found no adverse sperm effects (sperm motility, velocity, densities, morphology, or
incidence of abnormal sperm) in monkeys exposed for 7 h/day, 5 days/week for 104 weeks to 2
mg/m3 DPM. In another study in which A/Strong mice were exposed to DE containing 6 mg/m3
DPM for 8 h/day for 31 or 38 weeks, no significant differences were observed in sperm
morphology between exposed and control mice (Pereira et al., 1981). It was noted, however,
that there was a high rate of spontaneous sperm abnormalities in this strain of mice, and this
may have masked any small positive effect. Quinto and De Marinis (1984) reported a
statistically significant and dose-related increase in sperm abnormalities in mice injected
intraperitoneally for 5 days with 50, 100, or 200 mg/kg of DPM suspended in corn oil.
A significant decrease in sperm number was seen at the highest dose, but testicular weight was
unaffected by the treatment.
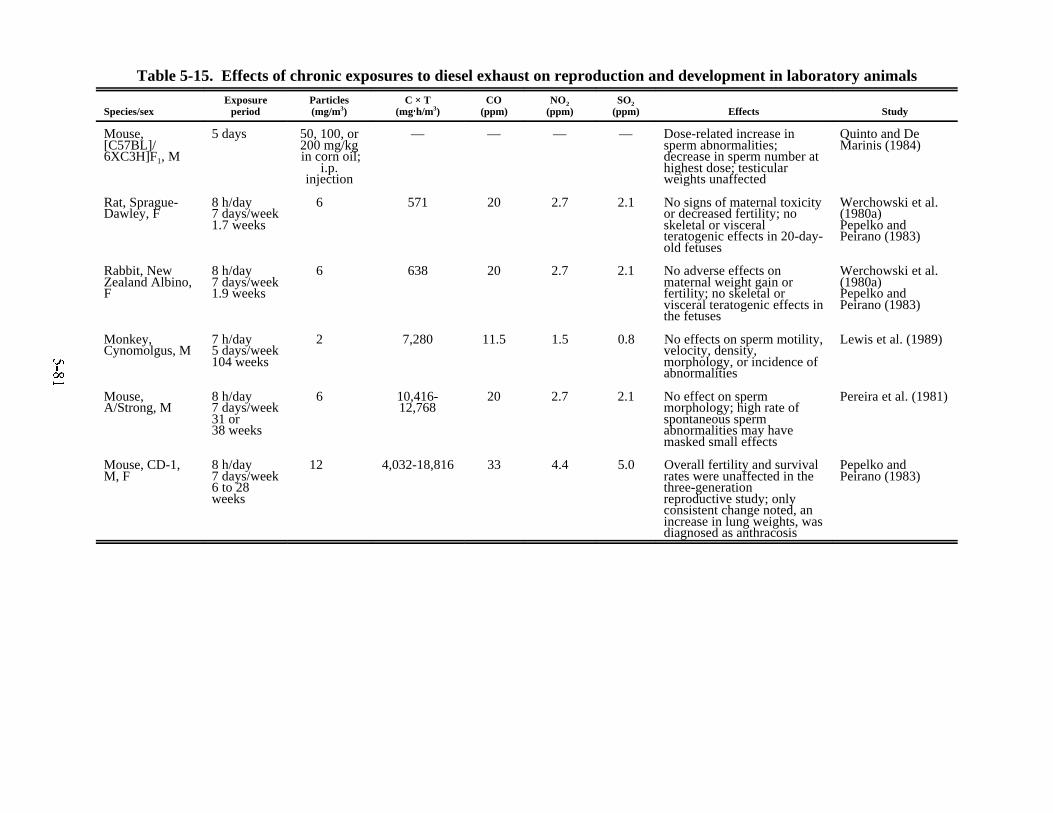
Table 5-15. Effects of chronic exposures to diesel exhaust on reproduction and development in laboratory animals
Species/sexExposure
periodParticles(mg/m3)
C × T(mgAh/m3)
CO(ppm)
NO2(ppm)
SO2(ppm) Effects Study
Mouse,[C57BL]/6XC3H]F1, M
5 days 50, 100, or200 mg/kg in corn oil;
i.p.injection
— — — — Dose-related increase insperm abnormalities;decrease in sperm number athighest dose; testicularweights unaffected
Quinto and DeMarinis (1984)
Rat, Sprague-Dawley, F
8 h/day7 days/week1.7 weeks
6 571 20 2.7 2.1 No signs of maternal toxicityor decreased fertility; noskeletal or visceralteratogenic effects in 20-day-old fetuses
Werchowski et al.(1980a) Pepelko andPeirano (1983)
Rabbit, NewZealand Albino,F
8 h/day7 days/week1.9 weeks
6 638 20 2.7 2.1 No adverse effects onmaternal weight gain orfertility; no skeletal orvisceral teratogenic effects inthe fetuses
Werchowski et al.(1980a) Pepelko andPeirano (1983)
Monkey,Cynomolgus, M
7 h/day5 days/week104 weeks
2 7,280 11.5 1.5 0.8 No effects on sperm motility,velocity, density,morphology, or incidence ofabnormalities
Lewis et al. (1989)
Mouse,A/Strong, M
8 h/day7 days/week31 or38 weeks
6 10,416-12,768
20 2.7 2.1 No effect on spermmorphology; high rate ofspontaneous spermabnormalities may havemasked small effects
Pereira et al. (1981)
Mouse, CD-1,M, F
8 h/day7 days/week6 to 28weeks
12 4,032-18,816 33 4.4 5.0 Overall fertility and survivalrates were unaffected in thethree-generationreproductive study; onlyconsistent change noted, anincrease in lung weights, wasdiagnosed as anthracosis
Pepelko andPeirano (1983)
5-81
5-82
Watanabe and Oonuki (1999) investigated the effects of diesel engine exhaust on
reproductive endocrine function in growing rats. The rats were exposed to whole diesel engine
exhaust (5.63 mg/m3 DPM, 4.10 ppm NO2, and 8.10 ppm NOx); a group was exposed to filtered
exhaust without DPM, and a group was exposed to clean air. Exposures were for 3 mo
beginning at birth (6 hrs/day for 5 days/week).
Serum levels of testosterone and estradiol were significantly higher and follicle-
stimulating hormone significantly lower in animals exposed to whole DE and filtered exhaust
compared to controls. Luteinizing hormone was significantly decreased in the whole-exhaust-
exposed group as compared to the control and filtered groups. Sperm production and activity of
testicular hyaluronidase were significantly reduced in both exhaust-exposed groups as compared
to the control group. This study suggests that DE stimulates hormonal secretion of the adrenal
cortex, depresses gonadotropin-releasing hormone, and inhibits spermatogenesis in rats.
Because these effects were not inhibited by filtration, the gaseous phase of the exhaust appears
more responsible than particulate matter for disrupting the endocrine system.
The effects of freshly generated DE particles on the reproductive system of male Fischer
344 rats were investigated by Tsukue et al. (2001). Groups (n=25) of 13-mo. old male rats were
exposed to whole DE diluted to 0.33, 0.99 or 3.24 mg/m3 (MMAD = 0.4 µm) for 8 months
12 hrs/day, 7 days/week. Subsequent to this exposure, evaluation of potential reproductive effect
was performed, including measurement of reproductive organ weights, sperm characteristics and
number, gonadotrophins, testosterone, and inhibin. Results showed either no effect or effects
with an inconsistent dose-response character that typically were not different from controls even
at the highest exposure concentration.
No teratogenic, embryotoxic, fetotoxic, or female reproductive effects were observed in
mice, rats, or rabbits at exposure levels up to 12 mg/m3 DPM. Effects on sperm morphology and
number were reported in hamsters and mice exposed to high doses of DPM; however, no adverse
effects were observed in sperm obtained from monkeys exposed at 2 mg/m3 for 7 hrs/day,
5 days/week for 104 weeks. Concentrations of 12 mg/m3 DPM did not affect male rat
reproductive fertility in the F0 and F1 generation breeders. Thus, exposure to DE would not
appear to be a reproductive or developmental hazard.
5.2. MODE OF ACTION OF DIESEL EXHAUST-INDUCED NONCANCER EFFECTS
5.2.1. Comparison of Health Effects of Filtered and Unfiltered Diesel Exhaust
There exist a total of four chronic toxicity studies of DE, in which the experimental
protocol included exposing test animals to exhaust containing no particles. Comparisons were
then made between the effects caused by whole, unfiltered exhaust and those caused by the
gaseous components of the exhaust. Concentrations of components of the exposure atmospheres
in these four studies are given in Table 5-16.

5-83
Heinrich et al. (1982) compared the toxic effects of whole and filtered DE on hamsters
and rats. Exposures were at 3.9 mg/m3 for 7 to 8 hrs/day and 5 days/week. Rats exposed for 24
mo to either whole or filtered exhaust exhibited no significant changes in respiratory frequency,
respiratory minute volume, compliance or resistance as measured by a whole-body
plethysmography, or heart rate. In the hamsters, histological changes (adenomatous
proliferations) were seen in the lungs of animals exposed to either whole or filtered exhaust;
however, in all groups exposed to the whole exhaust the number of hamsters exhibiting such
lesions was significantly higher than for the corresponding groups exposed to filtered exhaust or
clean air. Severity of the lesions was, however, not reported.
In a second study, Heinrich et al. (1986a, see also Stöber, 1986) compared the toxic
effects of whole and filtered DE on hamsters, rats, and mice. The test animals (96 per test
group) were exposed to 4.24 mg DPM/m3 for 19 hrs/day, 5 days/week for 120 (hamsters and
mice) or 140 (rats) weeks. Body weights of hamsters were unaffected by either exposure. Body
weights of rats and mice were reduced by the whole exhaust but not by the filtered exhaust.
Exposure-related higher mortality rates occurred in mice after 2 years of exposure to whole
exhaust. After 1 year of exposure to the whole exhaust, hamsters exhibited increased lung
weights, a significant increase in airway resistance, and a nonsignificant reduction in lung
compliance. For the same time period, rats exhibited increased lung weights, a significant
decrease in dynamic lung compliance, and a significant increase in airway resistance. Test
animals exposed to filtered exhaust did not exhibit such effects. Histopathological examination
indicated that different levels of response occurred in the three species. In hamsters, filtered
exhaust caused no significant histopathological effects in the lung; whole exhaust caused
thickened alveolar septa, bronchioloalveolar hyperplasia, and emphysematous lesions. In mice,
whole exhaust, but not filtered exhaust, caused multifocal bronchioloalveolar hyperplasia,
multifocal alveolar lipoproteinosis, and multifocal interstitial fibrosis. In rats, there were no
significant morphological changes in the lungs following exposure to filtered exhaust. In rats
exposed to whole exhaust, there were severe inflammatory changes in the lungs, thickened
alveolar septa, foci of macrophages, crystals of cholesterol, and hyperplastic and metaplastic
lesions. Biochemical studies of lung lavage fluids of hamsters and mice indicated that exposure
to filtered exhaust caused fewer changes than did exposure to whole exhaust. The latter
produced significant increases in lactate dehydrogenase, alkaline phosphatase, glucose-6-
phosphate dehydrogenase (G6PDH), total protein, protease (pH 5.1), and collagen. The filtered
exhaust had a slight but nonsignificant effect on G6PDH, total protein, and collagen. Similarly,
cytological studies showed that while the filtered exhaust had no effect on differential cell
counts, the whole
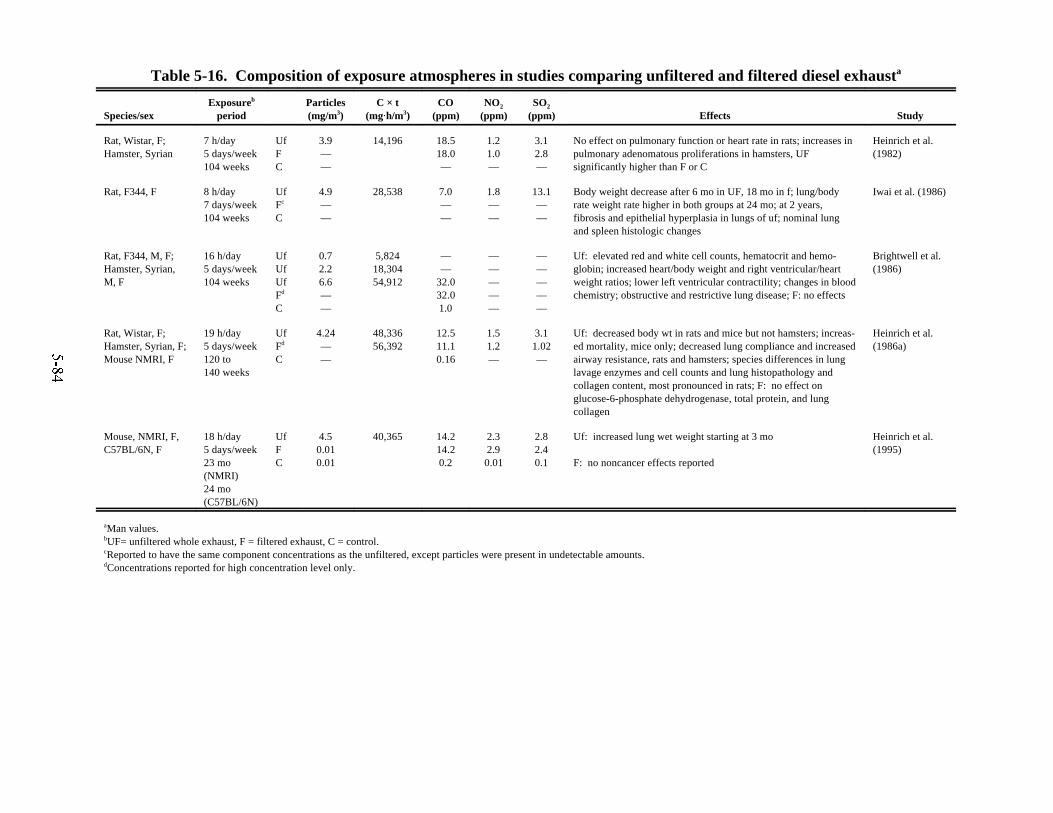
Table 5-16. Composition of exposure atmospheres in studies comparing unfiltered and filtered diesel exhausta
Species/sexExposureb
periodParticles(mg/m3)
C × t(mgAh/m3)
CO(ppm)
NO2
(ppm)SO2
(ppm) Effects Study
Rat, Wistar, F;Hamster, Syrian
7 h/day5 days/week104 weeks
UfFC
3.9——
14,196 18.518.0—
1.21.0—
3.12.8—
No effect on pulmonary function or heart rate in rats; increases inpulmonary adenomatous proliferations in hamsters, UFsignificantly higher than F or C
Heinrich et al.(1982)
Rat, F344, F 8 h/day 7 days/week104 weeks
UfFc
C
4.9——
28,538 7.0——
1.8——
13.1——
Body weight decrease after 6 mo in UF, 18 mo in f; lung/bodyrate weight rate higher in both groups at 24 mo; at 2 years,fibrosis and epithelial hyperplasia in lungs of uf; nominal lungand spleen histologic changes
Iwai et al. (1986)
Rat, F344, M, F;Hamster, Syrian, M, F
16 h/day5 days/week104 weeks
UfUfUfFd
C
0.72.26.6——
5,82418,30454,912
——
32.032.01.0
—————
—————
Uf: elevated red and white cell counts, hematocrit and hemo-globin; increased heart/body weight and right ventricular/heartweight ratios; lower left ventricular contractility; changes in bloodchemistry; obstructive and restrictive lung disease; F: no effects
Brightwell et al.(1986)
Rat, Wistar, F;Hamster, Syrian, F;Mouse NMRI, F
19 h/day5 days/week120 to140 weeks
UfFd
C
4.24——
48,33656,392
12.511.10.16
1.51.2—
3.11.02—
Uf: decreased body wt in rats and mice but not hamsters; increas-ed mortality, mice only; decreased lung compliance and increasedairway resistance, rats and hamsters; species differences in lunglavage enzymes and cell counts and lung histopathology andcollagen content, most pronounced in rats; F: no effect onglucose-6-phosphate dehydrogenase, total protein, and lungcollagen
Heinrich et al.(1986a)
Mouse, NMRI, F,C57BL/6N, F
18 h/day5 days/week23 mo(NMRI)24 mo(C57BL/6N)
UfFC
4.50.010.01
40,365 14.214.20.2
2.32.90.01
2.82.40.1
Uf: increased lung wet weight starting at 3 mo
F: no noncancer effects reported
Heinrich et al.(1995)
aMan values.bUF= unfiltered whole exhaust, F = filtered exhaust, C = control.cReported to have the same component concentrations as the unfiltered, except particles were present in undetectable amounts.dConcentrations reported for high concentration level only.
5-84

5-85
counts, the whole exhaust resulted in an increase in leukocytes (161 ± 43.3/µL versus 55.7 ±
12.8/µL controls), a decrease in AMs (30.0 ± 12.5 versus 51.3 ± 12.5/µL in the controls),
and an increase in granulocytes (125 ± 39.7 versus 1.23 ± 1.14/µL in the controls). All
values presented for this study are the mean with its standard deviation. The differences were
significant for each cell type. There was also a small increase in lymphocytes (5.81 ± 4.72
versus 3.01 ± 1.23 µL in the controls).
Iwai et al. (1986) exposed rats (24 per group) to whole or filtered DE 8 h/day,
7 days/week for 24 mo. The whole exhaust was diluted to achieve a concentration of
4.9 ± 1.6 mg/m3 DPM. Body weights in the whole exhaust group began to decrease after 6 mo
and in both exposed groups began to decrease after 18 mo when compared with controls.
Lung-to-body weight ratios of the rats exposed to the whole exhaust showed a significant
increase (p<0.01) after 12 mo in comparison with control values. Spleen-to-body weight ratios
of both exposed groups were higher than control values after 24 mo. After 6 mo of exposure to
whole exhaust, DPM accumulated in AMs, and Type II cell hyperplasia was observed. After
2 years of exposure, the alveolar walls had become fibrotic with mast cell infiltration and
epithelial hyperplasia. In rats exposed to filtered exhaust, after 2 years there were only minimal
histologic changes in the lungs, with slight hyperplasia and stratification of bronchiolar
epithelium and infiltration of atypical lymphocytic cells in the spleen.
Brightwell et al. (1986) evaluated the toxic effects of whole and filtered DE on rats and
hamsters. Three exhaust dilutions were tested, producing concentrations of 0.7, 2.2, and 6.6
mg/m3 DPM. The test animals (144 rats and 312 hamsters per exposure group) were exposed for
five 16-h periods per week for 2 years. The four exposure types were gasoline, gasoline catalyst,
diesel, and filtered diesel. The results presented were limited to statistically significant
differences between exhaust-exposed and control animals. The inference from the discussion
section of the paper was that there was a minimum of toxicity in the animals exposed to filtered
DE: “It is clear from the results presented that statistically significant differences between
exhaust-exposed and control animals are almost exclusively limited to animals exposed to either
gasoline or unfiltered diesel exhaust.” Additional results are described in Section 5.1.3.3.
Heinrich et al. (1995) exposed female NMRI and C57BL/6N mice to a DE dilution that
resulted in a DPM concentration of 4.5 mg/m3 and to the same dilution after filtering to remove
the particles. This study is focused on the carcinogenic effects of DPM exposure, and
inadequate information was presented to compare noncancer effects in filtered versus unfiltered
exhaust.
A comparison of the toxic responses in laboratory animals exposed to whole exhaust or
filtered exhaust containing no particles demonstrates across studies that when the exhaust is
sufficiently diluted to limit the concentrations of gaseous irritants (NO2 and SO2), irritant vapors
(aldehydes), CO, or other systemic toxicants, the diesel particles are the prime etiologic agents
5-86
of noncancer health effects, although additivity or synergism with the gases cannot be ruled out.
These toxic responses are both functional and pathological and represent cascading sequelae of
lung pathology based on concentration and species. The diesel particles plus gas exposures
produced biochemical and cytological changes in the lung that are much more prominent than
those evoked by the gas phase alone. Such marked differences between whole and filtered DE
are also evident from general toxicological indices, such as decreases in body weight and
increases in lung weights, pulmonary function measurements, and pulmonary histopathology
(e.g., proliferative changes in Type II cells and respiratory bronchiolar epithelium, fibrosis).
Hamsters, under equivalent exposure regimens, have lower levels of retained DPM in their lungs
than rats and mice do and, consequently, less pulmonary function impairment and pulmonary
pathology. These differences may result from lower DPM inspiration and deposition during
exposure, greater DPM clearance, or lung tissue less susceptible to the cytotoxicity of deposited
DPM.
5.2.2. Mode of Action for the Noncarcinogenic Effects of DPM
As noted in Chapter 2, diesel emissions are a complex mixture that includes both a vapor
phase and a particle phase. The particle phase consists of poorly soluble carbon particles on the
surfaces of which are adsorbed a large number of organic and inorganic compounds. Although
the effects to be discussed are considered attributable to the particle phase (termed diesel
particulate matter or DPM), additive or synergistic effects due to the vapor phase cannot be
totally discounted. This may be especially so in the human studies and the animal toxicology
studies where exposure is to various dilutions of diesel emissions, or in the in vitro studies in
which the test material was captured by filtration.
The mechanisms by which DPM is inhaled, deposited, and cleared from the respiratory
tract are discussed in Chapter 3. DPM deposited upon airway surfaces may be cleared from the
respiratory tract completely, or may be translocated to other sites within the respiratory system.
In rats, the pathogenic sequence following the deposition of inhaled DPM begins with the
interaction of DPM with airway epithelial cells and phagocytosis by AMs. The airway epithelial
cells and activated AMs release chemotactic factors that attract neutrophils and additional AMs.
As the lung burden of DPM increases, there is an aggregation of particle-laden AMs in alveoli
adjacent to terminal bronchioles, increases in the number of Type II cells lining particle-laden
alveoli, and the presence of particles within alveolar and peribronchial interstitial tissues and
associated lymph nodes.
The macrophages engulfing the DPM may release cytokines, growth factors, and
proteases, which may cause inflammation, cell injury, cell proliferation, hyperplasia, and
fibrosis. This is especially true under lung overload conditions occurring in laboratory rats when
the rate of deposition exceeds the rate of alveolar clearance. This phenomenon is described in

5-87
Chapter 3. The mechanisms leading to the generation of oxygen radicals and subsequent lung
injury are described in Chapter 7, Section 7.4.3.
DPM is a poorly soluble particle whose rate of clearance by dissolution is likely
insignificant compared to its rate of clearance as an intact particle. The organic material
adsorbed to the surface is desorbed from the DPM and may enter into metabolic reactions and be
activated and enter into reactions with other macromolecules or be detoxified and excreted
(Figure 7-1). The diesel particle may be cleared directly by the clearance mechanisms described
in Chapter 3.
The organic material desorbed from the particle (described in Chapter 7, Section 7.4.7)
appears to be associated with the immunological changes described above. The potential
adjuvant effects of DPM have also been studied. The results indicate that the nonextractable
particle core and the organic matter adsorbed to the core both contribute to the adjuvant activity
of DPM. Further, it is possible that any of the plethora of compounds present in the organic
fraction of DPM, including various PAH, may elicit this response.
Thus, the available evidence indicates that DPM has the potential to produce pathological
and immunological changes in the respiratory tract. Moreover, the magnitude of these responses
is determined by the dose delivered to the respiratory tract and is attributable to both the carbon
core and the adsorbed organic materials.
5.3. INTERACTIVE EFFECTS OF DIESEL EXHAUST
A multitude of factors may influence the susceptibility to exposure to DE as well as the
resulting response. Some of these have already been discussed in detail (e.g., the composition of
DE and concentration-response data); others will be addressed in this section (e.g., the
interaction of DE with factors particular to the exposed individual and the interaction of DE
components with other airborne contaminants).
In a study discussed already in this chapter, Mauderly et al. (1990a) compared the
susceptibility of normal rats and rats with preexisting laboratory-induced pulmonary emphysema
exposed for 7 h/day, 5 days/week for 24 mo to DE containing 3.5 mg/m3 DPM or to clean air
(controls). Emphysema was induced in one-half of the rats by intratracheal instillation of
elastase 6 weeks before exhaust exposure. Measurements included lung burdens of DPM,
respiratory function, bronchoalveolar lavage, clearance of radiolabeled particles, pulmonary
immune responses, lung collagen, excised lung weight and volume, histopathology, and mean
linear intercept of terminal air spaces. None of the data for the 63 parameters measured suggest
that rats with emphysematous lungs were more susceptible than rats with normal lungs to the
effects of DE exposure. In fact, each of the 14 emphysema-exhaust interactions detected by
statistical analysis of variance indicated that emphysema acted to reduce the effects of DE
exposure. DPM accumulated much less rapidly in the lungs of emphysematous rats than in those
5-88
of normal rats. The mean lung burdens of DPM in the emphysematous rats were 39%, 36%, and
37% of the lung burdens of normal rats at 12, 18, and 24 mo, respectively. No significant
interactions were observed among lung morphometric parameters. Emphysema prevented the
exhaust-induced increase for three respiratory indices of expiratory flow rate at low lung
volumes, reduced the exhaust-induced increase in nine lavage fluid indicators of lung damage,
prevented the expression of an exhaust-induced increase in lung collagen, and reduced the
exhaust-induced delay in DPM clearance.
Mauderly et al. (1987b) evaluated the relative susceptibility of developing and adult rat
lungs to damage by exposure to DE. Rats (48 per test group) were exposed to DE containing 3.5
mg/m3 DPM and about 0.8 ppm NO2. Exposures were for 7 h/day, 5 days/week through
gestation to the age of 6 mo, or from the age of 6 to 12 mo. Comparative studies were
conducted on respiratory function, immune response, lung clearance, airway fluid enzymes,
protein and cytology, lung tissue collagen, and proteinases in both age groups. After the 6-mo
exposure, adult rats, compared with controls, exhibited (1) more focal aggregates of particle-
containing AMs in the alveolar ducts near the terminal bronchioles, (2) a sixfold increase in the
neutrophils (as a percentage of total leukocytes) in the airway fluids, (3) a significantly higher
number of total lymphoid cells in the pulmonary lymph nodes, (4) delayed clearance of DPM
and radiolabeled particles (t1/2 = 90 days versus 47 days for controls), and (5) increased lung
weights. These effects were not seen in the developing rats. On a weight-for-weight
(milligrams of DPM per gram of lung) basis, DPM accumulation in the lungs was similar in
developing and adult rats immediately after the exposure. During the 6-mo postexposure period,
DPM clearance was much more rapid in the developing rats, approximately 2.5-fold. During
postexposure, diesel particle-laden macrophages became aggregated in the developing rats, but
these aggregations were located primarily in a subpleural position. The authors concluded that
exposure to DE, using pulmonary function, structural (qualitative or quantitative) biochemistry
as the indices, did not affect the developing rat lung more severely than the adult rat lung.
As a result of the increasing trend of using diesel-powered equipment in coal mining
operations and the concern for adverse health effects in coal miners exposed to both coal dust or
coal mine dust and DE, Lewis et al. (1989) and Karagianes et al. (1981) investigated the
interaction of coal dust and DE. Lewis et al. (1989) exposed rats, mice, and cynomolgus
monkeys to (1) filtered ambient air, (2) 2 mg/m3 DPM, (3) 2 mg/m3 respirable coal dust, and (4)
1 mg/m3 of both DPM and respirable coal dust. Gaseous and vapor concentrations were
identical in both DE exposures. Exposures were for 7 h/day, 5 days/week for up to 24 mo.
Synergistic effects between DE and coal dust were not demonstrated; additive toxic effects were
the predominant effects noted.
Karagianes et al. (1981) exposed rats (24 per group) to DE containing 8.3 mg/m3 of DPM
alone or in combination with about 6 mg/m3 of coal dust. No synergistic effects were found

5-89
between DE and coal dust; additive effects in terms of visual dust burdens in necropsied lungs
were related to dose (i.e., length of exposure and airborne particulate concentrations).
The health effects of airborne contaminants from sources other than diesel engines may
be altered in the presence of DPM by their adsorption onto the diesel particles. When adsorbed
onto diesel particles, the gases and vapors can be transported and deposited deeper into the
lungs, and because they are more concentrated on the particle surface, the resultant cytotoxic
effects or physiological responses may be enhanced. Nitrogen dioxide adsorbed onto carbon
particles caused pulmonary parenchymal lesions in mice, whereas NO2 alone produced edema
and inflammation but no lesions (Boren, 1964). Exposure to formaldehyde and acrolein
adsorbed onto carbon particles (1 to 4 :m) resulted in the recruitment of PMNs to tracheal and
intrapulmonary epithelial tissues but not when the aldehydes were tested alone (Kilburn and
McKenzie, 1978).
Madden et al. (2000) observed that O3 exposure increased the bioactivity of DPM. DPM,
preexposed to O3 for 48 h or nonozone-exposed DPM (1 to 500 :g), was instilled into the lungs
of laboratory rats. Lung inflammation and injury were examined 24 h after instillation by lung
lavage. DPM pre-exposed to 0.1 PPM O3 was more potent in increasing neutrophilia, lavage
total protein, and LDH compared to unexposed DPM. Treatment of DPM with higher
concentrations of O3 (1.0 PPM) decreased the bioactivity of the particles.
There is no direct evidence that DE, at concentrations found in the ambient environment,
interacts with other substances in the exposure environment or the physiological status of the
exposed subject other than impaired resistance to respiratory tract infections. Although there is
experimental evidence that gases and vapors can be adsorbed onto carbonaceous particles,
enhancing the toxicity of these particles when deposited in the lung, there is no evidence for an
increased health risk from such interactions with DPM under urban atmospheric conditions.
Likewise, there is no experimental evidence in laboratory animals that the youth or preexisting
emphysema of an exposed individual enhances the risk of exposure to DE.
5.4. COMPARATIVE RESPONSIVENESS AMONG SPECIES TO THE
HISTOPATHOLOGIC EFFECTS OF DIESEL EXHAUST
There is some evidence indicating that species may differ in pulmonary responses to DE.
Mauderly (1994) compared the pulmonary histopathology of rats and mice after 18 mo of
exposure to DE. There was less aggregation of macrophages in mice. Diffuse septal thickening
was noted in the mice, but there were few inflammatory cells, no focal fibrosis, little epithelial
hyperplasia, and no epithelial metaplasia, as was observed in rats. Heinrich et al. (1986a)
reported that wet lung weight of hamsters increased only 1.8-fold following chronic exposure to
DE, compared with an increase of 3.4-fold in rats. Smaller increases in neutrophils, lactic acid
dehydrogenase, collagen, and protein supported the conclusion of a lesser inflammatory response

5-90
in Syrian hamsters. The histopathologic changes in the lungs of Chinese hamsters after 6 mo
exposure to DE, on the other hand, was similar to that of rats (Pepelko and Peirano, 1983).
Guinea pigs respond to chronic DE exposure with a well-defined epithelial proliferation, but it is
based on an eosinophilic response in contrast to the neutrophil-based responses in other species.
Epithelial hyperplasia and metaplasia were quite striking in the terminal and respiratory
bronchioles of cats exposed for 27 mo to DE (Plopper et al., 1983). This study is of particular
interest because the terminal airways of cats are more similar to those of humans than rodent
species are. It should be noted, however, that exposure concentrations were very high
(12 mg/m3) for most of the period. Lewis et al. (1989) exposed rats and cynomolgus monkeys
8 h per day, 5 days per week for 2 years to DE at a particle concentration of 2 mg/m3.
Unfortunately, this exposure rate was sufficiently low that few effects were noted in either
species other than focal accumulations of particles, primarily in the alveolar macrophages,
interstitium, and lymphoid tissue. It is apparent that species do vary in their pulmonary
responses to DE exposure, despite the difficulty in making direct comparisons because of
differences in exposure regimes, lifespans, and pulmonary anatomy. Most species do respond,
however, suggesting that humans are likely to be susceptible to induction of pulmonary
pathology during chronic exposure to DE at some level.
5.5. DOSE-RATE AND PARTICULATE CAUSATIVE ISSUES
The purpose of animal toxicological experimentation is to elucidate mechanisms of
action and identify the hazards and dose-response effects posed by a chemical substance or
complex mixture and to extrapolate these effects to humans for subsequent health assessments.
The cardinal principle in such a process is that the intensity and character of the toxic action are
a function of the dose of the toxic agent(s) that reaches the critical site of action. The
considerable body of evidence reviewed clearly denotes that major noncancerous health hazards
may be presented to the lung following the inhalation of DE. Based on pulmonary function and
histopathological and histochemical effects, a determination can be made concerning which
dose/exposure rates of DE (expressed in terms of the DPM concentration) result in injury to the
lung and which appear to elicit no effect. The inhalation of poorly soluble particles, such as
those found in DE, increases the pulmonary particulate burden. When the dosing rate exceeds
the ability of the pulmonary defense mechanisms to achieve a steady-state lung burden of
particles, there is a slowing of clearance and the progressive retention of particles in the lung that
can ultimately approach a complete cessation of lung clearance (Morrow, 1988). This
phenomenon, which is reviewed in Chapter 3, has practical significance both for the
interpretation of experimental inhalation data and for the prevention of disease in humans
exposed to airborne particles.
5-91
The data for exposure intensities that cause adverse pulmonary effects demonstrate that
they are less than the exposure intensities reported to be necessary to induce lung tumors. Using
the most widely studied laboratory animal species and the one reported to be the most sensitive
to tumor induction, the laboratory rat, the no-adverse-effect exposure intensity for adverse
pulmonary effects was 56 mgAhAm-3/week (Brightwell et al., 1986). The lowest-observed-effect
level for adverse pulmonary effects (noncancer) in rats was 70 mgAhAm-3/week (Lewis et al.,
1989), and for pulmonary tumors, 122.5 mgAhAm-3/week (Mauderly et al., 1987a). The results
clearly show that noncancerous pulmonary effects are produced at lower exposure intensities
than are pulmonary tumors. Such data support the position that inflammatory and proliferative
changes in the lung may play a key role in the etiology of pulmonary tumors in exposed rats
(Mauderly et al., 1990b).
The effects of DE on the developing lung and on a model of a preexisting disease state
have been studied in rats (Mauderly et al., 1990a, 1987b). Mauderly et al. (1987b) showed that
diesel did not affect the developing lung more severely than the adult rat lung, and in fact, that
clearance was faster in the younger lung. Mauderly et al. (1990a) compared the pulmonary
response to inhalation of DE in rats with elastase-induced emphysema with normal rats. They
found that respiratory tract effects were not more severe in emphysematous rats and that the lung
burden of particles was less in the compromised rat. These studies provide limited evidence that
some factors that are often considered to result in a wider distribution of sensitivity among
members of the population may not have this effect with diesel exposure. However, these
studies have no counterpart in human studies and extrapolation to humans remains uncertain.
There is also the issue of whether the noncancerous health effects related to exposure to
DE are caused by the carbonaceous core of the particle or substances adsorbed onto the core, or
both.
Current understanding, derived primarily from studies in rats, suggests that much of the
toxicity resulting from the inhalation of DE relates to the carbonaceous core of the particles.
Several studies on inhaled aerosols demonstrate that lung reactions characterized by an
appearance of particle-laden AMs and their infiltration into the alveolar ducts, adjoining alveoli,
and tracheobronchial lymph nodes; hyperplasia of Type II cells; and the impairment of
pulmonary clearance mechanisms are not limited to exposure to diesel particles. Such responses
have also been observed in rats following the inhalation of coal dust (Lewis et al., 1989;
Karagianes et al., 1981), titanium dioxide (Heinrich et al., 1995; Lee et al., 1985), CB (Nikula et
al., 1995; Heinrich et al., 1995), titanium tetrachloride hydrolysis products (Lee et al., 1986),
quartz (Klosterkötter and Bünemann, 1961), volcanic ash (Wehner et al., 1986), amosite (Bolton
et al., 1983), and manmade mineral fibers (Lee et al., 1988) among others. In more recent
studies, animals have been exposed to CB that is similar to the carbon core of the DE particle.
Nikula et al. (1995) exposed rats for 24 mo to CB or DE at target exposure concentrations of 2.5
5-92
and 6 mg/m3 (exposure rates of 200 or 520 mgAhAm-3/week). Both concentrations induced AM
accumulation, epithelial proliferation, inflammation, and fibrosis. They observed essentially no
difference in potency of nonneoplastic or in tumor responses based on a regression analysis.
Dungworth et al. (1994) reported moderate to severe inflammation characterized by
multifocal bronchoalveolar hyperplasia, alveolar histiocytosis, and focal segmental fibrosis in
rats exposed to CB for up to 20 mo at exposure rates of 510 to 540 mgAhAm-3/week. The
observed lung pathology reflects notable dose-response relationships and usually evolves in a
similar manner. With increasing dose, there is an increased accumulation and aggregation of
particle-laden AMs, Type II cell hyperplasia, a foamy (degenerative) macrophage response,
alveolar proteinosis, alveolar bronchiolization, cholesterol granulomas, and often squamous cell
carcinomas and bronchioalveolar adenomas derived from metaplastic squamous cells in the areas
of alveolar bronchiolization.
Heinrich et al. (1995) compared effects of diesel exposure in rats and mice with exposure
to titanium dioxide or carbon black. Exposures to TiO2 and carbon black were adjusted during
the exposure to result in a similar lung burden for the three types of particles. At similar lung
burdens in the rat, DPM, TiO2, and CB had nearly identical effects on lung weights and on the
incidence of lesions, both noncancer and cancer. Also, a similar effect on clearance of a labeled
test aerosol was measured for the different particles. A comparison of the effect of DPM, TiO2,
and carbon black exposures in mice also showed a similar effect on lung weight, but noncancer
effects were not reported and no significant increase in tumors was observed.
Murphy et al. (1998) compared the toxicological effects of DPM with three other
particles chosen for their differing morphology and surface chemistry. One mg each of well-
characterized crystalline quartz, amorphous silica, CB, and DPM was administered to laboratory
rats by a single intratracheal instillation. The laboratory rats were sacrificed at 48 h, and 1, 6,
and 12 weeks after instillation. Crystalline quartz produced significant increases in lung
permeability, persistent surface inflammation, progressive increases in pulmonary surfactant and
activities of epithelial marker enzymes up to 12 wk after primary exposure. Amorphous silica
did not cause progressive effects but did produce initial epithelial damage with permeability
changes that regressed with time after exposure. By contrast, CB had little if any effect on lung
permeability, epithelial markers, or inflammation. Similarly, DPM produced only minimal
changes, although the individual particles were smaller and differed in surface chemistry from
CB. The authors concluded that DPM is less damaging to the respiratory epithelium than is
silicon dioxide, and that the surface chemistry of the particle is more important than ultrafine
size in explaining biological activity.
These experiments provide strong support for the idea that DE toxicity results from a
mechanism that is analogous to that of other relatively inert particles in the lung. This

5-93
qualitative similarity exists along with some apparent quantitative differences in the potency of
various particles for producing effects on the lung or on particle clearance.
The exact relationship between toxicity and particle size within the ultrafine particle
mode, including DPM (BéruBé et al., 1999), remains unresolved. Studies reviewed in the PM
CD (U.S. EPA, 1996) suggest a greater inherent potential toxicity of inhaled ultrafine particles.
Exposure to ultrafine particles may increase the release of proinflammatory mediators that could
be involved in lung disease. For example, Driscoll and Maurer (1991) compared the effects of
fine (0.3 :m) and ultrafine (0.02 :m) TiO2 particles instilled into the lungs of laboratory rats.
Although both size modes caused an increase in the numbers of AMs and PMNs in the lungs,
and release of TNF and fibronectin by AMs, the responses were greater and more persistent with
the ultrafine particles. While fine particle exposure resulted in a minimally increased
prominence of particle-laden macrophages associated with alveolar ducts, ultrafine particle
exposure produced a somewhat greater prominence of macrophages, some necrosis of
macrophages, and slight interstitial inflammation of the alveolar duct region. Moreover,
collagen increased only with exposure to ultrafine particles.
Oberdörster et al. (1992) compared the effects of fine (0.25 :m) and ultrafine (0.02 :m)
TiO2 particles instilled into the lungs of laboratory rats on various indicators of inflammation.
Instillation of ultrafine particles increased the number of total cells recovered by lavage,
decreased the percentage of AMs, and increased the percentage of PMNs and protein.
Instillation with fine particles did not cause statistically significant effects. Thus, the ultrafine
particles had greater pulmonary inflammatory potency than did larger sizes of this material. The
investigators attributed the enhanced toxicity to greater interaction of the ultrafine particles with
their large surface area, with alveolar and interstitial macrophages, which resulted in enhanced
release of inflammatory mediators. They suggested that ultrafine particles of low in vitro
solubility appear to enter the interstitium more readily than do larger sizes of the same material,
which accounted for the increased contact with macrophages in this compartment of the lung.
Driscoll and Maurer (1991) noted that the pulmonary retention of ultrafine TiO2 particles
instilled into rat lungs was greater than for the same mass of fine-mode TiO2 particles. Thus, the
available evidence tends to suggest a potentially greater toxicity for inhaled ultrafine particles.
Particle size, volume, surface area, and composition may be the critical elements in the
overload phenomenon following exposure to particles, which could explain those quantitative
differences. The overloaded AMs secrete a variety of cytokines, oxidants, and proteolytic
enzymes that are responsible for inducing particle aggregation and damaging adjacent epithelial
tissue (Oberdörster, 1994). For a more detailed discussion of mechanism, see Chapter 3.
On the basis of currently available laboratory animal data, the principal noncancerous
health hazard to humans posed by exposure to DE is a structural or functional injury to the lung.
Such effects are demonstrable at dose rates or cumulative doses of DPM lower than those

5-94
reported to be necessary to induce lung tumors in rats. An emerging human health issue
concerning short-term exposure to ambient DE/DPM is the potential for allergenic responses in
several studies. Heightened allergenic responses including increased cytokine production as well
as increased numbers of inflammatory cells have been detected in nasal lavage from humans
exposed to inhaled or instilled DE/DPM. In individuals already allergic to ragweed, exposure to
DE/DPM with the allergen was observed to result in an enhanced allergenic response,
particularly IgE production. Current knowledge indicates that the carbonaceous core of diesel
particles is the major causative factor in the injury to the lung and that other factors such as the
cytotoxicity of adsorbed substances on the particles also may play a role. The lung injury
appears to be mediated through effects on pulmonary AMs. Because noncancerous pulmonary
effects occur at lower doses than tumor induction does in the rat, and because these effects may
be cofactors in the etiology of DE-induced tumors, noncancerous pulmonary effects must be
considered in the total evaluation of DE, notably the particulate component.
5.6. SUMMARY AND DISCUSSION
5.6.1. Effects of Diesel Exhaust on Humans
The most readily identified acute noncancer health effect of DE on humans is its ability
to elicit subjective complaints of eye, throat, and bronchial irritation and neurophysiological
symptoms such as headache, lightheadedness, nausea, vomiting, and numbness and tingling of
the extremities. Studies of the perception and offensiveness of the odor of DE and a human
volunteer study in an exposure chamber have demonstrated that the time of onset of the human
subjective symptoms is inversely related to increasing concentrations of DE and the severity is
directly related to increasing concentrations of DE. In one study in which a diesel engine was
operated under varying load conditions, a dilution factor of 140 to 475 was needed to reduce the
exhaust level to an odor-detection threshold level.
A public health issue is whether short-term exposure to DE might result in an acute
decrement in ventilatory function and whether the frequent repetition of such acute respiratory
effects could result in chronic lung function impairment. One convenient means of studying
acute decrements in ventilatory function is to monitor differences in pulmonary function in
occupationally exposed workers at the beginning and end of a workshift. In studies of
underground miners, bus garage workers, dockworkers, and locomotive repairmen, increases in
respiratory symptoms (cough, phlegm, and dyspnea) and decreases in lung function (FVC,
FEV1, PEFR, and FEF25-75) over the course of a workshift were generally found to be minimal
and not statistically significant. In a study of acute respiratory responses in diesel bus garage
workers, there was an increased reporting of cough, labored breathing, chest tightness, and
wheezing, but no reductions in pulmonary function were associated with exposure to DE.
Pulmonary function was affected in stevedores over a workshift exposure to DE but normalized
5-95
after a few days without exposure to DE fumes. In a third study, there was a trend toward
greater ventilatory function changes during a workshift among coal miners, but the decrements
were similar in miners exposed and not exposed to DE.
Smokers appeared to demonstrate larger workshift respiratory function decrements and
increased incidence of respiratory symptoms. Acute sensory and respiratory symptoms were
earlier and more sensitive indicators of potential health risks from diesel exposure than were
decrements in pulmonary function. Studies on the acute health effects of exposure to DE in
humans, experimental and epidemiologic, have failed to demonstrate a consistent pattern of
adverse effects on respiratory morbidity; the majority of studies offer, at best, equivocal
evidence for an exposure-response relationship. The environmental contaminants have
frequently been below permissible workplace exposure limits; in those few cases where health
effects have been reported, the authors have failed to identify conclusively the individual or
collective causative agents in the DE.
Chronic effects of DE exposure have been evaluated in epidemiologic studies of
occupationally exposed workers (metal and nonmetal miners, railroad yard workers, stevedores,
and bus garage mechanics). Most of the epidemiologic data indicate an absence of an excess
risk of chronic respiratory disease associated with exposure to DE. In a few studies, a higher
prevalence of respiratory symptoms, primarily cough, phlegm, or chronic bronchitis, was
observed among the exposed. These increased symptoms, however, were usually not
accompanied by significant changes in pulmonary function. Reductions in FEV1 and FVC and,
to a lesser extent, FEF50 and FEF75, also have been reported. Two studies detected statistically
significant decrements in baseline pulmonary function consistent with obstructive airway
disease. One study of stevedores had a limited sample size of 17 exposed and 11 controls. The
second study in coal miners showed that both underground and surface workers at diesel-use
mines had somewhat lower pulmonary performance than their matched controls. The proportion
of workers in or at diesel-use mines, however, showed equivalent evidence of obstructive airway
disease, and for this reason the authors of the second paper felt that factors other than diesel
exposure might have been responsible. A doubling of the prevalence of minor restrictive airway
disease was also observed in workers in or at diesel-use mines. These two studies, coupled with
other reported nonsignificant trends in respiratory flow-volume measurements, suggest that
exposure to DE may impair pulmonary function among occupational populations.
Epidemiologic studies of the effects of DE on organ systems other than the pulmonary system
are scant. Whereas a preliminary study of the association of cardiovascular mortality and
exposure to DE found a fourfold higher risk ratio, a more comprehensive epidemiologic study
by the same investigators found no significant difference between the observed and expected
number of deaths caused by cardiovascular disease.
5-96
Caution is warranted in the interpretation of results from the epidemiologic studies that
have addressed noncarcinogenic health effects from exposure to DE. These investigations suffer
from myriad methodological problems, including (1) incomplete information on the extent of
exposure to DE, necessitating in some studies estimations of exposures from job titles and
resultant misclassification; (2) the presence of confounding variables such as smoking or
occupational exposures to other toxic substances (e.g., mine dusts); and (3) the short duration
and low intensity of exposures. These limitations restrict drawing definitive conclusions as to
the cause of any noncarcinogenic DE effect, observed or reported.
It is also apparent that at some level of exposure DE as measured by DPM appears to
have the potential to induce airway inflammation in humans without disease. Also, in one other
study peripheral blood changes were noted. An emerging area of concern is the immunological
changes that have been documented in response to DE exposure and the potential relationship of
these changes to the explosive growth of asthma in human populations.
5.6.2. Effects of Diesel Exhaust on Laboratory Animals
Laboratory animal studies of the toxic effects of DE have involved acute, subchronic,
and chronic exposure regimens. In acute exposure studies, toxic effects appear to have been
associated primarily with high concentrations of carbon monoxide, nitrogen dioxide, and
aliphatic aldehydes. In short- and long-term studies, toxic effects have been associated with
exposure to the complex exhaust mixture. Effects of DE in various animal species are
summarized in Tables 5-2 to 5-15. In short-term studies, health effects related to function, when
found, are mild and result from extremely high DPM concentrations of about 6 mg/m3 and
extensive durations of exposure approximating 20 h/day. There is ample evidence, however,
that other pathophysiological effects such as accumulation of DPM in pulmonary tissues,
evidence of inflammatory response, AM aggregation and accumulation near the terminal
bronchioles, Type II cell proliferation, and the thickening of alveolar walls adjacent to AM
aggregation do occur under short-term exposures at lower levels of DE. Little evidence exists,
however, from short-term studies that exposure to DE impairs lung function. Chronic exposures
cause lung pathology that results in altered pulmonary function and increased DPM retention in
the lung. Exposures to DE have also been associated with increased susceptibility to respiratory
tract infection, neurological or behavioral changes, an increase in banded neutrophils, and
morphological alterations in the liver.
5.6.2.1. Effects on Survival and Growth
The data presented in Table 5-3 show limited effects on survival in mice and rats and
some evidence of reduced body weight in rats following chronic exposures to concentrations of
1.5 mg/m3 DPM or higher and exposure durations of 16 to 20 h/day, 5 days/week for 104 to
5-97
130 weeks. Increased lung weights and lung to body-weight ratios in rats, mice, and hamsters;
an increased heart to body weight ratio in rats; and decreased lung and kidney weights in cats
have been reported following chronic exposure to DE. No evidence was found of an effect of
DE on other body organs (Table 5-4). The lowest-observed-effect level in rats approximated 1
to 2 mg/m3 DPM for 7 h/day, 5 days/week for 104 weeks.
5.6.2.2. Effects on Pulmonary Function
Pulmonary function impairment has been reported in rats, hamsters, cats, and monkeys
exposed to DE and included lung mechanical properties (compliance and resistance), diffusing
capacity, lung volumes, and ventilatory performance (Table 5-5). The effects generally
appeared only after prolonged exposures. The lowest exposure levels (expressed in terms of
DPM concentrations) that resulted in impairment of pulmonary function occurred at 2 mg/m3 in
cynomolgus monkeys (the only level tested), 1.5 and 3.5 mg/m3 in rats, 4.24 and 6 mg/m3 in
hamsters, and 11.7 mg/m3 in cats. Exposures in monkeys, cats, and rats (3.5 mg/m3) were for
7 to 8 h/day, 5 days/week for 104 to 130 weeks. While this duration is considered to constitute a
lifetime study in rodents, it is a small part of the lifetime of a monkey or cat. Exposures in
hamsters and rats (1.5 mg/m3) varied in hours per day (8 to 20) and weeks of exposure (26 to
130). In all species but the monkey, the testing results were consistent with restrictive lung
disease; alteration in expiratory flow rates indicated that 1.5 mg/m3 DPM was a LOAEL for a
chronic exposure (Gross, 1981). Monkeys demonstrated evidence of obstructive airway disease.
The nature of the pulmonary impairment is dependent on the dose of toxicants delivered to and
retained in the lung, the site of deposition and effective clearance or repair, and the anatomy and
physiology of the affected species; these variables appear to be factors in the disparity of the
airway disease in monkey versus the other species tested.
5.6.2.3. Histopathological and Histochemical Effects
Histological studies have demonstrated that chronic exposure to DE can result in effects
on respiratory tract tissue (Table 5-6). Typical findings include alveolar histiocytosis, AM
aggregation, tissue inflammation, increase in PMNs, hyperplasia of bronchiolar and alveolar
Type II cells, thickened alveolar septa, edema, fibrosis, and emphysema. Lesions in the trachea
and bronchi were observed in some studies. Associated with these histopathological findings
were various histochemical changes in the lung, including increases in lung DNA, total protein,
alkaline and acid phosphatase, glucose-6-phosphate dehydrogenase; increased synthesis of
collagen; and release of inflammatory mediators such as leukotriene LTB and prostaglandin
PGF2". Although the overall laboratory evidence is that prolonged exposure to DPM results in
histopathological and histochemical changes in the lungs of exposed animals, some studies have
also demonstrated that there may be a threshold of exposure to DPM below which pathologic

5-98
changes do not occur. These no-observed-adverse-effect levels for histopathological effects
were reported to be 2 mg/m3 for cynomolgus monkeys (the only concentration tested), 0.11 to
0.35 mg/m3 for rats, and 0.25 mg/m3 DPM for guinea pigs exposed for 7 to 20 h/day, 5 to
5.5 days/week for 104 to 130 weeks.
5.6.2.4. Effects on Airway Clearance
The pathological effects of DPM appear to be strongly dependent on the relative rates of
pulmonary deposition and clearance (Table 5-7). Clearance of particles from the alveolar region
of the lungs is a multiphasic process involving phagocytosis by AMs. Chronic exposure to DPM
concentrations of about 1 mg/m3 or above, under varying exposure durations, causes pulmonary
clearance to be reduced, with concomitant focal aggregations of particle-laden AMs, particularly
in the peribronchiolar and alveolar regions, as well as in the hilar and mediastinal lymph nodes.
The exposure concentration at which focal aggregates of particle-laden AMs occur may vary
from species to species, depending on rate of uptake and pulmonary deposition, pulmonary
clearance rates, the relative size of the AM population per unit of lung tissue, the rate of
recruitment of AMs and leukocytes, and the relative efficiencies for removal of particles by the
mucociliary and lymphatic transport system. The principal means by which PM clearance is
reduced is through a decrease in the function of pulmonary AMs. Impairment of particle
clearance seems to be nonspecific and applies primarily to dusts that are persistently retained in
the lungs. Lung dust levels of approximately 0.1 to 1 mg/g lung tissue appear to produce this
effect in the Fischer 344 rat (Health Effects Institute, 1995). Morrow (1988) suggested that the
inability of particle-laden AMs to translocate to the mucociliary escalator is correlated to an
average composite particle volume per AM in the lung. When this particle volume exceeds
approximately 60 :m3 per AM in the Fischer 344 rat, impairment of clearance appears to be
initiated. When the particulate volume exceeds approximately 600 :m3 per cell, evidence
suggests that AM-mediated particulate clearance virtually ceases, agglomerated particle-laden
macrophages remain in the alveolar region, and increasingly nonphagocytized dust particles
translocate to the pulmonary interstitium. Data for other laboratory animal species and humans
are, unfortunately, limited.
5.6.2.5. Neurological and Behavioral Effects
Behavioral effects have been observed in rats exposed to DE from birth to 28 days of age
(Table 5-14). Exposure caused a decreased level of spontaneous locomotor activity and a
detrimental effect on learning in adulthood. In agreement with the behavioral changes was
physiological evidence for delayed neuronal maturation. Exposures were to 6 mg/m3 DPM for 8
h/day, 7 days/week from birth to about 7, 14, 21, or 28 days of age.

5-99
5.6.2.6. Effects on Immunity and Allergenicity
Several laboratory animal studies have indicated that exposure to DPM can reduce an
animal’s resistance to respiratory infection. This effect, which can occur even after only 2 or 6 h
of exposure to DE containing 5 to 8 mg/m3 DPM, does not appear to be caused by direct
impairment of the lymphoid or splenic immune systems; however, in one study of influenza
virus infection, interferon levels and hemaglutinin antibody levels were adversely affected in the
exposed mice.
As with humans, there are animal data suggesting that DPM is a possible factor in the
increasing incidence of allergic hypersensitivity. The effects have been demonstrated primarily
in acute human and laboratory animal studies and appear to be associated with both the
nonextractable carbon core and the organic fraction of DPM. It also appears that synergies with
DPM may increase the potency of known airborne allergens. Both animal and human cell
culture studies indicate that DPM also has the potential to act as an adjuvant.
5.6.2.7. Other Noncancer Effects
Essentially no effects (based on the weight of evidence of a number of studies) were
noted for reproductive and teratogenic effects in mice, rats, rabbits, and monkeys; clinical
chemistry and hematology in the rat, cat, hamster, and monkeys; and enzyme induction in the rat
and mouse (Tables 5-11 through 5-13 and 5-15).
5.6.3. Comparison of Filtered and Unfiltered Diesel Exhaust
The comparison of the toxic responses in laboratory animals exposed to whole DE or
filtered exhaust containing no particles demonstrates across laboratories that diesel particles are
the principal etiologic agent of noncancerous health effects in laboratory animals exposed to DE
(Table 5-16). Whether the particles act additively or synergistically with the gases cannot be
determined from the designs of the studies. Under equivalent exposure regimens, hamsters have
lower levels of retained DPM in their lungs than rats and mice do and consequently less
pulmonary function impairment and pulmonary pathology. These differences may result from a
lower intake rate of DPM, lower deposition rate and/or more rapid clearance rate, or lung tissue
that is less susceptible to the cytotoxicity of DPM. Observations of a decreased respiration in
hamsters when exposed by inhalation favor lower intake and deposition rates.
5.6.4. Interactive Effects of Diesel Exhaust
There is no direct evidence that DE interacts with other substances in an exposure
environment, other than an impaired resistance to respiratory tract infections. Young animals
were not more susceptible. In several ways, animals with laboratory-induced emphysema were
more resistant. There is experimental evidence that both inorganic and organic compounds can

5-100
be adsorbed onto carbonaceous particles. When such substances become affiliated with
particles, these substances can be carried deeper into the lungs where they might have a more
direct and potent effect on epithelial cells or on AM ingesting the particles. Few specific studies
to test interactive effects of DE with atmospheric contaminants, other than coal dust, have been
conducted. Coal dust and DPM had an additive effect only.
5.6.5. Conclusions
Conclusions concerning the principal human hazard from exposure to DE are as follows:
• Allergenic inflammatory disorders of the airways to responses typical of asthma
have been demonstrated under short-term exposure scenarios to either DE or
DPM. The evidence indicates that the immunological changes appear to be due
to the DPM component of DE and that the immunological changes are caused by
both the nonextractable carbon core and the adsorbed organic fraction of the
diesel particle. The toxicological significance of these effects has yet to be
resolved.
• Some occupational studies of acute exposure to DE during work shifts suggest
that increased acute sensory and respiratory symptoms (cough, phlegm, chest
tightness, wheezing) are more sensitive indicators of possible health risks from
exposure to DE than pulmonary function decrements (which were consistently
found not to be significantly associated with DE exposure)
• Noncancer effects in humans from long-term chronic exposure to DPM are not
evident. Noncancer effects from long-term exposure to DPM of several
laboratory animal species, conducted to assess the pathophysiologic effects of
DPM in humans showed pulmonary histopathology (principally fibrosis) and
chronic inflammation.
Although the mode of action of DE is not clearly evident for any of the effects
documented in this chapter, the respiratory tract effects observed under acute scenarios are
suggestive of an irritant mechanism, while lung effects observed in chronic scenarios indicate an
underlying inflammatory response. Current knowledge indicates that the carbonaceous core of
the diesel particle is the causative agent of the lung effects, with the extent of the injury being
mediated at least in part by a progressive impairment of AMs. It is noted that lung effects occur
in response to DE exposure in several species and occur in rats at doses lower than those
inducing particle overload and a tumorigenic response (see above); it follows that lung effects
such as inflammation and fibrosis are relevant in the development of risk assessments for DE.

5-101
REFERENCES FOR CHAPTER 5
Abe, S; Takizawa, H; Sugawara, I; et al. (2000) Diesel exhaust (DE)-induced cytokine expression in humanbronchial epithelial cells. Am J Respir Cell Mol Biol 22:296-303.
Ames, RG; Attfield, MD; Hankinson, JL; et al. (1982) Acute respiratory effects of exposure to diesel emissions incoal miners. Am Rev Respir Dis 125:39-42.
Ames, RG; Reger, RB; Hall, DS. (1984) Chronic respiratory effects of exposure to diesel emissions in coal mines.Arch Environ Health 39:389-394.
Attfield, MD. (1978) The effect of exposure to silica and diesel exhaust in underground metal and nonmetalminers. In: Industrial hygiene for mining and tunneling: proceedings of a topical symposium; November; Denver,CO. Kelley, WD, ed. Cincinnati, OH: The American Conference of Governmental Industrial Hygienists, Inc.; pp.129-135.
Attfield, MD; Trabant, GD; Wheeler, RW. (1982) Exposure to diesel fumes and dust at six potash mines. AnnOccup Hyg 26:817-831.
Barnhart, MI; Chen, S-T; Salley, SO; et al. (1981) Ultrastructure and morphometry of the alveolar lung of guineapigs chronically exposed to diesel engine exhaust: six month's experience. J Appl Toxicol 1:88-103.
Barnhart, MI; Salley, SO; Chen, S-T; et al. (1982) Morphometric ultrastructural analysis of alveolar lungs ofguinea pigs chronically exposed by inhalation to diesel exhaust (DE). In: Toxicological effects of emissions fromdiesel engines: proceedings of the Environmental Protection Agency diesel emissions symposium; October, 1981;Raleigh, NC. Lewtas, J., ed. New York: Elsevier Biomedical; pp. 183-200. (Developments in toxicology andenvironmental science: v. 10).
Battigelli, MC. (1965) Effects of diesel exhaust. Arch Environ Health 10:165-167.
Battigelli, MC; Mannella, RJ; Hatch, TF. (1964) Environmental and clinical investigation of workmen exposed todiesel exhaust in railroad engine houses. Ind Med Surg 33:121-124.
Battigelli, MC; Hengstenberg, F; Mannela, RJ; et al. (1966) Mucociliary activity. Arch Environ Health12:460-466.
Bayram, H; Devalia, JL; Sapsford, RJ; et al. (1998a) The effect of diesel exhaust particles on cell function andrelease of inflammatory mediators from human bronchial epithelial cells in vitro. Am J Respir Cell Mol Biol18:441-448.
Bayram, H; Devalia, JL; Khair, O; et al. (1998b) Comparison of ciliary activity and inflammatory mediatorrelease from bronchial epithelial cells of nonatopic nonasthmatic subjects and atopic asthmatic patients and theeffect of diesel exhaust particles in vitro. J Allergy Clin Immunol 102(5): 771-782.
BéruBé, KA; Jones, TP; Williamson, BJ; et al. (1999) Physicochemical characterisation of diesel exhaustparticles: factors for assessing biological activity. Atmos Environ 33:1599-1614.
Bhatnagar, RS; Hussain, MZ; Sorensen, KR; et al. (1980) Biochemical alterations in lung connective tissue in ratsand mice exposed to diesel emissions. In: Health effects of diesel engine emissions: proceedings of aninternational symposium, v. 1; December 1979; Cincinnati, OH. Pepelko, WE; Danner, RM; Clarke, NA, eds.Cincinnati, H: U.S. Environmental Protection Agency, Health Effects Research Laboratory; pp. 557-570; EPA report no.EPA/600/9-80/057a. Available from: NTIS, Springfield, VA; PB81-173809.
5-102
Bice, DE; Mauderly, JL; Jones, RK; et al. (1985) Effects of inhaled diesel exhaust on immune responses after lungimmunization. Fundam Appl Toxicol 5:1075-1086.
Blomberg, A; Sainsbury, C; Rudell, B; et al. (1998) Nasal cavity lining fluid ascorbic acid concentration increasesin healthy human volunteers following short term exposure to diesel exhaust. Free Radical Res 28:59-67.
Boland, S; Baeza-Squiban, A; Fournier, T; et al. (1999) Diesel exhaust particles are taken up by human airwayepithelial cells in vitro and alter cytokine production. Am J Physiol 276:L604-L613.
Bolton, RE; Vincent, JH; Jones, AD; et al. (1983) An overload hypothesis for pulmonary clearance of UICCamosite fibres inhaled by rats. Br J Ind Med 40:264-272.
Boren, HG. (1964) Carbon as a carrier mechanism for irritant gases. Arch Environ Health 8:119-124.
Brightwell, J; Fouillet, X; Cassano-Zoppi, AL; et al. (1986) Neoplastic and functional changes in rodents afterchronic inhalation of engine exhaust emissions. In: Carcinogenic and mutagenic effects of diesel engine exhaust:proceedings of the international satellite symposium on toxicological effects of emissions from diesel engines;July; Tsukuba Science City, Japan. Ishinishi, N; Koizumi, A; McClellan, RO; et al., eds. Amsterdam, Holland:Elsevier Science Publishers B. V.; pp. 471-485. (Developments in toxicology and environmental science: v. 13).
Brunekreef, B; Janssen, NA; de Hartog, J.; et al. (1997) Air pollution from truck traffic and lung function inchildren living near motorways. Epidemiology 8(3):298-303.
Brunekreef, B; Janssen, NA; van Vliet, P; et al. (2000) Traffic related air pollution and its effect on respiratoryhealth of children living near motorways. Presented at: PM 2000: Particulate matter and health–the scientificbasis for regulatory decision-making. Sponsored by the Air and Waste Management Association , January 24-28,2000.
Campbell, KI; George, EL; Washington, IS, Jr. (1980) Enhanced susceptibility to infection in mice after exposureto dilute exhaust from light duty diesel engines. In: Health effects of diesel engine emissions: proceedings of aninternational symposium, v. 2; December 1979; Cincinnati, OH. Pepelko, WE; Danner, RM; Clarke, NA, eds.Cincinnati, OH: U.S. Environmental Protection Agency, Health Effects Research Laboratory; pp. 772-785; EPAreport no. EPA/600/9-80/057b. Available from: NTIS, Springfield, VA; PB81-173817.
Campbell, KI; George, EL; Washington, IS, Jr. (1981) Enhanced susceptibility to infection in mice after exposureto dilute exhaust from light duty diesel engines. Environ Int 5:377-382.
Castranova, V; Bowman, L; Reasor, MJ; et al. (1985) The response of rat alveolar macrophages to chronicinhalation of coal dust and/or diesel exhaust. Environ Res 36:405-419.
Chan, TL; Lee, PS; Hering, WE. (1981) Deposition and clearance of inhaled diesel exhaust particles in therespiratory tract of Fischer rats. J Appl Toxicol 1:77-82.
Chaudhari, A; Dutta, S. (1982) Alterations in tissue glutathione and angiotensin converting enzyme due toinhalation of diesel engine exhaust. J Toxicol Environ Health 9:327-337.
Chaudhari, A; Farrer, RG; Dutta, S. (1980) Effect of exposure to diesel exhaust on pulmonary prostaglandindehydrogenase (PGDH) activity. In: Health effects of diesel engine emissions: proceedings of an internationalsymposium, v. 1; December 1979; Cincinnati, OH. Pepelko, WE; Danner, RM; Clarke, NA, eds. Cincinnati, OH:U.S. Environmental Protection Agency, Health Effects Research Laboratory; pp. 532-537; EPA report no.EPA/600/9-80-057a. Available from: NTIS, Springfield, VA; PB81-173809.
Chaudhari, A; Farrer, RG; Dutta, S. (1981) Effect of exposure to diesel exhaust on pulmonary prostaglandindehydrogenase (PGDH) activity. J Appl Toxicol 1:132-134.
5-103
Chen, KC. (1986) Induction of aryl hydrocarbon hydroxylase in rat tissue following intratracheal instillation ofdiesel particulate extract and benzo[a]pyrene. J Appl Toxicol 6:259-262.
Chen, KC; Vostal, JJ. (1981) Aryl hydrocarbon hydroxylase activity induced by injected diesel particulate extractvs inhalation of diluted diesel exhaust. J Appl Toxicol 1:127-131.
Chen, S; Weller, MA; Barnhart, MI. (1980) Effects of diesel engine exhaust on pulmonary alveolar macrophages.Scanning Electron Microsc 3:327-338.
Devalia, JL; Bayram, H; Abdelaziz, MM; et al. (1999) Differences between cytokine release from bronchialepithelial cells of asthmatic patients and non-asthmatic subjects: effect of exposure to diesel exhaust particles. IntArch Allergy Immunol 118:437-439.
Diaz-Sanchez, D; Dotson, AR; Takenaka, H; et al. (1994) Diesel exhaust particles induce local IgE production invivo and alter the pattern of IgE messenger RNA isoforms. J Clin Invest 94(4):1417-1425.
Diaz-Sanchez, D; Tsien, A; Casillas, A; et al. (1996) Enhanced nasal cytokine production in human beings after invivo challenge with diesel exhaust particles. J Allergy Clin Immunol 98:114-123.
Diaz-Sanchez, D; Tsien, A; Fleming, J; et al. (1997) Combined diesel exhaust particulate and ragweed allergenchallenge markedly enhances human in vivo nasal ragweed-specific IgE and skews cytokine production to a Thelper cell 2-type pattern. J Immunol 158:2406-2413.
Diaz-Sanchez, D; Garcia, MP; Wang, M; et al. (1999) Nasal challenge with diesel exhaust particles can inducesensitization to a neoallergen in the human mucosa. J Allergy Clin Immunol 104(6):1183-1188.
Driscoll, KE; Maurer, JK. (1991) Cytokine and growth factor release by alveolar macrophages: potentialbiomarkers of pulmonary toxicity. Toxicol Pathol 19:398-405.
Dungworth, DL; Mohr, U; Heinrich, U; et al. (1994) Pathologic effects of inhaled particles in rat lungs:associations between inflammatory and neoplastic processes. In: Toxic and carcinogenic effects of solid particlesin the respiratory tract: [proceedings of the 4th international inhalation symposium]; March 1993; Hannover,Germany. Mohr, U; Dungworth, DL; Mauderly, JL, et al., eds. Washington, DC: International Life SciencesInstitute Press; pp. 75-98.
Dziedzic, D. (1981) Differential counts of B and T lymphocytes in the lymph nodes, circulating blood and spleenafter inhalation of high concentrations of diesel exhaust. J Appl Toxicol 1:111-115.
Edling, C; Axelson, O. (1984) Risk factors of coronary heart disease among personnel in a bus company. Int ArchOccup Environ Health 54:181-183.
Edling, C; Anjou, CG; Axelson, O; et al. (1987) Mortality among personnel exposed to diesel exhaust. Int ArchOccup Environ Health 59:559-565.
El Batawi, MA; Noweir, MH. (1966) Health problems resulting from prolonged exposure to air pollution in dieselbus garages. Ind Health 4:1-10.
Fedan, JS; Frazier, DG; Moorman, WJ; et al. (1985) Effects of a two-year inhalation exposure of rats to coal dustand/or diesel exhaust on tension responses of isolated airway smooth muscle. Am Rev Respir Dis 131:651-655.
Fujimaki, H; Nohara, O; Ichinose, T; et al. (1994) IL-4 production in mediastinal lymph node cells in miceintratracheally instilled with diesel exhaust particulates and antigen. Toxicology 92(1-3):261-268.
Fujimaki, H; Saneyoshi, K; Shiraishi, F; et al. (1997) Inhalation of diesel exhaust enhances antigen-specific IgEantibody production in mice. Toxicology 116:227-233.

5-104
Gamble, JF; Jones, WG. (1983) Respiratory effects of diesel exhaust in salt miners. Am Rev Respir Dis128:389-394.
Gamble, J; Jones, W; Hudak, J; et al. (1979) Acute changes in pulmonary function in salt miners. Presented at:Industrial hygiene for mining and tunneling: proceedings of a topical symposium; November 1978; Denver, CO.Cincinnati, OH: American Conference of Governmental Industrial Hygienists, Inc.; pp. 119-128.
Gamble, J; Jones, W; Hudak, J. (1983) An epidemiological study of salt miners in diesel and nondiesel mines. AmJ Ind Med 4:435-458.
Gamble, J; Jones, W; Minshall, S. (1987a) Epidemiological-environmental study of diesel bus garage workers:acute effects of NO2 and respirable particulate on the respiratory system. Environ Res 42:201-214.
Gamble, J; Jones, W; Minshall, S. (1987b) Epidemiological-environmental study of diesel bus garage workers:chronic effects of diesel exhaust on the respiratory system. Environ Res 44:6-17.
Green, FHY; Boyd, RL; Danner-Rabovsky, J; et al. (1983) Inhalation studies of diesel exhaust and coal dust inrats. Scand J Work Environ Health 9:181-188.
Griffis, LC; Wolff, RK; Henderson, RF; et al. (1983) Clearance of diesel soot particles from rat lung after asubchronic diesel exhaust exposure. Fundam Appl Toxicol 3:99-103.
Gross, KB. (1981) Pulmonary function testing of animals chronically exposed to diluted diesel exhaust. J ApplToxicol 1:116-123.
Hahon, N; Booth, JA; Green, F; et al. (1985) Influenza virus infection in mice after exposure to coal dust anddiesel engine emissions. Environ Res 37:44-60.
Hare, CT; Springer, KJ. (1971) Public response to diesel engine exhaust odors [final report]. San Antonio, TX:Southwest Research Institute; report no. AR-804. Available from: NTIS, Springfield, VA; PB-204012.
Hare, CT; Springer, KJ; Somers, JH; et al. (1974) Public opinion of diesel odor. In: Automotive engineeringcongress; February-March; Detroit, MI. New York: Society of Automotive Engineers; SAE technical paper no.740214.
Hashimoto, S; Gon, Y; Takeshita, I; et al. (2000) Diesel exhaust particles activate p38 MAP kinase to produceinterleukin 8 and RANTES by human bronchial epithelial cells and N-acetylcysteine attenuates p38 MAP kinaseactivation [In Process Citation]. Am J Respir Crit Care Med 161(1):280-285.
Hatch, GE; Boykin, E; Graham, JA; et al. (1985) Inhalable particles and pulmonary host defense: in vivo and invitro effects of ambient air and combustion particles. Environ Res 36:67-80.
Health Effects Institute (HEI). (1995) Diesel exhaust: a critical analysis of emissions, exposure, and health effects:a special report of the Institute's Diesel Working Group. Cambridge, MA: Health Effects Institute.
Heinrich, U; Peters, L; Funcke, W; et al. (1982) Investigation of toxic and carcinogenic effects of diesel exhaustin long-term inhalation exposure of rodents. In:Toxicological effects of emissions from diesel engines: proceedings of the Environmental Protection Agency diesel emissions symposium; October 1981; Raleigh, NC. Lewtas, J., ed. New York: Elsevier Biomedical; pp. 225-242. (Developments in toxicology and environmentalscience: v. 10).
Heinrich, U; Muhle, H; Takenaka, S; et al. (1986a) Chronic effects on the respiratory tract of hamsters, mice, andrats after long-term inhalation of high concentrations of filtered and unfiltered diesel engine emissions. J ApplToxicol 6:383-395.
5-105
Heinrich, U; Pott, F; Rittinghausen, S. (1986b) Comparison of chronic inhalation effects in rodents after long-termexposure to either coal oven flue gas mixed with pyrolized pitch or diesel engine exhaust. In: Carcinogenic andmutagenic effects of diesel engine exhaust: proceedings of the international satellite syposium on toxicologicaleffects of emissions from diesel engines; July; Tsukuba Science City, Japan. Ishinishi, N; Koizumi, A; McClellan,RO; et al., eds. Amsterdam, Holland: Elsevier Science Publishers BV; pp. 441-457. (Developments in toxicologyand environmental science: v. 13).
Heinrich, U; Fuhst, R; Rittinghausen, S; et al. (1995) Chronic inhalation exposure of Wistar rats and two differentstrains of mice to diesel engine exhaust, carbon black, and titanium dioxide. Inhal Toxicol 7:533-556.
Henderson, RF; Pickrell, JA; Jones, RK; et al. (1988a) Response of rodents to inhaled diluted diesel exhaust:biochemical and cytological changes in bronchoalveolar lavage fluid and in lung tissue. Fundam Appl Toxicol11:546-567.
Henderson, RF; Leung, HW; Harmsen, AG; et al. (1988b) Species differences in release of arachidonatemetabolites in response to inhaled diluted diesel exhaust. Toxicol Lett 42(3):325-32.
Hyde, DM; Plopper, CG; Weir, AJ; et al. (1985) Peribronchiolar fibrosis in lungs of cats chronically exposed todiesel exhaust. Lab Invest 52:195-206.
Ikeda, M; Suzuki, M; Watarai, K; et al. (1995) Impairment of endothelium-dependent relaxation by diesel exhaustparticles in rat thoracic aorta. Jpn J Pharmacol 68:183-189.
Ikeda, M; Watarai, K; Suzuki, M; et al. (1998) Mechanism of pathophysiological effects of diesel exhaustparticles on endothelial cells. Environ Toxicol Pharmacol 6:117-123.
International Life Sciences Institute (ILSI). (2000) ILSI Risk Science Institute workshop: The relevance of the ratlung response to particle overload for human risk assessment. Gardner, DE, ed. Inhal Toxicol:12(1-2):1-17.
Ishinishi, N; Kuwabara, N; Nagase, S; et al. (1986) Long-term inhalation studies on effects of exhaust from heavyand light duty diesel engines on F344 rats. In: Carcinogenic and mutagenic effects of diesel engine exhaust:proceedings of the international satellite symposium on toxicological effects of emissions from diesel engines;July; Tsukuba Science City, Japan. Ishinishi, N; Koizumi, A; McClellan, RO; et al., eds. Amsterdam, Holland:Elsevier Science Publishers B. V.; pp. 329-348. (Developments in toxicology and environmental science: v. 13).
Ishinishi, N; Kuwabara, N; Takaki, Y; et al. (1988) Long-term inhalation experiments on DE. In: DE and healthrisks: results of the HERP studies. Tsukuba, Ibaraki, Japan: Japan Automobile Research Institute, Inc., ResearchCommittee for HERP Studies; pp. 11-84.
Iwai, K; Udagawa, T; Yamagishi, M; et al. (1986) Long-term inhalation studies of diesel exhaust on F344 SPFrats. Incidence of lung cancer and lymphoma. In: Carcinogenic and mutagenic effects of diesel engine exhaust:proceedings of the international satellite symposium on toxicological effects of emissions from diesel engines;July; Tsukuba Science City, Japan. Ishinishi, N; Koizumi, A; McClellan, RO; et al., eds. Amsterdam, Holland:Elsevier Science Publishers B. V.; pp. 349-360. (Developments in toxicology and environmental science: v. 13).
Jörgensen, H; Svensson, A. (1970) Studies on pulmonary function and respiratory tract symptoms of workers in aniron ore mine where diesel trucks are used underground. J Occup Med 12:348-354.
Kahn, G; Orris, P; Weeks, J. (1988) Acute overexposure to diesel exhaust: report of 13 cases. Am J Ind Med13:405-406.
Kaplan, HL; MacKenzie, WF; Springer, KJ; et al. (1982) A subchronic study of the effects of exposure of threespecies of rodents to diesel exhaust. In: Toxicological effects of emissions from diesel engines: proceedings of theEnvironmental Protection Agency diesel emission symposium; October, 1981; Raleigh, NC. Lewtas, J., ed. NewYork: Elsevier Biomedical; pp. 161-182. (Developments in toxicology and environmental science: v. 10).
5-106
Karagianes, MT; Palmer, RF; Busch, RH. (1981) Effects of inhaled diesel emissions and coal dust in rats. Am IndHyg Assoc J 42:382-391.
Katz, M; Rennie, RP; Jegier, Z. (1960) Air pollution and associated health hazards from diesel locomotive trafficin a railroad tunnel. Occup Health Rev 11:2-15.
Kilburn, KH; McKenzie, WN. (1978) Leukocyte recruitment to airways by aldehyde-carbon combinations thatmimic cigarette smoke. Lab Invest 38:134-142.
Kilburn, KH. (2000) Effects of diesel exhaust on neurobehavioral and pulmonary functions. Arch Environ Health55:11-17.
Klosterkötter, W; Bünemann, G. (1961) Animal experiments on the elimination of inhaled dust. In: Inhaledparticles and vapours: proceedings of an international symposium; March-April 1960; Oxford, United Kingdom.Davies, C. N., ed. New York: Pergamon Press; pp. 327-341.
Knox, RB; Suphioglu, C; Taylor, P; et al. (1997) Major grass pollen allergen Lol p 1 binds to diesel exhaustparticles: implications for asthma and air pollution. Clin Exp Allergy 27:246-251.
Kobayashi, T; Ito, T. (1995) Diesel exhaust particulates induce nasal mucosal hyperresponsiveness to inhaledhistamine aerosol. Fundam Appl Toxicol 27:195-202.
Kobayashi, T; Ikeue, T; Ito, T; et al. (1997) Short-term exposure to diesel exhaust induces nasal mucosalhyperresponsiveness to histamine in guinea pigs. Fundam Appl Toxicol 38:166-172.
Laurie, RD; Boyes, WK. (1980) Neurophysiological alterations due to diesel exhaust exposure during the neonatallife of the rat. In: Health effects of diesel engine emissions: proceedings of an international symposium, v. 2;December 1979; Cincinnati, OH. Pepelko, WE; Danner, RM; Clarke, NA, eds. Cincinnati, OH: U.S.Environmental Protection Agency, Health Effects Research Laboratory; pp. 713-727; EPA report no.EPA-600/9-80/057b. Available from: NTIS, Springfield, VA; PB81-173817.
Laurie, RD; Boyes, WK. (1981) Neurophysiological alterations due to diesel exhaust exposure during the neonatallife of the rat. Environ Int 5:363-368.
Laurie, RD; Lewkowski, JP; Cooper, GP; et al. (1978) Effects of diesel exhaust on behavior of the rat. Presentedat: 71st annual meeting of the Air Pollution Control Asscociation; June; Houston, TX. Pittsburgh, PA: AirPollution Control Association.
Laurie, RD; Boyes, WK; Wessendarp, T. (1980) Behavioral alterations due to diesel exhaust exposure. In: Healtheffects of diesel engine emissions: proceedings of an international symposium, v. 2; December 1979; Cincinnati,OH. Pepelko, WE; Danner, RM; Clarke, NA, eds. Cincinnati, OH: U.S. Environmental Protection Agency, HealthEffects Research Laboratory; pp. 698-712; EPA report no. EPA-600/9-80-057b. Available from: NTIS,Springfield, VA; PB81-173817.
Lee, IP; Suzuki, K; Lee, SD; et al. (1980) Aryl hydrocarbon hydroxylase induction in rat lung, liver, and malereproductive organs following inhalation exposure to diesel emission. Toxicol Appl Pharmacol 52:181-184.
Lee, KP; Trochimowicz, HJ; Reinhardt, CF. (1985) Pulmonary response of rats exposed to titanium dioxide (TiO2)by inhalation for two years. Toxicol Appl Pharmacol 79:179-192.
Lee, KP; Kelly, DP; Schneider, PW; et al. (1986) Inhalation toxicity study on rats exposed to titaniumtetrachloride atmospheric hydrolysis products for two years. Toxicol Appl Pharmacol 83:30-45.
Lee, KP; Kelly, DP; O'Neal, FO; et al. (1988) Lung response to ultrafine Kevlar aramid synthetic fibrils following2-year inhalation exposure in rats. Fundam Appl Toxicol 11:1-20.
5-107
Levins, PL. (1981) Review of diesel odor and toxic vapor emissions. Washington, DC: U.S. Department ofTransportation, National Highway Traffic Safety Administration; report no. DOT-TSC-NHTSA-81-9.
Lewis, TR; Green, FHY; Moorman, WJ; et al. (1989) A chronic inhalation toxicity study of diesel engineemissions and coal dust, alone and combined. J Am Coll Toxicol 8:345-375.
Linnell, RH; Scott, WE. (1962) Diesel exhaust composition and odor studies. J Air Pollut Control Assoc12:510-515, 545.
Løvik, M; Høgseth, AK; Gaarder, PI; et al. (1997) Diesel exhaust particles and carbon black have adjuvantactivity on the local lymph node response and systemic IgE production to ovalbumin. Toxicology 121:165-178.
Madden, MC; Richards, JE; Dailey, LA; et al. (2000) Effect of ozone on diesel exhaust particle toxicity. ToxicolAppl Pharmacol (submitted)
Maejima, K; Tamura, K; Taniguchi, Y; et al. (1997) Comparison of the effects of various fine particles on IgEantibody production in mice inhaling Japanese cedar pollen allergens. J Toxicol Environ Health 52:231-248.
Mauderly, JL. (1994) Noncancer pulmonary effects of chronic inhalation exposure of animals to solid particles.In: Toxic and carcinogenic effects of solid particles in the respiratory tract: [proceedings of the 4th internationalinhalation symposium]; March 1993; Hannover, Germany. Mohr, U; Dungworth, DL; Mauderly, JL; et al., eds.Washington, DC: International Life Sciences Institute Press; pp. 43-55.
Mauderly, JL; Benson, JM; Bice, DE; et al. (1981) Observations on rodents exposed for 19 weeks to diluted dieselexhaust. In: Inhalation Toxicology Research Institute annual report 1980-1981. Albuquerque, NM: LovelaceBiomedical and Environmental Research Institute; pp. 305-311; report no. LMF-91.
Mauderly, JL; Benson, JM; Rice, DE; et al. (1984) Life span study of rodents inhaling diesel exhaust: effects onbody weight and survival. In: Inhalation Toxicology Research Institute annual report. Guilmette, RA; Medinsky,MA, eds. Albuquerque, NM: Inhalation Toxicology Research Institute; pp. 287-291; report no. LMF-113.Available from: NTIS, Springfield, VA; DE85-009283.
Mauderly, JL; Bice, DE; Carpenter, RL; et al. (1987a) Effects of inhaled nitrogen dioxide and diesel exhaust ondeveloping lung. Cambridge, MA: Health Effects Institute; research report no. 8.
Mauderly, JL; Jones, RK; Griffith, WC; et al. (1987b) Diesel exhaust is a pulmonary carcinogen in rats exposedchronically by inhalation. Fundam Appl Toxicol 9:208-221.
Mauderly, JL; Gillett, NA; Henderson, RF; et al. (1988) Relationships of lung structural and functional changes toaccumulation of diesel exhaust particles. In: Inhaled particles VI: proceedings of an international symposium andworkshop on lung dosimetry; September 1985; Cambridge, United Kingdom. Dodgson, J; McCallum, RI; Bailey,MR; et al., eds. Ann Occup Hyg 32(suppl. 1):659-669.
Mauderly, JL; Bice, DE; Cheng, YS; et al. (1989) Influence of experimental pulmonary emphysema ontoxicological effects from inhaled nitrogen dioxide and diesel exhaust. Cambridge, MA: Health Effects Institute;report no. HEI-RR-89/30. Available from NTIS, Springfield, VA; PB90-247347.
Mauderly, JL; Bice, DE; Cheng, YS; et al. (1990a) Influence of preexisting pulmonary emphysema onsusceptibility of rats to diesel exhaust. Am Rev Respir Dis 141:1333-1341.
Mauderly, JL; Cheng, YS; Snipes, MB. (1990b) Particle overload in toxicology studies: friend or foe? In:Proceedings of the particle lung interaction symposium; May; Rochester, NY. J Aerosol Med 3(suppl. 1):S-169-S-187.

5-108
Mauderly, JL; Banas, DA; Griffith, WC; et al. (1996) Diesel exhaust is not a pulmonary carcinogen in CD-1 miceexposed under conditions carcinogenic to F344 rats. Fundam Appl Toxicol 30:233-242.
McClellan, RO; Bice, DE; Cuddihy, RG; et al. (1986) Health effects of diesel exhaust. In: Aerosols: research, riskassessment and control strategies: proceedings of the second U.S.-Dutch international symposium; May 1985;Williamsburg, VA. Lee, SD; Schneider, T; Grant, LD; et al., eds. Chelsea, MI: Lewis Publishers, Inc.; pp.597-615.
Meiss, R; Robenek, H; Schubert, M; et al. (1981) Ultrastructural alterations in the livers of golden hamstersfollowing experimental chronic inhalation of diluted diesel exhaust emission. Int Arch Occup Environ Health48:147-157.
Mentnech, MS; Lewis, DM; Olenchock, SA; et al. (1984) Effects of coal dust and diesel exhaust on immunecompetence in rats. J Toxicol Environ Health 13:31-41.
Misiorowski, RL; Strom, KA; Vostal, JJ; et al. (1980) Lung biochemistry of rats chronically exposed to dieselparticulates. In: Health effects of diesel engine emissions: proceedings of an international symposium, v. 1;December 1979. Cincinnati, OH. Pepelko, WE; Danner, RM; Clarke, NA, eds. Cincinnati, OH: U.S.Environmental Protection Agency, Health Effects Research Laboratory; pp. 465-480; EPA report no.EPA/600/9-80/057a. Available from: NTIS, Springfield, VA; PB81-173809.
Miyabara, Y; Ichinose, T; Takano, H; et al. (1998a) Diesel exhaust inhalation enhances airwayhyperresponsiveness in mice. Int Arch Allergy Immunol 116:124-131.
Miyabara, Y; Takano, H; Ichinose, T; et al. (1998b) Diesel exhaust enhances allergic airway inflammation andhyperresponsiveness in mice. Am J Resp Crit Care Med 157:1138-1144.
Moorman, WJ; Clark, JC; Pepelko, WE; et al. (1985) Pulmonary fuction responses in cats following long-termexposure to diesel exhaust. J Appl Toxicol 5:301-305.
Morrow, PE. (1988) Possible mechanisms to explain dust overloading of the lungs. Fundam Appl Toxicol10:369-384.
Muranaka, M; Suzuki, S; Koizumi, K; et al. (1986) Adjuvant activity of diesel-exhaust particulates for theproduction of IgE antibody in mice. J Allergy Clin Immunol 77(4):616-23.
Murphy, SA; BéruBé, KA; Pooley, FD; et al. (1998) The response of lung epithelium to well characterised fineparticles. Life Sci 62:1789-1799.
Murphy, SA; et al (1999) Bioreactivity of carbon black and diesel exhaust particles to primary Clara and type IIepithelial cell cultures. Occup Environ Med 56:813-819.
Navarro, C; Charboneau, J; McCauley, R. (1981) The effect of in vivo exposure to diesel exhaust on rat hepaticand pulmonary microsomal activities. J Appl Toxicol 1:124-126.
Nel, AE; Diaz-Sanchez,D: Ng, D; Hiura, T; and Saxon, A. (1998) Enhancement of allergic inflammation by theinteraction between diesel exhaust particles and the immune system. J Allergy Clin Immunology 104(4, pt 1):539-554.
Nightingale, J A; Maggs, R; Cullinan, P; Donnelly, LE; Rogers, DF; Kinnersley, R; Chung, KF; Barnes, PJ;Ashmore, M; Newman-Taylor, A.(2000) Airway inflammation after controlled exposure to diesel exhaustparticulates. Am. J. Respir. Crit. Care Med. 162:161-166.
Nikula, KJ; Snipes, MB; Barr, EB; et al. (1995) Comparative pulmonary toxicities and carcinogenicities ofchronically inhaled diesel exhaust and carbon black in F344 rats. Fundam Appl Toxicol 25:80-94.

5-109
Nikula, KJ; Avila, KJ; Griffith, WC; et al. (1997a) Sites of particle retention and lung tissue responses tochronically inhaled diesel exhaust and coal dust in rats and cynomolgus monkeys. In: Proceedings of the sixthinternational meeting on the toxicology of natural and man-made fibrous and non-fibrous particles; September1996; Lake Placid, NY. Driscoll, KE; Oberdörster, G, eds. Environ Health Perspect Suppl 105(5):1231-1234.
Nikula, KJ; Avila, KJ; Griffith, WC; et al. (1997b) Lung tissue responses and sites of particle retention differbetween rats and cynomolgus monkeys exposed chronically to diesel exhaust and coal dust. Fundam Appl Toxicol37:37-53.
Nilsen, A; Hagemann, R; Eide, I. (1997) The adjunct activity of diesel exhaust particles and carbon black onsystemic IgE production to ovalbumin in mice after intranasal instillation. Toxicology 124:225-232.
Nordenhall, C; Pourazar, J; Blomberg, A; et al. (2000) Airway inflammation following exposure to diesel exhaust:a study of time kinetics using induced sputum. Eur Respir J 15:1046-1051.
Oberdörster, G. (1994) Extrapolation of results from animal inhalation studies with particles to humans? In: Toxicand carcinogenic effects of solid particles in the respiratory tract: [proceedings of the 4th international inhalationsymposium]; March 1993; Hannover, Germany. Mohr, U; Dungworth, DL; Mauderly, JL; et al., eds. Washington,DC: International Life Sciences Institute Press; pp. 335-353.
Oberdörster, G; Ferin, J; Gelein, R; et al. (1992) Role of the alveolar macrophage in lung injury: studies withultrafine particles. Environ Health Perspect 97:193-199.
Odor Panel of the CRC-APRAC Program Group on Composition of Diesel Exhaust. (1979) Development andevaluation of a method for measurement of diesel exhaust odor using a diesel odor analysis system (DOAS). NewYork: Coordinating Research Council, Inc., Air Pollution Research Advisory Committee; CRC-APRAC projectno. CAPI-1-64.
Ohtoshi, T; Takizawa, H; Okazaki, H; et al. (1998) Diesel exhaust particles stimulate human airway epithelialcells to produce cytokines relevant to airway inflammation in vitro. J Allergy Clin Immunol 101:778-785.
Ormstad, H; Johansen, BV; Gaarder, PI. (1998) Airborne house dust particles and diesel exhaust particles asallergen carriers. Clin Exp Allergy 28:702-708.
Pattle, RE; Stretch, H; Burgess, F; et al. (1957) The toxicity of fumes from a diesel engine under four differentrunning conditions. Br J Ind Med 14:47-55.
Penney, DG; Baylerian, MS; Fanning, KE; et al. (1981) A study of heart and blood of rodents inhaling dieselengine exhaust particulates. Environ Res 26:453-462.
Pepelko, WE. (1982a) Effects of 28 days exposure to diesel engine emissions in rats. Environ Res 27:16-23.
Pepelko, WE. (1982b) EPA studies on the toxicological effects of inhaled diesel engine emissions. In:Toxicological effects of emissions from diesel engines: proceedings of the Environmental Protection Agencydiesel emissions symposium; October 1981; Raleigh, NC. Lewtas, J, ed. New York: Elsevier Biomedical; pp.121-142. (Developments in toxicology and environmental science: v. 10).
Pepelko, WE; Peirano, WB. (1983) Health effects of exposure to diesel engine emissions: a summary of animalstudies conducted by the U.S. Environmental Protection Agency's Health Effects Research Laboratories atCincinnati, Ohio. J Am Coll Toxicol 2:253-306.
Pepelko, WE; Mattox, JK; Yang, YY; et al. (1980a) Pulmonary function and pathology in cats exposed 28 days todiesel exhaust. J Environ Pathol Toxicol 4:449-458.

5-110
Pepelko, WE; Mattox, J; Moorman, WJ; et al. (1980b) Pulmonary function evaluation of cats after one year ofexposure to diesel exhaust. In: Health effects of diesel engine emissions: proceedings of an internationalsymposium, v. 2; December 1979; Cincinnati, OH. Pepelko, WE; Danner, RM; Clarke, NA, eds. Cincinnati, OH:U.S. Environmental Protection Agency, Health Effects Research Laboratory; pp. 757-765; EPA report no.EPA/600/9-80-057b. Available from: NTIS, Springfield, VA; PB81-173817.
Pepelko, WE; Mattox, J; Moorman, WJ; et al. (1981) Pulmonary function evaluation of cats after one year ofexposure to diesel exhaust. Environ Int 5:373-376.
Pereira, MA; Sabharwal, PS; Gordon, L; et al. (1981) The effect of diesel exhaust on sperm-shape abnormalitiesin mice. Environ Int 5:459-460.
Plopper, CG; Hyde, DM; Weir, AJ. (1983) Centriacinar alterations in lungs of cats chronically exposed to dieselexhaust. Lab Invest 49:391-399.
Purdham, JT; Holness, DL; Pilger, CW. (1987) Environmental and medical assessment of stevedores employed inferry operations. Appl Ind Hyg 2:133-139.
Quinto, I; De Marinis, E. (1984) Sperm abnormalities in mice exposed to diesel particulate. Mutat Res 130:242.
Rabovsky, J; Petersen, MR; Lewis, TR; et al. (1984) Chronic inhalation of diesel exhaust and coal dust: effect ofage and exposure on selected enzyme activities associated with microsomal cytochrome P-450 in rat lung andliver. J Toxicol Environ Health 14:655-666.
Rabovsky, J; Judy, DJ; Rodak, DJ; et al. (1986) Influenza virus-induced alterations of cytochrome P-450 enzymeactivities following exposure of mice to coal and diesel particulates. Environ Res 40:136-144.
Reger, R. (1979) Ventilatory function changes over a work shift for coal miners exposed to diesel emissions. In:Toxicological and carcinogenic health hazards in the workplace: proceedings of the first annual NIOSH scientificsymposium; 1978; Cincinnati, OH. Bridbord, K; French, J, eds. Park Forest South, IL: Pathotox Publishers, Inc.;pp. 346-347.
Reger, R; Hancock, J; Hankinson, J; et al. (1982) Coal miners exposed to diesel exhaust emissions. Ann OccupHyg 26:799-815.
Research Committee for HERP Studies. (1988) Diesel exhaust and health risks: results of the HERP studies.Tsukuba, Ibaraki, Japan: Japan Automobile Research Institute, Inc.
Rudell, B; Sandström, T; Stjernberg, N; et al. (1990) Controlled diesel exhaust exposure in an exposure chamber:pulmonary effects investigated with bronchoalveolar lavage. J Aerosol Sci 21(suppl. 1):S411-S414.
Rudell, B; Sandström, T; Hammarström, U; et al. (1994) Evaluation of an exposure setup for studying effects ofdiesel exhaust in humans. Int Arch Occup Environ Health 66:77-83.
Rudell, B; Ledin, MC; Hammarström, U; et al. (1996) Effects on symptoms and lung function in humansexperimentally exposed to diesel exhaust. Occup Environ Med 53:658-662.
Sagai, M; Furuyama, A; Ichinose, T. (1996) Biological effects of diesel exhaust particles (DEP). III. Pathogenesisof asthma like symptoms in mice. Free Radic Biol Med 21:199-209.
Salvi, S; Blomberg, A; Rudell, B; et al. (1999) Acute inflammatory responses in the airways and peripheral bloodafter short-term exposure to diesel exhaust in healthy human volunteers. Am J Respir Crit Care Med 159:702-709.
Salvi, SS; Nordenhall, C; Blomberg, A; et al. (2000) Acute exposure to diesel exhaust increases IL-8 and GRO-alpha production in healthy human airways. Am J Respir Crit Care Med 161(2):550-557.

5-111
Saneyoshi, K; Nohara, O; Imai, T; et al. (1997) IL-4 and IL-6 production of bone marrow-derived mast cells isenhanced by treatment with environmental pollutants. Int Arch Allergy Immunol 114(3):237-245.
Schneider, DR; Felt, BT. (1981) Effect of diesel particulate exposure on adenylate and guanylate cyclase of ratand guinea pig liver and lung. J Appl Toxicol 1:135-139.
Schreck, RM; Soderholm, SC; Chan, TL; et al. (1981) Experimental conditions in GMR chronic inhalation studiesof diesel exhaust. J Appl Toxicol 1:67-76.
Steerenberg, PA; Zonnenberg, JAJ; Dormans, JAMA; et al. (1998) Diesel exhaust particles induced release ofinterleukin 6 and 8 by (primed) human bronchial epithelial cells (BEAS 2B) in vitro. Exp Lung Res 24:85-100.
Stöber, W. (1986) Experimental induction of tumors in hamsters, mice and rats after long-term inhalation offiltered and unfiltered diesel engine exhaust. In: Carcinogenic and mutagenic effects of diesel engine exhaust:proceedings of the international satellite symposium on toxicological effects of emissions from diesel engines;July; Tsukuba Science City, Japan. Amsterdam,: Ishinishi, N; Koizumi, A; McClellan, RO; et al. Elsevier SciencePublishers B. V.; pp. 421-439. (Developments in toxicology and environmental science: v. 13).
Strom, KA. (1984) Response of pulmonary cellular defenses to the inhalation of high concentrations of dieselexhaust. J Toxicol Environ Health 13:919-944.
Suzuki, T; Kanoh, T; Kanbayashi, M; et al. (1993) The adjuvant activity of pyrene in diesel exhaust on IgEantibody production in mice. Arerugi 42(8):963-8.
Suphioglu, C; Singh, MB; Taylor, P; et al. (1992) Mechanism of grass-pollen-induced asthma. Lancet339(8793):569-572.
Suzuki, T; Kanoh, T; Ishimori, M; et al. (1996) Adjuvant activity of diesel exhaust particulates (DEP) inproduction of anti-IgE and anti-IgG1 antibodies to mite allergen in mice. J Clin Lab Immunol 48:187-199.
Takafuji, S; Suzuki, S; Koizumi, K; et al. (1987) Diesel-exhaust particulates inoculated by the intranasal routehave an adjuvant activity for IgE production in mice. J Allergy Clin Immunol 79:639-645.
Takano, H; Yoshikawa, T; Ichinose, T; et al. (1997) Diesel exhaust particles enhance antigen-induced airwayinflammation and local cytokine expression in mice. Am J Respir Crit Care Med 156:36-42.
Takano, H; Ichinose, T; Miyabara, Y; et al. (1998a) Inhalation of diesel exhaust enhances allergen-relatedeosinophil recruitment and airway hyperresponsiveness in mice. Toxicol Appl Pharmacol 150:328-337.
Takano, H; Ichinose, T; Miyabara, Y; et al. (1998b) Diesel exhaust particles enhance airway responsivenessfollowing allergen exposure in mice. Immunopharmacol Immunotoxicol 20:329-336.
Takenaka, H; Zhang, K; Diaz-Sanchez, D; et al. (1995) Enhanced human IgE production results from exposure tothe aromatic hydrocarbons from diesel exhaust: direct effects on B-cell IgE production. J Allergy Clin Immunol95:103-115.
Terada, N; Maesako, K; Hiruma, K; et al. (1997). Diesel exhaust particulates enhance eosinophil adhesion to nasalepithelial cells and cause degranulation. Int Arch Allergy Immunol 114(2):167-174.
Terada, N; Hamano, N; Maesako, K; et al. (1999) Diesel exhaust particulates upregulate histamine receptormRNA and increase histamine-induced IL-8 and GM-CSF production in nasal epithelial cells and endothelialcells. Clin Exp Allergy 29(1):52-59.
Tsukue, N; Toda, N; Tsubone, H; et al. (2001) Diesel exhaust (DE) affects the regulation of testicular function inmale Fischer 344 rats. J. Toxicol Environ Health Part A 63:115-126.

5-112
Turk, A. (1967) Selection and training of judges for sensory evaluation of the intensity and character of dieselexhaust odors. Cincinnati, OH: U.S. Department of Health, Education, and Welfare, National Center for AirPollution Control; Public Health Service publication no. 999-AP-32. Available from: NTIS, Springfield, VA;PB-174707.
U.S. Environmental Protection Agency (U.S. EPA). (1996) Air quality criteria for particulate matter. ResearchTriangle Park, NC: National Center for Environmental Assessment-RTP Office; report nos.EPA/600/P-95/001aF-cF. 3v. Available from: NTIS, Springfield, VA; PB96-168224.
Ulfvarson, U; Alexandersson, R; Aringer, L; et al. (1987) Effects of exposure to vehicle exhaust on health. ScandJ Work Environ Health 13:505-512.
Valavanidis, A; Salika, A; Theodoropoulou, A. (2000) Generation of hydroxyl radicals by urban suspendedparticulate air matter. The role of iron ions. Atmos Environ 34:2379-2386.
Vallyathan, V; Virmani, R; Rochlani, S; et al. (1986) Effect of diesel emissions and coal dust inhalation on heartand pulmonary arteries of rats. Br J Ind Med 14:47-55.
van Vliet, P; Knape, M; de Hartog, J; et al. (1997) Motor vehicle exhaust and chronic respiratory symptoms inchildren living near freeways. Environ Res 74(2):122-132.
Vinegar, A; Carson, AI; Pepelko, WE. (1980) Pulmonary function changes in Chinese hamsters exposed sixmonths to diesel exhaust. In: Health effects of diesel engine emissions: proceedings of an internationalsymposium, v. 2; December, 1979; Cincinnati, OH. Pepelko, W E; Danner, R M; Clarke, N A, eds. Cincinnati,OH: U.S. Environmental Protection Agency, Health Effects Research Laboratory; pp. 749-756; EPA report no.EPA-600/9-80-057b. Available from: NTIS, Springfield, VA; PB81-173817.
Vinegar, A; Carson, A; Pepelko, WE; et al. (1981a) Effect of six months of exposure to two levels of dieselexhaust on pulmonary function of Chinese hamsters. Fed Proc 40:593.
Vinegar, A; Carson, A; Pepelko, WE. (1981b) Pulmonary function changes in Chinese hamsters exposed sixmonths to diesel exhaust. Environ Int 5:369-371.
Vostal, JJ; Chan, TL; Garg, BD; et al. (1981) Lymphatic transport of inhaled diesel particles in the lungs of ratsand guinea pigs exposed to diluted diesel exhaust. Environ Int 5:339-347.
Vostal, JJ; White, HJ; Strom, KA; et al. (1982) Response of the pulmonary defense system to diesel particulateexposure. In: Toxicological effects of emissions from diesel engines: proceedings of the Environmental ProtectionAgency diesel emissions symposium; October 1981; Raleigh, NC. Lewtas, J., ed. New York: Elsevier Biomedical;pp. 201-221. (Developments in toxicology and environmental science: v. 10).
Wade, JF, III; Newman, LS. (1993) Diesel asthma: reactive airways disease following overexposure to locomotiveexhaust. J Occup Med 35:149-154.
Wallace, MA; Salley, SO; Barnhart, MI. (1987) Analysis of the effects of inhaled diesel exhaust on the alveolarintravascular and interstitial cellular components of rodent lungs. Scanning Microsc 1:1387-1395.
Watanabe, N; Oonuki, Y. (1999) Inhalation of diesel engine engine exhaust affects spermatogenesis in growingmale rats. Environ Health Perspect 107:539-544.
Wehner, AP; Dagle, GE; Clark, ML; et al. (1986) Lung changes in rats following inhalation exposure to volcanicash for two years. Environ Res 40:499-517.

5-113
Werchowski, KM; Chaffee, VW; Briggs, GB. (1980a) Teratologic effects of long-term exposure to diesel exhaustemissions (rats). Cincinnati, OH: U.S. Environmental Protection Agency, Health Effects Research Laboratory;EPA report no. EPA-600/1-80-010. Available from: NTIS, Springfield, VA; PB80-159965.
Werchowski, KM; Henne, SP; Briggs, GB. (1980b) Teratologic effects of long-term exposure to diesel exhaustemissions (rabbits). Cincinnati, OH: U.S. Environmental Protection Agency, Health Effects Research Laboratory;EPA report no. EPA-600/1-80/011. Available from: NTIS, Springfield, VA; PB80-168529.
White, HJ; Garg, BD. (1981) Early pulmonary response of the rat lung to inhalation of high concentration ofdiesel particles. J Appl Toxicol 1:104-110.
Wiester, MJ; Iltis, R; Moore, W. (1980) Altered function and histology in guinea pigs after inhalation of dieselexhaust. Environ Res 22:285-297.
Wolff, RK; Gray, RL. (1980) Tracheal clearance of particles. In: Inhalation Toxicology Research Institute annualreport: 1979-1980. Diel, JH; Bice, DE; Martinez, BS, eds. Albuquerque, NM: Lovelace Biomedical andEnvironmental Research Institute; p. 252; report no. LMF-84.
Wolff, RK; Henderson, RF; Snipes, MB; et al. (1987) Alterations in particle accumulation and clearance in lungsof rats chronically exposed to diesel exhaust. Fundam Appl Toxicol 9:154-166.
Yang, HM; Ma, JY; Castranova, V; et al. (1997) Effects of diesel exhaust particles on the release of interleukin-1and tumor necrosis factor-alpha from rat alveolar macrophages. Exp Lung Res 23:269-284.
Rudell, B; Sandström, T; Hammarström, U; et al. (1994) Evaluation of an exposure setup for studying effects of diesel exhaust in humans. Int Arch Occup Environ Health 66:77-83.
Rudell, B; Ledin, MC; Hammarström, U; et al. (1996) Effects on symptoms and lung function in humans experimentally exposed to diesel exhaust. Occup Environ Med 53:658-662.
Sagai, M; Furuyama, A; Ichinose, T. (1996) Biological effects of diesel exhaust particles (DEP). III. Pathogenesis of asthma like symptoms in mice. Free Radic Biol Med 21:199-209.
Salvi, S; Blomberg, A; Rudell, B; et al. (1999) Acute inflammatory responses in the airways and peripheral blood after short-term exposure to diesel exhaust in healthy human volunteers. Am J Respir Crit Care Med 159:702-709.
Salvi, SS; Nordenhall, C; Blomberg, A; et al. (2000) Acute exposure to diesel exhaust increases IL-8 and GRO-alpha production in healthy human airways. Am J Respir Crit Care Med 161(2):550-557.
Saneyoshi, K; Nohara, O; Imai, T; et al. (1997) IL-4 and IL-6 production of bone marrow-derived mast cells is enhanced by treatment with environmental pollutants. Int Arch Allergy Immunol 114(3):237-245.
Schneider, DR; Felt, BT. (1981) Effect of diesel particulate exposure on adenylate and guanylate cyclase of rat and guinea pig liver and lung. J Appl Toxicol 1:135-139.
Schreck, RM; Soderholm, SC; Chan, TL; et al. (1981) Experimental conditions in GMR chronic inhalation studies of diesel exhaust. J Appl Toxicol 1:67-76.
Steerenberg, PA; Zonnenberg, JAJ; Dormans, JAMA; et al. (1998) Diesel exhaust particles induced release of interleukin 6 and 8 by (primed) human bronchial epithelial cells (BEAS 2B) in vitro. Exp Lung Res 24:85-100.
Stöber, W. (1986) Experimental induction of tumors in hamsters, mice and rats after long-term inhalation of filtered and unfiltered diesel engine exhaust. In: Carcinogenic and mutagenic effects of diesel engine exhaust: proceedings of the international satellite symposium on toxicological effects of emissions from diesel engines; July; Tsukuba Science City, Japan. Amsterdam,: Ishinishi, N; Koizumi, A; McClellan, RO; et al. Elsevier Science Publishers B. V.; pp. 421-439. (Developments in toxicology and environmental science: v. 13).
Strom, KA. (1984) Response of pulmonary cellular defenses to the inhalation of high concentrations of diesel exhaust. J Toxicol Environ Health 13:919-944.
Suzuki, T; Kanoh, T; Kanbayashi, M; et al. (1993) The adjuvant activity of pyrene in diesel exhaust on IgE antibody production in mice. Arerugi 42(8):963-8.
Suphioglu, C; Singh, MB; Taylor, P; et al. (1992) Mechanism of grass-pollen-induced asthma. Lancet 339(8793):569-572.
Suzuki, T; Kanoh, T; Ishimori, M; et al. (1996) Adjuvant activity of diesel exhaust particulates (DEP) in production of anti-IgE and anti-IgG1 antibodies to mite allergen in mice. J Clin Lab Immunol 48:187-199.
Takafuji, S; Suzuki, S; Koizumi, K; et al. (1987) Diesel-exhaust particulates inoculated by the intranasal route have an adjuvant activity for IgE production in mice. J Allergy Clin Immunol 79:639-645.
Takano, H; Yoshikawa, T; Ichinose, T; et al. (1997) Diesel exhaust particles enhance antigen-induced airway inflammation and local cytokine expression in mice. Am J Respir Crit Care Med 156:36-42.
Takano, H; Ichinose, T; Miyabara, Y; et al. (1998a) Inhalation of diesel exhaust enhances allergen-related eosinophil recruitment and airway hyperresponsiveness in mice. Toxicol Appl Pharmacol 150:328-337.
Takano, H; Ichinose, T; Miyabara, Y; et al. (1998b) Diesel exhaust particles enhance airway responsiveness following allergen exposure in mice. Immunopharmacol Immunotoxicol 20:329-336.
5-114

Takenaka, H; Zhang, K; Diaz-Sanchez, D; et al. (1995) Enhanced human IgE production results from exposure to the aromatic hydrocarbons from diesel exhaust: direct effects on B-cell IgE production. J Allergy Clin Immunol 95:103-115.
Terada, N; Maesako, K; Hiruma, K; et al. (1997). Diesel exhaust particulates enhance eosinophil adhesion to nasal epithelial cells and cause degranulation. Int Arch Allergy Immunol 114(2):167-174.
Terada, N; Hamano, N; Maesako, K; et al. (1999) Diesel exhaust particulates upregulate histamine receptor mRNA and increase histamine-induced IL-8 and GM-CSF production in nasal epithelial cells and endothelial cells. Clin Exp Allergy 29(1):52-59.
Tsukue, N; Toda, N; Tsubone, H; et al. (2001) Diesel exhaust (DE) affects the regulation of testicular function in male Fischer 344 rats. J. Toxicol Environ Health Part A 63:115-126.
Turk, A. (1967) Selection and training of judges for sensory evaluation of the intensity and character of diesel exhaust odors. Cincinnati, OH: U.S. Department of Health, Education, and Welfare, National Center for Air Pollution Control; Public Health Service publication no. 999-AP-32. Available from: NTIS, Springfield, VA; PB-174707.
U.S. Environmental Protection Agency (U.S. EPA). (1996) Air quality criteria for particulate matter. Research Triangle Park, NC: National Center for Environmental Assessment-RTP Office; report nos. EPA/600/P-95/001aF-cF. 3v. Available from: NTIS, Springfield, VA; PB96-168224.
Ulfvarson, U; Alexandersson, R; Aringer, L; et al. (1987) Effects of exposure to vehicle exhaust on health. Scand J Work Environ Health 13:505-512.
Valavanidis, A; Salika, A; Theodoropoulou, A. (2000) Generation of hydroxyl radicals by urban suspended particulate air matter. The role of iron ions. Atmos Environ 34:2379-2386.
Vallyathan, V; Virmani, R; Rochlani, S; et al. (1986) Effect of diesel emissions and coal dust inhalation on heart and pulmonary arteries of rats. Br J Ind Med 14:47-55.
van Vliet, P; Knape, M; de Hartog, J; et al. (1997) Motor vehicle exhaust and chronic respiratory symptoms in children living near freeways. Environ Res 74(2):122-132.
Vinegar, A; Carson, AI; Pepelko, WE. (1980) Pulmonary function changes in Chinese hamsters exposed six months to diesel exhaust. In: Health effects of diesel engine emissions: proceedings of an international symposium, v. 2; December, 1979; Cincinnati, OH. Pepelko, W E; Danner, R M; Clarke, N A, eds. Cincinnati, OH: U.S. Environmental Protection Agency, Health Effects Research Laboratory; pp. 749-756; EPA report no. EPA-600/9-80-057b. Available from: NTIS, Springfield, VA; PB81-173817.
Vinegar, A; Carson, A; Pepelko, WE; et al. (1981a) Effect of six months of exposure to two levels of diesel exhaust on pulmonary function of Chinese hamsters. Fed Proc 40:593.
Vinegar, A; Carson, A; Pepelko, WE. (1981b) Pulmonary function changes in Chinese hamsters exposed six months to diesel exhaust. Environ Int 5:369-371.
Vostal, JJ; Chan, TL; Garg, BD; et al. (1981) Lymphatic transport of inhaled diesel particles in the lungs of rats and guinea pigs exposed to diluted diesel exhaust. Environ Int 5:339-347.
Vostal, JJ; White, HJ; Strom, KA; et al. (1982) Response of the pulmonary defense system to diesel particulate exposure. In: Toxicological effects of emissions from diesel engines: proceedings of the Environmental Protection Agency diesel emissions symposium; October 1981; Raleigh, NC. Lewtas, J., ed. New York: Elsevier Biomedical; pp. 201-221. (Developments in toxicology and environmental science: v. 10).
5-115
Wade, JF, III; Newman, LS. (1993) Diesel asthma: reactive airways disease following overexposure to locomotive exhaust. J Occup Med 35:149-154.
Wallace, MA; Salley, SO; Barnhart, MI. (1987) Analysis of the effects of inhaled diesel exhaust on the alveolar intravascular and interstitial cellular components of rodent lungs. Scanning Microsc 1:1387-1395.
Watanabe, N; Oonuki, Y. (1999) Inhalation of diesel engine engine exhaust affects spermatogenesis in growing male rats. Environ Health Perspect 107:539-544.
Wehner, AP; Dagle, GE; Clark, ML; et al. (1986) Lung changes in rats following inhalation exposure to volcanic ash for two years. Environ Res 40:499-517.
Werchowski, KM; Chaffee, VW; Briggs, GB. (1980a) Teratologic effects of long-term exposure to diesel exhaust emissions (rats). Cincinnati, OH: U.S. Environmental Protection Agency, Health Effects Research Laboratory; EPA report no. EPA-600/1-80-010. Available from: NTIS, Springfield, VA; PB80-159965.
Werchowski, KM; Henne, SP; Briggs, GB. (1980b) Teratologic effects of long-term exposure to diesel exhaust emissions (rabbits). Cincinnati, OH: U.S. Environmental Protection Agency, Health Effects Research Laboratory; EPA report no. EPA-600/1-80/011. Available from: NTIS, Springfield, VA; PB80-168529.
White, HJ; Garg, BD. (1981) Early pulmonary response of the rat lung to inhalation of high concentration of diesel particles. J Appl Toxicol 1:104-110.
Wiester, MJ; Iltis, R; Moore, W. (1980) Altered function and histology in guinea pigs after inhalation of diesel exhaust. Environ Res 22:285-297.
Wolff, RK; Gray, RL. (1980) Tracheal clearance of particles. In: Inhalation Toxicology Research Institute annual report: 1979-1980. Diel, JH; Bice, DE; Martinez, BS, eds. Albuquerque, NM: Lovelace Biomedical and Environmental Research Institute; p. 252; report no. LMF-84.
Wolff, RK; Henderson, RF; Snipes, MB; et al. (1987) Alterations in particle accumulation and clearance in lungs of rats chronically exposed to diesel exhaust. Fundam Appl Toxicol 9:154-166.
Yang, HM; Ma, JY; Castranova, V; et al. (1997) Effects of diesel exhaust particles on the release of interleukin-1 and tumor necrosis factor-alpha from rat alveolar macrophages. Exp Lung Res 23:269-284.
5-116
6-1
6. ESTIMATING HUMANNONCANCER HEALTH RISKS OF DIESEL EXHAUST
6.1. INTRODUCTIONAs discussed earlier in this document (Chapter 2, Section 2.2.7, 2.2.8), diesel engine
exhaust (DE) consists of a complex mixture of gaseous pollutants and particles. In attempting toestimate potential health risks associated with human exposure to DE, researchers have focusedattention mostly on the particulate matter (PM) components. They have done so, in part, bycomparing the relative toxicity of unfiltered versus filtered DE (with gaseous componentsremoved), as discussed in Chapter 5.
Diesel particulate matter (DPM) consists mainly of: (a) elemental carbon (EC) particleshaving relatively large surface areas, (b) soluble organic carbon, including 5-ring or higherpolycyclic aromatic hydrocarbons (PAHs) such as benzo(a)pyrene, and other 3- or 4-ringcompounds distributed between gas and particle phases, and (c) metallic compounds. DPM alsotypically contains small amounts of sulfate/sulfuric acid and nitrates, trace elements, and water,plus some unidentified components. DPM is made up almost entirely of fine particles (i.e., allbelow 1–3 :m) with a significant subset of ultrafine particles (i.e., those with a mass mediandiameter below about 0.1 :m).
Health concerns have long focused on DPM. Toxicological data described in Chapter 5(Section 5.2) indicate DPM to be the prime etiologic agent of noncancer health effects when DEis sufficiently diluted to limit the concentrations of gaseous irritants (NO2 and SO2), irritantvapors (aldehydes), CO, or other systemic toxicants. The large surface areas of DPM allow foradsorption of organics from the diesel combustion process and for adsorption of additionalcompounds during transport in ambient air. The small size of DPM, combined with their largesurface area, likely enhance the potential for subcellular interactions with important cellularcomponents of respiratory tissues once the particles are inhaled by humans or other species(Johnston et al., 2000; Oberdörster et al., 2000).
The content of DPM as described above and in Chapter 2 is of clear toxicologicalsignificance. The experimental evidence described in Chapter 5 concerning DPM’s associationwith and etiology of noncancer effects is extensive and compelling. These points, along with thefact that DPM is easily and most frequently measured and reported in toxicological studies ofdiesel emissions, make DPM a reasonable choice as a measure of diesel emissions. As asurrogate, DPM is as valid as any other component of DE to show what is currently known—andprobably what is not yet known—about diesel emissions. Therefore, DPM is the quantitativefocus of this chapter.
1A new PM CD is now being prepared to reflect the latest scientific studies on ambient PM available sincethe last document was completed.
6-2
The usual agency approach to evaluating noncancer risks from inhaled exposures to toxicair pollutants such as ambient DE has been documented by EPA in the methods for derivation ofan inhalation reference concentration (RfC) (U.S. EPA, 1994). For DPM exposures, this meanscombining key elements derived from evaluations of specific DPM noncancer effects in animalsand humans (described in Chapter 5) with the use of quantitative dosimetry models (described inChapter 3). The goal is to estimate DPM concentrations to which humans might be exposedthroughout their lives (i.e., chronically) without experiencing any untoward or adverse effects. Such an effort can be accomplished through analysis of dose-response relationships where theadverse response is considered as a function of a corresponding measure of dose. Chapter 5 isreplete with dose-response information on adverse (but nonlethal) noncancer health effectsobserved in long-term (chronic/lifetime) exposure studies to DE in general and to DPM inparticular, albeit mostly in animals. Chapter 3 analyzes available methods to convert externalexposure concentrations of DPM in animal studies to estimates of a human-equivalentconcentration (HEC). The following sections of this chapter (Sections 6.2, 6.3, and 6.5) assessand integrate this information to derive a chronic RfC, using the above-cited methodology indeveloping dose-response assessments of the noncancer effects of toxic air pollutants. Yet another approach to consider in deriving quantitative estimates of potential humanhealth risks associated with ambient (nonoccupational) DPM exposures is the extent to whichDPM could contribute to the adverse health effects that have been associated with exposure toambient fine PM, PM2.5. Such associations with adverse health effects are based primarily onepidemiologic studies evaluated in EPA’s Air Quality Criteria Document for Particulate Matter(PM CD) (U.S. EPA, 1996a).1 This PM CD served as the scientific basis for the last periodicreview of the national ambient air quality standards (NAAQS) for PM, which resulted in theestablishment of revised PM standards in 1997, including standards for PM2.5. DPM is acomponent of ambient fine PM (see Chapter 2) and should be considered as a toxicologicallyimportant component of ambient fine PM. Any guidelines established for DPM, then, should beconcordant with information on fine PM in general, as presented in the PM CD. To more fullyconsider the implications of the relationship between ambient DPM and fine PM, theepidemiological evidence on fine PM and the basis for the PM2.5 standards are summarized, andthe relationship between ambient DPM and fine PM is discussed later in this chapter (Section6.4). This relationship is of interest with respect to the noncancer assessment of DE. As is notedhere , however, and reflected in Sections 6.2–6.4 below, the definitions, procedures, and statutorymandates that apply to criteria pollutants such as PM (regulated through the establishment of
6-3
NAAQS under sections 108 and 109 of the Clean Air Act) are fundamentally different fromthose that apply to toxic air pollutants such as DE and to the derivation of RfCs for suchpollutants. Thus, the ambient PM2.5 concentrations that are specified as the levels of the PM2.5
NAAQS should not be compared directly with any RfC that may be derived for DPM. It isreasonable to observe, however, that the annual PM2.5 standard would be expected to provide ameasure of protection from DPM, reflecting DPM’s current approximate proportion to PM2.5.
Estimates of DE levels associated with effects occurring under less than lifetime exposurescenarios (such as acute exposure) are not addressed in this chapter. Studies of acute exposure toDE are discussed in Chapter 5, but are accompanied by scant dose-response information, withsingle-exposure studies for various specialized endpoints (e.g., allergenicity/adjuvancy) and othermultiple-exposure-level studies reporting data on mortality only. Based on currently availablemethodologies, these studies do not yet appear to provide a sufficient basis from which to derivea dose-response assessment for an acute DE exposure scenario.
6.2. THE INHALATION REFERENCE CONCENTRATION APPROACHHistorically, approaches such as the Acceptable Daily Intake (ADI) were developed
whereby effect levels, such as no-observed-adverse-effect levels (NOAELs) or lowest-observed-adverse-effect levels (LOAELs) from human or animal data, were combined with certain “safetyfactors” to accommodate areas of uncertainty to make quantitative estimates of a safe dose, i.e., alevel at which no adverse effect would be likely to occur. In response to the National Academyof Sciences (NAS) report entitled “Risk Assessment in the Federal Government: Managing theProcess” (National Research Council, 1983), EPA developed two approaches similar to the ADI,i.e., the oral reference dose (RfD) (Barnes and Dourson, 1988) and the parallel inhalationreference concentration, the RfC, with its formal methodology (U.S. EPA, 1994). Similar to theADI in intent, the RfD/C approach is used for dose-response assessment of noncancer effects,using an explicitly delineated, rigorous methodology that adheres to the principles set forth in the1983 NRC report. The RfC methodology includes comprehensive guidance on a number ofcomplex issues, including consistent application to effect levels of uncertainty factors (UFs)rather than the ADI safety factors for consideration of uncertainty. Basically, these approachesattempt to estimate a likely subthreshold concentration in the human population. Use of theRfD/C approach is one of the principal current agency methods for deriving dose-responseassessments.
A chronic RfC is currently defined as:

2BMCLx is defined as the lower 95% confidence limit of the dose that will result in a level of “x” response(e.g., BMCL10 is the lower 95% confidence limit of a dose for a 10% increase in a particular response). SeeAppendix B for further specifics.
6-4
RfC =NOAEL
UFHEC (6-1)
An estimate (with uncertainty spanning perhaps an order of magnitude) of a continuousinhalation exposure to the human population (including sensitive subgroups) that is likelyto be without an appreciable risk of deleterious noncancer effects during a lifetime.
The RfC approach involves the following general steps:
• Identification of a critical effect relevant to humans, i.e., an adverse effect that occursat the lowest exposure/dose in human or animal studies and whose prevention avoidsthe occurrence of all other adverse effects;
• Selection of appropriate dose-response data to derive a point of departure (POD) forextrapolation of a key study (or studies) that provides a NOAEL, LOAEL, orbenchmark concentration (BMCLx)2;
• Estimation of HECs when animal exposure-response data are used (via use ofPBPK/dosimetry models);
• Application of UFs to the point of departure (e.g., NOAEL, LOAEL, BMCLx) toaddress extrapolation uncertainties (e.g., interindividual variability, interspeciesdifferences, adequacy of database); and
• Characterization of the “confidence” in the dose-response assessment and resultantRfC.
The basic quantitative formula for derivation of an RfC, given in Equation 6-1, has as itsbasic components an effect level, here a NOAEL, expressed as an HEC, and UFs. The units ofan RfC are typically mg/m3 or :g/m3.
Alternatively, the numerator in Equation 6-1 may be a LOAEL or BMCLx. The
benchmark concentration (BMC) approach and its application in this assessment are documentedin Appendix B and described further below. Also, a modifying factor (MF) may be used in thedenominator of this equation to account for scientific uncertainties, usually relating to the studychosen as the basis for the RfC. Further specifics of RfC derivation procedures are discussed as

6-5
they are used in the following sections. All such procedures are described in detail in the RfCMethodology (U.S. EPA, 1994).
6.3. CHRONIC REFERENCE CONCENTRATION FOR DIESEL EXHAUST As concluded in Chapter 5, chronic respiratory effects are the principal noncancer hazard
to humans from long-term environmental exposure to DE. Other effects (e.g., neurological,liver-related) are observed in animal studies at higher exposures than those producing therespiratory effects. The human and animal data for the immunological effects of DE arecurrently considered inadequate for dose-response evaluation. Thus, the respiratory effects areconsidered the “critical effect” for the derivation of a chronic RfC for DE.
The evidence for chronic respiratory effects is based mainly on animal studies showingconsistent findings of inflammatory, histopathological (including fibrosis), and functionalchanges in the pulmonary and tracheobronchial regions of laboratory animals, including the rat,mouse, hamster, guinea pig, and monkey. Occupational studies of DE provide somecorroborative evidence of possible respiratory effects (e.g., respiratory symptoms and possiblelung function changes), although those studies are generally deficient in exposure information.
Mode-of-action information about respiratory effects from DE exposure indicates that, atleast in rats, the pathogenic sequence following the inhalation of DPM begins with thephagocytosis of diesel particles by alveolar macrophages (AMs). These activated AMs releasechemotactic factors that attract neutrophils and additional AMs. As the lung burden of DPMincreases, there are aggregations of particle-laden AMs in alveoli adjacent to terminalbronchioles, increases in the number of Type II cells lining particle-laden alveoli, and thepresence of particles within alveolar and peribronchial interstitial tissues and associated lymphnodes. The neutrophils and AMs release mediators of inflammation and oxygen radicals, andparticle-laden macrophages are functionally altered, resulting in decreased viability and impairedphagocytosis and clearance of particles. This series of events may result in pulmonaryinflammation, fibrosis, and eventually lesions like those described in the studies reviewed inChapter 5. Although information describing the possible pathogenesis of respiratory effects inhumans is not available, the effects reported in studies of humans exposed to DE are notinconsistent with the findings in controlled laboratory animal studies.
Several reasons explain why the dose-response data from rats are considered especiallyappropriate for use in characterizing noncancer health effects in humans and deriving a chronicRfC for DE. First, similar noncancer respiratory effects are seen in other species (mouse,hamster, guinea pig, and monkey). Second, rats and humans exhibit similar noncancer responses(macrophage response and interstitial fibrosis) to other particles such as coal mine dust, silica,and beryllium (Haschek and Witschi, 1991; Oberdörster, 1994). Third, relative to other species

6-6
there exists a plethora of long-term, specialized, and mechanistic studies in rats. Fourth, anexpert panel convened by the International Life Sciences Institute (ILSI) recommended thatresponse data on persistent, inflammatory processes may be used to assess nonneoplasticresponses of poorly soluble particles (PSP) such as DPM (ILSI, 2000).
6.3.1. Principal Studies for Dose-Response Analysis: Chronic, Multiple-Dose Level Rat Studies The experimental protocols and results from the long-term, repeated-exposure chronic
studies demonstrating and characterizing the critical effects of pulmonary fibrotic changes andinflammation are discussed in Chapter 5. Salient points of these studies, including species/sexof the test species, the exposure regime and concentrations reported in mg DPM/m3, and effectlevels, are abstracted in Table 6-1 for further consideration. The effect levels are designated asN for no-observed-adverse-effect level, A for adverse-effect level, and BMCL10.
The purpose of many of the chronic studies listed in this table was not the elucidation ofthe concentration-response character of DPM. The studies of Heinrich et al. (1982, 1986) inhamsters, mice, and rats; of Iwai et al. (1986) in rats; of Lewis et al. (1989) in monkeys; and ofPepelko (1982a) in rats are all single-dose-level analyses that have as their genesis mechanistic orspecies-comparative purposes. As discussed in Chapter 5, many of these studies do providevaluable supporting information for designation of the critical effect of pulmonaryhistopathology. The lack of any clear dose-response data, however, precludes consideration ofthese studies as a basis for RfC derivation.
Likewise, studies of chronic, multiple-level exposure involving species other than rats,i.e., hamsters (Pepelko, 1982b), cats (Plopper et al., 1983), and guinea pigs (Barnhart et al., 1981,1982), provide cross-species corroboration of the critical effects of pulmonary histopathologyand inflammatory alteration.
The remaining studies showing exposure-response relationships in rats for the criticaleffects include those of Ishinishi et al. (1986, 1988), Mauderly et al. (1987a), Heinrich et al.(1995), and Nikula et al. (1995). As described in Chapter 5, all of these studies were conductedand reported in a thorough, exhaustive manner on the critical effects and little, if any, basis existsfor choosing one over another for purposes of RfC derivation. One way of taking advantage ofthis high degree of methodological and scientific merit would be to array data from all thesestudies and their effect levels (NOAEL, LOAEL, BMCLx) subsequent to normalization of theexposure conditions, i.e., conversion of the exposure regimes to yield an HEC. This exercisewould result in an interstudy concentration-response continuum normalized to a continuoushuman exposure to DPM that would facilitate the choice of a concentration to use as a point ofdeparture in deriving an RfC.

6-7
Table 6-1. Histopathological effects of diesel exhaust in the lungs of laboratory animals
Study Species/sexExposure
periodParticles(mg/m3) Effect levela Effectsb
Lewis et al. (1989) Monkey, Cynomolgus,M
7 h/day5 days/wk104 wks
2.0 N AM aggregation; no fibrosis,inflammation, or emphysema
Bhatnagar et al.(1980) Pepelko (1982a)
Rat, F344,M, F
7 h/day5 days/wk104 wks
2.0 Multifocal histiocytosis;inflammatory changes; TypeII cell proliferation; fibrosis
Pepelko (1982b) Hamster,Chinese, M
8 h/day5 days/wk26 wks
6.012.0
A Inflammatory changes; AMaccumulation; thickenedalveolar lining; Type II cellhyperplasia; edema; increasein collagen
Heinrich et al.(1982)
Hamster,Syrian, M, F
7-8 h/day5 days/wk120 wks
3.9 A Inflammatory changes, 60%adenomatous cell proliferation
Iwai et al. (1986) Rat, F344, F 8 h/day7 days/wk104 wks
4.9 A Type II cell proliferation;inflammatory changes;bronchial hyperplasia; fibrosis
Mauderly et al.(1987a)Henderson et al.(1988)
Rat, F344,M, F; Mouse,CD-1,M, F
7 h/day5 days/wk130 wks
0.353.57.1
NAA
Alveolar and bronchiolarepithelial metaplasia in rats at3.5 and 7.0 mg/m3; fibrosis at7.0 mg/m3 in rats and mice;inflammatory changes; fewquantitative data given
Heinrich et al.(1995)
Rat, Wistar,F;Mouse,NMRI, F(7 mg/m3
only)
18 h/day5 days/wk24 mo
0.82.57.0
AAA
Bronchioalveolar hyperplasia,interstitial fibrosis in allgroups; severity and incidenceincrease with exposureconcentration; text given only
Mouse,NMRI, F;C57BL/6N, F
18 h/day5 days/wk13.5 mo(NMRI)24 mo(C57BL/N)
7.0 A No increase in tumors;noncancer effects notdiscussed

Table 6-1. Histopathological effects of diesel exhaust in the lungs of laboratory animals(continued)
Study Species/sexExposure
periodParticles(mg/m3) Effect levela Effectsb
6-8
Ishnishi et al. (1986,1988)
Rat, M, F,F344, /Jcl.
16 h/day6 days/wk130 wks
0.11c
0.41c
1.08c
2.32c
0.46d
0.96d
1.84d
NNAA
NAA
Inflammatory changes; TypeII cell hyperplasia and lungtumors seen at >0.4 mg/m3;shortening and loss of cilia intrachea and bronchi; datagiven in text only
3.72d A
Heinrich et al.(1986)
Hamster,Syrian, M, F;Mouse,NMRI, F;Rat, Wistar,F
19 h/day5 days/wk120 wks
4.24 A Inflammatory changes;thickened alveolar septa;bronchioloalveolarhyperplasia; alveolar lipo-proteinosis; emphysema(diagnostic methodology notdescribed); hyperplasia; lungtumors
Barnhart et al.(1981, 1982);Vostal et al. (1981)
Guinea pig,Hartley, M
20 h/day5.5days/wk 104 wks
0.250.751.56.0
NAAA
Minimal response at 0.25 andultrastructural changes at0.75 mg/m3; thickenedalveolar membranes; cellproliferation; fibrosis at6.0 mg/m3; increase in PMN at0.75 mg/m3 and 1.5 mg/m3
Plopper et al.(1983)Hyde et al. (1985)
Cat, inbred,M
8 h/day7 days/wk124 wks
6.0c
12.0dAA
Inflammatory changes; AMaggregation; bronchiolarepithelial metaplasia; Type IIcell hyperplasia;peribronchiolar fibrosis
Nikula et al. (1995) Rat, F344, M 16 h/day5 days/wk23 mo
2.446.33
A, ABMCL10
AM hyperplasia, epithelialhyperplasia, inflammation,septal fibrosis,bronchoalveolar metaplasia
aN= no-observed-adverse-effect level; A = adverse-effect level; BMCL10 = benchmark concentration, lower limit, ata 10% response level (for incidence); see Appendix A for further specifics. bAM = Alveolar macrophage; PMN = Polymorphonuclear leukocytecLight-duty engine.dHeavy-duty engine.c1 to 61 weeks exposure.d62 to 124 weeks of exposure.eSee Appendix A.
6-9
6.3.2. Derivation of Human Continuous Equivalent Concentrations, HECsPharmacokinetic, or PK, models can be used to estimate across species the external
concentrations of a toxicant that would result in equivalent internal doses. When used for thesepurposes, PK models may be termed comparative dosimetric models. Chapter 3 reviewed andevaluated a number of dosimetric models applicable to DPM. This analysis indicated thatoutputs from the human component of the model developed by Yu et al. (1991) specifically forDPM, such as deposition and estimated lung burden, were not substantially different from otheravailable models. The analysis also demonstrated that the Yu model accounted for severaldiesel-specific phenomena, including particle overload lung clearance rates and interspecieskinetics of desorption of organics from the carbonaceous core of DPM, both slow- and fast-cleared. Of importance, the Yu model was parameterized for deposition and clearance in bothanimals and humans. Also, the animal component of the model was based on data from ratsactually exposed to DPM, whereas other models analyzed used data based only on genericparticles in the size range of DPM. It was concluded from this analysis that the Yu model couldbe used to estimate disposition of DPM both in animals and in humans and would therefore be anacceptable choice in performing animal-to-human extrapolation in deriving a continuous human-equivalent concentration. Note, however, that use of this or any other available PK model wouldaddress species differences in dose (i.e., pharmacokinetics, PK), and not necessarilypharmacodynamics (PD), the other component of uncertainty in animal-to-human or interspeciesextrapolation (U.S. EPA, 1994).
Guidance on choosing measures of exposure for poorly soluble particles such as DPM(ILSI, 2000) states that some measures of external dose (e.g., the aerosol exposure parameters ofMMAD, Fg, particle surface area, and density) should be characterized. Likewise, someindication of internal dose resulting from the external exposure (e.g., lung burden) should bemeasured so that differences in dose metrics may be considered as new mechanistic insights aredeveloped. The whole particle, as characterized in this assessment and used in the model of Yuet al. (1991), meets this recommended guidance, and DPM, in :g/m3, is used as the measure ofexternal exposure. Internal measures of exposure or dose were also considered in Chapter 3(Section 3.3.1.1) with the conclusion that the dose metric of lung burden of DPM in terms ofsurface area (mg/cm2) at the termination of the exposure period appears to be the most defensibleand appropriate measure of internal dose, especially where clearance is involved. More detailedspecifics are available in Chapter 3 and in Appendix A.
The logical and operational sequence of deriving a HEC using the Yu model and thesemetrics, i.e. external air concentration (in :g/m3) and lung burden (in mg/cm2), is demonstratedin Figure 6-1. First, the experimental animal exposures, including external concentration and

6-10
Figure 6-1. Flow diagram of procedure for calculating HECs.
daily and weekly duration, are entered into the animal component of the Yu model to estimate the animal lung burden, in mg DPM/cm2, for the specific exposure scenario. The humancomponent of the Yu model is then used by setting desired exposure conditions (continuous for70 years) and running the model to find an external exposure DPM concentration that wouldresult in this same lung burden. The human external DPM concentration matching this lungburden is the human-equivalent concentration. The step-by-step specifics and results of thisprocedure as applied to the various studies in Table 6-1 are shown in Table A-4 and fullyexplained in Appendix A.
The foregoing discussion does not address the variability in outcomes that may beestimated from the Yu et al. (1991) model from deposition of DPM. The model comparisonexercises in Chapter 3 showed relatively minor differences among the various human models forone measure, deposition, and indicated that human lung burdens estimated by the humancomponent of the Yu and ICRP66 models were nearly identical at low-exposure concentrations. Variability in output of their model (lung burden) was also examined by Yu and Yoon (1990),who studied dependency on tidal volume, respiration rate, and clearance (in terms of the overallparticle transport rate from the alveolar region, 8A). Analysis indicated that the model output issensitive, but not overly so, for these determinative parameters. A ± 20% change in values for8A, for example, was estimated to result in a 16%–26% change in soot burden at a 0.1 mg/m3
continuous diesel exposure for 10 years. For a ± 10% change in tidal volume, the modelprojected changes in soot burden ranging from 14% to 22% for this same exposure scenario. Thefact that the changes in the model outcome were comparable to changes in the input parameters,such as tidal volume, indicates that the variability of the model when applied to the humanpopulation would reflect the variability of these physiological parameters across that population. In sum, at low concentrations of DPM (< 0.5 mg/m3), relatively minor differences exist amongthe models currently available, and the input parameters in the human population may be a majorsource of variability. As discussed below, variability within the human population often isaddressed by applying safety or uncertainty factors, usually in the range of 10 (Renwick andLazarus, 1998; U.S. EPA, 1994).
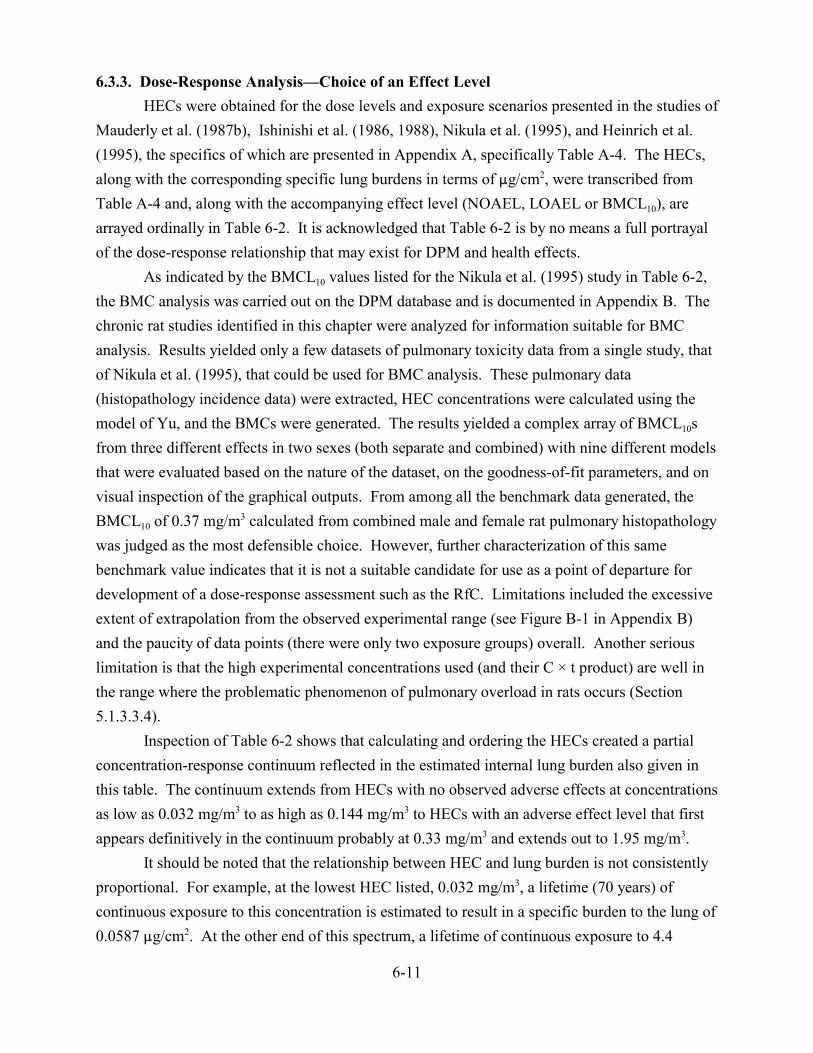
6-11
6.3.3. Dose-Response Analysis—Choice of an Effect LevelHECs were obtained for the dose levels and exposure scenarios presented in the studies of
Mauderly et al. (1987b), Ishinishi et al. (1986, 1988), Nikula et al. (1995), and Heinrich et al.(1995), the specifics of which are presented in Appendix A, specifically Table A-4. The HECs,along with the corresponding specific lung burdens in terms of :g/cm2, were transcribed fromTable A-4 and, along with the accompanying effect level (NOAEL, LOAEL or BMCL10), arearrayed ordinally in Table 6-2. It is acknowledged that Table 6-2 is by no means a full portrayalof the dose-response relationship that may exist for DPM and health effects.
As indicated by the BMCL10 values listed for the Nikula et al. (1995) study in Table 6-2, the BMC analysis was carried out on the DPM database and is documented in Appendix B. Thechronic rat studies identified in this chapter were analyzed for information suitable for BMCanalysis. Results yielded only a few datasets of pulmonary toxicity data from a single study, thatof Nikula et al. (1995), that could be used for BMC analysis. These pulmonary data(histopathology incidence data) were extracted, HEC concentrations were calculated using themodel of Yu, and the BMCs were generated. The results yielded a complex array of BMCL10sfrom three different effects in two sexes (both separate and combined) with nine different modelsthat were evaluated based on the nature of the dataset, on the goodness-of-fit parameters, and onvisual inspection of the graphical outputs. From among all the benchmark data generated, theBMCL10 of 0.37 mg/m3 calculated from combined male and female rat pulmonary histopathologywas judged as the most defensible choice. However, further characterization of this samebenchmark value indicates that it is not a suitable candidate for use as a point of departure fordevelopment of a dose-response assessment such as the RfC. Limitations included the excessiveextent of extrapolation from the observed experimental range (see Figure B-1 in Appendix B)and the paucity of data points (there were only two exposure groups) overall. Another seriouslimitation is that the high experimental concentrations used (and their C × t product) are well inthe range where the problematic phenomenon of pulmonary overload in rats occurs (Section5.1.3.3.4).
Inspection of Table 6-2 shows that calculating and ordering the HECs created a partialconcentration-response continuum reflected in the estimated internal lung burden also given inthis table. The continuum extends from HECs with no observed adverse effects at concentrationsas low as 0.032 mg/m3 to as high as 0.144 mg/m3 to HECs with an adverse effect level that firstappears definitively in the continuum probably at 0.33 mg/m3 and extends out to 1.95 mg/m3.
It should be noted that the relationship between HEC and lung burden is not consistentlyproportional. For example, at the lowest HEC listed, 0.032 mg/m3, a lifetime (70 years) ofcontinuous exposure to this concentration is estimated to result in a specific burden to the lung of0.0587 :g/cm2. At the other end of this spectrum, a lifetime of continuous exposure to 4.4

6-12
Table 6-2. Human equivalent continuous concentrations: 70-year HECs calculated with the modelof Yu et al. (1991) from long-term studies of rats repeatedly exposed to DPMa
Study
Exposureconcentration
(mg/m3) Effect levela
Lung burden(modeled)
(:g DPM /cm2)bHEC
(mg/m3)
Ishinishi et al. (1988) (LDc) 0.11 NOAEL 0.0587 0.032
Mauderly et al. (1987a) 0.35 NOAEL 0.0685 0.038
Ishinishi et al. (1988) (LDc) 0.41 NOAEL 0.245 0.128
Ishinishi et al. (1988) (HDc) 0.46 NOAEL 0.281 0.144
Heinrich et al. (1995) 0.84 LOAEL 0.94 0.33
Nikula et al. (1995) 2.44 & 6.3d BMCL10 -inflam 1.34 0.37
Ishinishi et al. (1988) (HDc) 0.96 LOAEL 3.16 0.883
Ishinishi et al. (1988) (LDc) 1.18 LOAEL 4.50 1.25
Nikula et al. (1995) 2.44 & 6.3d BMCL10 - fibrosis 4.70 1.3
Mauderly et al. (1987a) 3.47 LOAEL 4.95 1.375
Nikula et al. (1995) 2.44 LOAEL 7.00 1.95
Ishinishi et al. (1988) (HDc) 1.84 AEL 7.63 2.15
Heinrich et al. (1995) 2.5 AEL 8.40 2.35
Ishinishi et al. (1988) (LDc) 2.32 AEL 9.75 2.75
Mauderly et al. (1987a) 7.08 AEL 10.9 3.05
Ishinishi et al. (1988) (HDc) 3.72 AEL 15.8 4.4aEffect levels are based on the critical effects of pulmonary histopathology and inflammation as reported in the individual studies. NOAEL: no-observed-adverse-effect level; LOAEL: lowest-observed-adverse-effect level; AEL: adverse-effect level; BMCL10: lower 95% confidence estimate of the concentration of DPM associated with a 10% incidence of chronic pulmonary inflammation (inflam) or fibrosis (see Appendices A and B for more specifics).bLung burdens were derived from data generated from the animal portion of the Yu model using the concentration and duration scenario of each study. The human portion of the Yu model was then used to estimate the continuous, 70-year exposures that would result in this same lung burden, i.e., the HEC. See Table A-4 in Appendix A and accompanying text for further specifics on derivation.cLD/HD = light-duty/heavy-duty diesel engine.dThese values are the actual exposure levels used in the Nikula study. These values were converted into HEC and entered into BMC equations to obtain the estimate of the BMCL10 listed. The lung burdens for the two BMCL10s listed here were derived by interpolation.

6-13
mg/m3 is estimated to result in a specific lung burden of 15.8 :g/cm2. This latter lung burden isdisproportionally elevated compared with the burden estimated to result from exposure to thelowest concentration. Applying the absolute ratio of lung burden/HEC at the lowest HECexposure (i.e., 0.0587/ 0.032 = 1.8) to the highest concentration would result in a lower lungburden, 4.4 × 1.8 = 7.9 :g/cm2, which is much lower than the 15.8 :g/cm2 indicated. Thisdisproportionate increase in lung burden as a function of DPM concentration would be predictedfrom the assumption in the Yu model that the overload phenomena occurs in humans, as isdemonstrated in Figure 3-9 in Chapter 3. Inspection of Table 6-2 shows that this disproportionbetween lung burden and HEC begins to be noticeable around 0.33 mg/m3, at the HEC derivedfrom the Heinrich et al. (1995) study. HECs below this value are not appreciably influenced bythe overload/disproportionate lung burden phenomenon.
Inspection of the combined interstudy dose-response continuum in Table 6-2 to elucidatea point of departure for an RfC entails some interpretation. Exposures at the lower end of thistable show that elevated chronic exposures to DPM consistently result in AELs. Conversely,entries in the upper portion of this table show that low-level chronic exposures to DPM haveminimal, if any, effects within the capability of these studies to detect them. Intermediatechronic exposures, from 0.128 mg/m3 to 0.9 mg/m3, are, however, less clear and effect levels andexposures either have no or few observable effects, or effects that are minimally adverse. In choosing from among levels (e.g., NOAELs, LOAELs, BMCLxs) as a POD for derivation ofan RfC, the methodology (U.S. EPA, 1994) provides guidance for choice of a highest no-effectlevel below an effect level; the interim guidance for the BMC suggests that for use as a point ofdeparture, a benchmark (e.g., BMCL10) should be within the range of the observable responsedata so as to avoid excessive extrapolation, and take the shape of the dose-response curve intoconsideration (Barnes et al., 1995; U.S. EPA, 1995). The highest no-effect HECs (NOAELHEC)in this table are 0.128 mg/m3 and 0.144 mg/m3 from the Ishinishi et al. (1988) study, nearlyfivefold above other no-effect levels of 0.032 and 0.038 mg/m3. The lower BMCL10 (0.37mg/m3) is at nearly the same concentration as the lowest LOAEL of 0.33 mg/m3 and thus may betoo high an estimate for use as a POD based on these data. As discussed above, the limitationson this BMCL10, including excessive extrapolation out of the observable range (see Appendix Bfor more specifics), make it a less than optimal candidate for consideration as a POD in thedevelopment of dose-response assessments and therefore was not used for this purpose in thisassessment. However, this BMCL10 (i.e., at a response rate of 0.1 or 10%) was generated directlyfrom a modeled dose-response curve for chronic inflammation and lends credence to the other NOAELs in Table 6-2 as being associated with their respective dose-response curve at incidencesof considerably less than 10%. Moreover, the HECs of less than 0.33 mg/m3 are not appreciablyinfluenced by the overload phenomenon (see above). Based on this analysis, the value of 0.144

6-14
mg/m3 is chosen as the POD for development of the RfC, because it is the highest NOAELHEC
among those available.
6.3.4. Uncertainty Factors (UF) for the RfC—A Composite Factor of 30Areas of uncertainty designated in the RfC that are relevant to the DPM assessment are
interindividual variability and animal-to-human extrapolation. Each shall be addressed in thissection.
Considerable qualitative but little, if any, quantitative information exists regardingsubgroups that could be sensitive to any respiratory tract effects of DPM. It is acknowledged thatexposure to DPM could be additive to many other daily or lifetime exposures to airborne organiccompounds and nondiesel ambient PM. It is also likely that individuals who predispose theirlungs to increased particle retention through smoking or other high particulate burdens, who haveexisting respiratory tract inflammation or infections, or who have chronic bronchitis, asthma, orfibrosis could be more susceptible to adverse impacts from DPM exposure (U.S. EPA, 1996a,Chapter 5 of this document). Also, infants and children could have a greater susceptibility to theacute/chronic toxicity of DPM because of their greater breathing frequency and consequentpotential for greater particle deposition in the respiratory tract, which has not reached fulldevelopment. Increased respiratory symptoms and decreased lung function in children versusambient PM levels, of which DPM is a part, have been observed (U.S. EPA, 1996a). Thus, eventhough the limited evidence currently available (see Chapter 5) produces no clear evidence thatchildren are especially sensitive to effects from breathing DPM, the possibility that they actuallymay be more susceptible because of their inherent physiology and anatomy should remain aconsideration. Likewise, a number of factors may modify normal lung clearance, including,aging, gender, and disease. It should be noted that the results of Mauderly et al. (1989) discussedin Chapter 5 indicated that rats with diseased lungs (emphysematous) were no more susceptiblethan rats with normal lungs to the effects of DE exposure. Although the exact role of thesefactors is not resolved, all would influence the particle dose to the lung tissue from inhalationexposure. Activity patterns related to occupation and habitation in the proximity of majorroadways are certain to be contributory for some subgroups in receiving higher DPM exposures(Chapter 2). In the absence of DE-specific data, this assessment relies on a default UF value of10 to account for possible interindividual human variability (U.S. EPA, 1994; Renwick andLazarus, 1998).
Application of an animal-to-human extrapolation or interspecies uncertainty factor to anassessment may be modified via a number of circumstances. When the assessment is based onhuman data, no such UF is necessary. When the assessment is based on animal data, as is thecase with DPM, a default UF of 10 typically is applied to the animal effect level. This latter

6-15
action implies that the effect observed in the animal study would occur in humans at a 10-foldlower concentration, ostensibly from some combination of pharmacokinetic andpharmacodynamic factors that would reflect greater dose (PK consideration) to the human targetor greater sensitivity (PK consideration) of the human tissue.
The circumstances with DPM warrant modification away from application of the defaultUF for animal-to-human extrapolation. The first circumstance is the extensive effort in thisassessment to address the pharmacokinetic component of the UF. The point of employing state-of-the-art lung dosimetry models with specific parameterization for DPM in conversion ofanimal exposures to human-equivalent exposures is to derive an estimate of interspeciespharmacokinetics; to know this aspect of interspecies difference with some degree of certainty. Having made this informed effort addresses a major portion of the PK component. It isacknowledged, however, that uncertainties about the model employed here (or any other model)persist. Although the model comparison shown in Chapter 3 indicates relatively minorvariability in output among the various human models examined (see Table 3-3 and Figure 3-9)other sources of uncertainty and variability remain. These include, but are not limited to, matterssuch as the estimates if the model were applied to the general population or variability from theanimal portion of the model(s). A second circumstance involves the pharmacodynamic or PDcomponent of the interspecies UF, especially the aspect as to whether the experimental animalspecies used in the assessment is more or less sensitive than humans. In the consensus report ofILSI (2000) a specific recommendation is made concerning the PD aspect of the interspeciesuncertainty factor for poorly soluble particles such as DPM. Because the pulmonary responsesfrom DPM in the principal experimental species, the rat, are present under exposure conditionsthat do not appear to elicit any response in humans, the experimental species is considered moresensitive than humans. Accordingly, the report suggested that no accommodation be made foruncertainty concerning the pharmacodynamic component of the interspecies UF for DPM andpresumably for any other PSP, as the rat appeared to be a sensitive species, more so even than thehuman. However, other information currently available on DPM suggests that, at least withregard to inflammatory effects, humans may indeed be as sensitive or even more so than rats. Section 5.1.1.1.3 discusses several studies where humans were exposed to airborne DPM andeither precursors (Salvi et al., 2000; Nordenhall et al., 2000) or markers (Nightingale et al., 2000;Salvi et al.,1999) of inflammation were detected. These indicators of inflammation were inresponse to DPM levels of only 200–300 :g/m3 of 1–2h duration. Note that in Table 6-2,NOAEL concentrations to which rats actually were exposed were only 100–400 :g/m3, clearlywithin the range of the aforementioned human exposure levels. Thus, adverse effects(inflammation) have been shown to occur in humans at equivalent or possibly even lower levels

6-16
of DPM than observed in rats, indicating that humans may indeed be at least as sensitive if notmore so than rats.
The sum of these considerations on the animal-to-human UF is that, although majorportions of uncertainty have been addressed, degrees of uncertainty persist in both thepharmacodynamic and pharmacokinetic components of the factor. In considering both thisresidual uncertainty and the information discussed above, it would be prudent to acknowledgepartial degrees of uncertainty in both these areas with a partial uncertainty factor, i.e., 100.5 vice101, such that a factor of 3 would be applied for interspecies extrapolation.
In summary, the application of UFs for the two areas discussed above, interhuman andanimal to human, would result in a composite uncertainty factor of 30, 10 for interhuman × 3 foranimal to human. Use of other UFs, as discussed in the RfC methodology (U.S. EPA, 1994) fordeficiencies in database or for duration extrapolation, is not considered necessary. It should benoted that, given the emerging research on DE-induced immunological effects, it may benecessary at a later date to reconsider the basis for selection of the critical effect and UFs andthus the entire derivation of the DE RfC.
6.3.5. Derivation of the RfC for Diesel Exhaust On the basis of the above analysis, the value of 0.144 mg/m3 DPM was selected as the
point of departure for the RfC evaluation. This value was derived from concentrations in ratchronic studies that were modeled to obtain HECs. The pulmonary effects, histopathology andinflammation, were determined to be the critical noncancer effects. Response data oninflammation also were suggested by a specific scientific working group as a satisfactorysurrogate for fibrogenic responses in assessing the pulmonary responses of poorly solubleparticles such as DPM (ILSI, 2000). Sufficient documentation from other studies showed noeffect in the portal-of-entry tissues, the extrathoracic (nasopharyngeal) region of the respiratorysystem, or in other organs at the lowest levels that produce pulmonary effects in chronicexposures. Application of the dosimetric model of Yu et al. (1991) to the exposure value fromIshinishi et al. (1988) of 0.46 mg/m3 16 hr/day, 6 days/wk, a NOAEL, yielded a NOAELHEC of0.144 mg/m3. Application of the composite UF yields the RfC:
NOAELHEC ÷
÷ = =
UF = RfC0.144 mg/m mg/m g/m3 3 330 0 0048 5. .µ

6-17
6.4. EPIDEMIOLOGICAL EVIDENCE AND NAAQS FOR FINE PMHistorically, EPA has established primary NAAQS to protect sensitive human population
groups against adverse health effects associated with ambient exposures to certain widespread airpollutants, including PM, ozone (O3), carbon monoxide (CO), sulfur dioxide (SO2), nitrogendioxide (NO2), and lead (Pb). The U.S. Clean Air Act (the Act) requires that EPA periodicallyreview and revise as appropriate the criteria (scientific bases) and standards for each pollutant orclass of pollutants (e.g., PM) for which NAAQS have been established. The primary, health-based NAAQS must be based on the latest scientific information useful in indicating the kind andextent of all effects on public health expected from the presence of the pollutant in the ambientair, which is evaluated in a “Criteria Document” (CD). The NAAQS are then set at levels that, inthe judgment of the EPA Administrator, protect public health (as contrasted with the health ofany individual) with an adequate margin of safety. In determining the degree of protection thatwill satisfy this mandate, EPA considers the nature and severity of the effects, the types of healthevidence available, the kind and degree of scientific uncertainty that effects would in fact occurat any particular level of pollution, and the size and nature of sensitive populations at risk ofexperiencing exposures of concern. The EPA develops a staff paper to bridge the gap betweenthe scientific criteria and the public health policy considerations the Administrator must take intoaccount in reaching a final judgment. The EPA also must consider the recommendations of theClean Air Scientific Advisory Committee (CASAC), an independent committee established bythe Act specifically to advise the Administrator on air quality criteria and NAAQS. In contrast toan RfC, the NAAQS are not intended to identify a concentration that is protective against ahypothetical continuous lifetime exposure to a given level, but rather take into account expectedactual exposure conditions of U.S. populations.
The original PM NAAQS were set in 1971 in terms of total suspended particulate matter(TSP) and included both inhalable and noninhalable particles, ranging in size up to 25–50 :m. A later periodic review of the PM criteria and NAAQS led to the setting in 1987 of PM10
NAAQS (150 :g/m3, 24-h average; 50 :g/m3, annual average) aimed at protecting against healtheffects associated with those inhalable particles capable of penetrating to lower (thoracic) regionsof the human respiratory tract and depositing in tracheobronchial and alveolar tissue of the lung(#10.0 :m) (52 FR 24634, July 1, 1987). The most recently completed PM NAAQS review wasbased on an assessment of the latest available scientific information characterized in the EPA PMCD (U.S. EPA, 1996a) and additional staff assessments contained in an associated PM StaffPaper (U.S. EPA, 1996b). In 1997, on the basis of this information and taking into accountCASAC recommendations and extensive public comments, EPA established new PM2.5 NAAQS(15 :g/m3, annual average; 65 :g/m3, 24-h average) to protect against adverse health effectsassociated with exposures to fine PM. At the same time, EPA retained, in modified form, the

3At present, the 1997 PM2.5 standards are the subject of ongoing litigation, although they legally remain ineffect, as do the 1987 PM10 standards.
6-18
PM10 NAAQS originally set in 1987 to protect against effects associated with coarse fraction PM(62 FR 38652, July 18, 1997).3
The 1997 PM NAAQS decisions were based, in part, on important distinctions alreadyhighlighted by information present in the PM CD between the fine and coarse fractions of PM10 with regard to size, chemical composition, sources, and transport. Also of key importance werethe assessment and interpretation of new epidemiological findings on health effects associatedwith ambient PM. The epidemiological evidence and basis for the NAAQS for fine PM aresummarized below, followed by a discussion of the relevance of this information for noncancerassessment of DE.
6.4.1. Epidemiological Evidence for Fine PMThe PM CD (U.S. EPA, 1996a) and Staff Paper (U.S. EPA, 1996b) highlighted more than
80 newly published community epidemiologic studies, of which more than 60 found significantassociations between increased mortality and/or morbidity risks and various ambient PMindicators. The main findings of concern were community epidemiology results showingambient PM exposures to be statistically associated with increased mortality (especially amongpeople over 65 years of age and those with preexisting cardiopulmonary conditions) andmorbidity (indexed by increased hospital admissions, respiratory symptom rates, and decrementsin lung function).
Time-series mortality studies reviewed in the 1996 PM CD (U.S. EPA, 1996a) providestrong evidence that ambient PM air pollution is associated with increases in daily humanmortality and morbidity (e.g., increased hospital admissions and respiratory symptoms). Thesestudies provided evidence that such effects occur at routine ambient PM levels, extending to 24-hconcentrations below the 150 :g/m3 level of the PM10 NAAQS set in 1987. Overall, as shown inTable 6-3, the PM10 effects estimates derived from the recent PM10 total mortality studies suggestthat an increase of 50 :g/m3 in 24-h average PM10 is significantly associated with an increase intotal mortality, with an RR on the order of 1.025 to 1.05 in the general population. Table 6-3also shows higher relative risks for increased hospital admissions for the elderly and for thosewith preexisting respiratory conditions, both of which represent subpopulations at special risk formortality implications of acute exposures to air pollution, including PM; higher relative risks arealso shown for increased respiratory symptoms and decreased lung function in children. Resultsare very similar over a range of statistical models used in the analyses, and are not artifacts of themethods by which the data were analyzed. Further, these studies suggest a possible linear,
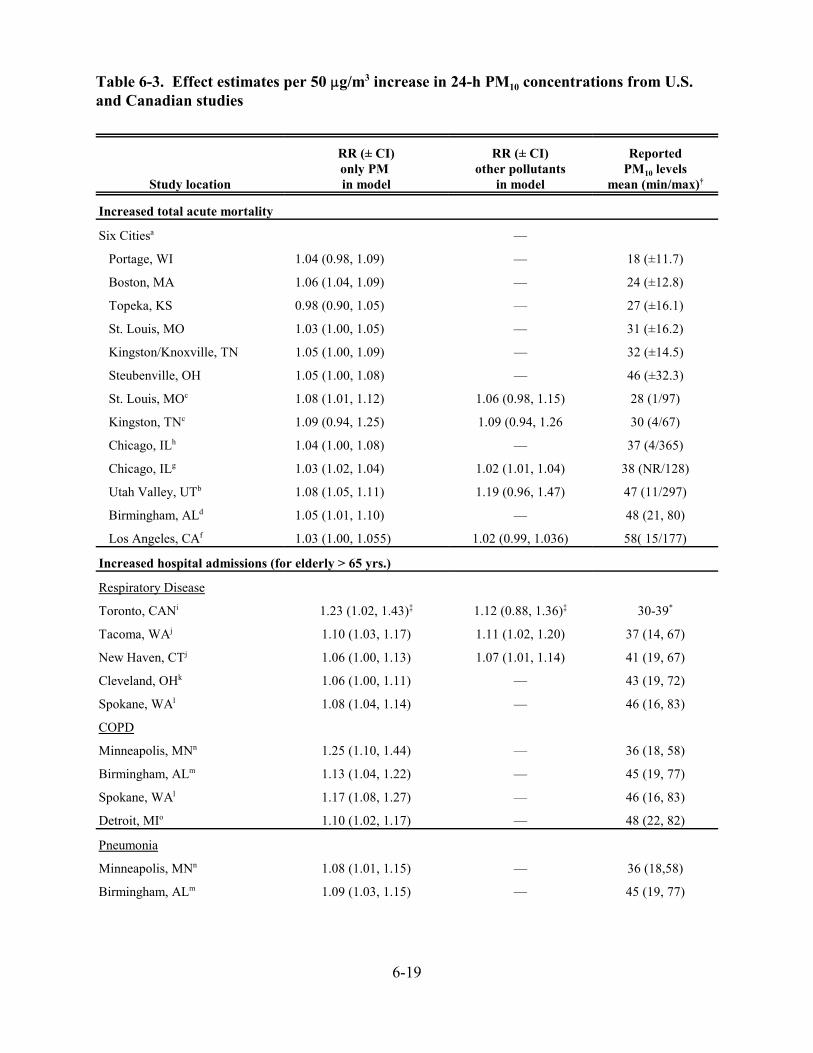
6-19
Table 6-3. Effect estimates per 50 :g/m3 increase in 24-h PM10 concentrations from U.S.and Canadian studies
Study location
RR (± CI)only PM in model
RR (± CI)other pollutants
in model
ReportedPM10 levels
mean (min/max)†
Increased total acute mortality
Six Citiesa —
Portage, WI 1.04 (0.98, 1.09) — 18 (±11.7)
Boston, MA 1.06 (1.04, 1.09) — 24 (±12.8)
Topeka, KS 0.98 (0.90, 1.05) — 27 (±16.1)
St. Louis, MO 1.03 (1.00, 1.05) — 31 (±16.2)
Kingston/Knoxville, TN 1.05 (1.00, 1.09) — 32 (±14.5)
Steubenville, OH 1.05 (1.00, 1.08) — 46 (±32.3)
St. Louis, MOc 1.08 (1.01, 1.12) 1.06 (0.98, 1.15) 28 (1/97)
Kingston, TNc 1.09 (0.94, 1.25) 1.09 (0.94, 1.26 30 (4/67)
Chicago, ILh 1.04 (1.00, 1.08) — 37 (4/365)
Chicago, ILg 1.03 (1.02, 1.04) 1.02 (1.01, 1.04) 38 (NR/128)
Utah Valley, UTb 1.08 (1.05, 1.11) 1.19 (0.96, 1.47) 47 (11/297)
Birmingham, ALd 1.05 (1.01, 1.10) — 48 (21, 80)
Los Angeles, CAf 1.03 (1.00, 1.055) 1.02 (0.99, 1.036) 58( 15/177)
Increased hospital admissions (for elderly > 65 yrs.)
Respiratory Disease
Toronto, CANi 1.23 (1.02, 1.43)‡ 1.12 (0.88, 1.36)‡ 30-39*
Tacoma, WAj 1.10 (1.03, 1.17) 1.11 (1.02, 1.20) 37 (14, 67)
New Haven, CTj 1.06 (1.00, 1.13) 1.07 (1.01, 1.14) 41 (19, 67)
Cleveland, OHk 1.06 (1.00, 1.11) — 43 (19, 72)
Spokane, WAl 1.08 (1.04, 1.14) — 46 (16, 83)
COPD
Minneapolis, MNn 1.25 (1.10, 1.44) — 36 (18, 58)
Birmingham, ALm 1.13 (1.04, 1.22) — 45 (19, 77)
Spokane, WAl 1.17 (1.08, 1.27) — 46 (16, 83)
Detroit, MIo 1.10 (1.02, 1.17) — 48 (22, 82)
Pneumonia
Minneapolis, MNn 1.08 (1.01, 1.15) — 36 (18,58)
Birmingham, ALm 1.09 (1.03, 1.15) — 45 (19, 77)

Table 6-3. Effect estimates per 50 :g/m3 increase in 24-h PM10 concentrations from U.S.and Canadian studies (continued)
Study location
RR (± CI)only PM in model
RR (± CI)other pollutants
in model
ReportedPM10 levels
mean (min/max)†
6-20
Spokane, WAl 1.06 (0.98, 1.13) — 46 (16, 83)
Detroit, MIo — 1.06 (1.02, 1.10) 48 (22, 82)
Ischemic HD
Detroit, MIp 1.02 (1.01, 1.03) 1.02 (1.00, 1.03) 48 (22, 82)
Increased respiratory symptoms
Lower Respiratory
Six Citiesq 2.03 (1.36, 3.04) Similar RR 30 (13,53)
Utah Valley, UTr 1.28 (1.06, 1.56)J — 46 (11/195)
1.01 (0.81, 1.27)B
Utah Valley, UTs 1.27 (1.08, 1.49) — 76 (7/251)
Cough
Denver, COx 1.09 (0.57, 2.10) — 22 (0.5/73)
Six Citiesq 1.51 (1.12, 2.05) Similar RR 30 (13, 53)
Utah Valley, UTs 1.29 (1.12, 1.48) — 76 (7/251)
Decrease in Lung Function
Utah Valley, UTr 55 (24, 86)** — 46 (11/195)
Utah Valley, UTs 30 (10, 50)** — 76 (7/251)
Utah Valley, UTw 29 (7,51)*** — 55 (1,181)
References:aSchwartz et al. (1996a). lSchwartz (1996). xOstro et al. (1991)bPope et al. (1992, 1994)/O3. mSchwartz (1994e). †Min/Max 24-h PM10 in parentheses unless notedcDockery et al. (1992)/O3. nSchwartz (1994f). otherwise as standard deviation (± S.D), 10 and dSchwartz (1993). oSchwartz (1994d). 90 percentile (10, 90). NR = not reported.fKinney et al. (1995)/O3, CO. pSchwartz and Morris (1995)/O3, CO, SO2. JChildren.gIto and Thurston (1996)/O3. qSchwartz et al. (1994). BAsthmatic children and adults.hStyer et al. (1995). rPope et al. (1991). *Means of several cities.iThurston et al. (1994)/O3. sPope and Dockery (1992). **PEFR decrease in ml/sec.jSchwartz (1995)/SO2. tSchwartz (1994g) ***FEV1 decrease.kSchwartz et al. (1996b). wPope and Kanner (1993). ‡RR refers to total population, not just>65 years.
Source: Adapted from U.S. EPA, 1996b, Tables V-3, V-6, and V-7. See U.S. EPA (1996a,b) for all referencecitations.

6-21
non-threshold PM/mortality relationship, but the data do not rule out the existence of anunderlying nonlinear, threshold relationship (U.S. EPA, 1996a, 12-310-311; 1996b, VI-16).Figure 6-2 illustrates the consistency and coherence of the PM10 epidemiology findings forincreased total and cause-specific mortality and morbidity risks in adults and children. Inaddition, Table 6-4 summarizes results from a wide array of U.S. and Canadian studies thatshowed increased risks of mortality and morbidity to be related to changes in short-term (24-h)fine PM (indexed by PM2.5 and other fine particle indicators).
As summarized below, long-term exposure studies reviewed in the 1996 PM CD (U.S.EPA, 1996a) also provide evidence of associations between indicators of PM, including fineparticle indicators, and chronic mortality and morbidity. Table 6-5 shows the direct comparisonsof two key prospective studies of long-term PM mortality: the Harvard Six Cities Study(Dockery et al., 1993) and the American Cancer Society (ACS) Study (Pope et al., 1995). Thesetwo studies agree in their findings of strong associations between fine particles and increasedmortality. The RR estimates for total mortality are large and highly significant in the Six Citiesstudy. With their 95% confidence intervals, the RR estimate for a 50 :g/m3 increase in PM15/10 is1.42 (1.16, 2.01), the RR estimate for a 25 :g/m3 increase in PM2.5 is 1.31 (1.11, 1.68), and theRR estimate for a 15 :g/m3 increase in SO4 is 1.46 (1.16, 2.16). The ACS study estimates fortotal mortality are smaller, but also more precise: RR = 1.17 (1.09, 1.26) for a 25 :g/m3 increasein PM2.5, and RR = 1.10 (1.06, 1.16) for a 15 :g/m3 increase in SO4. Both studies used Coxregression models and were adjusted for similar sets of individual covariates. In each case,however, caution must be applied in use of the stated quantitative risk estimates, given that thelifelong cumulative exposures of the study cohorts (especially in the dirtiest cities) includeddistinctly higher past PM exposures than those indexed by the more current PM measurementsused to estimate long-term PM exposures in the study. Thus, somewhat lower relative riskestimates than the published ones may well apply. A third study by Abbey et al. (1991, 1995)reported no association between long-term PM exposure (indexed by TSP and other estimatedPM indices) after 10 years, although the PM CD (U.S. EPA, 1996a) noted TSP may have been aninadequate index for exposure to inhalable particles and that additional follow-up might stillreveal chronic effects.
An additional line of evidence concerning long-term effects may be seen in comparingcause-specific deaths in the Six Cities and ACS studies. The relative risks for the most versusthe least polluted cities in the two studies are very similar for mortality from cardiopulmonarycauses (U.S. EPA, 1996b, V-17). These two long-term exposure studies, taken together, suggestthat there may be increases in mortality for specific disease categories that are consistent withlong-term exposure to ambient fine particles. Moreover, at least some fraction of these deaths is

6-22
Figure 6-2. Relative risk (RR) estimates for increased mortality and morbidity endpointsassociated with 50 µg/m3 increments in PM10 concentrations as derived fromstudies cited by numbers listed above each given type of health endpoint.
Note: Notice the consistency of RR elevations across studies for given endpoint and coherence of RR estimatesacross endpoints, e.g., higher RR values for symptoms versus hospital admissions and cause-specificmortality.
Source: PM Staff Paper (see U.S. EPA, 1996b for full reference citations for each study identified in figure.)
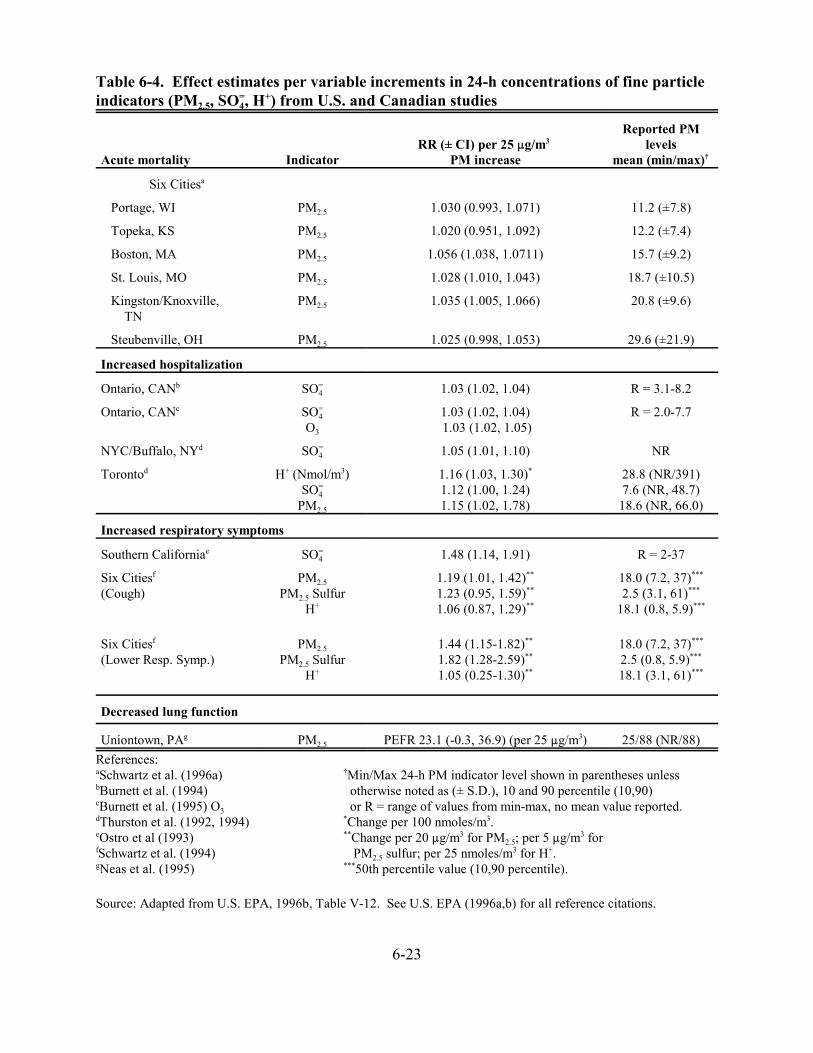
6-23
Table 6-4. Effect estimates per variable increments in 24-h concentrations of fine particleindicators (PM2.5, SO4
=, H+) from U.S. and Canadian studies
Acute mortality IndicatorRR (± CI) per 25 :g/m3
PM increase
Reported PMlevels
mean (min/max)†
Six Citiesa
Portage, WI PM2.5 1.030 (0.993, 1.071) 11.2 (±7.8)
Topeka, KS PM2.5 1.020 (0.951, 1.092) 12.2 (±7.4)
Boston, MA PM2.5 1.056 (1.038, 1.0711) 15.7 (±9.2)
St. Louis, MO PM2.5 1.028 (1.010, 1.043) 18.7 (±10.5)
Kingston/Knoxville, TN
PM2.5 1.035 (1.005, 1.066) 20.8 (±9.6)
Steubenville, OH PM2.5 1.025 (0.998, 1.053) 29.6 (±21.9)
Increased hospitalization
Ontario, CANb SO4= 1.03 (1.02, 1.04) R = 3.1-8.2
Ontario, CANc SO4=
O3
1.03 (1.02, 1.04) 1.03 (1.02, 1.05)
R = 2.0-7.7
NYC/Buffalo, NYd SO4= 1.05 (1.01, 1.10) NR
Torontod H+ (Nmol/m3)SO4
=
PM2.5
1.16 (1.03, 1.30)*
1.12 (1.00, 1.24)1.15 (1.02, 1.78)
28.8 (NR/391)7.6 (NR, 48.7)
18.6 (NR, 66.0)
Increased respiratory symptoms
Southern Californiae SO4= 1.48 (1.14, 1.91) R = 2-37
Six Citiesf
(Cough)PM2.5
PM2.5 SulfurH+
1.19 (1.01, 1.42)**
1.23 (0.95, 1.59)**
1.06 (0.87, 1.29)**
18.0 (7.2, 37)***
2.5 (3.1, 61)***
18.1 (0.8, 5.9)***
Six Citiesf
(Lower Resp. Symp.)PM2.5
PM2.5 SulfurH+
1.44 (1.15-1.82)**
1.82 (1.28-2.59)**
1.05 (0.25-1.30)**
18.0 (7.2, 37)***
2.5 (0.8, 5.9)***
18.1 (3.1, 61)***
Decreased lung function
Uniontown, PAg PM2.5 PEFR 23.1 (-0.3, 36.9) (per 25 :g/m3) 25/88 (NR/88)References:aSchwartz et al. (1996a) †Min/Max 24-h PM indicator level shown in parentheses unlessbBurnett et al. (1994) otherwise noted as (± S.D.), 10 and 90 percentile (10,90) cBurnett et al. (1995) O3 or R = range of values from min-max, no mean value reported.dThurston et al. (1992, 1994) *Change per 100 nmoles/m3.eOstro et al (1993) **Change per 20 :g/m3 for PM2.5; per 5 :g/m3 for fSchwartz et al. (1994) PM2.5 sulfur; per 25 nmoles/m3 for H+. gNeas et al. (1995) ***50th percentile value (10,90 percentile).
Source: Adapted from U.S. EPA, 1996b, Table V-12. See U.S. EPA (1996a,b) for all reference citations.

6-24
Table 6-5. Effect estimates per incrementsa in annual average levels of fine particleindicators from U.S. and Canadian studies
Type of healtheffect and location Indicator
Change in health indicatorper increment in PMa
Range of city PM levels
mean (:g/m3)
Increased total chronic mortality in adults Relative risk (95% CI)
Six Cityb PM15/10 1.42 (1.16-2.01) 18-47
PM2.5 1.31 (1.11-1.68) 11-30
SO4= 1.46 (1.16-2.16) 5-13
ACS Studyc
(151 U.S. SMSA)PM2.5 1.17 (1.09-1.26) 9-34*
SO4= 1.10 (1.06-1.16) 4-24
Increased bronchitis in children Odds ratio (95% CI)
Six Cityd PM15/10 3.26 (1.13, 10.28) 20-59
Six Citye TSP 2.80 (1.17, 7.03) 39-114
24 Cityf H+ 2.65 (1.22, 5.74) 6.2-41.0
24 Cityf SO4= 3.02 (1.28, 7.03) 18.1-67.3
24 Cityf PM2.1 1.97 (0.85, 4.51) 9.1-17.3
24 Cityf PM10 3.29 (0.81, 13.62) 22.0-28.6
Southern Californiag SO4= 1.39 (0.99, 1.92) —
Decreased lung function in children
Six Cityd,h PM15/10 NS Changes 20-59
Six Citye TSP NS Changes 39-114
24 Cityi,j H+ (52 nmoles/m3) !3.45% (-4.87, -2.01) FVC —
24 Cityi PM2.1 (15 :g/m3) !3.21% (-4.98, -1.41) FVC —
24 Cityi SO4= (7 :g/m3) !3.06% (-4.50, -1.60) FVC —
24 Cityi PM10 (17 :g/m3) !2.42% (-4.30, -.0.51) FVC —aEstimates calculated annual-average PM increments assume: a 100 :g/m3 increase for TSP; a 50 :g/m3
increase for PM10 and PM15; a 25 :g/m3 increase for PM2.5; and a 15 :g/m3 increase for SO4=, except where
noted otherwise; a 100 nmole/m3 increase for H+.bDockery et al. (1993). gAbbey et al. (1995a,b,c).cPope et al. (1995). hNS Changes = No significant changes.dDockery et al. (1989). iRaizenne et al. (1996). eWare et al. (1986). jPollutant data same as for Dockery et al. (1996).fDockery et al. (1996). *Range of annual median values for subset of 50 cities.
Source: Adapted from U.S. EPA, 1996a, Table 12-6 and U.S. EPA, 1996b, Table V-8. See U.S. EPA (1996a,b) forall reference citations.

4As an initial matter, EPA concluded that the existing PM10 standards were not adequate to protect publichealth, that fine and coarse fraction particles should be considered separately, that PM2.5 was the appropriateindicator to use for fine particles, and that an annual PM2.5 standard could provide the requisite reduction in riskassociated with both annual and 24-h averaging times in most areas of the United States. This annual standard,together with a 24-h standard, could provide supplemental protection against extreme peak fine particle levels that
6-25
likely to be a consequence of cumulative, long-term exposure effects. These effects extendbeyond the additive impacts of short-term exposure episodes, in terms of producing markedincreases above the expected number of daily deaths among especially susceptible groups, suchas the elderly and those with pulmonary disease.
The PM CD (U.S. EPA, 1996a) also highlighted a growing body of evidence directlycomparing fine and coarse fraction PM effects that suggests that fine particles are more stronglyrelated than coarse fraction particles to increased mortality and morbidity in both short- and long-term exposure studies. Such evidence notably includes the results of analyses of the typeillustrated in Figure 6-3 through 6-5. More specifically, Figure 6-3 shows a stronger relationshipbetween changes in short-term (24-h) concentrations of fine particles (indexed by PM2.5) andincreased mortality risks than for changes in short-term concentrations of coarse fraction particles(indexed by PM15-2.5). Similarly, a stronger relationship is seen between chronic mortality andlong-term exposure to fine particles (including both the sulfate and nonsulfate components) thanexposure to coarse fraction particles (Figure 6-4), and a much stronger relationship between lungfunction decrements and long-term exposure to fine particles than to coarse fraction particles(Figure 6-5).
6.4.2. NAAQS for Fine PMThe health effects evidence discussed above is relevant to this current HAD, as both this
document (Chapter 2) and the PM CD present information that clearly shows DPM to be aconstituent of ambient fine particles. Therefore, it is reasonable to conclude that DPM isassociated, but to an undetermined degree, with the health effects described above. Whereasbroader public health factors are taken into account in setting NAAQS than are relevant for thisnoncancer assessment of lifetime exposure for DPM, the annual PM2.5 NAAQS based primarilyon this evidence is of interest in considering the extent to which the RfC for DE (as derivedabove in Section 6.3) is concordant with the information on fine particles.
As presented in the Federal Register final rule notice (62 FR 38652, July 18, 1997), EPA drew upon the quantitative epidemiology information concisely summarized above to derive arationale for selection of an annual-average PM2.5 standard.4 First, to appropriately reflect the

might occur in some localized situations or in areas with distinct variations in seasonal fine particle levels (62 FR38652).
6-26
Topeka
Portage
Steubenville
St. Louis
Harriman
Boston
—
—
—
—
—
0.9 1 1.1
Relative Risk for 50 g/m PMin Six City Acute Study
315µ
Relative Risk
Topeka
Portage
Steubenville
St. Louis
Harriman
Boston
—
—
—
—
—
0.9 1 1.1
Relative Risk for 25 g/m Fine Particles(PM ) in Six City Acute Study
3
2.5
µ
Relative Risk
Topeka
Portage
Steubenville
St. Louis
Harriman
Boston
—
—
—
—
—
0.9 1 1.1
Relative Risk for 25 g/m Coarse Particles(Pm – PM ) in Six City Acute Study
3
15 2.5
µ
Relative Risk
Figure 6-3. Relative risks of acute mortality in Harvard Six Cities Study, for inhalablethoracic particles (PM15/PM10), fine particles (PM2.5), and coarse fractionparticles (PM15-PM2.5).
Note: The coarse fraction effects are smaller and statistically nonsignificant (i.e., lower 95% confidence intervals donot exceed relative risk of 1.0), except in Steubenville where there is high correlation between fine and coarseparticles (R2 = 0.69).
Source: PM CD (U.S. EPA, 1996a) graphical depiction of results from Schwartz et al. (1996).

6-27
Figure 6-4. Adjusted relative risks for mortality are plotted against each of seven long-term average particle indices in the Harvard Six Cities Study, from largestrange (total suspended particles, upper right) through sulfate and nonsulfatefine particle concentrations (lower left).
Note: A relatively strong linear relationship is seen for fine particles, and for sulfate and nonsulfate components. Topeka, which has a substantial coarse particle component of inhalable (thoracic) particle mass, stands apart fromthe linear relationship between relative risk and inhalable particle concentration.Source: U.S. EPA (1996a) replotting of results from Dockery et al. (1993).
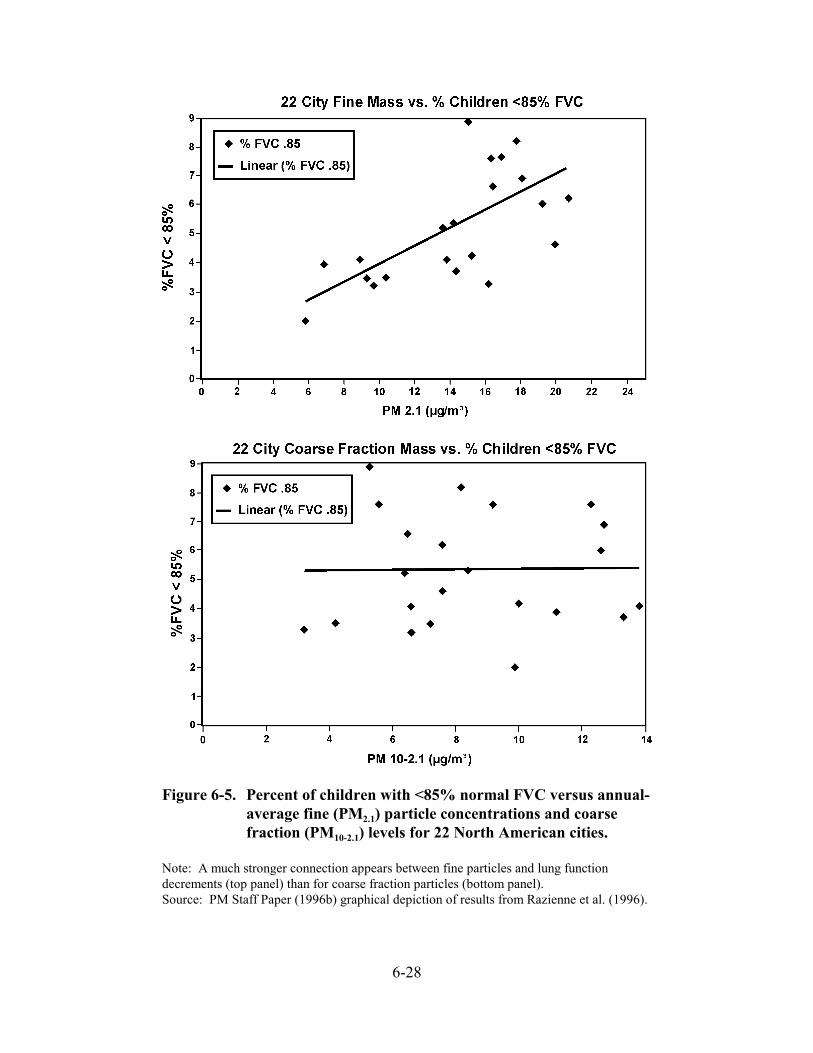
6-28
Figure 6-5. Percent of children with <85% normal FVC versus annual-average fine (PM2.1) particle concentrations and coarsefraction (PM10-2.1) levels for 22 North American cities.
Note: A much stronger connection appears between fine particles and lung functiondecrements (top panel) than for coarse fraction particles (bottom panel). Source: PM Staff Paper (1996b) graphical depiction of results from Razienne et al. (1996).
6-29
weight of evidence as a whole, EPA concluded that it was appropriate to limit annual PM2.5
concentrations to somewhat below those where the body of epidemiological evidence is mostconsistent and coherent, recognizing both the strengths and limitations of the full range ofinformation on the health effects of PM, as well as associated uncertainties. In accordance withEPA staff and CASAC views on the relative strengths of the epidemiologic studies, majorreliance was placed on several short-term (24-h) exposure studies showing significantlyincreased risks of daily mortality (Schwartz et al., 1996) and morbidity indexed by hospitaladmissions (Thurston et al., 1994) and respiratory symptoms/lung function decrements inchildren (Schwartz et al., 1994; Neas et al., 1995) in relationship to increased fine particle (PM2.5)concentrations. Whereas it was recognized that health effects may occur over the full range ofconcentrations observed in these studies, it was concluded that the strongest evidence for short-term PM2.5 effects occurs at concentrations near the long-term (e.g., annual) average. Morespecifically, the strength of the evidence of effects increases for concentrations of PM2.5 that areat or above the long-term mean levels reported for these studies. Given the serious nature of thepotential effects, EPA judged that it was both prudent and appropriate to select a level for anannual standard at or below such concentrations. More specifically, statistically significantincreases in relative risks for daily mortality or morbidity were most clearly observed in thesestudies to be associated with 24-h fine particle concentrations in cities with long-term mean fineparticle concentrations ranging from about 16 to about 21 :g/m3, leading to the judgment that anannual standard level of 15 :g/m3 would be appropriate.
Before reaching a final conclusion, the epidemiologic studies of long-term exposures tofine particles were also considered, which may reflect the accumulation of daily effects over timeas well as potential effects uniquely associated with long-term exposures. Even subject toadditional uncertainties, these studies were judged to provide important insights with respect tothe overall protection afforded by an annual standard. In particular, the annual mean PM2.5
concentrations for the multiple cities included in the two key long-term exposure mortalitystudies (Dockery et al., 1993; Pope et al., 1995) were 18 :g/m3 and about 21–22 :g/m3,respectively, with most of the 50 cities in the Pope, et al. (1995) having mean PM2.5
concentrations above 15 :g/m3. Taken together with other long-term exposure studies andconsidering other factors discussed in the final rule (62 FR 38676, July 18, 1997), EPAconcluded that the concordance of evidence for PM effects and associated levels provides clearsupport for an annual standard set at 15 :g/m3.
6-30
6.4.3. DPM as a Component of Fine PMChapter 2 of this document, as well as the PM CD (U.S. EPA, 1996a), report the extent to
which DPM may contribute to ambient PM2.5 concentrations. In some urban situations, theannual average fraction of PM2.5 attributable to DPM (according to mass concentrations) is about35% on the high end, although the proportion appears to be more typically in the range of about10% (see Chapter 2, Table 2-23 and Section 2.4.2.1).
An approach to considering the relationship of toxicity between DPM and PM2.5 would besimply to assume that, as DPM is contributory to the content of ambient PM2.5, so too would it becontributory to toxicity of PM2.5. This approach is qualitative only because no firm basiscurrently exists for apportioning toxicity among the various components of PM2.5. Nevertheless,some qualitative information from laboratory animal studies does exist, showing that DPM is nomore potent at eliciting pulmonary pathology than other poorly soluble particles such as talc,titanium dioxide, or carbon black in rats, or talc or titanium dioxide in mice. No data suggestthat DPM is any more potent in eliciting pulmonary pathology than any other poorly solubleparticle that typically may be present in ambient PM2.5. It may be reasonable to suggest, then,that DPM is no more likely to be toxicologically potent than any other fine particle constituentsthat typically make up ambient PM2.5.
Based on the foregoing aspects of such an approach, a conclusion could be drawn that aslong as DPM constituted its current approximate proportion to PM2.5, the annual PM2.5 standardwould also be expected to provide a measure of protection for DPM. Even if a basis did exist toapportion toxicity among the various components of ambient PM2.5, such as DPM, use of suchinformation in an approach to derive a safe air level for DPM would result in only a generalized,nonspecific estimate limited by a variety of factors including the accuracy of the apportionmentof DPM from PM2.5. The RfC derived in Section 6.3 was based on an approach that utilizedtoxicological information from actual DPM exposures, a more direct approach that would resultin a more specific estimate not limited by any apportionment scheme.
6.5. CHARACTERIZATION OF THE NONCANCER ASSESSMENT FOR DIESELEXHAUST
Adverse health effects from short-term acute (high-level) exposures to DE such asoccupational reports of decreases in lung function, wheezing, chest tightness, increases in airwayresistance, and reports in laboratory animals of inflammatory airway changes and lung functionchanges are acknowledged but are not assessed quantitatively. The focus of this dose-responseassessment is on the adverse noncancer health consequences of a lifetime, low-level, continuousair exposure by humans to DE.

6-31
This assessment uses the whole particle, termed DPM, as the key index or measure of DEdose. DPM includes any and all adsorbed organics, among which are a large number of PAHs,heterocyclic compounds, and their derivatives (Chapter 2), as well as the carbon core. It is notpossible to separate the carbon core of DPM from the adsorbed organics to compare the toxicityin exposures other than with limited in-vitro-type scenarios. The dosimetric model used in thederivation of the RfC (Yu et al., 1991) is consistent with this designation, as it considers DPM aswell as the adsorbed organics as two types, slow-cleared and fast-cleared. Studies with diesel dooccasionally report levels of accompanying gaseous components of DE (e.g., NOx, CO), butnearly all report particle concentration and characteristics.
Adverse responses occurring in the rat lung have been used in this assessment as the basisfor characterizing nonneoplastic human lung responses, yet use of these data in hazard evaluationfor cancer is not considered relevant to humans. The basis for this use of these noncancerpulmonary effects in rats for derivation of an RfC includes the fact that humans and rats exhibitsimilar responses to other poorly soluble particles and also that similar noncancer effects are seenin other species (ILSI, 2000; Freedman and Robinson, 1988). Thus, when viewed across species(including humans), the nonneoplastic pulmonary effects of inflammation and fibrosis used inthis assessment are dissociable from the cancer response and are of likely relevance to humans.
As a part of the RfC methodology (U.S. EPA, 1994), dose-response assessments areassigned levels of confidence that are intended to reflect the strengths and limitations of anassessment as well as to indicate the likelihood of the assessment changing with any additionalinformation. Confidence levels of either low, medium, or high are assigned both to the study (orstudies) used in the assessment to characterize the critical effects and to the overall toxicologicaldatabase of the substance. An overall confidence level also is assigned to the entire assessment.Usually, it is the same, or in any case no higher than the level assigned to the database.
Compared with the databases of most other toxicants, the basic toxicological database forDE is substantial. The critical effects are characterized using not one but multiple long-termchronic studies conducted independently of one another (Tables 6-1 and 6-2). The exhaustivemanner in which these studies were conducted and reported also imparts a high degree ofconfidence. Both developmental and reproductive areas are addressed. Also, ancillary studiesthat address mechanistic aspects of DE toxicity, either as the whole particle with adsorbedorganics, or segregated as a poorly soluble particle and extracted organics, are available and usedin this assessment. Although only limited human data are available, extensive consideration hasbeen given to the relevancy of the animal studies to the human condition. On the other hand,data from related toxicants such as general ambient PM indicate effects in endpoints (e.g.,cardiovascular measures) that have not been addressed in the DPM database. A major point to

6-32
consider in assigning confidence in this assessment, and a reason that the value of the RfC maychange in the future, is the emerging issue of allergenicity caused or exacerbated by DE. Although information to evaluate allergenicity in parallel to the present effects (pulmonaryinflammation and histopathology) is currently lacking, future efforts to elucidate and characterizethis effect may well be a driver to make a reevaluation of the noncancer RfC derivation for DEappropriate. With respect to the current RfC for DE, the confidence level is medium, both for thedatabase and overall. The level reflects the relevance of (and information lacking on)allergenicity effects associated with DE in humans, and the possibility that the current RfC couldchange as a consequence of this information becoming available from the scientific community.
In the introductory portion of this chapter, DPM is acknowledged as a constituent ofambient PM (U.S. EPA, 1996a,b). A discussion of the quantitative epidemiology, particularlyregarding fine PM, indicated that public health effects, including premature mortality, increasedhospital admissions, respiratory symptoms, and decreased lung function, were observed inpopulations living in areas with long-term mean PM2.5 levels generally ranging above 15 :g/m3. Application of the RfC method, which involved critical consideration of the entirety of thedisparate DE database with many chronic studies from several different species, evaluation of amyriad of possible DE-specific toxicological endpoints, and use of extrapolation models,produced a value of 5 :g/m3. As the accuracy of the RfC is stated in the definition (“...within anorder of magnitude ...”), this dose-response estimate could be considered to be not different fromthe level of 15 :g/m3, the lower end of the range identified for PM2.5. It is acknowledged hereagain that the levels of the PM2.5 NAAQS should not be considered as indicative of the samedegree of health protection for DE as intended by the RfC. Nevertheless, the congruence of theseestimates tends to enhance the overall confidence that this range of levels is near or inclusive ofthose that would be expected to be protective of the human population against the health effectsof DE.
6.6. SUMMARYTable 6-6 summarizes the key data and factors used in the dose-response analysis leading
to the derivation of the RfC for DE. The DE RfC of 5 :g DPM/m3 is a chronic exposure likely tobe without an appreciable risk of adverse human health effects.
The link between ambient fine PM and DPM with respect to origin, content, and possiblehealth effects has been presented and discussed in this chapter, and the general congruencebetween the DE RfC and the level of the annual NAAQS for fine particles has been noted. Although these values should not be compared directly, it is reasonable to observe that the annualPM2.5 standard would be expected to provide a measure of protection for DPM, reflecting DPM’s

6-33
Table 6-6. Decision summary for the quantitative noncancer RfC assessment forcontinuous exposure to diesel particulate matter (DPM)
Quantitative assessment for noncancer effects fromlifetime exposure to DPM 5 :g/m3
Critical effect Pulmonary inflammation andhistopathology in rats
Principal study Array of four chronic rat studies
Designated basis for quantitation (exposures in rats) 0.46 mg DPM /m3, 16 hr/day, 6d/wk, 130 wks; a NOAEL
NOAELHEC (HEC) 0.144 mg DPM / m3
Adjustments for uncertainty factors (interspeciesvariability and intraspecies extrapolation)
30
NOAELHEC/UF = RfC 0.144 mg/m3 / 30 = 5 :g/m3
current approximate proportion to PM2.5.The estimated air concentration of 5 :g/m3 (the RfC, a lifetime exposure to DE measured
as DPM) is above the ambient air levels reported in most rural areas but could be below thoselevels reported under short-term conditions in some urban scenarios, such as at busy intersectionsor bus stops (see Chapter 2, Table 2-23). The RfC is intended to address lifetime chronicexposures and aspects of time-averaging for less than lifetime scenarios, such as, for example,acute exposures at busy intersections or bus stops, which are not addressed in this particularassessment.
REFERENCES FOR CHAPTER 6
Abbey, DE; Mills, PK; Petersen, FF; et al. (1991) Long-term ambient concentrations of total suspended particulatesand oxidants as related to incidence of chronic disease in California Seventh-Day Adventists. Environ HealthPerspect 94:43-50.
Abbey, DE; Hwang, BL; Burchette, RJ; et al. (1995) Estimated long-term ambient concentrations of PM10 anddevelopment of respiratory symptoms in a nonsmoking population. Arch Environ Health 50:139-152.
Barnes, DG; Dourson, M. (1988) Reference dose (RfD): description and use in health risk assessments. RegulToxicol Pharmacol 8:471-486.
Barnes, DG; Daston, GP; Evans, JS; et al. (1995) Benchmark dose workshop: criteria for use of a benchmark dose toestimate a reference dose. Regul Toxicol Pharmacol 21:296-306.

6-34
Barnhart, MI; Chen, S-T; Salley, SO; et al. (1981) Ultrastructure and morphometry of the alveolar lung of guineapigs chronically exposed to diesel engine exhaust: six months’ experience. J Appl Toxicol 1:88-103.
Barnhart, MI; Salley, SO; Chen, S-T; et al. (1982) Morphometric ultrastructural analysis of alveolar lungs of guineapigs chronically exposed by inhalation to DE (DE). In: Toxicological effects of emissions from diesel engines:proceedings of the Environmental Protection Agency diesel emissions symposium; Lewtas, J., ed. October, 1981;Raleigh, NC. New York: Elsevier Biomedical; pp. 183-200. (Developments in toxicology and environmentalscience: v. 10).
Bhatnagar, RS; Hussain, MZ; Sorensen, KR; et al. (1980) Biochemical alterations in lung connective tissue in ratsand mice exposed to diesel emissions. In: Health effects of diesel engine emissions: proceedings of an internationalsymposium. Pepelko, WE; Danner, RM; Clarke, NA., eds., v. 1; December 1979; Cincinnati, OH. Cincinnati, OH:U.S. Environmental Protection Agency, Health Effects Research Laboratory; pp. 557-570; EPA report no.EPA-600/9-80-057a. Available from: NTIS, Springfield, VA; PB81-173809.
Dockery, DW; Pope, CA, III; Xu, X; et al. (1993) An association between air pollution and mortality in six U.S.cities. N Engl J Med 329:1753-1759.
Freedman, AP; Robinson, SE. (1988) Noninvasive magnetopneumographic studies of lung dust retention andclearance in coal miners. In: Respirable dust in the mineral industries: health effects, characterization, and control:proceedings of the international symposium on respirable dust in the mineral industries; October 1986; UniversityPark, PA. Frantz, RL; Ramani, RV., eds. University Park, PA: Pennsylvania State University Press; pp. 181-186.
Heinrich, U; Peters, L; Funcke, W; et al. (1982) Investigation of toxic and carcinogenic effects of DE in long-terminhalation exposure of rodents. In: Toxicological effects of emissions from diesel engines: proceedings of theEnvironmental Protection Agency diesel emissions symposium; October 1981; Raleigh, NC. Lewtas, J., ed. NewYork: Elsevier Biomedical; pp. 225-242. (Developments in toxicology and environmental science: v. 10).
Heinrich, U; Muhle, H; Takenaka, S; et al. (1986) Chronic effects on the respiratory tract of hamsters, mice, and ratsafter long-term inhalation of high concentrations of filtered and unfiltered diesel engine emissions. J Appl Toxicol6:383-395.
Heinrich, U; Fuhst, R; Rittinghausen, S; et al. (1995) Chronic inhalation exposure of Wistar rats and two differentstrains of mice to diesel engine exhaust, carbon black, and titantium dioxide. Inhal Toxicol 7:533-556.
Henderson, RF; Pickrell, JA; Jones, RK; et al. (1988) Response of rodents to inhaled diluted DE: biochemical andcytological changes in bronchoalveolar lavage fluid and in lung tissue. Fundam Appl Toxicol 11:546-567.
Hyde, DM; Plopper, CG; Weir, AJ; et al. (1985) Peribronchiolar fibrosis in lungs of cats chronically exposed to DE.Lab Invest 52:195-206.
International Life Sciences Institute Risk Science Institute Workshop Participants (ILSI). (2000) The relevance ofthe rat lung response to particle overload for human risk assessment: a workshop consensus report. In: ILSI RiskScience Institute Workshop: the relevance of the rat lung response to particle overload for human risk assessment;March 1998. Gardner, DE., ed. Inhal Toxicol 12:1-17.
Ishinishi, N; Kuwabara, N; Nagase, S; et al. (1986) Long-term inhalation studies on effects of exhaust from heavyand light duty diesel engines on F344 rats. In: Carcinogenic and mutagenic effects of diesel engine exhaust:proceedings of the international satellite symposium on toxicological effects of emissions from diesel engines; July;Tsukuba Science City, Japan. Ishinishi, N; Koizumi, A; McClellan, RO; et al., eds. Amsterdam, Holland: ElsevierScience Publishers B.V.; pp. 329-348. (Developments in toxicology and environmental science: v. 13).
6-35
Ishinishi, N; Kuwabara, N; Takaki, Y; et al. (1988) Long-term inhalation experiments on DE. In: DE and healthrisks: results of the HERP studies. Tsukuba, Ibaraki, Japan: Japan Automobile Research Institute, Inc., ResearchCommittee for HERP Studies; pp. 11-84.
Iwai, K; Udagawa, T; Yamagishi, M; et al. (1986) Long-term inhalation studies of DE on F344 SPF rats. Incidenceof lung cancer and lymphoma. In: Carcinogenic and mutagenic effects of diesel engine exhaust: proceedings of theinternational satellite symposium on toxicological effects of emissions from diesel engines; July; Tsukuba ScienceCity, Japan. Ishinishi, N; Koizumi, A; McClellan, RO; et al., eds. Amsterdam, Holland: Elsevier Science PublishersB. V; pp. 349-360. (Developments in toxicology and environmental science: v. 13).
Johnston, CJ; Finkelstein, JN; Mercer, P, et al. (2000) Pulmonary effects induced by ultrafine PTFE particles. Toxicol Appl Pharmacol 168:208-215.
Lewis, TR; Green, FHY; Moorman, WJ; et al. (1989) A chronic inhalation toxicity study of diesel engine emissionsand coal dust, alone and combined. J Am. Coll Toxicol 8:345-375.
Mauderly, JL; Jones, RK; Griffith, WC; et al. (1987a) DE is a pulmonary carcinogen in rats exposed chronically byinhalation. Fundam. Appl Toxicol 9:208-221.
Mauderly, JL; Bice, DE; Carpenter, RL; et al. (1987b) Effects of inhaled nitrogen dioxide and DE on developinglung. Cambridge, MA: Health Effects Institute; research report no. 8.
Mauderly, JL; Bice, DE; Cheng, YS; et al. (1989) Influence of experimental pulmonary emphysema on toxicologicaleffects from inhaled nitrogen dioxide and diesel exhaust. Cambridge, MA: Health Effects Institute; report no. HEI-RR-89/30. Available from: NTIS, Springfield, VA; PB90-247347.
National Research Council (NRC). (1983) Risk assessment in the federal government: managing the process.Washington, DC: National Academy Press.
Neas, LM; Dockery, DW; Koutrakis, P; et al. (1995) The association of ambient air pollution with twice daily peakexpiratory flow rate measurements in children. Am. J Epidemiol 141:111-122.
Nightingale, JA; Maggs, S; Cullinan, P; et al. (2000) Airway inflammation after controlled exposure to dieselexhaust particulates. Am.J Respir Crit Care Med 162(1):161-166.
Nikula, KJ; Snipes, MB; Barr, EB; et al. (1995) Comparative pulmonary toxicities and carcinogenicities ofchronically inhaled DE and carbon black in F344 rats. Fundam Appl Toxicol 25:80-94.
Nordenhall, C; Pourazar, J; Blomberg, A; (2000) Airway inflammation following exposure to diesel exhaust: a studyof time kinetics using induced sputum. Eur Respir J 15(6):1046-1051.
Oberdörster, G; Finkelstein, JN; Johnston, CJ; (2000) Ultrafine particles as inducers of acute lung injury;mechanisms and correlation with disease and age. Health Effects Institute 96:1-88.
Pepelko, WE. (1982a) Effects of 28 days exposure to diesel engine emissions in rats. Environ Res 27:16-23.
Pepelko, WE. (1982b) EPA studies on the toxicological effects of inhaled diesel engine emissions. In: Toxicologicaleffects of emissions from diesel engines: proceedings of the Environmental Protection Agency diesel emissionssymposium; October 1981; Raleigh, NC. Lewtas, J., ed. New York: Elsevier Biomedical; pp. 121-142.(Developments in toxicology and environmental science: v. 10).
Plopper, CG; Hyde, DM; Weir, AJ. (1983) Centriacinar alterations in lungs of cats chronically exposed to DE. LabInvest 49:391-399.
6-36
Pope, CA, III; Thun, MZ; Namboodiri, MM; et al. (1995) Particulate air pollution as a predictor of mortality in aprospective study of U.S. adults. Am J Respir Crit Care Med 151:669-674.
Raizenne, M; Neas, LM; Damokosh, AI; et al. (1996) Health effects of acid aerosols on North American children:pulmonary function. Environ Health Perspect 104:506-514.
Renwick, AG; Lazarus, NR. (1998) Human variability and noncancer risk assessment—an analysis of the defaultuncertainty factor. Regul Toxicol Pharmacol 27:3-20.
Salvi, S; Blomberg,A; Rudell, B; et al. (1999) Acute inflammatory responses in the airways and peripheral bloodafter short-term exposure to diesel exhaust in healthy human volunteers. Am J Respir Crit Care Med 159 (3):702-709.
Salvi, SS; Nordenhall,C; Blomberg, A; et al. (2000) Acute exposure to diesel exhaust increases IL-8 and GRO-alphaproduction in healthy human airways. Am J Respir Crit Care Med 161:550-557.
Schwartz, J; Dockery, DW; Neas, LM; Wypij, D; Ware, JH; Spengler, JD; Koutrakis, P; Speizer, FE; Ferris, BG, Jr.(1994) Acute effects of summer air pollution on respiratory symptom reporting in children. Am. J. Respir. Crit. CareMed. 150: 1234-1242.
Schwartz, J; Dockery, DW; Neas, LM. (1996) Is daily mortality associated specifically with fine particles? J AirWaste Manage Assoc 46:927-939.
Thurston, GD; Ito, K; Hayes, CG; et al. (1994) Respiratory hospital admissions and summertime haze air pollution inToronto, Ontario: consideration of the role of acid aerosols. Environ Res 65:271-290.
U.S. Environmental Protection Agency (U.S. EPA). (1994) Methods for derivation of inhalation referenceconcentrations and application of inhalation dosimetry [draft final]. Research Triangle Park, NC: Office of Healthand Environmental Assessment, Environmental Criteria and Assessment Office; report no. EPA/600/8-88/066F.
U.S. EPA. (1995) The use of the benchmark dose approach in health risk assessment. Washington, DC: U.S. EPA,Risk Assessment Forum; report no. EPA/630/R-94/007. Available from: NTIS, Springfield, VA;PB95-213765/XAB.
U.S. EPA. (1996a) Air quality criteria for particulate matter. Research Triangle Park, NC: National Center forEnvironmental Assessment-RTP Office; report nos. EPA/600/P-95/001aF-cF. 3v.
U.S. EPA. (1996b) Review of the national ambient air quality standards for particulate matter: policy assessment ofscientific and technical information. OAQPS staff paper. Research Triangle Park, NC: Office of Air QualityPlanning and Standards; report no. EPA/452/R-96-013. Available from: NTIS, Springfield, VA; PB97-115406REB.
Vostal, JJ; Chan, TL; Garg, BD; et al. (1981) Lymphatic transport of inhaled diesel particles in the lungs of rats andguinea pigs exposed to diluted DE. Environ Int 5:339-347.
Yu, CP; Yoon, KJ. (1990) Retention modeling of DE particles in rats and humans. Amherst, NY: State University ofNew York at Buffalo (Health Effects Institute research report no. 40).
Yu, CP; Yoon, KJ; Chen, YK. (1991) Retention modeling of DE particles in rats and humans. J Aerosol Med4:79-115.

1As noted in Chapter 6, a new PM CD is now being prepared to reflect the latest scientific studies on
ambient PM available since the last document was completed.
7-1
7. CARCINOGENICITY OF DIESEL EXHAUST
7.1. INTRODUCTION
Initial health hazard concerns regarding the potential carcinogenicity of diesel engine
exhaust (DE) were based on the reported induction of skin papillomas by diesel particle extracts
(Kotin et al., 1955), evidence for mutagenicity of extracts (Huisingh et al., 1978), evidence that
components of diesel extract act as weak tumor promoters (Zamora et al., 1983), and the
knowledge that diesel particles and their associated organics are respirable. During the 1980s,
both human epidemiologic studies and long-term animal cancer bioassays were initiated. In
1981, Waller published the first epidemiologic investigation, a retrospective mortality study of
London transport workers. Since then a large number of retrospective cohort and case-control
studies have been carried out with railroad workers, dockworkers, truck drivers, construction
workers, miners, and bus garage employees. During 1986 and 1987, several chronic animal
cancer bioassays were published. These studies and numerous laboratory investigations carried
out since then have been directed toward assessing the carcinogenic potential of whole exhaust,
evaluating the importance of various exhaust components in the induction of cancer, and
understanding the mode of action and implications of deposition, retention, and clearance of DE
particles.
7.1.1. Overview
This chapter evaluates the carcinogenic potential of DE in both humans (Section 7.2) and
animals (Section 7.3), discusses mode(s) of action (Section 7.4), and provides an overall weight-
of-evidence evaluation (Section 7.5) for carcinogenicity in humans. This chapter also
summarizes evaluations of DE conducted by other organizations (Section 7.6) and the final
conclusions (Section 7.7) identify major uncertainties for which additional research is needed.
This assessment focuses on DE, although it should be noted that diesel particles make up a
portion of ambient particulate matter (PM) (Chapter 2, Section 2.2.3; Chapter 6, Section 6.4.3),
and thus, the ambient PM data may have some relevance.
7.1.2. Ambient PM-Lung Cancer Relationships
A brief overview of the data regarding exposure to ambient PM and lung cancer is
provided as background information and is based on analyses contained in the 1996 Air Quality
Criteria for PM (PM CD) (U.S. EPA, 1996a).1 With DE being part of ambient PM, the question

7-2
of what is seen in the ambient PM data is of interest, as epidemiologic evidence for an effect of
ambient PM on lung cancer mortality or incidence could possibly contribute to evaluation of
DE-specific epidemiologic data.
Chapters 2 and 5 noted that DPM, consisting mostly of fine particles (<1.0 mm
diameter), represents a toxicologically important component of typical ambient fine particle
mixes. As discussed in Chapter 6, several large-scale prospective studies (Harvard Six Cities
Study; American Cancer Society (ACS) Study; Adventist Health Study of Smog (AHSMOG)
provide important evidence regarding associations between chronic exposures to ambient fine
particles and increased risks of noncancer mortality/morbidity effects (e.g., cardiorespiratory-
related deaths or hospital admissions) (U.S. EPA, 1996a). As summarized below, these same
studies also evaluated relationships between chronic PM exposures and lung cancer mortality
and/or incidence.
As an initial matter, both the Harvard Six Cities Study (Dockery et al., 1993), of
approximately 8,000 adults in six cities comprising a transect across the northcentral and
northeastern United States, and the ACS Study (Pope et al., 1995), of 550,000 adults in 151
cities across all U.S. geographic regions, found markedly increased relative risks (RR) of lung
cancer mortality associated with smoking. More specifically, the Six City Study reported
increased risks of smoking for current (RR = 8.00, 95% CI = 2.97-21.6) and former (RR = 2.54,
CI = 0.90-7.18) smokers, with the ACS Study reporting striking similar increased risks for
current smokers (RR = 9.73, 95% CI = 5.96-15.9).
After controlling for smoking and other risk factors, both the Six Cities Study and the
ACS Study (using a subset of 50 of the 151 cities) evaluated relationships between long-term
exposure to fine PM (indexed by PM2.5), from the least to the most polluted of the cities in each
study, and lung cancer mortality. In both studies, lung cancer mortality risks were not
statistically significantly associated with ambient PM2.5 concentrations in combined analyses of
data for both males and females (RR = 1.37, 95% CI = 0.81-2.31, in the Six Cities Study; RR =
1.03, 95% CI = 0.80-1.33, in the ACS Study). Also, lung cancer mortality risks were not
statistically significantly associated with ambient PM2.5 concentrations in the ACS Study for
smaller sample size subgroups broken out by sex and smoking status. In addition, analyses of
data from the AHSMOG series of studies, of 6,338 nonsmoking long-term California adult
residents, found no statistically significant associations between PM2.5 (estimated from visibility
data) and lung cancer mortality or total mortality (Abbey et al., 1995); further, no such
associations were reported for PM10 (estimated from total suspended particulate matter [TSP]
data) in the same study. Earlier AHSMOG analyses (Abbey et al., 1991) reported no statistically
significant associations between TSP (which includes not only fine PM but also larger coarse-

7-3
mode particles ranging up to 25-50 :m) and respiratory cancer for either sex (only respiratory
symptoms and any-site female cancers were reported to be associated with TSP in this study).
The ACS Study and the later AHSMOG analyses (Abbey et al., 1995) also evaluated
relationships between long-term exposures to sulfates (SO4) (which are predominantly but not
exclusively found in fine-mode particles, and can be considered an index for ambient fine
particles) and lung cancer mortality. The ACS Study reported somewhat elevated and
statistically significant lung cancer risk (RR = 1.36, 95% CI = 1.11-1.66) across 151 cities in
combined analyses of data for both males and females. However, in further analyses of
subgroups broken out by sex and smoking status (and thus having smaller sample sizes in each
than for the above overall combined analyses), only the lung cancer mortality risks for male
“ever-smokers” (RR = 1.44, 95% CI = 1.14-1.83) were statistically significant; no statistically
significant relationships were reported for male “never-smokers” (RR = 1.36, 95% CI = 0.40 -
4.66), for female “ever-smokers” (RR = 1.10, 95% CI = 0.72-1.68), or for female “never-
smokers” (RR = 1.61; 95% CI = 0.66 -3.92). In the later AHSMOG analyses, Abbey et al.
(1995) found no statistically significant associations between sulfates and lung cancer or total
mortality.
In summary, the three key prospective cohort studies summarized above, and discussed
in more detail in the 1996 PM CD (U.S. EPA, 1996a), provide an equivocal array of results with
regard to possible associations between chronic exposures to ambient PM and lung cancer
mortality and/or incidence. None of the analyses of fine particles (as indexed by PM2.5) in these
three studies reported statistically significant relationships between long-term PM2.5
concentrations and lung cancer mortality. Only the ACS Study found a statistically significant
association of increased risk of lung cancer with one indicator of ambient fine particles
(sulfates). Overall, then, these studies support a conclusion that there continues to be little
epidemiologic evidence for an effect of ambient PM on lung cancer mortality or incidence. It is
recognized, however, that subsequent AHSMOG analyses and other studies, published since
completion of the 1996 PM CD, have further analyzed relationships between ambient PM and
lung cancer. Results from these more recent studies are now being evaluated as part of the
integrated assessment of ambient PM that will be part of the new PM CD targeted for
completion in 2002.
7.2. EPIDEMIOLOGIC STUDIES OF THE CARCINOGENICITY OF
EXPOSURE TO DIESEL EXHAUST
An increased risk from malignancies of the lung, bladder, and lymphatic tissue has been
reported in populations potentially exposed to higher levels of DE than typically seen in the
environment. A few authors have reported other malignancies, including testicular cancer
7-4
(Garland et al., 1988), gastrointestinal cancer (Balarajan and McDowall, 1988; Guberan et al.,
1992), and prostate cancer (Aronsen et al., 1996). A detailed review of 22 lung cancer studies is
presented in this section; a few more studies exist, but these 22 are judged to be the key ones. A
detailed review of other health effect studies is not presented because findings are equivocal.
Excess risk of bladder cancer has been reported in several studies (Howe et al., 1980;
Wynder et al., 1985; Hoar and Hoover et al., 1985; Silverman et al., 1983; Vineis and Magnani
1985; Silverman et al., 1986; Jensen et al., 1987; Steenland et al., 1987; Isocovich et al., 1987;
Risch et al., 1988; Iyer et al., 1990; Steineck et al., 1990; Cordier et al., 1993; Notani et al.,
1993). Very few studies found significant excesses after adjustment for cigarette smoking.
Most studies failed to show any association between exposure to DE and occurrence of bladder
cancer. Some authors have reported excess mortality from lymphohematopoietic system cancers
in people potentially exposed to diesel fumes. Rushton and Alderson (1983) and Howe and
Lindsay (1983) found increased mortality from lymphatic neoplasms. Balarajan and McDowall
(1983) found raised mortality for malignant lymphomas. Flodin et al. (1987) observed increased
risk for multiple myeloma, and Bender et al. (1989) reported excess mortality from leukemia.
Because evidence for bladder cancer and lymphohematopoietic cancer was found to be
equivocal, detailed reviews of these studies are not presented here.
The potential for elevated DE exposure in the occupational setting generally includes
miners, railroad workers, truckers, bus and taxi drivers, heavy equipment operators, farm tractor
drivers, and those involved with heavy duty marine engines. Regarding the mining industry
some assert that excess lung cancer should be observed in the miners if exposure to DE is
causally associated with the occurrence of lung cancer since DE is allegedly present in the
mines. Our review of the mining industry data dose not support this assertion for the following
reasons. In the United States, the introduction of diesel engines into metal mines dates from the
early to the mid 1960s. Currently, there are approximately 265 underground metal/nonmetal
mines in the United States. Virtually all of these mines use diesel powered equipment for
various tasks, such as haulage, roof bolting etc. (Department of Labor, Mine Safety and Health
Administration, 2001). Introduction of diesel equipment into coal mines was even later. Of 910
existing underground coal mines in the United States, only 145 currently use diesel-powered
equipment. Of these 145 mines, 32 mines are currently using diesel equipment for face coal
haulage. The remaining mines use diesel equipment for transportation, materials handling, and
other support operations (Department of Labor, Mine Safety and Health Administration, 2001).
It should be noted that there is a paucity of epidemiologic studies in miners where exposure to
DE and health effects are explored. Furthermore, the majority of epidemiologic studies in
miners do not mention exposure to diesel equipment use. Thus, it is impossible to know how
many miners were exposed to DE and for how long and at what concentrations in a given study,

7-5
if any. Hence the studies in miners (coal, metal, and nonmetal with the exception of potash
miners) are not reviewed in this chapter, because the available studies are uninformative relative
to DE.
In this section, various mortality and morbidity studies of lung cancer from potential
exposure to diesel engine emissions are reviewed. Although an attempt was made to cover all
the relevant studies, a number of studies are not included for several reasons. In the United
States the change from steam to diesel engines in locomotives began after World War II. By
1946 about 10% of the locomotives in service were diesel, by 1952 55% were diesel, and
dieselization was about 95% complete by 1959 (Garshick et al., 1988). Therefore, exposure to
DE was less common, and the follow-up period for studies conducted prior to 1960 (Raffle,
1957; Commins et al., 1957; Kaplan, 1959) was not long enough to cover the long latency
period of lung cancer. The usefulness of these studies in evaluating the carcinogenicity of DE is
greatly reduced; thus, they are not considered here.
On the other hand, the trucking industry changed to diesel trucks by the 1960s. In the
1960s sales of diesel-powered Class 8 trucks (long-haul trucks) were 48% of the market, and by
the 1970s sales had risen to 85%. Thus, studies conducted among truck drivers prior to the
1970s may reflect exposures to gasoline exhaust as well as DE. Hence, studies with ambiguous
exposures or studies that examined several occupational risk factors were excluded because they
would have contributed little to the evaluation of the carcinogenicity of DE (Waxweiler et al.,
1973; Williams et al., 1977; Ahlberg et al., 1981; Stern et al., 1981; Buiatti et al., 1985;
Gustafsson et al., 1986; Siemiatycki et al., 1988). A study by Coggon et al. (1984) was excluded
because occupational information abstracted from death certificates had not been validated; this
would have resulted in limited information.
Several types of studies of the health effects of exposure to diesel engine emissions are
reviewed in this chapter, such as cohort studies, case-control studies, and studies that conducted
meta-analysis. In the cohort studies, cohorts of heavy construction equipment operators, railroad
and locomotive workers, bus garage employees, and miners were studied retrospectively to
determine increased mortality and morbidity resulting from exposures to varying levels of diesel
emissions in the workplace. The evaluation of each study presents the study population,
methodology used for the study, i.e., data collection and verification, analysis, results, and a
critique of the study. There are some methodologic limitations that are common to studies with
similar design. The total evidence, including limitations, is discussed at the end of the chapter in
the summary and discussion section.
7-6
7.2.1. Cohort Studies
7.2.1.1. Waller (1981): Trends in Lung Cancer in London in Relation to Exposure
to Diesel Fumes
A retrospective mortality study of a cohort of London transport workers was conducted
to determine if there was an excess of deaths from lung cancer that could be attributed to DE
exposure. From nearly 20,000 male employees in the early years, those aged 45 to 64 were
followed for the 25-year period between 1950 and 1974 (the actual number of employees is not
given in the paper), constituting a total of 420,700 man-years at risk. These workers were
distributed among five job categories: drivers, garage engineers, conductors, motormen or
guards, and engineers (works). Lung cancer were ascertained from death certificates of
individuals who died while still employed, or if retired, following diagnosis. Expected death
rates were calculated by applying greater London death rates to the population at risk within
each job category. Data were calculated in 5-year periods and 5-year age ranges, and the results
were combined to obtain the total expected deaths in the required age range for the calendar
period. A total of 667 cases of lung cancer was reported, compared with 849 expected, to give a
cancer mortality ratio of 79%. In each of the five job categories, the observed numbers were
below those expected. Engineers in garages had the highest mortality ratio, 90%, motormen and
guards had a mortality ratio of 87%, and both the bus drivers and conductors had mortality ratios
of 75%. The engineers in the central works had a mortality ratio of 66%. These mortality ratios
did not differ significantly from each other. Environmental sampling was done at one garage, on
one day in 1979, for benzo[a]pyrene (B[a]P) concentrations and was compared with
corresponding values recorded in 1957. Concentrations of B[a]P recorded in 1957 were at least
10 times greater than those measured in 1979.
This study failed to find any association between DE and occurrence of lung cancer,
which may be due to several methodologic limitations. The lung cancer deaths were ascertained
while the workers were employed (the worker either died of lung cancer or retired after lung
cancer was diagnosed). Although man-years at risk were based on the entire cohort, no attempt
was made to trace or evaluate the individuals who had resigned from the London transport
company for any other reason. Hence, information on resignees who may have had significant
exposure to DE, and on lung cancer deaths among them, was not available for analysis. This
may have led to a dilution effect, resulting in underascertainment of observed lung cancer deaths
and underestimation of mortality ratios. Eligibility criteria for inclusion in the cohort, such as
starting date and length of service with the company, were not specified. Therefore, there may
not have been sufficient latency for the development of lung cancer. Use of greater London
population death rates to obtain expected number of deaths may have resulted in a deficit in
mortality ratios reflecting the “healthy worker effect.” Investigators did not categorize the five
7-7
job categories either by qualitative or quantitative levels of DE exposure; neither did they use an
internal comparison group to derive risk estimates.
The age range considered for this study was limited (45 to 64 years of age) for the period
between 1950 and 1974. It is not clear whether this age range was applied to calendar year 1950
or 1974, or at the midpoint of the 25-year follow-up period. No analyses were presented either
by latency or by duration of employment (surrogate for exposure). The environmental survey
based on B[a]P concentrations suggests that the cohort in its earlier years was exposed to much
higher concentrations of environmental contaminants than currently exist. It is not clear when
the reduction in B[a]P concentration occurred, because there are no environmental readings
available between 1957 and 1979. It is also important to note that the concentrations of B[a]P
inside the garage in 1957 were not very different from those outside the garage, thus indicating
that exposure for garage workers was not much different from that of the general population.
Thus, this study fails to provide either positive or negative association between the DE exposure
and the occurrence of lung cancer.
7.2.1.2. Howe et al. (1983): Cancer Mortality (1965 to 1977) in Relation to Diesel Fumes and
Coal Exposure in a Cohort of Retired Railroad Workers
This is a retrospective cohort study of the mortality experience of 43,826 male pensioners
of the Canadian National Railroad (CNR) between 1965 and 1977. Members of this cohort
consisted of male CNR pensioners who had retired before 1965 and who were known to be alive
at the start of that year, as well as those who retired between 1965 and 1977. The records were
obtained from a computer file that is regularly updated and used by the company for payment of
pensions. To receive a pension, each pensioner must provide, on a yearly basis, evidence that he
is alive. Specific cause of death among members of this cohort was ascertained by linking these
records to the Canadian Mortality Data Base, which contains records of all deaths registered in
Canada since 1950. Of the 17,838 deaths among members of the cohort between 1965 and
1977, 16,812 (94.4%) were successfully linked to a record in the mortality file. A random
sample manual check on unlinked data revealed that failure to link was due mainly to some
missing information on the death records.
Occupation at time of retirement was used by the Department of Industrial Relations to
classify workers into three diesel fume and coal dust exposure categories: (1) nonexposed, (2)
possibly exposed, and (3) probably exposed. Person-years of observation were calculated and
classified by age at observation in 5-year age groups (35 to 39, 40 to 44, . . . , 80 to 84, and $85
years). The observed deaths were classified by age at death for different cancers, for all cancers
combined, and for all causes of death combined. Standard mortality ratios (SMRs) were then
calculated using rates of the Canadian population for the period between 1965 and 1977. The
7-8
relative risks were calculated using the three exposure categories: nonexposed, possibly exposed,
and probably exposed.
Both total mortality (SMR = 95, p<0.001) and all cancer deaths (SMR = 99, p>0.05)
were close to that expected for the entire cohort. Analysis by exposure to diesel fume levels in
the three categories (nonexposed, possibly exposed, and probably exposed) revealed an increased
relative risk for lung cancer among workers with increasing exposure to diesel fumes. The
relative risk for nonexposed workers was presumed to be 1.0; for those possibly exposed, the
relative risk was significantly elevated to 1.2 (p=0.013); and for those probably exposed, it was
significantly elevated to 1.35 (p=0.001). The corresponding rates for exposure to varying levels
of coal dust were very similar at 1.00, 1.21 (p=0.012), and 1.35 (p=0.001), respectively. The
trend tests were highly significant for both exposures (p<0.001). Analysis performed after the
exclusion of individuals who worked in the maintenance of steam engines, and hence were
exposed to high levels of asbestos, yielded a risk of lung cancer of 1.00, 1.21, and 1.33 for those
nonexposed, possibly exposed, and probably exposed to DE, respectively, with a highly
significant trend (p<0.001).
An analysis done on individuals who retired prior to 1950 showed the relative risk of
lung cancer among nonexposed, possibly exposed, and probably exposed to be 1.00, 0.70, and
0.44, respectively, based on fewer than 15 deaths in each category. A similar analysis of
individuals who retired after 1950 found the results in the same categories to be 1.00, 1.23, and
1.40, respectively. Although retirement prior to 1950 indicated exposure to coal combustion
fumes alone, retirement after 1950 shows the results of mixed exposure to coal combustion
fumes and diesel fumes. As there was considerable overlap between occupations involving
probable exposure to diesel fumes and probable exposure to coal, and as most members of the
cohort were employed during the years in which the transition from coal to diesel occurred, it
was difficult to distinguish whether lung cancer was associated with exposure to coal
combustion fumes or diesel fumes or a mixture of both.
Although this study showed a highly significant dose-response relationship between
diesel fumes and lung cancer, it has some methodological limitations. There were concurrent
exposures to both diesel fumes and coal combustion fumes during the transition period;
therefore, misclassification of exposure may have occurred, because only occupation at
retirement was available for analysis. It is possible that the elevated response observed for lung
cancer was due to the combined effects of exposure to both coal dust/coal combustion products
and diesel fumes and not just one or the other. However, deaths due to lung cancer were not
elevated among workers who retired prior to the 1950s and thus would have been primarily
exposed to coal dust/coal combustion products. Furthermore, it should be noted that so far coal
dust has not been demonstrated to be a pulmonary carcinogen in studies of coal miners. This

7-9
study was restricted to deaths among retired workers; therefore, it is unclear if a worker who
developed lung cancer when actively employed and filed for a disability claim instead of
retirement claim would be included in the study or not. Thus, it is possible that workers with
heavy exposure might have been excluded from the study. Neither information on duration of
employment in diesel work, nor coal dust-related jobs other than those held at retirement, nor
details of how the exposure categories were created was provided. Therefore, it was not possible
to evaluate whether this omission would have led to an under- or overestimate of the true
relative risk. Although information on potential confounders such as smoking is lacking, the use
of an internal comparison group to compute the relative risks minimizes the potential for
confounding by smoking, as there is no reason to assume different smoking patterns among
individuals exposed to DE versus those not exposed. Despite these limitations, this study
provides suggestive evidence toward a causal association between exposure to DE and excess
lung cancer.
7.2.1.3. Rushton et al. (1983): Epidemiological Survey of Maintenance Workers in the
London Transport Executive Bus Garages and Chiswick Works
This is a retrospective mortality cohort study of male maintenance workers employed for
at least 1 continuous year between January 1, 1967, and December 31, 1975, at 71 London
transport bus (also known as rolling stock) garages and at Chiswick Works. The following
information was obtained from computer listings: surname with initials, date of birth, date of
joining company, last or present job, and location of work. For those individuals who left their
job, date of and reason for leaving were also obtained. For those who died in service or after
retirement, and for men who had resigned, full name and last known address were obtained from
an alphabetical card index in the personnel department. Additional tracing of individuals who
had left was carried out through social security records. The area of residence was assumed to
be close to their work; therefore place of work was coded as residence. One hundred different
job titles were coded into 20 broader groups. These 20 groups were not ranked for DE exposure,
however. The reason for leaving was coded as died in service, retired, or other. The underlying
cause of death was coded using the eighth revision of the International Classification of Diseases
(ICD). Person-years were calculated from date of birth and dates of entry to and exit from the
study using the man-years computer language program. The workers were then subdivided into
5-year age and calendar period groups. The expected number of deaths was calculated by
applying the 5-year age and calendar period death rates of the comparison population with the
person-years of corresponding groups. The mortality experience of the male population in
England and Wales was used as the comparison population. Significance values were calculated
for the difference between the observed and expected deaths, assuming a Poisson distribution.

7-10
The person-years of observation totaled 50,008 and were contributed by 8,490
individuals in the study, with a mean follow-up of 5.9 years. Only 2.2% (194) of the men were
not traced. Observed deaths from all causes were significantly lower than expected (O = 495,
p<0.001). Observed deaths from all neoplasms and cancer of the lung were approximately the
same as those expected. The only significant excess observed, for cancer of the liver and gall
bladder at Chiswick Works, was based on four deaths (p<0.05). A few job groups showed a
significant excess of risks for various cancers. All the excess deaths observed for the various job
groups, except for the general hand category, were based on very small numbers (usually fewer
than five) and merited cautious interpretation. Only a notable excess in the general hand
category for lung cancer was based on as many as 48 cases (SMR = 133, p<0.03).
This mortality study did not demonstrate any cancer excess. Details of work history
were not obtained to permit any analysis by DE exposure. The study’s limitations, including
small sample size, short duration of follow-up (average of only 6 years), and lack of sufficient
latency period, make it inadequate to draw any conclusions.
7.2.1.4. Wong et al. (1985): Mortality Among Members of a Heavy Construction Equipment
Operators Union With Potential Exposure to DE Emissions
This retrospective mortality study was conducted on a cohort of 34,156 male members of
a heavy construction equipment operators union with potential exposure to DE emissions. Study
cohort members were identified from records maintained at Operating Engineers’ Local Union
No. 3-3A in San Francisco, CA. This union has maintained both work and death records on all
its members since 1964. Individuals with at least 1 year of membership in this union between
January 1, 1964, and December 31, 1978, were included in the study. Work histories of the
cohort were obtained from job dispatch computer tapes. The study follow-up period was
January 1964 to December 1978. Death information was obtained from a trust fund, which
provided information on retirement dates, vital status, and date of death for those who were
entitled to retirement and death benefits. Approximately 50% of the cohort had been union
members for less than 15 years, whereas the other 50% had been union members for 15 years or
more. The average duration of membership was 15 years. As of December 31, 1978, 29,046
(85%) cohort members were alive, 3,345 (9.8%) were dead, and 1,765 (5.2%) remained
untraced. Vital status of 10,505 members who had left the union as of December 31, 1978, was
ascertained from the Social Security Administration. Death certificates were obtained from
appropriate State health departments. Altogether, 3,243 deaths (for whom death certificates
were available) in the cohort were coded using the seventh revision of the ICD. For 102
individuals, death certificates could not be obtained, only the date of death; these individuals
were included in the calculation of the SMR for all causes of death but were deleted from the

7-11
cause-specific SMR analyses. Expected deaths and SMRs were calculated using the U.S.
national age-sex-race cause-specific mortality rates for 5-year time periods between 1964 and
1978. The entire cohort population contributed to 372,525.6 person-years in this 15-year study
period.
A total of 3,345 deaths was observed, compared with 4,109 expected. The corresponding
SMR for all causes was 81 (p=0.01), which is consistent with the “healthy worker effect.” A
total of 817 deaths was attributed to malignant neoplasms, slightly fewer than the 878 expected
based on U.S. white male cancer mortality rates (SMR = 93, p=0.05). Mostly there were SMR
deficits for cause-specific cancers, including lung cancer for the entire cohort (SMR = 99, O =
309). The only significant excess SMR was observed for cancer of the liver (SMR = 167, O =
23, p<0.05).
Analysis by length of union membership as a surrogate of duration for potential exposure
showed statistically significant increases in SMRs of cancer of the liver (SMR = 424, p<0.01) in
the 10- to 14-year membership group and of the stomach (SMR = 248, p<0.05) in the 5- to 9-
year membership group. No cancer excesses were observed in the 15- to 19-year and 20+-year
membership groups. Although the SMR for cancer of the lung had a statistically significant
deficit in the less-than-5-year duration group, it showed a positive trend with increasing length
of membership, which leveled off after 10 to 14 years.
Cause-specific mortality analysis by latency period showed a positive trend for SMRs of
all causes of death, although all of them were statistically significant deficits, reflecting the
diminishing “healthy worker effect.” This analysis also demonstrated a statistically significant
SMR excess for cancer of the liver (10- to 19-year group, SMR = 258). The SMR for cancer of
the lung showed a statistically significant deficit for a <10-year latency but showed a definite
positive trend with increasing latency.
In addition to these analyses of the entire cohort, similar analyses were carried out in
various subcohorts. Analyses of retirees, 6,678 individuals contributing to 32,670 person-years,
showed statistically significant increases (p<0.01) in SMRs for all cancers; all causes of death;
cancers of the digestive system, large intestine, respiratory system, and lung; emphysema; and
cirrhosis of the liver. The other two significant excesses (p<0.01) were for lymphosarcoma and
reticulosarcoma and nonmalignant respiratory diseases. Further analysis of the 4,075 retirees
(18,678 person-years) who retired at age 65 or who retired earlier but had reached the age of 65
revealed statistically significant SMR increases (p<0.05) for all cancers, cancer of the lung, and
lymphosarcoma and reticulosarcoma.
To analyze cause-specific mortality by job held (potential exposure to DE emissions), 20
functional job titles were used, which were further grouped into three potential categories: high
exposure, low exposure, and unknown exposure. A person was classified in a job title if he ever

7-12
worked on that job. Based on this classification system, if a person had ever worked in a high-
exposure job title he was included in that group, even though he may have worked for a longer
time in a low-exposure group or in an unknown exposure group. Information on length of work
in any particular job, hence indirect information on potential length of exposure, was not
available either.
For the high-exposure group a statistically significant excess was observed for cancer of
the lung among bulldozer operators who had 15 to 19 years of membership and 20+ years of
follow-up (SMR = 343, p<0.05). This excess was based on 5 out of 495 deaths observed in this
group of 6,712 individuals, who contributed 80,328 person-years of observation.
The cause-specific mortality analysis in the low-exposure group revealed statistically
significant SMR excesses in individuals who had ever worked as engineers. These excesses
were for cancer of the large intestine (SMR = 807, O = 3, p<0.05) among those with 15 to 19
years of membership and length of follow-up of at least 20 years, and cancer of the liver (SMR =
872, O = 3, p<0.05) among those with 10 to 14 years of membership and length of follow-up of
10 to 19 years. There were 7,032 individuals who contributed to 78,403 person-years of
observation in the low-exposure group.
For the unknown exposure group, a statistically significant SMR was observed for motor
vehicle accidents only (SMR = 174, O = 21, p<0.05). There were 3,656 individuals who
contributed to 33,388 person-years of observation in this category.
No work histories were available for those who started their jobs before 1967 and for
those who held the same job prior to and after 1967. This group comprised 9,707 individuals
(28% of the cohort) contributing to 104,448 person-years. Statistically significant SMR excesses
were observed for all cancers (SMR = 112, O = 339, p<0.05) and cancer of the lung (SMR =
119, O = 141, p<0.01). A significant SMR elevation was also observed for cancer of the
stomach (SMR = 199, O = 30, p<0.01).
This study demonstrates a statistically significant excess for cancer of the liver but also
shows statistically significant deficits in cancers of the large intestine and rectum. It may be, as
the authors suggested, that the liver cancer cases actually resulted from metastases from the large
intestine and/or rectum, as tumors of these sites will frequently metastasize to the liver. The
excess in liver cancer mortality and the deficits in mortality that are due to cancer of the large
intestine and rectum could also, as the authors indicate, be due to misclassification. Both
possibilities have been considered by the investigators in their discussion.
Cancer of the lung showed a positive trend with length of membership as well as with
latency, although none of the SMRs were statistically significant except for workers without any
work histories. The individuals without any work histories may have been the ones who were in
their jobs for the longest period of time, because workers without job histories included those

7-13
who had the same job before and after 1967 and thus may have worked 12 to 14 years or longer.
If they had belonged to the category in which heavy exposure to DE emissions was very
common for this prolonged time, then the increase in lung cancer, as well as stomach cancer,
might be linked to DE. Further information on those without work histories should be obtained
if possible, because such information may be quite informative with regard to the evaluation of
the carcinogenicity of DE.
The study design is adequate, covers about a 15-year observation period, has a large
enough population, and is appropriately analyzed; however, it has too many limitations to permit
any conclusions. First, no exposure histories are available; one has to make do with job
histories, which provide limited information on exposure level. Any person who ever worked at
the job, or any person working at the same job over any period of time, is included in the same
category; this would have a dilution effect, because extremely variable exposures were
considered in the study. Second, the length of time worked in any particular job is not available.
Third, work histories were not available for 9,707 individuals, who contributed 104,448 person-
years, a large proportion of the study cohort (28%). These individuals happen to show the most
evidence of a carcinogenic effect. Confounding by alcohol consumption for cancer of the liver
and smoking for emphysema and cancer of the lung was not ruled out. Fourth, 15 years’ follow-
up may not provide sufficient latency to observe excess lung cancer. Last, although 34,156
members were eligible for the study, the vital status of 1,765 individuals was unknown.
Nevertheless, they were still considered in the denominator of all the analyses. The investigators
fail to mention how the person-year calculation for these individuals was handled. Also, some
of the person-years might have been overestimated, as people may have paid the dues for a
particular year and then left work. These two causes of overestimation of the denominator may
have resulted in some or all the SMRs being underestimated.
7.2.1.5. Edling et al. (1987): Mortality Among Personnel Exposed to DE
This retrospective cohort mortality study of bus company employees investigated a
possible increased mortality of cardiovascular diseases and cancers from DE exposure. The
cohort comprised all males employed at five different bus companies in southeastern Sweden
between 1950 and 1959. Based on information from personnel registers, individuals were
classified into one or more categories and could have contributed person-years at risk in more
than one exposure category. The study period was from 1951 to 1983; information was
collected from the National Death Registry, and copies of death certificates were obtained from
the National Bureau of Statistics. Workers who died after age 79 were excluded from the study
because diagnostic procedures were likely to be more uncertain at higher ages (according to
investigators). The cause-, sex-, and age-specific national death rates in Sweden were applied to

7-14
the 5-year age categories of person-years of observation to determine expected deaths for all
causes, malignant diseases, and cardiovascular diseases. A Poisson distribution was used to
calculate p-values and confidence limits for the ratio of observed to expected deaths. The total
cohort of 694 men (after loss of 5 men to follow-up) was divided into three exposure categories:
(1) clerks with lowest exposure, (2) bus drivers with moderate exposure, and (3) bus garage
workers with highest exposure.
The 694 men provided 20,304 person-years of observation, with 195 deaths compared
with 237 expected. A deficit in cancer deaths largely accounted for this lower-than-expected
mortality in the total cohort. Among subcohorts, no difference between observed and expected
deaths for total mortality, total cancers, or cardiovascular causes was observed for clerks (lowest
diesel exposure), bus drivers (moderate diesel exposure), and garage workers (high diesel
exposure). The risk ratios for all three categories were less than 1 except for cardiovascular
diseases among bus drivers, which was 1.1.
When the analysis was restricted to members who had at least a 10-year latency period
and either any exposure or an exposure exceeding 10 years, similar results were obtained, with
fewer neoplasms than expected, whereas cardiovascular diseases showed risk around or slightly
above unity.
Five lung cancer deaths were observed among bus drivers who had moderate DE
exposure, whereas seven were expected. The only other lung cancer death was observed among
bus garage workers who had the highest DE exposure. This study’s major limitations, including
small size and poor data on DE exposure, make it inadequate to draw any conclusions.
7.2.1.6. Boffetta and Stellman (1988): DE Exposure and Mortality Among Males in the
American Cancer Society Prospective Study
Boffetta and Stellman conducted a mortality analysis of 461,981 males with known
smoking history and vital status at the end of the first 2 years of follow-up. The analysis was
restricted to males aged 40 to 79 years in 1982 who enrolled in the American Cancer Society’s
prospective mortality study of cancer. Mortality was analyzed in relation to exposure to DE and
to employment in selected occupations related to DE exposure. In 1982, more than 77,000
American Cancer Society volunteers enrolled more than 1.2 million men and women from all 50
States, the District of Columbia, and Puerto Rico in a long-term cohort study, the Cancer
Prevention Study II (CPS-II). Enrollees were usually friends, neighbors, or relatives of the
volunteers; enrollment was by family groups, with at least one person in the household 45 years
of age or older. Subjects were asked to fill out a four-page confidential questionnaire and return
it in a sealed envelope. The questionnaire included history of cancer and other diseases; use of
medications and vitamins; menstrual and reproductive history; occupational history; and

7-15
information on diet, drinking, smoking, and other habits. The questionnaire also included three
questions on occupation: (1) current occupation, (2) last occupation, if retired, and (3) job held
for the longest period of time, if different from the other two. Occupations were coded to an ad
hoc two-digit classification in 70 categories. Exposures at work or in daily life to any of the 12
groups of substances were also ascertained. These included diesel engine exhausts, asbestos,
chemicals/acids/solvents, dyes, formaldehyde, coal or stone dusts, and gasoline exhausts.
Volunteers checked whether their enrollees were alive or dead and recorded the date and place of
all deaths every other year during the study. Death certificates were then obtained from State
health departments and coded by a trained nosologist according to a system based on the ninth
revision of the ICD.
The data were analyzed to determine the mortality for all causes and lung cancer in
relation to DE exposure, mortality for all causes and lung cancer in relation to employment in
selected occupations with high DE exposure, and mortality from other causes in relation to DE
exposure. The incidence-density ratio was used as a measure of association, and test-based
confidence limits were calculated by the Miettinen method. For stratified analysis, the Mantel-
Haenszel method was used for testing linear trends. Although data on 476,648 subjects
comprising 939,817 person-years of risk were available for analysis, 3% of the subjects (14,667)
had not given any smoking history, and 20% (98,026) did not give information on DE exposure
and were therefore excluded from the main DE analysis. Among individuals who had provided
DE exposure history, 62,800 were exposed and 307,143 were not exposed. Comparison of the
population with known information on DE exposure with the excluded population with no
information on DE exposure showed that the mean ages were 54.7 and 57.7 years, the
nonsmokers were 72.4% and 73.2%, and the total mortality rates per 1,000 per year were 23.0%
and 28.8%, respectively.
All-cause mortality was elevated among railroad workers (relative risk [RR] = 1.43, 95%
confidence interval [CI] = 1.2, 1.72), heavy equipment operators (RR = 1.7, 95% CI = 1.19,
2.44), miners (RR = 1.34, 95% CI = 1.06, 1.68), and truck drivers (RR = 1.19, 95% CI = 1.07,
1.31). The age-adjusted lung cancer relative risk was elevated significantly (RR = 1.41, 95% CI
= 1.19,1.66), which was slightly decreased to 1.31 (95% CI = 1.10, 1.54). For lung cancer
mortality the age- and smoking-adjusted risks were significantly elevated for miners (RR = 2.67,
95% CI = 1.63, 4.37) and heavy equipment operators (RR = 2.60, 95% CI = 1.12, 6.06). Risks
were also elevated, but not significantly, for railroad workers (RR = 1.59, 95% CI = 0.94, 2.69)
and truck drivers (RR = 1.24, 95% CI = 0.93, 1.66). These risks were calculated with the
Mantel-Haenszel method, controlling for age and smoking. Although the relative risk was
nonsignificant for truck drivers, a small dose-response effect was observed when duration of DE
exposure was examined. For drivers who worked for 1 to 15 years, the relative risk was 0.87,
7-16
whereas for drivers who worked for more than 16 years, the relative risk was 1.33 (95% CI =
0.64, 2.75). Relative risks for lung cancer were not presented for other occupations. Mortality
analysis for other causes and DE exposure showed a significant excess of deaths (p<0.05) in the
following categories: cerebrovascular disease, arteriosclerosis, pneumonia, influenza, cirrhosis
of the liver, and accidents.
The main strength of this study is detailed information on smoking. The two main
methodologic concerns are the representativeness of the study population and the quality of
information on exposure. The sample, though very large, was composed of volunteers. Thus,
the cohort was healthier and less frequently exposed to important risk factors such as smoking
and alcohol. Self-administered questionnaires were used to obtain data on occupation and DE
exposure. None of this information was validated. Nearly 20% of the individuals had an
unknown exposure status to DE, and they experienced a higher mortality for all causes and lung
cancer than both the DE exposed and unexposed groups. This could have introduced a
substantial bias in the estimate of the association. Given that all DE exposure occupations, such
as heavy equipment operators, truck drivers, and railroad workers, showed elevated lung cancer
risk, this study is suggestive of a causal association. It should be noted that after adjusting for
smoking, the RR reduced slightly from 1.41 to 1.31 and remained significant, indicating that
observed excess of lung cancer was associated mainly with DE exposure.
7.2.1.7. Garshick et al. (1988): A Retrospective Cohort Study of Lung Cancer and DE
Exposure in Railroad Workers
An earlier case-control study of lung cancer and DE exposure in U.S. railroad workers by
these investigators had demonstrated a relative odds of 1.41 (95% CI = 1.06, 1.88) for lung
cancer with 20 years of work in jobs with DE exposure. To confirm these results, a large
retrospective cohort mortality study was conducted by the same investigators. Data sources for
the study were the work records of the U.S. Railroad Retirement Board (RRB). The cohort was
selected based on job titles in 1959, which was the year by which 95% of the locomotives in the
United States were diesel powered. DE exposure was considered to be a dichotomous variable
depending on yearly job codes between 1959 and death or retirement through 1980. Industrial
hygiene evaluations and descriptions of job activities were used to classify jobs as exposed or
unexposed to diesel emissions. A questionnaire survey of 534 workers at one of the railroads
where workers were asked to indicate the amount of time spent in railroad locations, either near
or away from sources of DE, was used to validate this classification. Workers selected for this
survey were actively employed at the time of the survey, 40 to 64 years of age, started work
between 1939 and 1949 in the job codes sampled in 1959, and eligible for railroad benefits. To
qualify for benefits, a worker must have had 10 years or more of service with the railroad and

7-17
should not have worked for more than 2 years in a nonrailroad job after leaving railroad work.
Workers with recognized asbestos exposure, such as repair of asbestos-insulated steam
locomotive boilers, passenger cars, and steam pipes, or railroad building construction and
repairs, were excluded from the job categories selected for study. However, a few jobs with
some potential for asbestos exposure were included in the cohort, and the analysis was done both
ways, with and without them.
The death certificates for all subjects identified in 1959 and reported by the RRB to have
died through 1980 were searched. Twenty-five percent of them were obtained from the RRB
and the remainder from the appropriate State departments of health. Coding of cause of death
was done without knowledge of exposure history, according to the eighth revision of the ICD. If
the underlying cause of death was not lung cancer, but was mentioned on the death certificate, it
was assigned as a secondary cause of death, so that the ascertainment of all cases was complete.
Workers not reported by the RRB to have died by December 31, 1980, were considered to be
alive. Deceased workers for whom death certificates had not been obtained or, if obtained, did
not indicate cause of death, were assumed to have died of unknown causes.
Proportional hazard models were fitted that provided estimates of relative risk for death
caused by lung cancer using the partial likelihood method described by Cox, using the time
dimension being the time since first entry into the cohort. The model also controlled for the
birth year and the calendar time. The 95% confidence intervals were constructed using the
asymptotic normality of the estimated regression coefficients of the proportional hazards model.
Exposure was analyzed by DE-exposed jobs in 1959 and by cumulative number of years of DE
exposure through 1980. Directly standardized rate ratios for deaths from lung cancer were
calculated for DE exposed compared with unexposed for each 5-year age group in 1959. The
standardized rates were based on the overall 5-year person-year time distribution of individuals
in each age group starting in 1959. The only exception to this was between 1979 and 1980,
when a 2-year person-year distribution was used. The Mantel-Haenszel analogue for person-
year data was used to calculate 95% confidence intervals for the standardized rate ratios.
The cohort consisted of 55,407 workers, 19,396 of whom had died by the end of 1980.
Death certificates were not available for 11.7% of all deaths. Of the 17,120 deaths for whom
death certificates were obtained, 48.4% were attributable to diseases of the circulatory system,
whereas 21% were attributable to all neoplasms. Of all neoplasms, 8.7% (1,694 deaths) were
due to lung cancer. A higher proportion of workers in the younger age groups, mainly brakemen
and conductors, were exposed to DE, while a higher proportion of workers in the older age
groups were potentially exposed to asbestos. In a proportional hazards model, analyses by age in
1959 found a relative risk of 1.45 (95% CI = 1.11, 1.89) among the age group 40 to 44 years and
a relative risk of 1.33 (95% CI = 1.03, 1.73) for the age group 45 to 49 years. Risk estimates in

7-18
the older age groups 50 to 54, 55 to 59, and 60 to 64 years were 1.2, 1.18, and 0.99, respectively,
and were not statistically significant. The two youngest age groups in 1959 had workers with
the highest prevalence and longest duration of DE exposure and lowest exposure to asbestos.
When potential asbestos exposure was considered as a confounding variable in a proportional
hazards model, the estimates of relative risk for asbestos exposure were all near null value and
not significant. Analysis of workers exposed to DE in 1959 (n = 42,535), excluding workers
with potential past exposure to asbestos, yielded relative risks of 1.57 (95% CI = 1.19, 2.06) and
1.34 (95% CI = 1.02, 1.76) in the 1959 age groups 40 to 44 years and 45 to 49 years. Directly
standardized rate ratios were also calculated for each 1959 age group based on DE exposure in
1959. The results confirmed those obtained by using the proportional hazards model.
Relative risk estimates were then obtained using duration of DE exposure as a surrogate
for dose. In a model that used years of exposure up to and including exposure in the year of
death, no exposure duration-response relationship was obtained. When analysis was done by
disregarding exposure in the year of death and 4 years prior to death, the risk of dying from lung
cancer increased with the number of years worked in a diesel-exhaust-exposed job. In this
analysis, exposure to DE was analyzed by exposure duration groups and in a model entering age
in 1959 as a continuous variable. The workers with greater than 15 years of exposure had a
relative risk of lung cancer of 1.72 (95% CI = 1.27, 2.33). The risk for 1 to 4 years of
cumulative exposure was 1.20 (95% CI = 1.01, 1.44); for 5 to 9 years of cumulative exposure, it
was 1.24 (95% CI = 1.06, 1.44); and for 10 to 14 years of cumulative exposure, it was 1.32
(95% CI = 1.13, 1.56).
The results of this study, demonstrating a positive association between DE exposure and
increased lung cancer, are consistent with the results of the case-control study conducted by the
same investigators in railroad workers dying of lung cancer from March 1981 through February
1982. This cohort study has addressed many of the weaknesses of the other epidemiologic
studies. The large sample size (55,400) allowed sufficient power to detect small risks and also
permitted the exclusion of workers with potential past exposure to asbestos. The stability of job
career paths in the cohort ensured that of the workers 40 to 44 years of age in 1959 classified as
DE-exposed, 94% of the cases were still in DE-exposed jobs 20 years later.
The main limitation of the study is the lack of quantitative data on exposure to DE in
either individual workers or overall job categories. This is one of the few studies in which
industrial hygiene measurements of DE were done. These measurements were correlated with
job titles to divide the cohort in dichotomous exposure groups of exposed and nonexposed. This
may have led to an underestimation of the risk of lung cancer because exposed groups included
individuals with low to high exposure. The number of years exposed to DE was used as a
surrogate for dose. The dose, based on duration of employment, was inaccurate because

7-19
individuals were working on steam and diesel locomotives during the transition period. It
should be noted that the investigators only included exposures after 1959; the duration of
exposure prior to 1959 was not known. If the categories of exposure to DE had been set up as
no, low, moderate, and high exposure, the results would have been more meaningful, as would
the dose-response relationship. Another limitation of this study was its inability to examine the
effect of years of exposure prior to 1959 and latency. No adjustment for smoking was made in
this study. However, an earlier case-control study done in the same cohort (Garshick et al.,
1987) showed no significant difference in the risk estimate after adjusting for smoking. Despite
these limitations, the results of this study indicate that occupational exposure to DE is associated
with a modest risk (1.5) of lung cancer.
The data of this study were used by Crump et al. (1991) to explore the development of
dose-response-based quantitative estimates of lung cancer associated with DE exposure by using
diesel exposure estimate data from the industrial hygiene (IH) studies conducted by Hammond
(1998) and Woskie et al. (1988a,b). These studies were conducted in conjunction with the
Garshick et al. (1988) study. The Woskie et al. (1988a,b) IH studies were conducted in four
small northern railroads where the workers were exposed to DE in the early 1980s, prior to the
Garshick et al. (1988) epidemiologic study. A total of 39 job titles were identified by Woskie et
al. (1988a,b), which were subsequently combined into 13 job groups and finally merged into 5
career exposure job codes as follows: brakers, conductors, and hostlers; clerks; engineers and
firers; signal maintainers; and shop workers. The average exposure estimates were assigned to
the cohort members by Crump et al. (1991) based on the job codes in 1959. Cumulative
exposures were calculated using these average exposures for each job code. The exposures in
the IH study by Hammond (1998) were defined as the concentrations of respirable-sized
particles (RSP), the adjusted respirable particles (ARP) concentrations, and the adjusted
extractable mass (AEM). The concentrations of ARP were estimated in the IH study by
removing the particle contribution of environmental tobacco smoke (ETS). Crump et al. (1991)
also used another index called total extractable material (TEX), which was the extractable RSP
including the particle contribution of ETS. Using these four exposure indices and the regional
climates for the United States, Crump et al. (1991) constructed various exposure metrics. They
conducted more than 50 analyses based on calendar year, age in 1959, attained age, and five job
codes identified in 1959: brakers, conductors, and hostlers; clerks; engineers and firers; signal
maintainers; and shop workers; using the exposure metrics. Crump et al. (1991) used the U.S.
general population age- and year-specific death rates for comparison and found that the relative
risk can be positively or negatively related to the duration of exposure depending on how age
was controlled in a model. Their use of the U.S. general population rates instead of the internal
unexposed group of railroad workers that was used by Garshick et al. (1988) identified that the

7-20
death ascertainment between 1977 and 1980 as incomplete. The Crump et al. (1991) analysis,
limited to 1959 through 1976, found an excess lung cancer risk similar to the subsequent
Garshick analysis (letter from Garshick, Harvard Medical School, to Chao Chen, U.S. EPA,
dated August 15, 1991).
Garshick conducted some additional analyses after confirming the underascertainment of
deaths by RRB identified by Crump et al. (1991). He reported that the relationship between
years of exposure, when adjusted for attained age and calendar year, was flat to negative
depending upon which model was used. He also found that in the years 1977-1980 the death
ascertainment was incomplete; approximately 20% to 70% of deaths were missing depending
upon the calendar year. Garshick’s analysis, based on job titles in 1959 and limited to deaths
occurring through 1976, showed that even though the relative risk for all exposure groups was
elevated, the youngest workers still had the highest risk of dying of lung cancer.
Crump (1999), on the other hand, reported that the negative dose-response continued to
be upheld in his latest analysis when age was controlled more carefully and years of exposure
quantified more accurately. Crump (1999) asserted that the negative dose-response trends for
lung cancer observed either with the cumulative exposure or with duration of exposure may be
due to underascertainment of deaths in the last 4 years of follow-up of the Garshick et al. (1988)
study as well as incomplete follow-up in earlier years.
California EPA’s (Cal EPA, 1998) Office of Environmental Health Hazard Assessment
(OEHHA) used the same railroad worker data for its quantitative risk assessment. The five job
categories defined by Woskie et al. (1988a,b) and used by Crump et al. (1991) were combined
into three exposure categories: exposed (engineers and firers; brakers, conductors, and hostlers;
collectively known as “train workers”), unexposed (clerks and signalmen), and uncertain
exposure (shop workers). In its analysis, OEHHA found a positive dose-response and a steadily
increasing risk of lung cancer with increasing duration of exposure by using age in 1959 but
allowing for an interaction term of age and calendar year in the model. This positive dose-
response finding was contradictory to the negative to flat dose-response findings of both Crump
et al. (1991) and Garshick (letter from Garshick, Harvard Medical School, to Chao Chen, U.S.
EPA, dated August 15, 1991).
The Health Effects Institute (HEI, 1999) convened an expert panel specifically to
evaluate strengths and limitations of two epidemiologic studies that had some exposure data, for
quantitative risk estimation and to resolve the discrepancies in the dose-response results reported
by Garshick et al. (1988), Crump et al. (1991), and OEHHA (Cal EPA, 1998). In their
evaluation of the epidemiologic study of railroad worker data for quantitative risk assessment,
the panel conducted their own analysis of the Garshick et al. (1988) data. They excluded the last
4 years of follow-up (1977-1980) because of underascertainment of deaths during these years.

7-21
The panel categorized the duration of exposure in 12 categories that were basically the duration
of employment. The exposure was assumed to be linearly increasing for 15 years prior to 1959.
Lags of 5 and 10 years were also considered in the analysis. The job categories based on job
held in 1959 were classified as clerks, signalmen, engineers and firers, conductors and brakers,
hostlers, and shop workers. For final analysis these were collapsed into three groups: clerks and
signalmen, train workers (engineers and firers, conductors and brakers, and hostlers), and shop
workers. Seven different models were used. The panel’s analysis revealed consistently elevated
lung cancer risk for train workers compared with clerks for each duration of employment (1-4,
5-9, 10-14, 15-17, 18+) in years and that shop workers had an intermediate risk of lung cancer.
Their analysis also revealed decreasing risk of lung cancer with increasing duration of
employment in all three job categories. These findings were similar to those of Garshick (letter
from Garshick, Harvard Medical School, to Chao Chen, U.S. EPA, dated August 15, 1991) and
Crump et al. (1991).
In addition to differences in adjusting the age (age in 1959 versus attained age) in their
respective analyses, these three investigators made different assumptions in estimating exposure
patterns in these railroad workers. Garshick et al. (1988) assumed that there was no exposure to
DE prior to 1959 and that the exposure to DE was constant throughout the period of follow-up,
i. e., 1959 to 1980 (block exposure pattern). Crump et al. (1991) assumed that the exposure to
DE increased steadily from 1945 to 1959 to the same level as assumed in the block exposure
pattern by Garshick et al. (1988) and then remained constant from 1959 through 1980 (ramp
exposure pattern). OEHHA assumed that the exposure increased steeply from 1945 to 1959.
The peak exposure attained in 1959 according to OEHHA was twice as high as assumed in the
block and ramp exposure patterns by Garshick et al. (1988) and Crump et al. (1991),
respectively. The exposures then declined steeply from 1959 to reach the levels assumed in the
block and ramp exposure patterns in 1980 (roof exposure pattern). The roof exposure pattern
was constructed on the assumption that diesel engines were “smokier” in the past. A detailed
discussion of divergent results observed by Crump and Cal EPA can be found in Chapter 8.
The panel discussed various possibilities for the negative dose-response found among
train workers and to a lesser extent among shop workers. They asserted that several types of
biases could affect the data, alone or in combination, and mask a true positive association. The
biases enumerated by the panel were: unmeasured confounding by smoking, exposure to other
sources of pollution, previous occupational exposures, exposure misclassification, use of
“duration of employment” as a surrogate measure for exposure, healthy worker survivor effect,
and differential or incomplete ascertainment of lung cancer deaths (for detailed discussion of
how an individual bias affects the results, please see HEI, 1999). The panel concluded,
“However, despite the reason or reasons why the relative risks in these data decrease with

7-22
duration of employment, the lack of a positive exposure-response association in the railroad
worker cohort substantially weakens that study’s potential to provide a reliable quantitative
estimate of risk of exposure to diesel engine emissions.” Thus, the panel recommended against
using the current railroad worker data as the basis for quantitative risk assessment in ambient
settings.
The panel also reported that the Garshick et al. study (1987, 1988) had several strengths,
such as a large number of study subjects (55,407 subjects, including 1,694 lung cancer deaths in
the cohort study and 1,256 lung cancer cases for the case-control study). The workers were
employed in an industry where many of them were exposed to DE. Confounding by asbestos
was handled by either excluding certain job categories from the analyses or controlling for it in
the analyses. Confounding by smoking was controlled in the analyses of case-control study.
The panel concluded that the overall results of the Garshick studies were generally consistent
with findings of a weak association between exposure to DE and occurrence of lung cancer.
Thus, it should be noted that although the railroad worker data are unsuitable for
quantitative risk assessment, they provide qualitative support for a positive association between
exposure to DE and occurrence of lung cancer.
7.2.1.8. Gustavsson et al. (1990): Lung Cancer and Exposure to DE Among Bus
Garage Workers
A retrospective mortality study (from 1952 to 1986), cancer incidence study (from 1958
to 1984), and nested case-control study were conducted among a cohort of 708 male workers
from five bus garages in Stockholm, Sweden, who had worked for at least 6 months between
1945 and 1970. Thirteen individuals were lost to follow-up, reducing the cohort to 695.
Information was available on location of workplace, job type, and beginning and ending
of work periods. Workers were traced through a computerized register of the living population,
death and burial books, and data from the Stockholm city archives.
For the cohort mortality analyses, death rates of the general population of greater
Stockholm were used. Death rates of occupationally active individuals, a subset of the general
population of greater Stockholm, were used as a second comparison group to reduce the bias
from “healthy worker effect.” Mortality analysis was conducted using the “occupational
mortality analysis program” (OCMAP-PC). For cancer incidence analysis, the “epidemiology in
Linköping” (EPILIN) program was used, with the incidence rates obtained from the cancer
registry.
For the nested case-control study, both dead and incident primary lung cancers identified
in the register of cause of deaths and the cancer register were selected. Six controls matched on
age ± 2 years, selected from the noncases at the time of the diagnosis of cases, were drawn at

7-23
random without replacements. Matched analyses were done to calculate odds ratios using
conditional logistic regression. The EGRET and Epilog programs were used for these analyses.
DE and asbestos exposure assessments were performed by industrial hygienists based on
the intensity of exposure to DE and asbestos, specific for workplace, work task, and calendar
time period. A DE exposure assessment was based on (1) amount of emission (number of buses,
engine size, running time, and type of fuel), (2) ventilatory equipment and air volume of the
garages, and (3) job types and work practices. Based on detailed historical data and very few
actual measurements, relative exposures were estimated (these were not absolute exposure
levels). The scale was set to 0 for unexposed and 1 for lowest exposure, with each additional
unit increase corresponding to a 50% increase in successive intensity (i.e., 1.5, 2.25, 3.38, and
5.06).
Based on personal sampling of asbestos during 1987, exposures were estimated and time-
weighted annual mean exposures were classified on a scale of three degrees (0, 1, and 2).
Cumulative exposures for both DE and asbestos were calculated by multiplying the level of
exposure by the duration of every work period. An exposure index was calculated by adding for
every individual contribution from all work periods for both DE and asbestos. Four DE index
classes were created: 0 to 10, 10 to 20, 20 to 30, and >30. The four asbestos index classes were
0 to 20, 20 to 40, 40 to 60, and >60. The cumulative exposure indices were used for the nested
case-control study.
Excesses were observed for all cancers and some other site-specific cancers using both
comparison populations for the cohort mortality study, but none of them was statistically
significant. Based on 17 cases, SMRs for lung cancer were 122 and 115 using Stockholm
occupationally active and general population, respectively. No dose-response was observed with
increasing cumulative exposure in the mortality study. The cancer incidence study reportedly
confirmed the mortality results (results not given).
The nested case-control study, on the other hand, showed increasing risk of lung cancer
with increasing exposure. Using 0 to 10 DE exposure index as the comparison group yielded
RRs of 1.34 (95% CI = 1.09 to 1.64), 1.81 (95% CI = 1.20 to 2.71), and 2.43 (95% CI = 1.32 to
4.47) for the DE indices 10 to 20, 20 to 30, and >30, respectively. The study was based on 17
cases and 6 controls for each case matched on age ± 2 years. Adjustment for asbestos exposure
did not change the lung cancer risk for DE.
The main strength of this study is the detailed exposure matrices constructed for both DE
and asbestos exposure, although they were based primarily on job tasks and very few actual
measurements. There are a few methodological limitations to this study. The cohort is small
and there were only 17 lung cancer deaths; thus the power is low. Exposure or outcome may be
misclassified, although any resulting bias in the relative risk estimates is likely to be toward
7-24
unity, because exposure classification was done independently of the outcome. Although the
analysis by dose indices was done, no latency analysis was performed. Although data on
smoking were missing, it is unlikely to confound the results because this is a nested case-control
study; therefore, smoking is not likely to be different among the individuals irrespective of their
exposure status to DE. Overall, this study provides some support to the excess lung cancer
results found earlier among populations exposed to DE.
7.2.1.9. Hansen (1993): A Follow-up Study on the Mortality of Truck Drivers
This is a retrospective cohort mortality study of unskilled male laborers, ages 15 to 74
years, in Denmark, identified from a nationwide census file of November 9, 1970. The exposed
group included all truck drivers employed in the road delivery or long-haul business (14,225).
The unexposed group included all laborers in certain selected occupational groups considered to
be unexposed to fossil fuel combustion products and to resemble truck drivers in terms of work-
related physical demands and various personal background characteristics (43,024).
Through automatic record linkage between the 1970 census register (the Central
Population Register 1970 to 1980) and the Death Certificate Register (1970 to 1980), the
population was followed for cause-specific mortality or emigration up to November 9, 1980.
Expected number of deaths among truck drivers was calculated by using the 5-year age group
and 5-year time period death rates of the unexposed group and applying them to the person-years
accumulated by truck drivers. ICD Revision 8 was used to code the underlying cause of death.
Test-based CIs were calculated using Miettinen’s method. A Poisson distribution was assumed
for the smaller numbers, and CI was calculated based on exact Poisson distribution (Ciba-
Geigy). Total person-years accrued by truck drivers were 138,302, whereas for the unexposed
population, they were 407,780. There were 627 deaths among truck drivers and 3,811 deaths in
the unexposed group. Statistically significant excesses were observed for all cancer mortality
(SMR = 121, 95% CI = 104 to 140); cancer of respiratory organs (SMR = 160, 95% CI = 128 to
198), which was due mainly to cancer of bronchus and lung (SMR = 160, 95% CI = 126 to 200);
and multiple myeloma (SMR = 439, 95% CI = 142 to 1,024). When lung cancer mortality was
further explored by age groups, excesses were observed in most age groups (30 to 39, 45 to 49,
50 to 54, 55 to 59, 60 to 64, and 65 to 74), but there were small numbers of deaths in each group
when stratified by age, and the excesses were statistically significant for the 55 to 59 (SMR =
229, O = 19, 95% CI = 138 to 358) and 60 to 64 (SMR = 227, O = 22, 95% CI = 142 to 344) age
groups only.
As acknowledged by the author, the study has quite a few methodologic limitations. The
exposure to DE is assumed in truck drivers based on use of diesel-powered trucks, but no
validation of qualitative or quantitative exposure is attempted. It is also not known whether any

7-25
of these truck drivers or any other laborers had changed jobs after the census of November 9,
1970, thus creating potential misclassification bias in exposure to DE. The truck drivers and the
unexposed laborers were from the same socioeconomic class and may have the same smoking
habits. Still, the lack of information on smoking data and a 36% rural population (usually
consuming less tobacco) in the unexposed group may potentially confound the lung cancer
results. However, a population survey carried out in 1988 showed very little difference in
smoking habits of residents of rural areas and the total Danish male population. The investigator
reports that diesel trucks were introduced in Denmark after World War II, and since the late
1940s the majority of the Danish fleet has been composed of diesel trucks. Consequently, even
though the follow-up period is relatively short, the truck drivers may have had exposure to DE
for 20 to 30 years. Therefore, the finding of excess lung cancer in this study is consistent with
the findings of other truck driver studies.
7.2.1.10. Saverin et al. (1999): DE and Lung Cancer Mortality in Potash Mining
This is a cohort mortality study conducted in male potash miners in Germany. The
mines began using mobile diesel-powered vehicles in 1969 and 1970. Miners who had worked
underground for at least 1 year after 1969 to 1991, when the mines were closed, were followed
from 1970 to 1994. A total of 5,981 individuals were identified from the medical records by a
team of medical personnel familiar with the mining technology. A total of 5,536 were eligible
for follow-up after 5.5% were excluded due to implausible or incomplete work history and 1.9%
were lost to follow-up. A subcohort of 3,258 miners who had worked for at least 10 years
underground (80% had held a single job) was also identified. The miners’ biannual medical
examination records were used to extract the information about personal data, smoking data, and
pre-mining occupation, and to reconstruct a chronology of workplaces occupied by the worker
since hire for each person.
Exposure categories were defined as production, maintenance, and workshop, roughly
corresponding to high, medium, and low. Concentrations of total carbon, including elemental
and organics, were measured in the airborne fine dust in 1992. A total of 255 samples covering
all workplaces was obtained. Most were personal dust samples; some were area dust samples.
Cumulative exposure was calculated for each miner, for each year of observation, using the work
chronology and the work category. For the workshop category years of employment were
considered as exposure time; for production and maintenance years of employment was
weighted by a factor of 5/8, since these workers for an 8-hour shift worked for only 5 hours
underground. As neither the mining technology nor the type of machinery used had changed
substantially from 1970 to 1992, the exposure measurements were considered to represent the
exposures throughout the study period. Accrued person-years were classified into cumulative

7-26
exposures and were expressed in intervals of 0.5 ymg/m3. Both the exposure data and the
smoking data obtained from the medical files were validated by personal interviews with 1,702
cohort members. Death certificates were obtained from local health centers for 94.4% of
deceased members. Autopsy data were available for 13% of the deceased. Internal comparison
was done between production and workshop categories. Using East German general male
population rates, SMRs were computed for the total cohort as well as the subcohort. Analyses
were done using Poisson and Cox regression models.
The concentrations of total carbon for production, maintenance, and workshop categories
were 0.39 mg/m3, 0.23 mg/m3, and 0.12 mg/m3, respectively. The cumulative exposure ranged
from 0.25 ymg/m3 to 6.25 ymg/m3. The regression analysis showed that the cohort’s smoking
habits were homogenous and that smoking had an even distribution over cumulative exposure.
A total of 424 deaths were observed for the entire cohort (SMR = 54). The all-cancer
deaths were 133, of which 38 were from lung cancer (SMR = 78). Analysis for the subcohort
using the internal comparison group of low exposure (workshop category, mean cumulative
exposure = 2.12 ymg/m3) RR of 2.17 (95% CI = 0.79, 5.99) was found for the production
category (mean cumulative exposure = 4.38 ymg/m3). The relative risks for lung cancer for 20
years of exposure in the production category (highest exposure = cumulative exposure of 4.9
ymg/m3) were calculated using Poisson and Cox regression methods. RRs of 1.16 and 1.68 were
observed for the total cohort, while RRs of 1.89 and 2.7 were observed for the subcohort by
Poisson and Cox regression methods respectively.
The main strengths of the study are the information available on DE exposure and
smoking. Although these potash miners were exposed to salt dust and nitric gases, exposures to
other confounders such as heavy metals and radon were absent. Smoking does not seem to be a
confounder in this study but cannot be completely ruled out. Unfortunately, the age distribution
of the cohort is not available. Since there were only 424 deaths in 25 years of follow-up in this
cohort of 5,536, it appears that the cohort is young. Although lung cancer risk was elevated by
twofold in the production category of the subcohort of miners who had worked for at least 10
years underground at the same job for 80% of their time and did not have more than 3 jobs, it
was not statistically significant. The follow-up period for this study was 25 years, but the cohort
members could have entered the cohort any time between 1970 and 1990, as long as they
worked underground for a year, i.e., they could have worked in the mines for 1 year to 21 years.
Thus, the authors may not have had enough follow-up or latency to observe the lung cancer
excess. Despite these limitations, the results of this study provide suggestive evidence for the
causal association between DE and excess lung cancer.
Table 7-1 summarizes the above cohort studies.
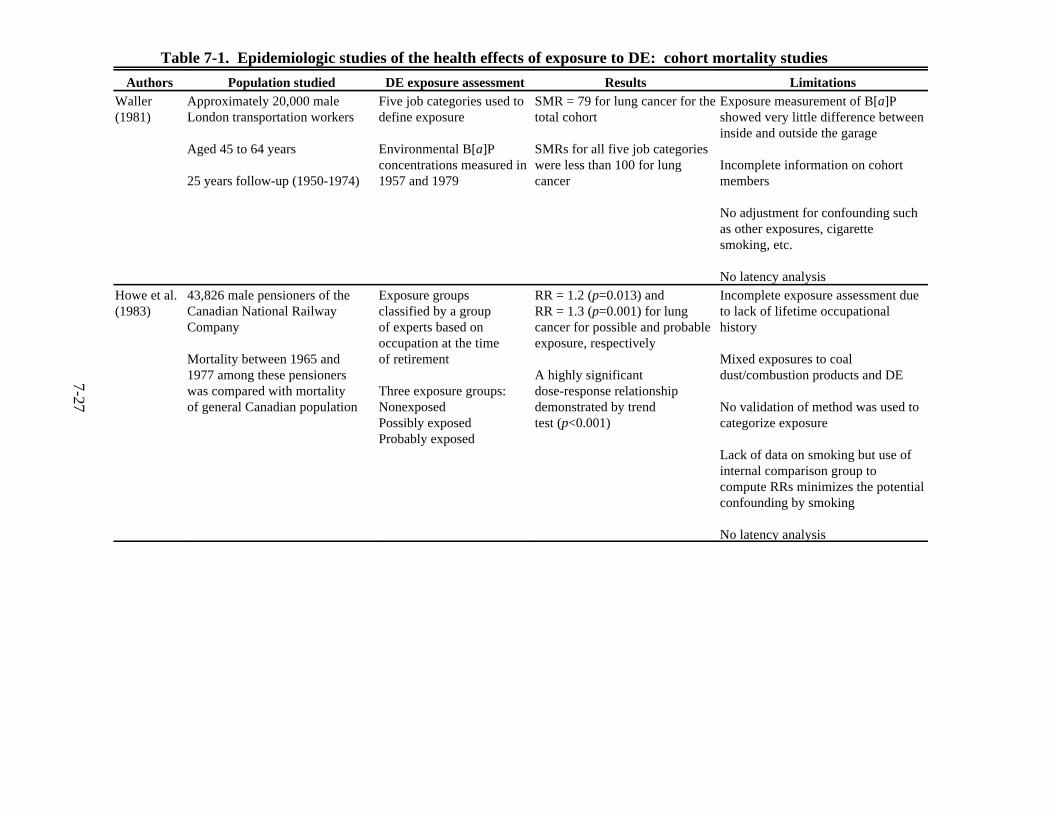
Table 7-1. Epidemiologic studies of the health effects of exposure to DE: cohort mortality studies
Authors Population studied DE exposure assessment Results LimitationsWaller(1981)
Approximately 20,000 maleLondon transportation workers
Aged 45 to 64 years
25 years follow-up (1950-1974)
Five job categories used todefine exposure
Environmental B[a]Pconcentrations measured in1957 and 1979
SMR = 79 for lung cancer for thetotal cohort
SMRs for all five job categorieswere less than 100 for lungcancer
Exposure measurement of B[a]Pshowed very little difference betweeninside and outside the garage
Incomplete information on cohortmembers
No adjustment for confounding suchas other exposures, cigarettesmoking, etc.
No latency analysisHowe et al.(1983)
43,826 male pensioners of theCanadian National RailwayCompany Mortality between 1965 and1977 among these pensionerswas compared with mortalityof general Canadian population
Exposure groupsclassified by a groupof experts based onoccupation at the timeof retirement
Three exposure groups:NonexposedPossibly exposedProbably exposed
RR = 1.2 (p=0.013) andRR = 1.3 (p=0.001) for lungcancer for possible and probableexposure, respectively A highly significantdose-response relationshipdemonstrated by trendtest (p<0.001)
Incomplete exposure assessment dueto lack of lifetime occupationalhistory
Mixed exposures to coaldust/combustion products and DE
No validation of method was used tocategorize exposure Lack of data on smoking but use ofinternal comparison group tocompute RRs minimizes the potentialconfounding by smoking
No latency analysis
7-27
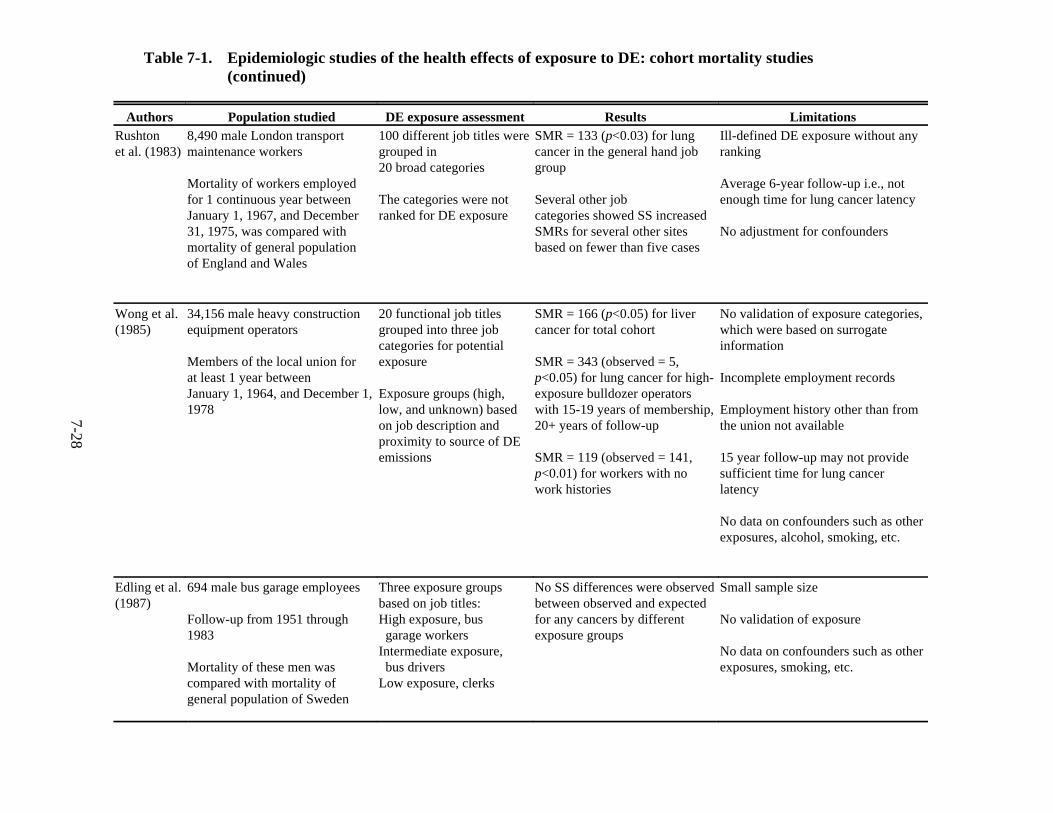
Table 7-1. Epidemiologic studies of the health effects of exposure to DE: cohort mortality studies(continued)
Authors Population studied DE exposure assessment Results LimitationsRushtonet al. (1983)
8,490 male London transportmaintenance workers
Mortality of workers employedfor 1 continuous year betweenJanuary 1, 1967, and December31, 1975, was compared withmortality of general populationof England and Wales
100 different job titles weregrouped in20 broad categories
The categories were notranked for DE exposure
SMR = 133 (p<0.03) for lungcancer in the general hand jobgroup
Several other jobcategories showed SS increasedSMRs for several other sitesbased on fewer than five cases
Ill-defined DE exposure without anyranking
Average 6-year follow-up i.e., notenough time for lung cancer latency
No adjustment for confounders
Wong et al.(1985)
34,156 male heavy constructionequipment operators
Members of the local union forat least 1 year betweenJanuary 1, 1964, and December 1,1978
20 functional job titlesgrouped into three jobcategories for potentialexposure
Exposure groups (high,low, and unknown) basedon job description andproximity to source of DEemissions
SMR = 166 (p<0.05) for livercancer for total cohort
SMR = 343 (observed = 5,p<0.05) for lung cancer for high-exposure bulldozer operatorswith 15-19 years of membership,20+ years of follow-up
SMR = 119 (observed = 141,p<0.01) for workers with nowork histories
No validation of exposure categories,which were based on surrogateinformation
Incomplete employment records
Employment history other than fromthe union not available
15 year follow-up may not providesufficient time for lung cancerlatency
No data on confounders such as otherexposures, alcohol, smoking, etc.
Edling et al.(1987)
694 male bus garage employees
Follow-up from 1951 through1983
Mortality of these men wascompared with mortality ofgeneral population of Sweden
Three exposure groupsbased on job titles:High exposure, bus garage workersIntermediate exposure, bus driversLow exposure, clerks
No SS differences were observedbetween observed and expectedfor any cancers by differentexposure groups
Small sample size
No validation of exposure
No data on confounders such as otherexposures, smoking, etc.
7-28
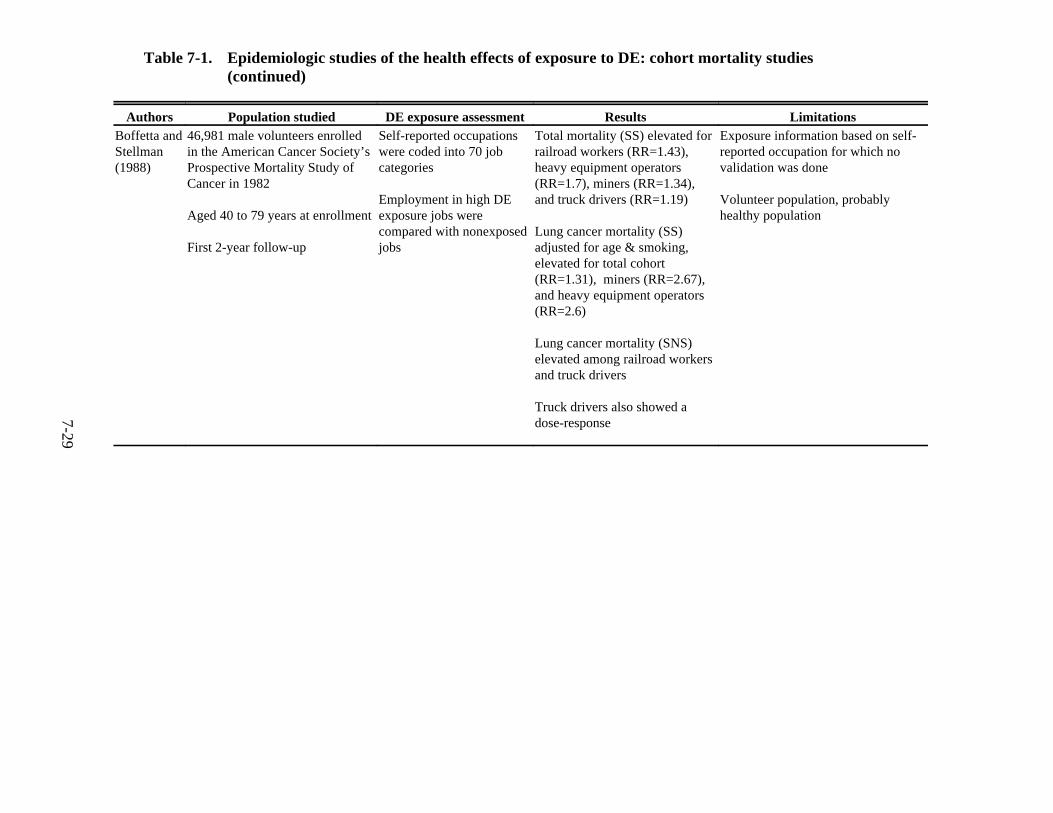
Table 7-1. Epidemiologic studies of the health effects of exposure to DE: cohort mortality studies(continued)
Authors Population studied DE exposure assessment Results LimitationsBoffetta andStellman(1988)
46,981 male volunteers enrolledin the American Cancer Society’sProspective Mortality Study ofCancer in 1982
Aged 40 to 79 years at enrollment
First 2-year follow-up
Self-reported occupationswere coded into 70 jobcategories
Employment in high DEexposure jobs werecompared with nonexposedjobs
Total mortality (SS) elevated forrailroad workers (RR=1.43),heavy equipment operators(RR=1.7), miners (RR=1.34),and truck drivers (RR=1.19)
Lung cancer mortality (SS)adjusted for age & smoking,elevated for total cohort(RR=1.31), miners (RR=2.67),and heavy equipment operators(RR=2.6)
Lung cancer mortality (SNS)elevated among railroad workersand truck drivers
Truck drivers also showed adose-response
Exposure information based on self-reported occupation for which novalidation was done
Volunteer population, probablyhealthy population
7-29
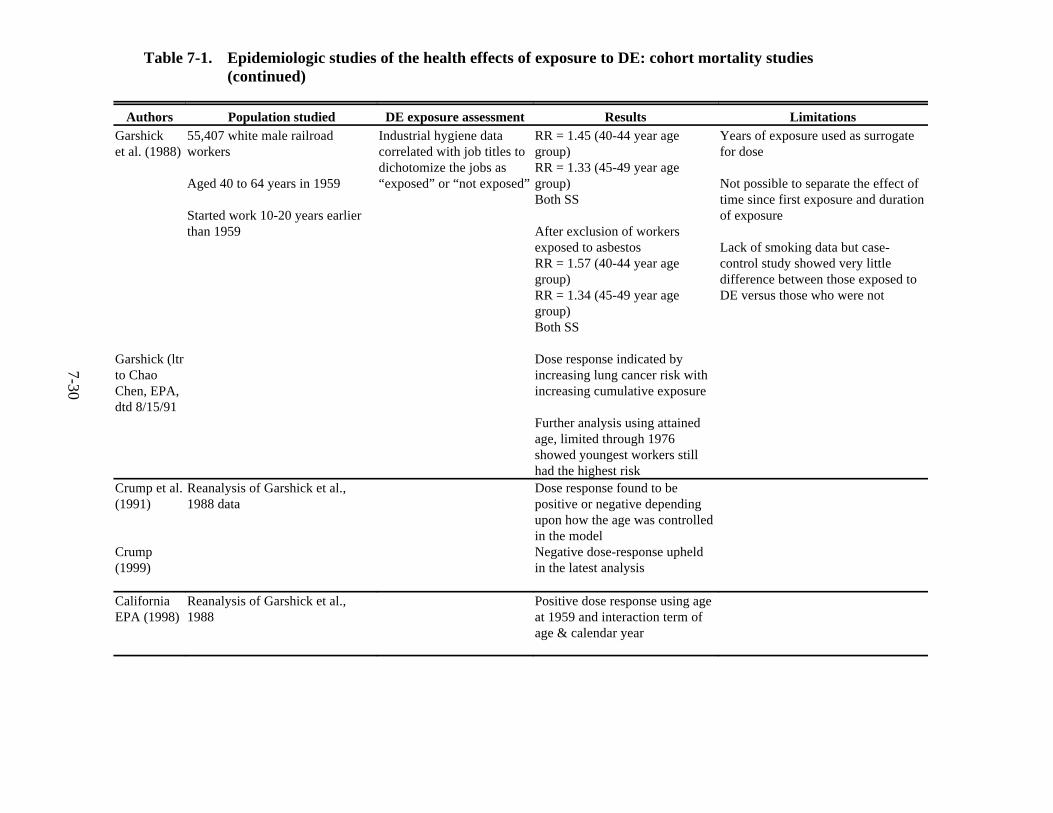
Table 7-1. Epidemiologic studies of the health effects of exposure to DE: cohort mortality studies(continued)
Authors Population studied DE exposure assessment Results LimitationsGarshicket al. (1988)
Garshick (ltrto ChaoChen, EPA,dtd 8/15/91
55,407 white male railroadworkers
Aged 40 to 64 years in 1959
Started work 10-20 years earlierthan 1959
Industrial hygiene datacorrelated with job titles todichotomize the jobs as“exposed” or “not exposed”
RR = 1.45 (40-44 year agegroup)RR = 1.33 (45-49 year agegroup)Both SS
After exclusion of workersexposed to asbestosRR = 1.57 (40-44 year agegroup)RR = 1.34 (45-49 year agegroup)Both SS
Dose response indicated byincreasing lung cancer risk withincreasing cumulative exposure
Further analysis using attainedage, limited through 1976showed youngest workers stillhad the highest risk
Years of exposure used as surrogatefor dose
Not possible to separate the effect oftime since first exposure and durationof exposure
Lack of smoking data but case-control study showed very littledifference between those exposed toDE versus those who were not
Crump et al. (1991)
Crump (1999)
Reanalysis of Garshick et al.,1988 data
Dose response found to bepositive or negative dependingupon how the age was controlledin the modelNegative dose-response upheldin the latest analysis
CaliforniaEPA (1998)
Reanalysis of Garshick et al.,1988
Positive dose response using ageat 1959 and interaction term ofage & calendar year
7-30

Table 7-1. Epidemiologic studies of the health effects of exposure to DE: cohort mortality studies(continued)
Authors Population studied DE exposure assessment Results Limitations
7-31
Gustavssonet al. (1990)
695 male workers from 5 busgarages in Stockholm, Sweden,who had worked for 6 monthsbetween 1945 and 1970
34 years follow-up (1952-1986)
Nested case-control study17 cases, six controls for eachcase matched on age ± 2 years
Four DE indices werecreated: 0 to 10, 10 to 20, 20-30,and >30 based on job tasksand duration of work
SNS SMRs of 122 and 115 (OAand GP), respectively
Case-control study resultsshowed dose response: RR = 1.34 (10 to 20)RR = 1.81 (20 to 30)RR = 2.43 (>30)
All SS with 0-10 as comparisongroup
Exposure matrix based on job tasks(not on actual measurements)
Small cohort, hence low power
Lack of smoking data is unlikely toconfound the results since it is anested case-control study
Hansen(1993)
Cohort of 57,249 unskilledlaborers, ages 15 to 74, inDenmark (nationwide census file)November 9, 1970
Follow-up through November 9,1980
DE exposure assumedbased on diesel-poweredtrucks
SS SMRs for lung cancer :SMR = 160 for total populationSMR = 229 for age 55-59 years SMR = 227 for age 60-64 years
No actual exposure data available
Lack of smoking data but populationsurvey showed very little differencebetween rural and urban smokinghabits
Job changes may have occurred fromlaborer to driver
Short follow-up period
Saverin etal. (1999)
Cohort of 5,536 potash minerswho had worked underground forat least 1 year after 1969
Subcohort of 3,258 who hadworked for at least 10 yearsunderground
Follow-up from 1970 to 1994
DE exposure categoriesdefined as: production (high)maintenance (medium)workshop (low)
225 air samples obtained:for total carbon, organics,& fine dust in 1992
SNS increased RRs adjusted forsmoking: 1.68 and 2.7 for totalcohort & subcohort, respectively
Small, young cohort
Few deaths
No latency analysis
Abbreviations: RR = relative risk; SMR = standardized mortality ratio; SNS = statistically nonsignificant; SS = statistically significant;O = occupationally active; GP = general population.

7-32
7.2.2. Case-Control Studies of Lung Cancer
7.2.2.1. Hall and Wynder (1984): A Case-Control Study of DE Exposure and Lung Cancer
Hall and Wynder (1984) conducted a case-control study of 502 male lung cancer cases
and 502 controls without tobacco-related diseases that examined an association between
occupational DE exposure and lung cancer. Histologically confirmed primary lung cancer
patients who were 20 to 80 years old were ascertained from 18 participating hospitals in 6 U.S.
cities 12 months prior to the interview. Eligible controls, patients at the same hospitals without
tobacco-related diseases, were matched to cases by age (± 5 years), race, hospital, and hospital
room status. The number of male lung cancer cases interviewed totaled 502, which was 64% of
those who met the study criteria for eligibility. Of the remaining 36%, 8% refused, 21% were
too ill or had died, and 7% were unreliable. Seventy-five percent of eligible controls completed
interviews. Of these interviewed controls, 49.9% were from the all-cancers category, whereas
50.1% were from the all-noncancers category. All interviews were obtained in hospitals to
gather detailed information on smoking history, coffee consumption, artificial sweetener use,
residential history, and abbreviated medical history as well as standard demographic variables.
Occupational information was elicited by a question on the usual lifetime occupation and was
coded by the abbreviated list of the U.S. Bureau of Census Codes. The odds ratios were
calculated to evaluate the association between DE exposure and risk of lung cancer incidence.
Summary odds ratios were computed by the Mantel-Haenszel method after adjusting for
potential confounding by age, smoking, and socioeconomic class. Two-sided, 95% confidence
intervals were computed by Woolf’s method. Occupational exposure to DE was defined by two
criteria. First, occupational titles were coded “probably high exposure” as defined by the
industrial hygiene standards established for the various jobs. The job titles included under this
category were warehousemen, bus and truck drivers, railroad workers, and heavy equipment
operators and repairmen. The second method used the National Institute for Occupational Safety
and Health (NIOSH) criteria to analyze occupations by diesel exposure. In this method, the
estimated proportion of exposed workers was computed for each occupational category by using
the NIOSH estimates of the exposed population as the numerator and the estimates of
individuals employed in each occupational category from the 1970 census as the denominator.
Occupations estimated to have at least 20% of their employees exposed to DE were defined as
“high exposure,” those with 10% to 19% of their employees exposed were defined as “moderate
exposure,” and those with less than 10% of their employees exposed were defined as “low
exposure.”
Cases and controls were compared with respect to exposure. The relative risk was 2.0
(95% CI = 1.2, 3.2) for those workers who were exposed to DE versus those who were not. The
risk, however, decreased to a nonsignificant 1.4 when the data were adjusted for smoking.
7-33
Analysis by NIOSH criteria found a nonsignificant relative risk of 1.7 in the high- exposure
group. There were no significantly increased cancer risks by occupation either by the first
method or by the NIOSH method. To assess any possible synergism between DE exposure and
smoking, the lung cancer risks were calculated for different smoking categories. The relative
risks were 1.46 among nonsmokers and ex-smokers, 0.82 among current smokers of <20
cigarettes/day, and 1.3 among current smokers of 20+ cigarettes/day, indicating a lack of
synergistic effects.
The major strength of this study is the availability of a detailed smoking history for all
the study subjects. However, this is offset by lack of DE exposure measurements, use of a poor
surrogate for exposure, and lack of consideration of latency period. Information was collected
on only one major lifetime occupation, and it is likely that those workers who had more than one
major job may not have reported the occupation with the heaviest DE exposures. Furthermore,
the exposure categories based on job titles were broad, and thus would have made a true effect of
DE difficult to detect.
7.2.2.2. Damber and Larsson (1987): Occupation and Male Lung Cancer, a Case-Control
Study in Northern Sweden
A case-control study of lung cancer was conducted in northern Sweden to determine the
occupational risk factors that could explain the large geographic variations of lung cancer
incidence in that country. The study region comprised the three northernmost counties of
Sweden, with a total male population of about 390,000. The rural municipalities, with 15% to
20% of the total population, have forestry and agriculture as dominating industries, and the
urban areas have a variety of industrial activities (mines, smelters, steel factories, paper mills,
and mechanical workshops). All male cases of lung cancer reported to the Swedish Cancer
Registry during the 6-year period between 1972 and 1977 who had died before the start of the
study were selected. Of 604 eligible cases, 5 did not have microscopic confirmation, and in
another 5 the diagnosis was doubtful, but these cases were included nevertheless. Cases were
classified as small-cell carcinomas, squamous cell carcinomas, adenocarcinomas, and other
types. For each case a dead control was drawn from the National Death Registry matched by
sex, year of death, age, and municipality. Deaths in controls classified as lung cancer and
suicides were excluded. A living control matched to the case by sex, year of birth, and
municipality was also drawn from the National Population Registry. Postal questionnaires were
sent to close relatives of cases and dead controls, and to living controls themselves to collect data
on occupation, employment, and smoking habits. Replies were received from 589 cases (98%),
582 surrogates of dead controls (96%), and 453 living controls (97%).
7-34
Occupational data were collected on occupations or employment held for at least 1 year
and included type of industry, company name, task, and duration of employment.
Supplementary telephone interviews were performed if occupational data were lacking for any
period between age 20 and time of diagnosis. Data analysis involved calculation of the odds
ratios by the exact method based on the hypergeometric distribution and the use of a linear
logistic regression model to adjust for the potential confounding effects of smoking. Separate
analyses were performed with dead and living controls, and on the whole there was good
agreement between the two control groups. A person who had been active for at least 1 year in a
specific occupation was in the analysis assigned to that occupation.
Using dead controls, the odds ratios adjusted for smoking were 1.0 (95% CI = 0.7, 1.5)
and 2.7 (95% CI = 1.0, 8.1) for professional drivers ($1 year of employment) and underground
miners ($1 year of employment), respectively. For 20 or more years of employment in those
occupations, the odds ratios adjusted for smoking were 1.2 (95% CI = 0.9, 2.6) and 9.8 (95% CI
= 1.5, 414). These were the only two occupations listed with potential DE exposure. An excess
significant risk was detected for copper smelter workers, plumbers, electricians, and asbestos
workers, as well as concrete and asphalt workers. All the odds ratios were calculated by
adjusting for age, smoking, and municipality. A comparison with the live controls resulted in
the odds ratios being lower than those observed with dead controls, and none were statistically
significant in this comparison.
This study did not detect any excess risk of lung cancer for professional drivers, who,
among all the occupations listed, had the most potential for exposure to motor vehicle exhaust.
However, it is not known whether these drivers were exposed exclusively to gasoline exhaust,
DE, or varying degrees of both. An excess risk was detected for underground miners, but it is
not known if this was due to diesel emissions from engines or from radon daughters in poorly
ventilated mines. Although a high response rate (98%) was obtained by the postal
questionnaires, the use of surrogate respondents is known to lead to misclassification errors that
can bias the results in either direction.
7.2.2.3. Lerchen et al. (1987): Lung Cancer and Occupation in New Mexico
This is a population-based case-control study conducted in New Mexico that examined
the association between occupation and occurrence of lung cancer in Hispanic and non-Hispanic
whites. Cases involved residents of New Mexico, 25 through 84 years of age, and diagnosed
between January 1, 1980, and December 31, 1982, with primary lung cancer, excluding
bronchioalveolar carcinoma. Cases were ascertained through the New Mexico Tumor Registry,
which is a member of the Surveillance Epidemiology and End Results (SEER) Program of the
National Cancer Institute. Controls were chosen by randomly selecting residential telephone
7-35
numbers and, for those over 65 years of age, from the Health Care Financing Administration’s
roster of Medicare participants. They were frequency-matched to cases for sex, ethnicity, and
10-year age category with a ratio of 1.5 controls per case. The 506 cases (333 males and 173
females) and 771 controls (499 males and 272 females) were interviewed, with a nonresponse
rate of 11% for cases. Next of kin provided interviews for 50% and 43% of male and female
cases, respectively. Among controls, only 2% of the interviews were provided by next of kin for
each sex. Data were collected by personal interviews conducted by bilingual interviewers in the
participants’ homes. A lifetime occupational history and a self-reported history of exposure to
specific agents were obtained for each job held for at least 6 months since age 12. Questions
were asked about the title of the position, duties performed, location and nature of industry, and
time at each job title. A detailed smoking history was also obtained. The variables on
occupational exposures were coded according to the Standard Industrial Classification scheme
by a single person and reviewed by another. To test the hypothesis about high-risk jobs for lung
cancer, the principal investigator created an a priori listing of suspected occupations and
industries by a two-step process involving a literature review for implicated industries and
occupations. The principal investigator also determined the appropriate Standard Industrial
Classification and Standard Occupational Codes associated with job titles. For four
agents—asbestos, wood dust, DE, and formaldehyde—the industries and occupations determined
to have exposure were identified, and linking of specific industries and occupations was based
on literature review and consultation with local industrial hygienists.
The relative odds were calculated for suspect occupations and industries, classifying
individuals as ever employed for at least 1 year in an industry or occupation and defining the
reference group as those subjects never employed in that particular industry or occupation.
Multiple logistic regression models were used to control simultaneously for age, ethnicity, and
smoking status. For occupations with potential DE exposure, the analysis showed no excess
risks for diesel engine mechanics and auto mechanics. Similarly, when analyzed by exposure to
specific agents, the odds ratio (OR) adjusted for age, smoking, and ethnicity was not elevated for
DE fumes (OR = 0.6, 95% CI = 0.2, 1.6). Significantly elevated ORs were found for uranium
miners (OR = 2.8), underground miners (OR = 2.4), construction workers, and welders (OR =
4.3). No excess risks were detected for the following industries: shipbuilding, petroleum
refining, printing, blast furnace, and steel mills. No excess risks were detected for the following
occupations: construction workers, painters, plumbers, paving equipment operators, roofers,
engineers and firemen, woodworkers, and shipyard workers. Females were excluded from
detailed analysis because none of the Hispanic female controls had been employed in high-risk
jobs; among the non-Hispanic white controls, employment in a high-risk job was recorded for at

7-36
least five controls for only two industries, construction and painting, for which the OR were not
significantly elevated. Therefore, the analyses were presented for males only.
Among the many strengths of this study are its population-based design, high
participation rate, detailed smoking history, and the separate analysis done for two ethnic groups,
southwestern Hispanic and non-Hispanic white males. The major limitations pertain to the
occupational exposure data. Job titles obtained from occupational histories were used as proxy
for exposure status, but these were not validated. Further, for nearly half the cases, next of kin
provided occupational histories. The authors acknowledge the above sources of bias but state
without substantiation that these biases would not strongly affect their results. They also did not
use a job exposure matrix to link occupations to exposures and did not provide details on the
method they used to classify individuals as DE exposed based on reported occupations. The
observed absence of an association for exposure to asbestos, a well-established lung carcinogen,
may be explained by the misclassification errors in exposure status or by sample size constraints
(not enough power). Likewise, the association for DE reported by only 7 cases and 17 controls
also may have gone undetected because of low power. In conclusion, there is insufficient
evidence from this study to confirm or refute an association between lung cancer and DE
exposure.
7.2.2.4. Garshick et al. (1987): A Case-Control Study of Lung Cancer and DE Exposure in
Railroad Workers
An earlier pilot study of the mortality of railroad workers by the same investigators
(Schenker et al., 1984) found a moderately high risk of lung cancer among workers exposed to
DE compared with those who were not. Based on these findings the investigators conducted a
case-control study of lung cancer in the same population. The population base for this case-
control study was approximately 650,000 active and retired male U.S. railroad workers with 10
years or more of railroad service who were born in 1900 or later. The U.S. Railroad Retirement
Board (RRB), which operates the retirement system, is separate from the Social Security System,
and to qualify for the retirement or survivor benefits the workers had to acquire 10 years or more
of service. Information on deaths that occurred between March 1, 1981, and February 28, 1982,
was obtained from the RRB. For 75% of the deceased population, death certificates were
obtained from the RRB, and, for the remaining 25%, they were obtained from the appropriate
State departments of health. Cause of death was coded according to the eighth revision of the
ICD. The cases were selected from deaths with primary lung cancer, which was the underlying
cause of death in most cases. Each case was matched to two deceased controls whose dates of
birth were within 2.5 years of the date of birth of the case and whose dates of death were within
31 days of the date of death noted in the case. Controls were selected randomly from workers

7-37
who did not have cancer noted anywhere on their death certificates and who did not die of
suicide or of accidental or unknown causes.
Each subject’s work history was determined from a yearly job report filed by his
employer with the RRB from 1959 until death or retirement. The year 1959 was chosen as the
effective start of DE exposure for this study since by this time 95% of the locomotives in the
United States were diesel powered. Investigators acknowledge that because the transition to
diesel-powered engines took place in the early 1950s, some workers had additional exposure
prior to 1959; however, if a worker had died or retired prior to 1959, he was considered
unexposed. Exposure to DE was considered to be dichotomous for this study, which was
assigned based on an industrial hygiene evaluation of jobs and work areas. Selected jobs with
and without regular DE exposure were identified by a review of job title and duties. Personal
exposure was assessed in 39 job categories representative of workers with and without DE
exposure. Those jobs for which no personal sampling was done were considered exposed or
unexposed based on similarities in job activities and work locations and by degree of contact
with diesel equipment. Asbestos exposure was categorized based on jobs held in 1959, or on the
last job held if the subject retired before 1959. Asbestos exposure in railroads occurred
primarily during the steam engine era and was related mostly to the repair of locomotive steam
boilers that were insulated with asbestos. Smoking history information was obtained from the
next of kin.
Death certificates were obtained for approximately 87% of the 15,059 deaths reported by
the RRB, from which 1,374 cases of lung cancer were identified. Fifty-five cases of lung cancer
were excluded from the study for either incomplete data (20) or refusal by two States to use
information on death certificates to contact the next of kin. Successful matching to at least one
control with work histories was achieved for 335 (96%) cases #64 years of age at death and 921
(95%) cases $65 years of age at death. In both age groups, 90% of the cases were matched with
two controls. There were 2,385 controls in the study; 98% were matched within ± 31 days of
the date of death, whereas the remaining 2% were matched within 100 days. Deaths from
diseases of the circulatory system predominated among controls. Among the younger workers,
approximately 60% had exposure to DE, whereas among older workers, only 47% were exposed
to DE.
Analysis by a regression model, in which years of DE exposure were the sum total of the
number of years in diesel-exposed jobs, used as a continuous exposure variable, yielded an odds
ratio of lung cancer of 1.39 (95% CI = 1.05, 1.83) for >20 years of DE exposure in the #64
years of age group. After adjustment for asbestos exposure and lifetime smoking (pack-years),
the odds ratio was 1.41 (95% CI = 1.06, 1.88). Both crude odds ratio and asbestos exposure as
well as lifetime smoking-adjusted odds ratio for the $65 years of age group were not significant.
7-38
Increasing years of DE exposure, categorized as $20 diesel years and 5 to 19 diesel years, with 0
to 4 years as the referent group, showed significantly increased risk in the #64 years of age
group after adjusting for asbestos exposure and pack-year category of smoking. For individuals
who had $20 years of DE exposure, the odds ratio was 1.64 (95% CI = 1.18, 2.29), whereas
among individuals who had 5 to 19 years of DE exposure, the odds ratio was 1.02 (95% CI =
0.72, 1.45). In the $65 years of age group, only 3% of the workers were exposed to DE for
more than 20 years. Relative odds for 5 to 19 years and $20 years of diesel exposure were less
than 1 (p>0.01) after adjusting for smoking and asbestos exposure.
Alternative models to explain past asbestos exposure were tested. These were variables
for regular and intermittent exposure groups and an estimate of years of exposure based on
estimated years worked prior to 1959. No differences in results were seen. The interactions
between DE exposure and the three pack-year categories (<50, >50, and missing pack-years)
were explored. The cross-product terms were not significant. A model was also tested that
excluded recent DE exposure occurring within the 5 years before death and gave an odds ratio of
1.43 (95% CI = 1.06, 1.94), adjusted for cigarette smoking and asbestos exposure, for workers
with 15 years of cumulative exposure. For workers with 5 to 14 years of cumulative exposure,
the OR were not significant.
The many strengths of the study are consideration of confounding factors such as
asbestos exposure and smoking; classification of DE exposures by job titles and industrial
hygiene sampling; exploration of interactions between smoking, asbestos exposure, and DE
exposure; and good ascertainment (87%) of death certificates from the 15,059 deaths reported by
the RRB.
The investigators also recognized and reported the following limitations: overestimation
of cigarette consumption by surrogate respondents, which may have exaggerated the
contribution of smoking to lung cancer risk, and use of the Interstate Commerce Commission
(ICC) job classification as a surrogate for exposure, which may have led to misclassification of
DE exposure jobs with low intensity and intermittent exposure, such as railroad police and bus
drivers, as unexposed. These two limitations would result in underestimation of the lung cancer
risk. This source of error could have been avoided if DE exposures were categorized by a
specific dose range associated with a job title that could have been classified as heavy, medium,
low, and zero exposure instead of a dichotomous variable. The use of death certificates to
identify cases and controls may have resulted in misclassification. Controls may have had
undiagnosed primary lung cancer, and lung cancer cases might have been secondary lesions
misdiagnosed as primary lung cancer. However, the investigators quote a third National Cancer
Survey report in which the death certificates for lung cancer were coded appropriately in 95% of
the cases. Last, as in all previous studies, there is a lack of data on the contribution of unknown

7-39
occupational or environmental exposures and passive smoking. In conclusion, this study
provides strong evidence that occupational DE emission exposure increases the risk of lung
cancer.
7.2.2.5. Benhamou et al. (1988): Occupational Risk Factors of Lung Cancer in a French
Case-Control Study
This is a case-control study of 1,625 histologically confirmed cases of lung cancer and
3,091 matched controls, conducted in France between 1976 and 1980. This study was part of an
international study to investigate the role of smoking and lung cancer. Each case was matched
with one or two controls, whose diseases were not related, to tobacco use, sex, age at diagnosis
(± 5 years), hospital of admission, and interviewer. Information was obtained from both cases
and controls on place of residence since birth, educational level, smoking, and drinking habits.
A complete lifetime occupational history was obtained by asking participants to give their
occupations from the most recent to the first. Women were excluded because most of them had
listed no occupation. Men who smoked cigars and pipes were excluded because there were very
few in this category. Thus, the study was restricted to nonsmokers and cigarette smokers.
Cigarette smoking exposure was defined by age at the first cigarette (nonsmokers, #20 years, or
>20 years), daily consumption of cigarettes (nonsmokers, <20 cigarettes a day, and $20
cigarettes a day), and duration of cigarette smoking (nonsmokers, <35 years, and $35 years).
The data on occupations were coded by a panel of experts according to their own chemical or
physical exposure determinations. Occupations were recorded blindly using the International
Standard Classification of Occupations. Data on 1,260 cases and 2,084 controls were available
for analysis. The remaining 365 cases and 1,007 controls were excluded because they did not
satisfy the required smoking status criteria.
A matched logistic regression analysis was performed to estimate the effect of each
occupational exposure after adjusting for cigarette status. Matched relative risk ratios were
calculated for each occupation with the baseline category, which consisted of patients who had
never been engaged in that particular occupation. The matched RR ratios, adjusted for cigarette
smoking for the major groups of occupations, showed that the risks were significantly higher for
production and related workers, transport equipment operators, and laborers (RR = 1.24, 95% CI
= 1.04, 1.47). On further analysis of this group, for occupations with potential diesel emission
exposure, significant excess risks were found for motor vehicle drivers (RR = 1.42, 95% CI =
1.07, 1.89) and transport equipment operators (RR = 1.35, 95% CI = 1.05, 1.75). No interaction
with smoking status was found in any of the occupations. The only other significant excess was
observed for miners and quarrymen (RR = 2.14, 95% CI = 1.07, 4.31). None of the significant
associations showed a dose-response relationship with duration of exposure.

7-40
This study was designed primarily to investigate the relationship between smoking (not
occupations or environmental exposures) and lung cancer. Although an attempt was made to
obtain complete occupational histories, the authors did not clarify whether, in the logistic
regression analysis, they used the subjects’ first occupation, predominant occupation, last
occupation, or ever worked in that occupation as the risk factor of interest. The most important
limitation of this study is that the occupations were not coded into exposures for different
chemical and physical agents, thus precluding the calculation of relative risks for diesel
exposure. Using occupations as surrogate measures of diesel exposure, an excess significant risk
was obtained for motor vehicle drivers and transport equipment operators, but not for motor
mechanics. However, it is not known if subjects in these occupations worked with diesel
engines or nondiesel engines.
7.2.2.6. Hayes et al. (1989): Lung Cancer in Motor Exhaust-Related Occupations
This study reports the findings from an analysis of pooled data from three lung cancer
case-control studies that examine in detail the association between employment in motor
exhaust-related (MER) occupations and lung cancer risk adjusted for confounding by smoking
and other risk factors. The three studies were carried out by the National Cancer Institute in
Florida (1976 to 1979), New Jersey (1980 to 1981), and Louisiana (1979 to 1983). These three
studies were selected because the combined group would provide a sufficient sample to detect a
risk of lung cancer in excess of 50% among workers in MER occupations. The analyses were
restricted to males who had given occupational history. The Florida study was hospital based,
with cases ascertained through death certificates. Controls were randomly selected from hospital
records and death certificates, excluding psychiatric diseases, matched by age and county. The
New Jersey study was population based, with cases ascertained through hospital records, cancer
registry, and death certificates. Controls were selected from among the pool of New Jersey
licensed drivers and death certificates. The Louisiana study was hospital based (it is not
specified how the cases were ascertained), and controls were randomly selected from hospital
patients, excluding those with lung diseases and tobacco-related cancers.
A total of 2,291 cases of male lung cancers and 2,570 controls were eligible, and the data
on occupations were collected by next-of-kin interviews for all jobs held for 6 months or more,
including the industry, occupation, and number of years employed. The proportion of next-of-
kin interviews varied by site from 50% in Louisiana to 85% in Florida. The coding schemes
were reviewed to identify MER occupations, which included truck drivers and heavy equipment
operators (cranes, bulldozers, and graders); bus drivers, taxi drivers, chauffeurs, and other motor
vehicle drivers; and automobile and truck mechanics. Truck drivers were classified as routemen
and delivery men and other truck drivers. All jobs were also classified with respect to potential

7-41
exposure to known and suspected lung carcinogens. ORs were calculated by the maximum
likelihood method, adjusting for age by birth year, usual amount smoked, and study area.
Logistic regression models were used to examine the interrelationship of multiple variables.
A statistically significant excess risk was detected for employment of 10 years or more
for all MER occupations (except truck drivers) adjusted for birth cohort, usual daily cigarette
use, and study area. The odds ratio for lung cancer using data gathered by direct interviews was
1.4 (95% CI = 1.1, 2.0), allowing for multiple MER employment, and 2.0 (95% CI = 1.3, 3.0),
excluding individuals with multiple MER employment. ORs for all MER employment, except
truck drivers who were employed for less than 10 years, were 1.3 (95% CI = 1.0, 1.7) and 1.3
(95% CI = 0.9, 1.8) including and excluding multiple MER employment, respectively. ORs
were then derived for specific MER occupations and, to avoid the confounding effects of
multiple MER job classifications, analyses were also done excluding subjects with multiple
MER job exposures. Truck drivers employed for more than 10 years had an odds ratio of 1.5
(95% CI = 1.1, 1.9). A similar figure was obtained excluding subjects with multiple MER
employment. An excess risk was not detected for truck drivers employed less than 10 years.
The only other job category that showed a statistically significant excess for lung cancer
included taxi drivers and chauffeurs who worked multiple MER jobs for less than 10 years (OR
= 2.5, 95% CI = 1.4, 4.8). For the same category, the risk for individuals working in that job for
more than 10 years was 1.2 (95% CI = 0.5, 2.6). A statistically significant positive trend
(p<0.05) with increasing employment of <2 years, 2 to 9 years, 10 to 19 years, and 20+ years
was observed for truck drivers but not for other MER occupations. A statistically nonsignificant
excess risk was also observed for heavy equipment operators, bus drivers, taxi drivers and
chauffeurs, and mechanics employed for 10 years or more. All of the above-mentioned ORs
were derived, adjusted for birth cohort, usual daily cigarette use, and State of residence.
Exposure to other occupational suspect lung carcinogens did not account for the excess risks
detected.
Results of this large study provide evidence that workers in MER jobs are at an excess
risk of lung cancer that is not explained by their smoking habits or exposures to other lung
carcinogens. Because no information on type of engine had been collected, it was not possible
to determine if the excess risk was due to exposure to DE or gasoline exhaust or a mixture of the
two. Among the study’s other limitations are a possible bias due to misclassification of jobs
reported by the large proportion of next-of-kin interviews. Such a bias would make the effect of
DE harder to detect due to broad categorization of jobs and the problems in classifying
individuals into uniform occupational groups based on the pooled data in the three studies that
used different occupational classification schemes.
7-42
7.2.2.7. Steenland et al. (1990): A Case-Control Study of Lung Cancer and Truck Driving in
the Teamsters Union
Steenland et al. conducted a case-control study of lung cancer deaths in the Teamsters
Union to determine the risk of lung cancer among different occupations. Death certificates were
obtained from the Teamsters Union files in the central States for 10,485 (98%) male decedents
who had filed claims for pension benefits and who had died in 1982 and 1983. Individuals were
required to have 20 years’ tenure in the union to be eligible to claim benefits. Cases comprised
all deaths (n = 1,288) from lung cancer, coded as ICD 162 or 163 for underlying or contributory
cause on the death certificate. The 1,452 controls comprised every sixth death from the entire
file, excluding deaths from lung cancer, bladder cancer, and motor vehicle accidents. Detailed
information on work history and potential confounders such as smoking, diet, and asbestos
exposure was obtained by questionnaire. Seventy-six percent of the interviews were provided by
spouses and the remainder by some other next of kin. The response rate was 82% for cases and
80% for controls. Using these interview data and the 1980 census occupation and industry
codes, subjects were classified either as nonexposed or as having held other jobs with potential
DE exposure. Data on job categories were missing for 12% of the study subjects. A second
work history file was also created based on the Teamsters Union pension application that lists
occupation, employer, and dates of employment. A three-digit U.S. census code for occupation
and industry was assigned to each job for each individual. This Teamsters Union work history
file did not have information on whether men drove diesel or gasoline trucks, and the four
principal occupations were long-haul drivers, short-haul or city drivers, truck mechanics, and
dockworkers. Subjects were assigned the job category in which they had worked the longest.
The case-control analysis was done using unconditional logistic regression. Separate
analyses were conducted for work histories from the Teamsters Union pension file and from
next-of-kin interviews. Covariate data were obtained from next-of-kin interviews. Analyses
were also performed for two time periods: employment after 1959 and employment after 1964.
These two cut-off years reflect years of presumed dieselization: 1960 for most trucking
companies and 1965 for independent driver and nontrucking firms. Data for analysis could be
obtained for 994 cases and 1,085 controls using Teamsters Union work history and for 872 cases
and 957 controls using next-of-kin work history. When exposure was considered as a
dichotomous variable, for both Teamsters Union and next-of-kin work history, no single job
category had an elevated risk. From the next-of-kin data, diesel truck drivers had an odds ratio
of 1.42 (95% CI = 0.74, 2.47) and diesel truck mechanics had an odds ratio of 1.35 (95% CI =
0.74, 2.47). ORs by duration of employment as a categorical variable were then estimated. For
the Teamsters Union work history data, when only employment after 1959 was considered, both
long-haul (p<0.04) and short-haul drivers (not significant) showed an increase in risk with

7-43
increased years of exposure. The length-of-employment categories for which the trends were
analyzed were 1 to 11 years, 12 to 17 years, and 18 years or more. Using 1964 as the cutoff
date, long-haul drivers continued to show a significant positive trend (p=0.04), with an odds
ratio of 1.64 (95% CI = 1.05, 2.57) for those who worked for 13+ years, the highest category.
Short-haul drivers, however, did not show a positive trend when 1964 was used as the cutoff
date. Similar trend analysis was done for most next-of-kin data. A marginal increase in risk with
increasing duration of employment as a truck driver (p=0.12) was observed. For truck drivers
who primarily drove diesel trucks for 35 years or longer, the odds ratio for lung cancer was 1.89
(95% CI = 1.04, 3.42). Similarly, the corresponding odds ratio was 1.34 (95% CI = 0.81, 2.22)
for both gasoline truck drivers and drivers who drove both types of trucks, and 1.09 (95% CI =
0.44, 2.66) for truck mechanics.
No significant interactions between age and DE exposure or smoking and DE exposure
were observed. All the ORs were adjusted for age, smoking, and asbestos in addition to various
exposure categories.
This is a well-designed and analyzed study. The main strengths of the study are the
availability of detailed records from the Teamsters Union, a relatively large sample size,
availability of smoking data , and measurements of exposures. The authors acknowledge some
limitations of this study, which include possible misclassifications of exposure and smoking
habits, as information was provided by next of kin; lack of sufficient latency to observe lung
cancer excess; and a small nonexposed group (n = 120). Also, they could not evaluate the
concordance between Teamsters Union and next-of-kin job categories easily because job
categories were defined differently in each data set. No data were available on levels of diesel
exposure for the different job categories. Despite these limitations, the positive findings of this
study, which are probably underestimated, provide a positive evidence toward causal association
between DE exposure and excess lung cancer.
7.2.2.8. Steenland et al. (1998): DE and Lung Cancer in the Trucking Industry:
Exposure-Response Analyses and Risk Assessment
Steenland et al. (1998) conducted an exposure-response analysis by supplementing the
data from their earlier case-control study of lung cancer and truck drivers in the Teamsters
Union (Steenland et al., 1990) with exposure estimates based on a 1990 industrial hygiene
survey of elemental carbon exposure, a surrogate for DE in the trucking industry.
Study subjects were long-term Teamsters enrolled in the pension system who died during
the period 1982-1983. Using death certificate information, the researchers identified 994 cases
of lung cancer for the study period, and 1,085 non-lung-cancer deaths served as controls.
Subjects were divided into job categories based on the job each held the longest. Most had held

7-44
only one type of job. The job categories were short-haul driver, long-haul driver, mechanic,
dockworker, other jobs with potential diesel exposure, and jobs outside the trucking industry
without occupational diesel exposure. Smoking histories were obtained from next of kin. ORs
were calculated for work in an exposed job category at any time and after 1959 (an estimated
date when the majority of heavy-duty trucks had converted to diesel) compared with work in
nonexposed jobs. ORs were adjusted for age, smoking, and potential asbestos exposure. Trends
in effect estimates for duration of work in an exposed job were also calculated.
An industrial hygiene survey by Zaebst et al. (1991) of elemental carbon exposures in the
trucking industry provided exposure estimates for each job category in 1990. The elemental
carbon measurements were generally consistent with the epidemiologic results, in that mechanics
were found to have the highest exposures and relative risk, followed by long-haul and then
short-haul drivers, although dockworkers had the highest exposures and the lowest relative risks.
Past exposures were estimated assuming that they were a function of (1) the number of
heavy-duty trucks on the road, (2) the particulate emissions (grams/mile) of diesel engines over
time, and (3) leaks from truck exhaust systems for long-haul drivers. Estimates of past exposure
to elemental carbon, as a marker for DE exposure, for subjects in the case-control study were
made by assuming that average 1990 levels for a job category could be assigned to all subjects in
that category, and that levels prior to 1990 were directly proportional to vehicle miles traveled
by heavy-duty trucks and the estimated emission levels of diesel engines. A 1975 exposure level
of elemental carbon in terms of micrograms per cubic meter was estimated by the following
equation: 1975 level = 1990 level*(vehicle miles 1975/vehicle miles 1990) (emissions
1975/emissions 1990). Once estimates of exposure for each year of work history were derived
for each subject, analyses were conducted by cumulative level of estimated carbon exposure.
Estimates were made for long-haul drivers (n = 1,237), short-haul drivers (n = 297),
dockworkers (n = 164), mechanics (n = 88), and those outside the trucking industry (n = 150).
Logistic regression was used to estimate ORs adjusted for five categories of age, race, smoking
(never, former-quitting before 1963, former-quitting in 1963 or later, current-with <1 pack per
day, and current-with 1 or more packs per day), diet, and reported asbestos exposure. A variety
of models for cumulative exposure were considered, including a log-linear model with
cumulative exposure, a model adding a quadratic term for cumulative exposure, a log transform
of cumulative exposure, dummy variables for quartile of cumulative exposure, and smoothing
splines of cumulative exposure. The estimates of rate ratios from logistic regression for specific
levels of exposure to elemental carbon were then used to derive excess risk estimates for lung
cancer after lifetime exposure to elemental carbon.
The survey found that mechanics had the highest current levels of DE exposures and
dockworkers who mainly used propane-powered forklifts had the lowest exposure. ORs of 1.69

7-45
and 0.93 were observed for the mechanics and dockworkers, respectively. The finding of the
highest lung cancer risk for mechanics and lowest for dockworkers is indicative of causal
association between the DE exposure and development of lung cancer. The log of cumulative
exposure was found to be the best-fitting model and was a significant predictor (p = 0.01).
However, the risk among mechanics did not increase with increasing duration of employment.
OR for quartile of cumulative exposure show a pattern of significantly increasing trends
in risk with increasing exposure, ranging between 1.08 and 1.72, depending on the exposure
level and lag structure used. The lifetime excess risk of lung cancer death (through age 75) for a
male truck driver was estimated to be in the range of 1.4%-2.3% (95% confidence limits ranged
from 0.3% to 4.6%) above the background risk, depending on the emissions scenarios assumed.
The authors found that current exposures indicated that truck drivers are exposed to DE at levels
about the same as ambient levels on the highways, which are about double the background levels
in urban air. They conclude that the data suggest a positive and significant increase in lung
cancer risk with increasing estimated cumulative exposure to DE among workers in the trucking
industry. They assert that these estimates suggest that the lifetime excess risk for lung cancer is
10 times higher than the OSHA standards, but caution that the results should be viewed as
exploratory.
The authors acknowledge that the increasing trend in risk with increasing estimates of
cumulative exposure is partly due to the fact that a component of cumulative dose is simple
duration of exposure, and that analyses by simple duration also exhibit a positive trend with
duration. This analysis essentially weights the duration by contrived estimates of exposure
intensity, and the authors acknowledge that this weighting depends on very broad assumptions.
This is not an analysis of new data that provides independent estimates of relative risk for
DE and lung cancer incidence. Instead, it is an attempt to convert the data from Steenland's
earlier study of lung cancer for the purpose of estimating a different risk metric, “lifetime excess
risk of lung cancer,” by augmenting these data with limited industrial hygiene data and
rationalizations about plausible models for cumulative exposure.
The Health Effects Institute (HEI, 1999) and others have raised some concerns about the
exposure estimations, selection of controls, and control for confounding variables, and hence,
this study’s usefulness for quantitative risk assessment. EPA and NIOSH will address these
concerns in the year 2001. The HEI (1999) panel noted that some of the strengths of this study
include the relevance of exposure levels to the general population and the use of an exposure
marker for diesel engine emissions that was an improvement over the concentration of
respirable-size particles (RSP). The number of study subjects (996 lung cancer cases) is large.
Histories of exposures to asbestos and smoking were obtained, and confounding by these two
variables was controlled in the analysis. Thus, it should be noted that these concerns are about

7-46
the use of these data for quantitative risk assessment, due to limitations of the exposure data. As
far as qualitative risk assessment is concerned, this study is still considered to be positive and
strong.
7.2.2.9. Boffetta et al. (1990): Case-Control Study on Occupational Exposure to DE and
Lung Cancer Risk
This is an ongoing (since 1969) case-control study of tobacco-related diseases in 18
hospitals (six U.S. cities). Cases comprise 2,584 males with histologically confirmed primary
lung cancers. Sixty-nine cases were matched to 1 control, whereas 2,515 were matched to 2
controls. Controls were individuals who were diagnosed with non-tobacco-related diseases. The
matching was done for sex, age (±2 years), hospital, and year of interview. The interviews were
conducted at the hospitals at the time of diagnosis. In 1985, the occupational section of the
questionnaire was modified to include the usual occupation and up to five other jobs as well as
duration (in years) worked in those jobs. After 1985, information was also obtained on exposure
to 45 groups of chemicals, including DE at the workplace or during hobby activities. A priori
aggregation of occupations was categorized into low probability of DE exposure (reference
group), possible exposure (19 occupations), and probable exposure (13 occupations). Analysis
was conducted based on “usual occupation” on all study subjects, and any occupation with
sufficient cases was eligible for further analysis. In addition, cases enrolled after 1985 for which
there were self-reported DE exposure and detailed work histories were also analyzed separately.
Both matched and unmatched analyses were done by calculating the adjusted (for
smoking and education) relative odds using the Mantel-Haenzael method and calculating the
test-based 95% confidence interval using the Miettinen method. Unconditional logistic
regression was used to adjust for potential confounders (the PROC LOGIST of SAS). Linear
trends for risk were also tested according to Mantel.
Adjusted relative odds for possible and probable exposure groups as well as the truck
drivers were slightly below unity, none being statistically significant for the entire study
population. Although slight excesses were observed for the self-reported DE exposure group
and the subset of post-1985 enrollees for highest duration of exposure (for self-reported
exposure, occupations with probable exposure, and truck drivers), none was statistically
significant. Trend tests for the risk of lung cancer among self-reported DE exposure, probable
exposure, and truck drivers with increasing exposure (duration of exposure used as surrogate for
increasing dose) were nonsignificant too. Statistically significant lung cancer excesses were
observed for cigarette smoking only.
The major strength of this study is availability of detailed smoking history. Even though
detailed information was obtained for the usual and five other occupations (1985), because it
7-47
was difficult to estimate or verify the actual exposure to DE, duration of employment was used
as a surrogate for dose instead. The numbers of cases and controls were large; however, the
number of individuals exposed to DE was relatively few, thus reducing the power of the study.
This study did not attempt latency analysis either. Due to these limitations, the findings of this
study are unable to provide either positive or negative evidence for a causal association between
DE and occurrence of lung cancer.
7.2.2.10. Emmelin et al. (1993): DE Exposure and Smoking: A Case-Referent Study of
Lung Cancer Among Swedish Dock Workers
This case-control study of lung cancer was drawn from a cohort defined as all male
workers who had been employed as dockworkers for at least 6 months between 1950 and 1974.
In the population of 6,573 from 20 ports, there were 90 lung cancer deaths (cases), identified
through Swedish death and cancer registers, during the period 1960 to 1982. Of these 90 deaths,
the 54 who were workers at the 15 ports for which exposure surrogate information was available
were chosen for the case-control study. Four controls, matched on port and age, were chosen for
each case from the remaining cohort who had survived to the time of diagnosis of the case. Both
live and deceased controls were included. The final analyses were done on 50 cases and 154
controls who had complete information on employment dates and smoking data. The smoking
strata were created by classifying ex-smokers as nonsmokers if they had not smoked for at least
5 years prior to the date of diagnosis of the case; otherwise they were classified as smokers.
Relative odds and regression coefficients were calculated using conditional logistic
regression models. Comparisons were made both with and without smoking included as a
variable, and the possible interaction between smoking and DE was tested. Both the weighted
linear regressions of the adjusted relative odds and the regression coefficients were used to test
mortality trends with all three exposure variables.
Exposure to DE was assessed indirectly by initially measuring: (1) exposure intensity
based on exhaust emission, (2) characteristics of the environment in terms of ventilation, and (3)
measures of proportion of time in higher exposed jobs. For exhaust emissions, annual diesel fuel
consumption at a port was used as the surrogate. For ventilation, the annual proportion of ships
with closed or semiclosed holds was used as the surrogate. The proportion of time spent below
decks was used as the surrogate for more exposed jobs. Although data were collected for all
three measures, only the annual fuel consumption was used for analysis. Because every man
was likely to rotate through the various jobs, the authors thought using annual consumption of
diesel fuel was the appropriate measure of exposure. Consequently, in a second analysis, the
annual fuel consumption was divided by the number of employees in the same port that year to
come up with the fuel-per-person measure, which was further used to create a second measure,

7-48
“exposed time.” The “annual fuel” and exposed-time data were entered in a calendar time-
exposure matrix for each port, from which individual exposure measures were created. A third
measure, “machine time” (years of employment from first exposure), was also used to compare
the results with other studies. All exposure measures were accumulated from the first year of
employment or first year of diesel machine use, whichever came later. The last year of exposure
was fixed at 1979. All exposures up to 2 years before the date of lung cancer diagnosis were
omitted from both cases and matched controls. A priori classification into three categories of
low, medium, and high exposure was done for all three exposure variables: machine time, fuel,
and exposed time.
Conditional logistic regression models, adjusting for smoking status and using low
exposures and/or nonsmokers as a comparison group, yielded positive trends for all exposure
measures, but no trend test results were reported, and only the relative odds for the exposed-time
exposure measure in the high-exposure group (OR = 6.8, 90% CI = 1.3 to 34.9) was reported as
statistically significant. For smokers, adjusting for DE exposure level, the relative odds were
statistically significant and about equal for all three exposure variables: machine time, OR = 5.7
(90% CI = 2.4 to 13.3); fuel, OR = 5.5 (90% CI = 2.4 to 12.7); and exposed time, OR = 6.2
(90% CI = 2.6 to 14.6). Interaction between DE and smoking was tested by conditional logistic
regression in the exposed-time variable. Although there were positive trends for both smokers
and nonsmokers, the trend for smokers was much steeper: low, OR = 3.7 (90% CI = 0.9 to 14.6);
medium, OR = 10.7 (90% CI = 1.5 to 78.4); and high, OR = 28.9 (90% CI = 3.5 to 240),
indicating more than additive interaction between these two variables.
In the weighted linear regression model with the exposed-time variable, the results were
similar to those using the logistic regression model. The authors also explored the smoking
variable further in various analyses, some of which suggested a strong interaction between DE
and smoking. However, with just six nonsmokers and no further categorization of smoking
amount or duration, these results are of limited value.
The DE exposure matrices created using three different variables are intricate. Analyses
by any of these variables yield essentially the same positive results and positive trends, providing
consistent support for a real effect of DE exposure, at least in smokers. However,
methodological limitations to this study prevent a more definitive conclusion. The numbers of
cases and controls are small. There are very few nonsmokers; thus, testing the effects of DE
exposure in them is futile. Lack of information on asbestos exposure, to which dockworkers are
usually exposed, may also confound the results. Also, no latency analyses are presented.
Overall, despite these limitations, this study supports the earlier findings of excess lung cancer
mortality among individuals exposed to DE.

7-49
7.2.2.11. Swanson et al. (1993): Diversity in the Association Between Occupation and Lung
Cancer Among Black and White Men
This population-based case-control study of lung cancer was conducted in metropolitan
Detroit. The cases and controls for this study were identified from the Occupational Cancer
Incidence Surveillance Study (OCISS). A total of 3,792 incident lung cancer cases and 1,966
colon and rectal cancer cases used as controls, diagnosed between 1984 and 1987 among white
and black males aged 40 to 84 years, were selected for the study. Information was obtained by
telephone interview either with the individual or a surrogate about lifetime work history and
smoking history, as well as medical, demographic, and residential history. Occupation and
industry data were coded using the 1980 U.S. Census Bureau classification codes. The
investigators selected certain occupations and industries as having little or no exposure to
carcinogens and defined them as an unexposed group. Analysis was done using logistic
regression method and adjusting for age at diagnosis, pack-years of cigarette smoking, and race.
The results were presented by various occupations and industries; those with potential
exposures to DE were drivers of heavy trucks and light trucks, farmers, and railroad workers,
respectively. Among white males, increasing lung cancer risks were observed with increasing
duration of employment for drivers of heavy trucks, drivers of light trucks, and farmers.
Although none of the individual ORs were statistically significant, trend tests were significant
for all three occupations (p#0.05). On the other hand, among black males increasing lung
cancer risks with increasing duration of employment were observed for farmers only, with an
OR of 10.4 (95% CI = 1.4, 77.1) reaching significance for employment of 20+ years. As for the
railroad industry, increasing lung cancer risks with increasing duration of employment were
observed for both white and black males. The trend test was significant for white males only,
with an OR of 2.4 (95% CI = 1.1, 5.1) reaching significance for employment of 10+ years.
The main strengths of the study are large sample size, availability of lifetime work
history and smoking history, and the population-based study format, precluding selection bias.
The major limitation, as in other studies, is lack of direct information on specific exposures. The
interesting result of this study is lung cancer excesses observed in farmers, mainly among crop
farmers, who have potential exposure to DE from their tractors in addition to pesticides,
herbicides, and other PM10. The authors point out that this is the first study to find excess lung
cancer in this occupation.
7.2.2.12. Hansen et al. (1998): Increased Risk of Lung Cancer Among Different Types of
Professional Drivers in Denmark
This is a population-based case-control study of lung cancer, conducted in professional
drivers in Denmark. The cases first diagnosed as primary lung cancer between 1970 and 1989
7-50
among males born between 1897 and 1966 were identified from the Danish Cancer Registry.
The registry provided the information on diagnosis from ICD-7, name, sex, and unique personal
identification number (PIDN). Information about past employment was obtained by linkage
with the nationwide pension fund. The fund keeps the records by name and PIDN about the date
of start and end of each job and unique company number of the employer. The records are kept
even after the employee has retired or died. Information about current employment was
obtained from the Danish Central Population Registry (CPR) by linkage with the PIDN.
Of 37,597 cases identified from the Registry, 8,853 did not have any employment
records. Controls (1:1) for 28,744 lung cancer cases with employment histories were selected
randomly from CPR, matched with the case by year of birth and sex. Furthermore, these
controls had to be alive, cancer free, and employed prior to the diagnosis of lung cancer in the
corresponding case. Employment histories were obtained for the controls in the same fashion as
cases from the pension fund. The employment record search resulted in a total of 1,640
lorry/bus drivers and 426 taxi drivers. They were further divided into subgroups by their
duration of employment. Information about smoking in drivers was acquired from two national
surveys conducted in 1970-72 and 1983. No direct information on smoking was available in
either cases or controls. A separate case-control study of mesothelioma indirectly looked at
asbestos exposure among professional drivers. OR, adjusting for socioeconomic status and 95%
CI, were computed using conditional logistic regression (PECAN procedure in the statistical
package EPICURE).
Significant ORs for lung cancer were found for lorry/bus drivers (OR = 1.31, 95% CI =
1.17, 1.46), taxi drivers (OR = 1.64, 95% CI = 1.22, 2.19), and unspecified drivers (OR = 1.39,
95% CI = 1.30, 1.51). Significant ORs were found for both lorry/bus drivers and taxi drivers by
duration of employment in 1-5 years and >5 years categories, with no lag time and with a 10-
year lag time. The ORs remained the same for lorry/bus drivers in these employment categories
for no lag time and 10-year lag time. Among taxi drivers, on the other hand, the OR of 2.2 in >5
year employment in no-lag-time analysis increased to 3.0 in the 10-year lag time analysis. The
authors asserted that the higher risk seen in the taxi drivers may be due to higher exposure
attributable due to longer time spent in traffic congestion. The trend tests for increasing risk
with increasing duration of employment (surrogate for exposure) were statistically significant
(p<0.001) for both lorry/bus drivers and taxi drivers in no-lag-time and 10-year lag time
analysis. All the ORs were adjusted for socioeconomic status.
The main strengths of the study are the large sample size, availability of information on
socioeconomic status, and detailed employment records. The main limitation, however, is lack
of information on what type of fuel these vehicles used. It is probably safe to assume that the
lorry/buses were diesel powered, whereas the taxis could be either diesel or gasoline powered. A
7-51
personal communication with Dr. Johnni Hansen confirmed that dieselization in Denmark was
completed in the late 1940s and lorries, buses, and taxis have been using diesel fuel since then.
Although direct adjustments were not done for smoking and exposure to asbestos, indirect
information on both these confounders indicates that they are unlikely to explain the observed
excesses and the increasing risk with increasing duration of employment. Thus, the results of
this study are strongly supportive of DE being associated with increased lung cancer.
7.2.2.13. Brüske-Hohlfeld et al. (1999): Lung Cancer Risk in Male Workers Occupationally
Exposed to Diesel Motor Emissions in Germany
This paper presents a pooled analysis of two case-control studies of lung cancer. The
first study, by Jöckel et al. (1995, 1998), was conducted between 1988 and 1993 and had 1,004
cases and 1,004 controls matched for sex, age, and region of residence, selected randomly from
the compulsory municipal registries. The inclusion criteria for cases were: they should have
been born in or after 1913, should have been of German nationality, and should have been
diagnosed with lung cancer within 3 months prior to the interview. The second study, by
Wichmann et al. (1998), was ongoing when it was included in this study. The study span
covered the years 1990 to 1996. By 1994 a total of 3,180 cases and 3,249 controls, randomly
selected from the compulsory population registries, were frequency matched on sex, age, and
region. The cases were less than 76 years old, were residents of the region and living in
Germany for more than 25 years, and had a diagnosis not more than 3 months old. Of 4,184
pooled cases and 4,253 pooled controls, the analysis was conducted on 3,498 male cases and
3,541 male controls. A personal interview was conducted with each study participant. Data
were collected on basic demographic information, detailed smoking history, and lifelong
occupational history about jobs held and industries worked in. The job titles and industries were
classified into 33 and 21 categories, respectively, using the German Statistical Office codes.
Based on job codes with potential exposure to diesel motor emission (DME), four
exposure groups were constituted. Group A comprised professional drivers of trucks, buses,
taxis, etc. Group B comprised other traffic-related jobs such as switchmen, diesel locomotive
drivers, and diesel forklift truck drivers. Group C comprised bulldozer operators, graders, and
excavators. Group D comprised full-time farm tractor drivers. Validation of the jobs was done
by written evaluation of the job task descriptions, which also avoided misclassification. The
following information was acquired for the construction of job task descriptions: (1) What
were your usual tasks at work and how often (in % of daily working hours) were they
performed? (2) What did you produce, manufacture, or transport? (3) Which material was
used? (4) What kind of machine did you operate? Some individuals had more than one job task
7-52
with DME exposure. The exposure assessment was done without knowing the status of the
case/control.
For each individual, cumulative exposure was calculated for the complete work history
by categorizing the duration of exposure as >0-3, >3-10, >10-20, >20-30, >30 years, and
beginning and end of exposure. The first year of exposure was defined as <1945, 1946-1955,
and >1956 while the last year of exposure was defined as <1965, 1966-1975, and >1976. For
professional drivers, hours driven per day were accumulated and were classified as “driving
hours.”
A smoker was defined as any individual who had smoked regularly for at least 6 months.
Smoking information was acquired in series with the starting time, type of tobacco, amount
smoked, duration in years, and calender year of quitting. Asbestos exposure was estimated by
certain job-specific supplementary questions.
The cases and controls were post-hoc stratified into 6 age and 17 region categories. ORs
adjusted for smoking and asbestos exposure were calculated by conditional logistic regression,
using “never exposed” workers as the reference group. The adjustment for cigarette smoking
was done by using pack-years as a continuous variable; adjustment for other tobacco products
was done by considering them as a binary variable. A total of 716 cases and 430 controls were
found to be ever exposed to DME. The smoking- and asbestos-adjusted OR of 1.43 (95% CI =
1.23, 1.67) for all DME exposed was reduced from the crude OR of 1.91. For the entire group
the various analyses yielded statistically significant ORs ranging from 1.25 to 2.31, adjusted for
smoking and asbestos exposure (West Germany, >10-20 years and >20-30 years of exposure,
first year of exposure in 1946-1955 and 1956+, end of exposure in 1966-1975 and 1976+, and
for the job categories of Group A, B, and C). The risk increased with increasing years of
exposure, and for both the first year of exposure (<1945, 1946-1955, and >1956) and end year of
exposure (<1965, 1966-1975, and >1976).
Separate analyses by four job categories (all the ORs were adjusted for smoking and
asbestos exposure) showed that for professional drivers (Group A) the overall OR was 1.25
(95% CI = 1.05, 1.47). Significant ORs were found for various factors in West Germany only.
The factors were: >0-3 years and >10-20 years of exposure (OR = 1.69, 95% CI = 1.13, 2.53,
and OR = 2.02, 95% CI = 1.32, 3.08, respectively), beginning of exposure in 1956+ and end of
exposure in 1976+ (OR = 1.56, 95% CI = 1.21, 2.03, and OR = 1.5, 95% CI = 1.14, 1.98,
respectively), and 1,000-49,999 driving hours (OR = 1.54, 95% CI = 1.15, 2.07). None of the
ORs were significant in East Germany in this group.
For other traffic-related jobs (Group B) the overall OR was 1.53 (95% CI = 1.04, 2.24).
The ORs for beginning of exposure in 1956+ and end of exposure in 1976+ were OR = 1.71,
95% CI = 1.05, 2.78, and OR = 2.68, 95% CI = 1.47, 4.90, respectively. The risk increased with
7-53
increasing duration of exposure and was statistically significant for >10-20 years (OR = 2.49)
and more than 20 years (OR = 2.88). No separate analyses for West Germany and East
Germany were presented in this category.
For heavy equipment operators (Group C) the overall OR of 2.31 (95% CI = 1.44, 3.7)
was highest among all the job categories. Significant ORs were observed for beginning
exposure in 1946-1955 (OR = 2.83, 95% CI = 1.10, 7.23) and end exposure in 1966-1975 (OR =
3.74, 95% CI = 1.20, 11.64). The risk increased with increasing duration of exposure and was
statistically significant for more than 20 years of exposure (OR = 4.3). Although no separate
analyses for West Germany and East Germany were presented, investigators mentioned that for
this job group hardly any difference was seen between West Germany and East Germany.
For drivers of the farming tractors (Group D) the overall OR of 1.29 was not significant.
Risk increased with increasing duration of exposure and was significant for exposure of more
than 30 years (OR = 6.81, 95% CI = 1.17, 39.51). No separate analyses for West Germany and
East Germany were presented in this category.
The professional drivers and the other traffic-related job categories probably have mixed
exposures to gasoline exhaust in general traffic. On the other hand, it should be noted that
exposure to DME among heavy equipment and farm tractor drivers is much higher and not as
mixed as in professional drivers. The heavy equipment drivers usually drive repeatedly through
their own equipment’s exhaust. Therefore, the observed highest risk for lung cancer in this job
category establishes a direct link with the DME. The only other study that found significantly
higher risk for heavy equipment operators (RR = 2.6) was conducted by Boffeta et al. (1988).
Although the only significant excess was observed for farming tractor operators among
individuals with more than 30 years of exposure, a steady increase in risk was observed for this
job category with increasing exposure. The investigators stated that the working conditions and
the DME of tractors remained fairly constant over the years. This increase may be due mainly to
exposure to DME and, in addition, PM10.
This is a well-designed, well-conducted, and well-analyzed study. Its main strengths are
large sample size, resulting in good statistical power; inclusion of incident cases that were
diagnosed not more than 3 months prior to the interview; use of only personal interviews,
reducing recall bias; diagnosis ascertained by cytology or histology; and availability of lifelong
detailed occupational and smoking history. Exposure estimation for each individual was based
on job codes and industry codes, which were validated by written job descriptions to avoid
misclassification. The main limitation of the study is lack of data on actual exposure to DME.
The cumulative quantitative exposures were calculated based on time spent in each job with
potential exposure to DME and the type of equipment used. Thus, this study provides strong
evidence for a causal association between exposure to DE and occurrence of lung cancer.
Table 7-2 summarizes the above lung cancer case-control studies.
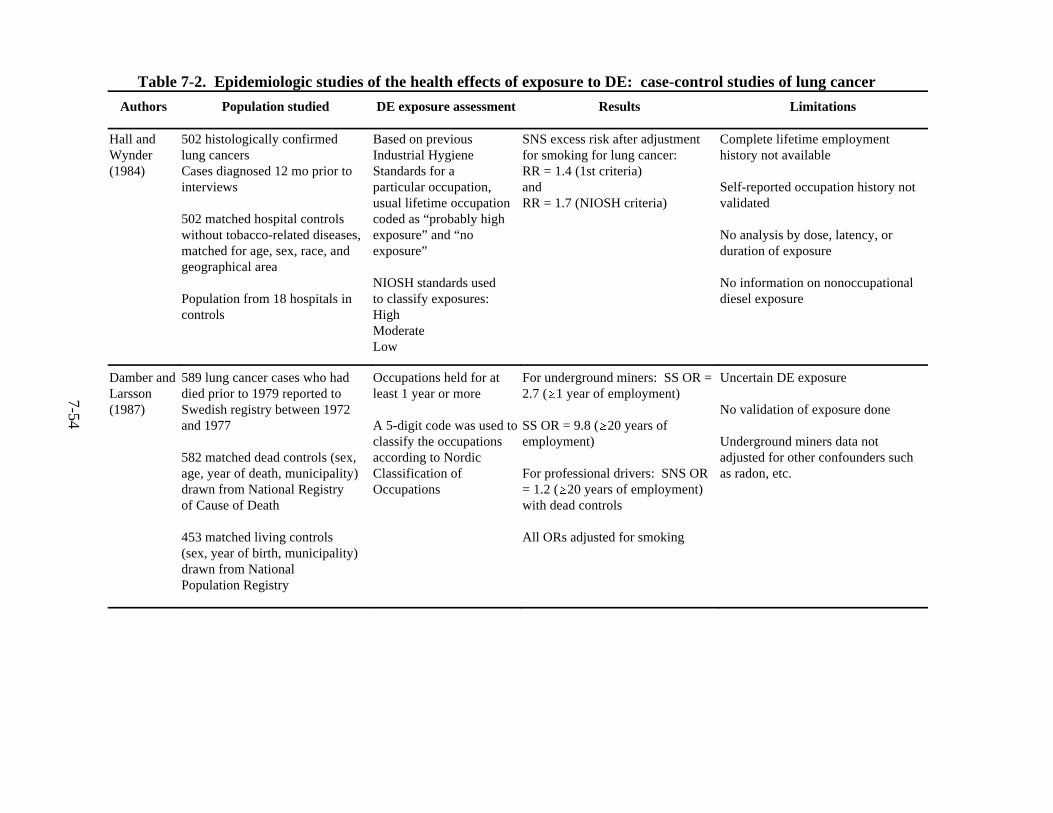
Table 7-2. Epidemiologic studies of the health effects of exposure to DE: case-control studies of lung cancer
Authors Population studied DE exposure assessment Results Limitations
Hall and Wynder(1984)
502 histologically confirmedlung cancers Cases diagnosed 12 mo prior tointerviews
502 matched hospital controlswithout tobacco-related diseases,matched for age, sex, race, andgeographical area
Population from 18 hospitals incontrols
Based on previousIndustrial HygieneStandards for aparticular occupation,usual lifetime occupationcoded as “probably highexposure” and “noexposure”
NIOSH standards usedto classify exposures:HighModerateLow
SNS excess risk after adjustmentfor smoking for lung cancer:RR = 1.4 (1st criteria)andRR = 1.7 (NIOSH criteria)
Complete lifetime employmenthistory not available
Self-reported occupation history notvalidated
No analysis by dose, latency, orduration of exposure
No information on nonoccupationaldiesel exposure
Damber andLarsson(1987)
589 lung cancer cases who haddied prior to 1979 reported toSwedish registry between 1972and 1977
582 matched dead controls (sex,age, year of death, municipality)drawn from National Registryof Cause of Death
453 matched living controls(sex, year of birth, municipality)drawn from NationalPopulation Registry
Occupations held for atleast 1 year or more
A 5-digit code was used toclassify the occupationsaccording to NordicClassification ofOccupations
For underground miners: SS OR =2.7 ($1 year of employment)
SS OR = 9.8 ($20 years ofemployment)
For professional drivers: SNS OR= 1.2 ($20 years of employment)with dead controls
All ORs adjusted for smoking
Uncertain DE exposure
No validation of exposure done
Underground miners data notadjusted for other confounders suchas radon, etc.
7-54

Table 7-2. Epidemiologic studies of the health effects of exposure to DE: case-control studies of lung cancer (continued)
Authors Population studied DE exposure assessment Results Limitations
Lerchenet al. (1987)
506 lung cancer cases fromNew Mexico tumor registry(333 males and 173 females)
Aged 25-84 years
Diagnosed between January 1,1980, and December 31, 1982
771 (499 males and 272 females)frequency matched with cases,selected from telephone directory
Lifetime occupationalhistory and self-reportedexposure history wereobtained
Coded according toStandard IndustrialClassification Scheme
No excess of relative odds wereobserved for DE exposure
Exposure based on occupationalhistory and self-report, which was notvalidated
50% occupational history providedby next of kin
Absence of lung cancer associationwith asbestos suggestsmisclassification of exposure
Garshicket al. (1987)
1,319 lung cancer cases who diedbetween March 1, 1981,and February 28, 1982
2,385 matched controls (two each,age and date of death)
Both cases and controls drawnfrom railroad worker cohortwho had worked for 10 ormore years
Personal exposureassessed for 39 jobcategories
This was corrected withjob titles to dichotomizethe exposure into:ExposedNot exposed
Industrial hygienesampling done
SS OR = 1.41 (#64 year age group)
SS OR = 1.64 (#64 year age group)for $20 years DE exposure groupwhen compared to 0- to 4-yearexposure group
All ORs adjusted for lifetimesmoking and asbestos exposure
Probable misclassification of DEexposure jobs
Years of exposure used as surrogatefor dose
13% of death certificates notascertained
Overestimation of smoking history
Benhamouet al. (1988)
1,260 histologically confirmedlung cancer cases
2,084 non-tobacco-relateddisease matched controls(sex, age at diagnosis,hospital admission, andinterviewer)
Occurring between 1976 and1980 in France
Based on exposuresdetermined by panel ofexperts
The occupations wererecorded blindly usingInternational StandardClassification ofOccupations as chemicalor physical exposures
Significant excess risks were foundin motor vehicle drivers(RR = 1.42) andtransport equipment operators(RR = 1.35) (smoking adjusted)
Exposure based on occupationalhistories not validated
Exposures classified as chemical andphysical exposures, not specific toDE
7-55

Table 7-2. Epidemiologic studies of the health effects of exposure to DE: case-control studies of lung cancer (continued)
Authors Population studied DE exposure assessment Results Limitations
Hayes et al.(1989)
Pooled data from three differentstudies consisting of 2,291 malelung cancer cases
2,570 controls
Occupational informationfrom next of kin for alljobs held
Jobs classified withrespect to potentialexposure to known andsuspected pulmonarycarcinogens
SS OR = 1.5 for truck drivers (>10years of employment)
SS positive trend with increasingemployment as truck driver
Adjusted for age, smoking, & studyarea
Exposure data based on jobdescription given by next of kin,which was not validated
Could have been mixed exposure toboth diesel and gasoline exhausts
Job description could have led tomisclassification
Steenlandet al. (1990)
1,058 male lung cancer deathsbetween 1982 and 1983
1,160, every sixth death fromentire mortality file, sorted bySocial Security number(excluding lung cancer,bladder cancer, and motorvehicle accidents)
Cases and controls were fromCentral State Teamsters whohad filed claims (requiring20-year tenure)
Longest job held: dieseltruck driver, gasolinetruck driver, both typesof trucks, truckmechanic, anddockworkers
As 1964 cut-off point:
SS OR = 1.64 for long-haul driverswith 13+ years of employment
Positive trend test for long-hauldrivers (p=0.04)
SS OR = 1.89 for diesel truckdrivers of 35+ years ofemployment
Adjusted for age, smoking, &asbestos
Exposure based on job titles notvalidated
Possible misclassification of exposureand smoking, based on next-of-kininformation
Lack of sufficient latency
Steenland etal. (1998)
Exposure-response analyses oftheir 1990 case-control study
Industrial hygiene data ofelemental carbon intrucking industry collectedby Zaebst et al. (1991)used to estimate individualexposures
Cumulative exposurescalculated based onestimated lifetimeexposures
For mechanics: OR = 1.69 (hadthe highest DE exposure)
Lowest DE exposure and lowestOR = 0.93 observed fordockworkers
Increasing risk of lung cancer withincreasing exposure
Adjusted for age & smoking
7-56
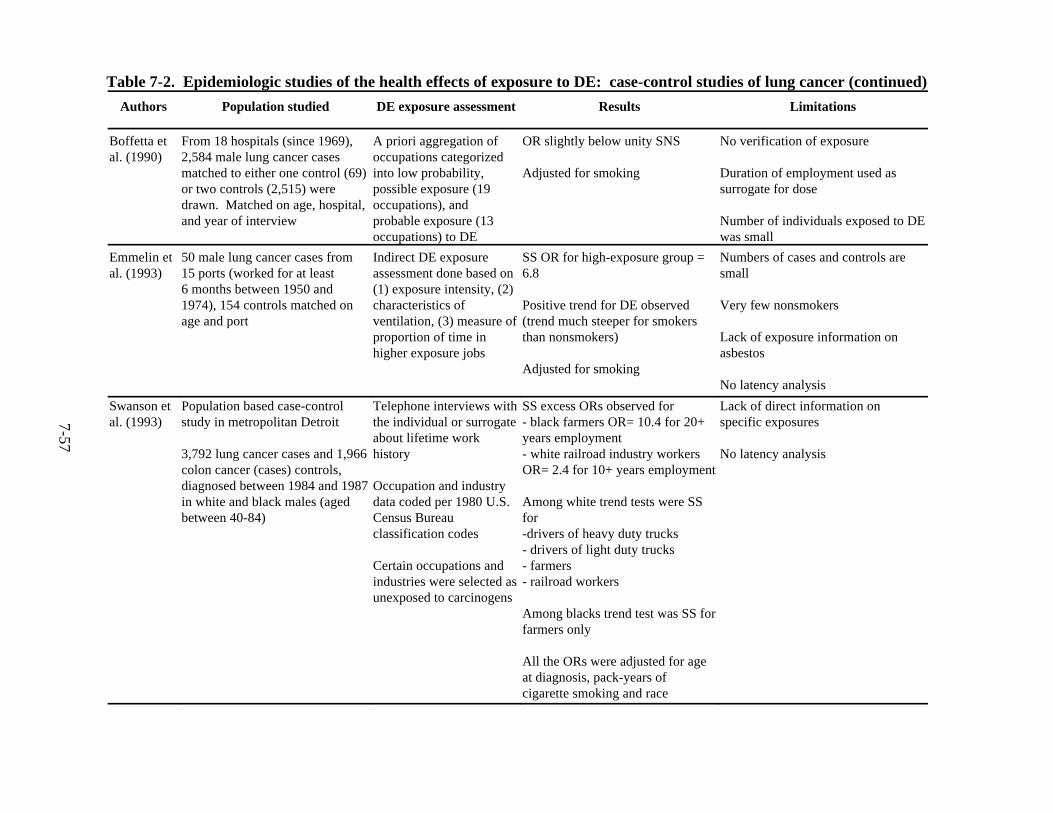
Table 7-2. Epidemiologic studies of the health effects of exposure to DE: case-control studies of lung cancer (continued)
Authors Population studied DE exposure assessment Results Limitations
Boffetta etal. (1990)
From 18 hospitals (since 1969),2,584 male lung cancer casesmatched to either one control (69)or two controls (2,515) weredrawn. Matched on age, hospital,and year of interview
A priori aggregation ofoccupations categorizedinto low probability,possible exposure (19occupations), andprobable exposure (13occupations) to DE
OR slightly below unity SNS
Adjusted for smoking
No verification of exposure
Duration of employment used assurrogate for dose
Number of individuals exposed to DEwas small
Emmelin etal. (1993)
50 male lung cancer cases from15 ports (worked for at least6 months between 1950 and1974), 154 controls matched onage and port
Indirect DE exposureassessment done based on(1) exposure intensity, (2)characteristics ofventilation, (3) measure ofproportion of time inhigher exposure jobs
SS OR for high-exposure group =6.8
Positive trend for DE observed(trend much steeper for smokersthan nonsmokers)
Adjusted for smoking
Numbers of cases and controls aresmall
Very few nonsmokers
Lack of exposure information onasbestos
No latency analysis
Swanson etal. (1993)
Population based case-controlstudy in metropolitan Detroit
3,792 lung cancer cases and 1,966colon cancer (cases) controls,diagnosed between 1984 and 1987in white and black males (agedbetween 40-84)
Telephone interviews withthe individual or surrogateabout lifetime workhistory
Occupation and industrydata coded per 1980 U.S.Census Bureauclassification codes
Certain occupations andindustries were selected asunexposed to carcinogens
SS excess ORs observed for- black farmers OR= 10.4 for 20+years employment- white railroad industry workersOR= 2.4 for 10+ years employment
Among white trend tests were SSfor-drivers of heavy duty trucks- drivers of light duty trucks- farmers- railroad workers
Among blacks trend test was SS forfarmers only
All the ORs were adjusted for ageat diagnosis, pack-years ofcigarette smoking and race
Lack of direct information onspecific exposures
No latency analysis
7-57
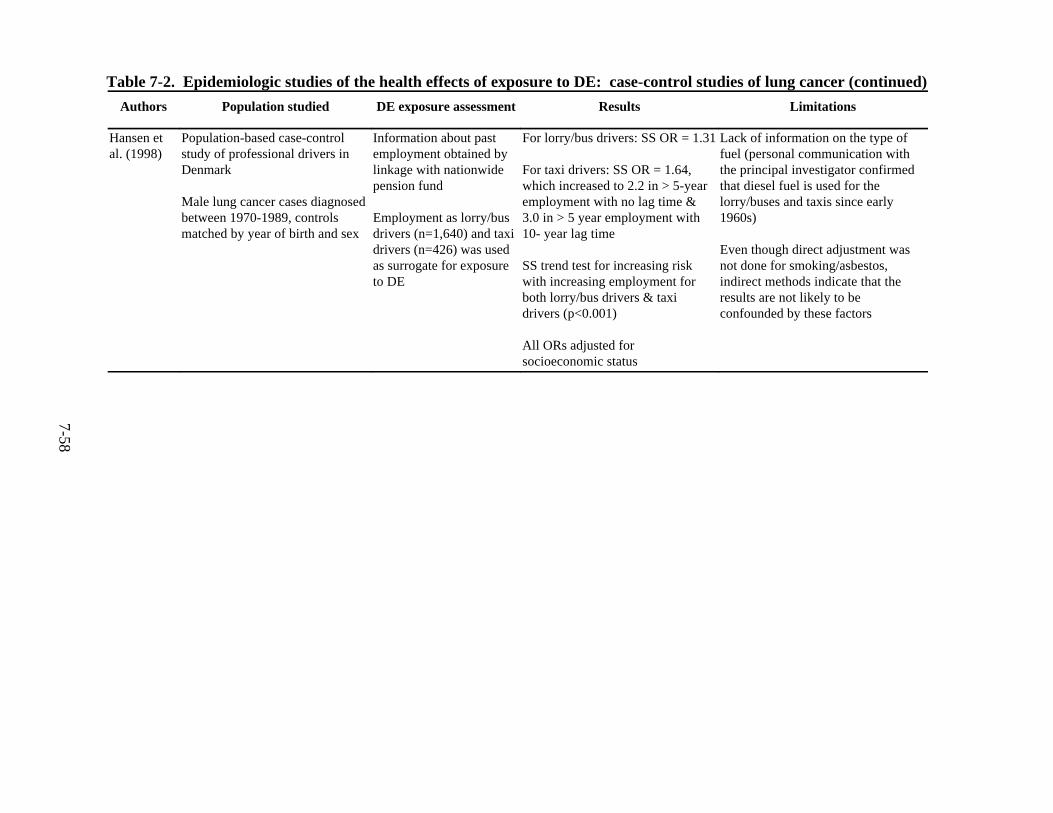
Table 7-2. Epidemiologic studies of the health effects of exposure to DE: case-control studies of lung cancer (continued)
Authors Population studied DE exposure assessment Results Limitations
Hansen etal. (1998)
Population-based case-controlstudy of professional drivers inDenmark
Male lung cancer cases diagnosedbetween 1970-1989, controlsmatched by year of birth and sex
Information about pastemployment obtained bylinkage with nationwidepension fund
Employment as lorry/busdrivers (n=1,640) and taxidrivers (n=426) was usedas surrogate for exposureto DE
For lorry/bus drivers: SS OR = 1.31
For taxi drivers: SS OR = 1.64,which increased to 2.2 in > 5-yearemployment with no lag time &3.0 in > 5 year employment with10- year lag time
SS trend test for increasing riskwith increasing employment forboth lorry/bus drivers & taxidrivers (p<0.001)
All ORs adjusted forsocioeconomic status
Lack of information on the type offuel (personal communication withthe principal investigator confirmedthat diesel fuel is used for thelorry/buses and taxis since early1960s)
Even though direct adjustment wasnot done for smoking/asbestos,indirect methods indicate that theresults are not likely to beconfounded by these factors
7-58

Table 7-2. Epidemiologic studies of the health effects of exposure to DE: case-control studies of lung cancer (continued)
Authors Population studied DE exposure assessment Results Limitations
Brüske-Hohlfeld etal. (1999)
Pooled analysis of two case-control studies (3,498 cases &3,541 controls)
Controls frequency matched onsex, age, & region, randomlyselected from the compulsorypopulation registry
Inclusion criteria: (1) born in orafter 1913/less than 75 years old,(2) German nationality/resident ofthe region - lived in Germany formore than 25 years, & (3) lungcancer diagnosis should be 3months prior to the study
Information obtained by personalinterview on:
Lifetime detailedoccupational & smokinghistories obtained fromeach individual in apersonal interview
Based on job codes (33job titles & 21 industries)potential DE exposureclassified in 4 categories:A- professional drivers oftrucks, buses, & taxis; B-other traffic related i.e.,switchman, locomotive, &forklift drivers; C-bulldozer operators,graders,& excavators; D-farm tractor drivers
Cumulative DE exposuresand pack-years (smoking)calculated for eachindividual
SS higher risk adjusted for smokingobserved for all 4 categories:
A- ORs ranged from 1.25 to 2.53B- ORs ranged from 1.53 to 2.88C- ORs ranged from 2.31 to 4.3D- 6.81 (exposure < 30 years)
Risk increased with increasingexposure
Lack of data on actual exposure todiesel exaust
Abbreviations: OR = odds ratio; RR = relative risk; SNS = statistically nonsignificant; SS = statistically significant.
7-59

7-60
7.2.3. Summaries of Studies and Meta-Analyses of Lung Cancer
7.2.3.1. Cohen and Higgins (1995): Health Effects of DE: Epidemiology
The Health Effects Institute (HEI) reviewed all published epidemiologic studies on the
health effects of exposure to DE available through June 1993, identified by a MEDLINE search
and by reviewing the reference sections of published research and earlier reviews. HEI
identified 35 reports of epidemiologic studies (16 cohort and 19 case-control) of the relation of
occupational exposure to diesel emissions and lung cancer published between 1957 and 1993.
HEI reviewed the 35 reports for epidemiologic evidence of health effects of exposure to DE for
lung cancer, other cancers, and nonmalignant respiratory disease. They found that the data were
strongest for lung cancer. The evidence suggested that occupational exposure to DE from
diverse sources increases the rate of lung cancer by 20% to 40% in exposed workers generally,
and to a greater extent among workers with prolonged exposure. They also found that the results
are not explicable by confounding caused by cigarette smoking or other known sources of bias.
Control for smoking was identified in 15 studies. Six studies (17%) reported relative risk
estimates less than 1; 29 studies (83%) reported at least one relative risk greater than one
indicating positive association. Twelve studies indicating a relative risk greater than 1 had 95%
confidence intervals, which excluded unity.
The authors conclude that epidemiologic data consistently show weak associations
between exposure to DE and lung cancer. They find that the evidence suggests that long-term
exposure to DE in a variety of occupational circumstances is associated with a 1.2- to 1.5-fold
increase in the relative risk of lung cancer compared with workers classified as unexposed. Most
of the studies that controlled for smoking found that the association between increased risk of
lung cancer and exposure to DE persisted after such controls were applied, although in some
cases the excess risk was lower. None of the studies measured exposure to diesel emissions or
characterized the actual emissions from the source of exposure for the time period most relevant
to the development of lung cancer. Most investigators classified exposure based on work
histories reported by subjects or their next of kin, or by retirement records. Although these data
provide relative rankings of exposure, the absence of concurrent exposure information is the key
factor that limits interpretation of the epidemiologic findings and subsequently their utility in
making quantitative estimates of cancer risks.
This is a comprehensive and thorough narrative review of studies of the health effects of
DE. It does not undertake formal estimation of summary measures of effect or evaluation of
heterogeneity in the results. The conclusion drawn about the consistency of the results is based
on the author's assessment of the failure of potential biases and alternative explanations for the
increase in risk to account for the observed consistency. In many if not most studies, the quality
of the data used to control confounding was relatively crude. Although the studies do include
qualitative assessment of whether control for smoking is taken into account, careful scrutiny of
2Of 35 studies identified in the literature search, 6 pairs of studies represented analyses of the same studypopulation, reducing the number of studies to 29.
7-61
the quality of the control or adjustment for smoking among the studies is absent. This leaves
open the possibility that prevalent residual confounding by inadequate control for smoking in
many studies may account for the consistent associations seen.
7.2.3.2. Bhatia et al. (1998): DE Exposure and Lung Cancer
Bhatia et al. (1998) report a meta-analysis of 29 published2 cohort and case-control
studies of the relation between occupational exposure to DE and lung cancer. A search of the
epidemiologic literature was conducted for all studies concerning lung cancer and DE exposure.
Occupational studies involving mining were excluded because of concern about the possible
influence of radon and silica exposures. Studies in which the minimum interval from time of
first exposure to end of follow-up was less than 10 years, and studies in which work with diesel
equipment or engines could not be confirmed or reliably inferred, were excluded. When studies
presented risk estimates for more than one specific occupational category of DE-exposed
workers, the subgroup risk estimates were used in the meta-analysis. Smoking-adjusted effect
measures were used when present.
Of 29 studies 23 met the criteria for inclusion in the meta-analysis. The observed
relative risk estimates were greater than 1 in 21 of these studies; this result is unlikely to be due
to chance. The pooled relative risk weighted by study precision was 1.33 (95% CI = 1.24, 1.44),
indicating increased relative risk for lung cancer from occupational exposure to DE.
Subanalyses by study design (case-control and cohort studies) and by control for smoking
produced results that did not differ from those of the overall pooled analysis. Cohort studies
using internal comparisons showed higher relative risks than those using external comparisons
(see Figure 7-1).
Bhatia and colleagues conclude that the analysis shows a small but consistent increase in
the risk for lung cancer among workers with exposure to DE. The authors evaluate the
dependence of the relative risk estimate on the presence of control for smoking among studies,
and provide a table that allows assessment of whether the quality of the data contributing to
control for smoking is related to the relative risk estimates (albeit in a limited number of
studies). Bhatia et al. assert that residual confounding is not affecting the summary estimates or
conclusions for the following reasons: (1) the pooled relative risks for studies adjusted for
smoking were the same as those for studies not adjusting for smoking; (2) in those studies giving
risk estimates adjusted for smoking and risk estimates not adjusted for smoking, there was only a
small reduction in the pooled relative risk from DE exposure; and (3) in studies with internal
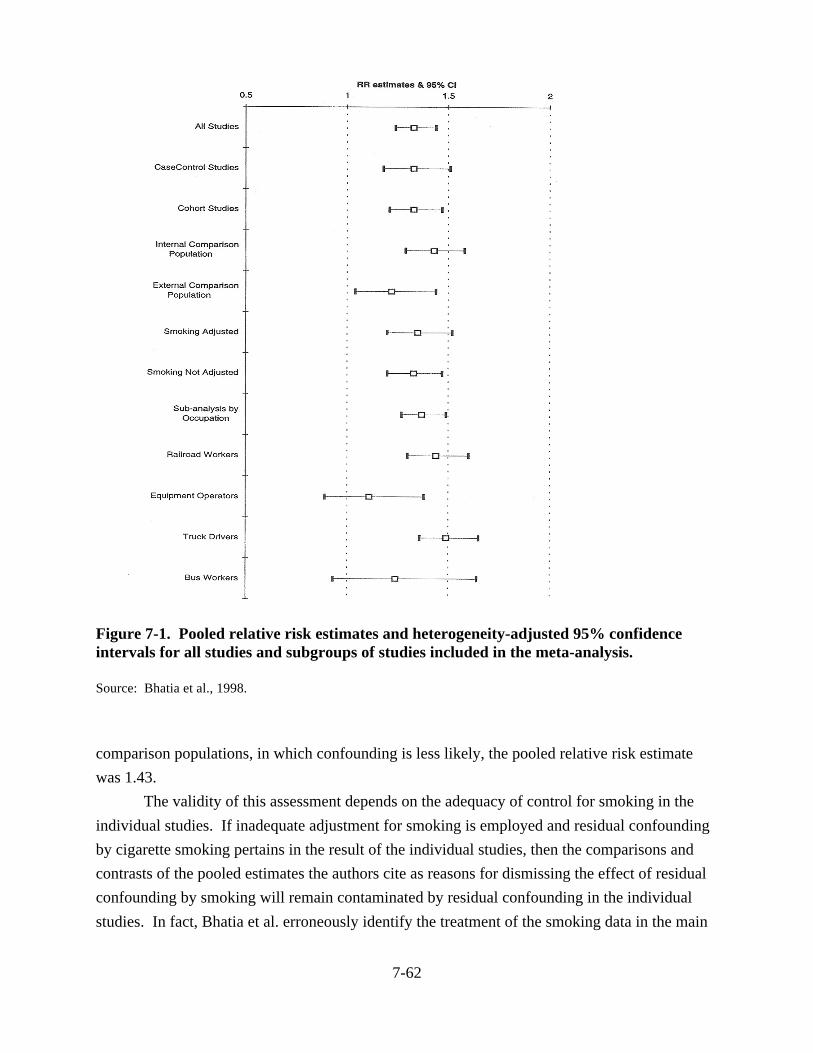
7-62
Figure 7-1. Pooled relative risk estimates and heterogeneity-adjusted 95% confidenceintervals for all studies and subgroups of studies included in the meta-analysis.
Source: Bhatia et al., 1998.
comparison populations, in which confounding is less likely, the pooled relative risk estimate
was 1.43.
The validity of this assessment depends on the adequacy of control for smoking in the
individual studies. If inadequate adjustment for smoking is employed and residual confounding
by cigarette smoking pertains in the result of the individual studies, then the comparisons and
contrasts of the pooled estimates the authors cite as reasons for dismissing the effect of residual
confounding by smoking will remain contaminated by residual confounding in the individual
studies. In fact, Bhatia et al. erroneously identify the treatment of the smoking data in the main

7-63
analysis for the 1987 report by Garshick et al. as a continuous variable representing pack-years
of smoking, whereas the analysis actually dichotomized the pack-years data into two crude dose
categories (above and below the 50 pack-years level). This clearly reduced the quality of the
adjustment for smoking, which already suffered from the fact that information on cumulative
cigarette consumption was missing for more than 20% of the lung cancer cases. In this instance,
the consistency between the adjusted and unadjusted estimates of the relative risk for DE
exposure may be attributable to failure of adjustment rather than lack of confounding by
cigarette smoking. A similar problem exists for the Bhatia et al. representation of the control for
confounding in the study by Boffetta and Stellman (1988).
An evaluation of the potential for publication bias is presented that provides reassurance
that the magnitude of published effects is not a function of the precision or study power;
however, this assessment cannot rule out the possibility of publication bias.
7.2.3.3. Lipsett and Campleman (1999): Occupational Exposure to DE and Lung Cancer: A
Meta-Analysis
Lipsett and Campleman (1999) conducted electronic searches to identify epidemiologic
studies published between 1975 and 1995 of the relationship of occupational exposure to DE and
lung cancer. Studies were selected based on the following criteria: (1) Estimates of relative risks
and their standard errors must be reported or derivable from the information presented. (2)
Studies must have allowed for a latency period of 10 or more years for development of lung
cancer after onset of exposure. (3) No obvious bias resulted from incomplete case ascertainment
in follow-up studies. (4) Studies must be independent: that is, a single representative study
selected from any set of multiple analyses of data from the same population. Studies focusing
on occupations involving mining were excluded because of potential confounding by radon,
arsenic, and silica, as well as possible interactions between cigarette smoking and exposure to
these substances in lung cancer induction.
Thirty of the 47 studies initially identified as relevant met the specified inclusion criteria.
Several risk estimates were extracted from six studies reporting results from multiple mutually
exclusive diesel-related occupational subgroups. If a study reported effects associated with
several levels or durations of exposure, the effect reported for the highest level or longest
duration of exposure was used. If estimates for several occupational subsets were reported, the
most diesel-specific occupation or exposure was selected. Adjusted risk estimates were used
when available.
Thirty-nine independent estimates of relative risk and standard errors were extracted.
Pooled estimates of relative risk were calculated using a random-effects model. Among study

7-64
populations most likely to have had substantial exposure to DE, the pooled smoking- adjusted
relative risk was 1.47 (95% CI = 1.29, 1.67) (see Figure 7-2).
Figure 7-2. Pooled estimates of relative risk of lung cancer in epidemiologic studiesinvolving occupational exposure to DE (random-effects models).
Source: Lipsett and Campleman, 1999.
The between-study variance of the relative risks indicated the presence of significant
heterogeneity in the individual estimates. The authors evaluated the potential sources of
heterogeneity by subset analysis and linear meta-regressions. Major sources of heterogeneity
included control for confounding by smoking, selection bias (a healthy worker effect), and
exposure patterns characteristic of different occupational categories. A modestly higher, pooled
relative risk was derived for the subset of case-control studies, which, unlike the cohort studies,
showed little evidence of heterogeneity.
This meta-analysis also evaluated the potential for publication bias, which provides
reassurance that the magnitude of published effects is not a function of the precision or study
7-65
power. Again, as stated in the Bhatia et al. (1998) review, this assessment cannot rule out the
possibility of publication bias.
Although a relatively technical approach was used in deriving summary estimates of
relative risk and the evaluation of possible sources of variation in the relative risks in this meta-
analysis, this approach should not be confused with rigorous evaluation of the potential
weaknesses among the studies included in the analysis. The heterogeneity attributable to
statistical adjustment for smoking was evaluated based on a dichotomous assessment of whether
control for smoking could be identified in the studies considered. This does not reflect the
adequacy of the adjustment for smoking employed in the individual studies considered.
7.2.4. Summary and Discussion
Certain extracts of DE have been demonstrated as both mutagenic and carcinogenic in
animals and in humans. Animal data suggest that DE is a pulmonary carcinogen among rodents
exposed by inhalation to high doses over long periods of time. While rat lung cancer response to
DE is not suitable for dose-response extrapolation to humans, the positive lung cancer response
doses imply a hazard for humans. Because large working populations are currently exposed to
DE and because nonoccupational ambient exposures currently are of concern as well, the
possibility that exposure to this complex mixture may be carcinogenic to humans has become an
important public health issue.
Because diesel emissions become diluted in the ambient air, it is difficult to study the
health effects in the general population. Nonoccupational exposure to DE is worldwide in urban
areas. Thus, “unexposed” reference populations used in occupational cohort studies are likely to
contain a substantial number of individuals who are nonoccupationally exposed to DE.
Furthermore, the “exposed” group in these studies is based on job titles, which in most instances
are not verified or correlated with environmental hygiene measurement. The issue of health
effect measurement is further complicated by the fact that occupational cohorts tend to be
healthy and have below-average mortality, usually referred to as the “healthy worker effect.”
Hence, the usual standard mortality ratios observed in cohort mortality studies are likely to be
underestimations of true risk.
A major difficulty with the occupational studies considered here was measurement of
actual DE exposure. Because all the cohort mortality studies were retrospective, assessment of
health effects from exposure to DE was naturally indirect. In these occupational settings, no
systematic quantitative records of ambient air were available. Most studies compared men in job
categories with presumably some exposure to DE with either standard populations (presumably
no exposure to DE) or men in other job categories from industries with little or no potential for
DE exposure. A few studies have included measurements of diesel fumes, but there is no

7-66
standard method for the measurement. No attempt is made to correlate these exposures with the
cancers observed in any of these studies, nor is it clear exactly which extract should have been
measured to assess the occupational exposure to DE. All studies have relied on the job
categories or self-report of exposure to DE. Gustavsson et al. (1990), Emmelin et al. (1993),
and Brüske-Hohlfeld et al. (1999) estimated exposure levels by getting detailed histories of job
tasks/categories and computing cumulative exposures, which unfortunately were not verifiable
due to of the lack of industrial hygiene data. In the studies by Garshick et al. (1987, 1988), the
diesel-exhaust-exposed job categories were verified based on an industrial hygiene survey done
by Woskie et al. (1988a,b). The investigators found that in most cases the job titles were good
surrogates for DE exposure. Also, in the railroad industry, where only persons who had at least
10 years of work experience were included in the study, the workers tended not to change job
categories over the years. Thus, a job known only at one point in time was a reasonable marker
of past DE exposure. Unfortunately, the exposure was only qualitatively verified. Quantitative
use of this information would have been much more meaningful. Zaebst et al. (1991) conducted
an industrial hygiene survey of elemental carbon exposure in the trucking industry by job
categories. Using these exposure measurements, Steenland et al. (1998) conducted an exposure-
response analysis of their earlier lung cancer case-control study (Steenland et al., 1990). These
exposure data are currently being verified and will be used for quantitative risk assessment in the
near future.
Occupations involving potential exposure to DE are miners, truck drivers, transportation
workers, railroad workers, and heavy equipment operators. No known studies in metal miners
have assessed whether DE is associated with lung cancer. Currently, there are about 265
underground metal/nonmetal mines in the United States (Department of Labor, Mine Safety and
Health Administration, 2001). Approximately 20,000 miners are employed, but not all of them
are currently working in the mines. Diesel engines were introduced in metal mines in the United
States in the early to mid-1960s. Although all these mines use diesel equipment, it is difficult to
estimate how many of these miners were actually exposed to diesel fumes.
Diesel engines were introduced in coal mines at an even later date in the United States,
and their use is still quite limited. There are 910 underground coal mines in the United States, of
which only 145 currently use diesel powered equipment (Department of Labor, Mine Safety and
Health Administration, 2001). Even if it were possible to estimate how many miners (metal and
coal) were exposed to DE, it would be very difficult to separate out the confounding effects of
other potential pulmonary carcinogens, such as radon decay products or heavy metals (e.g.,
arsenic, chromium). Furthermore, the relatively short latency period limits the usefulness of
these cohorts of miners.

7-67
Both metal and coal mines in Europe and Australia, on the other hand, have been using
diesel equipment for more than 50 years. The epidemiologic studies of coal miners conducted in
these countries discuss only exposures to coal dust. In most of the coal miner studies, DE
exposures are not even mentioned by the investigators as confounding exposures. Therefore, it
is not known how many miners, if any, were exposed to DE, for how long, and at what
concentrations. Although studies of coal miners reviewed by IARC (1997) generally found
lower than expected lung cancer mortality (with some exceptions where some excess of lung
cancer was observed), without knowing the concentrations, duration of exposure, and number of
miners exposed to DE, it is inappropriate to conclude that the reported lung cancer mortality
deficit in these studies provides a proof positive of absence of causal association between DE
exposure and occurrence of lung cancer.
7.2.4.1. Summary of the Cohort Mortality Studies
The cohort studies mainly demonstrated an increase in lung cancer. Studies of bus
company workers by Waller (1981), Rushton et al. (1983), and Edling et al. (1987) failed to
demonstrate any statistically significant excess risk of lung cancer, but these studies have certain
methodological problems, such as small sample sizes, short follow-up periods (just 6 years in the
Rushton et al. study), lack of information on confounding variables, and lack of analysis by
duration of exposure, duration of employment, or latency that preclude their use in determining
the carcinogenicity of DE. Although the Waller (1981) study had a 25-year follow-up period,
the cohort was restricted to employees (ages 45 to 64) currently in service. Employees who left
the job earlier, as well as those who were still employed after age 64 and who may have died
from cancer, were excluded.
Wong et al. (1985) conducted a mortality study of heavy equipment operators that
demonstrated a nonsignificant positive trend for cancer of the lung with length of membership
and latency. Analysis of deceased retirees showed a significant excess of lung cancer.
Individuals without work histories who started work prior to 1967, when records were not kept,
may have been in the same jobs for the longest period of time. Workers without job histories
included those who had the same job before and after 1967 and thus may have worked about 12
to 14 years longer; these workers exhibited significant excess risks of lung cancer and stomach
cancer. If this assumption about duration of jobs is correct, then these site-specific causes can be
linked to DE exposure. One of the methodologic limitations of this study is that most of these
men worked outdoors; thus, this cohort might have had relatively low exposure to DE. The
authors did not present any environmental measurement data either. Because of the absence of
detailed work histories for 30% of the cohort and the availability of only partial work histories
for the remaining 70%, jobs were classified and ranked according to presumed diesel exposure.
7-68
Information is lacking regarding duration of employment in the job categories (used for
surrogate of exposure) and other confounding factors (alcohol consumption, cigarette smoking,
etc.). Thus, this study cannot be used to support or refute a causal association between exposure
to DE and lung cancer.
A 2-year mortality analysis by Boffetta and Stellman (1988) of the American Cancer
Society’s prospective study, after controlling for age and smoking, demonstrated an excess risk
of lung cancer in certain occupations with potential exposure to DE. These excesses were
statistically significant among miners (RR = 2.67, 95% CI = 1.63, 4.37) and heavy equipment
operators (RR = 2.6, 95% CI = 1.12, 6.06). Recently Brüske-Hohlfeld et al. (1999) also have
observed significantly higher risk for lung cancer, in the range of 2.31 to 4.3, for heavy
equipment operators. The elevated risks were nonsignificant in railroad workers (RR = 1.59)
and truck drivers (RR = 1.24). A dose response was also observed for truck drivers. With the
exception of miners, exposure to DE occurred in the three other occupations showing an increase
in the risk of lung cancer. Despite methodologic limitations, such as the lack of representiveness
of the study population (composed of volunteers only, who were probably healthier than the
general population), leading to an underestimation of the risk, and the questionable reliability of
exposure data based on self-administered questionnaires that were not validated, this study is
suggestive of a causal association between exposure to DE and excess risk of lung cancer.
Two mortality studies were conducted by Gustavsson et al. (1990) and Hansen (1993)
among bus garage workers (Stockholm, Sweden) and truck drivers, respectively. An SMR of
122 was found among bus garage workers, based on 17 cases. A nested case-control study was
also conducted in this cohort. Detailed exposure matrices based on job tasks were assembled for
both DE and asbestos exposures. Statistically significant increasing lung cancer relative risks of
1.34, 1.81, and 2.43 were observed for DE indices of 10 to 20, 20 to 30, and >30, respectively,
using 0 to 10 as a comparison group. Adjustment for asbestos exposure did not change the
results. The main strength of this study is the detailed exposure matrices; some of the limitations
are low power (small cohort) and lack of smoking histories. But smoking is not likely to be
different among study individuals irrespective of their exposure status to DE.
Hansen (1993), on the other hand, found statistically significant SMR of 160 from cancer
of bronchus and lung. No dose response was observed, although the excesses were observed in
most of the age groups (30 to 39, 45 to 49, 50 to 54, 55 to 59, 60 to 64, and 65 to 74). There are
quite a few methodologic limitations to this study. Exposure to DE was assumed in truck drivers
for diesel-powered trucks, but no validation of exposure was attempted. Follow-up period was
short, no latency analysis was done, and smoking data were lacking. However, a population
survey carried out in 1988 showed very little difference in smoking habits of residents of rural
area and the total Danish male population, thus, smoking is unlikely to confound the finding of
7-69
excess lung cancer. The findings of both these studies are consistent with the findings of other
truck driver studies and are supportive of causal association.
Two mortality studies of railroad workers were conducted by Howe et al. (1983) and
Garshick et al. (1988). The Howe et al. study, which was conducted in Canada, found relative
risks of 1.2 (p<0.01) and 1.35 (p<0.001) among “possibly” and “probably” exposed groups,
respectively. The trend test showed a highly significant dose-response relationship with
exposure to DE and the risk of lung cancer. The main limitation of the study was the inability to
separate overlapping exposures of coal dust/combustion fumes and DE fumes. Information on
jobs was available at retirement only. There also was insufficient detail on the classification of
jobs by DE exposure. The exposures could have been nonconcurrent or concurrent, but because
the data are lacking, it is possible that the observed excess could be due to the effect of both coal
dust/combustion fumes and DE fumes and not just one or the other. It should be noted that, so
far, coal dust has not been demonstrated to be a pulmonary carcinogen in studies of coal miners.
However, lack of data on confounders such as asbestos and smoking (though use of the internal
comparison group to compute relative risks minimizes confounding by smoking) makes
interpretation of this study difficult. When three DE exposure categories were examined for
smoking-related diseases such as emphysema, laryngeal cancer, esophageal cancer, and buccal
cancer, positive trends were observed, raising a possibility that the dose response demonstrated
for diesel exposure may have been due to smoking. The findings of this study are at best
suggestive of DE being a lung carcinogen.
The strong evidence for linking DE exposure to lung cancer comes from the Garshick et
al. (1988) railroad worker study conducted in the United States. Relative risks of 1.57 (95% CI
= 1.19, 2.06) and 1.34 (95% CI = 1.02, 1.76) were found for ages 40 to 44 and 45 to 49,
respectively, after the exclusion of workers exposed to asbestos. The investigators reported that
the risk of lung cancer increased with increasing duration of employment. As this was a large
cohort study with a lengthy follow-up and adequate analysis, including dose response (based on
duration of employment as a surrogate) as well as adjustment for other confounding factors such
as asbestos, the observed association between increased lung cancer and exposure to DE is more
meaningful. Even though the reanalysis of these data by Crump et al. (1991) found that the
relative risk could be positively or negatively related to duration of exposure depending on how
age was controlled, additional analysis by Garshick et al. (letter from Garshick, Harvard Medical
School, to Chao Chen, U.S. EPA, dated August 15, 1991) found that the relationship between
years exposed when adjusted for the attained age and calendar years was flat to negative,
depending on the choice of the model. They also found that deaths were underreported by
approximately 20% to 70% between 1977 and 1980, and their analysis based on job titles,
limited to 1959-1976, showed that the youngest workers still had the highest risk of dying of
7-70
lung cancer. On the other hand, an analysis of the same data by California EPA (CalEPA, 1998)
yielded a positive dose response set using age at 1959 and adding an interaction term of age and
calendar year in the model. However, Crump (1999) reported that the negative dose-response
continued to be upheld in his latest analysis when age was controlled more carefully and years of
exposure quantified more accurately. Crump (1999) asserted that the negative dose-response
trends for lung cancer observed with either the cumulative exposure or duration of exposure may
be due to underascertainment of deaths in the last 4 years of follow-up of the Garshick et al.
(1988) study, as well as incomplete follow-up in earlier years. The HEI (1999) special panel
conducted its own analyses using Garshick et al. (1988) data to evaluate their usefulness for
quantitative risk assessment and found results similar to those of Crump et al. (1991) and
Garshick (letter from Garshick, Harvard Medical School, to Chao Chen, U.S. EPA, dated August
15, 1991). The HEI panel reported consistently elevated risk of lung cancer for train workers
compared with clerks for each duration of employment, and that shop workers had an
intermediate risk of lung cancer. But they found decreasing risk of lung cancer with increasing
duration of employment. The panel discussed various possibilities (different types of biases) for
the negative dose-response and advised against using the Garshick et al. (1988) data for
quantitative risk assessment. The panel also reported the strengths of the Garshick et al. (1988)
study such as large population, control for asbestos, and smoking, and concluded that the study
was generally consistent with findings of weak association between exposure to DE and
occurrence of lung cancer. Hence, the divergent results of these recent analyses do not negate
the positive evidence this study provides for the qualitative evaluation. The observance of dose-
response would have strengthened the causal association, but an absence of a dose-response does
not negate it.
Suggestive evidence is provided by a recent study of potash miners in Germany. The
information on the exposure (including elemental carbon and organics), work chronology, and
work category was used by the investigators to calculate cumulative exposures for each worker.
Furthermore, information on smoking habits indicated homogeneity in the cohort.
A statistically nonsignificant twofold increase in lung cancer was observed in the production
workers as compared to workshop workers. The lack of significance for this finding could be
due to short follow-up, not enough latency, and relatively young age of the cohort.
7.2.4.2. Summary of the Case-Control Studies of Lung Cancer
Among the 11 lung cancer case-control studies reviewed in this chapter, only 2 studies
did not find any increased risk of lung cancer. Lerchen et al. (1987) did not find any excess risk
of lung cancer, after adjusting for age and smoking, for diesel fume exposure. The major
limitation of this study was a lack of adequate exposure data derived from the job titles obtained

7-71
from occupational histories. Next of kin provided the occupational histories for 50% of the
cases that were not validated. The power of the study was small (analysis done on males only,
333 cases). Similarly, Boffeta et al. (1990) did not find any excess of lung cancer after adjusting
for smoking and education. This study had a few methodological limitations. The lung cancer
cases and controls were drawn from the ongoing study of tobacco-related diseases. It is
interesting to note that the leading risk factor for lung cancer is cigarette smoking. The exposure
was not measured. Instead, occupations were used as surrogates for exposure. Furthermore,
there were very few individuals in the study who were exposed to DE. On the other hand,
statistically nonsignificant excess risks were observed for DE exposure by Hall and Wynder
(1984) in workers who were exposed to DE versus those who were not (OR = 1.4 and 1.7 with
two different criteria) and by Damber and Larsson (1987) in professional drivers (OR = 1.2).
These rates were adjusted for age and smoking. Hall and Wynder (1984) had a high
nonparticipation rate of 36%. Therefore, the positive results found in this study are
underestimated at best. In addition, the self-reported exposures used in the study by Hall and
Wynder (1984) were not validated. This study also had low power to detect excess risk of lung
cancer for specific occupations.
The study by Benhamou et al. (1988), after adjusting for smoking, found significantly
increased risks of lung cancer among French motor vehicle drivers (RR = 1.42) and transport
equipment operators (RR = 1.35). The main limitation of the study was the inability to separate
exposures to DE from those to gasoline exhaust because both motor vehicle drivers and transport
equipment operators probably were exposed to the exhausts of both types of vehicles.
Hayes et al. (1989) combined data from three studies (conducted in three different states)
to increase the power to detect an association between lung cancer and occupations with a high
potential for exposure to DE. They found that truck drivers employed for more than 10 years
had
a significantly increased risk of lung cancer (OR = 1.5, 95% CI = 1.1, 1.9). This study also
found a significant trend of increasing risk of lung cancer with increasing duration of
employment among truck drivers. The relative odds were computed by adjusting for birth
cohort, smoking, and State of residence. The main limitation of this study is again the mixed
exposures to diesel and gasoline exhausts, because information on type of engine was lacking.
Also, potential bias may have been introduced because the way in which the cause of death was
ascertained for the selection of cases varied in the three studies. Furthermore, the methods used
in these studies to classify occupational categories were different, probably leading to
incompatibility of occupational categories.
Emmelin et al. (1993), in their Swedish dockworkers from 15 ports, found increased
relative odds of 6.8 (90% CI = 1.3 to 34.9). A strong interaction between smoking and DE was

7-72
observed in this study. Of 50 cases and 154 controls, only 6 individuals were nonsmokers.
Although intricate exposure matrices were created using three different variables, no direct
exposure measurement was done. Despite the limitations of small number of cases and controls;
lack of data on asbestos exposure, which is fairly common in dockworkers; and very few
nonsmokers; this study provides consistent support for a real effect of DE exposure and
occurrence of lung cancer, at least in smokers.
The most convincing evidence comes from the case-control studies among railroad
workers by Garshick et al. (1987); among truck drivers of the Teamsters Union by Steenland et
al. (1990, 1998); among truck drivers, railroad workers, and farmers in a population-based study
by Swanson et al. (1993); among different professional drivers in Denmark by Hansen et al.
(1998); and among male workers occupationally exposed to diesel motor emissions in Germany
by Brüske-Hohlfeld et al. (1999). Garshick et al. (1987) found that after adjustment for asbestos
and smoking, the relative odds for continuous exposure were 1.39 (95% CI = 1.05, 1.83).
Among the younger workers with longer DE exposure, the risk of lung cancer increased with
duration of exposure after adjusting for asbestos and smoking. Even after the exclusion of
recent DE exposure (5 years before death), the relative odds increased to 1.43 (95% CI = 1.06,
1.94). This appears to be a well-conducted and well-analyzed study with reasonably good
power. Potential confounders were controlled adequately, and interactions between DE and
other lung cancer risk factors were tested. Some of the limitations of this study are
misclassification of exposure because ICC job classification was used as surrogate for exposure
and use of death certificates for identification of cases and controls.
Steenland et al. (1990), on the other hand, created two separate work history files, one
from Teamsters Union pension files and the other from next-of-kin interviews. Using duration
of employment as a categorical variable and considering employment after 1959 (when
presumed dieselization occurred) for long-haul drivers, the risk of lung cancer increased with
increasing years of exposure. Using 1964 as the cutoff, a similar trend was observed for long-
haul drivers. For short-haul drivers, the trend was positive with a 1959 cutoff, but not when
1964 was used as the cutoff. For truck drivers who primarily drove diesel trucks and worked for
35 years, the relative odds were 1.89. The main strengths of the study are availability of detailed
records from the Teamsters Union, a relatively large sample size, availability of smoking data,
and measurements of exposure. The limitations of this study include possible misclassifications
of exposure and smoking, lack of levels of diesel exposure, a smaller nonexposed group, and an
insufficient latency period. Recently Steenland et al. (1998) conducted an exposure-response
analysis on these cases and controls, using the industrial hygiene survey results of Zaebst et al.
(1991). The estimates were made for long-haul drivers, short-haul drivers, dockworkers,
mechanics, and those outside the trucking industry. The survey found that mechanics had the

7-73
highest current levels of DE exposures and dockworkers who mainly used propane- powered
forklifts had the lowest exposure. The finding of the highest lung cancer risk for mechanics and
lowest for dock workers is indicative of a causal association between the DE exposure and
development of lung cancer. However, the risk among mechanics did not increase with
increasing duration of employment. The ORs for quartile cumulative exposures, computed by
using logistic regression adjusted for age, race, smoking, diet, and asbestos exposure, showed a
pattern of increasing trends in risk with increasing exposure, between 1.08 and 1.72 depending
upon exposure level and lag structure used.
In a population-based lung cancer case-control study Swanson et al. (1993) found
statistically significant excess risks adjusted for age at diagnosis, smoking, and race, among
white male drivers of heavy trucks employed for $20 years and railroad workers employed for
$10 years (OR = 2.5, 95% CI = 1.1, 4.4, and OR = 2.4, 95 % CI = 1.1, 5.1, respectively), and
among black farmers employed for $20 years (OR = 10.4, 95% CI = 1.4, 77.1). Although
individual ORs were not significant for various occupations with potential exposure to DE,
statistically significant trends were observed for drivers of heavy trucks, light trucks, farmers,
and railroad industry workers among whites, and among black farmers (p#0.05). The main
strengths of the study are availability of data on lifetime work history and smoking history; the
main limitation is absence of actual specific exposure data. This is the first study that found
increased lung cancer risk for farmers, who are exposed to DE of their farm tractors.
Hansen et al. (1998), in their study of professional drivers in Denmark, found statistically
significant ORs (adjusted for socioeconomic status) of 1.31, 1.64, and 1.39 for lorry/bus drivers,
taxi drivers, and unspecified drivers, respectively. The lag time analyses for duration of
employment were unchanged for lorry/bus drivers but increased to OR = 3 from 2.2 in taxi
drivers with a lag time of 10 years and duration of employment of > 5 years. The authors
asserted that the higher risk seen in the taxi drivers may be due to higher exposure to these
drivers because of longer time spent in traffic congestion. Furthermore, the trend tests for
increasing risk of lung cancer with increasing duration of employment were statistically
significant for both lorry/bus drivers and taxi drivers in both 10-year lag time and no lag time.
The main strengths of the study are the large sample size, availability of detailed employment
records, and information on socioeconomic status. The main limitations are absence of
individual data on smoking habits and asbestos exposure, and information about the type of fuel
used for the vehicles driven by these professional drivers. A personal communication with the
main investigator revealed that the lorries/buses and taxis have been using diesel fuel since the
late 1940s. Moreover, indirect information about smoking and asbestos exposure indicated that
these two confounders are unlikely to explain the observed excesses or the trends, resulting in
strong support of earlier positive studies.

7-74
Brüske-Hohlfeld et al. (1999) recently conducted a pooled analysis of two case-control
studies among male workers occupationally exposed to DME in Germany. The investigators
collected data on demographic information, detailed smoking, and occupational history. Job
titles and industries were classified in 33 and 21 categories respectively. Job descriptions were
written and verified to avoid misclassification of estimated exposure to diesel emissions.
Individual cumulative DME exposures and smoking pack-years were calculated. Asbestos
exposures were estimated by certain job-specific supplementary questions. Analysis of 3,498
lung cancer cases and 3,541 controls yielded statistically significant ORs ranging from 1.25 to
2.31 adjusted for smoking and asbestos exposure. The risk increased with increasing years of
exposure for both the first year of exposure and the end year of exposure. These investigators
presented analyses by various job categories, by years of exposure, first and end years of
exposure and, when possible, separately for West and East Germany. Significantly higher risks
were found among all four job categories. For professional drivers (of trucks, buses, and taxis)
ORs ranged from 1.25 to 2.53. For other traffic-related jobs (switchmen, diesel locomotive
drivers, diesel forklift truck drivers), ORs ranged from 1.53 to 2.88. For heavy equipment
operators (bulldozers, graders, and excavators), ORs ranged from 2.31 to 4.3, and for drivers of
farming equipment the only significant excess (OR = 6.81) was for exposure for <30 years.
This study shows increased risk for all the DME-exposed job categories. The
professional drivers and the other traffic-related jobs also have some mixed exposures to
gasoline exhaust in general traffic. On the other hand, it should be noted that exposure to DME
among heavy equipment and farm tractor drivers is much higher and not as mixed as in
professional drivers. The heavy equipment drivers usually drive repeatedly through their own
equipment’s exhaust. Therefore, the observed highest risk for lung cancer in this job category
establishes a strong link with the DME. The only other study that found significantly higher risk
for heavy equipment operators (RR = 2.6) was conducted by Boffeta et al. (1988). Although the
only significant excess in the group was observed for farming tractor operators with more than
30 years of exposure, a steady increase in risk was observed for this job category with increasing
exposure. The investigators stated that the working conditions and the DME of tractors
remained fairly constant over the years. This increase may be due mainly to exposure to DME
and PM10.
The main strengths of the study are large sample size, resulting in good statistical power;
inclusion of incident cases diagnosed not more than 3 months prior to the interview; use of only
personal interviews, reducing recall bias; diagnoses ascertained by cytology or histology; and
availability of lifelong detailed occupational and smoking history. Exposure estimation done for
each individual was based on job codes and industry codes, which were validated by written job
descriptions to avoid misclassification.

7-75
The main limitation of the study is lack of data on actual exposure to DME. The
cumulative quantitative exposures were calculated based on time spent in each job with potential
exposure to DME and the type of equipment used. Thus, this study provides strong evidence for
causal association between exposure to DE and occurrence of lung cancer.
7.2.4.3. Summary of the Reviews and Meta-Analyses of Lung Cancer
Three summaries of studies concerned with the relationship of DE exposure and lung
cancer risk are reviewed. The HEI report is a narrative study of 35 epidemiologic studies (16
cohort and 19 case-control) of occupational exposure to diesel emissions published between
1957 and 1993. Control for smoking was identified in 15 studies. Six of the studies (17%)
reported relative risk estimates less than 1, whereas 29 (83%) reported at least 1 excess relative
risk, indicating a positive association. Twelve studies indicating a relative risk greater than 1
had 95% confidence intervals that excluded unity. These studies found that the evidence
suggests that occupational exposure to DE from diverse sources increases the rate of lung cancer
by 20% to 40% in exposed workers generally, and to a greater extent among workers with
prolonged exposure. They also found that the results are not explicable by confounding due to
cigarette smoking or other known sources of bias.
Bhatia et al. (1998) identified 23 studies that met criteria for inclusion in the meta-
analysis. The observed relative risk estimates were greater than 1 in 21 of these studies. The
pooled relative risk weighted by study precision was 1.33 (95% CI= 1.24, 1.44), which indicated
increased relative risk for lung cancer from occupational exposure to DE. Subanalyses by study
design (case-control and cohort studies) and by control for smoking produced results that did not
differ from those of the overall pooled analysis. Cohort studies using internal comparisons
showed higher relative risks than those using external comparisons.
Lipsett and Campleman (1999) identify 39 independent estimates of relative risk among
30 eligible studies of DE and lung cancer published between 1975 and 1995. Pooled relative
risks for all studies and for study subsets were estimated using a random effect model.
Interstudy heterogeneity was also modeled and evaluated. A pooled smoking-adjusted relative
risk was 1.47 (95% CI = 1.29, 1.67). Substantial heterogeneity was found in the pooled-risk
estimates. Adjustment for confounding by smoking, having a lower likelihood of selection bias,
and increased study power were all found to contribute to lower heterogeneity and increased
pooled estimates of relative risk.
There is some variability in the conclusions of these summaries of the association of DE
and lung cancer. The three analyses find that smoking is unlikely to account for the observed
effects, and all conclude that the data support a causal association between lung cancer and DE
exposure. On the other hand, Stöber and Abel (1996), Muscat and Wynder (1995), and Cox

7-76
(1997) call into question the assertions by Cohen and Higgins (1995), Bhatia et al. (1998), and
Lipsett and Campleman (1999) that the associations seen for DE and lung cancer are unlikely to
be due to bias. They argue that methodologic problems are prevalent among the studies,
especially in evaluation of diesel engine exposure and control of confounding by cigarette
smoking, and thus, the observed association between exposure to DE and excess risk of lung
cancer is more likely to be due to bias. The conclusions of the two meta-analyses are based on
magnitude of pooled relative risk estimates and evaluation of potential sources of heterogeneity
in the estimates. Despite the statistical sophistication of the meta-analyses, the statistical models
used cannot compensate for deficiencies in the original studies and will remain biased to the
extent that bias exists in the original studies.
7.2.4.4. Discussion of Relevant Methodologic Issues
A persistent association of risk for lung cancer and DE exposure has been observed in
more than 30 epidemiologic studies published in the literature over the past 40 years. Evaluation
of whether this association can be attributed to a causal relation between DE exposure and lung
cancer requires careful consideration of whether chance, bias, or confounding might be likely
alternative explanations.
A total of 10 cohort and 12 case-control studies are reviewed in this chapter. An
increased lung cancer risk was observed in 8 cohort and 10 case-control studies, even though the
results were not always statistically significant. There is a consistent tendency for point
estimates of relative risk to be greater than one in studies that adjusted (either directly or
indirectly) for smoking, had a long enough follow-up, and sufficient statistical power among
truck drivers, railroad workers, dock workers, and heavy equipment workers. If this elevated
risk was due to chance one would expect almost equal distribution of these point estimates to be
above and below one. Many of the studies provide confidence intervals for their estimates of
excess risk or statistical tests, which indicate that it is unlikely that the individual study findings
were due to random variation. The persistence of this association between DE and lung cancer
risk in so many studies indicates that the possibility is remote that the observed association in
aggregate is due to chance. It is unlikely that chance alone accounts for the observed relation
between DE and lung cancer.
The excess risk is observed in both cohort and case-control designs, which contradicts the
concern that a methodologic bias specifically characteristic of either design (e.g., recall bias)
might account for the observed effect. Selection bias is certainly present in some of the
occupational cohort studies that use external population data in estimating relative risks, but this
form of selection bias (a healthy worker effect) would only obscure, rather than spuriously
produce, an association between DE and lung cancer. Several occupational epidemiologic

7-77
studies that use more appropriate data for their estimates are available. Selection biases may be
operating in some case-control studies, but it is not obvious how such a bias could be sufficiently
uniform in effect, prevalent, and strong enough to lead to the consistent association seen in the
aggregate data. Given the variety of designs used in studying the DE and lung cancer
association and the number of studies in different populations, it is unlikely that routinely
studying noncomparable groups is an explanation for the consistent association seen. Exposure
information bias is certainly a problem for almost all of the studies concerned. Detailed and
reliable individual-level data on DE exposure for the period of time relevant to the induction of
lung cancer are not available and are difficult to obtain. Generally, the only information from
which diesel exposure can be inferred is occupational data, which is a poor surrogate for the true
underlying exposure distribution. The variability in actual lifetime exposure to DE in an
occupational cohort may not be reflected in differences in job title, and there might be
considerable variability in actual exposure despite similar job titles. Study endpoints are
frequently mortality data taken from death certificate information, which is frequently inaccurate
and often does not fully characterize the lung cancer incidence experience of the population in
question. Using inaccurate surrogates for lung cancer incidence and for diesel exposure can lead
to substantial bias, and these shortcomings are endemic in the field. In most cases these
shortcomings will lead to misclassification of exposure and of outcome, which is nondifferential.
Nondifferential misclassification of exposure and/or outcome can bias estimates of a DE–lung
cancer association, if one exists, toward the null; but it is unlikely that such misclassification
would produce a spurious estimate in any one study. It is even more unlikely that it would bias a
sufficient number of studies in a uniform direction to account for the consistent aggregate
association observed.
Moreover, throughout this chapter, various methodologic limitations of individual studies
have been discussed, such as small sample size, short follow-up period, lack of data on
confounding variables, use of death certificates to identify the lung cancer cases, and lack of
latency analysis. The studies with small sample sizes (i.e., not enough power) and short follow-
up periods (i.e., not enough latent period) have been difficult to interpret due to these limitations.
The most important confounding variable is smoking which is a strong risk factor for
lung cancer. All the studies considered for this report are either cohort retrospective mortality or
case-control studies where history of exposures in the past is elicited. Smoking history is usually
difficult to obtain in such instances. The smoking histories obtained from surrogates (next of
kin, either spouse or offspring) were found to be accurate by Lerchen and Samet (1986) and
McLaughlin et al. (1987). Lerchen and Samet did not detect any consistent bias in the report of
cigarette consumption. In contrast, overreporting of cigarette smoking by surrogates was
observed by Rogot and Reid (1975), Kolonel et al. (1977), and Humble et al. (1984). Kolonel et

7-78
al. found that the age at which an individual started smoking was reported within 4 years of
actual age 84% of the time. These studies indicate that surrogates were able to provide fairly
credible information on the smoking habits of the study subjects. If the surrogates of the cases
were more likely to overreport cigarette smoking compared with the controls, then it might be
harder to find an effect of DE because most of the increase in lung cancer would be attributed to
smoking rather than to exposure to DE.
Some studies do not adjust for tobacco smoke exposure. Even though smoking is a
strong risk for lung cancer, it is only a confounder if there are differential smoking habits among
individuals exposed to DE versus individuals who are not exposed. Most of the occupational
cohorts include workers from the same socioeconomic background or used an internal
comparison group; hence, it is unlikely that confounding by cigarette smoking is substantial in
these studies. Some studies have adjusted for socioeconomic status and some studies have
compared the cigarette smoking habits by conducting rural and urban general population
surveys. Besides, in studies with long enough latency, adjustment for cigarette smoking did not
alter substantially the observed higher risk.
Another methodologic concern in these studies is use of death certificates to determine
cause of death. Death certificates were used by all of the cohort mortality studies and some of
the case-control studies of lung cancer to determine cause of death. Use of death certificates
could lead to misclassification bias because of overdiagnosis. Studies of autopsies done between
1960 and 1971 demonstrated that lung cancer was overdiagnosed when compared with hospital
discharge, with no incidental cases found at autopsy (Rosenblatt et al., 1971). Schottenfeld et al.
(1982) also found an overdiagnosis of lung cancer among autopsies conducted in 1977 and 1978.
On the other hand, Percy et al. (1981) noted 95% concordance when comparing 10,000 lung
cancer deaths observed in the Third National Cancer Survey from 1969 to 1971 (more than 90%
were confirmed histologically) to death-certificate-coded cause of death. These more recent
findings suggest that the diagnosis of lung cancer on death certificates is better than anticipated.
In reality, lung cancer is one cause of death that has been found to be generally reliably reported
on the death certificate. Thus, the misclassification bias probably is minimal in the studies
described in this chapter.
Finally, several investigators have not conducted latency analysis in their studies. The
latent period for lung cancer development is from 20 to 30 years or more. Considering the fact
that dieselization was not complete till almost 1959 for locomotives and the 1970s for the
trucking industry in the United States, most of the cohort studies conducted in the U.S.
population do not have a long enough follow-up period to allow for latency of 20 to 30+ years.
In addition, the study inclusion criteria for most of the studies are individuals who worked in the
industry for at least 6 months /1 year from the beginning of the follow-up period to the end of

3Hill in his address to the Royal Society of Medicine in 1965 on “The environment and disease:association or causation” explored several aspects of association between exposure and occurrence of an eventbefore deciding that the most likely interpretation of it is causation. He provided nine different aspects ofassociation that he characterized as his viewpoints before interpreting the association being causal. Theepidemiologic community universally adopted these (aspects/viewpoints) later as criteria for causality/causalassociation.
7-79
the follow-up period. Hence, the later the individual enters the cohort, the shorter the follow-up
period; thus, the latent period is insufficient for the occurrence of lung cancer in these late
entrants. Therefore, the observed slight to moderate increase in risk of lung cancer could be due
to insufficient latency. On the other hand, in certain case-control studies the elapsed period
between the identification of the lung cancer cases and exposure to DE is long enough to allow
for the 30+ years latency needed for the development of lung cancer (Hansen et al., 1998;
Brüske-Hohlfeld et al., 1999). These investigators identified lung cancer cases in the early to
mid-1990s and found significant excess risks for lung cancer among the individuals exposed to
DE. It should be noted that the use of diesel fuel for trucks, buses, and taxis had started in their
countries (Denmark and Germany, respectively) in the late 1940s.
7.2.4.5. Evaluation of Causal Association
In most situations, epidemiologic data are used to delineate the causality of certain health
effects. Several cancers have been causally associated with exposure to agents for which there is
no direct biological evidence. Insufficient knowledge about the biological basis for diseases in
humans makes it difficult to identify exposure to an agent as causal, particularly for malignant
diseases when the exposure was in the distant past. Consequently, epidemiologists and biologists
have used the original or modified version of a set of criteria provided by Hill (1965)3 that
define a causal relationship between exposure and the health outcome. A causal interpretation is
enhanced for studies that meet these criteria. None of these criteria actually proves causality;
actual proof is rarely attainable when dealing with environmental carcinogens. None of these
criteria should be considered either necessary (except temporality of exposure) or sufficient in
itself. The absence of any one or even several of these criteria does not prevent a causal
interpretation. However, if more criteria apply, this provides more credible evidence for
causality.
Thus, applying the Hill criteria (1965) of causal inference, as modified by Rothman
(1986), to the studies reviewed here resulted in the following:
• Strength of association. This phrase refers to the magnitude of the ratio of
incidence or mortality (RRs or ORs). Several studies found statistically
significant RRs and ORs that ranged from 1.2 to 2.6 (Howe et al., 1983; Rushton

7-80
et al., 1983; Wong et al., 1985; Gustavsson et al., 1990; Emmlin et al., 1993;
Hansen, 1993; Hansen et al., 1998) and, after adjustment for smoking and/or
asbestos, RRs and ORs remained statistically significant and in the same range in
certain studies (Dambar and Larson 1987; Garshick et al., 1987, 1988; Benhamou
et al., 1988; Boffetta and Stellman, 1988; Hays et al., 1989; Steenland et al.,
1990; Swanson et al., 1993; Brüsk-Hohlfeld et al., 1999). In addition, two meta-
analyses demonstrated that not only did excess in lung cancer remain the same
after stratification/adjustment for smoking and occupation, but in several
instances the pooled RRs showed modest increases, with little evidence of
heterogeneity. Overall, the studies in epidemiologic terms show relatively
modest to weak association between DE and occurrence of lung cancer. Even
though strong associations are more likely to be causal than modest-to-weak
associations, the fact that association is relatively modest or weak does not rule
out the causal link.
• Consistency. Increased lung cancer risk has been observed in several cohort and
case-control studies, conducted in several industries and occupations in which
workers were potentially exposed to DE. However, not all the excesses were
statistically significant. Statistically significant lung cancer excesses adjusted for
smoking were observed in truck drivers (Hayes et al., 1989; Hansen, 1993;
Swanson et al., 1993; Brüske-Hohlfeld et al., 1999), professional drivers
(Benhamou et al., 1988; Brüske-Hohlfeld et al., 1999), railroad workers
(Garshick et al., 1987; Swanson et al., 1993), heavy equipment drivers (Boffetta
and Stellman, 1988; Brüske-Hohlfeld et al., 1999), and farm tractor drivers
(Swanson et al., 1993; Brüske-Hohlfeld et al., 1999). Furthermore, the two
recent meta-analyses by Bhatia et al. (1998) and Lipsett and Campleman (1999)
found that even though a substantial heterogeneity existed in their initial pooled
estimates, stratification on several factors demonstrated a relationship between
exposure to DE and excess lung cancer that remained positive throughout various
analyses.
• Specificity. This criterion requires that a single cause lead to a single effect. With
respect to exposure to DE, excess for lung cancer is the only effect that is found
to be consistently elevated and statistically significant in several studies. Quite a
few studies have examined DE for other effects such as bladder cancer, leukemia,

7-81
gastrointestinal cancers, prostate cancer etc. The evidence for these effects is
inadequate.
• Temporality. The only necessary, but not sufficient, criterion described by Hill
for causality inference is that exposure to a causal agent precedes the effect in
time. This criterion is clearly satisfied in the studies reviewed here. Temporality
can be explored further in addressing the latency issue. A certain period is
necessary for development of an effect after exposure to a causal agent has
occurred. For instance, in cancer-causing agents a latent period can vary from 5
years (childhood leukemia) to $30 years (mesothelioma). Most of the studies
reviewed here did not conduct the latency analysis. Some studies had a short
follow-up period that did not allow enough time for the latency period (Waller,
1981; Howe et al., 1983; Rushton et al., 1983; Wong et al., 1985, Hansen, 1993)
while several studies clearly allowed for an adequate latency period (Garshick et
al., 1987; Gustavsson et al., 1990; Steenland et al., 1990; Swanson et al., 1993;
Brüske-Hohlfeld et al., 1999). Both type of studies showed mixed results.
• Biological gradient. This criterion refers to the dose-response curve. Due to the
lack of quantitative data on DE exposure in most studies reviewed here, analyzing
the dose-response curve directly was not possible. In very few studies, exposure
to DE was addressed specifically. Most investigators have used job
titles/categories and duration of employment as surrogates for exposure and thus
have presented response in relation to duration of employment. Significant dose-
response (using duration of employment as a surrogate) was observed in various
studies for railroad workers (Howe et al., 1983; Garshick et al., 1987; Garshick et
al., 1988; Swanson et al., 1993; Cal EPA, 1998), truck drivers (Boffetta and
Stellman, 1988; Hayes et al., 1989; Steenland et al., 1990; Swanson et al., 1993;
Hansen et al., 1998; Brüske-Hohlfeld et al., 1999), transportation/heavy
equipment operators (Wong et al., 1985; Gustavsson et al., 1990; Brüske-
Hohlfeld et al., 1999), farmers/farm tractor users (Swanson et al., 1993; Brüske-
Hohlfeld et al., 1999), and dockworkers (Emmelin et al., 1993).
• Biological plausibility. This criterion refers to the biologic plausibility of the
hypothesis, an important concern that may be difficult to judge. The hypothesis
considered for this review is that occupational exposure to DE is causally
associated with the occurrence of lung cancer and is supported by the following:
7-82
First, DE has been shown to cause lung and other cancers in animals (Heinrich et
al., 1986b; Iwai et al., 1986b; Mauderly et al., 1987; Pott et al., 1990; Mauderly,
1994). Second, it contains highly mutagenic substances such as polycyclic
aromatic hydrocarbons as well as nitroaromatic compounds (Claxton, 1983; Ball
et al., 1990; Gallagher et al., 1993; Sera et al., 1994; Nielsen et al., 1996a) that
are recognized human pulmonary carcinogens (IARC, 1989). Third, DE consists
of carbon core particles with surface layers of organics and gases; the tumorigenic
activity may reside in one, some, or all of these components. As explained in
Chapter 4, there is clear evidence that the mixture of organic constituents, both in
particles and vapor phases, have the capacity to interact with DNA and give rise
to mutations, chromosomal aberrations, and cell transformations, all well-
established steps in the process of carcinogenesis. Further, increased levels of
peripheral blood cell DNA adducts associated with occupational exposure to DE
have been observed in humans (Nielsen et al., 1996a,b). Thus, the above
evidence makes a convincing case that occupational exposures to DE are causally
associated with the occurrence of lung cancer is highly plausible biologically.
In conclusion, the epidemiologic studies of exposure to DE and occurrence of lung
cancer furnish evidence that is consistent with a causal association. This association observed in
several studies is unlikely to be due to chance or bias. Although many studies did not have
information on smoking, significant confounding by smoking is unlikely in these studies because
the comparison population was from the same socioeconomic class. The strength of association
(i.e., RRs/ORs between 1.2 and 2.6) was weak to modest by epidemiologic standards, with dose-
response relationships observed in several studies. Last, but not least, there is highly plausible
biological evidence that exposure to DE could result in excess risk of lung cancer in humans.
7.3. CARCINOGENICITY OF DIESEL EXHAUST IN LABORATORY ANIMALS
This chapter summarizes studies that assess the carcinogenic potential of DE in
laboratory animals. The first portion of this chapter summarizes results of inhalation studies.
Experimental protocols for the inhalation studies typically consisted of exposure (usually
chronic) to diluted exhaust in whole-body exposure chambers using rats, mice, and hamsters as
model species. Some of these studies used both filtered (free of particulate matter) DE and
unfiltered (whole) DE to differentiate gaseous-phase effects from effects induced by diesel PM
(DPM) and its adsorbed components. Other studies were designed to evaluate the relative
importance of the carbon core of the diesel particle versus that of particle-adsorbed compounds.

7-83
Finally, a number of exposures were carried out to determine the combined effect of inhaled DE
and tumor initiators, tumor promoters, or cocarcinogens.
Particulate matter concentrations in the DE used in these studies ranged from 0.1 to 12
mg DPM /m3. In this chapter, any mention of statistical significance implies that p#0.05 was
reported in the reviewed publications. A summary of the animal inhalation carcinogenicity
studies and their results is presented in Table 7-3.
Results of lung implantation and intratracheal instillation studies of whole diesel
particles, extracted diesel particles, and particle extracts are reported in Section 7.3.3 and in
Tables 7-4 and 7-5. Studies destined to assess the carcinogenic effects of DPM as well as
solvent extracts of DPM following subcutaneous (s.c.) injection, intraperitoneal (i.p.) injection,
or intratracheal (itr.) instillation in rodents are summarized in Section 7.3.5. Individual
chemicals present in the gaseous phase or adsorbed to the particle surface were not included in
this review because assessments of those of likely concern (i.e., formaldehyde, acetaldehyde,
benzene, polycyclic aromatic hydrocarbons [PAHs]) have been published elsewhere (U.S. EPA,
1993).
7.3.1. Inhalation Studies (Whole Diesel Exhaust)
7.3.1.1. Rat Studies
The potential carcinogenicity of inhaled DE was first evaluated by Karagianes et al.
(1981). Male Wistar rats (40 per group) were exposed to room air or diesel engine exhaust
diluted to a DPM concentration of 8.3 (± 2.0) mg/m3, 6 hr/day, 5 days/week for up to 20 months.
The animals were exposed in 3,000 L plexiglass chambers. Airflow was equal to 50 liters per
minute. Chamber temperatures were maintained between 25 oC and 26.5 oC. Relative humidity
ranged from 45% to 80%. Exposures were carried out during the daytime. The connected to an
electric generator and operated at varying loads and speeds to simulate operating conditions in
an occupational situation. To control the CO concentration at 50 ppm, the exhaust was diluted
35:1 with clean air. Six rats per group were sacrificed after 4, 8, 16, and 20 months exposure for
gross necropsy and histopathological examination.
The only tumor detected was a bronchiolar adenoma in the group exposed over 16
months to DE. No lung tumors were reported in controls. The equivocal response may have
been caused by the relatively short exposure durations (20 months) and small numbers of
animals examined. In more recent studies, for example, Mauderly et al. (1987), most of the
tumors were detected in rats exposed for more than 24 months.

7-84
Table 7-3. Summary of animal inhalation carcinogenicity studies
StudySpecies/strain
Sex/totalnumber
Exposureatmosphere
Particleconcentration
(mg/m3)Other
treatmentExposureprotocol
Post-exposure
observation Tumor type and incidence (%)a Comments
Adenomas
Karagianeset al. (1981)
Rat/Wistar M, 40M, 40
Clean airWholeexhaust
8.3 NoneNone
6 hr/day,5 days/week,for up to20 mo
NA 0/6 (0)1/6 (16.6)
Bronchoalveolar carcinoma0/30 (0)
1/30 (3.3)3/30 (10.0)1/30 (3.3)
Kaplan et al.(1983)White et al. (1983)
Rat/F344 M, 30M, 30M, 30M, 30
Clean airWholeexhaustWholeexhaustWholeexhaust
00.250.751.5
NoneNoneNoneNone
20 hr/day,7 days/week,for up to 15 mo
8 mo8 mo8 mo8 mo
Adenomas CarcinomasSquamouscell tumors All tumors
Heinrich etal. (1986a,b)Mohr et al.(1986)
Rat/Wistar
F, 96F, 92
F, 95
Clean airFiltered exhaustWholeexhaust
4 NoneNone
None
19 hr/day,5 days/weekfor up to35 mo
NA 0/96 (0)0/92 (0)
8/95 (8.4)
0/96 (0)0/92 (0)
0/95 (0)
0/96 (0)0/92 (0)
9/95 (9.4)
0/96 (0)0/92 (0)
17/95(17.8)c
Adenomas
Adenocarcinomaand
adenosquamouscarcinoma
Large celland
squamouscell
carcinomas All tumors
Iwai et al.(1986a,b)
Rat/F344 F, 24F, 24
F, 24
Clean airFiltered exhaustWholeexhaust
4.9 NoneNone
None
8 hr/day,7 days/week,for 24 mo
NA 1/22 (4.5)0/16 (0)
3/19 (0)
0/22 (0)0/16 (0)
3/19 (15.8)
0/22 (0)0/16 (0)
2/19 (10.5)
1/22 (4.5)f
0/16 (0)
8/19 (42.1)c,g
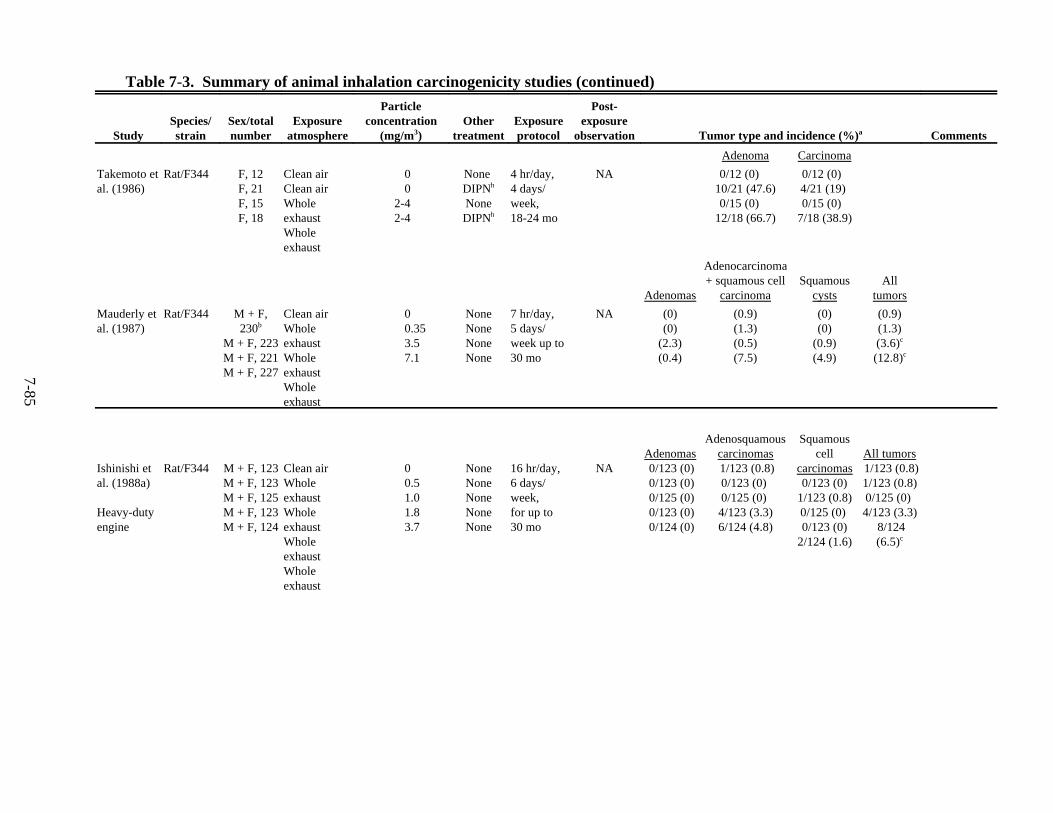
Table 7-3. Summary of animal inhalation carcinogenicity studies (continued)
StudySpecies/strain
Sex/totalnumber
Exposureatmosphere
Particleconcentration
(mg/m3)Other
treatmentExposureprotocol
Post-exposure
observation Tumor type and incidence (%)a Comments
Adenoma Carcinoma
Takemoto etal. (1986)
Rat/F344 F, 12F, 21F, 15F, 18
Clean airClean airWholeexhaustWholeexhaust
00
2-42-4
None DIPNh
NoneDIPNh
4 hr/day,4 days/week,18-24 mo
NA 0/12 (0) 10/21 (47.6)0/15 (0)
12/18 (66.7)
0/12 (0) 4/21 (19) 0/15 (0)
7/18 (38.9)
Adenomas
Adenocarcinoma+ squamous cell
carcinomaSquamous
cystsAll
tumors
Mauderly etal. (1987)
Rat/F344 M + F,230b
M + F, 223M + F, 221M + F, 227
Clean airWholeexhaustWholeexhaustWholeexhaust
00.353.57.1
NoneNoneNoneNone
7 hr/day,5 days/week up to30 mo
NA (0)(0)
(2.3)(0.4)
(0.9)(1.3)(0.5)(7.5)
(0)(0)
(0.9)(4.9)
(0.9)(1.3)(3.6)c
(12.8)c
Ishinishi etal. (1988a)
Heavy-dutyengine
Rat/F344 M + F, 123M + F, 123M + F, 125M + F, 123M + F, 124
Clean airWholeexhaustWholeexhaustWholeexhaustWholeexhaust
00.51.01.83.7
NoneNoneNoneNoneNone
16 hr/day,6 days/week,for up to30 mo
NAAdenomas 0/123 (0) 0/123 (0) 0/125 (0) 0/123 (0) 0/124 (0)
Adenosquamouscarcinomas 1/123 (0.8)0/123 (0) 0/125 (0) 4/123 (3.3)6/124 (4.8)
Squamouscell
carcinomas 0/123 (0) 1/123 (0.8)0/125 (0) 0/123 (0)
2/124 (1.6)
All tumors 1/123 (0.8)1/123 (0.8)0/125 (0) 4/123 (3.3)
8/124(6.5)c
7-85

Table 7-3. Summary of animal inhalation carcinogenicity studies (continued)
StudySpecies/strain
Sex/totalnumber
Exposureatmosphere
Particleconcentration
(mg/m3)Other
treatmentExposureprotocol
Post-exposure
observation Tumor type and incidence (%)a Comments
Adenomas Carcinomas All tumors
Ishinishi etal.(1988a)
Light duty
Rat/F344 NS, 5NS, 8
NS, 11NS, 5NS, 9
NS, 11
WholeexhaustWholeexhaustWholeexhaustWholeexhaustWholeexhaustWholeexhaust
0.10.10.11.11.11.1
NoneNoneNoneNoneNoneNone
16 hr/day,6 days/week,for 12 mo
6 mo12 mo18 mo 6 mo12 mo18 mo
0/5 (0)0/8 (0)0/11 (0)0/5 (0)0/9 (0)0/11 (0)
0/5 (0)0/8 (0)0/11 (0)0/5 (0)0/9 (0)0/11 (0)
0/5 (0)0/8 (0)0/11 (0)0/5 (0)0/9 (0)0/11 (0)
Heavy duty NS, 5NS, 9NS 11NS, 5NS, 6
NS, 13
WholeexhaustWholeexhaustWholeexhaustWholeexhaustWholeexhaustWholeexhaust
0.50.50.51.81.81.8
NoneNoneNoneNoneNoneNone
16 hr/day,6 days/week,for 12 mo
6 mo12 mo18 mo 6 mo12 mo18 mo
0/5 (0)0/9 (0)0/11 (0)0/5 (0)0/6 (0)0/13 (0)
0/5 (0)0/9 (0)0/11 (0)0/5 (0)0/6 (0)1/13 (0)
0/5 (0)0/9 (0)0/11 (0)0/11 (0)0/6 (0)1/13 (0)
7-86

Table 7-3. Summary of animal inhalation carcinogenicity studies (continued)
StudySpecies/strain
Sex/totalnumber
Exposureatmosphere
Particleconcentration
(mg/m3)Other
treatmentExposureprotocol
Post-exposure
observation Tumor type and incidence (%)a Comments
Primary lung tumors
Brightwellet al. (1989)
Rat/344 M + F, 260M + F, 144
M + F, 143
M + F, 143M + F, 144M + F, 143
Clean airFiltered exhaust (medium exposure)Filtered exhaust(high exposure)WholeexhaustWholeexhaustWholeexhaust
00
0
0.72.26.6
NoneNone
None
NoneNoneNone
16 hr/day,5 days/week,for 24 mo
NA 3/260 (1.2)0/144 (0)
0/143 (0)
1/143 (0.7)14/144 (9.7)c
55/143 (38.5)c
Tumorincidence forall rats dyingor sacrificed
& 24/25(96%) after 24mo % 12/27(44%)after 24 mo
Henrich etal. (1989a)
Rat/Wistar F, NSF, NSF, NS
F, NSF, NSF, NS
Clean airWholeexhaustFiltered exhaustClean airWholeexhaustFiltered exhaust
04.20
04.20
DPNd
DPNd
DPNd
DPNe
DPNe
DPNe
19 hr/day,5 days/weekfor 24 to30 mo
NA
Squamouscell
carcinoma(4.4) (46.8)c
(4.4)
(16.7) (31.3)c
(14.6)
All lungtumors(84.8)(83.0)(67.4)
(93.8)(89.6)(89.6)
Lewis et al.(1989)
Rat/F344 M + F,288n
Clean airWholeexhaust
2 NoneNone
7 hr/day,5 days/week,24 mo
NA No tumors 0/192 (0)0/192 (0)
7-87

Table 7-3. Summary of animal inhalation carcinogenicity studies (continued)
StudySpecies/strain
Sex/totalnumber
Exposureatmosphere
Particleconcentration
(mg/m3)Other
treatmentExposureprotocol
Post-exposure
observation Tumor type and incidence (%)a Comments
Adeno-squamous
carcinomasSquamous cell
carcinomas All tumors
Takaki et al.(1989)Light-dutyengine
Rat/F344 M + F, 123M + F, 123M + F, 125M + F, 123M + F, 124
Clean airWholeexhaustWholeexhaustWholeexhaustWholeexhaust
00.10.41.12.3
NoneNoneNoneNoneNone
16 hr/day,6 days/week, forup to30 mo
NA 1/23 (0.8) 1/23 (0.8) 1/25 (0.8)0/23 (0) 1/24 (8.1)
2/123 (1.6)1/23 (0.8)0/125 (0) 5/123 (4.1)2/124 (1.6)
1/23 (0.8)1/23 (0.8)0/125 (0) 0/123 (0) 0/124 (0)
4/123 (3.3)3/123 (2.4)1/125 (0.8)5/123 (4.1)3/124 (2.4)
AdenomasAdenocarcinoma
s
Squamouscell
carcinomas
Benignsquamous
celltumors
Heinrich etal.(1995)
Rat/Wistar F, 220F, 200F, 200F, 100F, 100F, 100
Clean airWholeexhaustWholeexhaustWholeexhaustCarbon blackTiO2
00.82.57.0
11.610.0
NoneNoneNoneNoneNoneNone
18 hr/day,5 days/week,for up to 24 mo
6 mo 0/217 (0)0/198 (0)2/200 (1)4/100 (4)13/100(13)4/100 (4)
1/217 (<1)0/198 (0)
1/200 (<1)4/100 (4)
13/100 (13)13/100 (13)
0/217 (0)0/198 (0)0/200 (0)2/100 (2)4/100 (4)3/100 (3)
0/217 (0)0/198 (0)
7/200 (3.5)14/100 (14)20/100 (20)20/100 (20)
Tumorincidencesafter 30 mo
AdenomasAdenocarcinoma
s
Squamouscell
carcinoma
Adeno-squamouscarcinoma
Otherneoplasms
Nikula et al.(1995)
Rat/F344 M + F,214b
M + F, 210M + F, 212M + F, 213M + F, 211
Clean airWholeexhaustWholeexhaustCarbon blackCarbon black
02.56.52.56.5
NoneNoneNoneNoneNone
16 hr/day, 5 days/week forup to24 mo
6 weeks 1/214 (<1)7/210 (3)23/212
(11)3/213 (1)13/211 (6)
1/214 (<1)4/210 (2)
22/212 (10)7/213 (3)
21/211 (10)
1/214 (<1)3/210 (1)3/212 (1)0/213 (0)3/211 (1)
0/214 (0)0/210 (0)
1/212 (<1)0/213 (0)
2/211 (<1)
0/214 (0)0/210 (0)0/212 (0)1/213 (<1)0/211 (0)
7-88
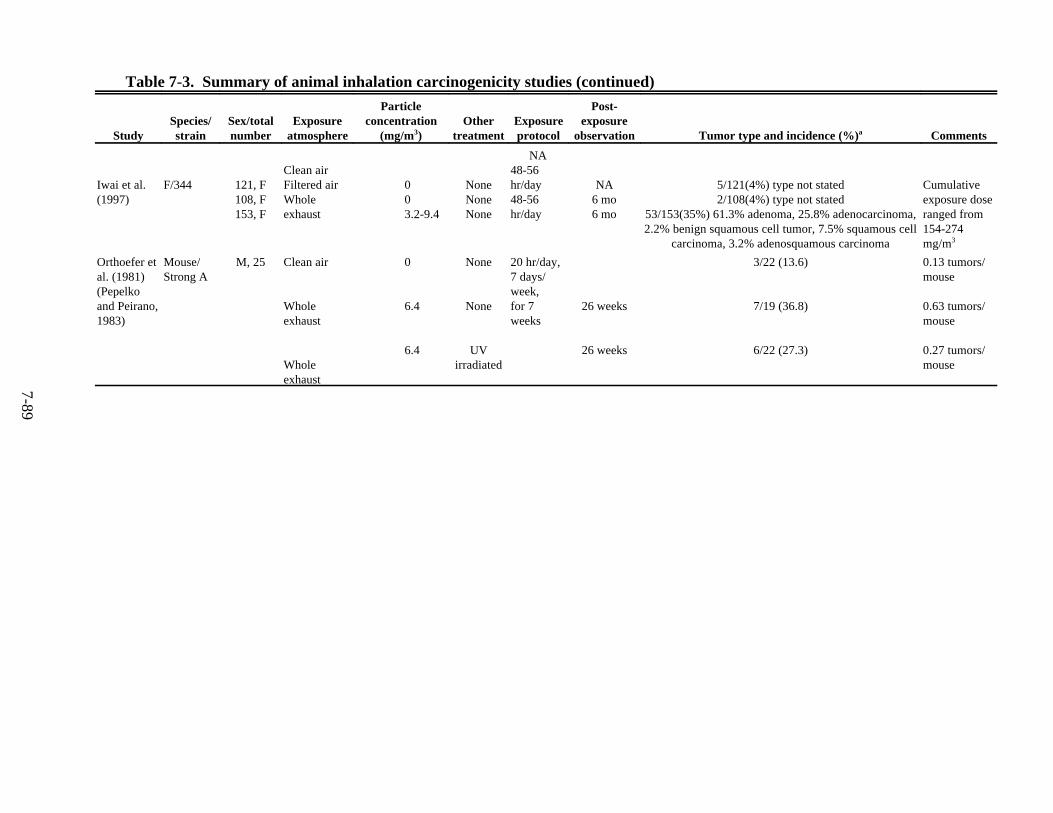
Table 7-3. Summary of animal inhalation carcinogenicity studies (continued)
StudySpecies/strain
Sex/totalnumber
Exposureatmosphere
Particleconcentration
(mg/m3)Other
treatmentExposureprotocol
Post-exposure
observation Tumor type and incidence (%)a Comments
Iwai et al.(1997)
F/344 121, F108, F153, F
Clean airFiltered airWholeexhaust
003.2-9.4
NoneNoneNone
NA48-56hr/day48-56hr/day
NA6 mo6 mo
5/121(4%) type not stated2/108(4%) type not stated
53/153(35%) 61.3% adenoma, 25.8% adenocarcinoma,2.2% benign squamous cell tumor, 7.5% squamous cell
carcinoma, 3.2% adenosquamous carcinoma
Cumulativeexposure doseranged from154-274mg/m3
Orthoefer etal. (1981)(Pepelkoand Peirano,1983)
Mouse/Strong A
M, 25 Clean air
Wholeexhaust
Wholeexhaust
0
6.4
6.4
None
None
UVirradiated
20 hr/day,7 days/week,for 7weeks
26 weeks
26 weeks
3/22 (13.6)
7/19 (36.8)
6/22 (27.3)
0.13 tumors/mouse
0.63 tumors/mouse
0.27 tumors/mouse
7-89

Table 7-3. Summary of animal inhalation carcinogenicity studies (continued)
StudySpecies/strain
Sex/totalnumber
Exposureatmosphere
Particleconcentration
(mg/m3)Other
treatmentExposureprotocol
Post-exposure
observation Tumor type and incidence (%)a Comments
Lung tumors
Mouse/Jackson A
Mouse/Jackson A
M + F, 40
M + F, 40
F, 60
F, 60
F, 60
F, 60
M, 429
M, 430
Clean air
Wholeexhaust
Clean air
Clean air
Wholeexhaust
Wholeexhaust
Clean air
Wholeexhaust
0
6.4
0
0
6.4
6.4
0
6.4
None
None
None
Urethanl
None
Urethank
None
None
20 hr/day,7 days/week,for 8weeks
20 hr/day,7 days/week,for approx. 7 mo.
8 weeks
8 weeks
16/36 (44.4)
11/34 (32.3)
4/58 (6.9)
9/52 (17.3)
14/56 (25.0)
22/59 (37.3)
73/403 (18.0)
66/368 (17.9)
0.5 tumors/mouse
0.4 tumors/mouse
0.09 tumors/mouse
0.25 tumors/mouse
0.32 tumors/mouse
0.39 tumors/mouse
0.23 tumors/mouse
0.20 tumors/mouse
Kaplan et al.(1982)
Mouse A/J
M, 458M, 18M, 485
Clean airClean airWholeexhaust
1.5 NoneUrethank
None
20 hr/day,7 days/week,for 3 mo
6 mo Pulmonary adenomas 144/458 (31.4)
18/18 (100)165/485 (34.2)
Pulmonary adenoma
Kaplan et al.(1983)White et al.(1983)
Mouse/A/J
M, 388M, 388M, 399M, 396
Clean airWholeexhaustWholeexhaustWholeexhaust
00.250.751.5
NoneNoneNoneNone
20 hr/day,7 days/week,for up to8 mo
NA 130/388 (33.5)131/388 (33.8)109/399 (27.3)99/396 (25.0)
7-90

Table 7-3. Summary of animal inhalation carcinogenicity studies (continued)
StudySpecies/strain
Sex/totalnumber
Exposureatmosphere
Particleconcentration
(mg/m3)Other
treatmentExposureprotocol
Post-exposure
observation Tumor type and incidence (%)a Comments
Pepelko andPeirano(1983)
Mouse/Sencar
M + F, 260 Clean airClean airClean airWholeexhaustWholeexhaustWholeexhaust
121212 NoneBHTl
Urethank
NoneBHTl
Urethanl
Continuous for 15mo
NA Adenomas(5.1)(12.2)(8.1)
(10.2)c
(5.4)(8.7)
Carcinomas(0.5)(1.7)(0.9)(1.0)(2.7)(2.6)
All tumors(5.6)(2.8)(9.0)
(11.2)c
(8.1)(11.2)
7-91

Table 7-3. Summary of animal inhalation carcinogenicity studies (continued)
StudySpecies/strain
Sex/totalnumber
Exposureatmosphere
Particleconcentration
(mg/m3)Other
treatmentExposureprotocol
Post-exposure
observation Tumor type and incidence (%)a Comments
7-92
All tumors
Pepelko andPeirano(1983)
Mouse/Strain A
M + F, 90 Clean air
Clean air
WholeexhaustWholeexhaust
Clean airWholeexhaust
1212012 None
Exposure(darkness)
Exposure(darkness)
Urethanm
Urethanm
NA 21/87 (24)
59/237 (24.9)
10/80 (12.5)22/250 (0.10)
66/75 (88)42/75 (0.95)
0.29 tumors/mouse
0.27 tumors/mouse
0.140.10
2.800.95
Adenomas Adenocarcinoma
Squamouscell
tumors All tumors
Heinrich etal. (1986a,b)
Mouse/NMRI
M + F, 84M + F, 93
M + F, 76
Clean air Filtered exhaustWholeexhaust
4 NoneNone
None
19 hr/day,5 days/weekfor up to30 mo
NA 9/84 (11)11/93 (12)
11/76 (15)
2/84 (2)18/93 (19)c
13/76 (17)c
——
—
11/84 (13)29/93 (31)c
24/76 (32)c
Takemoto etal.(1986)
Mouse/IRC
M + F, 45M + F, 69
Clean airWholeexhaust
02-4
NoneNone
4 hr/day,4 days/week, for19-28 mo
NA
Adenoma Adenocarcinoma
Mouse/C57BL
M + F, 12M + F, 38
Clean airWholeexhaust
02-4
NoneNone
4 hr/day,4 days/week for19-28 mo
NA 3/45 (6.7)6/69 (8.7)
1/45 (2.2)3/69 (4.3)
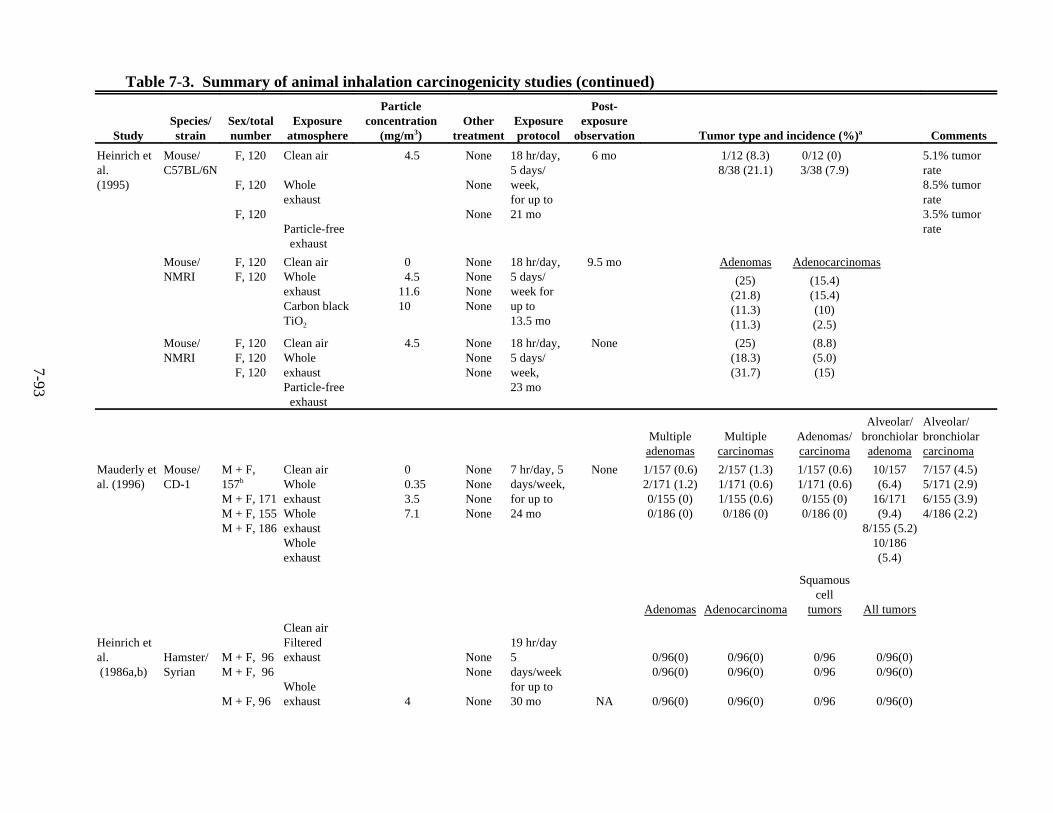
Table 7-3. Summary of animal inhalation carcinogenicity studies (continued)
StudySpecies/strain
Sex/totalnumber
Exposureatmosphere
Particleconcentration
(mg/m3)Other
treatmentExposureprotocol
Post-exposure
observation Tumor type and incidence (%)a Comments
7-93
Heinrich etal.(1995)
Mouse/C57BL/6N
F, 120
F, 120
F, 120
Clean air
Wholeexhaust
Particle-free exhaust
4.5 None
None
None
18 hr/day,5 days/week,for up to21 mo
6 mo 1/12 (8.3)8/38 (21.1)
0/12 (0) 3/38 (7.9)
5.1% tumorrate8.5% tumorrate3.5% tumorrate
Mouse/NMRI
F, 120F, 120
Clean airWholeexhaustCarbon blackTiO2
04.5
11.610
NoneNoneNoneNone
18 hr/day,5 days/week forup to13.5 mo
9.5 mo Adenomas Adenocarcinomas
(25)(21.8)(11.3)(11.3)
(15.4)(15.4)(10)(2.5)
Mouse/NMRI
F, 120F, 120F, 120
Clean airWholeexhaustParticle-free exhaust
4.5 NoneNoneNone
18 hr/day,5 days/week,23 mo
None (25)(18.3)(31.7)
(8.8)(5.0)(15)
Multipleadenomas
Multiplecarcinomas
Adenomas/carcinoma
Alveolar/bronchiolaradenoma
Alveolar/bronchiolarcarcinoma
Mauderly etal. (1996)
Mouse/CD-1
M + F,157b
M + F, 171M + F, 155M + F, 186
Clean airWholeexhaustWholeexhaustWholeexhaust
00.353.57.1
NoneNoneNoneNone
7 hr/day, 5days/week,for up to24 mo
None 1/157 (0.6)2/171 (1.2)0/155 (0)0/186 (0)
2/157 (1.3)1/171 (0.6)1/155 (0.6)0/186 (0)
1/157 (0.6)1/171 (0.6)0/155 (0)0/186 (0)
10/157(6.4)
16/171(9.4)
8/155 (5.2)10/186(5.4)
7/157 (4.5)5/171 (2.9)6/155 (3.9)4/186 (2.2)
Adenomas Adenocarcinoma
Squamouscell
tumors All tumors
Heinrich etal. (1986a,b)
Hamster/Syrian
M + F, 96M + F, 96
M + F, 96
Clean airFilteredexhaust
Wholeexhaust 4
NoneNone
None
19 hr/day5days/weekfor up to30 mo NA
0/96(0)0/96(0)
0/96(0)
0/96(0)0/96(0)
0/96(0)
0/960/96
0/96
0/96(0) 0/96(0)
0/96(0)

Table 7-3. Summary of animal inhalation carcinogenicity studies (continued)
StudySpecies/strain
Sex/totalnumber
Exposureatmosphere
Particleconcentration
(mg/m3)Other
treatmentExposureprotocol
Post-exposure
observation Tumor type and incidence (%)a Comments
Primary lungtumors
Brightwellet al.(1989)
Hamster/Syrian Golden
M + F,M + F, 202M + F, 104
M + F, 104
M + F, 101M + F, 102M + F, 101M + F, 204
M + F, 203
Clean airClean airFiltered exhaust (medium dose)Filtered exhaust (high dose)WholeexhaustWholeexhaustWholeexhaustFiltered exhaust (high dose)Wholeexhaust
000
0
0.72.26.60
6.6
NoneDENj
DENj
DENj
DENj
DENj
DENj
None
None
16 hr/day,5 days/week, for24 mo
NA 7/202 (3.5)4/104 (3.8)9/104 (8.7)
2/101 (2.0)
6/102 (5.9)4/101 (3.9)1/204 (0.5)0/203 (0)
Respiratorytract tumorsnot related toexhaustexposure forany of thegroups
aTable values indicate number with tumors/number examined (% animals with tumors).bNumber of animals examined for tumors.cSignificantly different from clean air controls.dDipentylnitrosamine; 6.25 mg/kg/week s.c. during first 25 weeks of exposure.eDipentylnitrasamine; 12.5 mg/kg/week s.c. during first 25 weeks of exposure.fSplenic lymphomas also detected in controls (8.3%), filtered exhaust group (37.5%) and wholeexhaust group (25%).g5.3% incidence of large cell carcinomas.h1 g/kg, i.p. 1/week for 3 weeks starting 1 mo into exposure.iIncludes adenomas, squamous cell carcinomas, adenocarcinomas, adenosquamous cell carcinoma,and mesotheliomas.j4.5 mg/diethylnitrosamine (DEN)/kg, s.c., 3 days prior to start of inhalation exposure.kSingle i.p. dose 1 mg/kg at start of exposure.lButylated hydroxytoluene 300 mg/kg, i.p. for week 1, 83 mg/kg for week 2, and 150 mg/kg forweeks 3 to 52.m12 mg/m3from 12 weeks of age to termination of exposure. Prior exposure (in utero) and of parentswas 6 mg/m3.n120-121 males and 71-72 females examined histologically.oNot all animals were exposed for full term, at least 10 males were killed at 3, 6, and 12 mo ofexposure.NS = Not specified.
NA = Not applicable.
7-94

7-95
Table 7-4. Tumor incidences in rats following intratracheal instillation of DE particles(DPM), extracted DPM, carbon black (CB), benzo[a]pyrene (B[a]P), or particles plusB[a]P
Experimental groupNumber of
animalsTotal dose
Animals withtumors (percent) Statistical
significancea
Control 47 4.5 mL 0 (0) -
DPM (original) 48 15 mg 8 (17) < 0.01
DPM (extracted) 48 30 mg 10 (21) < 0.001
DPM (extracted) 48 15 mg 2 (4) NS
CB (printex) 48 15 mg 10 (21) < 0.001
CB (lampblack) 48 14 mg 4 (8) NS
B[a]P 47 30 mg 43 (90) < 0.001
B[a]P 48 15 mg 12 (25) < 0.001
DEP + B[a]P 48 15 mg + 170 :gB[a]P
4 (8) NS
CB (printex) + B[a]P 48 15 mg + 443 :gB[a]P
13 (27) < 0.001
Table 7-5. Tumorigenic effects of dermal application of acetone extracts of DPM
Numberofanimals Strain/sex
Samplematerial
Time to firsttumor (mo)
Survivors attime of first
tumorTotal
tumors
Duration of experiment
(mo)
52 C57BL/40 FC57BL/12 M
Extract of DPMobtained duringwarmup
13 33 2 22
50 Strain A/M Extract of DPMobtained duringfull load
15 8 4 23
25 Strain A/F Extract of DPMobtained duringfull load
13 20 17 17
Source: Kotin et al., 1955.
7-96
General Motors Research Laboratories sponsored chronic inhalation studies at the
Southwest Research Institute using male Fischer 344 rats, 30 per group, exposed to DPM
concentrations of 0.25, 0.75, or 1.5 mg/m3 (Kaplan et al., 1983; White et al., 1983). The animals
were exposed in 12.6 m3 exposure chambers. Airflow was adjusted to provide 13 changes per
hour. Temperature was maintained at 22 ± 2 °C. The exposure protocol was 20 hr/day, 7
days/week for 9 to 15 months. Exposures were halted during normal working hours for
servicing. Some animals were sacrificed following completion of exposure, while others were
returned to clean air atmospheres for an additional 8 months. Control animals received clean air.
Exhaust was generated by 5.7-L Oldsmobile engines (four different engines used throughout the
experiment) operated at a steady speed and load simulating a 40-mph driving speed of a full-size
passenger car.
Although five instances of bronchoalveolar carcinoma were observed in 90 rats exposed
to DE for 15 months and held an additional 8 months in clean air, compared with none among
controls, statistical significance was not achieved in any of the exposure groups. These included
one tumor in the 0.25 mg/m3 group, three in the 0.75 mg/m3 group, and one in the 1.5 mg/m3
group. Rats kept in clean-air chambers for 23 months did not exhibit any carcinomas. No
tumors were observed in any of the 180 rats exposed to DE for 9 or 15 months without a
recovery period, or in the respective controls for these groups. Equivocal results may again have
been due to less-than-lifetime duration of the study as well as insufficient exposure
concentrations. Although the increases in tumor incidences in the groups exposed for 15 months
and held an additional 8 months in clean air were not statistically significant, relative to controls,
they were slightly greater than the historic background incidence of 3.7% for this specific lesion
in this strain of rat (Ward, 1983). The first definitive studies linking inhaled DE to induction of
lung cancer in rats were reported by researchers in Germany, Switzerland, Japan, and the United
States in the mid-to-late 1980s. In a study conducted at the Fraunhofer Institute exhaust-
generating system and exposure atmosphere characteristics are presented in Appendix A. The
type of engine used (3-cylinder, 43 bhp diesel) is normally used in mining situations and was of
Toxicology and Aerosol Research, female Wistar rats were exposed for 19 hr/day, 5 days/week
to both filtered and unfiltered (total) DE at an average particulate matter concentration of 4.24
mg/m3. Animals were exposed for a maximum of 2.5 years. The exposure system as described
by Heinrich et al. (1986a) used a 40 kilowatt 1.6-L diesel engine operated continuously under
the U.S. 72 FTP driving cycle. The engines used European Reference Fuel with a sulfur
content of 0.36%. Filtered exhaust was obtained by passing engine exhaust through a Luwa FP-
65 HT 610 particle filter heated to 80 °C and a secondary series of filters (Luwa FP-85, Luwa
NS-30, and Drager CH 63302) at room temperature. The filtered and unfiltered exhausts were
diluted 1:17 with filtered air and passed through respective 12 m3 exposure chambers. Mass
7-97
median aerodynamic diameter of DPM was 0.35 ± 0.10 :m (mean ± SD). The gas-phase
components of the DE atmospheres are presented in Appendix A.
The effects of exposure to either filtered or unfiltered exhaust were described by
Heinrich et al. (1986b) and Stöber (1986). Exposure to unfiltered exhaust resulted in 8
bronchoalveolar adenomas and 9 squamous cell tumors in 15 of 95 female Wistar rats examined,
for a 15.8% tumor incidence. Although statistical analysis was not provided, the increase
appears to be highly significant. In addition to the bronchioalveolar adenomas and squamous
cell tumors, there was a high incidence of bronchioalveolar hyperplasia (99%) and metaplasia of
the bronchioalveolar epithelium (65%). No tumors were reported among rats exposed to filtered
exhaust (n = 92) or clean air (n = 96).
Mohr et al. (1986) provided a more detailed description of the lung lesions and tumors
identified by Heinrich et al. (1986a,b) and Stöber (1986). Substantial alveolar deposition of
carbonaceous particles was noted for rats exposed to unfiltered DE. Squamous metaplasia was
observed in 65.3% of the rats breathing unfiltered DE, but not in the control rats. Of nine
squamous cell tumors, one was characterized as a Grade I carcinoma (borderline atypia, few to
moderate mitoses, and slight evidence of stromal invasion), and the remaining eight were
classified as benign keratinizing cystic tumors.
Iwai et al. (1986b) examined the long-term effects of DE inhalation on female F344 rats.
The exhaust was generated by a 2.4-L displacement truck engine. The exhaust was diluted 10:1
with clean air at 20 °C to 25 °C and 50% relative humidity. The engines were operated at 1,000
rpm with an 80% engine load. These operating conditions were found to produce exhaust with
the highest particle concentration and lowest NO2 and SO2 content. For those chambers using
filtered exhaust, proximally installed high-efficiency particulate air (HEPA) filters were used.
Three groups of 24 rats each were exposed to unfiltered DE, filtered DE, or filtered room air for
8 hr/day, 7 days/week for 24 months. Particle concentration was 4.9 mg/m3 for unfiltered
exhaust. Concentrations of gas-phase exhaust components were 30.9 ppm NOx, 1.8 ppm NO2,
13.1 ppm SO2, and 7.0 ppm CO.
No lung tumors were found in the 2-year control (filtered room air) rats, although one
adenoma was noted in a 30-months control rat, providing a spontaneous tumor incidence of
4.5%. No lung tumors were observed in rats exposed to filtered DE. Nineteen of the 24
exposed to unfiltered exhaust survived for 2 years. Of these, 14 were randomly selected for
sacrifice at this time. Four of the rats developed lung tumors; two of these were malignant. Five
rats of this 2-year exposure group were subsequently placed in clean room air for 3 to 6 months
and four eventually (time not specified) exhibited lung tumors (three malignancies). Thus, the
lung tumor incidence for total tumors was 42.1% (8/19) and 26.3% (5/19) for malignant tumors
in rats exposed to whole DE. The tumor types identified were adenoma (3/19), adenocarcinoma

7-98
(1/19), adenosquamous carcinoma (2/19), squamous carcinoma (1/19), and large-cell carcinoma
(1/19). The lung tumor incidence in rats exposed to whole DE was significantly greater than
that of controls (p#0.01). Tumor data are summarized in Table 7-3. Malignant splenic
lymphomas were detected in 37.5% of the rats in the filtered exhaust group and in 25.0% of the
rats in the unfiltered exhaust group; these values were significantly (p#0.05) greater than the
8.2% incidence noted in the control rats. The study demonstrates production of lung cancer in
rats following 2-year exposure to unfiltered DE. In addition, splenic malignant lymphomas
occurred during exposure to both filtered and unfiltered DE. This is the only report to date of
tumor induction at an extrarespiratory site by inhaled DE in animals.
A chronic (up to 24 months) inhalation exposure study was conducted by Takemoto et al.
(1986), in which female Fischer 344 rats were exposed to DE generated by a 269-cc YANMAR-
40CE NSA engine operated at an idle state (1,600 rpm). Exposures were 4 hours/day, 4
days/week. The animals were exposed in a 376-L exposure chamber. Air flow was maintained
at 120 L/min. Exhaust was diluted to produce a particle concentration of 2-4 mg/m3. When not
exposed the animals were maintained in an air-conditioned room at a temperature of 24 ± 2°C
and a relative humidity of 55 ± 5% with 12 hr of light and darkness. Temperature and humidity
in the exposure chambers was not noted. The particle concentration of the DE in the exposure
chamber was 2 to 4 mg/m3. B[a]P and 1-nitropyrene concentrations were 0.85 and 93 :g/g of
particles, respectively. No lung tumors were reported in the diesel-exposed animals. It was also
noted that the diesel engine employed in this study was originally used as an electrical generator
and that its operating characteristics (not specified) were different from those of a diesel-
powered automobile. However, the investigators deemed it suitable for assessing the effects of
diesel emissions.
Mauderly et al. (1987) provided data affirming the carcinogenicity of automotive diesel
engine exhaust in F344/Crl rats following chronic inhalation exposure. Male and female rats
were exposed to diesel engine exhaust at nominal DPM concentrations of 0.35 (n = 366), 3.5
(n = 367), or 7.1 (n = 364) mg/m3 for 7 hr/day, 5 days/week for up to 30 mo. Sham-exposed
(n = 365) controls breathed filtered room air. A total of 230, 223, 221, and 227 of these rats
(sham-exposed, low-, medium-, and high-exposure groups, respectively) were examined for lung
tumors. These numbers include those animals that died or were euthanized during exposure and
those that were terminated following 30 months of exposure. The exhaust was generated by
1980 model 5.7-L Oldsmobile V-8 engines operated through continuously repeating U.S.
Federal Test Procedure (FTP) urban certification cycles. The engines were equipped with
automatic transmissions connected to eddy-current dynamometers and flywheels simulating
resistive and inertial loads of a midsize passenger car. The D-2 diesel control fuel (Phillips
Chemical Co.) met U.S. EPA certification standards and contained approximately 30% aromatic

7-99
hydrocarbons and 0.3% sulfur. Following passage through a standard automotive muffler and
tailpipe, the exhaust was diluted 10:1 with filtered air in a dilution tunnel and serially diluted to
the final concentrations. The primary dilution process was such that particle coagulation was
retarded. Mokler et al. (1984) provided a detailed description of the exposure system. No
exposure-related changes in body weight or lifespan were noted for any of the exposed animals,
nor were there any signs of overt toxicity. Collective lung tumor incidence was greater (z
statistic, p#0.05) in the high (7.1 mg/m3) and medium (3.5 mg/m3) exposure groups (12.8% and
3.6%, respectively) versus the control and low (0.35 mg/m3) exposure groups (0.9% and 1.3%,
respectively). In the high-dose group the incidences of tumor types reported were adenoma
(0.4%), adenocarcinomas plus squamous cell carcinomas (7.5%), and squamous cysts (4.9%).
In the medium-dose group adenomas were reported in 2.3% of animals, adenocarcinomas plus
squamous cell carcinomas in 0.5%, and squamous cysts in 0.9%. In the low-exposure group
adenocarcinomas plus squamous cell carcinomas were detected in 1.3% of the rats. Using the
same statistical analysis of specific tumor types, adenocarcinoma plus squamous cell carcinoma
and squamous cyst incidence was significantly greater in the high-exposure group, and the
incidence of adenomas was significantly greater in the medium-exposure group. A significant
(p<0.001) exposure-response relationship was obtained for tumor incidence relative to exposure
concentration and lung burden of DPM. These data are summarized in Table 7-3. A logistic
regression model estimating tumor prevalence as a function of time, dose (lung burden of DPM),
and sex indicated a sharp increase in tumor prevalence for the high dose level at about 800 days
after the commencement of exposure. A less pronounced, but definite, increase in prevalence
with time was predicted for the medium-dose level. Significant effects were not detected at the
low concentration. DPM (mg per lung) of rats exposed to 0.35, 3.5, or 7.1 mg of DPM/m3 for
24 months were 0.6, 11.5, and 20.8, respectively, and affirmed the greater-than-predicted
accumulation that was the result of decreased particle clearance following high-exposure
conditions.
In summary, this study demonstrated the pulmonary carcinogenicity of high
concentrations of whole, diluted DE in rats following chronic inhalation exposure. In addition,
increasing lung particle burden resulting from this high-level exposure and decreased clearance
was demonstrated. A logistic regression model presented by Mauderly et al. (1987) indicated
that both lung DPM burden and exposure concentration may be useful for expressing exposure-
effect relationships.
A long-term inhalation study (Ishinishi et al., 1988a; Takaki et al., 1989) examined the
effects of emissions from a light-duty (LD) and a heavy-duty (HD) diesel engine on male and
female Fischer 344/Jcl rats. The LD engines were 1.8-L, 4-cylinder, swirl-chamber-type power
plants, and the HD engines were 11-L, 6-cylinder, direct-injection-type power plants. The

7-100
engines were connected to eddy-current dynamometers and operated at 1,200 rpm (LD engines)
and 1,700 rpm (HD engines). Nippon Oil Co. JIS No. 1 or No. 2 diesel fuel was used. The 30-
months whole-body exposure protocol (16 h/day, 6 days/week) used DPM concentrations of 0,
0.5, 1, 1.8, or 3.7 mg/m3 from HD engines and 0, 0.1, 0.4, 1.1, or 2.3 mg/m3 from LD engines.
The animals inhaled the exhaust emissions from 1700 to 0900 h. Sixty-four male rats and 59 to
61 female rats from each exposure group were evaluated for carcinogenicity.
For the experiments using the LD series engines, the highest incidence of hyperplastic
lesions plus tumors (72.6%) was seen in the highest exposure (2.3 mg/m3) group. However, this
high value was the result of the 70% incidence of hyperplastic lesions; the incidence of
adenomas was only 0.8% and that of carcinomas 1.6%. Hyperplastic lesion incidence was
considerably lower for the lower exposure groups (9.7%, 4.8%, 3.3%, and 3.3% for the 1.1, 0.4,
and 0.1 mg/m3 and control groups, respectively). The incidence of adenomas and carcinomas,
combining males and females, was not significantly different among exposure groups (2.4%,
4.0%, 0.8%, 2.4%, and 3.3% for the 2.3, 1.1, 0.4, and 0.1 mg/m3 groups and the controls,
respectively).
For the experiments using the HD series engines, the total incidence of hyperplastic
lesions, adenomas, and carcinomas was highest (26.6%) in the 3.7 mg/m3 exposure group. The
incidence of adenomas plus carcinomas for males and females combined equaled 6.5%, 3.3%,
0%, 0.8%, and 0.8% at 3.7, 1.8, 1, and 0.4 mg/m3 and for controls, respectively. A statistically
significant difference was reported between the 3.7 mg/m3 and the control groups for the HD
series engines. The carcinomas were identified as adenomas, adenosquamous carcinomas, and
squamous cell carcinomas. Although the number of each was not reported, it was noted that the
majority were squamous cell carcinomas. A progressive dose-response relationship was not
demonstrated. Tumor incidence data for this experiment are presented in Table 7-3.
The Ishinishi et al. (1988a) study also included recovery tests in which rats exposed to
whole DE (DPM concentration of 0.1 or 1.1 mg/m3 for the LD engine and 0.5 or 1.8 mg/m3 for
the HD engine) for 12 months were examined for lung tumors following 6-, 12-, or 18-month
recovery periods in clean air. The incidences of neoplastic lesions were low, and pulmonary
DPM burden was lower than for animals continuously exposed to whole DE and not provided a
recovery period. The only carcinoma observed was in a rat examined 12 months following
exposure to exhaust (1.8 mg/m3) from the HD engine.
Brightwell et al. (1986, 1989) studied the effects of DE on male and female F344 rats.
The DE was generated by a 1.5-L Volkswagen engine that was computer-operated according to
the U.S. 72 FTP driving cycle. The engine was replaced after 15 mo. The engine emissions
were diluted by conditioned air delivered at 800 m3/h to produce the high-exposure (6.6 mg/m3)
DE atmosphere. Further dilutions of 1:3 and 1:9 produced the medium- (2.2 mg/m3) and low-
7-101
(0.7 mg/m3) exposure atmospheres. The CO and NOx concentrations (mean ± SD) were 32 ± 11
ppm and 8 ± 1 ppm in the high-exposure concentration chamber. The inhalation exposures were
conducted overnight to provide five 16-h periods per week for 2 years; surviving animals were
maintained for an additional 6 mo.
For males and females combined, a 1.2% (3/260), 0.7% (1/144), 9.7% (14/144), and
38.5% (55/143) incidence of primary lung tumors occurred in F344 rats following exposure to
clean air or 0.7, 2.2, and 6.6 mg of DPM/m3, respectively (Table 7-3). DE-induced tumor
incidence in rats was dose-related and higher in females than in males (Table 7-3). These data
included animals sacrificed at the interim periods (6, 12, 18, and 24 mo); therefore, the tumor
incidence does not accurately reflect the effects of long-term exposure to the DE atmospheres.
When tumor incidence is expressed relative to the specific intervals, a lung tumor incidence of
96% (24/25), 76% (19/25) of which were malignant, was reported for female rats in the high-
dose group exposed for 24 months and held in clean air for the remainder of their lives. For
male rats in the same group, the tumor incidence equaled 44% (12/27), of which 37% (10/27)
were malignant. It was also noted that many of the animals exhibiting tumors had more than one
tumor, often representing multiple histological types. The numbers and types of tumors
identified in the rats exposed to DE included adenomas (40), squamous cell carcinomas (35),
adenocarcinomas (19), mixed adenoma/adenocarcinomas (9), and mesothelioma (1). It should
be noted that exposure during darkness (when increased activity would result in greater
respiratory exchange and greater inhaled dose) could account, in part, for the high response
reported for the rats.
Lewis et al. (1989) also examined the effects of inhalation exposure of DE and/or coal
dust on tumorigenesis on F344 rats. Groups of 216 male and 72 female rats were exposed to
clean air, whole DE (2 mg soot/m3), coal dust (2 mg/m3 respirable concentration; 5 to 6 mg/m3
total concentration), or DE plus coal dust (1 mg/m3 of each respirable concentration; 3.2 mg/m3
total concentration) for 7 h/day, 5 days/week during daylight hours for up to 24 mo. Groups of
10 or more males were sacrificed at intermediate intervals (3, 6, and 12 mo). The DE was
produced by a 7.0-L, 4-cycle, water-cooled Caterpillar Model 3304 engine using No. 2 diesel
fuel (<0.5% sulfur by mass). The exhaust was passed through a Wagner water scrubber, which
lowered the exhaust temperature and quenched engine backfire. The animals were exposed in
100-cubic-foot chambers. Temperature was controlled at 22 ± 2 °C and relative humidity at
50%±10%. The exhaust was diluted 27-fold with chemically and biologically filtered clean air
to achieve the desired particle concentration.
Histological examination was performed on 120 to 121 male and 71 to 72 female rats
terminated after 24 months of exposure. The exhaust exposure did not significantly affect the
tumor incidence beyond what would be expected for aging F344 rats. There was no
7-102
postexposure period, which may explain, in part, the lack of significant tumor induction. The
particulate matter concentration was also less than the effective dose in several other studies.
In a more recent study reported by Heinrich et al. (1995), female Wistar rats were
exposed to whole DE (0.8, 2.5, or 7.0 mg/m3) 18 h/day, 5 days/week for up to 24 mo, then held
in clean air an additional 6 mo. The animals were exposed in either 6 or 12 m3 exposure
chambers. Temperature and relative humidity were maintained at 23-25 °C and 50%-70%,
respectively. DE was generated by two 40-kw 1.6-L diesel engines (Volkswagen). One of them
was operated according to the U.S. 72 cycle. The other was operated under constant load
conditions. The first engine did not supply sufficient exhaust, which was filled by the second
engine. Cumulative exposures for the rats in the various treatment groups were 61.7, 21.8, and
7.4 g/m3 × h for the high, medium, and low whole-exhaust exposures. Significant increases in
tumor incidences were observed in the high (22/100; p<0.001) and mid (11/200; p<0.01)
exposure groups relative to clean-air controls (Table 7-3). Only one tumor (1/217), an
adenocarcinoma, was observed in clean-air controls. Relative to clean-air controls, significantly
increased incidences were observed in the high-exposure rats for benign squamous cell tumors
(14/100; p<0.001), adenomas (4/100; p<0.01), and adenocarcinomas (5/100; p<0.05). Only the
incidence of benign squamous cell tumors (7/200; p<0.01) was significantly increased in the
mid-exposure group relative to the clean-air controls.
Particle lung burden and alveolar clearance also were determined in the Heinrich et al.
(1995) study. Relative to clean air controls, alveolar clearance was significantly compromised
by exposure to mid and high DE. For the high-diesel-exhaust group, 3-mo recovery time in
clean air failed to reverse the compromised alveolar clearance.
In a study conducted at the Inhalation Toxicology Research Institute (Nikula et al.,
1995) F344 rats (114-115 per sex per group) were exposed 16 hr/day, 5 days/week during
daylight hours to DE diluted to achieve particle concentrations of 2.5 or 6.5 mg/m3 for up to 24
mo. Controls (118 males, 114 females) were exposed to clean air. Surviving rats were
maintained an additional 6 weeks in clean air, at which time mortality reached 90%. DE was
generated with two 1988 Model LH6 General Motors 6.2-L V-8 engines burning D-2 fuel that
met EPA certification standards. Chamber air flow was sufficient to provide about 15
exchanges per hour. Relative humidity was 40% to 70% and temperature ranged from 23 to 25
°C.
Following low and high DE exposure, the lung burdens were 36.7 and 80.7 mg,
respectively, for females and 45.1 and 90.1 mg, respectively, for males. The percentages of
susceptible rats (males and females combined) with malignant neoplasms were 0.9 (control), 3.3
(low DE), and 12.3 (high DE). The percentages of rats (males and females combined) with
malignant or benign neoplasms were 1.4 (control), 6.2 (low DE), and 17.9 (high DE). All
7-103
primary neoplasms were associated with the parenchyma rather than the conducting airways of
the lungs. The first lung neoplasm was observed at 15 mo. Among 212 males and females
examined in the high-dose group, adenomas were detected in 23 animals, adenocarcinomas in 22
animals, squamous cell carcinomas in 3 animals, and an adenosquamous carcinoma in 1 animal.
For further details see Table 7-3. Analysis of the histopathologic data suggested a progressive
process from alveolar epithelial hyperplasia to adenomas and adenocarcinomas.
Iwai et al. (1997) carried out a series of exposures to both filtered and whole exhaust
using a light-duty (2,369 mL) diesel engine. The protocol for engine operation was not stated.
Groups of female SPF F344 Fischer rats were exposed for 2 years for 8 hr/day, 7 days/week, 8
hr/day, 6 days/week, or 18 hr/day, 3 days/week to either filtered exhaust or exhaust diluted to a
particle concentration of 9.4, 3.2, and 5.1 mg/m3, respectively. Cumulative exposure (mg/m3 ×
hrs of exposure) equaled 274.4, 153.6, and 258.1 mg/m3. The animals were then held for an
additional 6 months in clean air. Lung tumors were reported in 5/121 (4%) of controls, 4/108
(4%) of those exposed to filtered exhaust, and 50/153 (35%) among those exposed to whole
exhaust. Among rats exposed to whole DE the following number of tumors were detected; 57
adenomas, 24 adenocarcinomas, 2 benign squamous cell tumors, 7 squamous cell carcinomas,
and 3 adenosquamous carcinomas. The authors stated that benign squamous cell tumors
probably corresponded to squamous cysts in another classification.
7.3.1.2. Mouse Studies
A series of inhalation studies using strain A mice was conducted by Orthoefer et al.
(1981). Strain A mice are usually given a series of intraperitoneal injections with the test agent;
they are then sacrificed at about 9 months and examined for lung tumors. In the present series,
inhalation exposure was substituted. DE was provided by one of two Nissan CN6-33 diesel
engines having a displacement of 3244 cc and run on a Federal Short Cycle. Flow through the
exposure chambers was sufficient to provide 15 air changes per hour. Temperature was
maintained at 24 °C and relative humidity at 75%. In the first study, groups of 25 male Strong
A strain (A/S) mice were exposed to irradiated DE (to simulate chemical reactions induced by
sunlight) or nonirradiated DE (6 mg/m3) for 20 h/day, 7 days/week. Additional groups of 40
Jackson A strain (S/J) mice (20 of each sex) were exposed similarly to either clean air or DE,
then held in clean air until sacrificed at 9 months of age. No tumorigenic effects were detected
at 9 months of age. Further studies were conducted in which male A/S mice were exposed 8
hr/day, 7 days/week until sacrifice (approximately 300 at 9 months of age and approximately
100 at 12 months of age). With the exception of those treated with urethan, the number of
tumors per mouse did not exceed historical control levels in any of the studies. Exposure to DE,

7-104
however, significantly inhibited the tumorigenic effects of the 5-mg urethan treatment. Results
are listed in Table 7-3.
Kaplan et al. (1982) also reported the effects of diesel exposure in strain A mice. Groups
of male strain A/J mice were exposed for 20 h/day, 7 days/week for 90 days and held until 9
months of age. Briefly, the animals were exposed in inhalation chambers to DE generated by a
5.7-L Oldsmobile engine operated continuously at 40 mph at DPM concentrations of 0, 0.25,
0.75, or 1.5 mg/m3. Controls were exposed to clean air. Temperature was maintained at 22 ± 2
°C and relative humidity at 50% ± 10% within the chambers. Among 458 controls and 485
exposed animals, tumors were detected in 31.4% of those breathing clean air versus 34.2% of
those exposed to DE. The mean number of tumors per mouse also failed to show significant
differences.
In a follow-up study, strain A mice were exposed to DE for 8 months (Kaplan et al.,
1983; White et al., 1983). After exposure to the highest exhaust concentration (1.5 mg/m3), the
percentage of mice with pulmonary adenomas and the mean number of tumors per mouse were
significantly less (p<0.05) than those for controls (25.0% vs. 33.5% and 0.30 ± 0.02 [S.E.] vs.
0.42 ± 0.03 [S.E.]) (Table 7-3).
Pepelko and Peirano (1983) summarized a series of studies on the health effects of diesel
emissions in mice. Exhaust was provided by two Nissan CN 6-33, 6-cylinder, 3.24-L diesel
engines coupled to a Chrysler A-272 automatic transmission and Eaton model 758-DG
dynamometer. Sixty-day pilot studies were conducted at a 1:14 dilution, providing DPM
concentrations of 6 mg/m3. The engines were operated using the Modified California Cycle.
These 20-hr/day, 7-days/week pilot studies using rats, cats, guinea pigs, and mice produced
decreases in weight gain and food consumption. Therefore, at the beginning of the long-term
studies, exposure time was reduced to 8 h/day, 7 days/week at an exhaust DPM concentration of
6 mg/m3. During the final 12 months of exposure, however, the DPM concentration was
increased to 12 mg/m3. For the chronic studies, the engines were operated using the Federal
Short Cycle. Chamber temperature was maintained at 24 °C and relative humidity at 50%.
Airflow was sufficient for 15 changes per hour.
Pepelko and Peirano (1983) described a two-generation study using Sencar mice exposed
to DE. Male and female parent-generation mice were exposed to DE at a DPM concentration of
6 mg/m3 prior to (from weaning to sexual maturity) and throughout mating. The dams continued
exposure through gestation, birth, and weaning. Groups of offspring (130 males and 130
females) were exposed to either DE or clean air. The exhaust exposure was increased to a DPM
concentration of 12 mg/m3 when the offspring were 12 weeks of age and was maintained until
termination of the experiment when the mice were 15 months old.

7-105
The incidence of pulmonary adenomas (16.3%) was significantly increased in the mice
exposed to DE compared with 6.3% in clean-air controls. The incidence in males and females
combined was 10.2% in 205 animals examined compared with 5.1% in 205 clean-air controls.
This difference was also significant. The incidence of carcinomas was not affected by exhaust
exposure in either sex. These results provided the earliest evidence for cancer induction
following inhalation exposure to DE. The increase in the sensitivity of the study, allowing
detection of tumors at 15 mo, may have been the result of exposure from conception. It is likely
that Sencar mice are sensitive to induction of lung tumors because they are also sensitive to
induction of skin tumors. These data are summarized in Table 7-3.
Takemoto et al. (1986) reported the effects of inhaled DE (2 to 4 mg/m3, 4 h/day, 4
days/week, for up to 28 mo) in ICR and C57BL mice exposed from birth. Details of the
exposure conditions are presented in Section 7.3.2.1. All numbers reported are for males and
females combined. Four adenomas and 1 adenocarcinoma were detected in 34 DE-exposed ICR
mice autopsied at 13 to 18 mo, compared with 3 adenomas among 38 controls. Six adenomas
and 3 adenocarcinomas were reported in 22 diesel-exposed ICR mice autopsied at 19 to 28 mo,
compared with 3 adenomas and 1 adenocarcinoma in 22 controls. Four adenomas and 2
adenocarcinomas were detected in 79 C57BL mice autopsied at 13 to 18 mo, compared with
none in 19 unexposed animals. Among males and females autopsied at 19 to 28 mo, 8 adenomas
and 3 adenocarcinomas were detected in 71 exposed animals, compared with 1 adenoma among
32 controls. No significant increases in adenoma or adenocarcinoma were reported for either
strain of exposed mice. However, the significance of the increase in the combined incidence of
adenomas and carcinomas was not evaluated statistically. A statistical analysis by Pott and
Heinrich (1990a) indicated that the difference in combined benign and malignant tumors
between whole DE-exposed C57BL/6N mice and corresponding controls was significant at
p<.05. See Table 7-3 for details of tumor incidence.
Heinrich et al. (1986b) and Stöber (1986), as part of a larger study, also evaluated the
effects of DE in mice. Details of the exposure conditions reported by Heinrich et al. (1986a) are
given in Section 7.3.1.1 and Appendix A. Following lifetime (19 h/day, 5 days/week, for a
maximum of 120 weeks) exposure to DE diluted to achieve a particle concentration of 4.2
mg/m3, 76 female NMRI mice exhibited a total lung tumor incidence of adenomas and
adenocarcinomas combined of 32%. Tumor incidences reported for control mice (n = 84)
equaled 11% for adenomas and adenocarcinomas combined. While the incidence of adenomas
showed little change, adenocarcinomas increased significantly from 2.4% for controls to 17%
for exhaust-exposed mice. In a follow-up study, however, Heinrich et al. (1995) reported a lack
of tumorigenic response in either female NMRI or C57BL/6N mice exposed 17 h/day, 5

7-106
days/week for 13.5 to 23 months to whole DE diluted to produce a particle concentration of 4.5
mg/m3. These data are summarized in Table 7-3.
The lack of a carcinogenic response in mice was reported by Mauderly et al. (1996). In
this study, groups of 540 to 600 CD-1 male and female mice were exposed to whole DE (7.1,
3.5, or 0.35 mg DPM/m3) for 7 hr/day, 5 days/week for up to 24 mo. Controls were exposed to
filtered air. DE was provided by 5.7-L Oldsmobile V-8 engines operated continuously on the
U.S. Federal Test Procedure urban certification cycle. The chambers were maintained at 25 °C-
28 °C, relative humidity at 40%-60%, and a flow rate sufficient for 15 air exchanges per hour.
Animals were exposed during the light cycle, which ran from 6:00 AM to 6:00 PM. DPM
accumulation in the lungs of exposed mice was assessed at 6, 12, and 18 months of exposure and
was shown to be progressive; DPM burdens were 0.2 ± 0.02, 3.7 ± 0.16, and 5.6 ± 0.39 mg for
the low-, medium-, and high-exposure groups, respectively. The lung burdens in both the
medium- and high-exposure groups exceeded that predicted by exposure concentration ratio for
the low-exposure group. Contrary to what was observed in rats (Heinrich et al., 1986b; Stöber,
1986; Nikula et al., 1995; Mauderly et al., 1987), an exposure-related increase in primary lung
neoplasms was not observed in the CD-1 mice, supporting the contention of a species difference
in the pulmonary carcinogenic response to poorly soluble particles. The percentage incidence of
mice (males and females combined) with one or more malignant or benign neoplasms was 13.4,
14.6, 9.7, and 7.5 for controls and low-, medium-, and high-exposure groups, respectively.
Although earlier studies provided some evidence for tumorigenic responses in diesel-
exposed mice, no increases were reported in the two most recent studies by Mauderly et al.
(1996) and Heinrich et al. (1995), which utilized large group sizes and were well designed and
conducted. Overall, the results in mice must therefore be considered to be equivocal.
7.3.1.3. Hamster Studies
Heinrich et al. (1982) examined the effects of DE exposure on tumor frequency in female
Syrian golden hamsters. Groups of 48 to 72 animals were exposed to clean air or whole DE at a
mean DPM concentration of 3.9 mg/m3. Inhalation exposures were conducted 7 to 8 hr/day, 5
days/week for 2 years. The exhaust was produced by a 2.4-L Daimler-Benz engine operated
under a constant load and a constant speed of 2,400 rpm. Flow rate was sufficient for about 20
exchanges per hour in the 250-L chambers. No lung tumors were reported in either exposure
group.
In a subsequent study, Syrian hamsters were exposed 19 hr/day, 5 days/week for a
lifetime to DE diluted to a DPM concentration of 4.24 mg/m3 (Heinrich et al., 1986b; Stöber,
1986). Details of the exposure conditions are reported in Appendix A. Ninety-six animals per
7-107
group were exposed to clean air or exhaust. No lung tumors were seen in either the clean-air
group or in the DE-exposed group.
In a third study (Heinrich et al., 1989b), hamsters were exposed to exhaust from a
Daimler-Benz 2.4-L engine operated at a constant load of about 15 kW and at a uniform speed
of 2,000 rpm. The exhaust was diluted to an exhaust-clean air ratio of about 1:13, resulting in a
mean particle concentration of 3.75 mg/m3. Exposures were conducted in chambers maintained
at 22 to 24 °C and 40% to 60% relative humidity for up to 18 mo. Surviving hamsters were
maintained in clean air for up to an additional 6 mo. The animals were exposed 19 hr/day, 5
days/week beginning at noon each day, under a 12-hr light cycle starting at 7 AM. Forty
animals per group were exposed to whole DE or clean air. No lung tumors were detected in
either the clean-air or diesel-exposed hamsters.
Brightwell et al. (1986, 1989) studied the effects of DE on male and female Syrian
golden hamsters. Groups of 52 males and 52 females, 6 to 8 weeks old, were exposed to DE at
DPM concentrations of 0.7, 2.2, or 6.6 mg/m3. They were exposed 16 hr/day, 5 days/week for a
total of 2 years and then sacrificed. Exposure conditions are described in Section 7.3.1.1. No
statistically significant (t test) relationship between tumor incidence and exhaust exposure was
reported.
In summary, DE alone did not induce an increase in lung tumors in hamsters of either sex
in several studies of chronic duration at high exposure concentrations.
7.3.1.4. Monkey Studies
Fifteen male cynomolgus monkeys were exposed to DE (2 mg/m3) for 7 hr/day, 5
days/week for 24 months (Lewis et al., 1989). The same numbers of animals were also exposed
to coal dust (2 mg/m3 respirable concentration; 5 to 6 mg/m3 total concentration), DE plus coal
dust (1 mg/m3 respirable concentration for each component; 3.2 mg/m3 total concentration), or
filtered air. Details of exposure conditions were listed previously in the description of the Lewis
et al. (1989) study with rats (Section 7.3.1.1) and are listed in Appendix A.
None of the monkeys exposed to DE exhibited a significantly increased incidence of
preneoplastic or neoplastic lesions. It should be noted, however, that the 24-mo time frame
employed in this study may not have allowed the manifestation of tumors in primates, because
this duration is only a small fraction of the monkeys’ expected lifespan. In fact, there have been
no near-lifetime exposure studies in nonrodent species.
7.3.2. Inhalation Studies (filtered DE)
Several studies have been conducted in which animals were exposed to DE filtered to
remove PM. As these studies also included groups exposed to whole exhaust, details can be
found in Sections 7.3.1.1 for rats, 7.3.1.2 for mice, and 7.3.1.3 for hamsters. Heinrich et al.
7-108
(1986b) and Stöber (1986) reported negative results for lung tumor induction in female Wistar
rats exposed to filtered exhaust diluted to produce an unfiltered particle concentration of 4.24
mg/m3. Negative results were also reported in female Fischer 344 rats exposed to filtered
exhaust diluted to produce an unfiltered particle concentration of 4.9 mg/m3 (Iwai et al., 1986a),
in Fischer 344 rats of either sex exposed to filtered exhaust diluted to produce an unfiltered
particle concentration of 6.6 mg/m3 (Brightwell et al., 1989), in female Wistar rats exposed to
filtered exhaust diluted to produce an unfiltered particle concentration of 7.0 mg/m3 (Heinrich et
al., 1995), and in female Fischer 344 rats exposed to filtered exhaust diluted to produce
unfiltered particle concentrations of 5.1, 3.2, or 9.4 mg/m3 (Iwai et al., 1997). In the Iwai et al.
(1986a) study, splenic lymphomas were detected in 37.5% of the exposed rats compared with
8.2% in controls.
In the study reported by Heinrich at al. (1986a) and Stober (1986), primary lung tumors
were seen in 29/93 NMRI mice (males and females combined) exposed to filtered exhaust,
compared with 11/84 in clean-air controls, a statistically significant increase. In a repeat study
by Heinrich et al. (1995), however, significant lung tumor increases were not detected in either
female NMRI or C57BL/6N mice exposed to filtered exhaust diluted to produce an unfiltered
particle concentration of 4.5 mg/m3.
Filtered exhaust also failed to induce lung tumor induction in Syrian Golden hamsters
(Heinrich et al., 1986a; Brightwell et al., 1989).
Although lung tumor increases were reported in one study and lymphomas in another,
these results could not be confirmed in subsequent investigations. It is therefore concluded that
little direct evidence exists for carcinogenicity of the vapor phase of DE in laboratory animals at
concentrations tested.
7.3.3. Inhalation Studies (DE plus Cocarcinogens)
Details of the studies reported here have been described earlier and in Table 7-3. Tumor
initiation with urethan (1 mg/kg body weight i.p. at the start of exposure) or promotion with
butylated hydroxytolulene (300 mg/kg body weight i.p. week 1, 83 mg/kg week 2, and 150
mg/kg for weeks 3-52) did not influence tumorigenic responses in Sencar mice of both sexes
exposed to concentrations of DE up to 12 mg/m3 (Pepelko and Peirano, 1983).
Heinrich et al. (1986b) exposed Syrian hamsters of both sexes to DE diluted to a particle
concentration of 4 mg/m3. See Section 7.3.1.1 for details of the exposure conditions. At the
start of exposure the hamsters received either one dose of 4.5 mg diethylnitrosamine (DEN)
subcutaneously per kg body weight or 20 weekly intratracheal instillations of 250 :g B[a]P.
Female NMRI mice received weekly intratracheal instillations of 50 or 100 :g B[a]P for 10 or
20 weeks, respectively, or 50 :g dibenz[ah]anthracene (DBA) for 10 weeks. Additional groups
of 96 newborn mice received one s.c. injection of 5 or 10 :g DBA between 24 and 48 hr after
birth. Female Wistar rats received weekly subcutaneous injections of dipentylnitrosamine

7-109
(DPN) at doses of 500 and 250 mg/kg body weight, respectively, during the first 25 weeks of
exhaust inhalation exposure. Neither DEN, DBA, or DPN treatment enhanced any tumorigenic
responses to DE. Response to B[a]P did not differ from that of BaP alone in hamsters, but
results were inconsistent in mice. Although 20 B[a]P instillations induced a 71% tumor
incidence in mice, concomitant diesel exposure resulted in only a 41% incidence. However,
neither 10 B[a]P instillations nor DBA instillations induced significant effects.
Takemoto et al. (1986) exposed Fischer 344 rats for 2 years to DE at particle
concentrations of 2 to 4 mg/m3. One month after start of inhalation exposure one group of rats
received di-isopropyl-nitrosamine (DIPN) administered i.p. at 1 mg/kg weekly for 3 weeks.
Among injected animals autopsied at 18 to 24 mo, 10 adenomas and 4 adenocarcinomas were
reported in 21 animals exposed to clean air, compared with 12 adenomas and 7 adenocarcinomas
in 18 diesel-exposed rats. According to the authors, the incidence of adenocarcinomas was not
significantly increased by exposure to DE.
Brightwell et al. (1989) investigated the concomitant effects of DE and DEN in Syrian
hamsters exposed to DE diluted to produce particle concentrations of 0.7, 2.2, or 6.6 mg/m3 for 2
years. The animals received a single dose of 4.5 mg DEN s.c. 3 days prior to start of inhalation
exposure. DEN did not affect the lack of responsiveness to DE alone. Heinrich et al. (1989b)
also exposed Syrian hamsters of both sexes to DE diluted to a particle concentration of 3.75
mg/m3 for up to 18 mo. After 2 weeks of exposure, groups were treated with either 3 or 6 mg
DEN/kg body weight, respectively. Again, DEN did not significantly influence the lack of
tumorigenic responses to DE.
Heinrich et al. (1989a) investigated the effects of DPN in female Wistar rats exposed to
DE diluted to achieve a particle concentration of 4.24 mg/m3 for 2-2.5 years. DPN at doses of
250 and 500 mg/kg body weight was injected subcutaneously once a week for the first 25 weeks
of exposure. The tumorigenic responses to DPN were not affected by exposure to DE. For
details of exposure conditions of the hamster studies see Section 7.3.1.3.
Heinrich et al. (1986a) and Mohr et al. (1986) compared the effects of exposure to
particles having only a minimal carbon core but a much greater concentration of PAHs than
DPM does. The desired exposure conditions were achieved by mixing coal oven flue gas with
pyrolyzed pitch. The concentration of B[a]P and other PAHs per milligram of DPM was about
three orders of magnitude greater than that of DE. Female rats were exposed to the flue gas-
pyrolyzed pitch for 16 hr/day, 5 days/week at particle concentrations of 3 to 7 mg/m3 for 22 mo,
then held in clean air for up to an additional 12 mo. Among 116 animals exposed, 22 tumors
were reported in 21 animals, for an incidence of 18.1%. One was a bronchioloalveolar
adenoma, one was a bronchioloalveolar carcinoma, and 20 were squamous cell tumors. Among
the latter, 16 were classified as benign keratinizing cystic tumors and 4 were classified as
carcinomas. No tumors were reported in 115 controls. The tumor incidence in this study was
comparable to that reported previously for the DE-exposed animals.
7-110
In analyzing the studies of Heinrich et al. (1986a,b), Heinrich (1990b), Mohr et al.
(1986), and Stöber (1986), it must be noted that the incidence of lung tumors occurring
following exposure to whole DE, coal oven flue gas, or carbon black (15.8%, 18.1%, and 8% to
17%, respectively) was very similar. This occurred despite the fact that the PAH content of the
PAH-enriched pyrolyzed pitch was more than three orders of magnitude greater than that of DE;
carbon black, on the other hand, had only traces of PAHs. Based on these findings, particle-
associated effects appear to be the primary cause of diesel-exhaust-induced lung cancer in rats
exposed at high concentrations. This issue is discussed further in Chapter 7.
7.3.4. Lung Implantation or Intratracheal Instillation Studies
7.3.4.1. Rat Studies
Grimmer et al. (1987), using female Osborne Mendel rats (35 per treatment group),
provided evidence that PAHs in DE that consist of four or more rings have carcinogenic
potential. Condensate was obtained from the whole exhaust of a 3.0-L passenger-car diesel
engine connected to a dynamometer operated under simulated city traffic driving conditions.
This condensate was separated by liquid-liquid distribution into hydrophilic and hydrophobic
fractions representing 25% and 75% of the total condensate, respectively. The hydrophilic,
hydrophobic, or reconstituted hydrophobic fractions were surgically implanted into the lungs of
the rats. Untreated controls, vehicle (beeswax/trioctanoin) controls, and positive (B[a]P)
controls were also included in the protocol (Table 7-6). Fraction Ilb (made up of PAHs with
four to seven rings), which accounted for only 0.8% of the total weight of DPM condensate,
produced the highest incidence of carcinomas following implantation into rat lungs. A
carcinoma incidence of 17.1% was observed following implantation of 0.21 mg IIb/rat, whereas
the nitro-PAH fraction (IId) at 0.18 mg/rat accounted for only a 2.8% carcinoma incidence.
Hydrophilic fractions of the DPM extracts, vehicle (beeswax/trioctanoin) controls, and untreated
controls failed to exhibit carcinoma formation. Administration of all hydrophobic fractions (IIa-
d) produced a carcinoma incidence (20%) similar to the summed incidence of fraction IIb
(17.1%) and IId (2.8%). The B[a]P positive controls (0.03, 0.1, 0.3 mg/rat) yielded a carcinoma
incidence of 8.6%, 31.4%, and 77.1%, respectively. The study showed that the tumorigenic
agents were primarily four- to seven-ring PAHs and, to a lesser extent, nitroaromatics.
However, these studies demonstrated that simultaneous administration of various PAH
compounds resulted in a varying of the tumorigenic effect, thereby implying that the
tumorigenic potency of PAH mixtures may not depend on any one individual PAH. This study
did not provide any information regarding the bioavailability of the particle-associated PAHs
that might be responsible for carcinogenicity.
Kawabata et al. (1986) compared the effects of activated carbon and DE on lung tumor
formation. One group of 59 F344 rats was intratracheally instilled with DPM (1 mg/week for 10

7-111
Table 7-6. Tumor incidence and survival time of rats treated by surgical lung implantation with fractions from DE condensate (35 rats/group)
Material portion by weight (%) Dose (mg)
Mediansurvival time
in weeks(range)
Number ofcarcinomasa
Number ofadenomasb
Carcinomaincidence (%)
Hydrophilic fraction (I) (25) 6.7 97 (24-139) 0 1 0
Hydrophobic fraction (II) (75)Nonaromatics +PACc 2 + 3 rings (IIa) (72)PAHd 4 to 7 rings (IIb) (0.8)Polar PAC (IIc) (1.1)Nitro-PAH (IId) (0.7)
20.00
19.220.210.290.19
99 (50-139)
103 (25-140)102 (50-140)97 (44-138)
106 (32-135)
50601 1000 14.2
017.1
02.8
Reconstituted hydrophobics(Ia, b, c, d) (74.5)
Control, unrelatedControl (beeswax/trioctanoin)B[a]P
19.91
0.30.1
0.03
93 (46-136)
110 (23-138)103 (51-136)69 (41-135)98 (22-134)97 (32-135)
70027113 101000 20.0
00
77.131.48.6
aSquamous cell carcinoma.bBronchiolar/alveolar adenoma.cPAC = polycyclic aromatic compounds.dPAH = polycyclic aromatic hydrocarbons.
Source: Adapted from Grimmer et al., 1987.

7-112
weeks). A second group of 31 rats was instilled with activated carbon using the same dosing
regime. Twenty-seven rats received only the solvent (buffered saline with 0.05% Tween 80),
and 53 rats were uninjected. Rats dying after 18 months were autopsied. All animals surviving
30 months or more postinstillation were sacrificed and evaluated for histopathology. Among 42
animals exposed to DPM surviving 18 months or more, tumors were reported in 31, including 20
malignancies. In the subgroup surviving for 30 mo, tumors were detected in 19 of 20 animals,
including 10 malignancies. Among the rats exposed to activated carbon, the incidence of lung
tumors equaled 11 of 23 autopsied, with 7 cases of malignancy. Data for those dying between
18 and 30 months and those sacrificed at 30 months were not reported separately. Statistical
analysis indicated that activated carbon induced a significant increase in lung tumor incidence
compared with no tumors in 50 uninjected controls and 1 tumor in 23 solvent-injected controls.
The tumor incidence was significantly greater in the DPM-instilled group and was significantly
greater than the increase in the carbon-instilled group.
A study reported by Rittinghausen et al. (1997) suggested that organic constituents of
diesel particles play a role in the induction of lung tumors in rats. An incidence of 16.7%
pulmonary cystic keratinizing squamous cell lesions was noted in rats intratracheally instilled
with 15 mg whole DE particles, compared with 2.1% in rats instilled with 15 mg particles
extracted to remove all organic constituents, and none among controls. Instillation of 30 mg of
extracted particles induced a 14.6% incidence of squamous lesions, indicating the greater
effectiveness of particles alone as lung particle overload increased.
Iwai et al. (1997) instilled 2, 4, 8, and 10 mg of whole diesel particles over a 2- to 10-
week period into female F/344 rats, 50 or more per group. Tumors were reported in 6%, 20%,
43%, and 74% of the rats, with incidence of malignant tumors equal to 2%, 13%, 34%, and
48%, respectively. In a second experiment comparing whole with extracted diesel particles,
tumor incidence equaled 1/48 (2%) in uninjected controls, 3/55 (5%) in solvent controls, 12/56
(21%) in extracted diesel particles, and 13/106 (12%) in animals injected with unextracted
particles. Although the extracted particles appeared to be more potent, when converted to a lung
burden basis (mg/100 mg dry lung) the incidence was only 14% among those exposed to
extracted exhaust compared with 31% in those exposed to whole particles.
Dasenbrock et al. (1996) conducted a study to determine the relative importance of the
organic constituents of diesel particles and particle surface area in the induction of lung cancer in
rats. Fifty-two female Wistar rats were intratracheally instilled with 16-17 doses of DPM,
extracted DPM, printex carbon black (PR), lampblack (LB), B[a]P, DPM + B[a]P, or PR +
B[a]P. The animals were held for a lifetime or sacrificed when moribund. The lungs were
necropsied and examined for tumors. Diesel particles were collected from a Volkswagen 1.6-L
engine operating on a US FTP-72 driving cycle. The mass median aerodynamic diameter
(MMAD) of the diesel particles was 0.25 :m and the specific surface area was 12 m2/gm.

7-113
Following extraction with toluene, specific surface area increased to 138 m2/gm. The MMAD
for extracted PR was equal to 14 nm, while the specific surface area equaled 271 m2/gm. The
MMAD for extracted lampblack was equal to 95 nm, with a specific surface area equal to 20
m2/gm. The B[a]P content of the treated particles was 11.3 mg per gm diesel particles and 29.5
mg B[a]P per gm PR. Significant increases in lung tumors were detected in rats instilled with 15
mg unextracted DPM and 30 mg extracted DPM, but not 15 mg extracted DPM. Printex CB was
more potent than lampblack CB for induction of lung tumors, whereas B[a]P was effective only
at high doses. Total dose and tumor responses are shown in Table 7-4.
A number of conclusions can be drawn from these results. First of all, particles devoid
of organics are capable of inducing lung tumor formation, as indicated by positive results in the
groups treated with high-dose extracted diesel particles and printex. Nevertheless, toluene
extraction of organics from diesel particles results in a decrease in potency, indicating that the
organic fraction does play a role in cancer induction. A relationship between cancer potency and
particle surface area was also suggested by the finding that printex with a large specific surface
area was more potent than either extracted DPM or lampblack, which have smaller specific
areas. Finally, while very large doses of B[a]P are very effective in the induction of lung
tumors, smaller doses adsorbed to particle surfaces had little detectable effect, suggesting that
other organic components of DE may be of greater importance in the induction of lung tumors at
low doses pf B[a]P (0.2-0.4 mg).
7.3.4.2. Syrian Hamster Studies
Kunitake et al. (1986) and Ishinishi et al. (1988b) conducted a study in which total doses
of 1.5, 7.5, or 15 mg of a dichloromethane extract of DPM were instilled intratracheally over 15
weeks into male Syrian hamsters that were then held for their lifetimes. The tumor incidences of
2.3% (1/44), 0% (0/56), and 1.7% (1/59) for the high-, medium-, and low-dose groups,
respectively, did not differ significantly from the 1.7% (1/56) reported for controls. Addition of
7.5 mg of B[a]P to a DPM extract dose of 1.5 mg resulted in a total tumor incidence of 91.2%
and malignant tumor incidence of 88%. B[a]P (7.5 mg over 15 weeks) alone produced a tumor
incidence rate of 88.2% (85% of these being malignant), which was not significantly different
from the DPM extract + B[a]P group. Intratracheal administration of 0.03 :g B[a]P, the
equivalent content in 15 mg of DPM extract, failed to cause a significant increase in tumors in
rats. This study demonstrated a lack of detectable interaction between DPM extract and B[a]P,
the failure of DPM extract to induce carcinogenesis, and the propensity for respiratory tract
carcinogenesis following intratracheal instillation of high doses of B[a]P. For studies using the
DPM extract, some concern must be registered regarding the known differences in chemical
composition between DPM extract and DPM. As with all intratracheal instillation protocols,
DPM extract lacks the complement of volatile chemicals found in whole DE.
7-114
The effects on hamsters of intratracheally instilled DPM suspension, DPM with Fe2O3, or
DPM extract with Fe2O3 as the carrier were studied by Shefner et al. (1982). The DPM
component in each of the treatments was administered at concentrations of 1.25, 2.5, or 5.0
mg/week for 15 weeks to groups of 50 male Syrian golden hamsters. The total volume instilled
was 3.0 mL (0.2 mL/week for 15 weeks). The DPM and dichloromethane extracts were
suspended in physiological saline with gelatin (0.5% w/v), gum arabic (0.5% w/v), and
propylene glycol (10% by volume). The Fe2O3 concentration, when used, was 1.25 mg/0.2 mL
of suspension. Controls received vehicle and, where appropriate, carrier particles (Fe2O3)
without the DPM component. Two replicates of the experiments were performed.
Adenomatous hyperplasia was reported to be most severe in those animals treated with DPM or
DPM plus Fe2O3 particles and least severe in those animals receiving DPM plus Fe2O3. Of the
two lung adenomas detected microscopically, one was in an animal treated with a high dose of
DPM and the other was in an animal receiving a high dose of DPM extract. Although lung
damage was increased by instillation of DPM, there was no evidence of tumorigenicity.
7.3.4.3. Mouse Studies
Ichinose et al. (1997a) intratracheally instilled 36 four-week-old male ICR mice per
group weekly for 10 weeks with sterile saline or 0.05, 0.1, or 0.2 mg DPM. Particles were
collected from a 2.74-L four-cylinder Isuzu engine run at a steady speed of 1,500 rpm under a
load of 10 torque (kg/m). Twenty-four hours after the last instillation, six animals per group
were sacrificed for measurement of lung 8-hydroxydeoxyguanosine (8-OHdG). The remaining
animals were sacrificed after 12 months for histopathological analysis. Lung tumor incidence
varied from 4/30 (13.3%) for controls to 9/30 (30%), 9/29 (31%), and 7/29 (24.1%) for mice
instilled with 0.05, 0.1, and 0.2 mg/week, respectively. The increase in animals with lung
tumors compared with controls was statistically significant for the 0.1 mg dose group, the only
group analyzed statistically. Increases in 8-OHdG, an indicator of oxidative DNA damage,
correlated well with the increase in tumor incidence in the 0.05 mg dose group, although less so
with the other two. The correlation coefficients r = 0.916, 0.765, and 0.677 for the 0.05, 0.10,
and 0.20 mg DPM groups, respectively.
In a similar study, 33 four-week-old male ICR mice per group were intratracheally
instilled weekly for 10 weeks with sterile saline, 0.1 mg DPM, or 0.1 mg DPM from which the
organic constituents were extracted with hexane (Ichinose et al., 1997b). Exhaust was collected
from a 2.74-L four-cylinder Izuzu engine run at a steady speed of 2,000 rpm under a load of 6
torque (kg/m). Twenty-four hours after the last instillation, six animals per group were
sacrificed for measurement of 8-OHdG. Surviving animals were sacrificed after 12 mo. The
incidence of lung tumors increased from 3/27 (11.1%) among controls to 7/27 (25.9%) among
those instilled with extracted diesel particles and 9/26 (34.6%) among those instilled with

7-115
unextracted particles. The increase in number of tumor-bearing animals was statistically
significant compared with controls (p<0.05) for the group treated with unextracted particles.
The increase in 8-OHdG was highly correlated with lung tumor incidence, r = 0.99.
7.3.5. Subcutaneous and Intraperitoneal Injection Studies
7.3.5.1. Mouse Studies
In addition to inhalation studies, Orthoefer et al. (1981) also tested the effects of i.p.
injections of DPM on male (A/S) strain mice. Three groups of 30 mice were injected with 0.1
mL of a suspension (particles in distilled water) containing 47, 117, or 235 :g of DPM collected
from Fluoropore filters in the inhalation exposure chambers. The exposure system and exposure
atmosphere are described in Appendix A. Vehicle controls received injections of particle
suspension made up of particulate matter from control exposure filters, positive controls
received 20 mg of urethan, and negative controls received no injections. Injections were made
three times weekly for 8 weeks, resulting in a total DPM dose of 1.1, 2.8, and 5.6 mg for the
low-, medium-, and high-dose groups and 20 mg of urethan for the positive control group.
These animals were sacrificed after 26 weeks and examined for lung tumors. For the low-,
medium-, and high-dose DPM groups, the tumor incidence was 2/30, 10/30, and 8/30,
respectively. The incidence among urethan-treated animals (positive controls) was 100%
(29/29), with multiple tumors per animal. The tumor incidence for the DPM-treated animals did
not differ significantly from that of vehicle controls (8/30) or negative controls (7/28). The
number of tumors per mouse was also unaffected by treatment.
In further studies conducted by Orthoefer et al. (1981), an attempt was made to compare
the potency of DPM with that of other environmental pollutants. Male and female Strain A mice
were injected i.p. three times weekly for 8 weeks with DPM, DPM extracts, or various
environmental mixtures of known carcinogenicity, including cigarette smoke condensate, coke
oven emissions, and roofing tar emissions. Injection of urethan or dimethylsulfoxide (DMSO)
served as positive or vehicle controls, respectively. In addition to DPM from the Nissan diesel
previously described, an eight-cylinder Oldsmobile engine operated at the equivalent of 40 mph
was also used to compare emission effects from different makes and models of diesel engine.
The mice were sacrificed at 9 months of age and their lungs examined for histopathological
changes. The only significant findings, other than for positive controls, were small increases in
numbers of lung adenomas per mouse in male mice injected with Nissan DPM and in female
mice injected with coke oven extract. Furthermore, the increase in the extract-treated mice was
significant only in comparison with uninjected controls (not injected ones) and did not occur
when the experiment was repeated. Despite the use of a strain of mouse known to be sensitive to
tumor induction, the overall findings of this study were negative. The authors provided several
possible explanations for these findings, the most likely of which were (1) the carcinogens that

7-116
were present were very weak, or (2) the concentrations of the active components reaching the
lungs were insufficient to produce positive results.
Kunitake et al. (1986) conducted studies using DPM extract obtained from a 1983 HD
MMC—6D22P 11-L V-6 engine. Five s.c. injections of DPM extract (500 mg/kg per injection)
resulted in a significant (p<0.01) increase in subcutaneous tumors for female C57BL mice (5/22
[22.7%] vs. 0/38 among controls). Five s.c. doses of DPM extract of 10, 25, 30, 100, or 200
mg/kg failed to produce a significant increase in tumor incidence. One of 12 female ICR mice
(8.3%) and 4 of 12 male ICR mice (33.3%) developed malignant lymphomas following neonatal
s.c. administration of 10 mg of DPM extract per mouse. The increase in malignant lymphoma
incidence for the male mice was statistically significant at p<0.05 compared with an incidence of
2/14 (14.3%) among controls. Treatment of either sex with 2.5 or 5 mg of DPM extract per
mouse did not result in statistically significant increases in tumor incidence.
Additional studies using DPM extract from LD (1.8-L, 4-cylinder) as well as HD engines
with female ICR and nude mice (BALB/c/cA/JCL-nu) were also reported (Kunitake et al.,
1988). Groups of 30 ICR and nude mice each were given a single s.c. injection of 10 mg HD
extract, 10 mg HD + 50 :g 12-O-tetradecanoylphorbol 13-acetate (TPA), 10 mg LD extract +
50 :g TPA, or 50 :g TPA. No malignant tumors or papillomas were observed. One
papillomatous lesion was observed in an ICR mouse receiving LD extract + TPA, and acanthosis
was observed in one nude mouse receiving only TPA.
In what appears to be an extension of the Kunitake et al. (1986) s.c. injection studies,
Takemoto et al. (1988) presented additional data for subcutaneously administered DPM extract
from HD and LD diesel engines. In this report, the extracts were administered to 5-week-old
and neonatal (<24 hr old) C57BL mice of both sexes. DPM extract from HD or LD engines was
administered weekly to the 5-week-old mice for 5 weeks at doses of 10, 25, 50, 100, 200, or 500
mg/kg, with group sizes ranging from 15 to 54 animals. After 20 weeks, comparison with a
control group indicated a significant increase in the incidence of subcutaneous tumors for the
500 mg/kg HD group (5 of 22 mice [22.7%], p<0.01), the 100 mg/kg LD group (6 of 32
[18.8%],
p<0.01), and the 500 mg/kg LD group (7 of 32 [21.9%], p<0.01) in the adult mouse
experiments. The tumors were characterized as malignant fibrous histiocytomas. No tumors
were observed in other organs. The neonates were given single doses of 2.5, 5, or 10 mg DPM
extract subcutaneously within 24 hr of birth. There was a significantly higher incidence of
malignant lymphomas in males receiving 10 mg of HD extract and of lung tumors for males
given 2.5 mg HD extract and for males given 5 mg and females given 10 mg LD extract. A
dose-related trend that was not significant was observed for the incidences of liver tumors for
both the HD extract- and LD extract-treated neonatal mice. The incidence of mammary tumors
in female mice and multiple-organ tumors in male mice was also greater for some extract-treated

7-117
mice, but was not dose related. The report concluded that LD DPM extract showed greater
carcinogenicity than did HD DPM extract.
7.3.6. Dermal Studies
7.3.6.1. Mouse Studies
In one of the earliest studies of diesel emissions, the effects of dermal application of
extract from DPM were examined by Kotin et al. (1955). Acetone extracts were prepared from
the DPM of a diesel engine (type and size not provided) operated at warmup mode and under
load. These extracts were applied dermally three times weekly to male and female C57BL and
strain A mice. Results of these experiments are summarized in Table 7-5. In the initial
experiments using 52 (12 male, 40 female) C57BL mice treated with DPM extract from an
engine operated in warmup mode, two papillomas were detected after 13 mo. Four tumors were
detected 16 months after the start of treatment in 8 surviving of 50 exposed male strain A mice
treated with DPM extract from an engine operated under full load. Among female strain A mice
treated with DPM extract from an engine operated under full load, 17 tumors were detected in
20 of 25 mice surviving longer than 13 mo. This provided a significantly increased tumor
incidence of 85%. Carcinomas as well as papillomas were seen, but the numbers were not
reported.
Depass et al. (1982) examined the potential of DPM and dichloromethane extracts of
DPM to act as complete carcinogens, carcinogen initiators, or carcinogen promoters. In skin-
painting studies, the DPM was obtained from an Oldsmobile 5.7-L diesel engine operated under
constant load at 65 km/h. The DPM was collected at a temperature of 100°C. Groups of 40
C3H/HeJ mice were used because of their low spontaneous tumor incidence. For the complete
carcinogenesis experiments, DPM was applied as a 5% or 10% suspension in acetone.
Dichloromethane extract was applied as 5%, 10%, 25%, or 50% suspensions. Negative controls
received acetone, and positive controls received 0.2% B[a]P. For tumor-promotion experiments,
a single application of 1.5% B[a]P was followed by repeated applications of 10% DPM
suspension, 50% DPM extract, acetone only (vehicle control), 0.0001% phorbol 12-myristate
13-acetate (PMA) as a positive promoter control, or no treatment (negative control). For the
tumor-initiation studies, a single initiating dose of 10% diesel particle suspension, 50% diesel
particle extract, acetone, or PMA was followed by repeated applications of 0.0001% PMA.
Following 8 months of treatment, the PMA dose in the initiation and promotion studies was
increased to 0.01%. Animals were treated three times per week in the complete carcinogenesis
and initiation experiments and five times per week in promotion experiments. All test
compounds were applied to a shaved area on the back of the mouse.
In the complete carcinogenesis experiments, one mouse receiving the high-dose (50%)
suspension of extract developed a squamous cell carcinoma after 714 days of treatment. Tumor
7-118
incidence in the B[a]P group was 100%, and no tumors were observed in any of the other
groups. For the promotion studies, squamous cell carcinomas with pulmonary metastases were
identified in one mouse of the 50% DPM extract group and in one in the 25% extract group.
Another mouse in the 25% extract group developed a grossly diagnosed papilloma. Nineteen
positive control mice had tumors (11 papillomas, 8 carcinomas). No tumors were observed for
any of the other treatment groups. For the initiation studies, three tumors (two papillomas and
one carcinoma) were identified in the group receiving DPM suspension and three tumors (two
papillomas and one fibrosarcoma) were found in the DPM extract group. These findings were
reported to be statistically insignificant using the Breslow and Mantel-Cox tests.
Although these findings were not consistent with those of Kotin et al. (1955), the
occurrence of a single carcinoma in a strain known to have an extremely low spontaneous tumor
incidence may be of importance. Furthermore, a comparison between studies employing
different strains of mice with varying spontaneous tumor incidences may result in erroneous
assumptions.
Nesnow et al. (1982) studied the formation of dermal papillomas and carcinomas
following dermal application of dichloromethane extracts from coke oven emissions, roofing tar,
DPM, and gasoline engine exhaust. DPM from five different engines, including a preproduction
Nissan 220C, a 5.7-L Oldsmobile, a prototype Volkswagen Turbo Rabbit, a Mercedes 300D, and
a HD Caterpillar 3304, was used for various phases of the study. Male and female Sencar mice
(40 per group) were used for tumor initiation, tumor promotion, and complete carcinogenesis
studies. For the tumor-initiation experiments, the DPM extracts were topically applied in single
doses of 100, 500, 1,000, or 2,000 :g/mouse. The high dose (10,000 :g/mouse) was applied in
five daily doses of 2,000 :g. One week later, 2 :g of the tumor promoter TPA was applied
topically twice weekly. The tumor-promotion experiments used mice treated with 50.5 :g of
B[a]P followed by weekly (twice weekly for high dose) topical applications (at the
aforementioned doses) of the extracts. For the complete carcinogenesis experiments, the test
extracts were applied weekly (twice weekly for the high doses) for 50 to 52 weeks. Only
extracts from the Nissan, Oldsmobile, and Caterpillar engines were used in the complete
carcinogenesis experiments.
In the tumor-initiation studies, both B[a]P alone and the Nissan engine DPM extract
followed by TPA treatment produced a significant increase in tumor (dermal papillomas)
incidence at 7 to 8 weeks postapplication. By 15 weeks, the tumor incidence was greater than
90% for both groups. No significant carcinoma formation was noted for mice in the tumor-
initiation experiments following exposure to DPM extracts of the other diesel engines, although
the Oldsmobile engine DPM extract at 2.0 mg/mouse did produce a 40% papilloma incidence in
male mice at 6 mo. This effect, however, was not dose dependent.

7-119
B[a]P (50.5 :g/week), coke oven extract (at 1.0, 2.0, or 4.0 mg/week), and the highest
dose of roofing tar extract (4.0 mg/week) all tested positive for complete carcinogenesis activity.
DPM extracts from only the Nissan, Oldsmobile, and Caterpillar engines were tested for
complete carcinogenic potential, and all three proved to be negative using the Sencar mouse
assay.
The results of the dermal application experiments by Nesnow et al. (1982) are presented
in Table 7-7. The tumor initiation-promotion assay was considered positive if a dose-dependent
response was obtained and if at least two doses provided a papilloma-per-mouse value that was
three times or greater than that of the background value. Based on these criteria, only emissions
from the Nissan were considered positive. Tumor initiation and complete carcinogenesis assays
required that at least one dose produce a tumor incidence of at least 20%. None of the DPM
samples yielded positive results based on this criterion.
Kunitake et al. (1986, 1988) evaluated the effects of a dichloromethane extract of DPM
obtained from a 1983 MMC M-6D22P 11-L V-6 engine. An acetone solution was applied in 10
doses every other day, followed by promotion with 2.5 :g of TPA three times weekly for 25
weeks. Exposure groups received a total dose of 0.5, 5, 15, or 45 mg of extract. Papillomas
were reported in 2 of 50 animals examined in the 45 mg exposure group and in 1 of 48 in the 15
mg group compared with 0 of 50 among controls. Differences, however, were not statistically
significant.
7.3.7. Summary and Conclusions of Laboratory Animal Carcinogenicity Studies
As early as 1955, Kotin et al. (1955) provided evidence for tumorigenicity and
carcinogenicity of acetone extracts of DPM following dermal application and also provided data
suggesting a difference in this potential depending on engine operating mode. Until the early
1980s, no chronic studies assessing inhalation of DE, the relevant mode for human exposure,
had been reported. Since then long-term inhalation bioassays with DE have been carried out in
the United States, Germany, Switzerland, and Japan, testing responses of rats, mice, and Syrian
hamsters, and to a limited extent cats and monkeys.

7-120
Table 7-7. Dermal tumorigenic and carcinogenic effects of various emission extracts
Tumor initiationComplete
carcinogenesis Tumor promotion
Sample Papillomasa Carcinomasb Carcinomasb Papillomasa
Benzo[a]pyrene +/+c +/+ +/+ +/+
Topside coke oven +/+ -/+ NDd ND
Coke oven main +/+ +/+ +/+ +/+
Roofing tar +/+ +/+ +/+ +/+
Nissan +/+ +/+ -/- ND
Oldsmobile +/+ -/- -/- ND
VW Rabbit +/+ -/- Ie ND
Mercedes +/- -/- ND ND
Caterpillar -/- -/- -/- ND
Residential furnace -/- -/- ND ND
Mustang +/+ -/+ ND ND
aScored at 6 mo. bCumulative score at 1 year. cMale/female. dND = Not determined. eI = Incomplete.
Source: Nesnow et al., 1982.
7-121
It can be reasonably concluded that with adequate exposure, inhalation of DE is capable
of inducing lung cancer in rats. Responses best fit cumulative exposure (concentration × daily
exposure duration × days of exposure). Examination of rat data shown in Table 7-8 indicates a
trend of increasing tumor incidence at exposures exceeding 1 × 10⁴ mg@hr/m3. Exposures greater
than approximately this value result in lung particle overload, characterized by slowed particle
clearance and lung pathology, as discussed in Chapters 3 and 5, respectively. Tumor induction
at high doses may therefore be primarily the result of lung particle overload with associated
inflammatory responses. Although tumorigenic responses could not be detected under non-
particle-overload conditions, the animal experiments lack sensitivity to determine if a threshold
exists. However, studies such as those reported by Driscoll et al. (1996) support the existence of
a threshold if it is assumed that inflammation is a prerequisite for lung tumor induction. If low-
dose effects do occur, it can be hypothesized that the organic constituents are playing a role. See
Chapter 7 for a discussion of this issue.
Although rats develop adenomas, adenocarcinomas, and adenosquamous cell carcinomas,
they also develop squamous keratinizing lesions. This latter spectrum appears for the most part
to be peculiar to the rat. In a recent workshop aimed at classifying these tumors (Boorman et al.,
1996), it was concluded that when these lesions occur in rats as part of a carcinogenicity study,
they must be evaluated on a case-by-case basis and regarded as a part of the total biologic profile
of the test article. If the only evidence of tumorigenicity is the presence of cystic keratinizing
epitheliomas, it may not have relevance to human safety evaluation of a substance or particle.
Their use in quantifying cancer potency is even more questionable.
The evidence for response of common strains of laboratory mice exposed under standard
inhalation protocols is equivocal. Inhalation of DE induced significant increases in lung tumors
in female NMRI mice (Heinrich et al., 1986b; Stöber, 1986) and in female Sencar mice (Pepelko
and Peirano, 1983). An apparent increase was also seen in female C57BL mice (Takemoto et
al., 1986). However, in a repeat of their earlier study, Heinrich et al. (1995) failed to detect lung
tumor induction in either NMRI or C57BL/6N mice. No increases in lung tumor rates were
reported in a series of inhalation studies using strain A mice (Orthoefer et al., 1981; Kaplan et
al., 1982, 1983; White et al., 1983). Finally, Mauderly et al. (1996) reported no tumorigenic
responses in CD-1 mice exposed under conditions resulting in positive responses in rats. The
successful induction of lung tumors in mice by Ichinose et al. (1997a,b) via intratracheal
instillation may have been the result of focal deposition of larger doses. Positive effects in
Sencar mice may be due to use of a strain sensitive to tumor induction in epidermal tissue by
organic agents, as well as exposure from conception, although proof for such a hypothesis is
lacking.
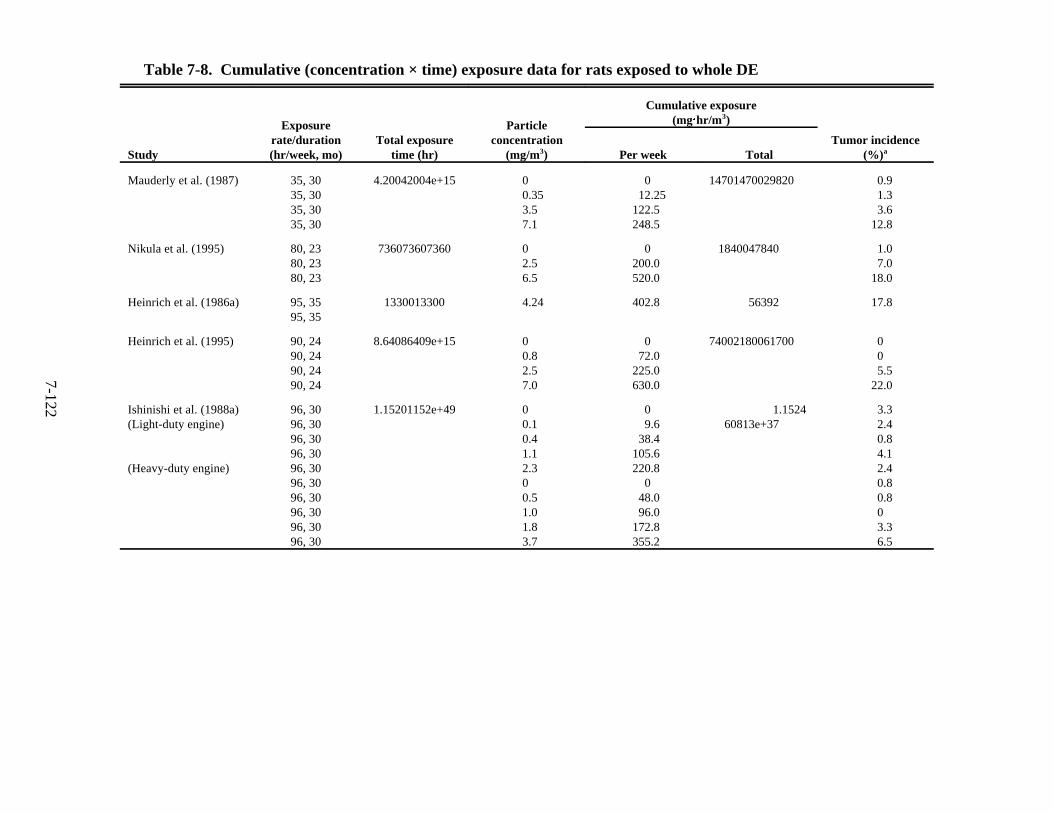
7-122
Table 7-8. Cumulative (concentration × time) exposure data for rats exposed to whole DE
Study
Exposurerate/duration(hr/week, mo)
Total exposuretime (hr)
Particleconcentration
(mg/m3)
Cumulative exposure(mg"hr/m3)
Tumor incidence(%)aPer week Total
Mauderly et al. (1987) 35, 3035, 3035, 3035, 30
4.20042004e+15 00.353.57.1
012.25
122.5248.5
14701470029820 0.91.33.6
12.8
Nikula et al. (1995) 80, 2380, 2380, 23
736073607360 02.56.5
0200.0520.0
1840047840 1.07.0
18.0
Heinrich et al. (1986a) 95, 3595, 35
1330013300 4.24 402.8 56392 17.8
Heinrich et al. (1995) 90, 2490, 2490, 2490, 24
8.64086409e+15 00.82.57.0
072.0
225.0630.0
74002180061700 005.5
22.0
Ishinishi et al. (1988a)(Light-duty engine)
(Heavy-duty engine)
96, 3096, 3096, 3096, 3096, 3096, 3096, 3096, 3096, 3096, 30
1.15201152e+49 00.10.41.12.300.51.01.83.7
09.6
38.4105.6220.8
048.096.0
172.8355.2
1.152460813e+37
3.32.40.84.12.40.80.803.36.5

Table 7-8. Cumulative (concentration × time) exposure data for rats exposed to whole DE (continued)
Study
Exposurerate/duration(hr/week, mo)
Total exposuretime (hr)
Particleconcentration
(mg/m3)
Cumulative exposure(mg"hr/m3)
Tumor incidence(%)aPer week Total
7-123
Brightwell et al. (1989) 80, 2480, 2480, 2480, 24
7.6807681e+15 00.72.26.6
056.0
176.0528.0
53761689650688 1.20.79.7
38.5
Kaplan et al. (1983) 140, 15140, 15140, 15140, 15
8.4008401e+15 00.250.751.5
035.0
105.0210.0
2100630012600 03.3
10.03.3
Iwai et al. (1986b) 56, 2456, 24
53765376 4.9 274.4 26342 36.8
Takemoto et al. (1986) 16, 18-2416, 18-24
1,152-1,5361,152-1,536
02-4
032-64
03,456-4,608
0
Karagianes et al.(1981)
30, 2030, 20
24002400 8.3 249 19920 16.6
Iwai et al. (1997) 56, 2448, 2454, 24
537649925616 9.43.25.1
526154275 5.47041597e+14 421242

7-124
Attempts to induce significant increases in lung tumors in Syrian hamsters by inhalation
of whole DE were unsuccessful (Heinrich et al., 1982, 1986b, 1989b; Brightwell et al., 1986).
However, hamsters are considered to be relatively insensitive to lung tumor induction. For
example, while cigarette smoke, a known human carcinogen, was shown to induce laryngeal
cancer in hamsters, the lungs were relatively unaffected (Dontenwill et al., 1973).
Neither cats (Pepelko and Peirano, 1983 [see Chapter 7]) nor monkeys (Lewis et al.,
1989) developed tumors following 2-year exposure to DE. The duration of these exposures,
however, was likely to be inadequate for these two longer-lived species, and group sizes were
quite small. Exposure levels were also below the maximum tolerated dose (MTD) in the
monkey studies and, in fact, only borderline for detection of lung tumor increases in rats.
Long-term exposure to DE filtered to remove particulate matter failed to induce lung
tumors in rats (Heinrich et al., 1986b; Iwai et al., 1986b; Brightwell et al., 1989), or in Syrian
hamsters (Heinrich et al., 1986b; Brightwell, 1989). A significant increase in lung carcinomas
was reported by Heinrich et al. (1986b) in NMRI mice exposed to filtered exhaust. However, in
a more recent study the authors were unable to confirm earlier results in either NMRI or
C57BL/6N mice (Heinrich et al., 1995). Although filtered exhaust appeared to potentiate the
carcinogenic effects of DEN (Heinrich et al., 1982), because of the lack of positive data in rats
and equivocal or negative data in mice it can be concluded that filtered exhaust is either not
carcinogenic or has a low cancer potency.
Kawabata et al. (1986) demonstrated the induction of lung tumors in Fischer 344 rats
following intratracheal instillation of DPM. Rittinghausen et al. (1997) reported an increase in
cystic keratinizing epitheliomas following intratracheal instillation of rats with either original
DPM or DPM extracted to remove the organic fraction, with the unextracted particles inducing a
slightly greater effect. Grimmer et al. (1987) showed not only that an extract of DPM was
carcinogenic when instilled in the lungs of rats, but also that most of the carcinogenicity resided
in the portion containing PAHs with four to seven rings. Intratracheal instillation did not induce
lung tumors in Syrian hamsters (Kunitake et al., 1986; Ishinishi et al., 1988b).
Dermal exposure and s.c. injection in mice provided additional evidence for tumorigenic
effects of DPM. Particle extracts applied dermally to mice have been shown to induce
significant skin tumor increases in two studies (Kotin et al., 1955; Nesnow et al., 1982).
Kunitake et al. (1986) also reported a marginally significant increase in skin papillomas in ICR
mice treated with an organic extract from an HD diesel engine. Negative results were reported
by Depass et al. (1982) for skin-painting studies using mice and acetone extracts of DPM
suspensions. However, in this study the exhaust particles were collected at temperatures of 100
°C, which would minimize the condensation of vapor-phase organics and, therefore, reduce the
availability of potentially carcinogenic compounds that might normally be present on DE
particles. A significant increase in the incidence of sarcomas in female C57Bl mice was
reported by Kunitake et al. (1986) following s.c. administration of LD DPM extract at doses of

7-125
500 mg/kg. Takemoto et al. (1988) provided additional data for this study and reported an
increased tumor incidence in the mice following injection of LD engine DPM extract at doses of
100 and 500 mg/kg. Results of i.p. injection of DPM or DPM extracts in strain A mice were
generally negative (Orthoefer et al., 1981; Pepelko and Peirano, 1983), suggesting that the strain
A mouse may not be a good model for testing diesel emissions.
Results of experiments using tumor initiators such as DEN, B[a]P, DPN, or DBA
(Brightwell et al., 1986; Heinrich et al., 1986b; Takemoto et al., 1986) were generally
inconclusive regarding the tumor-promoting potential of either filtered or whole DE. A report
by Heinrich et al. (1982), however, indicated that filtered exhaust may promote the tumor-
initiating effects of DEN in hamsters.
Several reports (Wong et al., 1985; Bond et al., 1990) affirm observations of the
potential carcinogenicity of DE by providing evidence for DNA damage in rats. These findings
are discussed in more detail in Chapter 3, Section 3.6. Evidence for the mutagenicity of organic
agents present in diesel engine emissions is also provided in Chapter 4.
Evidence for the importance of the carbon core was initially provided by studies of
Kawabata et al. (1986), which showed induction of lung tumors following intratracheal
instillation of carbon black that contained no more than traces of organics, and studies of
Heinrich (1990b) that indicated that exposure via inhalation to carbon black (Printex 90)
particles induced lung tumors at concentrations similar to those effective in DPM studies.
Additional studies by Heinrich et al. (1995) and Nikula et al. (1995) confirmed the capability of
carbon particles to induce lung tumors. Induction of lung tumors by other particles of low
solubility, such as titanium dioxide (Lee et al., 1986), confirmed the capability of particles to
induce lung tumors. Pyrolyzed pitch, on the other hand, essentially lacking a carbon core but
having much higher PAH concentrations than DPM, also was effective in tumor induction
(Heinrich et al., 1986a, 1994).
The relative importance of the adsorbed organics, however, remains to be elucidated and
is of some concern because of the known carcinogenic capacity of some of these chemicals.
These include polycyclic aromatics as well as nitroaromatics, as described in Chapter 2. Organic
extracts of particles also have been shown to induce tumors in a variety of injection, intratracheal
instillation, and skin-painting studies, and Grimmer et al. (1987) have, in fact, shown that the
great majority of the carcinogenic potential following instillation resided in the fraction
containing four- to seven-ring PAHs.
In summary, based on positive inhalation studies in rats exposed to high concentrations,
intratracheal instillation studies in rats and mice exposed to high doses, and supported by
positive mutagenicity studies, the evidence for carcinogenicity of DE is considered to be
adequate in animals. The contribution of the various fractions of DE to the carcinogenic
response is less certain. Exposure to filtered exhaust generally failed to induce lung tumors.
The presence of known carcinogens adsorbed to diesel particles and the demonstrated

7-126
tumorigenicity of particle extracts in a variety of injection, instillation, and skin-painting studies
indicate a carcinogenic potential for the organic fraction. Studies showing that long-term
exposure at high concentrations of poorly soluble particles (e.g., carbon black, TiO2) can also
induce tumors, on the other hand, have provided definitive evidence that the carbon core of the
diesel particle is primarily instrumental in the carcinogenic response observed in rats under
sufficient exposure conditions. The ability of DE to induce lung tumors at non-particle-overload
conditions, and the relative contribution of the particles’ core versus the particle-associated
organics (if effects do occur at low doses) remains to be determined.
7.4. MODE OF ACTION OF DIESEL EXHAUST-INDUCED CARCINOGENESIS
As noted in Chapter 2, DE is a complex mixture that includes a vapor phase and a
particle phase. The particle phase consists of an insoluble carbon core with a large number of
organic compounds, as well as inorganic compounds such as sulfates, adsorbed to the particle
surface. Some of the semivolatile and particle-associated compounds, in particular PAHs, nitro-
PAHs, oxy-PAHs, and oxy-nitro-PAHs (Scheepers and Bos, 1992), are considered likely to be
carcinogenic in humans. The vapor phase also contains a large number of organic compounds,
including several known or probable carcinogens such as benzene and 1,3-butadiene. Because
exposure to the vapor phase alone, even at high concentrations, failed to induce lung cancer in
laboratory animals (Heinrich et al., 1986b), the mode-of-action discussion will focus on the
particulate matter phase. Additive or synergistic effects of vapor-phase components, however,
cannot be ruled out, as chronic inhalation bioassays involving exposure to diesel particles alone
have not been carried out.
Several hypotheses regarding the primary mode of action of DE have been proposed.
Initially it was generally believed that cancer was induced by particle-associated organics acting
via a genotoxic mechanism. By the late 1980s, however, studies indicated that carbon particles
virtually devoid of organics could also induce lung cancer at sufficient inhaled concentrations
(Heinrich, 1990b). This finding provided support for a hypothesis originally proposed by Vostal
(1986) that induction of lung tumors arising in rats exposed to high concentrations of DE is
related to overloading of normal lung clearance mechanisms, accumulation of particles, and cell
damage followed by regenerative cell proliferation. The action of particles is therefore mediated
by epigenetic mechanisms that can be characterized more by promotional than initiation stages
of the carcinogenic process. More recently several studies have focused upon the production of
reactive oxygen species generated from particle-associated organics, which may induce oxidative
DNA damage at exposure concentrations lower than those required to produce lung particle
overload. Because it is likely that more than one of these factors is involved in the carcinogenic
process, a key consideration is their likely relative contribution at different exposure levels. The
following discussion will therefore consider the possible relationship of the organic components
of exhaust, inflammatory responses associated with lung particle overload, reactive oxygen

7-127
species, and physical characteristics of diesel particles to cancer induction, followed by a
hypothesized mode of action, taking into account the likely contribution of the factors discussed.
7.4.1. Potential Role of Organic Exhaust Components in Lung Cancer Induction
More than 100 carcinogenic or potentially carcinogenic components have been
specifically identified in diesel emissions, including various PAHs and nitroarenes such as
1-nitropyrene (1-NP) and dinitropyrenes (DNPs). The majority of these compounds are
adsorbed to the carbon core of the particulate phase of the exhaust and, if desorbed, may become
available for biological processes such as metabolic activation to mutagens. Among such
compounds identified from DE are B[a]P, dibenz[a,h]anthracene, pyrene, chrysene, and
nitroarenes such as 1-NP, 1,3-DNP, 1,6-DNP, and 1,8-DNP, all of which are mutagenic,
carcinogenic, or implicated as procarcinogens or cocarcinogens (Stenback et al., 1976;
Weinstein and Troll, 1977; Thyssen et al., 1981; Pott and Stöber, 1983; Howard et al., 1983;
Hirose et al., 1984; Nesnow et al., 1984; El-Bayoumy et al., 1988). More recently Enya et al.
(1997) reported isolation of 3-nitrobenzanthrone, one of the most powerful direct-acting
mutagens known to date, from the organic extracts of DE.
Grimmer et al. (1987) separated DE particle extract into a water- and a lipid-soluble
fraction, and the latter was further separated into a PAH-free, a PAH-containing, and a polar
fraction by column chromatography. These fractions were then tested in Osborne-Mendel rats
by pulmonary implantation at doses corresponding to the composition of the original DE. The
water-soluble fraction did not induce tumors; the incidences induced by the lipid-soluble
fractions were 0% with the PAH-free fraction, 25% with the PAH and nitro-PAH- containing
fractions, and 0% with the polar fraction. The PAH and nitro-PAH-containing fraction,
comprising only 1% by weight of the total extract, was thus shown to be responsible for most, if
not all, of the carcinogenic activity.
Exposure of rats by inhalation to 2.6 mg/m3 of an aerosol of tar-pitch condensate with no
carbon core but containing 50 :g/m3 B[a]P along with other PAHs for 10 months induced lung
tumors in 39% of the animals. The same amount of tar-pitch vapor condensed onto the surface
of carbon black particles at 2 and 6 mg/m3 resulted in tumor rates that were roughly two times
higher (89% and 72%). Because exposure to 6 mg/m3 carbon black almost devoid of extractable
organic material induced a lung tumor rate of 18%, the combination of PAHs and particles
increases their effectiveness (Heinrich et al., 1994). Although this study shows the tumor-
inducing capability of PAHs resulting from combustion, it should be noted that the B[a]P
content in the coal-tar pitch was about three orders of magnitude greater than in diesel soot.
Moreover, because organics are present on diesel particles in a thinner layer and the particles are
quite convoluted, they may be more tightly bound and less bioavailable. Nevertheless, these
studies provide evidence supporting the involvement of organic constituents of diesel particles in
the carcinogenic process.

7-128
Exposure of humans to related combustion emissions provides some evidence for the
involvement of organic components. Mumford et al. (1989) reported greatly increased human
lung cancer mortality in Chinese communes burning so-called smoky coal, but not wood, in
unvented open-pit fires used for heating and cooking. Although particle concentrations were
similar, PAH levels were five to six times greater in the air of communes burning smoky coal.
Coke oven emissions, containing high concentrations of PAHs but lacking an insoluble carbon
core, have also been shown to be carcinogenic in humans (Lloyd, 1971).
Adsorption of PAHs to a carrier particle such as hematite, CB, aluminum, or titanium
dioxide enhances their carcinogenic potency (Farrell and Davis, 1974). As already noted,
adsorption to carbon particles greatly enhanced the tumorigenicity of pyrolyzed pitch condensate
containing B[a]P and other aromatic carcinogens (Heinrich et al., 1995). The increased
effectiveness can be partly explained by more efficient transport to the deep lung. Slow release
also enhances residence time in the lungs and prevents overwhelming of activating pathways.
As discussed in Chapter 3, free organics are likely to be rapidly absorbed into the bloodstream,
which may explain why the vapor-phase component of exhaust is relatively ineffective in the
induction of pathologic or carcinogenic effects.
Even though the organic constituents may be tightly bound to the particle surface,
significant elution is still likely because particle clearance half-times are nearly 1 year in humans
(Bohning et al., 1982). Furthermore, Gerde et al. (1991) presented a model demonstrating that
large aggregates of inert dust containing crystalline PAHs are unlikely to form at doses typical of
human exposure. This allows the particles to deposit and react with the surrounding lung
medium, without interference from other particles. Particle-associated PAHs can then be
expected to be released more rapidly from the particles. Bond et al. (1984) provided evidence
that alveolar macrophages from beagle dogs metabolized B[a]P coated on diesel particles to
proximate carcinogenic forms. Unless present on the particle surface, B[a]P is more likely to
pass directly into the bloodstream and escape activation by phagocytic cells.
The importance of DE-associated PAHs in the induction of lung cancer in humans may
be enhanced because of the possibility that the human lung is more sensitive to these compounds
than are rat lungs. Rosenkranz (1996) summarized information indicating that in humans and
mice, large proportions of lung cancers contain both mutated p53 suppressor genes and K-ras
genes. Induction of mutations in these genes by genotoxins, however, is much lower in rats than
in humans or mice.
B[a]P, although only one of many PAHs present in DE, is the one most extensively
studied. Bond et al. (1983, 1984) demonstrated metabolism of particle-associated B[a]P and
free B[a]P by alveolar macrophages (AM) and by type II alveolar cells. The respiratory tract
cytochrome P-450 systems have an even greater concentration in the nonciliated bronchiolar
cells (Boyd, 1984). It is worth noting that bronchiolar adenomas that develop following diesel
exposure have been found to resemble both Type II and nonciliated bronchiolar cells. It should

7-129
also be noted that any metabolism of procarcinogens by these latter two cell types probably
involves the preextraction of carcinogens in the extracellular lining fluid and/or other
endocytotic cells, as they are not especially important in phagocytosis of particles. Thus,
bioavailability is an important issue in assessing the relative importance of PAHs.
Additionally, a report by Borm et al. (1997) indicates that incubating rat lung epithelial-
derived cells with human polymorphonucleocytes (PMNs) (either unactivated or activated by
preexposure to phorbol myristate acetate) increases DNA adduct formation caused by exposure
to B[a]P; at 0.05 to 0.5 micromolar concentration, addition of more activated PMN in relation to
the number of lung cells further increased adduct formation in a dose-dependent manner. The
authors suggest that “an inflammatory response in the lung may increase the biologically
effective dose of PAHs, and may be relevant to data interpretation and risk assessment of PAH-
containing particles.” These data raise the possibility that DE exposure at low concentrations
may result in levels of neutrophil influx that would not necessarily be detectable via
histopathological examination as acute inflammation, but that might be effective at amplifying
any potential DE genotoxic effect.
Nitro-PAHs have also been implicated as potentially involved in diesel-exhaust-induced
lung cancer. Although the nitro-PAH fraction of diesel was less effective than PAHs in the
induction of lung cancer when implanted into the lungs of rats (Grimmer et al., 1987), in a study
of various extracts of DE particles, 30%-40% of the total mutagenicity could be attributed to a
group of six nitroarenes (Salmeen et al., 1984). Moreover, Gallagher et al. (1994) reported
results suggesting that DNA adducts are formed from nitro-PAHs present in DNA and may play
a role in the carcinogenic process. Nitroarenes, however, quantitatively represent a very small
percentage of diesel particle extract (Grimmer et al., 1987), making their role in the tumorigenic
response uncertain.
The induction of DNA adducts in humans occupationally exposed to DE indicates the
likelihood that PAHs are participating in the tumorigenic response, and that these effects can
occur at exposure levels less than those required to induce lung particle overload. Distinct
adduct patterns were found among garage workers occupationally exposed to DE when
compared with nonexposed controls (Nielsen and Autrup, 1994). Furthermore, the findings
were concordant with the adduct patterns observed in groups exposed to low concentrations of
PAHs from combustion processes. Hemminki et al. (1994) also reported significantly elevated
levels of DNA adducts in lymphocytes from garage workers with known DE exposure compared
with unexposed mechanics. Hou et al. (1995) found elevated adduct levels in bus maintenance
workers exposed to DE. Although no difference in mutant frequency was observed between the
groups, the adduct levels were significantly different (3.2 vs. 2.3 × 10⁻⁸). Nielsen et al. (1996b)
measured three biomarkers in DE-exposed bus garage workers: lymphocyte DNA adducts,
hydroxyethylvaline adducts in hemoglobin, and 1-hydroxypyrene in urine. Significantly
increased levels were reported for all three. Qu et al. (1996) detected increased adduct levels, as

7-130
well as increases in some individual adducts, in the blood of underground coal miners exposed to
DE.
7.4.2. Role of Inflammatory Cytokines and Proteolytic Enzymes in the Induction of Lung
Cancer in Rats by Diesel Exhaust
It is well recognized that the deposition of particles in the lung can result in the efflux of
PMNs from the vascular compartment into the alveolar space compartment in addition to
expanding the AM population size. Following acute exposures, the influx of the PMNs is
transient, lasting only a few days (Adamson and Bowden, 1978; Bowden and Adamson, 1978;
Lehnert et al., 1988). During chronic exposure the numbers of PMNs lavaged from the lungs of
diesel-exposed rats generally increased with increasing exposure duration and inhaled DPM
concentration (Strom, 1984). Strom (1984) also found that PMNs in diesel-exposed lungs
remained persistently elevated for at least 4 months after cessation of exposure, a potential
mechanism that may be related to an ongoing release of phagocytized particles. Evidence in
support of this possibility was reported by Lehnert et al. (1989) in a study in which rats were
intratracheally instilled with 0.85, 1.06, or 3.6 mg of polystyrene particles. The PMNs were not
found to be abnormally abundant during the clearance of the two lower lung burdens, but they
became progressively elevated in the lungs of the animals in which alveolar-phase clearance was
inhibited. Moreover, the particle burdens in the PMNs became progressively greater over time.
Such findings are consistent with an ongoing particle relapse process, in which particles released
by dying phagocytes are ingested by new ones.
The inflammatory response, characterized by efflux of PMNs from the vascular
compartment, is mediated by inflammatory chemokines. Driscoll et al. (1996) reported that
inhalation of high concentrations of carbon black stimulated the release of macrophage
inflammatory protein 2 (MIP-2) and monocyte chemotactic protein 1 (MCP-1). They also
reported a concomitant increase in hprt mutants. In a following study it was shown that particle
exposure stimulates production of tumor necrosis factor TNF-", an agent capable of activating
expression of several proteins that promote both adhesion of leucocytes and chemotaxis (Driscoll
et al., 1997a). In addition, alveolar macrophages also have the ability to release several other
effector molecules or cytokines that can regulate numerous functions of other lung cells,
including their rates of proliferation (Bitterman et al., 1983; Jordana et al., 1988; Driscoll et al.,
1996).
Another characteristic of AMs and PMNs under particle overload conditions is the
release of a variety of potentially destructive hydrolytic enzymes, a process known to occur
simultaneously with the phagocytosis of particles (Sandusky et al., 1977). The essentially
continual release of such enzymes during chronic particle deposition and phagocytosis in the
lung may be detrimental to the alveolar epithelium, especially to Type I cells. Evans et al.
(1986) showed that injury to Type I cells is followed shortly thereafter by a proliferation of Type

7-131
II cells. Type II cell hyperplasia is a common feature observed in animals that have received
high lung burdens of various types of particles, including unreactive polystyrene microspheres.
Exaggerated proliferation as a repair or defensive response to DPM deposition may have the
effect of amplifying the likelihood of neoplastic transformation in the presence of carcinogens
beyond that which would normally occur with lower rates of proliferation, assuming an increase
in the cycling of target cells and the probability of a neoplastic-associated genomic disturbance.
7.4.3. Role of Reactive Oxygen Species in Lung Cancer Induction by Diesel Exhaust
Phagocytes from a variety of rodent species produce elevated levels of oxidant reactants
in response to challenges, with the physiochemical characteristics of a phagocytized particle
being a major factor in determining the magnitude of the oxidant-producing response. Active
oxygen species released by the macrophages and lymphatic cells can cause lipid peroxidation in
the membrane of lung epithelial cells. These lipid peroxidation products can initiate a cascade of
oxygen free radicals that progress through the cell to the nucleus, where they damage DNA. If
this damage occurs during the epithelial cell’s period of DNA synthesis, there is some
probability that the DNA will be replicated unrepaired (Lechner and Mauderly, 1994). The
generation of reactive oxygen species by both AMs and PMNs should therefore be considered as
one potential factor of what probably is a multistep process that culminates in the development
of lung tumors in response to chronic deposition of DPM.
Even though products of phagocytic oxidative metabolism, including superoxide anions,
hydrogen peroxide, and hydroxyl radicals, can kill tumor cells (Klebanoff and Clark, 1978), and
the reactive oxygen species can peroxidize lipids to produce cytotoxic metabolites such as
malonyldialdehyde, some products of oxidative metabolism apparently can also interact with
DNA to produce mutations. Cellular DNA is damaged by oxygen free radicals generated from a
variety of sources (Ames, 1983; Trotter, 1980). Along this line, Weitzman and Stossel (1981)
found that human peripheral leukocytes are mutagenic in the Ames assay. This mutagenic
activity was related to PMNs and blood monocytes; blood lymphocytes alone were not
mutagenic. These investigators speculated that the mutagenic activity of the phagocytes was a
result of their ability to produce reactive oxygen metabolites, inasmuch as blood leukocytes from
a patient with chronic granulomatous diseases, in which neutrophils have a defect in the
NADPH oxidase generating system (Klebanoff and Clark, 1978), were less effective in
producing mutations than were normal leukocytes. Of related significance, Phillips et al. (1984)
demonstrated that the incubation of Chinese hamster ovary cells with xanthine plus xanthine
oxidase (a system for enzymatically generating active oxygen species) resulted in genetic
damage hallmarked by extensive chromosomal breakage and sister chromatid exchange and
produced an increase in the frequency of thioguanidine-resistant cells (HGPRT test). Aside from
interactions of oxygen species with DNA, increasing evidence also points to an important role of

7-132
phagocyte-derived oxidants and/or oxidant products in the metabolic activation of
procarcinogens to their ultimate carcinogenic form (Kensler et al., 1987).
Driscoll et al. (1997b) have demonstrated that exposure to doses of particles producing
significant neutrophilic inflammation are associated with increased mutation in rat alveolar type
II cells. The ability of particle-elicited macrophages and neutrophils to exert a mutagenic effect
on epithelial cells in vitro supports a role for these inflammatory cells for the in vivo mutagenic
effects of particle exposure. The inhibition of bronchoalveolar lavage cell-induced mutations by
catalase implies a role for cell-derived oxidants in this response.
Hatch and co-workers (1980) have demonstrated that interactions of guinea pig AMs
with a wide variety of particles, such as silica, metal oxide-coated fly ash,
polymethylmethacrylate beads, chrysotile asbestos, fugitive dusts, polybead carboxylate
microspheres, glass and latex beads, uncoated fly ash, and fiberglass increase the production of
reactive oxygen species. Similar findings have been reported by numerous investigators for
human, rabbit, mouse, and guinea pig AMs (Drath and Karnovsky, 1975; Allen and Loose,
1976; Beall et al., 1977; Lowrie and Aber, 1977; Miles et al., 1977; Rister and Baehner, 1977;
Hoidal et al., 1978). PMNs are also known to increase production of superoxide radicals,
hydrogen peroxide, and hydroxyl radicals in response to membrane-reactive agents and particles
(Goldstein et al., 1975; Weiss et al., 1978; Root and Metcalf, 1977). Although these responses
may occur at any concentration, they are likely to be greatly enhanced at high exposure
concentrations with slowed clearance and lung particle overload.
Reactive oxygen species can also be generated from particle-associated organics. Sagai
et al. (1993) reported that DPM can nonenzymatically generate active oxygen species (e.g.,
superoxide [O2-] and hydroxyl radical [.OH] in vitro without any biologically activating systems)
such as microsomes, macrophages, hydrogen peroxide, or cysteine. Because DPM washed with
methanol could no longer produce these radicals, it was concluded that the active components
were compounds extractable with organic solvents. However, the nonenzymatic contribution to
the DPM-promoted active oxygen production was negligible compared with that generated via
an enzymatic route (Ichinose et al., 1997a). They reported that O2- and .OH can be
enzymatically generated from DPM by the following process. Soot-associated quinone-like
compounds are reduced to the semiquinone radical by cytochrome P-450 reductase. These
semiquinone radicals then reduce O2 to O2-, and the produced superoxide reduces ferric ions to
ferrous ions, which catalyzes the homobiotic cleavage of H2O2 dismutated from O2 by
superoxide dismutase or spontaneous reactions to produce .OH. According to Kumagai et al.
(1997), while quinones are likely to be the favored substrates for this reaction, the participation
of nitroaromatics cannot be ruled out.
One of the critical lesions to DNA bases generated by oxygen free radicals is 8-
hydroxydeoxyguanosine (8-OHdG). The accumulation of 8-OhdG as a marker of oxidative
DNA damage could be an important factor in enhancing the mutation rate leading to lung cancer

7-133
(Ichinose et al., 1997a). For example, formation of 8-OHdG adducts leads to G:C to T:A
transversions unless repaired prior to replication. Nagashima et al. (1995) demonstrated that the
production of (8-OHdG) is induced in mouse lungs by intratracheal instillation of DPM.
Ichinose et al. (1997b) reported further that although intratracheal instillation of DPM in mice
induced a significant increase in lung tumor incidence, comparable increases were not reported
when mice were instilled with extracted DPM (to remove organics). Lung injury was also less
in the mice instilled with extracted DPM. Moreover, increases in 8-OHdG in the mice instilled
with unextracted DPM correlated very well with increases in tumor rates. In a related study,
Ichinose et al. (1997a) intratracheally instilled small doses of DPM, 0.05, 0.1, or 0.2 mg weekly
for 3 weeks, in mice fed standard or high-fat diets either with or without $-carotene. High
dietary fat enhanced DPM-induced lung tumor incidence, whereas $-carotene, which may act as
a free radical scavenger, partially reduced the tumorigenic response. Formation of 8-OHdG was
again significantly correlated with lung tumor incidence in these studies, except at the highest
dose. Dasenbrock et al. (1996) reported that extracted DPM, intratracheally instilled into rats
(15 mg total dose) induced only marginal increases in lung tumor induction, while unextracted
DPM was considerably more effective. Although adducts were not measured in this study, it
nevertheless provides support for the likelihood that activation of organic metabolites and/or
generation of oxygen free radicals from organics are involved in the carcinogenic process.
Additional support for the involvement of particle-associated radicals in tissue damage
was provided by the finding that pretreatment with superoxide dismutase (SOD), an antioxidant,
markedly reduced lung injury and death due to instillation of DPM. Similarly, Hirafuji et al.
(1995) found that the antioxidants catalase, deferoxamine, and MK-447 inhibited the toxic
effects of DPM on guinea pig tracheal cells and tissues in vitro.
Although the data presented supported the hypothesis that generation of reactive oxygen
species resulting from exposure to DPM is involved in the carcinogenic process, it should be
noted that 8-OHdG is efficiently repaired and that definitive proof of a causal relationship in
humans is still lacking. It is also uncertain whether superoxide or hydroxyl radicals chemically
generated by DPM alone promote 8-OHdG production in vivo and induce lung toxicity, because
SOD is extensively located in mammalian tissues. Nevertheless, demonstration that oxygen free
radicals can be generated from particle-associated organics, that their presence will induce
adduct formation and DNA damage unless repaired, that tumor induction in experimental
animals correlates with OhdG adducts, and that treatment with antioxidant limits lung damage,
provides strong support for the involvement of oxygen free radicals in the toxicologic and
carcinogenic response to DE.
7.4.4. Relationship of Physical Characteristics of Particles to Cancer Induction
The biological potential of inhaled particles is strongly influenced by surface chemistry
and character. For example, the presence of trace metal compounds such as aluminum and iron,
as well as ionized or protonated sites, is important in this regard (Langer and Nolan, 1994). A
7-134
major factor is specific surface area (surface area/mg). PMNs characteristically are increased
abnormally in the lung by DE exposure, but their presence in the lungs does not appear to be
excessive following the pulmonary deposition of even high lung burdens of spherical TiO2
particles in the 1-2 :m diameter range (Strom, 1984). In these studies lung tumors were
detected only at an inhaled concentration of 250 :g/m3. In a more recent study in which rats
were exposed to TiO2 in the 15-40 nm size range, inhibition of particle clearance and
tumorigenesis were induced at concentrations of 10 mg/m3 (Heinrich et al., 1995). Comparison
of several chronic inhalation studies correlating particle mass and particle surface area retained
in the lung with tumor incidence indicated that particle surface area is a much better dosimeter
than particle mass (Oberdörster and Yu, 1990; Driscoll et al., 1996). Heinrich et al. (1995) also
found that lung tumor rates increased with specific particle surface area following exposure to
DE, carbon black, or titanium dioxide, irrespective of particle type. Langer and Nolan (1994)
reported that the hemolytic potential of Min-U-Sil15, a silica flour, increased in direct
relationship to specific surface area at nominal particle diameters ranging from 0.5 to 20 :m.
Ultrafine particles appear to be more likely to be taken up by lung epithelial cells. Riebe-
Imre et al. (1994) reported that CB is taken up by lung epithelial cells in vitro, inducing
chromosomal damage and disruption of the cytoskeleton, lesions that closely resemble those
present in tumor cells. Johnson et al. (1993) reported that 20-nm polytetrafluoroethylene
particles are taken up by pulmonary epithelial cells as well as polymorphonuclear leucocytes,
inducing an approximate 4-, 8-, and 40-fold increase in the release of interleukin-1 alpha and
beta, inducible nitric oxide synthetase, and macrophage inflammatory protein, respectively.
The carcinogenic potency of diesel particles, therefore, appears to be related, at least to
some extent, to their small size and convoluted shape, which results in a large specific particle
surface area. Toxicity and carcinogenicity increased with decreasing particle size into the
submicron range. For example, Heinrich et al. (1995) have shown that ultrafine titanium dioxide
(approximately 0.2 :m diameter) is much more toxic than particles with a 10-fold greater
diameter of the same composition used in an earlier study by Lee et al. (1986). This increase in
toxicity has been noted with even smaller particles. For example, carbon black particles 20 nm
in diameter were shown to be significantly more toxic than 50 nm particles (Murphy et al.,
1999). The relationship between particle size and toxicity is of concern because, as noted in
Chapter 2, approximately 50%-90% of the number of particles in DE are in the size range from
5 to 50 nm. Other than disruption of the cytoskeleton of epithelial cells, there is little
information regarding the means by which particle size influences carcinogenicity as well as
noncancer toxicity.
7-135
7.4.5. Integrative Hypothesis for Diesel-Induced Lung Cancer
The induction of lung cancer in rats by large doses of carbon black via inhalation
(Heinrich et al., 1995; Mauderly et al., 1991; Nikula et al., 1995) or intratracheal instillation
(Kawabata et al., 1994; Pott et al., 1994; Dasenbrock et al., 1996) led to the development of the
lung particle overload hypothesis. According to this hypothesis the induction of neoplasia by
insoluble low- toxicity particles is associated with an inhibition of lung particle clearance and the
involvement of persistent alveolar epithelial hyperplasia. Driscoll (1995), Driscoll et al. (1996),
and Oberdörster and Yu (1990) outlined a proposed mechanism for the carcinogenicity of DE at
high doses that emphasizes the role of phagocytic cells. Following exposure, phagocytosis of
particles acts as a stimulant for oxidant production and inflammatory cytokine release by lung
phagocytes. It was hypothesized that at high particle exposure concentrations the quantity of
mediators released by particle-stimulated phagocytes exceeds the inflammatory defenses of the
lung (e.g., antioxidants, oxidant-metabolizing enzymes, protease inhibitors, cytokine inhibitors),
resulting in tissue injury and inflammation. With continued particle exposure and/or the
persistence of excessive particle burdens, there then develops an environment of phagocytic
activation, excessive mediator release-tissue injury and, consequently, more tissue injury,
inflammation, and tissue release. This is accompanied by cell proliferation. As discussed in a
review by Cohen and Ellwein (1991), conceptually, cell proliferation can increase the likelihood
that any oxidant-induced or spontaneously occurring genetic damage becomes fixed in a
dividing cell and is clonally expanded. The net result of chronic particle exposures sufficient to
elicit inflammation and cell proliferation in the rat lung is an increased probability that the
genetic changes necessary for neoplastic transformation will occur. A schematic of this
hypothesis has been outlined by McClellan (1997) (see Figure 7-3). In support of this
hypothesis, it was reported that concentrations of inhaled CB resulted in increased cytokine
expression and inflammatory influx of neutrophils (Oberdörster et al., 1995), increased
formation of 8-OhdG (Ichinose et al., 1997b), and increase in the yield of hprt mutants, an effect
ameliorated by treatment with antioxidants (Driscoll, 1995; Driscoll et al., 1996). Metabolism
of carcinogenic organics to active forms as well as the generation of reactive oxygen species
from certain organic species are likely to contribute to the toxic and carcinogenic process.
At low exposure concentrations, the lung particle overload condition is not present and
the overload-induced inflammatory effects are not present. Note, however, as discussed in
Chapters 5 and 6, that other types of inflammation are present in the rat lung at exposures below
those inducing lung particle overload. However, at low exposures, activation of organic
carcinogens and generation of oxidants from the organic fraction can still be expected. Actual
contribution depends upon elution/bioavailability and the effectiveness of antioxidants. Direct
effects of ultrafine diesel particles taken up by epithelial cells are also likely to play a role.
Although high-dose induction of cancer is logically explained by this hypothesis, particle
overload has not been clearly shown to induce lung cancer in other species. As noted in the
quantitative chapter, the relevance of the rat pulmonary response is therefore problematic. The
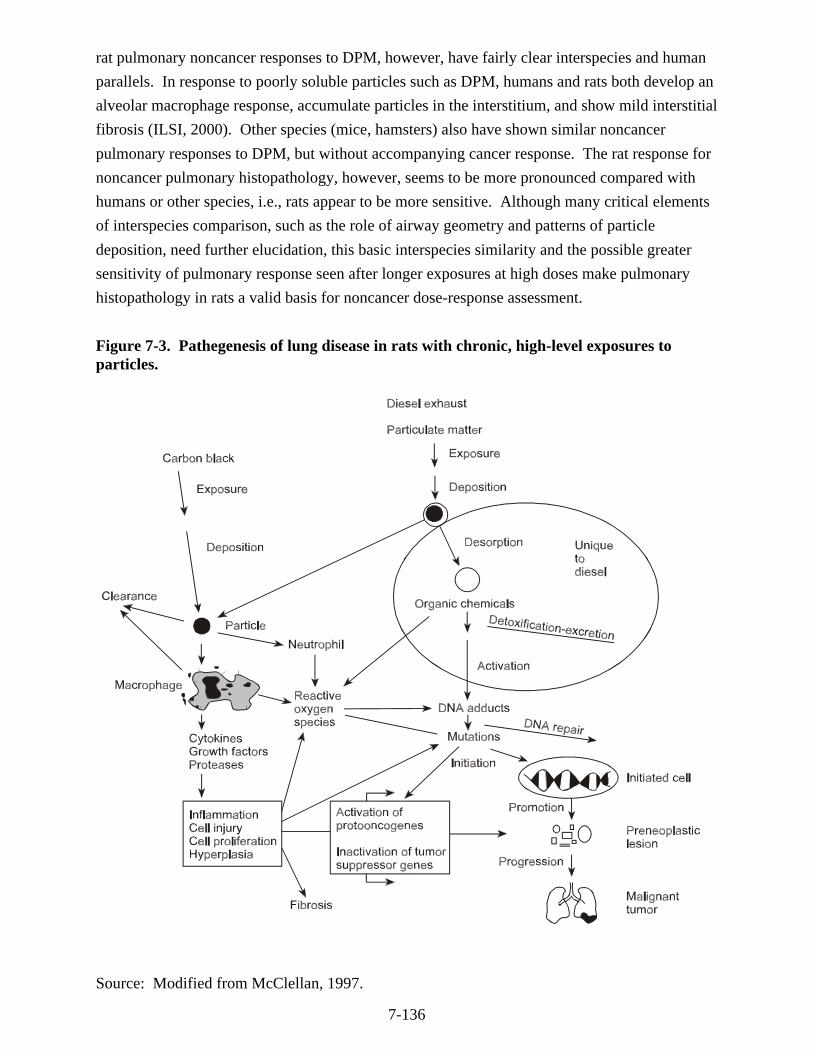
7-136
rat pulmonary noncancer responses to DPM, however, have fairly clear interspecies and human
parallels. In response to poorly soluble particles such as DPM, humans and rats both develop an
alveolar macrophage response, accumulate particles in the interstitium, and show mild interstitial
fibrosis (ILSI, 2000). Other species (mice, hamsters) also have shown similar noncancer
pulmonary responses to DPM, but without accompanying cancer response. The rat response for
noncancer pulmonary histopathology, however, seems to be more pronounced compared with
humans or other species, i.e., rats appear to be more sensitive. Although many critical elements
of interspecies comparison, such as the role of airway geometry and patterns of particle
deposition, need further elucidation, this basic interspecies similarity and the possible greater
sensitivity of pulmonary response seen after longer exposures at high doses make pulmonary
histopathology in rats a valid basis for noncancer dose-response assessment.
Figure 7-3. Pathegenesis of lung disease in rats with chronic, high-level exposures toparticles.
Source: Modified from McClellan, 1997.

7-137
7.4.6. Summary
Recent studies have shown rat lung tumor rates resulting from exposures to nearly
organic-free carbon black (CB) particles at high concentrations to be similar to those observed
for DE exposures, thus providing strong evidence for a particle overload mechanism for DE-
induced pulmonary carcinogenesis in rats. Such a mechanism is also supported by the fact that
carbon particles per se cause inflammatory responses and increased epithelial cell proliferation
and that AM function may be compromised under conditions of particle overload.
The particle overload hypothesis appears sufficient to account for DE-induced lung
cancer in rats. However, there is also biological plausibility for lung cancer induction in humans
at concentrations insufficient to induce lung particle overload as seen in rats (Chapter 3, Section
3.4 and ILSI, 2000). The uptake of particles by epithelial cells at ambient or occupational
exposure levels, DNA damage resulting from oxygen-free radicals generated from organic
molecules, and the gradual in situ extraction and activation of procarcinogens associated with the
diesel particles may play a role in this response and provide a basis for the plausibility. The
slower particle clearance rates in humans (up to a year or more) may result in greater extraction
of organics. This is supported by reports of increased DNA adducts in humans occupationally
exposed to DE at concentrations unlikely to induce lung particle overload. Although these
modes of action can be expected to function at lung overload conditions also, they are likely to
be overwhelmed by inflammatory associated effects.
The evidence to date indicates that caution must be exercised in extrapolating
observations made in animal models to humans when assessing the potential for DE-induced
pulmonary carcinogenesis. The carcinogenic response and the formation of DNA adducts in rats
exposed to DE and other particles at high exposure concentrations may be species-specific and
not DPM specific. The likelihood that different modes of action predominate at high and low
doses, such as lung particle overload, also renders high-dose extrapolation to lower ambient
concentrations uncertain.
7.5. WEIGHT-OF-EVIDENCE EVALUATION FOR POTENTIAL HUMAN
CARCINOGENICITY
A carcinogenicity weight-of-evidence evaluation is a synthesis of all pertinent
information addressing the question of how likely an agent is to be a human carcinogen. EPA’s
1986 Guidelines for Carcinogen Risk Assessment (U.S. EPA, 1986) provide a classification
system for the characterization of the overall weight of evidence for potential human
carcinogenicity based on human evidence, animal evidence, and other supportive data. This
system includes Group A: Human Carcinogen; Group B: Probable Human Carcinogen; Group
C: Possible Human Carcinogen; Group D: Not Classifiable as to Human Carcinogenicity; and
Group E: Evidence for Noncarcinogenicity to Humans.
7-138
As part of the guidelines development and updating process, the Agency has developed
revisions to the 1986 guidelines to take into account knowledge gained in recent years about the
carcinogenic processes. With regard to the weight-of-evidence evaluation for potential human
carcinogenicity, EPA’s 1996 Proposed Guidelines for Carcinogen Risk Assessment (U.S. EPA,
1996b) and the subsequent revised external review draft (U.S. EPA, 1999) emphasize the need
for characterizing cancer hazard, in addition to hazard identification. To express the weight of
evidence for potential human carcinogenicity, EPA’s proposed 1996 and 1999 guidelines utilize
a hazard narrative in place of the 1986 A-E classification system. In order to provide some
measure of consistency in using the 1996 and 1999 draft guidelines, standard hazard descriptors
are used as part of the hazard narrative. The revised guidelines also stress the importance of
considering the mode(s) of action information for making an inference about potential cancer
hazard beyond the range of observation, typically encountered at levels of exposure in the
general environment. “Mode of action” refers to a series of key biological events and processes
that are critical to the development of cancer. This is contrasted with “mechanisms of action,”
which is defined as a more detailed description of the complete sequence of biological events at
the molecular level that must occur to produce a carcinogenic response.
The sections to follow evaluate and weigh the individual lines of evidence and combine
all evidence to make an informed judgment about the carcinogenicity hazard of DE. A
conclusion in accordance with EPA’s 1986 classification system (U.S. EPA, 1986) is provided,
as well as a hazard narrative along with appropriate hazard descriptors according to EPA’s
Proposed Guidelines (U.S. EPA, 1996b, 1999). These sections draw on information reviewed in
Chapters 2, 3, 4, and 7.
7.5.1. Human Evidence
Twenty-two epidemiologic studies about the carcinogenicity of workers exposed to DE
in various occupations are reviewed in Section 7.2. Exposure to DE has typically been inferred
based on job classification within an industry. Increased lung cancer risk, although not always
statistically significant, has been observed in 8 out of 10 cohort and 10 of 12 case-control studies
within several industries, including railroad workers, truck drivers, heavy equipment operators,
and professional drivers. The increased lung cancer relative risks generally range from 1.2 to
1.5, though a few studies show relative risks as high as 2.6. Statistically significant increases in
pooled relative risk estimates (1.33 to 1.47) from two independent meta-analyses further support
a positive relationship between DE exposure and lung cancer in a variety of DE-exposed
occupations.
The generally small increased lung cancer relative risk (less than 2) observed in the
epidemiologic studies and meta-analyses potentially weakens the evidence of causality. When a
relative risk is less than 2, if confounders (e.g., smoking, asbestos exposure) are having an effect
on the observed risk increases, it could be enough to account for the increased risk. With the

7-139
strongest risk factor for lung cancer being smoking, there is a concern that smoking effects may
be influencing the magnitude of the observed increased relative risks. However, in studies for
which the effects of smoking were accounted for, increased relative risks for lung cancer
prevailed. Though some studies did not have information on smoking, significant confounding
by smoking is unlikely because the comparison populations were from the same socioeconomic
class. Moreover, when the meta-analysis focused only on the smoking-controlled studies, the
relative risks tended to increase.
As evaluated in Section 7.2.4.5, application of the criteria for causality (including the
biological plausibility) leads to the conclusion that the increased risks observed in available
epidemiologic studies are consistent with a causal association between exposure to DE and
occurrence of lung cancer. Overall, the human evidence for potential carcinogenicity for DE is
judged to be strong, but less than sufficient for DE to be considered as a human carcinogen
because of exposure uncertainties (lack of historical exposure data for workers exposed to DE)
and an inability to reach a fully and direct accounting for all possible confounders.
7.5.2. Animal Evidence
DE and its organic constituents, both in the gaseous and particle phase, have been
extensively tested for carcinogenicity in many experimental studies using several animal species
and with different modes of administration.
Several well-conducted lifetime rat inhalation studies have consistently demonstrated that
chronic inhalation exposure to sufficiently high concentrations of DE produced dose-related
increases in lung tumors (benign and malignant). However, the lung cancer responses in rats
from high-concentration exposures appear to be mediated by impairment of lung clearance
mechanisms through particle overload, resulting in persistent chronic inflammation and
subsequent pathologic and neoplastic changes in the lung. Overload conditions are not expected
to occur in humans as a result of environmental or most occupational exposures to DE. Thus,
the rat lung tumor response is not considered relevant to an evaluation of the potential for a
human environmental exposure-related hazard (Section 7.4).
The chronic inhalation studies of DE in mice showed equivocal results, whereas negative
findings were consistently seen in hamsters. The gaseous phase of DE (filtered exhaust without
particulate fraction) was found not to be carcinogenic in rats, mice, or hamsters.
In several intratracheal instillation studies, diesel particulate matter (DPM), carbon black,
and the organic DPM extracts which were virtually devoid of PAHs, have been found to produce
increased lung tumors in rats. When directly implanted into the rat lung, DPM condensate
containing mainly four- to seven-ring PAHs induced increases in lung tumors. In several dermal
studies in mice, DPM extracts have also been shown to cause skin tumors and sarcomas in mice
following subcutaneous injection.
7-140
Available data and hypotheses suggest that both the carbon core and the adsorbed
organics have potential roles in inducing lung tumors in the rat, although their relative
contribution to the carcinogenic response remains to be determined.
The consistent findings of carcinogenic activity by DPM and the organic extracts of
DPM in noninhalation studies (intratracheal instillation, lung implantation, skin painting)
contribute to the overall evidence for a human hazard potential for DE. The lack of a tumor
response from traditional animal inhalation studies in other rodent species is noted. Without
understanding the mode(s) of action of DE’s carcinogenicity in humans it is difficult to assess
the meaning of nonpositive results from the mouse and hamster inhalation bioassays, and the
unusable results from the rat, while having other evidence of carcinogenic potential and
plausibility.
It should be noted that the animal studies used DE from engines available in the 1980s,
and that present-day engine emissions have different characteristics (e.g., higher elemental
carbon content and lesser amounts of adsorbed organics on the carbon particles), with uncertain
impact on the outcome of the experimental studies. The same point can be made for the
occupational epidemiologic studies.
7.5.3. Other Key Data
Other key data are judged to be supportive of potential carcinogenicity of DE. As
discussed in Chapter 2, DE is a complex mixture of hundreds of constituents in either gaseous
phase or particle phase. Although present in small amounts, several organic compounds in the
gaseous phase (e.g. PAHs, formaldehyde, acetaldehyde, benzene, 1,3-butadiene) are known to
exhibit mutagenic and/or carcinogenic activities. PAHs and PAH derivatives, including nitro-
PAHs, present on the diesel particle are also known to be mutagenic and carcinogenic. As
reviewed in Chapter 4, DPM and DPM organic extracts have been shown to induce gene
mutations in a variety of bacteria and mammalian cell test systems. In addition, DE, DPM and
DPM extracts have been found to cause chromosomal aberrations, aneuploidy, and sister
chromatid exchange in both in vivo and in vitro tests.
There is also suggestive evidence for the bioavailability of the organics from DE
(Chapter 3, Section3.5). Elevated levels of DNA adducts in lymphocytes have been reported in
workers exposed to DE. In addition, animal studies showed that some of the radiolabeled
organic compounds are eluted from DE particles following deposition in the lungs.
7.5.4. Mode of Action
As discussed in Section 7.4, the modes of action of DE-induced carcinogenicity in
humans is not understood. It can be suggested that one or multiple modes of action may be
involved. These may include: (a) mutagenic and genotoxic events (e.g., direct and indirect
effects on DNA and effects on chromosomes) by organic compounds in the gaseous and particle

7-141
phases; (b) indirect DNA damage via the production of reactive oxygen species (ROS) induced
by particle-associated organics; and (c) particle-induced chronic inflammatory response leading
to oxidative DNA damage through the release of cytokines, ROS, etc., and an increase in cell
proliferation.
The particulate phase or whole DE exposure, as measured by DPM, appears to have the
greatest observable contribution to the carcinogenic effects, and both the particle core and the
associated organic compounds have demonstrated carcinogenic properties, although a role for
the gas-phase components cannot be ruled out. The carcinogenic activity of DE may also be
related to the small size of the particles. Moreover, the relative contribution of the possible
mode(s) of action may be different at different exposure levels. For example, available evidence
from rat studies indicates the importance of the role of the DPM in mediating lung tumor
response at high exposure levels. Thus, the role of the adsorbed organic compounds may take on
increasing importance at lower exposure levels.
7.5.5. Characterization of Overall Weight of Evidence: EPA’s 1986 Guidelines for
Carcinogen Risk Assessment
The totality of evidence supports the conclusion that DE is a probable human carcinogen
(Group B1). This conclusion is based on:
• “Limited”evidence (i.e., strong but less than sufficient evidence for “known
human carcinogen”), for a causal association between DE exposure and increased
risk of lung cancer among workers in different occupations;
• Evidence of carcinogenicity of DPM in rats and mice by noninhalation routes of
exposure (intratracheal instillation, lung implantation, skin painting, and
subcutaneous injection); and
• Extensive supporting data including the demonstrated mutagenic and/or
chromosomal effects of DE and its organic constituents, suggestive evidence for
the bioavailability of the organics from DE, and knowledge of the known
mutagenic and/or carcinogenic activity of a number of individual organic
compounds present on the particles (e.g,. PAH and derivatives) and in the DE
gases (e.g., benzene, 1,3-butadiene, and aldehydes).

7-142
7.5.6. Weight-of-Evidence Hazard Narrative: EPA’s Proposed Guidelines for Carcinogen
Risk Assessment (1996b, 1999)
The combined evidence supports the conclusion that DE is likely to be carcinogenic to
humans by inhalation and that this hazard applies to environmental exposure conditions. The
spectrum of evidence and the inferences drawn provide a substantial case for this hazard
potential. The weight of evidence of human carcinogenicity is based on:
• Strong but less than sufficient epidemiologic evidence for a causal association
between DE exposure and increased risk of lung cancer among workers in
different occupations;
• Evidence of carcinogenicity of DPM in rats and mice by noninhalation routes of
exposure (intratracheal instillation, lung implantation, skin painting, and
subcutaneous injection); and
• Extensive supporting data including the demonstrated mutagenic and/or
chromosomal effects of DE and its organic constituents, suggestive evidence for
the local and systemic bioavailability of the organics from DE, and knowledge of
the known mutagenic and/or carcinogenic activity of a number of individual
organic compounds present on the particles (e.g., PAH and derivatives) and in the
DE gases (e.g., benzene, 1,3 butadiene, and aldehydes).
The weight-of-evidence for the lung cancer hazard is considered strong, even though
inferences and uncertainties are involved. Major uncertainties include:
• There is scientific debate about the significance of the occupational epidemiologic
evidence for a causal association between occupational exposure and increased
lung cancer risk. Some experts view the evidence as weak given that most of the
relative risk increases are <2.0, whereas others consider the evidence as more than
adequate and compelling. With relatively low relative risks (<2.0), the effects of
possible confounding exposures or other factors could play a significant role in
the risk increases. For example, there is specific concern about whether the
effects of smoking, a known cause of lung cancer, has been adequately or fully
accounted for in the key studies. In more general terms, the lack of historical
exposure data to retrospectively validate estimated DE exposure levels is also a
limitation.
• A lack of knowledge about the mode(s) of action of DE lung cancer in humans
results in the use of a number of default risk assessment assumptions which, while
justifiable by evidence or policy choice, introduce uncertainty. To date, available
evidence for the role of DPM, both the adsorbed organics and the carbon core

7-143
particle, has been shown only for high exposure conditions in the rat lung. The
tumor inducing mode-of-action in the rat lung appears to depend on particle
overloading of the lung and subsequent pathology. This sequence is judged not to
be relevant for assessing the hazard to humans exposed in the ambient
environment. There is virtually no information about the relative role of DE
constituents in mediating the carcinogenic effects at lower experimental exposure
levels, though hypotheses exist.
While a major uncertainty relates to the incomplete understanding of DE’s mode(s) of
action for the induction of lung cancer in humans, available data and hypotheses suggest that
DE-induced lung carcinogenicity may be mediated by mutagenic and nonmutagenic events from
both the particles and the associated organic compounds, although a role for the organics in the
gaseous phase cannot be ruled out. Given that there is some evidence for a mutagenic mode of
action, a cancer hazard is presumed at environmental exposure levels. This is consistent with
EPA’s science policy position, which assumes a nonthreshold effect for carcinogens in the
absence of definitive data demonstrating a nonlinear or threshold mechanism. It should also be
noted that there are not orders of magnitude differences between lower level occupational and
higher end environmental exposure levels, in fact, there appears to be exposure overlap. This
observation means that an extrapolation of the occupational hazard to lower environmental
exposure levels is minimal, and thus, the conclusion of an environmental hazard is supported.
Given these circumstances, linear low-dose extrapolation also would be an appropriate default
choice in dose-response assessment that is focused on environmental levels of exposure (Chapter
8, Section 8.2). Because of insufficient information, the human carcinogenic potential of DE by
oral and dermal exposures cannot be determined.
7.6. EVALUATIONS BY OTHER ORGANIZATIONS
Several organizations have reviewed the relevant data and evaluated the potential human
carcinogenicity of DE or its particulate component. The conclusions reached by these
organizations are generally comparable to the evaluation made in this assessment using EPA’s
Carcinogen Risk Assessment Guidelines. A summary of available evaluations conducted by
other organizations is provided in Table 7-9.
7.7. CONCLUSION
It is concluded that environmental exposure to DE may present a lung cancer hazard to
humans. The particulate phase appears to have the greatest contribution to the carcinogenic
effect, both the particle core and the associated organic compounds have demonstrated

7-144
Table 7-9. Evaluations of DE as to human carcinogenic potential
Organization Human data Animal data Overallevaluation
NIOSH (1988) Limited Confirmatory Potential occupationalcarcinogen
IARC (1989) Limited Sufficient Probably carcinogenic tohumans
IPCS (1996) N/Aa N/A Probably carcinogenic tohumans
California EPA (1998) “Consistent evidence fora causal association”
“Demonstratedcarcinogenicity”
DPM as a “toxic aircontaminant” (CaliforniaAir Resources Board)
NTP (2000) “Elevated lung cancer inoccupationally exposedgroups”
“Supporting animal andmechanistic data”
DPM-Reasonablyanticipated to be acarcinogen
aNot applicable.
carcinogenic properties, although a role for the DE gas-phase components cannot be ruled out.
Using either EPA’s 1986 Guidelines for Carcinogen Risk Assessment (U.S. EPA, 1986) or the
proposed revisions (U.S. EPA, 1996b, 1999), DE is judged to be a probable human carcinogen,
or likely to be carcinogenic to humans by inhalation, respectively. The weight of evidence for
potential human carcinogenicity for DE is considered strong, even though inferences are
involved in the overall assessment. Major uncertainties of the hazard assessment include the
following unresolved issues:
• There has been a considerable scientific debate about the significance of the
available human evidence for a causal association between occupational exposure
and increased lung cancer risk. Some experts view the evidence as weak given
that most of the relative risk increases are <2.0 whereas others consider the
evidence as more than adequate and compelling. Additionally, there is debate
about whether the effects of smoking have been adequately accounted for in key
studies, as well as the lack of historical DE exposure data to retrospectively
validate estimated DE exposure levels for the available studies.
• A lack of knowledge about the mode(s) of action for DE lung cancer in humans
results in the use of a number of default risk assessment assumptions which, while
justifiable by evidence or policy choice, introduce uncertainty. To date, available
evidence for the role of DPM, both the adsorbed organics and the carbon core
particle, has been shown only for high-exposure conditions in the rat lung. The

7-145
tumor-inducing mode of action in the rat lung appears to depend on particle
overloading of the lung but this is judged to be not relevant for assessing the
human hazard of ambient exposures. There is virtually no information about the
relative role of DE constituents in mediating carcinogenic effects at lower
experimental or environmental exposure levels. Furthermore, there is only a
limited understanding regarding the relationship between DPM particle size and
carcinogenicity.
• DE is present in ambient PM (e.g., PM2.5 or PM10); however, a cancer hazard for
ambient PM has not been identified, as of 1996 (EPA 1996b). An updated
evaluation is expected in 2002.
Additional research is needed to address these issues to reduce the uncertainty associated with
the potential cancer hazard of exposure to DE.
REFERENCES FOR CHAPTER 7
Abbey, DE; Mills, PK; Petersen, FF; et al. (1991) Long-term ambient concentrations of total suspended particulates
and oxidants as related to incidence of chronic disease in California Seventh-Day Adventists. Environ Health
Perspect 94:43-50.
Abbey DE; Lebowitz MD; Mills PK; et al. (1995) Long-term ambient concentrations of particulates anddevelopment of chronic disease in a cohort of nonsmoking California residents. Inhal Toxicol 7:19-34.
Adamson, IYR; Bowden, DH. (1978) Adaptive response of the pulmonary macrophagic system to carbon. II.Morphologic studies. Lab Invest 38:430-438.
Ahlberg, J; Ahlbom, A; Lipping, H; et al. (1981) [Cancer among professional drivers—a problem-orientedregister-based study]. Läkartidningen 78:1545-1546.
Allen, RC; Loose, LD. (1976) Phagocytic activation of a luminol-dependent chemiluminescence in rabbit alveolarand peritoneal macrophages. Biochem Biophys Commun 69:245-252.
Ames, BN. (1983) Dietary carcinogens and anticarcinogens. Science 221:1256-1264.
Aronsen, KJ; Siemiatycki, J; Dewar, R; et al. (1996) Occupational risk factors for prostate cancer: results from acase-control study in Montreal, Quebec, Canada. Am J Epidemiol 143(4):363-373.
Balarajan, R; McDowell, ME. (1983) Malignant lymphomas and road transport workers. J Epidemiol CommunityHealth 37:316-317.
Balarajan, R; McDowall, ME. (1988) Professional drivers in London: a mortality study. Br J Ind Med 45:483-486.
Ball, JC; Green, B; Young, WC; et al., (1990) S9-activated Ames assays of diesel particle extracts: detectingindirect-acting mutagens in samples that are direct-acting. Environ Sci Technol 24:890-894.
Beall, GD; Repine, JE; Hoidal, JR; et al. (1977) Chemiluminscence by human alveolar macrophages: stimulationwith heat killed bacteria or phorbol myristate acetate. Infect Immunol 17:117-120.

7-146
Benhamou, S; Benhamou, E; Flamant, R. (1988) Occupational risk factors of lung cancer in a French case-controlstudy. Br J Ind Med 45:231-233.
Bender, AP; Parker, DL; Johnson, RA; et al. (1989) Minnesota Highway Maintenance Workers Study: cancermortality. Am J Ind Med 15:545-556.
Bhatia, R; Lopipero, P; Smith, A. (1998) Diesel exhaust exposure and lung cancer. Epidemiology 9(1):84-91.
Bitterman, PB; Aselberg, S; Crystal, RG. (1983) Mechanism of pulmonary fibrosis: spontaneous release of thealveolar macrophage-derived growth factor in interstitial lung disorders. J Clin Invest 72:1801-1813.
Boffetta, P; Stellman, SD. (1988) Association between diesel exhaust exposure and multiple myeloma: anexample of confounding. Prev Med 17:236-237.
Boffetta, P; Harris, RE; Wynder, EL. (1990) Case-control study on occupational exposure to diesel exhaust andlung cancer risk. Am J Ind Med 17:577-591.
Bohning, DE; Atkins, HL; Cohn, SH. (1982) Long-term particle clearance in man: normal and impaired. AnnOccup Hyg 26:259-271.
Bond, JA; Mitchell, CE; Li, AP. (1983) Metabolism and macromolecular covalent binding of benzo[a]pyrene incultured Fischer-344 rat lung type II epithelial cells. Biochem Pharmacol 32:3771-3776.
Bond, JA; Butler, MM; Medinsky, MA; et al. (1984) Dog pulmonary macrophage metabolism of free and particle-associated [14C]benzo[a]pyrene. J Toxicol Environ Health 14:181-189.
Bond, JA; Johnson, NF; Snipes, MB; et al. (1990) DNA adduct formation in rat alveolar type II cells: cellspotentially at risk for inhaled DE. Environ Mol Mutagen 16:64-69.
Boorman, GA; Brockman, M; Carlton, WW; et al. (1996) Classification of cystic keratinizing squamous lesions ofthe rat lung:report of a workshop. Toxicol Pathol 24:564-572.
Borm, PJA; Knaapen, AM; Schins, RFP; et al. (1997) Neutrophils amplify the formation of DNA adducts bybenzo[a]pyrene in lung target cells. Environ Health Perspect 105 (Suppl 5):1089-1093.
Bowden, DH; Adamson, IYR. (1978) Adaptive responses of the pulmonary macrophagic system to carbon. I.Kinetic studies. Lab Invest 38:422-438.
Boyd, MR. (1984) Metabolic activation and lung toxicity: a basis for cell-selective pulmonary damage by foreignchemicals. Environ Health Perspect 55:47-51.
Brightwell, J; Fouillet, X; Cassano-Zoppi, AL; et al. (1986) Neoplastic and functional changes in rodents afterchronic inhalation of engine exhaust emissions. In: Carcinogenic and mutagenic effects of diesel engine exhaust.Ishinishi, N; Koizumi, A; McClellan, R; et al., eds. Amsterdam: Elsevier; pp. 471-485.
Brightwell, J; Fouillet, X; Cassano-Zoppi, AL; et al. (1989) Tumors of the respiratory tract in rats and hamstersfollowing chronic inhalation of engine exhaust emissions. J Appl Toxicol 9:23-31.
Brüske-Hohlfeld, I; Mohner, M; Ahrens, W; et al. (1999) Lung cancer risk in male workers occupationallyexposed to diesel motor emissions in Germany. Am J Ind Med 36:405-414.
Buiatti, E; Kriebel, D; Geddes, M; et al. (1985) A case control study of lung cancer in Florence, Italy. I.Occupational risk factors. J Epidemiol Commun Health 39:244-250.
California Environmental Protection Agency. (Cal EPA, OEHHA) (1998) Health risk assessment for dieselexhaust. Public and Scientific Review Draft. February 1998.
7-147
Claxton, LD. (1983) Characterization of automotive emissions by bacterial mutagenesis bioassay: a review. Environ Mutagen 5:609-631.
Coggon, D; Pannett, B; Acheson, ED. (1984) Use of job-exposure matrix in an occupational analysis of lung andbladder cancers based on death certificates. J Natl Cancer Inst 72:61-65.
Cohen, SM; Ellwein, LB. (1991) Genetic error, cell proliferation and carcinogenesis. Cancer Res 51:6493-6505.
Cohen, AJ; Higgins, MWP. (1995) Health effects of diesel exhaust: epidemiology. In: Diesel exhaust: a criticalanalysis of emissions, exposure, and health effects. Cambridge, MA: Related HEI Publications; pp. 251-292.
Commins, BT; Waller, RE; Lawther, PJ. (1957) Air pollution in diesel bus garages. Br J Ind Med 14:232-239.
Cordier, S; Clavel, J; Limasset, JC; et al. (1993) Occupational risks of bladder cancer in France: a multicentercase-control study. Int J Epidemiol 22:403-411.
Cox, LA. (1997) Does diesel exhaust cause human lung cancer? J Risk Anal 17(6):807-829.
Crump, KS. (1999) Lung cancer mortality and diesel exhaust: reanalysis of a retrospective cohort study of U.S.railroad workers. Inhal Toxicol 11:101-107.
Crump, KS; Lambert, T; Chen, C; et al. (1991) Assessment of risk from exposure to diesel engine emissions. Clement International Corporation. Prepared for U.S. EPA under contract no. 68-02-4601; 56.
Damber, LA; Larsson, LG. (1987) Occupation and male lung cancer: a case-control study in northern Sweden. BrJ Ind Med 44:446-453.
Dasenbrock, C; Peters, L; Creutzenberg, O; et al. (1996) The carcinogenic potency of carbon particles with andwithout PAH after repeated intratracheal administration in the rat. Toxicol Lett 88:15-21.
Department of Labor, Mine Safety and Health Administration (2001, Jan. 19) Federal Register 66(13):5526-5706.
Depass, LR; Chen, KC; Peterson, LG. (1982) Dermal carcinogenesis bioassays of diesel particulates anddichloromethane extract of diesel particulates in C3H mice. In: Toxicological effects of emissions from dieselengines. Lewtas, J, ed. Amsterdam: Elsevier; pp. 321-326.
Dockery, DW; Pope, CA, III; Xu, X; et al. (1993) An association between air pollution and mortality in six U.S.
cities. N Engl J Med 329:1753-1759.
Dontenwill, W; Chevalier, H-J; Harke, H-P; et al. (1973) Investigations on the effects of chronic cigarette smokeinhalation in Syrian golden hamsters. J Natl Cancer Inst 51:1681-1832.
Drath, DB; Karnovsky, ML. (1975) Superoxide production by phagocytic leukocytes. J Exp Med 141:257-262.
Driscoll, K. (1995) Role of inflammation in the development of rat lung tumors in response to chronic particleexposure. In: Proceedings of the MIT toxicology symposium: particle overload in the rat lung and lung cancer:relevance for human risk assessment. Cambridge, MA: Massachusetts Institute of Technology; 29 pp.
Driscoll, KE; Carter, JM; Howard, BW; et al. (1996) Pulmonary inflammatory, chemokine, and mutagenicresponses in rats after subchronic inhalation of carbon black. Toxicol Appl Pharmacol 136:372-380.
Driscoll, KE; Carter, JM; Hassenbein, DG; et al. (1997a) Cytokines and particle-induced inflammatory cellrecruitment. Environ Health Perspect 105 (Suppl 5):1159-1164.
Driscoll, KE; Deyo, LC; Carter, JM; et al. (1997b) Effects of particle exposure and particle-elicited inflammatorycells on mutation in rat alveolar epithelial cells. Carcinogenesis 18:423-430.

7-148
Edling, C; Anjou, C-G; Axelson, O; et al. (1987) Mortality among personnel exposed to diesel exhaust. Int ArchOccup Environ Health 59:559-565.
El-Bayoumy, K; Rivenson, A; Johnson, B; et al. (1988) Comparative tumorigenicity of 1-nitropyrene, 1-nitrosopyrene, and 1-aminopyrene administered by gavage to Sprague-Dawley rats. Cancer Res 48:4256-4260.
Emmelin, A; Nyström, L; Wall, S. (1993) Diesel exhaust exposure and smoking: a case-referent study of lungcancer among Swedish dock workers. Epidemiology 4:237-244.
Enya, T; Suzuki, H; Watanabe, T; et al. (1997) 3-Nitrobenzanthrone, a powerful bacterial mutagen and suspectedhuman carcinogen found in diesel exhaust and airborne particulates. Environ Sci Technol 31:2772-2776.
Evans, M; Shami, SG; Martinez, LA. (1986) Enhanced proliferation of pulmonary alveolar macrophages aftercarbon instillation in mice depleted of blood monocytes by strontium-89. Lab Invest 54:154-159.
Farrell, RL; Davis, GW. (1974) Effect of particulate benzo(a)pyrene carrier on carcinogenesis in the respiratorytract of hamsters. In: Experimental lung cancer. Karbe, E; Davis, GW, eds. Berlin: Springer; pp. 186-198.
Flodin, U; Fredriksson, M; Persson, B. (1987) Multiple myeloma and engine exhausts, fresh wood, and creosote: acase-referent study. Am J Ind Med 12:519-529.
Gallagher, J; George, M; Kohan, M; et al. (1993) Detection and comparison of DNA adducts after in vitro and invivo diesel emission exposures. Environ Health Perspect 99:225-228.
Gallagher, J; Heinrich, U; George, M; et al. (1994) Formation of DNA adducts in rat lung following chronicinhalation of diesel emissions, carbon black, and titanium dioxide particles. Carcinogenesis 15:1291-1299.
Garland, FC; Gorham, ED; Garland, CF; et al. (1988) Testicular cancer in US Navy personnel. Am J Epidemiol127:411-414.
Garshick, E; Schenker, MB; Munoz, A; et al. (1987) A case-control study of lung cancer and diesel exhaustexposure in railroad workers. Am Rev Respir Dis 135:1242-1248.
Garshick, E; Schenker, MB; Munoz, A; et al. (1988) A retrospective cohort study of lung cancer and dieselexhaust exposure in railroad workers. Am Rev Respir Dis 137:820-825.
Gerde, P; Medinsky, MA; Bond, JA. (1991) Particle-associated polycyclic aromatic hydrocarbons--a reappraisalof their possible role in pulmonary carcinogenesis. Toxicol Appl Pharmacol 188:1-13. Goldstein, IM; Roos, D; Kaplan, HB; et al. (1975) Complement and immunoglobulins stimulate superoxideproduction by human leukocytes independently of phagocytosis. J Clin Invest 56:1155-1163.
Grimmer, G; Brune, H; Deutsch-Wenzel, R; et al. (1987) Contribution of polycyclic aromatic hydrocarbons andnitro-derivatives to the carcinogenic impact of diesel engine exhaust condensate evaluated by implantation intothe lungs of rats. Cancer Lett 37:173-180.
Guberan, E; Usel, M; Raymond, L; et al. (1992) Increased risk for lung cancer and for cancer of thegastrointestinal tract among Geneva professional drivers. Br J Ind Med 49:337-344.
Gustafsson, L; Wall, S; Larsson, LG; et al. (1986) Mortality and cancer incidence among Swedish dockworkers—a retrospective cohort study. Scand J Work Environ Health 12:22-26.
Gustavsson, P; Plato, N; Lidström, EB; et al. (1990) Lung cancer and exposure to diesel exhaust among busgarage workers. Scand J Work Environ Health 16:348-354.
Hall, NEL; Wynder, EL. (1984) Diesel exhaust exposure and lung cancer: a case-control study. Environ Res34:77-86.

7-149
Hammond, SK. (1998) Occupational exposure to diesel exhaust. Presented at the Scientific Review PanelMeeting, California Air Resources Board, March 11, 1998.
Hansen, ES. (1993) A follow-up study on the mortality of truck drivers. Am J Ind Med 23:811-821.
Hansen, J; Raaschou-Nielsen, O; Olsen, JH; et al. (1998) Increased risk of lung cancer among different types ofprofessional drivers in Denmark. Occup Environ Med 55:115-118.
Hatch, GE; Gardner, DE; Menzel, DB. (1980) Stimulation of oxidant production in alveolar macrophages bypollutant and latex particles. Environ Res 32:121-136.
Hayes, RB; Thomas, T; Silverman, DT; et al. (1989) Lung cancer in motor exhaust-related occupations. Am J IndMed 16:685-695.
Health Effects Institute (HEI). (1999) Diesel emissions and lung cancer and epidemiology and quantitative riskassessment–a special report of the institutes diesel epidemiology expert panel. Cambridge, MA: June, 1995.
Heinrich, U. (1990a) Presentation at workshop on health effects of diesel emissions. U.S. EPA, Research TrianglePark, July 1990.
Heinrich, U. (1990b) Carcinogenicity of carbon black “Printex 90” in female Wistar rats. Presented at: U.S.Environmental Protection Agency Diesel Emissions Peer Review Workshop; July 18-19; Chapel Hill, NC.
Heinrich, U; Peters, L; Funcke, W; et al. (1982) Investigation of toxic and carcinogenic effects of diesel exhaustin long-term inhalation exposure of rodents. In: Lewtas, J, ed. Toxicological effects of emissions from dieselemissions. Amsterdam: Elsevier; pp. 225-242.
Heinrich, U; Pott, F; Rittinghausen, S. (1986a) Comparison of chronic inhalation effects in rodents after long-termexposure to either coal oven flue gas mixed with pyrolized pitch or diesel engine exhaust. In: Carcinogenic andmutagenic effects of diesel engine exhaust. Ishinishi, N; Koizumi, A; McClellan, R; Stöber, W, eds. Amsterdam:Elsevier; pp. 441-457.
Heinrich, U; Muhle, H; Takenaka, S; et al. (1986b) Chronic effects on the respiratory tract of hamsters, mice andrats after long-term inhalation of high concentrations of filtered and unfiltered diesel engine emissions. J ApplToxicol 6:383-395.
Heinrich, U; Peters, L; Fuhst, R; et al. (1989a) The effect of automotive exhaust exposure on the carcinogenicityof diphenylnitrosamine (DPN) in the respiratory tract of rats. Exp Pathol 37:51-55.
Heinrich, U; Mohr, U; Fuhst, R; et al. (1989b) Investigation of a potential cotumorigenic effect of the dioxides ofnitrogen and sulfur, and of diesel-engine exhaust, on the respiratory tract of Syrian golden hamsters. ResearchReport No. 26. Cambridge, MA: Health Effects Institute; pp. 27.
Heinrich, U; Dungworth, DL; Pott, F; et al. (1994) The carcinogenic effects of carbon black particles and tar-pitchcondensation aerosol after inhalation exposure of rats. Ann Occup Hyg 48 (suppl. 4):351-356.
Heinrich, U; Fuhst, R; Rittinghausen, S; et al. (1995) Chronic inhalation exposure of Wistar rats and two differentstrains of mice to diesel engine exhaust, carbon black, and titanium dioxide. Inhal Toxicol 7:533-556.
Hemminki, K; Söderling, J; Ericson, P; et al. (1994) DNA adducts among personnel servicing and loading dieselvehicles. Carcinogenesis 15:767-769.
Hill, AG. (1965) The environment and disease: association or causation? Proc R Soc Med 58:295-300.
Hirafuji, M; Sakakibara, M; Endo, T; et al. (1995) Biological effects of diesel exhaust particles (DEP) on tissuesand cells isolated from respiratory tracts of guinea pigs. Res Commun Mol Pathol Pharmacol 90:221-233.
7-150
Hirose, M; Lee, M-S; Wang, CY; et al. (1984) Induction of rat mammary gland tumors by 1-nitropyrene, arecently recognized environmental mutagen. Cancer Res 44:1158-1162.
Hoar, SK; Hoover, R. (1985) Truck driving and bladder cancer mortality in rural New England. J Natl Cancer Inst74:771-774.
Hoidal, JR; Repine, JE; Beall, GD; et al. (1978) The effect of phorbol myristate acetate on metabolism andultrastructure of human alveolar macrophages. Am J Pathol 91:469-482.
Hou, S-M; Lambert, B; Hemminki, K. (1995) Relationship between hprt mutant frequency, aromatic DNAadducts and genotypes for GSTM1 and NAT2 in bus maintenance workers. Carcinogenesis 16:1913-1917.
Howard, PC; Gerrard, JA; Milo, GE; et al. (1983) Transformation of normal human skin fibroblasts by 1-nitropyrene and 6-nitrobenzo[a]pyrene. Carcinogenesis 4:353-355.
Howe, GR; Lindsay, JP. (1983) A follow-up study of a ten percent sample of the Canadian labour force: I. Cancermortality in males 1965-1973.
Howe, GR; Burch, JD; Miller, AB; et al. (1980) Tobacco use, occupation, coffee, various nutrients, and bladdercancer. J Natl Cancer Inst 64:701-713.
Howe, GR; Fraser, D; Lindsay, J; et al. (1983) Cancer mortality (1965-77) in relation to diesel fume and coalexposure in a cohort of retired railway workers. J Natl Cancer Inst 70:1015-1019.
Huisingh, J; Bradow, R; Jungers, R; et al. (1978) Application of bioassay to the characterization of diesel particleemissions. In: Application of short-term bioassay in the fractionation and analysis of complex mixtures. Waters,MD; Nesnow, S; Huisingh, JL; et al., eds. New York: Plenum; pp. 381-418.
Humble, CG; Samet, JM; Skipper, BE. (1984) Comparison of self- and surrogate-reported dietary information.Am J Epidemiol 119:86-98.
IARC. (International Agency for Research on Cancer) (1989) Monographs on the evaluation of carcinogenic risksto humans. Vol. 46. Diesel and gasoline engine exhaust and some nitroarenes. Lyon, France: IARC.
IARC. (1997) Monographs on the evaluation of carcinogenic risks to humans. Vol. 68. Silica, some silicates, coaldust and para-aramid fibrils. Lyon, France: IARC, pp. 362-375. Ichinose, T; Yajima, Y; Nagashima, M; et al. (1997a) Lung carcinogenesis and formation of 8-hydroxy-deoxyguanosine in mice by diesel exhaust particles. Carcinogenesis 18:185-192.
Ichinose, T; Yamanushi, T; Seto, H; et al. (1997b) Oxygen radicals in lung carcinogenesis accompanyingphagocytosis of diesel exhaust particles. Int J Oncol 11:571-575.
International Life Sciences Institute (ILSI). (2000) ILSI Risk Science Institute workshop: the relevance of the ratlung response to particle overload for human risk assessment. Gardner, DE, ed. Inhal Toxicol 12(1-2).
IPCS. (1996) International Program on Chemical Safety Environmental Health Criteria 171. Diesel fuel andexhaust emissions. Geneva: World Health Organization, pp.172-176.
Iscovich, J; Castelleto, R; Estevè, J; et al. (1987) Tobacco smoking, occupational exposure and bladder cancer inArgentina. Int J Cancer 40:734-740.
Ishinishi, N; Kuwabara, N; Takaki, Y; et al. (1988a) Long-term inhalation experiments on diesel exhaust. In:Diesel exhaust and health risks. Results of the HERP studies. Ibaraki, Japan: Research Committee for HERPStudies; pp. 11-84.
Ishinishi, N; Inamasu, T; Hisanaga, A; et al. (1988b) Intratracheal instillation study of diesel particulate extracts inhamsters. In: Diesel exhaust and health risk. Ibaraki, Japan: Research Committee for HERP Studies; pp. 209-216.

7-151
Iwai, K; Udagawa, T; Yamagishi, M; et al. (1986a) Long-term inhalation studies of diesel exhaust on F344 SPFrats. Incidence of lung cancer and lymphoma. In: Ishinishi, N; Koizumi, A; McClellan, R; Stöber, W, eds.Carcinogenic and mutagenic effects of diesel engine exhaust. Amsterdam: Elsevier; pp. 349-360.
Iwai, K; Udwaga, T; Yamagishi, M; et al. (1986b) Long-term inhalation studies of diesel exhaust on F344 SPFrats. Dev Toxicol Environ Sci 13:349-360.
Iwai, K; Higuchi, K; Udagawa, T; et al. (1997) Lung tumor induced by long-term inhalation or intratrachealinstillation of diesel exhaust particles. Exp Pathol Toxicol 49:393-401.
Iyer, V; Harris, RE; Wynder, EL. (1990) Diesel exhaust exposure and bladder cancer risk. Eur J Epidemiol 6:49-54.
Jensen, OM; Wahrendorf, J; Knudsen, JB; et al. (1987) The Copenhagen case-referent study on bladder cancer:risks among drivers, painters, and certain other occupations. Scand J Work Environ Health 13:129-134.
Jöckel, KH; Ahrens, W; Jahn, I; et al. (1995) Untersuchungen zu Lungenkrebs und Risiken am Arbeitsplatz(Schlussbericht). Berlin: Wirtschaftsverlag NW. Fb 01 HK 546.
Jöckel, KH; Ahrens, W; Jahn, I; et al. (1998) Occupational risk factors for lung cancer—a case-control study inWest Germany. Int J Epidemiol 27:549-560.
Johnson, C; Finkelstein, J; Gelein, R; et al. (1993) Early alterations in the mRNA abundance of IL-1", IL-1$,iNOS, MIP-2, TGF$, and VEGF associated with ultrafine particle exposure. Fundam Appl Toxicol 50:138 (abstr).
Jordana, M; Richards, C; Irving, LB; et al. (1988) Spontaneous in vitro release of alveolar macrophage cytokinesafter the intratracheal instillation of bleomycin in rats: characterization and kinetic studies. Am Rev Respir Dis137:1135-1140.
Kaplan, I. (1959) Relationship of noxious gases to carcinoma of the lung in railroad workers. J Am Med Assoc171:2039-2043.
Kaplan, HL; Mackenzie, WF; Springer, KJ; et al. (1982) A subchronic study of the effects of exposure of threespecies of rodents to diesel exhaust. In: Toxicological effects of emissions from diesel engines. Lewtas, J, ed.New York: Elsevier Biomedical; pp. 161-220.
Kaplan, HL; Springer, KJ; MacKenzie, WF. (1983) Studies of potential health effects of long-term exposure todiesel exhaust emissions. Final Report No. 01-0750-103 (SWRI) and No. 1239 (SFRE). San Antonio, TX:Southwest Research Institute.
Karagianes, RF; Palmer, RF; Busch, RH. (1981) Effects of inhaled diesel emissions and coal dust in rats. Am IndHyg Assoc J. 42:382-391.
Kawabata, Y; Iwai, K; Udagawa, T; et al. (1986) Effects of diesel soot on unscheduled DNA synthesis of trachealepithelium and lung tumor formation. In: Carcinogenic and mutagenic effects of diesel engine exhaust. Ishinishi,N; Koizumi, A; McClellan, R; et al., eds. Amsterdam: Elsevier; pp. 213-232.
Kawabata, Y; Udagawa, T; Higuchi, K; et al. (1994) Early one year exposure to diesel engine exhaust causes lungtumors. Toxic and carcinogenic effects of solid particles on the respiratory tract. In: Toxic and carcinogeniceffects of solid particles in the respiratory tract. Mohr, U; Dungworth, DL; Mauderly, JL; et al., eds. Washington,DC: International Life Sciences Institute Press, pp. 429-431.
Kensler, TW; Egner, PA; Moore, KG; et al. (1987) Role of inflammatory cells in the metabolic activity ofpolycyclic aromatic hydrocarbons in mouse skin. Toxicol Appl Pharmacol 90:337-346.
Klebanoff, SJ; Clark, RA. (1978) The metabolic burst. In: The neutrophil: function and clinical disorders.Amsterdam: North-Holland; pp. 283-368.

7-152
Kolonel, LN; Hirohata, T; Nomura, AMY. (1977) Adequacy of survey data collected from substitute respondents.Am J Epidemiol 106:476-484.
Kotin, P; Falk, H; Thomas, M. (1955) Aromatic hydrocarbons. III. Presence in the particulate phase of dieselengine exhausts and the carcinogenicity of exhaust extracts. Arch Ind Health 11:113-120.
Kumagai, Y; Arimoto, T; Shinyashiki, M; et al. (1997) Generation of reactive oxygen species during interactionof diesel exhaust particle components with NADPH cytochrome P450 reductase and involvement of thebioactivation in the DNA damage. Free Radical Biol Med 22:479-487.
Kunitake, E; Shimamura, K; Katayama, H; et al. (1986) Studies concerning carcinogenesis of diesel particulateextracts following intratracheal instillation, subcutaneous injection, or skin application. In: Carcinogenic andmutagenic effects of diesel engine exhaust. Ishinishi, N; Koizumi, A; McClellan, R; et al., eds. Amsterdam:Elsevier; pp. 235-252.
Kunitake, E; Imase, A; Shimamura, K; et al. (1988) Skin application and subcutaneous injection experiments ofdiesel particulate extracts using ICR mice and nude mice. In: Diesel exhaust and health risks. Results of the HERPstudies. Ibaraki, Japan: Research Committee for HERP Studies; pp. 217-225.
Langer, AM; Nolan, RP. (1994) Factors controlling the biological potential of inorganic dusts: surface area,chemistry and character. In: Toxic and carcinogenic effects of solid particles in the respiratory tract. Mohr, U;Dungworth, DL; Mauderly, JL; et al., eds. Washington, DC: International Life Sciences Institute Press, pp. 147-156.
Lechner, JF; Mauderly, JL. (1994) Sequence of events in lung carcinogenesis: initiation and promotion,protooncogenes and tumor suppressor genes and particulates. In: Toxic and carcinogenic effects of solid particlesin the respiratory tract. Mohr, U; Dungworth, DL; Mauderly, JL; et al., eds. Washington, DC: International LifeSciences Institute Press, pp. 235-251.
Lee, KP; Henry, NW, III; Trochimowicz, HJ; et al. (1986) Pulmonary response to impaired lung clearance in ratsfollowing excessive TiO2 dust deposition. Environ Res 41:144-167.
Lehnert, BE; Valdez, YE; Bomalaski, SH. (1988) Analyses of particles in the lung free cell, tracheobronchiallymph nodal, and pleural space compartments following their deposition in the lung as related to lung clearancemechanisms. Ann Occup Hyg 32:125-140.
Lehnert, BE; Ortiz, JB; London, JE; et al. (1989) Migratory behavior of alveolar macrophages during clearance oflight to heavy lung burdens of particles. 1989 Annual Meeting of the American Thoracic Society, Cincinnati, OH,May 14-17.
Lerchen, ML; Samet, JM. (1986) An assessment of the validity of questionnaire responses provided by a survivingspouse. Am J Epidemiol 123:481-489.
Lerchen, ML; Wiggins, CL; Samet, JM. (1987) Lung cancer and occupation in New Mexico. J Natl Cancer Inst79:639-645.
Lewis, TR; Green, FHY; Moorman, WJ; et al. (1989) A chronic inhalation toxicity study of diesel engineemissions and coal dust, alone and combined. J Am Coll Toxicol 8:345-375.
Lipsett, M; Campleman, S. (1999) Occupational exposure to diesel exhaust and lung cancer: a meta-analysis. Am J Public Health 80(7):1009-1017.
Lloyd, JW. (1971) Long-term mortality of steelworkers. V. Respiratory cancer in coke plant workers. J OccupMed 13:53-68.
Lowrie, DB; Aber, VR. (1977) Superoxide production by rabbit alveolar macrophages. Life Sci 21:1575-1584.

7-153
Mauderly, JL. (1994) Toxicological and epidemiological evidence for health risks from inhaled engine emissions. Environ Health Perspect 102(4):165-171.
Mauderly, JL; Jones, RK; Griffith, WC; et al. (1987) Diesel exhaust is a pulmonary carcinogen in rats exposedchronically by inhalation. Fundam Appl Toxicol 9:208-221.
Mauderly, JL; Snipes, MB; Barr, EB; et al. (1991) Influence of particle-associated organic compounds oncarcinogenicity of diesel exhaust. Eighth Health Effects Institute Annual Conference, April 21-24, ColoradoSprings, CO.
Mauderly, JL; Banas, DA; Griffith, WC; et al. (1996) Diesel exhaust is not a pulmonary carcinogen in CD-1mice exposed under conditions carcinogenic to F344 rats. Fundam Appl Toxicol 30:233-242.
McClellan, R. (1997) Use of mechanistic data in assessing human risks from exposure to particles. EnvironHealth Perspect 105(Suppl 5):1-17.
McLaughlin, JK; Dietz, MS; Mehl, ES; et al. (1987) Reliability of surrogate information on cigarette smoking bytype of informant. Am J Epidemiol 126:144-146.
Miles, PR; Lee, P; Thrush, MA; et al. (1977) Chemiluminescence associated with phagocytosis of foreignparticles in rabbit alveolar macrophages. Life Sci 20:165-170.
Mohr, U; Takenaka, S; Dungworth, DL. (1986) Morphologic effects of inhaled diesel engine exhaust on lungs ofrats: comparison with effects of coal oven flue gas mixed with pyrolized pitch. In: Carcinogenic and mutageniceffects of diesel engine exhaust. Ishinishi, N; Koizumi, A; McClellan, R; et al., eds. Amsterdam: Elsevier; pp.459-470.
Mokler, BV; Archibeque, FA; Beethe, RL; et al. (1984) Diesel exhaust exposure system for animal studies.Fundam Appl Toxicol 4:270-277.
Mumford, JL; Chapman, RS; Harris, DB. (1989) Indoor air exposure to coal and wood combustion emissionsassociated with a high lung cancer rate in Xuan Wei, China. Environ Int 15:315-320.
Murphy, SAM; Berube, KA; Richards, RJ. (1999) Bioreactivity of carbon black and diesel-exhaust particles toprimary Clara and type II epithelial cell cultures. Occup Environ Med 56:813-819.
Muscat, JE; Wynder, EL. (1995) Diesel engine exhaust and lung cancer: an unproven association. Environ HealthPerspect 103:812-818.
Nagashima, M; Kasai, H; Yokota, J; et al. (1995) Formation of an oxidative DNA damage, 8-hydroxydeoxyguanosine, in mouse lung DNA after intratracheal instillation of diesel exhaust particles and effectsof high-dietary fat and beta-carotene on this process. Carcinogenesis 16:1441-1445.
National Institute for Occupational Safety and Health (NIOSH). (1988) Carcinogenic effects of exposure to DE.NIOSH Current Intelligence Bulletin 50. DHHS (NIOSH) Publication No. 88-116. Atlanta, GA: Centers forDisease Control.
National Toxicology Program (NTP). (2000) 9th report on carcinogens. Public Health Service, U.S. Department ofHealth and Human Services, Research Triangle Park, NC. Available from: http://ntp-server.niehs.nih.gov.
Nesnow, S; Evans, C; Stead, A; et al. (1982) Skin carcinogenesis studies of emission extracts. In: Toxicologicaleffects of emissions from diesel engines. Lewtas, J, ed. Amsterdam: Elsevier; pp. 295-320.
Nesnow, S; Triplett, LL; Slaga, TJ. (1984) Tumor initiating activities of 1-nitropyrene and its nitrated products inSencar mice. Cancer Lett 23:1-8.
Nielsen, PS; Autrup, H. (1994) Diesel exhaust-related DNA adducts in garage workers. Clin Chem 40:1456-1458.

7-154
Nielsen, PS; Andreassen, A; Farmer, PB; et al. (1996a) Biomonitoring of diesel exhaust-exposed workers. DNAand hemoglobin adducts and urinary l-hydroxypyrene as markers of exposure. Toxicol Lett 86:27-37.
Nielsen, PS; de Pater, N; Okkels, H; et al. (1996b) Environmental air pollution and DNA adducts in Copenhagenbus drivers—effect of (incomplete entry)
Nikula, KJ; Snipes, MB; Barr, EB; et al. (1995) Comparative pulmonary toxicities and carcinogenicities ofchronically inhaled diesel exhaust and carbon black in F344 rats. Fundam Appl Toxicol 25:80-94.
Notani, PN; Shah, P; Jayant, K; et al. (1993) Occupation and cancers of the lung and bladder: a case-control studyin Bombay. Int J Epidemiol 22:185-191.
Oberdörster, G; Yu, CP. (1990) The carcinogenic potential of inhaled diesel exhaust: a particle effect? J AerosolSci 21 (suppl. 1):S397-S401.
Oberdörster, G; Baggs, R; Gelein, R; et al. (1995) Pulmonary effects of inhaled carbon black in rats. Toxicologist15:46.
Orthoefer, JG; Moore, W; Kraemer, D. (1981) Carcinogenicity of diesel exhaust as tested in strain A mice.Environ Int 5:461-471.
Pepelko, WE; Peirano, WB. (1983) Health effects of exposure to diesel engine emissions. J Am Coll Toxicol2:253-306.
Percy, C; Stanek, E, III; Gloeckler, L. (1981) Accuracy of cancer death certificates and its effect on cancermortality statistics. Am J Public Health 71:242-250.
Phillips, BJ; James, TEB; Anderson, D. (1984) Genetic damage in CHO cells exposed to enzymatically generatedactive oxygen species. Mutat Res 126:265-271.
Pope, CA, III; Thun, MJ; Namboordiri, MM; et al. (1995) Particulate air pollution as a predictor of mortality in aprospective study of U.S. adults. Am J Respir Crit Care Med 151:669-674.
Pott, F; Stöber, W. (1983) Carcinogenicity of airborne combustion products observed in subcutaneous tissue andlungs of laboratory rodents. Environ Health Perspect 47:293-303.
Pott, F; Heinrich, U. (1990) Relative significance of different hydrocarbons for the carcinogenic potency ofemissions from various incomplete combustion processes. In: complex mixtures and scientific risk. Scientificpublication 104. Vaino, A; Sorsa, M; McMichael, AJ; eds. Lyon, France: IARC; pp. 288-297.
Pott, F; Heinrich, U; Vainio, H; et al. (1990) Complex mixtures and cancer risk. In: Relative significance ofhydrocarbons for the carcinogenic potency of emissions from various incomplete combustion processes. IARC,288-297.
Pott, F; Dungworth, DL; Heinrich, U; et al. (1994) Lung tumours in rats after intratracheal instillation of dusts.Ann Occup Hyg 38:357-363, Suppl. 1.
Qu, SX; Leigh, J; Koelmeyer, H; et al. (1996) Detection of DNA adducts in coal miners exposed to dieselemissions in Australia. Fundam Appl Toxicol 50:237 (abstr).
Raffle, PAB. (1957) The health of the worker. Br J Ind Med 14:73-80.
Riebe-Imre, M; Aufderheide, M; Gärtner-Hübsch, S; et al. (1994) Cytotoxic and genotoxic effects of insolublepoarticles in vitro. In: Toxic and carcinogenic effects of solid particles in the respiratory tract. Mohr, U;Dungworth, DL; Mauderly, DL; et al., eds. Washington, DC: International Life Sciences Institute Press, pp. 519-523.

7-155
Risch, HA; Burch, JD; Miller, AB; et al. (1988) Occupational factors and the incidence of cancer of the bladder inCanada. Br J Ind Med 45:361-367.
Rister, M; Baehner, RL. (1977) Effect of hyperoxia on superoxide anion and hydrogen peroxide production ofpolymorphonuclear leukocytes and alveolar macrophages. Br J Haematol 36:241-248.
Rittinghausen, S; Mohr, U; Dungworth, DL. (1997) Pulmonary cystic keratinizing squamous cell lesions afterinhalation/instillation of different particles. Exper Toxicol Pathol 49:433-446.
Rogot, E; Reid, DD. (1975) The validity of data from next-of-kin in studies of mortality among migrants. Int JEpidemiol 4:51-54.
Root, RK; Metcalf, JA. (1977) H2O2 release from human granulocytes during phagocytosis. J Clin Invest60:1266-1279.
Rosenblatt, MB; Teng, PK; Kerpe, S; et al. (1971) Causes of death in 1,000 consecutive autopsies. NY State JMed 71:2189-2193.
Rosenkranz, HS. (1996) Mutagenic nitroarenes, diesel emissions, particle-induced mutations and cancer: an essayon cancer causation by a moving target. Mutat Res 367:65-72.
Rosenkranz, HS; Mermelstein, R. (1983) Mutagenicity and genotoxicity of nitroarenes: all nitro-containingchemicals were not created equal. Mutat Res 114:217-267.
Rothman, KJ. (1986) Modern epidemiology. Boston/Toronto: Little, Brown and Co.; pp. 16-21.
Rushton, L; Alderson, MR. (1983) Epidemiological survey of oil distribution centres in Britain. Br J Ind Med40:330-339.
Rushton, L; Alderson, MR; Nagarajah, CR. (1983) Epidemiological survey of maintenance workers in LondonTransport Executive bus garages at Chiswick Works. Br J Ind Med 40:340-345.
Sagai, M; Saito, H; Ichinose, T; et al. (1993) Biological effects of diesel exhaust particles. I. In vitro production ofsuperoxide and in vivo toxicity in mouse. Free Radical Biol Med 14:37-47.
Salmeen, IT; Pero, AM; Zator, R; et al. (1984) Ames assay chromatograms and the identification of mutagens indiesel exhaust particle extracts. Environ Sci Technol 18:375-382.
Sandusky, CB; Cowden, MW; Schwartz, SL. (1977) Effect of particle size on regurgitive exocytosis by rabbitalveolar macrophages. In: Pulmonary macrophages and epithelial cells. CONF-760927, National TechnicalInformation Service, U.S. Dept. of Commerce, pp. 85-105.
Saverin. R; Bräunlich, A; Dahman, D; et al. (1999) Diesel exhaust and lung cancer mortality in potash mining. Am J Ind Med 36:415-422.
Scheepers, PJT; Bos, RP. (1992) Combustion of diesel fuel from a toxicological perspective. II. Toxicity. IntArch Occup Environ Health 64:163-177.
Schenker, MB; Smith, T; Munoz, A; et al. (1984) Diesel exposure and mortality among railway workers: results ofa pilot study. Br J Ind Med 41:320-327.
Schottenfeld, D; Eaton, M; Sommers, SC; et al. (1982) The autopsy as a measure of accuracy of the deathcertificate. Bull NY Acad Med 58:778-794.
Sera, N; Fukuhara, K; Miyata, N; et al. (1994) Detection of nitro-azabenzol[a]pyrene derivatives in thesemivolatile phase originating from aiborne particulate matter, diesel and gasoline vehicles. Mutagenesis 9:47-52.

7-156
Shefner, AM; Collins, SC; Dooley, L; et al. (1982) Respiratory carcinogenicity of diesel fuel emissions interimresults. In: Toxicological effects of emissions from diesel engines. Lewtas, J, ed. Amsterdam: Elsevier; pp. 329-350.
Siemiatycki, J; Gérin, M; Stewart, P; et al. (1988) Associations between several sites of cancer and ten types ofexhaust and combustion products: results from a case-referent study in Montreal. Scand J Work Environ Health14:79-90.
Silverman, DT; Hoover, RN; Albert, S; et al. (1983) Occupation and cancer of the lower urinary tract in Detroit. JNatl Cancer Inst 70:237-245.
Silverman, DT; Hoover, RN; Mason, TJ; et al. (1986) Motor exhaust-related occupations and bladder cancer.Cancer Res 46:2113-2116.
Steenland, K; Burnett, C; Osoria, AM. (1987) A case-control study of bladder cancer using city directories as asource of occupational data. Am J Epidemiol 126:247-257.
Steenland, NK; Silverman, DT; Hornung, RW. (1990) Case-control study of lung cancer and truck driving in theTeamsters Union. Am J Public Health 80:670-674.
Steenland, K; Deddens, J; Stayner, L. (1998) Diesel exhaust and lung cancer in the trucking industry: exposure-response analyses and risk assessment. Am J Ind Med 34:220-228.
Steineck, G; Plato, N; Gerhardsson, M; et al. (1990) Increased risk of urothelial cancer in Stockholm during 1985-87 after exposure to benzene and exhausts. Int J Cancer 45:1012-1017.
Stenback, F; Rowland, J; Sellakumar, A. (1976) Carcinogenicity of benzo[a]pyrene and dusts in the hamster lung(instilled intratracheally with titanium oxide, aluminum oxide, carbon and ferric oxide). Oncology 33:29-34.
Stern, FB; Lemen, RA; Curtis, RA. (1981) Exposure of motor vehicle examiners to carbon monoxide: a historicalprospective mortality study. Arch Environ Health 36:59-66.
Stöber, W. (1986) Experimental induction of tumors in hamsters, mice and rats after long-term inhalation offiltered and unfiltered diesel engine exhaust. In: Carcinogenic and mutagenic effects of diesel engine exhaust.Ishinishi, N; Koizumi, A; McClellan, R; et al., eds. Amsterdam: Elsevier; pp. 421-429.
Stöber, W; Abel, UR. (1996) Lung cancer due to diesel soot particles in ambient air? A critical appraisal ofepidemiological studies addressing this question. Int Arch Occup Environ Health 68(Suppl):S3-S61.
Strom, KA. (1984) Response of pulmonary cellular defenses to the inhalation of high concentrations of dieselexhaust. J Toxicol Environ Health 13:919-944.
Swanson, GM; Lin, CS; Burns, PB. (1993) Diversity in the association between occupation and lung canceramong black and white men. Cancer Epidemiol Biomarkers Prev 2:313-320.
Takaki, Y; Kitamura, S; Kuwabara, N; et al. (1989) Long-term inhalation studies of exhaust from diesel engine inF-344 rats: the quantitative relationship between pulmonary hyperplasia and anthracosis. Exp Pathol 37:56-61.
Takemoto, K; Yoshimura, H; Katayama, H. (1986) Effects of chronic inhalation exposure to diesel exhaust on thedevelopment of lung tumors in di-isopropanol-nitrosamine-treated F344 rats and newborn C57BL and ICR mice.In: Carcinogenic and mutagenic effects of diesel engine exhaust. Ishinishi, N; Koizumi, A; McClellan, R; et al.,eds. Amsterdam: Elsevier; pp. 311-327.
Takemoto, K; Katayama, H; Kuwabara, T; et al. (1988) Carcinogenicity by subcutaneous administration of dieselparticulate extracts in mice. In: Diesel exhaust and health risks. Ibaraki, Japan: Research Committee for HERPStudies; pp. 227-234.

7-157
Thyssen, J; Althoff, J; Kimmerle, G; et al. (1981) Inhalation studies with benzo[a]pyrene in Syrian goldenhamsters. J Natl Cancer Inst 66:575-577.
Trotter, JR. (1980) Spontaneous cancer and its possible relationship to oxygen metabolism. Proc Natl Acad Sci77:1763-1767.
U.S. Environmental Protection Agency (U.S. EPA). (1986) Guidelines for carcinogen risk assessment. FederalRegister 51(185):33992-34003.
U.S. EPA. (1993) Motor vehicle-related air toxics study. Ann Arbor, MI: Office of Mobile Sources. EPA/420/R-93/005. Available from National Technical Information Service, Springfield, VA, PB93-182590/XAB.
U.S. EPA. (1996a) Air quality criteria for particulate matter. Prepared by the National Center for EnvironmentalAssessment, U.S. Environmental Protection Agency, Research Triangle Park, NC. EPA/600/P-95/001bF.
U.S. EPA. (1996b) Proposed guidelines for carcinogen risk assessment. Office of Research and Development.Federal Register 61(79):17960-18011. EPA/600/P-92/003C.
U.S. EPA. (1999) Guidelines for carcinogen risk assessment. Review Draft. NCEA-F-0644, July. Risk AssessmentForum, Washington, DC. http://www.epa.gov/ncea/raf/cancer.htm.
Vineis, P; Magnani, C. (1985) Occupation and bladder cancer in males: a case-control study. Int J Cancer 35:599-606.
Vostal, JJ. (1986) Factors limiting the evidence for chemical carcinogenicity of diesel emissions in long-terminhalation experiments. In: Carcinogenic and mutagenic effects of diesel engine exhaust: proceedings of theinternational satellite symposium on toxicological effects of emissions from diesel engines; July 1986; TsukubaScience City, Japan. Ishinishi, N; Koizumi, A; McClellan, RO; et al., eds. (Developments in toxicology andenvironmental science: v. 13.) Amsterdam: Elsevier Science Publishers BV; pp. 381-396.
Waller, RE. (1981) Trends in lung cancer in London in relation to exposure to diesel fumes. Environ Int 5:479-483.
Ward, JM. (1983) Background data and variations in tumor rates of control rats and mice. Prog Exper Tumor Res26:241-258.
Waxweiler, RJ; Wagoner, JK; Archer, VE. (1973) Mortality of potash workers. J Occup Med 15:486-489.
Weinstein, IB; Troll, W. (1977) National Cancer Institute workshop on tumor promotion and cofactors incarcinogenesis. Cancer Res 37:3461-3463.
Weiss, SJ; Rustagei, PK; LoBuglio, AF. (1978) Human granulocyte generation of hydroxyl radical. J Exp Med147:316-323.
Weitzman, SA; Stossel, TP. (1981) Mutation caused by human phagocytosis. Science 212:546-547.
White, HJ; Vostal, JJ; Kaplan, HL; et al. (1983) A long-term inhalation study evaluates the pulmonary effects ofdiesel emissions. J Appl Toxicol 1:332.
Wichmann, HE; Kreienbrock, L; Kreuzer, M; et al. (1998) Lungenkrebrisiko durch Radon in der BundesrepublikDeutschland (West). In: Fortschritte in der Umwelmedizin, ecomed VerlagsgesellschaftLandsberg/Lech.Wichmann, HE; Schliepköter, HW; Fulgraff, G; et al., eds.
Williams, RR; Stegens, NL; Goldsmith, JR. (1977) Associations of cancer site and type with occupation andindustry from the Third National Cancer Survey interview. J Natl Cancer Inst 59:1147-1185.
Wong, O; Morgan, RW; Kheifets, L; et al. (1985) Mortality among members of a heavy construction equipmentoperators union with potential exposure to diesel exhaust emissions. Br J Ind Med 42:435-448.

7-158
Woskie, SR; Smith, TJ; Hammond, SK; et al. (1988a) Estimation of the diesel exhaust exposures of railroadworkers: I. Current exposures. Am J Ind Med 13:381-394.
Woskie, SR; Smith, TJ; Hammond, SK; et al. (1988b) Estimation of the diesel exhaust exposures of railroadworkers: II. National and historical exposures. Am J Ind Med 13:395-404.
Wynder, LE; Dieck, G; Hall, NE. (1985) A case control study of diesel exhaust exposure and bladder cancer.Environ Res 34:475-489.
Zaebst, DD; Clapp, DE; Blade, LM; et al. (1991) Quantitative determination of trucking industry workers’exposures to diesel exhaust particles. Am Ind Hyg Assoc J 52:529-541.
Zamora, PO; Gregory, RE; Brooks, AL. (1983) In vitro evaluation of the tumor-promoting potential of diesel-exhaust-particle extracts. J Toxicol Environ Health 11:188-197.

8. DOSE-RESPONSE ASSESSMENT: CARCINOGENIC EFFECTS
8.1. INTRODUCTION Dose-response assessment for carcinogenicity defines the relationship between the
exposure/dose of an agent and the degree of carcinogenic response, and evaluates potential cancer risks to humans at exposure/dose levels of interest. Most often, the exposure/dose response of interest is well below the range of observation. As a result, dose-response assessment usually entails an extrapolation from the generally high exposures in studies on humans or laboratory animals to the exposure levels expected from human contact with the agent in the environment. It also includes considerations of the scientific validity of these extrapolations based on available knowledge about the underlying mechanisms or modes of carcinogenic action. The complete sequence of biological events that must occur to produce an adverse effect is defined as “mechanism of action.” In cases where only partial information is available, the term “mode of action” is used to refer to the mechanisms for key events that are judged to be sufficient to inform about the shape of the dose-response curve beyond the range of observation.
This chapter evaluates the available exposure/dose-response data and discusses extrapolation issues in estimating the cancer risk of environmental exposure to diesel engine exhaust (DE). It concludes that available data are inadequate to confidently derive a cancer unit risk estimate for DE or its component, diesel particulate matter (DPM). Unit risk is one possible output from a dose-response assessment and is defined as the estimated upper-bound cancer risk at a specific exposure or dose from a continuous average lifetime exposure to a carcinogen (in this case, cancer risk per :g/m3 of DPM). In lieu of unit-risk-based quantitative risk estimates, this chapter provides a perspective about potential risk at environmental levels. Subsequent sections of this chapter discuss issues related to dose-response evaluation of human cancer risk for DE exposure, including the target tumor site and underlying mode of action, suitable measures of dose, approaches to low-dose extrapolation, and appropriate data to be used in the dose-response analysis. This is followed by a simple analysis of the possible degree and extent of risk from environmental exposure to DE.
Appendix C provides a summary review of dose-response assessments conducted to date by other organizations and investigators. These risk estimations were performed on the basis of either epidemiologic and/or experimental data. As concluded in Section 8.5, EPA finds that available epidemiologic data are too uncertain to confidently derive a unit risk estimate for DE-induced lung cancer, and that rat data are not suitable for estimating human risk. Nevertheless, a review of dose-response evaluations is provided in the appendix for historical context.
8-1

8.2. MODE OF ACTION AND DOSE-RESPONSE APPROACH According to EPA’s 1996 Proposed Guidelines for Carcinogen Risk Assessment (U.S.
EPA, 1996), dose-response assessment is performed in two steps: assessment of observed data to derive a point of departure, followed by extrapolation to lower exposures to the extent necessary. Human data are always preferred over animal data, if available, as their use obviates the need for extrapolation across species. Mode-of-action information is important to dose-response evaluation, as it informs about the relevance of animal data to assessment of human hazard and risk, the shape of the dose-response curve at low doses, and the most appropriate measure(s) of exposure/dose and response.
If there are sufficient quantitative data (humans and/or animals) and adequate understanding of the carcinogenic process, the preferred approach is to use a biologically based model for both the range of observation and extrapolation below that range. Otherwise, as a default procedure, a standard mathematical model is used to curve-fit the observed dose-response data to obtain a point of departure, which is the lower 95% confidence limit of the lowest exposure/dose that is associated with a selected magnitude of excesses of cancer risk in human or animal studies. Default approaches for low-dose extrapolation should be consistent with the current understanding of the mode(s) of action. These include approaches that assume linearity or nonlinearity, or both. Linear extrapolation is used when there is insufficient understanding of the modes of action, or the mode-of-action information indicates that the dose-response curve at low dose is, or is expected to be, linear. Linear extrapolation involves the calculation of the slope of the line drawn from the point of departure to zero exposure or dose (i.e., above background). When there is sufficient evidence for a nonlinear mode of action but not enough data to construct a biologically based model for the relationship, a margin of exposure is used as a default approach. A margin-of-exposure analysis compares the point of departure (i.e., the lowest exposure associated with some cancer risk) with the dose associated with the environmental exposure(s) of interest and determines whether or not the exposure margins are adequate. Both default approaches may be used for a tumor response if it is mediated by linear and nonlinear modes of action. The dose-response approaches considered in this chapter follow the principles of EPA’s guidelines for carcinogen risk assessment (U.S. EPA, 1986, 1996, 1999).
As reviewed in Chapter 7, there is substantial evidence from combined human and experimental evidence that DE is likely to pose a cancer hazard to humans at anticipated levels of environmental exposure. The critical target organ is the lung. Evidence exists for a causal relationship between risk for lung cancer and occupational exposure to DE in certain occupational workers such as railroad workers, truck drivers, heavy equipment operators, transit workers, etc.
8-2
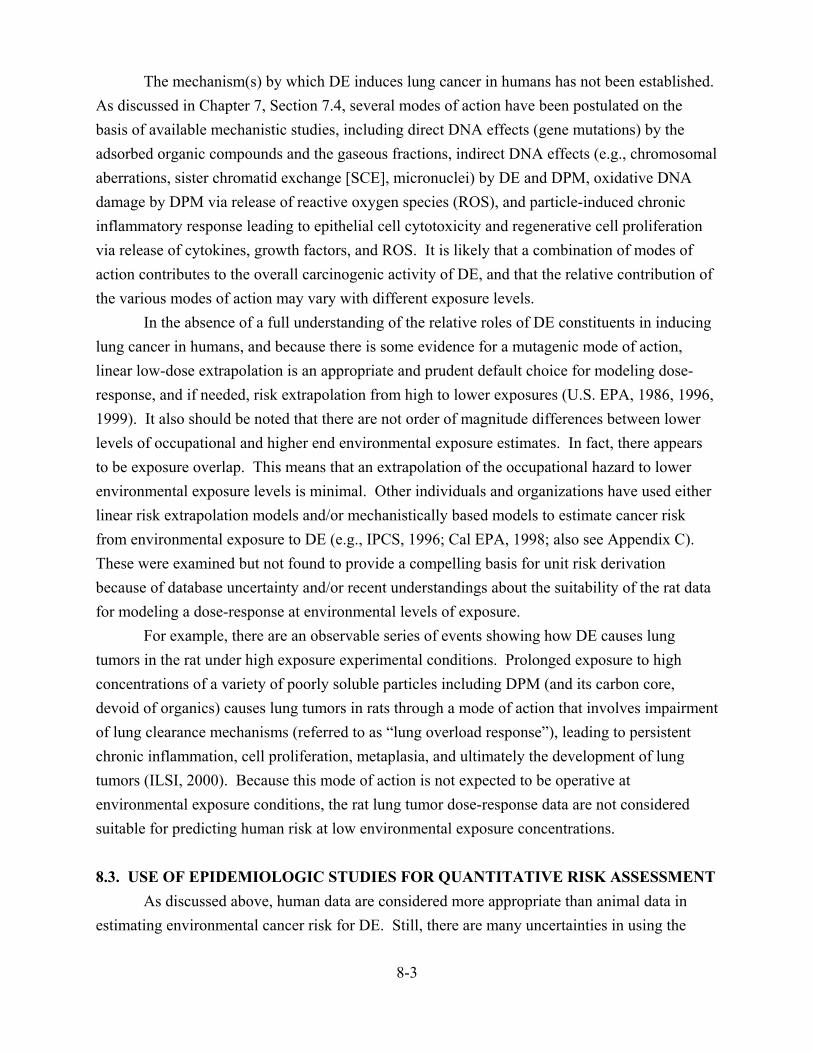
The mechanism(s) by which DE induces lung cancer in humans has not been established. As discussed in Chapter 7, Section 7.4, several modes of action have been postulated on the basis of available mechanistic studies, including direct DNA effects (gene mutations) by the adsorbed organic compounds and the gaseous fractions, indirect DNA effects (e.g., chromosomal aberrations, sister chromatid exchange [SCE], micronuclei) by DE and DPM, oxidative DNA damage by DPM via release of reactive oxygen species (ROS), and particle-induced chronic inflammatory response leading to epithelial cell cytotoxicity and regenerative cell proliferation via release of cytokines, growth factors, and ROS. It is likely that a combination of modes of action contributes to the overall carcinogenic activity of DE, and that the relative contribution of the various modes of action may vary with different exposure levels.
In the absence of a full understanding of the relative roles of DE constituents in inducing lung cancer in humans, and because there is some evidence for a mutagenic mode of action, linear low-dose extrapolation is an appropriate and prudent default choice for modeling dose-response, and if needed, risk extrapolation from high to lower exposures (U.S. EPA, 1986, 1996, 1999). It also should be noted that there are not order of magnitude differences between lower levels of occupational and higher end environmental exposure estimates. In fact, there appears to be exposure overlap. This means that an extrapolation of the occupational hazard to lower environmental exposure levels is minimal. Other individuals and organizations have used either linear risk extrapolation models and/or mechanistically based models to estimate cancer risk from environmental exposure to DE (e.g., IPCS, 1996; Cal EPA, 1998; also see Appendix C). These were examined but not found to provide a compelling basis for unit risk derivation because of database uncertainty and/or recent understandings about the suitability of the rat data for modeling a dose-response at environmental levels of exposure.
For example, there are an observable series of events showing how DE causes lung tumors in the rat under high exposure experimental conditions. Prolonged exposure to high concentrations of a variety of poorly soluble particles including DPM (and its carbon core, devoid of organics) causes lung tumors in rats through a mode of action that involves impairment of lung clearance mechanisms (referred to as “lung overload response”), leading to persistent chronic inflammation, cell proliferation, metaplasia, and ultimately the development of lung tumors (ILSI, 2000). Because this mode of action is not expected to be operative at environmental exposure conditions, the rat lung tumor dose-response data are not considered suitable for predicting human risk at low environmental exposure concentrations.
8.3. USE OF EPIDEMIOLOGIC STUDIES FOR QUANTITATIVE RISK ASSESSMENT As discussed above, human data are considered more appropriate than animal data in
estimating environmental cancer risk for DE. Still, there are many uncertainties in using the
8-3

available epidemiologic studies that have quantitative exposure data to extrapolate the risk to the general population for ambient-level DE exposure.
8.3.1. Sources of Uncertainty The greatest uncertainty in estimating DE-induced cancer risk from epidemiologic
studies is the lack of knowledge of actual historical exposures for individual workers, particularly for the early years. Reconstruction of historic exposures is based on job exposure categories, industrial hygiene measurements, and assumptions made about exposure patterns.
Another related uncertainty is the choice of markers of exposure to DE. As discussed above, the modes of action for DE-induced lung cancer in humans are not fully understood, and thus the best measure of DE exposure is unknown. Various markers of DPM (e.g., respirable-sized particles, elemental carbon [EC]) have been used as dosimeters for DE. Though EC is more sensitive and more specific than respirable-sized particles, both are considered appropriate dosimeters. Related to the choice of dosimeter, having a relatively constant relationship between the organics (on the particle) and the particle mass would be consistent with a possible mode-of-action role for both the particle and organic components. However, evidence of such a constant historic relationship remains unclear. As discussed in Chapter 2 (Section 2.5.2), it appears that newer model on-road engine exhaust has a lesser quantity of organics adsorbed onto the particle compared to older model engines. On the other hand, with regard to DE in the ambient air, there is significant variation in the amounts of DPM organic components emitted because of aged vehicles in the on-road fleet, driving patterns, and the additional presence of nonroad DE (e.g., marine vessels and locomotives, which generally use older technology than on-road engines).
Another major uncertainty associated with many of the DE epidemiologic studies was the inability to fully control for smoking effects, resulting in possible errors in estimating relative risk increases. Changes in adjustments for smoking could result in considerable changes in relative risk, because smoking has a much larger effect on relative lung cancer risk than is likely for DE. It is difficult to effectively control for a smoking effect in a statistical analysis because cigarette smoke contains an array of biologically active compounds and affects multiple steps of carcinogenesis, thus probably making smokers more susceptible to DE-induced lung cancer than are nonsmokers. A statistical analysis would not be able to adjust for such an effect without having a detailed record of the smoking history of individuals.
A potential uncertainty involves the use of occupational worker data to extrapolate cancer hazard risk to the general population and sensitive subgroups. By sex, age, and general health status, workers are not fully representative of the general population. For example, there is virtually no information to determine whether infants and children or people in poor health
8-4

respond differently to DE exposure than do workers. Finally, the use of linear low-dose extrapolation may contribute to uncertainty in estimating environmental risks.
8.3.2. Evaluation of Key Epidemiologic Studies for Potential Use in Quantitative Risk Estimates Among the available epidemiologic studies, only the railroad worker studies and the
Teamster truck driver studies have reconstructed quantitative historical exposure data for possible use in deriving a unit risk estimate for DE-induced lung cancer. This section evaluates the strengths and limitations of these data and their suitability for dose-response analysis.
8.3.2.1. Railroad Worker Studies Garshick and colleagues conducted both cohort and case-control studies of lung cancer
mortalities among U.S. railroad workers registered with the U.S. Railroad Retirement Board (RRB).
In the cohort study (Garshick et al., 1988), lung cancer mortality was ascertained through 1980 in 55,407 railroad workers, age 40 through 64 in 1959, with at least 10 years of work in selected railroad jobs (39 job titles). The cohort was selected on the basis of job titles in 1959. Industrial hygiene evaluations and descriptions of job activities were used to classify jobs as exposed or unexposed to diesel emissions. Workers with recognized asbestos exposure were excluded from the job categories selected for study. However, a few jobs with some potential for asbestos exposure were included in the cohort. Each subject’s work history was determined from a yearly job report filed by his employer with the RRB from 1959 until death or retirement. The year 1959 was chosen as the effective start of DE exposure for this study because by this time 95% of the locomotives in the United States were diesel powered. The author reported statistically significant relative risk increases of 1.57 for the 40-44 year age group and 1.34 for the 45-49 year age group, after exclusion of workers exposed to asbestos and controls for smoking. Age groups were determined by their ages in 1959.
A main strength of the cohort study is the large sample size (55,407), which allowed sufficient power to detect small risks. This study also permitted the exclusion of workers with potential past exposure to asbestos. The stability of job career paths in the cohort ensured that of the workers 40 to 64 years of age in 1959 classified as DE-exposed, 94% of the cases were still in DE-exposed jobs 20 years later.
The main limitation of the cohort study is the lack of quantitative data on exposure to DE. The number of years exposed to DE was used as a surrogate for dose. The dose, based on duration of employment, has inaccuracies because individuals were working on both steam and diesel locomotives during the transition period. It should be noted that the investigators included
8-5

only exposures after 1959; the duration of exposure prior to 1959 was not known. Other limitations of this study include its inability to examine the effect of years of exposure prior to 1959 and the less-than-optimal latency period for lung cancer expression. No adjustment for smoking was made in this study. For a detailed description of this study please refer to Chapter 7, Section 7.2.1.7.
Garshick and colleagues also conducted a case-control study of railroad workers who died of lung cancer between 1981 and 1982 (Garshick et al., 1987). The author reported statistically significant increased odds ratios (with asbestos exposure accounted for) of 1.41 (95% confidence interval [CI] = 1.06, 1.88) for the #64 year age group and 1.64 (95% CI = 1.18, 2.29) for the #64 year age group with $20 years of exposure when compared with the 0-4 year exposure group. The population base for this case-control study was approximately 650,000 active and retired male U.S. railroad workers with 10 years or more of railroad service who were born in 1900 or later. The cases were selected from deaths with primary lung cancer, which was the underlying cause of death in most cases. Each case was matched to two deceased controls whose dates of birth were within 2.5 years of the date of birth of the case and whose dates of death were within 31 days of the date of death noted in the case. Controls were selected randomly from workers who did not have cancer noted anywhere on their death certificates and who did not die of suicide or of accidental or unknown causes. A total of 1,256 cases and 2,385 controls were selected for the study. Among younger workers, approximately 60% had exposure to DE, whereas among older workers, only 47% were exposed to DE. DE exposure surrogates for workers were similar to those in the cohort study. Asbestos exposure was categorized on the basis of jobs held in 1959, or on the last job held if the subject retired before 1959. Smoking history information was obtained from the next of kin.
The strengths of the case-control study are consideration of confounding factors such as asbestos exposure and smoking; classification of DE exposures by job titles and industrial hygiene sampling; and exploration of interactions between smoking, asbestos exposure, and DE exposure. Major limitations of this study include (a) possible overestimation of cigarette consumption by surrogate respondents; (b) use of the Interstate Commerce Commission (ICC) job classification as a surrogate for exposure, which may have led to misclassification of DE exposure jobs with low intensity and intermittent exposure, such as railroad police and bus drivers, as unexposed; (c) lack of data on the contribution of unknown occupational or environmental exposures and passive smoking; and (d) a suboptimal latency period of 22 years, which may not be long enough to observe a full expression of lung cancer. For a detailed description of this study, please see Chapter 7, Section 7.2.2.4.
As a part of these epidemiologic studies, Woskie et al. (1988a) conducted an industrial hygiene survey in the early 1990s for selected jobs in four small northern railroads. DE
8-6

exposure was considered as a yes/no variable based on job in 1959 and estimated years of work in a diesel- exposed job as an index of exposure. Thirty-nine job titles were originally identified and were then collapsed into 13 job categories and, for some statistical analyses, into 5 categories (clerks, signal maintainers, engineers/firers, brakers/conductors/hostlers, and shop workers) (Woskie et al., 1988b; Hammond et al., 1988). As discussed below, these exposure estimations were used by Crump et al. (1991) and by Cal EPA (1998) for their dose-response analyses.
8.3.2.1.1. Potential for the data to be used for dose-response modeling. Both case-control and cohort studies can be used for dose-response analysis if exposure for each worker is available. Control of a smoking effect is important when lung cancer is the disease of interest. However, as discussed previously (see Section 8.3.1), one may not be able to control smoking completely in a dose-response analysis because of the lack of detailed records of the smoking history of individuals.
Garshick et al. (1988) reported a positive relationship of relative risk and duration of exposure by modeling age in 1959 as a covariate in an exposure-response analysis. The positive relationship disappeared when attained age was used instead of age in 1959, and a negative dose-response was observed (Crump et al., 1991). This negative dose-response continued to be upheld in a subsequent reanalysis (Crump, 1999). Garshick (letter from Garshick, Harvard Medical School, to Chao Chen, U.S. EPA, dated August 15, 1991) performed further analysis and reported that the relationship between years of exposure and risk of lung cancer, when adjusted for attained age and calendar year, was flat to negative depending upon which model was used. In contrast, California EPA (Cal EPA, 1998) found a positive dose-response by using age in 1959 but allowing for an interaction term of age and calendar year in the model.
Crump et al. (1991) also found, and Garshick (letter from Garshick, Harvard Medical School, to Chao Chen, U.S. EPA, dated August 15, 1991) confirmed, that in the years 1977-1980 the death ascertainment was not complete. About 20% to 70% of deaths were unaccounted for, depending upon the calendar year. Further analysis, based on job titles in 1959 and limited to deaths occurring through 1976, showed that the youngest workers still had the highest risk of dying of lung cancer.
Extensive statistical analyses were conducted by a panel convened by HEI (1999) to investigate the utility of the railroad worker cohort for use in dose-response based quantitative risk assessment. Seven models were used to test the data, and the models were formed by varying a number of covariates in different combinations. The covariates included employment duration, cumulative exposure with and without correction for background exposure, and three job categories: clerks and signalmen, train workers (which include engineers/firers/brakers/
8-7

conductors), and shop workers. The coefficient for each covariate in a model is used to calculate relative risk for the associated covariate. In summary, the panel found that effects of exposure as defined by an exposure-response curve were either flat or negative in all of the models. In these analyses, relative risk for each job category was assumed to be constant with respect to age. Further exploration of the data showed that the relative risk for train workers was not constant. The panel’s statistical analyses also revealed the complexity of the data and difficulties of providing an adequate summary measure of effect, probably because calendar year and cumulative exposure are highly correlated, which makes it especially difficult to sort out their separate effects. The difficulty of providing an adequate measure of DE effect was further demonstrated in Table C.3 of the HEI report, in which negative or positive effects for cumulative exposure (with background exposure adjustment) were obtained depending on whether or not job category was included in the model. A similar review of the divergent views about the railroad worker dose response also can be found in Chapter 7, Section 7.2.1.7.
The diverging results about the presence or absence of exposure response for the railroad worker data have become a source of continuing debate about the suitability of these data for estimating DE cancer risk. Although it is difficult to identify the exact reason for the diverging findings, the “age effect” appears to be a main source of uncertainty because age, calendar year, and cumulative exposure are not mutually independent. Therefore, an ideal dose-response analysis would account for the ages when exposure to DE began and terminated, along with the attained age and other covariates for each person, using age-dependent exposure concentration rather than cumulative exposure over lifetime as a dosimeter. This analysis would be possible for the railroad workers if information were available on the ages when exposure began and terminated.
Given the equivocal evidence for positive exposure response, EPA has not derived a unit risk on the basis of the available railroad worker data. This determination should not be construed, however, to imply that the railroad worker studies contain no useful information on lung cancer risk from exposure to DE.
8.3.2.2. Teamsters Union Trucking Industry Studies Steenland et al. (1990) conducted a case-control study of lung cancer deaths in the
Central States Teamsters Union to determine the risk of lung cancer among different trucking industry occupations. The study found statistically significant increased odds ratios for lung cancer of 1.89 and 1.64, depending on years of employment. Cases comprised all deaths from lung cancer (1,288). The 1,452 controls comprised every sixth death from the entire file, excluding deaths from lung cancer, bladder cancer, and motor vehicle accidents. Individuals were required to have 20 years tenure in the union to be eligible to claim benefits.
8-8

Detailed information on work history and potential confounders such as smoking, diet, and asbestos exposure was obtained by questionnaire. On the basis of interview data and the 1980 census occupation and industry codes, subjects were classified either as nonexposed or as having held other jobs with potential DE exposure. The Teamsters Union work history file did not have information on whether men drove diesel or gasoline trucks, and the four principal occupations were long-haul drivers, short-haul or city drivers, truck mechanics, and dockworkers. Subjects were assigned the job category in which they had worked the longest.
The main strengths of the study are the availability of detailed records from the Teamsters Union, a relatively large sample size, availability of smoking data, and measurement of possible asbestos exposures. Some limitations of this study include possible misclassifications of exposure and smoking habits, as information was provided by next-of-kin and lack of sufficient latency to observe lung cancer excess.
Steenland et al. (1998) conducted an exposure-response analysis by supplementing the data from their earlier case-control study of lung cancer and truck drivers in the Teamsters Union with exposure estimates based on a 1990 industrial hygiene survey of EC exposure (Zaebst et al., 1991), a surrogate for DE in the trucking industry. Available data indicate that exposure to workers in the trucking industry in 1990 averaged 2-27 :g/m3 of EC. The 1990 exposure information was used by Steenland as a baseline exposure measurement to reconstruct past exposure (in the period of 1949 to 1983) by assuming that the exposure for workers in different job categories is a function of highway mileages traveled by heavy-duty vehicles and efficiency of the engine over the years.
The industrial hygiene survey by Zaebst et al. (1991) of EC exposures in the trucking industry provided exposure estimates for each job category in 1990. The EC measurements were generally consistent with the epidemiologic results, in that mechanics were found to have the highest exposures and relative risk, followed by long-haul and short-haul drivers. Dockworkers who had the lowest exposures also had the lowest relative risks.
Past exposures were estimated assuming that they were a function of (a) the number of heavy-duty trucks on the road, (b) the particulate emissions (grams/mile) of diesel engines over time, and (c) leaks from truck exhaust systems for long-haul drivers. Estimates of past exposure to EC (as a marker for DE exposure) were made based on the assumption that average 1990 levels for a particular job category could be assigned to all subjects in that category, and that levels prior to 1990 were directly proportional to vehicle miles traveled by heavy-duty trucks and the estimated emission levels of diesel engines. For example, a 1975 exposure level was estimated by the following equation: 1975 level = 1990 level × (vehicle miles 1975/vehicle miles 1990) × (emissions 1975/emissions 1990). Once estimates of exposure for each year of work history were derived for each subject, analyses were conducted by cumulative level of estimated
8-9

carbon exposure. As with most epidemiologic studies, the endeavors to reconstruct exposures for epidemiologic studies are subject to uncertainties.
8.3.2.2.1. Potential for the data to be used for dose-response modeling. Steenland et al. (1998) analyzed their case-control data and showed a significant positive trend in lung cancer risk with increasing cumulative exposure to DE. The study by Steenland et al. (1998) could provide a valuable database for calculating unit risk for DE emissions. The strength of this data set is that the smoking histories of workers were obtained to the extent possible. Smoking is especially important in assessing the lung cancer risk due to DE exposure because smoking has much higher relative risk (or odds ratio) of lung cancer than does DE. In the Steenland et al. (1998) study, the overall (ever-smokers vs. nonsmokers) odds ratio for developing lung cancer from smoking is about 7.2, which is about fivefold larger than the 1.4 relative risk increase from a large synthesis of many DE epidemiologic studies. It is possible that a modest change of information on smoking and diesel exposure might alter the conclusion and risk estimate.
Another strength of the Teamster data for use in environmental risk assessment for the general population is that exposures of Teamsters are closer to ambient exposures than are those of railroad workers. The Teamsters Union truck driver case-control workers had cumulative exposure ranging from 19 to 2,440 :g/m3-years of EC, with the median and 95th percentile, respectively, of 358 and 754 :g/m3-years of EC. The median and 95th percentile of an environmentally equivalent exposure would be 3 and 6 :g/m3, respectively.1 These environmental equivalent exposures for the Teamsters Union truck drivers are close to the estimated ambient exposures of <1.0 :g/m3 to 4.0 :g/m3 (see Table 2-31).
Steenland et al. (1998) stated that their risk assessment is exploratory because it depends on estimates about unknown past exposures. An EPA reanalysis of DE exposure for this study is underway. With a revised exposure assessment, a reevaluation of the dose-response would be appropriate. In a recent review, HEI (1999) concluded that the Teamsters studies may be useful for quantitative risk assessment, but significant further evaluation and development are needed. Given the ongoing reanalysis of exposure, EPA will not, at this time, use the Steenland et al. (1998) occupational risk assessment findings to derive equivalent environmental parameters and cancer unit risk estimates.
1The conversion assumes (a) DPM = 40% EC as reported by Steenland et al. (1998), (b) environmental equivalent exposure is approximately = 0.21 × occupational exposure, and (c) 70 :g/m3-years is equivalent to a lifetime of exposure at 1 :g/m3.
8-10

8.3.3. Conclusion Even though available evidence supports a conclusion that DE is likely to be a human
lung carcinogen, the conclusion of the dose-response evaluation is that the available data are not sufficient to confidently estimate a cancer unit risk or unit risk range. The absence of such a cancer unit risk for DE limits the ability to quantify, with confidence, the potential impact of the hazard on exposed populations. Two significant short-term activities are underway to improve the epidemiologic database for dose-response assessment: (1) a follow-up study to correct the undercounting of mortality in the Garshick et al. (1988) railroad worker study, and (2) an EPA-sponsored effort to improve the exposure estimates for Teamsters Union truck drivers (Steenland et al., 1998). EPA will monitor this ongoing research as well as the ongoing NCI-NIOSH study of nonmetal miners and the recently NCI-funded epidemiologic study of truck drivers. As these studies or other new data become publicly available, EPA will reconsider the merit of conducting additional dose-response analysis and unit risk derivation.
8.4. PERSPECTIVES ON CANCER RISK Although the available data are considered inadequate to confidently estimate a cancer
unit risk, this does not mean that there is no information about the possible cancer risk of DE. To examine the significance of the potential cancer hazard from environmental exposure to DE, all relevant epidemiologic and exposure data as well as simple risk assessment tools can be used. Such an approach does not produce confident estimates of cancer unit risk. Rather, these exploratory approaches provide a perspective on the possible magnitude of cancer risk and thus insight about the potential significance of the hazard. This section describes approaches and methods that are used to gauge the magnitude of possible cancer risk from ambient exposure to DE.
The first approach involves examining the differences between the levels of occupational and ambient environmental exposures, while assuming that cancer risk to DE is linearly proportional with cumulative lifetime exposure. Risks to the general public would be low in comparison to occupational risk if the differences in exposure are large (e.g., about three orders of magnitude or more). On the other hand, if the exposure differences are smaller (i.e., within one to two orders of magnitude), environmental risks become more of a concern as they approach the range of workers’ risk observed in epidemiologic studies of past occupational exposures. This assumes that the carcinogenic potency of historical and current-day DE is not significantly different, a reasonable assumption, though not without uncertainty.
Table 8-1 shows occupational exposure estimates for some of the occupational groups where increased relative risks of lung cancer (e.g., meta-analyses) have been analyzed. Given that no statistical properties associated with these exposure estimates are known, their use here is
8-11
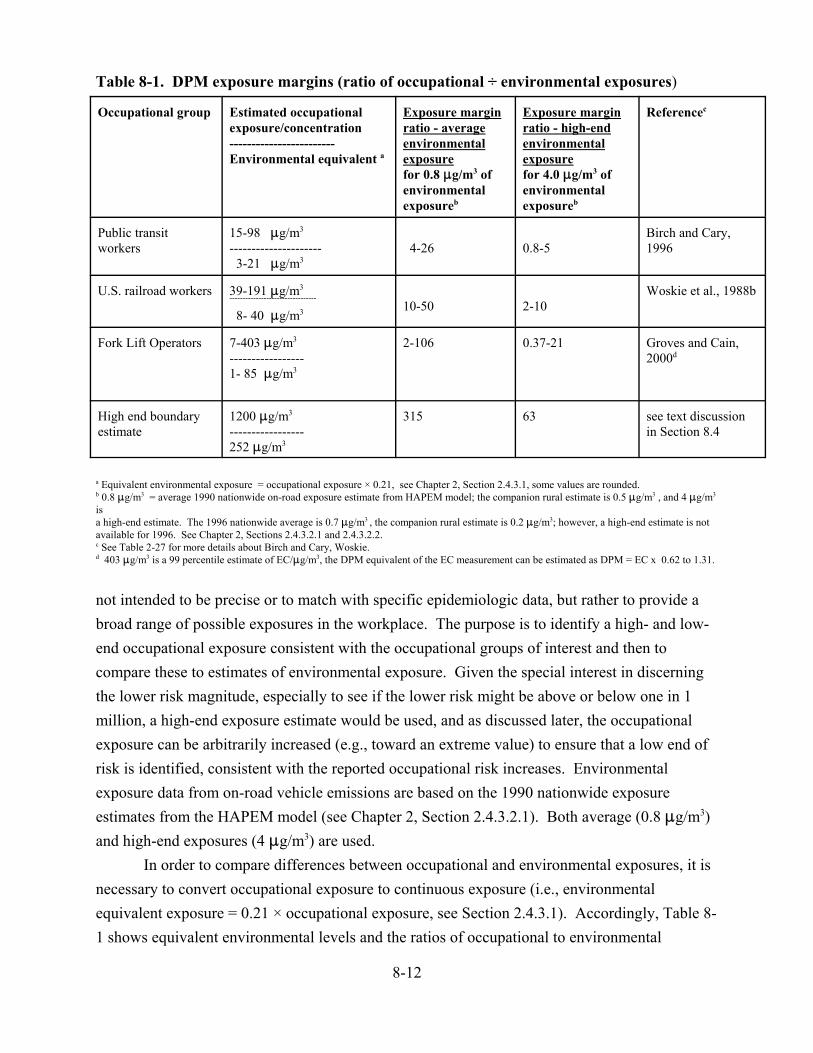
------------------------
---------------------
---------------------------------
-----------------
-----------------
Table 8-1. DPM exposure margins (ratio of occupational ÷ environmental exposures)
Occupational group Estimated occupational exposure/concentration
Environmental equivalent a
Exposure margin ratio - average environmental exposure for 0.8 :g/m3 of environmental exposureb
Exposure margin ratio - high-end environmental exposure for 4.0 :g/m3 of environmental exposureb
Referencec
Public transit workers
15-98 :g/m3
3-21 :g/m3 4-26 0.8-5
Birch and Cary, 1996
U.S. railroad workers 39-191 :g/m3
8- 40 :g/m3 10-50 2-10 Woskie et al., 1988b
Fork Lift Operators 7-403 :g/m3
1- 85 :g/m3
2-106 0.37-21 Groves and Cain, 2000d
High end boundary estimate
1200 :g/m3
252 :g/m3
315 63 see text discussion in Section 8.4
a Equivalent environmental exposure = occupational exposure × 0.21, see Chapter 2, Section 2.4.3.1, some values are rounded.b 0.8 :g/m3 = average 1990 nationwide on-road exposure estimate from HAPEM model; the companion rural estimate is 0.5 :g/m3 , and 4 :g/m3
is a high-end estimate. The 1996 nationwide average is 0.7 :g/m3 , the companion rural estimate is 0.2 :g/m3; however, a high-end estimate is notavailable for 1996. See Chapter 2, Sections 2.4.3.2.1 and 2.4.3.2.2.c See Table 2-27 for more details about Birch and Cary, Woskie.d 403 :g/m3 is a 99 percentile estimate of EC/:g/m3, the DPM equivalent of the EC measurement can be estimated as DPM = EC x 0.62 to 1.31.
not intended to be precise or to match with specific epidemiologic data, but rather to provide a broad range of possible exposures in the workplace. The purpose is to identify a high- and low-end occupational exposure consistent with the occupational groups of interest and then to compare these to estimates of environmental exposure. Given the special interest in discerning the lower risk magnitude, especially to see if the lower risk might be above or below one in 1 million, a high-end exposure estimate would be used, and as discussed later, the occupational exposure can be arbitrarily increased (e.g., toward an extreme value) to ensure that a low end of risk is identified, consistent with the reported occupational risk increases. Environmental exposure data from on-road vehicle emissions are based on the 1990 nationwide exposure estimates from the HAPEM model (see Chapter 2, Section 2.4.3.2.1). Both average (0.8 :g/m3) and high-end exposures (4 :g/m3) are used.
In order to compare differences between occupational and environmental exposures, it is necessary to convert occupational exposure to continuous exposure (i.e., environmental equivalent exposure = 0.21 × occupational exposure, see Section 2.4.3.1). Accordingly, Table 8-1 shows equivalent environmental levels and the ratios of occupational to environmental
8-12

exposures, referred to as exposure margins (EMs). An EM of 1 or less indicates that environmental exposure is comparable to occupational exposure. An EM >1 means that the occupational equivalent exposure is greater than the benchmarked environmental exposure.
Table 8-1 shows that the EMs based on the average nationwide environmental exposure (0.8 :g/m3) approach three orders of magnitude. EM’s that range from 1 to 10 also can be viewed as showing that adjusted occupational exposures are relatively close to the ambient environmental levels that were chosen as benchmarks. This closeness sets the stage for less uncertainty in hazard and risk extrapolation from the occupational to environmental setting. It also raises a concern that risks to the general public could approach worker risks that were observed in the occupational epidemiologic studies. Table 8-1 is based upon DE exposure estimates from on-road sources only. With the addition of exposure from nonroad sources, the average nationwide-based EM ratios would be lower. For example, using 1996 exposure data for urban populations (Table 2-30), the exposure from on-road sources is 0.5 :g/m3, whereas nonroad sources contribute 0.9 :g/m3, for a total of 1.4 :g/m3. Using this exposure value in place of the EM calculation of Table 8-1 (1990 estimate of 0.8) produces a nearly 43% reduction in the EM ratio. A comparison of EM changes for the high-end on-road plus nonroad exposure is not possible at the present time because the 1996 data have not yet been modeled to obtain a high-end value similar to the 1990 value of 4.0 :g/m3.
A second approach to explore the possible cancer risk to the general population from environmental exposure to DE is more quantitative. One begins by examining the risk observed in DE-exposed workers and then making reasoned assumptions as to how these risks can be translated to environmental exposure conditions. Such an approach involves three major assumptions: (1) the excess lung cancer risk as shown in numerous epidemiologic studies and in two meta-analyses is indeed due to DE exposure, (2) the increased lung cancer risk over background is linearly proportional to the lifetime exposure to DE, and (3) the past DE exposure for workers has the same cancer-inducing potential as the current DE in ambient air. Any of these assumptions could have an impact on the possible environmental risk by either increasing or decreasing the risk estimates, including the possibility of a lower or zero risk at environmental levels.
As reviewed in Chapter 7, Section 7.2, numerous epidemiologic studies have shown increased lung cancer risks (i.e., some are deaths, some are cases) among workers in certain occupations. The relative risks or odds ratios range from 1.2 to 2.6. Two independent metaanalyses show smoking-adjusted relative risk increases of 1.35 (Bhatia et al., 1997) and 1.47 (Lipsett and Campleman, 1999). For this analysis, a relative risk of 1.4 is selected as a reasonable estimate. This risk means that the workers faced an extra risk 40% higher than the
8-13

5% background lifetime lung cancer risk in the U.S. population.2 Thus, using the relationship [excess risk = (relative risk-1) × background risk], these DE-exposed workers would have an excess risk of 2% (10-2) (i.e., to develop lung cancer) due to occupational exposure to DE [(1.4 -1) × (0.05) = 0.02]. The validity of this interpretation depends on an important assumption: that the observed incremental risk of 40% was due to DE exposure alone and not to other unknown extraneous factors. It should be noted, however, that the conclusion about the risk perspective would not be changed even if the incremental risk of 40% were greatly reduced (e.g., to 20%); the conclusion would be changed only if almost all of the incremental risk were due to nondiesel factors.
Next, one would consider the EM (i.e., the EM ratio) between the occupational exposures and general-population environmental exposures. DPM concentrations in the workplace, used as a surrogate for worker exposure, are shown for three occupational worker groups in Table 8-1. These range from 7-403 :g/m3 (with an equivalent continuous exposure of 1-85 :g/m3). These worker groups are consistent with many of those cited in the meta-analyses. For this exploratory risk estimation approach, we want to intentionally adopt a high-end boundary exposure estimate that is unlikely to be exceeded, so that a lower bounding of the risk would be identified. An occupational boundary exposure of 1,200 :g/m3 with its environmental equivalent estimated value of 252 :g/m3 has been purposefully adopted to represent a high-end boundary estimate. This happens to be about three times the forklift operator value shown in Table 8-1, and clearly a high-end estimate when Table 2-27 is examined, exclusive of the estimates for miners which are not included in the meta-analyses. It should be noted once again that none of these estimates are intended to be precise.
Table 8-1 shows that the DPM exposure margin ratio between occupational and environmental exposure, using the nationwide average exposure value of 0.8 :g/m3, may range from 2 to 315 when the boundary estimate is used, and range from 0.37-63 when 4.0 :g/m3 is used as a high-end environmental benchmark exposure. Some of these extreme values will be used, as discussed in the next paragraph.
Risks from environmental exposure depend on the shape of the dose-response curve in the range between occupational and environmental exposures. If lifetime risks in this range were
2The background rate of 0.05 is an approximated lifetime risk calculated by the method of lifetable analysis using age-specific lung cancer mortality data and probability of death in the age group taken from the National Health Statistics (HRS) monographs of Vital Statistics of the U.S. (Vol. 2, Part A, 1992). Similar values based on two rather crude approaches also can be obtained: (1) 59.8 × 10⁻⁵ / 8.8 × 10-3 = 6.8 × 10⁻² where 59.8 × 10⁻⁵ and 8.8 × 10⁻³ are, respectively, the crude estimates of lung cancer deaths (including intrathoracic organs, estimated to be less than 105 of the total cases) and total deaths for 1996 reported in Statistical Abstract of the U.S. (Bureau of the Census, 1998, 118th Edition), and (2) 156,900/270,000,000 × 76 = 0.045, where 156,900 is the projected lung cancer deaths for the year 2000 as reported in Cancer Statistics J of the American Cancer Society, Jan/Feb 2000), 270,000,000 is the current U.S. population, and 76 is the expected lifespan.
8-14

to fall proportionately with reduced exposure, and if one assumes that past occupational exposures were at the high-boundary end, then the risk from average environmental exposure could be between 10-5 and 10-4 (0.02 ÷ 315 = 6 × 10⁻⁵). On the other hand, if occupational exposures for different groups were lower, risks from environmental exposure would be higher. For example, if occupational concentrations or exposures were closer to 100 :g/m3, a value that is represented in several data sets shown in Table 8-1 (with an equivalent environmental exposure of 21 :g/m3 and a corresponding EM of 26), then risks from environmental exposure would approach 10-3 (0.02 ÷ 26 = 8 × 10⁻⁴). If lifetime risks were to fall more than proportionately, then risks would be lower. The latter two sources of dose-response uncertainty (i.e., the actual occupational exposures and the shape of the dose-response curve at low exposures) cannot be further defined with currently available information. Use of higher environmental exposures (>0.8 up to 4.0 :g/m3) lowers the EM value and increases the estimated risk.
The magnitude of the estimated lifetime cancer risk derived from using a very high-end occupational-to-environmental exposure difference, establishes a reasonable basis to believe that the general population could face possible risks high enough to be of concern. This does not directly address the segments of the population that may be at highest risk: those who are additionally exposed to nonroad sources of DE and children who may be more sensitive to early-life DE exposure, if not in fact, a longer period of potential lifetime exposure.
The analyses presented above are not intended to be precise but are useful in gauging the possible risk range using simple risk exploration methods. Best scientific judgment guided the selection of assumptions and other elements of this analysis which are deemed reasonable and appropriate for identifying possible risks based on the information currently available. These analyses provide a sense of where an upper limit (or “upper bound”) of the cancer risk may be. The simple methodologies used are generic and are valid for any increased relative risk data, however, they are not unique to the DE data. These analyses are subject to numerous uncertainties, particularly the lack of actual exposure information in the epidemiologic studies and uncertainties related to the three major underlying assumptions mentioned earlier. Any of these uncertainties could have an impact on the possible risk levels discussed above. Lower risks are possible and one cannot rule out zero risk. The risks could be zero because (a) some individuals within the population may have a high tolerance to exposure from DE and therefore not be susceptible to the cancer risk from environmental exposure, and (b) although evidence of this has not been seen, there could be a threshold of exposure below which there is no cancer risk.
The estimated possible risk ranges (10-5 to 10-3 as well as lower and zero risk) provide a perspective of the potential significance of the lung cancer hazard. This perspective should not
8-15
be viewed as a definitive quantitative characterization of risk. The development of risk estimates does not constitute endorsement of their validity as surrogates for cancer unit risk or their suitability for estimating numbers of cancer cases. Further research is needed to more accurately assess and characterize environmental cancer risks of DE.
8.5. SUMMARY AND DISCUSSION There are numerous published quantitative dose-response assessments to estimate human
cancer risk from exposure to DE that use epidemiologic and/or experimental animal data (see Appendix C). These dose-response assessments were considered but failed to present a fully sufficient basis for a confident derivation of a cancer unit risk. This is because of epidemiologic exposure-related database uncertainties and the recent understanding about the lack of relevance of the rat lung cancer response to environmentally exposed humans. The dose-response analysis in this chapter has focused on the feasibility of using the occupational epidemiologic data to develop dose-response relationships and extrapolating them to the presumably lower levels of environmental exposure. Typically, this would result in the derivation of an exposure/dose-specific cancer unit risk. In the absence of an understanding about the mode(s) of action for DE-induced lung cancer in humans, coupled with the consideration that DE contains many mutagenic and carcinogenic constituents, linear low-dose extrapolation is judged to be an appropriate default choice for dose-response analysis, should there be satisfactory data to perform such an analysis.
This chapter specifically evaluated the suitability of using the railroad worker studies (Garshick et al., 1987, 1988) and the Teamster Union truck driver studies (Steenland et al., 1990, 1998) for dose-response analysis. However, because of uncertainties about the exposure response for the railroad workers and exposure uncertainties for the truck drivers, a dose-response-based cancer unit risk estimate for DE is not developed from these data sets at this time.
In the absence of a unit risk to assess environmental cancer risk, some insight about the possible significance of the hazard can be drawn from the available epidemiologic data and exploratory risk evaluation techniques. A discussion of possible risk is presented in the form of a perspective on the possible magnitude of risk from environmental exposure. The perspective discussion notes the small exposure margins and possible overlap between some occupational and environmental exposure levels. This lessens the uncertainty of extrapolating the occupational hazard and observed risk into the environmental setting. Furthermore, based on a more quantitative approach involving the observed lung cancer from occupational exposures and the magnitude of occupational and environmental exposure differences, an exploratory risk analysis shows that environmental cancer risks possibly range from 10-5 to nearly 10-3, while a
8-16

consideration of the numerous uncertainties and assumptions also indicates that lower risk is possible and zero risk cannot be ruled out. These risk findings are only general indicators of the potential significance of the lung cancer hazard and should not be viewed as a definitive quantitative characterization of risk or be used to estimate an exposure-specific population impact, i.e., estimating numbers of cancer deaths. Best scientific judgment guided the selection of assumptions and other elements of the analysis which are deemed reasonable and appropriate for identifying possible risks based on the information currently available. Further research is needed to more accurately assess and characterize environmental cancer risks of DE.
This exploratory risk analysis uses data collected from engines built prior to the mid-1990s. While engine exhaust emissions have been decreasing and exhaust composition has been changing in recent years, particularly for on-road engines, EPA believes that the insight gained from the risk perspective is pertinent to current on-road and nonroad engine use. New and cleaner engines will become available in response to environmental concerns and strict new regulations. As cleaner engines replace a substantial number of existing engines, the risk perspective will need to be reevaluated.
REFERENCES FOR CHAPTER 8
Bhatia, R; Lopipero, P; Smith, A. (1997) Diesel exhaust exposure and lung cancer. Epidemiology 9(1):84-91.
Birch, ME; Cary, RA. (1996) Elemental carbon-based method for monitoring occupational exposures to particulate diesel exhaust. Aerosol Sci Technol 25:221-241.
California Environmental Protection Agency (Cal EPA). (1998) Health risk assessment for DE. Public and Scientific Review Draft.
Crump, KS. (1999) Lung cancer mortality and DE: reanalysis of a retrospective cohort study of U.S. railroad workers. Inhal Toxicol 11:1-17.
Crump, KS; Lambert, T; Chen, C. (1991) Assessment of risk from exposure to diesel engine emissions. Clement International Corporation. Prepared for U.S. EPA under contract no. 68-02-4601.
Garshick, E; Schenker, MB; Munoz, A; et al. (1987) A case-control study of lung cancer and DE exposure in railroad workers. Am Rev Respir Dis 135:1242-1248.
Garshick, E; Schenker, MB; Munoz, A; et al. (1988) A retrospective cohort study of lung cancer and DE exposure in railroad workers. Am Rev Respir Dis 137:820-825.
Hammond, SK; Smith, TJ; Woskie, SR; et al. (1988) Markers of exposure to diesel exhaust and cigarette smoke in railroad workers. Am Ind Hyg Assoc J 49:516-522.
Health Effects Institute (HEI). (1999) Diesel emissions and lung cancer: epidemiology and quantitative risk assessment. A special report of the Institute’s Diesel Epidemiology Expert Panel. Cambridge, MA: Health Effects Institute.
8-17

International Life Sciences Institute (ILSI). (2000) ILSI Risk Science Institute workshop: The relevance of the rat lung response to particle overload for human risk assessment. Gardner, DE, ed. Inhal Toxicol:12(1-2).
International Programme on Chemical Safety: World Health Organization (IPCS). (1996) Diesel fuel and exhaust emissions. Environmental Health Criteria 171. Geneva: World Health Organization.
Lipsett, M; Campleman, S. (1999) Occupational exposure to DE and lung cancer: a meta-analysis. Am J Publ Health 89(7):1009-1017.
Steenland, NK; Silverman, DT; Hornung, RW. (1990) Case-control study of lung cancer and truck driving in the Teamsters Union. Am J Publ Health 80:670-674.
Steenland, K; Deddens, J; Stayner, L. (1998) DE and lung cancer in the trucking industry: exposure-response analysis and risk assessment. Am J Ind Med 34:220-228.
U.S. Environmental Protection Agency (EPA). (1986) Guidelines for carcinogen risk assessment. Federal Register 51(185):33992-34003.
U.S. EPA. (1996) Proposed guidelines for carcinogen risk assessment. Federal Register 61(79):17960-18011.
U.S. EPA. (1999) Guidelines for Carcinogen Risk Assessment. Review Draft. NCEA-F-0644, July. Risk Assessment Forum, Washington, DC. http://www.epa.gov/ncea/raf/cancer.htm.
Woskie, SR; Smith, TJ; Hammond, SK; et al. (1988a) Estimation of the DE exposures of railroad workers: II. National and historical exposures. Am J Ind Med 13:395-404.
Woskie, SR; Smith, TJ; Hammond, SK; et al. (1988b) Estimation of the DE exposures of railroad workers: I. Current exposures. Am J Ind Med 13:381-394.
Zaebst, D; Clapp, D; Blade, L; et al. (1991) Quantitative determination of trucking industry workers’ exposures to diesel particles. Am Ind Hyg Assoc J 52:529-541.
8-18

9. CHARACTERIZATION OF POTENTIAL HUMAN HEALTH EFFECTS OF DIESEL EXHAUST: HAZARD AND DOSE-RESPONSE ASSESSMENTS
9.1. INTRODUCTION Human health risk assessment entails the evaluation of all pertinent information on the
hazardous nature of environmental agents, on the extent of human exposure to them, and on the characterization of the potential risk to an exposed population. The information is typically organized into four components: hazard assessment, dose-response assessment, exposure assessment, and risk characterization. This health assessment document focuses only on the hazard and dose-response assessment components. The overall objectives of this diesel engine exhaust (DE) assessment are:
• to identify and characterize the human health effects, i.e., hazards that may result from environmental exposure to DE;
• to determine whether there is a quantitative exposure/dose-response relationship for DE exposure and the health effect in the range of observation, and if sufficient data are available (1) for noncancer effects to derive estimates of exposure that are believed to be without appreciable risk, and (2) for carcinogenicity to derive an exposure/dose-specific cancer unit risk; and
• to summarize and integrate the findings of the assessment into a characterization and discuss the uncertainties.
This chapter summarizes and integrates the key findings about the nature and characteristics of environmental exposure to DE (Chapter 2), health hazard information (Chapters 3, 4, 5, and 7), and dose-response analyses (Chapters 6 and 8) that are relevant to the potential human health effects associated with current-day environmental exposure to DE. It also discusses the uncertainties associated with the key findings, including critical data and knowledge gaps, key assumptions, and EPA’s science policy choices that are used to bridge the data and knowledge gaps.
This assessment is the Agency’s first health assessment for DE emissions and was developed to provide information about the potential for DE-related environmental health hazards that could be used in evaluating regulatory initiatives under provisions of the Clean Air Act.
9-1

9.2. PHYSICAL AND CHEMICAL COMPOSITION OF DIESEL EXHAUST As reviewed in Chapter 2, DE is a complex mixture of hundreds of constituents in gas or
particle phases. Gaseous components of DE include carbon dioxide, oxygen, nitrogen, water vapor, carbon monoxide, nitrogen compounds, sulfur compounds, and low molecular-weight hydrocarbons and their derivatives. The particulate matter of DE, diesel particulate matter (DPM), is composed of elemental carbon (EC), adsorbed organic compounds, and small amounts of sulfate, nitrate, metals, trace elements, water, and unidentified compounds. Incomplete combustion of fuel hydrocarbons as well as engine oil and other fuel components such as sulfur leads to the formation of DPM. DPM is either directly emitted from diesel-powered engines (primary particulate matter) or is formed from the gaseous compounds emitted by a diesel engine (secondary particulate matter).
DE emissions vary in chemical composition and particle sizes among different engine types, fuel formulations, and within engine types according to operating conditions. As the emissions age in the environment they also change. There also have been changes in DE emissions over time as a result of changes in engine technology and fuel reformulation. The following sections identify and characterize the key components of DE that are of concern in possible health outcomes, and discuss the changes in the composition of DE over time. The latter information is critical for making a scientific judgment about the appropriateness of using epidemiologic and toxicologic findings from past DE exposures to assess hazard and risk from current-day environmental exposures. It should be noted that available animal studies are based on exhaust exposures from various model year on-road diesel engines since 1980, whereas many of the epidemiologic studies refer to exposures from on-road and nonroad diesel engines in use from the 1950s through the mid-1990s.
After emission from the tailpipe, DE undergoes dilution, chemical and physical transformations, and dispersion and transport into the atmosphere. After a day or so in the ambient environment, the exhaust mixture is said to be aging, a recognition of the atmospheric transformation processes, mostly focused on the organics present, though some particle size changes also may occur. The public health impact of DE mixture transformations is not clear, as some atmospheric processes alter chemical forms to a less toxic form whereas others seem to produce a chemical form with increased toxicity (Chapter 2, Section 2.3).
9.2.1. Diesel Exhaust Components of Possible Health Concern The components of DE that are of health concern for this assessment are the particles
(elemental carbon core), the organic compounds adsorbed to the particles, and the organic compounds present in the gas phase. The gaseous oxides of carbon, nitrogen, and sulfur are also
9-2

of public health interest and the relevant health considerations for these are reviewed separately in EPA’s Ambient Air Quality Criteria Documents.
9.2.1.1. Diesel Particles Approximately 80%-95% of DPM mass is in the fine particle size range (#2.5
micrometers, ambient particulate matter [PM]), with a mean particle aerodynamic diameter of about 0.2 micrometers. Ultrafine particles (<0.1 micrometers), a smaller size component of the fine particles, average about 0.02 micrometers in aerodynamic diameter and account for about 1%-20% of the DPM mass and 50%-90% of the total number of particles in DPM (Chapter 2, Section 2.2.8.3).
Particle size is important for a number of reasons. Particles with aerodynamic diameters >2.5 micrometers (i.e., >PM2.5) tend to be retained in the upper portions of the respiratory tract, whereas particles with diameters <2.5 micrometers (i.e., PM2.5) are deposited in all areas, especially into the lower portions of the respiratory tract, including the deep lung. These fine and ultrafine particles have a very large surface area per gram mass (Chapter 2, Section 2.2.2), which enables them to adsorb and transport inorganic and organic compounds into the lung (Chapter 3, Section 3.3).
DPM is part of ambient particulate matter (PM). The EPA Emissions Trends Report (U.S. EPA, 2000) indicates that annual nationwide emissions of diesel PM2.5 (on-road and nonroad) in 1998 were 77% of all mobile-source emissions in 1998, 23% of the total PM2.5
inventory excluding natural and miscellaneous sources, and 6% if the natural and miscellaneous sources are included. Some geographic areas have a higher percentage of DPM in ambient PM2.5
because of differences in the number and types of diesel engines present in the area (e.g., on-road engines as well as nonroad engines). For instance, in Manhattan, New York, on-road diesel PM was reported to contribute about 53% of ambient PM10 during 3 days in 1993, whereas 1996-1997 studies in the Phoenix and Denver areas showed diesel PM to be 10%-15% of total PM2.5
mass (Chapter 2, Section 2.4.2.1). DPM generally contains a high percentage of EC per unit mass, which can be used as a
distinguishing feature from noncombustion sources of PM2.5 and, to an extent, other combustion sources. The DPM EC content can range from more than 50% to approximately 75% of the DPM mass depending on age of engine, type of engine (heavy-duty versus light-duty), fuel characteristics, and driving conditions. The organic carbon portion of DPM can range approximately from 19% to 43%, though higher and lower values also have been reported. In comparison, gasoline engine exhaust generally has a reverse pattern of low EC content and a high percentage of organics on the particle mass (see Chapter 2, Table 2-13).
9-3

9.2.1.2. Organic Compounds The organic compounds present in the gases and adsorbed onto the particles include a
wide spectrum of compounds related to unburned diesel fuel, lube oil, low levels of partial combustion, and pyrolysis products (see Chapter 2, Table 2-19). The organic compounds present in the gaseous phase include alkanes, alkenes, aldehydes, monocyclic aromatic compounds, and polycyclic aromatic hydrocarbons (PAHs). Among the gaseous components of DE, the aldehydes are particularly important because of their potential carcinogenic effects and because they make up an important fraction of the gaseous emissions. Formaldehyde accounts for a majority of the aldehyde emissions (65%-80%) from diesel engines. Acetaldehyde and acrolein are the next most abundant aldehydes. Other gaseous components of DE that are notable for their carcinogenic effects include benzene, 1,3-butadiene, PAHs, and nitro-PAHs (including those with #4 rings and nitro-PAHs with 2 and 3 rings). A number of the gaseous compounds (e.g., aldehydes, alkanes, alkenes, NOx, SOx) also are known to induce respiratory tract irritation given sufficient exposure (see Chapter 2, Table 2-21). Very small amounts of dioxins have been measured in heavy-duty diesel truck exhaust. These emissions are estimated to represent about 1.2% of the 1995 national dioxin inventory; dioxin emissions from nonroad exhausts have not been estimated (Chapter 2, Section 2.2.7.2).
Organic substances adsorbed onto DPM include C14-35 hydrocarbon compounds, PAHs with $4 rings, and nitro-PAHs. PAHs and their derivatives comprise <1% of the DPM mass (Chapter 2, Section 2.2.8). Many of these hydrocarbons are known to have mutagenic and carcinogenic properties. California EPA (Cal EPA, 1998) identified at least 19 hydrocarbons present in DE that are known or suspected carcinogens, according to evaluations by the International Agency for Research on Cancer (IARC).
9.2.2. “Fresh” Versus “Aged” Diesel Exhaust Newly emitted exhaust is termed “fresh,” whereas exhaust that is more than 1 or 2 days
old is referred to as “aged” because of alterations caused by sunlight and other chemical physical reactions that occur in the atmosphere. The overall toxicological consequence of DE aging is unclear because during aging some compounds in the DE mixture are altered to more toxic forms while others are made less toxic. For example, PAHs present in fresh emissions may be nitrated by atmospheric NO3 to form nitro-PAHs, thus adding to the existing burden of toxic nitro-PAHs present in fresh exhaust. On the other hand, PAHs present in the gas phase can react with hydroxyl radicals present in the ambient air, leading to a reduced atmospheric lifetime of the original PAHs. Alkanes and alkenes may be converted to aldehydes, and oxides of nitrogen to nitric acid (Chapter 2, Section 2.3).
9-4

9.2.3. Changes in Diesel Exhaust Emissions and Composition Over Time Chapter 2, with its Summary in Section 2.5, provides a full review of emissions trends
and a complete characterization of the physical and chemical changes in DE over the years, taking into consideration the lack of consistent analytical and measurement techniques and the variability in emissions based on vehicle mix, driving cycles, engine deterioration, and other factors. Key findings and inferences relevant to the potential health effects of DE are discussed below.
As discussed in Chapter 2, Section 2.2.3, the EPA Emissions Trend Report estimates that DPM10 on-road emissions decreased 27% between 1980 and 1998. DPM emission factors (g/mile by model year) from new on-road diesel vehicles decreased on average by a factor of six from the mid-1970s to the mid-1990s. These significant reductions are largely attributable to reductions in three PM components: EC, organic carbon, and sulfate. Limited data are available to assess the changes in emission rates from locomotive, marine, or other nonroad diesel sources over time, although it is estimated that DPM10 (#10 :m) emissions from nonroad diesel engines increased 17% between 1980 and 1998 (Chapter 2, Section 2.2.5).
Because of changes in engine technology and fuel composition, the chemical composition of DPM from on-road vehicles has also changed over time. The percentage of soluble organic material associated with DPM decreased by model year from the 1980s to the 1990s, and the proportion of EC is correspondingly higher. PAHs and nitro-PAHs are present in DPM from both new and older diesel engines. There are insufficient data to provide clear insight into the potential for changes in total PAH emissions over time or specific PAHs such as benzo[a]pyrene and 1-nitropyrene. It should be noted that the chemical composition of ambient DPM to which people are currently exposed is determined by a combination of exhaust from older and newer engines as well as on-road and nonroad applications of those engines. Consequently, the decrease in the soluble organic fraction of DPM by model year for on-road engines does not directly translate into a proportional decrease in DPM-associated organic material to which people are exposed. In addition, the contributions from high-emitting and/or smoking diesel engines have not been quantified (Chapter 2, Section 2.5.2).
Because of these uncertainties, the exposure impact of changes in DPM composition over time cannot be confidently characterized. Available data clearly indicate that toxicologically significant organic components of DE (e.g., PAHs, PAH derivatives, nitro-PAHs) were present in DPM and DE in the 1970s and are still present. Even though a significant fraction of ambient DPM (possibly more than 50%) is emitted by nonroad equipment, data are currently inadequate to characterize changes in the chemical composition of DPM from nonroad equipment over time. Given the variation in fuel, engine technology, and in-use operational factors over the years, caution should be exercised in presuming that a decrease in the amount of emissions or emission
9-5

constituents from older engines to present day in-use engines will result in a decrease in hazard/risk. In meeting the 2007 federal regulations for heavy-duty DE, the exhaust composition will be markedly changed with a consequence that health hazards are expected to be significantly reduced.
9.3. AMBIENT CONCENTRATIONS AND EXPOSURE TO DIESEL EXHAUST Chapter 2, Section 2.4 provides information on occupational and environmental
exposures to DE in order to provide a context for the hazard assessment and dose-response analysis. Highlights of the available information are discussed below.
DE is emitted from a variety of sources, both on-road (e.g., motor vehicles, construction equipment) and nonroad (e.g., farm equipment, railway locomotives, or marine uses). Environmental exposure to DE is generally higher in urban areas than in rural areas. The concentration of DE in the air will vary within any geographic area depending on the number and types of diesel engines in the area and the atmospheric patterns of dispersal. Some important factors that determine the difference between the ambient concentration of DE and the resultant exposure to an individual include the proximity of a person to the DE source and his/her pattern of activity which, for example, includes outdoor versus indoor activities as well as related breathing rates. Certain occupational populations (e.g., transportation and garage workers, heavy-equipment operators, and others who spend considerable time outdoors) can be exposed to much higher levels of DE than the general population. The amount or number of particles delivered and retained in the lung is one factor that could contribute to differential human susceptibility to DPM. For example, children have smaller lungs than adults and thus could have a higher lung burden of inhaled DPM per lung surface area if their activity pattern results in a high breathing frequency.
As DE is a complex mixture of many constituents, environmental concentration measurements and related human exposure is difficult to precisely measure. Even though levels of a number of DE constituents are generally known, it is difficult to quantify the portion that comes from DE since other types of emission sources also may emit the same constituent. Moreover, there is still incomplete knowledge about the relative roles of the relevant DE constituents in mediating the potential health effects of DE. Historically, exposure levels to DPM have been used as a surrogate marker/dosimeter for whole DE. Although uncertainty exists as to whether DPM mass (expressed as :g/m3 of DPM ) is the most appropriate dosimeter for health effect purposes, it is considered to be a reasonable choice until more definitive information is available about the mechanisms or mode(s) of toxicity action of DE.
Several techniques exist for estimating ambient concentrations of DPM, including chemical mass balance (CMB) source apportionment, dispersion modeling, and using EC as a
9-6

surrogate for DPM. DPM concentrations reported from CMB and dispersion modeling studies in the 1980s suggest that in urban and suburban areas (Phoenix and Southern California), the annual average DPM concentration ranged from 2 to 13 :g/m3. In the 1990s, annual or seasonal average DPM concentrations in suburban or urban locations have ranged from 1.2 to 4.5 :g/m3. DPM concentrations at a major bus stop in downtown Manhattan ranged from 13.2 to 46.7 :g/m3 over a 3-day period in 1993. In nonurban and rural areas in the 1980s, DPM concentrations were reported to range from 1.4 to 5 :g/m3. In the 1990s, nonurban air basins in California were reported to have DPM concentrations ranging from 0.2 to 2.6 :g/m3 (Chapter 2, Section 2.4.2).
A comprehensive exposure assessment is not presented in this assessment, though EPA is developing this in an analysis called the National Air Toxics Assessment. Interim exposure estimation based on EPA’s Hazardous Air Pollutant Exposure Model (HAPEM-MS3 model), for on-road sources only, suggests that in 1996 annual average DPM exposure in urban areas from only on-road engines was 0.7 :g/m3, while in rural areas exposure was 0.3 :g/m3. Among 10 urban areas, the 1996 annual average estimated exposure ranged from 0.5 to 1.2 :g/m3. A high-end exposure estimate for 1996 is not yet available. Comparable 1990 exposure estimates for on-road sources ranged from 0.9 :g/m3 for urban areas to 0.5 :g/m3 for rural areas. In 1990 exposure estimates for the most highly exposed individuals (e.g., outdoor workers and children who spend large amounts of time outdoors) were estimated to be up to 4.0 :g/m3 (Chapter 2, Section 2.4.3.2, Table 2-29). Nationwide level nonroad emission exposures are estimated to be nearly double those from on-road sources.
Estimates for occupational exposures to DE as DPM mass are generally higher than environmental exposures. Tables 2-27 and 2-28 provide historic exposure estimates for specific worker categories. For example, historic DPM exposure estimates range from 39–191 :g/m3 for railroad workers, 4–748 :g/m3 for firefighters, 7–98 :g/m3 for public transit workers and airport crews, 5–61 :g/m3 for mechanics and dock workers, and 2–7 :g/m3 for long- and short-haul truck drivers. For a direct comparison of lifetime exposures between an occupational setting (8 hours per day, 5 days per week, for 45 years) and environmental exposure (continuous exposure for 70 years), the occupational estimates are converted to an equivalent environmental lifetime estimate,1 which is also shown in Table 2-28. A conversion of EC-based measurements to total DPM also may be needed for some estimates. The estimated 70-year lifetime exposures equivalent to those for the occupational groups discussed above range from about 0.4–157 :g/m3. These data indicate that some lower-end occupational estimates of DPM, when converted to environmental equivalents, overlap the range of estimated environmental exposures
1Environmental equivalent occupational exposure = 0.21 × occupational exposure.
9-7

to DPM from on-road emissions (national average in 1990 of 0.8 :g/m3, with high-end exposures up to about 4 :g/m3). The addition of nonroad emission exposures, when appropriate, makes the case for overlap of occupational and environmental exposure more prevalent.
9.4. HAZARD CHARACTERIZATION The primary health effects of concern from environmental exposure to DE include
effects associated with both acute and short-term exposures as well as chronic exposures. It is recognized that acute exposures may produce transitory physiological symptoms of varied severity as well as exacerbation of allergenic effects from acute and repeated exposures. On the basis of combined human and experimental evidence from chronic exposure studies, noncancer respiratory effects and lung cancer are observed.
The health effects data are based on DE from a variety of engines existing before the mid-1990s. There have been changes in the physical and chemical composition of some DE emissions (on-road vehicle emissions) over time, though there is no definitive information to show that the emission changes portend significant toxicological changes. The mode(s) of action for DE toxicity in humans is not understood, and hence knowledge is lacking about the role of exhaust mixture components in modulating the toxicity. Taken together, these considerations have lead to a judgment that the hazards identified from older technology-based exposures are applicable to current-day exposures. As new and cleaner diesel engines replace a substantial number of existing engines, the general applicability of the older data will need to be reevaluated.
As discussed in Chapter 6 (Section 6.4), it is also reasonable to expect that DPM, being a constituent of ambient fine PM (PM2.5), would contribute to the wider spectrum of effects that have been associated with ambient PM2.5. Community epidemiologic studies have shown that ambient PM2.5 exposure is statistically associated with increased mortality (especially among people over 65 years of age with preexisting cardiopulmonary conditions) and morbidity as measured by increases in hospital admissions, respiratory symptom rates, decrements in lung function, and exacerbation of asthma, and possibly immunological effects in the respiratory system. There continues to be little epidemiologic evidence for an effect of ambient exposure to PM on cancer rates (U.S. EPA, 1996a,b), though U.S. EPA’s Criteria Document for Ambient PM (expected to be released in 2002) will examine the question further.
9.4.1. Acute and Short-Term Exposures The combined human and animal evidence indicates that DE can induce irritation to the
eye, nose, and throat, as well as inflammatory responses in the airways and the lung following
9-8

acute and/or short-term exposure to high concentrations. There also is suggestive evidence for possible immunological and allergenic effects of DE.
9.4.1.1. Acute Irritation DE contains various respiratory irritants in the gas phase and in the particulate phase
(e.g., SOx, NOx, aldehydes). Acute exposure to DE has been associated with irritation of the eye, nose, and throat, respiratory symptoms (cough and phlegm), and neurophysiological symptoms such as headache, lightheadedness, nausea, vomiting, and numbness or tingling of the extremities. Such symptoms have been described mainly in reports of individuals exposed to DE in the workplace, or in clinical studies in humans exposed acutely to high concentrations of DE. Because of the general lack of validating exposure information in the reports, the role of DE in causing these effects is unknown. An exposure-response relationship for these acute irritation and respiratory symptoms has not been demonstrated (Chapter 5, Section 5.1.1.1).
9.4.1.2. Respiratory Effects Available studies of occupational exposure to DE have not provided evidence for
significant decrements of lung function in workers over a work shift or after a short-term exposure period. Short-term and subchronic inhalation studies of DE in animals (rats, mice, hamsters, cats, guinea pigs) showed inflammation of the airways and minimal or no lung function changes. These effects were associated with high DE exposures (up to 6 mg/m3). Exposure-response relationships have not been established for these responses (Chapter 5, Sections 5.1.1, 5.1.2, and 5.1.3).
9.4.1.3. Immunological Effects Recent human and animal studies show that acute DE exposure episodes can exacerbate
immunological reactions to other allergens or initiate a DE-specific allergenic reaction. The effects seem to be associated with both the organic and carbon core fraction of DPM. In human subjects, intranasal administration of DPM has resulted in measurable increases of IgE antibody production and increased nasal mRNA for some proinflammatory cytokines. These types of responses also are markers typical of asthma, though for DE, evidence has not been produced in humans that DE exposure results in asthma. The ability of DPM to act as an adjuvant to other allergens also has been demonstrated in human subjects. For example, co-exposure to DPM and ragweed pollen was reported to significantly enhance the IgE antibody response and cytokine expression relative to ragweed pollen alone. Available animal studies also demonstrate the potential adjuvant effects of DPM with model allergens, e.g., in mouse studies the allergenic reaction to ovalbumin and Japanese cedar pollen (Chapter 5, Sections 5.1.1.1.3 and 5.1.1.1.4).
9-9

Additional research is needed to further characterize immunological effects of DE and to determine whether or not the immunological effects constitute a low-exposure hazard. This health endpoint is of considerable public health concern, given the increases in allergic hypersensitivity in the U.S. population (Chapter 5, Section 5.6.2.6).
9.4.2. Chronic Exposure 9.4.2.1. Noncancer Effects
Available long-term and cross-sectional human studies have provided evidence for an association between respiratory symptoms (cough and phlegm) and DE exposure, but there was no consistent effect on lung function. DE has been shown in many animal studies of several species to induce lung injury (chronic inflammation and histopathologic changes) following long-term inhalation exposure. DE also has been tested in laboratory animals for other health effects, but no significant effects have been found. Overall, available data lead to the conclusion of a potential chronic respiratory hazard to humans from long-term exposure to DE.
9.4.2.1.1. Respiratory effects. A few human studies in various diesel occupational settings suggest that DE exposure may impair pulmonary function, as evidenced by increases in respiratory symptoms and some reductions in baseline pulmonary function consistent with restrictive airway disease. Other studies found no particular effects. The methodologic limitations in available human studies limit their usefulness in drawing any firm conclusions about DE exposure and noncancer respiratory effects (Chapter 5, Section 5.1.1.2).
Available studies in animals, however, provide a large body of evidence demonstrating that prolonged inhalation exposure to high concentrations of DE can result in pulmonary injury. A number of long-term laboratory studies in rats, mice, hamsters, cats, and monkeys found varying degrees of adverse lung pathology including focal thickening of the alveolar walls, replacement of Type I alveolar cells by type II cells, and fibrosis. The rat is the most sensitive animal species to DE-induced pulmonary toxicity (Chapter 5, Sections 5.1.3 and 5.4).
Available mechanistic data, mainly in rats, indicates that the DPM fraction of DE is a controlling factor in the etiology of pulmonary toxicity, although a role for the adsorbed organic compounds on the particles and in the gaseous phase cannot be ruled out. The lung injury appears to be mediated by an invasion of alveolar macrophages that release chemotactic factors that attract neutrophils and additional alveolar macrophages, which in turn release mediators (e.g., cytokines, growth factors) and oxygen radicals. These mediators result in persistent inflammation, cytotoxicity, impaired phagocytosis, clearance of particles, and eventually deposition of collagen by activated fibroblasts. This mode of action seems to be operative for a variety of poorly soluble particles in addition to DPM (ILSI, 2000). Because long-term exposure
9-10
to DE has been shown to induce exposure-dependent chronic respiratory effects in a wide range of animal species, and the mode of action is deemed relevant to humans, there is a sufficient scientific basis to support a conclusion that humans also could be at hazard for these effects under a chronic exposure condition.
9.4.2.1.2. Other noncancer effects. The negative results from available studies in several animal species (rats, mice, hamsters, rabbits, monkeys) indicate that DE is not likely to pose a reproductive or developmental hazard to humans. There has been some evidence from animal studies indicating possible neurological and behavioral effects, as well as liver effects. These effects, however, are seen at exposures higher than the respiratory effects. Overall, there is insufficient evidence to conclude that a low-exposure hazard exists for these endpoints (Chapter 5, Section 5.1.3.3).
9.4.2.2. Carcinogenic Effects Many epidemiologic and toxicologic studies have been conducted to examine the
potential for DE to cause or contribute to the development of cancer in humans and animals, respectively. In addition, there are some mode-of-action studies that seek to provide an improved understanding about the underlying carcinogenic process and thus contribute to a better understanding of the likelihood of hazard to humans. The available evidence indicates that chronic inhalation of DE is likely to pose a lung cancer hazard to humans. There is insufficient information for an evaluation of the potential cancer hazard of DE by oral and dermal routes of exposure.
9.4.2.2.1. Epidemiologic studies. Twenty-two epidemiologic studies about the carcinogenicity of workers exposed to DE in various occupations are reviewed in Chapter 7, Section 7.2. Exposure to DE has typically been inferred on the basis of job classification within an industry, with cumulative exposure based on duration of employment or age. Increased lung cancer risk, although not always statistically significant, has been observed in 8 out of 10 cohort studies and 10 of 12 case-control studies within several industries, including railroad workers, truck drivers, heavy-equipment operators, farm tractor operators, and professional diesel vehicle drivers. The increased lung cancer relative risks generally range from 1.2 to 1.5, although a few studies show relative risks as high as 2.6. Statistically significant increases in relative risk, 1.33 to 1.47, are also shown in two independent meta-analyses. The meta-analyses demonstrate the effect of pooling many studies and in this case show the positive relationship between DE exposure and lung cancer across a variety of DE-exposed occupations.
9-11

The generally small increases in lung cancer relative risk (1.2 to 1.5, i.e., less than 2) observed in the epidemiologic studies potentially weakens the evidence of causality. This is because with a relative risk of less than 2, if confounders (e.g., smoking, asbestos exposure) were having an effect on the observed risk increases, then it could be enough to account for the increased risk. With the strongest risk factor for lung cancer being smoking, there is a lingering uncertainty as to whether smoking effects may be influencing the magnitude of the observed increased relative risks, in spite of the fact that in key studies the investigating epidemiologists assert that they have effectively controlled for smoking. In studies in which the effects of smoking were controlled, increased relative risks for lung cancer prevailed. While some studies did not have information on smoking, confounding by smoking is judged unlikely to be significant if the comparison populations were from the same socioeconomic class.
As evaluated in Chapter 7 (Section 7.2.4.5), application of the criteria for causality provides a rational basis to conclude that the increased risks observed in available epidemiologic studies are consistent with a causal association between exposure to DE and occurrence of lung cancer. Overall, the human evidence for potential carcinogenicity for DE is judged to be strong but less than sufficient to satisfy the criteria for a “known” human carcinogen because of exposure uncertainties (lack of historical exposure of workers to DE) and residual uncertainty as to whether all confounders have been satisfactorily accounted for. The epidemiologic evidence is inconclusive for DE being associated with other forms of cancer.
9.4.2.2.2. Animal studies. DE and its organic constituents, both in the gaseous and particle phase, have been extensively tested for carcinogenicity in many experimental studies using several animal species and with different modes of administration. Several well-conducted studies have consistently demonstrated that chronic inhalation exposure to sufficiently high concentrations of DE produced dose-related increases in lung tumors (benign and malignant) in rats. In contrast, chronic inhalation studies of DE in mice showed equivocal results, whereas negative findings were consistently seen in hamsters. The gaseous phase of DE (filtered exhaust without particulate fraction), was found not to be carcinogenic in rats, mice, or hamsters. The available data indicate that among the traditional animal test species, the rat is the most sensitive species to DE. As reviewed in Chapter 7, Section 7.4, the lung cancer response in rats from high-concentration exposures to DE appears to be mediated by impairment of lung clearance mechanisms owing to particle overload, resulting in persistent chronic inflammation and subsequent pathologic and neoplastic changes (i.e., cancer) in the rat lung. Particle overload conditions in the human lung are not expected to occur as a result of environmental or most occupational exposures to DE. Thus, the increased lung tumors in the rat are not an appropriate
9-12
basis from which to judge the potential for a human hazard or perform a dose-response analysis to derive a cancer unit risk for humans.
In several intratracheal instillation studies, DPM, DPM organic extracts, and carbon black, which is virtually devoid of PAHs, have been found to produce increased lung tumors in rats. When directly implanted into the rat lung, DPM condensate containing mainly four- to seven-ring PAHs induced increases in lung tumors. DPM extracts also have been shown to cause skin tumors in several dermal studies in mice and sarcomas in mice following subcutaneous injection. Overall there are consistent findings of carcinogenic activity by the organic extracts of DPM in noninhalation studies (i.e., intratracheal instillation, lung implantation, skin painting). This contributes to the evidence for a potential human hazard.
9.4.2.2.3. Other key data. While not as extensive as the human and animal carcinogenicity data, other types of data are judged to be supportive of DE’s potential carcinogenicity in humans. As mentioned previously, DE is a complex mixture of hundreds of constituents in either the gaseous phase or particle phase. Although present in small amounts, several organic compounds in the gaseous phase (e.g., PAHs, formaldehyde, acetaldehyde, benzene, 1,3-butadiene) are known to exhibit mutagenic and/or carcinogenic activities. PAHs and PAH derivatives, including nitro-PAHs present on the diesel particle, also are known to be mutagenic and carcinogenic. As reviewed in Chapter 4, DPM and DPM organic extracts have been shown to induce gene mutations in a variety of high-dose bacteria and mammalian cell test systems. DPM and DPM organic extracts also have been shown to induce chromosomal aberrations, aneuploidy, and sister chromatid exchange in both rodent and human in vitro tests.
There also is suggestive evidence for the bioavailability of organic compounds from the DE mixture. Elevated levels of DNA adducts in lymphocytes have been reported in workers exposed to DE. In addition, inhalation studies of animals using radio-labeled materials indicate some elution of organic compounds from DPM after deposition in the lung as measured by their presence in biological tissue and fluids (Chapter 3, Section 3.5).
9.4.2.2.4. Modes of carcinogenic action. The term “mode of action” refers to a series of key biological events and processes that are critical to the development of cancer. As discussed in Section 9.4.2.2.2, there is an understanding of the modes of action for the DE-induced lung tumors in the rat. However, the modes of action by which DE increases lung cancer risks in humans are unknown, and the evidence in rats is not applicable to environmentally exposed humans.
As discussed in Chapter 7, Section 7.4, it is hypothesized that multiple modes of action could be involved in mediating the carcinogenic effect of DE. These modes of action may
9-13

include: (a) mutagenic events (e.g., direct effects on DNA and effects on chromosomes) by organic compounds in the gas and particle phase, (b) indirect DNA damage via the production of reactive oxygen species (ROS) induced by particle-associated organics, and (c) particle-induced chronic inflammatory response leading to oxidative DNA damage through the release of cytokines, ROS, etc., and an increase in cell proliferation.
In rats, the particulate phase appears to have the greatest contribution to the carcinogenic effects, and both the particle core and the associated organic compounds have demonstrated carcinogenic properties in one or more test systems. While limited rat data and comparative potency calculations suggest that gas-phase components are not the primary factors in the development of lung cancer, a contributory role of the recognized toxic components cannot be dismissed. The relative importance of the various modes of action may be different at different exposure levels. Evidence from rat studies indicates the importance of the EC component of the DE particle in mediating lung tumor response at high exposure levels. As for the particle-absorbed organics, their inherent toxicity potential gives rise to a hypothesis that they may play a role in low or high exposures to DE.
9.4.2.2.5. Weight-of-evidence evaluation. Chapter 7, Section 7.5, provides an evaluation of the overall weight of evidence for human carcinogenicity in accordance with EPA’s Guidelines for Carcinogen Risk Assessment (U.S. EPA, 1986, 1996a, 1999). The totality of evidence supports the conclusion that DE is a probable human carcinogen (Group B1) by inhalation exposure using the criteria in the 1986 guidelines. A cancer hazard narrative for DE also is provided in accordance with the revised draft 1996/1999 guidelines, which concludes that DE is likely to be carcinogenic to humans by inhalation from environmental exposures. The common bases for either conclusion include the following lines of evidence:
• strong but less than sufficient evidence for a causal association between DE exposure and increased lung cancer risk among workers in varied occupations where exposure to DE occurs;
• extensive supporting data including the demonstrated mutagenic and/or chromosomal effects of DE and its organic constituents, and knowledge of the known mutagenic and/or carcinogenic activity of a number of individual organic compounds present with particles and in the DE gases;
• evidence of carcinogenicity of DPM and the associated organic compounds in rats and mice by noninhalation routes of exposure; and
• suggestive evidence for the bioavailability of DE organics from DE in humans and animals.
9-14
A notable uncertainty in the characterization of the potential cancer hazard of DE at low levels of environmental exposure is the incomplete understanding of about its mode(s) of action for the induction of lung cancer in humans. Available data suggest that DE-induced lung carcinogenicity may be mediated by mutagenic and nonmutagenic events by both the particles and the associated organic compounds, and that a role for the organics in the gaseous phase cannot be ruled out. Given that there is some evidence for a mutagenic mode of action, a cancer hazard is presumed possible at environmental levels of exposure. This is consistent with EPA’s science policy position that assumes a nonthreshold effect for carcinogens with a mutagenic component in the absence of definitive data demonstrating a threshold or nonlinear mechanism. Additional support for an environmental hazard also comes from a comparison of the estimated environmental levels to the estimated occupational exposure levels where risk is seen. Given that there is only a minimal margin between environmental and occupational exposure ranges, if not an overlap, the extrapolation of observable hazard from the occupational setting to the ambient environment is relatively confident. Because of insufficient information, the human carcinogenic potential of DE by oral and dermal exposures cannot be determined.
Several organizations previously have reviewed available relevant data and evaluated the potential human carcinogenicity of DE or the particulate component (DPM) of DE. Similar conclusions were reached by various organizations (see Table 7-9). For example, some organizations have concluded that DE is probably carcinogenic to humans (IARC, 1989; IPCS, 1996), or reasonably is anticipated to be a carcinogen (NTP, 2000).
Overall, the weight of evidence for potential human carcinogenicity for DE is considered strong, even though inferences are involved. Uncertainties are present, however, and include the following unresolved issues.
First, there has been a considerable scientific debate about the significance of the available human evidence for a causal association between occupational exposure and increased lung cancer risk. Some experts view the evidence as weak and/or inconsistent while others consider the evidence compelling. This is due to a lack of consensus about whether the effects of smoking and other potential confounders have been adequately accounted for in key studies, and the lack of agreed-upon historical DE exposure data for the available studies.
Second, while the mode of action for DE-induced lung tumors in rats from high exposure is sufficiently understood, the mode of action for the DE lung cancer risk in humans is not known. To date, available evidence for the role of both the adsorbed organics and the carbon core particle has only been shown under high-exposure experimental animal test conditions. There is virtually no information about the relative role of DE constituents in mediating carcinogenic effects at the low-exposure levels.
9-15

Additional research is needed to address these issues to reduce the uncertainty associated with the potential cancer hazard of exposure to DE.
The relevance of this hazard characterization to current ambient DE exposures hinges on recognizing that the health effects data are derived from engine technologies and fuels that existed in the past, and that some changes in the DE exhaust mixture have occurred and can be expected in the future. Although decreases in amount and changes in composition of DE emissions have occurred over time for on-road engines, a change is slow to manifest in the environment because, for example, vehicular fleet turnover is slow and the change is slow to dominate across an engine fleet. Available studies have not focused on the potential toxicological effect of the emission changes. There is no compelling evidence at present to show that past and present exhaust characteristics are so toxicologically dissimilar as to render the current use of the assessment’s findings outdated.
9.5. DOSE-RESPONSE ASSESSMENT In assessments of estimated human health risks, human data from environmental
exposures are always preferred over animal data, if available, as their use obviates the need for extrapolation across species, e.g., from animals to humans. However, for most environmental agents, available health effects information is generally limited to occupational exposures in studies of humans (e.g., workers) or high experimental exposures to laboratory animals. For the agents with high-exposure data compared to environmental exposure levels of interest, dose-response assessment is performed in two steps: assessment of data in the observable range to derive a point of departure (which usually is the lowest exposure or dose that induces some, minimal, or no apparent effects), followed by extrapolation to lower exposures to the extent necessary. Extrapolation to low exposures is ideally based on the understanding of mode(s) of toxic action of the agent which allows the development and use of a mode of action specific exposure-response model. In the absence of sufficient data, default methods and models are used to extrapolate to the lower exposure levels.
For DE, there is sufficient evidence to conclude that acute or short-term inhalation exposure at relatively high levels can cause irritant effects to the eye, nose, and throat, respiratory symptoms, and neurophysiological symptoms such as headache, nausea, etc., however, no quantitative data are available to derive an estimate of human exposure that is not likely to elicit irritant and inflammatory effects in humans.
There is also sufficient evidence to support the conclusion that DE has the potential to cause cancer and noncancer effects of the lung from long-term inhalation exposure. Chapters 6 and 8 provide dose-response analyses related to the noncancer and cancer hazards to humans, respectively, from lifetime exposure to DE. A dose-response analysis to estimate the expected
9-16

response at environmental exposure levels has less uncertainty the closer the animal test or estimated human epidemiologic-related exposures are to the environmental levels of interest. With increasing exposure margins (EM), and thus a greater range of extrapolation, the uncertainty about the shape of the dose-response curve in the region of low-dose extrapolation increases and the possibility of a zero risk cannot be ruled out.
9.5.1. Evaluation of Risk for Noncancer Health Effects As discussed previously (Section 9.4.2.1), the evidence for potential chronic noncancer
health effects of DE is based primarily on findings from chronic animal inhalation studies showing a spectrum of dose-dependent chronic inflammation and histopathological changes in the lung in several animal species including rats, mice, hamsters, and monkeys. A limited number of epidemiologic investigations of workers exposed to DE have not provided consistently clear evidence of significant chronic respiratory effects associated with DE exposure. On the other hand, the relatively large epidemiologic database for ambient PM shows a clear relationship between respiratory effects and ambient fine PM that is partially composed of DPM. The specific role of DPM or any other source-related constituent of ambient PM in causing the observed respiratory effects has not been defined.
The approach taken in this assessment to estimate a level of DE in the air to which humans may be exposed throughout their lifetime without an appreciable risk of deleterious effects is to derive a reference concentration (RfC) for DE based on the consistent data for respiratory inflammation in the rat studies. This approach assumes that humans would respond to DE similarly to the tested animals under similar exposure conditions. An uncertainty of this approach stems from the circumstance that animal studies have used high DE exposures, and the animal results must be translated to humans as well as to lower exposure levels since the potential chronic health effects of DE in humans at environmental exposure levels cannot be ascertained from the available DE human data.
It also is relevant to recognize that DPM is a component of ambient fine PM and that there is a relative wealth of human effects data for ambient PM showing a similarity of certain adverse health effects for DPM and ambient fine PM. This allows one to reasonably expect that the PM2.5 National Ambient Air Quality Standard (NAAQS) would provide a measure of protection from DPM, reflecting DPM’s current and approximate proportion to PM2.5. Ambient PM2.5 has been shown to be statistically associated with increased mortality (especially among people over 65 years of age with preexisting cardiopulmonary conditions) and morbidity, as measured by increases in hospital admissions, respiratory symptom rates, and decrements in lung function with both long- and short-term changes in ambient PM2.5 concentrations.
9-17

9.5.1.1. Chronic Reference Concentrations for Diesel Exhaust An inhalation Reference Concentration (RfC) is based upon long-term data, i.e., chronic
exposure, and can be derived from either human or animal data. An RfC is correctly defined as “an estimate of a continuous inhalation exposure to the human population, including sensitive subgroups, with uncertainty spanning perhaps an order of magnitude, that is likely to be without appreciable risks of deleterious noncancer effects during a lifetime.” The RfC methodology assumes that there is an exposure threshold below which effects will not occur. The RfC is not a bright line; rather, as the long-term human exposure increases above the RfC, the margin of protection decreases.
With the absence of DE exposure-response data in humans, this assessment derives an RfC for DE based on dose-response data from four chronic inhalation studies in rats (Mauderly et al., 1987; Ishinishi et al., 1988; Heinrich et al., 1995; Nikula et al., 1995). All of these studies used DPM (expressed as :g/m3) as a measure of DE exposure. The pulmonary effects, including inflamation and histopathologic lesions, were considered to be the critical noncancer effects. As shown in Table 6-2, the no-observable-adverse-effects levels (NOAELs), the lowest-observable-adverse-effects levels (LOAELs), and the adverse effects levels (AELs) for lung inflammation and histopathologic changes were identified for the first three studies. For the Nikula et al. study, lower 95% confidence estimates of the concentrations of DPM associated with a 10% incidence (BMCL10) of chronic pulmonary inflammation and fibrosis were derived since NOAEL’s were not observed. For all four studies, human equivalent concentrations (HECs) corresponding to the animal NOAEL, LOAEL, AEL, and BMCL10 were then computed using a dosimetry model developed by Yu et al. (1991) as described in Chapter 6, Section 6.5.2, and Appendix A. The dosimetry model accounts for species differences (rat to human) in respiratory exchange rates, particle deposition efficiency, differences in particle clearance rates at high and low doses, and transport of particles to lymph nodes. The purpose is to identify the highest HEC value with no apparent effect, i.e., NOAELHEC.
The highest NOAELHEC associated with no apparent effect is 144 :g/m3 from the Ishinishi et al. (1988) study; this then becomes the point of departure for deriving an RfC. To obtain the RfC, this point of departure was divided by two types of uncertainty factors (UF): a factor of 3 recognizes interspecies (i.e., rat to human) extrapolation uncertainties, and a factor of 10 reflects uncertainties about interindividual human variation in sensitivity. An evaluation of the interspecies extrapolation issues for dosimeteric and pharmacodynamic equivalence between rats and humans showed that although some adjustments could be accounted for, there remained a residual uncertainty, and thus an uncertainty of 3 out of a possible factor of 10 is used. In the absence of mechanistic or specific data, a default value of 10 is considered appropriate to account for possible human variability in sensitivity, particularly for children and people with
9-18

preexisting respiratory conditions. The spectrum of the population that may have a greater susceptibility cannot be better characterized until there is additional knowledge about mode of action. The resulting RfC for DE is 5 :g/m3 of DPM.
Overall, the confidence level in the RfC is considered medium in a range of low to high confidence. A principal uncertainty of the RfC analysis is the reliance on animal data to predict human risk. The critical effects, chronic inflammation, and pathologic changes, which are well characterized in four animal species, are considered relevant to humans. Collective evidence for all poorly soluble particles, including DPM, indicates that the rat is the most sensitive laboratory animal species tested to date. Although in general the rat is thought to be more sensitive to lung injury than humans to poorly soluble particles (ILSI, 2000), it is not clear that this is the case specifically for diesel. We must recall that DE is a mixture of not just carbon particles but also various organics, both on the particles and in gases. In addition, differences in particle deposition, retention, and clearance mechanisms have been largely but perhaps not completely addressed by the use of the rat-to-human dosimetry model. The use of rat data is not likely to grossly underestimate the human risk for pulmonary noncancer health effects. In terms of the potential for other critical health effects, there is growing evidence suggesting that DE can exacerbate allergenic effects to known sensitizers, while also evoking production of biochemical markers typically associated with asthma. Some work in this area indicates that humans may be as sensitive as rats and mice to the immunologic effects (Chapter 6, Section 6.3.4). This database is currently lacking key exposure-response data, but may in the future provide an alternative basis for RfC derivation. It also should be noted that the ambient PM health effects data show a broader array of adverse human health concerns (e.g., cardiovascular effects, as well as acute exposure effects). With DPM being a ubiquitous component of ambient PM, there is an uncertainty about the adequacy of the existing DE noncancer database to identify all of the pertinent DE-caused noncancer health hazards.
9.5.1.2. Risks Based on Ambient PM2.5
As discussed in Chapter 6 (Section 6.4), in 1997 EPA established an annual NAAQS for PM2.5, at a level of 15 :g/m3 to provide protection against adverse health effects associated with both long- and short-term exposures to ambient fine PM. DPM is a typical constituent of ambient fine PM (generally about 10% of PM2.5 with some examples up to 36%).2 Given the
2“A qualitative comparison of adverse effects of exposure to DPM and ambient fine PM shows that the respiratory system is adversely affected in both cases, though a wider spectrum of adverse effects has been identified for ambient fine PM. In contrast to the diesel PM database, there is a wealth of human data for fine PM noncancer effects which indicates that the health effects from fine PM do not have a discernable threshold at this time.”
9-19

similarity of health concerns for respiratory inflammation and pulmonary health effects from both DPM and fine particles, it is reasonable to expect that DPM contributes to some of the health effects associated with PM2.5. Current knowledge is insufficient, however, to describe the relative potencies of DPM and the other components of PM2.5. As long as the percentage of DPM to total ambient PM2.5 remains in similar proportion, protective levels for PM2.5 would be expected to offer a measure of protection from effects associated with DPM.
9.5.1.3. Conclusions This assessment estimates an exposure air level of DE (as measured by DPM) to which
humans may be exposed throughout their lifetime without experiencing any adverse noncancer health effects. The approach taken applies the RfC method using data specific to DE to produce an RfC of 5 :g/m3 of DPM on the basis of four chronic inhalation studies of DE in rats and a composite uncertainty factor of 30. In addition, this assessment also recognizes the relative wealth of data regarding health effects associated with ambient PM and presumes that a health protective level for PM2.5 also would be expected to provide a measure of protection from DPM, a constituent part of PM2.5. The PM2.5 standard of 15 :g/m3 as an annual average thus is expected to provide a measure of protection from DPM noncancer health effects, reflecting DPM’s current approximate proportion to PM2.5.
9.5.2. Evaluation of Cancer Risks As discussed in Section 9.4.3, the combined weight of evidence indicates that DE has the
potential to pose a cancer hazard to humans at anticipated levels of environmental exposure. The target organ of DE-induced carcinogenicity is the lung. Strong evidence exists for a causal relationship between risk for lung cancer and occupational exposure to DE in certain occupational workers such as railroad workers, truck drivers, heavy-equipment operators (e.g., shipyard, diesel farm equipment, and construction), and transit workers. The evidence, however, was less than sufficient to confidently characterize DE as carcinogenic to humans, and instead the assessment concludes that DE is likely to be a human carcinogen. It also has been shown unequivocally in several studies that DE can cause benign and malignant lung tumors in rats in a dose-related manner following chronic inhalation exposure to high concentrations; however, this response is not thought applicable to predict a hazard to humans exposed at lower environmental levels. The mechanism(s) by which DE would induce lung cancer in humans has not been established, but available data suggest that mutagenic and nonmutagenic modes of action are possible. Hence, for estimating DE cancer risk at low environmental exposures, linear low-dose extrapolation would be considered an appropriate default assumption, which is consistent with EPA’s science policy position that in the absence of an understanding of modes of carcinogenic
9-20

action, a nonthreshold effect is to be presumed (U.S. EPA, 1986, 1996a). This same assumption has been used by other organizations/risk assessors who have previously used either linear risk extrapolation models or mechanistically based models to estimate cancer risk from environmental exposure to DE (e.g., WHO-IPCS, 1996; Cal EPA, 1998; also see Appendix C).
Dose-response assessment is based on either human or animal data, although human data are always preferred if available. Several quantitative assessments have been conducted by organizations and investigators on the basis of both occupational data and rat data (see Appendix C). However, more recent evidence indicates that DE causes tumors in the rat lung via a mode of action that involves impairment of lung clearance mechanisms (referred to as “lung overload response”) associated with high exposures. This lung overload response is not expected in humans exposed to environmental levels (nor is it expected to occur in many occupational exposures), and thus the rat lung tumor dose-response data are not considered suitable for predicting human risk at low environmental exposures. Given that the rat data are not appropriate for estimating cancer risk to humans, this assessment focuses on using the occupational epidemiologic data for estimating environmental risk of DE to humans.
Even though occupational data are considered most relevant for use in dose-response assessment, uncertainties exist, including the following issues:
• the use of DPM (expressed as :g/m3) as a surrogate dosimeter for DE exposure, given that the relative roles of various constituents in mediating carcinogenic effects and the mode of carcinogenic action are still unknown;
• the representativeness of occupational populations for the general population and vulnerable subgroups, including infants and children and individuals with preexisting diseases, particularly respiratory conditions;
• the lack of actual DE exposure data for workers in the available epidemiologic studies;
• possible confounders (smoking and asbestos exposure) that could contribute to the observed lung cancer risk in occupational studies of DE if the control for these confounders is not adequate; and
• whether or not an exposure-response relationship for occupational lung cancer risk can be estimated for DE.
Chapter 8, Section 8.3, provides a discussion of these uncertainties, along with an evaluation of the suitability of available occupational studies for a derivation of a cancer unit risk estimate for DE. Unit risk is defined as the estimated upper-bound cancer risk at a specific exposure or dose
9-21

from a continuous average lifetime exposure of 70 years (in this case, cancer risk per :g/m3 of DPM).
Among the occupational studies, the railroad worker studies (Garshick et al., 1987, 1988) and the Teamsters Union truck driver studies (Steenland et al., 1990, 1998) are considered to have the best available exposure data for possible use in establishing exposure-response relationships and deriving a cancer unit risk. There have been different views on the suitability of these studies for estimating environmental cancer risks (e.g., Cal EPA, 1998; HEI, 1995, 1999). Given the equivocal evidence for the presence or absence of an exposure-response relationship for the study of railroad workers, and exposure uncertainties for the study of truck drivers, it is judged that available data are too uncertain at this time for the development of a confident quantitative dose-response analysis and subsequent derivation of cancer unit risk for DE.
In the absence of a cancer unit risk to assess population cancer risk, this assessment provides a “perspective” about the possible magnitude of risk in the population from environmental exposure to DE. One approach to estimating the possible magnitude of risk involves simply noting that risks to the general public would be low in comparison with occupational risk if the differences in the lower environmental exposures compared to the higher occupational exposures are large. If the differences are small, the environmental risks would approach the workers’ risk observed in studies of past occupational exposures. A comparison of environmental equivalent occupational and ambient environmental exposures showed that for certain occupations, there is a potential for overlap between environmental exposure and the estimated environmental equivalent occupational exposure, while in other cases the environmental exposures could be up to about 100-fold lower than the occupational levels (see Table 8-1). For the exposure overlap case, one can infer that the environmental risk could be the same as, or approach, the risk magnitudes observed in the occupational studies. In the 100-fold lower case, the environmental risk could be about 100-fold lower than the observed risk magnitudes in the occupational studies. Risks to the general public are of potential concern when a significant risk is seen in the occupational setting and the difference between occupational and ambient exposure may overlap or is relatively small (within one to two orders of magnitude).
A second approach, which is related to the first approach but more quantitative, is to estimate possible ranges of lung cancer risk from occupational exposures to DE, and then use a proportional relationship of exposure differences (e.g., EMs) to scale the occupational risk to the environmental exposure setting. Given the range of observed relative risks or odds ratios of lung cancer in a number of occupational studies, a relative risk increase of 1.4 was selected as a reasonable estimate of occupational risk for the purpose of this analysis. The relative risk of 1.4
9-22
means that the workers faced an extra risk that is 40% higher than the approximate 5% background lifetime lung cancer risk in the U.S. population. Using the relationship [excess risk = (relative risk-1) × background risk], 2% of these DE-exposed workers (i.e., 10-2 risk) would have been at risk (and developed lung cancer) attributable to occupational exposure to DE.
Using a nationwide average environmental exposure (0.8 :g/m3 DPM), and assuming (a) the excess lung cancer risk from occupational exposure is about 10-2; and (b) the past occupational exposures were no higher than about 1,200 :g/m3 (equivalent to an environmental equivalent EM of 315, connoting a relatively large EM), the environmental cancer risk would fall between 10-4 and 10-5. The selection of 1,200 :g/m3 is a very high value intentionally selected to illustrate a high-end exposure boundary and thus a lower bounding of risk calculated by this exploratory approach. On the other hand, if occupational exposures for some groups were lower, for example, closer to 100 :g/m3 (equivalent to an environmental equivalent EM of 26, connoting a smaller EM), the environmental risk would be higher and approach 10-3. The selection of 100 :g/m3 is purposefully toward the lower end of the reported occupational exposure range which spans 7–403 :g/m3 in Table 8-1. The risk estimates are attended by numerous uncertainties; their inclusion in this document does not constitute Agency endorsement of their validity as a surrogate for cancer unit risk; the range of values is not useful for estimating numbers of cancer cases; and the range of possible risk from environmental exposures also could be lower and a zero risk cannot be ruled out.
These types of exploratory analyses are not intended to be precise or provide a definitive characterization of cancer risk but are useful in illustrating and gauging the possible range of risk based on applying reasonable judgment. The analyses provides a sense of where an upper limit (or “upper bound”) of the risk may be. These analyses are subject to uncertainties, particularly the lack of actual exposure information for the occupational epidemiologic studies and the use of public-health-conservative risk assessment assumptions. The possible risks also could be lower and a zero risk cannot be ruled out because (a) some individuals in the population may have a high tolerance to exposure from DE and therefore not be susceptible to cancer from environmental exposure, and (b) although not reported, there could be a threshold of exposure below which there is no cancer risk. Given these circumstances, we refer to this risk analysis as a “perspective” on possible risks. Best scientific judgment guided the selection of assumptions and other elements of this analysis which are deemed reasonable and appropriate for identifying possible risks based on the information currently available. Further research is needed to more accurately assess and characterize environmental cancer risks from DE.
9-23
9.6. SUMMARY AND CONCLUSIONS The available health effects data show that acute (short-term episodic exposure) and
chronic (long-term) exposure to DE can pose hazards to humans and that environmental exposures, in some cases, may have a risk.
At relatively high acute exposures, DE can cause acute irritation to the eye and upper respiratory airways and symptoms of respiratory irritation which may be temporarily debilitating. Evidence also shows that DE has immunological toxicity that can induce allergic responses (some of which are also typical of asthma) and/or exacerbate existing respiratory allergies. While the hazard potential is important for these acute and short exposure-related effects, quantitative dose-response estimates for these effects could not be developed because of the lack of exposure-response information.
It is concluded that long-term exposure to low levels of DE poses a hazard for chronic inflammation and pathological changes in the human lung. A level of human lifetime exposure thought to be without appreciable risk for lung damage is estimated to be 5 :g/m3 of DPM, this being a calculated RfC value for DE. Because DPM is a constituent of ambient PM2.5 and there is some similarity in potential adverse effects from DE and PM2.5, it is expected that a measure of protection from health effects associated with DE is provided by the 1997 annual PM2.5 NAAQS, set at a level of 15 :g/m3.
DE is considered to pose a human lung carcinogenicity hazard, which is expressed in a weight-of-evidence conclusion that DE is judged to be a “probable” human carcinogen, or is “likely to be carcinogenic in humans by inhalation” at environmental or higher exposure conditions. Because of uncertainty in the available exposure-response data, a cancer unit risk/cancer potency for DE has not been derived. One should note that the closeness of the high-end environmental exposures and low-end estimates of occupational exposure suggest less uncertainty in the extrapolation of hazard and possible risk to the environmental setting. Exploratory analyses using public health conservative assumptions provides a perspective on the possible range of lung cancer risk from environmental exposure to DE. Best scientific judgment guided the selection of assumptions and other elements of this analysis which are deemed reasonable and appropriate for identifying possible risks based on the information currently available. These analyses indicate that lifetime cancer risk may exceed 10-5 and could be as high as 10-3 or nearly so, though considering the assumptions used and the uncertainties, lower risk is possible and a zero risk cannot be ruled out. This range of values is attended by numerous uncertainties, the inclusion of the range in this assessment does not constitute Agency endorsement of their validity as surrogates for cancer unit risk values, and the range is not suitable for estimating numbers of cancer cases. These risk findings should not be viewed as a definitive characterization of risk.
9-24

Even though the evidence for potential human health hazards for DE is convincing and persuasive, uncertainties exist because of the use of assumptions to bridge data and knowledge gaps about human exposures to DE and the underlying mechanisms by which DE may cause the observed toxicities in humans and animals. A notable uncertainty of this assessment is how the physical and chemical nature of DE emissions has changed over the years because the toxicological and epidemiologic observations are based on older engines and their emissions, yet the desire is to focus on the potential health hazards related to exposure from present-day or future emissions. There have been changes in the physical and chemical composition of some DE emissions (on-road vehicle emissions) over time, though there is no definitive information to show that the emission changes portend significant toxicological changes. The mode(s) of action for DE toxicity in humans is not understood, and hence knowledge is lacking about the role of exhaust mixture components in modulating the toxicity. Taken together, these considerations have lead to a judgment that the hazards identified from older technology-based exposures are applicable to current-day exposures. As new and cleaner diesel engines replace a substantial number of existing engines, the general applicability of the conclusions in this assessment will need to be reevaluated.
Other uncertainties include the assumptions that health effects observed at high doses may be applicable to low doses, and that toxicologic findings in laboratory animals are predictive of human responses. Also, the available data are not sufficient to demonstrate the absence or presence of an exposure/dose-response threshold in humans for DE toxicity at environmental exposures. Again, this is due in part to the lack of understanding of how DE may cause adverse health effects in exposed humans and laboratory animals. Although there are hypotheses about the specific mechanisms by which DE might cause cancer and other toxicities, no specific biological pathways or specific constituents of DE have been firmly established as responsible for low-dose effects. The assumptions used in this assessment, i.e., the presence of a biological threshold for chronic respiratory effects based on cumulative dosage and the absence of a threshold for lung cancer stemming from subtle and irreversible effects, are considered prudent and reasonable default choices.
The characterization of health hazards and risks contained in this document assumes that the potential DE health hazards are relevant for long-term exposures, up to and including lifetime exposures, and would apply to a wide spectrum of individuals but not necessary those that would have significant differential susceptibility. There is no DE-specific information that provides direct insight into the question of differential susceptibility within the general human population or vulnerable subgroups, for example, children or the elderly. Although default approaches to account for interindividual variation have been included in the derivation of the noncancer effects RfC (i.e., use of an uncertainty factor of 10), this may or may not adequately
9-25
protect certain subgroups that could be more vulnerable. Differential susceptibility to DPM among individuals in the population would be due to differences in dosimetry (i.e., differences in retained particle mass or number in the lung) and/or differences in respiratory system tissue response sensitivity. From the dosimetry perspective, we understand that age, gender, and disease status can influence deposition in the lung and other areas of the respiratory tract (U.S. EPA, 1996b, Section 10.7.7). For example, given that DE chronic toxicity is focused on the respiratory system, vulnerable subgroups might include those individuals who predispose their lungs to increased particle retention (e.g., smoking, high particulate burdens from nondiesel sources) or those having existing respiratory or lung inflammation, repeated respiratory infections, or chronic bronchitis or asthma. For children, there is also the hypothesis of possible increased sensitivity to exposure, given the ongoing processes of development from birth to maturation, of the respiratory and immune systems.
Despite the uncertainties regarding intraspecies variability, the default approach of using an uncertainty factor of 10 in the derivation of the noncancer effects RfC to account for possible interindividual variation in the toxic response to DE exposure is appropriate and reasonable given the lack of DE-specific data.
Variation in DE exposure is another source of uncertainty. Because of variation in human activity patterns and their proximity to DE sources of emissions, different population subgroups could potentially receive higher or lower exposure to DE. The highest exposed are clearly occupational subgroups whose job brings them very close to DE sources, such as diesel engine vehicle drivers and workers, diesel powered machinery operators, some underground miners, etc. High exposures in the general population would be to those living very near or having time outdoors in proximity to DE sources as well as those engaged in activities that cause high breathing rates where DE is present. Accordingly, where appropriate, analyses in this assessment have included possible high-end DE exposures in addition to the lower nationwide average exposure estimates.
Lastly, this assessment considers only potential heath effects from exposures to DE alone. DE exposure could be additive or synergistic to concurrent exposures to other air pollutants. For example, there is evidence that DPM that has been altered by being in the presence of ambient ozone significantly increases the rat lung inflammatory effect compared to DPM that was not subjected to ozone (Madden et al., 2000). This observation suggests a hypothesis that inflammation-related noncancer hazards of airborne DPM may be worsened by the increasing presence of ozone in the ambient air. Other concerns include the possible impacts for children and adults on the exacerbation of existing allergens resulting from DE exposure. However, in the absence of more definitive data demonstrating interactive effects
9-26

from combined exposures to DE and other pollutants, it is not possible to further address these issues at this time.
REFERENCES FOR CHAPTER 9
California Environmental Protection Agency-OEHHA (Cal EPA). (1998) Part B: Health risk assessment for diesel exhaust, Public and Scientific Review Draft. February 1998.
Garshick, E; Schenker, MB; Munoz, A; et al. (1987) A case-control study of lung cancer and diesel exhaust exposure in railroad workers. Am Rev Respir Dis 135:1242-1248.
Garshick, E; Schenker, MB; Munoz, A; et al. (1988) A retrospective cohort study of lung cancer and diesel exhaust exposure in railroad workers. Am Rev Respir Dis 137:820-825.
Health Effects Institute (HEI). (1995) Diesel exhaust: a critical analysis of emissions, exposure, and health effects. Cambridge, MA: Health Effects Institute.
HEI. (1999) Diesel emissions and lung cancer: epidemiology and quantitative risk assessment. A special report of the Institute’s Diesel Epidemiology Expert Panel. Cambridge, MA: Health Effects Institute.
Heinrich, U; Fuhst, R; Rittinghausen, S; et al. (1995) Chronic inhalation exposure of Wistar rats and two different strains of mice to diesel engine exhaust, carbon black, and titanium dioxide. Inhal Toxicol 7:553-556.
International Agency for Research on Cancer (IARC). (1989) Diesel and gasoline engine exhausts and some nitroarenes. IARC monographs on the evaluation of carcinogenic risks to humans: v. 46. Lyon, France: World Health Organization; pp. 41-185.
International Life Sciences Institute (ILSI). (2000) ILSI Risk Science Institute workshop: the relevance of the rat lung response to particle overload for human risk assessment. Gardner, DE, ed. Inhal Toxicol 12(1-2).
International Programme on Chemical Safety (IPCS), World Health Organization. (1996) Diesel fuel and exhaust emissions. Environmental Health Criteria 171. Geneva: World Health Organization.
Ishinishi, N; Kuwabara, N; Takaki, Y; et al. (1988) Long-term inhalation experiments on diesel exhaust. In: Diesel exhaust and health risks. Results of the HERP studies. Ibaraki, Japan: Research Committee for HERP Studies; pp. 11-84.
Madden, M; Richards, J; Dailey, L; et al. (2000) Effect of ozone on diesel exhaust toxicity in rat lung. Toxicol Appl Pharmacol 168:140-148.
Mauderly, JL; Jones, RK; Griffith, WC; et al. (1987) Diesel exhaust is a pulmonary carcinogen in rats exposed chronically by inhalation. Fundam Appl Toxicol 9:208-221.
National Toxicology Program (NTP). (2000) 9th report on carcinogens. Public Health Service, U.S. Department of Health and Human Services, Research Triangle Park, NC. Available from: http://ntp-server.niehs.nih.gov.
Nikula, KJ; Snipes, MB; Barr, EB; et al. (1995) Comparative pulmonary toxicities and carcinogenicities of chronically inhaled diesel exhaust and carbon black in F344 rats. Fundam Appl Toxicol 25:80-94.
Steenland, K; Silverman, DT; Hornung, RW. (1990) Case-control study of lung cancer and truck driving in the Teamsters Union. Am J Public Health 80:670-674.
9-27

Steenland, K; Deddens, J; Stayner, L. (1998) Diesel exhaust and lung cancer in the trucking industry: exposure-response analyses and risk assessment. Am J Ind Med 34:220-228.
U.S. Environmental Protection Agency (EPA). (1986) Guidelines for carcinogen risk assessment. Federal Register 51(185):33992-34003.
U.S. EPA. (1996a) Proposed guidelines for carcinogen risk assessment. Office of Research and Development. Federal Register 61(79):17960-18011. EPA/600/P-92/003C.
U.S. EPA. (1996b) Air quality criteria for particulate matter. National Center for Environmental Assessment; Research Triangle Park, NC: EPA/600/P-95/001aF.
U.S. EPA. (1999) Guidelines for Carcinogen Risk Assessment. Review Draft. NCEA-F-0644, July. Risk Assessment Forum, Washington, DC. http://www.epa.gov/ncea/raf/cancer.htm.
U.S. EPA. (2000) National air pollutant emission trends, 1900-1998. EPA-454/R-00-002, March.
World Health Organization (WHO-IPCS). (1996) Diesel fuel and exhaust emissions. Environmental Health Criteria 171, WHO-IPCS, Geneva, Switzerland.
Yu, CP; Yoon, KJ; Chen, YK. (1991) Retention modeling of DE particles in rats and humans. J Aerosol Med 4:79-115.
9-28

Appendix A
Calculation of Human Equivalent Continuous Exposure Concentrations (HECs)
A-1

A.1. INTRODUCTION As discussed in Chapter 3, the lung burden of diesel particulate matter (DPM) during
exposure is determined by both the amount and site of particle deposition in the lung and, subsequently, by rates of translocation and clearance from the deposition sites. Mathematical models have often been used to complement experimental studies in estimating the lung burdens of inhaled particles in different species under different exposure conditions. This appendix presents a mathematical model that simulates the deposition and clearance of DPM in the lungs of rats and humans of Yu et al.(1991) also published as Yu and Yoon (1990).
Diesel particles are aggregates formed from primary spheres 15-30 nm in diameter. The aggregates are irregularly shaped and range in size from a few molecular diameters to tens of microns. The mass median aerodynamic diameter (MMAD) of the aggregates is typically 0.2 µm and is polydisperse with a geometric standard deviation of around 2.3. The organics adsorbed onto the aggregates normally account for 10% to 30% of the particle mass. However, the exact size distribution of DPM and the specific composition of the adsorbed organics depend upon many factors, including engine design, fuels used, engine operating conditions, and the thermodynamic process of exhaust. The physical and chemical characteristics of DPM have been reviewed extensively by Amann and Siegla (1982) and Schuetzle (1983).
Four mechanisms deposit DPM within the respiratory tract during exposure: impaction, sedimentation, interception, and diffusion. The contribution from each mechanism to deposition, however, depends upon lung structure and size, the breathing condition of the subject, and particle size distribution. Under normal breathing conditions, diffusion is the most dominant mechanism and the other three mechanisms play minor roles.
Once DPM is deposited in the respiratory tract, both the carbonaceous core and the adsorbed organics will be removed from the deposition sites by mechanical clearance, provided by mucociliary transport in the ciliated conducting airways as well as macrophage phagocytosis and migration in the nonciliated airways, and dissolution. As the carbonaceous core or soot of DPM is insoluble, it is removed from the lung primarily by mechanical clearance, whereas the adsorbed organics are removed principally by dissolution (Chapter 3).
A.2. PARTICLE MODEL To develop a mathematical model that simulates the deposition and clearance of DPM in
the lung, an appropriate model for diesel particles must be introduced. For the deposition study, an equivalent sphere model developed by Yu and Xu (1987) was used to simulate the dynamics and deposition of DPM in the respiratory tract by various mechanisms. For the clearance study, a diesel particle is assumed to be composed of three different material components according to their characteristic clearance rates: (1) a carbonaceous core of approximately 80% of the particle
A-2

mass; (2) absorbed organics of about 10% of particle mass, which are slowly cleared from the lung; and (3) adsorbed organics quickly cleared from the lung, accounting for the remaining 10% of particle mass. The presence of two discrete organic phases in the particle model is suggested by observations that the removal of particle-associated organics from the lung exhibits a biphasic clearance curve (Sun et al., 1984; Bond et al., 1986), as discussed in Chapter 3. This curve represents two major kinetic clearance phenomena: a fast- phase organic washout with a half-time of a few hours, and a slow phase with a half-time that is a few hundred times longer. The detailed components involved in each phase are not known. It is possible that the fast phase consists of organics that are leached out primarily by diffusion mechanisms while the slow phase might include any or all of the following components: (a) organics that are “loosened” before they are released, (b) organics that have become intercalated in the carbon core and whose release is thus impeded, (c) organics that are associated for longer periods of time because of hydrophobic interaction with other organic-phase materials, (d) organics that have been ingested by macrophages and as a result effectively remain in the lung for a longer period of time because of metabolism by the macrophage (metabolites formed may interact with other cellular components), and (e) organics that have directly acted on cellular components, such as the formation of covalent bonds with DNA and other biological macromolecules to form adducts.
The above distinction of the organic components is general and made to account for the biphasic clearance of DPM; it does not specifically imply the actual nature of the adsorbed organics. For aerosols made of pure organics, such as benzo(a)pyrene (BaP) and nitropyrene (NP) in the same size range of DPM, Sun et al. (1984) and Bond et al. (1986) observed a nearly monophasic clearance curve. This might be explained by the absence of intercalative phenomena (a) and of hydrophobic interaction imposed by a heterogeneous mixture of organics (b). The measurement of a pure organic might also neglect that quantity which has become intracellularly (c) or covalently bound (d).
A.3. COMPARTMENTAL LUNG MODEL The model of Yu et al. (1991) comprises three principal compartments involved in
deposition and clearance: tracheobronchial (T or TB), alveolar (A), and lung-associated lymph node (L), as shown in Figure A-1. The outside compartments blood (B) and GI tract (G) and nasopharyngeal or head (H) are also represented. The alveolar compartment in the model is obviously the most important for long-term retention studies. However, for short-term consideration, retentions in other lung compartments may also be significant. The presence of these lung compartments and the two outside compartments in the model therefore provides a complete description of all clearance processes involved.
A-3

In Figure A-1, r (i) T, and r (i)
H, r (i) A are, respectively, the mass deposition rates of DE material
component i (i=1 [core], 2 [slowly cleared organics], and 3 [rapidly cleared organics]) in the head, tracheobronchial, and alveolar compartments; and λ(i)
XY represents the transport rate of material component i from any compartment X to any compartment Y. Let the mass fraction of material component i of a diesel particle be ƒi. Then
r (i) ' fi rH , (A-1)H
rT (i)
' fi rT , (A-2)
rA (i)
' fi rA , (A-3)
where rH, rT, and rA are, respectively, the total mass deposition rates of DPM in the H, T, and A compartments, determined from the equations:
rH ' c(TV)(RF)(DF)H , (A-4)
rT ' c(TV)(RF)(DF)T , (A-5)
rA ' c(TV)(RF)(DF)A . (A-6)
In Equations A-4 to A-6, c is the mass concentration of DPM in the air, TV is the tidal volume, RF is the respiratory frequency, and (DF)H, (DF)T, and (DF)A are, respectively, the deposition fractions of DPM in the H, T, and A compartments over a respiratory cycle. The
A-4

values of (DF)H, (DF)T, and (DF)A, which vary with the particle size, breathing conditions, and lung architecture, were determined from the deposition model of Yu and Xu (1987).
The differential equations for m(i)XY, the mass of material component i in compartment X as
a function of exposure time t, can be written as
Head (H)
Tracheobronchial (T)
Alveolar (A)
Lymph nodes (L)
dmT (i)
dt
dmA (i)
dt
dm (i) H ' r (i) & λ(i)
H HBm (i) , (A-7)dt H HGm (i) & λ(i)
H
' rT (i)
% λ(i) TGmT
(i) & λ(i)
ΑTmA (i)
& λ(i) TBmT
(i) , (A-8)
' rA (i)
& λ(i) ALmA
(i) & λ(i)
ATmA (i)
& λ(i) ABmA
(i) , (A-9)
dmL (i)
' λ(i) LBmL
(i) . (A-10)ALmA (i)
& λ(i)
dt
Equation A-9 may also be written as
A mA (i) , (A-11)
dmA (i)
' rA (i)
& λ(i)
dt
where
λ(i) ' λ(i)
% λ(i) % λ(i) . (A-12)A AT AL AB
is the total clearance rate of material component i from the alveolar compartment. In Equations A-7 to A-10, we have assumed vanishing material concentration in the blood compartment to calculate diffusion transport.
The total mass of the particle-associated organics in compartment X is the sum of m (2)X
and m (3)X the total mass of DPM in compartment X is equal to
mX ' mX (1)
% mX (2)
% mX (3) (A-13)
A-5
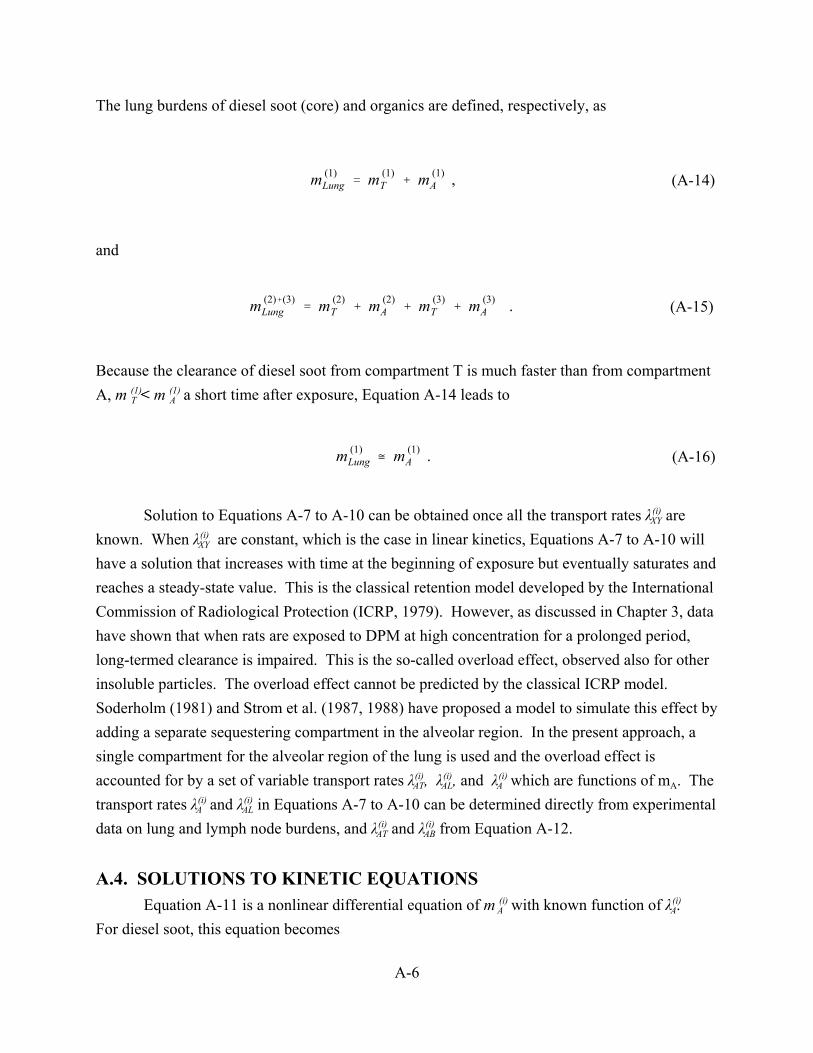
<
The lung burdens of diesel soot (core) and organics are defined, respectively, as
m (1) Lung ' mT
(1) % mA
(1) , (A-14)
and
m (2)%(3) ' mT
(2) % mA
(2) % mT
(3) % mA
(3) . (A-15)Lung
Because the clearance of diesel soot from compartment T is much faster than from compartment A, m (1)
AT < m (1) a short time after exposure, Equation A-14 leads to
m (1) Lung – mA
(1) . (A-16)
Solution to Equations A-7 to A-10 can be obtained once all the transport rates λ(i)XY are
known. When λ(i) are constant, which is the case in linear kinetics, Equations A-7 to A-10 willXY
have a solution that increases with time at the beginning of exposure but eventually saturates and reaches a steady-state value. This is the classical retention model developed by the International Commission of Radiological Protection (ICRP, 1979). However, as discussed in Chapter 3, data have shown that when rats are exposed to DPM at high concentration for a prolonged period, long-termed clearance is impaired. This is the so-called overload effect, observed also for other insoluble particles. The overload effect cannot be predicted by the classical ICRP model. Soderholm (1981) and Strom et al. (1987, 1988) have proposed a model to simulate this effect by adding a separate sequestering compartment in the alveolar region. In the present approach, a single compartment for the alveolar region of the lung is used and the overload effect is accounted for by a set of variable transport rates λ(i)
AL, and λA(i) which are functions of mA. TheAT, λ(i)
transport rates λA(i) and λ(i)AL in Equations A-7 to A-10 can be determined directly from experimental
data on lung and lymph node burdens, and λ(i) AB from Equation A-12.AT and λ(i)
A.4. SOLUTIONS TO KINETIC EQUATIONS Equation A-11 is a nonlinear differential equation of m A(i) with known function of λA(i.)
For diesel soot, this equation becomes
A-6
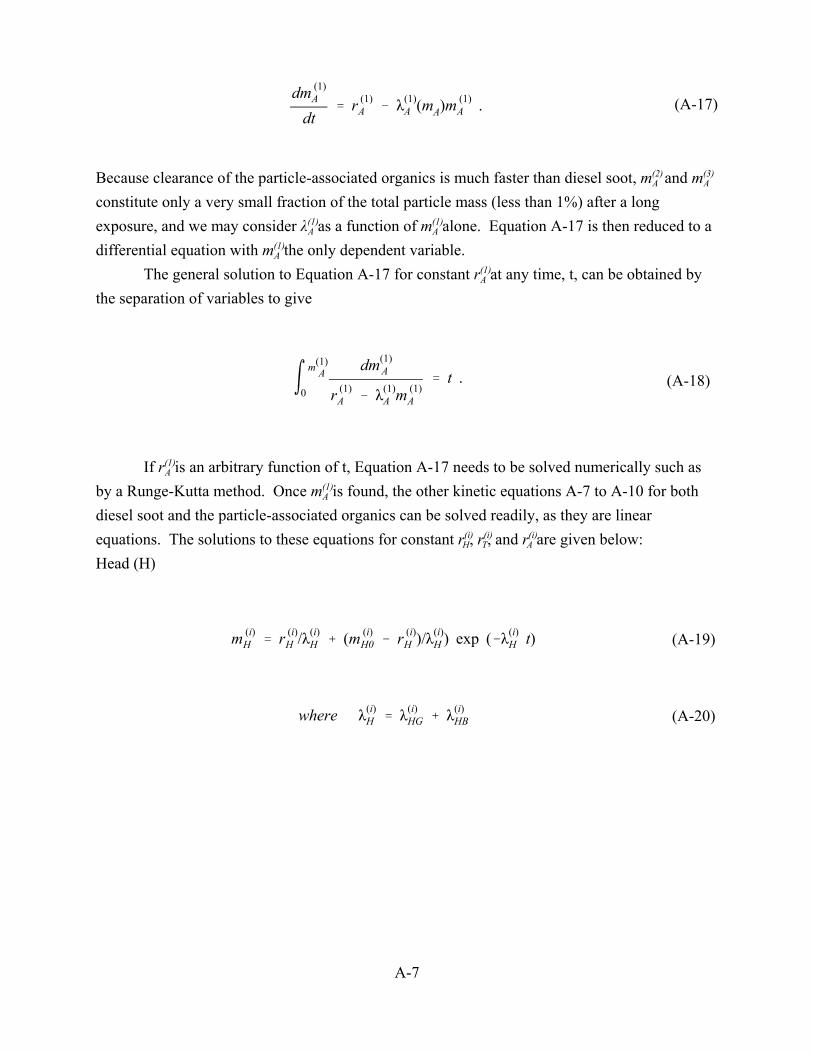
dmA (1)
' r (1) & λ(1)
A A (mA)mA (1) . (A-17)
dt
Because clearance of the particle-associated organics is much faster than diesel soot, m(2) and m(3)A A
constitute only a very small fraction of the total particle mass (less than 1%) after a long exposure, and we may consider λ(1)
A alone. Equation A-17 is then reduced to aA as a function of m(1)
differential equation with m(1)A the only dependent variable.
The general solution to Equation A-17 for constant r(1)A at any time, t, can be obtained by
the separation of variables to give
0
m(1) dm(1) A
r (1) A
A mA (1)
' t . (A-18) A & λ(1)
If r(1)A is an arbitrary function of t, Equation A-17 needs to be solved numerically such as
by a Runge-Kutta method. Once m(1)A is found, the other kinetic equations A-7 to A-10 for both
diesel soot and the particle-associated organics can be solved readily, as they are linear equations. The solutions to these equations for constant r(i)
T, and rA(i)are given below:H, r(i)
Head (H)
m (i) ' r (i) H H0 H )/λ(i)
HH H /λ(i)
% (m (i) & r (i) H ) exp (&λ(i) t) (A-19)
where λ(i) ' λ(i)
HB (A-20)H HG % λ(i)
A-7

Tracheobronchial (T)
t mT
(i) ' exp (&λ(i) t )
0 ( rT
(i) % λ(i) mA
(i) ) exp (λ(i) t ) dt % m (i) (A-21)T AT T T0
where λ(i) ' λ(i)
% λ(i) (A-22)T TG TB
Lymph nodes (L)
t
LB 0
ALmA (i)exp(λ(i) t ) dt % m (i)mL
(i) ' exp(&λ(i) t) λ(i)
LB L0 ) (A-23)
In Equations A-19 to A-23, m (i)XO represents the value of m X(i) at t = 0. In the sections to follow, the methods of determining r(i)
T, and r(i)H, r(i)
A, or (DF)H, (DF)T, and
H, r(DF) XY in the compartmental lung model are(DF)A r(DF)
T, and r(DAF) as well as the values of λ(i)
presented.
A.5. DETERMINATION OF DEPOSITION FRACTIONS The mathematical models for determining the deposition fractions of DPM in various
regions of the respiratory tract have been developed by Yu and Xu (1986, 1987) and are adopted in this report. Yu and Xu consider DPM as a polydisperse aerosol with a specified mass median aerodynamic diameter (MMAD) and geometrical standard deviation σg. Each diesel particle is represented by a cluster-shaped aggregate within a spherical envelope of diameter de. The envelope diameter de is related to the aerodynamic diameter of the particle by the relation
de ' φ&1/2(
Ca )1/2)( ζ )1/2 (A-24)da Ce ζo
where ζ is the bulk density of the particle in g/cm3, ζ0 = 1 g/cm3; φ is the packing density, which is the ratio of the space actually occupied by primary particles in the envelope to the overall envelope volume; and Cx is the slip factor given by the expression:
A-8

Cx ' 1 % 2 λ [1.257 % 0.4 exp &(0.55dx )] (A-25)dx λ
in which λ – 8 × 10⁻⁶cm3 is the mean free path of air molecules at standard conditions. In the diesel particle model of Yu and Xu (1986), ζ has a value of 1.5 g/cm3 and a φ value of 0.3 is chosen based upon the best experimental estimates. As a result, Equation A-24 gives de/da = 1.35. In determining the deposition fraction of DPM, de is used for diffusion and interception according to the particle model.
A.5.1. Deposition in the Head Particle deposition in the naso- or oropharyngeal region is referred to as head or
extrathoracic deposition. The amount of particles that enters the lung depends upon the breathing mode. Normally, more particles are collected via the nasal route than by the oral route because of the nasal hairs and the more complex air passages of the nose. Since the residence time of diesel particles in the head region during inhalation is very small (about 0.1 s for human adults at normal breathing), diffusional deposition is insignificant and the major deposition mechanism is impaction. The following empirical formulas derived by Yu et al. (1981) for human adults are adopted for deposition prediction of DPM: For mouth breathing:
(DF)H, in ' 0, for da 2# 3000
(DF)H, in ' &1.117 % 0.324 log(da 2Q), for da
2Q > 3000
(DF)H, ex ' 0,
and for nose breathing:
(DF)H, in ' &0.014 % 0.023 log(da 2Q), for da
2Q # 337
(A-26)
(A-27)
(A-28)
(A-29)
A-9

(DF)H, in ' &0.959 % 0.397 log(da 2Q), for da
2Q > 337 (A-30)
(DF)H, ex ' 0.003 % 0.033 log(da 2Q), for da
2Q # 215 (A-31)
(DF)H, ex ' &0.851 % 0.399 log(da 2Q), for da
2Q > 215 (A-32)
where (DF)H is the deposition efficiency in the head, the subscripts in and ex denote inspiration and expiration, respectively, da is the particle aerodynamic diameter in µm, and Q is the air flowrate in cm3/sec.
Formulas to calculate deposition of diesel particles in the head region of children are derived from those for adults using the theory of similarity, which assumes that the air passage in the head region is geometrically similar for all ages and that the deposition process is characterized by the Stokes number of the particle. Thus, the set of empirical equations from A-26 through A-32 are transformed into the following form: For mouth breathing:
(DF)H, in ' 0, for da 2Q # 3000 (A-33)
and for nose breathing:
(DF)H, in ' &1.117 % 0.972 logK % 0.324 log(da 2Q), for da
2Q > 3000 (A-34)
(DF)H, ex ' 0. (A-35)
(DF)H, in ' & 0.014 % 0.690 log K % 0.023 log(da 2Q), for da
2Q # 337 (A-36)
(DF)H, in ' &0.959 % 1.191 log K % 0.397 log (da 2Q), for da
2Q > 337 (A-37)
(DF)H, ex ' 0.003 % 0.099 log K % 0.033 log(da 2Q), for da
2Q #215 (A-38)
A-10

where K is the ratio of the linear dimension of the air passages in the head region of adults to that of children, which is assumed to be the same as the ratio of adult/child tracheal diameters.
(DF)H, ex ' 0.851 % 1.197 log K % 0.399 log(da 2Q), for da
2Q >215 (A-39)
For rats, the following empirical equations are used for deposition prediction of DPM in the nose:
(DF)H, in ' (DF)H, ex ' 0.046 % 0.009 log(da 2Q), for da
2Q # 13.33 (A-40)
A.5.2. Deposition in the Tracheobronchial and Alveolar Regions The deposition model adopted for DPM is the one previously developed for
monodisperse (Yu, 1978) and polydisperse spherical aerosols (Diu and Yu, 1983). In the model,
(DF)H, in ' (DF)H, ex ' &0.522 % 0.514 log(da 2Q), for da
2Q > 13.33 (A-41)
the branching airways are viewed as a chamber model shaped like a trumpet (Figure A-2). The cross-sectional area of the chamber varies with airway depth, x, measured from the beginning of the trachea. At the last portion of the trumpet, additional cross-sectional area is present to account for the alveolar volume per unit length of the airways. Inhaled diesel particles that escape capture in the head during inspiration will enter the trachea and subsequently the bronchial airways (compartment T) and alveolar spaces (compartment A).
Assuming that the airways expand and contract uniformly during breathing, the equation for the conservation of particles takes the form:
β(A1 % A2) Mc
% Q Mc ' & Qcη (A-42)
Mx Mx
where c is the mean particle concentration at a given x and time t; A1 and A2 are, respectively, the summed cross-sectional area (or volume per unit length) of the airways and alveoli at rest; η
is the particle uptake efficiency per unit length of the airway; β is an expansion factor, given by:
β ' 1 % Vt
(A-43)Vl
A-11

A-12
(A-44)
(A-45)
(A-46)
(A-47)
(A-48)
(A-49)
and Q is the air flow rate, varying with x and t according to the relation
where Q0 is the air flow rate at x = 0. In Equations A-43 and A-44, Vt is the volume of new airin the lungs and Vx and VR are, respectively, the accumulated airway volume from x = 0 to x, andtotal airway volume at rest.
Equation A-42 is solved using the method of characteristics with appropriate initial andboundary conditions. The amount of particles deposited between location x1 and x2 from time t1
to t2 can then be found from the expression
For diesel particles, 0 is the sum of those due to the individual deposition mechanismsdescribed above, i.e.,where 0I, 0S, 0P, and 0D are, respectively, the deposition efficiencies per unit length of the
airway due to impaction, sedimentation, interception, and diffusion. On the basis of the particlemodel described above, the expressions for 0I, 0S, 0P, and 0D are obtained in the following form:
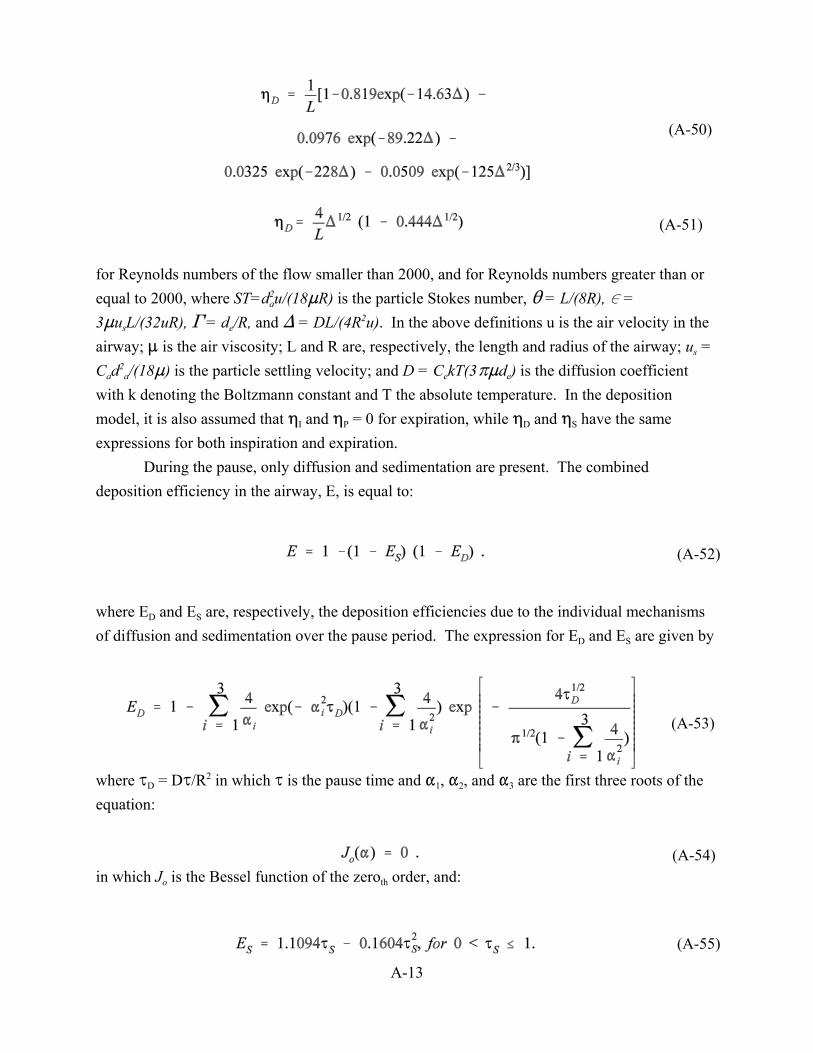
A-13
(A-50)
(A-51)
(A-52)
(A-53)
(A-54)
(A-55)
for Reynolds numbers of the flow smaller than 2000, and for Reynolds numbers greater than orequal to 2000, where ST=d2
au/(18:R) is the particle Stokes number, 2 = L/(8R), 0 =3:usL/(32uR), ' = de/R, and ) = DL/(4R2u). In the above definitions u is the air velocity in theairway; : is the air viscosity; L and R are, respectively, the length and radius of the airway; us =Cad2
a/(18:) is the particle settling velocity; and D = CekT(3B:de) is the diffusion coefficientwith k denoting the Boltzmann constant and T the absolute temperature. In the depositionmodel, it is also assumed that 0I and 0P = 0 for expiration, while 0D and 0S have the sameexpressions for both inspiration and expiration.
During the pause, only diffusion and sedimentation are present. The combineddeposition efficiency in the airway, E, is equal to:
where ED and ES are, respectively, the deposition efficiencies due to the individual mechanismsof diffusion and sedimentation over the pause period. The expression for ED and ES are given by
where JD = DJ/R2 in which J is the pause time and "1, "2, and "3 are the first three roots of theequation:
in which Jo is the Bessel function of the zeroth order, and:

and
ES ' 1 & 0.0069τ&1 &0.0859τ&2
& 0.0582τ&3 S S S ,
(A-56)for τS > 1,
where τS = uSτ/2R. The values of (DF)T and (DF)A over a breathing cycle are calculated by superimposing
DF for inspiration, deposition efficiency E during pause, and DF for expiration in the tracheobronchial airways and alveolar space. It is assumed that the breathing cycle consists of a constant flow inspiration, a pause, and a constant flow expiration, each with a respective duration fraction of 0.435, 0.05, and 0.515 of a breathing period.
A.5.3. Lung Models Lung architecture affects particle deposition in several ways: the linear dimension of the
airway is related to the distance the particle travels before it contacts the airway surface; the air flow velocity by which the particles are transported is determined by the cross-section of the airway for a given volumetric flowrate; and flow characteristics in the airways are influenced by the airway diameter and branching patterns. Thus, theoretical prediction of particle deposition depends, to a large extent, on the lung model chosen.
A.5.3.1. Lung Model for Rats Morphometric data on the lung airways of rats were reported by Schum and Yeh (1979).
Table A-1 shows the lung model data for Long Evans rats with a total lung capacity of 13.784 cm3. Application of this model to Fischer rats is accomplished by assuming that the rat has the same lung structure regardless of its strain and that the total lung capacity is proportional to the body weight. In addition, it is also assumed that the lung volume at rest is about 40% of the total lung capacity and that any linear dimension of the lung is proportional to the cubic root of the lung volume.
A.5.3.2. Lung Model for Human Adults The lung model of mature human adults used in the deposition calculation of DPM is the
symmetric lung model developed by Weibel (1963). In Weibel’s model, the airways are assumed to be a dichotomous branching system with 24 generations. Beginning with the 18th generation, increasing numbers of alveoli are present on the wall of the airways, and the last three generations are completely aleveolated. Thus, the alveolar region in this model consists of
A-14

all the airways in the last seven generations. Table A-2 presents the morphometric data of the airways of Weibel’s model adjusted to a total lung volume of 3000 cm3.
A.5.3.3. Lung Model for Children The lung model for children in the diesel study was developed by Yu and Xu (1987) on
the basis of available morphometric measurements. The model assumes a lung structure with dichotomous branching of airways, and it matches Weibel’s model for a subject when evaluated at the age of 25 years, the age at which the lung is considered to be mature. The number and size of airways as functions of age t (years) are determined by the following equations.
A.5.3.3.1. Number of airways and alveoli. The number of airways Ni(t) at generation i for age t is given by
Ni(t) ' 2i ,
N21(t)'Nr(t), N22(t)'N23(t)'0.
N21(t) ' 221, N22(t) ' Nr(t) &221,N23(t) ' 0,
N21(t) ' 221,N22(t) ' 222,N23(t) ' Nr(t) &221 &222
for 0 # i #20 (A-57)
for Nr(t) # 221 (A-58)
for 221 < Nr(t) # 222 (A-59)
for Nr(t) > 221 % 222, (A-60)
where Nr(t) is the total number of airways in the last three airway generations. The empirical equation for Nr which best fits the available data is
Thus, Nr(t) increases from approximately 1.5 million at birth to 15 million at 8 years of age and
Nr(t) ' 2.036 × 10⁷(1&0.926e &0.15t), t # 8 (A-61)1.468 × 10⁷, t > 8
remains nearly constant thereafter. Equations A-58 to A-60 also imply that in the last three
A-15

generations, the airways in the subsequent generation begin to appear only when those in the preceding generation have completed development.
The number of alveoli as a function of age can be represented by the following equation according to the observed data:
NA(t) ' 2.985 × 10⁸(1 &0.919e &0.45t) (A-62)
The number of alveoli distributed in the unciliated airways at the airway generation level is determined by assuming that alveolization of airways takes place sequentially in a proximal direction. For each generation, alveolization is considered to be complete when the number of alveoli in that generation reaches the number determined by Weibel’s model.
A.5.3.3.2. Airway size. Four sets of data are used to determine airway size during postnatal growth: (a) total lung volume as a function of age; (b) airway size as given by Weibel’s model; (c) the growth pattern of the bronchial airways; and (d) variation in alveolar size with age. From these data, it is found that the lung volume, LV(t) at age t, normalized to Weibel’s model at 4800 cm3 for an adult (25 years old), follows the equation
LV(t) ' 0.959 × 10⁵(1 & 0.998e &0.002t) (cm 3). (A-63)
The growth patterns of the bronchial airways are determined by the following equations
Di(t) & Diw ' αi[H(t) & H(25)], (A-64)
Li(t) & Liw ' βi[H(t) & H(25)], (A-65)
where Di(t) and Li(t) are, respectively, the airway diameter and length at generation i and age t, Diw and Liw the corresponding values for Weibel’s model, αi and βi are coefficients given by
αi ' 3.26 × 10&2exp[&1.183 (i%1)0.5] (A-66)
βi ' 1.05 × 10&6 exp [10.1] (i%1)&0.2] (A-67)
A-16

and H(t) is the body height, which varies with age t in the form
H(t) ' 1.82 × 10²(1 & 0.725e &0.14t) (cm). (A-68)
For the growth patterns of the airways in the alveolar region, it is assumed that
Di '
Li '
Da ' f(t), for 17 # i # 23 (A-69)Diw Liw Daw
where Da is the diameter of an alveolus at age t, Daw = 0.0288 cm is the alveolar diameter for adults in accordance with Weibel’s model, and f(t) is a function determined from
3 16 {LV(t) & j
π Di 2(t) Li(t)Ni(t)}
f(t) ' 23
i ' 0 4 (A-70)
{ j π D 2
awNA(t)}iwLiwNi(t) % 5π D 3
i ' 17 4 36
A.6. TRANSPORT RATES The values of transport rates λ(i)
XY for rats have been derived from the experimental data of clearance for diesel soot (Chan et al., 1981; Strom et al., 1987, 1988) and for the particle-associated organics (Sun et al., 1984; Bond et al., 1986; Yu et al., 1991). These values are used in the present model of lung burden calculation and are listed below:
λ(i) HG ' 1.73 (i ' 1,2,3) (A-71)
λ(1) λ(1) λ(1) ABHB ' TB ' LB ' λ(i)
' 0.00018 (A-72)
λ(2) λ(2) λ(2) λ(2) HB ' TB ' LB ' AB ' 0.0129 (A-73)
λ(3) λ(3) λ(3) λ(3) HB ' TB ' LB ' AB ' 12.55 (A-74)
A-17
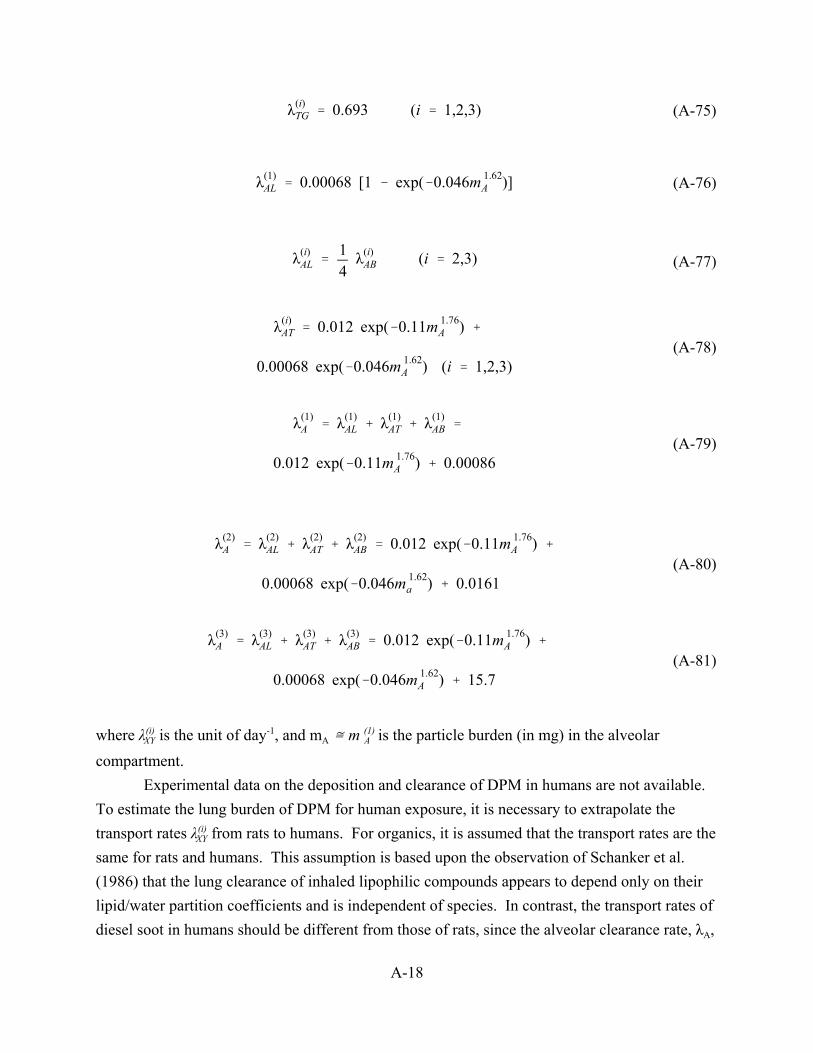
λ(i) ' 0.693 (i ' 1,2,3) (A-75)TG
λ(1) AL ' 0.00068 [1 & exp(&0.046mA
1.62)] (A-76)
λ(i) ' 1 λ(i) (i ' 2,3) (A-77)AL 4 AB
λ(i) ' 0.012 exp(&0.11mA
1.76) %AT (A-78)
0.00068 exp(&0.046mA 1.62) (i ' 1,2,3)
λ(1) ' AL % λ(1)
% λ(1) ' A λ(1)
AT AB (A-79)
0.012 exp(&0.11mA 1.76) % 0.00086
λ(2) ' AL % λ(2)
% λ(2) ' 0.012 exp(&0.11mA
1.76) %A λ(2) AT AB
(A-80) 0.00068 exp(&0.046ma
1.62) % 0.0161
λ(3) ' AL % λ(3)
% λ(3) ' 0.012 exp(&0.11mA
1.76) %A λ(3) AT AB
(A-81) 0.00068 exp(&0.046mA
1.62) % 15.7
XY is the unit of day-1, and mA – m (1) is the particle burden (in mg) in the alveolarwhere λ(i) A
compartment. Experimental data on the deposition and clearance of DPM in humans are not available.
To estimate the lung burden of DPM for human exposure, it is necessary to extrapolate the transport rates λ(i)
XY from rats to humans. For organics, it is assumed that the transport rates are the same for rats and humans. This assumption is based upon the observation of Schanker et al. (1986) that the lung clearance of inhaled lipophilic compounds appears to depend only on their lipid/water partition coefficients and is independent of species. In contrast, the transport rates of diesel soot in humans should be different from those of rats, since the alveolar clearance rate, λA,
A-18
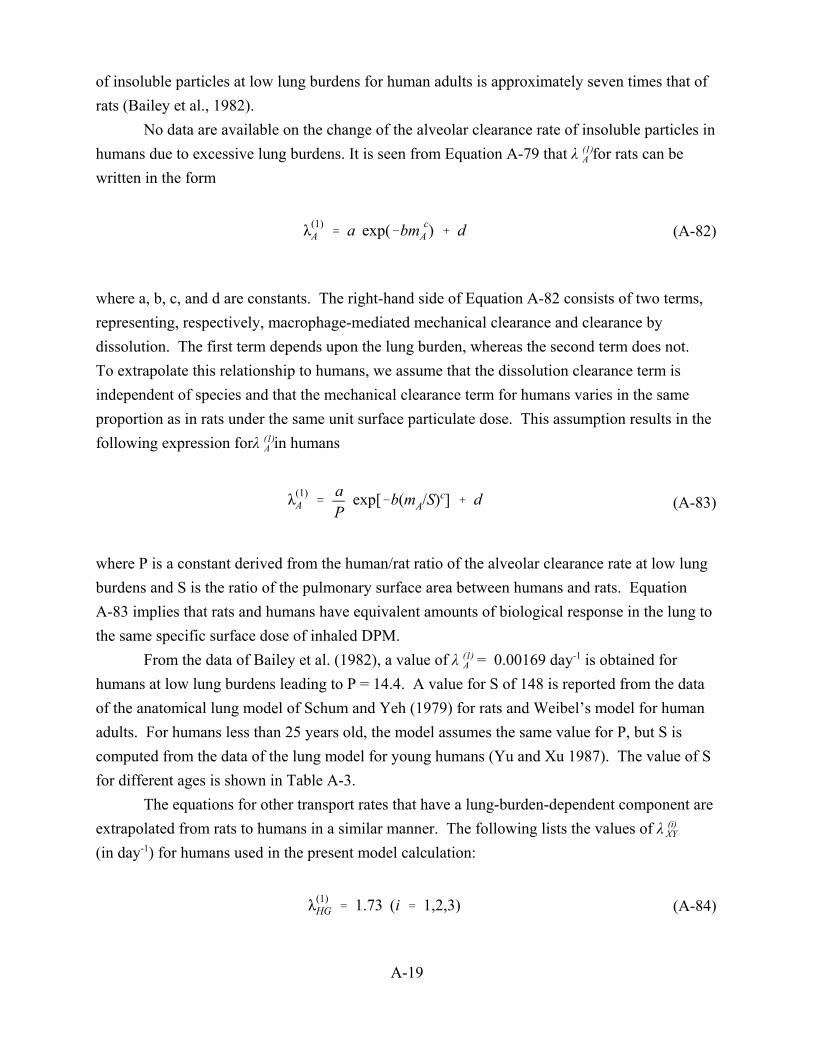
of insoluble particles at low lung burdens for human adults is approximately seven times that of rats (Bailey et al., 1982).
No data are available on the change of the alveolar clearance rate of insoluble particles in humans due to excessive lung burdens. It is seen from Equation A-79 that λ (1)
A for rats can be written in the form
λ(1) ' a exp(&bmA
c) % d (A-82)A
where a, b, c, and d are constants. The right-hand side of Equation A-82 consists of two terms, representing, respectively, macrophage-mediated mechanical clearance and clearance by dissolution. The first term depends upon the lung burden, whereas the second term does not. To extrapolate this relationship to humans, we assume that the dissolution clearance term is independent of species and that the mechanical clearance term for humans varies in the same proportion as in rats under the same unit surface particulate dose. This assumption results in the following expression forλ (1)
A in humans
λ(1) a A '
P exp[&b(mA/S)c] % d (A-83)
where P is a constant derived from the human/rat ratio of the alveolar clearance rate at low lung burdens and S is the ratio of the pulmonary surface area between humans and rats. Equation A-83 implies that rats and humans have equivalent amounts of biological response in the lung to the same specific surface dose of inhaled DPM.
From the data of Bailey et al. (1982), a value of λ (1) = 0.00169 day-1 is obtained forA
humans at low lung burdens leading to P = 14.4. A value for S of 148 is reported from the data of the anatomical lung model of Schum and Yeh (1979) for rats and Weibel’s model for human adults. For humans less than 25 years old, the model assumes the same value for P, but S is computed from the data of the lung model for young humans (Yu and Xu 1987). The value of S for different ages is shown in Table A-3.
The equations for other transport rates that have a lung-burden-dependent component are extrapolated from rats to humans in a similar manner. The following lists the values of λ (i)
XY
(in day-1) for humans used in the present model calculation:
λ(1) HG ' 1.73 (i ' 1,2,3) (A-84)
A-19
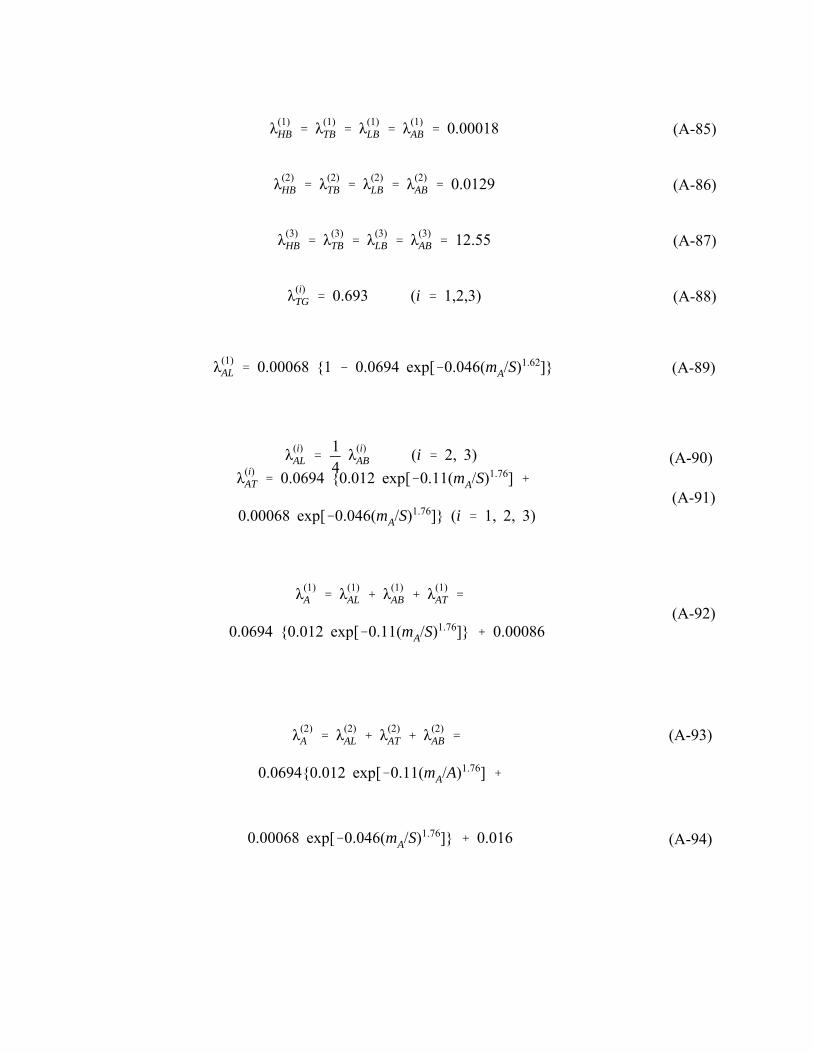
λ(1) λ(1) λ(1) λ(1) HB ' TB ' LB ' AB ' 0.00018 (A-85)
λ(2) λ(2) λ(2) λ(2) HB ' TB ' LB ' AB ' 0.0129 (A-86)
λ(3) λ(3) λ(3) λ(3) HB ' TB ' LB ' AB ' 12.55 (A-87)
λ(i) ' 0.693 (i ' 1,2,3) (A-88)TG
λ(1) AL ' 0.00068 {1 & 0.0694 exp[&0.046(mA/S)1.62]} (A-89)
λ(i) ' 1 λ(i) (i ' 2, 3) (A-90)AL 4 AB
λ(i) ' 0.0694 {0.012 exp[&0.11(mA/S)1.76] %AT
(A-91) 0.00068 exp[&0.046(mA/S)
1.76]} (i ' 1, 2, 3)
λ(1) ' AL % λ(1)λ(1) AB % λ(1) ' A AT (A-92)
0.0694 {0.012 exp[&0.11(mA/S)1.76]} % 0.00086
λ(2) ' AL % λ(2) % λ(2) ' (A-93)A λ(2) AT AB
0.0694{0.012 exp[&0.11(mA/A)1.76] %
0.00068 exp[&0.046(mA/S)1.76]} % 0.016 (A-94)

A.7. RESULTSA.7.1. Simulation of Rat Experiments
To test the accuracy of the model, simulation results are obtained on the retention of DPM in the rat lung and compared with the data of lung burden and lymph node burden obtained by Strom et al. (1988). A particle size of 0.19 µm MMAD and a standard geometric deviation, σg, of 2.3 (as used in Strom’s experiment) are used in the calculation.
The respiratory parameters for rats are based on their weight and calculated using the following correlations of minute volume, respiratory frequency, and growth curve data.
Minute volume = 0.9W (cm3/min) (A-95)
Respiratory frequency = 475W-0.3 (1/min) (A-96)
where W is the body weight (in grams) as determined from the equation
W = 5+537T/(100+T), for T$56 days (A-97) in which T is the age of the rat measured in days.
Equation A-95 was obtained from the data of Mauderly (1986) for rats ranging in age from 3 mo to 2 years old; Equation A-96 was obtained from the data of Strom et al. (1988); and Equation A-97 was determined from the best fit of the experimental deposition data. Figures A-3 and A-4 show the calculated lung burden of diesel soot (m (1)
T) and lymph node burden,A + m (1)
respectively, for the experiment by Strom et al. (1988) using animals exposed to DPM at 6 mg/m3 for 1, 3, 6, and 12 weeks; exposure in all cases was 7 days/week and 20 h daily. The solid lines represent the calculated accumulation of particles during the continuous exposure phase and the dashed lines indicate calculated post-exposure retention. The agreement between the calculated and the experimental data for both lung and lymph node burdens during and after the exposure periods was very good.
Comparison of the model calculation and the retention data of particle-associated BaP in rats obtained by Sun et al. (1984) is shown in Figure A-5. The calculated retention is shown by the solid line. The experiment of Sun et al. consisted of a 30-min exposure to diesel particles coated with [3H] benzo[a]pyrene ([3H] - BaP) at a concentration of 4 to 6 µg/m3 of air and followed by a post-exposure period of over 25 days. The fast and slow phase of ([3H] - BaP) clearance half-times were found to be 0.03 day and 18 days, respectively. These correspond to
AO = 0.0385 day-1 and λ (3) AO is the value of λ (i)λ 2
AO = 23.1 day-1 in our model, where λ (i) XY at mA 6 0.
Figure A-5 shows that the calculated retention is in excellent agreement with the experimental data obtained by Sun et al. (1984).
A-21

A.7.2. Predicted Burdens in Humans Selected results of lung burden predictions in humans are shown in Figures A-6 to A-9.
The particle conditions used in the calculation are 0.2 µm MMAD with σg = 2.3, and the mass fractions of the rapidly and slowly cleared organics are each 10% (ƒ1 = ƒ2 = 0.1). Figures A-6 and A-7 show, respectively, the lung burdens per unit concentration of diesel soot and the associated organics in human adults for different exposure patterns at two soot concentrations, 0.1 and 1 mg/m3. The exposure patterns used in the calculation are (a) 24 h/day and 7 days week; (b) 12 h/day and 7 days/week; and (c) 8 h/day and 5 days/week, simulating environmental and occupational exposure conditions. The results show that the lung burdens of both diesel soot and the associated organics reached a steady-state value during exposure. Because of differences in the amount of particle intake, the steady-state lung burdens per unit concentration were highest for exposure pattern (a) and lowest for exposure pattern (b). Also, increasing soot concentration from 0.1 to 1 mg/m3 increased the lung burden per unit concentration. However, the increase was not noticeable for exposure pattern (c). The dependence of lung burden on the soot concentration is caused by the reduction of the alveolar clearance rate at high lung burdens discussed above.
Figures A-8 and A-9 show the effect of age on lung burden, where the lung burdens per unit concentration per unit weight are plotted versus age. The data of lung weight at different ages are those reported by Snyder (1975). The exposure pattern used in the calculation is 24 h/day and 7 days/week for a period of 1 year at the two soot concentrations, 0.1 and 1 mg/m3. The results show that, on a unit lung weight basis, the lung burdens of both soot and organics are functions of age, and the maximum lung burdens occur at approximately 5 years of age. Again, for any given age, the lung burden per unit concentration is slightly higher at 1 mg/m3 than at 0.1 mg/m3.
A.8. PARAMETRIC STUDY OF THE MODEL The deposition and clearance model of DPM in humans, presented above, consists of a
large number of parameters that characterize the size and composition of diesel particles, the structure and dimension of the respiratory tract, the ventilation conditions of the subject, and the clearance half-times of the diesel soot and the particle-associated organics. Any single or combined changes of these parameters from their normal values in the model would result in a change in the predicted lung burden. A parametric study has been conducted to investigate the effects of each individual parameter on calculated lung burden in human adults. The exposure pattern chosen for this study is 24 h/day and 7 days/week for a period of 10 years at a constant soot concentration of 0.1 mg/m3. The following presents two important results from the parametric study.
A-22

A.8.1. Effect of Ventilation Conditions The changes in lung burden due to variations in tidal volume and respiratory frequency
are depicted in Figures A-10 and A-11. Increasing any one of these ventilation parameters increased the lung burden, but the increase was much smaller with respect to respiratory frequency than to tidal volume. This small increase in lung burden was a result of the decrease in deposition efficiency as respiratory frequency increased, despite a higher total amount of DPM inhaled. The mode of breathing has only a minor effect on lung burden because switching from nose breathing does not produce any appreciable change in the amount of particle intake into the lung (Yu and Xu, 1987). All lung burden results presented in this report are for nose breathing.
A.8.2. Effect of Transport Rates Transport rates have an obvious effect on the retention of DPM in the lung after
deposition. Because we are mainly concerned with the long-term clearance of diesel soot and the associated organics, only the effects of two transport rates, λ (1)
A , are studied.A and λ(2)
Experimental data of λ (1) from various diesel studies in rats have shown that λ (1) can vary by aA A
factor of two or higher. We use a multiple of 0.5 to 2 for the uncertainty in λ (1) and λ (2) toA A
examine the effect on lung burden. Figures A-12 and A-13 show respectively, the lung burden results for diesel soot and the associated organics versus the multiples of λ (1) and λ (2) used in theA A
calculation. As expected, increasing the multiple of λ (1) reduced the lung burden of diesel sootA
with practically no change in the organics burden (Figure A-12), while just the opposite occurred when the multiple of λ (2) was increased (Figure A-13).A
A.9. OPERATIONAL DERIVATION OF HUMAN EQUIVALENT CONCENTRATIONS (HECs) The model of Yu et al. (1991) is ordered into two parts; one part parameterized on the
physiology and anatomy of a 300 g rat and the other part parameterized on the physiology and anatomy of a 25 year old human male. The sequence of steps taken to calculate the human equivalent continuous concentrations (the HECs), outlined in Table A-4, were as follows:
• The exposure scenario of the rats was entered into the rat portion of the model and the model ran to obtain the output of lung burden in mg DPM/ rat lung at the time of the sacrifice of the rats.
• The output of mg DPM/ rat lung was normalized to mg DPM/ cm2 of rat lung tissue based on a total pulmonary surface area of 4090 cm2..
A-23

• The normalized rat lung burdens were used to calculate the corresponding lung burden based on the pulmonary surface area of 627,000 cm2. This operation yielded mg DPM / lung of a 25 year old human male.
• Various air concentrations were run in an iterative fashion with the human portion of the model under a continuous exposure scenario of 24 h/day, 7d/wk for 70 years with ventilatory parameters set at 0.926 L for tidal volume and 15 breaths per minute as the respiratory frequency to yield a total daily pulmonary volume of 20 m3. This was continued until the output (mg DPM/lung) was matched to the mg DPM /human lung obtained from the normalized rat lung burden; the concentration from the model that matched this lung burden was termed the human equivalent continuous concentration, the HEC. The human modeling runs did not consider the preadult status of airway and alveoli number discussed above but rather were ran for 1 to 70 years with adult (25 years of age) parameters mentioned above.
These HEC values address kinetic issues of DPM deposition and retention in the lung by humans. As noted above, these values do not reflect the kinetic variability that may exist in the human population exposed to DPM which includes men and women, young and old. However, the limited parametric analysis of the model clearly shows variability of those parameters most determinative in humans (e.g., tidal volume, respiration rate, and rates of clearance of particles from the airways) were mirrored in the corresponding output of the model (lung burden of DPM). One interpretation of this parallel in parameter-output is that the variability in the physiological characteristics of humans reflects the variability in the model such that, for example, a small tidal volume would be reflected with a decreased lung burden of DPM. Variability among humans of these key parameters such as tidal volume do vary but within an order of magnitude. This would mean that the DPM dose received by different individuals in the population from the same concentration would indeed vary within the extremes of these determinative parameters.
A-24
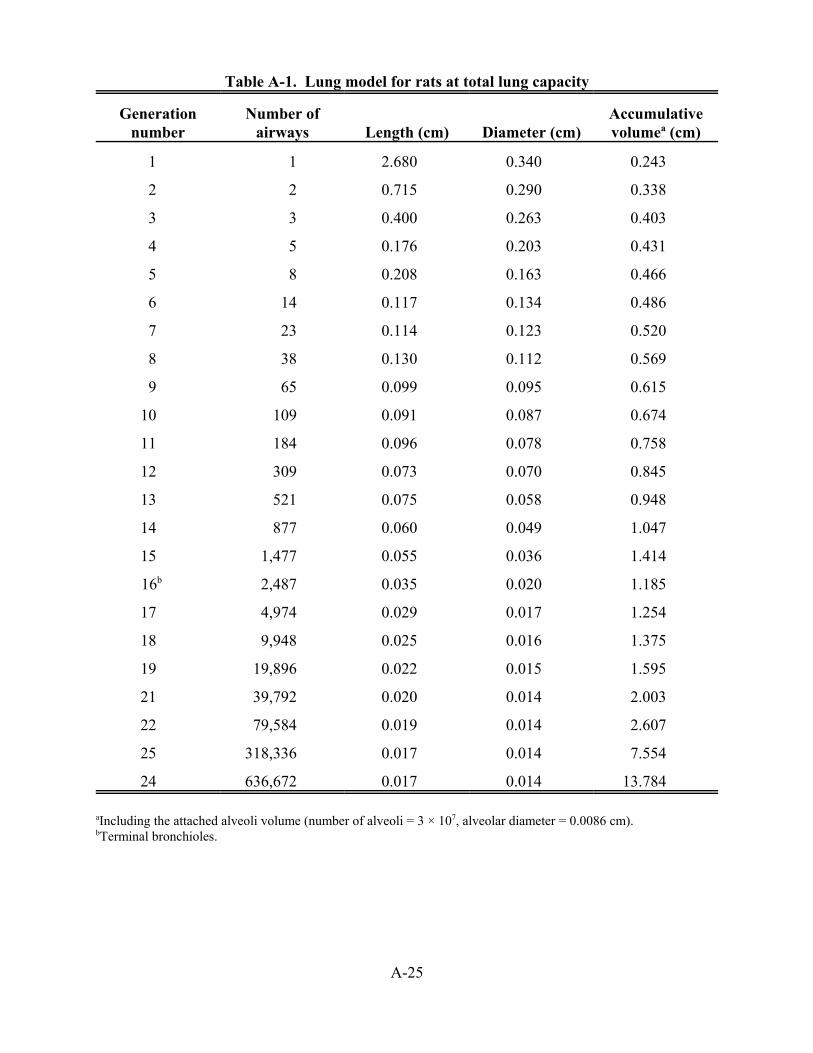
1
2
3
4
5
6
7
8
9
10
11
12
13
14
15
16
17
18
19
Table A-1. Lung model for rats at total lung capacity
Generation Number of Accumulative number airways Length (cm) Diameter (cm) volumea (cm)
1 2.680 0.340 0.243
2 0.715 0.290 0.338
3 0.400 0.263 0.403
5 0.176 0.203 0.431
8 0.208 0.163 0.466
14 0.117 0.134 0.486
23 0.114 0.123 0.520
38 0.130 0.112 0.569
65 0.099 0.095 0.615
109 0.091 0.087 0.674
184 0.096 0.078 0.758
309 0.073 0.070 0.845
521 0.075 0.058 0.948
877 0.060 0.049 1.047
1,477 0.055 0.036 1.414 b 2,487 0.035 0.020 1.185
4,974 0.029 0.017 1.254
9,948 0.025 0.016 1.375
19,896 0.022 0.015 1.595
21 39,792 0.020 0.014 2.003
22 79,584 0.019 0.014 2.607
25 318,336 0.017 0.014 7.554
24 636,672 0.017 0.014 13.784
aIncluding the attached alveoli volume (number of alveoli = 3 × 10⁷, alveolar diameter = 0.0086 cm). bTerminal bronchioles.
A-25

Table A-2. Lung model by Weibel (1963) adjusted to 3000 cm3 lung volume
Generation Number of Accumulative number airways Length (cm) Diameter (cm) volumea (cm)
0 1 10.260 1.539 19.06
2 2 4.070 1.043 25.63
2 4 1.624 0.710 28.63
3 8 0.650 0.479 29.50
4 16 1.086 0.385 31.69
5 32 0.915 0.299 33.75
6 64 0.769 0.239 35.94
7 128 0.650 0.197 38.38
8 256 0.547 0.159 41.13
9 512 0.462 0.132 44.38
10 1,024 0.393 0.111 48.25
11 2,048 0.333 0.093 53.00
12 4,096 0.282 0.081 59.13
13 8,192 0.231 0.070 66.25
14 16,384 0.197 0.063 77.13
15 32,768 0.171 0.056 90.69
16b 65,536 0.141 0.051 109.25
17 131,072 0.121 0.046 139.31
18 262,144 0.100 0.043 190.60
19 524,283 0.085 0.040 288.16
20 1,048,579 0.071 0.038 512.94
21 2,097,152 0.060 0.037 925.04
22 4,194,304 0.050 0.035 1,694.16
23 8,388,608 0.043 0.035 3,000.00
A-26

Table A-3. Ratio of pulmonary surface areas between humansand rats as a function of human age
Age (year) Surface area
0
1
2
3
4
5
6
7
8
9
10
11
12
13
14
15
16
27
28
19
20
21
22
23
24
25
4.99
17.3
27.6
36.7
44.7
51.9
58.5
64.6
70.4
76.0
81.4
86.6
91.6
96.4
101
106
110
115
119
123
128
132
136
140
144
148
A-27

Table A-4. Human equivalent continuous concentrations (HECs) calculated with the model of Yu et al. (1991) from long-term repeated exposure rat studies of DPM exposure
Rat exposure concs mg DPM/ rat lung mg DPM/cm2 mg DPM/ HEC Study Exposure conditionsa (mg/m3) (modeled)b rat&human lungb,c human lungc (mg/m3)c
Mauderly et al., 1987a 7 h/day, 5 days/wk, 130 wkd 0.35 0.28 6.85E-5 43 0.038
Mauderly et al., 1987a 7 h/day, 5 days/wk, 130 wk 3.47 20.23 4.95E-3 3101 1.375
Mauderly et al., 1987a 7 h/day, 5 days/wk, 130 wk 7.08 44.52 1.09E-2 6825 3.05
Ishinishi et al., 1988 (LDc) 16 h/day, 6 days/wk, 130 wk 0.11 0.24 5.87E-5 37 0.032
Ishinishi et al., 1988 (LD) 16 h/day, 6 days/wk, 130 wk 0.41 1.00 2.45E-4 153 0.128
Ishinishi et al., 1988 (LD) 16 h/day, 6 days/wk, 130 wk 1.18 18.45 4.51E-3 2828 1.25
Ishinishi et al., 1988 (LD) 16 h/day, 6 days/wk, 130 wk 2.32 39.89 9.75E-3 6115 2.75
Ishinishi et al., 1988 (HD) 16 h/day, 6 days/wk, 130 wk 0.46 1.15 2.81E-4 176 0.144
Ishinishi et al., 1988 (HD) 16 h/day, 6 days/wk, 130 wk 0.96 12.94 3.16E-3 1984 0.883
Ishinishi et al., 1988 (HD) 16 h/day, 6 days/wk, 130 wk 1.84 31.22 7.63E-3 4786 2.15
Ishinishi et al., 1988 (HD) 16 h/day, 6 days/wk, 130 wk 3.72 64.67 1.58E-2 9914 4.4
Nikula et al., 1995 16 h/day, 5 days/wk, 100 wk 2.44 28.64 7.00E-3 4391 1.95
Nikula et al., 1995 16 h/day, 5 days/wk, 100 wk 6.3 76.15 1.86E-2 11674 5.1
Heinrich et al., 1995 18 h/day, 5 days/wk, 104 wk 0.84 3.83 9.4E-4 587 0.33
Heinrich et al., 1995 18 h/day, 5 days/wk, 104 wk 2.5 34.4 8.4E-3 5274 2.35
Heinrich et al., 1995 18 h/day, 5 days/wk, 104 wk 6.98 97.8 2.4E-2 14993 6.7
a These are entered into the program as hrs/day, days/week for the total number of weeks exposed and the last week of exposure before evaluation (as this would affectclearance). The parameters for the rat were based on a body weight which was set in the program at 300g.b These values were obtained with the rat portion of the model and are noted as lung burden, in mg DPM /lung of a 300 g rat, at the final week of the exposure scenario. Theseoutputs were then normalized to cm2 of the rat lung, at 4090 cm2 total (Xu and Yu, 1987).c Preparatory to using the human portion of the model, the mg DPM/cm2 value from above was used to project the mg DPM that would be present in the adult human lungbased on a total lung surface area of 627,000 cm2 (Xu and Yu, 1987). Various air concentrations were then entered into the human model as 70 years continuous exposurescenarios and ran iteratively until the output (in mg DPM / lung at age 70) matched this mg DPM/human lung, i.e., the total lung burden. This matching air concentration is, bydefinition, the human equivalent continuous concentration (HEC).d weeks = (months of exposure) × 4.33.
A-28

Figure A-1. Compartmental model of DPM retention.
A-29

Figure A-2. Trumpet model of lung airways.
A-30

Figure A-3. The experimental and predicted lung burdens of rats to DPM at a solid and dashed concentration of 0.6 mg/m3 for different exposure spans. Lines are, respectively, the predicted burdens during exposure and post-exposure. Particle characteristics and exposure pattern are explained in the text. The symbols represent the experimental data from Strom et al. (1988).
A-31
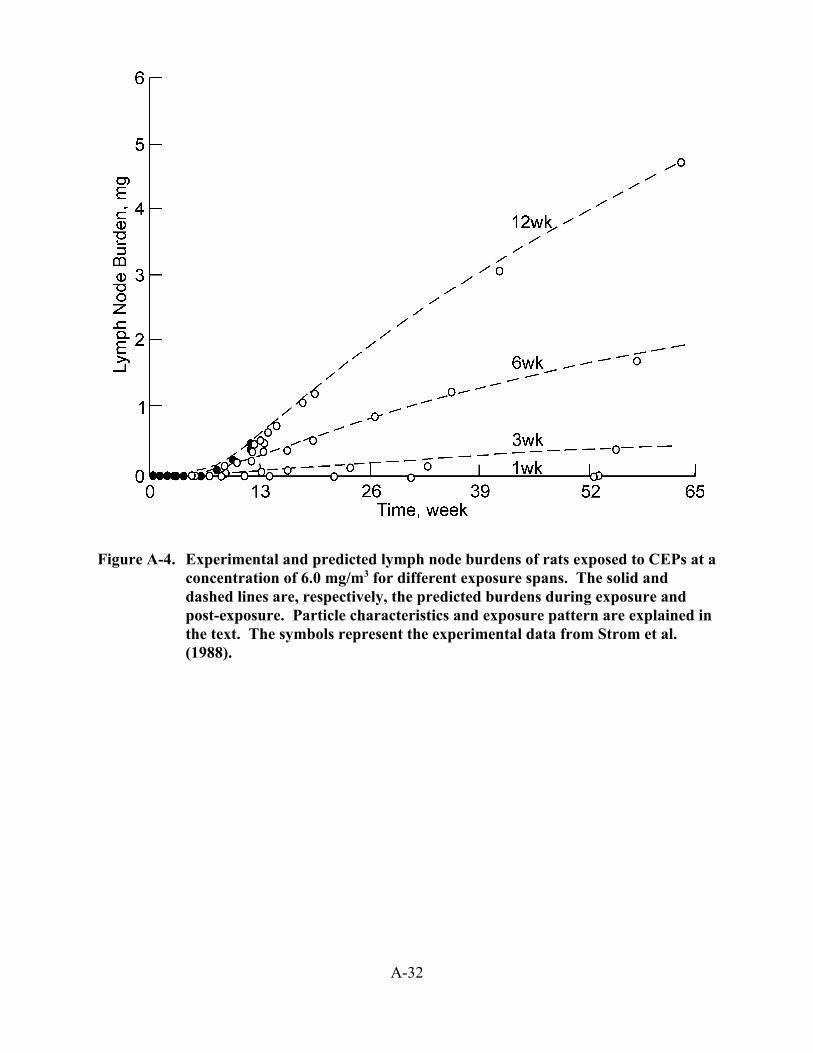
Figure A-4. Experimental and predicted lymph node burdens of rats exposed to CEPs at a concentration of 6.0 mg/m3 for different exposure spans. The solid and dashed lines are, respectively, the predicted burdens during exposure and post-exposure. Particle characteristics and exposure pattern are explained in the text. The symbols represent the experimental data from Strom et al. (1988).
A-32

Figure A-5. Comparison between the calculated lung retention (solid line) and the experimental data obtained by Sun et al. (1984) for the particle-associated BaP in rats.
A-33

Figure A-6. Calculated lung burdens of diesel soot per unit exposure concentration in human adults exposed continuously to DPM at two different concentrations of 0.1 and 1.0 mg/m3. Exposure patterns are (a) 24 h/day and 7 days/week, (b) 12 h/day and 7 days/week, and (c) 8 h/day and 5 days/week.
A-34
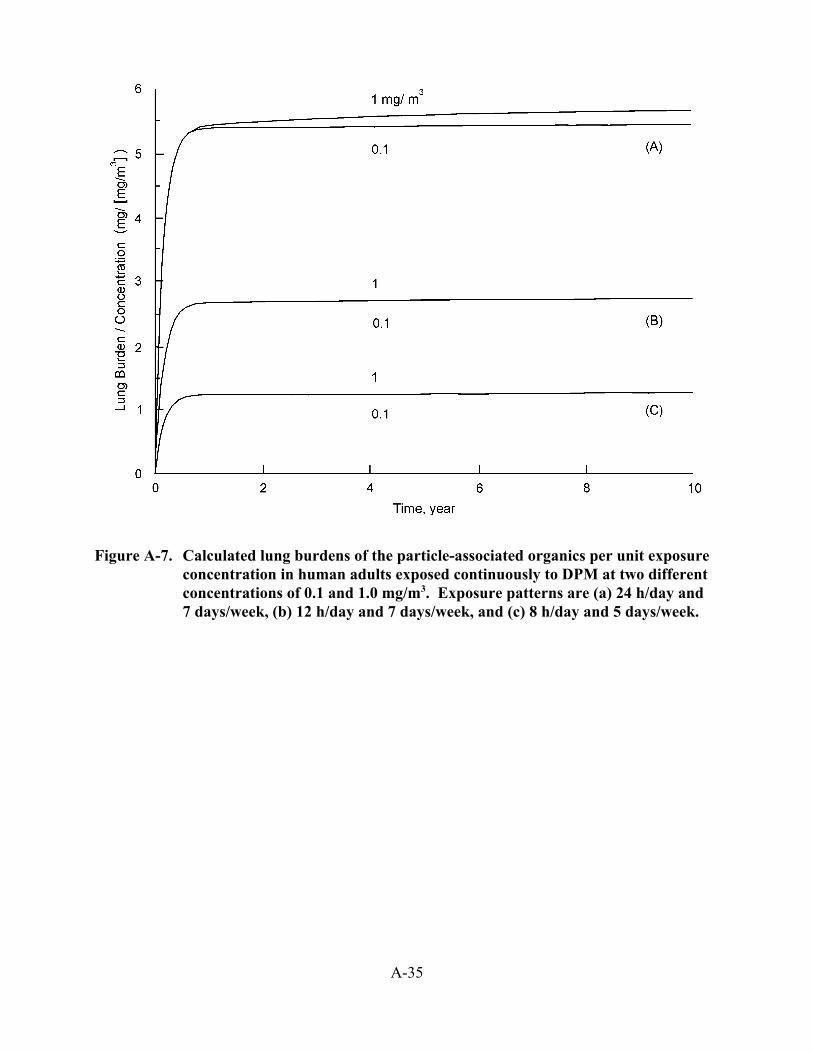
Figure A-7. Calculated lung burdens of the particle-associated organics per unit exposure concentration in human adults exposed continuously to DPM at two different concentrations of 0.1 and 1.0 mg/m3. Exposure patterns are (a) 24 h/day and 7 days/week, (b) 12 h/day and 7 days/week, and (c) 8 h/day and 5 days/week.
A-35

Figure A-8. Calculated lung burdens of diesel soot per gram of lung per unit exposure concentration in humans of different ages exposed continuously for 1 year to DPM of two different concentrations of 0.1 and 1.0 mg/m3 for 7 days/week and 24 h daily.
A-36
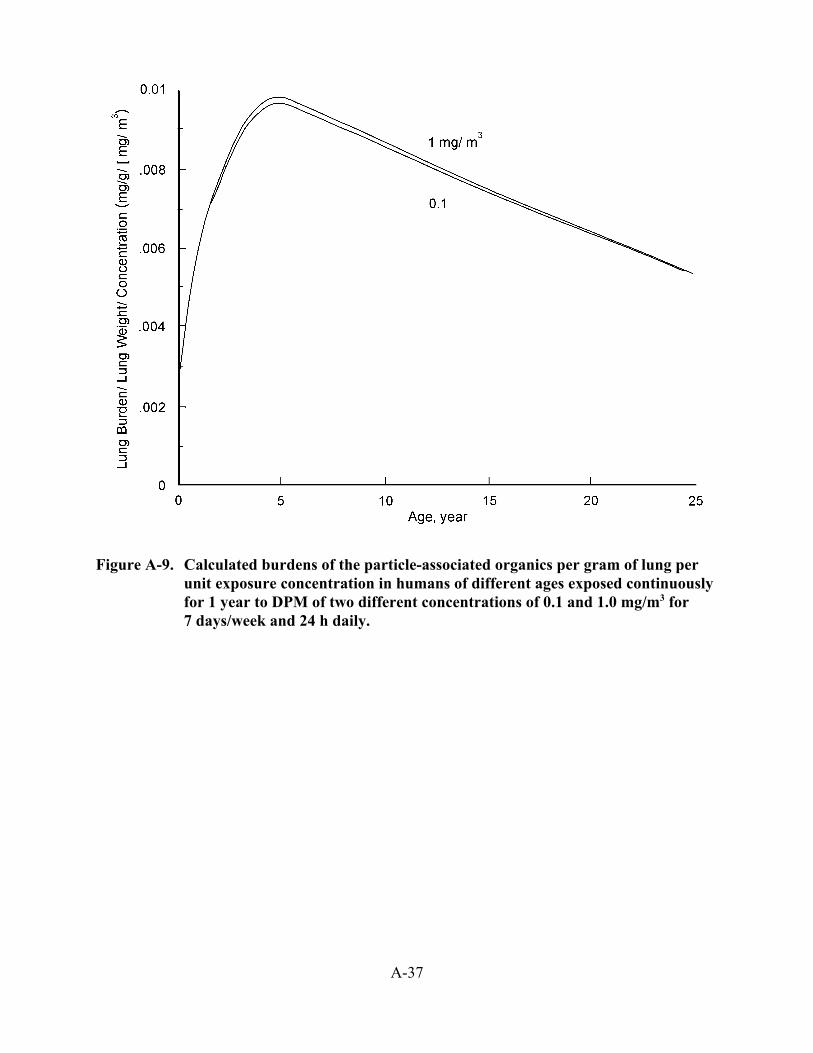
Figure A-9. Calculated burdens of the particle-associated organics per gram of lung per unit exposure concentration in humans of different ages exposed continuously for 1 year to DPM of two different concentrations of 0.1 and 1.0 mg/m3 for 7 days/week and 24 h daily.
A-37

Figure A-10. Calculated lung burdens in human adults versus tidal volume in liters for exposure to DPM at 0.1 mg/m3 for 10 years at 7 days/week and 24 h daily. Parameters used in the calculation are: (a) MMAD=0.2 µm, σg=2.3, ƒ2=0.1, ƒ3=0.1; (b) respiratory frequency = 14 min-1; and (c) lung volume = 3000 cm3.
A-38

Figure A-11. Calculated lung burdens in human adults versus respiratory frequency in bpm for exposure to DPM at 0.1 mg/m3 for 10 years at 7 days/week and 24 h daily. Parameters used in the calculation are: (a) MMAD=0.2 µm, σg=2.3, ƒ2=0.1, ƒ3=0.1; (b) tidal volume = 500 cm3, and (c) lung volume = 3200 cm3.
A-39
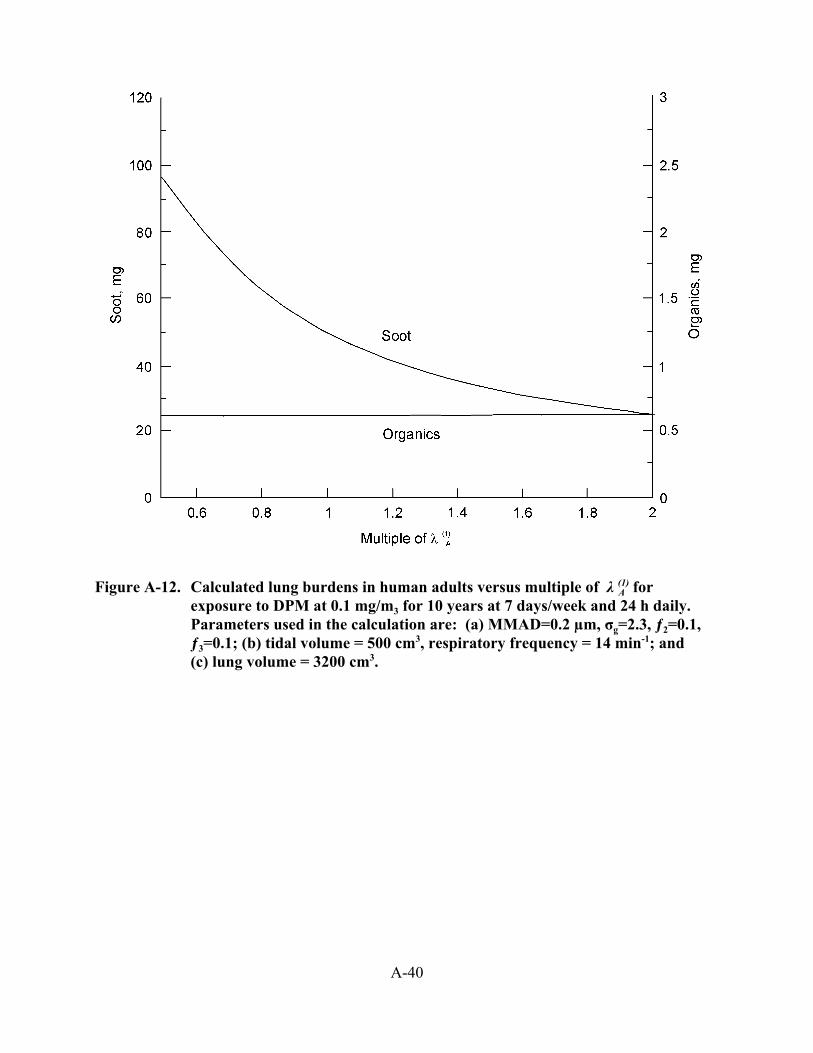
Figure A-12. Calculated lung burdens in human adults versus multiple of λ (1) forA exposure to DPM at 0.1 mg/m3 for 10 years at 7 days/week and 24 h daily. Parameters used in the calculation are: (a) MMAD=0.2 µm, σg=2.3, ƒ2=0.1, ƒ3=0.1; (b) tidal volume = 500 cm3, respiratory frequency = 14 min-1; and (c) lung volume = 3200 cm3.
A-40

Figure A-13. Calculated lung burdens in human adults versus multiple of λ (1) for exposureA to DPM at 0.1 mg/m3 for 10 years at 7 days/week and 24 h daily. Parameters used in the calculation are: (a) MMAD=0.2 µm σg=2.3, ƒ2=0.1, ƒ3=0.1; (b) tidal volume = 500 cm3, respiratory frequency = 14 min-1; and (c) lung volume = 3200 cm3.
A-41
REFERENCES FOR APPENDIX A
Amann, CA; Siegla, DC. (1982) Diesel particles -- what are they and why. Aerosol Sci Technol 1:73-101.
Bailey, MR; Fry, FA; James, AC. (1982) The long-term clearance kinetics of insoluble particles from the human lung. Ann Occup Hyg 26:273-289.
Bond, JA; Sun, JD; Medinsky, MA; et al. (1986) Deposition, metabolism and excretion of 1-[14C]nitropyrene and 1-[14C]nitropyrene coated on diesel exhaust particles as influenced by exposure concentration. Toxicol Appl Pharmacol 85:102-117.
Chan, TL; Lee, PS; Hering, WE. (1981) Deposition and clearance of inhaled diesel exhaust particles in the respiratory tract of Fisher rats. J Appl Toxicol 1:77-82.
Diu, CK; Yu, CP. (1983) Respiratory tract deposition of polydisperse aerosols in humans. Am Ind Hyg Assoc J 44:62-65.
Heinrich, U; Fuhst, R; Rittinghausen, S; et al. (1995) Chronic inhalation exposure of Wistar rats and two different strains of mice to diesel engine exhaust, carbon black, and titanium dioxide. Inhal Toxicol 7:533-556.
ICRP. (1979) Limits for intakes of radionuclides by workers. Ann ICRP 2. Publication 30, part 1.
Ishinishi, N; Kuwabara, N; Takaki, Y; et al. (1988) Long-term inhalation experiments on diesel exhaust. In: Diesel exhaust and health risks: results of the HERP studies. Tsukuba, Ibaraki, Japan: Japan Automobile Research Institute, Inc., Research Committee for HERP Studies; pp. 11-84.
Mauderly, JL. 1986. Respiration of F344 rats in nose-only inhalation exposure tubes. J Appl Toxicol 6:25-30.
Mauderly, JL; Jones, RK; Griffith, WC; et al. (1987) Diesel exhaust is a pulmonary carcinogen in rats exposed chronically by inhalation. Fundam Appl Toxicol 9:208-221.
Nikula, KJ; Snipes, MB; Barr, EB; et al. (1995) Comparative pulmonary toxicities and carcinogenicities of chronically inhaled diesel exhaust and carbon black in F344 rats. Fundam Appl Toxicol 25:80-94.
Schanker, LS; Mitchell, EW; Brown, RA. (1986) Species comparison of drug absorption from the lung after aerosol inhalation or intratracheal injection. Drug Metab Dispos 14(1):79-88.
Scheutzle, D. (1983) Sampling of vehicle emissions for chemical analysis and biological testing. Environ Health Perspect 47:65-80.
Schum, M; Yeh, HC. (1979) Theoretical evaluation of aerosol deposition in anatomical models of mammalian lung airways. Bull Math Biol 42:1-15.
Snyder, WS. (1975) Report of task group on reference man. Oxford, London: Pergamon Press, pp. 151-173.
Solderholm, SC. (1981) Compartmental analysis of diesel particle kinetics in the respiratory system of exposed animals. Oral presentation at EPA Diesel Emissions Symposium, Raleigh, NC, October 5-7. In: Toxicological effects of emissions from diesel engines (Lewtas J, ed.). New York: Elsevier, pp. 143-159.
Strom, KA; Chan, TL; Johnson, JT. (1987) Pulmonary retention of inhaled submicron particles in rats: diesel exhaust exposures and lung retention model. Research Publication GMR-5718. Warren, MI: General Motors Research Laboratories.
Strom, KA; Chan, TL; Johnson, JT. (1988) Inhaled particles VI. Dodgson, J; McCallum, RI; Bailey, MR; et al., eds. London: Pergamon Press, pp. 645-658.
A-42

Sun, JD; Woff, RK; Kanapilly, GM; et al. (1984) Lung retention and metabolic fate of inhaled benzo(a)pyrene associated with diesel exhaust particles. Toxicol Appl Pharmacol 73:48-59.
Weibel, ER. (1963) Morphometry of the human lung. Berlin: Springer-Verlag.
Xu, GB; Yu, CP. (1987) Desposition of diesel exhaust particles in mammalian lungs: a comparison between rodents and man. Aerosol Sci Tech 7:117-123.
Yu, CP. (1978) Exact analysis of aerosol deposition during steady breathing. Powder Technol 21:55-62.
Yu, CP; Xu, GB. (1986) Predictive models for deposition of diesel exhaust participates in human and rat lungs. Aerosol Sci Technol 5:337-347.
Yu, CP; Xu, GB. (1987) Predicted deposition of diesel particles in young humans. J Aerosol Sci 18:419-429.
Yu, CP; Yoon, KJ. (1990) Retention modeling of diesel exhaust particles in rats and humans. Res Rep Health Eff Inst 40:1-33.
Yu, CP; Diu, CK; Soong, TT. (1981) Statistical analysis of aerosol deposition in nose and mouth. Am Ind Hyg Assoc J 42:726-733.
Yu, CP; Yoon, KJ; Chen,YK. (1991) Retention modeling of diesel exhaust particles in rats and humans. J. Aerosol Med. 4(2): 79-115.
A-43

B-1
Appendix B
Benchmark Concentration Analysis ofDiesel Data

1For increases in incidence “extra risk” is used which is response incidence (inc) normalized to the
background (BG) incidence; response – BG/1-BG.
B-2
B-1. INTRODUCTION TO BENCHMARKThe benchmark dose or benchmark concentration approach, hereafter referred to as the
BMC approach, is an alternate to the N/LOAEL option for deriving effect levels. The BMC iscurrently undergoing extensive consideration by the Agency with promulgation of software andguidelines for application of this methodology (U.S. EPA, 2000). The BMC approach involvesfitting a dose-response function to dose and effect information from a single study to derive thebest fit of those data. This “best fit”is statistically termed the maximum likelihood estimate butis referred to in the benchmark terminology as the BMC curve. The curve defining thecorresponding lower 95% confidence limit of this “best fit”estimate is termed the BMCL curve. This BMCL curve is used to predict the dose that will result in a level of response that is defineda priori as the benchmark response “x”, BMCLx. In the analyses below, for example, thebenchmark response for a 10% increase in incidence1 of chronic inflammation is defined as aBMCL10; the corresponding 10% increase as determined from the BMC curve would be termedthe BMC10. This BMCL10 would be derived by first using the data and the programs to determinethe BMC and BMCL curves. The concentration corresponding to a 10% increase in incidencewould then be determined directly from the BMCL. The BMCL10 then would be used as therepresentative value for the effect level or point of departure in the dose-response assessment.
The latest version of the Agency Benchmark Dose Software (BMDS Version 1.2; U.S.EPA, 2000) was used to analyze data on chronic inflammation and pulmonary histopathologypresent in the chronic studies that were amenable to benchmark analysis. At this time, theAgency BMDS offers sixteen different models total that are appropriate for the analysis ofdichotomous data (gamma, logistic, probit, Weibull, log-logistic, multistage, log-probit,quantal-linear, quantal-quadratic), continuous data (linear, polynomial, power, Hill) and nesteddevelopmental toxicology data (NLogistic, NCTR, Rai & Van Ryzin). Results from all modelsinclude a reiteration of the model formula and model run options chosen by the user,goodness-of-fit information, a graphical presentation for visual inspection and the concentrationestimate for the response at the designated BMCLx, as well as the corresponding BMCx. Moredetails on the modeling results are described and presented in the analysis on dichotomous datafollowing.
The U.S. EPA benchmark dose (BMD/C) methods guidance has not been finalized at thistime to provide definitive procedures and criteria (U.S. EPA 1995). Therefore, in this documentprovisional criteria for minimum data to perform a benchmark analysis are designated such that(1) complete quantitative information on the response of interest should be available (e.g.,

B-3
incidence as number affected / total, means with variability) and that (2) at least two exposurelevels with responses that differ from those of the controls are provided, and (3) a benchmarkresponse of 10% is employed such that outcomes are BMCL10s. A response of 10% is at or nearthe limit of sensitivity in most long-term bioassays as determined from both the typical numberof animals used in bioassays and a low spontaneous background rate (e.g., 0.1%) for a giveneffect (Haseman, 1984; Haseman et al., 1989).
B-2. DIESEL DATA FOR BENCHMARK ANALYSISUsing the criteria set forth in Section B-1 and the information about the critical effects that
have been identified (pulmonary inflammation, pulmonary histopathology including indicatorsof fibrotic changes such as increases in alveolar-capillary wall thickness) the following ratchronic studies identified in Chapter 6 were analyzed for information suitable for BMC analysis: Ishinishi et al. (1986, 1988), Mauderly et al. (1987a,b; 1988); Heinrich et al. (1986, 1995), andNikula et al. (1995).
Results from this analysis yielded only a few data sets from a single study, that of Nikulaet al. (1995), that could be used for BMC analysis. The basis for not including data from theother studies varied. Information on pulmonary histopathology in the studies of Ishinishi et al.(1986, 1988), for example, was supplied only in narrative form with no quantitative informationgiven. A similar situation was found for those reports of the ITRI study; Wolff et al. (1987)reports on clearance alterations due to DPM exposure; Henderson et al. (1988) does giveinformation on hydroxyproline but only in graphical form; the 1988 study of Mauderly et al.deals with pulmonary function as a function of DPM lung loading; the 1987a reference ofMauderly et al. discusses tumor prevalence only and the Mauderly 1987b reference reports ondiesel exhaust in developing lung to a single exposure concentration of DPM with no dose-response information available. Those reports on the General Motor study contain extensiveinformation relating not to the critical effects, but mostly to precursors of inflammation such aslevels of polymorphonuclear neutrophils and lymphocytes in bronchoalveolar lavage from DPMexposed rats (Strom, 1984) and guinea pigs (Barnhart et al., 1981) as well as information oncollagen biosynthesis (Misiorowski et al., 1980) all of which is presented in graphical rather thantabular form amenable for benchmark analysis. The information on noncancer histopathologyreported by Heinrich et al. (1995) is in text form only and this author’s 1986 study dealsprimarily with clearance and mortality. Nikula et al. (1995), however, do present extensivequantitative dose-response information (incidence / dichotomous data) on several measures ofthe critical effect including chronic inflamation (presence of focal aggregates of neutrophils),focal fibrosis with epithelial hyperplasia (nodular fibrosis rimmed by hyperplasia), and septalfibrosis (interstitial fibrosis within alveolar septa) although the study had but 2 exposure
B-4
concentrations both of which are different from the controls, a minimal number on whichbenchmark analysis should be performed.
B-3. BENCHMARK ANALYSIS OF DIESEL DATAThese data from Nikula et al. (1995) were extracted, HEC concentrations calculated using
the model of Yu et al. (1991; Appendix A), and analyzed using all 9 applicable models fordichotomous data. Because the benchmark models were ran with the HEC, general from themodel of Yu et al. (1991), the BMCL10s are also HECs. The results and data are presented inTable B-1. Results were evaluated based on the nature of the data set, visual inspection of thegraphical output, and on the goodness-of-fit parameters, including p values and the AIC. Whenp values were generated for model fits, values for p that were less than 0.1 were considered toreflect a minimal fit to the data and were disqualified from further consideration. However, thesmall set of only 3 data points was often matched by the number of parameters fitted in severalof the models such that the outcome of the model exactly fit the data and thus no p value isgenerated; these model fits are often referred to as being overparameterized, and are indicated as“NA” in Table B-1. Values for p that were less than 0.1 were considered to reflect a minimal fitto the data. The AIC (Akaike Information Coefficient; Akaike, 1973; Stone, 1998) is aparameter generated for the models in U.S. EPA (2000) that allows for a general comparisonamong models run on the same data set. The AIC is defined as -2 log L + 2 p where log L is thelog likelihood of the fitted model, and p is the number of parameters estimated; smaller valuesindicate better fits.
The overall results of this mathematical analysis is reasonable in a biologically mechanisticsense in that chronic inflammation is more prevalent and apparently occurs at lowerconcentrations (i.e., has lower BMCL10 values) than does focal fibrosis. The information onseptal fibrosis were not interpretable as the data were not amenable (no or zero background andthen total incidence) to any meaningful benchmark or other dose-response analysis. The mostsensitive endpoint, chronic inflammation, is therefore the most sensitive benchmarkconcentration followed by focal fibrosis.
The choice for the most appropriate BMCL10 from among the various modeled values forchronic inflammation requires analysis of both the statistical and graphical outputs of the data. The shape of the dose-response curve from information given in Chapter 6 (Table 6-2) givesevidence of considerable “S” character, e.g., several low HECs without any reported effects upto about 0.2 mg/m3. The shape of the dose-response curves generated by several of the models,including gamma-hit, Weibull, multistage, and quantal linear were all a uniformly upwardsloping arc from the origin (graphs not shown) with minimal evidence of any “S” character, ashape not concordant with the data array in Table 6.2. Models that did generate curves with “S”

B-5
character included log-logistic, logistic, probit, quantal-quadratic, and log-probit. Because oftheir concordance with this independent data array on dose-response, the latter outputs arefurther analyzes.
The results for both chronic inflammation and focal fibrosis for those models with outputshaving appreciable “S” character suggest that females may be more sensitive than males forthese endpoints as the incidences are higher and the BMCL10 values are generally lower forfemales than for males. However, the model fits of the BMCL10s to the chronic inflammationdata segregated by sex were generally inadequate as judged from the p values (most being farless than 0.1) or from visual inspection of the fits to the data, several of which (e.g., log-logisticand log-probit) were lacking any appreciable “S” character. However, combining female andmale data improved data fitting as judged by the increased p values to where nearly all were>0.1 and to where the visual fits were concordant with the independent information on dose-response. Too, most of the combined BMCL10s were either intermediate between the female andmale values or somewhat closer to the female values such that the combined BMCL10 valueswere not much different from the females BMCL10s.
From among the combined male and female model outputs in Table B-1, the logistic,probit, and quantal quadratic results were all excluded based on the high AIC value relative tothe log-logistic and log-probit results. The log-logistic results were excluded based on the shapeof the lower portion of the dose-response curve which was upward sloping near the origin (graphnot shown) and not as concordant with the independent dose-response information in Table 6-2as was the fit of the log-probit model (Figure B-1). This leaves the fit of the log-probit model asbeing most reflective of the information in Table 6-2. The BMCL10 of the log-probit curve at0.37 mg/m3 remains and, by elimination, appears to be the most defensible choice from amongthe BMCL10s arrayed in Table B-1. Figure B-1 shows the graphical representation of the log-probit model fit to the data and the origin of the BMCL10. This graph also shows the relationshipof the BMCL10 of 0.37 mg/m3 to the variability that exists around the control value and that thevalue of 0.37 mg/m3 is not far removed from the outer range of this variability. The log-probitBMCL10 for focal fibrosis (combined) of 1.3 mg/m3 noted as being representative of this lesionfrom the BMC analysis in Table B-1.
Characterization of this benchmark value indicates that it may not be a suitable candidatefor use as a point of departure for development of a dose-response assessment such as the RfC. An attribute of the benchmark method is that the response (such as the 10% as used here) is nearthe range of the actual experimental values, such that extrapolation is not far below the observedexperimental range. However, due to the paucity of data points overall and lack of any valuesbelow an HEC of nearly 2 mg/m3 in the Nikula et al. (1995) study, the extrapolation of this BMCto the 10% response level is considerable, the BMLC10 of 0.37 mg/m3 being > 5-fold below the

B-6
nearest observed value of 1.95 mg/m3. Also, the high experimental exposures used in this studyare in the range of those resulting in pulmonary overload conditions in rats and therefore in therange of the model assumptions of Yu et al. (1991) about this phenomenon in humans forcalculation of the HECs (Chapter 3). The BMCL10 of 0.37 mg/m3 is considerably greater thanother NOAELs in the DPM data base of 0.144 mg/m3 and 0.128 mg/m3 (Table 6-2 in Chapter 6),possibly indicating that these NOAELs represent actual incidence levels that are considerablyless than10%; from the same log-probit model the corresponding BMCL05 was 0.21 mg/m3
(near the range of these NOAELs) and the corresponding BMCL01 was 0.07 mg/m3 (below therange of these NOAELs). These limitations on this BMCL10 make it a less than optimalcandidate for consideration as a point of departure in the development of dose-responseassessments.
B-4. SUMMARYThe recently developed EPA Benchmark dose software (U.S. EPA, 2000) and preliminary
guidance was utilized to analyze diesel data by the benchmark approach. Data from only one ofthe array of principal studies identified elsewhere (Chapter 6) was found to contain dataamenable to benchmark analysis. The data from this study, that of Nikula et al. (1995) onpulmonary inflammation and histopathology, was extracted and analyzed as dichotomous datausing all available models and designating a 10% response level such that BMCL10s werecalculated; as the models were ran with HECs, the BMCL10s were also HECs.
The analysis resulted in an array of BMCL10s from 3 different effects in two sexes (bothseparate and combined) with 9 different models. These BMCL10s were each considered from aperspective of biological relevance, known dose-response character, and from the individual fitto the data by the models from statistical parameters and visual judgments. The BMCL10 thatemerged after the above considerations was 0.37 mg/m3 for the combined male plus femaleincidence of chronic active pulmonary inflammation. A BMCL10 of 1.3 mg/m3 for pulmonaryfocal fibrosis was also noted in this analysis. Characterization of these benchmark valuesindicates that neither may be a suitable candidate for use as a point of departure in developmentof a dose-response assessment such as the RfC but that they are concordant with otherquantitative dose-response aspects of the DPM database.

B-7
Table B-1. BMC analysis of pathology incidence data in male and female F344 rats from the study of Nikula et al. (1995)using the different models available from U. S. EPA benchmark dose project (U.S. EPA, 2000) for dichotomous data based on10% extra risk (i.e., a 10% increase relative to a total that has been adjusted for background) and no threshold term. Theconcentrations used in the analysis are human continuous equivalent concentrations (HECs) obtained from the interspeciesextrapolation model of Yu et al. (1991). The table listings include the BMCL10 (the benchmark response level of 10%obtained from the lower 95% limit of the benchmark curve in mg/m3), the BMC10 (the corresponding estimate at 10%response from the best fit benchmark curve, also in mg/m3), P = goodness-of-fit values. NA indicates a G-O-F value was notavailable, usually due to the lack of degrees of freedom. AIC = Akaike Information Coefficient (see U.S. EPA, 2000 andbelow) which may be used for model comparison on the same data set.
Effect (from Table 5and 6, p 86, Nikulaet al., 1995)
Inc @0 mg/m3
Inc @1.95 mg/m3
HEC
Inc @5.1 mg/m3
HEC
BMCL10(BMC10)
log-logistic
BMCL10(BMC10)
log-probit
BMCL10(BMC10)
multi-stage
BMCL10(BMC10) -Weibull
BMCL10(BMC10) -
gamma
BMCL10(BMC10) -quantallinear
BMCL10(BMC10) -
probit
BMCL10(BMC10) -
logistic
BMCL10(BMC10)quantal
quadratic
Chronic active inflammation >18 mos,grades 1-3, male +female combined
5/177 59/162 118/174 0.32(0.64)P= NAAIC= 483
0.37(.70)P=NAAIC = 483
0.43(.49)P= 0.982AIC= 481
0.43(.49)P= 0.982AIC= 481
0.43(.49)P=0.98AIC= 480
0.43(.49)P= .982AIC= 481
1.06(1.19)P= 0.000AIC= 499
1.12(1.26)P=0.000AIC= 502
1.34(1.45)P= 0.000AIC = 505
Chronic activeinflammation >18 mos,grades 1-3 in males
1/86 19/81 54/85 0.67(1.16)P= NAAIC= 217
0.74(1.22)P = NAAIC = 217
0.56(.95)undefinedAIC= 217
.56(1.04)P= NAAIC= 216
.56(1.09)P= NAAIC= 217
0.50(.61)P= 0.15AIC= 216
1.31(1.55)P= 0.05AIC= 219
0.67(1.16)P= NAAIC= 217
1.42(1.57)P= 0.055AIC = 218
Chronic active inflammation >18 mos,grades 1-3 in females
4/91 40/81 64/89 0.18(0.26)P= NAAIC= 257
.016(.30)P = NAAIC = 257
0.33(.40)P= 0.173AIC= 257
0.33(.40)P= 0.173AIC= 257
0.33(.40)P= 0.17AIC= 257
0.33(.40)P= 0.173AIC= 257
0.83(.96)P= 0.0001AIC= 272
0.85(1.0)P= 0.000AIC= 273
1.21(1.35)P= 0.000AIC = 279
Focal fibrosis withepithelial hyperplasia,grades 1-4 in males andfemales combined
0/177 18/162 63/174 1.25(1.8)P= 1.000AIC= 345
1.3(1.8)P = 1.000AIC = 345
1.21(1.8)P= 1.000AIC= 345
1.21(1.8)P= 1.000AIC= 345
1.21(1.8)P= 1.0AIC= 345
1.1(1.3)P= 0.363AIC= 345
2.32(2.61)P= 0.013AIC= 353
2.50(2.8)P= 0.006AIC= 356
2.14(2.34)P= 0.091AIC = 347
Focal fibrosis withepithelial hyperplasia,grades 1-4 in males
0/86 5/81 19/85 1.72(2.7)P= 1.00AIC= 132
1.6(2.7)P = 1.000AIC = 132
1.79(2.8)undefinedAIC= 134
1.79(2.8)P= 1.00AIC= 132
1.79(2.75P= 1.0AIC= 132
1.7(2.4)P= 0.70AIC= 131
2.98(3.5)P= 0.199AIC= 134
3.17(3.69)P= 0.153AIC= 135
2.68(3.1)P=0.552AIC = 131
Focal fibrosis withepithelial hyperplasia,grades 1-4 in females
0/91 13/81 44/89 0.80(1.4)P= 1.00AIC= 199
0.87(1.47)P = 1.000AIC = 199
0.77P= 0.99AIC= 199
0.77(1.4)P=1.0AIC=199
0.71(1.4)P= 1.00AIC= 199
0.71(.88)P= 0.445AIC= 198
1.76P= 0.037AIC= 205
1.89(2.2)P= 0.02AIC= 207
1.7(1.9)P= 0.21AIC = 200
Septal fibrosis,>18 mos, grades 1-4 inmales
1/86 79/81 83/85 .003(.008)P= 0.35AIC= 53
(failed) 0.07(.08)P= 0.000AIC= 65
0.07(.08)P= 0.000AIC= 65
0.07(.08)P= 0.000AIC= 65
0.07(.08)P= 0.000AIC= 65
0.29(.37)P= 0.000AIC= 114
0.32(.44)P= 0.000AIC= 86
0.42(0.47)P= 0.000AIC = 100
Septal fibrosis,>18 mos, grades 1- 4 infemales
2/91 75/81 87/89 0.009 (.05)P= NAAIC= 87
(failed) 0.08(.10)P= 0.003AIC= 91
0.08(.10)P= 0.000AIC= 91
0.08(.10)P= 0.003AIC= 91
0.08(.10)P= 0.003AIC= 91
0.32(.40)P= 0.000AIC= 131
0.34(.45)P= 0.000AIC= 109
0.46(.51)P= 0.000AIC = 119

B-8
Figure B-1. Benchmark concentration analysis (log-probit) of chronic pulmonaryinflammation in rats exposed to DPM from Nikula et al. (1995). BMCL10,the lower confidence estimate of the concentration of DPM associated witha 10% incidence (extra risk); BMC10, the corresponding estimate from thebest (log-probit) fit. () data with 95% error bounds.
B-9
REFERENCES FOR APPENDIX B
Akaike, H. (1973) Information theory and an extension of the maximum likelihood principle. In: Proceedings of theSecond International Symposium on Information Theory, B.N. Petrov and F. Csaki, eds. Akademiai Kiado,Budapest, pp. 267-281
Barnhart, MI; Chen, S-T; Salley, SO; et al. (1981) Ultrastructure and morphometry of the alveolar lung of guineapigs chronically exposed to diesel engine exhaust: six months’ experience. J Appl Toxicol 1:88-103.
Haseman, JK. (1984) Statistical issues in the design, analysis, analysis and interpretation of animal carcinogenicitystudies. Environ Health Persp 58: 385-392.
Haseman, JK; Huff, JE; Rao, GN and Eustis, SL. (1989) Sources of variability in rodent carcinogenicity studies. Fund Appl Toxicol 12: 793-804.
Heinrich, U; Muhle, H; Takenaka, S; et al. (1986) Chronic effects on the respiratory tract of hamsters, mice, and ratsafter long-term inhalation of high concentrations of filtered and unfiltered diesel engine emissions. J Appl Toxicol6:383-395.
Heinrich, U; Fuhst, R; Rittinghausen, S; et al. (1995) Chronic inhalation exposure of Wistar rats and two strains ofmice to diesel engine exhaust, carbon black, and titanium dioxide. Inhal Toxicol 7:553-556.
Henderson, RF; Pickrell, JA; Jones, RK; et al. (1988) Response of rodents to inhaled diluted diesel exhaust:biochemical and cytological changes in bronchoalveolar lavage fluid and in lung tissue. Fundam Appl Toxicol11:546-567.
Ishinishi, N; Kuwabara, N; Nagase, S; et al. (1986) Long-term inhalation studies on effects of exhaust from heavyand light duty diesel engines on F344 rats. In: Ishinishi, N; Koizumi, A; McClellan, RO; et al., eds. Carcinogenicand mutagenic effects of diesel engine exhaust: proceedings of the international satellite symposium ontoxicological effects of emissions from diesel engines; July; Tsukuba Science City, Japan. (Developments intoxicology and environmental science: v. 13.) Amsterdam: Elsevier Science Publishers BV; pp. 329-348
Ishinishi, N; Kuwabara, N; Takaki, Y; et al. (1988) Long-term inhalation experiments on diesel exhaust. In: Dieselexhaust and health risks: results of the HERP studies. Tsukuba, Ibaraki, Japan: Japan Automobile ResearchInstitute, Inc., Research Committee for HERP Studies; pp. 11-84.
Mauderly, JL; Jones, RK; Griffith, WC; et al. (1987a) Diesel exhaust is a pulmonary carcinogen in rats exposedchronically by inhalation. Fundam Appl Toxicol 9:208-221.
Mauderly, JL; Bice, DE; Carpenter, RL; et al. (1987b) Effects of inhaled nitrogen dioxide and diesel exhaust ondeveloping lung. Cambridge, MA: Health Effects Institute; research report no. 8.
Misiorowski, RL; Strom, KA; Vostal, JJ; et al. (1980) Lung biochemistry of rats chronically exposed to dieselparticulates. In: Pepelko, WE; Danner, RM; Clarke, NA, eds. Health effects of diesel engine emissions: proceedingsof an international symposium; December 1979. Cincinnati, OH: U.S. Environmental Protection Agency, HealthEffects Research Laboratory; pp. 465-480; EPA report no. EPA-600/9-80-057a. Available from: NTIS, Springfield,VA; PB81-173809.
Nikula, KJ; Snipes, MB; Barr, EB; et al. (1995) Comparative pulmonary toxicities and carcinogenicities ofchronically inhaled diesel exhaust and carbon black in F344 rats. Fundam Appl Toxicol 25:80-94.
Stone, M. (1998) Akaike’s Criteria. In: Encyclopedia of Biostatistics, Armitage, P. and Colton, T., eds. Wiley,New York.

B-10
Strom, KA. (1984) Response of pulmonary cellular defenses to the inhalation of high concentrations of dieselexhaust. J Toxicol Environ Health 13:919-944.
U.S. Environmental Protection Agency (U.S. EPA). (1995) The use of the benchmark dose approach in health riskassessment. Washington, DC: Office of Research and Development, Risk Assessment Forum United StatesEnvironmental Protection Agency.
U.S. EPA. (2000) Benchmark dose software version 1.2. Washington, DC: National Center for EnvironmentalAssessment, United States Environmental Protection Agency. Available: http://www.epa.gov/ncea/bmds.htm[2000, June 7].
Wolff, RK; Henderson, RF; Snipes, MB; et al. (1987) Alterations in particle accumulation and clearance in lungs ofrats chronically exposed to diesel exhaust. Fundam Appl Toxicol 9:154-166.
Yu, CP; Yoon, K.J.; Chen, Y.K. (1991) Retention modeling of diesel exhaust particles in rats and humans. J. Aerosol Res. 4 (2): 79-115.

C-1
Appendix C
A Summary Review of Cancer Dose-responseAnalyses on Diesel Exhaust

C-2
C.1. INTRODUCTIONSeveral individuals and organizations have previously conducted dose-response
assessments to estimate quantitatively the cancer risk from exposures to DE. Estimations wereperformed on the basis of either epidemiologic and/or experimental data. As concluded inSection 8.5, EPA finds that available epidemiologic data are too uncertain to confidently derive aunit risk estimate for DE-induced lung cancer, and that rat data are not suitable for estimatinghuman risk. Nevertheless, a review of historical dose-response evaluations is provided here asbackground information. This information is not intended to constitute endorsement or arecommendation for use in quantitative risk assessment.
Early analyses to quantitatively assess the carcinogenicity of DE were hindered by a lackof positive epidemiologic studies and long-term animal studies. One means of overcoming theseobstacles was the use of comparative potency methods based on combined epidemiologic andexperimental data. By the late 1980s, the availability of dose-response data from animalbioassays and epidemiologic studies provided an opportunity for the derivation of both animaland human data-based estimates, although considerable uncertainties were generallyacknowledged by the authors of these assessments.
C.2. COMPARATIVE POTENCY METHODSIn this method, the potency of diesel particulate matter (DPM) extract is compared with
other combustion or pyrolysis products for which epidemiology-based unit risk estimates havebeen developed. Comparisons are made using short-term tests such as skin painting, mutations,and mammalian cell transformation. The ratio of the potency of DPM extract to each of theseagents is then multiplied by their individual unit risk estimates to obtain the unit risk for DE. Ifepidemiology-based estimates from more than one pollutant are used, the derived potencies aregenerally averaged to obtain an overall mean. Major uncertainties of this method include theassumptions that (1) the cancer potency of DE can be determined on the basis of the relativeeffectiveness of the organic fraction alone; (2) the relative potency in short-term tests is anaccurate predictor of lung cancer potency; and (3) DPM extracts are similar in chemicalcomposition and proportion as combustion or pyrolysis products.
In the study by Albert et al. (1983), epidemiology-based unit cancer risk estimates forcoke oven emissions, cigarette smoke condensate, and roofing tar were used. Samples of DPM were collected from three light-duty engines (a Nissan 220 C, an Oldsmobile 350, and aVolkswagen turbocharged Rabbit), all run on a highway fuel economy test cycle, and from aheavy-duty engine (Caterpillar 3304) run under steady-state, low-load conditions. The DPMextracts were tested in a variety of assays. Dose/concentration-dependent increases in responsewere obtained for the four assays listed below:
C-3
C Ames Salmonella typhimurium (TA98) reverse mutation,C Gene mutation in L5178Y mouse lymphoma cells,C Sencar mouse skin tumor initiation test, andC Viral enhancement of chemical transformation in Syrian hamster embryo cells.Only the first three assays were used to develop comparative potency estimates because
of variability of responses in the enhancement of the viral transformation assay. The in vitrostudies were carried out both in the presence and absence of metabolic activators. The potency,defined as the slope of the dose-response curve, was measured for each sample in each short-term assay.
The skin tumor initiation test was positive for all the engines tested except the Caterpillarengine. Only the Nissan engine, however, resulted in strong dose-response data. Because skintumor initiation was considered to be the most biologically relevant test, it was used to derivepotency estimates for the Nissan engine. An estimate for the Nissan engine was then derived bymultiplying the epidemiology-based potency estimates for each of the three agents (coke ovenemissions, roofing tar, and cigarette smoke condensate) by the ratios of their potencies in theskintumor initiation test to that of the Nissan diesel engine. According to this method, three 95%upper-bound estimates of lifetime cancer risk per microgram per cubic meter of extractableorganic matter were derived for the Nissan diesel, based on potency comparisons with each ofthe three agents. These values are: coke oven emissions, 2.6 × 10⁻⁴; roofing tar, 5.2 × 10⁻⁴; andcigarette smoke condensate, 5.4 × 10⁻⁴. The average of the three equals 4.4 × 10⁻⁴.
The potency of the other diesel emission samples was not estimated directly because ofthe weak response in the skin tumor initiation test. Instead, their potency relative to the Nissanengine was estimated as the arithmetic mean of their potency relative to the Nissan in theSalmonella assay in strain TA98, the sister chromatid exchange assay in Chinese hamster ovarycells, and the mutation assay in mouse lymphoma cells. The estimated lifetime cancer risk permicrogram per cubic meter of extractable organic matter for extracts from these engines are asfollows: Volkswagen, 1.3 × 10⁻⁴; Oldsmobile, 1.2 × 10⁻⁴; and Caterpillar, 6.6 × 10⁻⁶.
Harris (1983) developed comparative potency estimates for the same four engines usedby Albert et al. (1983) but used only two epidemiology-based potency estimates: those for cokeoven emissions and for roofing tar. He employed preliminary data from three of the same assaysused by Albert et al. (1983): the Sencar mouse skin tumor initiation assay, enhancement of viraltransformation in Syrian hamster embryo cells, and the L5178 mouse lymphoma test. The DEcancer potency estimates were then derived by multiplying the epidemiology-based cancerpotency estimates for both coke oven emissions and roofing tar by the ratio of their potenciescompared with DPM extract in each of the three bioassays. Harris (1983) derived an overall

C-4
mean relative risk value of 3.5 × 10⁻⁵ per µg/m3 for the three light-duty engines with a 95% upperconfidence limit of 2.5 × 10⁻⁴. Individual mean values for each engine were not reported.
McClellan (1986), Cuddihy et al. (1981, 1984), and Cuddihy and McClellan (1983)estimated a risk of about 7.0 × 10⁻⁵ per µg/m3 DPM using a comparative potency method similarto those reported in the preceding paragraph. The database was similar to that used by Albert etal. (1983) and Harris (1983). C.3. EPIDEMIOLOGY-BASED ESTIMATION OF CANCER RISK
The first lung cancer risk estimates based on epidemiologic data were derived by Harris(1983). He assessed the risk of exposure to DE using data from the London Transport WorkerStudy reported by Waller (1981). Five groups of employees from the London TransportAuthority (LTA) were used: bus garage engineers, bus drivers, bus conductors, engineers incentral works, and motormen and guards. The first group was considered to have received thehighest exposure; the next two, intermediate; and the last two groups, none. When cancer deathrates for the high-exposure group were compared with those of London males, there was noincrease in the observed-to-expected (O/E) ratios. The author, in fact, considered the results tobe negative. However, because the low rate of lung cancer in all the LTA exposure groups mayhave been the result of a “healthy worker” effect, Harris (1983) compared the exposed groupswith internal controls. He merged the three exposed groups and compared them with the twogroups considered to be unexposed. An adjustment was made for the estimated greater exposurelevels of garage engineers compared with bus drivers and conductors. Using this method, therelative risk of the exposed groups was greater than 1 but was statistically significant only forgarage engineers exposed from 1950 to 1960. In that case, the O/E ratio was 29% greater thanthe presumed unexposed controls.
Harris (1983) identified a variety of uncertainties relative to potency assessment based onthis study. These included:
C small unobserved differences in smoking incidences among groups, which could havea significant effect on lung cancer rates;
C uncertainty about the magnitude of exposure in the exposed groups;C uncertainty regarding the extent of change in exposure conditions over time;C random effects arising from the stochastic nature of the cancer incidence; andC uncertainty in the mathematical specification of the model.Taking the uncertainties into account, he derived a maximum likelihood excess relative
risk estimate of 1.23 × 10⁻⁴, with a 95% upper confidence limit of 5 × 10⁻⁴ per µg/m3 DPM peryear.

C-5
McClellan et al. (1989) reported risk estimates based on the Garshick et al. (1987) case-control study in which lung cancer in railroad workers was evaluated. Using a logisticregression, the expected relative risk of lung cancer death was estimated to rise 0.016 per year ofexposure to DE. Adjustments were made to convert to continuous exposure (168 vs. 40 hours)for 70 years. Because exposure levels could not be defined exactly, two sets of calculations weremade, assuming inhaled DPM concentrations of either 500 or 125 µg/m3 DPM. The number ofexcess cancer deaths per year in the United States was estimated to be 3,800 (95% C.I. 400-7400when an exposure of 125 µg/m3 was used, and 950 (95% C.I. 100-1,900) when 500 µg/m3 DPMwas used.
The California EPA (Cal-EPA, 1998) derived unit risk estimates for lung cancer basedupon the Garshick et al. (1987) case-control study and the Garshick et al. (1988) cohort study ofU.S. railroad workers. A variety of exposure patterns were considered, characterized by twocomponents: the average exposure concentration for the workers as measured by Woskie et al.(1988) and the extent of change in exposure from 1959 to 1980. The lowest lifetime riskestimate derived was 1.3 × 10⁻⁴ per µg/m3 and the highest was 2.4 × 10⁻³ per µg/m3. Thegeometric mean was 6 × 10⁻⁴ per µg/m3.
Steenland et al. (1998) estimated lung cancer risk of truck drivers on the basis of a case-control study of decedents in the Teamsters Union (Steenland et al., 1990). Retrospectiveexposure estimates were made starting with a set of 1990 exposure measurements for differentjob categories and then retrospectively estimating from 1982 to about 1950 using various factors,including diesel vehicle miles traveled and engine emission rates per mile. The 1990 jobcategory estimates came from an extensive industrial hygiene survey of elemental carbon (EC)exposures in the trucking industry by Zaebst et al. (1991). Lifetime (through age 75) excess riskof lung cancer death for male truck drivers was calculated with the aid of a cumulative exposuremodel. Assuming a most likely emissions scenario of 4.5 g/mile in 1970, and a 45-year exposureto 5 µg/m3 of EC beginning at age 20 and ending at age 65, the estimated excess lung cancer riskwas determined to be 1.6% (95% CI 0.4%-3.1%). Using the same data base, Stayner et al (1998)presented an estimate of excess lifetime risk of 4.5E-4 for a worker exposed to 1 µg/m3 of DEfor 45 years.
C.4. ANIMAL BIOASSAY-BASED CANCER POTENCY ESTIMATESWith the availability of chronic cancer bioassays, a considerable number of potency
estimates were derived using lung tumor induction in rats. A high degree of uncertainty exists inthe use of the rat data to predict human risk. Major uncertainties include: (1) differences inparticle deposition patterns between rats and humans, (2) differences in sensitivity between ratsand humans to the carcinogenic action of DE, and (3) extrapolation of rat lung tumor responses

C-6
at high concentrations to ambient concentrations without a clear understanding of the mode ofaction of DE. It is now widely recognized that the rat lung tumor response associated with anyinsoluble particles at high concentrations is mediated by a particle-overload mechanism (ILSI,2000), suggesting that rat data for DE are not suitable for estimating human risk at lowenvironmental concentrations.
The first risk estimate was reported by Albert and Chen (1986), based on the chronic ratbioassay conducted by Mauderly et al. (1987). Using a multistage model and assumingequivalent deposition efficiency in humans and rats, they derived a 95% upper confidence limitof 1.6 × 10⁻⁵ for lifetime risk of exposure to 1 µg/m3. Pott and Heinrich (1987) also used a linearmodel and data reported by Brightwell et al. (1989), Heinrich et al. (1986), and Mauderly et al.(1987). They reported risk estimates ranging from 6 × 10⁻⁵ to 12 × 10-5 per µg/m3. Smith andStayner (1990), using time-to-tumor models based on the data of Mauderly et al. (1987), derivedpoint (MLE) estimates ranging from 1.0 × 10⁻⁴ to 2.1 × 10⁻⁴ per µg/m3 after converting fromoccupational to environmental exposure scenario.
Pepelko and Chen (1993) developed unit risk estimates based on the data of Brightwell etal. (1989), Ishinishi et al. (1986), and Mauderly et al. (1987) using a detailed dosimetry model toextrapolate dose to humans and a linearized multistage (LMS) model. Taking the geometricmean of individual estimates from the three bioassays, they derived unit risk estimates of 1.4 ×10⁻⁵ per µg/m3 when dose was based on carbon particulate matter per unit lung surface arearather than whole DPM, and 1.2 × 10⁻⁴ per µg/m3 when based on lung burden per unit bodyweight.
Hattis and Silver (1994) derived a maximum likelihood estimate for occupationalexposure of 5.2 × 10⁻⁵ per µg/m3 based on lung burden and bioassay data reported by Mauderlyet al. (1987) and use of a five-stage Armitage-Doll low-dose extrapolation model. CaliforniaEPA (CAL-EPA, 1998) derived a geometric mean estimate of 6 × 10⁻⁵ per µg/m3 from fivebioassays using an LMS model.
To demonstrate the possible influence of particle effects as well as particle-associatedorganics, an additional modeling approach was conducted by Chen and Oberdorster (1996). Employing a biologically based two-stage model and using malignant tumor data from Mauderlyet al. (1987), the upper-bound risk estimate for exposure to 1 µg/m3 was estimated to be 1.7 × 10⁻⁵. This estimate is virtually identical to that using the LMS model, assumingnonthreshold effect of particles. If a threshold of particle effect is assumed, however, theestimated risk decreases about fivefold. The results also show that the mechanism of DE-induced lung tumor at high exposure concentrations may differ from that at low exposureconcentrations, with the organics and particles playing primary roles of tumorigenesis,respectively, at low and high concentrations. Overall, the potency estimates on the basis of

C-7
animal bioassays are in the range of 10-6 to 10-4 per 1 µg/m3 of DPM.Valberg and Crouch (1999) conducted a meta-analysis of rat bioassays by pooling
together data of low-dose groups from different bioassays. There are eight bioassays used in themeta-analysis; half of them had duration of 24 months, and the remaining studies had duration of30 months or more. Animals with continuous lifetime exposure of less than 600 µg/m3 of DEwere included in the analysis. Continuous lifetime exposure is calculated by protracting actualDE exposure to 30 months (24 hours per day, 7 days per week). The researchers concluded thatexposure of rats to DE at concentrations not associated with lung overload is consistent with notumorigenic effect.
REFERENCES FOR APPENDIX C
Albert, RE; Chen, C. (1986) U.S. EPA diesel studies on inhalation hazards. In: Carcinogenicity and mutagenicity ofdiesel engine exhaust. Ishinishi, N; Koizumi, A; McClellan, R; et al., eds. Amsterdam: Elsevier, pp. 411-419.
Albert, RE; Lewtas, J; Nesnow, S; et al. (1983) Comparative potency method for cancer risk assessment: applicationto diesel particulate emissions. Risk Anal 3:101-117.
Brightwell, J; Fouillet, X; Cassano-Zoppi, AL; et al. (1989) Tumours of the respiratory tract in rats and hamstersfollowing chronic inhalation of engine exhaust emissions. J Appl Toxicol 9:23-31.
California Environmental Protection Agency. (CAL-EPA, OEHHA) (1998) Health risk assessment for DE. Publicand Scientific Review Draft.
Chen, CW; Oberdörster, G. (1996) Selection of models for assessing dose-response relationships for particle-induced lung cancer. Inhal Toxicol 8(suppl):259-278.
Cuddihy, RG; McClellan, RO. (1983) Evaluating lung cancer risks from exposures to diesel engine exhaust. RiskAnal 3:119-124.
Cuddihy, RG; Griffith, WC; Clark, CR; et al. (1981) Potential health and environmental effects of light-duty dieselvehicles. Report No. LMF-89. Albuquerque, NM: Inhalation Toxicology Research Institute.
Cuddihy, RG; Griffith, WC; McClellan, RO. (1984) Health risks from light-duty diesel vehicles. Environ SciTechnol 18:14-21a.
Garshick, E; Schenker, MB; Munoz, A; et al. (1987) A case-control study of lung cancer and DE exposure inrailroad workers. Am Rev Respir Dis 135:1242-1248.
Garshick, E; Schenker, MB; Munoz, A; et al. (1988) A retrospective cohort study of lung cancer and DE exposurein railroad workers. Am Rev Respir Dis 137:820-825.
Harris, JE. (1983) Diesel emissions and lung cancer. Risk Anal 3:83-100.
Hattis, D; Silver, K. (1994) Use of mechanistic data in occupational health risk assessment: the example of dieselparticulates. In: Chemical risk assessment and occupational health. Smith, MC; Christiani, DC; Kelsey, KT, eds.Westport, CT: Auburn House, pp. 167-178.

C-8
Heinrich, U; Muhle, H; Takenaka, S; et al. (1986) Chronic effects on the respiratory tract of hamsters, mice and ratsafter long-term inhalation of high concentration of filtered and unfiltered diesel engine emissions. J Appl Physiol6:383-395.
Ishinishi, N; Kuwabara, N; Nagase, S; et al. (1986) Long-term inhalation studies on effects of exhaust from heavyand light duty diesel engines on F344 rats. In: Carcinogenic and mutagenic effects of diesel engine exhaust.Ishinishi, N; Koizumi, A; McClellan, RO; et al., eds. Amsterdam: Elsevier, pp. 329-348.
Mauderly, JL; Jones, RK; Griffith, WC; et al. (1987) DE is a pulmonary carcinogen in rats exposed chronically byinhalation. Fundam Appl Toxicol 9:208-221.
McClellan, RO. (1986) Health effects of DE: a case study in risk assessment. Am Ind Hyg Assoc J 47:1-13.
McClellan, RO; Cuddihy, RG; Griffith, WC; et al. (1989) Integrating diverse data sets to assess the risks of airbornepollutants. In: Assessment of inhalation hazards. Mohr, U, ed. New York: Springer Verlag, pp. 3-22.
Pepelko, WE; Chen, C. (1993) Quantitative assessment of cancer risk from exposure to diesel engine emissions.Regul Toxicol Pharmacol 17:52-65.
Pott, F; Heinrich, U. (1987) Dieselmotorabgas und Lungenk auf die Gefährdung des Menschen. In: Umwelthygiene,vol. 19. Med. Institut. f. Umwelthygiene, Annual Report 1986/87. Dusseldorf, F.R.G., pp. 130-167.
Smith, RA; Stayner, L. (1990) An exploratory assessment of the risk of lung cancer associated with exposure to DEbased on a study with rats. Final report. Division of Standards Development and Technology Transfer; Cincinnati,OH: NIOSH.
Stayner, L; Ddankovic, D; Smith, R; et al. (1998) Predicted lung cancer risk among miners exposed to dieselexhaust particles. Am J Ind Med 34:207-219.
Steenland, NK; Silverman, DT; Hornung, RW. (1990) Case-control study of lung cancer and truck driving in theTeamsters Union. Am J Publ Health 80:670-674.
Steenland, K; Deddens, J; Stayner, L. (1998) DE and lung cancer in the trucking industry: exposure-responseanalysis and risk assessment. Am J Ind Med 34:220-228.
Valberg, PA; Crouch, EA. (1999) Meta-analysis of rat lung tumors from lifetime inhalation of diesel exhaust. Environ Health Perspect 107(9):693-699.
Waller, RE. (1981) Trends in lung cancer in London in relation to exposure to diesel fumes. Environ Int 5:479-483.
Woskie, SR; Smith, TJ; Hammond, SK; et al. (1988) Estimation of the DE exposures of railroad workers: II.National and historical exposures. Am J Ind Med 13:395-404.
Zaebst, D; Clapp, D; Blade, L; et al. (1991) Quantitative determination of trucking industry workers’ exposures todiesel particles. Am Ind Hyg Assoc J 52:529-541.

United States Environmental Protection Agency/ORD National Center for
Environmental Assessment Washington, DC 20460
Official Business Penalty for Private Use $300
EPA/600/8-90/057F May 2002
Please make all necessary changes on the below label, detach or copy, and return to the address in the upper left-hand corner.
If you do not wish to receive these reports CHECK HERE G; detach, or copy this cover, and return to the address in the upper left-hand corner.
PRESORTED STANDARD POSTAGE & FEES PAID
EPA PERMIT No. G-35