Effects of Fuel Physical Properties on Diesel Engine Combustion Using Diesel and BioDiesel Fuels
16
08 PFL-944 Effects of Fuel Physical Properties on Diesel Engine Combustion using Diesel and Bio-diesel Fuels Youngchul Ra and Rolf D. Reitz University of Wisconsin, Madison Joanna McFarlane and Stuart C. Daw Oak Ridge National Laboratory Copyright © 2008 SAE International ABSTRACT A computational study using multi-diemsional CFD modeling was performed to investigate the effects of physical properties on diesel engine combustion characteristics with bio-diesel fuels. Properties of typical bio-diesel fuels that were either calculated or measured are used in the study and the simulation results are compared with those of conventional diesel fuels. The sensitivity of the computational results to individual physical properties is also investigated, and the results provide information about the desirable characteristics of the blended fuels. The properties considered in the study include liquid density, vapor pressure, surface tension, liquid viscosity, liquid thermal conductivity, liquid specific heat, latent heat, vapor specific heat, vapor diffusion coefficient, vapor viscosity and vapor thermal conductivity. The results show significant effects of the fuel physical properties on ignition delay and burning rates at various engine operating conditions. It is seen that there is no single physical property that dominates differences of ignition delay between diesel and bio- diesel fuels. However, among the 11 properties considered in the study, the simulation results were found to be most sensitive to the liquid fuel density, vapor pressure and surface tension through their effects on the mixture preparation processes. INTRODUCTION Biodiesel fuel is seen as a promising alternative to conventional diesel for use in compression-ignition (CI) engines. As a plant-based fuel, it can be produced domestically, is a renewable energy source, and essentially has a closed carbon cycle over its lifetime [1]. In terms of emissions, it has been reported that biodiesel tends to reduce unburned hydrocarbons, carbon monoxide, and particulate matter compared to its petroleum counterpart, while the NOx level is likely to increase with increasing biodiesel fraction in blended fuels [2,3]. Although it has been suggested through experimental research [2-7] that the difference of combustion between biodiesel and regular diesel can be attributed to differences in both the physical properties and the chemical oxidation mechanisms between the two fuels, biodiesel combustion is not as well understood as the combustion of regular diesel. While the effects of the physical and chemical properties of the fuel on combustion can be investigated experimentally, a computational study is an effective approach for investigating parametric effects of physical properties on mixture preparation, ignition and combustion, and subsequent pollutant formation. In recent evolution of computational methods of diesel engine operation, more effort has been made in modeling the in-cylinder processes. As spray injection, which is a critical physical process in mixture preparation, affects the subsequent combustion process, the accuracy of physical models is of significant importance. The performance of physical models also strongly depends on the accurate estimation of physical and chemical properties of the fuel. Following a review of the literature concerning the physical properties of alternative fuels, Chakravarthy et al. [8] compiled and presented a complete set of bio- diesel properties required for detailed engine simulations. Based on that research, in this paper, a study of the effects of physical property differences between biodiesel and diesel fuels on CI engine operation is presented. The sensitivity of computations of engine combustion to the individual properties is also investigated. In order to decouple the effect of differences in reaction chemistry between biodiesel and diesel, the simulations were performed by replacing the physical properties of diesel with those of biodiesel, while keeping the same reaction mechanism as that used for diesel engine simulations [9]. BIODIESEL PROPERTIES The physical properties of mixtures of hydrocarbons and biodiesel can be determined by calculating the physical properties of each individual component, and then imposing mixing rules to derive the properties of the mixtures. This method is feasible for biodiesel, which consists of a relatively simple formulation of fatty acid
Transcript of Effects of Fuel Physical Properties on Diesel Engine Combustion Using Diesel and BioDiesel Fuels

08 PFL-944
Effects of Fuel Physical Properties on Diesel Engine Combustion using Diesel and Bio-diesel Fuels
Youngchul Ra and Rolf D. Reitz University of Wisconsin, Madison
Joanna McFarlane and Stuart C. Daw Oak Ridge National Laboratory
Copyright © 2008 SAE International
ABSTRACT
A computational study using multi-diemsional CFD modeling was performed to investigate the effects of physical properties on diesel engine combustion characteristics with bio-diesel fuels. Properties of typical bio-diesel fuels that were either calculated or measured are used in the study and the simulation results are compared with those of conventional diesel fuels. The sensitivity of the computational results to individual physical properties is also investigated, and the results provide information about the desirable characteristics of the blended fuels. The properties considered in the study include liquid density, vapor pressure, surface tension, liquid viscosity, liquid thermal conductivity, liquid specific heat, latent heat, vapor specific heat, vapor diffusion coefficient, vapor viscosity and vapor thermal conductivity. The results show significant effects of the fuel physical properties on ignition delay and burning rates at various engine operating conditions. It is seen that there is no single physical property that dominates differences of ignition delay between diesel and bio-diesel fuels. However, among the 11 properties considered in the study, the simulation results were found to be most sensitive to the liquid fuel density, vapor pressure and surface tension through their effects on the mixture preparation processes.
INTRODUCTION
Biodiesel fuel is seen as a promising alternative to conventional diesel for use in compression-ignition (CI) engines. As a plant-based fuel, it can be produced domestically, is a renewable energy source, and essentially has a closed carbon cycle over its lifetime [1]. In terms of emissions, it has been reported that biodiesel tends to reduce unburned hydrocarbons, carbon monoxide, and particulate matter compared to its petroleum counterpart, while the NOx level is likely to increase with increasing biodiesel fraction in blended fuels [2,3]. Although it has been suggested through experimental research [2-7] that the difference of combustion between biodiesel and regular diesel can be attributed to differences in both the physical properties
and the chemical oxidation mechanisms between the two fuels, biodiesel combustion is not as well understood as the combustion of regular diesel.
While the effects of the physical and chemical properties of the fuel on combustion can be investigated experimentally, a computational study is an effective approach for investigating parametric effects of physical properties on mixture preparation, ignition and combustion, and subsequent pollutant formation. In recent evolution of computational methods of diesel engine operation, more effort has been made in modeling the in-cylinder processes. As spray injection, which is a critical physical process in mixture preparation, affects the subsequent combustion process, the accuracy of physical models is of significant importance. The performance of physical models also strongly depends on the accurate estimation of physical and chemical properties of the fuel.
Following a review of the literature concerning the physical properties of alternative fuels, Chakravarthy et al. [8] compiled and presented a complete set of bio-diesel properties required for detailed engine simulations. Based on that research, in this paper, a study of the effects of physical property differences between biodiesel and diesel fuels on CI engine operation is presented. The sensitivity of computations of engine combustion to the individual properties is also investigated. In order to decouple the effect of differences in reaction chemistry between biodiesel and diesel, the simulations were performed by replacing the physical properties of diesel with those of biodiesel, while keeping the same reaction mechanism as that used for diesel engine simulations [9].
BIODIESEL PROPERTIES
The physical properties of mixtures of hydrocarbons and biodiesel can be determined by calculating the physical properties of each individual component, and then imposing mixing rules to derive the properties of the mixtures. This method is feasible for biodiesel, which consists of a relatively simple formulation of fatty acid

esters. Properties of biodiesel and their methods of estimation have been described by Chakravarthy et al. [8]. Table 1 lists various physical properties that are required for spray and combustion simulations and how these are commonly derived. In the present study, the same strategy as that used by Chakravarthy et al. was employed to obtain the necessary properties of biodiesel surrogate fuel. 11 physical properties (p1 to p11) were considered in the study of biodiesel engine operation and its sensitivity to physical properties.
The assumed composition of biodiesel for the calculation of physical properties, which is based on Gas-Chromatography analysis of Soy-biodiesel, is listed in Table 2.
Table 1. Methods of estimation of physical properties.
No. Physical property
Method of analysis/references
p1 Liquid density Orrick & Ebar Group contribution [10], Rackett equation [11], Araújo and Meireles [40]
p2 Vapor pressure
Pitzer method[10,11], Araújo and Meireles [40]
p3 Surface tension
Weighted average of individual surface tensions [10]
p4 Liquid viscosity
Group contribution method [10], empirical correlations [12], Logarithmic equation [13], weighted average of individual components [14]
p5 Liquid thermal conductivity
GC TCD experimental analysis [15], numerical analysis [16], empirical correlations [17]
p6 Heat of vaporization
Pitzer method[10,11], Araújo and Meireles [40]
p7 Vapor heat capacity
GC TCD experimental analysis [15], numerical analysis [16], empirical correlations [17]
p8 Vapor diffusivity
Chapman-Enskog kinetic theory (Skelland [18])
p9 Vapor viscosity
Correlation from Chung and coworkers [19,20]
p10 Vapor thermal conductivity
Correlation from Chung and coworkers [19,20]
p11 Liquid Heat capacity
Interpolation of Lagrange polynomials [21], group contribution [22]
p12 Critical properties
Group contribution [10], correlation based on 400 fuels [11]
p13 Mixing rules for critical properties of mixtures
Lee-Kesler equation [10], Lumped parameter continuous thermodynamics [23]
Table 2. Assumed composition of biodiesel.
component amount [mol %] Hexadecanoic acid, methyl ester 17.0 Octadecanoic acid, methyl ester 9.0 9-Octadecenoic acid, methyl ester 30.0 9,12-Octadecadienoic acid, methyl ester 44.0
THERMODYNAMIC PROPERTIES
The critical properties of biodiesel are needed for thermodynamic calculations. Although it is difficult to obtain critical properties of prototypical biodiesel experimentally because the compounds decompose at temperatures below the critical point, they were estimated using group additivity and empirical formulations taken from Yuan et al. [10] following Reid et al. [11]. Mixture properties were determined using Lee-Kesler mixing rules. An equation of state model was used as suggested by Araújo and Meireles [40]. In the present study, the molecular weight and critical temperature of the considered biodiesel-surrogate were set to 292 g/mole and 775 K, respectively.
The density of the biodiesel-surrogate was obtained from data predicted by the Rackett equation [11], which matches the available experimental value, ρref = 0.8976 g/cm3, at Tref of 273.15K [24]. The densities are plotted in Fig. 1. Liquid density variation is considered in the present spray models, as well as in the mass and momentum balance equations in the gas and liquid phase interactions. Note that, the density of the diesel-surrogate is somewhat underestimated since diesel is represented by C14H30 in this study.
The vapor pressure of the biodiesel-surrogate was computed using a Peng-Robinson equation of state (PR-EOS) based on lumped parameter critical properties, which closely matches the literature formulation [25]. Figure 2 shows the vapor pressure variation of the two fuels as a function of liquid temperature. Compared to that of the diesel-surrogate, the vapor pressure of the biodiesel-surrogate is much lower, which is expected to influence the spray evaporation process significantly.
The heat of vaporization of the biodiesel-surrogate was also calculated up to the critical point, and is plotted along with that of the diesel-surrogate in Fig. 3. Compared to the diesel-surrogate, the heat of vaporization of the biodiesel-surrogate is lower at low temperatures, while it becomes higher at high temperatures. Since spray droplets are heated up quickly during the vaporization process in the combustion chamber, it is expected that the evaporation of the biodiesel-surrogate will be more affected by the high temperature characteristics of the heat of vaporization.

0.0
0.2
0.4
0.6
0.8
1.0
200 300 400 500 600 700 800
temperature [K]
dens
ity [k
g/L]
BiodieselDiesel
Figure 2. Liquid density profiles for biodiesel and diesel surrogate fuels. The density of biodiesel-surrogate was calculated as in Ref. [8].
1.E-03
1.E-01
1.E+01
1.E+03
1.E+05
1.E+07
300 400 500 600 700temperature [K]
vapo
r pre
ssur
e [P
a]
BiodieselC14H30
Figure 2. Vapor pressure profiles for biodiesel and diesel surrogate fuels.
0
100
200
300
400
500
200 300 400 500 600 700 800
temperature [K]
heat
of v
apor
izat
ion
[kJ/
kg]
BiodieselDiesel
Figure 3. Profiles of heat of vaporization for biodiesel and diesel surrogate fuels.
0
0.005
0.01
0.015
0.02
0.025
0.03
300 400 500 600 700
temperature [K]
surf
ace
tens
ion
[N/m
]
BiodieselDiesel
Figure 4. Surface tension profiles of biodiesel and diesel surrogate fuels.
1.0
1.5
2.0
2.5
3.0
3.5
4.0
4.5
200 300 400 500 600 700
temperature [K]
liqui
d he
at c
apac
ity [J
/kg-
K]
BiodieselDiesel
Figure 5. Profiles of liquid heat capacity for biodiesel and diesel surrogate fuels.
0
0.002
0.004
0.006
0.008
0.01
300 400 500 600 700
temperature [K]
liqui
d vi
scos
ity [N
-s/m
^2]
BiodieselDiesel
Figure 6. Profiles of liquid viscosity for biodiesel and diesel surrogate fuels.

0.00
0.02
0.04
0.06
0.08
0.10
0.12
0.14
0.16
300 400 500 600 700
temperature [K]
liqui
d th
erm
al c
ondu
ctiv
ity
[J/m
-s-K
]BiodieselDiesel
Figure 7. Profiles of liquid thermal conductivity for biodiesel and diesel surrogate fuels.
0
0.001
0.002
0.003
0.004
0.005
0 500 1000 1500 2000 2500 3000
temperature [K]
vapo
r hea
t cap
acity
[J/k
g-K
]
BiodieselDiesel
Figure 8. Profiles of vapor heat capacity for biodiesel and diesel surrogate fuels.
0
0.02
0.04
0.06
0.08
0.1
300 400 500 600 700 800 900 1000
temperature [K]
diffu
sivi
ty [c
m^2
/s]
BiodieselDiesel
Figure 9. Profiles of diffusivity in air for biodiesel and diesel surrogate fuels at ambient pressure.
0.0E+002.0E-054.0E-056.0E-058.0E-051.0E-041.2E-041.4E-041.6E-041.8E-04
300 500 700 900 1100
temperature [K]
vapo
r vis
cosi
ty [P
a-s]
BiodieselDiesel
Figure 10. Profiles of vapor viscosity for biodiesel and diesel surrogate fuels.
0
0.02
0.04
0.06
0.08
0.1
300 400 500 600 700 800 900 1000
temperature [K]
vapo
r the
rmal
con
duct
ivity
[W
/m-K
]
BiodieselDiesel
Figure 11. Profiles of vapor thermal conductivity for biodiesel and diesel surrogate fuels.
Surface tension is one of the key properties considered in spray breakup and collision/coalescence models. Empirical correlations were used to obtain surface tension of the biodiesel-surrogate. The surface tension is a linear function of temperature, with little change with the weighting factors of the different methyl esters. The surface tension of the biodiesel-surrogate is about the same as that for the diesel-surrogate at room temperature, but it decreases slower with temperature. In Fig. 4, the biodiesel-surrogate surface tension is compared with that of the diesel-surrogate as a function of temperature.
The heat capacity for methyl esters can be correlated as a function of the number of carbon atoms in the parent carboxylic acid moiety [26]. Compared to diesel, biodiesel’s heat capacity per unit mole is nearly 50% higher at temperatures near boiling point. However, when it is compared per unit mass, as used in the energy equation, the heat capacity of the biodiesel-surrogate is lower than that of the diesel surrogate. This

implies that the biodiesel-surrogate droplets may be heated faster than the diesel-surrogate droplets. The liquid heat capacities of the two fuels are compared in Fig. 5.
Liquid viscosity is considered in modeling drop internal flow, drop breakup and wall film motion. The liquid viscosity of the biodiesel-surrogate is higher than that of the diesel-surrogate, especially at low temperatures where most of the breakup processes take place in the cylinder. Therefore, it is expected that the breakup process is most affected by the viscosity difference. Comparison of the viscosities of the two fuels is shown in Fig. 6.
Liquid thermal conductivity is used in the present drop interior model to calculate the heat transfer between the drop interior and the surface where a transient temperature distribution is assumed. The thermal conductivity of the biodiesel-surrogate is slightly lower than that of the diesel-surrogate, as shown in Fig. 7.
The vapor heat capacity of the fuel is important in calculating the internal energy and temperature distribution of gas mixtures surrounding the spray drops, which substantially affects the transient heat transfer from the surrounding gas mixture to the drop surface. This is especially true where the fuel drops vaporize rapidly so that the fuel/air mixtures become rich. The vapor heat capacity of biodiesel was surrogated with that for Methyl Oleate, which is available in the literature [27]. Its vapor heat capacity is slightly lower than that of the diesel-surrogate over the temperature range of interest, as shown in Fig. 8.
TRANSPORT PROPERTIES
The transport properties of the vapor phase, i.e., diffusivity, viscosity, and thermal conductivity, were estimated for the soy biodiesel mixture at a number of elevated temperatures and pressures, including above the critical point [8].
The diffusivity for biodiesel vapor is much lower than that for diesel. Note that, in the present study, the pressure dependency of vapor diffusivity is taken into account through the density variation in the mass diffusivity. The viscosity of biodiesel vapor is slightly higher than that of diesel while its thermal conductivity is lower than that of diesel. Viscosity and thermal conductivity show little dependency on pressure, thus only the temperature dependency was considered in the present study. Figures 9 to 11 show comparisons of the diffusivity, viscosity and thermal conductivity of the two surrogate fuels, respectively.
SENSITIVITY TO PHYSICAL PROPERTIES
As mentioned above, 11 physical properties were considered to study the sensitivity of numerical simulations of engine operation to the individual physical properties of the biodiesel-surrogate. In order to
estimate the sensitivity to each property, only one property was varied from the value of the base fuel to that of the other fuel while all other properties were fixed at those of the base fuel. Two ways of sensitivity checking were considered; one considered the diesel-surrogate as the reference and the properties were changed individually from the diesel-surrogate (base) to the biodiesel-surrogate and the other is from the biodiesel-surrogate (base fuel) to the diesel-surrogate.
The energy conservation equation between the liquid and vapor phases in the evaporation process is given as
vaplvvapliq hPWRTee −−+= ρ//
where eliq is the liquid internal energy, evap is the vapor internal energy, R is the gas constant, T is the temperature, W is the molecular weight, Pv is the vapor pressure at temperature T, ρl is the liquid density, and hvap is the heat of vaporization.
However, it should be noted that the vapor heat capacity (involved through the vapor internal energy), heat of vaporization, vapor pressure and liquid heat capacity (involved through the liquid internal energy) are also coupled through the Clausius-Clapeyron equation, i.e.,
)/1/1( lg
vap
sat
vap
Th
dTdP
ρρ −=⎟⎟
⎠
⎞⎜⎜⎝
⎛
When any one of the properties considered in the Clausius-Clapeyron equation is changed, the equality of the energy equation is inevitably violated. Therefore, adjustment must be made to one of the other properties to maintain equality of the equation, as listed in Table 3.
Table 3. Properties adjusted with sensitivity variable.
Sensitivity property Adjusted property Liquid heat capacity Heat of vaporization Vapor heat capacity Heat of vaporization Heat of vaporization Liquid heat capacity Vapor pressure Liquid heat capacity
PHYSICAL SUB-MODELS
For simulating the spray processes and the mixing and combustion of fuel/air mixtures in the cylinder, various physical sub-models were employed in the KIVA-ERC-CHEMKIN code which is based on KIVA3V Release 2 [28] coupled with the CHEMKIN II library [29]. The sub models include ones related drop breakup, collision and coalescence, drop deformation, drop evaporation, wall impingement and vaporization, etc.
A hybrid primary break-up model [30] that is computationally effective as well as comprehensive enough to account for the effects of aerodynamics, liquid properties and nozzle flows was employed. In this

model, the injected fuel “blobs” are tracked by a Lagrangian method while the break-up of each blob is calculated from considerations of jet stability from Kelvin-Helmholtz (KH) instability theory. For the secondary and further break-up processes, a Kelvin Helmholtz (KH) – Rayleigh Taylor (RT) hybrid model [30] was used.
A droplet collision model based on the stochastic particle method [28] was used, in which the collision frequency is used to calculate the probability that a drop in one parcel will undergo a collision with a drop in another parcel, assuming all drops in each parcel behave in the same manner. The probability of coalescence is determined considering the Weber number that includes the effects of density and surface tension of liquid droplets.
Droplet deformation in terms of its distortion from sphericity is modeled using a forced, damped harmonic oscillator model, where the surface tension and viscosity of the droplet are the major properties used in the restoring force and damping terms, respectively [31]. Distortion of droplets affects the momentum change between droplets and the ambient gas, and subsequently drop velocities (or relative velocity between the drop and the gas) that are the governing parameters in the breakup and evaporation processes.
The droplet vaporization model [32, 33] considers the droplet temperature range from flash-boiling conditions to normal evaporation. The improved model accounts for variable internal droplet temperatures, and considers an unsteady internal heat flux with internal circulation, and a new model for the determination of the droplet surface temperature. The model uses an effective heat transfer coefficient model for the heat flux from the surrounding gas to the droplet surface. Also, the variable density of the diesel-surrogate fuel as a function of temperature is considered in the governing equations and the relevant sub-models. The effective heat transfer coefficient calculated in the model is also used to determine the amount of fuel to be treated as vapor when the drop surface temperature reaches the critical temperature while the drop interior is still in sub-critical condition. The detailed formulation is shown in Appendix A.
Effects associated with spray/wall interactions, including droplet splash, film spreading due to impingement forces, and motion due to film inertia were considered in a wall film submodel [34], in addition to calculations of film transport on complex surfaces with heating and vaporization of the film, and separation and re-entrainment of films at sharp corners.
In the 2-phase transport equations, droplets are treated as point sources and the wall film fuel flow is not resolved on the computational grid. Therefore, it is assumed that the vaporized fuel in a computational cell where droplets or wall film parcels exist mixes completely with the gaseous mixture within the cell. Thus, stratification of gaseous species within a single cell is not resolved.
COMBUSTION MODELING
Detailed chemistry was employed by coupling the KIVA3V (Release 2) with the Chemkin II library [29]. A skeletal reaction mechanism for n-heptane fuel with 34 species and 77 reactions [35], which was modified for hydrogen oxidation reactions and some key reactions of the low temperature path of n-heptane to intermediate hydrocarbon species from the mechanism of Patel et al. [36], was used to calculate the detailed chemical kinetics of combustion. Various n-heptane mechanisms have been widely employed for diesel combustion calculations by many researchers because of its similar ignition characteristics to those of diesel fuel. In the present study, the n-heptane mechanism was also used for reaction calculations in each cell, but the physical properties of the fuel were represented with those of the surrogate fuels in the calculations of spray processes, and in gaseous species mixing. For the calculation of NOx formation, a 4 species (N, NO, N2O and NO2) and 9 reaction NOx mechanism was used that has been reduced from the GRI NOx mechanism [37] and added to the n-heptane reaction mechanism.
The same reaction chemistry mechanism was used for the combustion calculations of both biodiesel and diesel surrogate fuels. Therefore, the present work only addresses differences in combustion that result from differences in the fuel physical properties. Inclusion of the effect of chemistry has been considered by Brakora et al. [9].
A phenomenological soot model [38] modified from the Hiroyasu soot model [39] was employed to predict soot emissions. In the modified model, acetylene (C2H2) is used as an inception species for soot formation, which not only enables the soot model to be coupled with the detailed chemistry calculation, but also improves the soot emission predictions.
COMPUTATIONAL CONDITIONS
Simulations of combustion in heavy and light-duty diesel engines with various injection timings were performed for biodiesel and diesel surrogate fuels to study the effects of differences of physical properties on combustion. The physical properties of the biodiesel-surrogate mentioned in the previous section were used as the fuel properties in the simulations. The properties of diesel surrogate fuel were represented by those of tetra-decane (C14H30).
In order to study the sensitivity of mixture preparation and combustion to the individual physical properties of the fuel, 11 physical properties (refer to the previous section) were varied between those of the biodiesel and diesel surrogate fuels. In addition, simulations of evaporation of single drops were performed under two non-reacting flow conditions; stagnant and convective flow. Assuming constant ambient conditions, the effects of the transport properties of the fuel vapor were not considered in the single drop cases. Spray

Table 4. Computational conditions.
Engine: 1.9 L light-duty engine Bore x Stroke [mm] 82 x 90.4 Compression ratio 16.5
Engine speed [rev/min] 2000
injector 7-hole, included angle=155 deg
Nozzle hole diameter [µm] 141 Injection timings [deg atdc] -20.0 ~ -6 Injection duration [degCA] 8.62
Injection amount [mg] 14.6 IVC temperature [K] 357, 373 IVC pressure [bar] 1.93, 2.93
Oxygen fraction @ IVC [%] 21, 15 Computation crank angle
[deg atdc] -132 ~ 112
Engine: 2.4 L heavy-duty engine Bore x Stroke [mm] 137.16 x 165.1 Compression ratio 16.2
Engine speed [rev/min] 1737
injector 6-hole, included angle=130 deg
Nozzle hole diameter [µm] 192 Injection timings [deg atdc] -20.0 ~ -6 Injection duration [degCA] 16.5
Injection amount [mg] 109 IVC temperature [K] 367 IVC pressure [bar] 2.21
Oxygen fraction @ IVC [%] 21 Computation crank angle
[deg atdc] -143 ~ 110
Figure 12. Vertical cross-section view of the computational grid for the small bore light-duty engine.
combustion was also simulated in the sensitivity study with all of the 11 physical species considered.
A small bore light-duty (1.9L) diesel engine with a compression ratio of 16.5 [35] was used for the simulations. In order to study the effects of boost pressure and engine geometry, the same engine with a boost pressure of 2.93 bar and a large bore heavy-duty engine [33] were also simulated for the two fuels.
The computational conditions are listed in Table. 4. For single drop simulations, the ambient temperature and pressure were fixed at 1000 K and 40 bar, respectively. The initial drop size was 100 µm. For the engine
0
0.2
0.4
0.6
0.8
1
1.2
0 0.2 0.4 0.6 0.8 1
normalized time
norm
aliz
ed in
ject
ion
rate
Figure 13. Injection rate shape used for the small bore light-duty engine simulations. Injection duration was 8.62 degCA for an engine speed of 2000 rev/min. Rates are normalized by the maximum value during the injection.
simulations, injection timings were varied from -20 ~ -6 deg atdc that ranges from PCCI to conventional DI modes. In the injection sweep, the same initial conditions were used for all simulations. The sensitivity study was performed for the case with injection timing of -6 deg atdc.
A representative computational grid for the small bore light-duty engine is shown in Fig. 12. Sector grids (1/7th and1/6th sectors for the small and large bore engines, respectively) were employed to save computation time. A total of 32656 cells at BTDC were considered. 20 cells were used for the 360/7 degree sector in the azimuthal direction and 1.078 x 0.87 mm resolution was used for the cells in the bowl region in radial and vertical directions, respectively. At the time of injection, the squish region has a resolution of 1.078 x 1.216 mm in radial and vertical directions, respectively. The resolution of the grid turned out to be within the grid-independence range from extensive grid-resolution dependence investigation.
It was concluded that a mesh resolution of ~ 1mm is satisfactory. A total of 32656 cells at BTDC were considered in the mesh shown in Fig. 12. 20 cells were used for the 360/7 degree sector in the azimuthal direction and 1.078 x 0.87 mm resolution was used for the cells in the bowl region in the radial and vertical directions, respectively. At the time of injection, the squish region has a resolution of 1.078 x 1.216 mm in the radial and vertical directions, respectively.
The fuel injection profiles were based on measurements of diesel spray injections [35], as shown in Fig. 13, and the same profile was used for the different injection timings and different fuels.
Due to the difference of physical properties (especially, density, vapor pressure and bulk modulus) of biodiesel from those of diesel, the biodiesel flow upstream of nozzle exit may differ from that of diesel, and subsequently, the injection rates of biodiesel sprays may
be altered. In the present study, however, the same injection rate shape was used for the simulation of the biodiesel-surrogate spray injections in order to facilitate the analysis of spray behavior differences between biodiesel and diesel surrogate fuels. The effects of biodiesel physical properties on spray injection are left for further investigation.
RESULTS AND DISCUSSION
SINGLE DROP SIMULATION
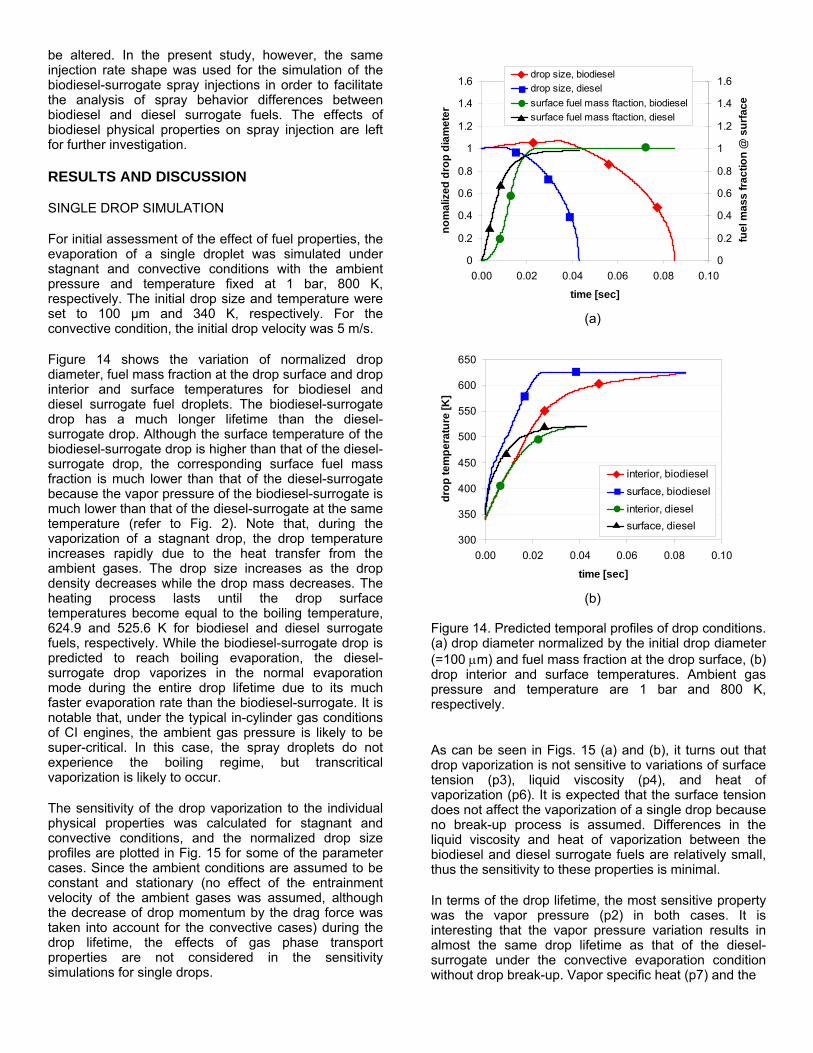
For initial assessment of the effect of fuel properties, the evaporation of a single droplet was simulated under stagnant and convective conditions with the ambient pressure and temperature fixed at 1 bar, 800 K, respectively. The initial drop size and temperature were set to 100 µm and 340 K, respectively. For the convective condition, the initial drop velocity was 5 m/s.
Figure 14 shows the variation of normalized drop diameter, fuel mass fraction at the drop surface and drop interior and surface temperatures for biodiesel and diesel surrogate fuel droplets. The biodiesel-surrogate drop has a much longer lifetime than the diesel-surrogate drop. Although the surface temperature of the biodiesel-surrogate drop is higher than that of the diesel-surrogate drop, the corresponding surface fuel mass fraction is much lower than that of the diesel-surrogate because the vapor pressure of the biodiesel-surrogate is much lower than that of the diesel-surrogate at the same temperature (refer to Fig. 2). Note that, during the vaporization of a stagnant drop, the drop temperature increases rapidly due to the heat transfer from the ambient gases. The drop size increases as the drop density decreases while the drop mass decreases. The heating process lasts until the drop surface temperatures become equal to the boiling temperature, 624.9 and 525.6 K for biodiesel and diesel surrogate fuels, respectively. While the biodiesel-surrogate drop is predicted to reach boiling evaporation, the diesel-surrogate drop vaporizes in the normal evaporation mode during the entire drop lifetime due to its much faster evaporation rate than the biodiesel-surrogate. It is notable that, under the typical in-cylinder gas conditions of CI engines, the ambient gas pressure is likely to be super-critical. In this case, the spray droplets do not experience the boiling regime, but transcritical vaporization is likely to occur.
The sensitivity of the drop vaporization to the individual physical properties was calculated for stagnant and convective conditions, and the normalized drop size profiles are plotted in Fig. 15 for some of the parameter cases. Since the ambient conditions are assumed to be constant and stationary (no effect of the entrainment velocity of the ambient gases was assumed, although the decrease of drop momentum by the drag force was taken into account for the convective cases) during the drop lifetime, the effects of gas phase transport properties are not considered in the sensitivity simulations for single drops.
0
0.2
0.4
0.6
0.8
1
1.2
1.4
1.6
0.00 0.02 0.04 0.06 0.08 0.10
time [sec]
nom
aliz
ed d
rop
diam
eter
0
0.2
0.4
0.6
0.8
1
1.2
1.4
1.6
fuel
mas
s fra
ctio
n @
sur
face
drop size, biodieseldrop size, dieselsurface fuel mass ftaction, biodieselsurface fuel mass ftaction, diesel
0
0.2
0.4
0.6
0.8
1
1.2
1.4
1.6
0.00 0.02 0.04 0.06 0.08 0.10
time [sec]
nom
aliz
ed d
rop
diam
eter
0
0.2
0.4
0.6
0.8
1
1.2
1.4
1.6
fuel
mas
s fra
ctio
n @
sur
face
drop size, biodieseldrop size, dieselsurface fuel mass ftaction, biodieselsurface fuel mass ftaction, diesel
(a)
300
350
400
450
500
550
600
650
0.00 0.02 0.04 0.06 0.08 0.10
time [sec]
drop
tem
pera
ture
[K]
interior, biodieselsurface, biodieselinterior, dieselsurface, diesel
300
350
400
450
500
550
600
650
0.00 0.02 0.04 0.06 0.08 0.10
time [sec]
drop
tem
pera
ture
[K]
interior, biodieselsurface, biodieselinterior, dieselsurface, diesel
(b) Figure 14. Predicted temporal profiles of drop conditions. (a) drop diameter normalized by the initial drop diameter (=100 µm) and fuel mass fraction at the drop surface, (b) drop interior and surface temperatures. Ambient gas pressure and temperature are 1 bar and 800 K, respectively.
As can be seen in Figs. 15 (a) and (b), it turns out that drop vaporization is not sensitive to variations of surface tension (p3), liquid viscosity (p4), and heat of vaporization (p6). It is expected that the surface tension does not affect the vaporization of a single drop because no break-up process is assumed. Differences in the liquid viscosity and heat of vaporization between the biodiesel and diesel surrogate fuels are relatively small, thus the sensitivity to these properties is minimal.
In terms of the drop lifetime, the most sensitive property was the vapor pressure (p2) in both cases. It is interesting that the vapor pressure variation results in almost the same drop lifetime as that of the diesel-surrogate under the convective evaporation condition without drop break-up. Vapor specific heat (p7) and the

0
0.2
0.4
0.6
0.8
1
1.2
0.00 0.02 0.04 0.06 0.08 0.10
time [sec]
nom
aliz
ed d
rop
diam
eter
biodiesel
diesel
p1 p6
p7
p2
p11
p5
p3, p40
0.2
0.4
0.6
0.8
1
1.2
0.00 0.02 0.04 0.06 0.08 0.10
time [sec]
nom
aliz
ed d
rop
diam
eter
biodiesel
diesel
p1 p6
p7
p2
p11
p5
p3, p4
(a)
0
0.2
0.4
0.6
0.8
1
1.2
0.00 0.01 0.02 0.03 0.04 0.05 0.06
time [sec]
nom
aliz
ed d
rop
diam
eter biodiesel
diesel
p1p6
p7
p2 p11
p5
p3, p4
0
0.2
0.4
0.6
0.8
1
1.2
0.00 0.01 0.02 0.03 0.04 0.05 0.06
time [sec]
nom
aliz
ed d
rop
diam
eter biodiesel
diesel
p1p6
p7
p2 p11
p5
p3, p4
(b) Figure 15. Sensitivity of single drop vaporization to individual physical properties listed in Table 1. (a) stagnant drop vaporization, (b) convective drop vaporization with initial drop velocity of 5 m/s. Baseline properties were set to those of the biodiesel-surrogate and changed individually to the corresponding the diesel-surrogate property.
liquid density (p1) were predicted to be the second most sensitive properties.
It is notable that use of the liquid specific heat of the diesel-surrogate for that of the biodiesel-surrogate (see Fig. 5) slows down evaporation such that the drop life time becomes longer than that for the biodiesel-surrogate case. Vapor pressure, which is the most different property between the biodiesel and diesel surrogate fuels (refer to Fig. 2), governs the fuel mass fraction at the drop surface, and thus the evaporation until the boiling temperature (or critical temperature under supercritical ambient pressure conditions) is reached. The fuel vapor specific heat (p7) becomes an important factor when the fuel drop vaporizes rapidly near the boiling regime because the temperature distribution near the drop surface is significantly affected by the specific heat of the gas mixture that includes a large fraction of fuel vapor supplied from the drop
4
6
8
10
12
14
16
-20 -10 0 10 20 30
crank angle [deg atdc]
pres
sure
[MP
a]
biodiesel, cainj= -20biodiesel, cainj= -15biodiesel, cainj= -10biodiesel, cainj= -6diesel, cainj= -20diesel, cainj= -15diesel, cainj= -10diesel, cainj= -6
-20
-6
4
6
8
10
12
14
16
-20 -10 0 10 20 30
crank angle [deg atdc]
pres
sure
[MP
a]
biodiesel, cainj= -20biodiesel, cainj= -15biodiesel, cainj= -10biodiesel, cainj= -6diesel, cainj= -20diesel, cainj= -15diesel, cainj= -10diesel, cainj= -6
-20
-6
Figure 16. Effects of physical property differences on combustion in a large bore heavy-duty engine. Injection timings were varied from -20 to -6 deg atdc. Solid lines are for the biodiesel-surrogate and dotted lines are for the diesel-surrogate.
surface. Therefore, variation of vapor specific heat alters the heat transfer from the surrounding gas mixtures. Liquid density (p1) change mostly affects the swelling of the drop, which implies that the sensitivity to this property may be significantly coupled to the breakup, collision/coalescence, and drop deformation processes in spray injection cases.
SPRAY SIMULATIONS
Simulations of biodiesel and diesel surrogate sprays injected into an engine cylinder were performed for three different operating conditions. Two different piston bowl geometries and two boost pressures were considered so as to compare the effects of spray impingement and ambient pressures. Due to the sufficiently large bore of the heavy-duty engine, spray impingement on the cylinder walls is minimized. By comparing the two cases with different boost pressures for the same bowl geometry of the 1.9 L light-duty engine, the effects of physical property differences due to boost pressure differences can be examined.
In Fig. 16, pressure profiles of combustion of biodiesel and diesel surrogate fuels in the large bore engine are compared for four different injection timings. Earlier injection timing allows more time for vaporization and mixing before ignition. This results in smaller differences of ignition timing than for cases with later injection timings. Note that, since the same combustion model was used for both fuels, the differences of ignition timings are only due to the effects of the physical property differences of the fuels on the mixture preparation process. Fuel sprays that are injected into an already ignited gas mixture meet higher temperature gases, and thus their vaporization is further enhanced. Therefore, it is expected that the effects of the physical property differences become less important in terms of their effect on the peak cylinder gas pressure as injection timings are advanced.
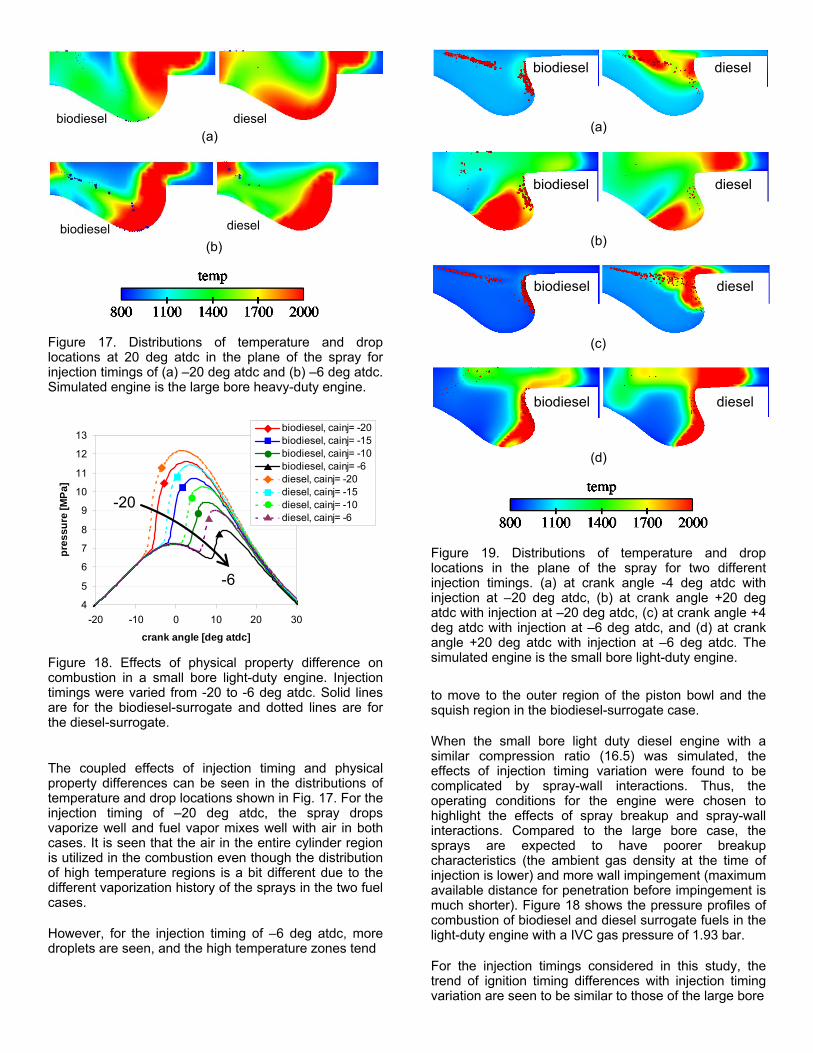
dieselbiodiesel dieselbiodiesel (a)
dieselbiodiesel dieselbiodiesel (b)
Figure 17. Distributions of temperature and drop locations at 20 deg atdc in the plane of the spray for injection timings of (a) –20 deg atdc and (b) –6 deg atdc. Simulated engine is the large bore heavy-duty engine.
4
5
6
7
8
9
10
11
12
13
-20 -10 0 10 20 30
crank angle [deg atdc]
pres
sure
[MPa
]
biodiesel, cainj= -20biodiesel, cainj= -15biodiesel, cainj= -10biodiesel, cainj= -6diesel, cainj= -20diesel, cainj= -15diesel, cainj= -10diesel, cainj= -6
-20
-64
5
6
7
8
9
10
11
12
13
-20 -10 0 10 20 30
crank angle [deg atdc]
pres
sure
[MPa
]
biodiesel, cainj= -20biodiesel, cainj= -15biodiesel, cainj= -10biodiesel, cainj= -6diesel, cainj= -20diesel, cainj= -15diesel, cainj= -10diesel, cainj= -6
-20
-6
Figure 18. Effects of physical property difference on combustion in a small bore light-duty engine. Injection timings were varied from -20 to -6 deg atdc. Solid lines are for the biodiesel-surrogate and dotted lines are for the diesel-surrogate.
The coupled effects of injection timing and physical property differences can be seen in the distributions of temperature and drop locations shown in Fig. 17. For the injection timing of –20 deg atdc, the spray drops vaporize well and fuel vapor mixes well with air in both cases. It is seen that the air in the entire cylinder region is utilized in the combustion even though the distribution of high temperature regions is a bit different due to the different vaporization history of the sprays in the two fuel cases.
However, for the injection timing of –6 deg atdc, more droplets are seen, and the high temperature zones tend
dieselbiodiesel dieselbiodiesel
(a)
dieselbiodiesel dieselbiodiesel
(b)
dieselbiodiesel dieselbiodiesel
(c)
dieselbiodiesel dieselbiodiesel
(d)
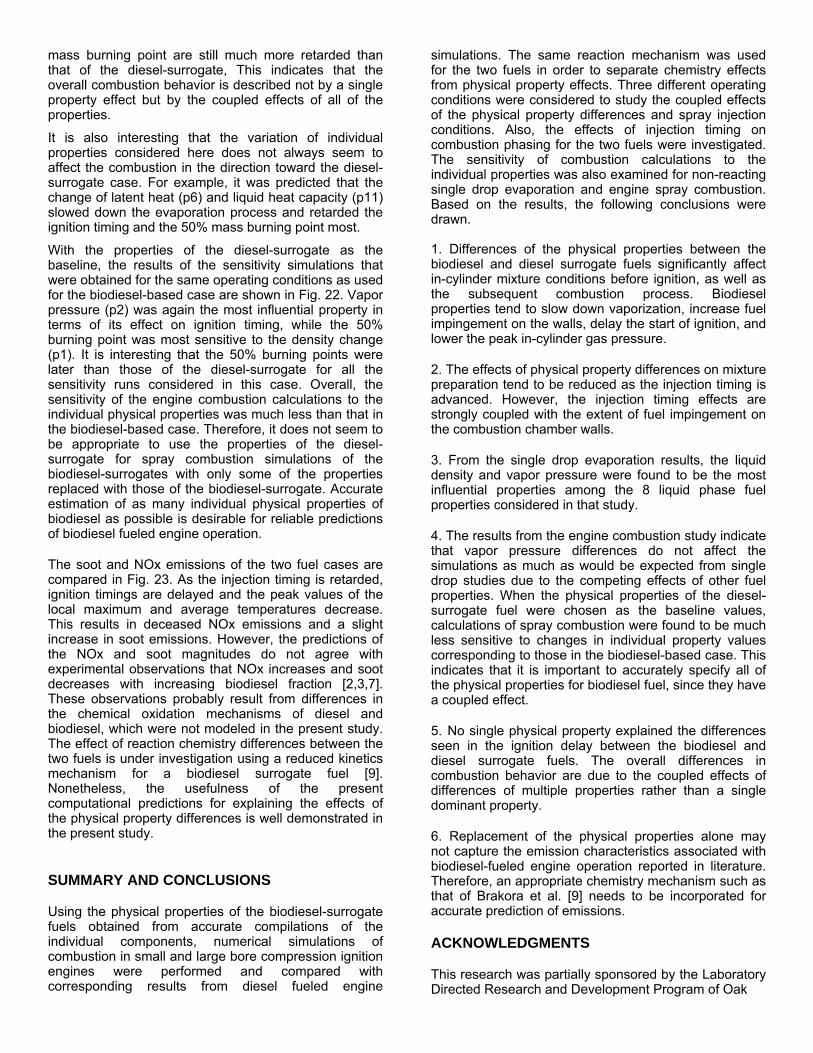
Figure 19. Distributions of temperature and drop locations in the plane of the spray for two different injection timings. (a) at crank angle -4 deg atdc with injection at –20 deg atdc, (b) at crank angle +20 deg atdc with injection at –20 deg atdc, (c) at crank angle +4 deg atdc with injection at –6 deg atdc, and (d) at crank angle +20 deg atdc with injection at –6 deg atdc. The simulated engine is the small bore light-duty engine.
to move to the outer region of the piston bowl and the squish region in the biodiesel-surrogate case.
When the small bore light duty diesel engine with a similar compression ratio (16.5) was simulated, the effects of injection timing variation were found to be complicated by spray-wall interactions. Thus, the operating conditions for the engine were chosen to highlight the effects of spray breakup and spray-wall interactions. Compared to the large bore case, the sprays are expected to have poorer breakup characteristics (the ambient gas density at the time of injection is lower) and more wall impingement (maximum available distance for penetration before impingement is much shorter). Figure 18 shows the pressure profiles of combustion of biodiesel and diesel surrogate fuels in the light-duty engine with a IVC gas pressure of 1.93 bar.
For the injection timings considered in this study, the trend of ignition timing differences with injection timing variation are seen to be similar to those of the large bore

4
6
8
10
12
14
16
18
-20 -10 0 10 20 30
crank angle [deg atdc]
pres
sure
[MPa
]
biodiesel, cainj= -20biodiesel, cainj= -15biodiesel, cainj= -10biodiesel, cainj= -6diesel, cainj= -20diesel, cainj= -15diesel, cainj= -10diesel, cainj= -6
-20
-6
4
6
8
10
12
14
16
18
-20 -10 0 10 20 30
crank angle [deg atdc]
pres
sure
[MPa
]
biodiesel, cainj= -20biodiesel, cainj= -15biodiesel, cainj= -10biodiesel, cainj= -6diesel, cainj= -20diesel, cainj= -15diesel, cainj= -10diesel, cainj= -6
-20
-6
Figure 20. Effects of physical property difference on combustion in a small bore light-duty engine operated under boost pressure (Pivc=2.926 bar). Injection timings were varied from -20 to -6 deg atdc. Solid lines are for the biodiesel-surrogate and dotted lines are for the diesel-surrogate.
engine, but the differences of ignition timings and peak cylinder pressures are predicted to be larger. Therefore, it can be stated that the effects of physical property differences become more significant at operating conditions where more spray impingement is expected. In order to confirm the argument, in-cylinder spray distributions for the two fuel cases are shown in Fig. 19, together with the corresponding temperature fields for two injection timings.
In the case with earlier injection timing (-20 deg atdc), it is expected that more spray droplets impinge on the walls (note that the ambient gas density at the time of injection is lower than in later injection cases, thus the liquid length is longer and the drop sizes after breakup are bigger). However, earlier injection also allows a longer time for fuel vaporization and fuel/air mixing in the high temperature environment before ignition occurs, which compensates for increased wall impingement. Investigation of cases with various vapor pressures indicated that the competition between the two effects depends on the vapor pressures of the fuel (results not shown). For the vapor pressure of the biodiesel-surrogate used in the present study, the overall spray impingement on the walls was predicted not to vary much for the injection timings considered in this study, as seen in Fig. 19..
When the ambient gas density at the time of injection is increased to promote spray breakup by elevating the boost level, it is evident from Fig. 20 that the reduced wall impingement helps form a better-mixed charge and the effects of physical property differences become less dependent on the injection timings. Figure 20 shows very similar trends to those of the large bore engine (Fig. 16) in terms of the pressure profiles for the combustion of the biodiesel and diesel surrogate fuels for the various injection timings.
6.0
6.5
7.0
7.5
8.0
8.5
9.0
9.5
0 5 10 15 20
crank angle [deg atdc]
pres
sure
[MPa
] biodiesel
dieselp1
p2
p7
p3
p11p4
p5, p8,p9,p10
p6
6.0
6.5
7.0
7.5
8.0
8.5
9.0
9.5
0 5 10 15 20
crank angle [deg atdc]
pres
sure
[MPa
] biodiesel
dieselp1
p2
p7
p3
p11p4
p5, p8,p9,p10
p6
(a)
-4
-3
-2
-1
0
1
Diesel
dens
ity
vapo
r pres
sure
surfa
ce te
nsion
liq. V
isc
liq. C
ond
laten
t hea
t
vap.
Cp
vap.
Diff
vap.
Visc
vap.
Cond
liq. C
p
Biodies
el
CA
50 d
iffer
ence
[deg
CA
]
-4
-3
-2
-1
0
1
Diesel
dens
ity
vapo
r pres
sure
surfa
ce te
nsion
liq. V
isc
liq. C
ond
laten
t hea
t
vap.
Cp
vap.
Diff
vap.
Visc
vap.
Cond
liq. C
p
Biodies
el
CA
50 d
iffer
ence
[deg
CA
]
(b)
60
70
80
90
100
Diesel
dens
ity
vapo
r pres
sure
surfa
ce te
nsion
liq. V
isc
liq. C
ond
laten
t hea
t
vap.
Cp
vap.
Diff
vap.
Visc
vap.
Cond
liq. C
p
Biodies
el
vapo
rized
fuel
@ E
OI [
%]
(c) Figure 21. Sensitivity of combustion to individual physical properties. (a) Profiles of in-cylinder gas pressure near the time of ignition, (b) crank angle of 50% heat release point compared to the baseline, and (c) vaporized mass at the time of end of injection normalized by the total injected fuel. Base fuel is the biodiesel-surrogate. Small bore light-duty engine operated at the lower boost pressure. Injection timing was –6 deg atdc.

6
6.5
7
7.5
8
8.5
9
9.5
0 5 10 15 20
crank angle [deg ATDC]
pres
sure
[MPa
]
biodiesel
diesel
p2p1
p7
p3, p4, p5, p6, p11
6
6.5
7
7.5
8
8.5
9
9.5
0 5 10 15 20
crank angle [deg ATDC]
pres
sure
[MPa
]
biodiesel
diesel
p2p1
p7
p3, p4, p5, p6, p11
(a)
0.0
0.5
1.0
1.5
2.0
2.5
3.0
3.5
4.0
Diesel
dens
ity
vapo
r pres
sure
surfa
ce te
nsion
liq. V
isc
liq. C
ond
laten
t hea
t
vap.
Cp
vap.
Diff
vap.
Visc
vap.
Cond
liq. C
p
Biodies
el
CA
50 d
iffer
ence
[dge
CA
]
0.0
0.5
1.0
1.5
2.0
2.5
3.0
3.5
4.0
Diesel
dens
ity
vapo
r pres
sure
surfa
ce te
nsion
liq. V
isc
liq. C
ond
laten
t hea
t
vap.
Cp
vap.
Diff
vap.
Visc
vap.
Cond
liq. C
p
Biodies
el
CA
50 d
iffer
ence
[dge
CA
]
(b)
60
70
80
90
100
Diesel
dens
ity
vapo
r pres
sure
surfa
ce te
nsion
liq. V
isc
liq. C
ond
laten
t hea
t
vap.
Cp
vap.
Diff
vap.
Visc
vap.
Cond
liq. C
p
Biodies
el
vapo
rized
fuel
@ E
OI [
%]
(c) Figure 22. Sensitivity of combustion to individual physical properties. (a) Profiles of in-cylinder gas pressure near the time of ignition, (b) crank angle of 50% heat release point compared the baseline, and (c) vaporized mass at the time of end of injection normalized by the total injected fuel. Base fuel is the diesel-surrogate. Small bore light-duty engine with cr=16.5. Injection timing was –6 deg atdc.
0
0.02
0.04
0.06
0.08
0.1
0.12
0.14
-25 -20 -15 -10 -5 0
start of injection command [deg atdc]
Soot
[g/k
g-f]
0
20
40
60
80
100
120
140
NO
x [g
/kg-
f]
Soot, biodieselSoot, dieselNOx, biodieselNOx, diesel
Figure 23. Predicted emissions of the biodiesel and diesel surrogates for various injection timings. The small bore light-duty engine with the lower boost pressure was simulated
The sensitivity of the engine simulations to the individual physical properties was investigated by replacing one property of the base fuel with that of the other. Two sensitivity runs with each of the two fuels set to the properties of the base fuel were performed. All of the 11 physical properties were considered in the study.
Figure 21 shows the results of the sensitivity simulations in terms of the pressure profiles near the time ignition, the crank angle of 50% mass burnt, and the vaporized fuel mass at the end of injection. In this case, the base fuel was the biodiesel-surrogate. The small bore light-duty engine operated at the lower boost pressure was simulated with injection timing of –6 deg atdc.
From the comparison of the results of the biodiesel and diesel surrogate combustion, it is seen that no single property has a dominant effect on the combustion characteristics. However, the effects of the individual properties are predicted to be significant.
As in the single drop vaporization cases (refer to Fig. 15), the liquid density (p1) and vapor heat capacity (p7) are predicted to be very influential in the engine combustion cases, as well. It is interesting that the vapor pressure does not seem to have as dominant an effect on the combustion as in the single drop cases. It is notable that the surface tension change (p3) advanced the ignition timing significantly. As can be seen from the vaporized fuel mass at the end of injection shown in Fig. 21 (c), the reduction of surface tension from that of the biodiesel-surrogate to that of the diesel-surrogate affects the breakup process, resulting in a smaller average drop size, and this substantially enhances vaporization.
Although the vaporized mass in the case of density (p1) variation is increased up to 92% of the diesel-surrogate case by the end of injection, its ignition timing and 50%
mass burning point are still much more retarded than that of the diesel-surrogate, This indicates that the overall combustion behavior is described not by a single property effect but by the coupled effects of all of the properties.
It is also interesting that the variation of individual properties considered here does not always seem to affect the combustion in the direction toward the diesel-surrogate case. For example, it was predicted that the change of latent heat (p6) and liquid heat capacity (p11) slowed down the evaporation process and retarded the ignition timing and the 50% mass burning point most.
With the properties of the diesel-surrogate as the baseline, the results of the sensitivity simulations that were obtained for the same operating conditions as used for the biodiesel-based case are shown in Fig. 22. Vapor pressure (p2) was again the most influential property in terms of its effect on ignition timing, while the 50% burning point was most sensitive to the density change (p1). It is interesting that the 50% burning points were later than those of the diesel-surrogate for all the sensitivity runs considered in this case. Overall, the sensitivity of the engine combustion calculations to the individual physical properties was much less than that in the biodiesel-based case. Therefore, it does not seem to be appropriate to use the properties of the diesel-surrogate for spray combustion simulations of the biodiesel-surrogates with only some of the properties replaced with those of the biodiesel-surrogate. Accurate estimation of as many individual physical properties of biodiesel as possible is desirable for reliable predictions of biodiesel fueled engine operation.
The soot and NOx emissions of the two fuel cases are compared in Fig. 23. As the injection timing is retarded, ignition timings are delayed and the peak values of the local maximum and average temperatures decrease. This results in deceased NOx emissions and a slight increase in soot emissions. However, the predictions of the NOx and soot magnitudes do not agree with experimental observations that NOx increases and soot decreases with increasing biodiesel fraction [2,3,7]. These observations probably result from differences in the chemical oxidation mechanisms of diesel and biodiesel, which were not modeled in the present study. The effect of reaction chemistry differences between the two fuels is under investigation using a reduced kinetics mechanism for a biodiesel surrogate fuel [9]. Nonetheless, the usefulness of the present computational predictions for explaining the effects of the physical property differences is well demonstrated in the present study.
SUMMARY AND CONCLUSIONS
Using the physical properties of the biodiesel-surrogate fuels obtained from accurate compilations of the individual components, numerical simulations of combustion in small and large bore compression ignition engines were performed and compared with corresponding results from diesel fueled engine
simulations. The same reaction mechanism was used for the two fuels in order to separate chemistry effects from physical property effects. Three different operating conditions were considered to study the coupled effects of the physical property differences and spray injection conditions. Also, the effects of injection timing on combustion phasing for the two fuels were investigated. The sensitivity of combustion calculations to the individual properties was also examined for non-reacting single drop evaporation and engine spray combustion. Based on the results, the following conclusions were drawn. 1. Differences of the physical properties between the biodiesel and diesel surrogate fuels significantly affect in-cylinder mixture conditions before ignition, as well as the subsequent combustion process. Biodiesel properties tend to slow down vaporization, increase fuel impingement on the walls, delay the start of ignition, and lower the peak in-cylinder gas pressure.
2. The effects of physical property differences on mixture preparation tend to be reduced as the injection timing is advanced. However, the injection timing effects are strongly coupled with the extent of fuel impingement on the combustion chamber walls.
3. From the single drop evaporation results, the liquid density and vapor pressure were found to be the most influential properties among the 8 liquid phase fuel properties considered in that study.
4. The results from the engine combustion study indicate that vapor pressure differences do not affect the simulations as much as would be expected from single drop studies due to the competing effects of other fuel properties. When the physical properties of the diesel-surrogate fuel were chosen as the baseline values, calculations of spray combustion were found to be much less sensitive to changes in individual property values corresponding to those in the biodiesel-based case. This indicates that it is important to accurately specify all of the physical properties for biodiesel fuel, since they have a coupled effect.
5. No single physical property explained the differences seen in the ignition delay between the biodiesel and diesel surrogate fuels. The overall differences in combustion behavior are due to the coupled effects of differences of multiple properties rather than a single dominant property.
6. Replacement of the physical properties alone may not capture the emission characteristics associated with biodiesel-fueled engine operation reported in literature. Therefore, an appropriate chemistry mechanism such as that of Brakora et al. [9] needs to be incorporated for accurate prediction of emissions.
ACKNOWLEDGMENTS
This research was partially sponsored by the Laboratory Directed Research and Development Program of Oak

Ridge National Laboratory (ORNL), managed by UT-Battelle, LLC for the U. S. Department of Energy under Contract No. DE-AC05-00OR22725. The authors thank ORNL for funding support. REFERENCES
1. Fuel Fact Sheets, National Biodiesel Board, www.biodiesel.org. 2. Akasaka, Y., Suzuki, T., and Sakurai, Y. 1997. ”Exhaust Emissions of a DI Diesel Engine Fueled with Blends of Biodiesel and Low Sulfur Diesel Fuel,” SAE 972998, 1997. 3. McCormick, R. L., Alvarez, J. R., Graboski, M. S., Tyson, K. S., and Vertin, K., ”Fuel Additive and Blending Approaches to Reducing NOx Emissions from Biodiesel,” SAE 2002-01-1658, 2002. 4. Szybist, J. P., and Boehman, A. L., “Behavior of a Diesel Injection System with Biodiesel Fuel,” SAE 2003-01-1039, 2003. 5. Tat, M. E., Van Geroen, J. H., and Wang, P. S., ”Fuel Property Effects on Injection Timing, Ignition Timing and Oxides of Nitrogen Emissions from Biodiesel-Fueled Engines,” 2004 ASAE/CSAE Annual International Meeting, Ottowa, Ontario, Canada, August 1-4, 2004. 6. Cheng, A.S., Upatnieks, A., and Mueller, C.J., “Investigation of the impact of biodiesel fuelling on NOx emissions using an optical direct injection diesel engine,” Int. J. Engine. Research, 7, 297-318, 2006. 7. Marchese, A. J., Vaughn, T. L., Hammill, M., and Harris, M., “Ignition Delay of Bio-Ester Fuel Droplets,” SAE 2006-01-3302, 2006. 8. Chakravarthy, K., McFarlane J., Daw, S.C. Ra, Y. and Reitz, R.D., “Physical Properties of Soy Bio-diesel & Implications for Use of Bio-diesel in Diesel Engines,” SAE 2007-01-4030, 2007. 9. Brakora, J.L., Ra, Y., Reitz, R.D., McFarlane J., and Daw, S.C., “Development and Validation of a Reduced Reaction Mechanism for Biodiesel-Fueled Engine Simulations,” submitted to SAE 2008 World Congress, 2007. 10. Yuan, W., Hansen, A.C., Zhang, Q., ”Predicting the physical properties of biodiesel for combustion modeling,” Transactions of the ASAE 46(6), 1487-1493, 2003. 11. Reid, R.C., Prausnitz, J.M., Sherwood, T.K., “Properties of Gases and Liquids, 4th Ed., New York, N.Y., McGraw-Hill, 1987. 12. Yamane, K., Ueta, A., Shimamoto, Y., “Influence of physical and chemical properties of biodiesel fuel on injection, combustion, and exhaust emission characteristics in a DI-CI engine,” In Proceedings of the 5th International Symposium on Diagnostics and Modeling of Combustion in Internal Combustion Engines, COMODIA 2001, July 1-4, 2001, Nagoya. 13. Allan, C.A.W., Watts, K.C., Ackman, R.G., Pegg, M.J., Fuel 78, 1319, 1999. 14. Schumacher, L., Chellappa, A., Wetherell, W., Russell, M.D., “The physical and chemical
characterization of biodiesel low sulfur diesel fuel blends,” National Biodiesel Board, U. Missouri, Dec. 20, 1995. 15. Herb, S.F., Magidman, P., Reimansc, R.W., “Observations on response factors for thermal conductivity detectors in GLC analysis of fatty acid methyl esters,” J. Am. Oil Chemists Soc. 44(1), p. 32, 1967. 16. Tseng, C.C., Viskanta, R., ”Effect of radiation absorption on fuel droplet evaporation,” Combustion Science and Technology 177(8), 1511-1542, 2005. 17. Huber, M.L., Perkins, R.A., “Thermal conductivity correlations for minor constituent fluids in natural gas: n-octane, n-nonane, and n-decane,” Fluid Phase Equilibria 227, 47-55, 2005. 18. Skelland, A.H.P., Diffusional Mass Transfer, Krieger Publishing Company, Malabar FL. 19. Chung, T.-H., Ajlan, M., Lee, L.L., Starling, K.E., ”Generalized multiparameter correlation for nonpolar and polar fluid transport properties,” Ind. Eng. Chem. Res. 27, 671-679, 1988. 20. Chung, T.H., Lee, L.L., Starling, K.E., “Applications of kinetic gas theory and multiparameter correlation for prediction of dilute gas viscosity and thermal conductivity,” Ind. Eng. Chem. Fundam. 23, 8-13, 1984. 21. Duran, A., Carmona, M., Monteagudo, J.M., “Modeling soot and SOF emissions from a diesel engine”, Chemosphere 56(3), 209-225, 2004. 22. Fisher, E.M., Pitz, W.J., Curran, H.J., Westbrook, C.K., “Detailed chemical kinetics mechanisms for the combustion of oxygenated fuels,” Proceedings of the Combustion Institute 28, 1579-1586, 2000. 23. Tamim, J., Hallett, W.L.H., ”A continuous thermodynamics model for multicomponent droplet vaporization,” Chem. Eng. Science 50, 2933-2942, 1995. 24. Tat, M.E., van Gerpen, J.H., ”The specific gravity of biodiesel and its blends with diesel fuel,” The Journal of the American Oil Chemists’ Society 77(2), 115-119, 2000. 25. Yaw, C. L., CRC Handbook of Chemicals and Physics, various editions; and Chemical Properties Handbook, McGraw-Hill Publishing Company, 1999. 26. van Bommel, M.J., Oonk, H.A.J., van Miltenberg, J.C., ”Heat capacity measurements of 13 methyl esters of n-carboxylic acids from methyl octanoate to methyl eicosanoate between 5K and 350K,” J. Chem. Eng. Data 49, 1036-1042, 2004. 27. Gallant, R.W., and Yaws, C.L., Physical Properties of Hydrocarbons, 3rd ed., Houston, Gulf Pub. Co., 1995. 28. Amsden, A.A., KIVA-3V, Release 2, Improvements to KIVA-3V, LA-UR-99-915, 1999. 29. Kee, R.J., Rupley, F.M., Miller, J.A., “CHEMKIN-II: A FORTRAN Chemical Kinetics Package for the Analysis of Gas Phase Chemical Kinetics,” Sandia Report SAND 89-8009, 1989. 30. Beale, J.C., and Reitz, R.D., “Modeling Spray Atomization with the Kelvin-Helmholtz/Rayleigh-Taylor Hybrid Model,” Atomization and Sprays, 9, 623-650, 1999.

31. Liu, A.B., Mather, D., Reitz, R.D., “Modeling the Effects of Drop Drag and Breakup on Fuel Sprays,” SAE 930072, 1993. 32. Ra, Y., and Reitz, R.D., “A Model for Droplet Vaporization for Use in Gasoline and HCCI Engine Applications,” Journal of Engineering for Gas Turbines & Power, 126(2), 422-428, 2004. 33. Ra, Y. and Reitz, R.D., “The Application of a Multi-Component Vaporization Model to Gasoline Direct Injection Engines,” Int. J. of Engine Research, 4(3), 193-218, 2003. 34. O'Rourke, P.J., and Amsden, A. A., “A spray/wall interaction submodel for the KIVA-3 wall film model,” SAE 2000-01-0271, 2000. 35. Opat, R., Ra, Y., Gonzalez, M.A., Krieger, D., R., Reitz, R.D., Foster, D. E., Durrett, R.P., and Siewert, R.M., “Investigation of Mixing and Temperature Effects on HC/CO Emissions for Highly Dilute Low Temperature
Combustion in a Light Duty Diesel Engine,” SAE 2007-01-0193, 2007. 36. Patel, A., Kong, S.C., and Reitz, R.D., “Development and Validation of a Reduced Reaction Mechanism for HCCI Engine Simulations,” SAE 2004-01-0558, 2004. 37. http://www.me.berkeley.edu/gri_mech/ 38. Kong, S.C., Sun, Y., and Reitz, R.D., “Modeling Diesel Spray Flame Lift-Off, Sooting Tendency and NOx Emissions Using Detailed Chemistry with Phenomenological Soot Model,” Journal of Gas Turbines and Power, 129, 245-251, 2007. 39. Hiroyasu, H. and Kadota, T., “Models for Combustion and Formation of Nitric Oxide and Soot in DI Diesel Engines,” SAE 760129, 1979. 40. Araújo, M.E., Meireles, M.A.A., “Improving phase equilibrium calculation with the Peng-Robinson EOS for fats and oils related compounds/supercritical CO2 systems.” Fluid Phase Equilibria 169, 49-64, 2000.
APPENDIX A. A model of transcritical droplet vaporization. During the lifetime of drop evaporation at supercritical ambient conditions, the vapor pressure of a liquid droplet at a subcritical liquid temperature cannot exceed the ambient pressure, thus it cannot be subjected to boiling evaporation. However, when droplets are heated by heat transfer from the surrounding gases at supercritical conditions, which is possible under diesel condition, the surface temperature of the droplet can reach the critical mixing temperature, while the temperature of the drop interior remains sub-critical. In this case, the phase change near the critical mixing line on a phase equilibrium plot is very complex and involved due to high pressure gas absorption and non-ideal gas behavior. In order to model the phase change of liquid fuel drops under transcritical conditions, a simple model that employs the concept of effective radius of phase change was used to estimate the amount of fuel to be treated as vaporized during a given time step during the evaporation calculation. The assumptions made in the model include; 1) the critical mixing line is independent of ambient pressure, i.e., the critical mixing temperature is equal to the critical temperature. 2) no absorption of gases into the liquid drop is assumed. 3) the droplet and the surrounding gas mixtures are bounded by a sharp phase transition boundary. 4) the density of the liquid drop interior is uniform and is evaluated at the average drop interior temperature. 5) only the temperature gradient within the drop-gas interface is considered in evaluation of heat transfer into the drop interior. 6) a quasi-steady state vaporization process is assumed. The effective radius of a droplet beyond which the liquid is regarded vaporized is calculated from the characteristic length of heat transfer at the drop surface that is at the critical temperature. From dimensional analysis, the characteristic length of heat transfer, lc, can
be determined from the thermal diffusivity, )/( vck ρα = , and a characteristic heating time, τc, i.e.,
cv
cc ckl τρ
τα =~ A-(1)
where k and ρ are the thermal conductivity and density of the liquid droplet, respectively, evaluated at the interior drop temperature. The characteristic heating time can be obtained from the elapsed time to heat up the entire drop mass from the initial temperature to final temperature assuming no critical phase change from the drop surface and given the heat flux from the drop surface to the drop interior. The energy balance equation for this heating process is given as
)(~)(
,,
dsefffc
dfdv TTAh
TTVc −
−
τρ
or
)()(
3~
,
,
dsefff
dfddvc TTh
TTrc
−
−ρτ A-(2)
where V is the volume of the drop, cv is the specific heat of the liquid drop, Td,f is the final drop temperature after heating, Td is the initial drop temperature, A is the drop surface area, hf,eff is the effective heat transfer coefficient that takes the effects of internal circulation of the liquid drop into account, rd is the drop radius, and Ts is the drop surface temperature, which is equal to the critical temperature. Therefore, the effective radius of phase change is determined using a model constant, χ, as

)()(
3~
,
,
dsefff
dfddv
vcc TTh
TTrc
ckl
−
−= ρ
ρχτα
)(3)(
,
,
dsefff
dfdd
TThTTkr−
−= χ A-(3)
A constant value of χ=0.05 was used, in the present study. The transcritical vaporization model was combined with the evaporation model reported in Ref. [32].