Feeding fossil fuels to the soil
19
Resources, Conservation and Recycling 46 (2006) 75–93 Feeding fossil fuels to the soil An analysis of energy embedded and technological learning in the fertilizer industry C.A. Ram´ ırez a,∗ , E. Worrell b a Department of Science, Technology and Society, Copernicus Institute, Utrecht University, Heidelberglaan 2, 3584 CS Utrecht, The Netherlands b Ecofys, P.O. Box 8408, 3503 RK Utrecht, The Netherlands Received 2 March 2005; accepted 9 June 2005 Available online 15 August 2005 Abstract In this paper, we assess energy demand due to fertilizer consumption in the period 1961–2001. Based on historical trends of gross energy requirements, we calculated that in 2001, global energy embedded in fertilizer consumption amounted to 3660 PJ, which represents about 1% of the global energy demand. Total energy demand has increased at an average rate of 3.8% p.a. Drivers behind the trend are rising fertilizer consumption and a shift towards more energy intensive fertilizers. Our results show that despite significant energy efficiency improvements in fertilizer manufacture (with exception of phosphate fertilizer in the last 20 years) improvements in energy efficiency have not been sufficient to offset growing energy demand due to rising fertilizer consumption. Furthermore, we found that specific energy consumption of ammonia and urea developed in close concordance with the learning curve model, showing progress ratios of 71% for ammonia production and 88% for urea. This suggests an alternative approach for including technological change in energy intensive industries in middle and long-term models dealing with energy consumption and CO 2 emissions, while few learning curves exist for energy efficiency of end use technologies. © 2005 Elsevier B.V. All rights reserved. Keywords: Fertilizer industry; Energy analysis; Learning curve ∗ Corresponding author. Tel.: +31 30 2537639; fax: +31 30 2537601. E-mail address: [email protected] (C.A. Ram´ ırez). 0921-3449/$ – see front matter © 2005 Elsevier B.V. All rights reserved. doi:10.1016/j.resconrec.2005.06.004
-
Upload
independent -
Category
Documents
-
view
3 -
download
0
Transcript of Feeding fossil fuels to the soil

Resources, Conservation and Recycling 46 (2006) 75–93
Feeding fossil fuels to the soilAn analysis of energy embedded and technological
learning in the fertilizer industry
C.A. Ramıreza,∗, E. Worrellb
a Department of Science, Technology and Society, Copernicus Institute, Utrecht University,Heidelberglaan 2, 3584 CS Utrecht, The Netherlands
b Ecofys, P.O. Box 8408, 3503 RK Utrecht, The Netherlands
Received 2 March 2005; accepted 9 June 2005Available online 15 August 2005
Abstract
In this paper, we assess energy demand due to fertilizer consumption in the period 1961–2001.Based on historical trends of gross energy requirements, we calculated that in 2001, global energyembedded in fertilizer consumption amounted to 3660 PJ, which represents about 1% of the globalenergy demand. Total energy demand has increased at an average rate of 3.8% p.a. Drivers behindthe trend are rising fertilizer consumption and a shift towards more energy intensive fertilizers. Ourresults show that despite significant energy efficiency improvements in fertilizer manufacture (withexception of phosphate fertilizer in the last 20 years) improvements in energy efficiency have notbeen sufficient to offset growing energy demand due to rising fertilizer consumption. Furthermore,we found that specific energy consumption of ammonia and urea developed in close concordancewith the learning curve model, showing progress ratios of 71% for ammonia production and 88% forurea. This suggests an alternative approach for including technological change in energy intensiveindustries in middle and long-term models dealing with energy consumption and CO2 emissions,while few learning curves exist for energy efficiency of end use technologies.© 2005 Elsevier B.V. All rights reserved.
Keywords: Fertilizer industry; Energy analysis; Learning curve
∗ Corresponding author. Tel.: +31 30 2537639; fax: +31 30 2537601.E-mail address: [email protected] (C.A. Ramırez).
0921-3449/$ – see front matter © 2005 Elsevier B.V. All rights reserved.doi:10.1016/j.resconrec.2005.06.004

76 C.A. Ramırez, E. Worrell / Resources, Conservation and Recycling 46 (2006) 75–93
1. Introduction
The growth of fertilizer use is an integral part of the technological revolution in agriculturethat has generated major changes in production techniques, shifts in inputs and growth inoutput and productivity. Although several fertilizers have been known for over a century (e.g.superphosphate production by treatment of ground bones with sulfuric acid was patentedin 1842), it is only in the last 50 years that growth in fertilizer consumption has reallytaken place (Fig. 1). In the year 2001, about 137 million tonnes of fertilizer nutrients wereapplied around the world. The growth in agricultural production has been enabled by thegrowth of yields that has been accompanied by an increasingly intensive use of land (FAO,2000). With higher yields normally demanding higher fertilizer application rates, and withthis trend expecting to continue for the next 30 years, debate is also intensifying over theinteractions between increasing fertilizer application and the effects on ecosystem stability,biodiversity and processes of climate change.
Several analyses of the energy embedded in fertilizers can be found in literature, espe-cially in the late 1970s and early 1980s (e.g.Achorn and Salladay, 1982; Disney and Aragan,1997; Hignett and Mudahar, 1982; Honti, 1976; Lockeretz, 1980) when higher energy pricesaffected the price and supply of fertilizers. Interest in the topic seemed, however, to havedecreased with the fall in energy prices. Only, from the beginning of the 1990s concernfor climate change (related with the high use of fossil fuels needed to produce fertilizers)increased again the attention to energy consumption and energy efficiency in fertilizer pro-duction (Worrell and Blok, 1994). This also included the indirect energy use due to increasefertilization has proven to be a determining factor on calculating the net available energybenefits of biofuels (e.g.Pimentel, 2001; Patzek, 2004; Worrell et al., 1995).
If the interactions between fertilizer application and climate change are to be betterunderstood, there is a need for studies that analyze the role that different factors (e.g. energyefficiency, increasing fertilizer consumption) have played in the development of energy use.There is, however, a remarkable lack of this kind of studies. In this context, the purposeof this paper is two-fold. First, to analyze the impact of improvements in energy efficiencyduring the manufacture of fertilizers in world energy demand (due to increased fertilizer
Fig. 1. Historical trends of world fertilizer consumption.Source: IFA, 2004.

C.A. Ramırez, E. Worrell / Resources, Conservation and Recycling 46 (2006) 75–93 77
Table 1Composition of important fertilizers
Product As percentage of final product (mass)
Nitrogen [N] Phosphorus [P2O5] Potassium [K2O]
Nitrogen fertilizersAmmonia 82 0 0Ammonium sulphate 21 0 0Ammonium nitrate 33–35 0 0Calcium ammonium nitrate 25 0 0Urea 46 0 0
Phosphate fertilizersSingle superphosphate 0 16–20 0Tripple superphosphate 0 46 0Monoammonium phosphate 11 52 0Diammonium phosphate 18 46 0
Potash fertilizersMuriat of potash (potassium chloride) 0 0 60Sulfate of potash 0 0 50
Complex fertilizersNP 15–25 15–25 0NK 13–25 0 15–46NPK 5–25 5–25 5–25
consumption), and second, to examine technological learning in the fertilizer industry. Thepaper is composed of two parts. In the first part, we develop historical trends of gross energyrequirements by kind of fertilizer and assess the energy demand embedded in fertilizerconsumption for the time period 1961–2001. Furthermore, we examine the role of fertilizerconsumption, fertilizer mix and changes in energy efficiency in total energy demand. Inthe latter part, we explore whether technological development in the fertilizer industry canbe analyzed using the concept of learning or experience curve to study energy efficiencydevelopment in the fertilizer industry.
2. Methodology
In this paper, energy and mass balances are made for the following fertilizers (see alsoTable 1): ammonia, ammonium nitrate (AN), calcium ammonium nitrate (CAN), urea, singlesuperphosphate (SSP), triple superphosphate (TSP), mono-ammonium phosphate (MAP)and diammonium phosphate (DAP), muriat of potash (potassium chloride), PK 22-22 andcomplex fertilizers (NPK). In 2001, these fertilizers accounted for 83% of total nitrogen,1
91% of total phosphates, and 96% of total potash consumed in the world.We distinguish between specific energy consumption (SEC) and gross energy require-
ment (GER). SEC is defined as the amount of energy used (as fuel, heat, electrical or
1 The other 17% is made up by nitrogen solutions, calcium nitrate, sodium nitrate, ammonium chloride, calciumcyanamid and ammonium bicarbonate.

78 C.A. Ramırez, E. Worrell / Resources, Conservation and Recycling 46 (2006) 75–93
mechanical energy) to produce one unit of product. GER is defined as the amount of energy,which is sequestered by the process, including energy to produce the raw materials in thecourse of the production of a specific process (Worrell and Blok, 1994). For instance, wedefine the SEC of ammonium nitrate as the amount of electricity, heat and fuels used tocovert ammonia and nitric acid to 1 tonne of AN, while the GER also includes the energy(electricity, heat and fuels) used to produce ammonia and nitric acid. In our analysis, wedo not include the energy use for transportation of raw materials and distribution of fertil-izers. The analysis of GER can be understood as a simplified LCA of the fertilizer industryfocusing on energy use. Historical developments of SEC by product were calculated in thispaper using fossil fuel and electricity data gathered from literature. GER were calculatedusing the SEC trends and literature data on input efficiencies by process. All energy data isexpressed in lower heating value (LHV). We use metric units throughout this study.
Energy consumption is analyzed at the process boundary, and adjusted to a primaryfuel equivalent basis. The primary fuel equivalent energy requirement of electricity wascalculated based on historical efficiency development of power plants. Where steam data isgiven, energy values are converted into primary fuel assuming 85% boiler efficiency.
In order to single out the influence of increasing fertilizer consumption, changes in themix of fertilizers use and changes in energy efficiency during fertilizer manufacturing onthe total energy embedded in fertilizer consumption, we apply a statistical decompositionmethodology. Statistical decomposition allows us to “give quantitative measures of therelative contributions of a set of pre-defined factors leading to the change in the aggregateindicator” (Ang and Liu, 2001) [for a detailed overview of the existing methodologies, seeAng and Zhang (2000)]. The method used in this paper is known as the log-mean divisiaindex method I (see Eqs.(1)–(6)).
Dtot = Et
E0= DconsDstrDint (1)
Dcons= exp
{∑i
ωi(t∗) ln
(Yt
Y0
)}(2)
Dstr = exp
{∑i
ωi(t∗) ln
(Si,t
Si,0
)}(3)
Dint = exp
{∑i
ωi(t∗) ln
(Ii,t
Ii,0
)}(4)
ωi(t∗) = L(Ei,0, Ei,t)
L(E0, Et)(5)
where
L(x, y) = y − x
ln(y/x)(6)
Dtot is the total change in energy embedded due to fertilizer consumption;Dint the effectof changes in energy efficiency during fertilizer manufacture;Dstr the effect of changes in
C.A. Ramırez, E. Worrell / Resources, Conservation and Recycling 46 (2006) 75–93 79
fertilizer mix; Dconsthe effect of increasing consumption of fertilizers;Et the total primaryenergy consumption of fertilizer industry in yeart, in Gigajoules;Ei,t the energy consump-tion due to fertilizeri in yeart, in Gigajoules;Yt the total fertilizer consumption in yeart(=�Yi,t), in tonnes;Yi,t the consumption of fertilizeri in yeart, in tonnes;Si,t the consump-tion share of fertilizeri in year t (=Yi,t/Yt); Ii,t is the energy efficiency of manufacturingfertilizer i (=EI,t/Yi,t), in Gigajoules per tonne.
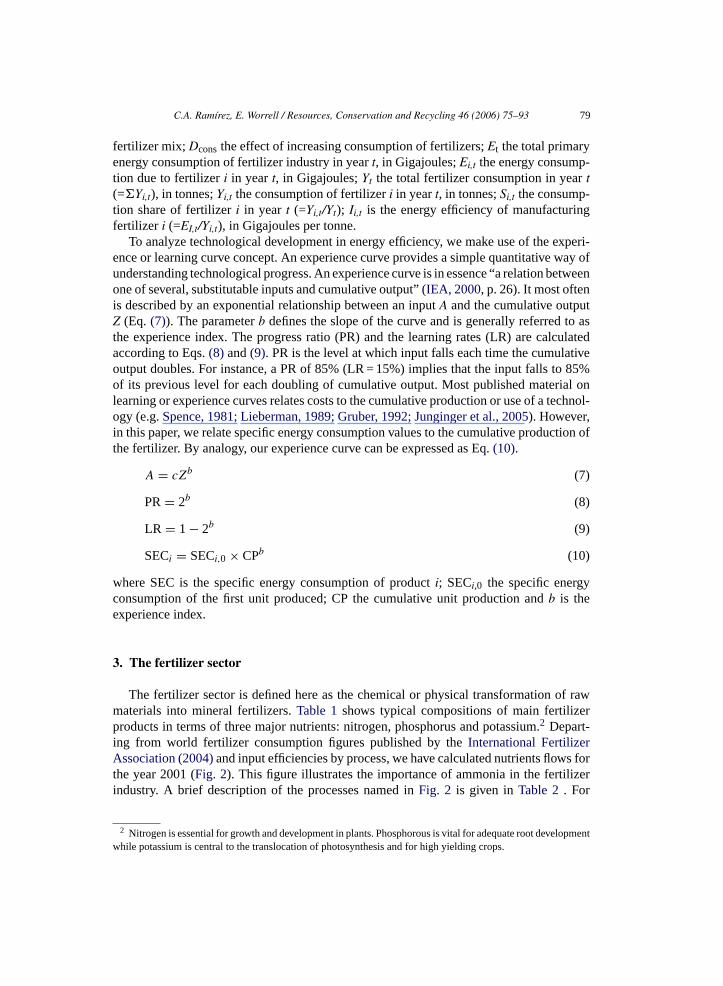
To analyze technological development in energy efficiency, we make use of the experi-ence or learning curve concept. An experience curve provides a simple quantitative way ofunderstanding technological progress. An experience curve is in essence “a relation betweenone of several, substitutable inputs and cumulative output” (IEA, 2000, p. 26). It most oftenis described by an exponential relationship between an inputA and the cumulative outputZ (Eq. (7)). The parameterb defines the slope of the curve and is generally referred to asthe experience index. The progress ratio (PR) and the learning rates (LR) are calculatedaccording to Eqs.(8) and(9). PR is the level at which input falls each time the cumulativeoutput doubles. For instance, a PR of 85% (LR = 15%) implies that the input falls to 85%of its previous level for each doubling of cumulative output. Most published material onlearning or experience curves relates costs to the cumulative production or use of a technol-ogy (e.g.Spence, 1981; Lieberman, 1989; Gruber, 1992; Junginger et al., 2005). However,in this paper, we relate specific energy consumption values to the cumulative production ofthe fertilizer. By analogy, our experience curve can be expressed as Eq.(10).
A = cZb (7)
PR= 2b (8)
LR = 1 − 2b (9)
SECi = SECi,0 × CPb (10)
where SEC is the specific energy consumption of producti; SECi,0 the specific energyconsumption of the first unit produced; CP the cumulative unit production andb is theexperience index.
3. The fertilizer sector
The fertilizer sector is defined here as the chemical or physical transformation of rawmaterials into mineral fertilizers.Table 1shows typical compositions of main fertilizerproducts in terms of three major nutrients: nitrogen, phosphorus and potassium.2 Depart-ing from world fertilizer consumption figures published by theInternational FertilizerAssociation (2004)and input efficiencies by process, we have calculated nutrients flows forthe year 2001 (Fig. 2). This figure illustrates the importance of ammonia in the fertilizerindustry. A brief description of the processes named inFig. 2 is given inTable 2. For
2 Nitrogen is essential for growth and development in plants. Phosphorous is vital for adequate root developmentwhile potassium is central to the translocation of photosynthesis and for high yielding crops.

80 C.A. Ramırez, E. Worrell / Resources, Conservation and Recycling 46 (2006) 75–93
Fig
.2.
Glo
baln
utrie
ntflo
ws,
2001
.

C.A
.Ram
ırez,E.W
orrell/Resources,C
onservationand
Recycling
46(2006)
75–9381
Table 2Brief descriptions of production processes by kind of fertilizer
Product Description Main reactions
Ammonia (NH3) Produced by the reaction betweenhydrogen and nitrogen at highpressure (Haber process). There aretwo main stages: the reformingstages (first and second reformer) andthe converting stage (ammoniasynthesis). Between these two stages,carbon monoxide is converted intocarbon dioxide and removed from theprocess
CH4 + H2O→ CO + 3H2 } Primary reformer
CH4 + 2H2O→ CO2 + 4H2
2CH4 + O2 → 2CO + 4H2} Secondary reformerCH4 + O2 → CO2 + 2H2
CO + H2O→ CO2 + H2 } Water–gas shiftN2 + 3H2 → 2NH3 } Ammonia synthesis
Urea (NH2CONH2) Produced by reacting ammonia andcarbon dioxide
2NH3 + CO→ NH4COONH2
NH4COONH2 → NH2CONH2 + H2O
Nitric acid (HNO3) Produced by the oxidation ofammonia
4NH3 + 5O2 → 4NO + 6H2O2NO + O2 → 2NO2
3NO2 + H2O→ 2HNO3 + NO
Ammonium nitrate(NH4NO3)
Produced by reacting ammonia withnitric acid
NH3 + HNO3 → NH4NO3
Calcium ammoniumnitrate (Ca(NO3)2)
Produced by mixing slurry ofammonium nitrate with a fillercontaining ground dolomite, groundlimestone or with byproduct calciumcarbonate
2NH4NO3 + CaCO3 → Ca(NO3)2 + 2NH3 + CO2 + H2O
Sulfuric acid (H2SO4) Produced by the oxidation of sulfur S + O2 → SO2
SO2 + 1/2O2 → SO3
SO3 + H2O→ H2SO4

82C
.A.R
amırez,E
.Worrell/R
esources,Conservation
andR
ecycling46
(2006)75–93
Table 2 (Continued )
Product Description Main reactions
Ammonium sulfate((NH4)2SO4)
It is mainly a byproduct frommanufacture of caprolactam andacrylonytrile, scrubbing coke ovengas or from other processes. It canalso be produced directly byneutralizing ammonia with sulfuricacid or from a solution, which isobtained
2NH3 + H2SO4 → (NH4)2SO4
Phosphoric acid(H3PO4)a,b
Produced from the reaction ofphosphate rock and sulfuric acid
3Ca3(PO4)2·CaF2 + 10H2SO4 + 20H2O→ 10CaSO4·2H2O + 2HF + 6H3PO4
Superphosphates Produced by reacting phosphate rockand sulfuric acid (singlesuperphosphate) or phosphoric acid(triple superphosphate)
Ca10F2(PO4)6 + 7H2SO4 + H2O→ 2HF + 3Ca(H2PO4)2·H20 + 7CaSO4} SSPCa10F2(PO4)6 + 7H3PO4 + 10H2O→ 2HF + 10Ca(H2PO4)2·H2O} TSP
Ammoniumphosphate
Produced by neutralizing phosphoricacid with ammonia
2NH3 + H3PO4 → (NH4)HPO4} DAPNH3 + H3PO4 → NH4H2PO4} MAP
Potassium chloride(potash)c
Occurs naturally in association withsodium or magnesium chloride
Compound fertilizers They are produced either bychemical or physical blending
a Pure phosphoric acid has the chemical form H3PO4 but is customary in the phosphate industry to express quantities of phosphate fertilizer in terms of the equivalentP2O5 content. Thus, 1 tonne of phosphoric acid (100%) is equivalent to 0.724 tonnes P2O5.
b The process described is generally known as the classical or dehydratate process (DH). Two variations, which reduce the energy use are the hemihidratate and thehemidratate dehydrate process. The main difference between these two processes and DH is that higher strength H2SO4 is used which results in direct production ofH3PO4 at a strength of 50% P2O5, obviating the need for evaporative concentration.
c Strictly, potash has the chemical form of K2O, but in the fertilizer industry potassium chloride (KCl) is referred to as potash and is normally recorded in by its K2Oequivalent: 1 tonne of KCl is equivalent to 0.632 tonnes K2O.

C.A. Ramırez, E. Worrell / Resources, Conservation and Recycling 46 (2006) 75–93 83
Fig. 3. SEC and GER involved in the production of ammonium nitrate (AN).
a more extended description of each process, we refer toKirk-Othmer (1993), EuropeanCommunity (2004)andWiesenberger (2002).
4. Energy embedded in fertilizer consumption
The first step to calculate the energy embedded in fertilizer consumption is to obtainhistorical trends in SEC for each fertilizer. The trends are then use to calculate GER usinginput efficiencies by process. In order to illustrate the procedure used,Fig. 3shows how theGER trend for ammonium nitrate (AN) was obtained: from SEC trends for the productionof ammonia, nitric acid and AN. Each point in the graphs represents typical SEC valuesfor the average of plants in a given year. The points were obtained from a literature review(about 50 sources) and include data for different geographical regions. In this way, thetrends characterize the average developments of SEC in the world. Feedstocks requirementsneeded to calculate GER are shown on top of the arrows. The values represent stoichiometricrequirements and are constant during the period studied.3 Negative values of the SEC for
3 Deviations on from the stoichiometric requirements reported in the literature were found to be of less than10%, which justifies to use stoichiometric values in this analysis.

84 C.A. Ramırez, E. Worrell / Resources, Conservation and Recycling 46 (2006) 75–93
Fig. 4. Historical gross energy requirements by type of fertilizer.
nitric acid appear because (a) all chemical reactions in the production of nitric acid areexothermic and (b) plants have improved heat utilization, and consequently, modern plantsexport heat. Note that the technological development in ammonia production is the mostimportant factor in the GER of AN and in fact, of all nitrogen fertilizers.
Fig. 4shows the historical developments in GER obtained by kind of fertilizer. By usingthe GER per tonne of nutrient and the world consumption as reported by theInternationalFertilizer Association (2004), we calculate world energy use by the fertilizer sector (Fig. 5).
Fig. 5. World historical consumption of primary energy for fertilizer production.

C.A. Ramırez, E. Worrell / Resources, Conservation and Recycling 46 (2006) 75–93 85
According to our analysis, in the year 2001, energy embedded in world fertilizer consump-tion was about 3660 PJ, of which 72% was for the production of nitrogen fertilizers, 10%for phosphate fertilizers, 16% for complex fertilizers and only 2% for potassium fertiliz-ers. The highest average annual rate of energy demand was shown by nitrogen fertilizersfollowed by compound fertilizers (4.5 and 3.9% p.a., respectively). Energy for phosphatefertilizer increased at a rate of 2.1% p.a., while the rate for potassium fertilizers was 1.7%p.a. Total energy demand increased by about 3.8% p.a. in the period 1961–2001 (this rateis the result of an increase of about 6% p.a. between 1961 and 1988 and a decrease of 0.3%p.a. between 1989 and 2001). The fall in energy demand shown between 1990 and 1994 isdue to a steep decrease in fertilizer consumption (and production) in Central and EasternEurope and Central Asia. The fall in consumption by 70% is directly linked to the changesof the economic and political systems in the region (Malinowski, 2000), and although since1995 the agricultural systems began to recuperate from the crisis (and fertilizer consumptionbegan to increase), fertilizer consumption has not yet reached the peak levels of 1989.
In order to understand the development in embedded energy due to fertilizer consumptionbetween 1961 and 2001 (Fig. 5), we have applied a decomposition methodology to eachnutrient for the time period 1961–1981 and 1981–2001. The results allow us to assess theeffect of improved energy efficiency in fertilizer manufacture (Dint), increasing consumptionof fertilizers (Dcons) and changes in the fertilizer mix used (Dstr) in the change in total energyembedded (Dtot). For nitrogen, the fertilizers (i) taken into account are: direct applicationof ammonia, ammonium nitrate, calcium ammonium nitrate and urea. Phosphate fertilizersare single superphosphate, triple superphosphate, ammonium phosphate and PK 22-22.The results for the world are depicted inFig. 6. There are three major findings from theseresults. The first is not surprising: growth in fertilizer consumption has been the maindriver of increasing energy consumption. The second finding is that the fertilizer mix hasmoved towards more energy-intensive fertilizers per tonne of nutrient, which has led toan increasing energy demand. This trend is especially significant for phosphate fertilizers(i.e. from superphosphates towards ammonium phosphates). The third implication is thatalthough significant improvements in energy efficiency have been able to offset the increasedenergy consumption as a result of changes in the fertilizer mix (with exception of phosphatefertilizers in the period 1981–2001), they were not sufficient to offset the impact of increasedfertilizer consumption. In the case of nitrogen fertilizers, the impact of changes in energyefficiency was higher in the period 1961–1981 than in 1981–2001.
5. Technological improvement in the nitrogen fertilizer industry: learning curves
The results shown so far point out significant improvements in energy efficiency. Inthis section, we further examine the nitrogen fertilizer industry, since it accounts for over70% of the total energy demand. As mentioned earlier, the decrease in GER values ofnitrogen fertilizers has been driven by the decreasing SEC of ammonia production. It isnot our intention to assess all process changes that have contributed to a reduction ofthe specific energy consumption in the nitrogen fertilizer industry, since this has alreadybeen well documented (e.g.Appl, 1997; Quartulli and Buividas, 1976). Instead, we lookat technological development as a learning process. Most published material on experience

86 C.A. Ramırez, E. Worrell / Resources, Conservation and Recycling 46 (2006) 75–93
Fig. 6. Effect of increasing consumption, fertilizer mix and energy efficiency on the world energy use due tofertilizer consumption between 1961 and 2001.

C.A. Ramırez, E. Worrell / Resources, Conservation and Recycling 46 (2006) 75–93 87
Fig. 7. Historical trends in the price of ammonia, production cost of ammonia and natural gas in the US, withexplanatory notes for changes in ammonia prices.Data sources: ammonia prices: US Mineral yearbooks (severalyears); natural gas prices:Energy Information Administration (2001); production costs of ammonia:Vrooman(2004)andMudahar and Hignett (1987b).
or learning curves relates prices to the cumulative production or use of a technology.4
The mathematical equations behind the experience curve were described in Section2.In this paper, we relate the historical trends in specific energy consumption of variousnitrogen fertilizers to cumulative production. Natural gas costs represent around 70–90%of the ammonia production costs and (including the gas cost in ammonia production andthe additional process gas costs needed for the production of urea) natural gas representsaround 70–75% of urea production costs (Hydro Company, 2003; Appl, 1997; UNIDO,1967). Hence, it is reasonable to assume that decreasing total energy consumption perunit of product has been a main driver of technological change in the nitrogen fertilizerindustry. Several reports confirm this point (e.g.Swaminathan and Sukalac, 2004; Mudaharand Hignett, 1987a; Marsal, 1986; Slack and James, 1973). Furthermore, by working withSECs instead of prices per unit of product we avoid problems associated with fluctuations offertilizer prices that reflect market conditions, and not necessarily are related to technologyproductivity changes. As an example, inFig. 7, we plot historical trends for the US price ofammonia, production costs of ammonia and natural gas prices (all deflated to 2001 values).The figure shows the strong influence of market forces and price of natural gas on the pricesand production costs of ammonia. As a consequence, the correlation factor between costsor prices and cumulative output is too weak (R2 < 0.4) to make any strong conclusion aboutlearning rates in US ammonia production.
4 Strictly speaking, learning curves apply to production cost rather that price. However, given than productioncosts are generally not publicly available, price data tend to be used as a surrogate measure of cost.

88 C.A. Ramırez, E. Worrell / Resources, Conservation and Recycling 46 (2006) 75–93
Fig. 8. Changes in SEC values for ammonia. Best available technologies.
A main difference with experience curves based on prices is the existence of a physicallimit: specific energy consumption figures cannot be below the theoretical minimum energyrequirements, for instance, in the case of ammonia 23.3 GJ/tonnes N (LHV). Therefore, theequation for the experience curve (Eq.(10)) can be rewritten as follows:
SECi = SECmin + SECi,0 × CPb (11)
where SECmin is the thermodynamically minimum energy requirement; SEC the specificenergy consumption of producti; SECi,0 the specific energy consumption of the first unitproduced; CP the cumulative unit production;b is the experience index.
Fig. 8 plots the experience curve for specific energy consumption obtained for worldammonia production between 1913 and 2001. The experience curve inFig. 8 is based onBest Available Technologies values (BAT). The progress ratio found for ammonia pro-duction is 71% (R2 = 0.997).5 We compare the learning curve plotted inFig. 8 with alearning curve obtained by using average SEC values. Results are depicted inFig. 9. Theprogress ratio found for the average development in SEC in the period 1913–2001 is 77%(R2 = 0.925). The potential for energy savings in ammonia production is still significant.Based on the current progress ratios, it will take a 3.3 doubling of the 2001 cumulative pro-duction (3066 million tons) for the world’s SEC average to reach BAT performance levels of2001 (≈32 GJ/tonnes N). We estimate that at the current rate of annual production growth,a cumulative production of 12,000 million tonnes will be reached in the year 2045. Calcula-tions on fertilizer requirements until the year 2030 made byFAO (2000), assume, however,a slowdown in the growth of world population and crop production and an improvement infertilizer use efficiency, which would result in growth rates of nitrogen fertilizers between
5 If the SECmin is not taken into account (Eqs.(6)–(10)), the progress ratio is 81% (R2 = 0.951).

C.A. Ramırez, E. Worrell / Resources, Conservation and Recycling 46 (2006) 75–93 89
Fig. 9. Trends in SEC and cumulative production of ammonia, BAT and average technologies. Data in LHV.
0.7 and 1.3% p.a. (compared with an average annual rate of 3% over the last 40 years). Withthese assumptions, a cumulative production of 12,000 millions tonnes would be reached inthe years 2065 or 2055, respectively.
We performed a similar analysis for urea.Fig. 10shows the learning curves for BAT andaverage SEC development. The progress ratios found were for SECBAT 88% (R2 = 0.856)
Fig. 10. Trends in SEC and cumulative production of urea, for BAT and average developments in technologies.

90 C.A. Ramırez, E. Worrell / Resources, Conservation and Recycling 46 (2006) 75–93
Fig. 11. Comparison of the effect of best available technologies in global energy embedded in fertilizer consump-tion by kind of fertilizer, with a zoom for phosphate and potash fertilizers.
and for SECaverage91% (R2 = 0.724). Contrary to the ammonia curves were the gap betweenBAT and average SECs seems to be closing up, there is no indication of this happening forurea production.
We attempted to perform the same kind of analysis for other fertilizers (AN, CAN, SSP,TSP, DAP, MAP). We found that despite a decline in SEC throughout the years (Fig. 4),correlation factors between SEC and cumulative production are too low (R2 < 0.65) pointingout weak dependences among the variables. This result is not totally unexpected. Firstly,most of the processes for the manufacture of these fertilizers are relatively simple (e.g.mixing and blending), and thus the space for improvement may be more limited. Secondly,because energy plays a minor role in production costs for these processes, increased energyefficiency may not be a main driver of technological development.
6. Discussion and conclusions
This paper departed from two main goals: to assess world energy demand due to fertil-izer consumption and the impacts of increasing energy efficiency on total energy demand,and examining technological development using the learning curve concept. We calculatethat primary energy demand for the year 2001 was about 3660 PJ, which represents about1% of the world total energy demand in 2001. Recent data on energy consumption relatedto fertilizers has been published byKongshaug (1998),6 estimating the global energy con-sumption due to fertilizer consumption in 1998 at 3832 PJ, compared to 3629 PJ in 1998 in
6 We have adjusted the data provided inKongshaug (1998)to the number of fertilizers used in this study.

C.A. Ramırez, E. Worrell / Resources, Conservation and Recycling 46 (2006) 75–93 91
this study. This is a difference of 5%. Kongshaug does not publish global energy consump-tion figures for earlier years so it is not possible to compare trends in the development ofenergy consumption.
When analyzing the drivers of increasing energy demand for fertilizer production (about3.8% p.a. for the period 1961–2001), we found that although improvements in energy effi-ciency have been able to counterbalance the effect of changes in fertilizer mix towardsmore energy intensive fertilizers, they have not been able to offset the impact of increasedfertilizer consumption. A comparison with BAT developments (Fig. 11) reveals a savingpotential for the year 2001 of about 19% (687 PJ of energy). This potential is found mainlyin the nitrogen fertilizer industry (Fig. 11). For instance, we calculate the energy embed-ded due to nitrogen fertilizer consumption in 2001 at 2660 PJ. However, if BAT wouldhave been used, the energy embedded in 2001 would have been 2140 PJ, which wouldplace the energy demand due to nitrogen fertilizers in 2001 below the level seen in 1980(2160 PJ). In other words, the implementation of BAT would have counterbalanced theeffects of raising fertilizer consumption and changes in fertilizer mix in the last two decades(Fig. 6).
As far as we know, no attempts have previously been done to use the concept oflearning curves to development of industrial energy efficiency. The results presented inFigs. 7–9reveal that over the long term, developments in specific energy consumptionfor ammonia and urea decline in close concordance with the learning curve concept.This is an important result since middle and long-term models of energy consumptionand CO2 emissions face the difficulty of how to consider technological changes. Theuse of progress ratios can provide an alternative to include technological change intoscenario developments. Another consequence of our findings is that for energy inten-sive industries for which classical learning curves (i.e. based on prices or costs) cannotbe developed due to high dependences on market prices and strong fluctuations of rawmaterial prices (e.g. ammonia, seeFig. 7), the analysis of SEC as a main indicator oftechnological development can provide a way out to analyze rates of technological changefor energy intensive processes (i.e. those processes for which energy is a major cost fac-tor).
The results in this paper are only the first step into understanding learning in energyefficiency development. It would be interesting to test if the results found in this study forurea and ammonia apply as well to other industrial energy intensive processes. Furthermore,if the results are going to be used for more than developing business-as-usual scenarios, forinstance, if progress ratios are to be changed by policy measures, the dynamics behind thelearning curve need to be better understood.
Acknowledgements
This research has been financed by the Netherlands Organization for Scientific Research(NWO) and the Netherlands Agency for Energy and the Environment (NOVEM).
The authors are grateful to Dr. Martin Junginger and Prof. Dr. Kornelis Blok for theirinsights during the preparation of this manuscript and to the International Fertilizer Asso-ciation for providing the production and consumption data for this study.
92 C.A. Ramırez, E. Worrell / Resources, Conservation and Recycling 46 (2006) 75–93
References
Ang BW, Liu F. A new energy decomposition method. Perfect in decomposition and consistent in aggregation.Energy 2001;26:537–48.
Ang BW, Zhang FQ. Survey of index decomposition analysis in energy and environmental studies. Energy2000;25:1149–76.
Achorn FP, Salladay DG. Optimizing use of energy in the production of granular ammonium phosphate fertilizers.Report TA/82/5. Paris: International Fertilizer Association; 1982.
Appl M. Modern production technologies. Nitrogen. London, UK: CRU publishing; 1997.Disney R, Aragan H. The choice of technology in the production of fertilizers. A case study of Ammonia and
Urea. World Dev 1997;5(9–10):853–66.Energy Information Administration (EIA). Historical natural gas annual, 1930–2000. Washington, DC, USA: EIA;
2001.European Community. Best available technologies in the large volume inorganic chemicals, ammonia, acids &
fertilizer industries. Draft report, EC, available online at:http://eippcb.jrc.es/pages/FActivities.htm; 2004.Food and Agriculture Organization (FAO). World agriculture: towards 2015/2030—a FAO perspective. Rome,
Italy: FAO; 2000.Gruber H. The learning curve of semiconductor memory chips. Appl Econ 1992;24:885–94.Hignett TP, Mudahar MS. Energy consumption in North American fertilizer plants and potential savings. Report
TA/82/3. Paris, France: International Fertilizer Association; 1982.Honti P. The nitrogen industry. Budapest: Akademiai Kiado; 1976.Hydro Company. Agri Fertilizer Industry Handbook. Hydro; 2003.International Energy Agency (IEA). Experiences curves for energy technology policy. Paris, France: OECD/IEA;
2000.International Fertilizer Association (IFA). IFADATA Statistics, CD-Rom. Paris, France: IFA; 2004.Junginger M, Faaij A, Turkenburg W. Global experiences curves for wind farm. Energy Policy 2005:113–50.Kirk-Othmer. Encyclopedia of chemical technology, vol. 10. fourth ed. John Wiley & Sons; 1993.Kongshaug G. Energy consumption and greenhouse gas emissions in fertilizer production. In: IFA Technical
Conference; 1998.Lieberman MB. The learning curve, technological barriers to entry and competitive survival in the chemical process
industries. Strat Manage J 1989;10(5):431–47.Lockeretz W. Energy inputs for nitrogen, phosphates and potash fertilizers. In: Pimentel D, editor. Handbook of
energy utilization in agriculture. FL, USA: CRC Press; 1980.Marsal JDR. Energy saving in fertilizer plants. Report TA/86/14. Paris, France: International Fertilizer Association;
1986.Malinowski M. Fertilizer situation central and east Europe. In: 26th IFA Enlarged Council Meeting, International
Fertilizer Association; 2000.Mudahar MS, Hignett TP. Energy requirements in the fertilizer sector. In: Helsel ZR, editor. Energy in plant
nutrition and pest control. Amsterdam, the Netherlands: Elsevier; 1987a. pp. 25–61.Mudahar MS, Hignett TP. Energy efficiency, economics and policy in the fertilizer sector. In: Helsel ZR, editor.
Energy in plant nutrition and pest control. Amsterdam, the Netherlands: Elsevier; 1987b. pp. 1–23.Patzek TW. Sustainability of the corn-ethanol biofuel cycle. Berkeley, USA: University of California; 2004.Pimentel D. The limits of biomass utilization. In: Meyers R, editor. Encyclopedia of physical sciences and tech-
nology. USA: Academic Press; 2001. p. 159–71.Quartulli OJ, Buividas LJ. Some current and future trends in ammonia production technology. Nitrogen
1976;100:60–5.Slack AV, James R. Ammonia (in fourth parts). New York: Marcel Dekker Inc; 1973.Spence AM. The learning curve and competition. Bell J Econ 1981;12:49–70.Swaminathan B, Sukalac KE. Technology transfer and mitigation of climate change: the Fertilizer industry per-
spective. In: IPCC Expert Meeting on Industrial Technology Development, Transfer and Diffusion; 2004.United Nations Industrial Development Organization (UNIDO). Fertilizer industry. Unido monographs on indus-
trial development monograph No. 6. Vienna, Austria: UNIDO; 1967.

C.A. Ramırez, E. Worrell / Resources, Conservation and Recycling 46 (2006) 75–93 93
Vrooman H. Demand destruction for natural gas in the US nitrogen industry. In: National Energy Modeling System,Annual Energy Outlook, 2004 Conference; 2004.
Wiesenberger H. State of the art for the production of fertilizers with regard to the IPCC directive. Austria: FederalEnvironmental Agency; 2002.
Worrell E, Blok K. Energy savings in the nitrogen fertilizer industry in the Netherlands. Energy1994;19(2):195–209.
Worrell E, Meuleman B, Blok K. Energy Savings by efficient application of fertilizer. Resour Conserv Recycl1995;13(3–4):233–50.