
Q19)Enumerate upon the Alternative fuels technological advances Ans: Overview
Upload
independentCategory
view
0download
0
MacLean, Lave, Lankey, and Joshi
Volume 50 October 2000 Journal of the Air & Waste Management Association 1769
ISSN 1047-3289 J. Air & Waste Manage. Assoc. 50:1769-1779
Copyright 2000 Air & Waste Management Association
TECHNICAL PAPER
A Life-Cycle Comparison of Alternative Automobile Fuels
Heather L. MacLeanDepartment of Civil Engineering, University of Toronto, Toronto, Ontario, Canada
Lester B. LaveGraduate School of Industrial Administration, Carnegie Mellon University, Pittsburgh, Pennsylvania
Rebecca LankeyAAAS Fellow, U.S. Environmental Protection Agency, Washington, DC
Satish JoshiDepartment of Agricultural Economics, Michigan State University, East Lansing, Michigan
ABSTRACTWe examine the life cycles of gasoline, diesel, compressednatural gas (CNG), and ethanol (C2H5OH)-fueled internalcombustion engine (ICE) automobiles. Port and direct in-jection and spark and compression ignition engines areexamined. We investigate diesel fuel from both petroleumand biosources as well as C2H5OH from corn, herbaceousbio-mass, and woody biomass. The baseline vehicle is agasoline-fueled 1998 Ford Taurus. We optimize the otherfuel/powertrain combinations for each specific fuel as a partof making the vehicles comparable to the baseline in termsof range, emissions level, and vehicle lifetime. Life-cyclecalculations are done using the economic input-output life-cycle analysis (EIO-LCA) software; fuel cycles and vehicleend-of-life stages are based on published model results.
We find that recent advances in gasoline vehicles, thelow petroleum price, and the extensive gasoline infrastruc-ture make it difficult for any alternative fuel to become
IMPLICATIONSAdvances in reformulated gasoline-fueled automobiles,low petroleum prices, and the extensive gasoline infra-structure hamper alternative fuels in competing with gaso-line. However, no fuel dominates for all economic, envi-ronmental, and sustainability attributes. CNG is less ex-pensive than gasoline, has lower pollutant and GHG emis-sions, and has large North American reserves. However,onboard storage penalties and the lack of fuel infrastruc-ture lower its attractiveness. Biofuels offer lower GHGemissions, are sustainable, and reduce the demand forimported fuels. Bioethanol would be attractive if the priceof gasoline doubled or if significant reductions in GHGemissions were required.
commercially viable. The most attractive alternative fuel iscompressed natural gas because it is less expensive than gaso-line, has lower regulated pollutant and toxics emissions,produces less greenhouse gas (GHG) emissions, and is avail-able in North America in large quantities. However, the bulkand weight of gas storage cylinders required for the vehicleto attain a range comparable to that of gasoline vehiclesnecessitates a redesign of the engine and chassis. Additionalnatural gas transportation and distribution infrastructure isrequired for large-scale use of natural gas for transportation.Diesel engines are extremely attractive in terms of energyefficiency, but expert judgment is divided on whether theseengines will be able to meet strict emissions standards, evenwith reformulated fuel. The attractiveness of direct injec-tion engines depends on their being able to meet strict emis-sions standards without losing their greater efficiency.Biofuels offer lower GHG emissions, are sustainable, andreduce the demand for imported fuels. Fuels from foodsources, such as biodiesel from soybeans and C2H5OH fromcorn, can be attractive only if the co-products are in highdemand and if the fuel production does not diminish thefood supply. C2H5OH from herbaceous or woody biomasscould replace the gasoline burned in the light-duty fleet whilesupplying electricity as a co-product. While it costs morethan gasoline, bioethanol would be attractive if the price ofgasoline doubled, if significant reductions in GHG emissionswere required, or if fuel economy regulations for gasolinevehicles were tightened.
INTRODUCTIONThe environmental quality and sustainability costs of U.S.cars and light-duty trucks are high. However, these

MacLean, Lave, Lankey, and Joshi
1770 Journal of the Air & Waste Management Association Volume 50 October 2000
vehicles also offer significant benefits related to personalfreedom, mobility, and consumer affordability. The so-cial costs can be lowered at the same time that automakersimprove vehicle safety, performance, and affordability,and, more generally, consumer acceptance. One approachto achieving these goals is to substitute alternative fuelsfor gasoline and diesel, the focus of our work. However,continuing low fuel prices and the recent rapid improve-ment in performance and emissions control of gasoline-fueled automobiles make it ever more difficult for thealternative fuels to compete.
The potential of each fuel and powertrain combina-tion can be assessed only through an economy-wide ex-amination of the material inputs and environmentaldischarges associated with the “life cycle” of each combi-nation.1 For example, in 1996, light-duty vehicles in theUnited States consumed over 4.5 billion barrels of crudeoil equivalent (a weighted average of the energy in allcrude oil products used in light-duty vehicles).2 To under-stand the implications of this fuel use, society needs toquantify the amount of nonrenewable resource use andenvironmental discharges that result from producing andusing this fuel. We employ a systems approach, life-cycleassessment (LCA), to assess the potential of near-term fossiland biofuels used in internal combustion engine (ICE)automobiles. We also include lifetime consumer expen-diture on fuel and discuss infrastructure issues for each ofthe options. The life-cycle approach has identified im-portant examples in which nonsystems methods lead torecommending options that move away from the goaldue to secondary impacts. For example, drawing a nar-row boundary around vehicle-regulated exhaust andevaporative emissions would indicate that a hybrid elec-tric vehicle would be preferred over a conventional gaso-line automobile. However, a broader systems approachidentifies the implications of the significantly higher pro-duction cost for the hybrid, which is greater than the valu-ation of the relatively minor emissions benefits and lowerlifetime expenditure on fuel.3
To make a fair comparison of alternative fuel/powertrain combinations, we assume that the volumeproduced is sufficient so that each powertrain is optimizedfor the fuel, and a large infrastructure supports refueling,repair, and so on. Based on 19% of vehicles requiring pre-mium gasoline and this fuel having a 20% market share,4
we assume the alternative fuels have at least 20% marketshare and so would be transported and retailed compara-bly to current premium gasoline. We analyze the energy,yield, farmland requirements, and co-products of thebiofuels, assuming both near-term and sustainable pro-duction. “Sustainable” production of the biofuels refersto production of these fuels when no fossil fuel is used toproduce them or any required inputs (e.g., fertilizer).
Although significant research and development isbeing devoted to non-ICE automobile options, there arelarge remaining potential improvements in the ICE al-ternatives. Currently, only gasoline and diesel ICE ve-hicles are optimized for fuel economy, emissions, andconsumer attributes (e.g., vehicle range, ease of refuel-ing). Although manufacturers are producing small num-bers of vehicles that are able to run on alternative fuels,these vehicles are not optimized for these fuels (takingadvantage of the specific fuel properties, such as octane).In addition, the current infrastructure is designed for thepetroleum fuels.
Researchers, including those at University of Califor-nia at Davis, Ford Motor Company, and Argonne NationalLaboratory, have developed spreadsheet-based life-cyclemodels that consider a large number of fossil and biofuel/engine combinations for automobiles.5-10 The studies arebased on process modeling of the life-cycle componentsand include varying proportions of the economy-wideinteractions resulting from the life cycles. These modelsfocus on efficiency, energy use, emissions of criteria pol-lutants, and greenhouse gas (GHG) emissions of the fuelcycles and vehicle operation, and do not include economicdata. Generally, the studies place less emphasis on theother life-cycle components and on vehicle optimization.Major studies on specific biofuel issues (e.g., process costestimates, process requirements, and source yields) areongoing at the U.S. Department of Energy (National Re-newable Energy Laboratory), Argonne, and Oakridge Na-tional Laboratories.
The most comprehensive life-cycle study of a gaso-line-fueled ICE automobile is a study by the U.S. Councilfor Automobile Research.11 Other conventional automo-bile life-cycle studies include refs 1 and 12–15. Kreucher’sstudy includes life-cycle inventories of alternative-fueledautomobiles as well as the baseline conventional gaso-line-fueled automobile.12 Sullivan et al. report a life-cycleinventory of diesel and electric vehicles, comparing theseto a baseline gasoline-fueled vehicle.14 Our present workemphasizes the fuel cycles, but also includes results fromthe remainder of the life cycles of conventional and alter-native fuel/powertrain ICE automobiles. We include eco-nomic data for the fuel options.
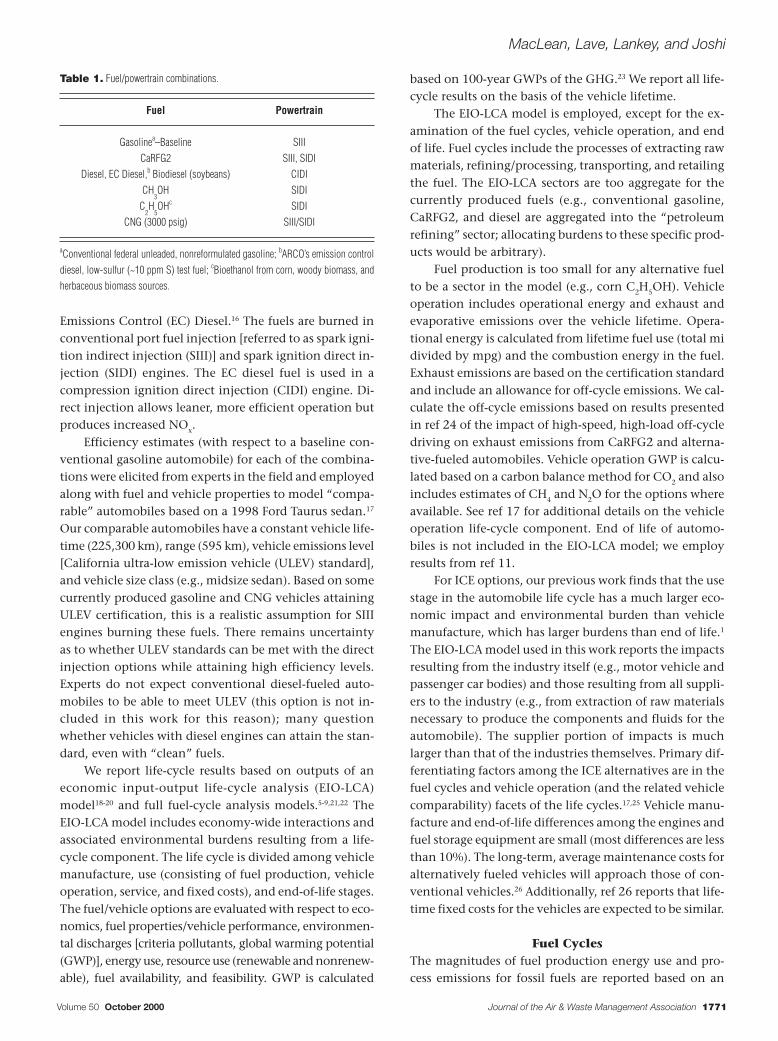
METHODSWe model automobiles with the fuel/powertrain optionsin Table 1. The fossil fuels are gasoline, reformulated gaso-line (RFG), reformulated diesel, CH3OH, and compressednatural gas (CNG). The biofuels include biodiesel from soy-beans and ethanol (C2H5OH) from corn (corn C2H5OH),woody biomass, and herbaceous biomass. We analyze Cali-fornia Phase 2 reformulated gasoline (CaRFG2) and a low-sulfur test fuel currently marketed in California, ARCO
MacLean, Lave, Lankey, and Joshi
Volume 50 October 2000 Journal of the Air & Waste Management Association 1771
Emissions Control (EC) Diesel.16 The fuels are burned inconventional port fuel injection [referred to as spark igni-tion indirect injection (SIII)] and spark ignition direct in-jection (SIDI) engines. The EC diesel fuel is used in acompression ignition direct injection (CIDI) engine. Di-rect injection allows leaner, more efficient operation butproduces increased NOx.
Efficiency estimates (with respect to a baseline con-ventional gasoline automobile) for each of the combina-tions were elicited from experts in the field and employedalong with fuel and vehicle properties to model “compa-rable” automobiles based on a 1998 Ford Taurus sedan.17
Our comparable automobiles have a constant vehicle life-time (225,300 km), range (595 km), vehicle emissions level[California ultra-low emission vehicle (ULEV) standard],and vehicle size class (e.g., midsize sedan). Based on somecurrently produced gasoline and CNG vehicles attainingULEV certification, this is a realistic assumption for SIIIengines burning these fuels. There remains uncertaintyas to whether ULEV standards can be met with the directinjection options while attaining high efficiency levels.Experts do not expect conventional diesel-fueled auto-mobiles to be able to meet ULEV (this option is not in-cluded in this work for this reason); many questionwhether vehicles with diesel engines can attain the stan-dard, even with “clean” fuels.
We report life-cycle results based on outputs of aneconomic input-output life-cycle analysis (EIO-LCA)model18-20 and full fuel-cycle analysis models.5-9,21,22 TheEIO-LCA model includes economy-wide interactions andassociated environmental burdens resulting from a life-cycle component. The life cycle is divided among vehiclemanufacture, use (consisting of fuel production, vehicleoperation, service, and fixed costs), and end-of-life stages.The fuel/vehicle options are evaluated with respect to eco-nomics, fuel properties/vehicle performance, environmen-tal discharges [criteria pollutants, global warming potential(GWP)], energy use, resource use (renewable and nonrenew-able), fuel availability, and feasibility. GWP is calculated
based on 100-year GWPs of the GHG.23 We report all life-cycle results on the basis of the vehicle lifetime.
The EIO-LCA model is employed, except for the ex-amination of the fuel cycles, vehicle operation, and endof life. Fuel cycles include the processes of extracting rawmaterials, refining/processing, transporting, and retailingthe fuel. The EIO-LCA sectors are too aggregate for thecurrently produced fuels (e.g., conventional gasoline,CaRFG2, and diesel are aggregated into the “petroleumrefining” sector; allocating burdens to these specific prod-ucts would be arbitrary).
Fuel production is too small for any alternative fuelto be a sector in the model (e.g., corn C2H5OH). Vehicleoperation includes operational energy and exhaust andevaporative emissions over the vehicle lifetime. Opera-tional energy is calculated from lifetime fuel use (total midivided by mpg) and the combustion energy in the fuel.Exhaust emissions are based on the certification standardand include an allowance for off-cycle emissions. We cal-culate the off-cycle emissions based on results presentedin ref 24 of the impact of high-speed, high-load off-cycledriving on exhaust emissions from CaRFG2 and alterna-tive-fueled automobiles. Vehicle operation GWP is calcu-lated based on a carbon balance method for CO2 and alsoincludes estimates of CH4 and N2O for the options whereavailable. See ref 17 for additional details on the vehicleoperation life-cycle component. End of life of automo-biles is not included in the EIO-LCA model; we employresults from ref 11.
For ICE options, our previous work finds that the usestage in the automobile life cycle has a much larger eco-nomic impact and environmental burden than vehiclemanufacture, which has larger burdens than end of life.1
The EIO-LCA model used in this work reports the impactsresulting from the industry itself (e.g., motor vehicle andpassenger car bodies) and those resulting from all suppli-ers to the industry (e.g., from extraction of raw materialsnecessary to produce the components and fluids for theautomobile). The supplier portion of impacts is muchlarger than that of the industries themselves. Primary dif-ferentiating factors among the ICE alternatives are in thefuel cycles and vehicle operation (and the related vehiclecomparability) facets of the life cycles.17,25 Vehicle manu-facture and end-of-life differences among the engines andfuel storage equipment are small (most differences are lessthan 10%). The long-term, average maintenance costs foralternatively fueled vehicles will approach those of con-ventional vehicles.26 Additionally, ref 26 reports that life-time fixed costs for the vehicles are expected to be similar.
Fuel CyclesThe magnitudes of fuel production energy use and pro-cess emissions for fossil fuels are reported based on an
Table 1. Fuel/powertrain combinations.
Fuel Powertrain
Gasolinea–Baseline SIIICaRFG2 SIII, SIDI
Diesel, EC Diesel,b Biodiesel (soybeans) CIDICH
3OH SIDI
C2H
5OHc SIDI
CNG (3000 psig) SIII/SIDI
aConventional federal unleaded, nonreformulated gasoline; bARCO’s emission controldiesel, low-sulfur (~10 ppm S) test fuel; cBioethanol from corn, woody biomass, andherbaceous biomass sources.

MacLean, Lave, Lankey, and Joshi
1772 Journal of the Air & Waste Management Association Volume 50 October 2000
assessment of published studies.5-10 In selecting the fullfuel-cycle studies we utilize for the energy and emissionsestimates, we consider the study method, comprehensive-ness, and year of the study, as well as publications thatcite the study results. The studies are generally in closeagreement. For the fossil fuels, we take averages wherepossible of the values for energy use and the various pro-cess emissions from the studies.
For the biofuels, particularly those that are not pro-duced commercially or are produced as byproducts, thedata on feedstock yields, energy use, and especially pro-cess emissions are more uncertain. We develop insightsfor the biofuels based on fuel cycle data for biodiesel andC2H5OH from biomass sources using near-term technolo-gies.10,22,27-29 For the biofuel energy use and process emis-sions, we utilize ref 10, and based on refs 28 and 29, weupdate the biomass yields and electricity credits to corre-spond to the latest available estimates. Additional detailsof the biofuel method are in the Biofuels section.
Fossil FuelsFossil fuels are nonrenewable; their production and useresult in large amounts of GHG emissions. However, gaso-line is attractive with respect to price, availability, ease ofuse, fuel properties (e.g., relatively high-energy density),continuing vehicle performance and emissions improve-ments (with RFG), and is supported by the current infra-structure. We examine the potential of gasoline-poweredSIII vehicles to lower environmental costs by consideringCaRFG2 (the “cleanest” high-volume gasoline in theUnited States). Additionally, we consider the potential ofdirect injection engines with CaRFG2, as these enginesare capable of higher efficiency operation. However, themore efficient direct injection engines produce more par-ticulate matter and NOx. Much of the success of directinjection engines will depend on the level of efficiencythey are able to attain while meeting strict emissions stan-dards. We examine a low-sulfur diesel fuel, since it couldbe used in the most efficient, proven ICE; while uncer-tain, this fuel/engine combination may have the poten-tial to meet ULEV standards.
Although CNG is a fossil fuel, it has several benefitsover other fossil fuels. It is an inherently “cleaner” fuelresulting in lower engine emissions, is in abundant sup-ply in North America, currently has a low price, and re-sults in lower GWP. A primary impact of the vehiclecomparability issue is the additional fuel and fuel storagerequired for CNG vehicles to attain the 595-km range.For example, the CNG vehicle becomes considerablyheavier (average 1720 kg compared to the 1510-kg Taurus)and less efficient than the baseline gasoline vehicle whensufficient heavy storage cylinders are added to attain thiskm range.17 Holding cylinder type constant, 3000-psig
options are slightly more attractive than 3600-psig op-tions due to the lower storage cylinder wall thickness andresulting lower-weight cylinders. However, there is a smallpenalty for onboard fuel storage volume at the lower pres-sure. Since the results are similar for both pressures17 andfuel-cycle differences are small,30 we limit the scope ofthis work to the 3000-psig options.
Due to safety issues associated with CH3OH as aresult of its toxicity and to its relative unattractiveness(lower energy density, no significant efficiency or emis-sions benefits) compared with C2H5OH, we do not ana-lyze it further.
BiofuelsConcern over fossil fuel consumption, GHG emissions,and U.S. dependence on foreign fuel sources has led tothe investigation of renewable fuel sources for automo-biles. Currently, only a small percentage of energy is pro-duced from renewable resources (3% of the U.S. energysupply is provided by biomass sources, and a recent ex-ecutive order calls for a tripling of that level by 2010).31 Inthe United States, biofuels are produced from severalsources, including C2H5OH from corn and biodiesel fromsoybeans. Approximately 1.5 billion gal of C2H5OH areproduced from corn annually, consuming ~6% of domes-tic corn production.27 Aside from being derived from re-newable sources and, therefore, supporting sustainability,biofuels address issues of global warming, energy inde-pendence (if the farming and fuel production are domes-tic), and support for a farm economy. If the fuels andinputs into the fuel production were to be produced us-ing no fossil fuels, production and combustion of thesefuels would result in no net CO2. The carbon released asCO2 from burning the fuel would be incorporated intothe regrowth of the plant.
Both C2H5OH and biodiesel are primary candidatesfor renewable automobile fuels. Biodiesel used in high-efficiency CIDI engines has the potential to be sustain-able, has low sulfur content, and has resulting emissionsbenefits. Attaining very low sulfur content in conven-tional diesel fuel is expensive. C2H5OH has good ve-hicle fuel properties, the potential to be sustainable,low sulfur content (which benefits emissions), and canbe produced from several biomass sources. Currently,corn is the primary source, but herbaceous biomasscrops (e.g., switch grass) and short rotation woody bio-mass crops (e.g., hybrid poplars) are being developedfor C2H5OH production. Unfortunately, biofuels aremore expensive than gasoline (we include details in theFuel Expenditure section).
Current and near-term biofuel production assumes theuse of fossil fuels for the production of fertilizers, as fuelfor farm equipment and transportation, and in varying

MacLean, Lave, Lankey, and Joshi
Volume 50 October 2000 Journal of the Air & Waste Management Association 1773
proportions for the fuel conversion process. The majorityof fuel conversion energy for corn C2H5OH and biodieselis currently from fossil fuel sources. In contrast, the near-term assumption for the herbaceous and woody biomass-derived fuels is that the combustion of the lignin(a nonfermentable biomass component) can be used togenerate the steam and electricity required for C2H5OHproduction, resulting in little fossil fuel use.27
To make a significant contribution, bioalcohols neednot replace all the gasoline used in light-duty vehicles.However, an interesting statistic for biofuels is how muchland would have to be used for biomass growth in orderfor the biofuel to replace the ~100 billion gal of gasolinecurrently fueling the light-duty fleet.32 Approximately 120billion gal of C2H5OH or 75 billion gal of biodiesel arerequired, taking into account the differences in the heat-ing values and fuel-engine efficiencies of the fuels (SIDIwith the bioethanol and CIDI with the biodiesel). Basedon current and near-term yields from refs 27 and 29, wecalculate the required corn, soybean, woody, and herba-ceous biomass quantities. Farmland requirements are es-timated based on the average U.S. corn, soybean, woody,and herbaceous biomass yields.27,33 For these calculations,the baseline case is conventional gasoline in an SIII en-gine. To provide an additional reference point, we calcu-late the amount of gasoline that would be required tofuel the light-duty fleet assuming the fleet comprised SIDIgasoline vehicles.
The attractiveness of sustainable production of thebiofuels is evaluated using a simplified approach. We as-sume that we are able to substitute the current or near-term fuel-cycle fossil fuel use on a MJ basis with theproduced biofuel; that is, we assume that C2H5OH orbiodiesel can be used to produce fertilizer, to run farmequipment, and provide process heat. We do not assumeany other process changes.
Since the co-products from using corn or soybeanscan be worth more than the fuel, the cost of the resultingfuel depends on the value of the co-products. Both dry-and wet-milling corn processes are used for C2H5OH pro-duction. The dry-milling process is designed for C2H5OHproduction, and the only co-product is distillers’ grainsand solubles. However, the wet-milling process has sev-eral co-products, which are more valuable than the dis-tillers’ grains and solubles.27 We present the dry-millingscenario in this work. Co-products of biodiesel from soy-beans are soymeal and glycerin. The only near-term bio-mass C2H5OH co-product is steam from burning the lignin.The steam can be used for process heat and the excessused to generate electricity that can be sold to the grid.We calculate the amounts of co-products that are producedbased on ref 10, updating co-product yields according torefs 27–29.
RESULTSAir Pollutants
The focus for automobile-related air pollutants has beenon vehicle exhaust and evaporative emissions. The focus isnow shifting to other life-cycle stages due to the promiseof continuing significant improvements in vehicle emis-sions.17,34,35 Since we assume all vehicles meet the ULEVstandard, exhaust and evaporative emissions are reportedto be equal. Table 2 reports life-cycle air pollutant emis-sions for the fossil-fueled automobiles and the improve-ment for the ULEV over the baseline Tier 1 vehicle.
The emissions associated with the manufacture of thevehicle are larger in magnitude than those from the fossilfuel cycles. Some of this difference is due to the EIO-LCAmodel, which draws a larger boundary around the pro-cess than the models used for the fuel-cycle results. ForULEV vehicles, lifetime driving emissions are roughlyequal to the fuel-cycle emissions, except for CO wherefuel-cycle emissions are small. Even when vehicles attainULEV standards, exhaust emissions of CO dominate thoseof the other life-cycle stages. For the various fuels, fuel-cycle emissions are similar for each pollutant. Low sulfur,reformulated fuels might require more processing andenergy than the values reported here.
Fuel-cycle emissions for the biofuel options are re-ported in refs 7, 10, 22, and 27. We report insights basedon these estimates. With current and near-term produc-tion methods, the biofuels cycles (even with the electric-ity credit in the case of the biomass C2H5OH) emit higherlevels of SO2, particles, and especially NO2 and CO, thanthe fossil fuel cycles emit. The major sources of theseemissions are the combustion of the fossil fuel used inproducing the fertilizers and in operating farm and trans-portation equipment, and emissions from the fuel con-version processes. In our judgment, the current fuel-cycleproduction emissions for the biofuels are not a signifi-cant concern due to the potential to lower the emissionsfrom these processes (e.g., tractors using cleaner diesel withemissions control systems). In the longer term, alcoholor biodiesel-fueled tractors can replace current diesel trac-tors. As expected, the electricity credit results in pollut-ant emissions credits, since the biomass electricity iscleaner than the primarily fossil fuel electricity it displaces.Even with the near-term technology assumption, emis-sions of SOx from biomass C2H5OH production are smallerthan for fossil fuel production, and in the cases where theelectricity credit is applied, these emissions are reportedas negative values.
Global Warming PotentialFigure 1 reports GWP for the vehicle alternatives. Thefigure assumes sustainable production (no fossil fueluse) for the biofuel options. We omit corn C2H5OH and

MacLean, Lave, Lankey, and Joshi
1774 Journal of the Air & Waste Management Association Volume 50 October 2000
biodiesel since, as shown below, avast amount of land is required forlarge-scale production. For anyfossil-fueled automobile option, theamount of CO2 equivalent generatedfrom its life cycle is between 77,000kg for the CNG SIDI combinationand 99,000 kg for the CaRFG2 SIII op-tion. Multiplying this life-cycleamount by the large number of ve-hicles being produced in the UnitedStates gives at least a partial indica-tion of the magnitude of the impactof these vehicles on GWP. Even witha range of 595 km, the direct-injectionCNG vehicles have the potential tolower GHG emissions by 30% com-pared with the baseline vehicle. TheEC diesel lowers GHG emissions by25% compared with the baselinegasoline vehicle. RFG has local airquality benefits but results in an in-crease in GWP, even though the fuelhas a lower carbon content than
Table 2. Estimated air pollutants resulting from life cycles of fossil-fueled automobiles (kg/vehicle lifetime).
SOx
CO NOx
NMOG/ VOCsa Particulate Matter (PM
10)
Manufacture 54 82 44 20 6Service 22 29 16 4 2Fixed Costs 9 17 7 4 1End of Life 0.3 0.7 0.8 0.2 0.2
Vehicle Exhaust Emissionsb
Baseline (Tier 1) 681 61 36 6ULEV 340 31 6 6
Fuel Productionc
Gasoline SIII 28 16 24 13 6CaRFG2 SIII 32 17 26 13 6CaRFG2 SIDI 28 15 23 11 6EC Diesel CIDI 24 12 16 5 4CNG 3000 SIII 10 20 40 6 3CNG 3000 SIDI 9 17 35 5 2
aNonmethane organic gases (NMOG) for vehicles and volatile organic compounds (VOCs) for fuel production; bVehicleexhaust emissions refers to estimates of both on- and off-cycle exhaust emissions discharged over the vehicle lifetime.These amounts do not include an allowance for malfunction emissions. Sulfur oxides are not regulated exhaust emissionsand so are not included; cFuel production includes stages from raw materials extraction to delivery of fuel at end user.
Glo
bal
War
min
g P
ote
ntia
l(k
g C
O2
equi
v./v
ehic
le li
fetim
e)
Figure 1. Life cycle GWP of automobile alternatives (assumes sustainable production of biofuels).

MacLean, Lave, Lankey, and Joshi
Volume 50 October 2000 Journal of the Air & Waste Management Association 1775
conventional gasoline. This is due to the slightly lowervehicle fuel economy with CaRFG2 (because of lowerenergy density of the fuel) and the additional energyrequired during the fuel production. The potential forGHG benefits from the direct injection engines is de-pendent on their attaining a high efficiency while meet-ing strict emissions standards.
For fossil fuels, the GWP from lifetime vehicle opera-tion dwarfs the emissions from the other life-cyclecomponents. For the baseline automobile, the sum ofGWP emissions across all the life-cycle stages, except ve-hicle operation, is 42,000-kg CO2 equivalent, comparedwith 55,000 kg for vehicle operation. The GWP resultingfrom the fossil fuel production is similar to that for ve-hicle manufacture, about 20–30% of the GWP resultingfrom vehicle operation.
Although some reductions in GHG emissions fromautomobiles could be realized with the use of CNG andincreases in fossil-fueled vehicle efficiency, improve-ments necessary to satisfy the Kyoto Agreement and asustainable transportation system require more radicalmeasures.36 Biofuels have the potential to offer thesemuch greater reductions. As mentioned previously, sus-tainable production would result in no net CO2 fromthe fuel cycle and fuel combustion. If the excess energywere used to generate electricity that reduces generationfrom conventional sources, there would be a net CO2
benefit. There remains a GWP due to the non-CO2 GHG(for the current and near-term biofuels, these amountsare less than 10,000 kg CO2 equivalent per vehicle life-time). The fuel cycle emissions shown in Figure 1 aredue to these non-CO2 GHG.
Wang et al. report that even with current and near-term production methods, there are potential GWP ben-efits for the biofuels, particularly for biomass C2H5OH,due to carbon sequestration, the electricity credit, and thefact that little fossil fuel energy is used in the C2H5OHconversion process.27 Current production of corn C2H5OHand biodiesel has less benefit for GWP, due to the absenceof the electricity co-product, and significantly higher pro-cess fossil energy. For a near-term scenario, ref 10 reportsabout a 25% decrease in fuel-cycle CO2 equivalent emis-sions for E85 (85% corn C2H5OH, 15% conventional gaso-line) flexibly fueled vehicles compared with conventionalgasoline automobiles.
Energy UseTable 3 shows energy use for the automobile life cycles.Comparing the fossil fuel automobile options, there arenot substantial differences in their life-cycle energy use.The EC diesel results in the largest saving, 20%, due toits high efficiency. However, the energy required to pro-duce this very low sulfur diesel is uncertain, and it is
not likely the same processes would be employed withlarge-scale production. The results for any of the otheroptions are within 10% of the baseline’s 1351 GJ. Mir-roring the GWP results, the operational energy use forthe fossil fuel options is much larger than the energyrequired for fuel production. For example, to producethe gasoline for the baseline vehicle over its lifetimerequires ~150 GJ, while operating the vehicle requiresover 800 GJ.
Table 3 reports near-term amounts of total and fossilenergy for the biofuels. Comparing fuel cycle total en-ergy for the biofuels with that of the fossil fuels is mis-leading. For bioalcohols and biodiesel, large amounts ofenergy are required in the conversion processes. For thefossil fuels, nature has already converted the biomass tothese fuels (e.g., petroleum is formed by the decay andincomplete oxidation of biomass and animal debris bur-ied in sedimentary rocks during geologic times); there-fore, far less energy is required throughout the fossil fuelcycles. A more relevant fuel-cycle energy use comparisonis to compare fossil fuel energy use, since, particularly forthe biomass C2H5OH, the majority of the energy used in
Table 3. Energy use of ICE options (GJ/vehicle lifetime).
Life Cycle Stage or Industrya Suppliersb TotalFuel/Powertrain
Vehicle
Manufacture 8 233 241Service 7 90 97Fixed Costs 1 40 41End of Life 2 2
Vehicle Use Fuel Cycle Vehicle Operation Total
Gasoline SIII 154 816 970CaRFG2 SIII 172 800 972CaRFG2 SIDI 152 705 857EC Diesel CIDI 89 612 701Biodiesel CIDI 231/252c 612 843/864E100 Corn SIDI 400/420 657 1057/1077E100 H SIDI Creditd 73/988 657 730/1645E100 H SIDI 125/1062 657 782/1719E100 W SIDI Creditd 5/1116 657 662/1773E100 W SIDI 108/1266 657 765/1923CNG 3000 SIIIe 151 803 954CNG 3000 SIDI 134 701 835
Note: Table assumes near-term production for biofuels; aRefers to the primary/final industry for the life-cycle stage (e.g., for manufacture, motor vehicle, andpassenger car bodies); bRefers to all of the industries throughout the economywho are the suppliers to the industry referred to in item a; cFirst entry is fossilenergy and second figure is total energy; dH is herbaceous biomass, W is woodybiomass, and Credit is electricity credit co-product for biofuels; eCNG – Type 3cylinders, 3000-psig pressure.

MacLean, Lave, Lankey, and Joshi
1776 Journal of the Air & Waste Management Association Volume 50 October 2000
the biomass conversion plant is from the biomass itself.Just 10% of the biomass fuel cycle energy is required forbiomass farming and transportation to a C2H5OH conver-sion facility; the remaining 90% is used in the conversionof biomass to C2H5OH and its transport, storage, and dis-tribution.
After subtracting the fossil energy required to pro-duce 1 gal of C2H5OH from the energy contained in thegallon, the net energy balance is close to 60,000 Btu/galfor biomass C2H5OH (even ignoring the electricity cred-its) and 25,000 Btu/gal for corn C2H5OH.
Fuel Availability/FeasibilityExperts disagree on the amount of petroleum that couldbe extracted at prices close to the current levels. Similarly,there is no consensus on the amount of natural gas thatcould be extracted at current prices. However, since theUnited States imports more than half of the petroleum ituses, even relatively small reductions in demand due tothe use of biofuels could help to lower oil prices and in-crease U.S. energy security.
Table 4 reports biofuel yields and land required tosubstitute the gasoline currently used by SIII light-dutyvehicles with the biofuels used in their relevant engines.Results for both current/near-term and sustainable pro-duction are shown. The low soybean yield per acre is aprimary factor in the much larger land requirement forthe biodiesel. Assuming a 5–15% efficiency advantage ofSIDI gasoline engines over SIII, and taking into accountthe slightly lower energy content of CaRFG2 (which isthe fuel we assume is used in SIDI engines), between 88and 98 billion gal CaRFG2 would be required to fuel thecurrent fleet if SIDI automobiles were used.17
Two central biofuel issues are sustainable productionand co-product value. Clearly, with sustainable produc-tion (using biodiesel or C2H5OH to run tractors, etc.), lessC2H5OH is available to fuel automobiles. Table 4 indicates
the reduced yields and resulting larger land area requiredfor the sustainable production.
The land area of the United States is 1.94 billion acres.Ninety-two million acres are developed, 380 million acresare cropland, and 125 million acres are pastureland, yield-ing a total of ~600 million acres.32 Even eliminating fromconsideration land that is in areas too dry or too cold togrow biomass, or on hills and mountains too high or steepto harvest, there is a great deal of land that could be usedfor growing woody or herbaceous biomass.
Most current biofuel processes do not take advan-tage of the use of waste materials in production of thefuels. For example, the current production of cornC2H5OH uses cornstarch as the raw material. The pro-cess might also use the corn stover as biomass to pro-duce C2H5OH. If so, the biomass process would supplyadditional C2H5OH as well as steam to run both processes.Electricity credits associated with this fuel productionare even possible.
Note that the co-product of the woody and herba-ceous alcohol cycles is electricity, while the corn C2H5OHand particularly the biodiesel fuel cycles yield more valu-able co-products. Based on the near-term electricity cred-its associated with woody and herbaceous biomass (1.73and 0.865 kWh/gal of C2H5OH produced, respectively),27
production of 120 billion gal of C2H5OH would result innet electricity generation of ~210 million MWh for woodybiomass or 105 million MWh for herbaceous biomass.These amounts correspond to 6 and 3%, respectively, ofcurrent net U.S. generation. Based on ref 27, this electric-ity co-product is assumed to have the potential to dis-place electricity generation on the basis of the U.S. averagegeneration mix. For additional details, see ref 27. Efficiencyimprovements for C2H5OH production would trade in-creased C2H5OH yield for decreased electricity credits. Pro-ducing C2H5OH from corn (dry-milling process) orbiodiesel from soybeans in the above quantities yields
Table 4. Biofuel requirements to replace 100 billion gal of gasoline used to fuel SIII vehicles:a near-term and sustainable poduction.
Fuel Biosourceb Yield Fuel Yield: Required Biosource Land Required: Fuel Yield: Land Required:(bushel or dry Near-Termd (billions bushels Near-Term Sustainable Productione Sustainable ton/acre/yr)c (gal fuel/bushel or dry tons) Production (gal fuel/bushel Production
or dry ton) (billions acres) or dry ton) (billions acres)
Corn C2H
5OH 125 2.6 46 0.37 0.85 1.1
Herbaceous C2H
5OH 5.75 80 1.5 0.26 63 0.33
Woody C2H
5OH 5.26 76 1.6 0.30 62 0.37
Soybean Biodiesel 36 1.4 55 1.5 0.81 2.6
aValues in the table are to produce 120 billion gal of C2H
5OH or 75 billion gal of biodiesel; bBiosource refers to corn, soybeans, or biomass corresponding to that required for the fuel
produced; cValues for corn and soybeans are reported in bushels, those for herbaceous and woody biomass in dry tons biomass; dNear-term refers to current corn C2H
5OH and soybean
biodiesel production and near-term C2H
5OH from herbaceous and woody biomass; eSustainable production refers to no fossil fuel use throughout the entire fuel cycle.

MacLean, Lave, Lankey, and Joshi
Volume 50 October 2000 Journal of the Air & Waste Management Association 1777
significant amounts of co-products. The corn C2H5OH pro-duction would result in 332 million dry tons of distillers’grains and solubles, and the soybean biodiesel, 55 mil-lion tons of glycerin and 1.2 billion tons of soymeal.
Unused farm land and excess production of corn andsoybeans might make some production of corn C2H5OHor biodiesel attractive, particularly if there were high de-mand for the co-products and concern for reducing pe-troleum imports. However, using food to produce vehiclefuel in a world with more than 6 billion people raises moralconcerns. In addition, corn and soybeans require morefertilizer, pesticides, and effort (e.g., irrigation, planting,harvesting) than the herbaceous and woody biomasssources. Furthermore, the amount of land suitable for cornor soybeans is much smaller than the amount of landsuitable for hybrid trees or grasses. In our judgment, fuelsfrom corn and soybeans will not have an appreciable ef-fect on the market for light-duty vehicle fuel.
Fertilizer UseFertilizer use for the fossil fuel cycles is small.7,10 The EIO-LCA model reports small amounts of fertilizer use by thesupplier industries to vehicle manufacture, service, andfixed costs. Assuming near-term technology productionmethods, farming of all of the biofuel crops requires sig-nificant amounts of fertilizer. Corn and herbaceous bio-mass farming require large amounts of nitrogen fertilizer—440 g/bushel and 9300 g/dry ton biomass, respectively.10
Woody biomass and soybeans require far less nitrogenfertilizer— about 930 g/dry ton and 130 g/bushel, respec-tively. Smaller amounts of phosphoric and potassium fer-tilizers are required. The use of the additional nitrogenfertilizer in production of the herbaceous biomass is amajor source of the higher GHG emis-sions of N2O from the C2H5OH producedfrom this feedstock. However, comparedwith corn, production of soybeans andbiomass has lower N2O and NOx emis-sions from nitrification and denitrifica-tion of nitrogen fertilizer. Wang reportsthat ~1.5% of the nitrogen in nitrogenfertilizer applied to corn fields is releasedas N2O to the atmosphere.10
Fuel ExpenditureWe estimate the expenditure on each fuelfor the conventional and alternative-fueled vehicles over their lifetimes. Weassume constant annual fuel use and con-stant fuel price, based on current andnear-term technologies. The entries inTable 5 are the estimated lifetime(225,300 km) fuel expenditure estimates
net of taxes, delivery, and retail markup. Since some ofthe fuel/engine combinations are more efficient on anenergy content basis than is gasoline in an SIII engine, thefuel prices are reported on an energy content basis. Thegasoline price estimates are based on the October 1999 re-finery gate price of $0.629/gal for conventional gasolineand the additional premium for CaRFG2.37 Since the priceof EC diesel is uncertain, our estimate reflects the Octo-ber 1999 refinery gate price of conventional diesel plus asmall premium.
Estimates of costs of production of C2H5OH from bio-mass range from $0.6 to $1.9/gal, with similar averagecosts for production from woody and herbaceous sources.33
Wooley et al. report a near-term production cost ofC2H5OH from woody biomass as $1.44/gal C2H5OH (withan uncertainty range of +$0.20/–$0.08); assuming the bestindustry technology, the cost is $1.16.29 In terms of gaso-line equivalent gallons, the costs are $1.73 and $1.39, re-spectively. Wooley et al. estimate that biomass feedstockconversion costs will fall to $0.76/gal by 2015.29 Based onthese reports, we assume identical near-term C2H5OH costfrom herbaceous and woody biomass, resulting in a costof $1.44/gal.
We calculate the price for corn C2H5OH using twoinformation sources. Both costs are reported in Table 5.The first value is based on C2H5OH industry price infor-mation; EIN Publishing Inc. reports an October 1999 sell-ing price for C2H5OH FOB their plant of $0.90/gal.38 Wecalculate the second value based on the current C2H5OHsubsidy for its use in gasohol and on the gasoline excisetax being reduced by $0.06/gal for C2H5OH-blended gaso-line. Therefore, this provides a $0.60/gal C2H5OH subsidy,since typically one part C2H5OH is blended with nine parts
Table 5. Near-term fuel prices and lifetime expenditure on fuel (net of taxes, delivery, and retail markup).
Fuel Lifetime Energy Pricea LifetimeRequired (GJ) (1999$/GJ) Expenditure (1999$)
Gasoline SIII 740 5.18 3836CaRFG2 SIII 740 5.85 4330CaRFG2 SIDI 650 5.85 3804EC Diesel CIDI 570 4.40 2510Biodiesel CIDI 570 13.88 7911C
2H
5OH SIDI Corn 595 11.22,b 15.34c 6679,b 9128c
C2H
5OH SIDI Herbaceous Biomass 595 17.96 10,686
C2H
5OH SIDI Woody Biomass 595 17.96 10,686
CNG 3000-psig SIII 720 2.31 1663CNG 3000-psig SIDI 640 2.31 1478
Note: Number of significant digits in the table is for calculation purposes and does not represent the accuracy of thefigures; aAssumes use of current technology for fossil fuel, corn C
2H
5OH, and biodiesel production and near-term
technology for herbaceous and woody biomass fuels; bPrice calculated based on C2H
5OH subsidy based on its use in
gasohol; cPrice calculated based on October 1999 C2H
5OH price [EIN 00].

MacLean, Lave, Lankey, and Joshi
1778 Journal of the Air & Waste Management Association Volume 50 October 2000
gasoline, resulting in a corn C2H5OH price of $1.23/gal.Prices of CNG are based on a wellhead price of $2.31/MCF (million standard cubic feet) for October 1999.37
Compared to the baseline, the only significant sav-ing is through the use of CNG or diesel. The high effi-ciency of the diesel lowers fuel cost; however, the price oflow sulfur, reformulated diesel, were it produced in sig-nificant volume, is very uncertain. The biofuels are con-siderably more expensive than the fossil fuel options. Theinfrastructure required and the associated cost of biofuelproduction is the major barrier to wider use. The refinerygate price for gasoline is less than half the productioncost of bioethanol.
CONCLUSIONSGasoline- and diesel-fueled automobiles have made im-portant progress in improving fuel economy and reduc-ing emissions. Near-term improvements of gasolinevehicles, combined with low-sulfur RFG, make it difficultfor any fuel to displace gasoline. A further difficulty is theneed to build a new infrastructure to produce and deliverthe alternative fuel. No alternative fuel is likely to be suc-cessful unless there are substantial petroleum price in-creases or more stringent regulations concerning emissionsand fuel economy standards, along with new regulationsconcerning GHG emissions.
CNG is the most attractive alternative fuel, since it iscurrently less expensive than gasoline and diesel and haslower emissions. However, onboard storage and vehiclerange issues, along with the need for new pipelines totransport the gas and new filling stations to sell it, poten-tially doom widespread adoption of CNG. Additionally,with a strong focus on GWP, a shift away from fossil fuelswould be necessary. And although diesel vehicles are at-tractive due to their high efficiency and fuel availability,the ability of these vehicles to meet strict emissions stan-dards even with low sulfur, reformulated fuel is uncertain.
Biofuels offer the benefits of lower GHG emissions,sustainability, and domestic fuel production. The herba-ceous and woody biomass-based C2H5OH options are moreattractive than producing the biofuels from food prod-ucts. The latter crops require additional maintenance, andfeasible fuel production requires a high demand for theirco-products. The C2H5OH from herbaceous or woody bio-mass could replace much of the gasoline required for thelight-duty fleet while supplying electricity as a co-prod-uct. While it is more expensive than gasoline, bioethanolwould be attractive if the price of gasoline doubled, if sig-nificant reductions in GHG emissions were required, orwith tightening of fuel economy regulations for gasolinevehicles.
Major uncertainties need to be resolved before firmpolicy conclusions can be drawn.
• What will be the efficiency of direct injectionengines after modifying them to meet strict emis-sions standards?
• Can diesel engines meet strict emissions stan-dards using low-sulfur reformulated fuel?
• What are near-term biomass yields, processingcosts, C2H5OH yields, and electricity credits?
• What would be the price of CNG if there were amajor increase in the demand for this fuel?
• What will happen to gasoline and diesel prices,both as a result of petroleum price changes andas a result of requiring low-sulfur, reformulatedfuels?
• What will future regulations require for tailpipeemissions, fuel economy, and GHG emissions?
ACKNOWLEDGMENTSThis research was made possible through support fromthe Center for Integrated Study of the Human Dimen-sions of Global Change. This center has been createdthrough a cooperative agreement between the NationalScience Foundation (SBR-9521914) and Carnegie MellonUniversity, and has been generously supported by grantsfrom the Electric Power Research Institute, the ExxonMobilCorporation, Texaco, Sloan Foundation, General Motors,American Petroleum Institute, and U.S. EnvironmentalProtection Agency. All views expressed herein are thoseof the authors.
REFERENCES1. MacLean, H.L.; Lave, L.B. A Life-Cycle Model of an Automobile;
Environ. Sci. Technol. 1998, 3 (7), 322A.2. Transportation Energy Databook, 18th ed.; Davis, S., Ed.; ORNL-6941;
Prepared for the U.S. Department of Energy by Oak Ridge NationalLaboratory: Oak Ridge, TN, 1998.
3. Lave, L.B.; MacLean, H.L. An Environmental-Economic Evaluationof Hybrid Electric Vehicles: The Toyota Prius; Transportation Res., sub-mitted for publication, 1999.
4. Dougher, R.S.; Hogarty, T.F. Octane Requirements of the Motor VehicleFleet and Gasoline Grade Sales; Research Study #083; R-48958; Ameri-can Petroleum Institute: Washington, DC, 1996.
5. Evaluation of Fuel-Cycle Emissions on a Reactivity Basis: Vol. 1–MainReport; Acurex Environmental Final Report; FR-96-114; Prepared forthe California Air Resources Board by Acurex Environmental Corp.:Mountain View, CA, 1996.
6. Evaluation of Fuel-Cycle Emissions on a Reactivity Basis: Vol. 2–Appendi-ces; Acurex Environmental Final Report; FR-96-114; Prepared for theCalifornia Air Resources Board by Acurex Environmental Corp.: Moun-tain View, CA, 1996.
7. Delucchi, M.A. A Revised Model of Emissions of Greenhouse Gases fromthe Use of Transportation Fuels and Electricity; UCD-ITS-RR-97-8; Insti-tute of Transportation Studies, University of California-Davis: Davis,CA, 1997.
8. Delucchi, M.A. Emissions of Greenhouse Gases from the Use of Transpor-tation Fuels and Electricity. Vol. 1: Main Text; ANL/ESD/TM-22; Centerfor Transportation Research, Argonne National Laboratory: Argonne,IL, 1991.
9. Kreucher, W.M. Ford Motor Company, Detroit, MI. Personal commu-nication, 1999.
10. Wang, M.Q. GREET 1.4 Transportation Fuel-Cycle Model; Center forTransportation Research, Argonne National Laboratory: Argonne, IL,1998.
11. Sullivan, J.L.; Williams, R.L.; Yester, S.; Cobas-Flores, E.; Chubbs, S.T.;Hentges, S.G.; Pomper, S.D. Life-Cycle Inventory of a Generic U.S.Family Sedan—Overview and Results USCAR AMP Project; SAE Tech-nical Paper 982160; Society of Automotive Engineers: Warrendale,PA, 1998.
MacLean, Lave, Lankey, and Joshi
Volume 50 October 2000 Journal of the Air & Waste Management Association 1779
12. Kreucher, W.M. Economic, Environmental and Energy Life-Cycle In-ventory of Automotive Fuels; SAE Technical Paper 982218; Society ofAutomotive Engineers: Warrendale, PA, 1998.
13. Schweimer, G.; Schuckert, M. Life Cycle Inventory of a Golf;Forschungsbericht Nr. K–EFVT 9604 V/5; VolkswagenKonzernforschung: Wolfsburg, Germany, 1996.
14. Sullivan, J.L.; Costic, M.M.; Han, W. Automotive Life Cycle Assess-ment Overview, Metrics, and Examples; SAE Technical Paper 980467;Society of Automotive Engineers: Warrendale, PA, 1998.
15. Sullivan, J.L.; Hu, J. Life Cycle Energy Analysis for Automobiles; SAETechnical Paper 951829; Society of Automotive Engineers: Warrendale,PA, 1995.
16. New ARCO Diesel Fuel Could Lead to Cleaner Bus, Truck, and CarEmissions; Press Release, ARCO, 1999.
17. MacLean, H.L.; Lave, L.B. Environmental Implications of AlternativeFueled Automobiles: Air Quality and Greenhouse Gas Tradeoffs;Environ. Sci. Technol. 2000, 34 (2), 225.
18. Hendrickson, C.; Horvath, A.; Joshi, S.; Lave, L. Economic Input-Output Models for Environmental Life Cycle Assessment; Environ.Sci. Technol. 1998, 3 (4), 184A.
19. Lave, L.B.; Cobas-Flores, E.; Hendrickson, C.T.; McMichael, F.C. Us-ing Input-Output Analysis to Estimate Economy-Wide Discharges;Environ. Sci. Technol. 1995, 29 (9), 420.
20. Cobas-Flores, E.; Hendrickson, C.T.; Lave, L.B.; McMichael, F.C. Eco-nomic Input/Output Analysis to Aid Life Cycle Assessment of Elec-tronics Products. In Proceedings of the 1995 IEEE Symposium onElectronics and the Environment; Institute of Electrical and ElectronicsEngineers: Piscataway, NJ, May 1995; p 273.
21. Wang, M.Q. Development and Use of the GREET Model to Estimate Fuel-Cycle Energy Use and Emissions of Various Transportation Technologiesand Fuels; ANL/ESD-31; Center for Transportation Research, ArgonneNational Laboratory: Argonne, IL, 1996.
22. Sheehan, J.; Camobreco, V.; Duffield, J.; Graboski, M.; Shapouri, H.Life-Cycle Inventory of Biodiesel and Petroleum Diesel for Use in an UrbanBus; Final Report; NREL/SR-580-24089; National Renewable EnergyLaboratory: Golden, CO, 1998.
23. Inventory of U.S. Greenhouse Gas Emissions and Sinks 1990–1997; U.S.Environmental Protection Agency, Office of Policy: Washington, DC,1999.
24. Cadle, S.H.; Groblicki, P.J.; Gorse, R.A.; Hood, J.; Korduba-Sawicky,D.; Sherman, M. A Dynamometer Study of Off-Cycle Exhaust Emis-sion—The Auto/Oil Air Quality Improvement Research Programs; SAETechnical Paper 971655; Society of Automotive Engineers: Warrendale,PA, 1997.
25. MacLean, H.L. Life-Cycle Models of Conventional and Alternative-Fueled Automobiles. Ph.D. Thesis, Carnegie Mellon University, Pitts-burgh, PA, 1998.
26. Federal Alternative Motor Fuels Programs Fifth Annual Report to Con-gress; DOE/GO-10096-240; U.S. Department of Energy, Departmentof Transportation Technologies, National Renewable Energy Labora-tory: Golden, CO, 1996.
27. Wang, M.; Saricks, C.; Santini, D. Effects of Fuel Ethanol Use on Fuel-Cycle Energy and Greenhouse Gas Emissions; ANL/ESD-38; Center forTransportation Research, Argonne National Laboratory: Argonne, IL,1999.
28. Wang, M.Q. Argonne National Laboratory, Argonne, IL. Personal com-munication, 1999.
29. Wooley, R.; Ruth, M.; Sheehan, J.; Ibsen, K.; Majdeski, H.; Galvez, A.Lignocellulosic Biomass to Ethanol Process Design and Economics Utiliz-ing Co-Current Dilute Acid Prehydrolysis and Enzymatic Hydrolysis Cur-rent and Futuristic Scenarios; NREL/TP-580-26157; National RenewableEnergy Laboratory: Golden, CO, July 1999.
30. Joshi, S. Alternative Fuel Cycles: Energy Use and Discharges; WorkingPaper; Green Design Initiative, Carnegie Mellon University: Pitts-burgh, PA, 1999.
31. Wald, M.L. U.S. Will Try to Replace Fossil Fuels with Farm Products.New York Times, August 12, 1999.
32. Statistical Abstract of the United States: 1996, 116th ed.; U.S. Bureau ofthe Census: Washington, DC, 1996; Tables No. 365, p 229 and 1019,p 632.
33. Lankey, R. Alternative Fuels from Biomass; Technical Report (and sup-porting spreadsheet); Green Design Initiative, Carnegie Mellon Uni-versity: Pittsburgh, PA, 1999.
34. Cadle, S.H.; Gorse, R.A.; Belian, T.C.; Lawrence, D.R. Real-World Ve-hicle Emissions: A Summary of the Eighth Coordinating ResearchCouncil On-Road Vehicle Emissions Workshop; J. Air & Waste Man-age. Assoc. 1999, 49, 242.
35. Ross, M.; Goodwin, M.; Watkins, T.; Wenzel, T.; Wang, M. Real-WorldEmissions from Conventional Passenger Cars; J. Air & Waste Manage.Assoc. 1998, 48, 502.
36. White House Web site, The Historic Kyoto Agreement: A Critical FirstStep in a Global Effort to Address Global Warming. Target and Time-table. www1.whitehouse.gov/CEQ/1B_CLIMA.html (accessed 1997).
37. U.S. Department of Energy. Energy Information Administration Website, Table 6. U.S. Refiner Motor Gasoline Prices by Grade and SalesType; Table 4. Selected National Average Natural Gas Prices, 1993-1999. www.eia.doe.gov/price.html (accessed March 20, 2000).
38. Ethanol Interest Grows as Gas Prices Increase; EIN Newsletter, EIN Pub-lishing: Alexandria, VA; March 14, 2000.
About the AuthorsHeather L. MacLean is an assistant professor in the De-partment of Civil Engineering, University of Toronto, Toronto,ON, Canada. Lester B. Lave is the Higgins Professor of Eco-nomics in the Graduate School of Industrial Administrationat Carnegie Mellon University, Pittsburgh, PA. RebeccaLankey is an AAAS Environmental Sciences and Engineer-ing Fellow at the U.S. Environmental Protection Agency,Washington, DC. Satish Joshi is an assistant professor inthe department of Agricultural Economics at Michigan StateUniversity, East Lansing, MI.
Copyright © 2022 FDOKUMEN