NITRIC OXIDE IN A DIESEL ENGINE: LASER-BASED DETECTION ...
168
N ITRIC OXIDE IN A DIESEL ENGINE : LASER - BASED DETECTION AND INTERPRETATION
-
Upload
khangminh22 -
Category
Documents
-
view
0 -
download
0
Transcript of NITRIC OXIDE IN A DIESEL ENGINE: LASER-BASED DETECTION ...
NITRIC OXIDE IN A DIESEL ENGINE:LASER-BASED DETECTION AND
INTERPRETATION

Nitric oxidein adieselengine:laser-baseddetectionandinterpretationGenieGertrudaMaria StoffelsThesisKatholiekeUniversiteitNijmegen- IllustratedWith references- With summaryin DutchISBN 90-9012846-8NUGI 812Subjectheadings:combustiondiagnostics/ dieselenginenitric oxide/ laser-spectroscopictechniques/ imaging
Cover: Imageby theauthor. Excitation/emissionspectrumrecordedfrom therunningengineat42�
aTDC(P=10bars,T=850K) showing thenitric oxidefluorescenceandinterferingoxygenfluorescence.Falsecolourrepresentationof figure2.14.
NITRIC OXIDE IN A DIESEL ENGINE:LASER-BASED DETECTION AND
INTERPRETATION
EEN WETENSCHAPPELIJKE PROEVE OP HET GEBIED VAN DE
NATUURWETENSCHAPPEN, WISKUNDE EN INFORMATICA
PROEFSCHRIFT
TER VERKRIJGING VAN DE GRAAD VAN DOCTOR
AAN DE KATHOLIEKE UNIVERSITEIT NIJMEGEN,VOLGENS BESLUIT VAN HET COLLEGE VAN DECANEN
IN HET OPENBAAR TE VERDEDIGEN
OP DINSDAG 14 SEPTEMBER 1999,DES NAMIDDAGS OM 1.30 UUR PRECIES
DOOR
GENIE GERTRUDA MARIA STOFFELS
GEBOREN OP 5 NOVEMBER 1969TE WIJCHEN
PROMOTOR : PROF. DR. J.J. TER MEULEN
CO-PROMOTERES : DR. N.J. DAM
DR. W.L. MEERTS
MANUSCRIPTCOMMISSIE : PROF. DR. G.J.M. MEIJER
PROF. DR. IR. R.S.G. BAERT
TECHNISCHE UNIVERSITEIT EINDHOVEN
PROF. DR. K. KOHSE-HOINGHAUS
UNIVERSITAT BIELEFELD, DUITSLAND
This work hasbeenmadepossibleby financialsupportof the ‘NederlandseOrganisatievoorToegepast-NatuurwetenschappelijkOnderzoek’(TNO) and the ‘Stichting TechnischeWeten-schappen’(STW), appliedsciencedivision of the ‘NederlandseOrganisatievoor Wetenschap-pelijk Onderzoek’(NWO) andthetechnologyprogrammeof theMinistry of EconomicAffairs.

Aanmijn ouders

Voorwoord
Mijn proefschriftis af!
Voor U liggen de resultatenvan mijn onderzoek.Zo’n vijf jaar geledenstartteik hiermeeinhetverbrandingslabop detweedeverdiepingvandeN2-vleugel.Ongeveertweejaar laterver-huisdeik naarhet nieuwediesellabin de Graalburchtwaarik, samenmet ‘mijn jongens’vanhetDieselteam,naarhartelustlawaaikonmaken.Hier zijn uiteindelijkdemeesteexperimentenuitgevoerddie in dit proefschriftbeschrevenzijn. Ik hebdit werk natuurlijkniet alleengedaan.Op dezeplaatswil ik danook iedereenbedankendie, op directeof indirectewijze, heeftmee-gewerktaanmijn onderzoekenproefschrift.
Omte beginnendeledenvanhetDieselteamende‘bewoners’vandeGraalburcht:
Mijn promotor, HansterMeulen,dieondanksdathij geenGraalburchtbewoneris, hetdieselon-derzoekop devoetvolgt enaltijd weerenthousiastis bij het zienvannieuweresultaten.Zijnkritischeblik op het werk heeftzeker bijgedragentot het welslagenvan het onderzoeken detotstandkomingvandit proefschrift.
Mijn, mij-altijd-pestendeco-promotor, UPD Nico Dam. Onzevelediscussiesover demeetre-sultatenen de interpretatiedaarvan,maarook over paddestoelenen anderezin en onzin, zijnvoor mij erg verhelderendgeweest;vooralals ik er weereensnietsvansnapte/begreep.Mededooral zijn commentaar, met‘plezier’ metrodepenin mijn conceptengekriebeld,is mijn proef-schriftgewordenzoalshetis. Zijn nevenfunctiealsspellingcheckervoorkwamdaternietoveralflourescencestaat.
Mijn andereco-promotor, tevensfinancieelmanageren netwerkbeheerdervan onzeafdeling,Leo Meerts,met niet aflatendebelangstellingvoor het dieselgebeuren.Zijn bezoekjesaandeGraalburcht,dediscussiesovervelerleionderwerpenendeBBQ in zijn achtertuinnahetafde-lingsuitstapjegavendewetenschapeensociaalkarakter.
Leander, helaasgeenbewonervandeGraalburchtof lid vanhetDieselteam,is onmisbaarge-weestin debeginfasevanmijn onderzoek.Hij heeftmetveelenthousiasmeeenoudetweetaktmotoruit eengrasmaaimachineopgelaptendezegrondigomgebouwdtot ‘mijn dieselmotor’.
Onzetechnicus,Charles,die in SolidWorksdenieuwecilinderkop vanmijn motorontwierpentelkenstrotsweershowdehoemooi je die in drie dimensieskon draaien.Hij boodaltijd weereenhelpendehandalsdemotorhetweereensnietdeedof alseenvensterkapotwas.
Erik-Jan,mijn opvolger, die meetin degroteDAF-motorendaarbijvijandig zijn optiekenuit-lijning veilig probeertte stellendooroveralbriefjesop te plakken met ‘Don’t touch, you willmeetEJ’. Het lawaaidatdeDAF-motormaaktvalt overigensnogwel meevergelekenmetdeherrievanderadiovanzijn rodeAlf a.
vii
Voorwoord
Rene,die alseerste‘niet-dieselmotor-OIO’ hetgeweld in deGraalburchtkwamversterkenmetzijn flowexperimenten.TheWall zal voor mij onlosmakelijk verbondenblijvenmetdeGraal-burcht.
Marianna,bondgenotein destrijd tegendemannen,bij wie ik altijd evenmijn hartkon luchten,zomaartussendoorof tijdenshethardlopen.Ooit makenwij nogeenhandleiding:‘How to dealwith Nico’ vooralle nieuwkomers.
DeDeensetop-Batavier Nicholas,deDuits/EngelsePenelope,toegelatentot devrouwenkamer,endeRoemeensePh.D.studenteAngelawaarmeedevelezinnigeenonzinnigediscussiesin deGraalburchteeninternationaalkarakterkregen.
Patrick voor hetuitstapjein deSRS-wereld,mijn eersteartikel, enSander, computerspecialistbij uitstek,voor het fantastischecomputerprogrammavoor de bewerking van de plaatjesvanmijn ‘dubbelpulsexperiment’,hoofdstuk3 vandit proefschrift,endeoverigestudentendie deGraalburchthebbenbevolkt, deroetonderzoekersArjen enNassia,pico-puls-producentFloris,O2-thermometerspecialistJeroen,taggingexpertTim envlam-foto-akoesticusJanMatthijs.
Tot slot de eerstedieselpromovendus,mijn voorgangerDr. TheoBrugmanuit wiensbrein denaamDieselteamis ontsproten.Hij brachtmij debeginselenvan laserdiagnostiekin motorenbij. Zijn grotewenswasdeeluit temakenvandecorona,ommij een‘makkelijke’ vraagtekun-nenstellen,maardit heefthij helaasnietmeerkunnendoen.Wel weethij nu alleantwoorden.
BuitendeGraalburcht,maarniet minderbelangrijk:
Alle medewerkersvan de instrumentmakerij, de glasinstrumentmakerij, de quick-service,dezelf-serviceen de afdelingenelektronica,grafischevormgeving en computer- en communica-tiezaken.
Also I wantto thankDaveRickeard,JamesBanisterandJill Duff from theEssoResearchCen-tre in Abingdon,UK, for their fruitful collaboration.
GerardMeijer, Rik BaertandKatharinaKohse-Hoinghausaregratefullyacknowledgedfor theircarefulproofreadingof themanuscript.
Voor deprettigesfeerop onzeafdeling,ook ‘buiten’ hetwerk, wil ik bedankenalle medewer-kersvan de ‘oude’ afdelingMolecuul- en Laserfysica,met nameelektronicaspecialistFransvan Rijn, Jorg, RobertKD, Jules,Adrian, Koen,Andre Ep, Marcel, Harold, Erko, Maarten,Richard,Rienk,Iwanenalle medewerkersenstudentenvandehuidigegroepenMolecuul-enLaserfysicaI enII enToegepasteFysica:detechniciChris,John,Cor enEugenedie altijd weleenoplossinghaddenvoor de problemenop elektronischen technischgebied,Magdaen Inevoor hunhulpbij administratievekwestiesenverderRogier, RobertS, Ivan,Frank,Bas,Maar-ten,Michiel, Karen,Martina,Jack,Bernard,Ralph,Dave,Gerard,Gert,Giel alscollega,Mike,Rick, Rudy, Deniz,HansP, Rob,Andrei,Andre vR, veiligheidsinspecteurFransH, Jos,Sacco,Tim, Stefan,Brenda,Edi, Sergio, Iulia, Luc-Jan,Rik, Moniqueenalle anderen.
Uiteraardzijn er ook buitendewetenschappelijke wereldveelpersonendie minstensevenbe-langrijk zijn geweest.Al mijn vrienden,kennissenenfamilieledenwil ik hierdanookbedankenvoor hunsteuneninteresse,ook al washetvaakmoeilijk te begrijpenwaarik meebezigwas.Eenaantalwil ik speciaalnoemen:
ParanimfCarolienvoor het steedsweer moetenaanhorenvan mijn gemopperover misluktemetingen,kapottelasersenhetvervelendeschrijven. Onzezwem-,wandel-,schaats-enfiets-
viii

Voorwoord
avondenhielpenaltijd weerdeellendeevente vergeten.
Mijn vriendenuit mijn studietijd:ParanimfKaren,ik hebveelvanhaargeleerdenbenblij datookzij haarpromotieonderzoekbij onsopdeafdelingkonbeginnen,enEric metjullie dochterMarit en natuurlijk Johanen verderPeter, Paul en Erno, ik hoopdat ook jullie proefschriftensnelaf zijn.
Restmij enkel nogmijn oudersen mijn broertjeste bedanken. Antoon,ver weg in SurinameenBasietsdichterbij in Tilburg, jullie zijn fijne broers.PapenMam, fijn dat ik altijd op julliehulp kanrekenenendater altijd eenveilige thuishavenis. En tot slot natuurlijk Giel voor veelmeerdanik hier ooit op kanschrijven.
Mensen,allemaalbedankt!
ix

Contents
1 Dieselcombustion: an intr oduction 11.1 The‘rational engine’ . . . . . . . . . . . . . . . . . . . . . . . . . . . . . . . 21.2 Generalintroduction . . . . . . . . . . . . . . . . . . . . . . . . . . . . . . . 31.3 Thecombustionprocessin a dieselengine . . . . . . . . . . . . . . . . . . . . 7
1.3.1 Combustionphases . . . . . . . . . . . . . . . . . . . . . . . . . . . 81.3.2 Establishedview of thedieselcombustionprocess . . . . . . . . . . . 101.3.3 New ideasaboutthedieselcombustionprocess . . . . . . . . . . . . . 121.3.4 Theestablishedview comparedto thenew ideas . . . . . . . . . . . . 14
1.4 Formationof nitric oxide . . . . . . . . . . . . . . . . . . . . . . . . . . . . . 161.4.1 ThermalNO (Zeldovich NO) . . . . . . . . . . . . . . . . . . . . . . 171.4.2 PromptNO (FenimoreNO) . . . . . . . . . . . . . . . . . . . . . . . 191.4.3 NO generatedvia nitrousoxide . . . . . . . . . . . . . . . . . . . . . 191.4.4 NO productionfrom fuel nitrogen . . . . . . . . . . . . . . . . . . . . 201.4.5 Formationof NO2 . . . . . . . . . . . . . . . . . . . . . . . . . . . . 20
1.5 Formationandoxidationof soot . . . . . . . . . . . . . . . . . . . . . . . . . 21
2 Laser-baseddiagnosticsin a dieselengine 232.1 Introduction . . . . . . . . . . . . . . . . . . . . . . . . . . . . . . . . . . . . 242.2 Experimentalsetup . . . . . . . . . . . . . . . . . . . . . . . . . . . . . . . . 27
2.2.1 Theengine . . . . . . . . . . . . . . . . . . . . . . . . . . . . . . . . 272.2.2 Enginecharacteristics . . . . . . . . . . . . . . . . . . . . . . . . . . 312.2.3 Opticalsetup . . . . . . . . . . . . . . . . . . . . . . . . . . . . . . . 34
2.3 Opticaldiagnostics . . . . . . . . . . . . . . . . . . . . . . . . . . . . . . . . 362.3.1 Spontaneouslight emission . . . . . . . . . . . . . . . . . . . . . . . 362.3.2 Laserinducedlight emission. . . . . . . . . . . . . . . . . . . . . . . 38
Quantificationof LIF . . . . . . . . . . . . . . . . . . . . . . . . . . . 392.3.3 Elasticlight scattering . . . . . . . . . . . . . . . . . . . . . . . . . . 44
2.4 Spontaneouslight emission. . . . . . . . . . . . . . . . . . . . . . . . . . . . 442.4.1 Dispersedflameemission . . . . . . . . . . . . . . . . . . . . . . . . 452.4.2 Flameemissionimages . . . . . . . . . . . . . . . . . . . . . . . . . 46
2.5 Spectroscopy in adieselengine. . . . . . . . . . . . . . . . . . . . . . . . . . 502.5.1 Nitric oxideandoxygen . . . . . . . . . . . . . . . . . . . . . . . . . 502.5.2 Dispersedfluorescencespectra. . . . . . . . . . . . . . . . . . . . . . 552.5.3 Saturation. . . . . . . . . . . . . . . . . . . . . . . . . . . . . . . . . 58
Appendix . . . . . . . . . . . . . . . . . . . . . . . . . . . . . . . . . . . . . . . . 59
xi
Contents
3 A method to assessthe local attenuation coefficientby Mie scattering using twocounterpropagatinglaser beams 613.1 Introduction . . . . . . . . . . . . . . . . . . . . . . . . . . . . . . . . . . . . 623.2 Theory. . . . . . . . . . . . . . . . . . . . . . . . . . . . . . . . . . . . . . . 64
3.2.1 Doubleimagemethod . . . . . . . . . . . . . . . . . . . . . . . . . . 643.2.2 Singleimagemethod . . . . . . . . . . . . . . . . . . . . . . . . . . 673.2.3 Transmission. . . . . . . . . . . . . . . . . . . . . . . . . . . . . . . 68
3.3 Experimentalsetup . . . . . . . . . . . . . . . . . . . . . . . . . . . . . . . . 693.3.1 Doubleimagemethod . . . . . . . . . . . . . . . . . . . . . . . . . . 693.3.2 Singleimagemethod . . . . . . . . . . . . . . . . . . . . . . . . . . 703.3.3 Transmission. . . . . . . . . . . . . . . . . . . . . . . . . . . . . . . 71
3.4 ResultsandDiscussion . . . . . . . . . . . . . . . . . . . . . . . . . . . . . . 713.4.1 Doubleimagemethod . . . . . . . . . . . . . . . . . . . . . . . . . . 713.4.2 Singleimagemethod . . . . . . . . . . . . . . . . . . . . . . . . . . . 753.4.3 Transmission. . . . . . . . . . . . . . . . . . . . . . . . . . . . . . . 773.4.4 Flameemission. . . . . . . . . . . . . . . . . . . . . . . . . . . . . . 80
3.5 Conclusion . . . . . . . . . . . . . . . . . . . . . . . . . . . . . . . . . . . . 81Appendix . . . . . . . . . . . . . . . . . . . . . . . . . . . . . . . . . . . . . . . . 81
4 Semi-quantitative nitric oxidedensitiesfr om spatially averageddispersedfluorescencespectra 834.1 Introduction . . . . . . . . . . . . . . . . . . . . . . . . . . . . . . . . . . . . 844.2 ExperimentalMethod . . . . . . . . . . . . . . . . . . . . . . . . . . . . . . . 86
4.2.1 Engine . . . . . . . . . . . . . . . . . . . . . . . . . . . . . . . . . . 864.2.2 Detailsof testfuels . . . . . . . . . . . . . . . . . . . . . . . . . . . . 874.2.3 Opticalsetup . . . . . . . . . . . . . . . . . . . . . . . . . . . . . . . 87
4.3 ResultsandDiscussion . . . . . . . . . . . . . . . . . . . . . . . . . . . . . . 874.3.1 Enginecharacteristics . . . . . . . . . . . . . . . . . . . . . . . . . . 874.3.2 Dispersedfluorescencespectra . . . . . . . . . . . . . . . . . . . . . 884.3.3 NO density . . . . . . . . . . . . . . . . . . . . . . . . . . . . . . . . 904.3.4 Effectof engineconditions. . . . . . . . . . . . . . . . . . . . . . . . 94
4.4 Conclusion . . . . . . . . . . . . . . . . . . . . . . . . . . . . . . . . . . . . 96Appendix . . . . . . . . . . . . . . . . . . . . . . . . . . . . . . . . . . . . . . . . 97
5 Nitric oxidedistrib utions in relation to temperature and chemicalcompositioninhomogeneities 1015.1 Introduction . . . . . . . . . . . . . . . . . . . . . . . . . . . . . . . . . . . . 1025.2 Theory . . . . . . . . . . . . . . . . . . . . . . . . . . . . . . . . . . . . . . 1035.3 Experimentalsetup . . . . . . . . . . . . . . . . . . . . . . . . . . . . . . . . 1065.4 ResultsandDiscussion . . . . . . . . . . . . . . . . . . . . . . . . . . . . . . 108
5.4.1 NO fluorescencedistributions . . . . . . . . . . . . . . . . . . . . . . 108Raw data . . . . . . . . . . . . . . . . . . . . . . . . . . . . . . . . . 108Laserintensity . . . . . . . . . . . . . . . . . . . . . . . . . . . . . . 110Temperature . . . . . . . . . . . . . . . . . . . . . . . . . . . . . . . 111
5.4.2 NO densitydistributions . . . . . . . . . . . . . . . . . . . . . . . . . 115
xii
Contents
Temperaturedistributions . . . . . . . . . . . . . . . . . . . . . . . . 116Collisionaldecayratedistributions. . . . . . . . . . . . . . . . . . . . 118Discussion . . . . . . . . . . . . . . . . . . . . . . . . . . . . . . . . 119
5.4.3 Reproducibility . . . . . . . . . . . . . . . . . . . . . . . . . . . . . . 1205.4.4 IntegratedNO density . . . . . . . . . . . . . . . . . . . . . . . . . . 121
5.5 Conclusion . . . . . . . . . . . . . . . . . . . . . . . . . . . . . . . . . . . . 125Appendix . . . . . . . . . . . . . . . . . . . . . . . . . . . . . . . . . . . . . . . . 126
6 Summary and outlook 1296.1 Summary . . . . . . . . . . . . . . . . . . . . . . . . . . . . . . . . . . . . . 1296.2 Outlook . . . . . . . . . . . . . . . . . . . . . . . . . . . . . . . . . . . . . . 133
References 139
Samenvatting 147
Curriculum Vitae 151
Publications 153
xiii

Chapter 1
Dieselcombustion: an intr oduction
Abstract
This introductorychapterstartswith a historicalnoteaboutthe inventionof thedieselengine,followedby a shortdescriptionof its operatingcycle. Theestablishedview of thecombustionprocessoccurringin thecombustionchamberof a dieselengine,aswell assomerecentmodi-ficationsaredescribed.Thenitric oxide(NO) andsootformedduringcombustionarethemostimportantpolluting componentsin the exhaustgasesof the dieselengine. A literature-basedoverview of thechemicalpathwaysinvolved in theNO formationanda possiblepathway forthe formationof sootaregiven. Finally, a shortpreview is provided of this thesis,in whichtheLaserInducedFluorescence(LIF) detectiontechniqueis appliedto observe NO moleculesinsidethecylinderof anoptically accessibletwo-strokedieselengine.
1
1 Dieselcombustion:anintroduction
1.1 The ‘rational engine’
RudolfDiesel(1858-1913)patentedanenginein 1892that,in hisview, wasnotjustanimprove-menton existing heatengines,but a machineof anentirelynew kind [1]. It wasanenginethatwasbuilt on scientific,rationalprinciplesandDieselfully expectedthat this ‘rational engine’would replacethesteamengine,usedfor heavy transportationthosedays,completely.
Many inventors,long beforeDiesel,weretrying to find a working fluid thatwould providethepossibilityto makeamoreefficientandsmallerengine,comparedto thecomplicatedsteamengine,the efficiency of which wasat mostonly 7%. The steamenginesusedwater, raisedto steam,asa working fluid to transferthe energy of the combustion,that took placeoutsidethe engine,to the cylinder, wherethe steamdid its work by expandingagainsta piston. Airwouldbeagoodcandidateto useasworkingfluid becauseit is readilyavailableandit containsoxygensothat thecombustioncouldtake placeinsidetheengine.Thefirst successfulinternalcombustionengine,burningcoalgaswith a thermalefficiency of 14%,wasintroducedin 1867.TheOtto engine,calledafter its inventorNicolausOtto, waswidely usedin passengercarsatthetimeDieselstartedthinkingaboutanew heatengine.
Theuniqueaspectof Diesel’sapproachwashisconviction thathisnew enginecouldrealizetheidealCarnotcycle,thatwasfirst describedin 1824by theFrenchpioneerin thermodynamicsNicolasCarnot. In his enginethepressureshouldriseonly dueto thecompressionof air andignition of injectedfuel shouldoccuronly asa resultof thehigh pressureandtemperature(inOttoenginesignition hasto beinitiated).After thisautoignitionthecombustionshouldcontinueandaddheatisothermallyin accordancewith theidealof Carnot.Dieselhadcalculatedthathisenginecouldhave anefficiency of 73%for almostall fuelsif thecombustionprocessoccurredisothermally. He publishedhis ideasin 1893 in a book entitled: Theoryand Constructionof a Rational Heat Engineto Take Place of the SteamEngineand of All PresentlyKnownCombustionEngines.
However, soonafterhisfirst experimentsin 1893,Dieselfoundout thataninternalcombus-tion enginecannever realizetheCarnotcycle becausetoo largeamountsof air arerequiredtokeepthecombustionisothermal.Nevertheless,in 1897,after four yearsof strugglingwith therequiredhigh pressuresandthe problemof how to inject fuel into the compressedair, Dieselpresentedhis first engine.It wasa one-cylinder enginewith a thermalefficiency of 26%andamaximumcompressionof 30 bars,which wasa spectacularresult. During the next yearstheenginewasfurtherdevelopedwith a largestepforwardin 1920whenthefuel-injectionsystemswereperfected.
Thus, the dieselengineas it is today is quite different from the original Carnotengineas it wasproposedby Diesel. However, the essentialfeaturesof the combustionenginearestill the same:It is a high-compressionenginein which fuel is injectedin air neartheendofthe compressionstroke and is ignited by the heatof the compression.The inventionof thedieselengineis a ratheruniquestory in thehistoryof technology, asit startedwith an ideainwhich puresciencewasappliedto engineering.Although the scientific ideal of the inventorcouldnot berealised,the inventionof thedieselenginehascauseda revolution in heavy roadtransportationin thelastcentury.
2
1.2 Generalintroduction
1.2 General intr oduction
In internalcombustionengines,like Otto engines(alsocalledspark-ignition(SI) or gasolineengines)anddieselengines(alsocalledcompression-ignition(CI) engines),combustiontakesplaceinsidethe engineafter fuel is injectedin thecombustionchamber. Fuel canbe injectedeitherdirectly into thecombustionchamber(Direct Injection(DI)) or into a prechamber, sepa-ratedfromthemaincombustionchamber(IndirectInjection(IDI)). In thelattercasecombustionstartsin theprechamberanddueto theresultingpressureriseburninggasesandfuel aredriveninto themaincombustionchamber. An Ottoengineusesasparkplugto initiate thecombustion,whereasin adieselengineignition occursasa resultof thehighpressureandtemperature.
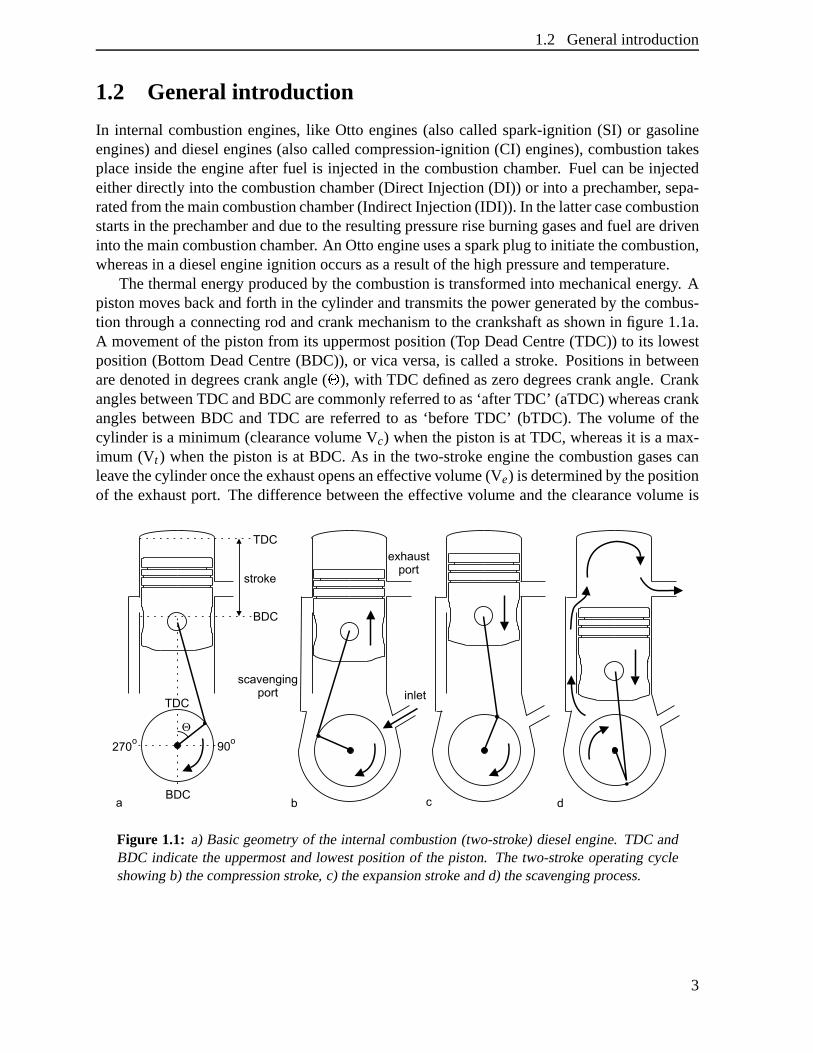
Thethermalenergy producedby thecombustionis transformedinto mechanicalenergy. Apistonmovesbackandforth in thecylinder andtransmitsthepower generatedby thecombus-tion througha connectingrod andcrankmechanismto thecrankshaftasshown in figure1.1a.A movementof thepistonfrom its uppermostposition(Top DeadCentre(TDC)) to its lowestposition(Bottom DeadCentre(BDC)), or vica versa,is calleda stroke. Positionsin betweenaredenotedin degreescrankangle(
�), with TDC definedaszerodegreescrankangle.Crank
anglesbetweenTDC andBDC arecommonlyreferredto as‘after TDC’ (aTDC)whereascrankanglesbetweenBDC andTDC are referredto as ‘before TDC’ (bTDC). The volumeof thecylinder is a minimum(clearancevolumeVc) whenthepistonis at TDC, whereasit is a max-imum (Vt ) whenthepistonis at BDC. As in the two-stroke enginethe combustiongasescanleavethecylinderoncetheexhaustopensaneffectivevolume(Ve) is determinedby thepositionof theexhaustport. Thedifferencebetweentheeffective volumeandtheclearancevolumeis
Figure 1.1: a) Basicgeometryof the internalcombustion(two-stroke) dieselengine.TDC andBDC indicatetheuppermostandlowestpositionof the piston. The two-stroke operatingcycleshowing b) thecompressionstroke,c) theexpansionstroke andd) thescavengingprocess.
3
1 Dieselcombustion:anintroduction
calledthedisplacedor sweptvolume(Vd)1. Onecompletecombustioncyclecomprises,besidesthe fuel injectionandcombustion,alsotherefreshmentof thecylinder contents(burnedgaseshave to leave thecylinder, while freshair hasto go in).
The total combustioncycle can take placeduring two or four strokes. The first engineswere four-stroke enginesin which eachcylinder requiresfour strokesof the piston (i.e. tworevolutionsof thecrankshaft)for acompleteprocessthatproducesonepowerstroke. In short,thecycle startswith an intake stroke in which the pistonmovesdown andfreshair is let intothecylinder throughaninlet valve thatclosesjust after thepistonhaspassedBDC. Followingis a compressionstroke in which thepistonmovesup,compressingtheair in thecylinder. Justbeforethepistonis at TDC fuel is injectedandautoignitioninitiatesthe combustionprocess.In thesubsequentexpansionstroke,thehigh-pressurehigh-temperaturecombustiongasesdrivethepistondown again.As in thisstrokethepistondoesits work by forcingthecrankto rotate,itis oftencalledthepowerstroke. WhenthepistonreachesBDC theexhaustvalveopensandthecombustiongasescanleave thecylinderwhenthepiston,in theexhauststroke,movesupagainto TDC. Theinlet valveopenswhenthepistonapproachesTDC, andjust afterTDC, whentheexhaustvalve is closed,thecyclestartsagain.
To get a higheroutputfrom a given enginesizethe two-stroke enginewasdeveloped. Inaddition, it hasa simplerconstructionasthe inlet andexhaustvalves,on top of the cylinder,arereplacedby an exhaustport in the cylinder wall anda scavengingport that is connectedwith the crankcase(seefigure 1.1). Theseports,which are locatednearBDC andof whichtheexhaustport is placeda bit higherthanthescavengingport, areopenedandclosedby themotion of the piston. This enginerequiresonly two strokes(i.e. onerevolution of the crankshaft) to produceonepower stroke. A compressionstroke startswhen the pistonmovesup,closingthescavengingandexhaustports,followedby a compressionof theair in thecylinder(figure 1.1b). During this stroke alsofreshair is drawn into the crankcasethroughan inlet.Similar to the four-stroke engine,combustion occursif the piston approachesTDC and thepiston movesdown in an expansionor power stroke (figure 1.1c). Oncethe piston reachestheexhaustport thecombustiongasesstartto leave thecylinder. Whenthescavengingport isopenedaswell, the freshair, compressedin thecrankcase,flows into thecylinder anddrivesout thecombustiongases(scavenging,figure1.1c).
Although passengercarsareusuallypoweredby an Otto enginethe dieselengineis usedworld wide for heavy transportation.It offerssignificantfuel economyadvantagesover otherpower plantsusedfor roadtransportation,becauseof its high thermalefficiency (up to 40%;for anOtto engineit is about30%)andbecausetheheavy oil it consumesis relatively cheap.Comparedto Ottoengines,dieselengineshave low carbonmonoxide(CO) emissions,but, asaresultof thehigh pressureandtemperaturerequiredfor theautoignitionof dieselcombustion,theemissionof nitric oxides(NOx) is higher. In addition,thelargehydrocarbons(HC) presentin thedieselfuel arepartly transformedinto sootparticles.
SootparticlesandNOx arethemostimportantpollutingcomponentsin theexhaustgasesofadieselengine.NOx participatesin chainreactionsthatremoveozonefrom thestratosphere,re-
1Thesevolumesareimportantfor thedeterminationof thecompressionratio ( � ) of theenginedefinedas[2]
��� effectivecylindervolume
minimumcylindervolume� Vd � Vc
Vc� Ve
Vc �
4
1.2 Generalintroduction
1990 1995 2000 20050
2
4
6
8
10
12
14
16
x10
Em
issi
ons
(g/k
Wh)
Time (year)
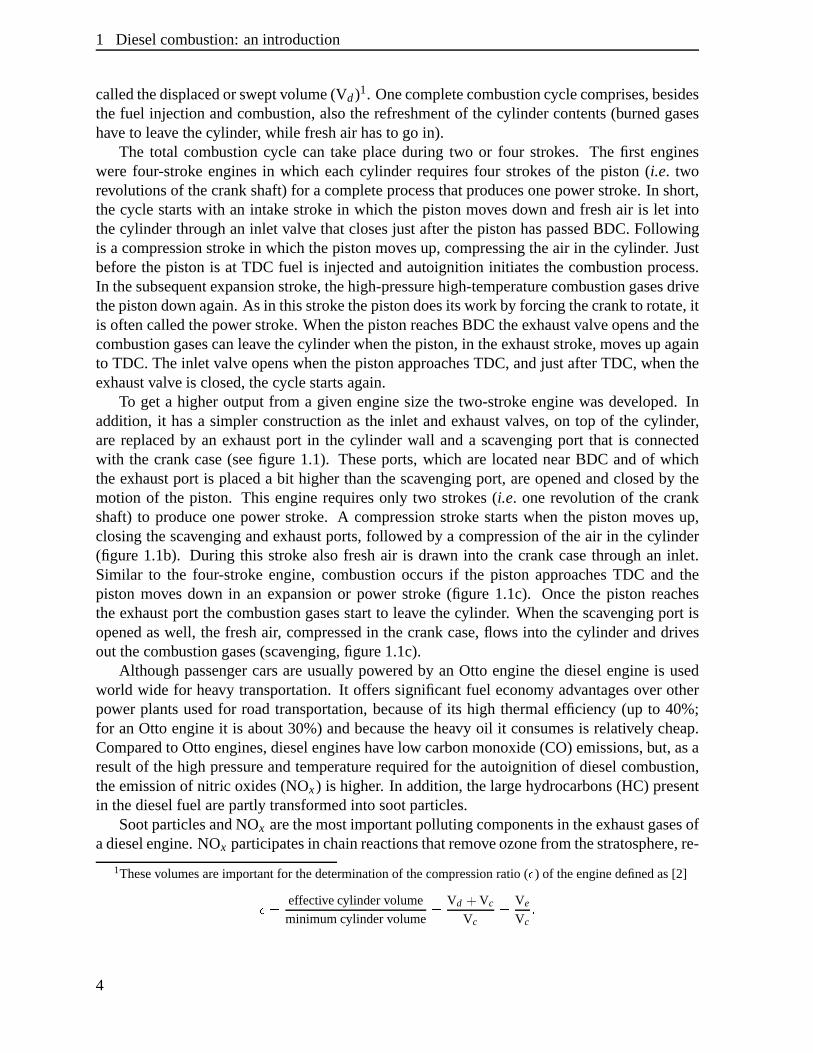
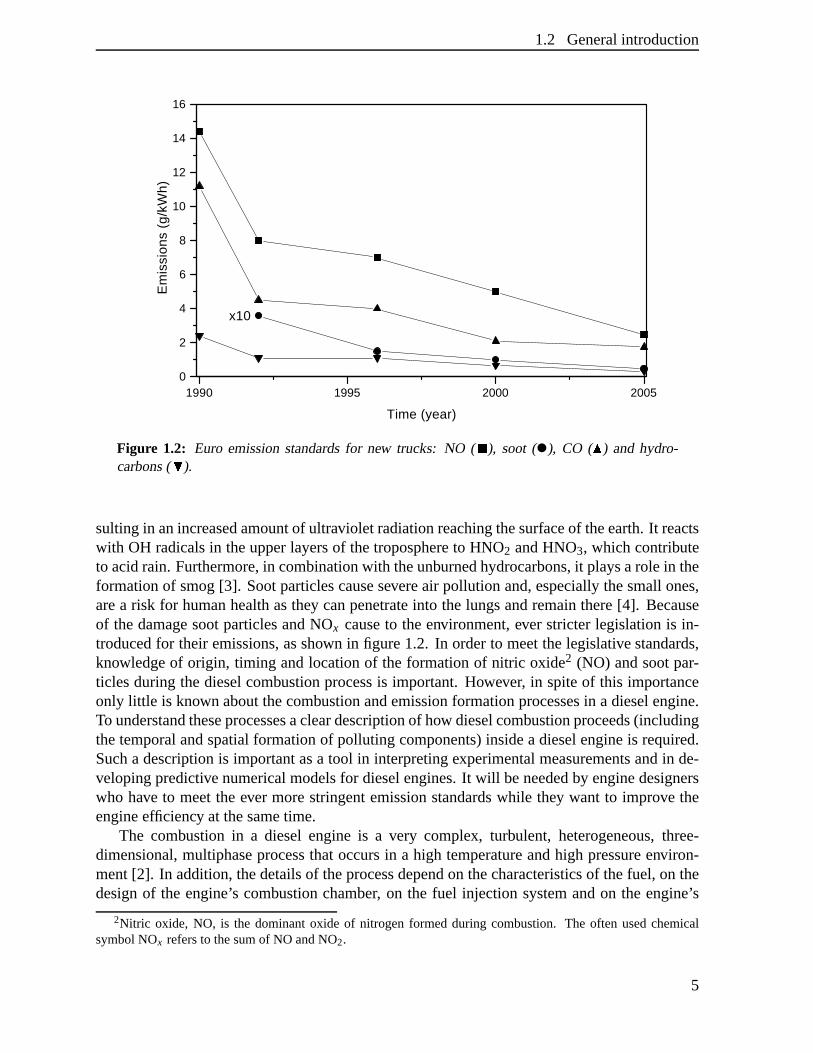
Figure 1.2: Euro emissionstandardsfor new trucks: NO ( � ), soot ( ), CO ( � ) and hydro-carbons( ).
sultingin anincreasedamountof ultraviolet radiationreachingthesurfaceof theearth.It reactswith OH radicalsin theupperlayersof thetroposphereto HNO2 andHNO3, which contributeto acidrain. Furthermore,in combinationwith theunburnedhydrocarbons,it playsarole in theformationof smog[3]. Sootparticlescausesevereair pollution and,especiallythesmallones,area risk for humanhealthasthey canpenetrateinto the lungsandremainthere[4]. Becauseof thedamagesootparticlesandNOx causeto theenvironment,ever stricterlegislationis in-troducedfor their emissions,asshown in figure1.2. In orderto meetthelegislativestandards,knowledgeof origin, timing andlocationof the formationof nitric oxide2 (NO) andsootpar-ticlesduring thedieselcombustionprocessis important.However, in spiteof this importanceonly little is known aboutthecombustionandemissionformationprocessesin a dieselengine.To understandtheseprocessesacleardescriptionof how dieselcombustionproceeds(includingthetemporalandspatialformationof polluting components)insidea dieselengineis required.Sucha descriptionis importantasa tool in interpretingexperimentalmeasurementsandin de-velopingpredictivenumericalmodelsfor dieselengines.It will beneededby enginedesignerswho have to meetthe ever morestringentemissionstandardswhile they want to improve theengineefficiency at thesametime.
The combustion in a diesel engineis a very complex, turbulent, heterogeneous,three-dimensional,multiphaseprocessthatoccursin a high temperatureandhigh pressureenviron-ment[2]. In addition,thedetailsof theprocessdependon thecharacteristicsof thefuel, on thedesignof the engine’s combustionchamber, on the fuel injection systemandon the engine’s
2Nitric oxide, NO, is the dominantoxide of nitrogenformedduring combustion. The often usedchemicalsymbolNOx refersto thesumof NO andNO2.
5
1 Dieselcombustion:anintroduction
operatingconditions.To obtaininformationaboutthewaythecombustionandtheformationofsootparticlesandNO proceed,measurementshave to beperformedunderrealisticconditions,preferablyin a runningdieselengine.Dueto therecentdevelopmentof advancedlaser-baseddiagnostics,detailedmeasurementsof the physicalandchemicalprocessesoccurringduringdieselcombustioninsidethecombustionchamberof a runningdieselenginearenow possible.
Theobjectiveof theexperimentspresentedin thecurrentwork is thedevelopmentof alaser-basedmeasurementtechniquefor semi-quantitativedeterminationof theNO density, with bothspatialandtemporalresolution,duringthecombustionin a dieselengine.Ultimately, thetech-niquedevelopedduring this projectshouldbe useful for diagnosticsof realistic,commercialdieselengines.Therefore,the operatingconditionsof the researchengineusedfor this workhavebeenkeptasrealisticaspossible,implying mainly that i) standard,commercialdieselfuelis usedand ii ) theengineis operatedsteadilyrunning. As mostimportanttool in this methodtheLaserInducedFluorescence(LIF) detectiontechniqueis usedto observeNO moleculesin-sidethe combustionchamberof an optically accessibledieselengine. In short this techniqueinvolveselectronicexcitationof NO moleculesby laserradiationfollowedby detectionof theensuingfluorescence.The intensity of the fluorescenceis a measurefor the densityof NOmolecules.However, althoughthefluorescenceintensityis proportionalto theNO density, theproportionalityconstantincludesseveralspectroscopicandexperimentalfactors.Evaluationofthesefactorsresultsin expressionsthatdependonthelocalconditionsin thecombustioncham-ber (i.e. pressure,temperature,laserintensity, gasmixture), which in generalarenot known.Therefore,additionalexperimentshave to beperformedto obtaintheunknown quantitiesandadetailedprocessingof theobservedNO LIF signalis requiredbeforeit canbeinterpretedasaNO density.
This generalintroductionis followedby a descriptionof theestablishedview of thedieselcombustionprocessoccurringin a dieselengineandsomerecentmodifications.Includedarethe importantaspectsconcerningtheformationof NO andsoot. At theendof this chapterthepathwaysimportantfor thenitric oxideformationaresummarised,aswell asthoseinvolvedintheformationof sootparticles.
Chapter2 startswith a shortoverview of several laser-baseddiagnostictechniquesthatarefrequentlyusedto studycombustionprocesses,andsomeapplicationsto dieselengines,asre-portedin literature,aregiven. It includesa short review of previous NO LIF measurementsthatwereperformedon optically accessibledieselengines.This is followedby a detailedde-scriptionof theopticallyaccessibledieselenginethecurrentexperimentsareperformedon,theenginecharacteristics,andanoverview of thedifferentopticalsetupsapplied.A moredetaileddescriptionof the LIF techniqueand the otheroptical techniquesusedin the experimentsisgiven.Theflameemission,dispersedin its differentwavelengthcomponents,aswell asimagesshowing theflamedevelopmentduringthecombustionarepresented.Finally, ananalysisof thelaserspectroscopy of NO in a dieselengineis given,with anemphasison its interferencewithoxygen(O2).
In theexperimentdescribedin chapter3 amethodis developedto reconstructthelocal laserintensityin thecombustionchamberof therunningenginefrom adistributionof theelasticallyscatteredlaserradiation.Thismethodis validatedby comparingits resultsto anexactmethodinwhich thelocal laserintensityis reconstructedby makinguseof two elasticscatteringimages,recordedfrom two laserbeamswhich traversethe enginein oppositedirection. Additionally,thetotal transmissionof thelaserradiationthroughthecombustionchamberof thefiring engine
6
1.3 Thecombustionprocessin a dieselengine
is derivedfrom thesedistributions.Theresultsof thefirst NO LIF experimentsaregivenin chapter4 in which dispersedfluo-
rescencespectraof NO arepresented.They show NO fluorescencethroughoutthewholecom-bustionstroke startingaroundTDC. Theintensityof theNO dispersionpeaksof thesespectraprovides information about the spatially averagedNO density, presentin the probevolumewithin thecylinder. The factors,all dependingon the in-cylinder conditions,thatarerequiredto translatetheobservedfluorescenceintensityinto asemi-quantitativeNO densityarederived.Using theseprocessingfactorsrelative NO densitiesasa functionof crankanglefor differentengineconditions(compressionratio, loadandfuel) areobtained.Furthermore,theNO disper-sion spectragive informationaboutthe wavelengthsof the fluorescencebandsof NO andO2
obtainedfrom therunningengine.Fromthesespectraa fluorescencebandof NO freefrom O2
fluorescence,thatcanbeusedto obtainspatiallyresolvedNO distributions,is determined.NO LIF distributionsmeasuredthrougha narrow-bandreflectionfilter to eliminateO2 flu-
orescenceare the subjectof chapter5. To translatethem into semi-quantitative NO densitydistributionsthe positiondependenceof the processingfactorsis derived. The observed NOdensitydistributionsare discussedwith an emphasison the assumptionsthat are madewithrespectto theuniformity of thetemperatureandgasmixtureto obtainthedistributions.
Finally, asummaryof themostimportantresultsandtheassumptionsmadein theinterpre-tation of the NO fluorescenceyield is given in chapter6. In addition,an outlook is given inwhich it is discussedto what extent the developedmethodmeetsthe objectivesof this study,andhow it canbeimproved.
1.3 The combustion processin a dieselengine
The total combustionprocessinsidea dieselengineinvolvesboth premixedanddiffusion re-actionzones.Initially a premixedburn occursbecausesomefuel andair have mixedalreadybeforeautoignitionoccurs.This is followedby amixing controlledburnwhich is dominatedbydiffusionburning,but cancontainsomepremixedburn aswell. A division of thecombustionprocessinto four separatephasescharacterisedby combustiontype,basedontheconceptof theheatreleaserate,is describedbelow in section1.3.1.
Sucha division of the total combustionprocesswill not give anansweron how thedieselcombustionprocessstartsanddevelopsandhow polluting componentsareformed. To give agooddescriptionof thecomplex processesoccurringduringdieselcombustion,measurementshave to beperformedunderrealisticdieselengineconditions.But, prior to therelatively recentdevelopmentof advancedlasertechniques,it wasnot possibleto performdetailedmeasure-mentson thecombustionprocessesoccurringwithin thereactingdieselfuel jet. Someinforma-tion aboutthe fuel jet penetrationandspreadof thecombustionzonescouldbeobtainedfromrecordingthenaturalflameemission.However, thespatialresolutionis limited becausethesig-nal is integratedalongtheline of sightandtheinformationis notspeciesspecificor quantitative.Samplingprobescouldprovidequantitativespeciesspecificdatabut they areperturbing,havealimited temporalresolutionandprovide only informationaboutonespecificsmallvolume.Asdetailedinformationaboutthedieselcombustionprocessis limited, thedescriptionof thedieselcombustionprocessinitially wasderivedfrom studiesof spraycombustionin furnacesandgasturbines[5, 6]. In this descriptionit wasassumedthat the quasi-steadyportion of the diesel
7
1 Dieselcombustion:anintroduction
combustionprocess,after the premixed burn, behavessimilar to the otherspraycombustionprocesses.Thisview (the‘old view’) of thedieselcombustionprocessis givenin section1.3.2.
The developmentof advancedlaser-baseddiagnosticsallowed to study the processesoc-curring insidea reactingfuel jet. Suchexperimentshave provided a lot of new informationon thedieselcombustionandpollutantformationprocesses,thatis partly in contradictionwiththetraditionaldescriptionof dieselcombustion.Thefirst experimentsindicatingthatthedieselcombustionprocessis differentfrom the old view wereexperimentscombiningLII andelas-tic scatteringexperimentsthatshowedthatsootwaspresentalsoat positionswhereit wasnotexpectedaccordingto the old view and that no fuel dropletswerepresentoutsidethe liquidfuel jet [7]. A lot of theserecentresultswhereacquiredby Dec andco-workersusingsev-eralplanarimagingandnaturalflameemissiondiagnosticsin anoptically accessibleDI dieselengineof the heavy duty sizeclassrunningon a low-sootingfuel. Dec hascombinedthe re-sultsof thesedata,including liquid-phasefuel distributions[8, 9], quantitative vapour-fuel/airmixture images[9, 10], poly-aromatichydrocarbon(PAH) distribution images,soot concen-trations[11–14], sootparticlesizedistributions[13,14], imagesof the diffusion flamestruc-ture[15], andnaturalchemiluminescenceimagesof theautoignition[13] to arriveat a detailedmodifiedview of thetemporalandspatialevolutionof a reactingdieselfuel jet [16]. Thisalter-nativeview, which describesmainly thebeginningof thecombustionin muchmoredetail thanthe old view, is summarisedin section1.3.3,includingsomemorerecentresultswith respectto theNO formation[17] andtheautoignition[18]. It should,however, benotedthat thusfarthemodelis derivedfrom resultsthatwereobtainedfrom oneparticularengineoperatedat onetypical conditionon a speciallow-sootingfuel. The larger amountsof sootproducedby theuseof a commercialdieselfuel reducedtheoptical transparency of this enginerapidly, whichprecludedto obtainin-cylinder measurements.In addition,astill now insufficient informationis availableaboutthelaterpartof thecombustion,themodelonly givesa full descriptionof thefirst partof thecombustionprocess(the laterpart canonly beestimated).Also, theeffectsofswirl andwall interactionsareneglected.
1.3.1 Combustion phases
Basedon the heatreleaseratedifferentphases,characterisedby burning type, canbe distin-guishedin thetotaldieselcombustionprocessoccurringin aDI dieselengine.Theheatreleaserateis definedastherateatwhichthechemicalenergy of thefuel is releasedby thecombustionprocess.It canbeobtainedfrom thein-cylinderpressureasa functionof crankangleby calcu-lationsbasedon thefirst law of thermodynamicsanduseof theidealgaslaw [2]. Four phases,eachcontrolledby differentphysicalor chemicalprocesses,canbe distinguishedin the heatreleaserate.Therelative importanceof eachphasedependsonthecombustionsystemusedandtheengineoperatingconditions,but they arecommonto all dieselengines.
Typical in-cylinderpressureandheatreleaseratecurvesfor thecompressionandexpansionstrokeof adirectinjectiondieselenginearegivenin figure1.3.During thecompressionstroke,startingat the momentthe exhaustand inlet ports (or valves) close,air is compressedto apressureof about40 barsanda temperatureof about850K. (Thesearethevaluesthatwouldbe reachedif no combustionwould occur.) Towardsthe endof the compressionstroke fuelis injectedinto the cylinder (Start Of Injection (SOI) in figure 1.3). The fuel is injectedathigh pressurethroughoneor moresmall holesin the injector tip of the fuel injectionsystem,
8
1.3 Thecombustionprocessin a dieselengine
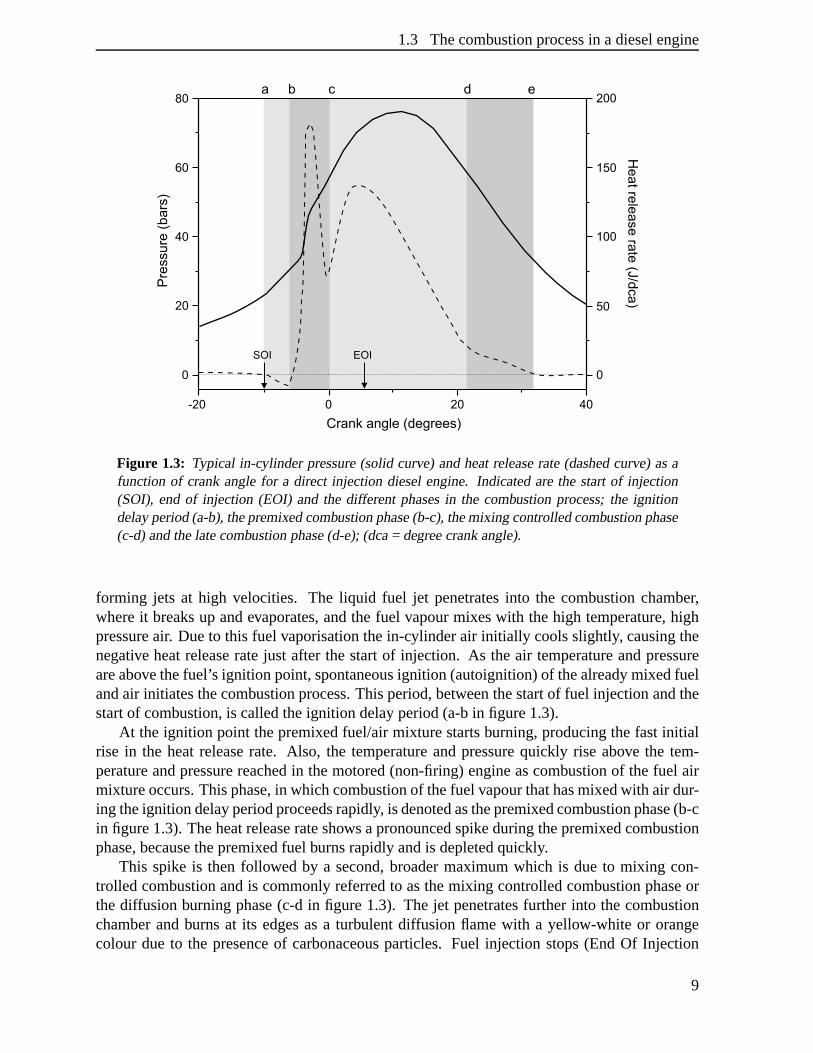
Figure 1.3: Typical in-cylinder pressure(solid curve) andheatreleaserate(dashedcurve) asafunction of crankanglefor a direct injection dieselengine. Indicatedarethe startof injection(SOI), endof injection (EOI) and the differentphasesin the combustion process;the ignitiondelayperiod(a-b),thepremixedcombustionphase(b-c),themixing controlledcombustionphase(c-d) andthelatecombustionphase(d-e);(dca= degreecrankangle).
forming jets at high velocities. The liquid fuel jet penetratesinto the combustion chamber,whereit breaksup andevaporates,andthe fuel vapourmixeswith thehigh temperature,highpressureair. Dueto this fuel vaporisationthein-cylinderair initially coolsslightly, causingthenegative heatreleaseratejust after the startof injection. As the air temperatureandpressureareabovethefuel’s ignition point,spontaneousignition (autoignition)of thealreadymixedfuelandair initiatesthecombustionprocess.Thisperiod,betweenthestartof fuel injectionandthestartof combustion,is calledtheignition delayperiod(a-bin figure1.3).
At the ignition point thepremixedfuel/air mixturestartsburning,producingthefastinitialrise in the heatreleaserate. Also, the temperatureandpressurequickly rise above the tem-peratureandpressurereachedin themotored(non-firing)engineascombustionof thefuel airmixtureoccurs.Thisphase,in whichcombustionof thefuel vapourthathasmixedwith air dur-ing theignition delayperiodproceedsrapidly, is denotedasthepremixedcombustionphase(b-cin figure1.3).Theheatreleaserateshowsapronouncedspikeduringthepremixedcombustionphase,becausethepremixedfuel burnsrapidlyandis depletedquickly.
This spike is then followed by a second,broadermaximumwhich is dueto mixing con-trolled combustionandis commonlyreferredto asthemixing controlledcombustionphaseorthediffusionburningphase(c-d in figure1.3). The jet penetratesfurther into the combustionchamberandburnsat its edgesasa turbulent diffusion flamewith a yellow-white or orangecolour dueto the presenceof carbonaceousparticles. Fuel injection stops(End Of Injection
9
1 Dieselcombustion:anintroduction
(EOI) in figure1.3),but mixing of theair in thecylinderwith burningandalreadyburnedgasescontinuesthroughoutthe combustionandexpansionprocesses.This period, lastingabout20degreescrankangle,is themainheatreleaseperiod.
Normally80%of thetotal fuel energy is releasedin themixing controlledandthepremixedcombustion phase. The residualfuel energy will be releasedat a lower rateduring the latecombustionphase(d-ein figure1.3).
As theexhaustopensthe in-cylinder pressuredropsandcombustiongasescanflow out ofthecylinder. Oncethe inlet opens,air flows into thecylinder andtheburnedgases,displacedby this freshair, continueto flow out of theexhaustport (so-calledscavenging).
1.3.2 Establishedview of the dieselcombustion process
Thebasicconceptsof theestablishedview of dieselspraycombustionaregivenin a paperbyFaeth[6]. Uponinjectiontheliquid fuel jet penetratesinto thehigh pressure,high temperatureenvironmentof thecombustionchamber. Themodelenvisagesthedieseljet ashaving a cold,fuel-rich core,surroundedby a mixture that containsfuel dropletsandvapourisedfuel, witha decreasingamountof fuel from the centreof the sprayto the edge. Autoignition and theinitial premixedburn areexpectedto occurtowardstheedgeof thesprayin regionswheretheequivalenceratio3 rangesfrom nearstoichiometricto up to about1.5 [2,19]. Subsequently, thediffusionflamedevelopsrapidly throughoutthemixturein theclose-to-stoichiometricregions.
It is, however, notspecifiedif thecombustionoccursin many smalldiffusionflamesaroundindividual fuel dropletsor in onesingle,largediffusionflamesheathsurroundingtheperipheryof thespray, beingfed by thefuel vapourfrom many droplets.In a paperby Chui et al. [20] asheath-typecombustionis suggestedfor dieseldiffusionflames,but this view is not generallyaccepted.TheBoschAutomotiveHandbook[21], for example,suggeststhatdieselcombustionstartsin regionsaroundindividualdropletsthatcontainaflammablemixture.
Sincethis descriptiondoesnot dealdirectly with the nitric oxide andsootformationpro-cessesduring dieselcombustionsomepossibilitiesto accountfor this are presented,mainlybasedon theoreticalideasbut in combinationwith observedfeatures.Theregionswheresootis expectedto form arederived from theknowledgethat sootformationresultsfrom fuel thatis brokenup into sootprecursorsat temperaturesabove about1300K in combinationwith theassumptionthat sootforms undernearlystoichiometricconditions[2]. That is, for sootto beformedmixing of thefuel with thehot in-cylinderair only is notsufficientandheatingfrom thecombustionis requiredaswell. Therefore,sootparticlesareassumedto form in regionswherethetemperatureis sufficiently increasedby thecombustionandthemixture is nearlystoichio-metric. At thefuel-rich sideof thediffusionflametheseconditionsaremet. Therefore,sootis
3The fuel/air equivalenceratio ��� is definedasthe ratio of the actualfuel/air ratio F � A actual andthe stoi-chiometricfuel/air ratio F � A stoich (at stoichiometricconditionsthereis just enoughoxygenfor conversionof allfuel into completelyoxidisedproducts)as[2]
��� F � A actual
F � A stoich �in which thefuel/air ratio is givenby F � A �����mfuel ���mair with �mfuel and �mair the fuel andair massflow rates,respectively. This impliesfor stoichiometricmixtures ��� 1, for fuel-rich mixtures,in which thereis insufficientoxygento oxidiseall thefuel, ��� 1, andfor fuel-leanmixtures,in which excessair is present,��� 1.
10

1.3 Thecombustionprocessin a dieselengine
Diffusion FlameLiquid Fuel
Vapor Fueland Droplets�
Soot Concentration�Low
�High�
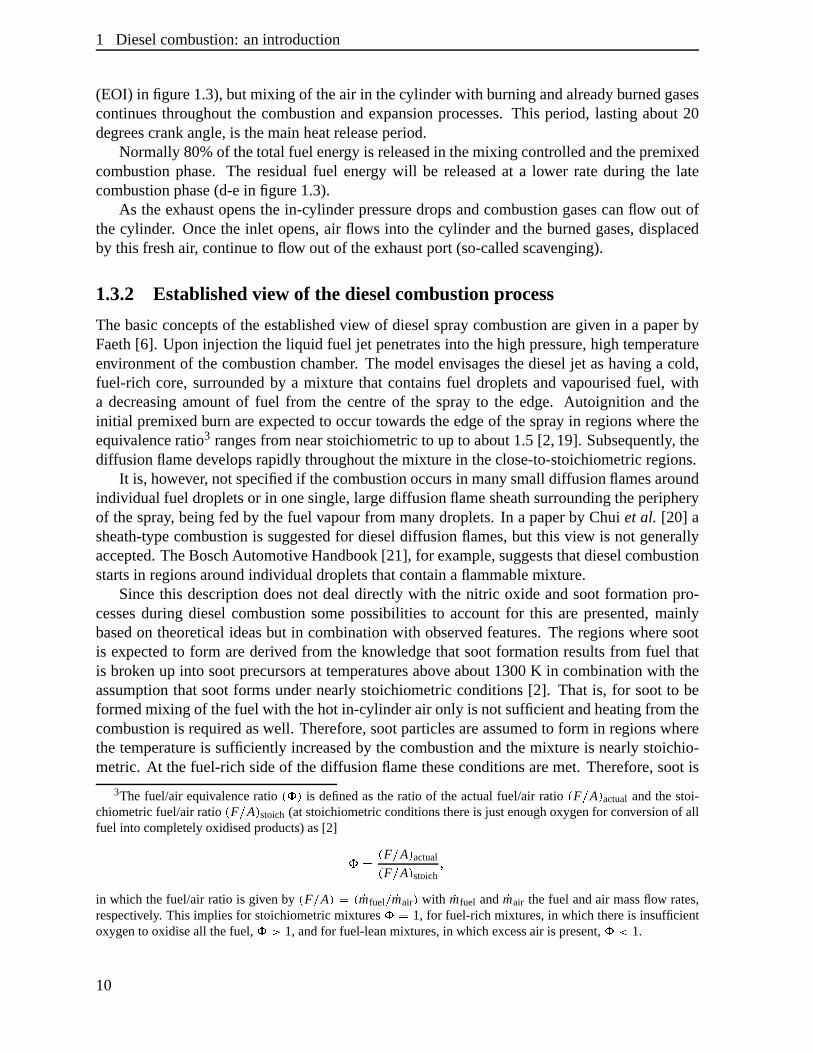
Figure 1.4: Schematicrepresentationof theestablishedview of thedieselcombustionprocess,showing a crosssectionthroughthemiddleplaneof a fuel jet. A fuel core(black)is surroundedby fuel dropletsandfuel vapour(grey). Thediffusion flameis locatedaroundthe jet peripherywith sootat thefuel-rich side.(FromDec[16]; reproducedwith permissionfrom SAE paperno.970873 c
1997,Societyof Automotive Engineers,Inc.)
expectedto form at theinnersideof thediffusionflamearoundthejet periphery, startingat thepositionswhereautoignitionoccurs. Becauseof stoichiometry, the initial fuel-rich premixedburn is notexpectedto beanimportantsourcefor sootformation.Lateron,sootoxidisesin theflamezonewhenit contactsunburnedoxygen.
Nitric oxideis expectedto form in thehigh temperatureregionsin boththeflamefront andtheburnedgasesvia the thermalNO mechanism(seesection1.4.1). Formationratesthenarethehighestin theclose-to-stoichiometricregionsat high temperature[2], that is, at theedgeofthediffusionflame.Therefore,NO formation,like sootformation,is expectedin thediffusionflamezone,but at theleansidewheremoreoxygenis present.
Dec hassummarisedthis view of the DI dieselcombustion in a schematicpicturewhichis reproducedin figure1.4 [16]. It hasto be taken into accountthat this schematicrepresentsonly a generalview, that often is usedto show how dieselcombustionproceeds.The pictureof dieselcombustionmight be more complex, but the available information is not sufficientfor a full description,andmoredetailedexperimentaldataareneededin order to arrive at abetter, morecompletedescriptionof the dieselcombustionprocess.Figure1.4 shows a crosssectionthroughthecentreof a fuel jet. A region of densefuel droplets,possiblywith anintactliquid streamneartheinjector, is seen(black).Aroundthis fuel corea regionof moredisperse,vapourisingdropletsandvapourfuel is present(grey). In thecaseof a sheath-typecombustionthediffusionflameis formedaroundthe jet periphery, wherefuel andair mix. Aroundthe jetperipheryon the fuel-rich sideof the reactionzonesoot formationis expected. For the caseof droplet combustion the flame zoneconsistsof a lot of small flameletsaroundindividualdropletsor clustersof droplets.Now sootis expectedto form aroundeachdropletwithin theindividual diffusion flamelets.However, as interactionwith the gasflow aroundthe dropletscould extinguishthe flameletsbeforesootburnout,the sootdistribution aroundthe peripherywill bemorehomogeneous,similar to thatfor thesheathflamecase.
11
1 Dieselcombustion:anintroduction
1.3.3 New ideasabout the dieselcombustion process
Becausethe establishedview of dieselcombustion is not able to explain a numberof recentexperimentaldataobtainedby laserdiagnostictechniques,an alternative ‘conceptualmodelof dieselcombustion’ wasdevelopedby Dec [16]. This new model is able to reconciletheexperimentaldataknown at thattime,but it shouldbenotedthatthedatausedin themodelareobtainedfrom onespecifictestengineoperatedat only onetypical operationconditionwith aspecial,low-sootingfuel4. Furthermore,themodelonly givesa full descriptionof thefirst partof the combustion,from the startto the endof the fuel injection (i.e. just after the beginningof the mixing controlledburn). As not sufficient dataareavailableaboutthe last part of themixing controlledburn only anestimatedpictureis givenfor thatpart.Additionally, themodelpresentsanaveragedescriptionof theeventsoccurringin a singlecycle in theabsenceof wallinteractionsandswirl; variationsin distributions,shapes,sizeandtimecanoccurfrom cycle tocycle.
After the startof the injection a fuel jet penetratesinto the combustionchamber. At thesideof the injector (upstream)the jet mainly containsliquid fuel whereasat the leadingend(downstream)thehot air causesthe fuel to evaporateat theedgesof the liquid fuel jet. Thus,aroundthe liquid fuel jet a region that containsvapourfuel develops. This region first startsalongthe sidesof the jet around2
�aSOI(after SOI). The vapourfuel region becomeslarger
duringfurtherpenetrationof the jet. The liquid fuel jet will have reachedits maximumlengthwhenthehot air, penetratinginto the jet, is sufficient to vaporiseall the fuel around3
�aSOI.
However, thevapourregion continuesto grow anda headvortex, which is typical for a pene-tratinggasjet, developsat theleadingendof thejet. Thevapour-fuel/airmixturein theheadisrelatively uniform with anequivalenceratio varyingbetween2 and4. Althoughtheexacttimeandpositionof theautoignitionarenotwell known, it is expectedthatautoignitionstartsin theheadof thefuel jet shortlyafterthefuel injectionbetween2
�and3.5
�aSOI.By 4.5
�aSOIau-
toignition is seento haveoccurredthroughoutthewholevolumeof thevapour-fuel/airmixturein theleadingpartof thejet. At 5
�aSOI,just afterthetime theheatreleaseratecurve startsto
rise,fuel breaksdown dueto therising temperature(‘cracking’) andlargePAHs areseen,uni-formly distributedin theheadof thejet. This indicatesthattherapidrisein theheatreleaserateis the resultof combustionoccurringin this fuel-rich mixture. NO cannotyet be seenduringthis fuel-richpremixedburning.
After this point, around6�
aSOI,sootformationstarts. Initially, very small sootparticlesare found in large partsof the fuel jet. Hereafter, at about6.5
�aSOI, soot is found in the
wholeregion of thevapourfuel jet. However, no sootis seenin a region just a few millimetresdownstreamof the liquid fuel region. Thediffusionflameshows up at 6.5
�aSOI.It is located
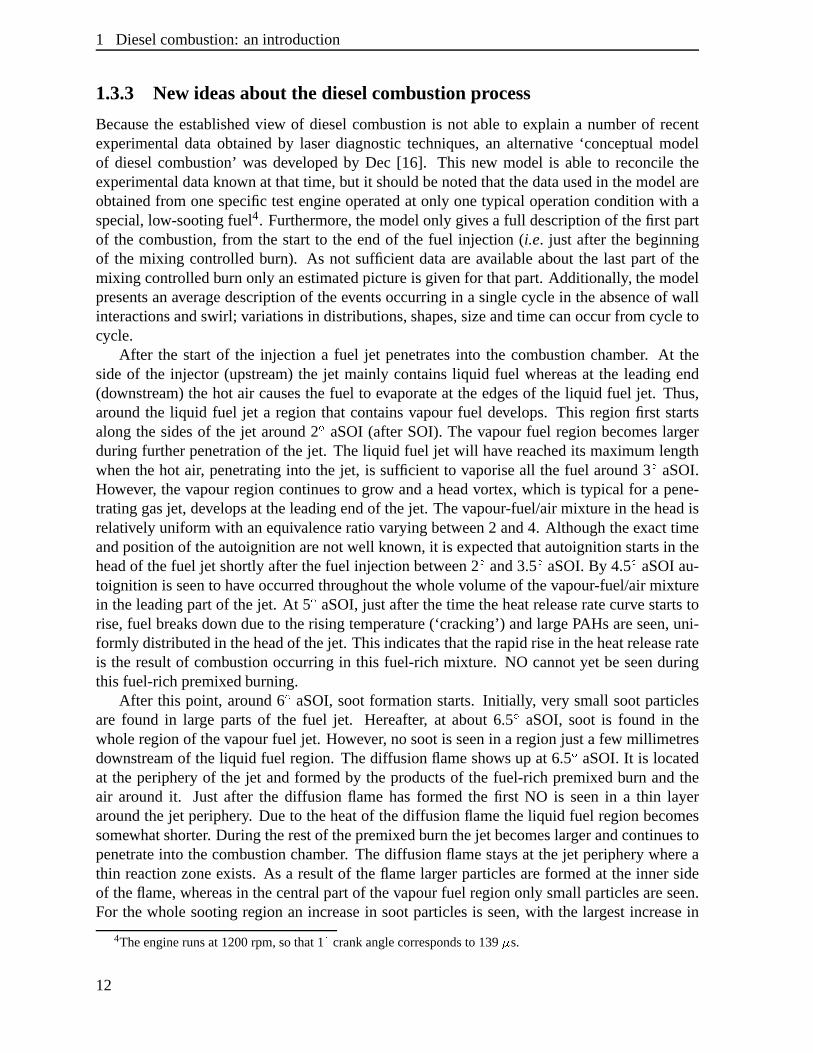
at the peripheryof the jet andformedby the productsof the fuel-rich premixedburn andtheair aroundit. Justafter the diffusion flame hasformed the first NO is seenin a thin layeraroundthe jet periphery. Dueto theheatof thediffusionflametheliquid fuel region becomessomewhatshorter. During therestof thepremixedburn thejet becomeslargerandcontinuestopenetrateinto thecombustionchamber. Thediffusionflamestaysat the jet peripherywhereathin reactionzoneexists. As a resultof theflamelarger particlesareformedat the innersideof theflame,whereasin thecentralpartof thevapourfuel region only smallparticlesareseen.For thewhole sootingregion an increasein sootparticlesis seen,with the largestincreasein
4Theenginerunsat 1200rpm,sothat1! crankanglecorrespondsto 139 " s.
12
1.3 Thecombustionprocessin a dieselengine
Scale (mm)#
Fuel-Rich Premixed Flame
Initial Soot Formation
Thermal NO Production Zone$Soot Oxidation Zone# Diffusion Flame
Vapor-Fuel/Air Mixture(equivalence ratio 2- 4)
0 10 20
Liquid Fuel
Low HighSoot Concentration#
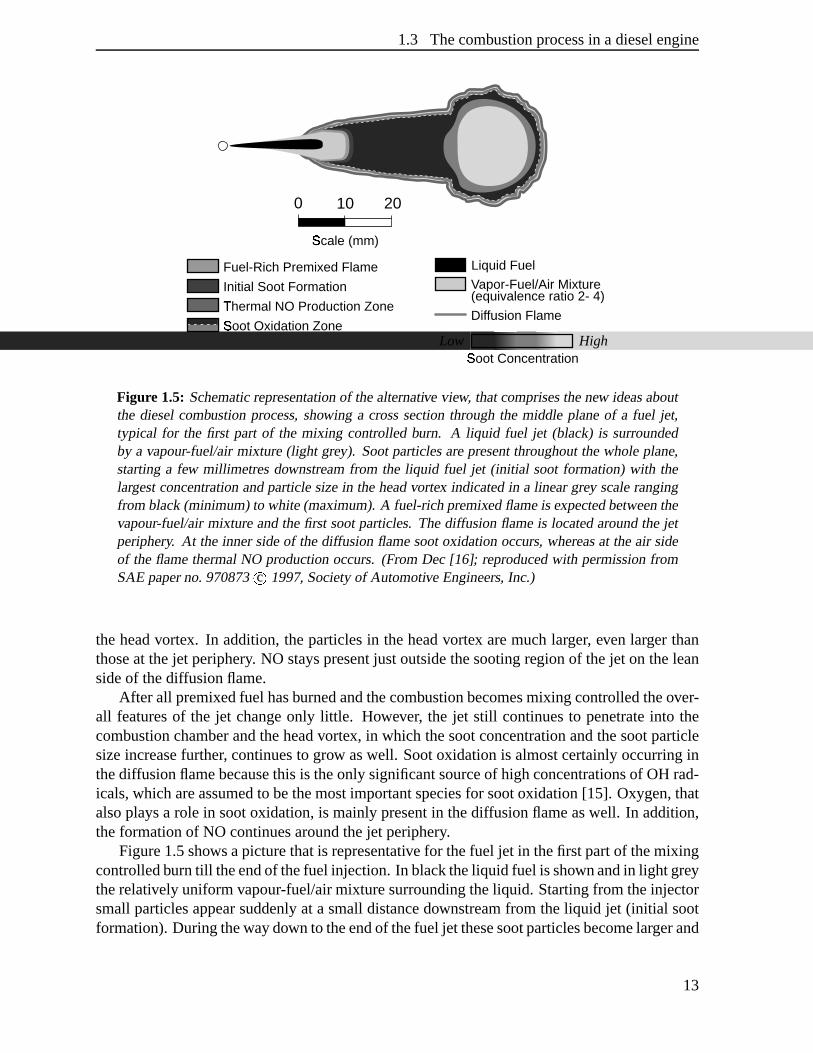
Figure 1.5: Schematicrepresentationof thealternative view, thatcomprisesthenew ideasaboutthe dieselcombustionprocess,showing a crosssectionthroughthe middle planeof a fuel jet,typical for the first part of the mixing controlledburn. A liquid fuel jet (black) is surroundedby a vapour-fuel/air mixture(light grey). Sootparticlesarepresentthroughoutthewholeplane,startinga few millimetresdownstreamfrom the liquid fuel jet (initial soot formation)with thelargestconcentrationandparticlesizein theheadvortex indicatedin a lineargrey scalerangingfrom black(minimum)to white (maximum).A fuel-richpremixedflameis expectedbetweenthevapour-fuel/air mixtureandthefirst sootparticles.Thediffusionflameis locatedaroundthe jetperiphery. At the innersideof thediffusionflamesootoxidationoccurs,whereasat theair sideof theflamethermalNO productionoccurs.(FromDec[16]; reproducedwith permissionfromSAE paperno.970873 c
1997,Societyof Automotive Engineers,Inc.)
theheadvortex. In addition,theparticlesin theheadvortex aremuchlarger, evenlarger thanthoseat thejet periphery. NO stayspresentjust outsidethesootingregionof thejet on theleansideof thediffusionflame.
After all premixedfuel hasburnedandthecombustionbecomesmixing controlledtheover-all featuresof the jet changeonly little. However, the jet still continuesto penetrateinto thecombustionchamberandtheheadvortex, in which thesootconcentrationandthesootparticlesizeincreasefurther, continuesto grow aswell. Sootoxidationis almostcertainlyoccurringinthediffusionflamebecausethis is theonly significantsourceof highconcentrationsof OH rad-icals,whichareassumedto bethemostimportantspeciesfor sootoxidation[15]. Oxygen,thatalsoplaysa role in sootoxidation,is mainly presentin thediffusionflameaswell. In addition,theformationof NO continuesaroundthejet periphery.
Figure1.5showsapicturethatis representative for thefuel jet in thefirst partof themixingcontrolledburntill theendof thefuel injection.In blacktheliquid fuel is shownandin light greytherelatively uniformvapour-fuel/airmixturesurroundingtheliquid. Startingfrom theinjectorsmallparticlesappearsuddenlyat a smalldistancedownstreamfrom theliquid jet (initial sootformation).Duringthewaydown to theendof thefuel jet thesesootparticlesbecomelargerand
13
1 Dieselcombustion:anintroduction
their concentrationincreases.In theheadvortex, wheresootparticlesaccumulate,thehighestsootconcentrationandthelargestsootparticlesarefound.Also, largerparticlesareseenat theperipheryof thejet at thefuel rich sideof thediffusionflame.At theinnersideof thediffusionflamesootoxidationoccurs,whereasat theair sideof theflamethermalNO productionoccurs.
Althoughthedieselcombustionprocessis describedin muchmoredetailby thealternativemodel,someuncertaintiesstill exist. Oneof themainquestionsis to whatextentthelow-sootingfuel resultswill hold for real dieselfuel aswell. Besidesthis, it is unknown how the earlyformationof smallsootparticlesoccursover thewholeregionof thejet justaftertheendof theliquid fuel jet. For thepresentoneexpectsthata fuel-rich premixedflameis presentat a smalldistancedownstreamfrom theliquid fuel justbeforethefirst sootappears(seefigure1.5).Thisflamewouldresultfrom therelatively uniform,fuel-richcombustiblemixtureatanequivalenceratioof 2-4thatis formeddownstreamtheliquid fuel whenthelastliquid is vaporisedby thehotair in which it penetrates.Sucha flamewould beperfectfor theinitial formationof smallsootparticles,sinceit containsa lot of fuel andit is sufficiently hot for sootformation.This theoryis supportedby thefactthattheconcentrationandsizeof thesootparticlesincreasetowardstheendof thespray.
Otheruncertaintiesexist aboutthe later part of the combustion,after the time periodthismodel is devisedfor. In addition,sincethis descriptionis derived from dataobtainedat oneenginecondition,it is not known what the influenceof the engineconditionson the reactingfuel jet is. Therefore,moreexperimentsarerequiredto investigatethe effect of otherengineconditionsonthecombustionprocess.It is alsonecessaryto obtaininformationonthecombus-tion processin anenginerunningon a commercialdieselfuel, thatproducesmuchmoresoot,insteadof a speciallow-sootingfuel. Furthermore,the effectsof wall interactionsandswirlshouldbeincludedin themodel.
1.3.4 The establishedview compared to the new ideas
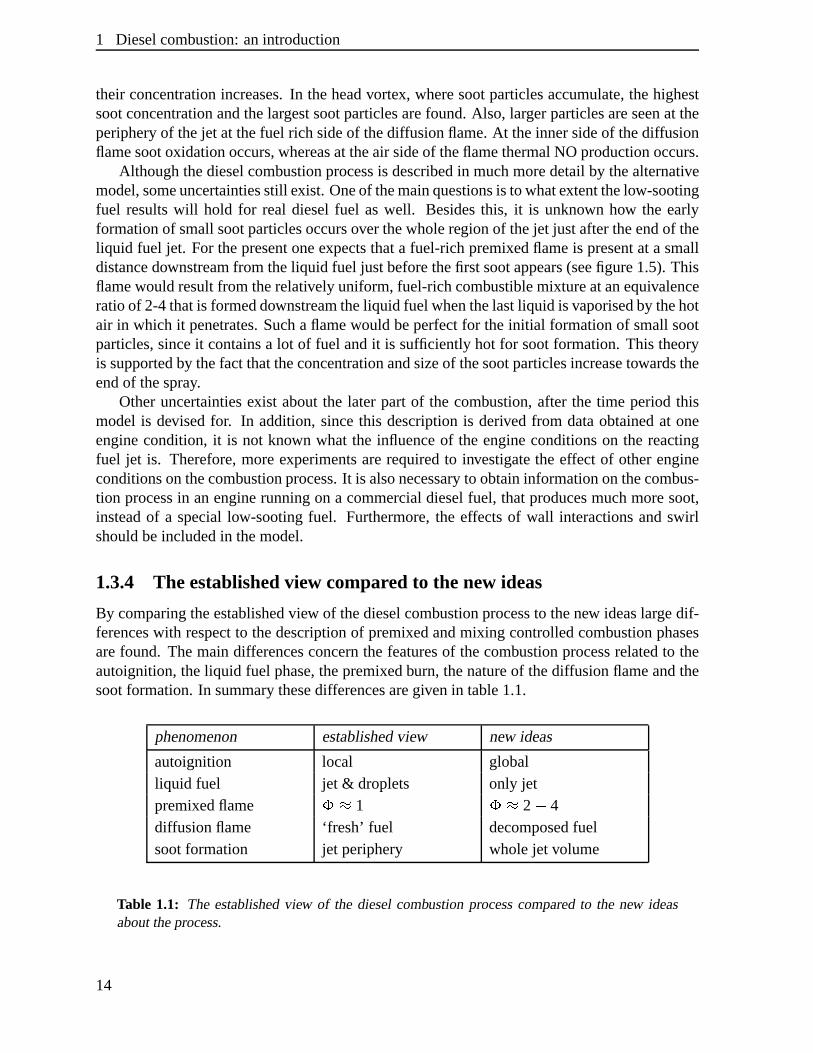
By comparingtheestablishedview of thedieselcombustionprocessto thenew ideaslargedif-ferenceswith respectto thedescriptionof premixedandmixing controlledcombustionphasesarefound. Themaindifferencesconcernthe featuresof thecombustionprocessrelatedto theautoignition,theliquid fuel phase,thepremixedburn, thenatureof thediffusionflameandthesootformation.In summarythesedifferencesaregivenin table1.1.
phenomenon establishedview new ideas
autoignition local globalliquid fuel jet & droplets only jetpremixedflame %'& 1 %�& 2 ( 4diffusionflame ‘fresh’ fuel decomposedfuelsootformation jet periphery wholejet volume
Table 1.1: The establishedview of the dieselcombustion processcomparedto the new ideasabouttheprocess.
14
1.3 Thecombustionprocessin a dieselengine
In the generallyaccepteddescriptionof the dieselcombustion processtheseaspectsarethoughtto occur in the way as summarisedbelow. First, autoignitionoccursonly at a fewpositionsin themixturethatarealmoststoichiometric,mainlyat theperipheryof thejet. Thesepositionscorrespondto thepositionswherethefirst sootis formedandthereforethefirst flameemissionis seen.Second,liquid fuel emanatesfrom the injectorandfuel dropletsarepresentnear(sheath-type)or within (dropletflame)the combustionzone. Third, the initial premixedburnoccurstowardstheedgeof thesprayin regionswherethemixtureis nearlystoichiometric.Fourth, the diffusion combustionproceedsasa moreor lessclassicalliquid (non-premixed)-fuel/air diffusionflameat thejet periphery. Fifth, sootformationoccursmainly at thefuel-richsideof thediffusionflamein asortof shellaroundthejet periphery.
According to the new ideasaboutthe dieselcombustion processtheseaspectsare to bedescribeddifferently. First, autoignitionoccursthroughoutthe whole volumeof the vapour-fuel/air mixture beforethe first sootis seen.Second,the liquid fuel coreis shortandno fueldropletsarepresentoutsidethe liquid fuel jet, so that the fuel presentin thecombustionzoneis in thevapourphaseonly. Third, duringthepremixedburncombustionoccursunderfuel-richconditionsatequivalenceratiosrangingfrom 2 to 4. Fourth,alsobeforethediffusionburningallfuel first undergoesrich premixedcombustion.Thediffusionflame,finally, occursbetweentheproductsof thefuel-richpremixedcombustionandair at theperipheryof thejet. Fifth, thefuel-rich premixedcombustioninitiatestheearlyformationof smallsootparticlesjust downstreamthevapour-fuel/air region. Thereafter, in themixing controlledphase,sootparticlesarepresentthroughoutthewholefuel jet, increasingin sizeandconcentrationtowardstheendof thejet.
The conceptualmodel of the dieselcombustion processalso includesexperimentaldataabouttheformationof sootandNO, in contrastto theestablisheddescription.Sootformationwould startafteranexpected,but not proven,fuel-rich premixedflamejust downstreamof theliquid fuel jet, in theproductsof therich combustion.Thensootformationandparticlegrowthcontinuewhile the sootmovesdown the jet to the headvortex and/orto the diffusion flame.Hereafter, sootoxidationoccursin thediffusionflame.
Nitric oxideformationis foundnot to occurduringpremixedcombustion,includingtheini-tial premixedburningphasejust afterautoignitionandtheexpectedlyfuel-richpremixedflameatasmalldistancedownstreamof theliquid fuel duringthemixing controlledburn[17]. This isexplainedby thefact that in thepremixedburn little oxygenis presentandtheadiabaticflametemperaturesarebelow thoserequiredfor thermalNO production.In addition,theequivalenceratio in theregion of thepremixedburn is in between2 and4, which is too high for significantNO production(only little NO is formedat equivalenceratiosabove 1.8 [22]). However, it ispossiblethatHCN is producedandthat this ‘fix ednitrogen’will beconvertedto NO at a latertime in the diffusion flame. Formationof NO is seenat the leansideof the diffusion flamearoundthe jet peripherywheretemperaturesarehigh andoxygenis present,which are idealconditionsfor thermalNO production.The fact thatNO during this partof thecombustionisseenat thediffusionflameshould,however, notbetakenasanindicationthatmostof theNO isproducedonly whenthediffusionflameis present.ThermalNO productionis a relatively slowprocessandmightpossiblycontinuein thelaterpartof thecombustionin thehot postcombus-tion gasesaftertheendof theactualcombustion.In addition,NO canbeformedin thediffusionflameby theconversionof fixednitrogenresultingfrom thefuel-richpremixedcombustion.
15
1 Dieselcombustion:anintroduction
1.4 Formation of nitric oxide
Nitrogenoxides,NOx, thatareformedduring the combustionof fossil fuel in air, aremainlyNO (nitric oxide),NO2 (nitric dioxide)andN2O (nitrousoxide). During dieselcombustionathighpressuresandtemperaturesalmostall NOx is in theform of NO. Muchof theNO2 presentin theemissionof enginesresultsfrom oxidationof NO at atmosphericpressurevia [23]
2NO ) O2 * 2NO2 + (1.1)
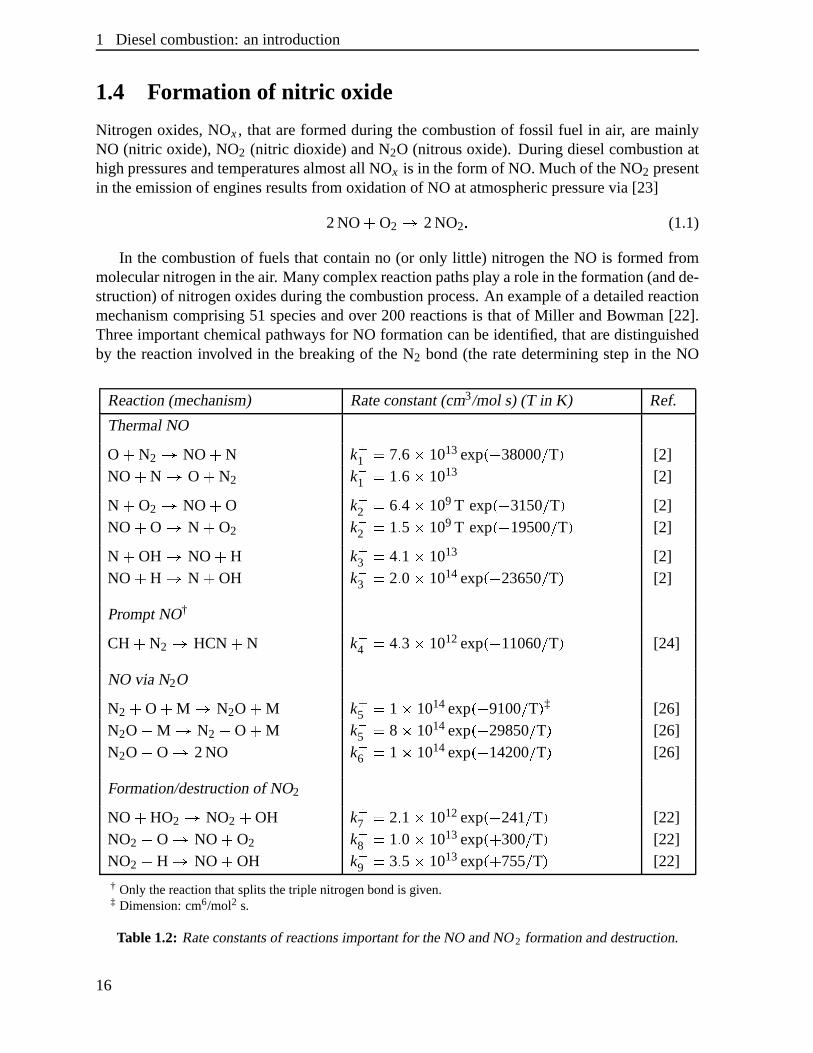
In the combustionof fuels that containno (or only little) nitrogenthe NO is formedfrommolecularnitrogenin theair. Many complex reactionpathsplayarole in theformation(andde-struction)of nitrogenoxidesduringthecombustionprocess.An exampleof adetailedreactionmechanismcomprising51 speciesandover 200reactionsis thatof Miller andBowman[22].Threeimportantchemicalpathwaysfor NO formationcanbeidentified,thataredistinguishedby the reactioninvolved in the breakingof the N2 bond(the ratedeterminingstepin the NO
Reaction(mechanism) Rateconstant(cm3/mol s) (T in K) Ref.
ThermalNO
O ) N2 * NO ) N k ,1 - 7 + 6 . 1013exp /0( 380001 T 2 [2]NO ) N * O ) N2 k 31 - 1 + 6 . 1013 [2]
N ) O2 * NO ) O k ,2 - 6 + 4 . 109 T exp /4( 31501 T2 [2]NO ) O * N ) O2 k 32 - 1 + 5 . 109 T exp /4( 195001 T2 [2]
N ) OH * NO ) H k ,3 - 4 + 1 . 1013 [2]NO ) H * N ) OH k 33 - 2 + 0 . 1014exp /0( 236501 T 2 [2]
PromptNO†
CH ) N2 * HCN ) N k ,4 - 4 + 3 . 1012exp /0( 110601 T 2 [24]
NO via N2O
N2 ) O ) M * N2O ) M k ,5 - 1 . 1014exp /4( 91001 T 2 ‡ [26]N2O ) M * N2 ) O ) M k 35 - 8 . 1014exp /4( 298501 T 2 [26]N2O ) O * 2NO k ,6 - 1 . 1014exp /4( 142001 T 2 [26]
Formation/destructionof NO2
NO ) HO2 * NO2 ) OH k ,7 - 2 + 1 . 1012exp /0( 2411 T 2 [22]NO2 ) O * NO ) O2 k ,8 - 1 + 0 . 1013exp /�) 3001 T 2 [22]NO2 ) H * NO ) OH k ,9 - 3 + 5 . 1013exp /�) 7551 T 2 [22]
† Only thereactionthatsplitsthetriple nitrogenbondis given.‡ Dimension:cm6/mol2 s.
Table1.2: Rateconstantsof reactionsimportantfor theNO andNO2 formationanddestruction.
16
1.4 Formationof nitric oxide
formation)[22,24,25]. Thesearethemechanismsof i) thermalNO, ii ) promptNO andiii ) NOgeneratedvia N2O. Theamountof NO formedthrougheachof thesemechanismsdependsonthetemperature,pressureandequivalenceratio of theflame. PromptNO or its precursorscanonly beformedin theflamefront, whereasthermalNO andNO via N2O canbeformedin boththeflamefront andthepost-flamegases.If, in addition,thefuel containsa significantamountof nitrogen(e.g. coal)NO canbeformedalsofrom this fuel-boundnitrogen[22,24]. Eachofthesefour mechanismswill beshortlydiscussedbelow. Additionally, theconversionof NO toNO2 in thecombustionchamber(importantfor light loaddieselenginesasusedin thepresentwork) is described.
1.4.1 Thermal NO (Zeldovich NO)
In many combustionprocessesthe oxidation of atmosphericmolecularnitrogen(N2) by the‘thermal’ mechanismis an importantsourceof NOx emissions. The formation pathway ofthermalNO is often called the Zeldovich mechanism,after Y.B. Zeldovich, who postulatedthemechanism.Thethreeelementaryreactionsthatcomprisethe formationof thermalNO incombustionof near-stoichiometricfuel-airmixturesare[2,22,24]
O ) N2 5 NO ) N (1.2)
N ) O2 5 NO ) O (1.3)
N ) OH 5 NO ) H + (1.4)
Theforwardandbackwardreactionrateconstants,k ,i andk 3i , respectively, for thesereactionsaregivenin table1.2. Reaction1.2 hasa high activationenergy dueto thestrongtriple bondin theN2 molecule,andbecauseof this it is theratelimiting stepin thethermalNO formation.It is sufficiently fastonly at high temperatures(that is why this way to form NO is calledthethermalNO mechanism).
From reactions1.2 to 1.4 the rate of NO formation can be derived. Assumingquasi-equilibriumfor reactions1.3and1.4,andassumingthermaldecompositionof molecularoxygento bethemainsourceof O-atoms,theinitial NO formationratefollowsas[2]
d[NO]
dt - kx / T 2 [O2]12e [N2]e
mol
cm3s 6 (1.5)
in which [X] e denotesthe equilibrium concentrationof the speciesX in molcm3 3 andkx / T 2 - 6 . 1016T 3 1
2 exp /0( 690901 T 2 (T in Kelvin).For thermalNO formationin a dieselenginethe critical period is whenthe temperatures
of the burnedgasesare at a maximum. That part of the mixture which burns early in thecombustion(beforeTDC) is especiallyimportantsinceit is compressedto ahighertemperature,increasingtheNO formationrateascombustionproceedsandcylinderpressureincreases.Afterthepeakpressurethetemperatureof theburnedgasdecreasesdueto expansionof thecylindervolumeanddueto mixing with coolergases,resultingin decreasingthermalNO formationrate.TheNO formationrateis thehighestat stoichiometricconditions.
Usingequation1.5 theinitial NO formationratein thetwo-strokeenginecanbeestimated,usingequilibrium concentrations[N2]e and [O2]e basedon the amountof N2 andO2 in theunburnedair. Figure1.6ashows the initial NO formation ratesasa function of crankangle
17
1 Dieselcombustion:anintroduction
0 20 40 60 80 1000
10
20
30
40b
x 105
NO
con
tent
(pp
m)
Crank angle (degrees)
10-45
10-35
10-25
10-15
10-5
a
d[N
O]/
dt (
mol
cm
-3 s
-1)
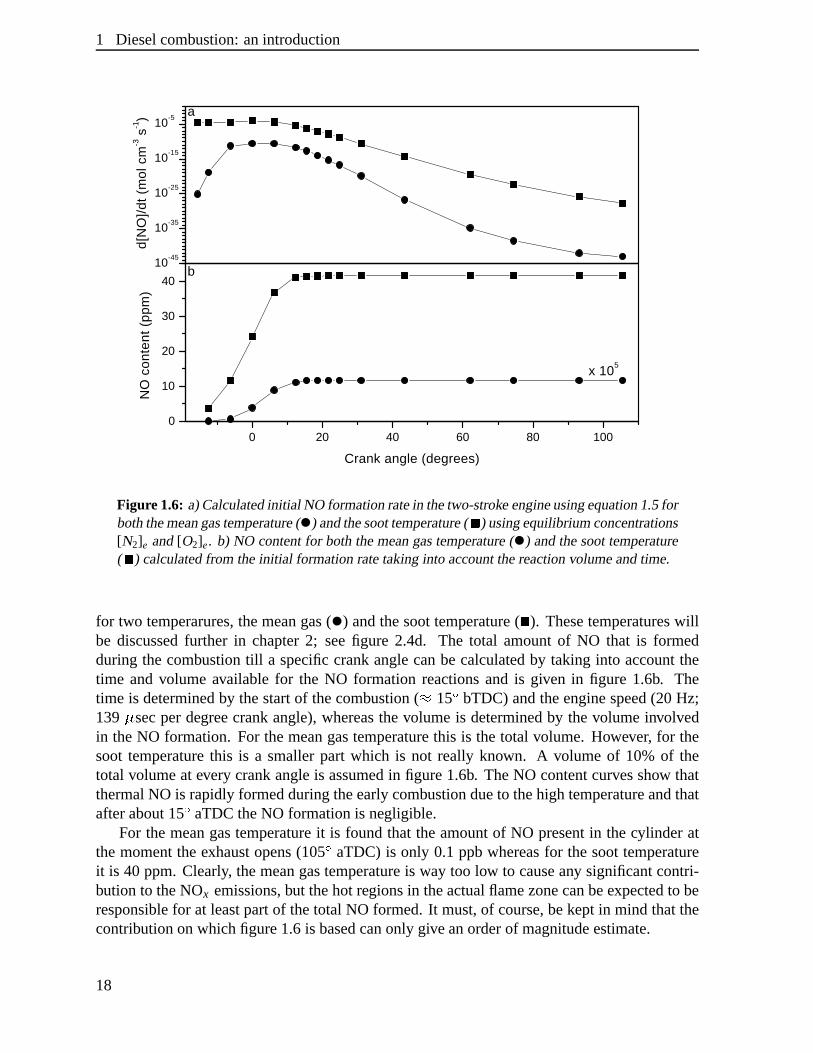
Figure1.6: a)Calculatedinitial NO formationratein thetwo-strokeengineusingequation1.5forboththemeangastemperature( ) andthesoottemperature( � ) usingequilibriumconcentrations[N2]e and[O2]e. b) NO contentfor boththemeangastemperature( ) andthesoottemperature( � ) calculatedfrom theinitial formationratetakinginto accountthereactionvolumeandtime.
for two temperarures,themeangas( ) andthesoottemperature( � ). Thesetemperatureswillbe discussedfurther in chapter2; seefigure 2.4d. The total amountof NO that is formedduring the combustiontill a specificcrankanglecanbe calculatedby taking into accountthetime and volume available for the NO formation reactionsand is given in figure 1.6b. Thetime is determinedby thestartof thecombustion(& 15
�bTDC) andtheenginespeed(20 Hz;
139 7 secper degreecrankangle),whereasthevolumeis determinedby thevolumeinvolvedin theNO formation. For themeangastemperaturethis is the total volume. However, for thesoot temperaturethis is a smallerpart which is not really known. A volumeof 10% of thetotal volumeat every crankangleis assumedin figure1.6b. TheNO contentcurvesshow thatthermalNO is rapidly formedduringtheearlycombustiondueto thehigh temperatureandthatafterabout15
�aTDCtheNO formationis negligible.
For themeangastemperatureit is found that theamountof NO presentin thecylinder atthemomenttheexhaustopens(105
�aTDC) is only 0.1 ppbwhereasfor thesoottemperature
it is 40 ppm. Clearly, themeangastemperatureis way too low to causeany significantcontri-bution to theNOx emissions,but thehot regionsin theactualflamezonecanbeexpectedto beresponsiblefor at leastpartof thetotal NO formed.It must,of course,bekeptin mind thatthecontributionon whichfigure1.6 is basedcanonly giveanorderof magnitudeestimate.
18
1.4 Formationof nitric oxide
1.4.2 Prompt NO (FenimoreNO)
In combustion of hydrocarbonfuels, especiallyunder fuel-rich conditions,the prompt NOmechanismcan be important. This rapidly formed NO is called prompt NO as this way ofNO formationoccursmainly in regionsneartheflamezone.Themechanismof promptNO for-mationwaspostulatedby C.P. Fenimore(hencethealternativenameFenimoreNO) andis morecomplicatedthanthethermalNO mechanism.PromptNO formationin hydrocarbonflamesisinitiated by the rapid reactionof hydrocarbonradicalswith N2 resultingin aminesor cyano-compoundsthat reactfurther to form NO [22,24]. Although it is not fully understoodwhichhydrocarbonis responsiblefor promptNO, it is expectedthatCH is a majorcontributor. SinceCH is presentonly at theflamefront [22], this would imply thatalsothepromptNO formationis confinedto the flame front, in contrastwith the thermalNO. CH reactswith N2 formingmetastable(HCN2 208 which subsequentlyformshydrocyanicacid(HCN) andN-atoms,
CH ) N2 * / HCN22 8 * HCN ) N 6 (1.6)
with aneffectiverateconstantk ,4 thatis givenin table1.2.BoththeN-atomandtheCN-radical,formedby thermaldecompositionof HCN, reactwith O-atomsandOH-radicalsto form NO viaseveralcomplex pathways[22].
Fuel-richconditionsfavour promptNO formationbecauseC2H2, a precursorof the CH-radical,is abundantlypresent,but only little promptNO is formedat equivalenceratiosabove1.8[22]. Therate-limitingstepin promptNO formationis theformationof HCN. However, theactivation energy of this reactionis muchlower (about92 kJ/mol) thanthe activation energy(319 kJ/mol) of the reactionsproducingthermalNO. Therefore,in contrastto thermalNO,promptNO is alsoformedatrelatively low temperatures(down to about1000K). For thedieselenginepromptNO formationshouldoccurduringthepremixedburn, which is fuel-rich, or intheflamefront of thediffusionflame. It is alsopossiblethatduring thepremixedcombustiononly HCN is formedthatwill beconvertedto NO at a latertime in thecombustion.
1.4.3 NO generatedvia nitr ousoxide
Formationof NO via N2O (nitrousoxide)startswith a reactionanalogousto thefirst reactionof the thermalNO mechanism,in which anO-atomreactswith molecularnitrogen.However,aswasfirst postulatedby Wolfrum [26], the productof this reactionmay be N2O if a thirdmoleculeM is presentto stabilisethecollisioncomplex,
N2 ) O ) M 5 N2O ) M + (1.7)
Therateconstantsfor theforwardandbackwardreactions,k ,5 andk 35 respectively, aregivenintable1.2. This reactionhasa low activationenergy (76 kJ/mol)andbecomesmoreimportantat higherpressuresbecauseit is a three-bodyreaction.Subsequently, theN2O mayreactwithO-atomsto form NO,
N2O ) O * 2NO6 (1.8)
with a rateconstantk,6 alsogivenin table1.2.TheNO formationratecanbewrittenas[26]
d[NO]
dt - kg[O][N2] 6 (1.9)
19
1 Dieselcombustion:anintroduction
wherekg is an effective rateconstantthat increasesat higherpressuresandthat, at tempera-turesbelow 1700K, is larger thantherateconstantthatdeterminesthethermalNO formation[26] (at higher temperaturesit approachesthe thermalformationrate). Becausereaction1.7hasa smallertemperaturedependencethan reaction1.2 from the Zeldovich mechanism,theN2O mechanismbecomesasignificantcontributerat low temperatures,wheretheformationofthermalNO is suppressed,andunderleanconditions,wheretheformationof CH is suppressedleadingto lessprompt NO. Therefore,undercircumstancesof leanpremixed combustionathighpressureandlow temperatureNO generatedvia N2O is animportantpathway.
1.4.4 NO production fr om fuel nitr ogen
Thenitrogenchemicallyboundin thefuel (fuel-boundnitrogen)is anothersourcein theforma-tion of NO by combustionof fossil fuels. It is mostimportantin coalcombustion,becausecoalcontainsabout0.5-2.0mass-%[22] chemicallyboundnitrogen,whereasliquid fuel typicallycontains0.07mass-%[2]. During combustionthe fuel nitrogen,that canexist asaminesandring compounds(e.g. pyridine), is converted,usuallyquitefast,to precursorsof NO. Themostimportantnitrogen-containingspeciesareammonia(NH3) andhydrocyanic acid (HCN), thelatter is alsobeingformedin the promptNO mechanism.Thesecompoundsoxidise,usuallyrapidly, to NO via severalcomplex reactionpathways[22].
Theconversionof fuelnitrogentoNOis stronglydependentontheinitial amountof nitrogenin thefuel/airmixtureandonthestoichiometryof themixture.Relativelyhighconversionratiosarefoundfor leanandstoichiometricmixtureswhereastheconversionratiosarelower for richmixtures.They areonly weaklydependentontemperature,in contrastto thestrongtemperaturedependenceof thermalNO. Although dieselfuel cancontainsomenitrogen,this fuel-boundnitrogenwill not contributesignificantlyto thetotal amountof NO thatis formed[2].
1.4.5 Formation of NO2
At typical flametemperaturesthe NO2/NO ratiosshouldbesmall consideringchemicalequi-librium, but in dieselenginesthe ratio canbehigher. This NO2 is assumedto resultfrom thereactionof NO with HO2 [2,22],
NO ) HO2 * NO2 ) OH + (1.10)
SignificantHO2 concentrationsarefoundin thelower-temperatureregionsof theflameandcanreactwith NO that is transportedby diffusion from the high temperatureregions to the lowtemperatureregions.NO2 conversionbackto NO mayoccurvia
NO2 ) O * NO ) O2 (1.11)
NO2 ) H * NO ) OH + (1.12)
Therateconstantsof thesereactionsarealsogivenin table1.2. Thereactionsremoving NO2
are fastandNO2 will convert backrapidly to NO if high radicalconcentrationsarepresent.However, if theNO2 formedin theflameis mixedwith coldergases,theselast reactionswillnot take placedueto a decreasein theradicalconcentrations.This is thereasonwhy relativelyhighNO2/NO ratiosarefoundin light loaddieselengineswherecoolerregions,thatinhibit theconversionbackto NO, aremoreabundant[27].
20
1.5 Formationandoxidationof soot
1.5 Formation and oxidation of soot
Theformationof sootduringcombustionis theresultof anincompletecombustionof thehydro-carbonsin thefuel,whichoccursunderconditionsof localoxygendeficiency. It is anextremelycomplicatedprocessin whichasortof gaseous-solidphasetransitiontakesplacewherethefinalsolid phase(i.e. thesoot)exhibits no uniquechemicalor physicalstructure[28]. Sootforma-tion compriseschemicallyandphysicallydifferentprocesseslike theformationandgrowth oflargearomatichydrocarbonsandtheir transitionto so-calledprimaryparticles,thecoagulationof thesesmallspeciesinto largerparticles,andthegrowth of solid particlesdueto attachmentof gas-phasespeciesto thesurface. Most of the informationaboutsootformationis obtainedfrom measurementsin simplepremixedflames,shocktubesandcombustionbombs.Althougha modelthatgivesa generaldescriptionof thesootformationprocessin all differentcombus-tion environmentsis not yet available,somemodelsexist for specificaspectsandcombustionprocesses[2,24,28,29]. Below, only ashortoverview of onepossiblesootformationprocessisgiven,andsomeaspects,importantfor thespecificcaseof dieselcombustion,aresummarised.
In diesel enginessoot particles are expectedto form during a few millisecondsfromfuel hydrocarbonsin the temperaturerangeof 1300-2800K andat pressuresbetween50 and100bars[2]. Sincethesetemperaturesareabovethoseof thein-cylinderair beforecombustion,heatfrom the combustion is requiredto initiate the soot formationprocess.This multi-stepprocessprobablystartswith the hydrocarbonsin the fuel breakingup into small hydrocarbonradicals.Theseradicalsform smallhydrocarbonswhichreactto largerones,of which thepoly-cyclic aromatichydrocarbons(PAHs) arean importantgroup,asthey arethe most importantprecursorsof soot.An importantchannelin theformationof PAHs startswith theformationofacetylene,C2H2, from hydrocarbonradicals.TheC2H2 reactswith CH or CH2 to C3H3, pairsof which canform thefirst ring, benzeneC6H6. Subsequently, themoleculegrows by furtherreactionswith C2H2 to a largePAH. Coagulationof larger PAH moleculesinitiatesgrowth inthe third dimension,andthe first very small particlesareformed,often callednuclei, with adiameterof about2 nm. Thiswaya largenumberof verysmallparticles,thataretheprecursorsof thelaterformedsoot,maybeproduced.
Thebulk of thesootis formedasa resultof particlegrowth which,duringtheearlystages,occursdueto bothcoagulation,whereparticlescollideandcoalesce,andsurfacegrowth, whichoccursby gasphasespeciesattachingto the surface. Surfacegrowth reactionsleadto an in-creasein the soot volume fraction but doesnot changethe numberof particles,whereasbycoagulationthe numberof particlesdecreasesandthe sootvolumefraction remainsconstant.If theindividualparticlesarestill smallbothprocesseswill resultin particlesof approximatelysphericalshape. Theseprocessesof particle growth result in primary soot particles,calledspherules,containingsome105 carbonatomsataH/C ratioof about0.1anda typicaldiameterbetween20 and30 nm. If surfacegrowth hasstopped,coagulationof spherulescontinuesandasmany asa few thousandof thesespherulesmayagglomerateinto clustersor chainsformingsootparticleswith a typicaldiameterbetween100and150nm [2].
Besidessootformation,duringall phasesof theformationprocesssootoxidationoccursaswell. Sootparticlesor sootprecursorsaredestroyed dueto oxidationby speciesasO2, O orOH in or nearthe flame. A large fraction of the soot formedis oxidisedwithin the cylinderbeforethe exhaustopens.The final emissionof soot from the enginedepends,of course,onbothformationandoxidationrates.
21


Chapter 2
Laser-baseddiagnosticsin a dieselengine
Abstract
Theoptically accessibletwo-stroke dieselengine,which theexperimentsareperformedon, isdecribed,aswell as its characteristicsandthe optical setups.The optical techniquesusedtostudytheNO formationinsidethecylinder of theengineareexplained,includinga discussionabouttheeffectsof RotationalEnergy Transfer(RET) on theobtainedNO LaserInducedFlu-orescence(LIF) signals.To derivea temperatureof theglowing sootparticlesthespontaneousflameemissionis used.In addition,two dimensionalimagesof theflameemission,showing theflamedevelopmentduringthestroke, arepresented.Thechapterendswith a discussionaboutthe NO spectroscopy in thedieselengine.Excitation/emissionspectrarecordedfrom a flameandfrom therunningenginearegiven.They show theinterferenceof NO andO2 fluorescenceandcanbe usedto selectwavelengthssuitablefor the excitation anddetectionof NO insidethecombustionchamber. Finally, examplesof dispersedfluorescencespectrarecordedfrom therunningengineareshown.
23
2 Laser-baseddiagnosticsin a dieselengine
2.1 Intr oduction
Powerful lasersin combinationwith fastintensifieddetectionsystemsarewidely usedto studythephysicalandchemicalprocessesoccurringduringcombustion.Laser-basedopticaldiagnos-tics canbe highly selective, sensitive andnon-intrusive. They allow spatiallyandtemporallyresolveddetectionof specificchemicalspeciesandquantumstates(a requirementfor the de-terminationof a temperature)within complex, reactive, turbulent environments[30–33]. Theresultsof thesespectroscopictechniquesgive information aboutthe distributionsof variousimportantparameterssuchasgascomposition,temperatureanddensity.
For thespecificcaseof dieselcombustion,laser-baseddiagnosticsallow to obtaininforma-tion about(almost)all aspectsof thecombustionprocess,from autoignitionto pollutantforma-tion. By combiningresultsobtainedsimultaneouslyusingseveraldifferenttechniques,relationscanbeestablishedbetweendifferentfeaturesof thecombustion.During thelastdecade,laser-basedopticaldiagnosticshavebeenappliedby severalresearchgroupsto obtainsuchinforma-tion undermoreor lessrealisticcombustionconditionsandin a varietyof optically accessibleengines(both dieselandspark-ignition(SI) engines)[7–18,34–54]. The major experimentalproblemin usinglaserdiagnosticsin optically accessibleenginesis the sootthat reducesop-tical transparency dueto bothwindow fouling andattenuationof the laserintensitywithin thecombustionchamber. Therefore,in almostall experimentsa substituteor low-sootingfuel wasusedto reducethesootformationand,therefore,to increasetheoptical transparency. Further-more,in someexperimentsextraoxygenwasaddedto theintakeair, whichcanreducethesootproductiondrastically, but at thesametime increasestheNO production.It shouldalsobeno-ticedthatin mostof theexperiments,theoptically accessibleenginewasoperatedin skip-firedmode(i.e. firing only every nth cycle) in orderto reducethe temperatureof thecylinder. ThemostcommonlyusedlasertechniquesareLaserInducedFluorescence(LIF), LaserInducedScattering(LIS) (i.e. Rayleigh/Miescattering),LaserInducedIncandescence(LII), andRamanscattering.Detectionof thechemiluminescenceandthenaturalflameemission(including thetwo colourmethod)shouldbementionedaswell, since,althoughthey arenot laser-based,thesetechniquesareoften usedto obtainadditionalinformationnecessaryto characterisethe com-bustionprocess.
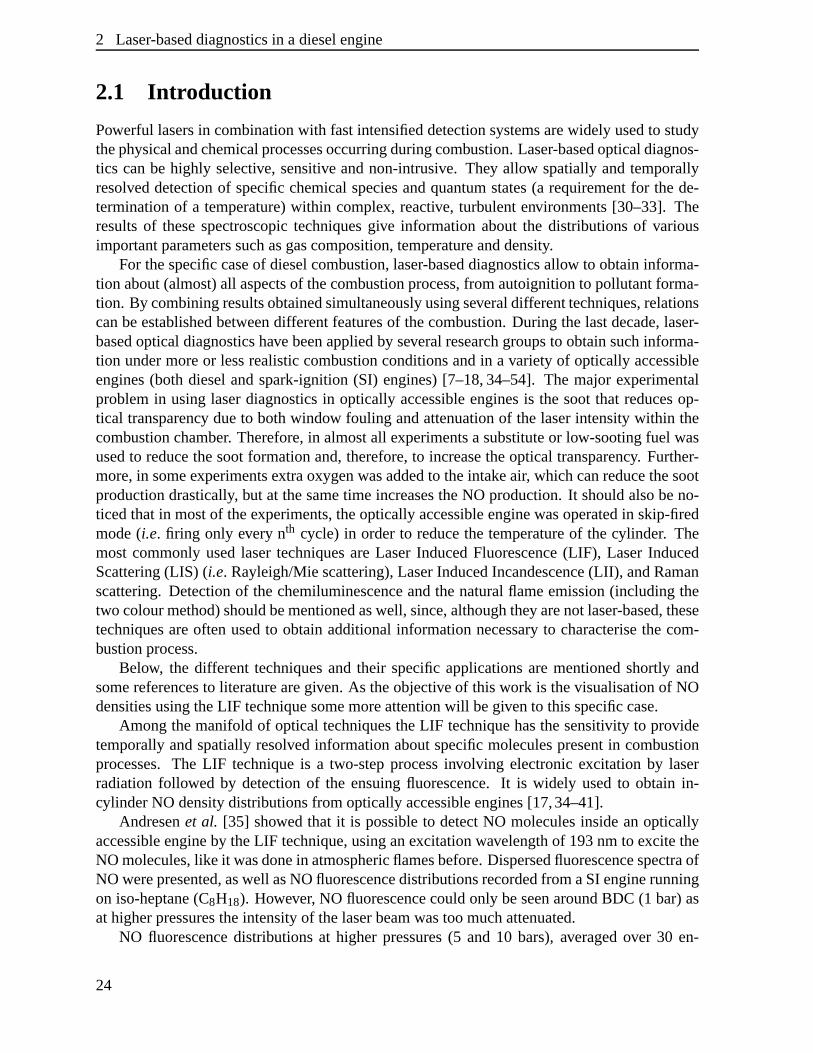
Below, the different techniquesand their specificapplicationsarementionedshortly andsomereferencesto literaturearegiven.As theobjectiveof this work is thevisualisationof NOdensitiesusingtheLIF techniquesomemoreattentionwill begivento this specificcase.
Amongthemanifoldof optical techniquestheLIF techniquehasthesensitivity to providetemporallyandspatiallyresolved informationaboutspecificmoleculespresentin combustionprocesses.The LIF techniqueis a two-stepprocessinvolving electronicexcitation by laserradiationfollowed by detectionof the ensuingfluorescence.It is widely usedto obtain in-cylinderNO densitydistributionsfrom optically accessibleengines[17,34–41].
Andresenet al. [35] showed that it is possibleto detectNO moleculesinsidean opticallyaccessibleengineby theLIF technique,usinganexcitationwavelengthof 193nm to excite theNO molecules,likeit wasdonein atmosphericflamesbefore.DispersedfluorescencespectraofNO werepresented,aswell asNO fluorescencedistributionsrecordedfrom aSI enginerunningon iso-heptane(C8H18). However, NO fluorescencecouldonly beseenaroundBDC (1 bar)asat higherpressurestheintensityof thelaserbeamwastoomuchattenuated.
NO fluorescencedistributions at higher pressures(5 and 10 bars),averagedover 30 en-
24

2.1 Introduction
gine cyclesandalsorecordedusing193 nm excitation,werepresentedby Arnold et al. [36].Thedistributionswereobtainedfrom a transparentDI passengercardieselengine,runningonn-heptaneto keepthe engineoptically transparent.It was mentionedthat for a quantitativeanalysisof thefluorescencesignaltheeffectsof pressureshouldbetakeninto account.
Alataset al. [37] succeededin measuringNO fluorescencedistributionsthroughoutalmostthewholeenginecycleusing226nmexcitationof NO. However, a50/50mixtureof iso-octaneandn-tetradecanewasusedasfuel andtheDI dieselengine,with asquarecombustionchamber,wasaresearchenginerunningin skip-firedmodein orderto reducesootproduction.In addition,oxygen-enrichedintakeair (30%)hadto beusedto increasetheNO concentrationandto reducethesootconcentrationevenmore.Althoughthestartof theNO formationcouldnotberesolvedandtheresultswerenotprocessedfor changingpressure,temperatureandlaserintensityduringthestroke it wasconcludedthatNO formationstartsearlyduringthecombustionandstopsnotlater than40 degreescrankangle. Furthermore,it wasconcludedthat thegreatestprobleminacquiringtheNO imagesis theattenuationof thelaserradiation.
TheLIF imagingtechnique,using193nm laserradiationto excite theNO molecules,wasappliedfor the first time to an optically accessibleIDI dieselenginerunningon commercialdieselfuel by Brugmanet al. [34,38]. To keepthe enginetransparent,oxygenwasaddedtothe intake air (20%), anda specialUV transparent,chemicallyinert lubricantwasused. NOfluorescenceimages,averagedover 50 enginecycles,andexcitationspectraup to pressuresofabout5 barsasa function of load andcrank anglewere reported. NO fluorescenceimagescouldnot beobtainedat higherpressures(i.e. smallercrankangles)becausethewindowswereblockedby thepiston. Additionally, curvesof the total amountof NO in theengine,obtainedby integratingthesignalof the images,werepresented.Both thefluorescenceimagesandtheNO curveswereprocessedfor thechangein laserintensity. In orderto obtainsemi-quantitativeinformationaboutthe amountof NO presentin the cylinder effectsof the changingpressureandtemperatureduringthestrokewerealsotakeninto account.
Nakagawa et al. [39] appliedtheLIF techniqueto a singlejet DI dieselenginerunningona mixed fuel (50/50iso-octane/n-tetradecaneand40/60ethylalcohol/n-dodecanemixtures)inskip-firedmode. ReportedwereNO fluorescenceimages,averagedover five lasershotsandusing226nmexcitation,thatshowedthelocationof NO relative to thereactingfuel jet, but thestartandendof the NO formationcouldnot be determined.However, to obtaintheseresultssignificantoxygenenrichmentof the intake air (between21 and35%)wasrequiredto reducethe sootproductionandenhancethe NO signal. The resultswerenot processedfor changingpressure,temperatureandmixing. Moreover, no spectroscopicevidencewaspresentedfor theabsenceof O2 fluorescencein theimages.
Themostrecentpaperby DecandCanaan[17] presentedtemporallyandspatiallyresolvedNO distributionsfrom a DI dieselenginerecordedby single-shotLIF imaging in which NOmoleculeswere excited at 226 nm. Here, a low-sootingfuel was usedand the enginewasoperatedskip-fired.Additionally, acurveof thetotalamountof NO in thecombustionchamberwasgiven,obtainedby integratingtheNO fluorescencesignaloverarepresentativesectorof thecombustionchamber. In orderto determinethe total in-cylinder NO contentthe fluorescencesignalwascorrectedfor the effectsof the changingpressure,temperatureandmixing duringthe stroke. However, no correctionswere madefor the attenuationof the laser intensity orinducedfluorescenceon its way throughthe combustionchamberasthe authorsclaim that itcanbe neglected. The resultsshowed that NO formationdoesnot startduring the premixed
25
2 Laser-baseddiagnosticsin a dieselengine
burn (which is fuel-rich), but beginsaroundtheperipheryof thefuel jet just afterthediffusionflameforms. During theburn-outphaseNO remainsalongthetrackof thefuel jet andtheNOformationcontinuesin thehotpost-combustiongases,afterthediffusionflamehasgoneout.
BesidesNO distributionsOH radicaldistributionsin dieselcombustionareobtainedusingthe LIF techniqueaswell [15,35,36,39,43]. Thesedistributionsgive informationaboutthelocationof thediffusionflame. During dieselcombustiontheOH radicalsaremainly presentin a narrow region at the flame front (the reactionzone)becausethreebody recombinationreactionsthatreducethehighflamefront OH concentrationsto equilibriumlevelsoccurrapidlyat dieselenginepressures.It wasfoundthatthediffusionflameis locatedaroundtheperipheryof thejet [15].
Detectionof thenaturalflameluminosity, LIS andLII, arecommonlyusedtechniquesforthevisualisationof sootin dieselflames[7,11,12,14,43–46]. Thenaturalflameluminosity isgenerallyacceptedto arisefrom glowing sootparticles(exceptperhapsduring the very earlystageof combustion; seee.g. [13]). Its spatialdistribution and (spectral)intensity thereforeprovide an experimentallystraightforward, albeit not necessarilyeasily interpretable,way oflearningsomethingaboutthe sootproduction. The LIS techniquedetectsthe radiationof thelaserbeamthat is elasticallyscatteredby thesootparticles(and,in fact,by any otherkind ofparticlesaswell). The principle of the LII techniqueis basedon the detectionof the radia-tion emittedby sootparticlesthat are rapidly heatedby the absorptionof laserlight from ahigh-power laser. Thesetechniques(or combinationsof them)provide informationaboutthedistribution of soot particlesand of variousaspectsof soot including particle sizes,numberdensities,andsootvolumefractionsduringthewholecombustionprocess.
In addition, laser inducedRayleighscatteringallows the investigationof the liquid andvapourphasesof the dieseljet. It canbe usedto obtainthe structureof the liquid dieselfuelspray, aswell asto obtainquantitativedistributionsof thefuel vapourconcentrationduringthedieselcombustionprocess[8,9,47,48]. The fuel/air ratio at a singlepoint in thesprayregionof an evaporatingdieselsprayis also determinedby the useof instantaneousmulti-speciesRamanscattering[49]. This techniqueusesan imagingspectrometerto detectsimultaneouslythe relative intensitiesof Ramanscatteredsignalsfrom a (substitute)fuel molecule(C16H32)andnitrogen(N2).
The two colour method,which is not laser-based,canbe usedto determinesootconcen-trationsand temperatures[33,50–54]. In this methodthe thermalradiationat two differentwavelengthsis detectedandtheflametemperatureor sootconcentrationis determinedfrom theratio of their intensities.Anothertechniquethat is not laser-basedbut needsanintensifiedfastdetectionsystemis thedetectionof thechemiluminescencewhich providesinformationabouttheautoignition. Here,theearly, relatively weaknaturallight emittedby molecules(OH, C2,CH) thatareexcitedbyexothermicchemicalreactionsthatarespecificfor theinitial combustionis detected[13,18].
26
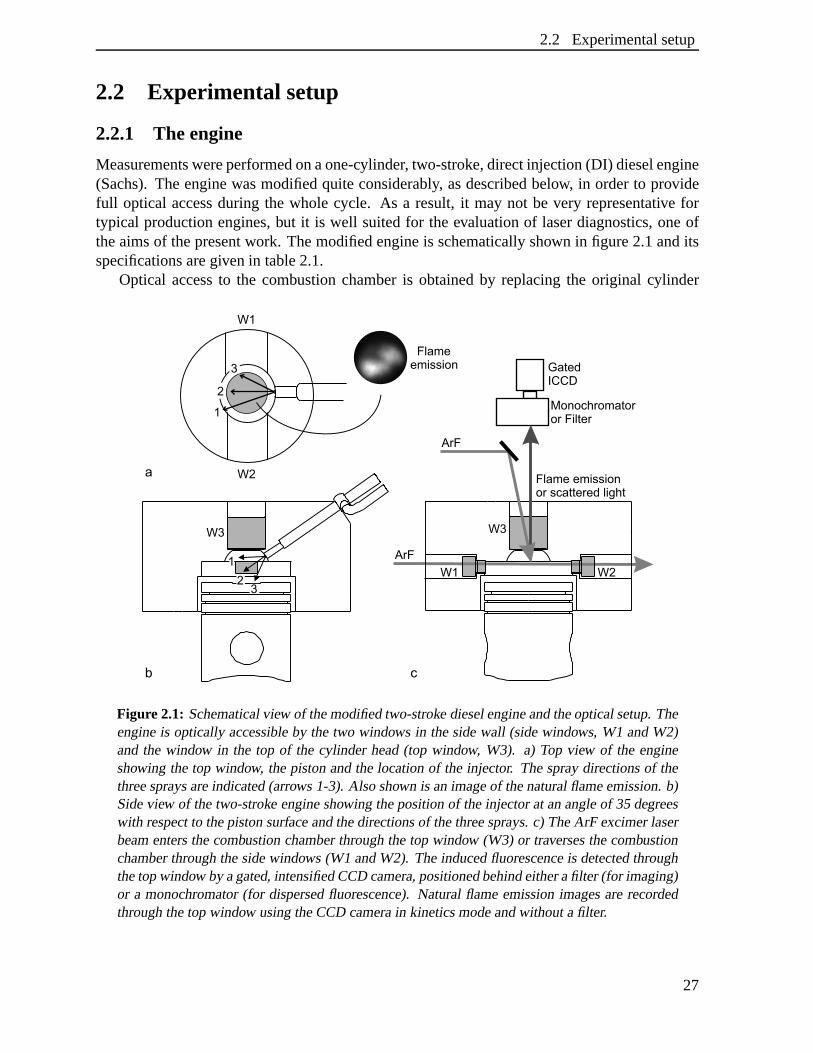
2.2 Experimentalsetup
2.2 Experimental setup
2.2.1 The engine
Measurementswereperformedonaone-cylinder, two-stroke,directinjection(DI) dieselengine(Sachs).Theenginewasmodifiedquiteconsiderably, asdescribedbelow, in orderto providefull optical accessduring the whole cycle. As a result, it may not be very representative fortypical productionengines,but it is well suitedfor the evaluationof laserdiagnostics,oneoftheaimsof thepresentwork. Themodifiedengineis schematicallyshown in figure2.1anditsspecificationsaregivenin table2.1.
Optical accessto the combustion chamberis obtainedby replacingthe original cylinder
Figure2.1: Schematicalview of themodifiedtwo-stroke dieselengineandtheopticalsetup.Theengineis optically accessibleby the two windows in thesidewall (sidewindows, W1 andW2)andthe window in the top of the cylinder head(top window, W3). a) Top view of the engineshowing thetop window, thepistonandthe locationof the injector. Thespraydirectionsof thethreespraysareindicated(arrows 1-3). Also shown is animageof thenaturalflameemission.b)Sideview of thetwo-stroke engineshowing thepositionof theinjectorat anangleof 35 degreeswith respectto thepistonsurfaceandthedirectionsof thethreesprays.c) TheArF excimerlaserbeamentersthecombustionchamberthroughthetop window (W3) or traversesthecombustionchamberthroughthesidewindows (W1 andW2). Theinducedfluorescenceis detectedthroughthetopwindow by agated,intensifiedCCDcamera,positionedbehindeitherafilter (for imaging)or a monochromator(for dispersedfluorescence).Naturalflameemissionimagesarerecordedthroughthetopwindow usingtheCCD camerain kineticsmodeandwithout afilter.
27
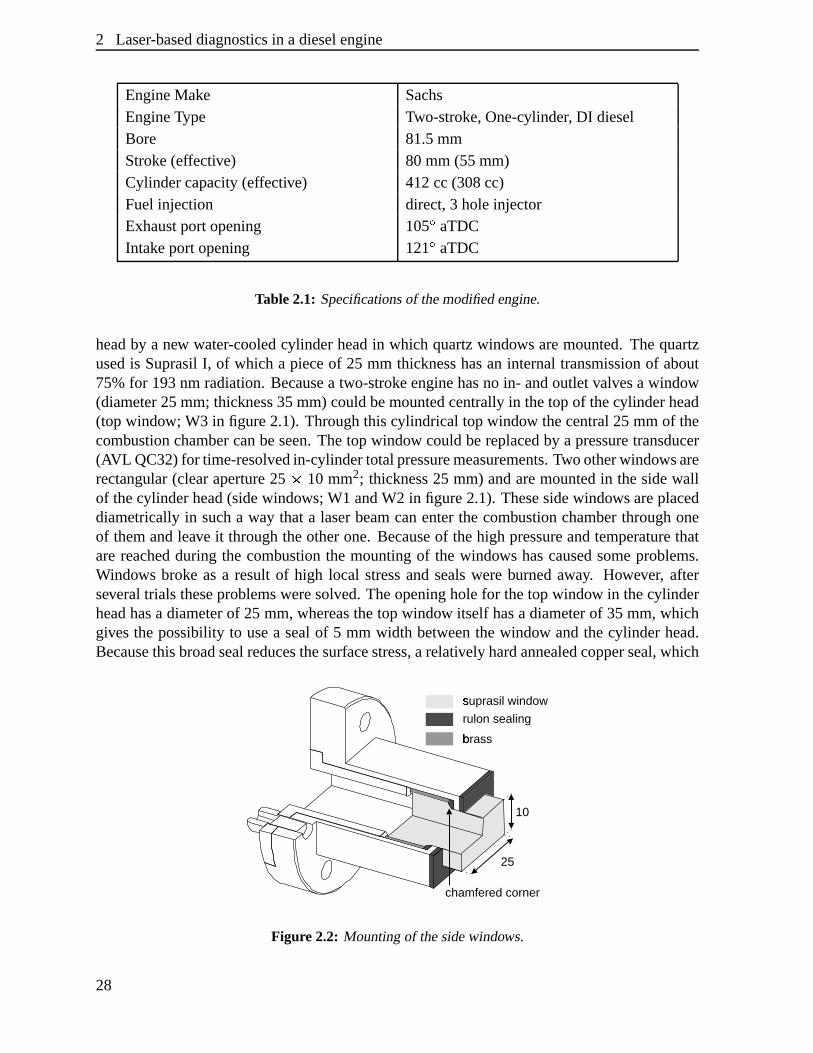
2 Laser-baseddiagnosticsin a dieselengine
EngineMake SachsEngineType Two-stroke,One-cylinder, DI dieselBore 81.5mmStroke (effective) 80 mm (55mm)Cylindercapacity(effective) 412cc (308cc)Fuelinjection direct,3 holeinjectorExhaustportopening 105
�aTDC
Intakeportopening 121�
aTDC
Table2.1: Specificationsof themodifiedengine.
headby a new water-cooledcylinder headin which quartzwindows aremounted.Thequartzusedis SuprasilI, of which a pieceof 25 mm thicknesshasan internaltransmissionof about75%for 193nm radiation.Becausea two-strokeenginehasno in- andoutletvalvesa window(diameter25mm; thickness35mm) couldbemountedcentrallyin thetop of thecylinderhead(top window; W3 in figure2.1). Throughthis cylindrical top window thecentral25 mm of thecombustionchambercanbeseen.Thetop window couldbereplacedby a pressuretransducer(AVL QC32)for time-resolvedin-cylindertotalpressuremeasurements.Twootherwindowsarerectangular(clearaperture25 . 10 mm2; thickness25 mm) andaremountedin thesidewallof thecylinder head(sidewindows;W1 andW2 in figure2.1). Thesesidewindowsareplaceddiametricallyin sucha way that a laserbeamcanenterthe combustionchamberthroughoneof themandleave it throughtheotherone. Becauseof thehigh pressureandtemperaturethatarereachedduring the combustionthe mountingof the windows hascausedsomeproblems.Windows broke asa result of high local stressandsealswereburnedaway. However, afterseveraltrials theseproblemsweresolved.Theopeningholefor thetop window in thecylinderheadhasa diameterof 25 mm,whereasthetop window itself hasa diameterof 35 mm,whichgivesthe possibility to usea sealof 5 mm width betweenthe window andthe cylinder head.Becausethisbroadsealreducesthesurfacestress,arelatively hardannealedcopperseal,which
suprasil window9rulon sealing
brass:
chamfered corner
10
25
Figure2.2: Mountingof thesidewindows.
28
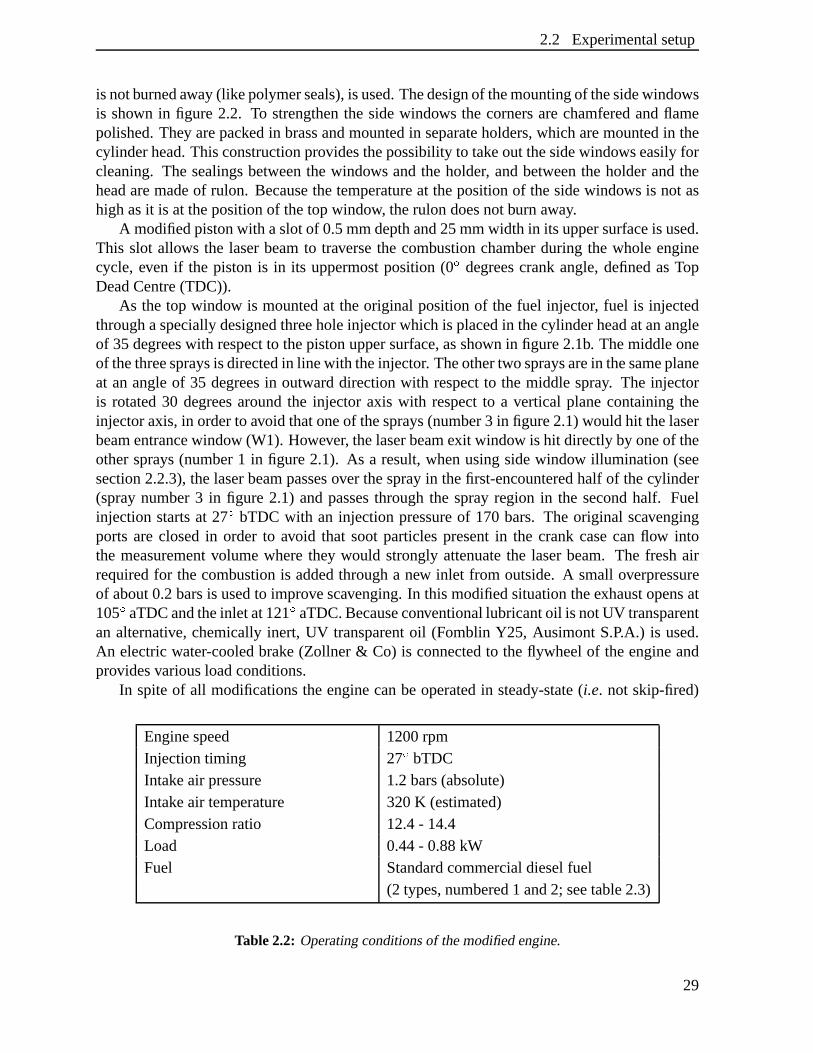
2.2 Experimentalsetup
is notburnedaway(likepolymerseals),is used.Thedesignof themountingof thesidewindowsis shown in figure 2.2. To strengthenthe sidewindows the cornersarechamferedandflamepolished.They arepackedin brassandmountedin separateholders,which aremountedin thecylinderhead.Thisconstructionprovidesthepossibilityto takeout thesidewindowseasilyforcleaning. The sealingsbetweenthe windows andthe holder, andbetweenthe holderandtheheadaremadeof rulon. Becausethetemperatureat thepositionof thesidewindows is not ashighasit is at thepositionof thetopwindow, therulon doesnotburn away.
A modifiedpistonwith aslotof 0.5mmdepthand25mmwidth in its uppersurfaceis used.This slot allows the laserbeamto traversethe combustionchamberduring the whole enginecycle, even if the piston is in its uppermostposition(0
�degreescrankangle,definedasTop
DeadCentre(TDC)).As the top window is mountedat theoriginal positionof the fuel injector, fuel is injected
throughaspeciallydesignedthreeholeinjectorwhich is placedin thecylinderheadatanangleof 35 degreeswith respectto thepistonuppersurface,asshown in figure2.1b. Themiddleoneof thethreespraysis directedin line with theinjector. Theothertwospraysarein thesameplaneat an angleof 35 degreesin outward directionwith respectto the middle spray. The injectoris rotated30 degreesaroundthe injector axis with respectto a vertical planecontainingtheinjectoraxis,in orderto avoid thatoneof thesprays(number3 in figure2.1)wouldhit thelaserbeamentrancewindow (W1). However, thelaserbeamexit window is hit directlyby oneof theothersprays(number1 in figure2.1). As a result,whenusingsidewindow illumination (seesection2.2.3),thelaserbeampassesover thesprayin thefirst-encounteredhalf of thecylinder(spraynumber3 in figure 2.1) andpassesthroughthe sprayregion in the secondhalf. Fuelinjection startsat 27
�bTDC with an injection pressureof 170 bars. The original scavenging
ports are closedin order to avoid that sootparticlespresentin the crank casecanflow intothe measurementvolumewherethey would stronglyattenuatethe laserbeam. The freshairrequiredfor thecombustionis addedthrougha new inlet from outside.A small overpressureof about0.2barsis usedto improvescavenging.In this modifiedsituationtheexhaustopensat105
�aTDCandtheinlet at121
�aTDC.Becauseconventionallubricantoil is notUV transparent
an alternative, chemicallyinert, UV transparentoil (Fomblin Y25, AusimontS.P.A.) is used.An electricwater-cooledbrake (Zollner & Co) is connectedto theflywheelof theengineandprovidesvariousloadconditions.
In spiteof all modificationstheenginecanbe operatedin steady-state(i.e. not skip-fired)
Enginespeed 1200rpmInjectiontiming 27
�bTDC
Intakeair pressure 1.2bars(absolute)Intakeair temperature 320K (estimated)Compressionratio 12.4- 14.4Load 0.44- 0.88kWFuel Standardcommercialdieselfuel
(2 types,numbered1 and2; seetable2.3)
Table2.2: Operatingconditionsof themodifiedengine.
29
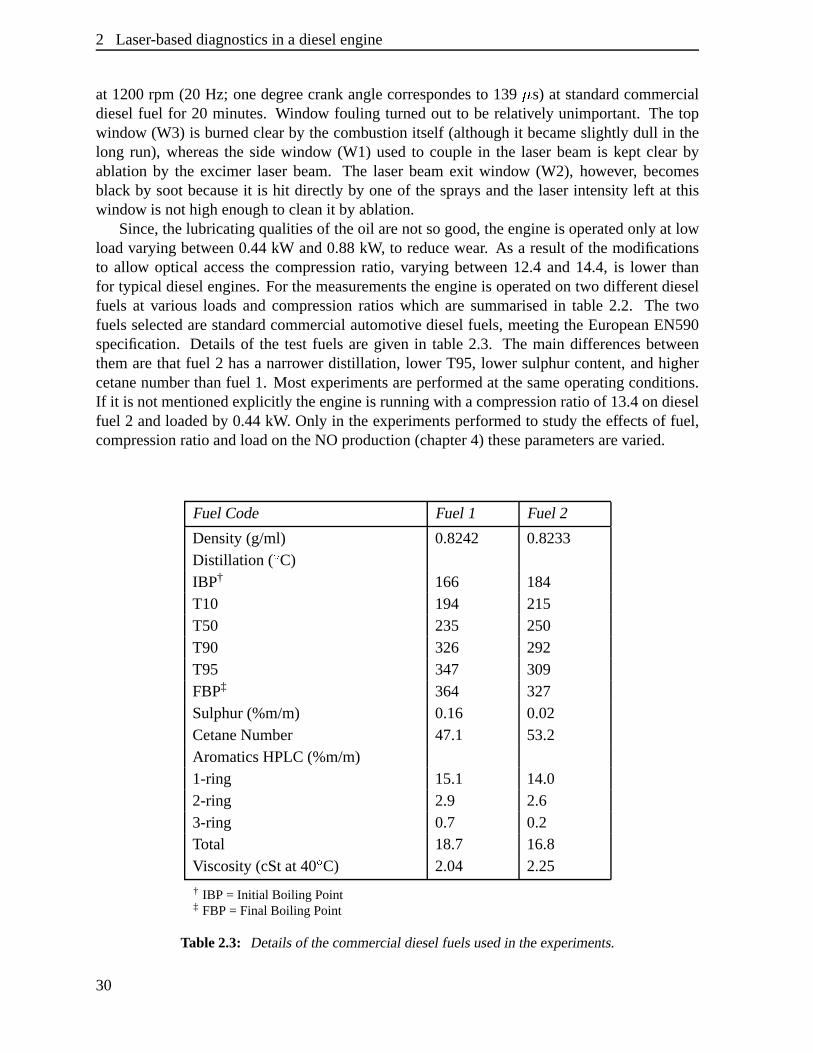
2 Laser-baseddiagnosticsin a dieselengine
at 1200rpm (20 Hz; onedegreecrankanglecorrespondesto 139 7 s) at standardcommercialdieselfuel for 20 minutes. Window fouling turnedout to be relatively unimportant.The topwindow (W3) is burnedclearby thecombustionitself (althoughit becameslightly dull in thelong run), whereasthe side window (W1) usedto couplein the laserbeamis kept clear byablationby the excimer laserbeam. The laserbeamexit window (W2), however, becomesblack by sootbecauseit is hit directly by oneof the spraysandthe laserintensity left at thiswindow is nothighenoughto cleanit by ablation.
Since,thelubricatingqualitiesof theoil arenot sogood,theengineis operatedonly at lowloadvaryingbetween0.44kW and0.88kW, to reducewear. As a resultof themodificationsto allow optical accessthe compressionratio, varying between12.4 and14.4, is lower thanfor typical dieselengines.For themeasurementstheengineis operatedon two differentdieselfuels at variousloadsand compressionratios which are summarisedin table 2.2. The twofuelsselectedarestandardcommercialautomotive dieselfuels,meetingtheEuropeanEN590specification. Detailsof the test fuels aregiven in table2.3. The main differencesbetweenthemarethat fuel 2 hasa narrower distillation, lower T95, lower sulphurcontent,andhighercetanenumberthanfuel 1. Most experimentsareperformedat thesameoperatingconditions.If it is notmentionedexplicitly theengineis runningwith acompressionratioof 13.4ondieselfuel 2 andloadedby 0.44kW. Only in theexperimentsperformedto studytheeffectsof fuel,compressionratioandloadon theNO production(chapter4) theseparametersarevaried.
FuelCode Fuel1 Fuel2
Density(g/ml) 0.8242 0.8233Distillation (
�C)
IBP† 166 184T10 194 215T50 235 250T90 326 292T95 347 309FBP‡ 364 327Sulphur(%m/m) 0.16 0.02CetaneNumber 47.1 53.2AromaticsHPLC(%m/m)1-ring 15.1 14.02-ring 2.9 2.63-ring 0.7 0.2Total 18.7 16.8Viscosity(cStat 40
�C) 2.04 2.25
† IBP = Initial Boiling Point‡ FBP= FinalBoiling Point
Table2.3: Detailsof thecommercialdieselfuelsusedin theexperiments.
30
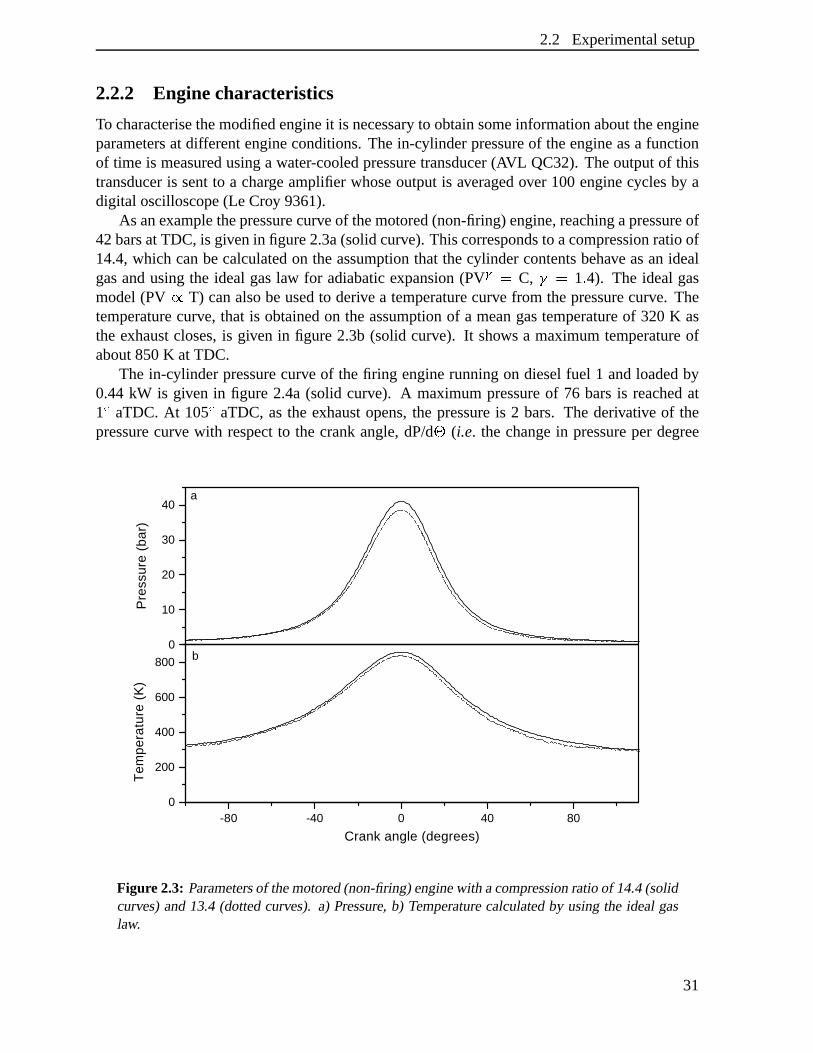
2.2 Experimentalsetup
2.2.2 Enginecharacteristics
To characterisethemodifiedengineit is necessaryto obtainsomeinformationabouttheengineparametersat differentengineconditions.Thein-cylinder pressureof theengineasa functionof time is measuredusinga water-cooledpressuretransducer(AVL QC32).Theoutputof thistransduceris sentto a chargeamplifierwhoseoutputis averagedover 100enginecyclesby adigital oscilloscope(Le Croy 9361).
As anexamplethepressurecurveof themotored(non-firing)engine,reachingapressureof42barsatTDC, is givenin figure2.3a(solidcurve). Thiscorrespondsto acompressionratioof14.4,which canbecalculatedon theassumptionthat thecylinder contentsbehave asan idealgasandusingthe ideal gaslaw for adiabaticexpansion(PV; - C, < - 1 + 4). The ideal gasmodel(PV = T) canalsobeusedto derive a temperaturecurve from thepressurecurve. Thetemperaturecurve, that is obtainedon theassumptionof a meangastemperatureof 320K asthe exhaustcloses,is given in figure 2.3b (solid curve). It shows a maximumtemperatureofabout850K at TDC.
The in-cylinder pressurecurve of thefiring enginerunningon dieselfuel 1 andloadedby0.44 kW is given in figure 2.4a(solid curve). A maximumpressureof 76 barsis reachedat1�
aTDC. At 105�
aTDC, asthe exhaustopens,the pressureis 2 bars. The derivative of thepressurecurve with respectto the crankangle,dP/d
�(i.e. the changein pressureper degree
-80 -40 0 40 800
200
400
600
800 b
Tem
pera
ture
(K
)
Crank angle (degrees)
0
10
20
30
40a
Pre
ssur
e (b
ar)
Figure2.3: Parametersof themotored(non-firing)enginewith acompressionratioof 14.4(solidcurves)and13.4(dottedcurves). a) Pressure,b) Temperaturecalculatedby usingthe ideal gaslaw.
31
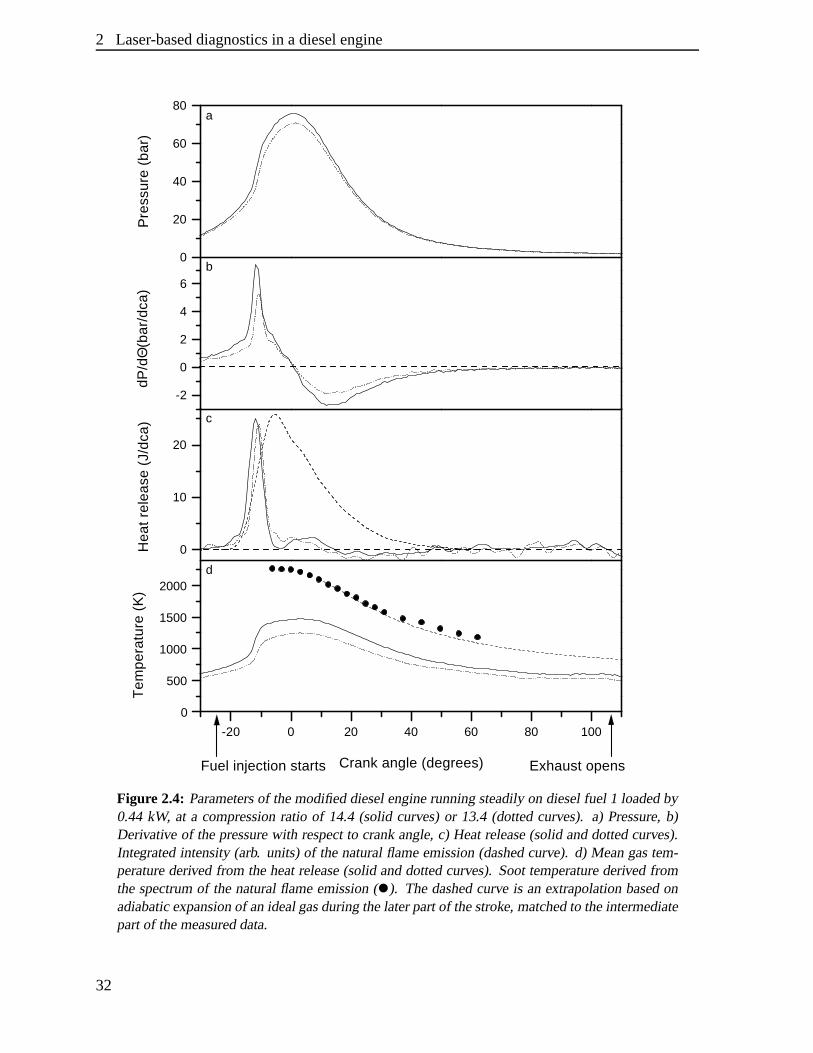
2 Laser-baseddiagnosticsin a dieselengine
-20 0 20 40 60 80 100
0
500
1000
1500
2000d
Exhaust opens
Tem
pera
ture
(K
)
Crank angle (degrees)
0
10
20
c
Hea
t re
leas
e (J
/dca
)
-2
0
2
4
6b
dP/d
Θ(b
ar/d
ca)
0
20
40
60
80a
Fuel injection starts
Pre
ssur
e (b
ar)
Figure 2.4: Parametersof themodifieddieselenginerunningsteadilyon dieselfuel 1 loadedby0.44 kW, at a compressionratio of 14.4 (solid curves)or 13.4 (dottedcurves). a) Pressure,b)Derivative of thepressurewith respectto crankangle,c) Heatrelease(solid anddottedcurves).Integratedintensity(arb. units)of thenaturalflameemission(dashedcurve). d) Meangastem-peraturederived from theheatrelease(solid anddottedcurves). Soottemperaturederived fromthespectrumof thenaturalflameemission( ). Thedashedcurve is anextrapolationbasedonadiabaticexpansionof anidealgasduringthelaterpartof thestroke,matchedto theintermediatepartof themeasureddata.
32
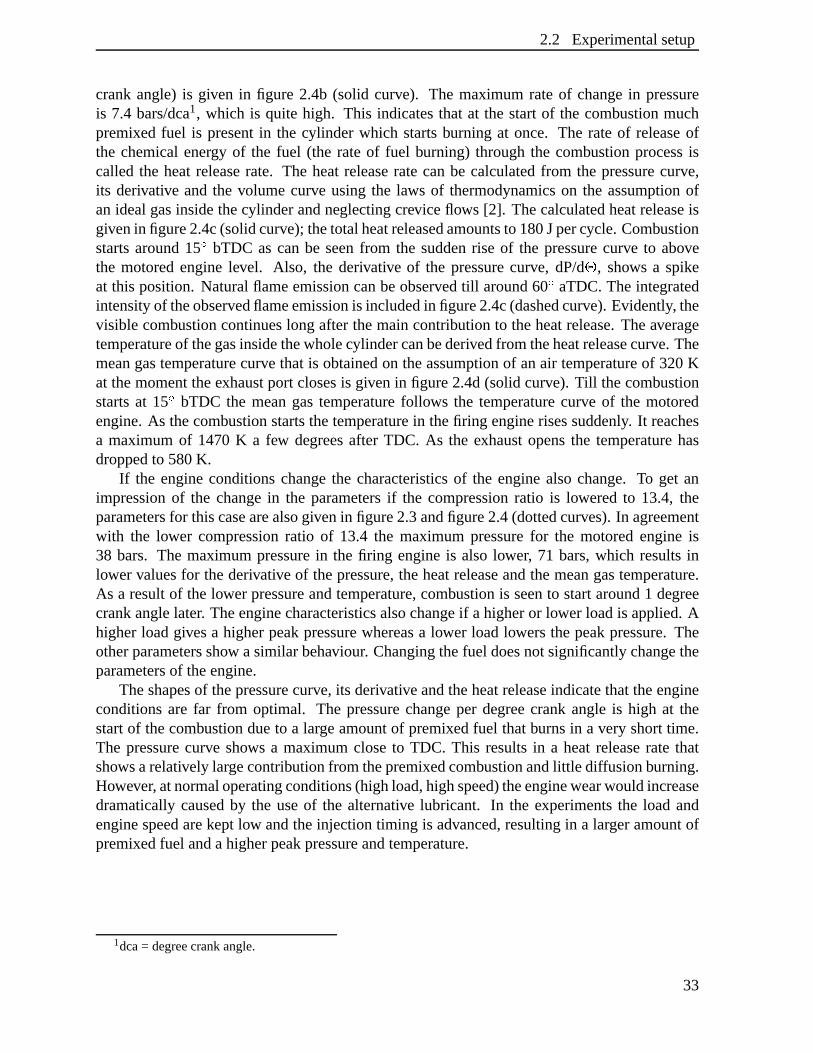
2.2 Experimentalsetup
crankangle)is given in figure 2.4b (solid curve). The maximumrateof changein pressureis 7.4 bars/dca1, which is quite high. This indicatesthat at the startof the combustionmuchpremixed fuel is presentin the cylinder which startsburning at once. The rateof releaseofthe chemicalenergy of the fuel (the rateof fuel burning) throughthe combustionprocessiscalled the heatreleaserate. The heatreleaseratecanbe calculatedfrom the pressurecurve,its derivative andthe volumecurve using the laws of thermodynamicson the assumptionofanidealgasinsidethecylinder andneglectingcrevice flows [2]. Thecalculatedheatreleaseisgivenin figure2.4c(solidcurve); thetotalheatreleasedamountsto 180Jpercycle. Combustionstartsaround15
�bTDC ascanbe seenfrom the suddenrise of the pressurecurve to above
the motoredenginelevel. Also, the derivative of the pressurecurve, dP/d�
, shows a spikeat this position. Naturalflameemissioncanbeobservedtill around60
�aTDC.Theintegrated
intensityof theobservedflameemissionis includedin figure2.4c(dashedcurve). Evidently, thevisible combustioncontinueslong after themaincontribution to theheatrelease.Theaveragetemperatureof thegasinsidethewholecylindercanbederivedfrom theheatreleasecurve. Themeangastemperaturecurve that is obtainedon theassumptionof anair temperatureof 320Kat themomenttheexhaustport closesis givenin figure2.4d(solid curve). Till thecombustionstartsat 15
�bTDC the meangastemperaturefollows the temperaturecurve of the motored
engine.As thecombustionstartsthetemperaturein thefiring enginerisessuddenly. It reachesa maximumof 1470K a few degreesafter TDC. As the exhaustopensthe temperaturehasdroppedto 580K.
If the engineconditionschangethe characteristicsof the enginealsochange. To get animpressionof the changein the parametersif the compressionratio is loweredto 13.4, theparametersfor thiscasearealsogivenin figure2.3andfigure2.4(dottedcurves).In agreementwith the lower compressionratio of 13.4 the maximumpressurefor the motoredengineis38 bars. The maximumpressurein the firing engineis also lower, 71 bars,which resultsinlower valuesfor thederivative of thepressure,theheatreleaseandthemeangastemperature.As a resultof the lower pressureandtemperature,combustionis seento startaround1 degreecrankanglelater. Theenginecharacteristicsalsochangeif ahigheror lower loadis applied.Ahigherloadgivesa higherpeakpressurewhereasa lower load lowersthepeakpressure.Theotherparametersshow asimilarbehaviour. Changingthefuel doesnotsignificantlychangetheparametersof theengine.
Theshapesof thepressurecurve, its derivativeandtheheatreleaseindicatethattheengineconditionsare far from optimal. The pressurechangeper degreecrank angleis high at thestartof thecombustiondueto a largeamountof premixedfuel thatburnsin a very shorttime.The pressurecurve shows a maximumcloseto TDC. This resultsin a heatreleaserate thatshowsarelatively largecontributionfrom thepremixedcombustionandlittle diffusionburning.However, atnormaloperatingconditions(highload,highspeed)theenginewearwouldincreasedramaticallycausedby the useof the alternative lubricant. In the experimentsthe load andenginespeedarekept low andtheinjectiontiming is advanced,resultingin a largeramountofpremixedfuel andahigherpeakpressureandtemperature.
1dca= degreecrankangle.
33
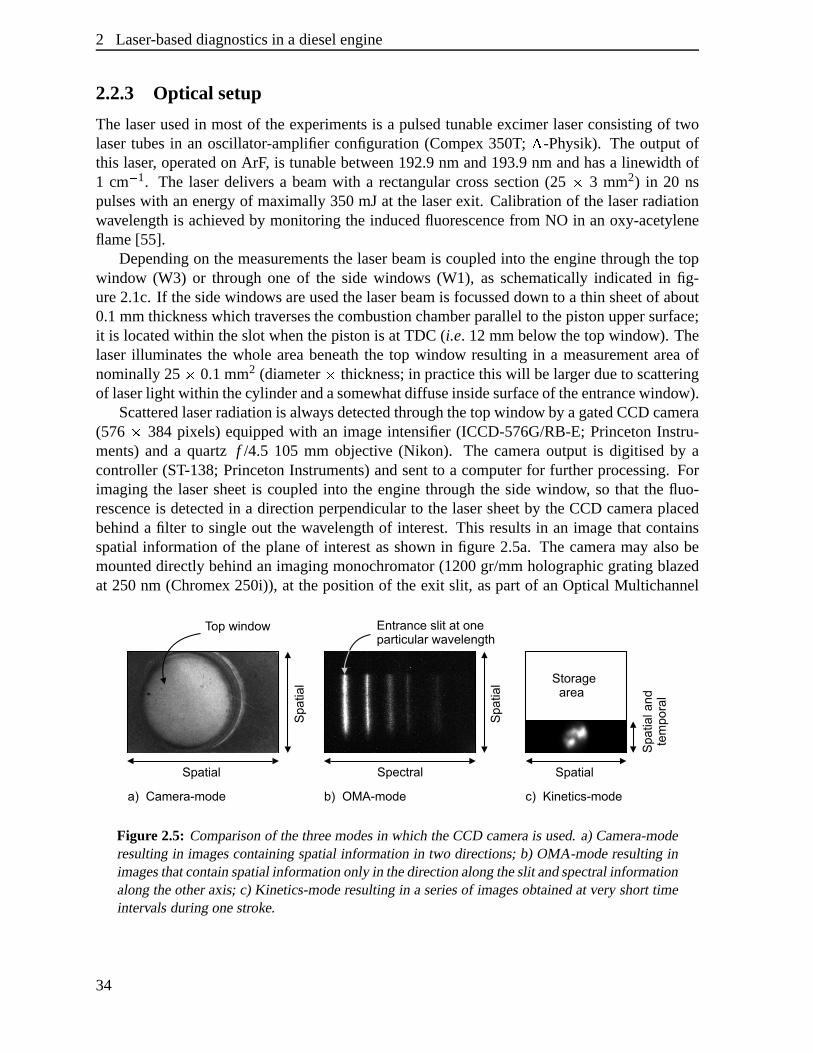
2 Laser-baseddiagnosticsin a dieselengine
2.2.3 Optical setup
The laserusedin mostof theexperimentsis a pulsedtunableexcimer laserconsistingof twolasertubesin an oscillator-amplifier configuration(Compex 350T; > -Physik). The outputofthis laser, operatedon ArF, is tunablebetween192.9nm and193.9nm andhasa linewidth of1 cm3 1. The laserdeliversa beamwith a rectangularcrosssection(25 . 3 mm2) in 20 nspulseswith anenergy of maximally350mJat the laserexit. Calibrationof the laserradiationwavelengthis achievedby monitoringthe inducedfluorescencefrom NO in an oxy-acetyleneflame[55].
Dependingon themeasurementsthe laserbeamis coupledinto theenginethroughthetopwindow (W3) or throughone of the side windows (W1), as schematicallyindicatedin fig-ure2.1c. If thesidewindowsareusedthelaserbeamis focusseddown to a thin sheetof about0.1mmthicknesswhich traversesthecombustionchamberparallelto thepistonuppersurface;it is locatedwithin theslot whenthepistonis at TDC (i.e. 12 mm below thetop window). Thelaserilluminatesthe whole areabeneaththe top window resultingin a measurementareaofnominally25 . 0.1mm2 (diameter. thickness;in practicethiswill belargerdueto scatteringof laserlight within thecylinderandasomewhatdiffuseinsidesurfaceof theentrancewindow).
Scatteredlaserradiationis alwaysdetectedthroughthetopwindow by agatedCCDcamera(576 . 384 pixels) equippedwith an imageintensifier(ICCD-576G/RB-E;PrincetonInstru-ments)and a quartz f /4.5 105 mm objective (Nikon). The cameraoutput is digitised by acontroller(ST-138; PrincetonInstruments)andsentto a computerfor furtherprocessing.Forimagingthe lasersheetis coupledinto the enginethroughthe sidewindow, so that the fluo-rescenceis detectedin a directionperpendicularto the lasersheetby theCCD cameraplacedbehinda filter to singleout the wavelengthof interest.This resultsin an imagethat containsspatialinformationof the planeof interestasshown in figure 2.5a. The cameramay alsobemounteddirectly behindanimagingmonochromator(1200gr/mmholographicgratingblazedat 250nm (Chromex 250i)), at thepositionof theexit slit, aspartof anOpticalMultichannel
Figure 2.5: Comparisonof thethreemodesin which theCCD camerais used.a) Camera-moderesultingin imagescontainingspatialinformationin two directions;b) OMA-moderesultinginimagesthatcontainspatialinformationonly in thedirectionalongtheslit andspectralinformationalongtheotheraxis;c) Kinetics-moderesultingin a seriesof imagesobtainedat very shorttimeintervalsduringonestroke.
34
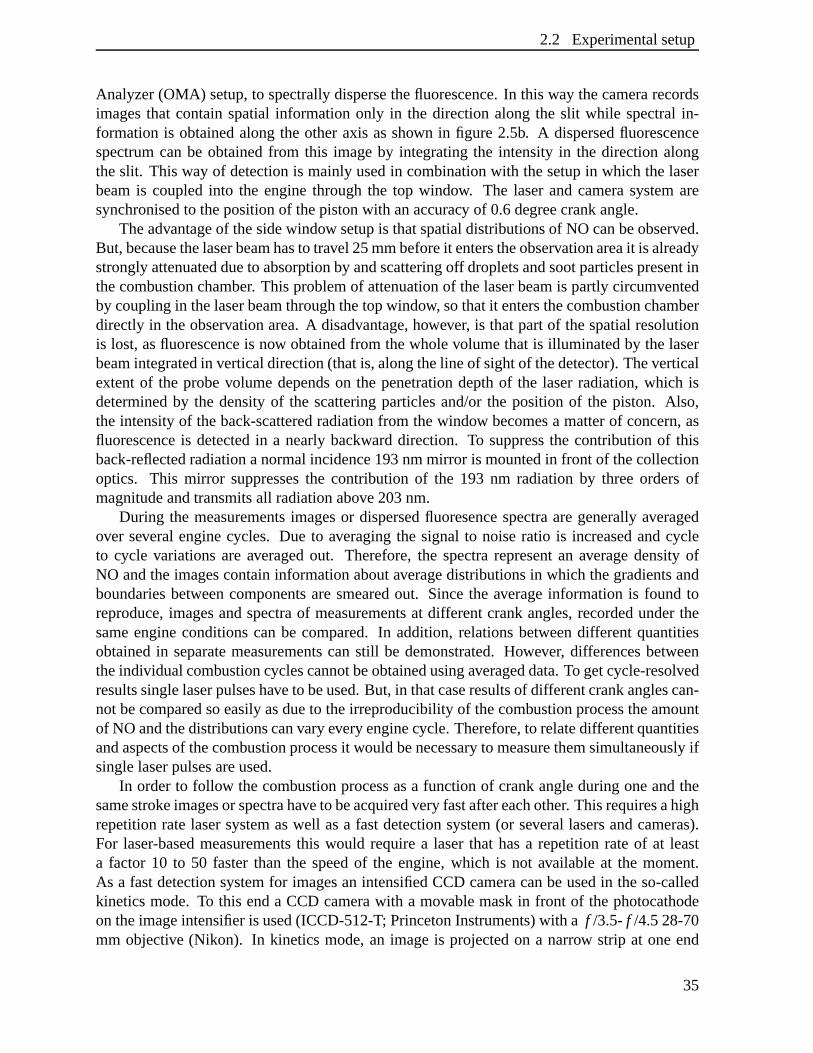
2.2 Experimentalsetup
Analyzer(OMA) setup,to spectrallydispersethefluorescence.In this way thecamerarecordsimagesthat containspatialinformationonly in the directionalong the slit while spectralin-formationis obtainedalongthe otheraxis asshown in figure 2.5b. A dispersedfluorescencespectrumcanbe obtainedfrom this imageby integratingthe intensity in the directionalongtheslit. This way of detectionis mainly usedin combinationwith thesetupin which thelaserbeamis coupledinto the enginethroughthe top window. The laserandcamerasystemaresynchronisedto thepositionof thepistonwith anaccuracy of 0.6degreecrankangle.
Theadvantageof thesidewindow setupis thatspatialdistributionsof NO canbeobserved.But,becausethelaserbeamhasto travel 25mmbeforeit enterstheobservationareait is alreadystronglyattenuateddueto absorptionby andscatteringoff dropletsandsootparticlespresentinthecombustionchamber. This problemof attenuationof thelaserbeamis partly circumventedby couplingin thelaserbeamthroughthetopwindow, sothatit entersthecombustionchamberdirectly in theobservationarea.A disadvantage,however, is thatpartof thespatialresolutionis lost, asfluorescenceis now obtainedfrom thewholevolumethat is illuminatedby thelaserbeamintegratedin verticaldirection(thatis,alongtheline of sightof thedetector).Theverticalextent of the probevolumedependson the penetrationdepthof the laserradiation,which isdeterminedby the densityof the scatteringparticlesand/orthe positionof the piston. Also,the intensityof theback-scatteredradiationfrom thewindow becomesa matterof concern,asfluorescenceis detectedin a nearlybackward direction. To suppressthe contribution of thisback-reflectedradiationanormalincidence193nmmirror is mountedin front of thecollectionoptics. This mirror suppressesthe contribution of the 193 nm radiationby threeordersofmagnitudeandtransmitsall radiationabove203nm.
During the measurementsimagesor dispersedfluoresencespectraaregenerallyaveragedover several enginecycles. Due to averagingthe signal to noiseratio is increasedandcycleto cycle variationsare averagedout. Therefore,the spectrarepresentan averagedensityofNO andtheimagescontaininformationaboutaveragedistributionsin which thegradientsandboundariesbetweencomponentsaresmearedout. Sincethe averageinformation is found toreproduce,imagesandspectraof measurementsat differentcrankangles,recordedunderthesameengineconditionscanbe compared.In addition, relationsbetweendifferentquantitiesobtainedin separatemeasurementscanstill be demonstrated.However, differencesbetweentheindividualcombustioncyclescannotbeobtainedusingaverageddata.To getcycle-resolvedresultssinglelaserpulseshaveto beused.But, in thatcaseresultsof differentcrankanglescan-not becomparedsoeasilyasdueto theirreproducibilityof thecombustionprocesstheamountof NO andthedistributionscanvaryeveryenginecycle. Therefore,to relatedifferentquantitiesandaspectsof thecombustionprocessit wouldbenecessaryto measurethemsimultaneouslyifsinglelaserpulsesareused.
In orderto follow thecombustionprocessasa functionof crankangleduringoneandthesamestrokeimagesor spectrahaveto beacquiredveryfastaftereachother. Thisrequiresahighrepetitionratelasersystemaswell asa fastdetectionsystem(or several lasersandcameras).For laser-basedmeasurementsthis would requirea laserthat hasa repetitionrateof at leasta factor 10 to 50 fasterthan the speedof the engine,which is not availableat the moment.As a fastdetectionsystemfor imagesan intensifiedCCD cameracanbeusedin theso-calledkineticsmode. To this enda CCD camerawith a movablemaskin front of the photocathodeontheimageintensifieris used(ICCD-512-T; PrincetonInstruments)with a f /3.5-f /4.528-70mm objective (Nikon). In kineticsmode,an imageis projectedon a narrow strip at oneend
35

2 Laser-baseddiagnosticsin a dieselengine
of the imageintensifierandtherestof the intensifieris maskedandusedasa storagearea,asshown in figure2.5c. After recordingan imagetherows in the illuminatedareaareshiftedtothemaskedpartof thephotocathodeandanew imagecanberecordedin theexposedpart.Thetime betweenthe imagesis determinedby the frequency that is usedto openthe gateagain.However, the minimum time is determinedby the numberof rows in the unmasked areaandthe time requiredto shift a row (minimal 1.6 7 s for this particulardetectionsystem). If, forexample,50 rows of the total of 512 rows areunmasked, 10 imagescanbe acquiredwith aminimum time of 80 7 s betweenthe images.The camerain kineticsmodeis usedto obtainsingleshotimagesof thenaturalflameemission,whichis alsodetectedthroughthetopwindow,at differentcrankanglesduringonestroke. This way theflamedevelopmentduringonestrokecanbefollowedanddifferencesbetweendifferentstrokescanbeseen.
2.3 Optical diagnostics
To studytheNO formationinsidethecylinder of the two-stroke dieselenginemainly theLIFtechniqueis applied.In addition,elasticscatteringof thelaserradiationis usedto obtaininfor-mationaboutthe local intensityof the laserradiationin therunningengine.Thespontaneousemissionof the flames(naturalflameemission)is observed in orderto get informationabouttheflamestructureandthetemperatureof thesootparticles.Brief descriptionsof thedifferentopticaltechniques,with anemphasison theaspectsimportantfor theinvestigationof thecom-bustionprocessinsidethetwo-stroke engine,will begivenbelow. More extendeddescriptionscanbefoundin theliterature[30–33].
2.3.1 Spontaneouslight emission
Justdetectingthespontaneouslight emissionfrom theflameis probablythemoststraightfor-wardopticaltechniqueto getsomeinformationaboutthecombustionprocess.In dieselengineswith highly sooting,luminous,non-transparentflamesthespontaneousemissionis dominatedby the thermalblack (or grey) bodyemissionfrom incandescentsootparticlesthatareheatedto flametemperatures.Thisemissionhasabroadspectraldistributionwith anintensitythatis afunctionof thetemperatureandthesootvolumefraction[33].
However, it shouldbe notedthatbesidesthis strongsootluminosity thespontaneouslightemissionalsocontainsa relatively weaknaturalemissionfrom gaseouscombustionproducts(mainly OH, CH andC2 radicals),dueto aprocesscalledchemiluminescence[13,18]. Chemi-luminescencearisesfrom combustionradicals,which areraisedto anexcitedstateby exother-mic chemicalreactionsandthensubsequentlydecaybackto their groundstateby emitting aphoton. The wavelengthof thephotonis characteristicfor the emittingmoleculeandassuchit providesinformationaboutthe chemicalreactionsthat occur. Becausechemiluminescenceis produceddirectly by the exothermicreactionsthat play a role in the early combustion(i.e.beforesootis formed)it givesinformationaboutthelocation(in bothspaceandtime)of theini-tial combustion(autoignition).Subsequentto theearlycombustion,sootformationis inducedby therising temperatureandluminoussootappears.Althoughchemiluminescencecontinuesto occurthroughoutthewholecombustionprocess,theintenseyellow-whiteemissionfrom theincandescentsootparticlescompletelydominatesover theweaker chemiluminescenceassoon
36
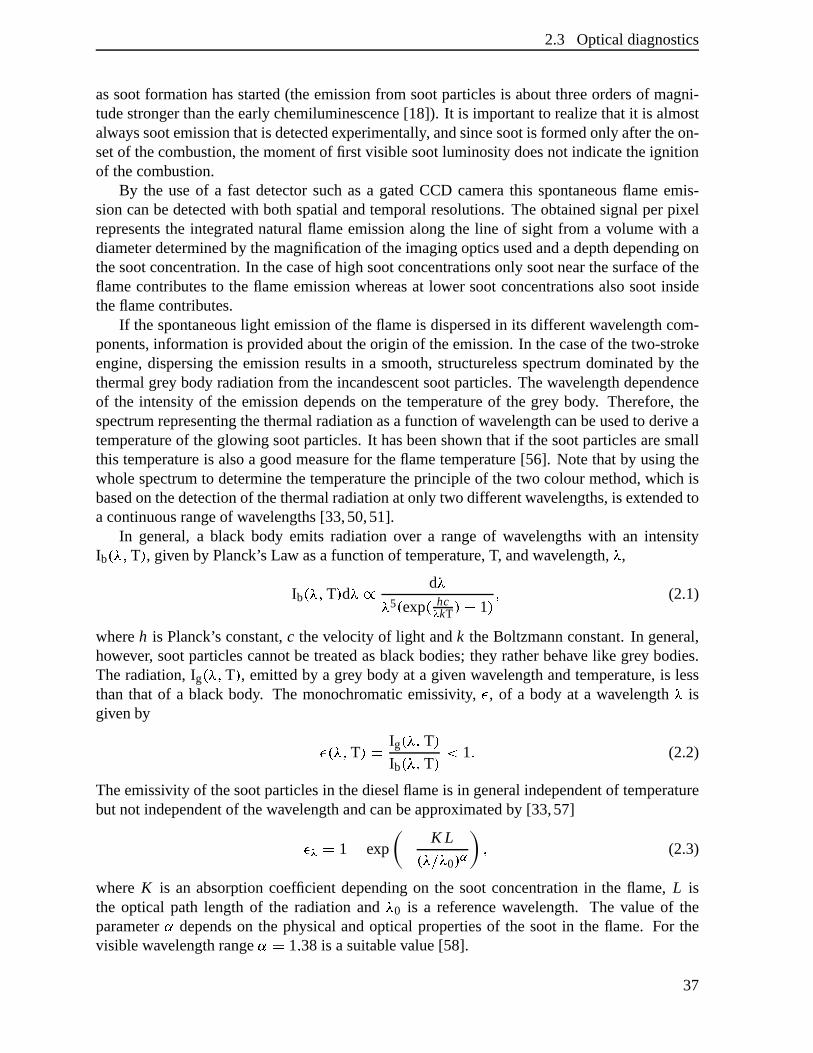
2.3 Opticaldiagnostics
assootformationhasstarted(theemissionfrom sootparticlesis aboutthreeordersof magni-tudestrongerthantheearlychemiluminescence[18]). It is importantto realizethatit is almostalwayssootemissionthatis detectedexperimentally, andsincesootis formedonly aftertheon-setof thecombustion,themomentof first visible sootluminositydoesnot indicatetheignitionof thecombustion.
By the useof a fast detectorsuchasa gatedCCD camerathis spontaneousflameemis-sioncanbedetectedwith bothspatialandtemporalresolutions.Theobtainedsignalperpixelrepresentsthe integratednaturalflameemissionalongthe line of sight from a volumewith adiameterdeterminedby themagnificationof theimagingopticsusedandadepthdependingonthesootconcentration.In thecaseof highsootconcentrationsonly sootnearthesurfaceof theflamecontributesto the flameemissionwhereasat lower sootconcentrationsalsosoot insidetheflamecontributes.
If thespontaneouslight emissionof theflameis dispersedin its differentwavelengthcom-ponents,informationis providedabouttheorigin of theemission.In thecaseof thetwo-strokeengine,dispersingthe emissionresultsin a smooth,structurelessspectrumdominatedby thethermalgrey bodyradiationfrom theincandescentsootparticles.Thewavelengthdependenceof the intensityof the emissiondependson the temperatureof the grey body. Therefore,thespectrumrepresentingthethermalradiationasa functionof wavelengthcanbeusedto deriveatemperatureof theglowing sootparticles.It hasbeenshown that if thesootparticlesaresmallthis temperatureis alsoa goodmeasurefor theflametemperature[56]. Notethatby usingthewholespectrumto determinethetemperaturetheprincipleof thetwo colourmethod,which isbasedonthedetectionof thethermalradiationatonly two differentwavelengths,is extendedtoacontinuousrangeof wavelengths[33,50,51].
In general,a black body emits radiationover a rangeof wavelengthswith an intensityIb ?A@�B T C , givenby Planck’s Law asa functionof temperature,T, andwavelength,@ ,
Ib ?�@DB TC d@FE d@@ 5 ? exp ? hcG
kT CIH 1C B (2.1)
whereh is Planck’s constant,c thevelocity of light andk theBoltzmannconstant.In general,however, sootparticlescannotbe treatedasblackbodies;they ratherbehave like grey bodies.Theradiation,Ig ?A@DB T C , emittedby a grey bodyat a givenwavelengthandtemperature,is lessthanthat of a black body. The monochromaticemissivity, J , of a body at a wavelength@ isgivenby
J ?A@DB T CLK Ig ?A@DB T CIb ?A@DB T C
M 1 N (2.2)
Theemissivity of thesootparticlesin thedieselflameis in generalindependentof temperaturebut not independentof thewavelengthandcanbeapproximatedby [33,57]
J G K 1 H exp H K L
?�@POQ@ 0 C0R B (2.3)
whereK is an absorptioncoefficient dependingon the sootconcentrationin the flame, L isthe optical path length of the radiationand @ 0 is a referencewavelength. The value of theparameterS dependson the physicalandoptical propertiesof the soot in the flame. For thevisible wavelengthrangeS�K 1 N 38 is asuitablevalue[58].
37
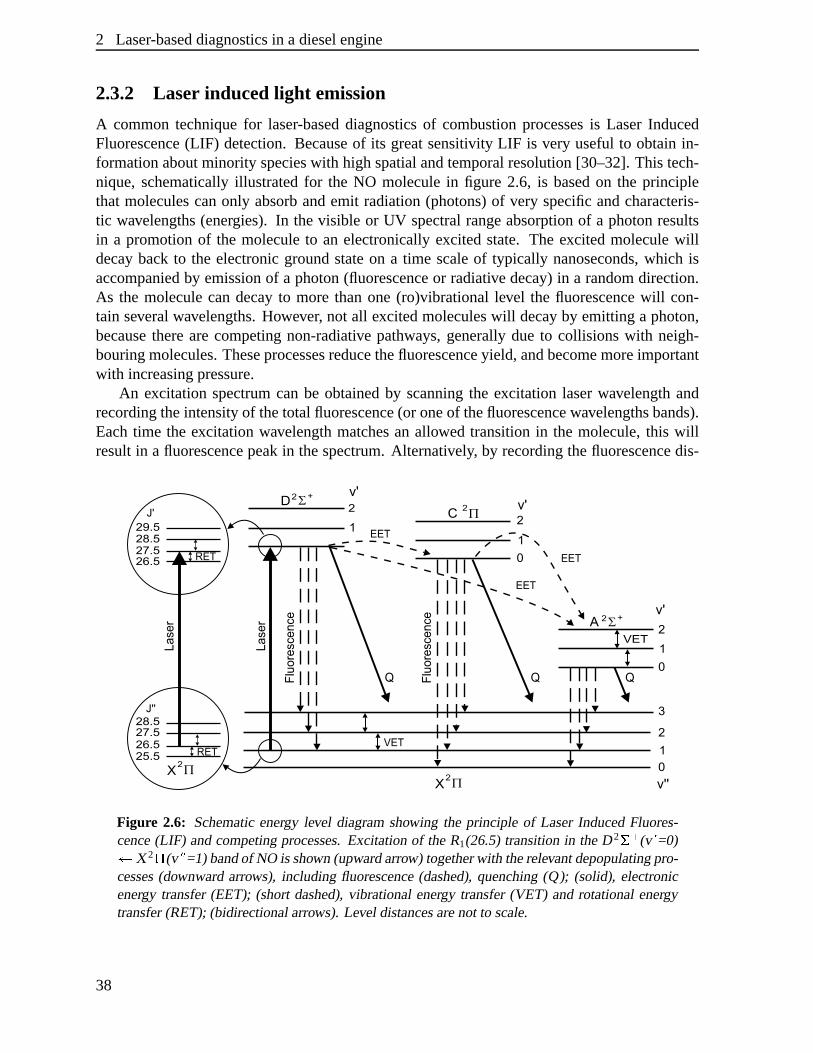
2 Laser-baseddiagnosticsin a dieselengine
2.3.2 Laser induced light emission
A commontechniquefor laser-baseddiagnosticsof combustion processesis Laser InducedFluorescence(LIF) detection.Becauseof its greatsensitivity LIF is very usefulto obtainin-formationaboutminority specieswith highspatialandtemporalresolution[30–32]. This tech-nique, schematicallyillustratedfor the NO moleculein figure 2.6, is basedon the principlethat moleculescanonly absorbandemit radiation(photons)of very specificandcharacteris-tic wavelengths(energies). In thevisible or UV spectralrangeabsorptionof a photonresultsin a promotionof the moleculeto an electronicallyexcited state. The excited moleculewilldecaybackto the electronicgroundstateon a time scaleof typically nanoseconds,which isaccompaniedby emissionof a photon(fluorescenceor radiative decay)in a randomdirection.As the moleculecandecayto more thanone(ro)vibrationallevel the fluorescencewill con-tain severalwavelengths.However, not all excitedmoleculeswill decayby emittinga photon,becausetherearecompetingnon-radiative pathways,generallydue to collisionswith neigh-bouringmolecules.Theseprocessesreducethefluorescenceyield, andbecomemoreimportantwith increasingpressure.
An excitation spectrumcanbe obtainedby scanningthe excitation laserwavelengthandrecordingtheintensityof thetotal fluorescence(or oneof thefluorescencewavelengthsbands).Eachtime the excitation wavelengthmatchesan allowed transitionin the molecule,this willresultin a fluorescencepeakin thespectrum.Alternatively, by recordingthefluorescencedis-
Figure 2.6: Schematicenergy level diagramshowing the principle of LaserInducedFluores-cence(LIF) andcompetingprocesses.Excitationof theR1(26.5) transitionin theD 2 T�U (v V =0)W X 2 X (v V V =1)bandof NO is shown (upwardarrow) togetherwith therelevantdepopulatingpro-cesses(downward arrows), including fluorescence(dashed),quenching(Q); (solid), electronicenergy transfer(EET); (shortdashed),vibrationalenergy transfer(VET) androtationalenergytransfer(RET); (bidirectionalarrows). Level distancesarenot to scale.
38
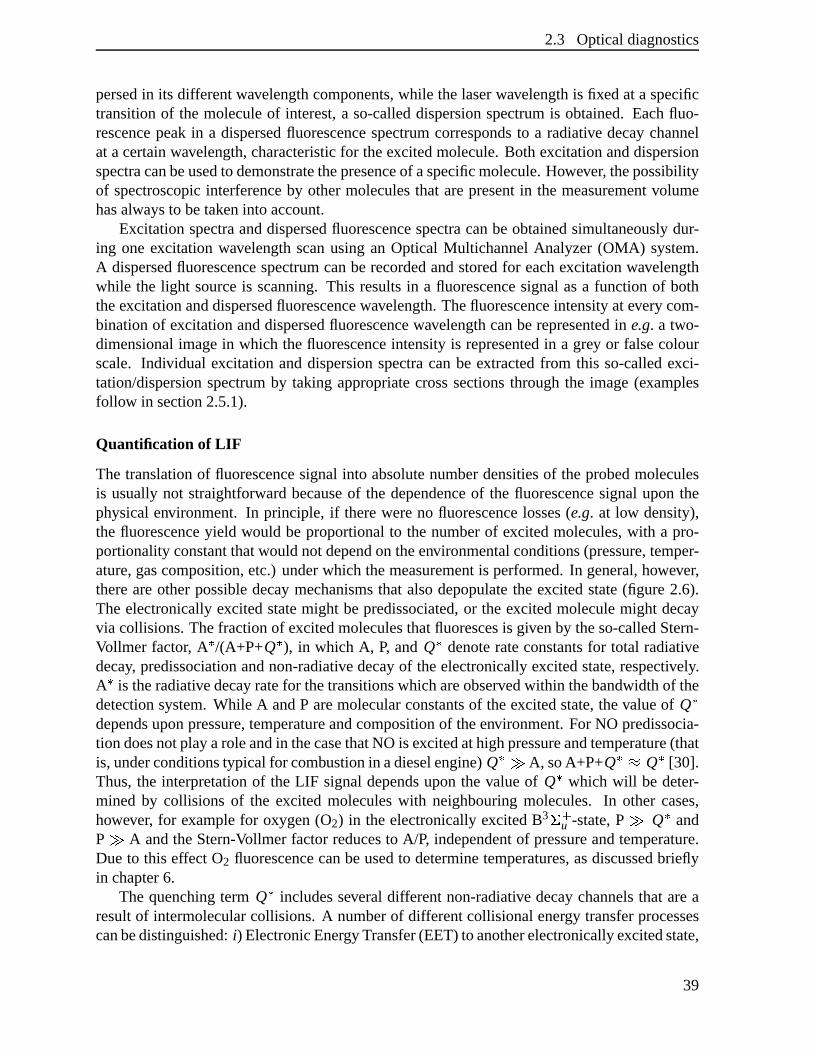
2.3 Opticaldiagnostics
persedin its differentwavelengthcomponents,while thelaserwavelengthis fixedat a specifictransitionof the moleculeof interest,a so-calleddispersionspectrumis obtained.Eachfluo-rescencepeakin a dispersedfluorescencespectrumcorrespondsto a radiative decaychannelat a certainwavelength,characteristicfor theexcitedmolecule.Both excitationanddispersionspectracanbeusedto demonstratethepresenceof aspecificmolecule.However, thepossibilityof spectroscopicinterferenceby othermoleculesthat arepresentin the measurementvolumehasalwaysto betakeninto account.
Excitationspectraanddispersedfluorescencespectracanbeobtainedsimultaneouslydur-ing oneexcitation wavelengthscanusingan Optical MultichannelAnalyzer (OMA) system.A dispersedfluorescencespectrumcanberecordedandstoredfor eachexcitationwavelengthwhile the light sourceis scanning.This resultsin a fluorescencesignalasa function of boththeexcitationanddispersedfluorescencewavelength.Thefluorescenceintensityat everycom-binationof excitationanddispersedfluorescencewavelengthcanberepresentedin e.g. a two-dimensionalimagein which thefluorescenceintensityis representedin a grey or falsecolourscale. Individual excitation anddispersionspectracanbe extractedfrom this so-calledexci-tation/dispersionspectrumby taking appropriatecrosssectionsthroughthe image(examplesfollow in section2.5.1).
Quantification of LIF
The translationof fluorescencesignalinto absolutenumberdensitiesof theprobedmoleculesis usuallynot straightforward becauseof the dependenceof the fluorescencesignaluponthephysicalenvironment. In principle, if therewereno fluorescencelosses(e.g. at low density),the fluorescenceyield would be proportionalto the numberof excitedmolecules,with a pro-portionalityconstantthatwouldnotdependon theenvironmentalconditions(pressure,temper-ature,gascomposition,etc.) underwhich themeasurementis performed.In general,however,thereareotherpossibledecaymechanismsthat alsodepopulatethe excited state(figure 2.6).The electronicallyexcitedstatemight bepredissociated,or the excitedmoleculemight decayvia collisions.Thefractionof excitedmoleculesthatfluorescesis givenby theso-calledStern-Vollmer factor, A Y /(A+P+QY ), in which A, P, and QY denoterateconstantsfor total radiativedecay, predissociationandnon-radiative decayof theelectronicallyexcitedstate,respectively.A Y is theradiativedecayratefor thetransitionswhichareobservedwithin thebandwidthof thedetectionsystem.While A andP aremolecularconstantsof theexcitedstate,thevalueof QYdependsuponpressure,temperatureandcompositionof theenvironment.For NO predissocia-tion doesnotplayaroleandin thecasethatNO is excitedathighpressureandtemperature(thatis,underconditionstypical for combustionin adieselengine)QY[Z A, soA+P+QY]\ QY [30].Thus,the interpretationof the LIF signaldependsuponthe valueof QY which will be deter-mined by collisions of the excited moleculeswith neighbouringmolecules. In other cases,however, for examplefor oxygen(O2) in theelectronicallyexcitedB3 ^`_
u -state,P Z QY andP Z A andtheStern-Vollmer factorreducesto A/P, independentof pressureandtemperature.Dueto this effect O2 fluorescencecanbeusedto determinetemperatures,asdiscussedbrieflyin chapter6.
The quenchingterm QY includesseveral differentnon-radiative decaychannelsthat arearesultof intermolecularcollisions. A numberof differentcollisionalenergy transferprocessescanbedistinguished:i) ElectronicEnergyTransfer(EET)to anotherelectronicallyexcitedstate,
39
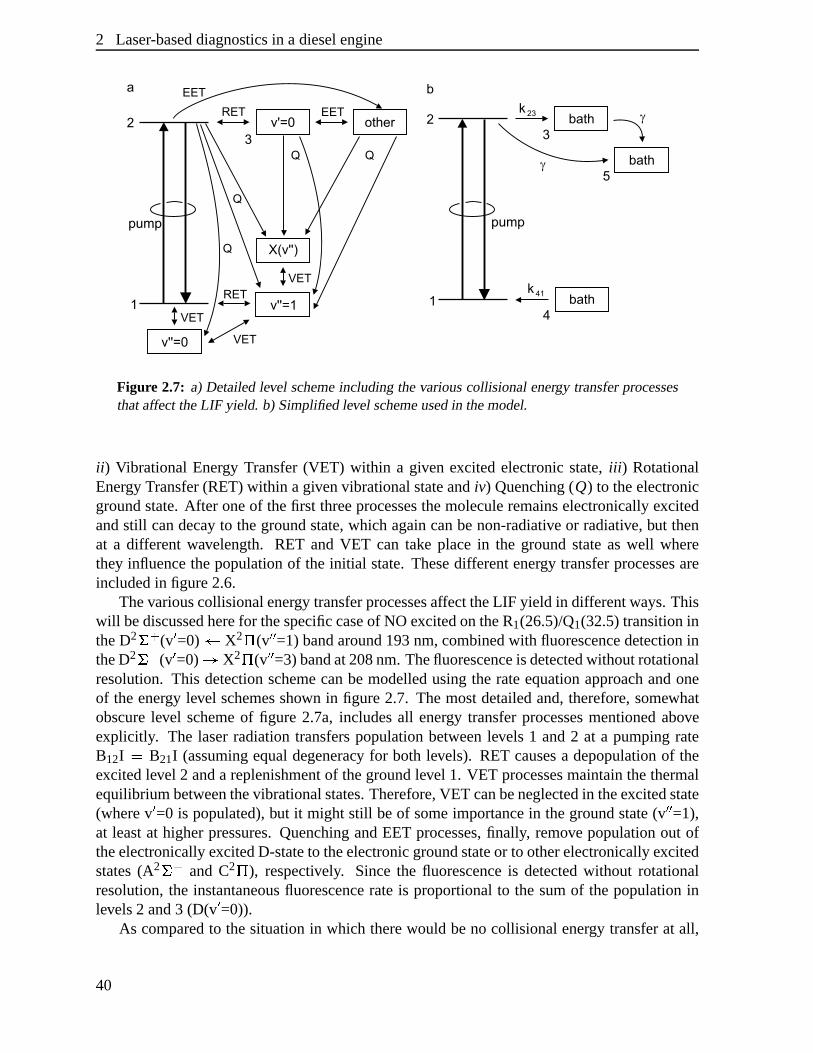
2 Laser-baseddiagnosticsin a dieselengine
Figure 2.7: a) Detailedlevel schemeincludingthevariouscollisionalenergy transferprocessesthataffect theLIF yield. b) Simplifiedlevel schemeusedin themodel.
ii ) VibrationalEnergy Transfer(VET) within a given excited electronicstate,iii ) RotationalEnergy Transfer(RET)within agivenvibrationalstateandiv) Quenching(Q) to theelectronicgroundstate.After oneof thefirst threeprocessesthemoleculeremainselectronicallyexcitedandstill candecayto thegroundstate,which againcanbenon-radiative or radiative, but thenat a different wavelength. RET and VET can take placein the groundstateas well wherethey influencethepopulationof the initial state.Thesedifferentenergy transferprocessesareincludedin figure2.6.
Thevariouscollisionalenergy transferprocessesaffect theLIF yield in differentways.Thiswill bediscussedherefor thespecificcaseof NO excitedontheR1(26.5)/Q1(32.5)transitionintheD2 ^`_ (va =0) b X2 c (v ada =1) bandaround193nm,combinedwith fluorescencedetectionintheD2 ^`_ (va =0) e X2 c (vada =3)bandat208nm. Thefluorescenceis detectedwithoutrotationalresolution. This detectionschemecanbe modelledusingthe rateequationapproachandoneof theenergy level schemesshown in figure2.7. Themostdetailedand,therefore,somewhatobscurelevel schemeof figure 2.7a, includesall energy transferprocessesmentionedaboveexplicitly. The laserradiationtransferspopulationbetweenlevels 1 and2 at a pumpingrateB12I K B21I (assumingequaldegeneracy for both levels). RET causesa depopulationof theexcitedlevel 2 anda replenishmentof thegroundlevel 1. VET processesmaintainthethermalequilibriumbetweenthevibrationalstates.Therefore,VET canbeneglectedin theexcitedstate(wherev a =0 is populated),but it might still beof someimportancein thegroundstate(vada =1),at leastat higherpressures.QuenchingandEET processes,finally, remove populationout oftheelectronicallyexcitedD-stateto theelectronicgroundstateor to otherelectronicallyexcitedstates(A2 ^`_ and C2 c ), respectively. Sincethe fluorescenceis detectedwithout rotationalresolution,the instantaneousfluorescencerateis proportionalto the sumof the populationinlevels2 and3 (D(va =0)).
As comparedto thesituationin which therewould beno collisionalenergy transferat all,
40
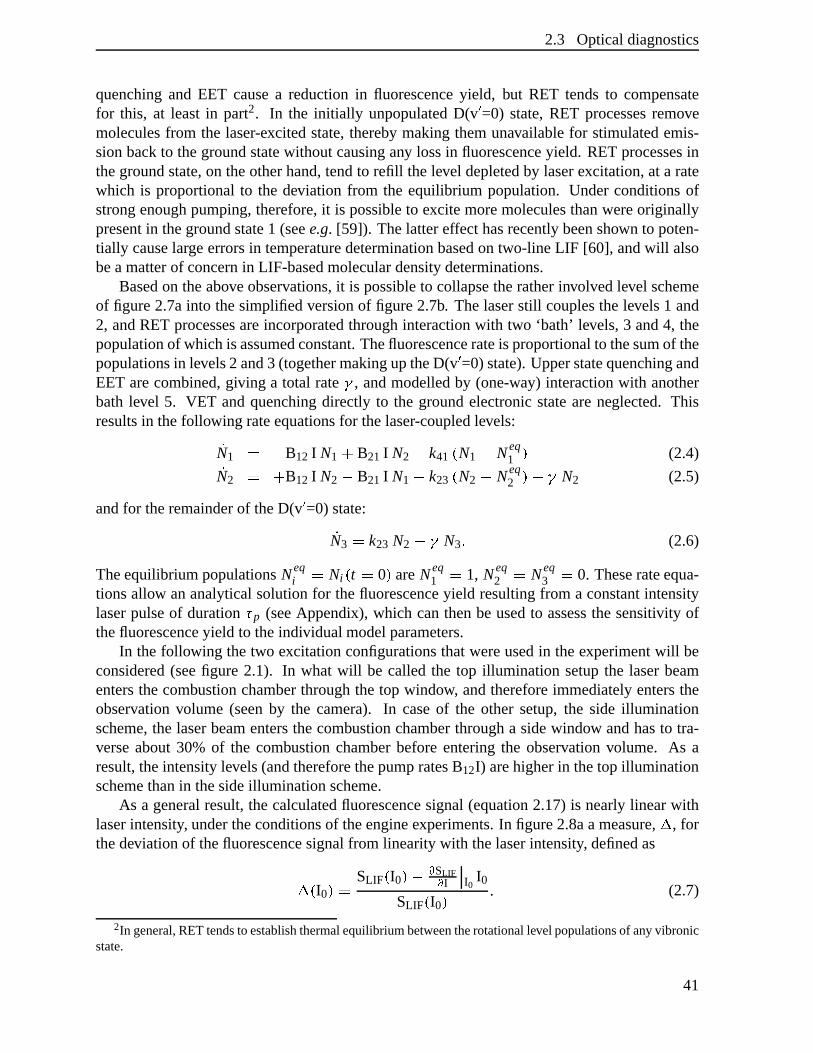
2.3 Opticaldiagnostics
quenchingand EET causea reductionin fluorescenceyield, but RET tendsto compensatefor this, at leastin part2. In the initially unpopulatedD(v a =0) state,RET processesremovemoleculesfrom the laser-excited state,therebymakingthemunavailablefor stimulatedemis-sionbackto thegroundstatewithout causingany lossin fluorescenceyield. RET processesinthegroundstate,on theotherhand,tendto refill thelevel depletedby laserexcitation,at a ratewhich is proportionalto the deviation from the equilibrium population. Underconditionsofstrongenoughpumping,therefore,it is possibleto excite moremoleculesthanwereoriginallypresentin thegroundstate1 (seee.g. [59]). Thelattereffect hasrecentlybeenshown to poten-tially causelargeerrorsin temperaturedeterminationbasedon two-line LIF [60], andwill alsobeamatterof concernin LIF-basedmoleculardensitydeterminations.
Basedon theaboveobservations,it is possibleto collapsetheratherinvolvedlevel schemeof figure2.7ainto thesimplifiedversionof figure2.7b. Thelaserstill couplesthe levels1 and2, andRET processesareincorporatedthroughinteractionwith two ‘bath’ levels,3 and4, thepopulationof whichis assumedconstant.Thefluorescencerateis proportionalto thesumof thepopulationsin levels2 and3 (togethermakinguptheD(v a =0) state).UpperstatequenchingandEET arecombined,giving a total rate f , andmodelledby (one-way) interactionwith anotherbath level 5. VET andquenchingdirectly to the groundelectronicstateareneglected. Thisresultsin thefollowing rateequationsfor thelaser-coupledlevels:
gN1 K H B12 I N1 h B21 I N2 H k41 ? N1 H Neq
1 C (2.4)gN2 K h B12 I N2 H B21 I N1 H k23 ? N2 H Neq
2 CiHjf N2 (2.5)
andfor theremainderof theD(v a =0) state:g
N3 K k23 N2 H�f N3 N (2.6)
TheequilibriumpopulationsNeqi K Ni ? t K 0C areNeq
1 K 1, Neq2 K Neq
3 K 0. Theserateequa-tionsallow ananalyticalsolutionfor thefluorescenceyield resultingfrom a constantintensitylaserpulseof duration k p (seeAppendix),which canthenbe usedto assessthesensitivity ofthefluorescenceyield to theindividualmodelparameters.
In thefollowing thetwo excitationconfigurationsthatwereusedin theexperimentwill beconsidered(seefigure 2.1). In what will be called the top illumination setupthe laserbeamentersthecombustionchamberthroughthe top window, andthereforeimmediatelyenterstheobservation volume (seenby the camera). In caseof the other setup,the side illuminationscheme,the laserbeamentersthecombustionchamberthrougha sidewindow andhasto tra-verseabout30% of the combustion chamberbeforeenteringthe observation volume. As aresult,theintensitylevels(andthereforethepumpratesB12I) arehigherin thetop illuminationschemethanin thesideilluminationscheme.
As a generalresult,thecalculatedfluorescencesignal(equation2.17)is nearlylinearwithlaserintensity, undertheconditionsof theengineexperiments.In figure2.8aameasure,l , forthedeviationof thefluorescencesignalfrom linearitywith thelaserintensity, definedas
l ? I0 CLK SLIF ? I0 CLHnm SLIF
m I I0I0
SLIF ? I0 C B (2.7)
2In general,RETtendsto establishthermalequilibriumbetweentherotationallevelpopulationsof any vibronicstate.
41
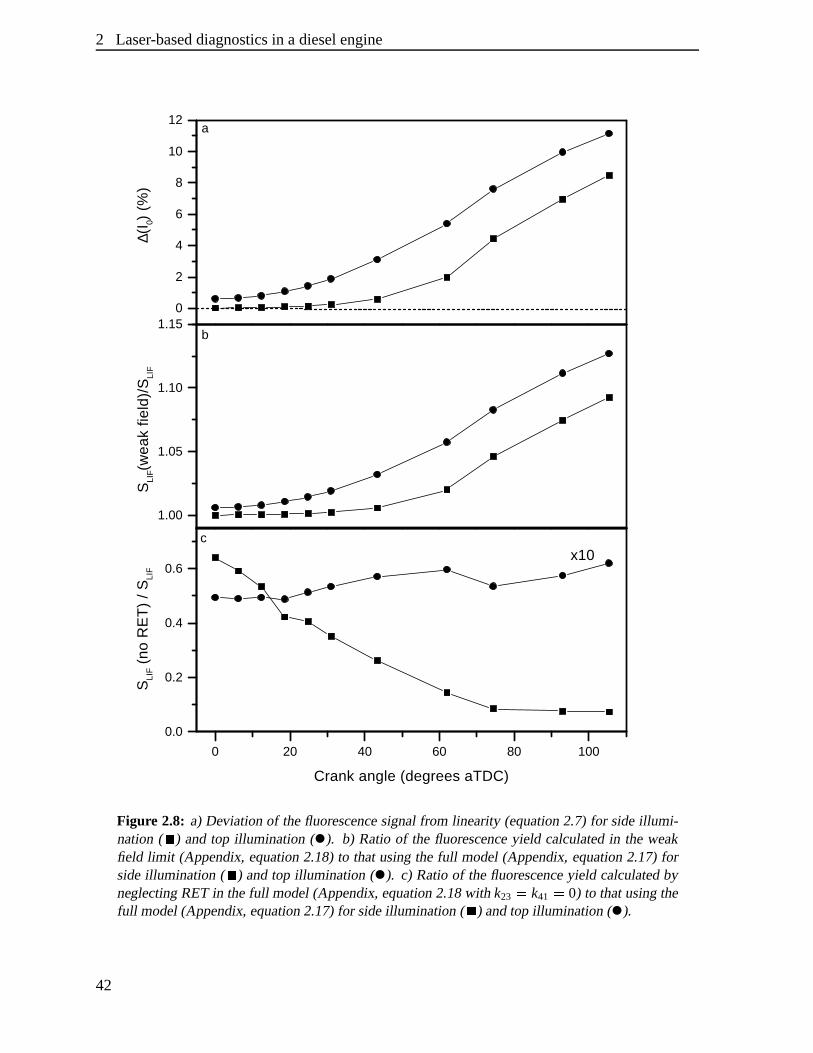
2 Laser-baseddiagnosticsin a dieselengine
0 20 40 60 80 100
0.0
0.2
0.4
0.6
cx10
SLI
F (n
o R
ET
) /
SLI
F
Crank angle (degrees aTDC)
1.00
1.05
1.10
1.15b
SLI
F(w
eak
field
)/S
LIF
0
2
4
6
8
10
12a
∆(I 0)
(%
)
Figure 2.8: a) Deviation of thefluorescencesignalfrom linearity (equation2.7) for sideillumi-nation( o ) andtop illumination ( ). b) Ratio of the fluorescenceyield calculatedin the weakfield limit (Appendix,equation2.18)to thatusingthe full model(Appendix,equation2.17)forsideillumination ( o ) andtop illumination ( ). c) Ratioof thefluorescenceyield calculatedbyneglectingRET in thefull model(Appendix,equation2.18with k23 p k41 p 0) to thatusingthefull model(Appendix,equation2.17)for sideillumination ( o ) andtop illumination ( ).
42
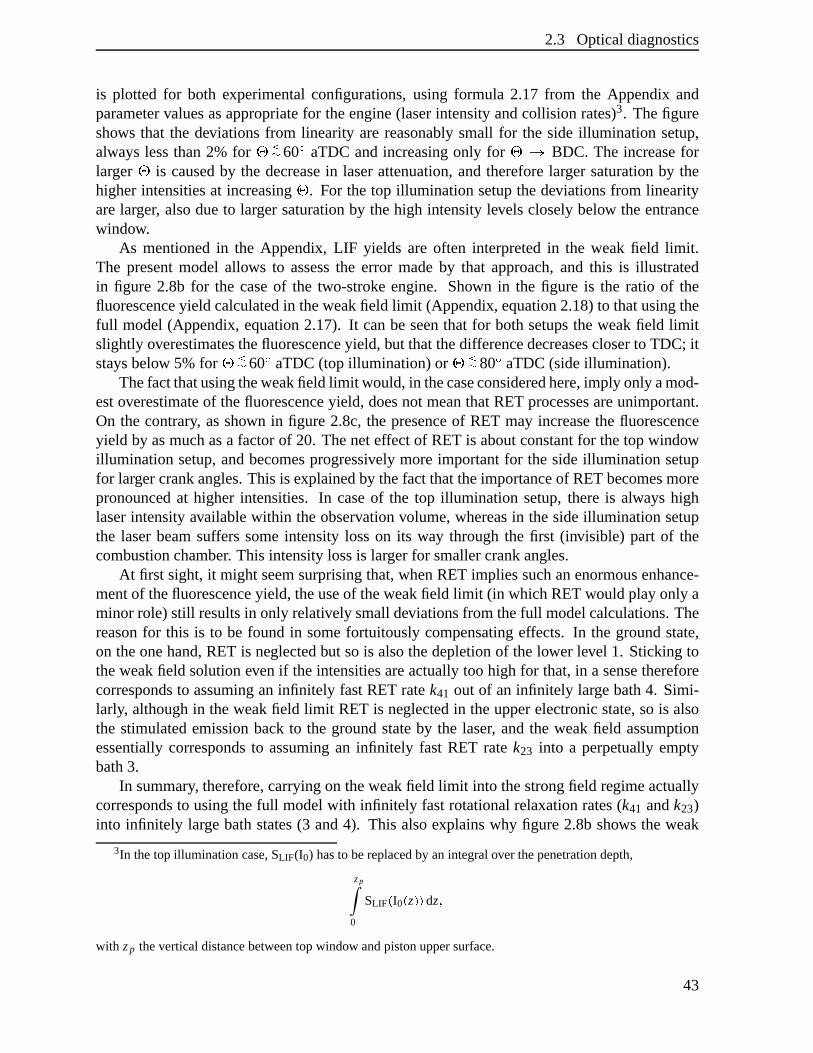
2.3 Opticaldiagnostics
is plotted for both experimentalconfigurations,using formula 2.17 from the Appendix andparametervaluesasappropriatefor theengine(laserintensityandcollision rates)3. Thefigureshows that the deviationsfrom linearity arereasonablysmall for the side illumination setup,alwayslessthan2% for qsrt 60u aTDC andincreasingonly for qve BDC. The increaseforlarger q is causedby the decreasein laserattenuation,andthereforelarger saturationby thehigherintensitiesat increasingq . For the top illumination setupthedeviationsfrom linearityarelarger, alsodueto larger saturationby thehigh intensitylevelscloselybelow theentrancewindow.
As mentionedin the Appendix, LIF yields are often interpretedin the weak field limit.The presentmodel allows to assessthe error madeby that approach,and this is illustratedin figure 2.8b for the caseof the two-stroke engine. Shown in the figure is the ratio of thefluorescenceyield calculatedin theweakfield limit (Appendix,equation2.18)to thatusingthefull model(Appendix,equation2.17). It canbe seenthat for bothsetupstheweakfield limitslightly overestimatesthefluorescenceyield, but thatthedifferencedecreasescloserto TDC; itstaysbelow 5% for qsrt 60u aTDC(top illumination)or qsrt 80u aTDC(sideillumination).
Thefactthatusingtheweakfield limit would,in thecaseconsideredhere,imply only amod-estoverestimateof thefluorescenceyield, doesnot meanthatRET processesareunimportant.On the contrary, asshown in figure 2.8c, the presenceof RET may increasethe fluorescenceyield by asmuchasa factorof 20. Theneteffect of RET is aboutconstantfor thetop windowillumination setup,andbecomesprogressively moreimportantfor the sideillumination setupfor largercrankangles.This is explainedby thefactthattheimportanceof RETbecomesmorepronouncedat higher intensities. In caseof the top illumination setup,thereis alwayshighlaserintensityavailablewithin theobservationvolume,whereasin thesideillumination setupthe laserbeamsuffers someintensity losson its way throughthe first (invisible) part of thecombustionchamber. This intensitylossis largerfor smallercrankangles.
At first sight,it might seemsurprisingthat,whenRET impliessuchanenormousenhance-mentof thefluorescenceyield, theuseof theweakfield limit (in whichRETwouldplayonly aminor role)still resultsin only relatively smalldeviationsfrom thefull modelcalculations.Thereasonfor this is to be found in somefortuitously compensatingeffects. In the groundstate,on theonehand,RET is neglectedbut sois alsothedepletionof thelower level 1. Stickingtotheweakfield solutionevenif theintensitiesareactuallytoo high for that,in a sensethereforecorrespondsto assuminganinfinitely fastRET ratek41 out of an infinitely largebath4. Simi-larly, althoughin theweakfield limit RET is neglectedin theupperelectronicstate,so is alsothe stimulatedemissionbackto the groundstateby the laser, andthe weakfield assumptionessentiallycorrespondsto assumingan infinitely fast RET ratek23 into a perpetuallyemptybath3.
In summary, therefore,carryingon theweakfield limit into thestrongfield regimeactuallycorrespondsto usingthefull modelwith infinitely fastrotationalrelaxationrates(k41 andk23)into infinitely large bathstates(3 and4). This alsoexplainswhy figure2.8bshows theweak
3In thetop illumination case,SLIF(I0) hasto bereplacedby anintegralover thepenetrationdepth,
zp
0
SLIF w I0 w zx�x dz y
with zp theverticaldistancebetweentop window andpistonuppersurface.
43

2 Laser-baseddiagnosticsin a dieselengine
field limit to alwaysoverestimatethefluorescenceyield. In practice,consideringtherelativelysmallerrorsmade,theweakfield limit will beusedin thesubsequentchapters.Theresultsoffigures2.8aand2.8bwill, however, bekeptin mind.
2.3.3 Elastic light scattering
As a laserbeamtraversesthecombustionchamberelasticscatteringof the laserradiationcanbeobserved. Theelasticallyscatteredradiationhasthesamewavelengthasthelaserradiationandresultsfrom scatteringoff fuel vapour, liquid fuel andoil dropletsand/orsootparticles.Whenthe diameterof the scatteringparticlesis small comparedto the laserwavelengththiselasticscatteringis calledRayleighscattering,whereasit is denotedby Mie scatteringif thediameterof thescatteringparticlesis large. As thescatteringcrosssectionsfor Mie scatteringoftenaremuchlarger thanthoseassociatedwith fluorescence,the intensityof theelasticMiescatteringtendsto be much larger than that of the inelasticfluorescence.The crosssectionfor elasticscatteringdependson theparticlesize. For particleswithin theRayleighlimit it isproportionalto theparticlediameterto thesixth power [61]. However, for largerparticlestherelationbetweenparticlesizeand intensity is muchmorecomplex. Consequently, recordingthe scatteredlight providesonly qualitative informationof wherescatteringparticlesare, orarenot, presentin thecombustionchamber. (NotethatcombiningscatteringexperimentswithLaser InducedIncandescence(LII) allows to obtain quantitative information aboutparticlessizesanddensities[11–13].)
Due to the scatteringthe laserintensity is attenuatedon its way throughthe combustionchamber. In addition,absorptionby sootparticlesandoil andfuel dropletsplaysanimportantpart in thedecreaseof the laserintensity. As the intensityof theelasticallyscatteredradiationis proportionalto thelaserintensity, imagesof theelasticallyscatteredradiationcanbeusedtoreconstructthelocal laserintensityinsidetherunningengine(chapter3).
2.4 Spontaneouslight emission
Basedon the combustion-inducedpressurerise seenin the enginecharacteristics(figure 2.4)it follows thatcombustionstartsaround15u bTDC.Flameluminosity, asobservedthroughthetop window, can indeedbe detectedfrom about15u bTDC onwards,up to about60u aTDC.To the unaidedeye, the flameshave a white colour which resultsfrom the burning of sootparticlesthatareformedin a fuel rich spray. It indicatesthatthenaturalemissionof theflamesresultsfrom highly sootingflameswith temperaturesaround2000-2500K [2]. Thisis,however,only a rough estimate;a more accuratesoot temperaturecan be derived from the spectrallydispersedspontaneousflameemission(section2.4.1). Informationaboutthe structureof theflamesfollows from two-dimensionalflameemissionimages(section2.4.2).
44
2.4 Spontaneouslight emission
2.4.1 Dispersedflame emission
Thevisible flameluminosityis predominantlydueto glowing sootparticles.Its spectraldistri-bution is a functionof thetemperatureof thesoot,andcanserveaskind of asootthermometer,by comparisonto thewell known blackor grey bodyradiationdistribution curvesasdescribedin section2.3.1.To obtainatemperatureof thesootparticlesthespontaneousflameemissionofthetwo-strokeenginecomingthroughthetopwindow is dispersedinto its differentwavelengthcomponentsby a dispersionprismandrecordedwith a CCD cameraasshown in theupperleftof figure2.9. Two slits (S) areusedto definethepositionthattheemissionis obtainedfrom. Alens(L; f K 200mm) is usedto focusthedispersedemissionon theintensifiedCCD camera.It is usedwith abellowsin betweenthelensandthecamerato enlargetheimagein orderto fillthewholeCCD chip.
Spectraof thedispersedflameemission,obtainedwith agatewidth of 500nsandaveragedover 200 enginecyclesare recordedfor all crankanglesat which it canbe observed. Theyrepresentanaverageemissionsignalfrom a narrow strip (1 z 25 mm2) throughthecentreofthetop window. Frequency calibrationis achievedby recordingthewell known emissionlinesproducedby a mercurylamp which wasplacedon top of the engine. The spectralresponsefunction of the setupwascalibratedusinga quartztungsten-halogencalibrationlamp (OrielInstruments;63358-M).
A few of thesedispersedflameemissionspectraaregivenin figure2.9. Thefirst spectrum
Figure 2.9: Spontaneouslight emissionfrom the flamesdispersedin its differentwavelengthcomponentsfor severalcrankanglesasindicatedin thefigure(+ and { refer to anglesafterandbeforeTDC, respectively). Theexperimentalsetupusedto dispersetheflameemissionis shownin theupperleft; S=slit;L=lens.
45
2 Laser-baseddiagnosticsin a dieselengine
of the naturalflame emissioncan be observed at 15u bTDC. The intensity increasesalmostlinearly till just beforeTDC, after which it decreasestill at around60u aTDC the last visibleflameemissioncanbeobserved.Thespectrashow no fine structuredueto chemiluminescenceof excitedmolecules.This indicatesthat thespontaneousflameemissionindeedis dominatedby grey body radiationof incandescentsootparticlesin this wavelengthrange. If a specificmoleculewouldcontributesignificantlyto theflameemission,anemissionpeakatawavelengthcharacteristicfor themoleculewouldshow up. Thiscaneasilybeobservedfor e.g. C2, CH andOH in Otto engines,wherethe thermalradiationfrom the soot is muchlower than in dieselengines[35]. For dieselenginesOH fluorescencehasbeenseenaround310 nm (which isbelow thewavelengthrangeof figure2.9),but its intensityis smallcomparedto thestronggreybodyemissionthatdominatesthespectrumat wavelengthsabove340nm [18].
Theobservedflameemissionspectracanbefit to Planck’sLaw combinedwith theemissiv-ity givenin equation2.1andequation2.3,respectively, to obtaininformationaboutthevalueofK L andthetemperatureof theincandescentsootparticles4. Thespectracanbefit well to blackbody(Planck)curves,theadditionof thegrey bodytermgiving no improvement.Apparently,theK L-valuefor theflamesin thisengineis high,resultingin anemissivity of thesootparticlesof almostunity. The temperaturesderivedfrom thesootspectraby fitting themto blackbodycurvesis shown in figure2.4d( ). Thedashedcurve in this figureis anextrapolationbasedonadiabaticexpansionof anidealgas( f|K 1 N 36, for thecombustionstroke)duringthelastpartofthestroke,matchedto theexperimentaldataaround15u aTDC.
Thesoottemperaturereachesamaximumof about2250K aroundTDC,andis alwaysmuchhigherthanthemeangastemperaturederivedfrom theheatreleaserate(figure2.4d).Fromthisit followsthatthecylindercontentsarenot in thermalequilibrium.Thesoottemperaturerepre-sentsthe temperatureof the locally presentsootwhereasthemeangastemperaturerepresentstheaveragetemperatureof thegasinsidethewholecylinder. As sootparticlesareformeddur-ing the combustionwherethe temperatureis locally high andnot yet in equilibrium with thewholecylinder contents,thesoottemperatureis expectedto behigherthanthemeangastem-perature[53]. Themeasuredsoottemperatureis in agreementwith the(empirical)temperaturefollowing from thecolourof theflameemission.Thewhite colour indicatesa temperatureofcarbonparticlesin theflamesof 2000-2500K [2].
2.4.2 Flameemissionimages
Recordingtwo-dimensionalimagesof the emissionfrom incandescentsootparticlesthat areformedin theflamesprovidesinformationaboutthespatialstructureof theflames.However,usuallya CCD cameraneedsabout300 ms to recordoneimage,which is not fastenoughtofollow thecombustionduringonesinglestroke. By usinganintensifiedCCDcamerain kineticsmodeimagescanbeacquiredvery fastaftereachother(0.1-1ms)which givesthepossibilityto follow the evolution of theflameduring onestroke. By usingan ICCD camerain kineticsmodewith a gatewidth of 200nssingleshotimagesof thespontaneousflameemissionof thetwo-strokeengineareobtainedasa functionof crankangle.
Figure2.10(bottomfour rows)shows four seriesof ninesingleshotimagesobtainedevery3.6 degreescrank angle(0.5 ms) of the samestroke, covering the time spanthat the flame
4It hasbeenshown that if the sootparticlesaresmall this temperatureis alsoa goodmeasurefor the flametemperature[56].
46
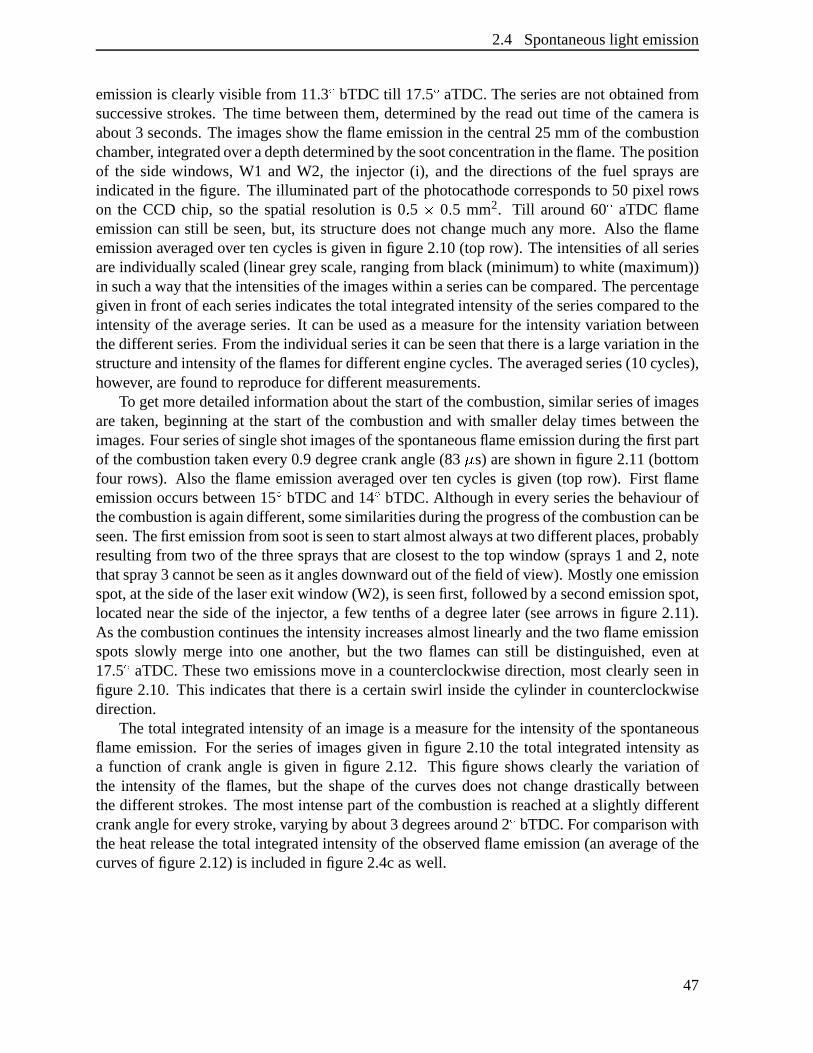
2.4 Spontaneouslight emission
emissionis clearlyvisible from 11.3u bTDC till 17.5u aTDC.Theseriesarenot obtainedfromsuccessive strokes. The time betweenthem,determinedby the readout time of thecameraisabout3 seconds.Theimagesshow theflameemissionin thecentral25 mm of thecombustionchamber, integratedoveradepthdeterminedby thesootconcentrationin theflame.Thepositionof the side windows, W1 andW2, the injector (i), and the directionsof the fuel spraysareindicatedin thefigure. Theilluminatedpartof thephotocathodecorrespondsto 50 pixel rowson the CCD chip, so the spatialresolutionis 0 N 5 z 0 N 5 mm2. Till around60u aTDC flameemissioncanstill be seen,but, its structuredoesnot changemuchany more. Also the flameemissionaveragedover tencyclesis givenin figure2.10(top row). Theintensitiesof all seriesareindividually scaled(lineargrey scale,rangingfrom black(minimum)to white (maximum))in suchawaythattheintensitiesof theimageswithin aseriescanbecompared.Thepercentagegivenin front of eachseriesindicatesthetotal integratedintensityof theseriescomparedto theintensityof theaverageseries.It canbeusedasa measurefor the intensityvariationbetweenthedifferentseries.Fromtheindividualseriesit canbeseenthatthereis a largevariationin thestructureandintensityof theflamesfor differentenginecycles.Theaveragedseries(10cycles),however, arefoundto reproducefor differentmeasurements.
To getmoredetailedinformationaboutthestartof thecombustion,similar seriesof imagesaretaken, beginning at the startof the combustionandwith smallerdelaytimesbetweentheimages.Fourseriesof singleshotimagesof thespontaneousflameemissionduringthefirst partof thecombustiontakenevery0.9degreecrankangle(83 } s) areshown in figure2.11(bottomfour rows). Also the flameemissionaveragedover ten cyclesis given (top row). First flameemissionoccursbetween15u bTDC and14u bTDC.Althoughin every seriesthebehaviour ofthecombustionis againdifferent,somesimilaritiesduringtheprogressof thecombustioncanbeseen.Thefirst emissionfrom sootis seento startalmostalwaysattwo differentplaces,probablyresultingfrom two of thethreespraysthatareclosestto the top window (sprays1 and2, notethatspray3 cannotbeseenasit anglesdownwardoutof thefield of view). Mostly oneemissionspot,at thesideof thelaserexit window (W2), is seenfirst, followedby asecondemissionspot,locatednearthesideof the injector, a few tenthsof a degreelater (seearrows in figure2.11).As thecombustioncontinuestheintensityincreasesalmostlinearlyandthetwo flameemissionspotsslowly merge into one another, but the two flamescan still be distinguished,even at17.5u aTDC.Thesetwo emissionsmove in a counterclockwisedirection,mostclearlyseeninfigure2.10. This indicatesthat thereis a certainswirl insidethecylinder in counterclockwisedirection.
Thetotal integratedintensityof an imageis a measurefor the intensityof thespontaneousflameemission.For the seriesof imagesgiven in figure 2.10 the total integratedintensityasa function of crankangleis given in figure 2.12. This figure shows clearly the variationofthe intensity of the flames,but the shapeof the curvesdoesnot changedrasticallybetweenthedifferentstrokes.Themostintensepartof thecombustionis reachedat a slightly differentcrankanglefor everystroke,varyingby about3 degreesaround2u bTDC.For comparisonwiththeheatreleasethetotal integratedintensityof theobservedflameemission(anaverageof thecurvesof figure2.12)is includedin figure2.4caswell.
47
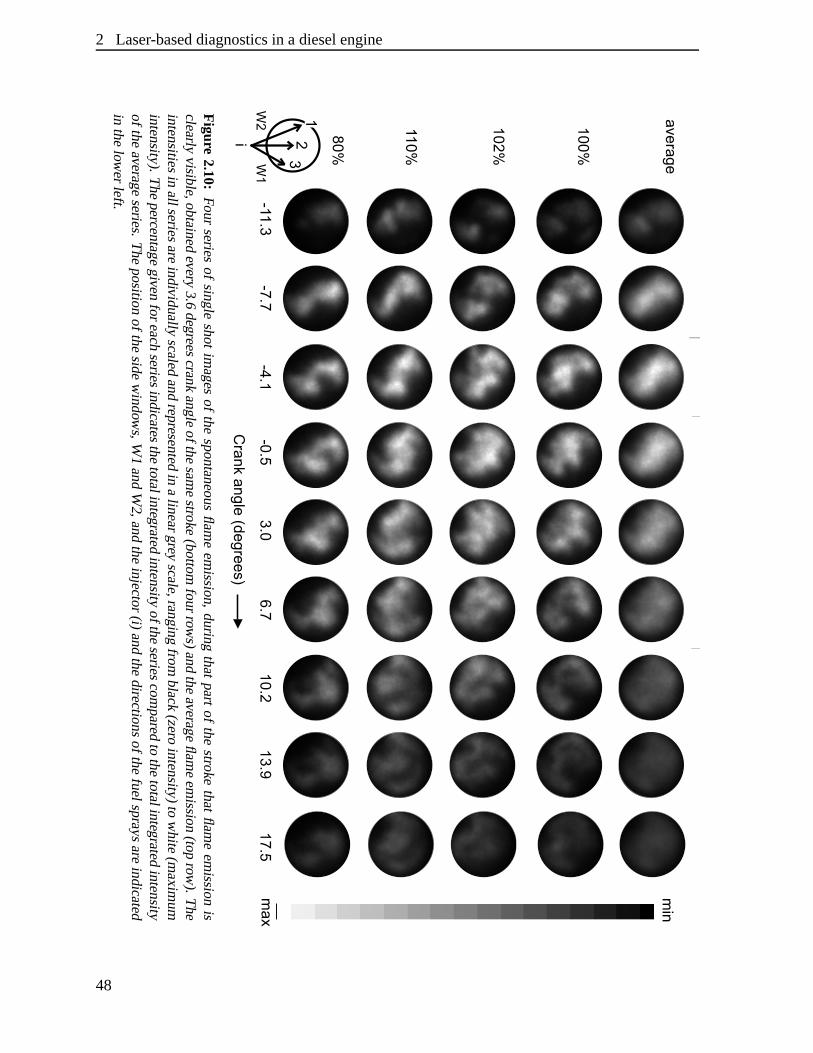
2 Laser-baseddiagnosticsin a dieselengine
Figure
2.10:Fourseriesof
singleshotim
agesofthe
spontaneousflame
emission,during
thatpartofthe
strokethatflam
eem
issionisclearly
visible,obtainedevery3.6
degreescrankangleofthesam
estroke(bottom
fourrows)andthe
averageflameem
ission(toprow
).The
intensitiesinallseriesareindividually
scaledandrepresentedin
alineargrey
scale,rangingfromblack(zero
intensity)tow
hite(m
aximum
intensity).The
percentagegivenforeachseriesindicatesthe
totalintegratedintensityoftheseriescom
paredtothe
totalintegratedintensityofthe
averageseries.The
positionofthe
sidew
indows,W
1and
W2,and
theinjector(i)
andthe
directionsofthefuelspraysare
indicatedin
thelow
erleft.
48
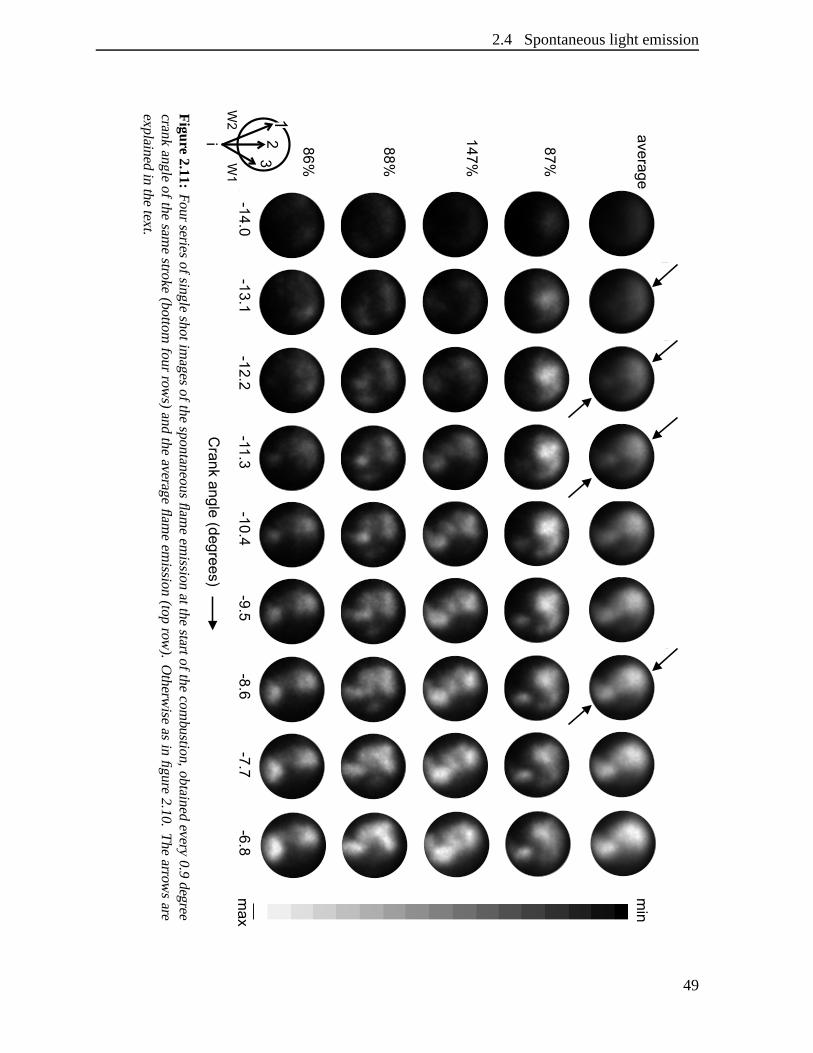
2.4 Spontaneouslight emission
Figure
2.11:Fourseriesofsingleshotim
agesofthespontaneousflam
eem
issionatthestartofthe
combustion,obtainedevery
0.9degree
crankangleofthe
samestroke
(bottomfour
rows)and
theaverageflam
eem
ission(toprow
).O
therwiseas
infigure
2.10.The
arrows
areexplainedin
thetext.
49
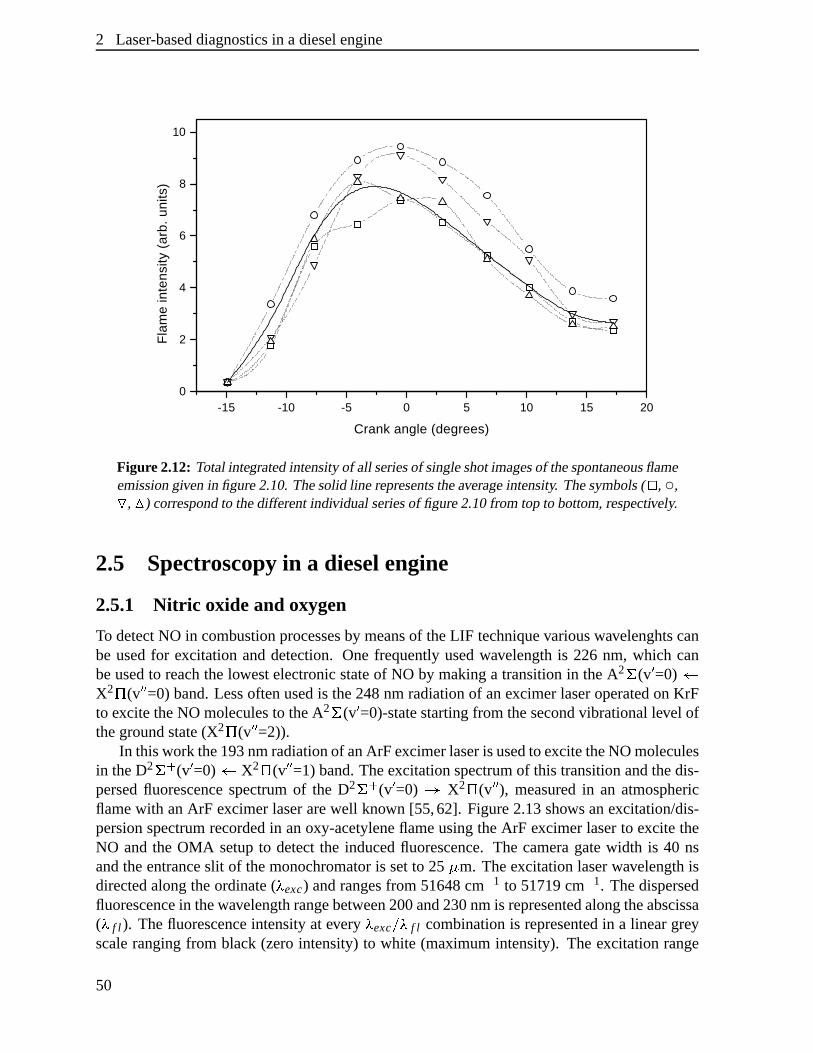
2 Laser-baseddiagnosticsin a dieselengine
-15 -10 -5 0 5 10 15 200
2
4
6
8
10
Fla
me
inte
nsity
(ar
b. u
nits
)
Crank angle (degrees)
Figure2.12: Total integratedintensityof all seriesof singleshotimagesof thespontaneousflameemissiongivenin figure2.10.Thesolid line representstheaverageintensity. Thesymbols( ~ , ,�
, � ) correspondto thedifferentindividual seriesof figure2.10from topto bottom,respectively.
2.5 Spectroscopyin a dieselengine
2.5.1 Nitric oxide and oxygen
To detectNO in combustionprocessesby meansof theLIF techniquevariouswavelenghtscanbe usedfor excitation anddetection. Onefrequentlyusedwavelengthis 226 nm, which canbeusedto reachthelowestelectronicstateof NO by makinga transitionin theA2 ^ (v a =0) bX2 c (v ada =0) band.Lessoftenusedis the248nm radiationof anexcimerlaseroperatedon KrFto excite theNO moleculesto theA2 ^ (v a =0)-statestartingfrom thesecondvibrationallevel ofthegroundstate(X2 c (v ada =2)).
In thiswork the193nmradiationof anArF excimerlaseris usedto excitetheNO moleculesin theD2 ^`_ (v a =0) b X2 c (vada =1) band.Theexcitationspectrumof this transitionandthedis-persedfluorescencespectrumof the D2 ^`_ (va =0) e X2 c (v ada ), measuredin an atmosphericflamewith anArF excimerlaserarewell known [55,62]. Figure2.13shows anexcitation/dis-persionspectrumrecordedin anoxy-acetyleneflameusingtheArF excimerlaserto excite theNO andthe OMA setupto detectthe inducedfluorescence.The cameragatewidth is 40 nsandtheentranceslit of themonochromatoris setto 25 } m. Theexcitationlaserwavelengthisdirectedalongtheordinate(@ exc) andrangesfrom 51648cm� 1 to 51719cm� 1. Thedispersedfluorescencein thewavelengthrangebetween200and230nmis representedalongtheabscissa( @ f l ). Thefluorescenceintensityat every @ exc O�@ f l combinationis representedin a lineargreyscalerangingfrom black (zerointensity)to white (maximumintensity). The excitation range
50
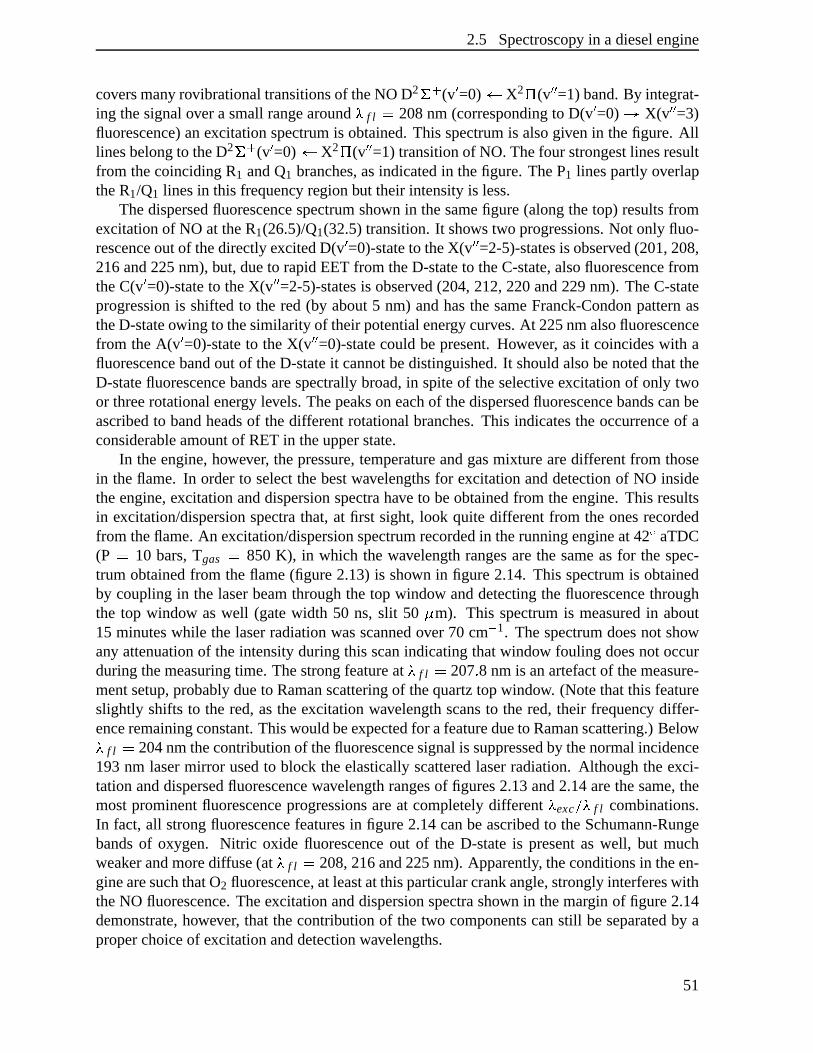
2.5 Spectroscopy in a dieselengine
coversmany rovibrationaltransitionsof theNO D2 ^`_ (va =0) b X2 c (v ada =1) band.By integrat-ing thesignalovera smallrangearound@ f l K 208nm (correspondingto D(va =0) e X(v ada =3)fluorescence)anexcitationspectrumis obtained.This spectrumis alsogivenin thefigure. Alllinesbelongto theD2 ^`_ (va =0) b X2 c (vada =1) transitionof NO. Thefour strongestlinesresultfrom thecoincidingR1 andQ1 branches,asindicatedin thefigure. TheP1 linespartly overlaptheR1/Q1 linesin this frequency regionbut their intensityis less.
Thedispersedfluorescencespectrumshown in thesamefigure(alongthetop) resultsfromexcitationof NO at theR1(26.5)/Q1(32.5)transition.It shows two progressions.Not only fluo-rescenceoutof thedirectlyexcitedD(v a =0)-stateto theX(v ada =2-5)-statesis observed(201,208,216and225nm),but, dueto rapidEET from theD-stateto theC-state,alsofluorescencefromtheC(va =0)-stateto theX(v ada =2-5)-statesis observed(204,212,220and229nm). TheC-stateprogressionis shiftedto the red (by about5 nm) andhasthesameFranck-CondonpatternastheD-stateowing to thesimilarity of theirpotentialenergy curves.At 225nmalsofluorescencefrom theA(v a =0)-stateto theX(v ada =0)-statecouldbepresent.However, asit coincideswith afluorescencebandout of theD-stateit cannotbedistinguished.It shouldalsobenotedthattheD-statefluorescencebandsarespectrallybroad,in spiteof theselective excitationof only twoor threerotationalenergy levels.Thepeakson eachof thedispersedfluorescencebandscanbeascribedto bandheadsof thedifferentrotationalbranches.This indicatestheoccurrenceof aconsiderableamountof RET in theupperstate.
In theengine,however, thepressure,temperatureandgasmixturearedifferentfrom thosein theflame. In orderto selectthebestwavelengthsfor excitationanddetectionof NO insidetheengine,excitationanddispersionspectrahave to beobtainedfrom theengine.This resultsin excitation/dispersionspectrathat,at first sight, look quite differentfrom the onesrecordedfrom theflame.An excitation/dispersionspectrumrecordedin therunningengineat 42u aTDC(P K 10 bars,Tgas K 850 K), in which the wavelengthrangesarethe sameasfor the spec-trum obtainedfrom theflame(figure2.13) is shown in figure2.14. This spectrumis obtainedby couplingin the laserbeamthroughthe top window anddetectingthefluorescencethroughthe top window aswell (gatewidth 50 ns, slit 50 } m). This spectrumis measuredin about15 minuteswhile the laserradiationwasscannedover 70 cm� 1. Thespectrumdoesnot showany attenuationof theintensityduringthis scanindicatingthatwindow fouling doesnot occurduringthemeasuringtime. Thestrongfeatureat @ f l K 207N 8 nmis anartefactof themeasure-mentsetup,probablydueto Ramanscatteringof thequartztopwindow. (Notethatthis featureslightly shifts to the red,astheexcitation wavelengthscansto the red, their frequency differ-enceremainingconstant.Thiswouldbeexpectedfor afeaturedueto Ramanscattering.)Below@ f l K 204nmthecontributionof thefluorescencesignalis suppressedby thenormalincidence193nm lasermirror usedto block theelasticallyscatteredlaserradiation. Although theexci-tationanddispersedfluorescencewavelengthrangesof figures2.13and2.14arethesame,themostprominentfluorescenceprogressionsareat completelydifferent @ exc OQ@ f l combinations.In fact,all strongfluorescencefeaturesin figure2.14canbeascribedto theSchumann-Rungebandsof oxygen. Nitric oxide fluorescenceout of the D-stateis presentas well, but muchweakerandmorediffuse(at @ f l K 208,216and225nm). Apparently, theconditionsin theen-ginearesuchthatO2 fluorescence,at leastat thisparticularcrankangle,stronglyinterfereswiththeNO fluorescence.Theexcitationanddispersionspectrashown in themargin of figure2.14demonstrate,however, that thecontribution of the two componentscanstill beseparatedby aproperchoiceof excitationanddetectionwavelengths.
51
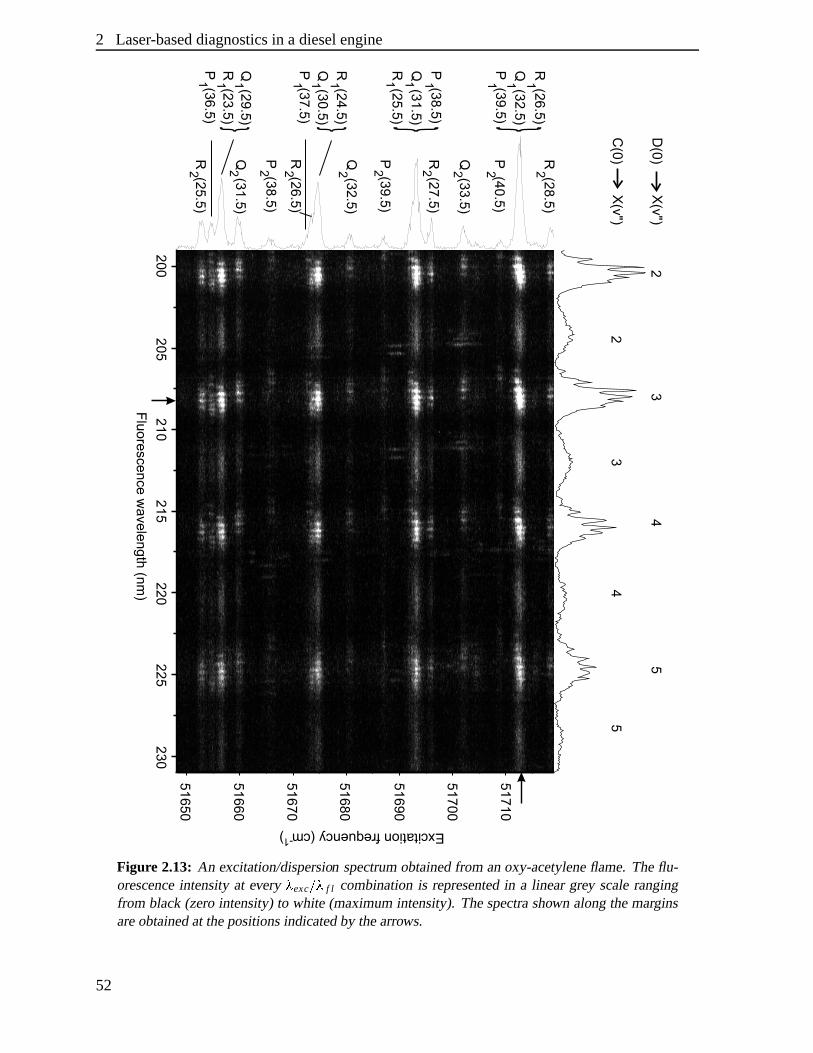
2 Laser-baseddiagnosticsin a dieselengine
Figure 2.13: An excitation/dispersion spectrumobtainedfrom anoxy-acetyleneflame.Theflu-orescenceintensityat every � exc � � f l combinationis representedin a linear grey scalerangingfrom black(zerointensity)to white (maximumintensity).Thespectrashown alongthemarginsareobtainedat thepositionsindicatedby thearrows.
52
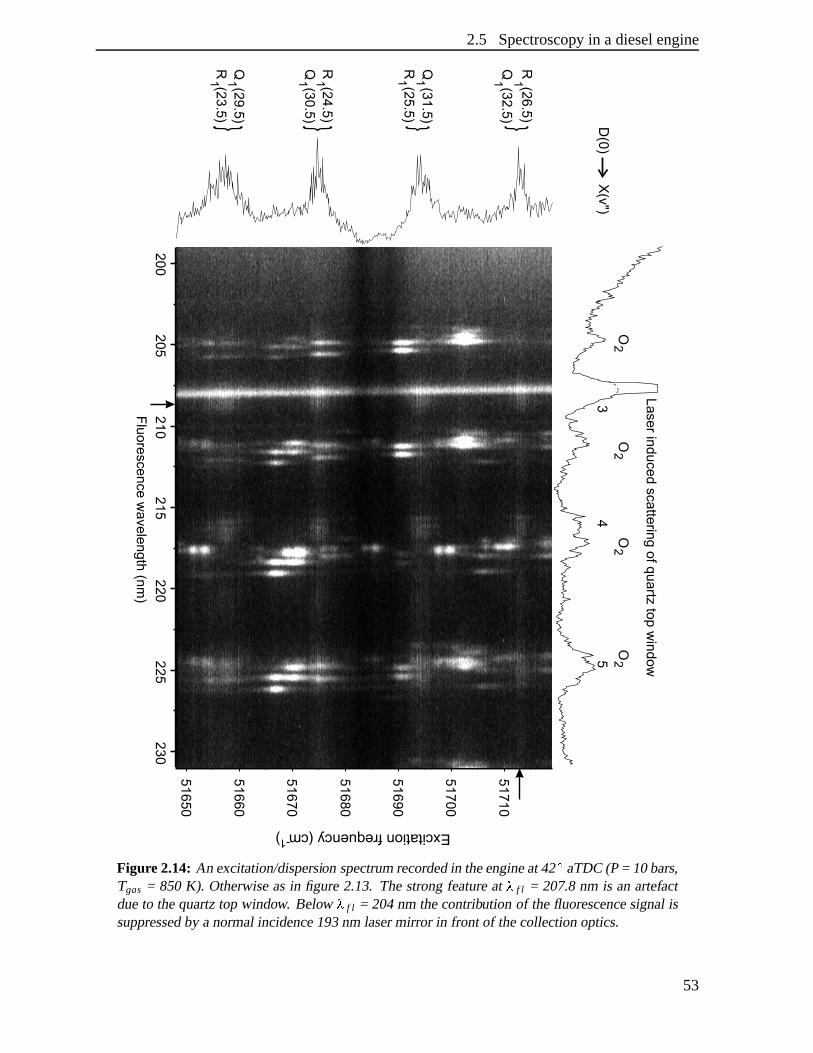
2.5 Spectroscopy in a dieselengine
Figure2.14: An excitation/dispersion spectrumrecordedin theengineat42 � aTDC(P= 10bars,Tgas = 850K). Otherwiseasin figure2.13. Thestrongfeatureat � f l = 207.8nm is an artefactdueto thequartztop window. Below � f l = 204nm thecontribution of thefluorescencesignalissuppressedby anormalincidence193nm lasermirror in front of thecollectionoptics.
53
2 Laser-baseddiagnosticsin a dieselengine
TheO2 transitionsthatcanbeexcitedwithin thetuningrangeof anexcimer laseroperatedon ArF belongto theSchumann-RungeB3 ^`_
u b X3 ^ �g system.Thevibrationalgroundstate(v ada =0) canbe excited to the B(va =4)-statevia several rotationaltransitions,causinglarge ab-sorptionsin theintensityprofileof theexcimerlaserradiationwhentransmittedthroughair. Inaddition,transitionsin theB(va =10,11) b X(v ada =2) andB(va =14,15,16)b X(v ada =3) bandscanbeobserved.Thecorrespondingdispersedfluorescencespectraextendto thevisiblewavelengthrange,reachingvibrationallevelsin theX-stateashighasv ada =35[63–66]. At hightemperaturestheO2 spectrumbecomessodensethatit is almostimpossibleto avoid O2 excitationcompletely(seee.g. [65]). Therefore,evenif thelaserfrequency is off-resonantfor anO2 excitation,somefluorescenceof O2 will still beobserved. Also, someO2 fluorescenceis seenwhich is inducedby thebroad-bandfractionof theexcimerlaserradiation.ThisO2 fluorescenceinterferesin theNO spectra(it partlyoverlapstheNO fluorescencebands)andbecomesstrongerwhentemper-aturesarehigher, becauseO2 is excited from thevibrationallyexcitedX(v ada =2 or 3)-states,ascanbeseenin figure2.14. Around @ exc K 51685cm� 1 thelaserintensityreachingtheengineis relatively weak,causingdarkhorizontalbandsat @ exc in figure2.14,dueto absorptionontherotationalR(21)andP(19)linesof theB(va =4) b X(v ada =0) transitionof O2 presentin theairthroughwhich thelaserbeamis transmitted.
In emissiontheO2 fluorescenceis seenaround205nm, 211nm, 217.5nm and225nm. Itis characterisedby narrow doubletstructuresdueto fastpredissociationof theupperstate[63–65]. This predissociationcausesexcitedO2 moleculesto dissociatebeforesignificantRET hasoccurred,so that, contraryto the ratherbroadNO fluorescence,the O2 fluorescenceconsistsof only two closelyspacedlines originating from the directly excited level. (At still higherpressuresupperstateRET hasbeenobserved for O2 aswell [67].) However, asseveral O2
transitionscan be excited simultaneouslythe total O2 fluorescencesignal consistof severaldoublets,causingsomebroadening.At 225 nm the NO fluorescencecoincideswith the O2
fluorescence.At 208 nm and 216 nm, however, the NO fluorescencecan be distinguishedfrom that of O2 in caseof appropriateresolutionof the dispersedfluorescence.Fluorescenceresultingfrom O2 excited from the vibrationalgroundstate(B(va =4) b X(v ada =0)) is not seenin theengineor flamespectra.This is partly becausethe frequency thatexcitesthis transitionis alreadypartly absorbedby O2 in theambientair. Also, theoscillatorstrengthfor transitionsstartingfrom v ada =0 is lessthan for transitionsfrom v ada =2,3 and the B(va =4)-statedissociatesfast[65].
In the NO excitation spectrumincludedin figure 2.14 the strongR1/Q1 lines canstill berecognised.The apparentincreasein backgroundsignal is the resultof the gapsbetweenthecloselyspacedlinesdisappearingdueto pressurebroadeningof thespectrallines.Also, thetran-sition frequency canshift by collisionswith neighbouringmolecules.At theengineconditionsat which this spectrumis obtained(P K 10 bars,Tgas K 850K) thetransitionfrequenciesarered-shiftedby about1.5 cm� 1 ascomparedto thecorrespondingatmosphericflamespectrum.However, dueto increasedpressurebroadeningtheexcitationfrequency is relatively insensitiveto the actualvalueof the pressureshift. In the dispersedfluorescencespectrumalmostonlyNO fluorescencefrom the directly excited D-stateis observed (besidesthe O2 fluorescence).Fluorescencefrom theC-stateis hardlydetectableany moreat this crankangle.
The spectrumof figure 2.14canbe usedto selectsuitablewavelengthsfor excitation anddetectionof NO insidethe combustionchamberof the engine. The interferencefrom hot O2
hasto beminimisedwhereastheNO signalis preferredto bemaximal.TheR1(26.5)/Q1(32.5)
54

2.5 Spectroscopy in a dieselengine
excitation line at @ exc K 51712N 5 cm� 1 (193.377nm) turnsout to be a goodone,asO2 ex-citation is almostavoided(only O2 fluorescenceinducedby the broad-bandlaserradiationisseen)andNO fluorescenceis relatively strong. For detectionof NO the D(v a =0) e X( ada =3)fluorescencebandat 208nm is in principlethebestone,asthenearestO2 fluorescencesignalsareat 205nmand211.5nm. However, if thelaserbeamis coupledinto theenginethroughthetopwindow, thesignal(obtainedthroughthesamewindow) alsocontainsacontributioncausedby non-resonantscatteringby thetopwindow itself at 207.8nm.
During theNO measurementsthe laserradiationis fixedat thewavelengthpositionof theR1(26.5)/Q1(32.5)transition. The laseris tunedto resonanceby monitoringthe inducedfluo-rescencefrom NO in the oxy-acetyleneflameshiftedby a known amountto get in resonancewith theNO transitionunderengineconditions.
2.5.2 Dispersedfluorescencespectra
A seriesof dispersedfluorescencespectraaveragedover 100enginecyclesin thewavelengthrangebetween200 nm and 265 nm is given in figure 2.15. Thesespectraare obtainedbycouplingin thelaserbeam(exciting theR1(26.5)/Q1(32.5)NO transition)throughthetop win-dow anddetectingtheinducedfluorescence,alsothroughthetop window, by theOMA system(50 } m entranceslit). Thepeakat 207.8nm andtherisein intensityabove 250nm seenin allspectra,both resultfrom laserinducedemissionsof the top window. The fact thatall spectrashow spectralstructure(eitherNO or O2 fluorescence)indicatesthat fluorescencecanbe ob-tainedthroughoutthewholestroke,evenatTDC wherepressureandtemperaturearehigh. Theseriesof spectrashows theO2 fluorescencemostly inducedby thebroad-bandradiationof theexcimer laserascanbe seenfrom the many O2 fluorescencepeaksof differenttransitionsofO2 (B(va =14,15,16)e X(v ada ) andB(va =10,11)e X(v ada )) arisingaroundTDC. In addition,theyshow the interferenceof O2 fluorescencewith theNO fluorescenceresultingfrom theexcitedD-stateaswell asfrom theA-stateandC-statepopulatedby EET.
At 19u bTDC almostno fluorescenceis seen,whereasat 16u bTDC many narrow fluores-cencepeaksarise,all resultingfrom hot O2. The O2 fluorescenceappearssuddenlyon ap-proachingTDC ascanbeseenin figure2.16.Thisfigurepresentsfour spectra,with 0.6degreecrankanglebetweenthem,showing the rise of the O2 fluorescencewithin 1.8 degreecrankangle. The suddenappearanceof O2 fluorescenceis dueto the fastrise in temperatureat thestartof the combustion. As the combustioncontinues,the O2 fluorescenceintensityremainsalmostconstanttill around40u aTDC;it thendecreasesandafter62u aTDCnoO2 fluorescenceis seenany morebecauseof thesmallpopulationof thev ada =2and3 statesasaresultof thelowertemperature.
Fluorescencefrom NO is seenfirst aroundTDC at 235nm. It resultsfrom boththedirectlyexcited D(v a =0)-stateandthe A(v a =0)-state,the latter beingpopulatedout of the D-statedueto rapid EET. At increasingcrankanglesseveral broadNO fluorescencebandsappearbesidethenarrow O2 fluorescencepeaks.Fromaround35u aTDConwardsthestructureof thespectragetsdominatedby NO fluorescenceof increasingintensity. Fluorescenceresultingfrom theD(v a =0)-stateto the X(v ada =3,4)-statesis seenat 208 nm (red shoulderof the quartzRamanscatteringpeak)and 216 nm (blue side of the O2 peak),respectively. (The fluorescencetothe X(v ada =2)-stateat 201 nm cannotbe seenas its contribution is suppressedby the 193 nmlasermirror in front of thecollectionoptics.)At 225nm theD(va =0) e X(v ada =5) andA(v a =0)
55
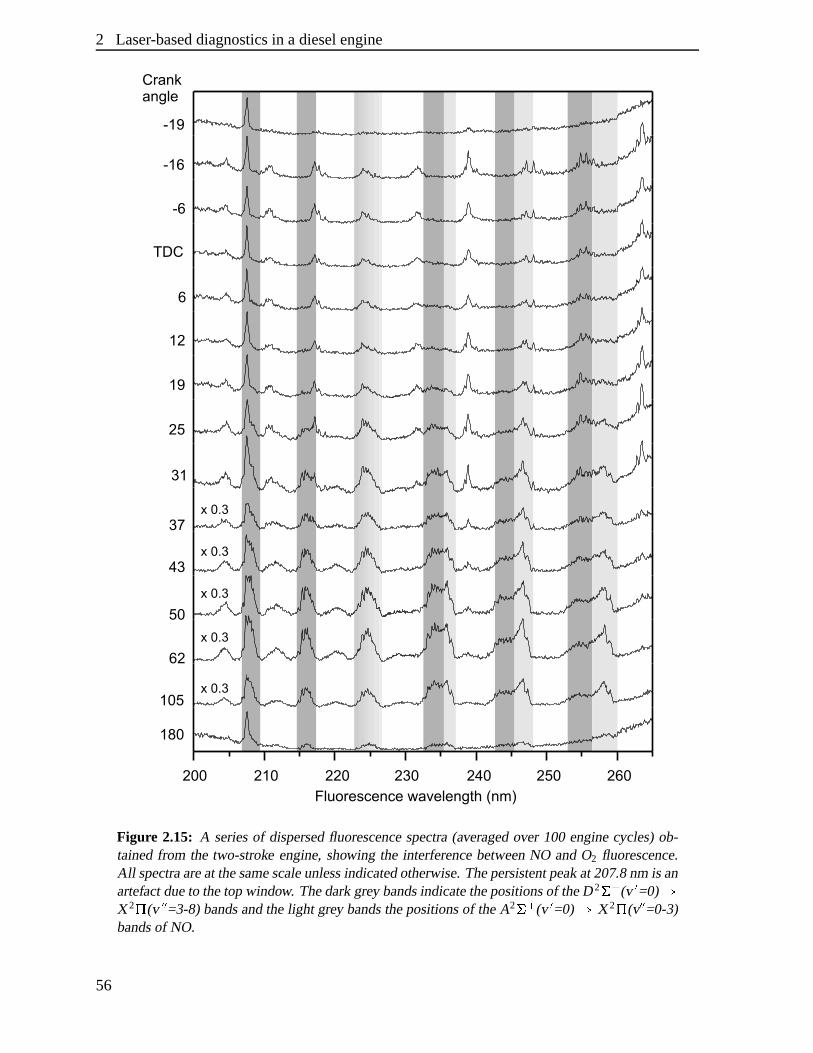
2 Laser-baseddiagnosticsin a dieselengine
Figure 2.15: A seriesof dispersedfluorescencespectra(averagedover 100 enginecycles)ob-tainedfrom the two-stroke engine,showing the interferencebetweenNO andO2 fluorescence.All spectraareat thesamescaleunlessindicatedotherwise.Thepersistentpeakat207.8nmis anartefactdueto thetopwindow. Thedarkgrey bandsindicatethepositionsof theD 2 T U (v V =0) �X 2 X (v V V =3-8)bandsandthelight grey bandsthepositionsof theA2 T U (v V =0) � X 2 X (vV V =0-3)bandsof NO.
56
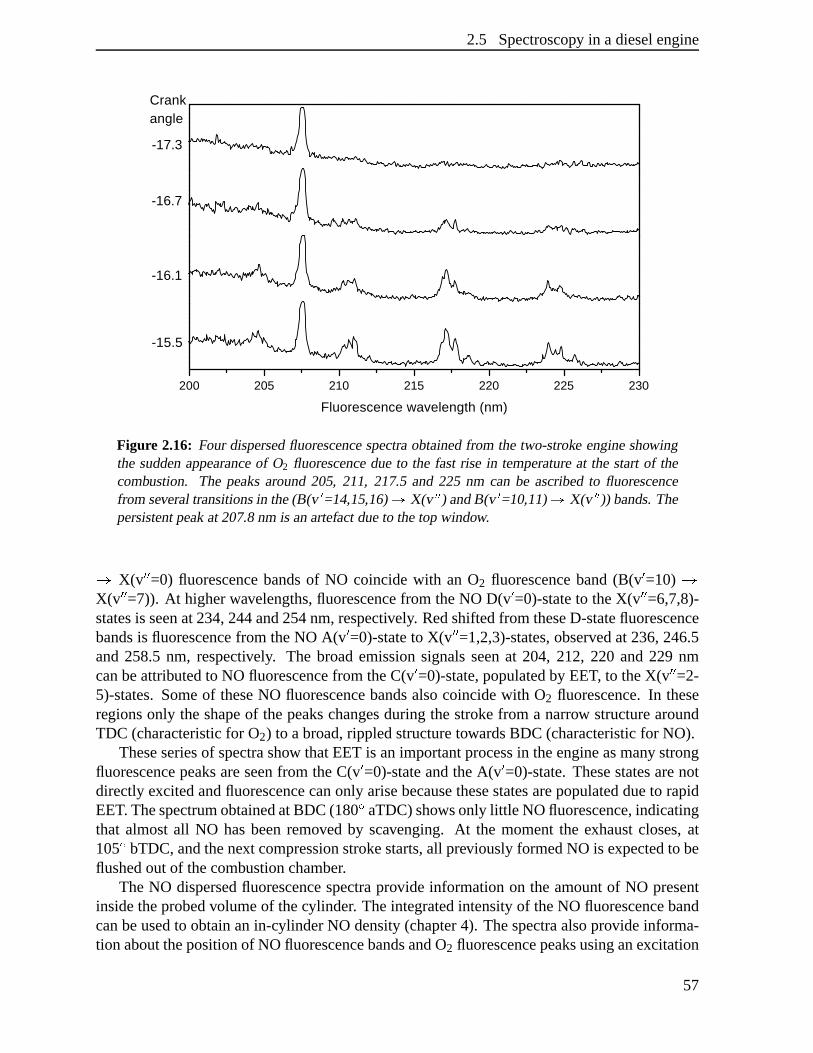
2.5 Spectroscopy in a dieselengine
200 205 210 215 220 225 230
Fluorescence wavelength (nm)
-15.5
-16.1
-16.7
-17.3
Crank angle
Figure 2.16: Four dispersedfluorescencespectraobtainedfrom the two-stroke engineshowingthe suddenappearanceof O2 fluorescencedueto the fastrise in temperatureat the startof thecombustion. The peaksaround205, 211, 217.5and 225 nm can be ascribedto fluorescencefrom severaltransitionsin the(B(v V =14,15,16)� X(v V V ) andB(v V =10,11)� X(v V V )) bands.Thepersistentpeakat207.8nm is anartefactdueto thetopwindow.
e X(v a�a =0) fluorescencebandsof NO coincidewith an O2 fluorescenceband(B(va =10) eX(v ada =7)). At higherwavelengths,fluorescencefrom theNO D(va =0)-stateto theX(v ada =6,7,8)-statesis seenat234,244and254nm,respectively. Redshiftedfrom theseD-statefluorescencebandsis fluorescencefrom theNO A(v a =0)-stateto X(v ada =1,2,3)-states,observedat 236,246.5and258.5nm, respectively. The broademissionsignalsseenat 204, 212, 220 and229 nmcanbeattributedto NO fluorescencefrom theC(va =0)-state,populatedby EET, to theX(v ada =2-5)-states.Someof theseNO fluorescencebandsalsocoincidewith O2 fluorescence.In theseregionsonly theshapeof thepeakschangesduring thestroke from a narrow structurearoundTDC (characteristicfor O2) to abroad,rippledstructuretowardsBDC (characteristicfor NO).
Theseseriesof spectrashow thatEET is animportantprocessin theengineasmany strongfluorescencepeaksareseenfrom theC(va =0)-stateandtheA(v a =0)-state.Thesestatesarenotdirectly excitedandfluorescencecanonly arisebecausethesestatesarepopulateddueto rapidEET. ThespectrumobtainedatBDC (180u aTDC)showsonly little NO fluorescence,indicatingthat almostall NO hasbeenremoved by scavenging. At the momentthe exhaustcloses,at105u bTDC,andthenext compressionstrokestarts,all previously formedNO is expectedto beflushedoutof thecombustionchamber.
The NO dispersedfluorescencespectraprovide informationon the amountof NO presentinsidetheprobedvolumeof thecylinder. Theintegratedintensityof theNO fluorescencebandcanbeusedto obtainanin-cylinderNO density(chapter4). Thespectraalsoprovide informa-tion aboutthepositionof NO fluorescencebandsandO2 fluorescencepeaksusinganexcitation
57
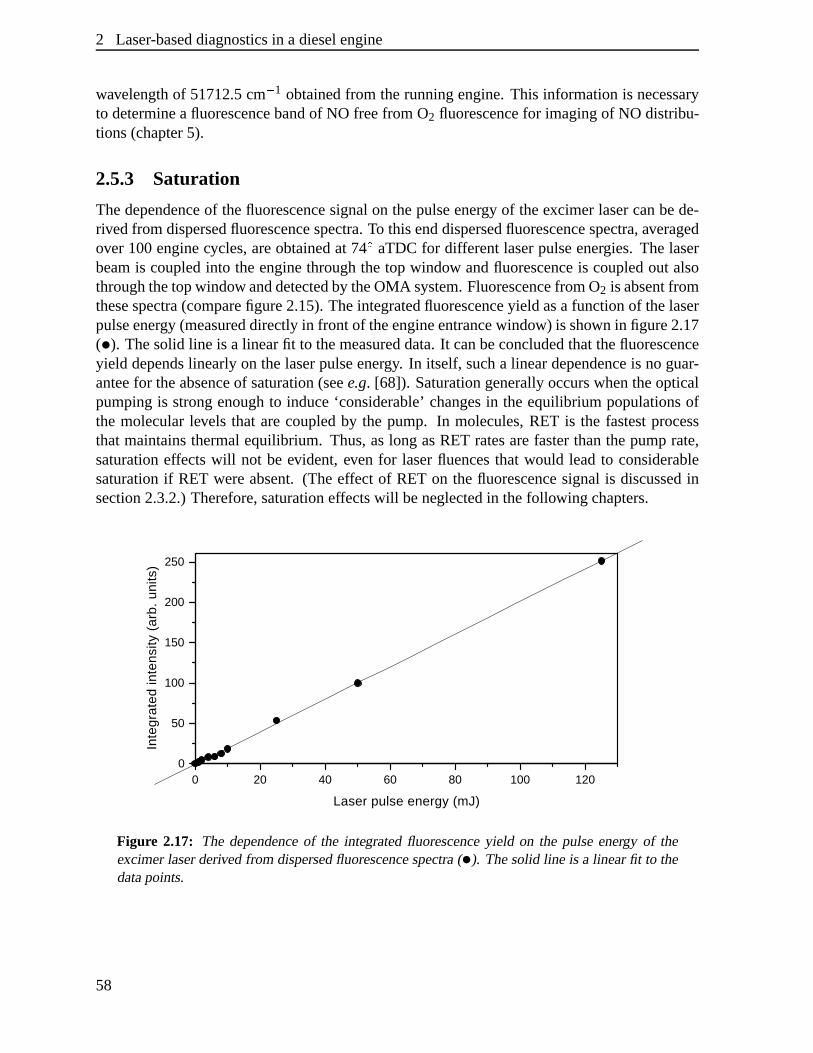
2 Laser-baseddiagnosticsin a dieselengine
wavelengthof 51712.5cm� 1 obtainedfrom therunningengine.This informationis necessaryto determineafluorescencebandof NO freefrom O2 fluorescencefor imagingof NO distribu-tions(chapter5).
2.5.3 Saturation
Thedependenceof thefluorescencesignalon thepulseenergy of theexcimer lasercanbede-rivedfrom dispersedfluorescencespectra.To thisenddispersedfluorescencespectra,averagedover 100enginecycles,areobtainedat 74u aTDCfor differentlaserpulseenergies. Thelaserbeamis coupledinto theenginethroughthe top window andfluorescenceis coupledout alsothroughthetopwindow anddetectedby theOMA system.Fluorescencefrom O2 is absentfromthesespectra(comparefigure2.15).Theintegratedfluorescenceyield asa functionof thelaserpulseenergy (measureddirectly in front of theengineentrancewindow) is shown in figure2.17( ). Thesolid line is a linearfit to themeasureddata.It canbeconcludedthatthefluorescenceyield dependslinearly on thelaserpulseenergy. In itself, sucha lineardependenceis no guar-anteefor theabsenceof saturation(seee.g. [68]). Saturationgenerallyoccurswhentheopticalpumpingis strongenoughto induce‘considerable’changesin the equilibrium populationsofthe molecularlevels that arecoupledby the pump. In molecules,RET is the fastestprocessthatmaintainsthermalequilibrium. Thus,aslong asRET ratesarefasterthanthepumprate,saturationeffectswill not be evident, even for laserfluencesthat would leadto considerablesaturationif RET wereabsent.(The effect of RET on the fluorescencesignal is discussedinsection2.3.2.)Therefore,saturationeffectswill beneglectedin thefollowing chapters.
0 20 40 60 80 100 1200
50
100
150
200
250
Inte
grat
ed in
tens
ity (
arb.
uni
ts)
Laser pulse energy (mJ)
Figure 2.17: The dependenceof the integratedfluorescenceyield on the pulseenergy of theexcimer laserderivedfrom dispersedfluorescencespectra( ). Thesolid line is a linearfit to thedatapoints.
58
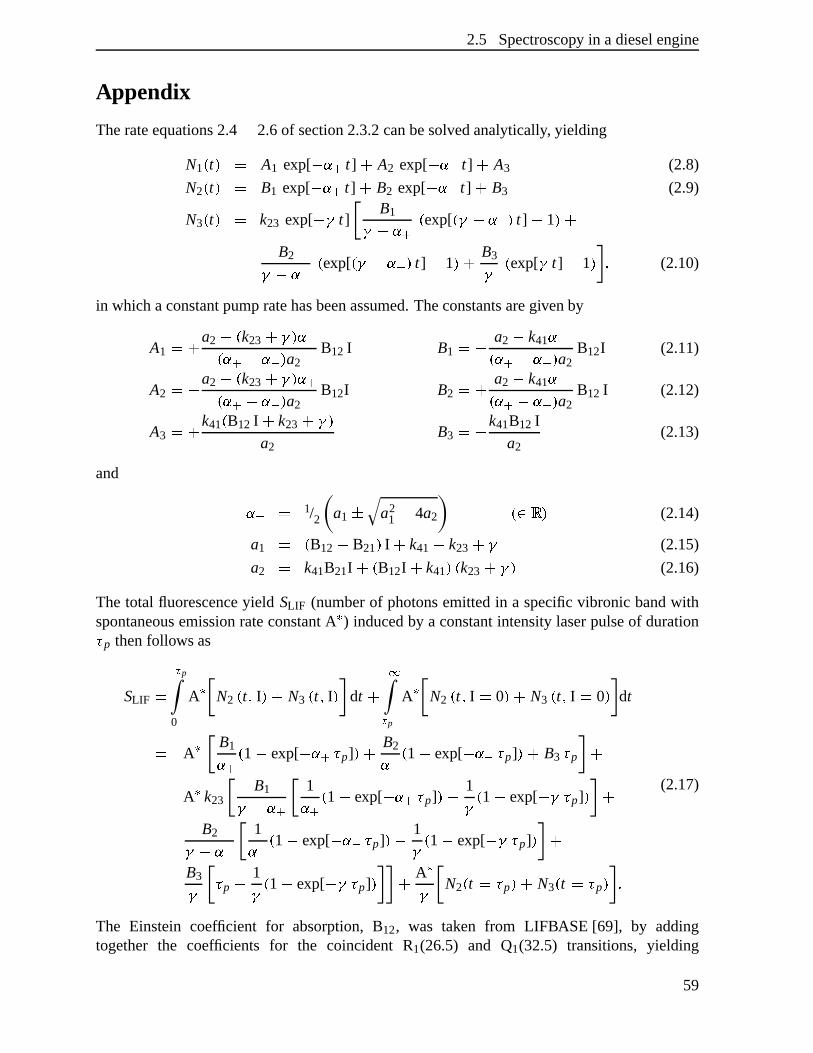
2.5 Spectroscopy in a dieselengine
Appendix
Therateequations2.4 H 2.6of section2.3.2canbesolvedanalytically, yielding
N1 ? t C�K A1 exp[ H]S _ t ] h A2 exp[ H[S � t ] h A3 (2.8)
N2 ? t C�K B1 exp[ H]S _ t ] h B2 exp[ H[S � t ] h B3 (2.9)
N3 ? t C�K k23 exp[ H�f t ]B1
f�H�S _ ? exp[ ? f�H�S _ C t ] H 1C hB2
f�H�S �? exp[ ? f�H�S � C t ] H 1C h B3
f ? exp[ f t ] H 1C B (2.10)
in which aconstantpumpratehasbeenassumed.Theconstantsaregivenby
A1 K h a2 H ? k23 h f�C0S �? S _ H�S � C a2B12 I B1 K�H a2 H k41S �? S _ H�S � C a2
B12I (2.11)
A2 K�H a2 H ? k23 h f�C0S _? S _ H�S � C a2
B12I B2 K h a2 H k41S _? S _ H�S � C a2
B12 I (2.12)
A3 K h k41 ? B12 I h k23 h f�Ca2
B3 K�H k41B12 I
a2(2.13)
and
S�� K 1/2 a1 � a21 H 4a2 ?4��� C (2.14)
a1 K ? B12 h B21C I h k41 h k23 h f (2.15)
a2 K k41B21I h�? B12I h k41C ? k23 h f�C (2.16)
The total fluorescenceyield SLIF (numberof photonsemittedin a specificvibronic bandwithspontaneousemissionrateconstantA Y ) inducedby a constantintensitylaserpulseof durationk p thenfollowsas
SLIF K�
p
0
A Y N2 ? t B I C h N3 ? t B I C dt h�
�p
A Y N2 ? t B I K 0C h N3 ? t B I K 0C dt
K A Y B1
S _ ? 1 H exp[ H[S _ k p] C h B2
S �? 1 H exp[ H[S � k p] C h B3 k p h
A Y k23B1
f�H�S _1
S _ ? 1 H exp[ H]S _ k p] CiH 1
f ? 1 H exp[ H�f�k p] C hB2
f|H�S �1
S �? 1 H exp[ H[S � k p] CIH 1
f ? 1 H exp[ H�f�k p] C hB3
f k p H 1
f ? 1 H exp[ H�f�k p] C h A Yf N2 ? t K�k p C h N3 ? t K�k p C N
(2.17)
The Einstein coefficient for absorption,B12, was taken from LIFBASE[69], by addingtogether the coefficients for the coincident R1(26.5) and Q1(32.5) transitions, yielding
59
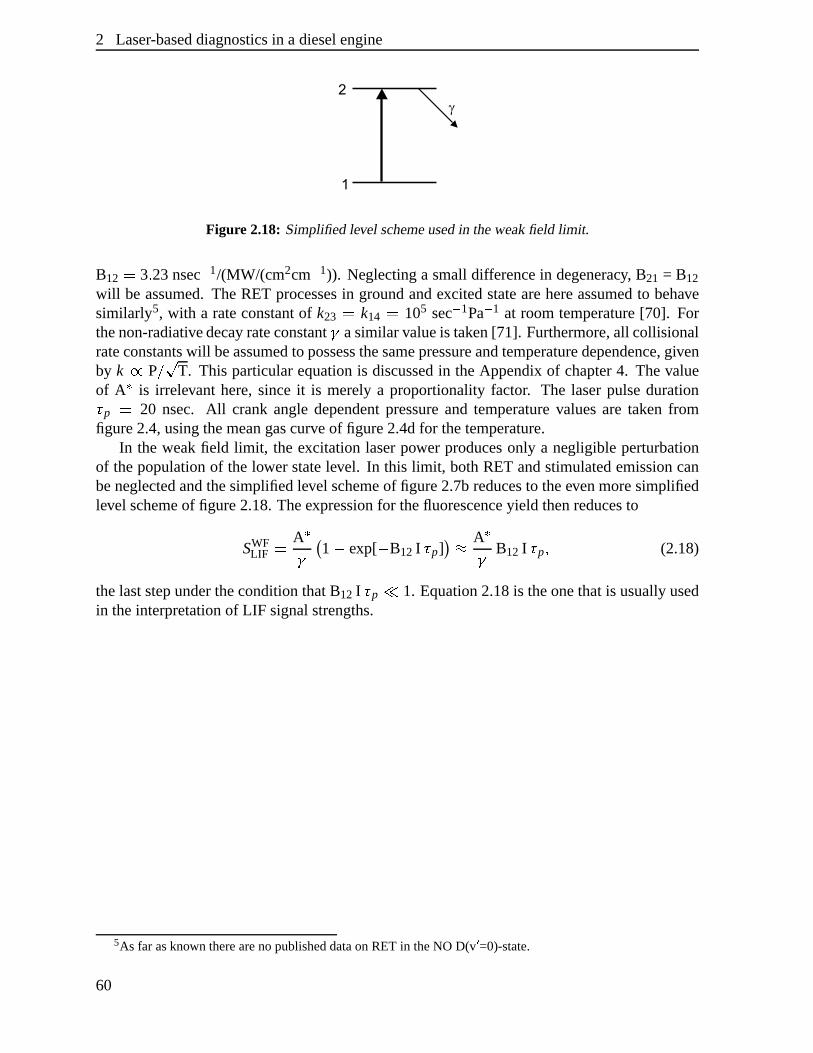
2 Laser-baseddiagnosticsin a dieselengine
Figure 2.18: Simplifiedlevel schemeusedin theweakfield limit.
B12 K 3 N 23 nsec� 1/(MW/(cm2cm� 1)). Neglectinga smalldifferencein degeneracy, B21 = B12
will be assumed.TheRET processesin groundandexcitedstatearehereassumedto behavesimilarly5, with a rateconstantof k23 K k14 K 105 sec� 1Pa� 1 at roomtemperature[70]. Forthenon-radiativedecayrateconstantf asimilarvalueis taken[71]. Furthermore,all collisionalrateconstantswill beassumedto possessthesamepressureandtemperaturedependence,givenby k E POQ� T. This particularequationis discussedin theAppendixof chapter4. Thevalueof A Y is irrelevant here,sinceit is merelya proportionalityfactor. The laserpulsedurationk p K 20 nsec. All crank angledependentpressureand temperaturevaluesare taken fromfigure2.4,usingthemeangascurveof figure2.4dfor thetemperature.
In the weakfield limit, the excitation laserpower producesonly a negligible perturbationof thepopulationof the lower statelevel. In this limit, bothRET andstimulatedemissioncanbeneglectedandthesimplifiedlevel schemeof figure2.7breducesto theevenmoresimplifiedlevel schemeof figure2.18.Theexpressionfor thefluorescenceyield thenreducesto
SWFLIF K A Y
f 1 H exp[ H B12 I k p] \ A Yf B12 I k p B (2.18)
thelaststepundertheconditionthatB12 I k p � 1. Equation2.18is theonethatis usuallyusedin theinterpretationof LIF signalstrengths.
5As far asknown thereareno publisheddataon RET in theNO D(v V =0)-state.
60
Chapter 3
A method to assessthe local attenuationcoefficientby Mie scatteringusing twocounterpropagatinglaserbeams
Abstract
Two-dimensionallaserinducedfluorescencedistributionsof specificmoleculeswihin thecom-bustionchamberof a runningdieselenginecanbe interpretedquantitatively, provided that anumberof additionalparametersis known. Oneof the mostelusive of theseis the local illu-minationintensitydistribution over the field of view, dealtwith in this chapter. A methodtoderive thespatiallyresolvedattenuationcoefficient is developed,usingtwo elasticlight scatter-ing images,recordedsimultaneouslyfrom thesameareawithin theengine,but illuminatedfromoppositedirections(doubleimagemethod).Althoughexact in principle, this methodrequiresconsiderableexperimentalexpenditure,andfor this reasona moreapproximatemethodusingonly a singleelasticscatteringimageis describedaswell (singleimagemethod). The singleimagemethodrequiresthe total transmissionlossesover theengine’s combustionchamberasinput. Sincetheexperimentaldeterminationof transmissionfacesits own difficulties, it is de-scribedin aseparatesection.Theresultsof thesingleimagemethodarecomparedagainstthoseof thedoubleimagemethod.Finally, they arecomparedagainstimagesof thenaturalemissionof thecylindercontentsduringcombustion.
61
3 A methodto assessthelocalattenuationcoefficient........
3.1 Intr oduction
Laser-basedopticaldiagnosticscanbe usedto characterisecombustionprocessesin greatde-tail. They areappreciatedfor their ability to combinenon-intrusivenesswith sensitivity andselectivity for specificchemicalspeciesandquantumstates[30]. As suchthey have beenap-pliedto bothopenflamesandinternalcombustionengines[31,32]. LaserInducedFluorescence(LIF) is a diagnostictechniquethat hasthe sensitivity to provide spatiallyandtemporallyre-solvedinformationonminority speciesin combustionprocesses.Themeasurementprincipleofthis techniqueinvolveselectronicexcitationof themoleculesof interestby laserradiationanddetectionof theinducedfluorescence.By usinga sheetof laserlight andrecordingthefluores-cenceby a gatedCCD camerain a directionperpendicularto theplaneof thelasersheet,two-dimensionaldistributionsof thespeciesof interestcanbeobtained.Two-dimensionalLIF hasbeenusedto demonstratethepresenceof a largenumberof specificsmallmoleculesin avarietyof combustionenvironments[31,32]. Spatiallyresolveddetectionof thelaserinducedfluores-cenceprovidesinformationon the local densityof themoleculeof interest,but in generalthisinformationis hardto quantify. In principle, if the transitionis not saturated,thefluorescenceintensityis proportionalto the intensityof the laserbeam,thedensityof themoleculesin theprobedstateandthefractionof excitedmoleculesthatfluorescesat theright wavelength.Theproportionalityconstant,however, dependsstronglyon the local conditionsin theobservationpoint, like pressure,temperatureandchemicalcomposition.For a two-dimensionalmeasure-ment,fluorescencequenchingandtemperaturemightbeinhomogeneousasthelocalconditionswithin the observation volumecanbe differentat eachposition. In addition, the local laserintensitywill generallyvaryoverthefield of view, dueto scatteringandabsorption.In practice,the laserintensitydistribution within a certainmeasurementvolumeis difficult to assess.Ingeneral,whenLIF is to beappliedto practicalcombustiondevices,factorsthatdeterminethelaserintensityin themeasurementvolumecomprisei) lossesdueto the(often limited) opticalaccessto the combustion, ii ) extinction betweenthe accessports and the actualobservationareaand iii ) extinction within the observation areaitself. Although the last two loss factors,in principle, arecausedby the sameprocesses,they shouldbe distinguishedin the analysis.In the following, several publishedattemptsto dealwith this problemwill be discussed,andsubsequentlythespecificproblemof NO detectioninsidethecombustionchamberof a runningdieselengineby meansof UV LIF will beconsidered.
Stepowski [72] developeda techniquein which thefluorescencesignalobtainedfrom OHexcitedby laserlight in a flameis quantifiedby a locally determinedabsorptionbetweentwocloselyspacedpoints. To be independentof the local environment,which could be differentfor the two probedpoints,a bi-directionallaserbeamconfigurationwasused. After the firstlaserbeama secondlaserbeamis sentthroughtheflamealongthesamepathbut in oppositedirectionandwith a slight delay. In situ calibrationof the fluorescencesignal is determinedfrom the ratio of the two fluorescencesignalsinducedby the two excitation beams. In thismethodit is assumedthattheattenuationof thelaserbeamis causedonly by absorptionby themoleculeof interest.Versluisetal. [73] haveextendedthis techniqueandpresentedadetectionschemefor two-dimensionalspatiallyresolvedabsolutenumberdensitymeasurementsof OHradicalsin flames. The OH concentrationis derived from the ratio of two OH LIF images,which areobtainedfrom two laserbeamstravelling throughtheflamealongthesamepathbutin oppositedirection. By using this bi-directionalapproachanddivision of the imageson a
62
3.1 Introduction
pixel-to-pixel basis,quenchingratesareeliminated.A disadvantageof this methodis the lossin sensitivity, asby the division of both signalsthe experimentin principle is reducedto anabsorptionmeasurementandthesensitivity of theLIF techniqueis lost.
This methodcannotdirectly beappliedto measureabsoluteconcentrationsof moleculesindieselenginesasthe processthat reducesthe intensityof the laserradiationis morecompli-cated.Whereasin theflameexperiments[72,73] attenuationof thelaserintensityis (assumedto be)causedby absorptionof the radiationby only thespeciesof interest,this molecularab-sorptionplaysonly a minor part in thedecreaseof the laserintensityin thedieselengine.Onits way throughthe combustionchamber, attenuationof the laserbeamis mainly causedbyscatteringoff andabsorptionby sootparticlesandoil andfuel droplets.Therefore,thelaserin-tensityattenuationdependson thedensityof scatteringandabsorbingparticlesandoil andfueldropletsratherthanonthedensityof theabsorbingmolecules.Althoughin thiscasethemethodwith thetwo anti-collinearlaserbeamsis not usefulto determinetheabsoluteconcentrationofthe molecularspeciesof interestit can,however, be usedto determinea local factor for theattenuationof the laserradiation.This local attenuationcoefficient is requiredto calculatethelocal laserintensity, oneof the parametersthat is necessaryto quantify two-dimensionalLIFdistributions.
In thepresentwork thetechniquewith thebi-directionallaserbeamconfigurationis adaptedto obtainaneffectiveattenuationcoefficientfor thelaserintensitywhichcanbeusedto calculatethe local laserintensity. To this end the elasticallyscatteredlaserradiation,the intensityofwhich is proportionalto the local laserintensity, is recorded.To be independentof the localscatteringcircumstancestwo laserbeamsareused,the secondof which traversesthe enginewith ashortdelay(\ 50 ns)andin oppositedirectionascomparedto thefirst laserbeam.Twocamerasareusedto recordtwo-dimensionalimagesof theelasticallyscatteredlaserradiation.Contraryto theflameexperiment[73], in which theimagesarerecordedaftereachotheron thesamecamera,bothimagesnow have to berecordedat nearlythesamemomentusingtwo laserandcamerasystems,asthe combustionin a dieselengineis very irreproducible.After somemanipulation,discussedbelow, this resultsin an imagerepresentingan attenuationfactorforthelaserintensitywhichcanbeusedto reconstructthelocal laserintensity.
Using this methodin practicefor the determinationof NO densitydistributions impliesthatthreeimages,scatteringdistributionsin bothdirectionsandaNO fluorescencedistribution,wouldhave to berecordedsimultaneously. This is rathercomplicated,asthreecamerasystemsand(at least)two laserbeamswouldhave to beused.It wouldbeof interest,if possible,to useonly onescatteringimageto arrive at thelocal laserintensity. In addition,therefore,a methodis developedto extract the local laserintensityfrom only onescatteringimage. This method,which will bedenotedasthesingleimagemethod,is checkedby comparingits resultwith thatof the methodusing imagesobtainedfrom two laserbeamstravelling throughthe engineinoppositedirection,denotedasthedoubleimagemethod.
Finally, thesingleimagemethodis appliedto elasticscatteringimagesin orderto comparethemto simultaneouslymeasuredflameemissionimages.
63
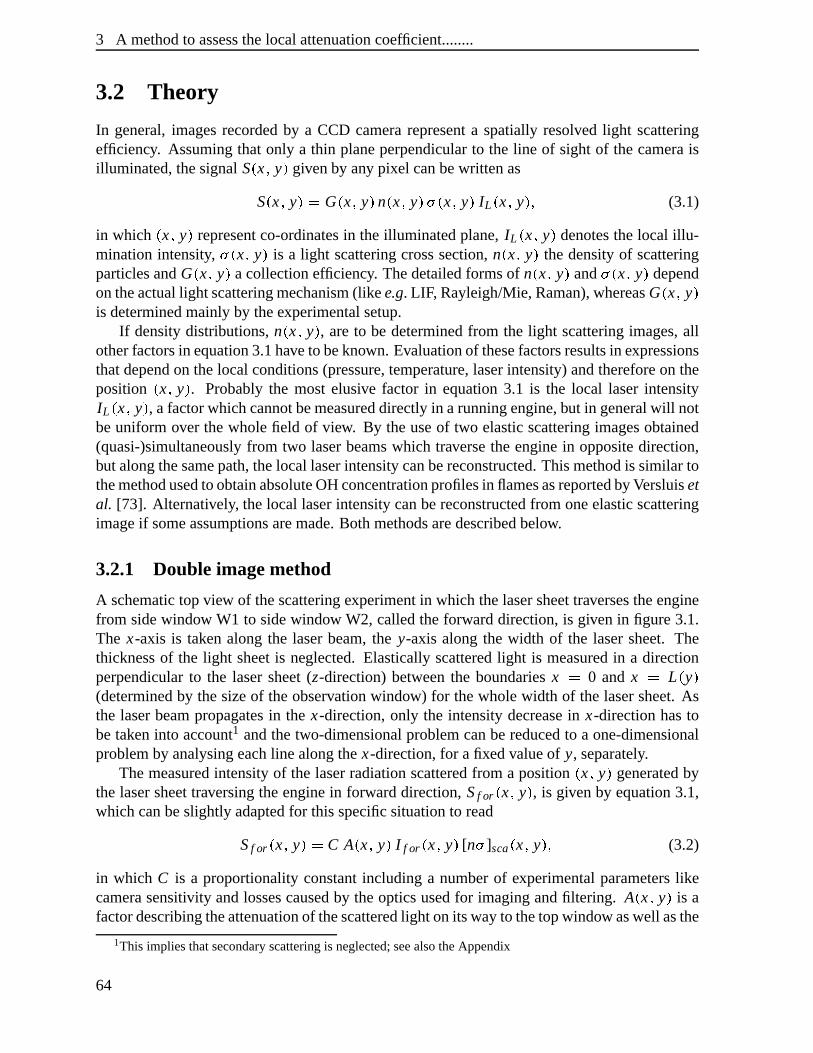
3 A methodto assessthelocalattenuationcoefficient........
3.2 Theory
In general,imagesrecordedby a CCD camerarepresenta spatially resolved light scatteringefficiency. Assumingthatonly a thin planeperpendicularto the line of sightof thecameraisilluminated,thesignalS? x B y C givenby any pixel canbewrittenas
S? x B y CLK G ? x B y C n ? x B y C�� ? x B y C IL ? x B yC B (3.1)
in which ? x B y C representco-ordinatesin theilluminatedplane,IL ? x B y C denotesthelocal illu-minationintensity, � ? x B y C is a light scatteringcrosssection,n ? x B y C thedensityof scatteringparticlesandG ? x B y C acollectionefficiency. Thedetailedformsof n ? x B y C and � ? x B y C dependontheactuallight scatteringmechanism(likee.g. LIF, Rayleigh/Mie,Raman),whereasG ? x B y Cis determinedmainly by theexperimentalsetup.
If densitydistributions,n ? x B y C , areto be determinedfrom the light scatteringimages,allotherfactorsin equation3.1haveto beknown. Evaluationof thesefactorsresultsin expressionsthatdependon thelocal conditions(pressure,temperature,laserintensity)andthereforeon theposition ? x B y C . Probablythe most elusive factor in equation3.1 is the local laserintensityIL ? x B y C , a factorwhichcannotbemeasureddirectly in arunningengine,but in generalwill notbeuniform over thewholefield of view. By theuseof two elasticscatteringimagesobtained(quasi-)simultaneouslyfrom two laserbeamswhich traversethe enginein oppositedirection,but alongthesamepath,thelocal laserintensitycanbereconstructed.Thismethodis similar tothemethodusedtoobtainabsoluteOHconcentrationprofilesin flamesasreportedbyVersluisetal. [73]. Alternatively, thelocal laserintensitycanbereconstructedfrom oneelasticscatteringimageif someassumptionsaremade.Both methodsaredescribedbelow.
3.2.1 Double imagemethod
A schematictopview of thescatteringexperimentin which thelasersheettraversestheenginefrom sidewindow W1 to sidewindow W2, calledtheforwarddirection,is givenin figure3.1.The x-axis is taken along the laserbeam,the y-axis along the width of the lasersheet. Thethicknessof the light sheetis neglected. Elasticallyscatteredlight is measuredin a directionperpendicularto the lasersheet(z-direction)betweenthe boundariesx K 0 and x K L ? y C(determinedby thesizeof theobservationwindow) for thewholewidth of the lasersheet.Asthe laserbeampropagatesin the x-direction,only the intensitydecreasein x-directionhastobetakeninto account1 andthetwo-dimensionalproblemcanbereducedto a one-dimensionalproblemby analysingeachline alongthex-direction,for afixedvalueof y, separately.
Themeasuredintensityof the laserradiationscatteredfrom a position ? x B y C generatedbythe lasersheettraversingtheenginein forwarddirection,Sf or ? x B yC , is givenby equation3.1,whichcanbeslightly adaptedfor this specificsituationto read
Sf or ? x B y C�K C A ? x B yC I f or ? x B y C [n� ]sca ? x B yC B (3.2)
in which C is a proportionalityconstantincluding a numberof experimentalparameterslikecamerasensitivity andlossescausedby theopticsusedfor imagingandfiltering. A ? x B y C is afactordescribingtheattenuationof thescatteredlight onits wayto thetopwindow aswell asthe
1This impliesthatsecondaryscatteringis neglected;seealsotheAppendix
64
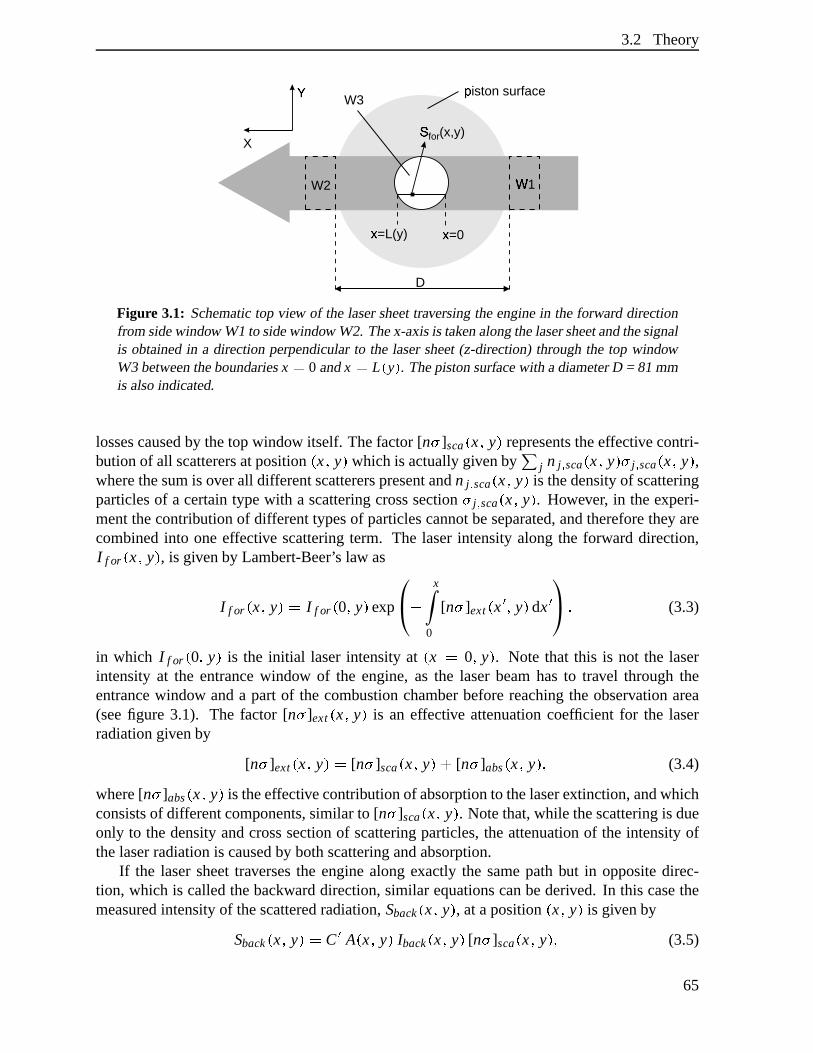
3.2 Theory
x=0�x=L(y)�
piston surface�W3
S (x,y)
for
W1¡
W2
D
X
Y¢
Figure 3.1: Schematictop view of the lasersheettraversingtheenginein theforwarddirectionfrom sidewindow W1 to sidewindow W2. Thex-axisis takenalongthelasersheetandthesignalis obtainedin a directionperpendicularto the lasersheet(z-direction)throughthe top windowW3 betweentheboundariesx p 0 andx p L £ y¤ . Thepistonsurfacewith adiameterD = 81mmis alsoindicated.
lossescausedby thetopwindow itself. Thefactor[n� ]sca ? x B yC representstheeffectivecontri-butionof all scatterersatposition ? x B y C which is actuallygivenby j n j ¥ sca ? x B y C4� j ¥ sca ? x B y C ,wherethesumis overall differentscattererspresentandn j ¥ sca ? x B y C is thedensityof scatteringparticlesof a certaintypewith a scatteringcrosssection� j ¥ sca ? x B y C . However, in theexperi-mentthecontribution of differenttypesof particlescannotbeseparated,andthereforethey arecombinedinto oneeffective scatteringterm. The laserintensityalongthe forward direction,I f or ? x B y C , is givenby Lambert-Beer’s law as
I f or ? x B yC�K I f or ? 0 B y C exp Hx
0
[n� ]ext ? x a B y C dx a B (3.3)
in which I f or ? 0 B y C is the initial laserintensityat ? x K 0 B y C . Note that this is not the laserintensity at the entrancewindow of the engine,as the laserbeamhasto travel throughtheentrancewindow anda part of the combustionchamberbeforereachingthe observation area(seefigure 3.1). The factor [n� ]ext ? x B y C is an effective attenuationcoefficient for the laserradiationgivenby
[n� ]ext ? x B y C�K [n� ]sca ? x B yC h [n� ]abs ? x B y C B (3.4)
where[n� ]abs ? x B y C is theeffectivecontributionof absorptionto thelaserextinction,andwhichconsistsof differentcomponents,similar to [n� ]sca ? x B y C . Notethat,while thescatteringis dueonly to thedensityandcrosssectionof scatteringparticles,the attenuationof the intensityofthelaserradiationis causedby bothscatteringandabsorption.
If the lasersheettraversesthe enginealongexactly the samepath but in oppositedirec-tion, which is calledthebackwarddirection,similar equationscanbederived. In this casethemeasuredintensityof thescatteredradiation,Sback ? x B y C , at aposition ? x B y C is givenby
Sback ? x B yC�K C a A ? x B y C Iback ? x B y C [n� ]sca ? x B y C B (3.5)
65
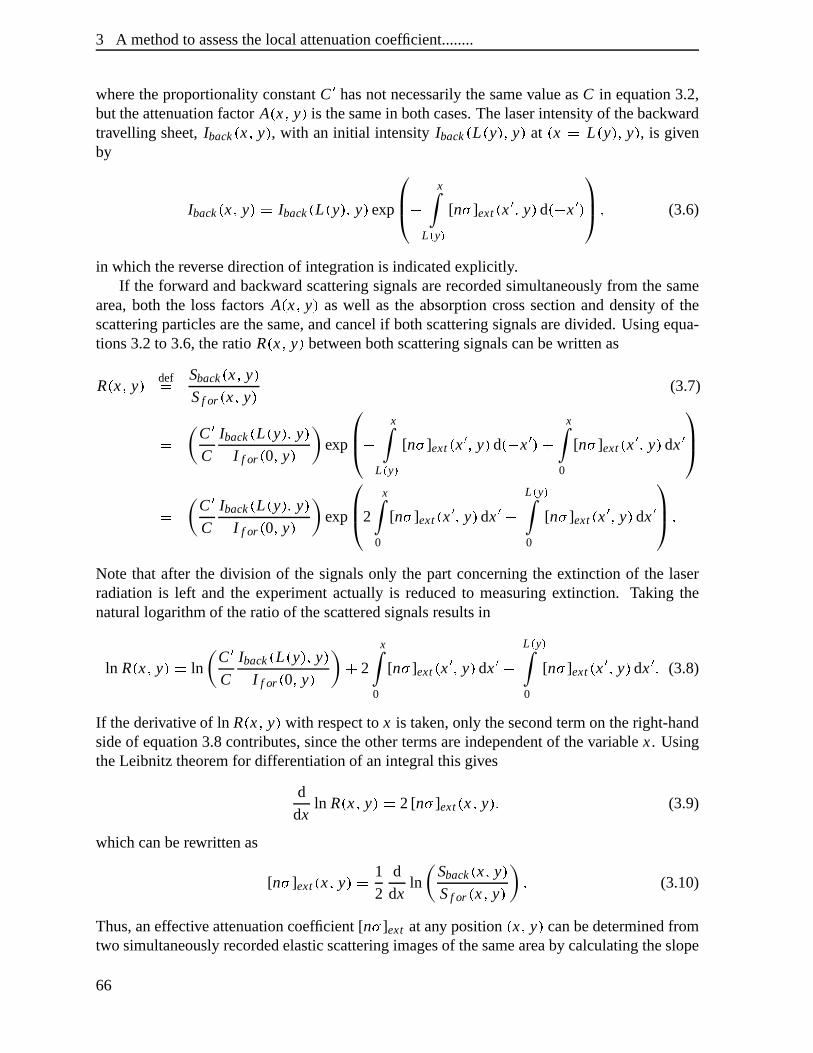
3 A methodto assessthelocalattenuationcoefficient........
wheretheproportionalityconstantC a hasnot necessarilythesamevalueasC in equation3.2,but theattenuationfactorA ? x B y C is thesamein bothcases.Thelaserintensityof thebackwardtravelling sheet,Iback ? x B y C , with an initial intensity Iback ? L ? yC B y C at ? x K L ? yC B y C , is givenby
Iback ? x B y CLK Iback ? L ? yC B y C exp Hx
L ¦ y§[n� ]ext ? x a B y C d ? H x a C B (3.6)
in which thereversedirectionof integrationis indicatedexplicitly.If the forwardandbackwardscatteringsignalsarerecordedsimultaneouslyfrom thesame
area,both the loss factorsA ? x B y C aswell as the absorptioncrosssectionanddensityof thescatteringparticlesarethesame,andcancelif bothscatteringsignalsaredivided. Usingequa-tions3.2to 3.6,theratio R? x B y C betweenbothscatteringsignalscanbewrittenas
R ? x B yC defK Sback ? x B y CSf or ? x B y C (3.7)
K C aC
Iback ? L ? y C B y CI f or ? 0 B y C exp H
x
L ¦ y§[n� ]ext ? x a B yC d ? H x a C h
x
0
[n� ]ext ? x a B y C dx a
K C aC
Iback ? L ? y C B y CI f or ? 0 B y C exp 2
x
0
[n� ]ext ? x a B y C dx a HL ¦ y§
0
[n� ]ext ? x a B y C dx a N
Note that after the division of the signalsonly the part concerningthe extinction of the laserradiationis left and the experimentactually is reducedto measuringextinction. Taking thenaturallogarithmof theratioof thescatteredsignalsresultsin
ln R ? x B yCLK lnC aC
Iback ? L ? y C B yCI f or ? 0 B y C h 2
x
0
[n� ]ext ? x a B y C dx a HL ¦ y§
0
[n� ]ext ? x a B y C dx a N (3.8)
If thederivativeof ln R? x B y C with respectto x is taken,only thesecondtermon theright-handsideof equation3.8contributes,sincetheothertermsareindependentof thevariablex. UsingtheLeibnitz theoremfor differentiationof anintegral this gives
d
dxln R? x B y CLK 2[n� ]ext ? x B y C B (3.9)
whichcanberewrittenas
[n� ]ext ? x B y C�K 1
2
d
dxln
Sback ? x B yCSf or ? x B y C N (3.10)
Thus,aneffectiveattenuationcoefficient [n� ]ext atany position ? x B y C canbedeterminedfromtwo simultaneouslyrecordedelasticscatteringimagesof thesameareaby calculatingtheslope
66
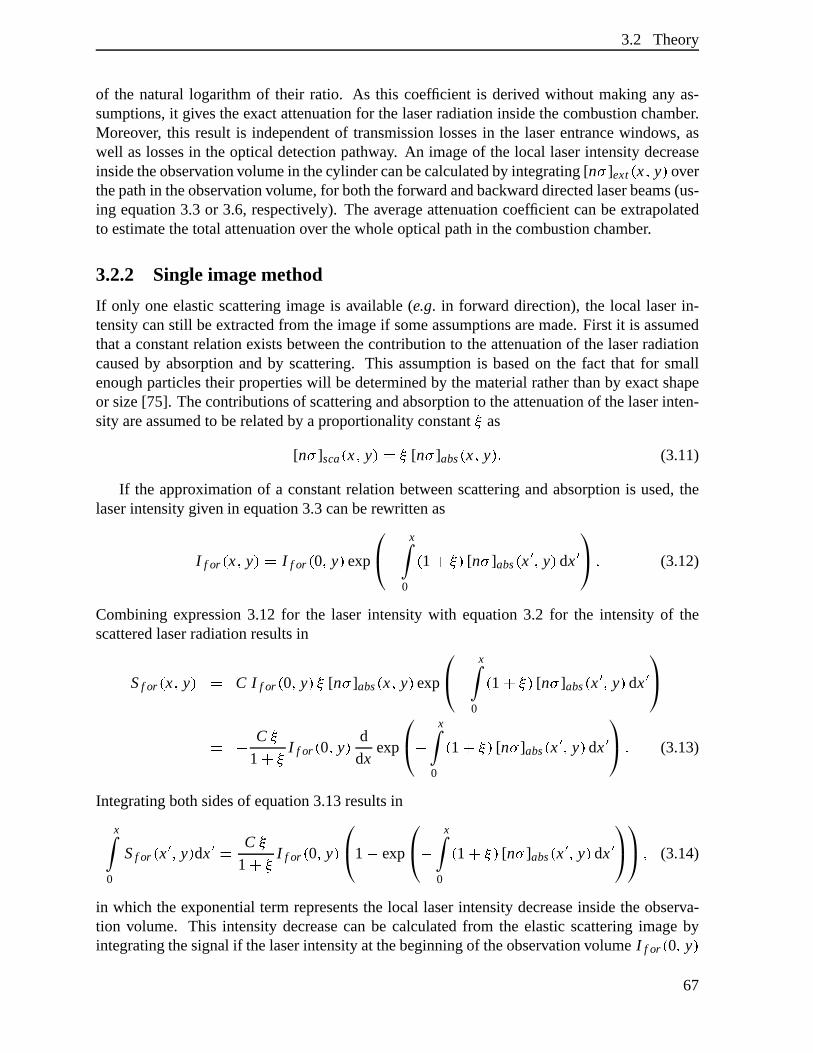
3.2 Theory
of the naturallogarithmof their ratio. As this coefficient is derived without makingany as-sumptions,it givestheexactattenuationfor thelaserradiationinsidethecombustionchamber.Moreover, this result is independentof transmissionlossesin the laserentrancewindows, aswell aslossesin theopticaldetectionpathway. An imageof the local laserintensitydecreaseinsidetheobservationvolumein thecylindercanbecalculatedby integrating[n� ]ext ? x B y C overthepathin theobservationvolume,for boththeforwardandbackwarddirectedlaserbeams(us-ing equation3.3 or 3.6, respectively). Theaverageattenuationcoefficient canbeextrapolatedto estimatethetotal attenuationover thewholeopticalpathin thecombustionchamber.
3.2.2 Singleimagemethod
If only oneelasticscatteringimageis available(e.g. in forward direction),the local laserin-tensitycanstill beextractedfrom theimageif someassumptionsaremade.First it is assumedthata constantrelationexistsbetweenthecontribution to theattenuationof the laserradiationcausedby absorptionandby scattering. This assumptionis basedon the fact that for smallenoughparticlestheir propertieswill bedeterminedby thematerialratherthanby exactshapeor size[75]. Thecontributionsof scatteringandabsorptionto theattenuationof thelaserinten-sity areassumedto berelatedby aproportionalityconstant as
[n� ]sca ? x B y C�K�¨ [n� ]abs ? x B y C©N (3.11)
If the approximationof a constantrelationbetweenscatteringandabsorptionis used,thelaserintensitygivenin equation3.3canberewrittenas
I f or ? x B y C�K I f or ? 0 B y C exp Hx
0
? 1 h ¨ªC [n� ]abs ? x a B yC dx a N (3.12)
Combiningexpression3.12 for the laser intensity with equation3.2 for the intensity of thescatteredlaserradiationresultsin
Sf or ? x B y C�K C I f or ? 0 B yC�¨ [n� ]abs ? x B y C exp Hx
0
? 1 h ¨�C [n� ]abs ? x a B y C dx a
K H C ¨1 h ¨ I f or ? 0 B y C d
dxexp H
x
0
? 1 h ¨ªC [n� ]abs ? x a B y C dx a N (3.13)
Integratingbothsidesof equation3.13resultsin
x
0
Sf or ? x a B yC dx a K C ¨1 h ¨ I f or ? 0 B y C 1 H exp H
x
0
? 1 h ¨�C [n� ]abs ? x a B y C dx a B (3.14)
in which theexponentialtermrepresentsthe local laserintensitydecreaseinsidetheobserva-tion volume. This intensity decreasecan be calculatedfrom the elasticscatteringimagebyintegratingthesignalif thelaserintensityat thebeginningof theobservationvolumeI f or ? 0 B y C
67
3 A methodto assessthelocalattenuationcoefficient........
is known. This intensitycanbeapproximatedfrom thetotal transmissionof thelaserradiationthroughtheengine.On theassumptionof anaverageattenuationcoefficient thatdoesnot varyappreciablyover lengthscalescorrespondingto the sizeof the observation area,the intensitydecreasein thefirst partof thecombustionchamber, thatcannotbeseenthroughthewindow,canbedetermined.
3.2.3 Transmission
Theintensityof thelaserradiation,whereit enterstheobservationareaat theposition ? 0 B y C inthecombustionchamberof theengine,is givenby
I f or ? 0 B y C�K IW1TW1 exp H0
W1
[n� ]ext ? x a B y C dx a B (3.15)
whereIW1 is theintensityof thelaserradiationbeforeenteringtheengine(throughwindow W1)andTW1 the transmissionof the entrancewindow. Using an averageattenuationcoefficient,[n� ]ext , equation3.15canberewrittenas
I f or ? 0 B y C�K IW1TW1 exp H [n� ]ext? D H L C
2B (3.16)
whereD is thediameterof thecylinder (seefigure3.1).Theaverageattenuationcoefficient canbeobtainedfrom thetotal transmissionof thelaser
radiationthroughthecombustionchamberof therunningengine.For theforwarddirectionthetransmissionthroughthecombustionchamberof theengineis givenby
IW2 K IW1TW1TW2 exp ? H [n� ]ext D C B (3.17)
whereIW2 theintensityof thelaserradiationafterits way throughthefiring engineandthetwosidewindowsandTW2 thetransmissionof theexit window. Equation3.17canberewrittenas
[n� ]ext K«H 1
Dln
IW2
IW1TW1TW2B (3.18)
which subsequentlycanbeusedin equation3.16,if oneassumesthat theaverage attenuationin thewholecylinder is thesameasthat in theinvisible parts(notethat L \ 0 N 3D). However,a disadvantageof this methodis thatthewindow transmission,which is difficult to measure,isincludedin theresult.
Alternatively, the averageattenuationcoefficient of the observation volume, without anycontribution from the sidewindows, canbe derived from the doubleimagemethod. The ef-fective attenuationcoefficient, [n� ]ext ? x B y C from equation3.10, canbe usedto calculateanaverageattenuationof the laserbeamover the observation area,which canbe assumedto beequalto theaverageattenuationfor thewholepathin thecombustionchamber.
Using the averageattenuationcoefficient in the integral of equation3.14 and integratingover thepartof thecylinder thatcanbeseen(i.e. 0 M x M L ? yC ) resultsin
L ¦ y§
0
Sf or ? x a B yC dx a K C ¨1 h ¨ I f or ? 0 B yC 1 H exp H ? 1 h ¨�C [n� ]absL ? y C B (3.19)
68
3.3 Experimentalsetup
whichcanberewrittenas
I f or ? 0 B yC�K 1 h ¨C ¨ 1 H IW2
IW1TW1TW2
L ¬ y D
� 1 L ¦ y§
0
Sf or ? x a B yC dx a N (3.20)
If this result for the laserintensityat the beginning of the observation areais usedin equa-tion 3.14,anexpressionfor thelocal laserintensitydecreasecanbederived
I f or ? x B y CI f or ? 0 B yC K 1 H 1 H IW2
IW1TW1TW2
L ¬ yD
x
0Sf or ? x a B y C dx a
L ¦ y§0
Sf or ? x a B y C dx aN (3.21)
Notethatthisexpressionis independentof theexactvalueof theproportionalityconstant ;only theassumptionof aconstantrelationbetweenabsorptionandscatteringis used.If thevalueof ¨ is varied,only theabsolutevaluesof thelaserintensitychange,but not thedistribution. Amethodto estimatethevalueof ¨ is givenin theAppendix.
3.3 Experimental setup
Theengineusedin theexperimentis anoptically accessibleone-cylinder two-stroke direct in-jectiondieselengine(boreD=81mm)whichis describedin detailin chapter2, section2.2.Theengineis steadilyrunning(i.e. not skip-fired)on standardcommercialdieselfuel andambient(non-oxygen-enriched)intake air. Optical accessto the combustionchamberis provided byquartzwindows (SuprasilI) in thecylinder head.Two rectangularsidewindows(W1 andW2;25 z 10 mm2; thickness25 mm) areplaceddiametricallyin thewall in sucha way thata lasersheetcanenterthecombustionchamberthroughoneof themandcanleave it throughtheother.A cylindrical top window (W3; diameter25 mm; thickness35 mm) is placedcentrallyin thetopof thecylinderhead.
3.3.1 Double imagemethod
Theexperimentalsetupshowing theengine,two laserbeamsandtwo CCDcamerasis schemat-ically givenin figure3.2.Thelasersystemsusedarebothpulsed(10Hz) excimerlasers(Com-pex 350TandEMG 150MSCT; ® -Physik)runningonArF deliveringradiationtunablebetween192.9and193.9nm. Both deliver pulseswith a durationof 20 ns,a bandwidthof 1 cm� 1 anda rectangularbeamprofile (25 z 3 mm2) . The laserbeamsareorientedin a horizontalplaneparallelto thepistonuppersurfaceandshapedinto athin sheet(25 z 0.5mm2) by two cylindri-cal lenses.Thelasersheettraversingtheenginein forwarddirectionis coupledinto theenginethroughthesidewindow W1 andcoupledout throughtheothersidewindow W2. Thesecondlasersheetgoingin backwarddirectionis directedanti-collinearlythroughtheengine(coupledin throughW2 andout throughW1). The sheetsspatiallyoverlappedinsidethe engine. Theelasticallyscatteredlaserradiationis detectedin a directionperpendicularto the lasersheetsthroughthe top window by two similar camerasystems(figure 3.2). By the useof 193 nm
69
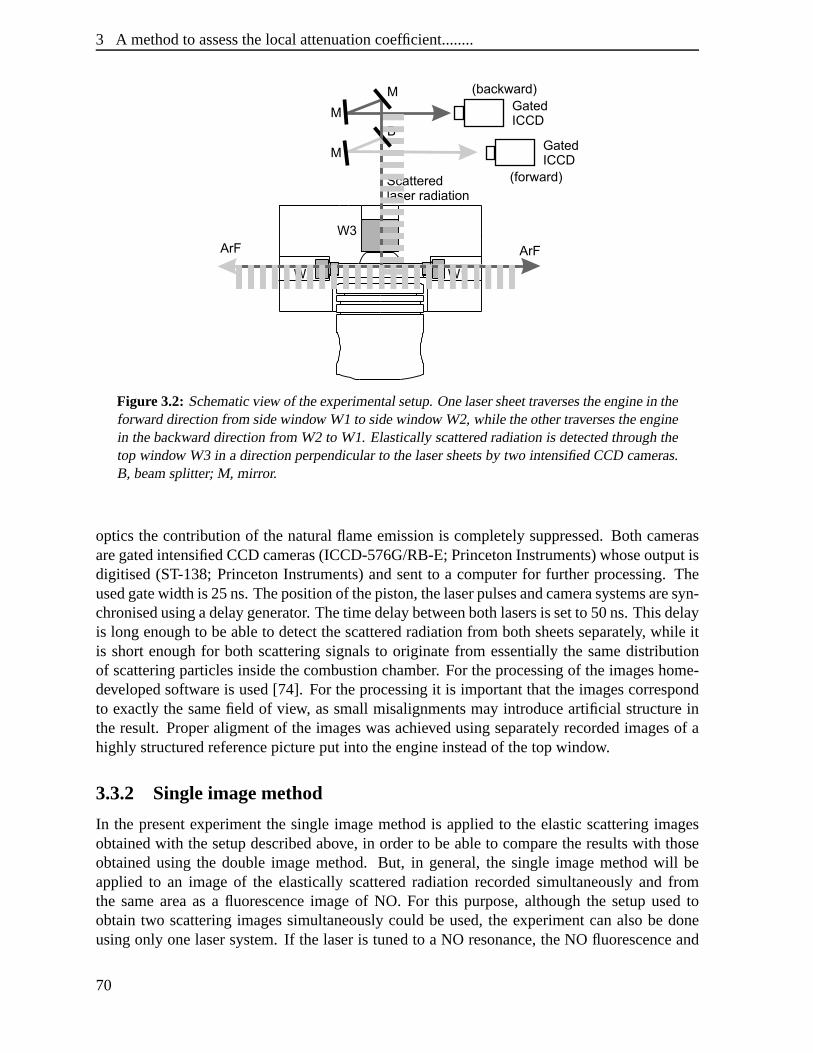
3 A methodto assessthelocalattenuationcoefficient........
Figure3.2: Schematicview of theexperimentalsetup.Onelasersheettraversestheenginein theforwarddirectionfrom sidewindow W1 to sidewindow W2, while theothertraversestheenginein thebackwarddirectionfrom W2 to W1. Elasticallyscatteredradiationis detectedthroughthetop window W3 in a directionperpendicularto thelasersheetsby two intensifiedCCD cameras.B, beamsplitter;M, mirror.
opticsthecontribution of thenaturalflameemissionis completelysuppressed.Both camerasaregatedintensifiedCCDcameras(ICCD-576G/RB-E;PrincetonInstruments)whoseoutputisdigitised(ST-138; PrincetonInstruments)andsentto a computerfor further processing.Theusedgatewidth is 25ns.Thepositionof thepiston,thelaserpulsesandcamerasystemsaresyn-chronisedusingadelaygenerator. Thetimedelaybetweenbothlasersis setto 50ns.Thisdelayis long enoughto beableto detectthescatteredradiationfrom bothsheetsseparately, while itis shortenoughfor both scatteringsignalsto originatefrom essentiallythe samedistributionof scatteringparticlesinsidethecombustionchamber. For theprocessingof theimageshome-developedsoftwareis used[74]. For theprocessingit is importantthat the imagescorrespondto exactly the samefield of view, assmall misalignmentsmay introduceartificial structureintheresult. Properaligmentof the imageswasachievedusingseparatelyrecordedimagesof ahighly structuredreferencepictureput into theengineinsteadof thetopwindow.
3.3.2 Singleimagemethod
In the presentexperimentthe single imagemethodis appliedto the elasticscatteringimagesobtainedwith thesetupdescribedabove, in orderto beableto comparetheresultswith thoseobtainedusing the doubleimagemethod. But, in general,the single imagemethodwill beappliedto an imageof the elasticallyscatteredradiationrecordedsimultaneouslyand fromthe sameareaas a fluorescenceimageof NO. For this purpose,althoughthe setupusedtoobtaintwo scatteringimagessimultaneouslycould be used,the experimentcanalsobe doneusingonly onelasersystem.If the laseris tunedto a NO resonance,theNO fluorescenceand
70
3.4 ResultsandDiscussion
elasticallyscatteredradiationcanbe obtainedfrom the samelaserpulsewith differentfilters(onetransmittingNO fluorescenceandonetransmittingthelaserradiation)in front of thetwocamerasystems.If insteadof theNO fluorescencethenaturalflameemissionis recorded,thesamesetupcanalsobeusedto obtainonescatteringimageandoneimageof thenaturalflameemission.
3.3.3 Transmission
To obtain information about the transmissionof the laser radiationthroughthe combustionchamber, theabsoluteattenuationof the193nmlaserradiationthroughthefiring engineandthesidewindows is measured.Thelaserbeamis coupledin andout throughthesidewindowsandthetransmittedradiationis detectedbehindtheexit window by aCCDcamera.However, asthecontribution of thewindows, which cannotbemeasureddirectly, is still includedin theresultthis methodgives the transmissionthroughthe combustion chamberin arbitrary units only.Resultswill becomparedwith thosederivedindependentlyfrom thedoubleimagemethod.
3.4 Resultsand Discussion
Using thesetupwith two laserbeamspropagatingin forwardandbackwarddirectionthroughthe engineand two camerasystems,imagesof the elasticallyscatteredlaserradiationweremeasuredin forwardandbackwarddirectionasafunctionof crankangle.They will bedenotedasforwardandbackwardelasticscatteringimages.Forward,Sf or ? x B y C (column1), andback-ward,Sback ? x B y C (column2), elasticscatteringimagestakenatdifferentcrankanglesaregivenin figure3.3. Theimagesareaveragedoverfiveenginecycles.Thesidewindow W1 is locatedat the right handsideandW2 at the left handsideof the images,so that in forwarddirectionthe laserbeamis directedfrom right to left whereasin backward directionit is directedfromleft to right (indicatedin thefigureby thehorizontalarrows). Thedarkspotsthatarepresentinall imagesaretheresultof dirt on theoutsideof thetop window. However, asthetransmissionlossesdueto the top window areincludedin the factorsA ? x B y C in equations3.2 and3.5, theeffect of thedirt will cancelin the determinationof thefluorescenceratio (equation3.8), andthefinal attenuationfactor(equation3.10)is not affectedby this dirt2. For crankanglesbelow37u aTDCno elasticscatteringimagesarepresentedbecausethesignalbecomestoo weak.
The imageswereanalysedusingboththedoubleimagemethodandthesingleimagemet-hod. By comparingthe resultsof both methods,the assumptionsmadein the single imagemethodcanbechecked.
3.4.1 Double imagemethod
First, the doubleimagemethod,describedin section3.2.1,is appliedto determinethe distri-bution of the local laserattenuationcoefficient, [n� ]ext ? x B y C (equation3.10),asa functionofcrankangle.Thedistributions,which aregivenin figure3.3 (column3), show a fairly homo-geneouslydistributedattenuationfactorover the whole observation area. No placesareseen
2Of course,somesignalmustremainin theimagesatthelocationof thedirt, otherwisetheratioin equation3.10is not defined.
71
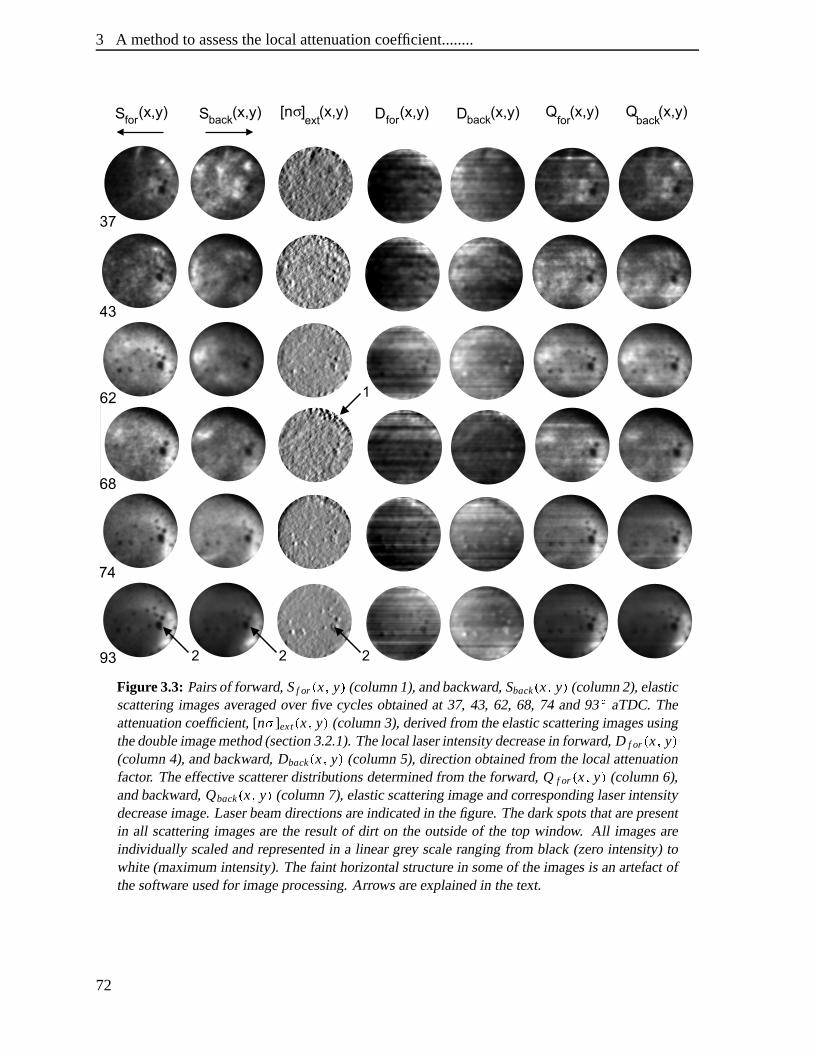
3 A methodto assessthelocalattenuationcoefficient........
Figure3.3: Pairsof forward,Sf or £ x ¯ y¤ (column1),andbackward,Sback £ x ¯ y¤ (column2),elasticscatteringimagesaveragedover five cyclesobtainedat 37, 43, 62, 68, 74 and93 � aTDC.Theattenuationcoefficient, [n° ]ext £ x ¯ y¤ (column3), derivedfrom theelasticscatteringimagesusingthedoubleimagemethod(section3.2.1).Thelocallaserintensitydecreasein forward,D f or £ x ¯ y¤(column4), andbackward, Dback £ x ¯ y¤ (column5), directionobtainedfrom thelocal attenuationfactor. Theeffective scattererdistributionsdeterminedfrom theforward,Q f or £ x ¯ y¤ (column6),andbackward,Qback £ x ¯ y¤ (column7), elasticscatteringimageandcorrespondinglaserintensitydecreaseimage.Laserbeamdirectionsareindicatedin thefigure.Thedarkspotsthatarepresentin all scatteringimagesarethe resultof dirt on the outsideof the top window. All imagesareindividually scaledandrepresentedin a linear grey scalerangingfrom black (zerointensity)towhite (maximumintensity).Thefainthorizontalstructurein someof theimagesis anartefactofthesoftwareusedfor imageprocessing.Arrows areexplainedin thetext.
72
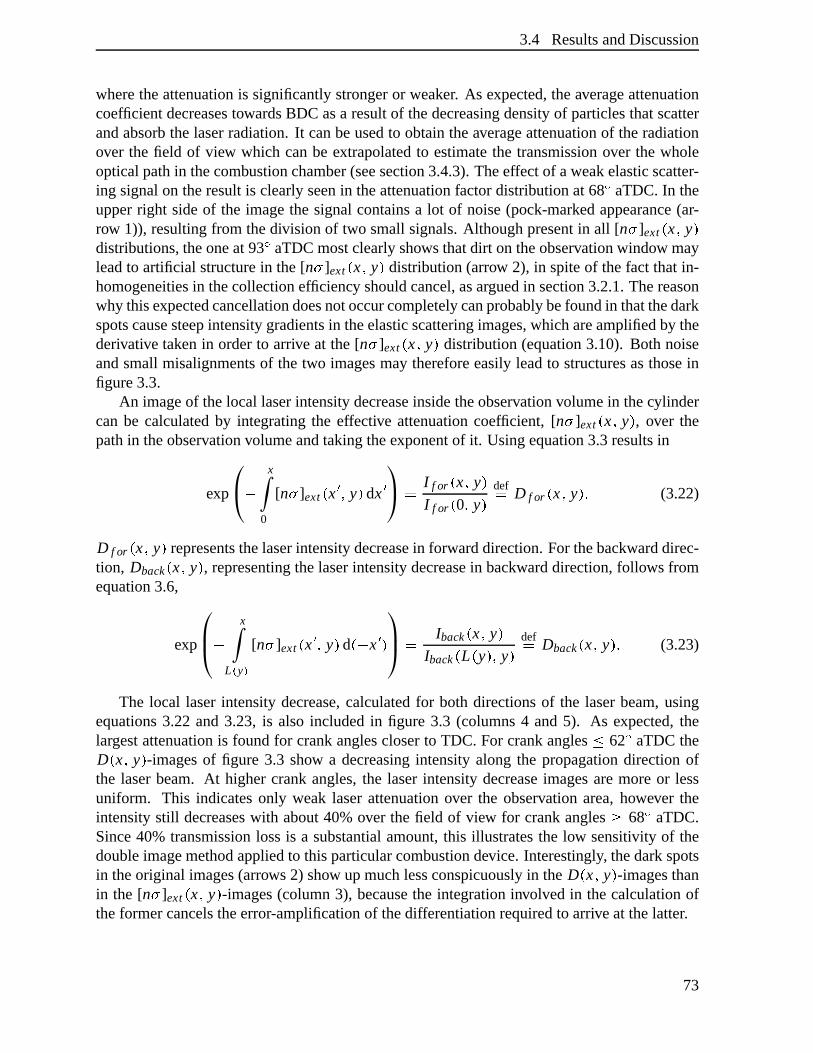
3.4 ResultsandDiscussion
wheretheattenuationis significantlystrongeror weaker. As expected,theaverageattenuationcoefficient decreasestowardsBDC asa resultof thedecreasingdensityof particlesthatscatterandabsorbthelaserradiation.It canbeusedto obtaintheaverageattenuationof theradiationover the field of view which canbe extrapolatedto estimatethe transmissionover the wholeopticalpathin thecombustionchamber(seesection3.4.3).Theeffectof aweakelasticscatter-ing signalon theresultis clearlyseenin theattenuationfactordistribution at 68u aTDC.In theupperright sideof the imagethe signalcontainsa lot of noise(pock-marked appearance(ar-row 1)), resultingfrom thedivision of two smallsignals.Althoughpresentin all [n� ]ext ? x B y Cdistributions,theoneat 93u aTDCmostclearlyshowsthatdirt on theobservationwindow mayleadto artificial structurein the[n� ]ext ? x B y C distribution (arrow 2), in spiteof thefactthat in-homogeneitiesin thecollectionefficiency shouldcancel,asarguedin section3.2.1.Thereasonwhy thisexpectedcancellationdoesnotoccurcompletelycanprobablybefoundin thatthedarkspotscausesteepintensitygradientsin theelasticscatteringimages,whichareamplifiedby thederivative taken in orderto arrive at the[n� ]ext ? x B y C distribution (equation3.10). Both noiseandsmallmisalignmentsof the two imagesmay thereforeeasilyleadto structuresasthoseinfigure3.3.
An imageof thelocal laserintensitydecreaseinsidetheobservationvolumein thecylindercan be calculatedby integrating the effective attenuationcoefficient, [n� ]ext ? x B y C , over thepathin theobservationvolumeandtakingtheexponentof it. Usingequation3.3resultsin
exp Hx
0
[n� ]ext ? x a B y C dx a K I f or ? x B y CI f or ? 0 B y C
defK D f or ? x B y C©N (3.22)
D f or ? x B y C representsthelaserintensitydecreasein forwarddirection.For thebackwarddirec-tion, Dback ? x B y C , representingthelaserintensitydecreasein backwarddirection,follows fromequation3.6,
exp Hx
L ¦ y§[n� ]ext ? x a B y C d ? H x a C K Iback ? x B y C
Iback ? L ? yC B y CdefK Dback ? x B y C©N (3.23)
The local laserintensitydecrease,calculatedfor both directionsof the laserbeam,usingequations3.22 and3.23, is also includedin figure 3.3 (columns4 and5). As expected,thelargestattenuationis foundfor crankanglescloserto TDC. For crankangles± 62u aTDCtheD ? x B y C -imagesof figure 3.3 show a decreasingintensityalong the propagationdirectionofthe laserbeam. At highercrankangles,the laserintensitydecreaseimagesaremoreor lessuniform. This indicatesonly weak laserattenuationover the observation area,however theintensitystill decreaseswith about40%over the field of view for crankangles² 68u aTDC.Since40% transmissionlossis a substantialamount,this illustratesthe low sensitivity of thedoubleimagemethodappliedto thisparticularcombustiondevice. Interestingly, thedarkspotsin theoriginal images(arrows 2) show upmuchlessconspicuouslyin the D ? x B y C -imagesthanin the [n� ]ext ? x B y C -images(column3), becausethe integrationinvolved in thecalculationoftheformercancelstheerror-amplificationof thedifferentiationrequiredto arriveat thelatter.
73
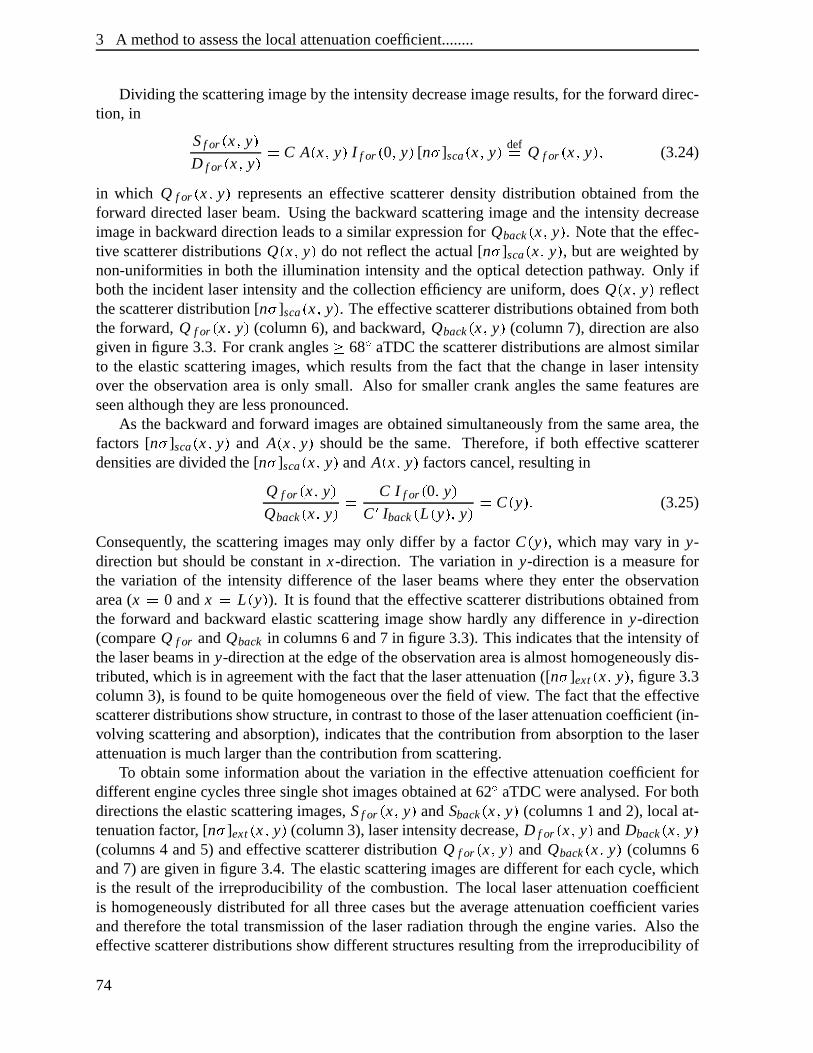
3 A methodto assessthelocalattenuationcoefficient........
Dividing thescatteringimageby theintensitydecreaseimageresults,for theforwarddirec-tion, in
Sf or ? x B yCD f or ? x B y C K C A ? x B y C I f or ? 0 B y C [n� ]sca ? x B yC defK Q f or ? x B y C B (3.24)
in which Q f or ? x B yC representsan effective scattererdensitydistribution obtainedfrom theforward directedlaserbeam.Using thebackward scatteringimageandthe intensitydecreaseimagein backwarddirectionleadsto a similar expressionfor Qback ? x B y C . Notethattheeffec-tive scattererdistributionsQ ? x B y C do not reflecttheactual[n� ]sca ? x B y C , but areweightedbynon-uniformitiesin both the illumination intensityandthe optical detectionpathway. Only ifboththeincidentlaserintensityandthecollectionefficiency areuniform, doesQ ? x B y C reflectthescattererdistribution [n� ]sca ? x B y C . Theeffectivescattererdistributionsobtainedfrom boththeforward, Q f or ? x B y C (column6), andbackward, Qback ? x B y C (column7), directionarealsogivenin figure3.3. For crankangles² 68u aTDCthescattererdistributionsarealmostsimilarto the elasticscatteringimages,which resultsfrom the fact that the changein laserintensityover the observation areais only small. Also for smallercrankanglesthe samefeaturesareseenalthoughthey arelesspronounced.
As thebackwardandforward imagesareobtainedsimultaneouslyfrom thesamearea,thefactors[n� ]sca ? x B y C and A ? x B yC shouldbe the same. Therefore,if both effective scattererdensitiesaredividedthe[n� ]sca ? x B yC andA ? x B y C factorscancel,resultingin
Q f or ? x B y CQback ? x B y C K
C I f or ? 0 B y CC a Iback ? L ? y C B y C K C ? y C©N (3.25)
Consequently, the scatteringimagesmay only differ by a factorC ? yC , which may vary in y-directionbut shouldbe constantin x-direction. The variationin y-directionis a measureforthe variation of the intensity differenceof the laserbeamswherethey enterthe observationarea(x K 0 andx K L ? y C ). It is foundthat theeffective scattererdistributionsobtainedfromthe forward andbackward elasticscatteringimageshow hardly any differencein y-direction(compareQ f or andQback in columns6 and7 in figure3.3). This indicatesthattheintensityofthelaserbeamsin y-directionat theedgeof theobservationareais almosthomogeneouslydis-tributed,which is in agreementwith thefactthatthelaserattenuation([n� ]ext ? x B y C , figure3.3column3), is foundto bequitehomogeneousover thefield of view. Thefact thattheeffectivescattererdistributionsshow structure,in contrastto thoseof thelaserattenuationcoefficient(in-volving scatteringandabsorption),indicatesthat thecontribution from absorptionto the laserattenuationis muchlargerthanthecontribution from scattering.
To obtainsomeinformationaboutthe variationin the effective attenuationcoefficient fordifferentenginecyclesthreesingleshotimagesobtainedat 62u aTDCwereanalysed.For bothdirectionstheelasticscatteringimages,Sf or ? x B y C andSback ? x B y C (columns1 and2), local at-tenuationfactor, [n� ]ext ? x B y C (column3), laserintensitydecrease,D f or ? x B y C andDback ? x B y C(columns4 and5) andeffective scattererdistribution Q f or ? x B yC and Qback ? x B yC (columns6and7) aregivenin figure3.4. Theelasticscatteringimagesaredifferentfor eachcycle,whichis the resultof the irreproducibility of the combustion. The local laserattenuationcoefficientis homogeneouslydistributedfor all threecasesbut the averageattenuationcoefficient variesandthereforethe total transmissionof the laserradiationthroughthe enginevaries. Also theeffective scattererdistributionsshow differentstructuresresultingfrom theirreproducibilityof
74

3.4 ResultsandDiscussion
Sfor(x,y) Dfor
(x,y)backS (x,y)backD (x,y)[n ]
ext(x,y)σ³ Q (x,y)
´for
Q (x,y)´
back
Figure 3.4: Three pairs of single shot elastic scatteringimages, Sf or £ x ¯ y¤ and Sback £ x ¯ y¤(columns 1 and 2), obtainedat 62 � aTDC, the correspondinglaser attenuationcoefficient,[n° ]ext £ x ¯ y¤ (column 3), the laserintensitydecrease,D f or £ x ¯ y¤ and Dback £ x ¯ y¤ (columns4and5), andeffectivescattererdistributions,Q f or £ x ¯ y¤ andQback £ x ¯ y¤ (columns6 and7). Laserbeamdirectionsareindicatedin thefigure.All imagesareindividually scaledandrepresentedina lineargrey scalerangingfrom black(zerointensity)to white (maximumintensity).
thecombustion.In all cases,however, Q f or andQback areverysimilar, indicatingthatthelaserintensitydistributionover thewidth of thebeamis virtually uniform,andthattheprocessingoftheforwardandbackwardimagesyieldsconsistentresults.
3.4.2 Singleimagemethod
Both forwardandbackwardscatteringimagescanbe usedseparatelyto obtainthe local laserintensityusingthesingleimagemethoddescribedin section3.2.2(equation3.21). The inputparametersaretheproportionalityconstant thatrelatesthecontributionsfrom absorptionandscattering(equation3.11),andthetransmissionof thelaserradiationthroughthewholeengine.
To illustratethemethodandtheinfluenceof theinputparameters,onepairof singleshotim-agesis evaluatedfor threedifferentvaluesof thetransmissionof thelaserradiationthroughthewholeengine.In figure3.5(row 1) onepair of singleshotelasticscatteringimages,Sf or ? x B y CandSback ? x B yC , recordedat62u aTDCis giventogetherwith thelaserintensitydecreaseimages,D f or ? x B y C andDback ? x B y C , andeffective scattererdistributions,Q f or ? x B yC andQback ? x B y C ,obtainedusing the doubleimagemethod. Both the forward andbackward imagewereana-lysedseparatelywith thesingleimagemethod,usingthe transmissionobtainedby thedoubleimagemethod(discussedin section3.4.3). The results,given in figure3.5 (row 2), show thelaser intensity decreaseimagesas they are derived from one single elasticscatteringimageusingequation3.21. Also the correspondingeffective scattererdistributions Q f or ? x B y C andQback ? x B y C resultingfrom the division of the elasticscatteringimageby the correspondinglaserintensitydecreaseimagearegiven. Comparingthescattererdistributionsprovidesa way
75
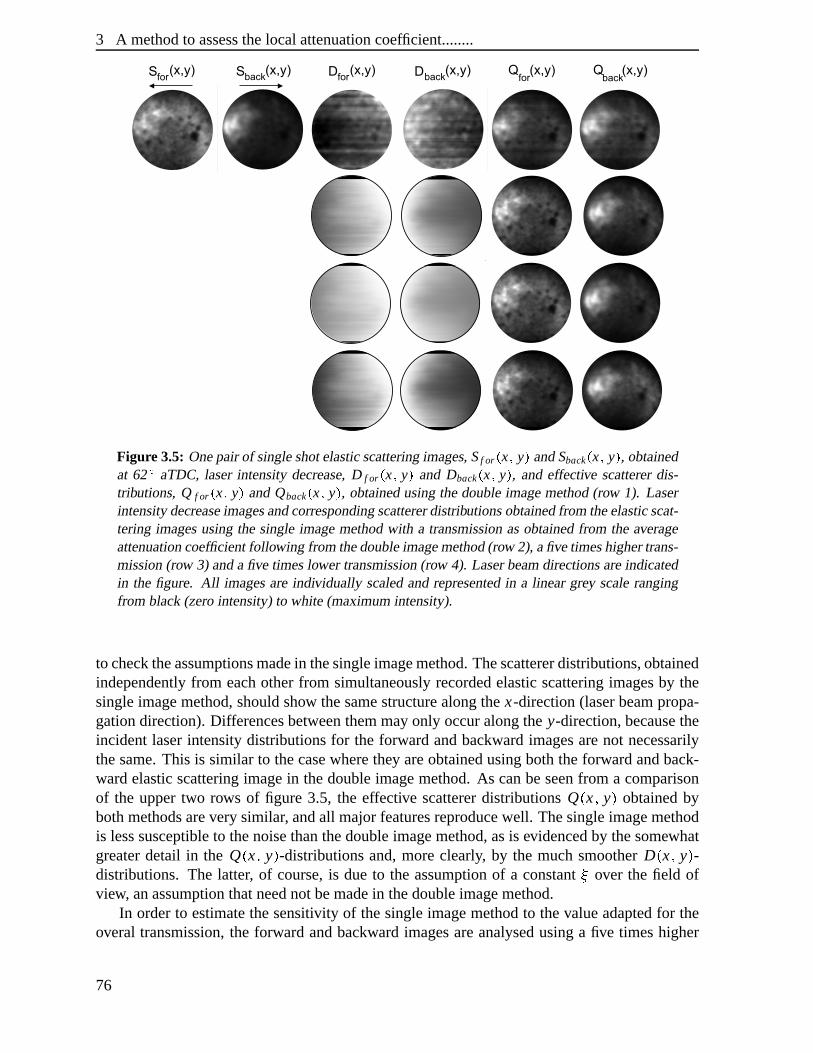
3 A methodto assessthelocalattenuationcoefficient........
Figure3.5: Onepairof singleshotelasticscatteringimages,Sf or £ x ¯ y¤ andSback £ x ¯ y¤ , obtainedat 62 � aTDC, laserintensitydecrease,D f or £ x ¯ y¤ and Dback £ x ¯ y¤ , andeffective scattererdis-tributions,Q f or £ x ¯ y¤ andQback £ x ¯ y¤ , obtainedusingthedoubleimagemethod(row 1). Laserintensitydecreaseimagesandcorrespondingscattererdistributionsobtainedfrom theelasticscat-tering imagesusingthe single imagemethodwith a transmissionasobtainedfrom the averageattenuationcoefficient following from thedoubleimagemethod(row 2), afivetimeshighertrans-mission(row 3) andafive timeslower transmission(row 4). Laserbeamdirectionsareindicatedin the figure. All imagesareindividually scaledandrepresentedin a linear grey scalerangingfrom black(zerointensity)to white (maximumintensity).
to checktheassumptionsmadein thesingleimagemethod.Thescattererdistributions,obtainedindependentlyfrom eachotherfrom simultaneouslyrecordedelasticscatteringimagesby thesingleimagemethod,shouldshow thesamestructurealongthex-direction(laserbeampropa-gationdirection).Dif ferencesbetweenthemmayonly occuralongthe y-direction,becausetheincidentlaserintensitydistributionsfor the forward andbackward imagesarenot necessarilythesame.This is similar to thecasewherethey areobtainedusingboththeforwardandback-wardelasticscatteringimagein thedoubleimagemethod.As canbeseenfrom a comparisonof the uppertwo rows of figure 3.5, the effective scattererdistributions Q ? x B y C obtainedbybothmethodsareverysimilar, andall majorfeaturesreproducewell. Thesingleimagemethodis lesssusceptibleto thenoisethanthedoubleimagemethod,asis evidencedby thesomewhatgreaterdetail in the Q ? x B y C -distributionsand,moreclearly, by the muchsmootherD ? x B y C -distributions. The latter, of course,is dueto the assumptionof a constant over the field ofview, anassumptionthatneednotbemadein thedoubleimagemethod.
In orderto estimatethesensitivity of thesingleimagemethodto thevalueadaptedfor theoveral transmission,the forward andbackward imagesareanalysedusinga five timeshigher
76
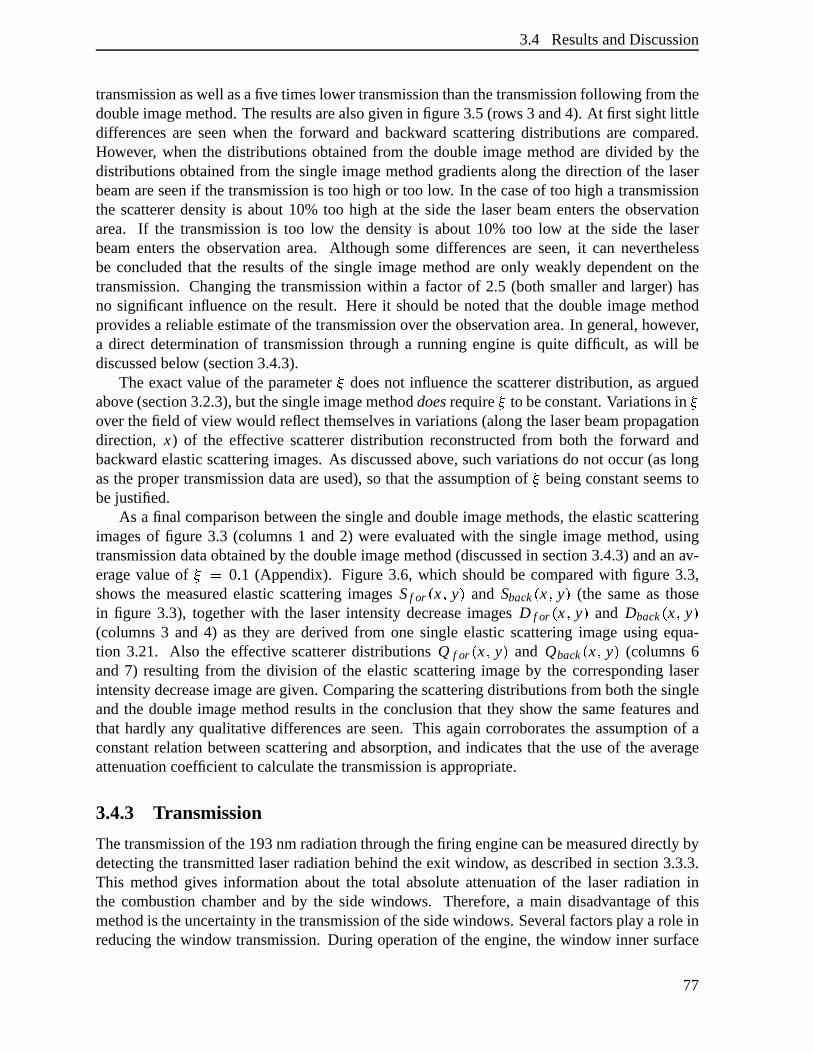
3.4 ResultsandDiscussion
transmissionaswell asafivetimeslowertransmissionthanthetransmissionfollowing from thedoubleimagemethod.Theresultsarealsogivenin figure3.5(rows3 and4). At first sightlittledifferencesare seenwhen the forward and backward scatteringdistributions are compared.However, whenthe distributionsobtainedfrom the doubleimagemethodaredivided by thedistributionsobtainedfrom thesingleimagemethodgradientsalongthedirectionof the laserbeamareseenif thetransmissionis too high or too low. In thecaseof too high a transmissionthe scattererdensityis about10% too high at the side the laserbeamentersthe observationarea. If the transmissionis too low the density is about10% too low at the side the laserbeamentersthe observation area. Although somedifferencesare seen,it can neverthelessbe concludedthat the resultsof the single imagemethodare only weakly dependenton thetransmission.Changingthe transmissionwithin a factorof 2.5 (both smallerand larger) hasno significantinfluenceon the result. Hereit shouldbe notedthat the doubleimagemethodprovidesa reliableestimateof thetransmissionover theobservationarea.In general,however,a direct determinationof transmissionthrougha runningengineis quite difficult, aswill bediscussedbelow (section3.4.3).
The exactvalueof theparameter doesnot influencethescattererdistribution, asarguedabove(section3.2.3),but thesingleimagemethoddoesrequire to beconstant.Variationsin ¨over thefield of view would reflectthemselvesin variations(alongthelaserbeampropagationdirection, x) of the effective scattererdistribution reconstructedfrom both the forward andbackwardelasticscatteringimages.As discussedabove, suchvariationsdo not occur(aslongasthepropertransmissiondataareused),so that theassumptionof ¨ beingconstantseemstobejustified.
As a final comparisonbetweenthesingleanddoubleimagemethods,theelasticscatteringimagesof figure 3.3 (columns1 and2) wereevaluatedwith the single imagemethod,usingtransmissiondataobtainedby thedoubleimagemethod(discussedin section3.4.3)andanav-eragevalueof ¨jK 0 N 1 (Appendix). Figure3.6, which shouldbe comparedwith figure 3.3,shows the measuredelasticscatteringimagesSf or ? x B y C and Sback ? x B yC (the sameas thosein figure 3.3), togetherwith the laserintensity decreaseimagesD f or ? x B y C and Dback ? x B y C(columns3 and 4) as they are derived from one single elasticscatteringimageusing equa-tion 3.21. Also the effective scattererdistributions Q f or ? x B y C and Qback ? x B yC (columns6and7) resultingfrom the division of the elasticscatteringimageby the correspondinglaserintensitydecreaseimagearegiven.Comparingthescatteringdistributionsfrom boththesingleandthe doubleimagemethodresultsin the conclusionthat they show the samefeaturesandthat hardly any qualitative differencesareseen. This againcorroboratesthe assumptionof aconstantrelationbetweenscatteringandabsorption,andindicatesthat the useof the averageattenuationcoefficient to calculatethetransmissionis appropriate.
3.4.3 Transmission
Thetransmissionof the193nmradiationthroughthefiring enginecanbemeasureddirectlybydetectingthe transmittedlaserradiationbehindtheexit window, asdescribedin section3.3.3.This methodgives information about the total absoluteattenuationof the laserradiation inthe combustion chamberand by the side windows. Therefore,a main disadvantageof thismethodis theuncertaintyin thetransmissionof thesidewindows. Severalfactorsplayarole inreducingthewindow transmission.During operationof theengine,thewindow innersurface
77
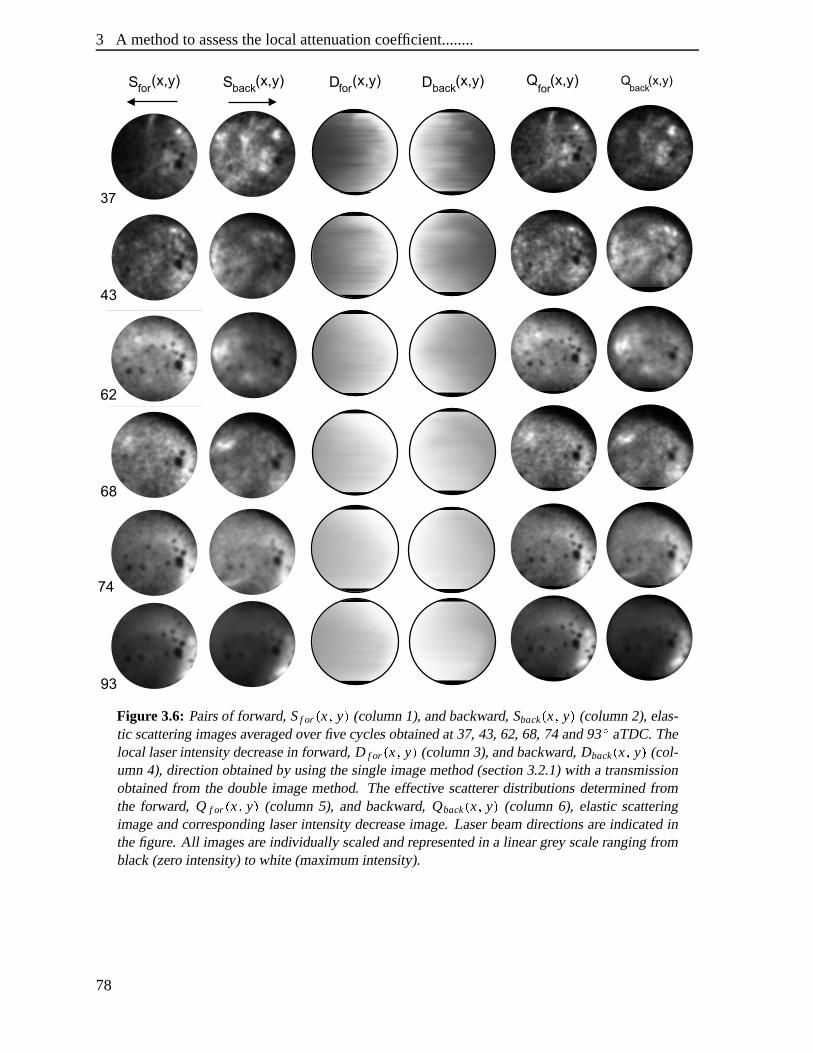
3 A methodto assessthelocalattenuationcoefficient........
Figure 3.6: Pairsof forward,Sf or £ x ¯ y¤ (column1), andbackward,Sback £ x ¯ y¤ (column2), elas-tic scatteringimagesaveragedover fivecyclesobtainedat37,43,62,68,74 and93 � aTDC.Thelocal laserintensitydecreasein forward,D f or £ x ¯ y¤ (column3), andbackward,Dback £ x ¯ y¤ (col-umn4), directionobtainedby usingthesingleimagemethod(section3.2.1)with a transmissionobtainedfrom the doubleimagemethod. The effective scattererdistributionsdeterminedfromthe forward, Q f or £ x ¯ y¤ (column 5), andbackward, Qback £ x ¯ y¤ (column 6), elasticscatteringimageandcorrespondinglaserintensitydecreaseimage.Laserbeamdirectionsareindicatedinthefigure.All imagesareindividually scaledandrepresentedin a lineargrey scalerangingfromblack(zerointensity)to white (maximumintensity).
78
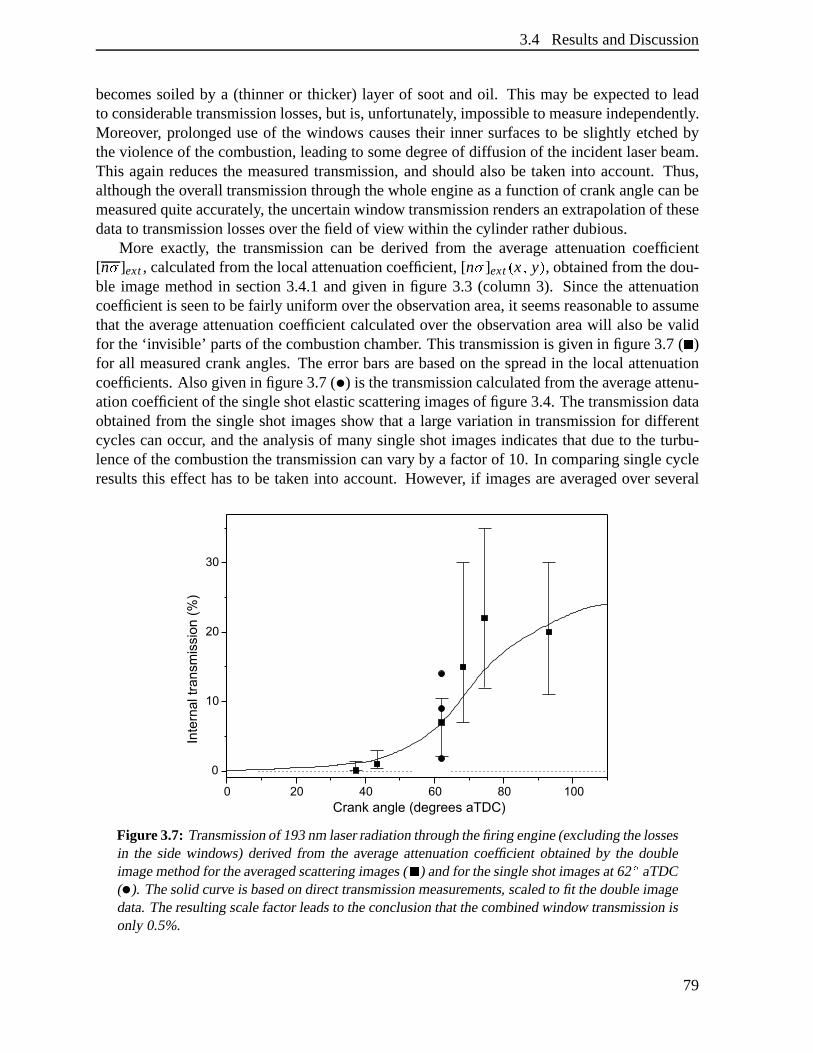
3.4 ResultsandDiscussion
becomessoiledby a (thinneror thicker) layer of sootandoil. This may be expectedto leadto considerabletransmissionlosses,but is, unfortunately, impossibleto measureindependently.Moreover, prolongeduseof the windows causestheir inner surfacesto be slightly etchedbytheviolenceof thecombustion,leadingto somedegreeof diffusionof theincidentlaserbeam.This againreducesthe measuredtransmission,andshouldalsobe taken into account.Thus,althoughtheoverall transmissionthroughthewholeengineasa functionof crankanglecanbemeasuredquiteaccurately, theuncertainwindow transmissionrendersanextrapolationof thesedatato transmissionlossesover thefield of view within thecylinder ratherdubious.
More exactly, the transmissioncan be derived from the averageattenuationcoefficient[n� ]ext , calculatedfrom thelocalattenuationcoefficient, [n� ]ext ? x B y C , obtainedfrom thedou-ble imagemethodin section3.4.1andgiven in figure 3.3 (column3). Sincethe attenuationcoefficient is seento befairly uniformover theobservationarea,it seemsreasonableto assumethat the averageattenuationcoefficient calculatedover the observation areawill alsobe validfor the‘invisible’ partsof thecombustionchamber. This transmissionis givenin figure3.7( o )for all measuredcrankangles.The errorbarsarebasedon thespreadin the local attenuationcoefficients.Also givenin figure3.7( ) is thetransmissioncalculatedfrom theaverageattenu-ationcoefficientof thesingleshotelasticscatteringimagesof figure3.4.Thetransmissiondataobtainedfrom the singleshot imagesshow that a large variationin transmissionfor differentcyclescanoccur, andtheanalysisof many singleshotimagesindicatesthatdueto the turbu-lenceof thecombustionthetransmissioncanvaryby a factorof 10. In comparingsinglecycleresultsthis effect hasto be taken into account.However, if imagesareaveragedover several
Figure3.7: Transmissionof 193nmlaserradiationthroughthefiring engine(excludingthelossesin the side windows) derived from the averageattenuationcoefficient obtainedby the doubleimagemethodfor theaveragedscatteringimages( o ) andfor thesingleshotimagesat62 � aTDC( ). Thesolidcurve is basedondirecttransmissionmeasurements,scaledto fit thedoubleimagedata.Theresultingscalefactorleadsto theconclusionthatthecombinedwindow transmissionisonly 0.5%.
79
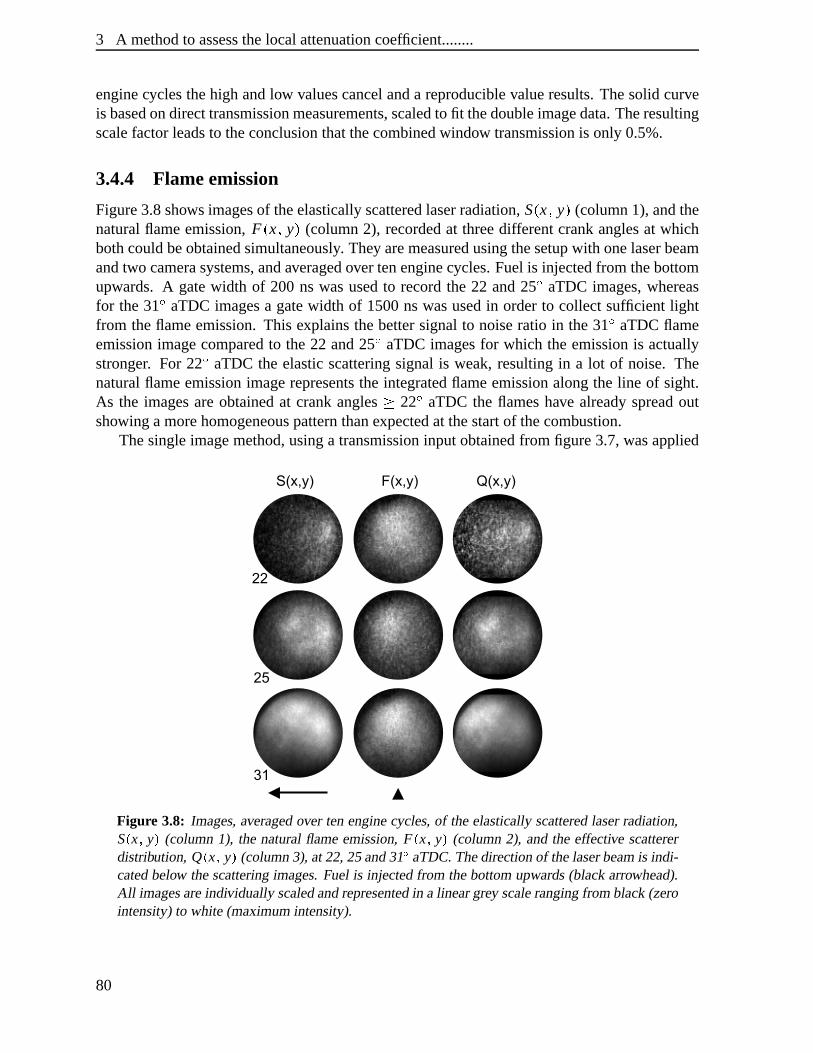
3 A methodto assessthelocalattenuationcoefficient........
enginecyclesthehigh andlow valuescancelanda reproduciblevalueresults.Thesolid curveis basedondirecttransmissionmeasurements,scaledto fit thedoubleimagedata.Theresultingscalefactorleadsto theconclusionthatthecombinedwindow transmissionis only 0.5%.
3.4.4 Flameemission
Figure3.8showsimagesof theelasticallyscatteredlaserradiation,S? x B y C (column1), andthenaturalflameemission,F ? x B y C (column2), recordedat threedifferentcrankanglesat whichbothcouldbeobtainedsimultaneously. They aremeasuredusingthesetupwith onelaserbeamandtwo camerasystems,andaveragedover tenenginecycles.Fuelis injectedfrom thebottomupwards. A gatewidth of 200 ns wasusedto recordthe 22 and25u aTDC images,whereasfor the31u aTDC imagesa gatewidth of 1500nswasusedin orderto collect sufficient lightfrom theflameemission.This explainsthebettersignalto noiseratio in the31u aTDCflameemissionimagecomparedto the 22 and25u aTDC imagesfor which the emissionis actuallystronger. For 22u aTDC the elasticscatteringsignal is weak,resultingin a lot of noise. Thenaturalflameemissionimagerepresentsthe integratedflameemissionalongthe line of sight.As the imagesareobtainedat crankangles ² 22u aTDC the flameshave alreadyspreadoutshowing amorehomogeneouspatternthanexpectedat thestartof thecombustion.
Thesingleimagemethod,usinga transmissioninput obtainedfrom figure3.7,wasapplied
Figure 3.8: Images,averagedover tenenginecycles,of theelasticallyscatteredlaserradiation,S£ x ¯ y¤ (column1), the naturalflameemission,F £ x ¯ y¤ (column2), andthe effective scattererdistribution, Q £ x ¯ y¤ (column3), at22,25and31� aTDC.Thedirectionof thelaserbeamis indi-catedbelow thescatteringimages.Fuel is injectedfrom thebottomupwards(blackarrowhead).All imagesareindividually scaledandrepresentedin a lineargrey scalerangingfrom black(zerointensity)to white (maximumintensity).
80
3.5 Conclusion
to theelasticscatteringimagesto obtainanimageof theeffectivescattererdistribution,Q ? x B y C ,similar to Q f or ? x B y C in equation3.24.Theeffectivescattererdistributionsarealsogivenin fig-ure 3.8 (column3). Due to the processingthe signal in the effective scattererdistributionsisshiftedto theleft (in thedirectionof thelaserbeam)comparedto theelasticscatteringimages.Theflameemissionimagesandtheeffectivescattererdistributionsshow similarstructure.Thismakesit plausiblethattheincandescentsootparticlespresentin theflamesaremainly respon-siblefor theelasticscattering(andabsorption)of thelaserradiation.
3.5 Conclusion
A methodis developedto obtain the local laserintensity inside the combustion chamberofan optically accessibleengine. By the useof two elasticscatteringimages,obtainedfromtwo laserbeamswhich traversetheenginein oppositedirection,thelocal effective attenuationcoefficient of the laserintensityover the field of view canbe obtainedwithout knowledgeofthe initial intensitydistributionsof the laserbeams.It is foundthat theattenuationcoefficientis fairly homogeneouslydistributedover thefield of view. Theattenuationcoefficientsareusedto reconstructthe laserintensitydecreaseover the observation area. In addition,an effectivescattererdistributionis determinedfrom theelasticscatteringimageandthecorrespondinglaserintensitydecreaseimage. On the assumptionthat the averageattenuationcoefficient over thefield of view is valid for thewholecylindercontentsthetransmissionof thelaserradiationoverthe whole optical path in the combustionchamberis determined.This result is comparedtotheabsolutetransmissionof thelaserradiation,includingthelossesby thewindows,measuredby detectingthetransmittedradiationbehindtheexit window. Window lossesarefoundto beconsiderable.Moreover, thetransmissionof 193nm laserradiationis foundto vary by up to afactorof 10 betweenindividualstrokes.
As an alternative, a methodis developedto reconstructthe local laserintensity from onesingleelasticscatteringimage. Theresultsof bothmethodsarecomparedandshow thesamestructuresindicatingthatthemethodusingonly onescatteringimageis usable.Thesingleim-agemethodis appliedto anelasticscatteringimagein orderto comparethedeterminedeffectivescattererdistribution to a simultaneouslymeasuredimageof the naturalflameemission.It isfoundthat thedistribution of thescattererscompareswith theflameemission,makingit plau-siblethatthelaserradiationis scatteredmainly by theincandescentsootparticlesin theflame.Thesemethodscanbeusedto correctplanarLIF distributionsfor laserintensityvariationsoverthefield of view.
Appendix
Themethodin which thelocal laserintensityis derivedfrom oneelasticscatteringimageis ba-sedontheassumptionthataconstantrelationexistsbetweenthecontribution to theattenuationof thelaserradiationcausedby absorptionandby scattering,i.e.
[n� ]sca ? x B yC�K�¨ [n� ]abs ? x B y C .Theproportionalityconstant canbeestimatedfrom theexpressionsfor attenuation,absorption
81
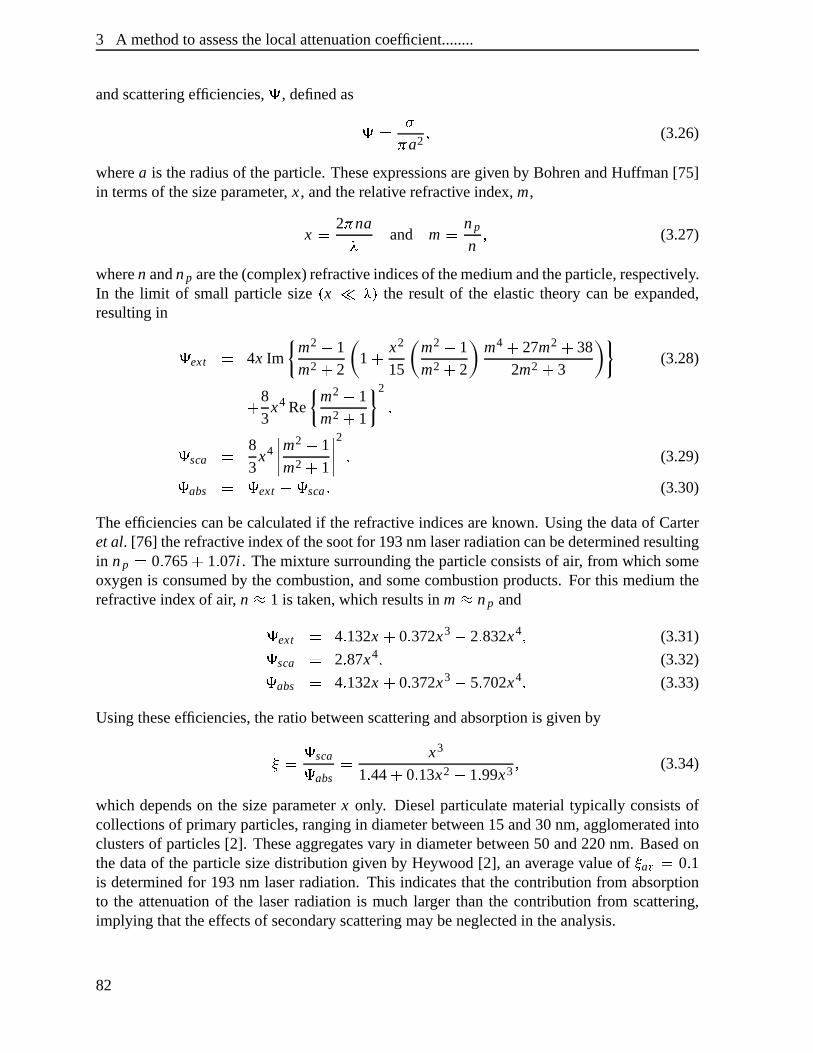
3 A methodto assessthelocalattenuationcoefficient........
andscatteringefficiencies,µ , definedas
µ¶K �· a2 B (3.26)
wherea is theradiusof theparticle.Theseexpressionsaregivenby BohrenandHuffman[75]in termsof thesizeparameter, x, andtherelative refractive index, m,
x K 2· na
@ and m K np
nB (3.27)
wheren andnp arethe(complex) refractiveindicesof themediumandtheparticle,respectively.In the limit of small particlesize ? x � @ C the result of the elastictheorycanbe expanded,resultingin
µ ext K 4x Imm2 H 1
m2 h 21 h x2
15
m2 H 1
m2 h 2
m4 h 27m2 h 38
2m2 h 3(3.28)
h 8
3x4 Re
m2 H 1
m2 h 1
2
B
µ sca K 8
3x4 m2 H 1
m2 h 1
2
B (3.29)
µ abs K µ ext Hjµ sca N (3.30)
Theefficienciescanbecalculatedif therefractive indicesareknown. Usingthedataof Carteretal. [76] therefractive index of thesootfor 193nmlaserradiationcanbedeterminedresultingin np K 0 N 765 h 1 N 07i . Themixturesurroundingtheparticleconsistsof air, from which someoxygenis consumedby thecombustion,andsomecombustionproducts.For this mediumtherefractive index of air, n \ 1 is taken,which resultsin m \ np and
µ ext K 4 N 132x h 0 N 372x3 H 2 N 832x4 B (3.31)
µ sca K 2 N 87x4 B (3.32)
µ abs K 4 N 132x h 0 N 372x3 H 5 N 702x4 N (3.33)
Usingtheseefficiencies,theratio betweenscatteringandabsorptionis givenby
¨¸K µ sca
µ absK x3
1 N 44 h 0 N 13x2 H 1 N 99x3 B (3.34)
which dependson the sizeparameterx only. Dieselparticulatematerialtypically consistsofcollectionsof primaryparticles,rangingin diameterbetween15 and30 nm,agglomeratedintoclustersof particles[2]. Theseaggregatesvary in diameterbetween50 and220nm. Basedonthedataof theparticlesizedistribution givenby Heywood[2], anaveragevalueof ¨ a¹ K 0 N 1is determinedfor 193nm laserradiation. This indicatesthat thecontribution from absorptionto the attenuationof the laserradiationis much larger than the contribution from scattering,implying thattheeffectsof secondaryscatteringmaybeneglectedin theanalysis.
82
Chapter 4
Semi-quantitative nitric oxidedensitiesfr om spatially averageddispersedfluorescencespectra1
Abstract
The formationof nitric oxide (NO) in a dieselenginehasbeenstudiedasa functionof crankanglethroughoutthewholecombustioncycle,usingtheLaserInducedFluorescence(LIF) tech-nique.Measurementswereperformedin anopticallyaccessibleone-cylinder, two-stroke,directinjectiondieselengine.Theenginewasoperatedin steadystateatdifferentloads,compressionratiosandcommercialdieselfuels. A tunableArF excimer laserbeamwasusedto excite theNO moleculesin the D2 ^ _ (v a =0) b X2 c (v ada =1) bandat 193 nm. Dispersedfluorescencespectraallowed to discriminatebetweenNO and interferingoxygenfluorescence.From thespectra,a relative measurefor theamountof NO presentin theprobedvolumeof thecylinderwasobtained.Thisamountwastransformedinto anin-cylinderNO density/content,takingintoaccountthechangesin laserintensity, pressure,temperatureandvolumeduringthestroke. TheresultingNO density/contentcurvesshow a slow startof the NO formationat the beginningof the combustion,graduallyrising to a broadmaximumto somewherein between20u and50u aTDC. It is concludedthat,in this engine,thebulk of NO formationtakesplacerelativelylatein thestroke. Thissuggeststhatthediffusionburningphaseof combustionmakesanimpor-tantcontribution to theNO formation,contraryto themodelwhichassumesthatNO is formedmainly duringtheinitial premixedburn.
1Adaptedfrom: G.G.M. Stoffels, E.J. van den Boom, C.M.I. Spaanjaars,N.J. Dam, W.L. Meerts,J.J. terMeulen,J.C.L. Duff andD.J. Rickeard,”In-cylinder measurementsof NO formation in a dieselengine”,SAEpaperno.1999-01-1487(1999).
83
4 Semi-quantitativenitric oxidedensities........
4.1 Intr oduction
Thedieselengineoffers thebenefitsof high fuel economyandreducedCO2 emissions.How-ever, comparedto gasolineengines,its disadvantagelies in its emissionsof nitric oxides(NOx)and particulatematter (PM), which are facing increasinglystringentregulationsin Europe,North America, and the Far East. The chemistryof NOx formation is thought to be wellunderstood,but the complex physicsof dieselinjection andcombustionmakesan analyticalapproachto understandingnitric oxide(NO) formationin a dieselenginedifficult. Theobjec-tiveof thiswork wasto quantifytheNO densitywithin adieselenginecylinderasa functionoftime throughoutthewholecombustioncycle usingopticaldiagnosticsbasedon LaserInducedFluorescence.
Laser-baseddiagnosticsareof interestfor thestudyof combustionprocessesbecausetheyallow non-intrusive,spatiallyandtemporallyresolvedmeasurementsof specificchemicalspe-cies[30–33]. The LaserInducedFluorescence(LIF) techniquehasthe sensitivity to provideinformation also aboutseveral minority speciespresentin combustion processes.This LIFtechniqueis in principlea two stepprocess:electronicexcitationof moleculesby a laserbeamanddetectionof theensuingfluorescence.Thefluorescencecanbedispersedby a monochro-matorto obtainspectrallyresolved informationor a filter canbe usedto singleout a specificfluorescencewavelengthband.By theuseof thePlanarLIF (PLIF) technique,which involvesexcitationby a thin lasersheetanddetectionof thefluorescencethrougha filter in a directionperpendicularto the sheet,two-dimensionalfluorescencedistributionscanbe obtained. The(P)LIF techniquehasbeenusedto demonstratethe presenceof a large variety of molecularspeciesin combustionprocesses,but quantificationof fluorescencesignalsis difficult. Theflu-orescencesignal is proportionalto the local densityof moleculesexcited by the laserbeamthatfluoresceat theright wavelength.However, theproportionalityconstantdependsstronglyon the local pressureandtemperature,the local laserintensityandthe chemicalcompositionof the environment. Sincemostof theseparametersarenot known anddifficult to measure,someassumptionshave to bemadeto obtainquantitativedata.Anotherproblemis thepossiblespectroscopicinterferencebetweendifferentmolecules.
TheLIF techniquehasbeenappliedbeforeto bothsparkignition (SI) engines(seee.g. therecentwork of Sick et al. [41,77] andreferencesin there)andto dieselengines[17,37–39] tomeasurethe in-cylinder NO distribution andthein-cylinder NO content.Nakagawa et al. [39]appliedPLIF imaging to a single fuel jet dieselresearchenginerunningon a mixed fuel tominimise soot production. However, to obtain sufficient NO fluorescenceoxygenenrichedintake air wasused.Theresultsshowedthelocationof theNO relative to thereactingfuel jet,but thestartandtheendof theNO formationarenot determined.Thedatawerenot correctedfor changesin laser intensity, pressure,temperatureand mixing to obtain somequantitativeinformationabouttheamountof NO presentin thecylinder.
Recently, animpressivepaperby DecandCanaan[17] presentedNO distributionsshowingthe timing and locationof NO formation in a direct injection (DI) dieselenginerunningona low-sootingfuel, obtainedby single-shotPLIF imaging. A tripled Nd:YAG laserpumpinga narrow-line opticalparametricoscillator(OPO)wasusedto excite theNO moleculesin theA(v a =0) b X(v ada =0) bandat226.035nmandthefluorescenceof theA(v a =0) e X(v ada =1,2,3,4)bandswas detected. In addition to the NO distributions, a curve of the total averagedNOPLIF intensity as a function of crank anglewas shown, obtainedby integration of the NO
84
4.1 Introduction
PLIF signalover a representative sectorof thecombustionchamber. In orderto determinethetotal in-cylinder NO contentthe integratedNO PLIF signal was correctedfor the effects ofpressure,temperatureandmixing. However, no attentionwasgiven to the attenuationof thelaserintensityor the inducedfluorescenceon its way throughthecombustionchamberastheauthorsclaim thatit canbeneglected.It wasfoundthatNO formationdoesnotstartduringthepremixedcombustion(which is fuel rich), but beginsaroundthefuel jet peripheryjustafterthediffusionflameforms,whereit remainsuntil thejet structurebeginsto disappear. As theburn-outphasecontinues,NO remainsalongthetrackof thefuel jet, andtheNO formationcontinuesin thehotpost-combustiongasesaftertheendof combustion.TheNO contentcurveshowsthatonly 67%of theNO hasformedby theendof theapparentheatrelease,soNO formationmustcontinuein thepost-combustiongasesafterthediffusionflamehasgoneout.
For thepresentchapter, theLIF techniquewasusedto obtaindispersedfluorescencespec-tra of NO from an optically accessibletwo-stroke DI diesel engine. The enginewas op-eratedin normal mode(i.e. not skip-fired) on standardcommercialdiesel fuel and ambient(non-oxygen-enriched)intake air. Using an excimer laserto excite the NO moleculesin theD(v=a 0) b X(v ada =1) bandat 193.377nm,NO fluorescencecouldbedetectedduringthewholecombustionprocess.Dispersedfluorescencespectrain thewavelengthrangebetween200nmand230nm wereobtainedasa functionof crankangleusinga monochromator. Themainad-vantageof dispersedfluorescencespectraover imagesis that thespectraallow discriminationbetweenNO andoxygen(O2) fluorescence.Whenthefluorescencewasdispersedinto its differ-entwavelengthcomponentstheinterferenceof NO andO2 fluorescencecouldclearlybeseen.Thespectraallowedto discriminateagainstO2 fluorescenceandto arriveatasemi-quantitativemeasurefor theamountof NO insidetheprobedvolumeof thecylinder asa functionof crankangle.Thesedatawereprocessedfor thechangesin laserintensity, pressure,temperatureandvolumeduring the stroke in orderto obtainan in-cylinder NO densityasa function of crankangle.
A secondaim of this experimentwasalsoto make a qualitative/quantitativeassessmentoftheeffectonNO productionof engineconditions(compressionratioandload)andfuel. To thatend,dispersedfluorescencespectraof NO weremeasuredfor differentengineconditionsandfuels.
Thischapterbeginswith adescriptionof theexperimentalmethod,includingtheengine,itsoperatingconditionsandtheopticsusedto obtainthedispersedfluorescencespectra.Next theresultsarepresented:theenginecharacteristicsobserved,thefluorescencespectraobtainedbydispersingtheLIF signal,andthetranslationof thefluorescenceyield into a semi-quantitativemeasureof NO content. Theseresultsarediscussedin termsof the effectsof enginecondi-tionsandfuelson NO formation. Finally, thefindingsof this work arecomparedwith currenttheoreticalandexperimentaldataonof NO in theliteratureandsomeconclusionsaredrawn.
85
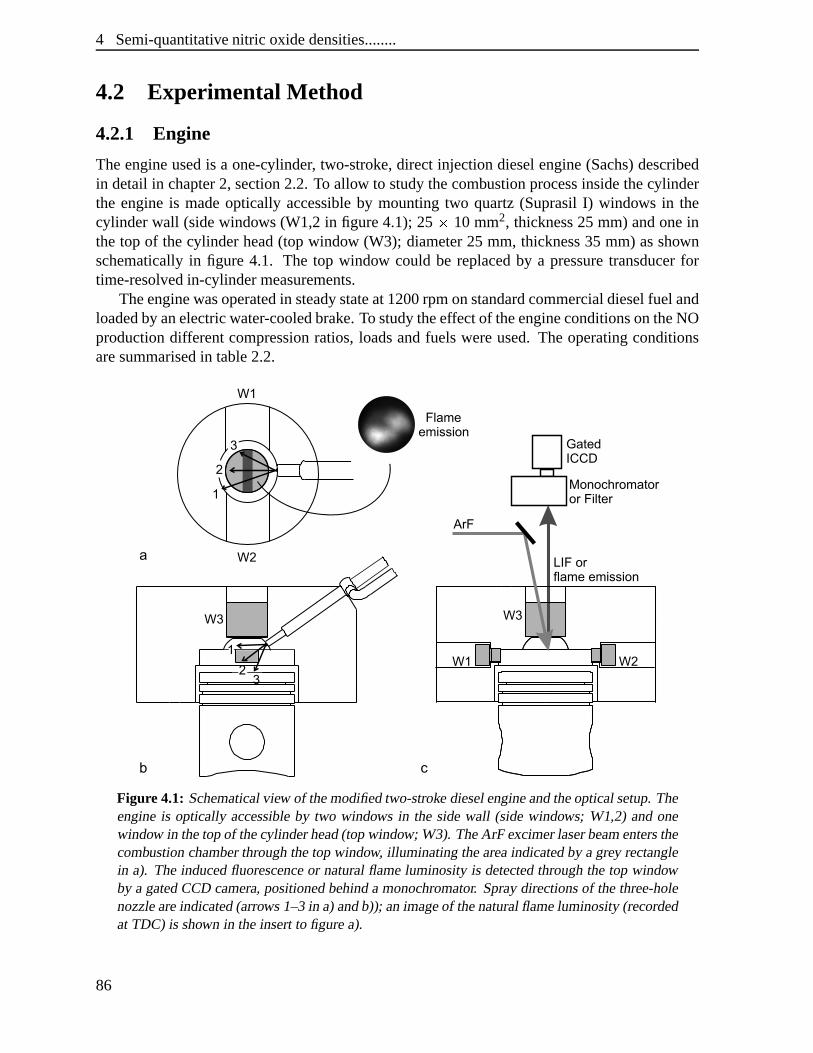
4 Semi-quantitativenitric oxidedensities........
4.2 Experimental Method
4.2.1 Engine
Theengineusedis a one-cylinder, two-stroke, direct injectiondieselengine(Sachs)describedin detail in chapter2, section2.2. To allow to studythecombustionprocessinsidethecylinderthe engineis madeoptically accessibleby mountingtwo quartz(SuprasilI) windows in thecylinder wall (sidewindows (W1,2 in figure4.1); 25 z 10 mm2, thickness25 mm) andoneinthe top of thecylinder head(top window (W3); diameter25 mm, thickness35 mm) asshownschematicallyin figure 4.1. The top window could be replacedby a pressuretransducerfortime-resolvedin-cylindermeasurements.
Theenginewasoperatedin steadystateat1200rpmonstandardcommercialdieselfuel andloadedby anelectricwater-cooledbrake. To studytheeffectof theengineconditionsontheNOproductiondifferentcompressionratios,loadsandfuels wereused.The operatingconditionsaresummarisedin table2.2.
Figure4.1: Schematicalview of themodifiedtwo-stroke dieselengineandtheopticalsetup.Theengineis optically accessibleby two windows in the sidewall (sidewindows; W1,2) andonewindow in thetopof thecylinderhead(topwindow; W3). TheArF excimerlaserbeamentersthecombustionchamberthroughthetopwindow, illuminating theareaindicatedby agrey rectanglein a). The inducedfluorescenceor naturalflameluminosity is detectedthroughthe top windowby a gatedCCD camera,positionedbehinda monochromator. Spraydirectionsof thethree-holenozzleareindicated(arrows1–3in a)andb)); animageof thenaturalflameluminosity(recordedat TDC) is shown in theinsertto figurea).
86
4.3 ResultsandDiscussion
4.2.2 Detailsof test fuels
Thetwo fuelsselectedwerestandardcommercialautomotivedieseloil, meetingtheEuropeanEN590specification.Thedetailsof the testfuelsaregiven in table2.3. Themaindifferencesbetweenthem were that fuel 2 had a narrower distillation range,lower T95, lower sulphurcontent,andhighercetanenumberthanfuel 1.
4.2.3 Optical setup
Theoptical setupusedin theLIF experimentsis alsoindicatedschematicallyin figure4.1. ApulsedArF excimerlaser(Compex 350T; ® -Physik),tunablebetween192.9and193.9nmwith20nspulsedurationandabandwidthof 1 cm� 1, wasusedto excitenitric oxidemoleculesattheR1(26.5)/Q1(32.5)transitionin theD2 ^ _ (v a =0) b X2 c (vada =1) bandat 193.377nm [55]. Thistransitionwasselectedto minimiseinterferencefrom vibrationallyhotoxygen,thathasseveralstrongabsorptionswithin the tuning rangeof the ArF excimer laser[63–66]. The laserwassynchronisedto the positionof thepistonwith an accuracy of 0.6 degreecrankangle. It wasmanuallytunedto resonancewith theNO transitionbeforeeachmeasurementcycle; frequencydrift duringeachmeasurementwaslessthanthelaserbandwidthandnegligible with respecttotheobservedNO line widths. A normalincidence193nm lasermirror wasusedin front of thecollectionopticsto suppressthecontributionof theelasticallyscatteredradiation.
To obtaindispersedfluorescencespectra,the unfocused,rectangular(25 z 3 mm2) laserbeamwascoupledinto thecombustionchamberthroughthe top window, with a pulseenergyof 130 mJ, typically. The areailluminatedby the laserbeamis indicatedin figure 4.1a. Theensuingfluorescencewascoupledout also throughthe top window, anddetectedby a gated(50 ns) intensifiedCCD camera(ICCD-576G/RB-E;PrincetonInstruments)placedbehindamonochromator(Chromex 250i; 1200gr/mmgrating,entranceslit width 50 } m, slit orientedparallelto the lengthof the illuminatedarea),which wasusedto dispersethe inducedfluores-cencein its differentwavelengthcomponents.This systemeffectively constitutesan OpticalMultichannelAnalyser(OMA), whoseoutputwasdigitisedandsentto a computerfor furtherprocessing.Thespectrallyresolvedfluorescencewasaveragedover theheightof theslit, andthereforerepresentsanaverageover thewholeprobevolume.
4.3 Resultsand Discussion
4.3.1 Enginecharacteristics
For a good interpretationof the NO fluorescenceyield motor parameterslike pressureandtemperaturein thecylinderareimportant.To obtainsomeinformationabouttheseparametersofthemodifiedenginefor thedifferentengineconditions,thein-cylinder pressurewasmeasuredfor all engineoperatingconditionsusedin theexperiment.Thesecurveswereusedto calculatetheheatreleaseandthemeangastemperature,on theassumptionof anidealgasin thecylinderandneglectingcreviceflows [2].
Two typical in-cylinderpressurecurves,theirderivativeswith respectto crankangleandthecalculatedheatreleasecurvesaregivenin chapter2, figures2.4a,b andc, respectively. In thesecasestheenginewasrunningon dieselfuel 1 andloadedby 0.44kW. Thedifferencebetween
87
4 Semi-quantitativenitric oxidedensities........
theengineconditionswasthecompressionratio which was14.4(solid curve) or 13.4(dashedcurve). Similar curveswereobtainedat theotherengineconditions.In themodifiedenginethepeakpressures,typically 70-75bars,arealreadyreachedat Top DeadCentre(TDC) andat themomenttheexhaustopensthepressurehasdroppedto about2 bars.Themeangastemperaturecurves,derivedfrom theheatreleasecurves,aregivenin figure2.4d(solid anddashedcurves)andshow maximumtemperaturesof 1300-1500K a few degreesafterTDC, droppingto about500-600K just beforethe exhaustopens. Sincethe meangastemperatureis not necessarilydecisive with respectto the NO formation, also the temperatureas it can be obtainedfromthenaturalflameluminosity [33] (seesection2.4.1)is includedin figure2.4d( o )2. This soottemperaturehasamaximumof about2250K andis muchhigherthanthemeangastemperature.Thereasonfor thedifferenceis foundin thefact that thecylinder contentsarenot likely to bein thermalequilibrium. The meangastemperaturerepresentsan averagetemperatureof thegasinsidethewhole cylinder, whereasthe soottemperaturerepresentsthe temperatureof thelocally presentsoot. This latter temperatureis obtainedfrom theactualcombustionwherethetemperatureis locally highandnotyet in equilibriumwith therestof thegasin thecylinder.
4.3.2 Dispersedfluorescencespectra
Dispersedfluorescencespectrawereobtainedby coupling in the laserbeamthroughthe topwindow while detectingthe fluorescencethroughthe samewindow with the OMA system.Thelaserinducedfluorescence,dispersedinto its wavelengthcomponentsbetween200nmand230nm,is shown in figure4.2for differentcrankangles.During themeasurementof thisseriesof dispersionspectra,theenginewasrunningondieselfuel 1 atacompressionratioof 14.4andloadedby 0.44kW. Thespectraareaveragedover 100enginecyclesandrepresentanaveragefluorescencesignalof a narrow strip (25 z ca.0.5 mm2) with a vertical extent dependingonthepenetrationdepthof thelaserradiation.No backgroundsignalfrom naturalflameemissionis observed in this wavelengthregion with the usedcameragatewidth of 50 ns, so that allobserved signal is laserinduced. The peakat 207.8nm presentin all spectrais an artefactof the measurementsetup,causedprobablyby Ramanscatteringof the quartztop window.All spectrashow spectralstructureindicatingthatfluorescencecanbeobtainedthroughoutthewholestroke,evenat TDC wherethepressureandtemperaturearehigh andattenuationof thelaserradiationis strong.
Around 30u aTDC, a conspicuousqualitative changein spectralstructureandintensity isseen.Thegrey bandsin figure4.2markthespectrallybroadstructuresat208nm(redshoulderof thequartzphosphorescencepeak),216nmand225nm. ThesestructurescanbeattributedtoNO fluorescencefrom thedirectlyexcitedD(v a =0)-stateto theX(v aºa =3,4,5)-states,respectively.(TheD(v a =0) e X(v ada =2) bandat201nmis suppressedby the193nmmirror.) Thetwo weakeremissionsignalsseenat212.5nmand220nm(for q¼»t 40u aTDC) resultfromNOfluorescenceout of the C(va =0)-state,populatedby ElectronicEnergy Transfer(EET), to the X(v ada =3,4)-states.For q rt 30u aTDC,additionalpeaksat 211nm and217.5nm arepresentbesidestheNO signals.Thesefluorescencefeaturescanbeascribedto hot oxygen(O2). Within thetuningrangeof anexcimerlaseroperatedon ArF a numberof O2 transitionsin theSchumann-RungeB3 ^ _
u b X3 ^ �g systemcanbeexcited,thestrongestof whichstartfrom v ada =2 or 3 [63–66].At
2It hasbeenshown that if the sootparticlesaresmall this temperatureis alsoa goodmeasurefor the flametemperature[56].
88
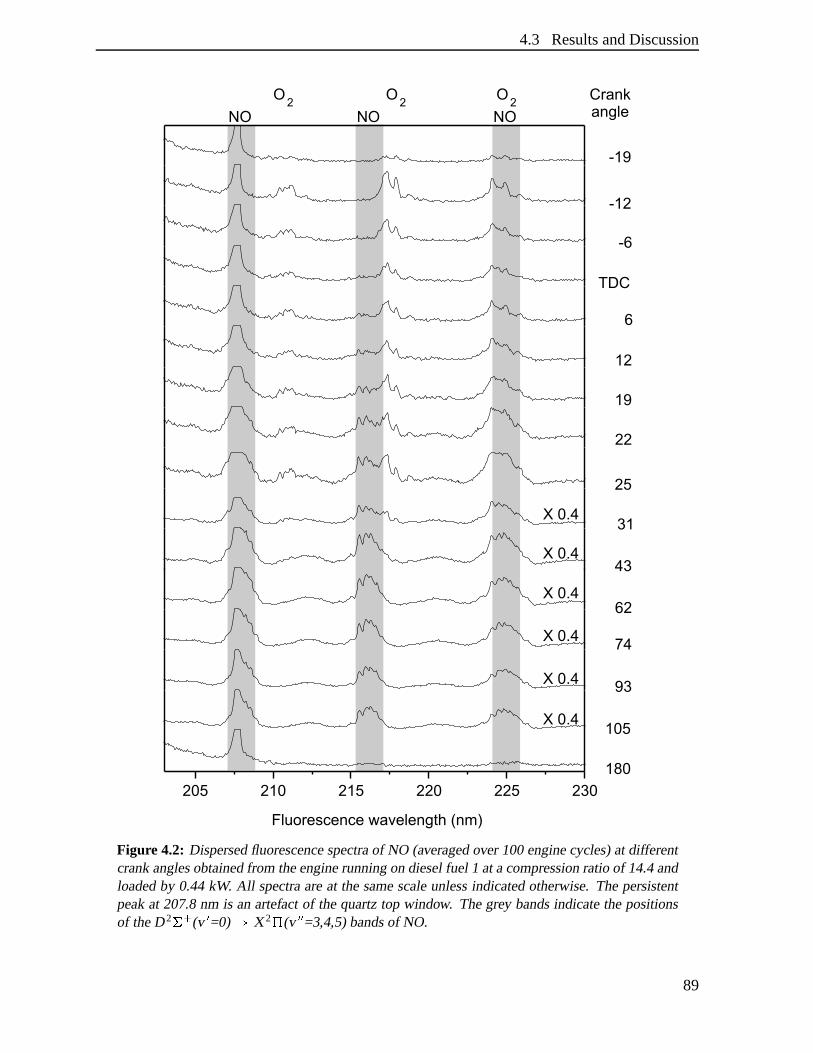
4.3 ResultsandDiscussion
Figure 4.2: Dispersedfluorescencespectraof NO (averagedover 100enginecycles)at differentcrankanglesobtainedfrom theenginerunningondieselfuel 1 atacompressionratioof 14.4andloadedby 0.44kW. All spectraareat thesamescaleunlessindicatedotherwise.Thepersistentpeakat 207.8nm is anartefact of thequartztop window. Thegrey bandsindicatethepositionsof theD 2 T U (v V =0) � X 2 X (v V V =3,4,5)bandsof NO.
89
4 Semi-quantitativenitric oxidedensities........
thehigh temperaturesthatarereachedduringthecombustionaroundTDC, thesevibrationallyexcitedlevelsaresufficiently populatedto givefluorescencesignals.WhenusinganArF laser,completelyavoiding O2 excitationat high temperaturesis difficult becauseall strongNO tran-sitionslie closeto someO2 resonance.TheO2 fluorescenceis characterisedby narrow doubletstructures,due to fastpredissociationof the upperstate[63–65]. Also the doubletstructureseenat 225nm nearTDC is theresultof fluorescenceof O2. Around225nm, only theshapeof thepeakchangeswith increasingcrankanglefrom adoubletstructure(characteristicfor O2)for q rt 30u aTDC to a broad,rippled structure(characteristicfor NO) for q »t 30u aTDC,becausethefluorescencebandsof NO andO2 coincidein thiswavelengthregion. AlthoughNOfluorescenceis themostevidentin thespectrafor q½»t 30u aTDC,it canalreadybeseenin thespectrumrecordedat6u bTDC. Thespectrumat180u aTDC(BDC) showsnoNO fluorescence,indicatingthatevery cycle all NO is removedby scavenging.(For comparison,Braumeret al.found that five cycleswereneededto completelyremove all NO in their SI engine[78].) At180u aTDC,nooxygenfluorescenceis seenneither, becauseof thesmallpopulationof thev ada =2and3 asa resultof thelow temperatureat thatmoment.
Similar seriesof spectra,reproducingwell, wereobtainedfor several engineruns. Also,dispersedfluorescencespectrawereobtainedfor otherengineconditions.They show thesamespectralstructuresand only little differenceis seenin the intensity of the NO fluorescencepeaks,mainly aroundTDC. TheNO dispersionspectraprovide informationon theamountofNO presentinsidetheprobedvolumeof thecylinder, whichcanbeusedto obtainanin-cylinderNO density. They alsoprovide informationaboutthewavelengthsof thefluorescencebandsofNO andO2 obtainedfrom the runningengine. This information is necessaryto determineafluorescencebandof NO that is freefrom O2 fluorescenceandcanbeusedfor imagingof NOdistributions.
4.3.3 NO density
Theareabelow theNO fluorescencepeaksin thedispersionspectra(theso-calledfluorescenceyield) providesinformationontheamountof NO presentinsidetheprobedvolumeof thecylin-derat differentcrankangles.To comparethefluorescenceyieldsat differentcrankanglesandengineconditionsit is necessaryto convert theminto morequantitative data. However, asal-mostall NO fluorescencebandsareoverlappedby O2 fluorescence,the structuresdueto O2
fluorescencehave to betakeninto account.Fromthis point of view theNO fluorescencebandat 208nmwouldbebestsuitedfor evaluation,but unfortunatelyit is exactlyat this wavelengththat interferencewith a signaloriginatingfrom the quartzwindow occurs. Alternatively, theNO peakat 216 nm wasused,becauseit is only slightly mixed with the O2 fluorescenceat217.5nm. To determinethe contribution of O2, the peaksin the 12u bTDC spectrum(whereonly O2 fluorescenceis present)arefitted to Gaussiancurves. Becausethepositionandshapeof the O2 peaksdo not changeduring the stroke (a benefitof the fastpredissociationof theB-state),this resultcanbeused,togetherwith a proportionalityconstantfor thechangein in-tensity, to determinetheO2 contribution to theemissionin the216-218nm region at all crankangles.Takingthiscontributioninto account,theNO fluorescenceat216nmis fittedto aGaus-siancurve in orderto obtainanNO fluorescenceyield. Following this procedure,fluorescenceyield curvesasa functionof crankangleareobtainedfor theengineat differentoperatingcon-ditions(fuel, load,compressionratio). Thefluorescenceyield curve obtainedfrom thespectra
90
4.3 ResultsandDiscussion
presentedin figure4.2 is givenin figure4.3a(opensquares,~ ). Curvesobtainedfor otheren-gineconditionslook rathersimilarandmostof thedifferencesareseenaroundTDC (discussedbelow). However, comparisonof just thefluorescenceyieldswould bedeceptive becausetheyalsodependonthepressure,temperatureandlaserradiationintensityinsidethecylinder. Theseparametersvary during the stroke andfor differentengineconditions. Therefore,in ordertocomparethefluorescenceyieldsthroughoutthestrokeandfor differentengineconditions,theyhave to be translatedinto an in-cylinder NO concentration,taking into accountthe changingin-cylinderconditions.Themodelusedto processthemeasuredfluorescenceyield is describedin theAppendix.
Two NO densitycurvesasa function of crankanglederived from the fluorescenceyieldcurvein figure4.3afollowing theproceduredescribedin theAppendix,aregivenin figure4.3b.The differencebetweenthe curves is the temperatureusedin the processing. The o -curveresultsfrom usingthemeangastemperaturewhereasthe -curve resultsfrom usingthesoottemperature.For comparisonthesetwo temperaturecurvesareincludedin figure4.3a.For bothcurvesthein-cylinderpressuregivenin figure2.4 is used.Undertheassumptionthattheprobevolume is representative for the whole cylinder content(seeAppendixandfigure 4.1c), NOcontentcurvescanbederivedfrom thedensitycurves,resultingin figure4.3c.
Beforediscussingtheshapeof thecurvesin figure4.3,somediscussionconcerningpossibleerror sourcesis appropriate.However, sincemostof thesearesystematicerrorsthat appearin all NO contentcurves they do not affect the relative differencesbetweencurves,andNOcontentcurvesat differentengineconditionscanbecompared.Becausethefluorescenceyieldcurvesobtainedfor severalenginerunsreproducewell, theaccuracy of theobtainedNO contentcurve will bedeterminedmainly by theprecisionof thefluorescenceyield processingmethod.Although the generalrelationshipbetweenthe fluorescenceyield andthe NO contentis wellestablished(equation1 of the Appendix),someerrorswill be introducedby the assumptionsmadein obtainingthedifferentfactorsthatareusedin themodel. It is, for instance,not clearwhich temperaturehasto beusedin theprocessing.Neitherthesoottemperaturenor themeangastemperaturerepresentsthelocal temperatureat thepositiontheNO is measured.Duringtheactualcombustion,therelevanttemperatureis probablyhigherthanthemeangastemperature,asthe cylinder contentsarenot likely to be in thermalequilibrium at that moment. The soottemperaturemaythereforebea betterestimatefor theNO temperaturein thebeginningof thecombustion. However, this temperaturewill likely be too high at the endof the combustion,sincethegasescool down fasterthanthesootparticles.Probably, a realistictemperatureof theprobevolumeis somewherein betweenthe two temperaturecurvesof figure4.3a. Theeffectof the two different temperaturesis seenin figure 4.3b whereNO densitycurves are givenresultingfrom thesamefluorescenceyield curveusingbothtemperatures.Theuseof themeangastemperatureresultsin a curve thatshows a fasterriseof theNO densityin theearlyphaseof thecombustion.
TheNO densitycurve,givenin figure4.3b,showsthatNO canfirst bedetectedat6u bTDCandthat its densityincreasesthroughoutthecombustionstroke till somewherein between20uand50u aTDC, dependingslightly on the temperatureusedin the derivation. The dip around20u aTDC is probablynot realistic. The subsequentdecreaseis largely dueto the expandingin-cylinder volume,ascanbeseenfrom theNO contentcurvesof figure4.3c. Thelattercon-tinue to rise up to about50u aTDC, after which they more or lesslevel off or show a smalldecrease.Comparisonof theNO curveswith theengineparametercurvesof figure2.4 leadsto
91
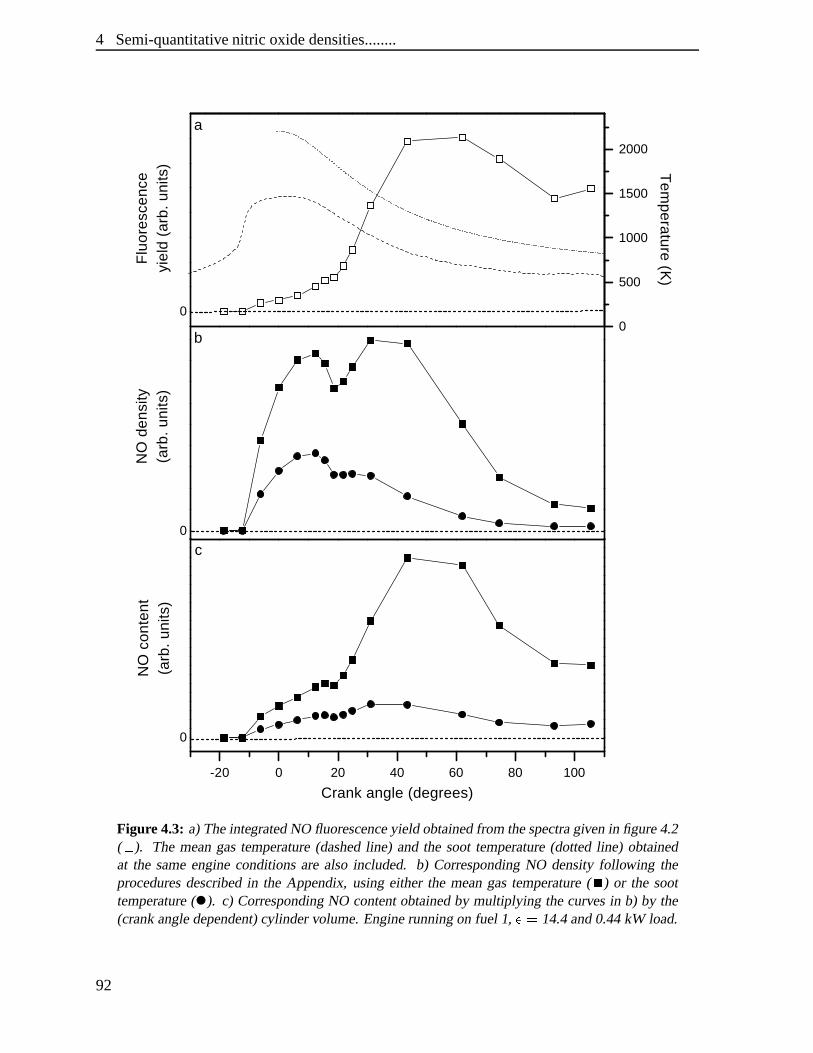
4 Semi-quantitativenitric oxidedensities........
-20 0 20 40 60 80 100
0
0
0
c
NO
con
tent
(arb
. un
its)
Crank angle (degrees)
b
NO
den
sity
(arb
. un
its)
aF
luor
esce
nce
yiel
d (a
rb. u
nits
)
0
500
1000
1500
2000T
emperature (K
)
Figure4.3: a)TheintegratedNO fluorescenceyield obtainedfrom thespectragivenin figure4.2( ~ ). The meangastemperature(dashedline) and the soot temperature(dottedline) obtainedat the sameengineconditionsare also included. b) CorrespondingNO densityfollowing theproceduresdescribedin the Appendix, usingeither the meangastemperature( o ) or the soottemperature( ). c) CorrespondingNO contentobtainedby multiplying thecurvesin b) by the(crankangledependent)cylinder volume.Enginerunningon fuel 1, ¾ p 14.4and0.44kW load.
92
4.3 ResultsandDiscussion
theconclusionthat,in this (considerablymodified)engine,thebulk of NO formationdoesnotcoincidewith the highestpressureandtemperaturepart of the stroke. Neither is any relationseenbetweenthe NO formationandthe peakof the premixed burn in the heatreleasecurveat 12u bTDC. At this crankangleonly O2 fluorescenceis presentin thespectraof figure4.2,indicatingthat,althoughtheredefinitelyis laserintensitywithin thecylinder (andnotethattheO2 fluorescencein all spectraup to 25u aTDCis aboutequallystrong),theNO densityis stillbelow the detectionlimit. The bulk of NO formationtakesplacerelatively late in the stroke,suggestingthat thediffusionburningphaseof combustion(startingat 3u aTDC)makesanim-portantcontribution to theNO formation. Only little NO productionis seenduring the initialpremixedcombustion,which is fuel rich.
Theapparentlylatestartof NO formationimpliedby theNO curvesof figure4.3mayraisethe questionwhetherall laserintensitymight be absorbedearly in the combustionchamber,beforereachingtheareawhereNO is formed. Although this possibilitycannotunequivocallybeexcluded(sincethelaserintensitycannotdirectly bemeasuredwithin thecylinder), it is notconsideredvery likely, againbecauseof thepresenceof theO2 fluorescence.Thisfluorescenceoriginatesfrom excitation of O2 moleculesin the v ada =2 or 3 states.(In fact, the temperaturedependenceof the O2 is even strongerthan that of the NO fluorescence,becausethe lowerlevels involved are at a higher energy in O2 (v ada =3 Ja a =5/15 around5800cm� 1) than in NO(v ada =1, Jada =26.5/32.5around4300 cm� 1)). Thus, it is likely that the O2 fluorescencesignaloriginatesmainly in the highesttemperatureregionswithin the cylinder, that is, from aroundthesprayedgeswherethepremixedcombustionoccurs.This is alsotheregionwhereNO mightbeexpectedto form (seeimagesin DecandCanaan[17]). Therefore,theabsenceof detectableNO fluorescencein thepresenceof hot O2 fluorescencecanbetakenasanindicationthatNOformationhasnotyetbegunat 12u bTDC.
This somewhat surprisingresult is supportedby theoreticalpredictionsby the group ofPeters[79] andalsoby recentexperimentalresultsfrom laserimagingtechniquesfrom otherresearchgroups[17,39]. Nakagawaetal. [39] foundthatNO wasformedontheleansideof theflame,whereoxygenis presentandthetemperatureis high. TheregionwhereNO is locatedwasfoundto expandduringthecombustion,indicatingthatNO is not formedin theregionswherethepremixedcombustionoccurs.Imagesreportedby DecandCanaan[17] showedthat,in theengineused,NO formationstartsaroundthe jet peripheryjust after thediffusionflameforms.It wasfoundthatNO remainedconfinedto theedgeof thejet until thejet structuredisappeared.As thecombustioncontinued,NO formationcontinuedin thehotpost-combustiongases,in thetrail of thereactingfuel jet. Additionally, DecandCanaan[17] presenteda NO contentcurvethatshowedthatNO formationdoesnotarisefrom thepremixedcombustionbut startsjustafterthe diffusionflameforms andcontinuesin thehot post-combustiongasesafter the endof thecombustion.Only 67%of theNO hadformedby theendof theapparentheatrelease.It is alsoin agreementwith dataobtainedfrom cylinder gassamplingmeasurementsthat showed thatNO formationstartssomewhatafter thebeginningof thecombustionandrisesthroughoutthecombustionprocess[80].
Theseresultssupporttheexpectationthattheinitial premixedburnis toofuel rich to producesignificantNO asdiscussedin theconceptualmodelof Dec[16], which is derivedfrom dataofseveraldifferentlaser-baseddiagnostics.However, theresultsappearto conflictwith themodelsthatpredictthattheinitial premixedburn hasa largecontribution to theNO formationandthatthe NOx emissionscorrelatewith the amountof fuel consumedduring the initial premixed
93
4 Semi-quantitativenitric oxidedensities........
burn [24,81]. Rather, thepresentresultsindicatethatany correlationof NOx emissionwith thefuel consumptionduring thepremixedburn musthave anotherreason.An explanationcanbefoundin therapid,largeriseof thein-cylindertemperaturearoundTDC causedby thepremixedburn [17]. The higherair temperaturewill causean increasein temperatureof the diffusionflameresultingin a higherNO productionin the diffusion burning phase.This effect wouldbe larger if thecontribution of thepremixedburn to the total burn is largerand/orthevolumeat TDC is smaller. Consequently, it will have moreinfluencein engineswith a small bore,asthe oneusedin this experiment(note that in this enginealso the premixed burn contributesrelatively muchto theheatrelease).
The decreasein NO contentat the endof the stroke canpossiblybe explainedby a con-versionof NO into NO2 by oxidationin the colderpart of the stroke, which is alsopredictedby theoreticalcalculations[79]. A relatively largeconversionto NO2 in this engine,usedat alight load,would beconsistentwith a generallyhigh NO2/NO ratio at theexhaustoccurringinlight-loaddieselengines,wherecoolerregionsadvancetheconversionto NO2 [27].
4.3.4 Effect of engineconditions
To studytheeffect of differentengineconditionson theNO production,thecompressionratio( J ), fuel andloadwerevaried. Dispersedfluorescencespectrawererecordedfor thedifferentengineconditions.They wereevaluatedusingthemeangastemperaturein theway describedin the Appendix in orderto obtainNO densitycurvesasa function of crankangle. The NOdensitycurvesshown in figure 4.4aareobtainedat differentcompressionratios( J =14.4( o );J =13.4( ~ )), thecurvesin figure4.4bresultfrom theenginerunningon differentfuels (fuel 1( o ); fuel 2 ( ~ )), andthosein figure4.4careobtainedfrom theengineloadedby differentloads(0.75kW ( o ); 0.88kW ( ~ )). Fromthecurvesin figure4.4it canbeconcludedthatchangingtheengineconditionswithin theselimits hasonly little influenceon theNO production.A highercompressionratio leadsto anearlierstartof NO formation,ascanbeseenin figure4.4a.Thisalsofollows from a comparisonof the curvesof figures4.4aandc wherethe NO formationin the situationwith the lower J (figure 4.4c) startsmuch later. A possibleexplanationforthis couldbethat,for lower compressionratios,thelower temperaturesprevailing duringmostof thecombustioncycle reduceall reactionrates,leadingto a slower riseof theNO densitytoabovethedetectionlimit. (Notethatabsolutevaluesin figure4.4maynotbecomparedbetweengraphs.)Fromfigure4.4bit follows that for both fuelsNO formationstartsat thesamecrankangle,but theearlydiffusionburningcontributesmoreto theNO formationin thecaseof fuel 1.BecauseNO formationcontinueslongerin thecaseof fuel 2, thedensitiesreachedat theendof thecycle arecomparable.The influenceof loadcanbederived from figure4.4c. A higherloadresultsin a slightly advancedriseof theNO density, which canbetheresultof thehighertemperaturesat higherloads,but otherwisethetwo curvesareverysimilar.
As discussedin thecontext of figure4.3,thedensitycurvescanbeconvertedto NO contentcurves,thusremoving theeffect of the increasingin-cylinder volume. All NO contentcurvesthusderivedfrom figure4.4show aslow startof NO formationfollowedby asteeprisearound30u aTDCanda maximumaround80u aTDC,afterwhich a smalldecreasefollows. This indi-catesthat,for all conditionsstudied,theNO formationdoesnot arisefrom theinitial premixedcombustionbut thatthediffusionburningphaseof combustionmakesanimportantcontribution.
94
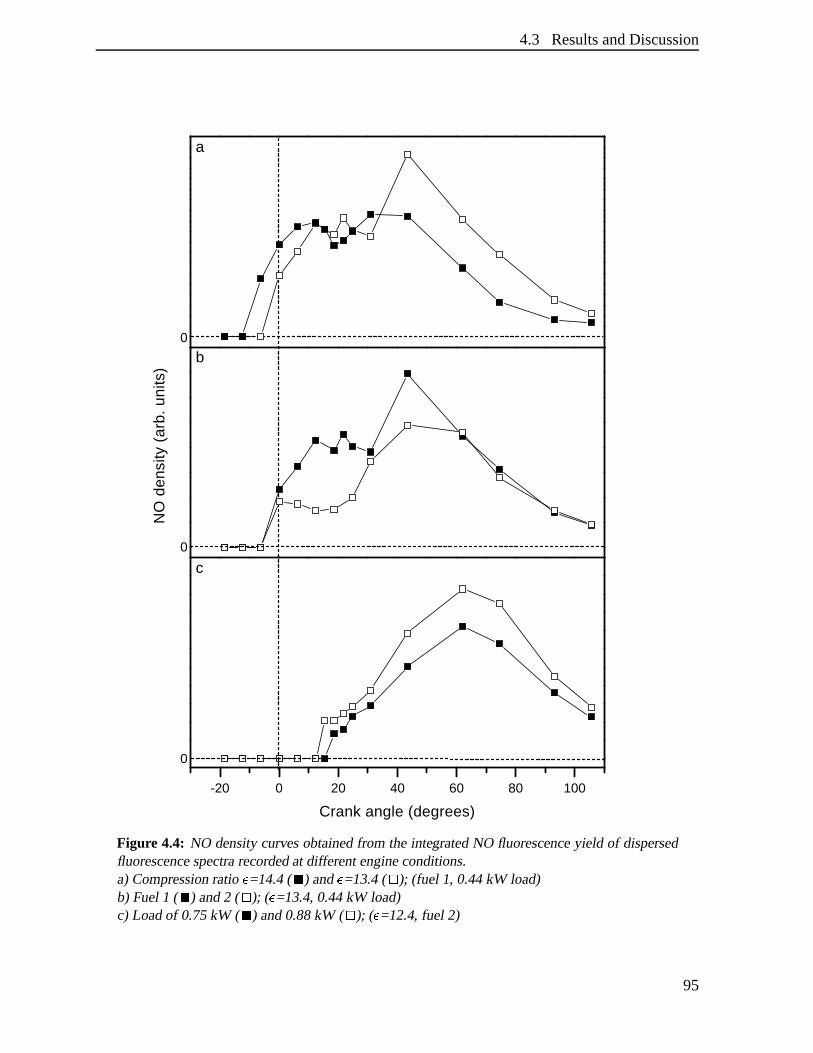
4.3 ResultsandDiscussion
-20 0 20 40 60 80 100
0
0
0
c
NO
den
sity
(ar
b. u
nits
)
Crank angle (degrees)
b
a
Figure 4.4: NO densitycurvesobtainedfrom theintegratedNO fluorescenceyield of dispersedfluorescencespectrarecordedat differentengineconditions.a) Compressionratio ¿ =14.4( À ) and ¿ =13.4( Á ); (fuel 1, 0.44kW load)b) Fuel1 ( À ) and2 ( Á ); (¿ =13.4,0.44kW load)c) Loadof 0.75kW ( À ) and0.88kW ( Á ); ( ¿ =12.4,fuel 2)
95
4 Semi-quantitativenitric oxidedensities........
4.4 Conclusion
TheLaserInducedFluorescence(LIF) techniquewasusedto studythenitric oxide(NO) pro-ductioninsidethecombustionchamberof anopticallyaccessibletwo-strokedieselenginerun-ning on standardcommercialdieselfuel. Using193nm excitationof NO anddetectionof theensuingfluorescenceat216nmallowedthedeterminationof NO densitythroughoutthewholecombustionstroke.
Dispersedfluorescencespectraasa function of crank anglewere measured.They showspectralstructureresultingfrom NO fluorescencefrom 6Â bTDConwards,aswell asadditionalfluorescenceresultingfrom hot oxygen(O2), partly overlappingthe NO fluorescencebands.For crankangles ÃÄ 20Â aTDC the spectraaredominatedby fluorescencefrom vibrationallyhot O2 (vÅdÅ =2,3),whereasit is almostabsentin thespectraat crankangles ÆÄ 40Â aTDC.In theevaluationof themeasuredfluorescencesignals,this interferingO2 fluorescencewastakenintoaccount.
From the dispersedfluorescencespectraa relative measurefor the amountof NO presentinsidethecylinderwasobtained.In orderto comparetheamountsof NO throughoutthestrokeandfor differentengineconditions,fluorescencespectrawereprocessedfor the changingin-cylinderconditions(volume,pressure,temperatureandlaserradiationintensity).Two differentestimatesof thelocal temperaturewithin theprobevolumewereused.
TheresultingNO densitycurvesshowedthat,for thisengine,thedensityincreasesthrough-out thecombustionstroke till somewherebetween20Â and50Â aTDC.Thereafter, theNO den-sity in theprobevolumeseemsto decrease,however, this is mainly aneffect of theexpandingcylinder volumeasseenfrom theNO contentcurves.This indicatesthat thediffusionburningphaseof thecombustionmakesanimportantcontributionto theNO formationandthatNO for-mationcontinuesin thehotpost-combustiongases.Thisresultis in agreementwith therecentlypresentedresultsfrom the groupof Dec [17], showing that NO wasformedat the peripheryof the jet, startingjust after the diffusion flameforms. Towardsthe endof the stroke a smalldeclineof theNO contentcurveswasseen.This couldbedueto theconversionof NO to NO2
in thecolderpartof thestroke.In the future,planarLIF will be usedto obtaintwo-dimensionaldistributionsof NO fluo-
rescence,usingtheO2 interference-freebandat 208nm. In addition,theLIF methodwill beappliedon a realisticsix-cylinder, direct-injection,11Ç 6 È DAF dieselengine.Oneof thecylin-dersis elongatedandhasbeenmadeopticallyaccessibleby awindow in thepistonandwindowsin thetopof thecylinderwall. Also,otherexcitation/detectionschemeswill bepursued,notablyusing226nmexcitationof NO in theA(v Å =0) É X(v ÅdÅ =0) band.Firstmeasurementsusingthisexcitationpathwayarecurrentlybeingevaluated[82].
96
4.4 Conclusion
Appendix: Signalprocessing
In orderto quantifythemeasuredfluorescenceyield, all factorsconcerningtheexcitationof themoleculesandthe inducedfluorescenceresultingfrom theexcitedmoleculeshave to betakeninto account.For thecaseof pulsedexcitationin which thefluorescenceoutof theexcitedstateis recorded,the relationbetweenthefluorescencesignalSLIF, andthe local NO density, Ê NO,canbewrittenas
SLIF Ë CV
AF ÌÎÍr Ï�Ð Ì PÑ T ÌÎÍr Ï4Ï g Ì�Ò L Ñ Ò aÏ fvÓ J Ì T ÌÎÍr Ï4Ï IL ÌÎÍr Ï�Ê NO ÌÎÍr Ï d3r (4.1)
wheretheintegrationis takenoverthewholevolumeseenby thedetector. C is aproportionalityconstant,IL ÌÎÍr Ï is the local intensity of the laserbeamand AF ÌÎÍr Ï is a factor describingtheattenuationof inducedfluorescenceon its way to the top window. The Boltzmannfraction,fvÓ J(T ÌÎÍr Ï ), describesthe temperature-dependentpopulationof the probedstate. The Stern-Vollmer factor, Ð (P,T ÌÎÍr Ï ), accountsfor the competitionbetweenradiative and non-radiative(collision-induced)decayof excitedmolecules,andg ÌAÒ L Ñ Ò aÏ is theoverlapintegralof thelaserline profile with the NO absorptionspectrum. In the model rotationalenergy transferin thegroundstateis neglectedasdiscussedin chapter2, section2.3.2.
In orderto extracta NO densityfrom themeasuredfluorescenceyield, all factorsin equa-tion 4.1 have to be known. However, althoughthe generalrelationshipbetweenthe fluores-cenceyield andthe NO contentis clear, mostof the individual factorsaredifficult to obtain.Furthermore,evaluationof thesefactorsresultsin expressionswhich dependon thein-cylinderconditions(volume,pressure,temperatureand laserintensity)of which particularly the tem-peratureis insufficiently known. The evaluationof the individual factorsof equation4.1 isdiscussedbelow for thecaseof laserillumination andfluorescencedetectionboth throughthetopwindow.
Ideally, for theexperimentalsetupof figure4.1,each(square)CCD pixel collectsfluores-cencefrom a squarerod parallelto thecylinder axisandextendingfrom thebottomof thetopwindow downwards(z-direction;z=0at thetopwindow). In practice,someaveragingwill takeplacedueto the finite depthof field of the cameraobjective ( f /4.5), aswell assomeimageblurring dueto theslightly etchedlower surfaceof theobservationwindow. Neglectingtheseeffectsfor thepresentanalysis,andtaking into accountthat thespectrain figure4.2 representaveragesover theslit height,equation4.1canberewrittenas
SLIF ÌAÔ Ï Ë C ÌAÔ Ïzp
zÕ 0
AF Ì zÏ�Ð Ì PÑ T Ì zÏ©Ñ Ô Ï g ÌAÒ L Ñ Ò a Ñ zÏ fvÓ J Ì T Ì zÏ0Ï IL Ì zÏ�Ê NO Ì zÏ dz
Ö C ÌAÔ Ï Ð Ì PÑ T Ñ Ô Ï g ÌAÒ L Ñ Ò aÏ fvÓ J Ì T Ï Ê NO
zp
zÕ 0
IL Ì zÏ AF Ì zÏ dz (4.2)
in whichzp is thepositionof thepistonuppersurface.In thesecondstepseveralproportionalityfactorshavebeenreplacedby theiraveragevalues(indicatedby overbars),whichallowsto takethemout of theintegral. This model,therefore,providesa valuefor theaverage NO densityinthewholevolumeseenby thedetector(theprobevolume).
97
4 Semi-quantitativenitric oxidedensities........
Proportionality constantC: This factoris justagaugeconstantincludinganumberof experi-mentalparameterslikecollectionefficiency, window transmission,camerasensitivity, etc. It isconstantduringthewholecombustionstroke.Local laser intensity IL Ì zÏ and Fluorescenceattenuation AF Ì zÏ : On their way throughthecombustionchamberboth the laserradiationandthe inducedfluorescencesuffer attenuation,duemainly to absorptionby andscatteringoff sootparticlesand fuel andoil droplets. Theintensityof thelaserbeam,with anintensity I0 whenit entersthecombustionchamber, canbewrittenas
IL Ì zÏ Ë I0 exp ×z
0
Øext Ì zÅ Ï next Ì zÅ Ï dzÅ Ñ (4.3)
in which Ø ext is aneffectiveextinctioncrosssectionandnext is thedensityof attenuatingparti-cles.A similarequationholdsfor thefluorescenceattenuation,AF Ì zÏ . In general,both Ø ext andnext will beafunctionof positionz. Thelocalextinctioncoefficient is (for thisparticularsetup)aninaccessibleparameter, thatcannotbemeasured.An approximationcanbemadeby replac-ing Ø ext Ì zÏ next Ì zÏ by its average,[nØ ]ext . In this approximation,andcombiningtheequationsfor IL andAF, theintegral in equation4.2canbewrittenas
zp
zÕ 0
IL Ì zÏ AF Ì zÏ dz Ö I0
zp
zÕ 0
exp Ì × 2[nØ ]ext zÅ Ï dzÅ ËÙI0
21 × exp Ì × 2zp Ú Ù Ï Ñ (4.4)
in which a penetrationdepthÙ
hasbeendefinedasÙ Ë 1Ú [nØ ]ext . Also, [nØ ]ext hasbeen
assumedto be thesameat thewavelengthsof excitation (193nm) andfluorescencedetection(216nmin thecaseof figure4.2).
A measurefor the averageextinction coefficient over the whole cylinder canbe obtainedfrom transmissionmeasurementsof thelaserbeam,asdiscussedin chapter3. Thesedata,givenin figure4.5,show arisein transmissionaround60Â aTDC, whichcoincideswith theendof thevisiblecombustion,suggestingthatunburnedfuel playsapartin theabsorptionof 193nmlaserradiation.Apart from this, theexpansionalsoreducesthedensityof sootandotherabsorbingspecies,which causeslessattenuationof the laserradiationwith increasingcrankangle. Thepenetrationdepthof thelaserradiation,definedin equation4.4,is alsoincludedin figure4.5,aswell asthedistancebetweenthe lower surfaceof thetop window andtheuppersurfaceof thepiston(zp).
For the interpretationof thespectraof figure4.2,we have assumedtheaverage extinctioncoefficient obtainedfrom thetransmissionmeasurementsto beequalto theaverage extinctioncoefficient [nØ ]ext of equation4.4. It has,however, beencheckedthatchangingthesevaluesbyasmuchasa factorof 10 (bothsmallerandlarger)hasrelatively little influenceontheshapeoftheNO densitycurvesasa functionof crankangle(theabsolutenumbersdochange,of course,but thesearearbitraryunitsanyway).Boltzmann fraction fvÓ J Ì T Ï : The temperaturedependentfractionalpopulationof the probedstate(v ÅdÅ =1,JÅdÅ =26.5/32.5)canbecalculatedusingthewell establishedspectroscopicdataof theNO electronicgroundstate[83]. For theaveragetemperatureT eitherthemeangastemperatureor thesoottemperaturehasbeenused.
98
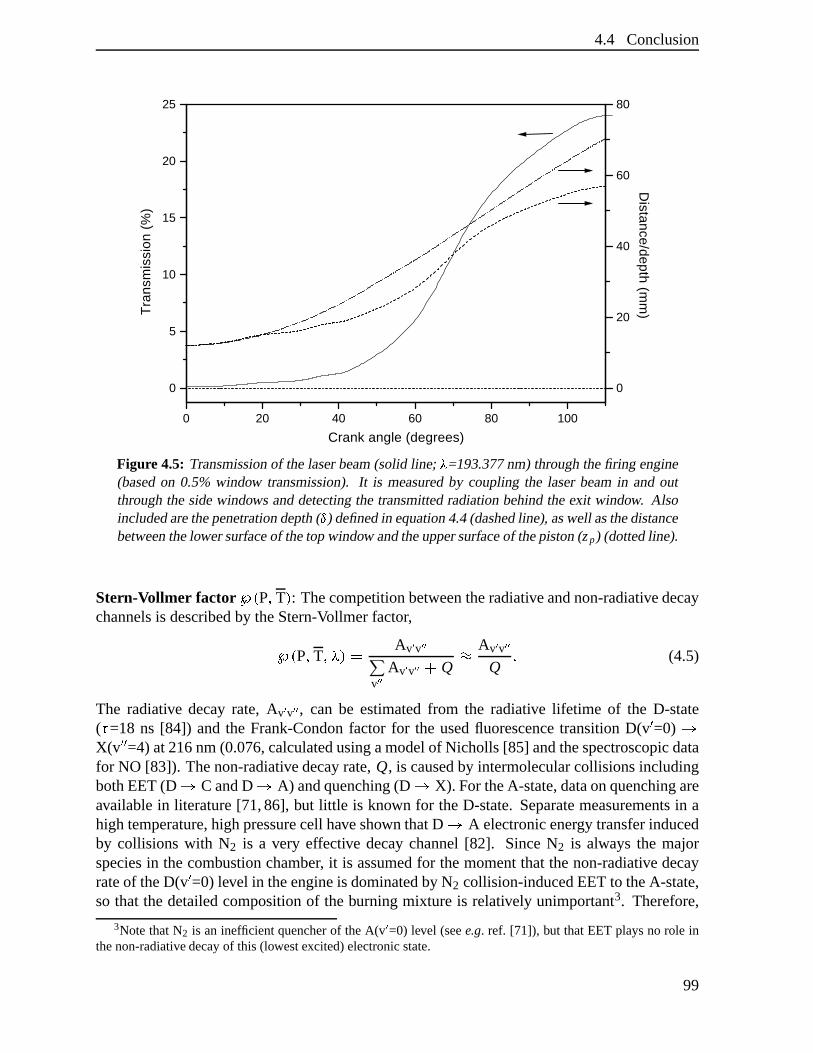
4.4 Conclusion
0 20 40 60 80 100
0
5
10
15
20
25
Tra
nsm
issi
on (
%)
Crank angle (degrees)
0
20
40
60
80
Distance/depth (m
m)
Figure 4.5: Transmissionof thelaserbeam(solid line; Û =193.377nm) throughthefiring engine(basedon 0.5% window transmission).It is measuredby coupling the laserbeamin andoutthroughthesidewindows anddetectingthe transmittedradiationbehindtheexit window. Alsoincludedarethepenetrationdepth(Ü ) definedin equation4.4(dashedline), aswell asthedistancebetweenthelowersurfaceof thetopwindow andtheuppersurfaceof thepiston(zp) (dottedline).
Stern-Vollmer factor Ð Ì PÑ T Ï : Thecompetitionbetweentheradiativeandnon-radiativedecaychannelsis describedby theStern-Vollmer factor,
Ð Ì PÑ T Ñ Ô Ï Ë AvÝ vÝ ÝvÝ Ý AvÝ vÝ Ý�Þ Q
Ö AvÝ vÝ ÝQ
Ç (4.5)
The radiative decayrate, AvÝ vÝ Ý , can be estimatedfrom the radiative lifetime of the D-state( ß =18 ns [84]) andthe Frank-Condonfactor for the usedfluorescencetransitionD(vÅ =0) àX(v ÅdÅ =4) at216nm(0.076,calculatedusingamodelof Nicholls [85] andthespectroscopicdatafor NO [83]). Thenon-radiativedecayrate,Q, is causedby intermolecularcollisionsincludingbothEET(D à C andD à A) andquenching(D à X). For theA-state,dataonquenchingareavailablein literature[71,86], but little is known for theD-state.Separatemeasurementsin ahightemperature,highpressurecell haveshown thatD à A electronicenergy transferinducedby collisions with N2 is a very effective decaychannel[82]. SinceN2 is always the majorspeciesin thecombustionchamber, it is assumedfor themomentthat thenon-radiative decayrateof theD(v Å =0) level in theengineis dominatedby N2 collision-inducedEETto theA-state,so that thedetailedcompositionof theburningmixture is relatively unimportant3. Therefore,
3NotethatN2 is an inefficient quencherof theA(v á =0) level (seee.g. ref. [71]), but thatEET playsno role inthenon-radiativedecayof this (lowestexcited)electronicstate.
99
4 Semi-quantitativenitric oxidedensities........
Q canbewritten asQ Ë â ncolØ
col , in which â�Ë 8kTÚQãåä is themeanrelative velocity of
thecollisionpartnersata totaldensityncol (æ P/ T) and Ø col is aneffectivenon-radiativecrosssection,takento beindependentof pressureandtemperature.In thefiring engineQ ç A [30]andtherefore
Ð Ì PÑ T ÏLæ T
PÇ (4.6)
Overlap integral g Ì�Ò L Ñ Ò aÏ : The overlapintegral canbe calculatedanalyticallyby assumingGaussianprofilesfor boththelaseremission(L ÌAÒ × Ò L Ï ) andtheNO absorptionline (N ÌAÒ × Ò aÏ ),with centralfrequenciesÒ L and Ò a, respectively. A shift in thepositionof thelinesis not takeninto accountbecausethelaseris tunedto resonance(Ò L ËèÒ a), underengineconditions,beforeeachmeasurement.This resultsin:
g Ì�Ò L Ñ Ò aÏ Ëéëê
0
L ÌAÒ × Ò L Ï N Ì�Ò × Ò aÏ dÒ æ 1ì 2
L Þ ì 2a
Ñ (4.7)
in whichì
L andì
a are the widths (FWHM) of the laseremissionline andthe NO absorp-tion line, respectively4.
ìL is constant(1 cmí 1) but
ìa is affectedby the changingpressure
andtemperatureduring thestroke. Calculationofì
a requiresinformationaboutthe pressurebroadeningof the NO absorptionlines in the D(vÅ =0) É X(v ÅdÅ =1) bandunderenginecondi-tions.Thesedataarenot availablein literature.For thepresentpurposethefunctionalpressureandtemperaturedependenceof theA É X bandis taken[87,88], in combinationwith a pro-portionality factorthat is derivedfrom own measurementson theD É X bandin theengine,(section2.5.1,figure2.14),yielding
ìa Ë 0 Ç 53P
295
T
0î 75
cmí 1 Ñ (4.8)
with P thepressurein barandT theaveragetemperaturein Kelvin.Following theproceduredescribedabove,relativevaluesfor theaverageNO densitywithin
the probevolumecanbe extractedfrom the fluorescenceyield asa function of crankangle.To theextent that theprobevolumeis representative for thewholecylinder (which seemsnotunreasonable,in view of the illuminatedareaindicatedin figure4.1 andthepenetrationdepthof figure4.5), thesedensitydatacanberelatedto anin-cylinder NO contentby multiplicationwith the(crankangledependent)in-cylindervolume,
NNO æ Ê NO V Ì zp Ï]Ç (4.9)
4Undertheconditionsof thepresentexperiments,pressurebroadeningis likely to give thedominantcontribu-tion to theNO linewidth. Thus,it would bemoreappropriateto usea Lorentzianinsteadof a Gaussianlineshape,but this wouldnot leadto analyticalresultsfor theoverlapintegral. Numericalcalculationshaveshown thatequa-tion 4.7givesabout3%toosmallresults,almostindependentof crankangle.Sinceall NO densityresultsreportedherearein arbitraryunits,sucha virtually constantproportionallityfactoris irrelevant. Note thatalsoa possiblecontributionof neighbouringNO transitionsathigh pressureandtemperatureto theoverlapintegral is neglected.
100
Chapter 5
Nitric oxidedistrib utions in relation totemperatureand chemicalcompositioninhomogeneities
Abstract
ThePlanarLaserInducedFluorescence(PLIF) techniqueis usedto studythespatialandtempo-ral distribution of nitric oxide(NO) insidethecombustionchamberof anoptically transparenttwo-strokedieselenginerunningoncommercialdieselfuel. TheNO moleculesareexcitedby asheetof excimerlaserradiationin theD2 ï é (v Å =0) É X2 ð (v ÅdÅ =1)bandat193.377nm. Inducedfluorescenceis detectedby a CCD camerathrougha narrow-bandfilter in orderto singleout aNO fluorescencebandat 208nm that is freeof oxygen(O2) fluorescence.Additionally, distri-butionsof theelasticallyscatteredradiationarerecordedto reconstructthelocal laserintensity,in orderto correcttheNO fluorescencedistributionsfor thedecreasein laserintensityover thefield of view. Theobtaineddistributionsaretransformedinto NO densitydistributionson theassumptionsthat all other factorsin the transformationof NO fluorescenceinto NO densityareuniform over thefield of view. Theextent to which deviationsfrom uniformity in temper-atureandfluorescencequenchingrateaffect the derived NO densitydistribution is estimated.A measurefor theNO densityinsidetheprobevolumeasa functionof crankangleis derivedfrom thefluorescencedistributionsby integratingthetotalfluorescence.Thisfluorescenceyieldis transformedinto a semi-quantitative NO density/contentin thecylinder taking into accountthe crankangledependenceof the engineparameters(pressure,temperatureand laserradia-tion intensity).TheseNO density/contentcurvesarecomparedto similar curvesobtainedfromdispersedfluorescencespectra.
101
5 Nitric oxidedistributionsin relationto........
5.1 Intr oduction
Strategiesfor thereductionof toxic emissionsfrom dieselenginesfocuson particulates(soot)andoxidesof nitrogen(NOx). Emissioncontrol thereforeaimsat eithercatalyticexhaustgasafter-treatmentor at combustionoptimisation,whereoptimisationis taken to imply reducedtoxic compoundformationwhile (at least)maintainingcombustionefficiency. Combustionop-timisation,arguablythemorefundamentalwayof tacklingtheemissionproblem,posesahugechallengeboth to experimentaldataacquisitionandinterpretation,andto theoreticalcombus-tion modelling.Non-intrusiveopticaldiagnostics,basedon planarLaserInducedFluorescence(LIF), areusedto monitortheamountaswell asthedistributionof nitric oxide(NO) insidethecombustionchamberof adieselengine.
Themeasurementprincipleof theplanarLIF (PLIF) techniqueinvolveselectronicexcitationof themoleculesof interestby a thin sheetof laserradiation,anddetectionof thesubsequentfluorescencein a directionperpendicularto thesheetby anintensifiedCCD camera.PLIF hasbeenusedto demonstratethepresenceof a largenumberof specificsmallmoleculesin avarietyof combustionenvironments,but in generaltheobserveddataareveryhardto quantify[30–32].Although in principle theLIF intensityis linearly proportionalto the local numberdensityoflaser-excitedmolecules,theproportionalityconstantdependsonthelocal laserintensity, whichis likely to vary over the field of view, and the local physico-chemicalenvironment,involv-ing local temperature,density, chemicalcompositionandpossiblyspectroscopicinterferenceby othermolecules.Therefore,the proportionalityconstantwill dependon the positionanda fluorescencedistribution cannotimmediatelybe interpretedasa moleculardensitydistribu-tion. Sincemostof theparametersnecessaryfor thetranslationof fluorescenceinto densityareusuallynot known anddifficult to assesssimultaneouslywith the(P)LIF measurements,someassumptionshave to bemadeto obtainamoleculardensitydistributionandto quantifydata.
The PLIF techniquehasbeenappliedto both gasolineengines[41,77] and to dieselen-gines[17,37–39] to obtain informationaboutthe in-cylinder NO contentandthe in-cylinderNO distribution. Thedieselenginesusedwereoften runningskip-firedin orderto reducethecylindertemperature[17,37,39]. In addition,alow sootingdieselfuel [17,37,39]and/oroxygenenrichedintakeair wasused[37–39] to reducesootproduction.For this chapterthePLIF tech-niqueis usedto obtaintwo-dimensionalNO fluorescencedistributionswithin the combustionchamberof a small,optically accessibletwo-stroke, direct-injection(DI) dieselengine,that isoperatedin normalmode(i.e. notskip-fired)usingstandardcommercialdieselfuel andambient(non-oxygen-enriched)intake air. Cycle-averagedNO fluorescencedistributionsasa functionof crankanglearerecordedby detectingthefluorescencefrom NO moleculeswhichareexcitedin the D2 ï é (vÅ =0) É X2 ð (v ÅdÅ =1) bandat 193.377nm usingan ArF excimer laser. As it isdifficult to completelyavoid oxygen(O2) excitation in this wavelengthrange,it is necessaryto usea narrow-bandfilter to singleout theD2 ï é (vÅ =0) à X2 ð (v ÅdÅ =3) NO fluorescencebandat 208nm, that is not overlappedby O2 fluorescence.Distributionsof theelasticallyscatteredlaserradiationareobtainedimmediatelyaftertheNO fluorescencedistributionsduringthesameenginerun. Theseareusedto processthefluorescencedistributionsfor thechangein laserin-tensityon its way throughthecylinder (seechapter3). In-cylinderNO densitydistributionsarederivedby evaluationof thefluorescencedistributionstakingall location-dependentfactorsintoaccount.TheseNO distributionsareusedto calculateasemi-quantitativeNO densityor contentin the probevolumeasa function of crankangle. Thereforethe total NO fluorescencein the
102
5.2 Theory
imageis averagedandprocessedfor the changesin laserintensity, pressureandtemperatureduringthestroke.
This chapterstartswith a concisetheoreticalpart giving the relationshipbetweenthe NOfluorescenceyield andthe NO densityanda descriptionof all factorsinvolved, followed byan experimentalpart in which the setupis described.The resultsof the PLIF measurementsarepresentedandtranslatedinto NO densitydistributionswhichareanalysedwith anemphasison theeffectsof inhomogeneitiesin temperatureand/orchemicalcompositionof thecylindercontentsover the field of view. Finally, an in-cylinder NO density/contentis derived fromthedistributionsandcomparedagainsttheresultsobtainedfrom dispersedfluorescencespectradealtwith in chapter4, andsomeconclusionsaregiven.
5.2 Theory
Thispartconcentratesontheevaluationof datarecordedwith theexperimentalsetupdescribedbelow, in whichimagesthatcontainspatiallyresolvedinformationaboutNO canbeobtainedbyilluminating a planeby a thin lasersheetandrecordingtheinducedfluorescencein a directionperpendicularto it by aCCDcamera.For thecaseof pulsedexcitationin whichthefluorescenceoutof theexcitedstateis recorded,therelationbetweenthefluorescencemeasuredby any pixel,SLIF Ì x Ñ y Ï , andthecorrespondinglocal NO density, Ê NO Ì x Ñ y Ï , is givenby
SLIF Ì x Ñ y Ï Ë C AF Ì x Ñ y Ï�Ð Ì T Ñ PÏ g ÌAÒ a Ì T Ñ PÏ©Ñ Ò L Ï fvÓ J Ì T Ï IL Ì x Ñ y Ï�Ê NO Ì x Ñ yÏñÑ (5.1)
in which Ì x Ñ yÏ representthecoordinatesin the illuminatedplane,with the x-axis takenalongthe directionof the laserbeamandthe y-axis alongthe width of the lasersheet.C is a pro-portionality constant,mainly determinedby the experimentalsetup, fvÓ J Ì T Ï is the Boltzmannfractionthatdescribesthetemperaturedependentfractionalpopulationof theprobedstateandg Ì�Ò a Ì T Ñ PÏ©Ñ Ò L Ï is the overlap integral of the laserline profile with the NO absorptionspec-trum. TheStern-Vollmer factor, Ð Ì T Ñ PÏ , describesthecompetitionbetweentheradiative andnon-radiativedecay, IL Ì x Ñ y Ï is thelocal laserintensityandAF Ì x Ñ y Ï is a factordescribingtheattenuationof theinducedfluorescenceon its wayoutof theengine.
In orderto extracta two-dimensionalNO densitydistribution, Ê NO Ì x Ñ y Ï , from a measuredNO fluorescenceimage,all otherfactorsin equation5.1haveto beknown. Unfortunately, mostof thesefactorsaredifficult to obtain. In addition,their evaluationoftenresultsin expressionsthat dependon the local circumstances(pressure,temperature,laserintensity)at the positionÌ x Ñ y Ï , which in generalarenot sufficiently known. Thepressureasa functionof crankanglein therunningengineis known well andis expectedto beuniformover thewholefield of view.Thetemperature,on theotherhand,is difficult to determineandin generalcannotbeexpectedto be the sameover the whole field of view. Furthermore,the laserintensitydependson theposition,asit is attenuatedon its way throughthecombustionchamber. Consequently, mostoftheindividual factorsin equation5.1will dependon theposition Ì x Ñ y Ï aswell ason thecrankangle.Theevaluationof thedifferentfactorsis discussedbelow.Proportionality constant C: This factor is constantduring the whole combustionstroke. Itincludesa numberof experimentalparameterslike collectionefficiency, window transmission,camerasensitivity, etc. In principle,this factorwill bethesamefor everyposition Ì x Ñ yÏ , exceptfor asmallamountof vignettingat themargin of theobservationwindow.
103
5 Nitric oxidedistributionsin relationto........
Local laser intensity IL Ì x Ñ y Ï : Theintensityof thelaserbeamis attenuatedon its way throughthe combustionchamberdueto scatteringoff andabsorptionby particulatesandfuel andoildroplets. For the presentpurposethe procedureoutlinedin chapter3 to reconstructthe laserattenuationfrom asingleelasticscatteringimageis followed.Fluorescenceattenuation AF Ì x Ñ y Ï : Theinducedfluorescence,like thelaserradiation,suffersattenuationon its way to theobservationwindow dueto absorptionandscattering.As the in-ducedfluorescence(208nm) is at almostthesamewavelengthasthelaserradiation(193nm),it is assumedthat the averageattenuationcoefficient derived for the laserradiationcanalsobe usedfor the fluorescence.Becausethis attenuationcoefficient wasfound to be ratherho-mogeneousover the field of view (chapter3), it can be expectedthat the attenuationof thefluorescenceon its way to thetop window will bemoreor lessthesamefor thewholeimage.
Additionally, AF Ì x Ñ y Ï includesattenuationcausedby the top window itself. However,theselosseswill bethesamefor every position Ì x Ñ y Ï sincethetop window is burnedclearbythecombustionandno localiseddirt is seenon it.Boltzmann factor fvÓ J Ì TÏ : Thefractionalpopulationof theprobedstates(vÅdÅ =1, J=26.5/32.5)dependsstrongly on temperature.Although it can be calculatedusing the well establishedspectroscopicdataof theNO electronicgroundstate[83], theappropriatetemperature,however,is difficult to determine.Thelattermaydependon theposition Ì x Ñ yÏ , and,sincethevÅdÅ =1 stateis probed,small variationsin temperaturewill have a relatively largeeffect on thepopulation.In general,therefore,the Boltzmannfactorcannotbe expectedto be uniform over the wholeimage.Thispoint will bediscussedfurtherbelow.Stern-Vollmer factor Ð Ì T Ñ PÏ : TheStern-Vollmer factor, describingthecompetitionbetweentheradiativeandnon-radiativedecaychannels,is givenby
Ð Ì PÑ TÏ Ë AvÝ vÝ ÝvÝ Ý AvÝ vÝ Ý Þ Q
Ö AvÝ vÝ ÝQ
Ñ (5.2)
in which thenon-radiativedecayrate,Q, is assumedto bemuchlargerthanall radiativedecayratesAvÝ vÝ Ý underthe conditionsprevalentin the engine[30]. The radiative decayratecanbeestimatedfrom theradiativelifetime of theD-state( ß =18ns[84]) andtheFranck-Condonfactorfor the monitoredfluorescencetransitionD(vÅ =0) à X(v ÅdÅ =3) at 208 nm (0.165, calculatedusing a modelof Nicholls [85] and the spectroscopicdatafor NO [83]). The non-radiativedecayrate is causedby intermolecularcollisions, including both ElectronicEnergy Transfer(EET; D à C andD à A) andquenching(D à X) (seesection2.3.2). After EET radiativedecaycanstill occur from the NO A- or C-state,but that will be at wavelengthsoutsidethedetectionsystembandwidth. In contrastto the NO A-state,for which dataon quenchingareavailablein literature[71,86], only little is known for theD-state.In general,Q canbewrittenasQ Ë col â ncol
Øcol, in which â¸Ëóò 8kTÚQãåä is themeanrelative velocity of thecollision
partnersat a total densityncol (æ P/T) and Ø col is a non-radiative collision crosssection,thatincludesbothEET andquenching.As a first approximationQ Ö â ntot
Øeff , in which ntot is the
total densityand Ø eff aneffectivenon-radiativecollisioncrosssection,sothat
Ð Ì PÑ TÏLæ ò T
PÇ (5.3)
The Stern-Vollmer factor, in general,will not be uniform over the field of view asit dependson thesquareroot of thetemperaturewhich canvary with theposition Ì x Ñ y Ï . In addition,the
104
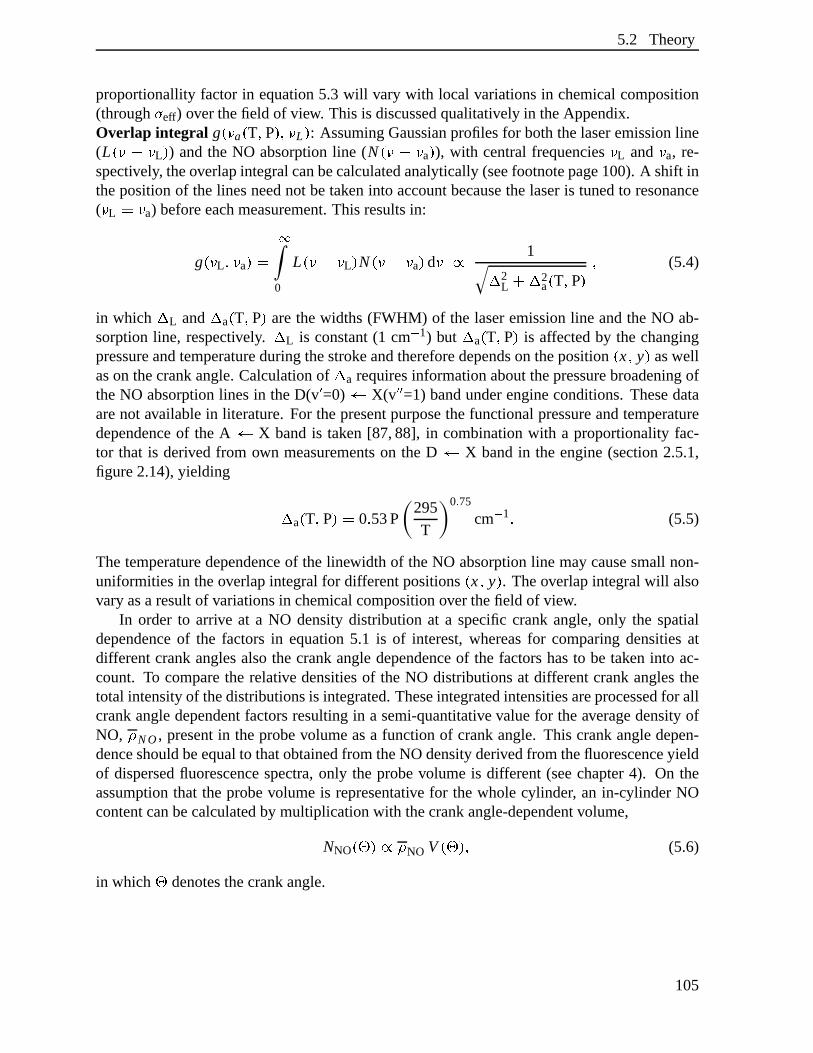
5.2 Theory
proportionallityfactorin equation5.3 will vary with local variationsin chemicalcomposition(throughØ eff) over thefield of view. This is discussedqualitatively in theAppendix.Overlap integral g Ì�Ò a Ì T Ñ PÏ©Ñ Ò L Ï : AssumingGaussianprofilesfor boththelaseremissionline(L Ì�Ò × Ò L Ï ) andthe NO absorptionline (N Ì�Ò × Ò aÏ ), with centralfrequenciesÒ L and Ò a, re-spectively, theoverlapintegralcanbecalculatedanalytically(seefootnotepage100).A shift inthepositionof thelinesneednot betakeninto accountbecausethelaseris tunedto resonance( Ò L Ë�Ò a) beforeeachmeasurement.This resultsin:
g ÌAÒ L Ñ Ò aÏ Ëê
0
L Ì�Ò × Ò L Ï N Ì�Ò × Ò aÏ dÒ æ 1ì 2
L Þ ì 2a Ì T Ñ PÏ
Ñ (5.4)
in whichì
L andì
a Ì T Ñ PÏ arethewidths (FWHM) of the laseremissionline andtheNO ab-sorptionline, respectively.
ìL is constant(1 cmí 1) but
ìa Ì T Ñ PÏ is affectedby the changing
pressureandtemperatureduringthestrokeandthereforedependson theposition Ì x Ñ y Ï aswellason thecrankangle.Calculationof
ìa requiresinformationaboutthepressurebroadeningof
theNO absorptionlines in theD(v Å =0) É X(v ÅdÅ =1) bandunderengineconditions.Thesedataarenot availablein literature.For thepresentpurposethefunctionalpressureandtemperaturedependenceof the A É X bandis taken [87,88], in combinationwith a proportionalityfac-tor that is derived from own measurementson the D É X bandin the engine(section2.5.1,figure2.14),yielding
ìa Ì T Ñ PÏ Ë 0 Ç 53P
295
T
0î 75
cmí 1 Ç (5.5)
Thetemperaturedependenceof the linewidth of theNO absorptionline maycausesmallnon-uniformitiesin theoverlapintegral for differentpositionsÌ x Ñ y Ï . Theoverlapintegral will alsovaryasa resultof variationsin chemicalcompositionover thefield of view.
In order to arrive at a NO densitydistribution at a specificcrankangle,only the spatialdependenceof the factorsin equation5.1 is of interest,whereasfor comparingdensitiesatdifferentcrankanglesalsothe crankangledependenceof the factorshasto be taken into ac-count. To comparethe relative densitiesof the NO distributionsat differentcrankanglesthetotal intensityof thedistributionsis integrated.Theseintegratedintensitiesareprocessedfor allcrankangledependentfactorsresultingin a semi-quantitativevaluefor theaveragedensityofNO, Ê NO, presentin theprobevolumeasa functionof crankangle. This crankangledepen-denceshouldbeequalto thatobtainedfrom theNO densityderivedfrom thefluorescenceyieldof dispersedfluorescencespectra,only the probevolumeis different(seechapter4). On theassumptionthat the probevolumeis representative for the whole cylinder, an in-cylinder NOcontentcanbecalculatedby multiplicationwith thecrankangle-dependentvolume,
NNO Ì4ô ÏLæ Ê NO V Ì4ô Ï©Ñ (5.6)
in which ô denotesthecrankangle.
105
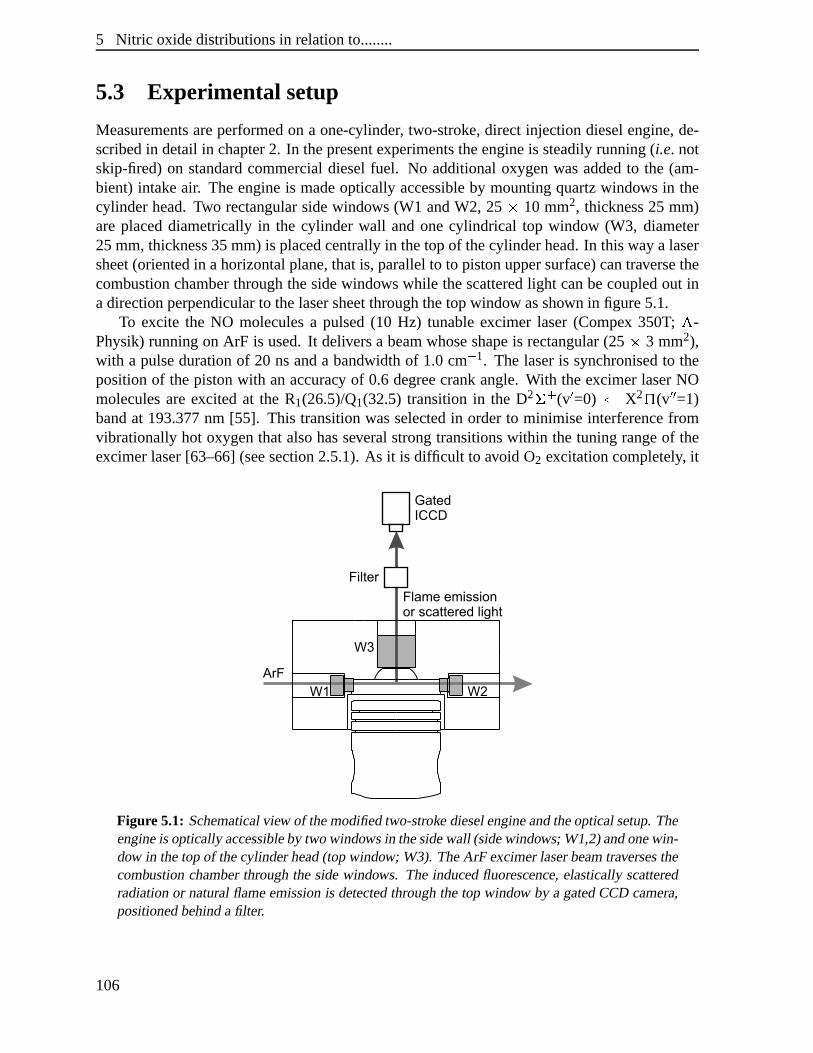
5 Nitric oxidedistributionsin relationto........
5.3 Experimental setup
Measurementsareperformedon a one-cylinder, two-stroke, direct injectiondieselengine,de-scribedin detail in chapter2. In thepresentexperimentstheengineis steadilyrunning(i.e. notskip-fired)on standardcommercialdieselfuel. No additionaloxygenwasaddedto the (am-bient) intake air. Theengineis madeoptically accessibleby mountingquartzwindows in thecylinder head.Two rectangularsidewindows (W1 andW2, 25 õ 10 mm2, thickness25 mm)areplaceddiametricallyin the cylinder wall andonecylindrical top window (W3, diameter25mm,thickness35mm) is placedcentrallyin thetopof thecylinderhead.In thiswaya lasersheet(orientedin ahorizontalplane,thatis, parallelto to pistonuppersurface)cantraversethecombustionchamberthroughthesidewindows while thescatteredlight canbecoupledout inadirectionperpendicularto thelasersheetthroughthetopwindow asshown in figure5.1.
To excite the NO moleculesa pulsed(10 Hz) tunableexcimer laser(Compex 350T; ö -Physik)runningon ArF is used.It deliversa beamwhoseshapeis rectangular(25 õ 3 mm2),with a pulsedurationof 20 nsanda bandwidthof 1.0 cmí 1. The laseris synchronisedto thepositionof thepistonwith anaccuracy of 0.6 degreecrankangle.With theexcimer laserNOmoleculesareexcited at the R1(26.5)/Q1(32.5) transitionin the D2 ï é (vÅ =0) É X2 ð (vÅdÅ =1)bandat 193.377nm [55]. This transitionwasselectedin orderto minimiseinterferencefromvibrationallyhot oxygenthatalsohasseveralstrongtransitionswithin the tuningrangeof theexcimerlaser[63–66](seesection2.5.1).As it is difficult to avoid O2 excitationcompletely, it
Figure5.1: Schematicalview of themodifiedtwo-stroke dieselengineandtheopticalsetup.Theengineis opticallyaccessibleby two windowsin thesidewall (sidewindows;W1,2)andonewin-dow in thetopof thecylinderhead(topwindow; W3). TheArF excimerlaserbeamtraversesthecombustionchamberthroughthesidewindows. The inducedfluorescence,elasticallyscatteredradiationor naturalflameemissionis detectedthroughthetop window by a gatedCCD camera,positionedbehindafilter.
106
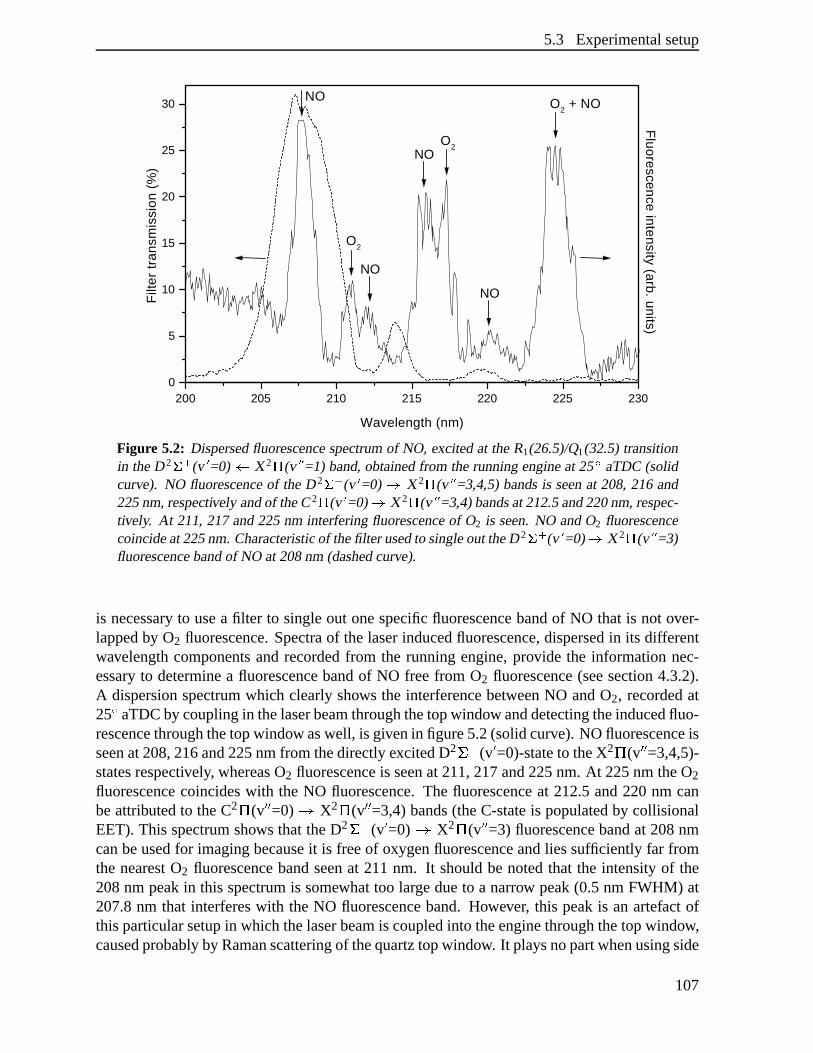
5.3 Experimentalsetup
200 205 210 215 220 225 2300
5
10
15
20
25
30
Filt
er t
rans
mis
sion
(%
)
Wavelength (nm)
NO
NO
NO
NO
O2 + NO
O2
O2
Fluorescence intensity (arb. units)
Figure 5.2: Dispersedfluorescencespectrumof NO, excitedat theR1(26.5)/Q1(32.5)transitionin theD 2 ÷�ø (v á =0) ù X 2 ú (v á á =1) band,obtainedfrom therunningengineat 25 û aTDC(solidcurve). NO fluorescenceof theD 2 ÷ ø (v á =0) ü X 2 ú (v á á =3,4,5)bandsis seenat 208,216and225nm,respectively andof theC2 ú (v á =0) ü X 2 ú (v á á =3,4)bandsat212.5and220nm,respec-tively. At 211,217and225nm interferingfluorescenceof O2 is seen.NO andO2 fluorescencecoincideat225nm. Characteristicof thefilter usedto singleouttheD 2 ÷ ø (v á =0) ü X 2 ú (v á á =3)fluorescencebandof NO at 208nm (dashedcurve).
is necessaryto usea filter to singleout onespecificfluorescencebandof NO that is not over-lappedby O2 fluorescence.Spectraof thelaserinducedfluorescence,dispersedin its differentwavelengthcomponentsandrecordedfrom the runningengine,provide the informationnec-essaryto determinea fluorescencebandof NO free from O2 fluorescence(seesection4.3.2).A dispersionspectrumwhich clearlyshows the interferencebetweenNO andO2, recordedat25Â aTDCby couplingin thelaserbeamthroughthetopwindow anddetectingtheinducedfluo-rescencethroughthetopwindow aswell, is givenin figure5.2(solidcurve). NO fluorescenceisseenat208,216and225nmfrom thedirectlyexcitedD2 ï é (v Å =0)-stateto theX2 ð (v ÅdÅ =3,4,5)-statesrespectively, whereasO2 fluorescenceis seenat 211,217and225nm. At 225nm theO2
fluorescencecoincideswith the NO fluorescence.The fluorescenceat 212.5and220 nm canbeattributedto theC2 ð (vÅdÅ =0) à X2 ð (v ÅdÅ =3,4)bands(theC-stateis populatedby collisionalEET). This spectrumshows that theD2 ï é (v Å =0) à X2 ð (vÅdÅ =3) fluorescencebandat 208nmcanbeusedfor imagingbecauseit is freeof oxygenfluorescenceandlies sufficiently far fromthe nearestO2 fluorescencebandseenat 211 nm. It shouldbe notedthat the intensityof the208nm peakin this spectrumis somewhattoo largedueto a narrow peak(0.5nm FWHM) at207.8nm that interfereswith the NO fluorescenceband. However, this peakis an artefact ofthisparticularsetupin which thelaserbeamis coupledinto theenginethroughthetopwindow,causedprobablyby Ramanscatteringof thequartztopwindow. It playsnopartwhenusingside
107
5 Nitric oxidedistributionsin relationto........
window illumination, insteadof topwindow illumination,asdonein theexperimentsdescribedbelow.
For themeasurementsof two-dimensionalimagesthelaserbeamis orientedin a horizontalsheet(0.5 mm thick) parallelto theuppersurfaceof the pistonat TDC. It is coupledinto thecombustionchamberthroughthelaserentrancewindow (W1) andcoupledout throughtheexitwindow (W2) (seefigure 5.1). The laserfrequency is manuallytunedto resonancewith theNO transitionbeforeeachmeasurement.Theensuingfluorescenceis coupledout in adirectionperpendicularto thelasersheetthroughthetop window (W3), anddetectedby a gated(50 ns)intensifiedCCD camera(ICCD-576G/RB-E;PrincetonInstruments)whoseoutputis digitisedandsentto a computerfor furtherprocessing.WhenrecordingNO fluorescencedistributions,acombinationof anarrow-bandfilter consistingof four highly reflectingmirrors(LaserOptik)andanormalincidence193nmlasermirror is usedin front of thecamerato singleoutanarrowfluorescencewavelengthbandcentredat 208nm. Thecharacteristicof this combination,alsogiven in figure 5.2 (dashedcurve), shows a transmissionof 30% at its centrewavelengthof207nm anda bandwidthof about5 nm FWHM. Thepeaksat 214and219.5nm arecausedbyotherinterferencemaximain thereflectionfilter. In thecaseof recordingtwo-dimensionalelas-tic scatteringdistributionsa filter transmitting193nm radiationis used.For themeasurementof bothdistributionsusingasinglelaserpulsetheimageswouldhaveto beobtainedsimultane-ously, because,dueto theirreproducibilityof thecombustion,thedistributionof NO moleculesandscatteringparticlesis expectedto bedifferentfor every cycle. However, if imagesareav-eragedover several enginecycles, cycle to cycle variationsare averagedout. Therefore,incasethatfluorescencedistributionsandelasticscatteringdistributionsareaveragedthey canberecordeddirectly aftereachother, asis donein thepresentexperiment.
Additionally, distributionsof thenaturalflameemissionareobtainedby recordingtheflameemissionthroughthetopwindow usingagatewidth of 200ns.
5.4 Resultsand Discussion
5.4.1 NO fluorescencedistrib utions
Raw data
Two-dimensionalNO fluorescencedistributionswererecordedusingthe208nmfilter describedabove by couplingin the laserbeamthroughthesidewindow anddetectingthe inducedfluo-rescencethroughthe top window, in a directionperpendicularto the laserbeam. In addition,distributionsof theelasticallyscatteredlaserradiationwererecordedimmediatelyaftertheNOfluorescencedistributions,usingafilter transmittingonly thelaserradiation.All imagesareav-eragedover25enginecyclesandrepresentanareawith adiameterof 25mm; theprobevolumeamountto principle25ýnõ 0 Ç 5 mm3, locatedat thepositionof thepistonuppersurfaceatTDC.The illuminatedpart of the CCD cameracorrespondsto an areaof 100 õ 100 pixels, so thespatialresolutionis 0 Ç 25 õ 0 Ç 25mm2. A seriesof eightNO fluorescencedistributionsrecordedat differentcrankanglesin thecombustionstroke is given in figure5.3. Thedistributionsarepresentedin a linear grey scalerangingfrom black (minimum intensity) to white (maximumintensity)andeachimageis individually scaled.The laserbeamtravels from right to left andfuel is injectedfrom thebottomof theimagesupwards.
108
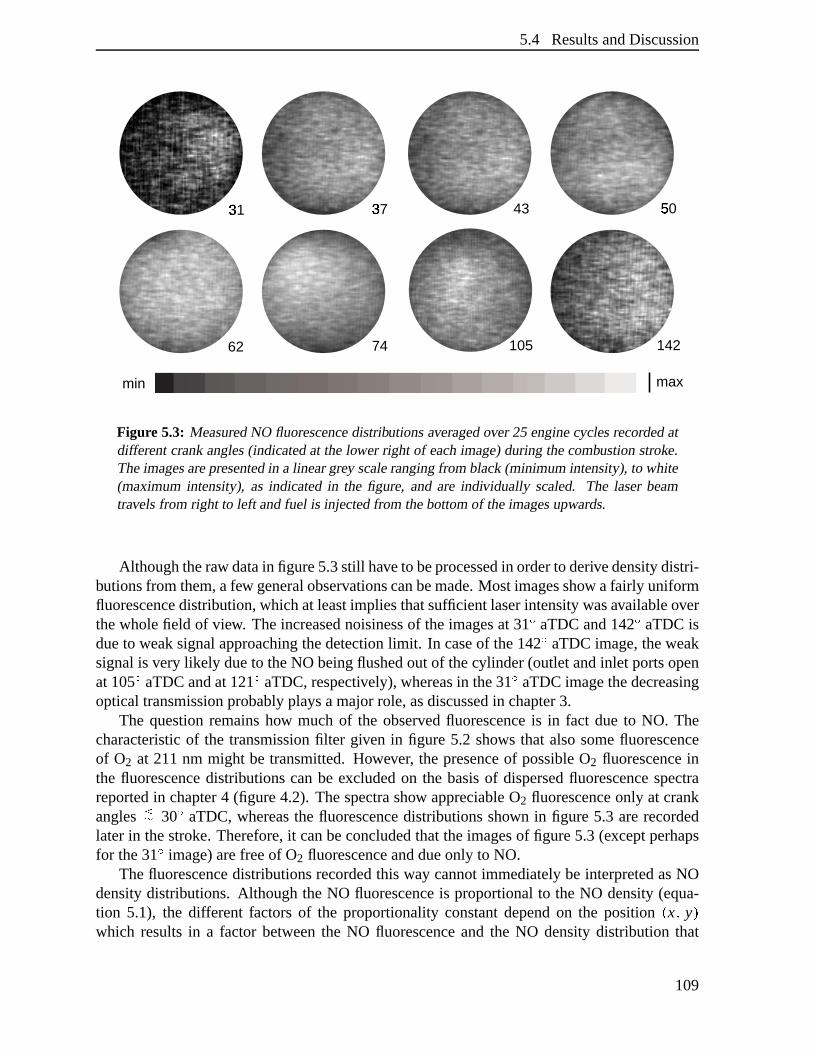
5.4 ResultsandDiscussion
maxmin
50þ
31ÿ
37ÿ
43
14262 74 105
Figure 5.3: MeasuredNO fluorescencedistributionsaveragedover 25 enginecyclesrecordedatdifferentcrankangles(indicatedat thelower right of eachimage)duringthecombustionstroke.Theimagesarepresentedin a lineargrey scalerangingfrom black(minimumintensity),to white(maximumintensity), as indicatedin the figure, and are individually scaled. The laserbeamtravelsfrom right to left andfuel is injectedfrom thebottomof theimagesupwards.
Althoughtheraw datain figure5.3still haveto beprocessedin orderto derivedensitydistri-butionsfrom them,afew generalobservationscanbemade.Most imagesshow afairly uniformfluorescencedistribution,whichat leastimpliesthatsufficient laserintensitywasavailableoverthewholefield of view. Theincreasednoisinessof theimagesat 31Â aTDCand142Â aTDCisdueto weaksignalapproachingthedetectionlimit. In caseof the142Â aTDCimage,theweaksignalis very likely dueto theNO beingflushedoutof thecylinder (outletandinlet portsopenat105Â aTDCandat121Â aTDC,respectively), whereasin the31Â aTDCimagethedecreasingopticaltransmissionprobablyplaysamajorrole,asdiscussedin chapter3.
The questionremainshow much of the observed fluorescenceis in fact due to NO. Thecharacteristicof the transmissionfilter given in figure 5.2 shows that alsosomefluorescenceof O2 at 211nm might be transmitted.However, the presenceof possibleO2 fluorescenceinthe fluorescencedistributionscanbe excludedon the basisof dispersedfluorescencespectrareportedin chapter4 (figure4.2). Thespectrashow appreciableO2 fluorescenceonly at crankangles ÃÄ 30Â aTDC,whereasthe fluorescencedistributionsshown in figure 5.3 arerecordedlaterin thestroke. Therefore,it canbeconcludedthattheimagesof figure5.3 (exceptperhapsfor the31Â image)arefreeof O2 fluorescenceanddueonly to NO.
Thefluorescencedistributionsrecordedthis way cannotimmediatelybe interpretedasNOdensitydistributions. Although the NO fluorescenceis proportionalto the NO density(equa-tion 5.1), the different factorsof the proportionalityconstantdependon the position Ì x Ñ y Ïwhich resultsin a factor betweenthe NO fluorescenceand the NO densitydistribution that
109
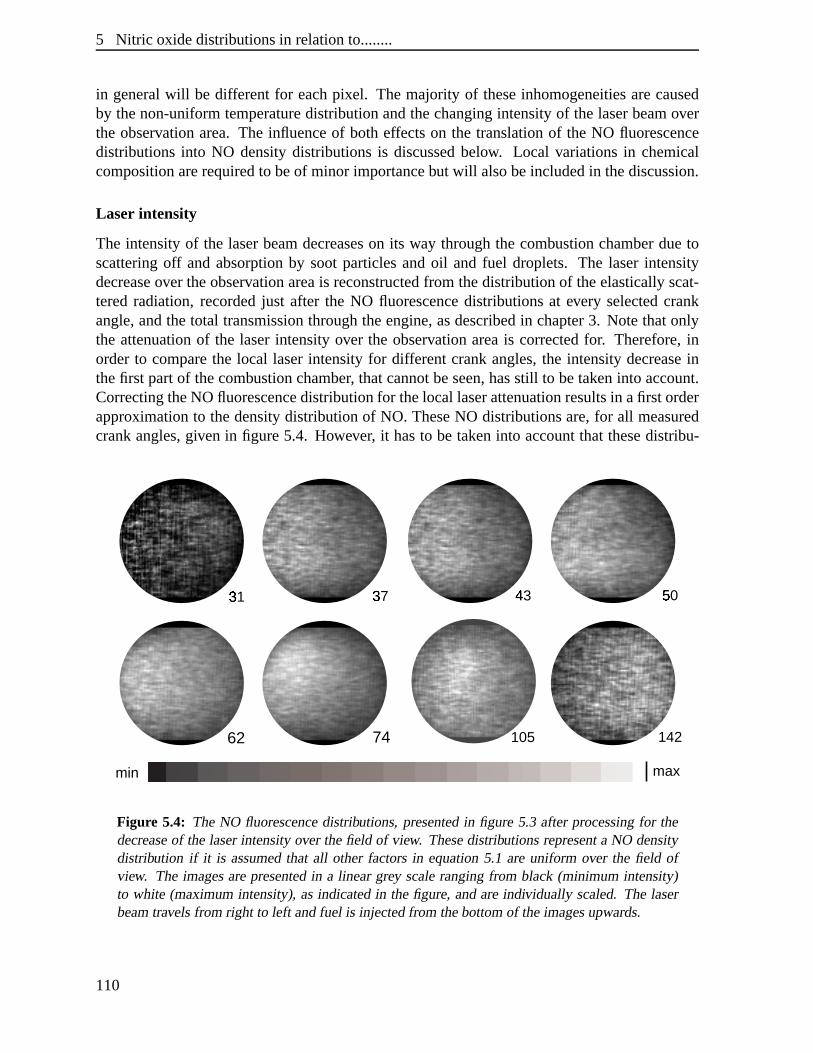
5 Nitric oxidedistributionsin relationto........
in generalwill be differentfor eachpixel. The majority of theseinhomogeneitiesarecausedby thenon-uniformtemperaturedistribution andthechangingintensityof the laserbeamoverthe observation area. The influenceof both effectson the translationof the NO fluorescencedistributions into NO densitydistributions is discussedbelow. Local variationsin chemicalcompositionarerequiredto beof minor importancebut will alsobeincludedin thediscussion.
Laser intensity
The intensityof the laserbeamdecreaseson its way throughthe combustionchamberduetoscatteringoff andabsorptionby sootparticlesandoil and fuel droplets. The laserintensitydecreaseover theobservationareais reconstructedfrom thedistributionof theelasticallyscat-teredradiation,recordedjust after the NO fluorescencedistributionsat every selectedcrankangle,andthetotal transmissionthroughtheengine,asdescribedin chapter3. Note thatonlythe attenuationof the laserintensityover the observation areais correctedfor. Therefore,inorderto comparethe local laserintensity for differentcrankangles,the intensitydecreaseinthefirst partof thecombustionchamber, thatcannotbeseen,hasstill to betakeninto account.CorrectingtheNO fluorescencedistributionfor thelocal laserattenuationresultsin afirst orderapproximationto thedensitydistribution of NO. TheseNO distributionsare,for all measuredcrankangles,given in figure5.4. However, it hasto be taken into accountthat thesedistribu-
maxmin
50�
31�
37�
43�
14262 74 105
Figure 5.4: The NO fluorescencedistributions,presentedin figure 5.3 after processingfor thedecreaseof the laserintensityover thefield of view. Thesedistributionsrepresenta NO densitydistribution if it is assumedthat all other factorsin equation5.1 areuniform over the field ofview. The imagesarepresentedin a linear grey scalerangingfrom black (minimum intensity)to white (maximumintensity),asindicatedin thefigure,andareindividually scaled.The laserbeamtravelsfrom right to left andfuel is injectedfrom thebottomof theimagesupwards.
110
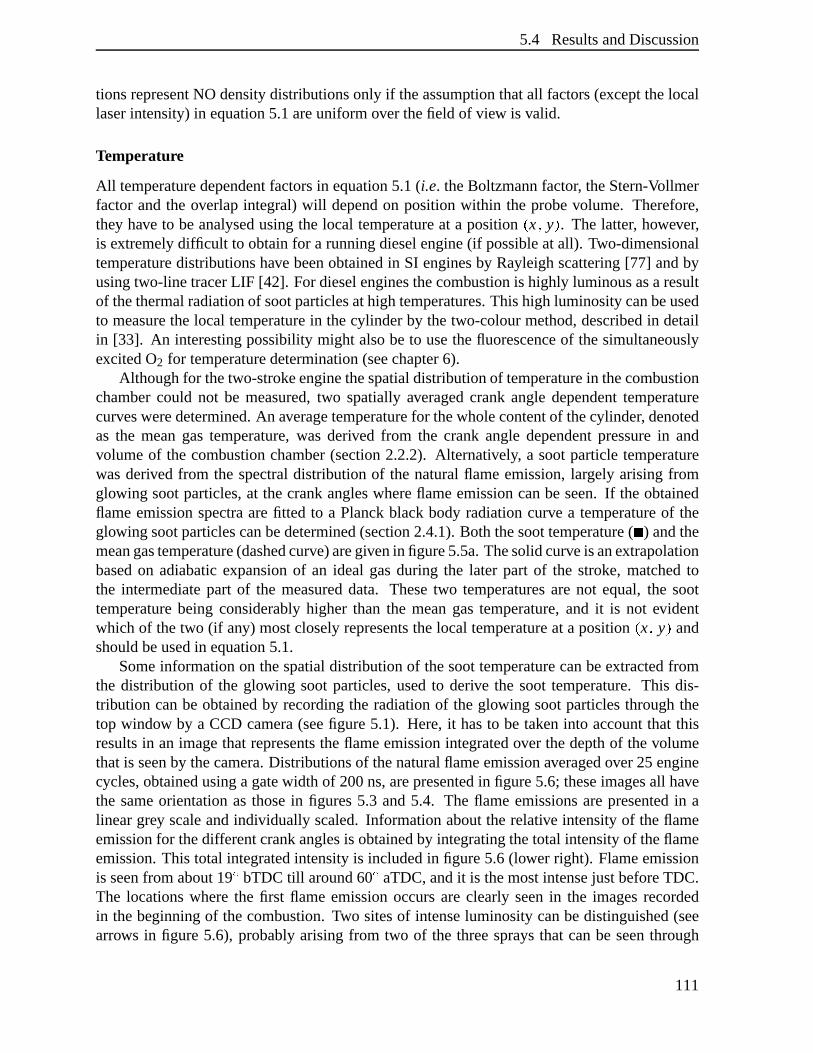
5.4 ResultsandDiscussion
tionsrepresentNO densitydistributionsonly if theassumptionthatall factors(exceptthelocallaserintensity)in equation5.1areuniformover thefield of view is valid.
Temperature
All temperaturedependentfactorsin equation5.1(i.e. theBoltzmannfactor, theStern-Vollmerfactorandthe overlapintegral) will dependon positionwithin the probevolume. Therefore,they have to beanalysedusingthe local temperatureat a position Ì x Ñ y Ï . The latter, however,is extremelydifficult to obtainfor a runningdieselengine(if possibleat all). Two-dimensionaltemperaturedistributionshave beenobtainedin SI enginesby Rayleighscattering[77] andbyusingtwo-line tracerLIF [42]. For dieselenginesthecombustionis highly luminousasaresultof thethermalradiationof sootparticlesathightemperatures.Thishigh luminositycanbeusedto measurethe local temperaturein thecylinder by thetwo-colourmethod,describedin detailin [33]. An interestingpossibilitymight alsobeto usethefluorescenceof thesimultaneouslyexcitedO2 for temperaturedetermination(seechapter6).
Althoughfor thetwo-strokeenginethespatialdistributionof temperaturein thecombustionchambercould not be measured,two spatially averagedcrank angledependenttemperaturecurvesweredetermined.An averagetemperaturefor thewholecontentof thecylinder, denotedas the meangastemperature,was derived from the crank angledependentpressurein andvolumeof the combustionchamber(section2.2.2). Alternatively, a sootparticletemperaturewasderived from the spectraldistribution of the naturalflameemission,largely arisingfromglowing sootparticles,at thecrankangleswhereflameemissioncanbe seen.If theobtainedflameemissionspectraarefitted to a Planckblack body radiationcurve a temperatureof theglowing sootparticlescanbedetermined(section2.4.1).Both thesoottemperature( À ) andthemeangastemperature(dashedcurve)aregivenin figure5.5a.Thesolidcurveisanextrapolationbasedon adiabaticexpansionof an ideal gasduring the later part of the stroke, matchedtothe intermediatepart of the measureddata. Thesetwo temperaturesare not equal, the soottemperaturebeing considerablyhigher than the meangastemperature,and it is not evidentwhich of thetwo (if any) mostcloselyrepresentsthelocal temperatureat a position Ì x Ñ y Ï andshouldbeusedin equation5.1.
Someinformationon thespatialdistribution of thesoottemperaturecanbeextractedfromthe distribution of the glowing sootparticles,usedto derive the soot temperature.This dis-tribution canbe obtainedby recordingthe radiationof the glowing sootparticlesthroughthetop window by a CCD camera(seefigure5.1). Here,it hasto be taken into accountthat thisresultsin an imagethat representstheflameemissionintegratedover thedepthof thevolumethatis seenby thecamera.Distributionsof thenaturalflameemissionaveragedover25 enginecycles,obtainedusinga gatewidth of 200ns,arepresentedin figure5.6; theseimagesall havethe sameorientationasthosein figures5.3 and5.4. The flameemissionsarepresentedin alineargrey scaleandindividually scaled.Informationaboutthe relative intensityof theflameemissionfor thedifferentcrankanglesis obtainedby integratingthetotal intensityof theflameemission.This total integratedintensityis includedin figure5.6(lower right). Flameemissionis seenfrom about19Â bTDC till around60Â aTDC,andit is themostintensejust beforeTDC.The locationswherethe first flameemissionoccursare clearly seenin the imagesrecordedin thebeginningof thecombustion. Two sitesof intenseluminositycanbedistinguished(seearrows in figure 5.6), probablyarisingfrom two of the threespraysthat canbe seenthrough
111
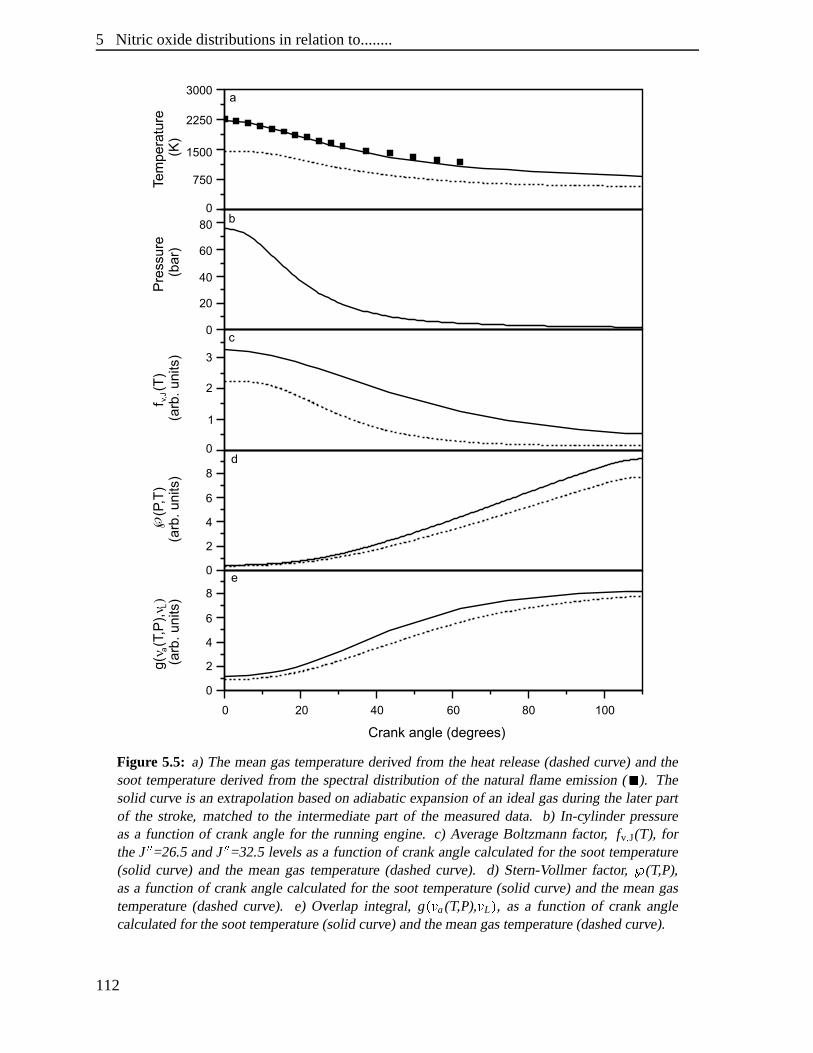
5 Nitric oxidedistributionsin relationto........
Figure 5.5: a) The meangastemperaturederived from theheatrelease(dashedcurve) andthesoottemperaturederived from the spectraldistribution of the naturalflameemission( À ). Thesolid curve is anextrapolationbasedon adiabaticexpansionof an idealgasduringthe laterpartof the stroke, matchedto the intermediatepart of the measureddata. b) In-cylinder pressureasa function of crankanglefor the runningengine. c) AverageBoltzmannfactor, fv � J(T), fortheJ á á =26.5andJ á á =32.5levelsasa functionof crankanglecalculatedfor thesoottemperature(solid curve) and the meangastemperature(dashedcurve). d) Stern-Vollmer factor, � (T,P),asa functionof crankanglecalculatedfor the soottemperature(solid curve) andthemeangastemperature(dashedcurve). e) Overlap integral, g ��� a(T,P),� L � , as a function of crank anglecalculatedfor thesoottemperature(solid curve) andthemeangastemperature(dashedcurve).
112
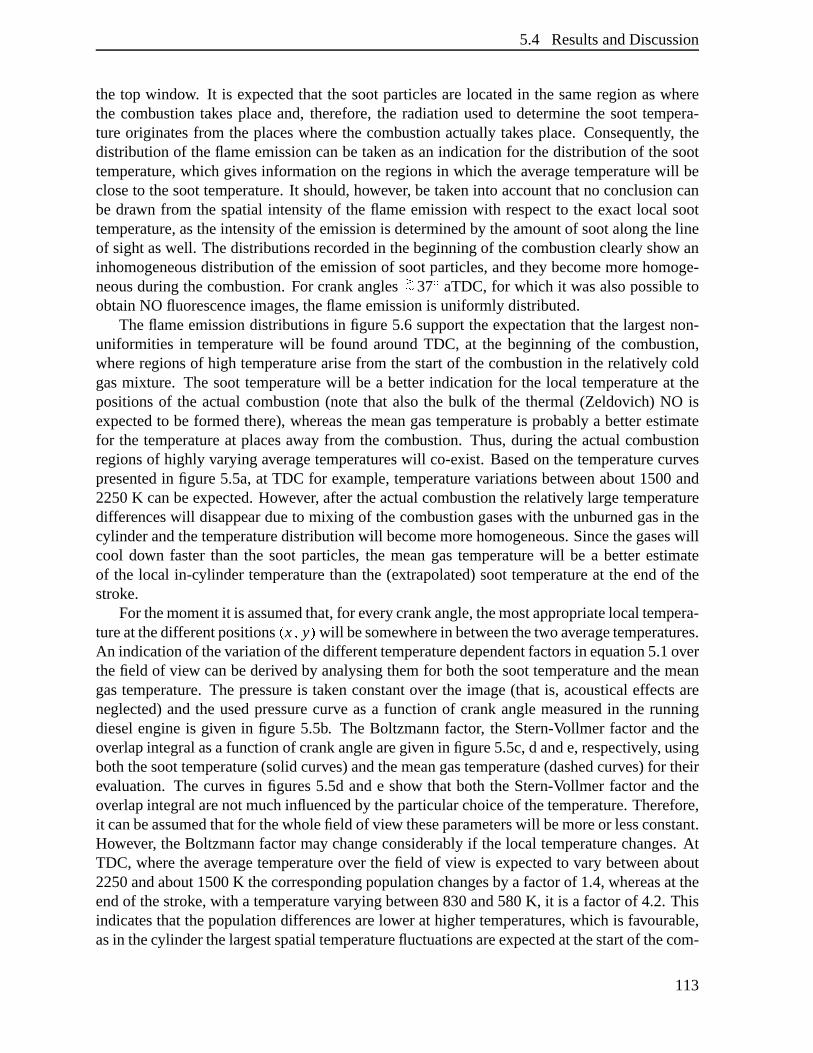
5.4 ResultsandDiscussion
the top window. It is expectedthat the sootparticlesarelocatedin the sameregion aswherethe combustiontakesplaceand, therefore,the radiationusedto determinethe soot tempera-ture originatesfrom the placeswherethe combustionactuallytakesplace. Consequently, thedistribution of theflameemissioncanbetakenasanindicationfor thedistribution of thesoottemperature,which givesinformationon theregionsin which theaveragetemperaturewill becloseto thesoottemperature.It should,however, betakeninto accountthatno conclusioncanbe drawn from the spatialintensityof the flameemissionwith respectto the exact local soottemperature,astheintensityof theemissionis determinedby theamountof sootalongthelineof sightaswell. Thedistributionsrecordedin thebeginningof thecombustionclearlyshow aninhomogeneousdistribution of theemissionof sootparticles,andthey becomemorehomoge-neousduringthecombustion. For crankangles ÆÄ 37Â aTDC,for which it wasalsopossibletoobtainNO fluorescenceimages,theflameemissionis uniformly distributed.
Theflameemissiondistributionsin figure5.6 supporttheexpectationthat the largestnon-uniformities in temperaturewill be found aroundTDC, at the beginning of the combustion,whereregionsof high temperaturearisefrom thestartof thecombustionin therelatively coldgasmixture. The soottemperaturewill be a betterindicationfor the local temperatureat thepositionsof the actualcombustion(note that alsothe bulk of the thermal(Zeldovich) NO isexpectedto be formedthere),whereasthemeangastemperatureis probablya betterestimatefor the temperatureat placesaway from the combustion. Thus,during the actualcombustionregionsof highly varyingaveragetemperatureswill co-exist. Basedon thetemperaturecurvespresentedin figure5.5a,at TDC for example,temperaturevariationsbetweenabout1500and2250K canbeexpected.However, aftertheactualcombustiontherelatively largetemperaturedifferenceswill disappeardueto mixing of thecombustiongaseswith theunburnedgasin thecylinderandthetemperaturedistributionwill becomemorehomogeneous.Sincethegaseswillcool down fasterthan the soot particles,the meangastemperaturewill be a betterestimateof the local in-cylinder temperaturethanthe (extrapolated)soottemperatureat the endof thestroke.
For themomentit is assumedthat,for everycrankangle,themostappropriatelocaltempera-tureatthedifferentpositionsÌ x Ñ y Ï will besomewherein betweenthetwoaveragetemperatures.An indicationof thevariationof thedifferenttemperaturedependentfactorsin equation5.1overthefield of view canbederivedby analysingthemfor boththesoottemperatureandthemeangastemperature.The pressureis taken constantover the image(that is, acousticaleffectsareneglected)andthe usedpressurecurve asa function of crankanglemeasuredin the runningdieselengineis given in figure 5.5b. The Boltzmannfactor, the Stern-Vollmer factorandtheoverlapintegralasafunctionof crankanglearegivenin figure5.5c,d ande,respectively, usingboththesoottemperature(solidcurves)andthemeangastemperature(dashedcurves)for theirevaluation. The curvesin figures5.5dande show that both the Stern-Vollmer factorandtheoverlapintegralarenotmuchinfluencedby theparticularchoiceof thetemperature.Therefore,it canbeassumedthatfor thewholefield of view theseparameterswill bemoreor lessconstant.However, theBoltzmannfactormaychangeconsiderablyif thelocal temperaturechanges.AtTDC, wheretheaveragetemperatureover thefield of view is expectedto vary betweenabout2250andabout1500K thecorrespondingpopulationchangesby a factorof 1.4,whereasat theendof thestroke,with a temperaturevaryingbetween830and580K, it is a factorof 4.2. Thisindicatesthatthepopulationdifferencesarelower at highertemperatures,which is favourable,asin thecylinderthelargestspatialtemperaturefluctuationsareexpectedatthestartof thecom-
113
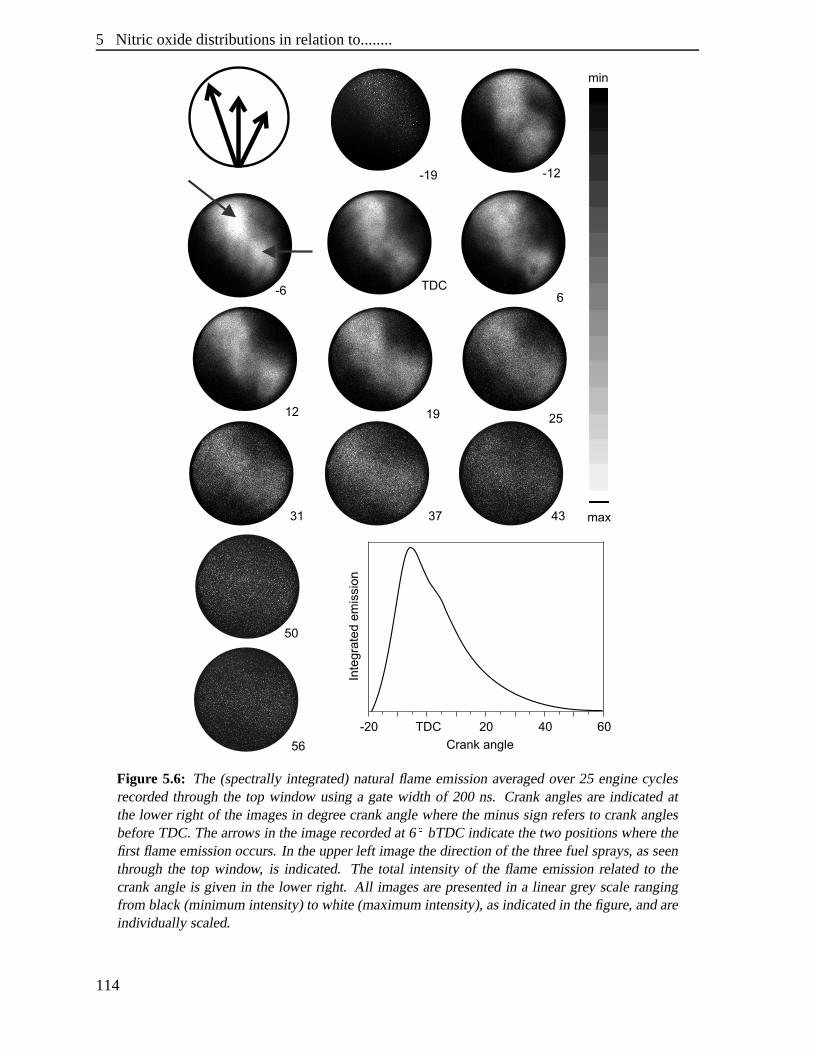
5 Nitric oxidedistributionsin relationto........
Figure 5.6: The (spectrallyintegrated)naturalflameemissionaveragedover 25 enginecyclesrecordedthroughthe top window usinga gatewidth of 200 ns. Crankanglesare indicatedatthe lower right of the imagesin degreecrankanglewheretheminussignrefersto crankanglesbeforeTDC. Thearrows in theimagerecordedat 6 û bTDC indicatethetwo positionswherethefirst flameemissionoccurs.In theupperleft imagethedirectionof thethreefuel sprays,asseenthroughthe top window, is indicated. The total intensityof the flame emissionrelatedto thecrankangleis given in the lower right. All imagesarepresentedin a linear grey scalerangingfrom black(minimumintensity)to white (maximumintensity),asindicatedin thefigure,andareindividually scaled.
114
5.4 ResultsandDiscussion
bustion,wherethetemperatureis highest.Whenthetemperaturedrops,towardstheendof thestroke, it is expectedto becomemorehomogeneousandto approachthemeangastemperature.
Thefluorescencedistributionsin figure5.3areobtainedlatein thecombustionstroke,afterthe actualcombustion. Becausethe temperatureis then expectedto be more or lesshomo-geneouslydistributed, it is assumedthat temperaturegradientsover the field of view are ofminor importance.Therefore,asafirst approximation,asingleuniformtemperatureis usedforinterpretationof theimages.Thisassumptionwill berelaxedlateron.
5.4.2 NO densitydistrib utions
Whenthe assumptionsaremadethat i) the temperaturedistribution over the field of view isuniform andii ) thefluorescencequenchingis homogeneous,theNO fluorescencedistributionsprocessedfor thelaserattenuationoverthefieldof view, asgivenin figure5.4,canbeinterpretedasNO densitydistributions. Theexperimentalerror, determinedfrom smallscalefluctuationspresentin the distributions,is about10%. By comparingthe measuredNO fluorescencedis-tributionswith the resultingNO densitydistributionsonly little differenceis seen.The mostconspicuousfeatureis thatat almostall crankanglesthe mostintensepart of the distributionis shiftedsomewhatalongthe x-axis towardsthesideof the laserexit window. Thenoisy im-agesat 31Â and142Â aTDC, discussedabove, will not be consideredfurther. In mostof theotherNO densitydistributionsin figure5.4a gradualincreasein NO intensityover thefield ofview is seenalongthe x-axis going from right to left. The gradientof the intensity increasebecomeslarger going from the37Â aTDC imageto the74Â aTDC image(i.e. with increasingcrankangle).However, at105Â aTDCthehighestintensityis shiftedsomewhatto themiddleoftheimage.To getsomefeelingfor theobservedintensitydifferencesover thefield of view, theintensitydifferencesof thedistributionat74Â aTDC,whicharerelatively large,areanalysedinmoredetail.Theaverageintensityof thisNO distributiondiffersby about20%from thelowestandhighestintensitiesthat areseenat the sideof the entranceandexit window, respectively.Similar, mostly somewhat lower, valuesresult for the otherdensitydistributions. Within theapproximationof a uniform temperaturedistribution it canbe concludedthat the NO densityvariesover thefield of view by maximally40%.
BeforeinterpretingtheNO densitydistributions,it is appropriateto getsomeinsightin theerrorsthatmight be introducedby theassumptionsmadein the translationof theNO fluores-cencedistributionsinto NO densitydistributions.Firstly, it wasassumedthatthetemperaturebehomogeneouslydistributedoverthefield of view. Secondly, theexactcompositionof thecylin-dercontentswassupposedto berelatively unimportant.It would neverthelessbeinterestingtohaveanideaof theinfluencethatanon-uniformtemperatureand/orcompositionof thecylindercontentswould have on theobtainedNO densitydistribution. In otherwords,to which extentcanvariationsin NO fluorescenceintensitybe explainedby variationsin temperatureand/orcomposition?To getsomefeelingaboutthis, it is calculatedwhatthevariationsin temperatureor compositionwouldhave to beto fully explain theobservedNO fluorescencedistributionsoffigure5.4 (which have alreadybeenprocessedfor the laserattenuation)if theNO distributionwouldbeuniform.
115
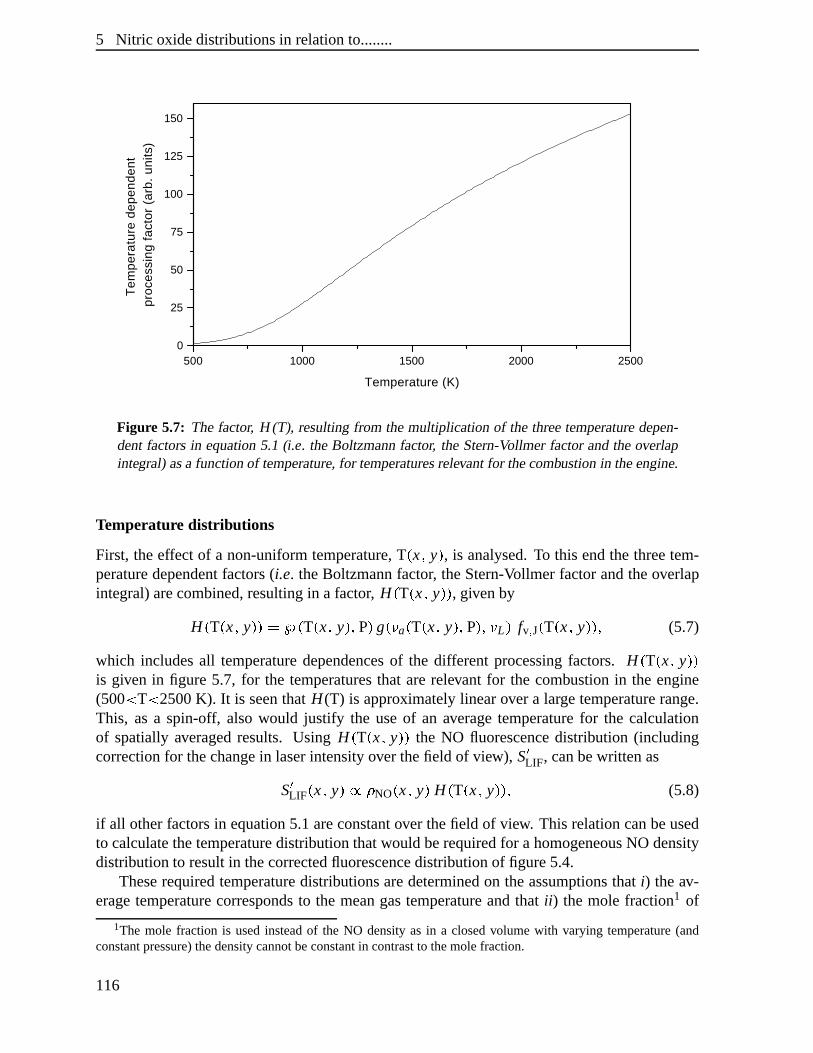
5 Nitric oxidedistributionsin relationto........
500 1000 1500 2000 25000
25
50
75
100
125
150T
empe
ratu
re d
epen
dent
pr
oces
sing
fac
tor
(arb
. un
its)
Temperature (K)
Figure 5.7: Thefactor, H (T), resultingfrom themultiplicationof the threetemperaturedepen-dentfactorsin equation5.1 (i.e. theBoltzmannfactor, theStern-Vollmer factorandtheoverlapintegral) asa functionof temperature,for temperaturesrelevantfor thecombustionin theengine.
Temperature distrib utions
First, theeffect of a non-uniformtemperature,T Ì x Ñ y Ï , is analysed.To this endthe threetem-peraturedependentfactors(i.e. theBoltzmannfactor, theStern-Vollmer factorandtheoverlapintegral)arecombined,resultingin a factor, H Ì T Ì x Ñ y Ï4Ï , givenby
H Ì T Ì x Ñ y Ï4Ï Ë Ð Ì T Ì x Ñ y ÏñÑ PÏ g ÌAÒ a Ì T Ì x Ñ y Ï©Ñ PÏ©Ñ Ò L Ï fvÓ J Ì T Ì x Ñ y Ï4ÏñÑ (5.7)
which includesall temperaturedependencesof the differentprocessingfactors. H Ì T Ì x Ñ y Ï4Ïis given in figure 5.7, for the temperaturesthat arerelevant for the combustionin the engine(500 T 2500K). It is seenthat H (T) is approximatelylinearover a largetemperaturerange.This, as a spin-off, also would justify the useof an averagetemperaturefor the calculationof spatially averagedresults. Using H Ì T Ì x Ñ y Ï4Ï the NO fluorescencedistribution (includingcorrectionfor thechangein laserintensityover thefield of view), SÅLIF, canbewritten as
SÅLIF Ì x Ñ y Ï�ænÊ NO Ì x Ñ y Ï H Ì T Ì x Ñ y Ï4ÏñÑ (5.8)
if all otherfactorsin equation5.1areconstantover thefield of view. This relationcanbeusedto calculatethetemperaturedistribution thatwouldberequiredfor a homogeneousNO densitydistribution to resultin thecorrectedfluorescencedistributionof figure5.4.
Theserequiredtemperaturedistributionsaredeterminedon theassumptionsthat i) theav-eragetemperaturecorrespondsto the meangastemperatureandthat ii ) the mole fraction1 of
1The mole fraction is usedinsteadof the NO densityas in a closedvolumewith varying temperature(andconstantpressure)thedensitycannotbeconstantin contrastto themolefraction.
116
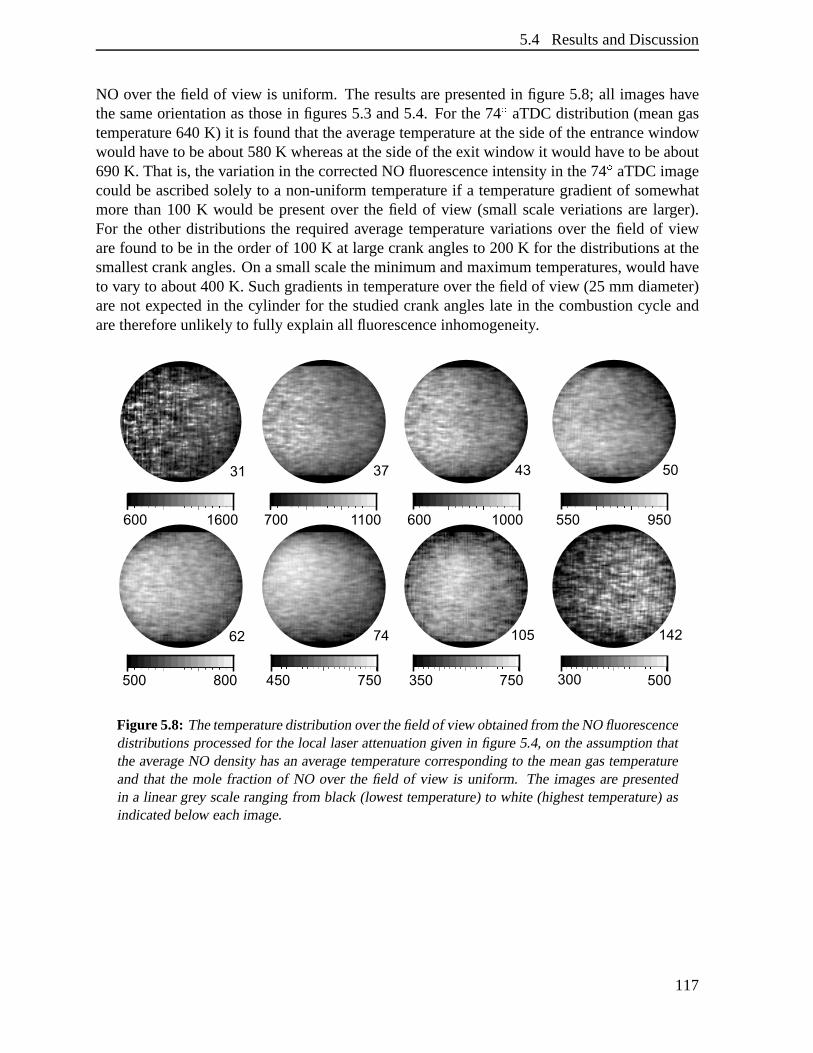
5.4 ResultsandDiscussion
NO over thefield of view is uniform. The resultsarepresentedin figure5.8; all imageshavethesameorientationasthosein figures5.3 and5.4. For the74Â aTDCdistribution (meangastemperature640K) it is foundthattheaveragetemperatureat thesideof theentrancewindowwouldhave to beabout580K whereasat thesideof theexit window it wouldhave to beabout690K. Thatis, thevariationin thecorrectedNO fluorescenceintensityin the74Â aTDCimagecouldbe ascribedsolely to a non-uniformtemperatureif a temperaturegradientof somewhatmore than100 K would be presentover the field of view (small scaleveriationsare larger).For the otherdistributionsthe requiredaveragetemperaturevariationsover the field of viewarefoundto bein theorderof 100K at largecrankanglesto 200K for thedistributionsat thesmallestcrankangles.On a smallscaletheminimumandmaximumtemperatures,would haveto vary to about400K. Suchgradientsin temperatureover thefield of view (25 mm diameter)arenot expectedin the cylinder for thestudiedcrankangleslate in thecombustioncycle andarethereforeunlikely to fully explainall fluorescenceinhomogeneity.
Figure5.8: Thetemperaturedistributionoverthefieldof view obtainedfromtheNO fluorescencedistributionsprocessedfor the local laserattenuationgiven in figure5.4,on theassumptionthattheaverageNO densityhasanaveragetemperaturecorrespondingto themeangastemperatureand that the mole fraction of NO over the field of view is uniform. The imagesarepresentedin a lineargrey scalerangingfrom black(lowesttemperature)to white (highesttemperature)asindicatedbelow eachimage.
117
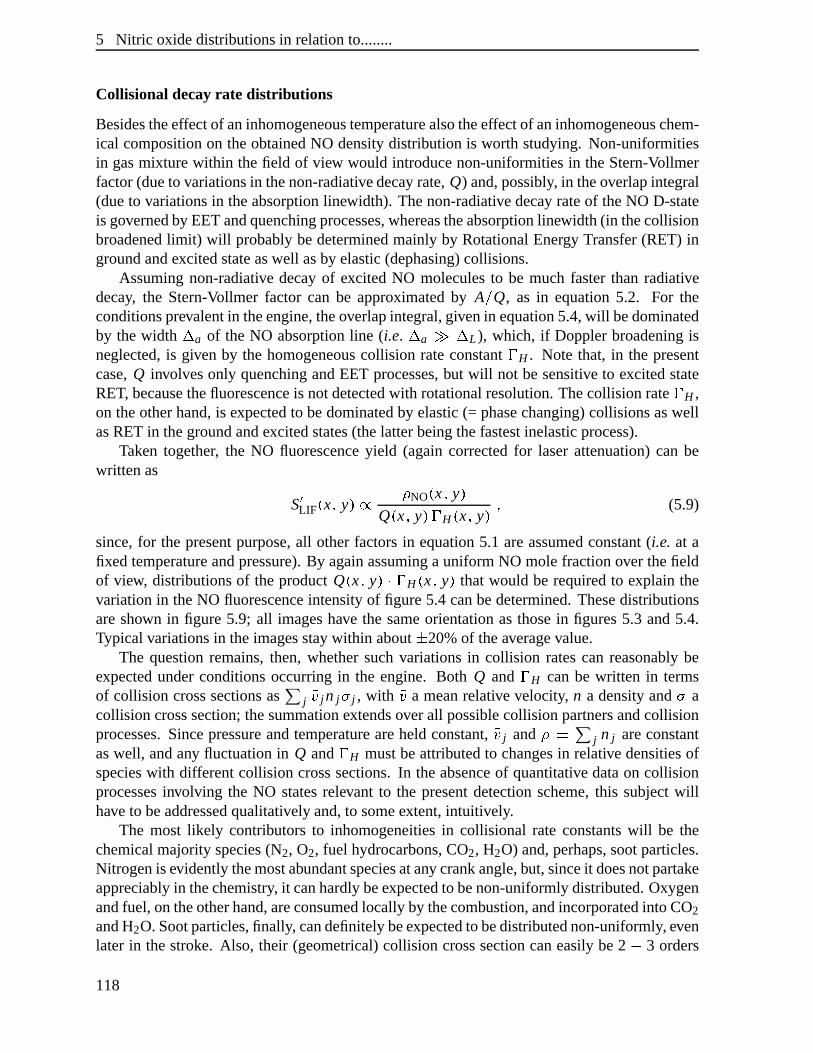
5 Nitric oxidedistributionsin relationto........
Collisional decayrate distrib utions
Besidestheeffectof aninhomogeneoustemperaturealsotheeffectof aninhomogeneouschem-ical compositionon theobtainedNO densitydistribution is worth studying.Non-uniformitiesin gasmixturewithin thefield of view would introducenon-uniformitiesin theStern-Vollmerfactor(dueto variationsin thenon-radiativedecayrate,Q) and,possibly, in theoverlapintegral(dueto variationsin theabsorptionlinewidth). Thenon-radiativedecayrateof theNO D-stateis governedby EETandquenchingprocesses,whereastheabsorptionlinewidth (in thecollisionbroadenedlimit) will probablybedeterminedmainly by RotationalEnergy Transfer(RET) ingroundandexcitedstateaswell asby elastic(dephasing)collisions.
Assumingnon-radiative decayof excited NO moleculesto be much fasterthan radiativedecay, the Stern-Vollmer factor can be approximatedby AÚ Q, as in equation5.2. For theconditionsprevalentin theengine,theoverlapintegral,givenin equation5.4,will bedominatedby thewidth
ìa of the NO absorptionline (i.e.
ìa ç ì
L ), which, if Dopplerbroadeningisneglected,is given by the homogeneouscollision rateconstant H . Note that, in the presentcase,Q involvesonly quenchingandEET processes,but will not besensitive to excitedstateRET, becausethefluorescenceis notdetectedwith rotationalresolution.Thecollision rate H ,on theotherhand,is expectedto bedominatedby elastic(= phasechanging)collisionsaswellasRET in thegroundandexcitedstates(thelatterbeingthefastestinelasticprocess).
Taken together, the NO fluorescenceyield (againcorrectedfor laserattenuation)can bewrittenas
SÅLIF Ì x Ñ y ÏDæ Ê NO Ì x Ñ y ÏQ Ì x Ñ y Ï� H Ì x Ñ yÏ Ñ (5.9)
since,for the presentpurpose,all otherfactorsin equation5.1 areassumedconstant(i.e. at afixedtemperatureandpressure).By againassuminga uniform NO molefractionover thefieldof view, distributionsof theproductQ Ì x Ñ y Ï �� H Ì x Ñ y Ï thatwould be requiredto explain thevariationin theNO fluorescenceintensityof figure5.4canbedetermined.Thesedistributionsareshown in figure 5.9; all imageshave the sameorientationasthosein figures5.3 and5.4.Typical variationsin theimagesstaywithin about� 20%of theaveragevalue.
The questionremains,then,whethersuchvariationsin collision ratescan reasonablybeexpectedunderconditionsoccurringin the engine. Both Q and H canbe written in termsof collision crosssectionsas j �â j n j
Øj , with �â a meanrelative velocity, n a densityand Ø a
collisioncrosssection;thesummationextendsoverall possiblecollisionpartnersandcollisionprocesses.Sincepressureandtemperatureareheldconstant,�â j and Ê Ë j n j areconstantaswell, andany fluctuationin Q and H mustbeattributedto changesin relative densitiesofspecieswith differentcollision crosssections.In theabsenceof quantitative dataon collisionprocessesinvolving the NO statesrelevant to the presentdetectionscheme,this subjectwillhave to beaddressedqualitatively and,to someextent,intuitively.
The most likely contributors to inhomogeneitiesin collisional rate constantswill be thechemicalmajority species(N2, O2, fuel hydrocarbons,CO2, H2O) and,perhaps,sootparticles.Nitrogenis evidentlythemostabundantspeciesatany crankangle,but, sinceit doesnotpartakeappreciablyin thechemistry, it canhardlybeexpectedto benon-uniformlydistributed.Oxygenandfuel, ontheotherhand,areconsumedlocally by thecombustion,andincorporatedinto CO2
andH2O.Sootparticles,finally, candefinitelybeexpectedto bedistributednon-uniformly, evenlater in thestroke. Also, their (geometrical)collision crosssectioncaneasilybe2 × 3 orders
118
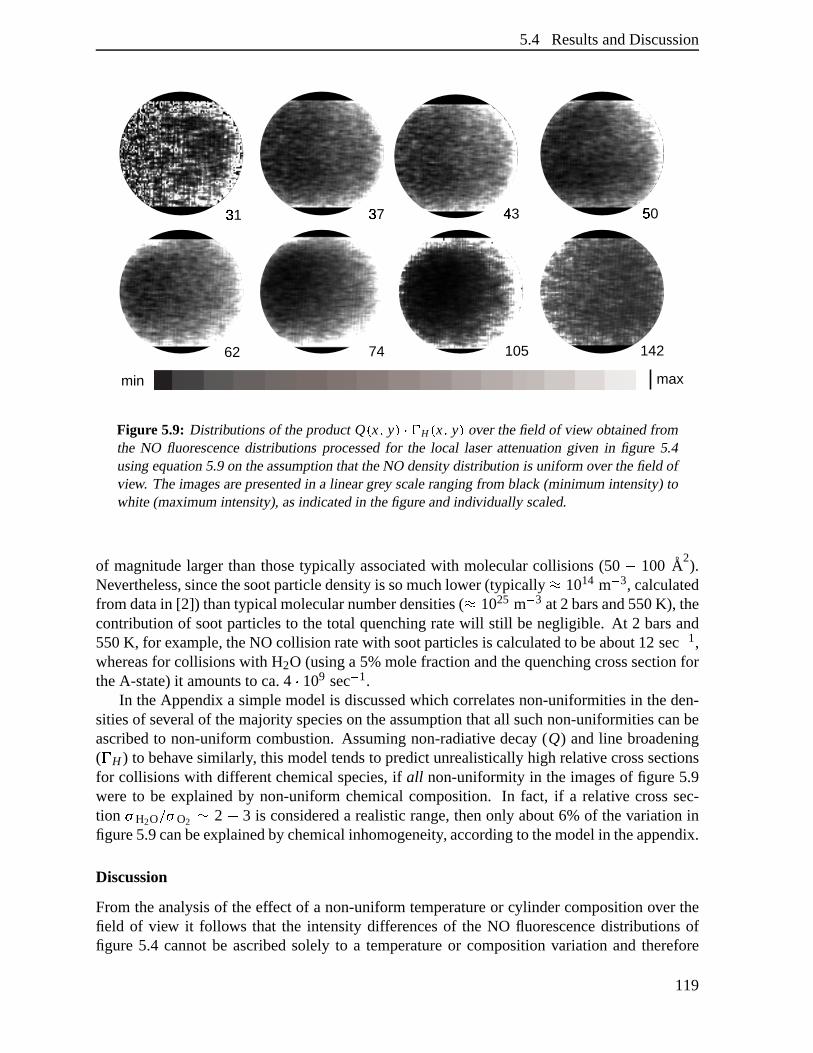
5.4 ResultsandDiscussion
maxmin
50�
31�
37�
43�
14262 74 105
Figure 5.9: Distributionsof theproductQ � x � y����� H � x � y� over thefield of view obtainedfromthe NO fluorescencedistributions processedfor the local laserattenuationgiven in figure 5.4usingequation5.9on theassumptionthattheNO densitydistribution is uniformover thefield ofview. Theimagesarepresentedin a lineargrey scalerangingfrom black(minimumintensity)towhite (maximumintensity),asindicatedin thefigureandindividually scaled.
of magnitudelarger thanthosetypically associatedwith molecularcollisions(50 × 100 A2).
Nevertheless,sincethesootparticledensityis somuchlower(typically Ö 1014 mí 3, calculatedfrom datain [2]) thantypicalmolecularnumberdensities(Ö 1025 mí 3 at2 barsand550K), thecontribution of sootparticlesto the total quenchingratewill still benegligible. At 2 barsand550K, for example,theNO collisionratewith sootparticlesis calculatedto beabout12 secí 1,whereasfor collisionswith H2O (usinga 5%molefractionandthequenchingcrosssectionfortheA-state)it amountsto ca.4 � 109 secí 1.
In theAppendixa simplemodelis discussedwhich correlatesnon-uniformitiesin theden-sitiesof severalof themajorityspecieson theassumptionthatall suchnon-uniformitiescanbeascribedto non-uniformcombustion. Assumingnon-radiative decay(Q) andline broadening( H ) to behavesimilarly, this modeltendsto predictunrealisticallyhigh relativecrosssectionsfor collisionswith differentchemicalspecies,if all non-uniformityin the imagesof figure5.9were to be explainedby non-uniformchemicalcomposition. In fact, if a relative crosssec-tion Ø H2OÚ Ø O2 � 2 × 3 is considereda realisticrange,thenonly about6% of thevariationinfigure5.9canbeexplainedby chemicalinhomogeneity, accordingto themodelin theappendix.
Discussion
Fromtheanalysisof theeffect of a non-uniformtemperatureor cylinder compositionover thefield of view it follows that the intensitydifferencesof the NO fluorescencedistributionsoffigure 5.4 cannotbe ascribedsolely to a temperatureor compositionvariationand therefore
119
5 Nitric oxidedistributionsin relationto........
mustarise,at leastpartly, from a non-uniformNO distribution. However, botheffectswill stillhave someinfluenceon theobservedNO densitydistribution. Thecombustionwill introducelargenon-uniformitiesover thefield of view aroundTDC ascanbeseenin theobservedflameemissions(figure 5.6). In regionswherethe combustiontakesplacethe temperaturewill berelatively high and relatively large amountsof combustion products,including NO, will bepresent.Dueto mixing, temperatureanddensitydifferencesover thecombustionchamberwillbecomesmallertowardsthe end of the stroke, but still areaswith a higher temperatureandhigherdensityof combustionproductscanexist. Thus,althoughtheintensitydifferencesseenin theNO densitydistribution indicatethat regionsexist with a somewhathigheror lower NOdensity, thedensitydifferencescanbesmalleror largerthanobservedin thedistributionsasdueto temperatureandcompositionvariationsthe amountof NO canbe under- or overestimated.In general,for mostcrankanglestheNO densityappearsto besomewhathigherat theleft sideof theimageswheretheprobevolumeintersectsoneof thefuel sprays(number1 in figure2.1).
5.4.3 Reproducibility
The seriesof NO densitydistributionspresentedin figure 5.4 is only oneexample,showingNO densitydistributionsobtainedbetween31Â aTDC and142Â aTDCduringoneenginerun.To getsomeinformationaboutthereproducibilityof theresults,NO fluorescencedistributionsand correspondingelasticscatteringdistributions were obtainedfor several different enginerunsat two successive days.Theseresultswereevaluatedin theway describedabove in orderto obtaindensitydistributionsof NO. Four representative seriesof NO densitydistributions,eachconsistingof distributionsobtainedat four differentcrankanglesaveragedover25enginecycles(62Â , 74Â , 105Â and142Â aTDC)arepresentedin figure5.10;all imageshave thesameorientationasthosein figures5.3and5.4. It shouldbenotedfrom thestartthatthedistributionspresentedin figure5.10arerecordedunderdifferentconditions(fuel, compressionratio,injectororientation)thanthoseof figure5.4.
By comparingthe four seriesof figure5.10only little differencesareseen,indicatingthataveragedistributionsobtainedfrom differentenginerunsreproducewell. Although it cannotbeseendirectly from theimages,alsotheintensitiesof theimagesat a specificcrankangleareof thesameorderof magnitude.Themostconspicuousfeaturein almostall distributionsis aslightly higherintensityat theright handsideof theimage.Theimagesdonotshow significantchangesin thedistributionof theNO densityasafunctionof crankangle.Thedifferencesin thedetailsof theimagesin eachcolumncanbeattributedto theirreproducibilityof thecombustionitself. In principle theseimagesrepresenta NO densitydistribution that is similar to the NOdensitydistributionsin figure5.4.
Intensity differencesover the field of view in thesedistributions are similar (maximally20%) to thoseobservedin thedistributionsof figure5.4. Consequently, thevariationsin tem-peratureor compositionthatarerequiredto explaintheobservedNO distributionsof figure5.10by auniformNO distributionaresimilar to thosefoundfor theimagespresentedin figure5.4.
120
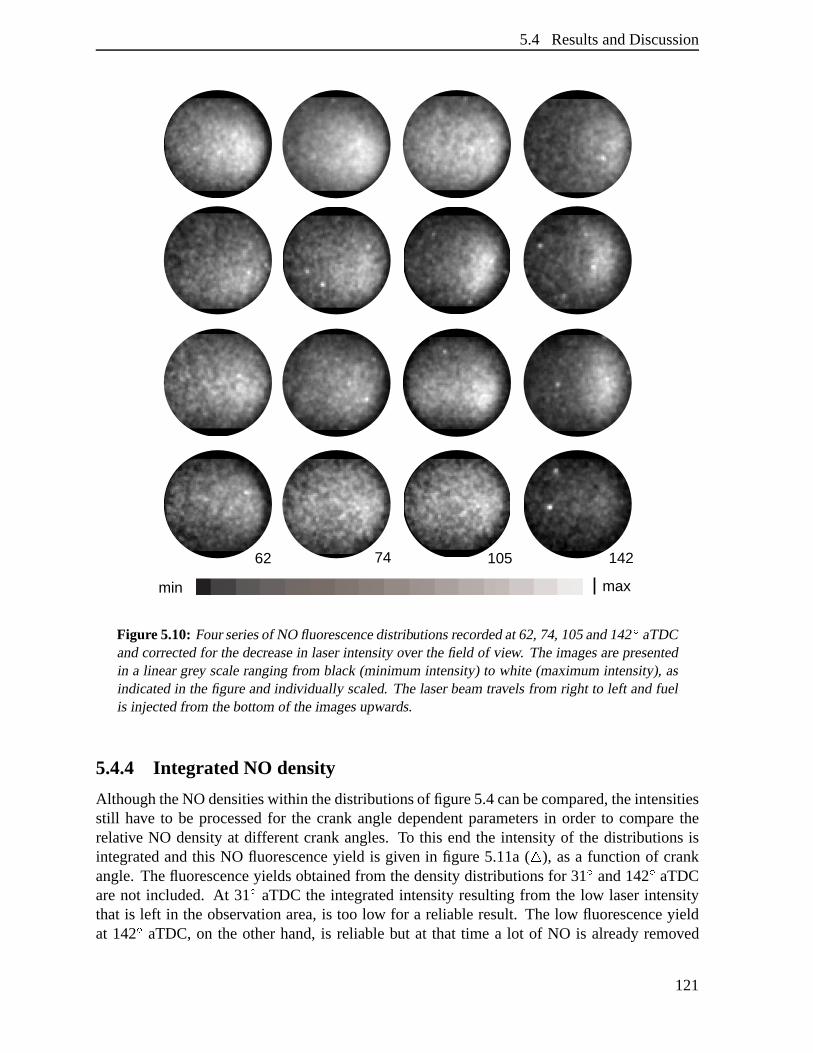
5.4 ResultsandDiscussion
maxmin
14262 74 105
Figure5.10: Fourseriesof NO fluorescencedistributionsrecordedat62,74,105and142û aTDCandcorrectedfor thedecreasein laserintensityover thefield of view. Theimagesarepresentedin a lineargrey scalerangingfrom black(minimumintensity)to white (maximumintensity),asindicatedin thefigureandindividually scaled.Thelaserbeamtravels from right to left andfuelis injectedfrom thebottomof theimagesupwards.
5.4.4 Integrated NO density
AlthoughtheNO densitieswithin thedistributionsof figure5.4canbecompared,theintensitiesstill have to be processedfor the crankangledependentparametersin order to comparetherelative NO densityat differentcrankangles.To this endthe intensityof the distributionsisintegratedandthis NO fluorescenceyield is given in figure 5.11a(� ), asa function of crankangle.Thefluorescenceyieldsobtainedfrom thedensitydistributionsfor 31Â and142Â aTDCarenot included. At 31Â aTDC the integratedintensityresultingfrom the low laserintensitythat is left in theobservationarea,is too low for a reliableresult. The low fluorescenceyieldat 142Â aTDC, on the otherhand,is reliablebut at that time a lot of NO is alreadyremoved
121
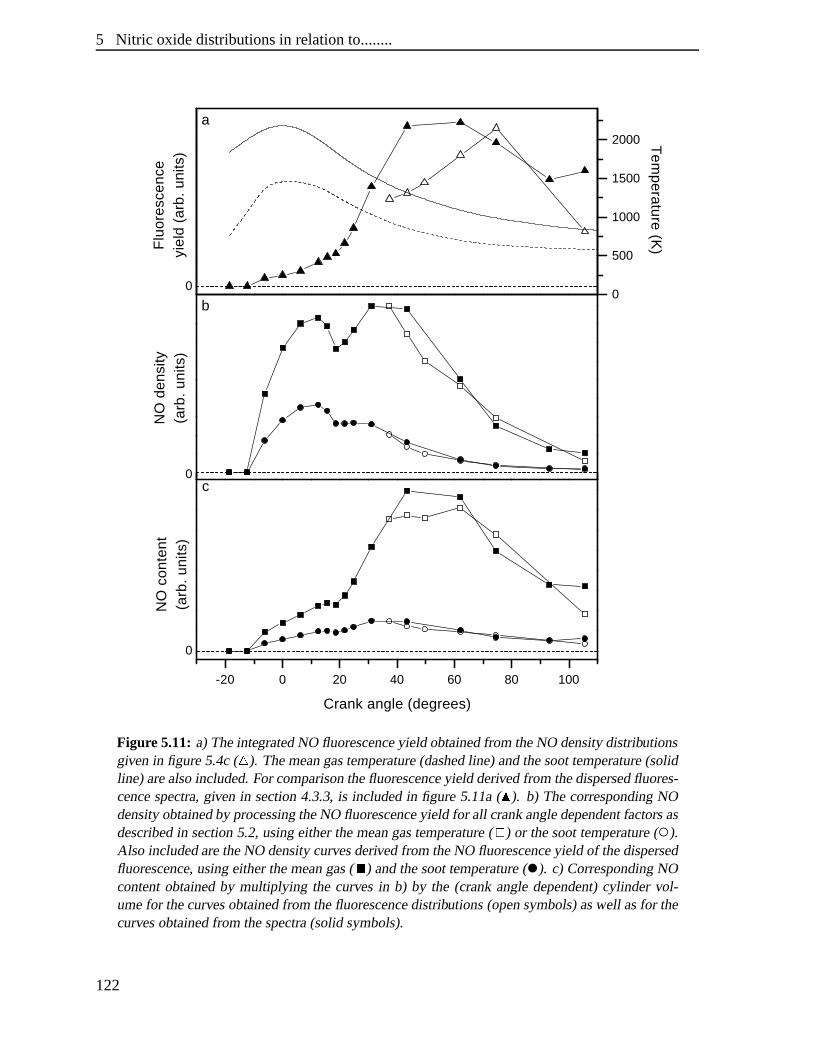
5 Nitric oxidedistributionsin relationto........
-20 0 20 40 60 80 100
c
NO
con
tent
(arb
. un
its)
Crank angle (degrees)
0
0
0
b
NO
den
sity
(arb
. un
its)
a
Flu
ores
cenc
eyi
eld
(arb
. uni
ts)
0
500
1000
1500
2000 Tem
perature (K)
Figure5.11: a)TheintegratedNO fluorescenceyield obtainedfrom theNO densitydistributionsgivenin figure5.4c(� ). Themeangastemperature(dashedline) andthesoottemperature(solidline) arealsoincluded.For comparisonthefluorescenceyield derivedfrom thedispersedfluores-cencespectra,given in section4.3.3,is includedin figure5.11a( � ). b) ThecorrespondingNOdensityobtainedby processingtheNO fluorescenceyield for all crankangledependentfactorsasdescribedin section5.2,usingeitherthemeangastemperature( Á ) or thesoottemperature( ).Also includedaretheNO densitycurvesderivedfrom theNO fluorescenceyield of thedispersedfluorescence,usingeitherthemeangas( À ) andthesoottemperature( ). c) CorrespondingNOcontentobtainedby multiplying the curves in b) by the (crankangledependent)cylinder vol-umefor thecurvesobtainedfrom thefluorescencedistributions(opensymbols)aswell asfor thecurvesobtainedfrom thespectra(solid symbols).
122
5.4 ResultsandDiscussion
from thecylinderby thescavengingprocess.Althoughthisfluorescenceyield curveis obtainedwith a differentsetupincludinga differentprobevolume,it is similar to thefluorescenceyieldcurve that is obtainedby integratingtheareabelow theNO fluorescencepeaksin a dispersedfluorescencespectrum(seechapter4). For comparisonthe fluorescenceyield curve derivedfrom the dispersedfluorescencespectra,given in chapter4, (measuredundernearlythe sameconditions)is includedin figure5.11a( � ).
Justcomparingthefluorescenceyield curvesfor thedifferentcrankanglesis deceptive, asthey areobtainedfrom the NO distributions,which areonly processedfor the laserintensitydecreaseover the field of view. For a propercomparisonthe fluorescenceyield curve hastobe translatedinto an in-cylinder NO densitycurve, taking into accountall crankangledepen-dentfactors(includingthelaserintensitydecreasein thefirst, invisible,partof thecombustionchamber),asdescribedin section5.2. Most of the factorsusedin the translationarethesamefor bothfluorescenceyields,but thepathsof thelaserbeamandinducedfluorescencearequitedifferentresultingin a differentapproachfor the processingof the laserandfluorescenceat-tenuation,eventhoughthesameextinctioncoefficient is used.In theprocessingboththemeangastemperatureandthe soot temperatureareused. The effect of usingan averagetempera-ture (ratherthana local temperature)on thederivedNO densitywill bediscussedbelow. Forcomparisonboth temperaturecurvesareincludedin figure 5.11a;the pressurecurve is givenin figure5.5a. In figure5.11btheNO densitycurve evaluatedfor both themeangastempera-ture ( Á ) andthesoottemperature( ), is given. TheNO contentcurvesthatarederived fromthedensitycurvesundertheassumptionthat theprobevolumeis representative for thewholecylinder content(equation5.6) aregivenin figure5.11c. In addition,theNO densityandNOcontentcurvesfor both themeangas( À ) andthesoottemperature( ) resultingfrom thedis-persedfluorescencespectraarealsogivenfor comparisonin figures5.11bandc, respectively.A comparisonof thecurvesin figures5.11bandc shows thatthecurvesobtainedfrom theNOfluorescencedistributions(opensymbols)arevery similar to thoseobtainedfrom the spectra(solid symbols). However, NO densitiescould not be obtainedfrom NO fluorescencedistri-butionsfor crankangles ÃÄ 35Â aTDC asthe laserintensityleft in the observation areais tooweak.
The fact that thecurvesderived from thedispersedfluorescencespectraandfrom the2D-distributionsshow aboutthe sameshapeindicatesthat both methodsyield consistentresultsfor the in-cylinder NO densityor content. The main advantageof the dispersedfluorescencespectrais that they can be recordedby coupling in the laserbeamthroughthe top windowso that the laserbeamentersthe observation areaimmediately. Therefore,in-cylinder NOdensitiescanbe determinedfor all crankangles,whereasin the caseof the imagesonly NOfluorescencecanbeobtainedfor crankangles ÆÄ 35Â aTDCbecauseof thelackof laserintensityin theobservationareaat lower crankangles.In addition,for crankangles ÃÄ 30Â aTDCalsosomeO2 fluorescencewill interferein the images. On the otherhand,the NO fluorescencedistributionsoriginatefrom awell definedplaneinsidethecombustionchamber. Consequently,the fluorescencedistributionscontainspatialinformationaboutthe NO moleculesinside thecombustionchamber, in contrastto thespectrathatrepresenttheintegratedfluorescenceof theprobevolume. But to arrive at theNO densitydistribution bothhave to beprocessedfor localdifferencesin in-cylinderconditionswhicharemainly causedby thevariationin laserintensityandthetemperaturegradients.
Beforesomeconclusionsaredrawn from the shapeof the curvesin figure 5.11aboutthe
123
5 Nitric oxidedistributionsin relationto........
total NO density/contentin thecylinder asa functionof crankangle,it shouldberealisedthatneitherthecurveobtainedfrom themeangastemperaturenor thecurve from thesoottempera-turerepresentsthe‘real’ NO densitycurve. Probablythemostappropriateaveragetemperaturewill be in betweenboth temperaturesandcanevenchangefrom thesoottemperatureat TDCto themeangastemperatureat theendof thestroke. This leadsto theconclusionthatalthoughbothNO densitycurveshave a similar shape,they graduallycanchangefrom oneto theotherwhengoingto largercrankanglesandsothey canhaveasomewhatdifferentshape.In addition,it is necessaryto haveanideaof theinfluenceof theuseof anaveragetemperatureinsteadof alocal temperaturein theprocessingof the integratedfluorescenceyield. Becausethetempera-turedependentfactorsin theproportionalityfactorbetweenthefluorescenceyield andtheNOdensity(equation5.1)are,in general,nota linearfunctionof temperature,theuseof anaveragetemperaturewill introduceanerrorin theNO distributionor density.
Two differentcasesof temperaturevariationscanbedistinguishedin dealingwith thisprob-lem: i) relatively largetemperaturedifferences(typically in theorderof 700K) canbeexpectedin thebeginningof thecombustionbetweenareaswheretheactualcombustionoccursandtheareasof unburnedgas,whereasii ) smallerfluctuationsdueto turbulencecanbe expectedev-erywhere. For the processingof the integratedfluorescenceyield the two casesin principlereferto yieldsobtainedduringtheactualcombustion(i) andafterit (ii ). However, althoughthelocal temperatureduring theactualcombustionis expectedto vary considerably, this doesnotnecessarilyimply thatalsothe temperatureat thepositionswheretheNO is present,andthusfluorescenceis obtainedfrom, will vary by the sameamount. The NO formationis expectedto startat the relatively high temperaturesitesat the edgeof the flame. After that it will mixwith the colderair in the cylinder. Therefore,in the early part of the stroke, the presenceofNO will bebiasedto areasat a relatively high temperatureandthe local temperaturethat is tobeusedwill show smallervariationsthanthe temperaturedifferencesthatareexpectedfor thewholecylindercontentat thatcrankangle.
An estimateof theerrorthat is madeby usingtheaveragetemperaturein thetranslationofthe NO fluorescenceyield into a NO densitycanbe derived from H Ì T Ï , the factor includingall temperaturedependencesof equation5.1, given in figure 5.7. This curve shows a moreor lesslinear behaviour for temperaturesbetween800 and2250K. This indicatesthat in thistemperaturerangetheeffect of usingtheaveragetemperatureon the total NO densitywill besmall. It is estimatedthatin thecaseof variationsof about500K in this temperaturerange,thetotal NO density, derivedby usingtheaveragetemperature,may locally beabout5% to 10%too low, for temperaturevariationsof only 100K it wouldbeatmost2%too low. However, fortemperaturesbelow 800K a variationof 100K givesanerrorthatcanriseto about10%for anaveragetemperatureof 500K. (Note,thattheseerrorsarein thesameorderastheexperimentalerror.)
This impliesfor theNO curvesat thestartof thecombustion,wherelargerfluctuationsareexpected,thatboththeuseof thesoottemperatureandthemeangastemperatureasanaveragetemperatureareestimatedto yield NO densitiesthatareto beabout10%too low comparedtotheNO densitiesderivedby usinga local temperature.At theendof thecombustionstrokeonlysmall temperaturevariationsareexpected.Usingthesoottemperatureasaveragetemperatureinsteadof thelocal temperaturewould givealmostno variationin theNO density. However, ifthemeangastemperature,which is below 800K for crankangles ÆÄ 50Â aTDC, is used,it isestimatedthat thederivedNO densityis about10%too low comparedto theNO densitythat
124
5.5 Conclusion
wouldbederivedby usinga local temperature.In the interpretationof the NO curves presentedin figure 5.11 theseremarksabout the
temperatureshouldbe taken into account.Assumingthat in the beginningof the combustionthe temperaturewill be closerto the soottemperaturewhereasat the endof the stroke it willbecloserto themeangastemperature,it canbeconcludedfrom thecurvesin figure5.11b,thattheNO densityin theprobevolumeincreasesthroughoutthecombustionstroke till somewherebetween20 and50Â aTDC.Theendof thedensityincreasedependson thetemperaturethat isusedin thederivation.Thesubsequentdecreasein NOdensityin theprobevolumeis largelydueto theexpandingvolumeof thecylinder. This is illustratedby theNO contentcurvespresentedin figure5.11c,whichshow anincreasein theamountof NO upto about50Â aTDCafterwhichit seemsto decreaseagain.This however, might besomewhatmisleadingasit dependson thetemperatureused.A moreextensivediscussionabouttheshapeof thecurvesin relationto thecombustionprocesscanbefoundin chapter4, section4.3.3.
5.5 Conclusion
Two-dimensionalnitric oxide (NO) fluorescencedistributionscouldbeobtainedfor crankan-gles ÆÄ 35Â aTDC,for lower crankanglesthe laserintensityleft in theobservationareais toolow. ThemeasuredNO fluorescencedistributionsareprocessedfor thechangein laserintensityover the field of view, resultingin a first orderapproximationof the NO densitydistribution.By assumingall otherfactorsinvolved in the relationbetweenNO fluorescenceandNO den-sity to be constantover thefield of view, thesedistributionscanbe interpretedasNO densitydistributions.
Theresultsarediscussedwith anemphasison theinfluenceof aninhomogeneousdistribu-tion of temperatureand/orchemicalcomposition(quenching)overthefield of view. It is arguedthat the intensitydifferencesseenin the NO densitydistributionscannotbe explainedsolelyby a temperatureor compositionvariation that might occurover the field of view, althoughthey will havesomeinfluenceon theobservedNO densitydistribution. Therefore,theintensitydifferencesthat arefound areascribedto variationsin the NO density, althoughthey may beunder- or overestimateddueto temperatureand/orcompositionvariations.
The integratedintensityof theNO fluorescencedistributionsis usedasa relative measurefor theamountof NO presentinsidethecylinder. To comparetheamountsof NO throughoutthe stroke they are processedfor the changingin-cylinder conditions(pressure,temperatureandlaserradiationintensity)usingtwo differenttemperaturecurves. Theshapeof thecurvesis discussedwith anemphasison the effect of theuncertaintiesin temperature.The resultingsemi-quantitative NO density/contentcurvesarecomparedto similar curvesderivedfrom NOdispersedfluorescencespectra(chapter4). They show goodagreementfor thepartof thestrokefor whichNO distributionscouldbeobtained.This indicatesthatbothmethodsyield consistentresultson theamountof in-cylinderNO.
125
5 Nitric oxidedistributionsin relationto........
Appendix
Non-uniformitiesin the laser-inducedNO fluorescenceyield, that remainafter the laseratten-uation over the field of view hasbeencorrectedfor, neednot be due to a non-uniformNOdistribution. Instead,they couldarisefrom, for example,a non-uniformtemperaturedistribu-tion (discussedin the main text) or non-uniformcollisional relaxationprocesses.This latteraspectwill bediscussedhere.
Collisional energy redistribution entersthe fluorescenceyield in two ways(equation5.1):via the Stern-Vollmer factor, Ð , andvia the overlapintegral, g Ì�Ò a Ñ Ò L Ï . For the caseat hand,thenon-radiativedecayrateQ in theStern-Vollmer factoris expectedto bedominatedby EET(D à A), but theNO absorptionlinewidth
ì Ò a will bedeterminedmainly by RET in groundandexcited statesandby elasticcollisions. (Note that, sincethe fluorescenceis not detectedwith rotationalresolution,RET andelasticcollisionsdo not affect the Stern-Vollmer factor.)Theefficiency of all thesecollision processesdependson thecollision partners.Therefore,ifthe collision partners(otherchemicalspecies)arenon-uniformlydistributed,even a uniformNO densitywouldgive riseto aninhomogeneousfluorescenceyield.
In orderto isolatetheeffectof suchaninhomogeneouscollisionpartnerdistribution, it willherebe assumedthat temperatureandpressure(and thereforealso the total density, nT ) areuniformover thefield of view. Writing2
Q Ëj�â j n j
Øj Ñ (5.10)
with �â theaveragerelativevelocityandthesumextendingoverall possiblecollisionpartnersofaNO molecule,then j n j Ë nT Ë constant, andspatialvariationsin non-radiativedecayratemustbe dueto varying chemicalcomposition,involving specieswith different �â j and/or Ø j .Sinceonly anorder-of-magnitudeestimateis of interesthere,variationsin �â j will beneglected(scalewith ò reducedmass) and
Q Ë �â nTj
f jØ
j with n j Ë f j nT (5.11)
( f j is avolumefraction,with j f j Ë 1). For thenon-radiativedecayonly themostabundantchemicalspecieswill beof importance,thatis, N2, O2, H2O, CO2 and‘fuel’. Then
Q Ë �â nT f N2Ø
N2 Þ f O2Ø
O2 Þ f H2OØ
H2O Þ f CO2Ø
CO2 Þ f fuelØ
fuel Ç (5.12)
Subsequently, it will beassumedthatnon-uniformitiesin chemicalcompositionarisefromthenon-uniformnatureof the combustion. If that is the case,thenthe local volumefractionsof severalchemicalspecieswill becorrelated.For instance,if combustionlocally reducestheamountof O2, the local concentrationsof H2O andCO2 will be larger. Assumingcompletecombustionof analkanefuel would imply
2CnH2né
2 Þ Ì 3n Þ 1Ï O2 ×�à 2n CO2 Þ Ì 2n Þ 2Ï H2O Ñ (5.13)
2Thefollowing discussionwill bein termsof thenon-radiativedecayrateQ, but a similar reasoningholdsfortheeffectivecollision rate � thatdeterminestheNO absorptionlinewidth.
126
5.5 Conclusion
or, for n not too small,
2CnH2n Þ 3n O2 ×Pà 2n CO2 Þ 2n H2O Ç (5.14)
Fromthis equationit follows that(taking2CnH2n � 2n CH2)
f H2O Ë f CO2 Ë f�i
fuel × f fuel and f N2 Ë f�i
N2Ñ (5.15)
wherethesuperscriptÌ i Ï indicatesaninitial value(beforecombustion). f O2 canbedeterminedfrom thenormalisationcondition.Furthermore,it will beassumedthat
ØH2O Ë Ø CO2 Ë Ø fuel Ë a Ø O2 and Ø N2 Ë Ø O2 Ç (5.16)
This mainly servesto reducethenumberof freeparametersin themodel,andis basedon theideathatthenumberof internaldegreesof freedomof thecollisionpartnerwill providearoughindicationof its efficiency in collisionalenergy redistribution. For quenchingof theNO A-statefluorescence,for example,a Ö 2 × 3 [71]3. With theseassumptionsit follows that
Q Ë �â nTØ
O2 f�i
N2 Þ f O2 Þ 2a f�i
fuel × a f fuel Ç (5.17)
Usingtheinitial values f�i
CO2 Ë f�i
H2O Ë 0, thenormalisationcondition j f j Ë j f�i Ë 1
canberewrittenas f fuel Ë f O2 × f�i
O2 Þ f�i
fuel, (usingrelation5.15)sothat
Q Ë �â nTØ
O2 f�i
N2 Þ Ì 1 × aÏ f O2 Þ a Ì f�i
fuel Þ f�i
O2Ï Ç (5.18)
This equationallows to relatedifferencesin quenchingrate to differencesin oxygenvolumefraction f O2: If Q[2] Ë"! Q[1] then
f [2]O2 Ë
a
1 × a Þ f�i
N2 Ì#! × 1Ï Þ ! f [1]O2Ç (5.19)
Or, in otherwords,if acertainvariationin NO fluorescenceyield wouldhaveto beascribedto avariationin non-radiativedecayconstant(ratherthanto avariationin NO density),this formulaallowsto relatetherequiredvariationin quenchingcrosssectionto avariationin oxygenvolumefraction (underthe assumptionsof the model,of course). As an example,figure 5.12 showsì
f O2 Ë f [2]O2× f [1]
O2asa function of the relative collision crosssectiona Ë Ø
H2OÚ Ø O2 for
severalvaluesof !�Ë Q[2] Ú Q[1], for theinitial conditions
f�i
N2 Ë 0 Ç 74 Ñ f�i
O2 Ë 0 Ç 175 and f�i
fuel Ë 0 Ç 085 Ç (5.20)
Q[1] is understoodto representanaveragevalueover thefield of view, and f [1]O2 Ë 0 Ç 10 is taken
(typical oxygencontentin the exhaustgases[2]). The vertical rangein the figure hasbeenlimited to thepossiblerangeof f [2]
O2 $ Ì 0 % f�i
O2Ï , but in practicethevariationwill probablystay
3Although for this examplealso & N2 ' & O2, this is not expectedto be the casefor non-radiative collisionaldecayof the NO D-state,sincehereD ( A EET providesan additionaldecaychannelfor which N2 hasbeenshown to beveryeffective [82].
127
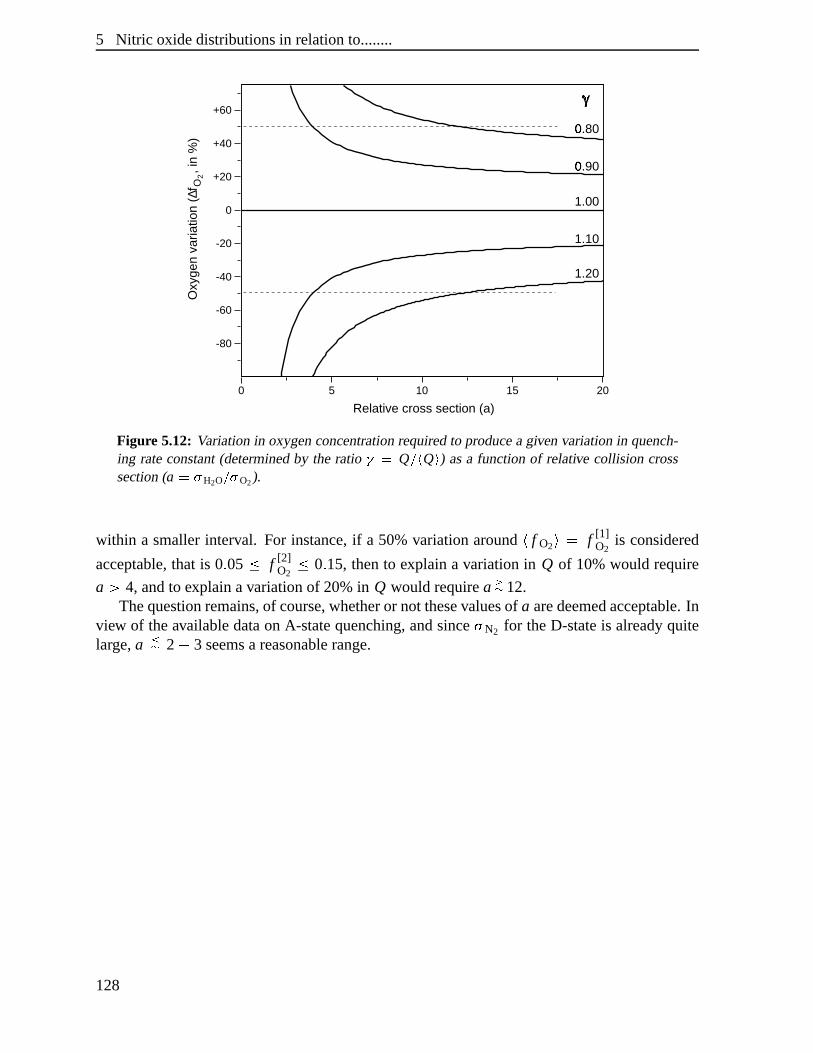
5 Nitric oxidedistributionsin relationto........
0 5 10 15 20
-80
-60
-40
-20
0
+20
+40
+60
Relative cross section (a)
0.80)
0.90)
1.00
1.10
1.20
γ*
Oxy
gen
varia
tion
( f
, i
n %
)O
2∆
Figure 5.12: Variationin oxygenconcentrationrequiredto producea givenvariationin quench-ing rateconstant(determinedby the ratio +-, Q .0/ Q 1 ) asa functionof relative collision crosssection(a ,32 H2O .42 O2).
within a smallerinterval. For instance,if a 50%variationaround 5 f O2 687 f [1]O2
is considered
acceptable,that is 0 9 05 : f [2]O2
: 0 9 15, thento explain a variationin Q of 10%would require
a ; 4, andto explainavariationof 20%in Q would requirea <= 12.Thequestionremains,of course,whetheror not thesevaluesof a aredeemedacceptable.In
view of theavailabledataon A-statequenching,andsince> N2 for theD-stateis alreadyquitelarge,a ?= 2 @ 3 seemsa reasonablerange.
128
Chapter 6
Summary and outlook
6.1 Summary
The main objective of the work describedin this thesisis the developmentof a methodtodeterminethe nitric oxide (NO) densitywith both spatialandtemporalresolutionduring thecombustioninsidethe cylinder of a dieselengineby meansof laserdiagnostics.As a tool toobserve theNO moleculestheLaserInducedFluorescence(LIF) techniqueis used.This non-intrusive techniqueallows to detectminority speciesin combustionwith spatialandtemporalresolution.Theintensityof thefluorescenceresultingfrom theNO molecules,thatareexcitedby thelaserradiationis a measurefor theamountof NO presentin thecylinder of therunningengine.
The engineusedis a one-cylinder, two-stroke, direct injection dieselenginewhich is de-scribedin section2.2.1.Theengineis madeoptically accessibleby mountingtwo quartzwin-dowsin thecylinderwall throughwhichthelaserbeamcantraversethecombustionchamber. Athird window is placedin thecentreof thecylinderheadandis usedto detectthefluorescence.The enginewasoperatedin steady-state,on standardcommercialdieselfuel andnon-oxygenenrichedintakeair, in contrastto mostotherexperimentsreportedin literature.In previouslyde-scribedexperimentstheresearchenginewasmostlyoperatedin skip-firedmodeonasubstitutefuel andoftenextra oxygenwassuppliedto theintakeair [17,34–39].
Theexperimentsreportedin this thesishave shown that it is possibleto observe NO insidethecombustionchamberof thetwo-strokedieselengineapplyingtheLIF technique.Radiationof 193 nm, deliveredby an excimer laserrunningon ArF, wasusedto excite NO moleculesin the D2 ACB (v D =0) E X2 F (vDGD =1) band. At highertemperaturesandpressuresit proved un-avoidableto alsoexcite oxygen(O2) whenexciting NO with 193nmradiationandbesidesNOfluorescenceinterferingfluorescencefrom hot O2 is observed. However, NO fluorescencecanbe spectrallyseparatedfrom O2 fluorescenceby a properchoiceof the excitation anddetec-tion wavelengths. To selectthe bestwavelengthsfor excitation and detectionof NO withinthecombustionchamberexcitation/emissionspectrarecordedfrom therunningengineareused(section2.5.1).
To usethefluorescenceyield asa measurefor theNO densitya linearrelationshipbetweenthefluorescenceyield andthelaserintensityshouldexist andthereforetheeffect of saturationis investigated.Saturationof a transitiongenerallyoccurswhentheopticalpumpingis strongenoughto induce‘considerable’changesin theequilibriumpopulationsof themolecularlevels
129
6 Summaryandoutlook
that arecoupledby the pump. In molecules,RotationalEnergy Transfer(RET) is the fastestprocessthat maintainsthermalequilibrium. Thus, as long as RET ratesare fasterthan thepump rate, saturationeffects will not be evident, even for laserfluencesthat would lead toconsiderablesaturationif RET wereabsent.For theengineexperiment,thefluorescenceyieldis shown to dependlinearly on laserintensity. The effect of RET in groundandexcitedstatehasbeenestimatedto increasethefluorescenceyield by asmuchasafactorof 20. Furthermore,it hasbeenshown that the weakfield limit, which is usuallyassumedin the interpretationoffluorescencedata,still givesreasonablyaccurateresultsfarbeyondthelimits within which thisapproximationwouldbevalid. This is dueto thefactthat,for theconditionsof thisexperiment,RET ratescomparedto the pump rate are fast enoughto keepthe populationsof the laser-coupledlevelsin thermalequilibrium.
Dispersedfluorescencespectra,obtainedby excitationof NOatawavelengththatminimisesO2 interferenceshow thatit is possibleto observefluorescencefrom NO insidethecombustionchamberthroughoutthewholecombustionstrokestartingaroundTDC (chapter4). Thesemea-surementsaredoneby couplingin thelaserradiationthroughthetop window, sothat it enterstheobservationareaimmediately. All spectra,from themomentthecombustionstartsonwards,show spectralstructure.This indicatesthat sufficient laserintensityis availableto inducede-tectableamountsof fluorescencethroughoutthewholecombustionstroke,evenat TDC wherepressureandtemperaturearehigh. For crankangles ?= 20H aTDC the spectraaredominatedby fluorescencefrom vibrationallyhot O2 (v DGD =2,3),whereasthis is almostabsentin thespec-tra at crankangles <= 40H aTDC.OxygenfluorescencepeaksandNO fluorescencebandscanbedistinguishedbecausethey arepartly at differentspectralpositionsandthey show differentspectralfeatures.TheNO fluorescencebandsarespectrallybroadasaresultof fluorescenceoutof many rotationallevels,mostof which arepopulateddueto rapid RET in the excitedstate.The O2 fluorescencepeaks,on the contrary, arecharacterisedby two closelyspacednarrowlines(doubletstructure)dueto fastpredissociationof theupperstate,thatresultsin dissociationof the excited O2 moleculesbeforeRET hasoccurred.The intensityof the NO fluorescencebandsin thesespectrais proportionalto theNO densityin themeasurementvolumeandcanbeusedto determinetherelativeamountof NO presentin thecylinderasafunctionof crankangle(chapter4).
Spatialfluorescencedistributionsof NO areobtainedfor crankangles <= 35H aTDC(chap-ter5). They arerecordedthroughasomewhatinvolvednarrow-bandtransmissionfilter (FWHM5 nm) thatonly transmitsthefluorescencewithin a narrow wavelengthregion centredaroundthe NO fluorescencebandat 208 nm which is free of O2 fluorescence(seefigure 5.2). Thefluorescenceintensitycollectedfrom a certainpositionis a measurefor the local NO densityinsidethecylinder.
To comparetheNO fluorescenceintensitiesthroughoutthecombustionstrokeandat differ-ent positionsin the probevolumethe observed fluorescencesignalshave to be processedforthechangingin-cylinder conditionsin orderto transformtheminto NO densities.Thegeneralrelationshipbetweenfluorescenceanddensityis well known. The NO fluorescencesignal isproportionalto i) the NO densityin the volumeirradiatedby the laserbeamandseenby thedetector, ii ) thefractionof moleculesthatis reallyexcitedandiii ) thefractionof moleculesthatis detected.On its turn the fraction of moleculesthat is excited dependson i) the numberofmoleculesin theright quantumstatein themeasurementvolume,determinedby theBoltzmannfactor( fvI J J TK ), ii ) the intensityof the laserradiationat theexcitationposition(IL J x L y K ) and
130
6.1 Summary
iii ) theoverlapof thelaserline profilewith theNO absorptionspectrum(g JNM a J T L PKOL M L K ). Sim-ilarly, thefractionof moleculesthat is detecteddependson i) thefractionof excitedmoleculesthat fluorescesat the right wavelength,determinedby the Stern-Vollmer factor (P J T L PK ) aswell asii ) theattenuationof theinducedfluorescenceon its way to thedetector(AF J x L y K ).
In general,therefore,althoughthe NO fluorescenceis proportionalto the NO densitytheproportionalityconstantincludesseveralspectroscopicandexperimentalfactorsthatvary, bothtemporallyandspatially, duringthecombustion.Mostly, theseprocessingfactorscanbeevalu-ated,but thisresultsin expressionsthatdependonthelocalphysicalandchemicalconditionsinthecombustionchamber. In general,thesequantities,likepressure,temperature,laserintensityattenuationcoefficient andgasmixture,arenot known anddifficult to assess.Furthermore,theprocessingfactorsinvolve molecularconstantswhich arenot alwaysavailablefrom literaturefor theelectronicstateinvolved.
To obtainthe requiredparametersadditionalexperimentshave beenperformedandsomeassumptionshadto bemade.Thewaysthey areassessedandtheapproximationsmadethereby,aresummarisedshortly below. Of all quantitiesthe in-cylinder pressureis mostprobablytheeasiestparameterto obtain. It is constantover the volumeand its dependenceasa functionof crank angleis determinedrelatively easily and accuratelyby using a pressuretransducer(section2.2.2).
Measuringthe in-cylinder temperatureis a largerproblemasit mayvary with position. Infact,at the momentthe local temperaturecannotbe determined.Two differentmeasuresof atemperatureasa functionof crankangleareobtainedfor thetwo-stroke engine,however, bothof themnot spatially resolved. The first one,called the meangastemperature,is calculatedfrom theheatrelease,which is obtainedfrom thein-cylindervolumeandmeasuredin-cylinderpressure(section2.2.2). This temperaturerepresentsanaveragetemperatureof thegasin thecylinder andwill thereforebe lower thanthe local temperatureat thosesiteswheretheactualcombustionoccurs.Thesecondtemperatureis derivedfrom thespontaneousflameemissionbyfitting a Planck’s curve to thedispersedemissionspectrum(section2.4.1).This representsthetemperatureof glowing sootparticles,which is expectedto moreaccuratelyrepresentthelocaltemperaturein theburning fuel/air mixture [56]. At any time, the measuredNO fluorescencesignalwill containcontributionsof newly formedandalreadyexistingNO whicharenotneces-sarilyat thesameplaceandtemperature.Thus,it is not clearwhich temperature,if any, shouldbeused.In addition,it shouldbenotedthatbothtemperaturesarespatiallyaveragedtempera-tures.In generala local temperatureshouldbeusedbecausethetemperaturewill generallynotbeuniformover themeasurementvolume.
Determinationof theattenuationof thelaserradiationdueto scatteringoff andabsorptionbysootparticlesandoil andfuel dropletson its way throughthecombustionchamberis thenextmajor problem. The attenuationof the laserradiationcanbe measuredjust by detectingthelaserintensitythatis left behindtheexit window. In this case,however, thetransmissionlossesthroughthewindows,which arenot known, areincluded.In addition,it only givesanaveragetransmissionandno informationaboutthe local laserintensityin themeasurementvolume. Ithasbeenshown thatthelocal laserintensityattenuationcanbeassessedexactly usingtwo dis-tributionsof elasticallyscatteredlaserradiation,recorded(virtually) simultaneouslyfrom twolaserbeamswhich traversetheenginealongthesamepath,but in oppositedirection(chapter3;doubleimagemethod).It is foundthattheattenuationcoefficient is fairly homogeneouslydis-tributedover the field of view for the studiedcrankangles( <= 30H aTDC). This distribution
131
6 Summaryandoutlook
is usedto reconstructan imageof the laserintensitydecreaseover theobservationarea.Fur-thermore,this experimentprovidesinformationabouttheattenuationof thelaserradiationasaresultof thecontentsof thecombustionchamberonly, independentof window losses.Althoughthis methodis exact, it requiresa complicatedexperimentalsetup,andfor this reasona moreapproximatemethodis alsodeveloped.Usingthis methodthe local laserintensityattenuationcanbeassessedfrom only onedistributionof theelasticallyscatteredlaserradiationif thetotaltransmissionthroughthecombustionchamberis known (chapter3; singleimagemethod).
Besidesattenuationof thelaserradiation,attenuationof theinducedfluorescenceoccursaswell. To estimatethisattenuationit is assumedthattheinducedfluorescencebehavessimilar tothelaserradiationasit hasalmostthesamewavelength.Therefore,thesameattenuationcoeffi-cientasfoundfor thelaserradiationis taken.It shouldberealized,however, thatthedistributionof scatteringandabsorbingparticlesin thebeginningof thecombustionis not uniform,sothatdifferencesin theattenuationof thefluorescencemightoccur.
The compositionof the gasmixture in the cylinder is alsoof someimportancefor the in-terpretationof the NO fluorescenceyield, asdifferentmoleculescontribute differently to thefluorescencequenching.Besidesknowledgeof themoleculespresentin themixtureandtheirdistribution, knowledgeof the molecularconstantsthat are involved in the calculationof thecollision ratesis necessary. However, in contrastto theNO A-state,for which dataon quench-ing areavailablein literature[71,86], only little is known for theNO D-state.To obtainsomeinformationaboutthequenchingprocessandenergy transferprocessesof theNO D-stateunderpressureandtemperatureconditionspresentin the engine,measurementsin a high pressure,high temperaturecell areperformed[82]. Thesemeasurementshave shown that for the NOD-statenitrogen(N2) is a very efficient collision partner, causingElectronicEnergy Transfer(EET) to theNO A-state.As N2 is alwaysthemajority speciesin thecombustionchamber, itis assumedthatN2 collision inducedEETdominatesthenon-radiativedecayrate.This impliesthat theexactcompositionof themixture in thecylinder is relatively unimportant.Therefore,for the moment,it is assumedthat the non-radiative decayis causedby N2, homogeneouslydistributedover the cylinder. In addition, the moleculesin the gasmixture are importantforthedeterminationof pressurebroadening,of theNO absorptionline. However, dataaboutlinebroadeningfor theD E X transitionof NO arealsonot availablein literature.For thepresentpurposedataof the A E X bandare taken in combinationwith own measurementson theD E X bandin theengine.
Undertheconditionsdiscussedabovetheprocessingfactorscanbedeterminedasafunctionof crankangleandposition. As it is not clearwhich temperatureshouldbeused,calculationshave beenperformedbothfor thesoottemperatureandthemeangastemperature.Takingintoaccountall processingfactorsthe measuredfluorescenceyield, both from spectraanddistri-butions,canbeconvertedinto a relative NO densityasa functionof crankangleandposition(for thedistributions).Thus,theresultingNO densitydistributionsor curvescanbecomparedthroughoutthestrokeandover theobservationarea.In principle,they canbecalibratedto giveabsolutevalues.
Nitric oxidedensitycurvesasa functionof crankanglearederivedfrom theintegratedflu-orescenceyield of theNO dispersedfluorescencespectra.Thedensitycurvescanbeobtainedfor differentengineconditions(load,fuel, compressionratio) andit is concludedthat,asfar asinvestigated,theengineoperatingconditionsareof minor importance,asall NO densitycurvesshow the samefeatures(chapter4). Nitric oxide is seenfirst aroundTDC andits densityin-
132
6.2 Outlook
creasesthroughoutthecombustionstroketill somewherebetween20and50H aTDC,dependingon the temperatureusedin theprocessingandtheengineconditions.Hereafter, a decreaseinNO densityin the probevolumeis seen,mainly dueto the expandingcylinder volume. Thisresultleadsto theconclusionthattheNO formationcontinuestill latein thestrokeandthatthediffusion burning phaseis importantfor the NO formation. Only little NO formationis seenduringthefuel-rich initial premixedburn. This resultis in agreementwith experimentalresultsfrom laserimagingtechniquesfrom otherresearchgroups[17,39] aswell aswith theoreticalcalculationsfrom thegroupof Peters[79].
TheNO fluorescencedistributionsaretransformedinto NO densitydistributionsundertheassumptionsof a uniform temperaturedistribution anda homogeneousfluorescencequench-ing over the field of view. The derived NO densitydistributions,obtainedfor crank angles<= 35H aTDConly, show aratherhomogeneousdistributionthatvariesgraduallyover theobser-vationarea;largefluctuationsin theNO densityarenot seen(chapter5). This canbeexpectedasthedistributionsareobtainedat crankangleslate in thecombustionprocessandtheformedNO hasalreadymixedwith thecylindercontents.Theremainingnon-uniformitymight to someextent also be explainedby temperatureor mixture variations. The integratedNO densitiesagreewith theindependentlymeasureddensitycurvesfrom thedispersedfluorescencespectra.
6.2 Outlook
As statedabove, themaingoalof this thesiswasto developa methodto measuredensitydis-tributionsof NO in thecylinderof anopticallyaccessibledieselenginerunningoncommercialdieselfuel by meansof theLIF technique.In thedeterminationof NO densitiesusingtheLIFtechniquetwo partscanbedistinguishedi) NO fluorescencehasto bedetectedwith temporalandspatialresolutionandii ) thefluorescenceyield hasto betranslatedinto aNO densitytakinginto accountthechangingconditionsin thecombustionchamber. A summaryof theway fluo-rescenceof NO in thecombustionchamberof theengineis detected,theassumptionsmadeintheinterpretationof thefluorescenceyield andthemostimportantresultsis givenin section6.1.In this outlookit will bediscussedto whatextenttheresultsof thedevelopedmethodmeettheobjectiveandwhatcanbedoneto improvethemethod.
Theexperimentsandresultsdescribedin this thesishave shown thatmany of theproblemsarisingby i) the detectionof the NO fluorescencesignaland ii ) the interpretationof the NOfluorescenceyield asa NO densityaresolved. Curvesdescribingtherelative NO densityasafunction of crankanglewereobtainedfor the whole combustionstroke. In addition,relativedistributionsof the local NO densityover themeasuringvolumewereobtained,be it only forcrankangles <= 35H aTDCandundertheassumptionsof auniformtemperaturedistributionanda homogeneousfluorescencequenching.In principle, both canbe calibratedto give absolutevaluesby measuringtheamountof NOx at theexhaust.In this caseit is importantto take intoaccountthatin theenginemostNOx is presentasNO but at lowertemperaturesin theexhaustitcanbeconvertedto NO2. Therefore,bothcomponentsshouldbemeasuredat theexhaust.Butit shouldbe notedthat a lot of assumptionshave hadto be madeto assessthe densitycurvesanddistributions,andsomerequiredquantitiesarestill not,or only badly, known. Thefactthatdensitydistributionsareobtainedonly late in thecombustionstroke andthatuncertaintiesstillexist in theinterpretationof thefluorescenceyield leadsto theconclusionthat theobjective of
133
6 Summaryandoutlook
this work is not yet fully achieved.To usetheLIF techniqueasa tool to obtainquantitative in-formationaboutNO in thefuture,furtherrefineddevelopmentsarenecessary. NO fluorescencedistributionshave to be obtainedthroughoutthewhole combustionstroke andto quantify theNO fluorescencemoreaccurately, it will benecessaryto developmethodsto measurethebadlyknown quantitieslocally. In addition,experimentsareneededto obtainmoreinformationaboutthemolecularconstantsof theNO molecule.
In this work local NO densitydistributionswerenot obtainedthroughoutthe whole com-bustionstrokebut only for crankangles <= 35H aTDCbecauseat smallercrankanglesthelaserintensityleft in theobservationvolumewastoo low (thelaserbeamhasto travel about25 mmbeforereachingthe observation area). If the laserintensity is sufficient, in principle, fluores-cencedistributionscanbe obtainedat lower crankanglesaswell, in spiteof the higherpres-sures1. Theproblemof thetravelling distanceof thelaserbeamcanbesolvedto someextentbymountinganobservationwindow closerto thelaserentrancewindow or usinga largerwindow,so that the laserbeamentersthe observation areaimmediately. In addition, the fluorescenceattenuationcanbeminimisedif thelaserbeampassesthemeasuringareajust below theobser-vationwindow. However, althoughthiswayfluorescencesignalcancertainlybeobtainedfromthe edgeof the combustionchamberit is no guaranteethat NO fluorescencecanbe obtainedfrom thewholeplanein thecombustionchamber.
A morefundamentalproblemin recordingNO distributionsat crankanglesaroundTDCis the presenceof O2. At the high pressuresandtemperaturespresentaroundTDC it is un-avoidableto alsodetectO2 whenspatialfluorescencedistributionsof NO arerecordedusinganexcitationwavelengthof 193nm becausethespectralpositionsof thefluorescenceof bothspecieslie tooclosetogetherto separateby available2D-filters.This,togetherwith thefactthattheattenuationof the193nmradiationis large,will probablyprecludespatialfluorescencedis-tributionsof NO densitiesto beobtainedthroughoutthewholecombustionstrokeusing193nmlaserradiation.
In analternativedetectionschemefor LIF measurementsthatcouldbeusedto measureNOdistributions226nmis usedto excitetheNO moleculesin theA2 ACB (v D =0) E X2 F (vDGD =0)bandandfluorescencefromtheA2 ACB (v D =0) Q X2 F (v DGD =1@ 4)bandsfrom237to 276nmis detected.Experimentsdescribedin literaturehave alreadyshown that this wavelengthcanalsobe usedfor detectionof NO insidethecombustionchamberof dieselengines[17,37,39]2. It shouldbementionedthat,likein thecaseof using193nmradiation,O2 is easilyexcitedaswell. However,if thelaserusedhasa narrow bandwidthandexcitationanddetectionwavelengthsareselectedcarefully interferenceof O2 fluorescencecanbe avoidedeven at high pressuresandtempera-tures.An advantageof thisdetectionscheme,comparedto 193nmexcitation,is thatmoleculesareexcitedfrom thevibrationalgroundstate,whosepopulationis moreconstantat thetemper-aturespresentduring the combustion. This resultsin the fluorescenceyield not dependingsostronglyon temperatureasin thecaseof 193nm excitation. Therefore,thetemperaturediffer-encesoverthefield of view, arelessimportantfor theevaluationof thelocalfluorescenceyield.(Note that the local temperatureis still importantasit is not only involved in the Boltzmannfactor, describingthepopulationof thelower level, but alsoin theStern-Vollmer factorandthe
1Note, that thehigh pressuresaroundTDC, in itself, areno problemfor measuringfluorescencedistributionsascanbeseenfrom thedispersedfluorescencespectrawhereindeedfluorescencesignalis obtained.
2Theenginesusedin theseexperimentswereall runningon a low sootingfuel in orderto increasetheopticaltransparency of thecombustionchamber.
134
6.2 Outlook
overlapintegral.) A secondadvantageis that theattenuationof the226nm laserradiationonits way throughthecombustionchamberis weaker thantheattenuationof the193nmradiation(althoughthis still hasto beprovenfor realdieselfuel). Theexcitedstateis theA(v D =0)-statethat hasthe additionaladvantagethat moreinformationaboutmolecularconstants,like colli-sioncrosssections,is availablein literature.A disadvantage,however, is that thecompositionof the cylinder contentsis moreimportantin calculatingthe non-radiative decayrate. As, incontrastto the D-state,the depopulationof the excitedA-stateis not dominatedby collisionswith themajority species,N2, thedistribution andconcentrationof all speciesshouldbetakeninto account.Thefirst experimentsperformedusing226nm laserradiationin a realisticDAFsix-cylinderDI dieselenginegivepromisingresultsabouttheuseof 226nmradiationto obtainNO fluorescencedistributionsaroundTDC [82].
Besides193nmand226nm,also248nmlaserradiationcanbeusedto exciteNO moleculesin theA2 A B (v D =0) E X2 F (v DGD =2) band.With 248nmtheinterferenceof O2 canbeavoidedbyacarefullychosenexcitationanddetectionscheme.Theadvantageof using248nmradiationisthattheattenuationof the248nmlaserradiationis lessthantheattenuationof 193and226nmlaserradiation.However, animportantdisadvantageis thatNO moleculesareexcitedfrom theX(v DGD =2)-statethepopulationof whichhasanevenstrongertemperaturedependencethanthatoftheX(v DGD =1)-statethatis excitedusing193nmlaserradiation.Therefore,thedeterminationof alocal temperaturebecomesincreasinglyimportant.Moreover, astheX(v DGD =2)-stateis populatedonly athighertemperaturesthiswavelengthcannotbeusedfor measurementslatein thestroke.For thisalternativedetectionschemetheexcitedstateis alsotheA(v D =0)-stateandthereforethecompositionof thecylindercontentswill beimportantlike in thecaseof using226nm.
OnceNO fluorescencedistributionsthroughoutthe whole combustionprocesscanbe ob-tainedsuccessfully, still the questionremainsif the NO fluorescenceyield canbe interpretedasa NO density. As alreadymentionedin this work a numberof assumptionsweremadeintheprocessingof theNO fluorescenceyield. For fluorescencedistributionsrecordedin thebe-ginningof thecombustionprocesstheassumptionsof a uniform temperaturedistribution anda homogeneousfluorescencequenchingwill certainlynot bevalid. Therefore,it is requiredtohave informationaboutthelocal conditionsin thecombustionchamber.
At the momentthe local in-cylinder temperaturecannotbe measured.Thusfar, only twodifferentspatiallyaveragedtemperaturesasa functionof crankangleareobtainedfor thetwo-strokeengine.Sincebothtemperaturesarenotnecessarilytheappropriateonesfor theinterpre-tationof theNO fluorescencesignalanddonotgivelocal information,asdiscussedabove(sec-tion 6.1),it is of importanceto developamethodto measurethelocaltemperature.Onepossibleway to determinethis temperatureis to useLaserInducedPredissociativeFluorescence(LIPF)of O2. As theexcitedstatesof O2 havea fastpredissociationratefluorescenceoccursonly dur-ing thepredissociationlifetime, in which no fluorescenceis lost by collisions. Therefore,theStern-Vollmerfactorreducesto A/P, independentof thequenchingrate.Thefluorescencesignalbecomesproportionalto the populationof the lower statewith a proportionalityconstantthatdoesnot dependon thelocal collision conditions.By measuringtherelativepopulationof twostates,which areexcitedsimultaneously, the temperaturecanbecalculatedvia theBoltzmannexpressionfor a populationdistribution in thermalequilibrium[89–91]. It should,however, benotedthat laserintensityandRET in the lower statecanhave aneffect on theratio of theLIFsignalsfrom thetwo transitionsandthereforealsoonthederivedtemperature[60]. Experimentsarein progressto measurethelocal temperatureusingcoincidingtransitionsfrom theX(v DGD =2)
135

6 Summaryandoutlook
andtheX(v DGD =3) in theSchumann-Rungeband(a possibilitycouldbe theR1(17) transitionoftheB(vD =10) E X(v DGD =2) bandandtheR1(19) transitionof theB(vD =16) E X(v DGD =3) bandat193.258nm(51744.31cmR 1)).
The unknown compositionof the gasmixture is anotherproblemthat hasto be solved inorderto correctlytransformthe NO fluorescenceyield into a NO density. Till now the exactcompositionis assumedto beunimportantastheprocessesthatinfluencethefluorescenceyieldandpressurebroadeningareassumedto bedominatedby N2, asdiscussedabove (section6.1).However, for NO fluorescencedistributionsrecordedin the beginning of the combustionbymeansof 226 nm laserradiationthe direct environmentof the NO moleculeis an importantparameterin theprocessingof the fluorescenceyield. But, at the moment,it is impossibletomeasurethelocalcompositionof thegasmixtureat thesamepositionastheNO fluorescenceisdetectedfrom. By applyingtheLIF techniqueto obtainquantitativeinformationabouttheotherspeciespresentthe sameproblemarisesagain,as for the interpretationof their fluorescenceyield the sameinformation is required. To solve the problemof the fluorescencequenchingDecandco-workers[17] haveassumedthatthegascompositionat thepositionandtimeNO isformedconsistsof theproductsof thecombustionprocessandmixeswith therestof thecylindercontentsduring the latter part of the combustionstroke. This, however, is not a satisfactorysolutionasit requiresknowledgeaboutthecombustionproductsof realdieselfuel asafunctionof crankangleandmixing rates,parametersthat, again,arenot well known. Otherpossiblesolutionsin whichtheproblemof fluorescencelossby quenchingis circumventedareto choosea fastpredissociatingstate(if thatexists)or to choosea statein which thefluorescencelossisdominatedby themajorityspecies.
For the conversionof the NO fluorescenceyield to a NO densitymoreinformationaboutmolecularconstantsof theNO molecule,like line broadening,quenchingandEET crosssec-tions,in a high pressure,high temperatureenvironmentaspresentin thecombustionchamber,is required.Therefore,systematicexperimentson NO in severalknown gasmixturesin a highpressure,high temperatureenvironmentwill have to be performed. Information about linebroadeningcanbeobtainedby recordingexcitationspectraof NO in differentgasmixturesatseveralpressureandtemperaturecombinations.By measuringthedispersedfluorescenceasaresultof laserexcitationundercontrolledconditionsquenchingandEET ratescanbederived.Furthermore,the importanceof RET hasto beassessedasthis processrefills thegroundstatethat is depletedby the laserexcitation. Therefore,it increasesthefluorescenceyield in suchawaythatit appearsnotsaturatedalthoughthelaserintensityis sohigh thatall populationoutofthegroundstatecanberemoved.At themomentit is assumedthatRETprocessesareunimpor-tantaslong asRET ratesarefasterthanthepumprateandthefluorescenceyield is linearwiththe laserintensity. InformationaboutRET ratescanbe obtainedby usingdouble-resonancetechniques.One laserfrequency is usedto populatea specificrotationallevel of a state. Asecondlaserbeamis usedto probethe distribution of the moleculesafter delaytimesduringwhich collisionsmayhave transferedthepopulationinto otherrotationallevelsof thepreparedstate.
Although it is not so importantfor theLIF techniquein itself, it is worthwhile to mentionthatin almostall experimentsreportedin this thesisfluorescencesignalsareaveragedover25-100enginecyclesto increasethesignalto noiseratio. Sincetheaveragedinformationis foundto reproduce,fluorescencedistributionsof differentmeasurementsrecordedunderthesameen-gine conditionscanbe compared.In addition,relationsbetweendifferentquantitiesobtained
136
6.2 Outlook
in separatemeasurementscanstill bedemonstrated.A disadvantageof averagingis that infor-mationabout(the differencesbetween)individual combustioncyclescannotbe obtained.Toget informationaboutindividual combustioncyclescycle-resolvedresultsalsohave to be ob-tained,e.g. by usinga singlelaserpulse.However, in thatcaseit is moredifficult to compareNO densitiesobtainedat differentcrankangles.For a goodcomparisona lot of singlecyclemeasurementshave to be obtainedandanalysedto get a sort of averagevalueor distributionthatcanbecompared.To relatedifferentquantitiesandaspectsof thecombustionprocessthatareobtainedfrom only oneenginecycle it is necessaryto measurethemsimultaneously. Thisrequiresa morecomplicatedsetupasmostlytwo camerasystemsarenecessaryandsometimestwo lasersystemsaswell.
Informationaboutthedieselcombustionprocessandtheformationmechanismof NO canalsobe obtainedby measuringothermolecularspeciespresentor formed in the combustionprocess.Interestingspeciesaremoleculesthatcanbeprecursorsof NO, likeCH or CN involvedin thepromptNO mechanism(section1.4.2)or N2O thatcanform NO via the‘N2O pathway’(section1.4.3).Otheraspectsof thecombustionprocesscanbestudiedby measuringmolecularspeciesthat arecharacteristicfor that specificaspectof the combustion. The flamefront canbevisualisedby moleculeslike OH andCH which areconfinedto theflamefront region [15,92]. Specieslike, CN, OH andCH in combustion processescan be detectedusing the LIFtechnique[92,93]. Soot is anotherimportantaspectof the combustion processthat can bevisualisedusing the LII technique[11,12,14]. Futuremeasurementswill also focus on therelationof NO to otheraspectsof thecombustionprocessby measuringe.g. sootdistributionsandNO distributions,spontaneousflameemissionandNO distributionsor sootdistributionsandspontaneousflameemissionsimultaneously.
The questionthat still remainsat the endof this outlook is whetherthe LIF techniqueinthefuturecanbeusedasa tool to obtainquantitativeNO densitydistributionswith bothspatialandtemporalresolutionin a dieselenginerunningon commercialdieselfuel throughoutthewholecombustionstroke. Thisquestioncannotyetbeansweredsatisfactorily, but theproblemsthat will have to be solved areoutlinedabove. Much will, of course,dependon the amountof researchthat is put into it. But, in the endthereis alwaysthe possibility that the develop-mentof alternativesto thedieselengine(or to the dieselfuel) will overtake the dieselengineitself. However this maywork out, combustionoptimisationwill thereforeremainan issueofconsiderableeconomicalimportance,andLIF-baseddiagnosticsaredefinitively an extremelyversatiletool in achieving this.
137

References
[1] L. Bryant, ”Rudolf Diesel and his rational engine”, Scientific American221, 108-117(1969).
[2] J.B. Heywood, ”Internal combustion engine fundamentals”,McGraw-Hill, Singapore(1988).
[3] A. HeintzandG.A. Reinhardt,”ChemieundUmwelt”, Vieweg Verlag,Wiesbaden(1993).
[4] A. Fisher-Riedman,”Environmentalaspectsof fine particlesandsoot”, 2nd SymposiumTowardscleandieselengines,Villigen (1998).
[5] W.G. Agnew, ”Room at the piston top: contributions of combustion scienceto enginedesign”,Proc.20th Symposium(Int’ l) on Combustion,pp.1-17(1984).
[6] G.M. Faeth,”Current statusof dropletand liquid combustion”, Prog.Energy Combust.Sci.3, 191-224(1977).
[7] J.E.Dec,A.O. zur Loye andD.L. Siebers,”Soot distribution in a DI dieselengineusing2D laserinducedincandescenceimaging”,SAEpaperno.910224(1991).
[8] C. Espey andJ.E.Dec, ”The effect of TDC temperatureanddensityon the liquid-phasefuel penetrationin aDI dieselengine”,SAEpaperno.952456(1995).
[9] C. Espey, J.E.Dec,T.A. LitzingerandD.A. Santavicca,”Quantitative2D fuel vaporcon-centrationimagingin a firing DI dieselengineusingplanarlaserinducedRayleighscat-tering”, SAEpaperno.940682(1994).
[10] C. Espey, J.E.Dec,T.A. Litzinger andD.A. Santavicca,”PlanarlaserRayleighscatteringfor quantitative vapor-fuel imaging in a dieseljet”, CombustionandFlame109, 65-86(1997).
[11] C. Espey andJ.E.Dec, ”Diesel enginecombustionstudiesin a newly designedoptical-accessengineusing high-speedvisualisationand 2D laser imaging,” SAE paperno.930971(1993).
[12] J.E.Dec, ”Soot distribution in a DI dieselengineusing2D imagingof laserinducedin-candescence,elasticscattering,andflameluminosity”, SAEpaperno.920115(1992).
[13] J.E. Dec and C. Espey, ”Ignition and early soot formation in a DI dieselengineusingmultiple2D imagingdiagnostics”,SAEpaperno.950456(1995).
139
References
[14] J.E.DecandC. Espey, ”Soot andfuel distribution in a DI dieselenginevia 2D imaging”,SAEpaperno.922307(1992).
[15] J.E.DecandE.B.Coy, ”OH radicalimagingin aDI dieselengineandthestructureof theearlydiffusionflame”,SAEpaperno.960831(1996).
[16] J.E.Dec, ”A conceptualmodelof DI dieselcombustionbasedon laser-sheetimaging”,SAEpaperno.970873(1997).
[17] J.E.DecandR.E.Canaan,”PLIF imagingof NO formationin adieselengine”,SAEpaperno.980147(1998).
[18] J.E.Dec andC. Espey, ”Chemiluminescenceimagingof autoignitionin a DI dieselen-gine”, SAEpaperno.982685(1998).
[19] J. Rife andJ.B. Heywood, ”Photographicandperformancestudiesof dieselcombustionwith a rapidcompressionmachine”,SAEpaperno.740948(1974).
[20] H.H.Chui,H.K. Kim andE.J.Croke,”Internalgroupcombustionof liquid droplets”,Proc.19th Symposium(Int’ l) on Combustion,pp.971-980(1982).
[21] ”Boschautomotivehandboek”,3r d ed.,RobertBoschGmbH,Stuttgart,Germany, world-widedistribution throughtheSAE,Warrendale,PA (1993).
[22] J.A. Miller andC.T. Bowman,”Mechanismandmodellingof nitrogenchemistryin com-bustion”,Prog.Energy Combust.Sci.15, 287-338(1989).
[23] J. Olbregts, ”Termolecularreactionof nitrogenmonoxideandoxygen: a still unsolvedproblem”,Int. J.Chem.Kin. 17, 835-848(1985).
[24] J.Warnatz,U. MaasandR.W. Dibble, ”Combustion”,SpringerVerlag,Berlin (1996).
[25] M.C. Drake,J.W. Ratcliffe, R.J.Blint, C.D.CarterandN.M. Laurendeau,”Measurementsandmodelingof flamefrontNO formationandsuperequilibriumradicalconcentrationsinlaminarhigh-pressurepremixed flames”,Proc.19th Symposium(Int’ l) on Combustion,pp.387-395(1990).
[26] J. Wolfrum, ”Bildung von Stickstoffoxiden bei der Verbrennung”,Chemie-Ingenieur-Technik44, 656-659(1972).
[27] Ref. [2], p. 577-578.
[28] H. Bockhorn(ed.),”Soot formationin combustion”,SpringerVerlag,Berlin (1994).
[29] B.S.HaynesandH.G.Wagner, ”Soot formation”,Prog.Energy Combust.Sci.7, 229-273(1981).
[30] A.C. Eckbreth, ”Laser diagnosticsfor combustion temperatureand species”,AbacusPress,Cambridge(1988).
140
References
[31] K. Kohse-Hoinghaus,”Lasertechniquesfor thequantitativedetectionof reactive interme-diatesin combustionsystems”,Prog.Energy Combust.Sci.20, 203-279(1994).
[32] E.W. RotheandP. Andresen,”Application of tunableexcimerlasersto combustiondiag-nostics:a review”, Appl. Opt.36, 3971-4033(1997).
[33] H. ZhaoandN. Ladommatos,”Optical diagnosticsfor sootandtemperaturemeasurementin dieselengines”,Prog.Energy Combust.Sci.24, 221-255(1998).
[34] Th.M. Brugman,”Laser-baseddiagnosticson NO in a dieselengine”,Ph.D. Thesis,Ap-pliedPhysics,Universityof Nijmegen(1999).
[35] P. Andresen,G. Meijer, H. Schluter, H. Voges,A. Koch, W. Hentschel,W. OppermannandE. Rothe,”Fluorescenceimaginginsideaninternalcombustionengineusingtunableexcimerlasers”,Appl. Opt.29, 2392-2404(1990).
[36] A. Arnold, F. Dinkelacker, T. Heitzmann,P. Monkhouse,M. Schafer, V. Sick,J.Wolfrum,W. HentschelandK.P. Schindler, ”DI dieselenginecombustionvisualizedby combinedlasertechniques”,Proc.24th Symposium(Int’ l) onCombustion,pp.1605-1612(1992).
[37] B. Alatas, J.A. Pinson,T.A. Litzinger and D.A. Santavicca, ”A study of NO and sootevolution in aDI dieselenginevia planarimaging”,SAEpaperno.930973(1993).
[38] Th.M. Brugman,G.G.M.Stoffels,N. Dam,W.L. MeertsandJ.J.terMeulen,”Imagingandpost-processingof laser-inducedfluorescencefrom NO in adieselengine”,Appl. Phys.B64, 717-724(1997).
[39] H. Nakagawa,H. Endo,Y. Deguchi,M. Matsuhei,H. OikawaandT. Shimada,”NO mea-surementsin dieselsprayflameusinglaserinducedfluorescence”,SAEpaperno.970874(1997).
[40] G. Josefsson,I. Magnusson,F. Hildenbrand,C. SchulzandV. Sick, ”Multidimensionallaserdiagnosticsandnumericalanalysisof NO formationin agasolineengine”,Proc.27th
Symposium(Int,l) on Combustion,pp.2085-2092(1998).
[41] F. Hildenbrand,C. Schulz,V. Sick, G. Josefsson,I. Magnusson,O. AnderssonandM.Alden,”Laserspectroscopicinvestigationof flow fieldsandNO-formationin arealisticSIengine”,SAEpaperno.980148(1998).
[42] S. Einecke, C. Schulz,V. Sick, A. Dreizler, R. SchiesslandU. Maas,”Two-dimensionaltemperaturemeasurementsin an SI engineusing two-line tracerLIF”, SAE paperno.982468(1998).
[43] H. Kosaka,T. Nishigaki,T. Kamimoto,T. Sano,A. MatsutaniandS.Harada,”Simultane-ous2D imagingof OH radicalsandsootin adieselflameby lasersheettechniques”,SAEpaperno.960834(1996).
[44] J.A. Pinson,T. Ni andT.A. Litzinger, ”Quantitative imagingstudyof theeffectsof intakeair temperatureon sootevolution in anoptically accessibleDI dieselengine”,SAE paperno.942044(1994).
141

References
[45] H. Fujimoto, K. Kurata,G. Asai andJ. Senda,”OH radicalgenerationandsoot forma-tion/oxidationin aDI dieselengine”,SAEpaperno.982630(1998).
[46] G. Wiltalsky, W. Stolz, J. Kohler andC. Espey, ”The quantificationof laserinducedin-candescence(LII) for planartime resolvedmeasurementsof thesootvolumefractionin acombustingdieseljet”, SAEpaperno.961200(1996).
[47] J.D.NaberandD.L. Siebers,”Effectsof gasdensityandvaporizationon penetrationanddispersionof dieselsprays”,SAEpaperno.960034(1996).
[48] M. Suzuki,K. NishidaandH. Hiroyasu,”Simultaneousconcentrationmeasurementsofvaporandliquid in anevaporatingdieselspray”,SAEpaperno.930863(1993).
[49] F. Rabenstein,J. EgermannandA. Leipertz,”Vapor-phasestructuresof diesel-typefuelsprays:anexperimentalanalysis”,SAE paperno.982543(1998).
[50] M. BakenhusandR.D. Reitz,”Two-colorcombustionvisualizationof singleandsplit in-jectionsin asingle-cylinderheavy-dutyDI dieselengineusinganendoscope-basedimag-ing system”,SAEpaperno.1999-01-1112(1999).
[51] P. Flynn,M. Mizusawa,O.A. UyeharaandP.S.Myers,”An experimentaldeterminationofthe instantaneouspotentialradiantheattransferwithin anoperatingdieselengine”,SAEpaperno.720022(1972).
[52] S. Kobayashi,T. Sakai,T. Nakahira,M. Komori andK. Tsujimura,”Measurementsofflametemperaturedistribution in DI dieselenginewith highpressurefuel injection”, SAEpaperno.920692(1992).
[53] X. Li andJ.S.Wallace,”In-cylinder measurementsof temperatureandsootconcentrationusingthetwo-colormethod”,SAEpaperno.950848(1995).
[54] C. Arcoumanis,C. Bae,A. Nagwaney andJ.H.Whitelaw, ”Effectof EGRon combustiondevelopmentin a1.9L DI dieselopticalengine”,SAEpaperno.950850(1995).
[55] M. Versluis,M. Ebben,M. DrabbelsandJ.J.ter Meulen,”Frequency calibrationin theArF lasertuning rangeusing laser-inducedfluorescenceof NO”, Appl. Opt. 30, 5229-5234(1991).
[56] Y. Matsui,T. KamimotoandS.Matsuoka,”A studyon thetime andspaceresolvedmea-surementsof flametemperatureandsootconcentrationin a DI dieselengineby thetwo-colormethod”,SAEpaperno.790491(1979).
[57] H.G. Hottel andF.P. Broughton,”Determinationof true temperatureandtotal radiationfrom luminousgasflames”,Ind. andEngng.Chem.4, 166(1932).
[58] Y. Matsui, T. KamimotoandS. Matsuoka,”A studyon the applicationof the two-colormethodto the measurementof flame temperatureand soot concentrationin dieselen-gines”,SAEpaperno.800970(1980).
142
References
[59] N. Dam,S.StolteandJ.Reuss,”Rotationalandvibrationalrelaxationin ethylene”,Chem.Phys.135, 437-455(1989).
[60] J.W. Daily andE.W. Rothe,”Effectsof laserintensityandof lower-staterotationalenergytransferupon temperaturemeasurementsmadewith laser-inducedfluorescence”,Appl.Phys.B 68, 131-140(1999).
[61] M. Kerker, ”The scatteringof light andotherelectromagneticradiation”,AcademicPress(1969).
[62] A.M. Wodtke,L. Huwel,H. Schluter, G. Meijer andP. Andresen,”High-sensitivity detec-tion of NO in aflameusinga tunableArF laser”,Opt.Lett. 13, 910-912(1988).
[63] P.H. Kruppenie,”The spectrumof molecularoxygen”,J. Phys.Chem.Ref.Data.1, 423-534(1972).
[64] A.M. Wodtke,L. Huwel,H. Schluter, H. Voges,G. Meijer andP. Andresen,”Predissocia-tion of O2 in theB-state”,J.Chem.Phys.89, 1929-1935(1988).
[65] M.P. LeeandR.K. Hanson,”Calculationsof O2 absorptionandfluorescenceat elevatedtemperaturesfor abroadbandargon-fluoridelasersourceat193nm”, J.Quant.Spectrosc.Radiat.Transfer36, 425-440(1986).
[66] M. Shimauchi,T. Miura andH. Takuma,”Absorptionlinesof vibrationallyexcitedO2 andHF in ArF laserspectrum”,Jpn.J.Appl. Phys.33, 4628-4635(1994).
[67] V. Sick, M. Decker, J. HeinzeandW. Stricker, ”Collisional processesin the O2 B3 Au-
state”,Chem.Phys.Lett. 249, 335-340(1996).
[68] E.W. Rothe,Y.W. GuandG.P. Reck,”Laserinducedpredissociativefluorescence:dynam-icsandpolarization.Implicationsfor diagnostics”,Appl. Opt.35, 934-947(1996).
[69] J. LuqueandD.R. Crosly, ”LIFBASE: Databaseandspectralsimulationprogram(Ver-sion1.3)”, SRI InternationalReportMP 98-021(1998).
[70] A.S. SudbøandM.M.T. Loy, ”Measurementsof absolutestate-to-staterateconstantsforcollision-inducedtransitionsbetweenspin-orbitandrotationalstatesof NO (X2 F , v=2),J.Chem.Phys.76, 3646-3654(1982).
[71] M.C. Drake andJ.W. Ratcliffe, ”High temperaturequenchingcrosssectionsfor nitric ox-ide laser-inducedfluorescencemeasurements”,J.Chem.Phys.98, 3850-3865(1992).
[72] D. Stepowski, ”Auto calibrationof OH laserinducedfluorescencesignalsby localabsorp-tion measurementin a flame”, Proc.23rd Symposium(Int’ l) on Combustion,pp. 1839-1846(1990).
[73] M. Versluis,N. Georgiev, L. Martinsson,M. AldenandS.Kroll, ”2-D absoluteconcentra-tion profilesin atmosphericflamesusingplanarLIF in abi-directionallaserbeamconfig-uration”,Appl. Phys.B 65, 411-417(1997).
143
References
[74] S. Stoks,”Interpretationof 2D NO LIF imagesfrom a dieselengine”, Internal report,Universityof Nijmegen(1999).
[75] C.F. BohrenandD.R. Huffman, ”Absorption andscatteringof light by small particles”,JohnWiley & Sons,New York (1983).
[76] J.G.Carter, R.H.Huebner, R.N.HammandR.D.Birkhoff, ”Optical propertiesof graphitein theregion1100to 1300A”, Phys.Rev. A 137, A639-A641(1965).
[77] C.Schulz,V. Sick,J.Wolfrum,V. Drewes,M. ZahnandR.Maly, ”Quantitative2D single-shotimagingof NOconcentrationsandtemperaturesin atransparentSI engine”,Proc.26th
Symposium(Int’ l) onCombustion,pp.2597-2604(1996).
[78] A. Braumer, V. Sick, J. Wolfrum, V. Drewes,M. ZahnandR. Maly, ”Quantitative two-dimensionalmeasurementsof nitric oxide andtemperaturedistributionsin a transparentsquarepistonengine”,SAEpaperno.952462(1995).
[79] H. Pitsch,H. BarthsandN. Peters,”Modellierung der Schadstoffbildung bei der diesel-motorischenVerbrennung”,in A. Leipertz (ed.), ”Berichte zur Energie- und Verfahren-stechnik”,ESYTECGmbH,Erlangen(Germany), 97.1, pp.139-163(1997).
[80] I.A. Voiculescuand G.L. Borman, ”An experimentalstudy of dieselenginecylinder-averagedNOx histories”,SAEpaperno.780228(1978).
[81] Ref. [2], p. 586-587.
[82] E.J.vandenBoometal., unpublishedresults.
[83] K.P. HuberandG. Herzberg, ”Molecular spectraandmolecularstructureIV. Constantsofdiatomicmolecules”,VanNostrandReinhold,New York (1979).
[84] A.A. RadzigandB.M. Smirnov, ”Referencedataonatoms,moleculesandions”, SpringerVerlag,Berlin (1985).
[85] R.W. Nicholls, ”Approximate formulasfor Frank-Condonfactors”, J. Chem.Phys.74,6980-6981(1981).
[86] P.H. Paul, J.A. Gray, J.L. Durant Jr. and J.W. ThomanJr, ”A model for temperature-dependentcollisionalquenchingof NO A2 A8B ”, Appl. Phys.B 57, 249-259(1993).
[87] A.Y. Chang,M.D. DiRosaandR.K. Hanson,”Temperaturedependenceof collisionbroad-ening and shift in the NO A E X (0,0) bandin the presenceof argon and nitrogen”,J.Quant.Spectrosc.Radiat.Transfer47, 375-390(1992).
[88] M.P. Lee,B.K. McMillin andR.K. Hanson,”Temperaturemeasurementin gasesby useof planarlaserinducedfluorescenceimagingof NO”, Appl. Opt.32, 5379-5396(1993).
[89] G.A. Massey and C.J. Lemon, ”Feasibility of measuringtemperatureand densityfluc-tuationsin air usinglaser-inducedO2 fluorescence”,IEEE J. Quant.Electr. 20, 454-457(1984).
144
References
[90] M.P. Lee,P.H. Paul andR.K. Hanson,”Quantitative imagingof temperaturefields in airusingplanarlaser-inducedfluorescenceof O2” Opt.Lett. 12, 75-77(1987).
[91] P. Andresen,A. Bath,W. Groger, H.W. Lulf, G.MeijerandJ.J.terMeulen,”Laser-inducedfluorescencewith tunableexcimerlasersasa possiblemethodfor instantaneoustempera-turefield measurementsat highpressures:checkswith anatmosphericflame”,Appl. Opt.27, 365-378(1988).
[92] R.J.H.Klein-Douwel, J.J.L.SpaanjaarsandJ.J.ter Meulen,”Two-dimensionaldistribu-tionsof C2, CH andOH in a diamonddepositingoxyacetyleneflamemeasuredby laserinducedfluorescence”,J.Appl. Phys.78, 2086-2096(1995).
[93] R.J.H.Klein-Douwel,J.J.SchermerandJ.J.terMeulen,”CN distributionsin flamedeposi-tion of diamondandits relationto thegrowth rate,morphology, andnitrogenincorporationof thediamondlayer”, DiamondandRelatedMaterials7, 1118-1132(1998).
145

Samenvatting
Stikstofmonoxidein eendieselmotor: detectiemet laserlicht en interpretatie
Dedieselmotor, in 1897uitgevondendoorRudolfDiesel,is wereldwijdnogsteedsdemeestge-bruiktemotorvoor vrachtvervoer. Stikstofmonoxide(NO), gevormdtijdensdieselverbranding,is, naastroet, een van de meestvervuilendecomponentenin het uitlaatgasvan de dieselmo-tor. Vanwege de schadedie NO aanrichtaanhet milieu wordende eisenmet betrekkingtotde emissiessteedsstrenger. Om te kunnenblijvenvoldoenaandezesteedsscherpergesteldeeisenis het vanbelanginformatiete hebbenover devormingvanNO gedurendehetverbran-dingsproces.Dit proefschriftgaatover de ontwikkeling van eenmethodeom de hoeveelheidNO temetenmetbehulpvanlaserlichtin decilindervaneenoptischtoegankelijkedieselmotor,die loopt op commerciele dieselbrandstof.Het doel is om te bepalenwanneeren waar in deverbrandingsprocesNO gevormdwordt, doordedichtheidvanNO als functievanhet tijdstipin deverbrandingscyclusendeplaatsin decilinder te meten.
Deexperimentenzijn uitgevoerdin eeneen-cilinder, directingespotentweetaktdieselmotorwaarvan de verbrandingskameroptischtoegankelijk is gemaaktdoor kwartsvensterste mon-terenin de cilinderwanden in de cilinderkop. Bij de metingenis gebruik gemaaktvan eenverstembaregepulsteexcimeerlaser;eenbrondie eenlichtbundelmeteengoedgedefinieerdegolflengte(energie, kleur) enrichting uitzendt.Het licht vandelaser, werkendin hetultravio-lette (UV) gedeeltevanhetspectrum(193nm), kanvia een vande venstersde verbrandings-kamerbereiken. De techniekdie gebruiktwordt om NO moleculenzichtbaarte maken is delasergeınduceerdefluorescentie(LIF) detectie.Dezemeetmethodemaaktgebruikvan de ei-genschapdatmoleculenenkel licht kunnenabsorberenenuitzendenmeteenvoorhetmolecuulkarakteristieke setvangolflengtes.Als het laserlichtdatdeverbrandingskamerbinnenkomt dejuistegolflengteheeft(in resonantieis meteenenergie-overgangin hetNO molecuul)kanditdoordeNO moleculengeabsorbeerdworden,diedaardoorin eenelektronischaangeslagentoe-standkomen(excitatie). Dezetoestandis echterniet stabielennakortetijd (enkelemiljardsteseconden)vallendemoleculenterugnaarhungrondtoestandwaarbijweerlicht metdezelfdeofeenanderegolflengtewordt uitgezonden(fluorescentie).Dezefluorescentiewordt via hetven-ster in de cilinderkop gedetecteerdmet eengevoeligecamera(CCD camera).Door eenfilterte plaatsenvoor de camerakan eenspecifieke golflengtegeselecteerdworden. Eenspectrumdat informatiebevat over deaanwezigegolflengteskangemetenwordendoormetbehulpvaneenmonochromatorde fluorescentiein de verschillendegolflengtecomponentente ontleden.Wanneereenlint van laserstralingwordt gebruikten de fluorescentiein eenloodrechterich-ting wordt gedetecteerdkunnenafbeeldingen(plaatjes)vandeverdelingvanmoleculenin eentweedimensionaalvlak in deverbrandingskamerwordengemaakt.
De intensiteitvandeuitgezondenfluorescentie,plaats-entijdsopgelostgedetecteerd,is een
147
Samenvatting
maatvoor dehoeveelheidNO in demotorop eenspecifieke plaatsen tijd tijdenshetverbran-dingsproces.De intensiteitvandefluorescentieis evenredigmetdedichtheidvanNO molecu-len in hetmeetvolume.Deevenredigheidsconstantebevatechtereenaantalspectroscopischeenexperimentelefactoren(Boltzmannfactor, fluorescentieopbrengsten excitatie efficientie)dieafhangenvandeplaatselijke fysischeenchemischeomstandighedenwaarinhetNO molecuulzichbevindt. Dezeomstandigheden,beschrevendoorgroothedenalsdruk,temperatuur, laserin-tensiteitengassamenstelling,veranderengedurendedeverbrandingscyclusenzijn meestalnietconstantvoor hetgehelemeetvolume. Om gemetenfluorescentiesignalenvanNO te interpre-terenalsdichtheden,zodatmetingenop verschillendetijdstippenenplaatsenin deverbrandingmetelkaarvergelekenkunnenworden,moetrekeninggehoudenwordenmetdezeveranderendegrootheden.In hetalgemeenzijn dezegroothedenechternietdirectbekendenis hetnoodzake-lijk zevia extraexperimententeachterhalenof, indiendatnietmogelijk is, zezogoedmogelijkaf te schatten.
Het eerstehoofdstukis eenalgemeneinleiding tot het verbrandingsproceszoalszich datafspeeltin eendieselmotor. Naeenkortebeschrijvingvandewerkingvandedieselmotorwordthet algemeengangbarebeeldvan het dieselverbrandingsprocesgegeven. Dit wordt gevolgddoor enkele nieuweontwikkelingenin de theorievan dit procesnaaraanleidingvan recente,op lasertechniekengebaseerde,experimenten.Tenslottewordendeverschillendemechanismendie kunnenleidentot devormingvanNO in verbrandingsprocessensamengevat.
Hoofdstuktweebegint meteenkort overzichtvaneenaantallaserdiagnostischemethodendie gebruiktzijn voor de bestuderingvan verschillendeaspectenvan het verbrandingsprocesin dieselmotorenin experimentenbeschreven in de literatuur. De nadrukligt hierbij op LIF-metingenvoordedetectievanNO in motorenzoalsdie tot nu toezijn uitgevoerd.Dit overzichtwordt gevolgd dooreenbeschrijvingvande optischtoegankelijk gemaaktedieselmotorendeexperimenteleopstelling. Om de metingen,aaneende dagelijksepraktijk zo goedmogelijkbenaderendsysteem,te verrichten,wordt demotoronderstabieleconditiesenop commercieledieselbrandstofbedreven.Groothedenzoalsdedruk in decilinder, degemiddeldetemperatuurvanhetgasin decilinder, de temperatuurvandegloeienderoetdeeltjesenhetwarmteverlooptijdenshet verbrandingsproceszijn bepaald.Verderwordende optischetechnieken beschre-ven die in dit proefschrifttoegepastzijn. Naastde LIF-techniekzijn dat de detectievan hetnatuurlijke licht vandevlammenendedetectievanhet laserlichtdatelastisch(zonderveran-deringvangolflengte)verstrooidis (Mie verstrooiing).Aan heteindvandit hoofdstukwordenenkele meetresultatengegeven, die het mogelijk maken om de meestgeschikteexcitatie- endetectiegolflengteste bepalenom NO in deverbrandingskamervandemotor te metenmetdeLIF-techniek.Het is gebleken,dathetmethetgebruiktelaserlichtniet te vermijdenis bij hogetemperaturentevens‘warm’ zuurstof(O2) teexciteren,waarvandefluorescentieinterfereertmetdefluorescentievanNO. Daaromis hetnoodzakelijk voor deexcitatieeengolflengtete kiezendieresulteertin eenminimaleO2 fluorescentieenvoordedetectievanNO eengolflengtegebieddatgeenoverlapheeftmetO2 fluorescentie.
De intensiteitvanhetlaserlichtin deverbrandingskamerneemtaf alsgevolg vanverstrooi-ing aanenabsorptiedoor roetdeeltjesenbrandstof-enoliedruppels.Hoofdstukdrie beschrijfteenexperimentwaarineenmethodeis ontwikkeld om delokaleverzwakkingscoefficientvoorhet laserlichtte bepalen,die gebruiktkan wordenom de lokale laserintensiteitte berekenen.Dezemethodemaaktgebruikvan tweegelijktijdig opgenomenplaatjesvan het elastischver-strooidelicht van tweelaserbundelsdie in tegengestelderichting, maarvia hetzelfdepad,de
148
Samenvatting
verbrandingskamerdoorkruisen.Beideplaatjesrepresenterendezelfdesituatiein de verbran-dingskamer, echtermet eenanderebelichting. Via eenaantalwiskundigebewerkingenkanhet effect van de belichtinguit de plaatjesgeelimineerdworden. Tevenskan uit de verzwak-kingscoefficientdetotaletransmissievanhetlaserlichtdoordeverbrandingskamerbepaaldwor-den. Omdatdezemethodenogalomslachtigis, is eenietsminderexactemethodeontwikkeldwaarbijde lokale intensiteitvanhet laserlichtin deverbrandingskamerwordt gereconstrueerduit een enkel plaatjevan het resonantverstrooidelaserlichten de totale transmissiedoor decilinder.
De resultatenvandeeersteLIF-experimentenaanNO wordengepresenteerdin hoofdstukvier. Hierin wordenspectragegevenvandefluorescentie,ontleedin deverschillendegolfleng-tecomponenten,als eenfunctie van het tijdstip in de verbrandingscyclus. DezespectratonenaandatfluorescentievanNO gedetecteerdkanwordengedurendehet totaleverbrandingspro-ces,zelfs op het momentdat de zuiger zich geheelbovenin de cilinder bevindt en druk entemperatuurhet hoogstzijn. De spectragemetenin het begin van de verbrandinglatennaastNO fluorescentieinterfererendefluorescentievanO2 zien.De intensiteitvandeNO fluorescen-tiepiekenin despectrais eenmaatvoordehoeveelheidNO dieaanwezigis in hetmeetvolume.Het bewerkenvanhetfluorescentiesignaalvoor deveranderendeconditiesin deverbrandings-kamerresulteertin eencurve die derelatieve dichtheidvanNO alseenfunctievanhet tijdstipin de verbrandinggeeft. Relatieve dichtheidscurven van NO zijn bepaaldvoor verschillendemotorcondities,zoalsbelastingen brandstoftype.Voor zover het is onderzochtis de invloedvan de motorconditiesen de brandstofop de hoeveelheidNO klein. Uit de gevondencurvenkandeconclusiegetrokkenwordendatdevormingvanNO langzaamop gangkomt endathetmeesteNO relatieflaatin deverbrandingwordtgevormd.Dit suggereertdatdediffusefasevanhetdieselverbrandingsproceseenbelangrijke rol speeltin hetformatieprocesvanNO.
Fluorescentieverdelingenvan NO gedurendehet verbrandingsproces,gemetendoor eensmalbandigfilter dat enkel de voor NO specifieke golflengtedoorlaat,zijn gegeven in hoofd-stukvijf. In hetbegin vandeverbrandingkondengeenverdelingenvanNO gemetenwordenals gevolg van de te lagelaserintensiteitin het meetvolume. De gemetenfluorescentieverde-lingen zijn bewerkt voor de afnemendeintensiteitvan het laserlicht. Dezeverdelingenzijngeınterpreteerdals dichtheidsverdelingenvan NO onderde aannamesvan uniformetempera-tuurverdelingengassamenstelling.Dezeaannameskunnengemaaktwordenaanheteindvande verbrandingscyclus waarde verbrandingsproductenredelijk homogeenverdeeldzijn. Omverdelingen,gemetenin hetbegin vandeverbranding,goedtekunneninterpreterenis hetechternoodzakelijk delokaletemperatuurengassamenstellingtekennen.Degevondendichtheidsver-delingenlateneenredelijk uniformeverdelingvanNO zien,wat te verwachtenis aanheteindvandeverbrandingwaarhetgevormdeNO reedsgemengdis metderestvandecilinderinhoud.Tenslotteis eencurve vanderelatieve dichtheidvanNO als functievandetijd in hetverbran-dingsprocesbepaalddoorde intensiteitin dedichtheidsverdelingente integreren.Dezecurvekomt goedovereenmetdecurvebepaalduit despectra.
In hetafsluitendehoofdstukzeswordendebelangrijksteresultatenenaannamessamenge-vat. Besprokenwordt welke informatiegemistwordt of onvolledig is om deLIF-signalenvanNO volledig te kunnenkwantificerenen welke experimentengedaanzoudenkunnenwordenomdezeinformatieteverkrijgen.Tevenswordtbediscussieerdin hoeverrehethaalbaaris in detoekomstook daadwerkelijk kwantitative dichtheidsverdelingenvanNO gedurendehetgeheleverbrandingsprocestebepalenmetbehulpvandeLIF-techniek.
149

Curriculum Vitae
Op 5 november1969benik geborente Wijchenwaarik ook de lagereschoolhebdoorlopen.Hierna volgde de middelbareschoolperiodeop het DominicusCollege te Nijmegen,die in1988werdafgeslotenmethetbehalenvanhetVWO-diploma.Aansluitendbenik natuurkundegaanstuderenaandeKatholieke UniversiteitNijmegen(KUN), waarik naeenjaar mijn pro-pedeusebehaalde.OpdeafdelingMolecuul-enLaserfysicahebik mijn afstudeerstagegedaan,begeleiddoorAdrianMarijnissenenHansterMeulen.Mijn afstudeerwerkbetroflaserspectro-scopieaankortlevendemoleculengevormdin eengepulsteontlading.Na hetbehalenvanhetdoctoraaldiplomain januari1994,benik begonnenalsonderzoeker in opleiding(OIO) onderbegeleidingvan Hanster Meulen,Nico Dam en Leo Meertsbij ToegepasteFysica,eveneensaandeKUN. Mijn promotieonderzoekbestonduit hetontwikkelenvaneenmethodeom stik-stofmonoxide(NO) tedetecterenin deverbrandingskamervaneendieselmotormetbehulpvanlasertechniekenenhetinterpreterenvandegemetensignalenalsNO dichtheden.De resultatenvan dit onderzoekvindt u terug in dit proefschrift. Tijdensmijn studie-en promotietijdhebik eerste-en tweedejaarsnatuurkunde-en scheikundestudentengeassisteerdbij het practicumnatuurkunde.Tevensbenik werkcollege-assistentgeweestbij hetcollegeAtoom-enMolecuul-fysica. Ook heb ik in mijn onderzoekstijdstudentenbegeleidbij hun afstudeerwerk.In juli1999benik begonnenalspostdoconderzoekeraandeTechnischeUniversiteitDelft (TUD).
151

Publications
S Generationof 224nmradiationby stimulatedRamanscatteringof ArF excimerlaserradiationin amixtureof H2/D2.G.G.M.Stoffels,P. Schmidt,N. DamandJ.J.terMeulen,AppliedOptics,36, 6797-6801(1997).
S Imagingandpost-processingof laser-inducedfluorescencefrom NO in adieselengine.Th.M. Brugman,G.G.M.Stoffels,N. Dam,W.L. MeertsandJ.J.terMeulen,AppliedPhysicsB, 64, 717-724(1997).
S In-cylindermeasurementsof NO in arunningdieselengineby meansof LIF diagnostics.G.G.M.Stoffels,Th.M. Brugman,C.M.I. Spaanjaars,N. Dam,W.L. MeertsandJ.J.terMeulen,in Challengesin PropellantsandCombustion,100YearsAfter Nobel,FourthInternationalSymposiumon SpecialTopicsin ChemicalPropulsion,Begell house,New York, pp. 972-982(1997).
S Imagingof anunderexpandednozzleflow by UV laserRayleighscattering.N.J.Dam,M. Rodenburg, R.A.L. Tolboom,G.G.M.Stoffels,P.M. Huisman-KleinherenbrinkandJ.J.terMeulen,Experimentsin Fluids,24, 93-101(1998).
S In-cylindermeasurementsof NO formationin adieselengine.G.G.M.Stoffels,E.J.vandenBoom,C.M.I. Spaanjaars,N. Dam,W.L. Meerts,J.J.terMeulen,J.C.L.Duff andD.J.Rickeard,SAEpaperno.1999-01-1487(1999).
S Laserdiagnosticsof nitric oxideinsideaDI two-strokedieselengine.G.G.M.Stoffels,E.J.vandenBoom,C.M.I. Spaanjaars,N. Dam,W.L. MeertsandJ.J.terMeulen,to bepublishedin LaserTechniquesApplied to Fluid Mechanics,SelectedPapersfrom the9th InternationalSymposium,Lissabon,Portugal,13-16July, 1998,SpringerVerlag,Berlin (1999).
153
Publications
S Methodsto correctplanarLIF distributionsfor localnon-uniformlaserattenuation.G.G.M.Stoffels,S.Stoks,N. DamandJ.J.terMeulen,submittedto AppliedOptics(1999).
S PlanarLIF measurementsof NO distributionsin a realisticdieselengine,in relationto temperatureandchemicalcompositioninhomogeneities.G.G.M.Stoffels,C.M.I. Spaanjaars,N. DamandJ.J.terMeulen,submittedto AppliedPhysicsB (1999).
S Nitric oxidedensitiesin a realisticdieselenginemeasuredbyplanarandbackscatterLIF.G.G.M.Stoffels,C.M.I. Spaanjaars,N. DamandJ.J.terMeulen,in preparation.
154