Refractive-index and density matching in concentrated particle ...
Upload
khangminh22Category
view
3download
0
Janu
ary 2004
R E S E A R C H R E P O R T
H E A L T HE F F E CTSINSTITUTE
101 Federal Street, Suite 500
Boston, MA 02110, USA
+1-617-488-2300
www.healtheffects.org
R E S E A R C HR E P O R T
H E A L T HE F F E CTSINSTITUTE
Number 145
November 2009
Number 145November 2009
PRESSVERSION
Effects of Concentrated Ambient Particles and Diesel Engine Exhaust on Allergic Airway Disease in Brown Norway Rats
Jack R. Harkema, James G. Wagner, Norbert E. Kaminski, Masako Morishita, Gerald J. Keeler, Jacob D. McDonald, and Edward G. Barrett


Effects of Concentrated Ambient Particles and Diesel Engine Exhaust on Allergic Airway
Disease in Brown Norway Rats
Jack R. Harkema, James G. Wagner, Norbert E. Kaminski, Masako Morishita,Gerald J. Keeler, Jacob D. McDonald, and Edward G. Barrett
with a Critique by the HEI Health Review Committee
Research Report 145
Health Effects Institute
Boston, Massachusetts
Trusted Science
·
Cleaner Air
·
Better Health

Publishing history: The Web version of this document was posted at
www.healtheffects.org
in November 2009and then finalized for print.
Citation for document:
Harkema JR, Wagner JG, Kaminski NE, Morishita M, Keeler GJ, McDonald JD, Barrett EG. 2009. Effects of Concentrated Ambient Particles and Diesel Engine Exhaust on Allergic Airway Disease in Brown Norway Rats. HEI Research Report 145. Health Effects Institute, Boston, MA.
© 2009 Health Effects Institute, Boston, Mass., U.S.A. Asterisk Typographics, Barre, Vt., Compositor. Printed by Recycled Paper Printing, Boston, Mass. Library of Congress Catalog Number for the HEI Report Series: WA 754 R432.
Cover paper: made with at least 55% recycled content, of which at least 30% is post-consumer waste; freeof acid and elemental chlorine. Text paper: made with 100% post-consumer waste recycled content; acid free;no chlorine used in processing. The book is printed with soy-based inks and is of permanent archival quality.

C O N T E N T S
About HEI vii
About This Report ix
Preface xi
HEI STATEMENT 1
INVESTIGATORS’ REPORT by Harkema et al. 5
ABSTRACT 5
INTRODUCTION 6
SPECIFIC OBJECTIVES 7
STUDY DESIGNS, METHODS, AND MATERIALS 8
Design of Inhalation Studies of CAPs in Detroit 8
Design of Inhalation Studies of DEE 10
Sampling Methods for CAPs and DEPs in Inhalation Exposure Chambers 12
ANALYTICAL METHODS FOR AMBIENT PARTICLES, CAPS, AND DEPS 12
Gravimetric Analysis 12
Ion Analysis 12
Carbon Analysis 13
Trace Element Analysis 13
Lung Tissue Digestion Procedure and Retained Element Analysis 13
Speciated Organic Analysis 13
URBAN AMBIENT AEROSOL AND GASEOUS POLLUTANT MEASUREMENTS 14
PM2.5 and MOI 14
Annular Denuder/Filter Pack Systems 14
TEOM 14
Scanning Mobility Particle Sizer (SMPS) 14
O3 14
CO 14
Total Nitrogen Oxides (NOx) 14
SO2 15
STATISTICAL ANALYSES FOR AMBIENT AIR, CAPS, AND DEPS 15
ANIMAL NECROPSIES AND TISSUE SELECTION FOR ANALYSIS 15
AIRWAY TISSUE SELECTION AND PROCESSING FOR AIRWAY MORPHOMETRY 16

Research Report 145
MORPHOMETRIC ANALYSIS OF IM IN AIRWAY EPITHELIUM 16
Numeric Epithelial Cell Density 16
Epithelial Cell Labeling Index and Systemic Deliveryof Bromodeoxyuridine (BrdU) 16
ANALYSES OF BALF 17
Cellularity 17
Total Protein 17
Mucin Glycoprotein 17
OVA-Specific IgE 17
Elastase and �-Glucuronidase 17
Cytokines 17
GENE EXPRESSION ANALYSIS OF AIRWAY MUCIN AND INFLAMMATORY CYTOKINES 17
STATISTICAL ANALYSES OF BIOLOGIC ENDPOINTS 18
RESULTS 18
Chemical and Physical Characterization of Ambient PM2.5 18
Chemical and Physical Characterization of CAPs 18
Trace Elements from Particles Retained in Lung Tissues of CAPs-Exposed Rats 21
Biologic Changes Related to CAPs Exposures in Detroit 21
Results of Inhalation Studies of DEE 32
Chemical and Physical Characterization of DEPs 33
Trace Elements in Lung Tissue of DEE-Exposed Rats 33
BIOLOGIC CHANGES RELATED TO DEE EXPOSURES 34
Study 1: Exposure to DEE During Allergen Sensitization 34
Study 2: Exposure to DEE During Allergen Challenge 39
DISCUSSION 42
CAPs Inhalation Studies in SW Detroit 42
DEE Studies 46
CONCLUSION 48
REFERENCES 48
ABBREVIATIONS AND OTHER TERMS 54
Elements 55

Research Report 145
CRITIQUE by the Health Review Committee 57
INTRODUCTION 57
BACKGROUND 57
Asthma 57
Exposure to CAPs in Animal Models of Human Airway Disease 57
Exposure to Diesel Exhaust in Humans and Other Species 58
OBJECTIVES AND SPECIFIC AIMS 59
STUDY DESIGN 59
CAPs Collection and Exposures 59
Exposure to DEE 59
Biologic Endpoints 60
Detection of Trace Elements 60
Statistical Analysis 60
RESULTS 60
Physical and Chemical Characterization of Exposure Atmospheres 60
Biologic Endpoints 61
HEI EVALUATION 63
SUMMARY AND CONCLUSIONS 65
ACKNOWLEDGMENTS 66
REFERENCES 66
RELATED HEI PUBLICATIONS 69
HEI BOARD, COMMITTEES, AND STAFF 71


A B O U T H E I
vii
The Health Effects Institute is a nonprofit corporation chartered in 1980 as an independent research organization to provide high-quality, impartial, and relevant science on the effects of air pollution on health. To accomplish its mission, the institute
• Identifies the highest-priority areas for health effects research;
• Competitively funds and oversees research projects;
• Provides intensive independent review of HEI-supported studies and related research;
• Integrates HEI’s research results with those of other institutions into broader evaluations; and
• Communicates the results of HEI research and analyses to public and private decision makers.
HEI receives half of its core funds from the U.S. Environmental Protection Agency and half from the worldwide motor vehicle industry. Frequently, other public and private organizations in the United States and around the world also support major projects or certain research programs. HEI has funded more than 280 research projects in North America, Europe, Asia, and Latin America, the results of which have informed decisions regarding carbon monoxide, air toxics, nitrogen oxides, diesel exhaust, ozone, particulate matter, and other pollutants. These results have appeared in the peer-reviewed literature and in more than 200 comprehensive reports published by HEI.
HEI’s independent Board of Directors consists of leaders in science and policy who are committed to fostering the public–private partnership that is central to the organization. The Health Research Committee solicits input from HEI sponsors and other stakeholders and works with scientific staff to develop a Five-Year Strategic Plan, select research projects for funding, and oversee their conduct. The Health Review Committee, which has no role in selecting or overseeing studies, works with staff to evaluate and interpret the results of funded studies and related research.
All project results and accompanying comments by the Health Review Committee are widely disseminated through HEI’s Web site (
www.healtheffects.org
), printed reports, newsletters, and other publications, annual conferences, and presentations to legislative bodies and public agencies.


A B O U T T H I S R E P O R T
ix
Research Report 145,
Effects of Concentrated Ambient Particles and Diesel Engine Exhaust on Allergic Airway Disease in Brown Norway Rats
, presents a research project funded by the Health Effects Institute and conducted by Dr. Jack R. Harkema of the Department of Pathobiology and Diagnostic Investigation, Michigan State University, East Lansing, Michigan, and his colleagues. This report contains three main sections.
The HEI Statement
, prepared by staff at HEI, is a brief, nontechnical summary of the study and its findings; it also briefly describes the Health Review Committee’s comments on the study.
The Investigators’ Report
, prepared by Harkema and colleagues, describes the scientific background, aims, methods, results, and conclusions of the study.
The Critique
is prepared by members of the Health Review Committee with the assistance of HEI staff; it places the study in a broader scientific context, points out its strengths and limitations, and discusses remaining uncertainties and implications of the study’s findings for public health and future research.
This report has gone through HEI’s rigorous review process. When an HEI-funded study is completed, the investigators submit a draft final report presenting the background and results of the study. This draft report is first examined by outside technical reviewers and a biostatistician. The report and the reviewers’ comments are then evaluated by members of the Health Review Committee, an independent panel of distinguished scientists who have no involvement in selecting or overseeing HEI studies. During the review process, the investigators have an opportunity to exchange comments with the Review Committee and, as necessary, to revise their report. The Critique reflects the information provided in the final version of the report.


P R E F A C E
HEI’s Research on Particles and the Exacerbation of Allergy and Asthma
Particles emitted from a number of sources (e.g.,diesel and gasoline vehicles, electric power plants, andfactories), and formed from gases also emitted fromthese sources, contribute to the exposure of urbanpopulations to particulate matter (PM). Epidemiologicand experimental studies published in the 1990s sug-gested the possibility of adverse effects on the respira-tory and immune systems of people exposed to dieselexhaust and other par ticles on a shor t-term basis;these effects could be more severe in persons withasthma and other allergic diseases. Some of thesestudies raised the question of whether various constit-uents of traffic-generated air pollution (including dieselexhaust particles) might contribute to an increase insymptoms of asthma or rhinitis or might enhanceimmune responses to allergens. In reviewing this liter-ature, however, the HEI Health Research Committeenoted that the epidemiologic studies did not measureambient concentrations of individual pollutants, andmany of the experimental studies did not use relevantexposure routes and particle doses. Thus the Commit-tee considered that additional research with improvedmeasures of exposure and outcomes was needed toelucidate dose–response relationships.
In 2000, HEI issued Request for Applications (RFA)00-1, Effects of Diesel Exhaust and Other Particles on theExacerbation of Asthma and Other Allergic Diseases. TheRFA sought studies that would provide a better under-standing of whether, and by what mechanism, particlesfrom diesel engines and other sources may contributeto the frequency and severity of asthma attacks andto the exacerbation of allergic responses — especiallyin susceptible groups such as children, older people,and people with chronic airway diseases. The Commit-tee was interested in research proposals for epidemio-logic studies, studies of controlled exposure inhumans, and animal studies.
RFA 00-1 was part of a larger HEI effort to studythe effects on human health of exposure to currentand future diesel particulate emissions and to investi-gate how the toxicity of diesel particles compares withthat of other ambient par ticles. HEI’s earlier effor tsincluded a comprehensive review of the health effectsassociated with diesel emissions (HEI Diesel WorkingGroup 1995) and a project initiated in 1998 to exam-ine more closely the epidemiologic studies used inquantitative risk assessment (HEI Diesel EpidemiologyExpert Panel 1999).
Four studies have been funded under RFA 00-1;one is presented in this Research Repor t, one waspublished in 2008, one in 2009, and one is underreview by HEI. All four are described briefly below. Foradditional information on this research program, seethe HEI Program Summary Research on Diesel Exhaustand Other Particles (2003).
“Fine Airborne Particles and Allergic Airway Disease,” Jack Harkema, Michigan State University
The study by Harkema and colleagues that is pre-sented in this repor t (HEI Research Repor t 145,Effects of Concentrated Ambient Particles and DieselEngine Exhaust on Allergic Airway Disease in Brown Nor-way Rats) is the third of the four studies to be com-pleted and published (Harkema et al. 2009). Theinvestigators evaluated the effects on epithelial cellremodeling and inflammation in the airways of BrownNorway rats inhaling either whole diesel exhaust orconcentrated ambient particles during the initial (sen-sitization phase) or subsequent (challenge phase) ex-posure to an airborne allergen. The underlying hypoth-esis was that inhalation of particles during either sensi-tization or challenge causes airway remodeling andexacerbates airway inflammation.
Health Effects Institute Research Report 145 © 2009 xi

xii
Preface
“The Relationship Between Pollutant Particles in Alveolar Macrophages from Normal Children and Proxy Markers of PM10 Exposure,” Jonathan Grigg, University of Leicester, Leicester, United Kingdom
The study by Grigg and colleagues examinedwhether the detection of PM (which was not specific todiesel) in macrophages obtained from sputum could beused as a biomarker of PM exposure in children. Theinvestigators also explored the relationship between PMload in macrophages and markers of inflammation inchildren’s lungs. This study was published as HEI ResearchReport 134, Black-Pigmented Material in Airway Macro-phages from Healthy Children: Association with Lung Func-tion and Modeled PM10 (Grigg et al. 2008).
“Health Effects of Diesel Exhaust in Asthmatics: A Real-World Study in a London Street,” Junfeng (Jim) Zhang, University of Medicine and Dentistry of New Jersey–School of Public Health
The study by Junfeng (Jim) Zhang and colleaguesused two locations in London, United Kingdom, tostudy the effects of a real-world exposure to urbandiesel traffic in persons with mild or moderate asthma.The study tested the hypotheses that exposure to die-sel exhaust leads to worsening of asthma symptoms,with a reduction in lung function and an increase in oxi-dative stress and inflammation in the airways, and thatsuch effects are dependent on the severity of asthma.Each subject participated in an experimental exposuresession and a control exposure session by walking ineach site for two hours while portable monitors deter-mined concentrations of selected air pollutants. Theexposure site was a busy street (Oxford Street) wheremotor-vehicle traffic was restricted to taxis and buses,the majority of which were powered by diesel engines;the control site was a nearby park with no motor-vehicletraffic (Hyde Park). The subjects’ asthma symptoms,pulmonary function, and indicators of inflammationand oxidative stress were subsequently measured. Thisstudy was published as HEI Research Repor t 138,Health Effects of Real-World Exposure to Diesel Exhaustin Persons with Asthma (Zhang et al. 2009).
“Exacerbation of Allergic Inflammation in the Lower Respiratory Tract by Diesel Exhaust Particles,” Mark A. Riedl, University of California–Los Angeles School of Medicine (original Principal Investigator, David Diaz-Sanchez, now at the U.S. Environmental Protection Agency)
The goal of the study by Effros and colleagues wasto evaluate the effects on the immune system and
lung function of the inhalation of diesel exhaust emis-sions in asthmatic subjects. The study compared theeffects of exposure to whole diesel exhaust and toNO2, which is a major component of the gas phaseof diesel exhaust, in asthmatic subjects and in asth-matic subjects who were also allergic to cat dander.The final repor t for this study is currently beingreviewed at HEI.
ADDITIONAL STUDIES
While the studies funded by this RFA were inprogress, the U.S. Environmental Protection Agencyintroduced lower PM emission standards for heavy-duty diesel engines, which are expected to result inlower concentrations of several pollutants in ambientair. As part of an effort to assess how emissions andhealth effects of diesel engines may be changing withthe introduction of new technologies developed tomeet the new standards, HEI initiated the AdvancedCollaborative Emissions Study (ACES), in collaborationwith the Coordinating Research Council, a nonprofitorganization that directs research on automotive tech-nologies and fuels. The study has two main compo-nents: a recently completed characterization of theemissions from four heavy-duty diesel engines meetingthe 2007 PM standards (Coordinating Research Coun-cil 2009), and a chronic inhalation bioassay in rodentsto evaluate both short- and long-term health effects ofthe emissions of one of the four engines. As the newdiesel fleet slowly replaces older models, it will also beimportant to document the associated changes in airquality and health.
REFERENCES
Coordinating Research Council. 2009. Phase I of theAdvanced Collaborative Emissions Study. CRC Report:ACES Phase 1. CRC, Alpharetta, GA. Available fromwww.crcao.com/reports/recentstudies2009/ACES%20Phase%201/ACES%20Phase1%20Final%20Report%2015JUN2009.pdf.
Grigg J, Kulkarni N, Pierse N, Rushton L, O’CallaghanC, Rutman A. 2008. Black-Pigmented Material inAirway Macrophages from Healthy Children: As-sociation with Lung Function and Modeled PM10.Research Report 134. Health Effects Institute, Boston,MA.
Harkema JR, Wagner JG, Kaminski NE, Morishita M,Keeler GJ, McDonald JD, Barrett EG. 2009. Effects of

Preface
Concentrated Ambient Par ticles and Diesel EngineExhaust on Allergic Airway Disease in Brown NorwayRats. Research Report 145, Health Effects Institute,Boston, MA.
Health Effects Institute. 2000. Fall 2000 ResearchAgenda.
Health Effects Institute. 2003. Research on DieselExhaust and Other Par ticles. Program Summary.Health Effects Institute, Boston, MA.
HEI Diesel Epidemiology Expert Panel. 1999. DieselEmissions and Lung Cancer : Epidemiology and Quan-
titative Risk Assessment. Special Report. Health EffectsInstitute, Cambridge, MA.
HEI Diesel Working Group. 1995. Diesel Exhaust: ACritical Analysis of Emissions, Exposure, and HealthEffects. Special Report. Health Effects Institute, Cam-bridge, MA.
Zhang J, McCreanor JE, Cullinan P, Chung KF, Ohman-Strickland P, Han I-K, Järup L, Nieuwenhuijsen MJ. 2009.Health Effects of Real-World Exposure to DieselExhaust in Persons with Asthma. Research Report 138,Health Effects Institute, Boston, MA.
xiii


Synopsis of Research Report 145H E I S T A T E M E N T
Effects of Concentrated Ambient Particles and Diesel Emissions on Rat Airways
BACKGROUND
In the 1990s, results from several epidemiologicand controlled-exposure studies suggested an asso-ciation between exposure to air pollution fromtraffic-derived particulate matter (PM) and increasesin symptoms of airway diseases, including exacer-bation of asthma. Some results also suggested thatexhaust from diesel engines contributed to theseeffects. To address some of the questions raised bythese findings, HEI issued Request for Applications00-1, “Effects of Diesel Exhaust and Other Particleson the Exacerbation of Asthma and Other AllergicDiseases.” In response, Dr. Jack R. Harkema, Mich-igan State University (MSU), and colleagues pro-posed a study to investigate how the inhalation ofPM2.5 (PM with an aerodynamic diameter � 2.5 µm)concentrated from ambient air (concentrated am-bient particles, CAPs) or diesel engine exhaust (DEE)would affect the airway inflammatory and allergicresponses to the airborne allergen ovalbumin (OVA)in a rat model of asthma. Harkema and his col-leagues proposed to expose rats to the pollutantsat critical points in the induction of the allergicresponse, namely, the initial or sensitization phaseand the second or challenge phase. The investiga-tors hypothesized that inhalation of CAPs or DEEduring sensitization or challenge would enhanceinflammatory responses in the airways. The HEIHealth Research Committee recommended the pro-posal for funding.
APPROACH
The study was conducted in two different loca-tions: the CAPs study in Michigan (exposures inDetroit and analysis at MSU in East Lansing) andthe DEE study at the Lovelace Respiratory ResearchInstitute (LRRI) in Albuquerque, New Mexico. The
same OVA sensitization and challenge regimen wasused in both the CAPs and DEE studies: BrownNorway rats were sensitized by intranasal instilla-tion of a 0.5% solution of OVA (or saline as a control)on days 1 through 3; they rested for days 4 through14 and were challenged intranasally with a 1.0%solution of OVA (or saline) on days 15 through 17.
In Detroit, Harkema and colleagues used a mobileresearch facility that they had used in a previouslyfunded HEI study to collect CAPs from an area ofthe city with a higher-than-average prevalence ofasthma. On the same 3 days that groups of rats werechallenged with OVA or saline (days 15–17), the in-vestigators exposed the rats to CAPs for 8 hours/dayin the mobile facility. The two 3-day exposures,conducted in two different weeks, are referred to asCAPs Experiments 1 and 2 in this document andthe Critique prepared by the HEI Health ReviewCommittee in its independent review of the study.The investigators made measurements of PM mass;elemental carbon and organic carbon (EC and OC);sulfate, nitrate, and ammonium ions; pollutant gases(ozone, carbon monoxide [CO], sulfur dioxide [SO2],and total nitrogen oxides [NOx]); several organicspecies including polycyclic aromatic hydrocarbons(PAHs); and several trace elements in both ambientair and CAPs. The mobile laboratory also collectedmeteorological measurements.
At the LRRI, a team led by Dr. Joe Mauderly pro-duced DEE from a single-cylinder 5500-watt dieselengine generator using number 2 nationally certifieddiesel fuel. The PM and gaseous components of DEEwere characterized physically and chemically as inthe CAPs substudy. Whole-body exposures to DEEat either 30 or 300 µg/m3 PM (or to filtered air as acontrol) were conducted for 8 hours/day for 3 dayson the same days as either sensitization (days 1–3)or challenge (days 15–17) with OVA or saline.
This Statement, prepared by the Health Effects Institute, summarizes a research project funded by HEI and conducted by Dr. Jack R.Harkema, Department of Pathobiology and Diagnostic Investigation, Room 218, National Food Safety and Toxicology Building, East Lansing,MI 48864, and colleagues. Research Report 145 contains both the detailed Investigators’ Report and a Critique of the study prepared by theInstitute’s Health Review Committee.
1

Research Report 145
2
In both the CAPs and DEE studies, rats werekilled on day 18 and airway tissues from the noseand lung were harvested and bronchoalveolar lavagefluid (BALF) was collected. Total and differential cellcounts and levels of secreted mucin glycoprotein(Muc5AC), total protein, elastase, �-glucuronidase,multiple cytokines, and other soluble mediators in-cluding OVA-specific immunoglobulin E (IgE) wereevaluated in the BALF. Fixed nasal, and proximaland distal axial pulmonary airways were examinedmorphometrically to assess characteristics of inflam-mation in the airways, which included mucus cellmetaplasia and an increase in stored intraepithelialmucosubstances (IM) in airway epithelial cells. Theinvestigators also used bromodeoxyuridine (BrdU)labeling to assess the number of surface epithelialcells synthesizing DNA in the axial airways. Levelsof RNA specific for mucin and multiple cytokineswere also assessed in lung tissue.
RESULTS
The concentrator in the mobile laboratory inDetroit preferentially concentrated particles around0.6 µm and smaller in diameter from ambient air,and by 20- to 31-fold based on PM2.5 mass. Some PMcomponents in the CAPs (e.g., some trace metals)were concentrated in proportion to their mass inambient air, but others, including EC and OC,showed some variation. In both CAPs Experiments1 and 2 the proportions of the major identifiable com-ponents of CAPs — OC, sulfate, nitrate, and ammo-nium ions — were similar, but levels of several tracemetals — including Rb, Ni, Fe, and Al —were higherduring CAPs Experiment 1 than Experiment 2.Ambient concentrations of several components ofthe PM mix that were not concentrated —ultrafineparticles (diameter � 0.1 µm), PAHs, and the pol-lutant gases SO2 and NOx, were also higher duringCAPs Experiment 1 than Experiment 2.
At the LRRI most of the particles derived from thediesel generator were in the ultrafine range, andthe major chemical component was EC, followedby OC (6%–14%), with small amounts of inorganicions and trace metals. Levels of NOx and CO in thehigh-diesel-exposure atmosphere were approxi-mately 4 ppm.
At both study sites OVA sensitization and chal-lenge of rats resulted in several features of aninflammatory response in the nasal and pulmonaryareas. In the absence of sensitization and challenge
with OVA, exposure to either CAPs alone or DEEalone had few biologic effects.
Exposure to CAPs during OVA challenge in CAPsExperiment 1 increased some features of the OVA-induced inflammatory response in the lungs — theseverity and extent of distribution of detectedpathology in the bronchi and alveoli; total numberof cells (particularly eosinophils and lymphocytes);levels of total protein, Muc5AC, and tumor necro-sis factor � in BALF; and levels of IM in proximaland distal pulmonary airways—but decreased levelsof several cytokine-specific RNAs in lung tissue.Levels of nearly all measured cytokines and OVA-specific IgE (a characteristic of an allergic immuneresponse) in BALF were not affected. Few, if any,effects of CAPs during OVA challenge on inflamma-tory or immune endpoints were detected in CAPsExperiment 2. No effects of CAPs during OVA chal-lenge were detected in the nose in either CAPsexperiment.
The effects of DEE exposure on OVA sensitiza-tion and OVA challenge were mild, and the patternof DEE-associated changes was quite complicated.First, in both sensitization and challenge sub-studies, greater effects were observed at the lowerDEE exposure concentration, 30 µg/m3 PM, than atthe higher, 300 µg/m3 PM; few effects were detectedat the high-level DEE exposure. Second, exposureto the low-level DEE during OVA sensitization pre-dominantly enhanced inflammatory endpoints in-duced by OVA alone, whereas exposure to the samelevel of DEE during OVA challenge attenuatedinflammatory endpoints induced by OVA alone. Nochanges in levels of OVA-specific IgE were detected,and no effects of DEE exposure during either OVAsensitization or challenge were detected in the nose.
SUMMARY AND CONCLUSIONS
In its independent review of the study, HEI’sHealth Review Committee thought that Harkemaand colleagues successfully designed and conducteda descriptive study to evaluate the effects of twopollutants — CAPs (concentrated PM2.5) and DEE —in a rodent model of asthma. The model had somebut not all characteristics of the human disease,so caution should be used in extrapolating dataobtained in the model to humans.
The most surprising findings were the relativelack of effect of high-level DEE (300 µg/m3 PM)exposure in the model, which used rats sensitized

Research Report 145
and challenged with the airborne allergen OVA. Inaddition, low-level DEE exposure (30 µg/m3 PM)during allergen sensitization mildly enhanced in-flammatory responses, but the same exposure dur-ing allergen challenge attenuated several effects ofexposure to OVA alone.
These findings differ from those of previous diesel-exposure studies, which have reported enhancementof inflammatory and allergic responses in humanswhen exposed and in animal models. Differencesin findings could be the result of the lower levelsof diesel emissions used in the current study com-pared with some previous studies. Another possibleexplanation is that in some prior diesel-exposurestudies rodents and humans were administereddiesel particles, rather than the whole emissionsused in the current study. Thus, the presence ofgases in the DEE used in the present study couldbe hypothesized to have inhibited responses to thediesel particulate fraction. On the other hand, somecontrolled human studies of exposure to DEE —which clearly contained both gaseous and particulatecomponents — have shown limited enhancement ofallergic and inflammatory responses, findings in-consistent with the notion that gases found in dieselemissions might have inhibited a diesel-particulate-mediated enhancement of allergic and inflamma-tory responses that would otherwise have occurred.
The Committee also thought that the investigatorsmade good use of a mobile air research laboratory toexpose rats to CAPs at a site where the prevalence ofasthma in the population is higher than average. InCAPs Experiment 1, exposure to CAPs during the3 days of OVA sensitization enhanced some allergic
and inflammatory endpoints, a finding consistentwith data from previous studies, but that was notobserved in CAPs Experiment 2. Differences in thefindings of the two CAPs experiments suggest thatthe observed differences in composition of CAPs,and hence sources of PM2.5, in the different weeksthat CAPs were collected may be factors in deter-mining the pattern of response obtained. However,the investigators did not perform analyses to iden-tify sources of pollutants. In addition, in contrast tothe investigators, the Committee was not convincedthat the multiple elements whose levels were ele-vated in CAPs in Experiment 1 were associated spe-cifically with local stationary sources. Thus, theCommittee did not believe that positive effects ofCAPs in Experiment 1 could be attributed easily toany one set of PM components or type of source.
The Committee also cautioned that in this study,as in all others that use CAPs, the concentrated par-ticles may not be representative of particles in am-bient air. Concentrated and ambient particles maydiffer in either physical characteristics — selectiveconcentration of a particular size of particle — orchemical composition — selective concentration ofparticular components. In a similar note of cautionabout the diesel-exposure results, the Committeenoted that the diesel emissions emitted by the gen-erator used in the current study differ from emis-sions derived from new diesel-powered vehicles,which are subject to recent regulations to reduceparticulate emissions. Future studies to explore theeffects of exposure to airborne pollutants will needto use more relevant exposure atmospheres andbetter models of human disease.
3


INVESTIGATORS’ REPORT
Effects of Concentrated Ambient Particles and Diesel Engine Exhaust on Allergic Airway Disease in Brown Norway Rats
Jack R. Harkema, James G. Wagner, Norbert E. Kaminski, Masako Morishita, Gerald J. Keeler, Jacob D. McDonald, and Edward G. Barrett
Departments of Pathobiology and Diagnostic Investigation (J.R.H., J.G.W.) and Department of Pharmacology and Toxicology (N.E.K.), Michigan State University, East Lansing, Michigan; Department of Environmental Health Sciences and Atmospheric, Oceanic, and Space Sciences, University of Michigan, Ann Arbor, Michigan (M.M., G.J.K.); and Lovelace Respiratory Research Institute, Albuquerque, New Mexico (J.D.M., E.G.B.)
ABSTRACT
Increased concentrations of airborne fine particulatematter (PM2.5; particulate matter with an aerodynamicdiameter � 2.5 µm)* are associated with increases in emer-gency room visits and hospitalizations of asthmatic patients.Emissions from local stationary combustion sources (e.g.,coal-burning power plants) or mobile motor vehicles (e.g.,diesel-powered trucks) have been identified as potentialcontributors to the development or exacerbation of allergicairway disease. In the present study, a rodent model ofallergic airway disease was used to study the effects ofconcentrated ambient particles (CAPs) or diesel engineexhaust (DEE) on the development of allergic airway dis-ease in rats sensitized to the allergen ovalbumin (OVA).The overall objective of our project was to understand theeffects of PM2.5 on the development of OVA-induced aller-gic airway disease. Our specific aims were to test the fol-lowing hypotheses: (1) exposure to CAPs during OVAchallenge enhances epithelial remodeling of the airway
Health Effects Institute Research Report 145 © 2009
This Investigators’ Report is one part of Health Effects Institute ResearchReport 145, which also includes a Critique by the Health Review Commit-tee and an HEI Statement about the research project. Correspondence con-cerning the Investigators’ Report may be addressed to Dr. Jack R. Harkema,Department of Pathobiology and Diagnostic Investigation, Room 218,National Food Safety and Toxicology Building, East Lansing, MI 48864;517-353-8627; [email protected].
Although this document was produced with partial funding by the UnitedStates Environmental Protection Agency under Assistance Award CR–83234701 to the Health Effects Institute, it has not been subjected to theAgency’s peer and administrative review and therefore may not necessarilyreflect the views of the Agency, and no official endorsement by it should beinferred. The contents of this document also have not been reviewed byprivate party institutions, including those that support the Health EffectsInstitute; therefore, it may not reflect the views or policies of these parties,and no endorsement by them should be inferred.
* A list of abbreviations and other terms appears at the end of the Investi-gators’ Report.
and inflammation in rats previously sensitized to the aller-gen; and (2) exposure to DEE during OVA sensitization, orduring OVA challenge, exacerbates epithelial remodelingof the airway and inflammation in rats.
In the DEE studies, Brown Norway (BN) rats were sensi-tized with three daily intranasal (IN) instillations of 0.5%OVA, and then two weeks later were challenged with INOVA or saline for 3 consecutive days. Rats were exposed toDEE diluted to mass concentrations of 30 or 300 µg/m3 die-sel exhaust particles (DEPs) or to filtered air during eitherthe sensitization or challenge periods. For the CAPsstudies, the same OVA sensitization and challenge ratmodel was used but exposures to Detroit, Michigan, CAPswere limited to the OVA challenge period. Two separate 3-day CAPs exposures were conducted (week 1, high meanmass concentration = 595 µg/m3; week 2, low mean massconcentration = 356 µg/m3) during OVA challenge. In boththe DEE and CAPs studies, rats were killed 24 hours afterthe last OVA challenge, bronchoalveolar lavage fluid(BALF) was collected and analyzed for cellularity andsecreted mediators, and lungs and nose were processed forhistopathologic examination and morphometric analysisof intraepithelial mucosubstances (IM).
The results of our animal inhalation studies in thesouthwest (SW) Detroit community, an area with elevatedambient PM2.5 concentrations, suggested that, during aller-gen challenge, exposure to CAPs that were predominantlyassociated with emissions from combustion sources mark-edly enhanced the OVA-induced allergic airway disease,which was characterized by an increased infiltration in thelungs of eosinophilic and lymphocytic inflammation, in-creased IM in conducting airways, and increased concen-trations in BALF of mucin-specific proteins and inflamma-tory cytokines. These findings suggest that urban airbornePM2.5 derived from stationary combustion sources (e.g.,
5

Effects of CAPs and DEE on Allergic Airway Disease in Rats
refineries, coal-burning power plants, waste-treatmentplants) may enhance the development of human allergicairway diseases like childhood asthma. Previous animalinhalation studies in this community have also suggestedthat these fine, ambient combustion-derived particles mayalso exacerbate preexisting allergic airway disease.
In contrast to our CAPs studies in Detroit, the controlledDEE exposures of allergen-sensitized BN rats, during eitherallergen sensitization or challenge periods, caused only afew mild modifications in the character of the allergen-induced disease. This finding contrasts with other re-ported studies that indicate that DEPs at relatively higherexposure doses do enhance allergic airway disease in somerodent models. The reasons for these disparities betweenstudies likely reflect differences in exposure dose, animalmodels, the timing of exposures to the allergens and DEPexposures, the methods of allergen sensitization and chal-lenge, or physicochemical differences among DEEs.
INTRODUCTION
Air pollution is a major health concern in heavily popu-lated urban centers, where ambient levels of PM2.5 andgaseous pollutants (e.g., ozone [O3]) are generally high.Individuals with chronic airway diseases (e.g., childrenwith asthma) living in these urban environments may beparticularly vulnerable to the toxic effects of PM2.5 andother air pollutants. Though the results of several humanand animal studies (Harkema et al. 2004; McCreanor et al.2007; Miyabara et al. 1998; Rabinovitch et al. 2006; Vagag-gini et al. 2002; Wagner et al. 2002) suggest that exposureto common urban air pollutants such as O3 and particulatematter (PM) may exacerbate preexisting allergic asthmaand rhinitis, the effects of these air pollutants on the devel-opment of allergic airway diseases are unclear. Furthermore,the underlying cellular and molecular events (pathogene-sis) responsible for any exacerbation of allergic airway dis-ease, particularly the remodeling of the airway structure,by exposure to air pollutants, have not been thoroughlyinvestigated.
According to recent estimates, approximately 5% to 10%of the population in the United States has asthma, and20% has some form of respiratory allergy (Peden 1996).Asthma is the most common chronic disease of childhood,affecting approximately 10 million children under the ageof 16 years in the United States (Gergen et al. 1988). Be-tween 1982 and 1992, the prevalence of pediatric asthma(children under age 18) in the United States increased by58% (American Lung Association, Epidemiology and Sta-tistics Unit 1992). There is a growing concern that popula-tions in urban settings appear to be particularly at risk,
6
with minority populations showing disproportionate ratesof this disease (Nelson et al. 1997). The national trend ofincreasing incidence of asthma is reflected in Michiganurban communities such as Detroit, where it has been re-ported that 17.4% of 230 children studied had physician-diagnosed asthma (Joseph et al. 1996). The rising trends forasthma also suggest that more of our urban population maysuffer from disease related to air pollution in the future.Multiple and complex factors cause and aggravate pediat-ric asthma, including genetic disposition, demographicvariables, psychosocial stressors, and environmental expo-sures (Weiss et al. 1992; Bates 1995; Beggs and Curson1995). The last category includes exposures to particulateair pollution.
Increased ambient air pollution levels, particularly ofrespirable particulate matter (Pope et al. 1991; Tseng et al.1992; Koenig et al. 1993; Schwartz et al. 1993; Dockeryand Pope 1994; Walters et al. 1994; Peters et al. 1997; Ostroand Chestnut 1998) and O3 (Koenig et al. 1987; Ponka1991; Cody et al. 1992; Thurston et al. 1992; Abbey et al.1993; White et al. 1994; Kesten et al. 1995; Ostro et al. 1995;Romieu et al. 1995), have been associated with symptomsof asthma (Pope et al. 1991; Abbey et al. 1993) and anincrease in emergency department visits and hospitaliza-tions for asthma (Koenig et al. 1987; Ponka 1991; Cody etal. 1992; Thurston et al. 1992; Schwartz et al. 1993; Walterset al. 1994; White et al. 1994; Kesten et al. 1995; Ostro et al.1995; Romieu et al. 1995). Studies in the United States andEurope reported an association between increased morbidityand mortality and ambient PM concentrations that werebelow the limits specified in the U.S. National AmbientAir Quality Standards (Dockery and Pope 1994; Schwartz1994, 1995). Highly sensitive subpopulations, such as per-sons with asthma, are at increased risk, and exposure toPM and copollutants in the ambient environment may be acritical factor in increased morbidity and mortality in theseindividuals in urban centers (Schwartz 1993; Hoek andBrunekreef 1995; U.S. Environmental Protection Agency[EPA] 1996).
Several experimental studies have been conducted toexamine the effects of diesel exhaust and other compo-nents of PM2.5 in exacerbating allergic airway disease.Diaz-Sanchez and his colleagues have conducted severalin vivo studies of human subjects who were intranasallyadministered DEPs or ragweed allergen or both. Theseinvestigators demonstrated that IN administration of DEPsmarkedly enhanced ragweed-specific immunoglobulin E(IgE) and the production of messenger RNA (mRNA) forTh2-type cytokines (cytokines associated with allergicrhinitis and asthma) in the nasal mucosa (Diaz-Sanchez etal. 1997). Furthermore, Diaz-Sanchez and his colleagueshave demonstrated that intranasally administered DEPs

J. Harkema et al.
can act as mucosal adjuvants to a de novo IgE response andincrease allergic sensitization (Diaz-Sanchez et al. 1999).They also conducted in vitro studies to demonstrate thatthe organic constituents of DEPs, and in particular phe-nanthrene, a major polyaromatic hydrocarbon constituentof DEPs, can enhance IgE production by IgE-secretingEpstein-Barr virus–transformed human B cells (Tsien et al.1997). Nel and colleagues (2001) have suggested that or-ganic extracts of DEPs induce the production and releaseof oxygen species by macrophages and bronchial epithelialcells and that these reactive species of oxygen may be re-sponsible for the promotion of cytokines and chemokinesinvolved in the exacerbation of allergic inflammation.
Results from experimental studies using laboratoryrodents also suggest that DEPs and other potential constit-uents of PM2.5 play an important role in the increasingprevalence of allergic airway disease. Mice that were intra-nasally instilled with DEPs and the commonly used exper-imental aeroallergen OVA over several weeks also hadgreater IgE antibody production compared to mice thatreceived only OVA (Takafuji et al. 1987). Similarly, Takanoand colleagues (Takano et al. 1997) demonstrated thatintranasally instilled DEPs enhance OVA-induced airwayinflammation in mice. Fujimaki and associates (1997)exposed mice by inhalation to 3 and 6 mg/m3 of DEPs forsix weeks and intranasally instilled OVA before, during,and after the exposures to DEPs. They found that the OVA-specific IgE antibody titers of mice exposed to DEPs andOVA were significantly higher than those of mice exposedto OVA alone.
Lambert and coworkers (1999) showed in a BN ratmodel of house-dust-mite allergy that preexposure to par-ticles of residual oil fly ash (ROFA) enhances the sensitiza-tion period such that the secondary immune responsesincreased after allergen challenge. Furthermore, theseinvestigators conducted additional studies with BN rats,and the results from these studies suggest that the metallicconstituents of ROFA mediate the enhancement of sensiti-zation to the house-dust-mite antigen (Lambert et al. 2000).They suggest that pulmonary inflammation induced byROFA and its metallic constituents may play a key role inthe mediation of the adjuvant effect.
Though data from recent laboratory studies stronglysuggest that exposures to high concentrations of DEPs orother constituents of particulate air pollution may enhancethe induction of allergic airway disease in humans or lab-oratory animals, the effects of PM2.5 from real-world urbanatmospheres have not been adequately investigated. Well-designed studies are needed to investigate specificallythe effects of PM2.5, from urban communities with highdaytime concentrations of particulate air pollution, on theinduction of allergic airway disease. In addition, the effects
of PM2.5 exposure on the remodeling of airway epithelium(measured by, for example, mucus cell metaplasia [MCM]and associated mucin-gene expression) caused by allergensensitization and challenge have not been thoroughly inves-tigated. The present study used community- and laboratory-based animal inhalation studies to address these two spe-cific gaps in our present data.
SPECIFIC OBJECTIVES
The overall objective of this project was to understandthe effects of fine CAPs, CAPs with a mass median aero-dynamic diameter 0.1–2.5 µm, and DEE on the inductionof antigen-induced allergic airway disease (e.g., allergicasthma). The primary focus of these studies was to deter-mine the effects of exposures to these airborne particles onallergen-induced airway inflammation and the remodelingof the surface epithelium lining the respiratory airways. Inaddition, our studies were designed to better understandthe underlying cellular and molecular mechanisms respon-sible for CAPs- and DEE-related modulation (either anincrease or a decrease) of inflammatory responses resultingfrom the exposure of the airway epithelium to allergens.
An integrated investigative team of environmental andbiomedical scientists from Michigan State University(MSU) in East Lansing, Michigan, and the University ofMichigan (UM) in Ann Arbor, Michigan, conducted toxi-cologic and atmospheric research of CAPs in a SW Detroitcommunity that has a high incidence of childhood asthmaand high concentrations of particulate air pollution dur-ing the summer months. The team used a state-of-the-artmobile air research laboratory (AirCARE 1), located in thecommunity, to conduct ambient monitoring, concentrateambient particles, and perform concurrent inhalation toxi-cology studies with CAPs in laboratory rats. The airways ofrats exposed to CAPs and the airway allergen OVA wereexamined for cellular or molecular markers, or both, of air-way epithelial injury and remodeling caused by OVA chal-lenge and for potential alterations resulting from CAPsexposure during OVA challenge. These experiments, whichexamined the effects of CAPs on the induction of allergicairway disease, extended our previous studies that weredesigned to determine the effects of CAPs exposure onrats with only preexisting allergic airway disease (Harkemaet al. 2004).
Using the same rat model of allergic airway disease, MSUand UM investigators along with scientists at the LovelaceRespiratory Research Institute (LRRI; Albuquerque, NM)also studied the effects of DEPs on the induction of allergicairway disease. These inhalation studies were conductedunder controlled exposure conditions at the LRRI.
7

Effects of CAPs and DEE on Allergic Airway Disease in Rats
Figure 1. CAPs exposure and OVA sensitization and challenge protocols.Rats were sensitized with OVA by IN instillation on days 1 through 3, andchallenged on days 15 through 17. Prior to IN challenge, rats were exposedto CAPs or filtered air on days 15 through 17. All necropsies were con-ducted on day 18. Black bars represent 8-hour exposures to CAPs.
The two specific aims for the entire project were to testthe following hypotheses:
Aim 1: Exposure to CAPs during OVA challenge will exac-erbate airway epithelial remodeling (e.g., MCM) and air-way inflammation in the airways of rats previously sensi-tized to the antigen.
Aim 2: Exposure to DEE during OVA sensitization or chal-lenge will exacerbate airway epithelial remodeling and air-way inflammation in rats.
STUDY DESIGNS, METHODS, AND MATERIALS
DESIGN OF INHALATION STUDIES OF CAPS IN DETROIT
Laboratory Animals
Male BN rats (Harlan Laboratories; Indianapolis, IN),age 10 to 12 weeks, were assigned to one of four experi-mental groups. Male rats were chosen for these experi-ments to avoid hormonal changes during the estrous cyclethat have been shown to influence epithelial cell popula-tions and the mucus apparatus in the airways of femalerodents, and that thus might complicate the interpretationof results (Hayashi et al. 1979). Prior to the start of thisstudy, the laboratory rodents were housed in polycarbon-ate cages in the University Research Containment Facilityat MSU. Rats were free of pathogens and respiratory dis-ease, and all treatment protocols were approved by theMSU Institutional Animal Care and Use Committee. Alllaboratory animal facilities at MSU (including the mobilelaboratory used in our study) are accredited by the Associ-ation of Assessment and Accreditation of Laboratory Ani-mal Care International.
Inhalation Exposures (Air or CAPs) and IN Instillations (Saline or OVA)
Two separate 3-day inhalation exposure studies wereconducted in July 2003. The first inhalation study wasconducted during week 1 (July 14–16). The second wasconducted during week 2 (July 21–23). Different laboratoryrats were used for each study. Both studies followed thesame exposure and treatment protocols. In each study, 32male BN rats were sensitized daily for 3 consecutive daysto OVA, a protein allergen derived from chicken eggs, byIN instillation of a 0.5% solution of OVA in saline (150 µL/nasal passage). The airway sensitization of these animalswas conducted in the laboratory of Dr. Harkema at MSU.Twelve days after the end of the IN sensitization, all therats were moved to AirCARE 1, which was parked at May-bury Elementary School in SW Detroit (AirCARE 1 and the
8
exposure site are described in detail below). Rats wereexposed to CAPs or filtered air in whole-body, stainlesssteel and glass inhalation-exposure chambers, locatedwithin AirCARE 1. Inhalation exposures were for 3 con-secutive days, 8 hours/day (7:30 AM to 3:30 PM). A Har-vard/EPA ambient fine particle concentrator was used togenerate the CAPs. One hour after the end of each dailyinhalation exposure, the rats were intranasally challengedwith a 1.0% solution of OVA in saline (150 µL/nasal pas-sage; allergen challenge) or were challenged with salinealone (controls; no allergen challenge). Twenty-four hoursafter the last IN challenge, each rat was killed and airwaytissues from the nose and lungs were removed for analysis.In the MSU laboratory, standard analytical techniqueswere used to identify exposure-related alterations in thenasal and pulmonary airway tissues and in BALF from theexposed rodents (specific details provided below).
In summary, the four experimental groups of rats forboth weeks 1 and 2 were (1) control rats exposed to filteredair and challenged with saline (Air/Saline group), (2) ratsexposed to CAPs and challenged with saline (CAPs/Salinegroup), (3) rats exposed to filtered air challenged with OVA(Air/OVA group), and (4) rats exposed to CAPs and chal-lenged with OVA (CAPs/OVA group). Figure 1 summa-rizes the experimental groups and exposure/instillationprotocols for these studies.
AirCARE 1 and Ambient Fine Particle Concentrator
AirCARE 1 is a unique and specially designed mobileair research laboratory constructed inside the confines of a16.2-m semitrailer (Figure 2). The design and operation ofthis mobile lab for inhalation toxicology studies of “real-world” airborne particles have been previously described indetail (Harkema et al. 2004). In brief, AirCARE 1 contains

J. Harkema et al.
Figure 2. The layout and design of the AirCARE 1 laboratories.
on-board electric power, water, and heating, ventilation,and air conditioning (HVAC) systems. It contains three dis-tinct rooms that provide over 37 m2 of laboratory space.These three rooms are (1) a biomedical laboratory for ani-mal necropsies and surgical procedures, (2) an inhalationexposure laboratory, and (3) an atmospheric measurementlaboratory (Figure 2). Each laboratory has its own separateHVAC control, which allows for careful monitoring of tem-perature within each room. A 10-m telescoping meteoro-logical tower attached to the outside of AirCARE 1 was
used to collect routine meteorological measurements oftemperature, relative humidity, solar radiation, wind speed,and wind direction.
The inhalation exposure laboratory within AirCARE 1contains an ambient fine particle concentrator, two rein-forced, stainless-steel Hinners-type whole-body inhala-tion chambers (CAPs and filtered air), and a HazeltonH1000 chamber to house laboratory rodents during non-exposure periods. The concentrator is a three-stage aerosolconcentrator that utilizes virtual impactors to increase
9

Effects of CAPs and DEE on Allergic Airway Disease in Rats
Figure 3. Protocol for study 1, DEE exposure during OVA (or saline) sensi-tization. Rats were exposed to 0, 30, or 300 µg/m3 DEE for 8 hours on days1 through 3 and then sensitized with OVA (or saline) by IN instillation 1hour after DEE exposure. They were challenged with OVA on days 15through 17. All necropsies were conducted on day 18. Black bars represent8-hour exposure to 0, 30, or 300 µg/m3 DEE.
the concentration of particles (size range 0.1–2.5 µm) by afactor of approximately 30 (Sioutas et al. 1995; Harkemaet al. 2004). Therefore, when the ambient concentrationof PM2.5 was 25 µg/m3, the chamber concentration wasapproximately 750 µg/m3 with 7 to 8 air changes perhour. The PM2.5-size-selective inlet to the concentrator ismounted on top of the trailer roof approximately 1.5 mabove the grated, aluminum mezzanine platform. A seriesof stainless-steel ducts 0.31 m in diameter connect theinlet to the concentrator.
The two inhalation chambers are located directly in-linewith the outlet of the concentrator. These chambers have avolume of 0.32 m3 and hold a single level of 16 rats. Onechamber was used to expose the rats to CAPs, and the otherserved as a control chamber providing only filtered air.
The SW Detroit Community: Site for Inhalation Exposures
The site selected for this inhalation toxicology studywas an urban, residential neighborhood in SW Detroit,which has reported moderately high to very high hospital-ization rates in children with asthma (Joseph et al. 1996;Lippman et al. 2000). AirCARE 1 was parked at MayburyElementary School, located in a community in whichhuman epidemiologic and asthma intervention studieshave been recently conducted (Keeler et al. 2002; Lewis etal. 2005). The densest industrial community in Detroit isin this area, which contains iron and steel manufacturingplants, coke ovens, chemical plants, refineries, sewage-sludge incinerators, and coal-fired utilities (Keeler et al.2002). In addition, SW Detroit experiences heavy motorvehicle traffic, including both passenger-car and diesel-truck traffic, due to its proximity to major interstate high-ways and the entrance to the Ambassador Bridge to Wind-sor, Ontario, Canada. Recent studies, which used detailedchemical and physical characterization of PM2.5 mea-sured in SW Detroit coupled with receptor modeling(positive matrix factorization), identified six major sourcesof ambient PM2.5 mass during the summer months (Mor-ishita et al. 2006). The major PM2.5 mass contributorsincluded (1) coal combustion and secondary sulfate aero-sol, (2) motor vehicle and urban road dust, (3) municipalwaste incinerators, (4) oil combustion and oil refineries,(5) sewage-sludge incinerators, and (6) iron and steel man-ufacturing facilities.
DESIGN OF INHALATION STUDIES OF DEE
Study 1: Exposure to DEE During Allergen (OVA) Sensitization
Male, 10-to-14-week-old BN rats (8 rats/exposure group)were exposed to two concentrations of DEE or to filtered
10
air in whole-body exposure chambers at the LRRI. DEEexposure studies occurred during February and March2003. Rats were exposed for 3 consecutive days, 8 hours/day (7:30 AM to 3:30 PM), to filtered air alone (0 µg/m3
DEE; controls), a low concentration of DEE (30 µg/m3), or ahigh concentration of DEE (300 µg/m3). DEE was generatedusing a single-cylinder, 5500-watt diesel engine generatorusing number 2 nationally certified diesel fuel (see moredetails below). One hour after the end of each daily inhala-tion exposure, rats were intranasally instilled with a 0.5%solution of OVA in saline (150 µL/nasal passage for airwaysensitization) or with saline alone (no OVA sensitization).At the end of the 3-day inhalation exposures, the rats weremoved back to the animal housing facilities at the LRRI.Twelve days after the end of the last exposure, all the ratswere intranasally challenged with 300 µL of a 1% solutionof OVA in saline (150 µL/nasal passage per day for 3 con-secutive days). Twenty-four hours after the last IN chal-lenge, each rat was killed and airway tissues from the noseand lungs were removed for analysis. All necropsies wereconducted at the LRRI. The same tissue and fluid analysesdescribed for the CAPs study were conducted for the DEEstudies. All of these analyses were conducted at MSU inthe laboratory of Dr. Harkema.
A summary of the experimental groups and exposureand instillation protocols in this first DEE study is pre-sented in Figure 3. The six experimental groups in study 1were (1) rats exposed to filtered air and sensitized withsaline (Air/Saline), (2) rats exposed to 30 µg/m3 DEE andsensitized with saline (30 DEE/Saline), (3) rats exposed to300 µg/m3 DEE and sensitized with saline (300 DEE/Saline), (4) rats exposed to filtered air and sensitized withOVA (Air/OVA), (5) rats exposed to 30 µg/m3 DEE and sen-sitized with OVA (30 DEE/OVA), and (6) rats exposed to300 µg/m3 DEE and sensitized with OVA (300 DEE/OVA).

J. Harkema et al.
Study 2. Inhalation Exposure to DEE During Allergen (OVA) Challenge
Male, 10-to-14-week-old BN rats (8 rats/exposure group)were sensitized to OVA by IN instillation with a 0.5%solution of OVA in saline (150 µL/nasal passage) for 3 con-secutive days. Airway sensitization procedures and thehousing of these animals were also conducted at the LRRI.Twelve days after the end of the IN sensitization, rats wereexposed to three concentrations of DEE in whole-bodyinhalation exposure chambers at the LRRI. As in study 1,rats were exposed for 3 consecutive days, 8 hours/day(7:30 AM to 3:30 PM) to DEE concentrations of 0, 30, or300 µg/m3. DEE was generated as it was in study 1.
One hour after the end of each daily inhalation expo-sure, rats were intranasally challenged with a 1% solutionof OVA in saline (150 µL/nasal passage) or with salinealone (no OVA challenge). At the end of the 3-day inhala-tion exposures, the rats were moved back to the animalhousing facilities at the LRRI. Twenty-four hours after thelast IN OVA challenge, each rat was killed and airway tis-sues from the nose and lungs were removed for analysis, aswas described for study 1. Study 2 was also conducted inFebruary and March 2003.
Figure 4 summarizes the experimental groups and theexposure and instillation protocols in study 2. The sixexperimental groups in study 1 were (1) rats exposed to fil-tered air and challenged with saline (Air/Saline); (2) ratsexposed to 30 µg/m3 DEE and challenged with saline (30DEE/Saline); (3) rats exposed to 300 µg/m3 DEE and chal-lenged with saline (300 DEE/Saline); (4) rats exposed to fil-tered air and challenged with OVA (Air/OVA); (5) ratsexposed to 30 µg/m3 DEE and challenged with OVA (30DEE/OVA); and (6) rats exposed to 300 µg/m3 DEE andchallenged with OVA (300 DEE/OVA).
Figure 4. Protocol for study 2, DEE exposure during OVA (or saline) chal-lenge. Rats were sensitized with OVA by IN instillation on days 1 through 3.They were exposed to 0, 30, or 300 µg/m3 DEE for 8 hours on days 15through 17 and then challenged with OVA (or saline) by IN instillation 1hour after DEE exposure. All necropsies were conducted on day 18. Blackbars represent 8-hour exposure to 0, 30, or 300 µg/m3 DEE.
Generation of DEE
DEE was produced by a 406-cc displacement, air-cooledsingle-cylinder diesel engine generator (5500-watt Yan-mar, Model YDG5500E; Yanmar America Corp., BuffaloGrove, IL) operated with a number 2 diesel certificationfuel (Phillips Chemical Company, Borger, TX) and com-mercially available crankcase oil (Rotella T 40-weightmotor oil; Shell, The Netherlands). Electrical current waspulled from the engine to provide a constant load duringoperation. The engine was operated in a steady-state con-figuration at 100% capacity. Single-cylinder-engine emis-sions have been used to study the composition and charac-teristics of exhaust from diesel engines operating withalternative fuels and lubricants, and have also been usedin a study that assessed differences in mutagenicity associ-ated with different diesel fuels (McDonald et al. 2004).This system was a surrogate for on-road diesel emissions,and the composition of the material emitted from thisengine system showed reasonable similarities to on-roaddiesel emissions.
DEE Exposure of Laboratory Rats
Exposure concentrations were targeted to mass concen-trations of diesel particulate of 30 and 300 µg/m3. Dilutionwas achieved with ambient air that had been passedthrough activated charcoal followed by high efficiencyparticulate air (HEPA) filtration. Details on the configura-tion of the exposure system and the approach for charac-terizing the exposure atmosphere have been previouslyreported (McDonald et al. 2004). The animal inhalationexposure chambers were conventional 1-m3 whole-bodyinhalation exposure chambers (Hazleton H-1000; LabProducts, Maywood, NJ) operated at a flow rate of approx-imately 250 L/min. Temperature, relative humidity, andflow (as measured by an orifice plate mated to electronicpressure transducer) in the whole-body exposure systemwere monitored and recorded at all times by LabVIEW(version 6) software. DEE concentrations were adjustedmanually for dilution in the air transit system prior to theanimal exposures.
Total nitrogen oxides (NOx = NO + NO2) were measuredusing a chemiluminescence analyzer (API Model 200A)that was zeroed with ultra zero air and calibrated withNational Institute of Standards and Technology (NIST)–traceable span gases. Carbon monoxide (CO) concentra-tions were determined using a photoacoustic multigas ana-lyzer (Innove 1312, LumaSense Technologies, Denmark).The manufacturer performed the initial calibration, andcalibration was checked on-site against NIST-traceablespan gases. Total hydrocarbons (THC) were measuredusing a real-time flame ionization detector (model 300H;
11

Effects of CAPs and DEE on Allergic Airway Disease in Rats
California Analytical Instruments, Orange, CA) calibratedagainst a certified propane standard. Sampling and charac-terization methods for DEPs are described in detail below.
The Hazelton H1000 whole-body exposure chamberswere equipped with individual animal cages, an auto-mated watering system, and food bins. Experience hasshown that DEE distributes evenly within these exposurechambers, but to assure that animals whose cages were atdifferent levels were exposed to equal amounts of the samematerial, the animals’ cages were rotated daily. The wel-fare of the animals during exposure and nonexposure peri-ods was maintained and monitored by an attending certi-fied veterinarian. The temperature of the animals’ cageswas maintained at between 18 and 27�C, and the humidityat between 30% and 70%.
SAMPLING METHODS FOR CAPS AND DEPS IN INHALATION EXPOSURE CHAMBERS
Samples were collected directly from the exposurechambers as described by McDonald and colleagues (2004)for the DEE exposure study, and by Harkema and associ-ates (2004) for the CAPs exposure study in SW Detroit. Inbrief, during the DEE exposure periods, the mass of partic-ulate matter in the exposure chambers was determined byplacing 47-mm Teflon (polytetrafluoroethylene [PTFE]) fil-ters (Gelman Sciences, Ann Arbor, MI) in holders attachedto the exhaust manifold of the exposure system, which wasoperating at a flow rate of 10 L/min. Prebaked quartz filters(Gelman Sciences) were also placed in filter packs andwere sampled at a flow rate of 10 L/min. During the expo-sure study in Detroit, the mass of CAPs was determined byplacing 47-mm Teflon filters in Teflon-coated aluminum fil-ter packs (URG Inc., Chapel Hill, NC) attached to the backof the animal exposure chambers and downstream of theconcentrator, which was operating at a flow rate of 2 L/min.Backup filters coated with sodium carbonate were placedbehind the Teflon filters to correct for the loss of nitratefrom the Teflon filters as a result of volatilization duringsampling. Prebaked quartz filters were placed in URG filterpacks mounted on the exposure chamber and sampled at aflow rate of 2 L/min. The size distribution of DEPs andCAPs was measured using a 10-stage micro-orifice uniformdeposit impactor (MOUDI) (MSP Corp., Shoreview, MN)with Teflon filters at a 30-L/min sampling flow rate. TheMOUDI was also used to obtain the size-fractionated chem-ical characteristics of DEPs and CAPs. Flow rates weremeasured with a calibrated rotameter (Matheson, Mont-gomeryville, PA). In addition, continuous measurement ofthe mass of CAPs was performed directly from the exposurechamber. A TEOM (tapered element oscillating micro-balance) series 1400a monitor (Rupprecht & Patashnick
12
Co, Inc., Albany, NY) was placed in-line to continuouslymeasure the concentrated fine mass concentration duringthe 8-hour exposure periods. The TEOM sampled CAPs ata flow rate of 3 L/min, and the TEOM filter was heated to40�C to match the ambient TEOM measurements. Particulatematerial for subsequent speciated particle and semivolatileorganic analysis was collected on sorbent-impregnated fil-ters (SIFs). To ensure that target analytes were trapped effi-ciently, two filters were collected in series and analyzedseparately. SIFs were made with glass fiber filters (47 mmPallflex; Pall-Gelman, East Hills, NY) impregnated withfinely ground XAD-4 sorbent (Sigma-Aldrich, St. Louis, MO)to trap vapor-phase, semivolatile organic compounds thatwould desorb or pass through the filters without the inclu-sion of the sorbent, and prevent particle-phase compoundsfrom desorbing from the filter during collection. XAD-4was finely ground and precleaned by Soxhlet solvent extrac-tion (1:1 methanol/dichloromethane) for 24 hours prior touse. Filters were dipped into a slurry of the finely groundXAD-4, air dried, and dipped again using proceduresadapted from Gundel and Hering (1998). Samples werealso collected from the clean-air control chamber on sev-eral monitoring days, and field blanks, which included SIFfilters that went through transit and sample handling butwere not sampled, were also included.
ANALYTICAL METHODS FOR AMBIENT PARTICLES, CAPS, AND DEPS
A brief overview of the analytical methods used for thisproject is provided below.
GRAVIMETRIC ANALYSIS
All gravimetric determinations were made using amicrobalance (MT5; Mettler-Toledo, Columbus, OH) in atemperature-and-humidity-controlled clean laboratory asdescribed in Federal Reference Method (EPA 1997). Mea-surements of field blanks, filter-lot blanks, replicate anal-yses, and externally certified standard weights were incor-porated into all gravimetric analyses for quality assurance(QA) and quality control (QC) purposes. A minimum of10% of the preweighed and postweighed filters was re-weighed to replicate the analysis, and all the values werewithin ± 15 µg.
ION ANALYSIS
Teflon filter samples were analyzed for sulfate ions( ), nitrate ions ( ), and ammonium ions ( ) byion chromatography (IC) (Model DX-600; DIONEX Corp.,Sunnyvale, CA). A detailed description of the analytical
SO42� NO3
� NH4�

J. Harkema et al.
methods we used was previously documented (Keeler etal. 1991, 2002). The IC method incorporates routine dailyQA and QC measures, including the use of field blanks,ultrapurified water blanks (Milli-Q, Billerica, MA), replicateanalyses, and external standards (Simulated Rainwater � 2,ICA and ICB; High-Purity Standards, Charleston, SC).
CARBON ANALYSIS
Quartz filters were prebaked at 550�C for 2 hours prior tosampling. PM samples were collected onto quartz filters andwere stored at �40�C prior to analysis for carbonaceousaerosols using a thermal-optical analyzer (Sunset Labora-tory, Forest Grove, OR). The thermal-optical-reflectancemethod developed by Huntzicker and coworkers (1982)was used to measure organic and elemental carbon (EC) byconverting particles to gases under different temperatureand oxidation conditions. First, organic carbon (OC) wasmeasured by the reflectance of a sample that was heated inhelium up to 550�C. Then, oxygen was added to the heliumat temperatures higher than 550�C and desorbed gases wereoxidized to carbon dioxide (CO2) by catalytic conversionand reduced to methane, which was quantified by a flameionization detector. To account for pyrolytic carbon, a lasermonitored the reflectance of the sample.
TRACE ELEMENT ANALYSIS
All equipment and supplies used in sampling were rig-orously acid cleaned, and all filters were placed in 50-mm,acid-cleaned petri dishes, sealed with Teflon tape and tri-ple bagged in the field. Sample handling, processing, andanalysis of PM samples took place in a class 100 ultracleanlaboratory at the UM Air Quality Laboratory (UMAQL),which is designed for ultra-trace-element analysis withan emphasis on the measurement of low-level elements inthe environment (Long and Martin, 1992; Keeler et al.2002). After gravimetric analysis of the Teflon sample fil-ters was completed, the filters were placed in 15-mL cen-trifuge tubes and wetted with 150 µL of ethanol before theparticles were extracted into 10 mL of a solution of 10%nitric acid (HNO3), which was made on the same day itwas used. The extraction solution was then sonicated for48 hours in an ultrasonic bath and, after that, allowed topassively acid digest for two weeks. Sample extracts wereanalyzed for a suite of trace elements using inductivelycoupled plasma–mass spectrometry (ICP–MS) (FinniganELEMENT2; Thermo, San Jose, CA). Calibration curveswere created using multielement standards (SPEX Certi-Prep, Metuchen, NJ) in a 10% HNO3 solution, to match thesample solution. A set of standard solutions was analyzed,and the software for the Finnigan ELEMENT2 calculated a
standard curve, with its r2 value for each element. TheUMAQL routine analysis method incorporated daily QAand QC measures such as the use of field blanks, acidblanks, laboratory blanks, and replicate analyses. Through-out the analysis run, check standards were analyzed assamples to evaluate the instrument stability. Check stan-dards that were not within 15% of the calibration stan-dards resulted in recalibration of the instrument with mass-calibration software. NIST (Gaithersburg, MD) StandardReference Material (SRM) 1643d was used as a QC stan-dard to check the calibration of the instrument. If mea-sured values were not within ± 20% of the expectedvalues, the calibration procedure was repeated. Minimumdetection limits for each element were calculated as threetimes the standard deviation (SD) of seven consecutivemeasurements of a spiked blank.
LUNG TISSUE DIGESTION PROCEDURE AND RETAINED ELEMENT ANALYSIS
A complete protocol for digestion of lung tissues (rightmiddle lobe; see Figure 5) and for analysis of trace ele-ments by ICP–MS was developed from biopsy mineral anal-ysis (Braselton et al. 1997) and has been reported elsewhere(Morishita et al. 2004). For QA and QC purposes, blanksand NIST SRM 1577b Bovine Liver were digested with allthe samples. The diluted extracts were analyzed directlyfor trace elements using ICP–MS, as described above.
SPECIATED ORGANIC ANALYSIS
SIF extractions were conducted using microwave-assisted solvent extraction (MARS-X; CEM Corp., Mat-thews, NC) with approximately 20 mL of analytical gradedichloromethane. Prior to extraction, samples were spikedwith a suite of deuterated internal standards closely re-sembling the chemical structures and behavior of the ana-lytes of interest. These internal standards mimicked thebehavior of the target analytes throughout the extractionprocess. The internal standards used included deuteratedphenanthrene, acenaphthene, chrysene, benzo[a]pyrene,and dibenzo[a,h]anthracene. After extraction, solvents wereconcentrated by rotary evaporation and filtered through a0.2 µm Acrodisc filter (Waters Corp.). Extracts were thenevaporated to approximately 50 µL under a gentle nitro-gen stream and brought to 200 µL with acetonitrile priorto analysis.
Sample extracts were injected (1 µL injections with theinjector operated at 300�C) into a gas chromatograph (HP5890 GC) equipped with a phenylmethylsilicone fused-silica capillary column (30 m, 0.25 mm � 0.25 mm; DB-5 ms;J&W Scientific) and coupled to a mass spectrometer
13

Effects of CAPs and DEE on Allergic Airway Disease in Rats
(5972 MS). Samples were quantified by comparing the re-sponse of the deuterated internal standards to the analyteof interest. Analyte response was referenced to calibrationcurves created from standard solutions made with authen-tic standards (Sigma-Aldrich) and the NIST SRM 2260.Several blank SIFs were analyzed in the same batch as thesamples, and the concentrations of the blanks were sub-tracted from the sample extract concentrations. The preci-sion of the analysis was approximately 10% among allanalytes. The limits of quantitation in solution wereapproximately 30 pg/µL. This translated to a lower limit ofquantitation of approximately 5 ng/m3 with the low vol-ume collected (5 m3), and a limit of detection of 1 ng/m3.
URBAN AMBIENT AEROSOL AND GASEOUS POLLUTANT MEASUREMENTS
Aerosol sampling of size-segregated pollutants was per-formed for each exposure period using multiorifice impac-tors (MOIs) as well as PM2.5 cyclone samplers. The volumesampled was determined using calibrated dry test meters(DTMs) (Schlumberger, Owenton, KY). The DTMs werecalibrated against a spirometer, a primary calibration stan-dard, before and after being deployed in the field. In addi-tion, calibrated rotameters were used to check the flow rateat the beginning and end of the sampling period. Contin-uous measurements of air pollutants and meteorologicalparameters, including wind speed, wind direction, temper-ature, relative humidity, and solar radiation, were recordedfrom the exposure trailer.
PM2.5 AND MOI
Fine particle mass was sampled onto 47-mm Teflonmembrane filters. Vacuum pumps were used to draw airthrough a Teflon-coated cyclone inlet (URG Inc.) at a flowrate of 16.7 L/min. A six-stage MOI (MSP Corp., Shore-view, MN) was used to collect size-fractionated samples.Particles were collected on 37-mm Teflon filters on eachstage of the MOI at a flow rate of 30 L/min. The sizes of theparticles collected on the six stages were as follows: firststage, > 5 µm; second stage, 5–2.5 µm; third stage, 2.5–1 µm;fourth stage, 1–0.6 µm; fifth stage, 0.6–0.18 µm; and laststage, < 0.18 µm.
ANNULAR DENUDER/FILTER PACK SYSTEMS
Annular denuder/filter pack systems were employed tocollect the acidic gaseous species, including nitrous acid(HNO2), HNO3, sulfur dioxide (SO2), ammonia (NH3), and
14
inorganic fine particulate ions ( , , , H+). Adetailed description of the annular denuder sampling sys-tem has been previously reported (Keeler et al. 1991).
TEOM
Levels of PM2.5 were monitored at 30-minute intervalscontinuously with a Rupprecht & Patashnick Series 1400aTEOM equipped with a sharp-cut cyclone inlet (BGI Inc.,Waltham, MA). The TEOM filter was heated to 40�C tominimize interference from particle-bound water andsemivolatile components.
SCANNING MOBILITY PARTICLE SIZER (SMPS)
A Series 3936 SMPS (TSI, Shoreview, MN) system con-tinuously measured the concentrations of submicrometeraerosols, in the range from 10 to 800 nm in diameter, andoutput the average concentrations for 5-minute intervals.The SMPS consisted of an electrostatic classifier, to deter-mine particle size, and a condensation particle counter, todetermine particle concentrations.
O3
Ambient O3 was measured using a continuous UV photo-metric analyzer (TECO 49; Teco Diagnostics, Anaheim,CA). The analyzer was calibrated before and after the expo-sure studies using an O3 calibrator (TECO 5009). Ambientair was sampled at a flow rate of 2.0 L/min. Voltage fromthe analyzer that corresponded to the concentration wastransmitted to a data logger. The average O3 concentrationwas recorded every 30 minutes. The instrument specifica-tions listed the limit of detection (LOD) as 1 part per bil-lion (ppb) and the precision as ± 1 ppb.
CO
Continuous ambient CO measurements were made usinga nondispersive infrared analyzer (TECO 48S). The instru-ment specifications listed the LOD as 0.04 ppm and theprecision as ± 0.1 ppm.
TOTAL NITROGEN OXIDES (NOx)
Ambient NOx concentrations were measured using acommercial chemiluminescence detector (TECO 42S). Theinstrument has a single photomultiplier tube that automat-ically cycles between the NO and NOx modes. Signalsfrom the photomultiplier tube were conditioned and thensent to the microprocessor where a mathematical algo-rithm was utilized to calculate three independent outputs— NO, NO2, and NOx. The instrument specifications listedthe LOD as 0.4 ppb and the precision as ± 0.4 ppb.
SO42� NO3
� NH4�

J. Harkema et al.
SO2
Ambient SO2 concentrations were measured using apulsed fluorescence technique (TECO 43S). The instrumentspecifications listed the LOD as 0.6 ppm and the precisionas ± 1 ppb.
STATISTICAL ANALYSES FOR AMBIENT AIR, CAPS, AND DEPS
Statistical analyses, including correlation, multiple re-gression, and analysis of variance (ANOVA), for all of thegaseous pollutants and PM components were performedusing a statistical analysis system (SAS 9.1; SAS Institute,Inc., Cary, NC). Data describing the parameters of particlenumber, mass, and components were expressed as themean value ± the SD. Statistical significance was testedusing the Tukey-Kramer post-hoc test. The criterion forstatistical significance was P � 0.05.
Figure 5. Sites of rat nasal and pulmonary tissues selected for morphometric
ANIMAL NECROPSIES AND TISSUE SELECTION FOR ANALYSIS
In both the CAPs and DEE inhalation studies, rodentswere killed 24 hours after the last IN challenge. At the timeof death, the animals were deeply anesthetized and exsan-guinated via the abdominal aorta. After death, the tracheawas cannulated, and the heart and lung block was re-moved. The right extrapulmonary bronchus was ligated withsuture, and the right lung lobes were removed. The entireright cranial lobe and the microdissected main axial airwayfrom the right caudal lobe were processed for isolation oftotal RNA (Figure 5). The right-middle and accessory lobeswere placed in a Teflon container, frozen in liquid nitrogen,and stored at �80�C. The head of each rat was removed, andthe lower jaw and skin were removed. The nasal airwayswere flushed retrograde through the nasal pharyngeal meatuswith 3 mL of 10% neutral buffered formalin prior to im-mersion and storage in a larger volume of the same fixative.
15
and biochemical analyses.

Effects of CAPs and DEE on Allergic Airway Disease in Rats
The left lung lobe was instilled with 4 mL sterile salinethrough the tracheal cannula which was withdrawn to re-cover BALF (Figure 5). A second lavage was performed andcombined with the first. The BALF samples from each ratwere analyzed for total and differential cell counts, secretedmucins, total protein, cytokines, and soluble mediators.
After bronchoalveolar lavage, the left lung lobe wasperfusion-fixed with a 10% neutral-buffered formalin viathe trachea at a constant pressure of 30 cm of fixative.After 2 hours of perfusion fixation, the trachea was ligatedand the lung lobe was immersed in a large volume of thesame fixative. Forty-eight hours later, the left lung lobewas processed for light microscopy as described below.Figure 5 summarizes the sites in the rat respiratory tractselected for analysis.
AIRWAY TISSUE SELECTION AND PROCESSING FOR AIRWAY MORPHOMETRY
The intrapulmonary airways of the fixed left lung lobefrom each rodent were microdissected according to a mod-ified version of the technique of Plopper and colleagues(1983), which is fully described in our previous publica-tion (Steiger et al. 1995). Beginning at the lobar bronchus,airways were split down the long axis of the largest daugh-ter branches (i.e., main axial airway, the large-diameterconducting airway) through the twelfth airway generation.Tissue blocks that transverse the entire lobe of the lung atthe levels of the fifth and eleventh airway generations ofthe main axial airway (proximal and distal axial airwaygenerations 5 and 11, respectively) were excised and pro-cessed for light microscopy and morphometric analyses(Figure 5). The lung tissue blocks were embedded in paraf-fin, and 5-µm sections from the proximal face of each blockwere cut and placed on charged slides (Probe-on Plus;Fisher Scientific, Pittsburg, PA). Tissue sections were his-tochemically stained with (1) hematoxylin and eosin forroutine histopathologic examination or (2) Alcian Blue(pH 2.5)/Periodic Acid Schiff Sequence (AB/PAS) to detectacidic and neutral mucosubstances for the quantitation ofstored mucosubstances within the airway epithelium.
After nasal lavage, the nasal airways were fixed in 10%neutral-buffered formalin for at least 24 hours prior to fur-ther processing. After fixation, the head was decalcified in13% formic acid for 4 days, and then rinsed in distilledwater for 4 hours. After decalcification, the nasal airwayswere sectioned at four specific anatomical locations, usingthe following gross dental and palatine landmarks previ-ously described by Young (1981): The most proximal nasaltissue section (T1) was taken immediately posterior to theupper incisor teeth; the second section (T2) was taken at theincisive papilla of the hard palate; the third nasal tissue
16
section (T3) was taken at the level of the second palatalridge; and the most distal section (T4) was taken at thelevel of the first upper molar teeth (Figure 5). Tissue blockswere embedded, sectioned, and stained as described abovefor the pulmonary tissues.
The following airway levels of the respiratory tract wereselected for morphometric determination of the amount ofAB/PAS-stained mucosubstances in the surface epithe-lium lining the airway lumen (intraepithelial mucosub-stances [IM]): (1) the proximal nasal septum in T1, (2) thedistal nasal septum in T2, (3) the proximal axial airway inthe left lung lobe (generation 5), and (4) the distal axial air-way in the left lung lobe (generation 11) (Figure 5). Allmorphometric analyses were conducted in Dr. Harkema’slaboratory at MSU according to procedures that are welldocumented in the literature (Harkema et al. 1997a,b) andbriefly described below.
MORPHOMETRIC ANALYSIS OF IM IN AIRWAY EPITHELIUM
The volume densities of stored IM in the surface epithe-lium lining the nasal and pulmonary airways were deter-mined using image analysis and standard morphometrictechniques previously described in detail (Harkema et al.1997a,b). The quantity of stored mucosubstances per unitarea was determined as described by Harkema and associ-ates (1987a,b) and was expressed as the mean volume (nL)of IM/mm2 of basal lamina ± SEM (n = 8/group).
NUMERIC EPITHELIAL CELL DENSITY
The numeric epithelial cell density was determined bycounting the number of epithelial cell nuclear profiles inthe surface epithelium and dividing by the length of theunderlying basal lamina. The length of the basal laminawas calculated from its contour length in a digitized imageusing the U.S. National Institutes of Health image systemas described in Harkema et al. (1997a,b). The data areexpressed as the mean number of epithelial cells presentin the surface epithelium lining the axial airway per milli-meter of basal lamina ± SEM (n = 8/group).
EPITHELIAL CELL LABELING INDEX AND SYSTEMIC DELIVERY OF BROMODEOXYURIDINE (BRDU)
The number of surface epithelial cells in the axial air-way of the left lung lobe that were engaged in DNA synthe-sis was assessed by positive immunoreactivity with BrdU(Sigma Chemical Co., St. Louis, MO). During the 3 days ofinhalation exposure, BrdU (50 mg/kg body weight) wasdelivered to each rat in vivo at a constant rate (10 µL/hr)via an Alzet osmotic pump (ALZA Corp., Palo Alto, CA),

J. Harkema et al.
which was implanted subcutaneously along the dorsal mid-line of the rat approximately 24 hours before the start of theinhalation exposures to filtered air, CAPs, or DEE. The os-motic pumps were removed at the time of necropsy, approx-imately 24 hours after the end of the inhalation exposures.
The cumulative epithelial cell labeling index (LI; per-centage of BrdU-labeled epithelial cells) in the axial air-way was determined using lung sections immunohisto-chemically stained to label cells with BrdU incorporatedinto nuclear DNA (i.e., cells that have undergone DNAsynthesis) (Henderson et al. 1993; Hotchkiss et al. 1997).BrdU labeling was also standardized per the length ofepithelium surface of conducting airways. A unit-lengthlabeling index (ULLI) was determined by dividing the LIby millimeters of basal lamina counted. The data areexpressed as LI and ULLI ± SEM (n = 8/group).
ANALYSES OF BALF
CELLULARITY
Total cells recovered by nasal and bronchoalveolar lav-ages were counted manually using a hemacytometer. Cellsmears were made with a cytocentrifuge and stained withDiff-Quick. Differential cell counts that included neutrophils,macrophages, eosinophils, and lymphocytes were deter-mined by counting 200 cells per slide (Hotchkiss et al.1989a,b). Cell smears, hemacytometer counts, and other cyto-logical analyses were performed in Dr. Harkema’s laboratoryat MSU. The BALF was centrifuged to remove cells and de-bris, and the supernatant was stored at �80�C until enzyme-linked immunosorbent assays (ELISAs) were performed.
TOTAL PROTEIN
Protein concentration in the BALF was determined bythe bicinchonic acid method using a microplate assay(Pierce Kit #23225). Absorbance readings of protein stan-dards and experimental samples were read at 550 nmusing a BioTek ELx808 (BioTek Instruments, Winooski,VT) plate reader.
MUCIN GLYCOPROTEIN
The amount of rMuc5AC mucin glycoprotein in theBALF was monitored by ELISA using a monoclonal anti-body (Mucin 5AC Ab-1; NeoMarkers, Fremont, CA) spe-cific for this mucin gene product (Steiger et al. 1992, 1994,1995). ELISAs were performed in 96-well plates usinghorseradish-peroxidase-conjugated avidin-biotin complex(ABC Reagent; Vector Laboratories, Burlingame, CA) and afluorescent substrate. Results for this assay were expressedas units/sec (Vmax).
OVA-SPECIFIC IGE
Concentrations of OVA-specific IgE in the BALF wereestimated by an ELISA using a rabbit monoclonal antibodyspecific for this gene product (Molecular Probes, Eugene,OR). ELISAs were performed in 96-well plates using horse-radish-peroxidase-conjugated avidin-biotin complex and afluorescent substrate.
ELASTASE AND �-GLUCURONIDASE
Estimates of the amounts of elastase and �-glucuronidaserecovered in the BALF were determined by an ELISA usinga rabbit monoclonal antibody to either human elastase(Calbiochem, San Diego, CA) or �-glucuronidase (Molecu-lar Probes, Eugene, OR). ELISAs were performed in 96-wellplates using horseradish-peroxidase-conjugated avidin-biotin complex (ABC Reagent; Vector Laboratories, Burlin-game, CA) and a fluorescent substrate.
CYTOKINES
Concentrations of the rat inflammatory cytokines tumornecrosis factor (TNF)�, interferon (INF), interleukin (IL)-4,IL-6, and IL-10 in the BALF were determined with a BDCytometric Bead Array (CBA) Rat Protein Flex Set (BD Bio-sciences, San Diego, CA), which was used, according to themanufacturer’s instructions, with a BD FACSCalibur flowcytometer and BD CBA Analysis Software (BD Biosciences).These analyses were also conducted in Dr. Harkema’s lab-oratory at MSU.
GENE EXPRESSION ANALYSIS OF AIRWAY MUCIN AND INFLAMMATORY CYTOKINES
Allergic or asthmatic airway disease has several hall-mark features of immunologic involvement as evidencedby the presence of inflammatory cells and associated solu-ble mediators (e.g., cytokines). The cytokines IL-4 and IL-5play an essential role in this disease process (Broide et al.1992; Hogg 1997; Mori et al. 1997; Hogan et al. 1998). Re-peated exposure to airway allergens leads to clonal expan-sion of T cells that secrete IL-4 and IL-5 (Walker et al. 1991;Hogg 1997; Hogan et al. 1998). In light of this, a ribonucleaseprotection assay (rCK-1; PharMingen, San Diego, CA) anda sensitive quantitative reverse transcriptase–polymerasechain reaction (RT–PCR) method (Vanden Heuvel et al.1993), requiring minimal amounts of tissue, were employedto measure the steady state mRNA expression of IL-4 andIL-5 and other inflammatory or anti-inflammatory cyto-kines (e.g., IL-1�, IL-1�, TNF�, TNF�, INF, IL-2, IL-9,IL-10, and IL-13) in pulmonary airways.
We used a similar quantitative RT–PCR assay to deter-mine steady-state levels of airway-specific mucin mRNA
17

Effects of CAPs and DEE on Allergic Airway Disease in Rats
Figure 6. Average mass size distribution of ambient particles in Detroit,July 2003. Bars represent the mean and standard deviations (N 21).
(i.e., rMuc5AC) in pulmonary tissues, as an early indi-cator of exposure-induced MCM. These molecular anal-yses were performed in the laboratory of Dr. Harkemausing techniques well described in the literature (Wagneret al. 2001).
STATISTICAL ANALYSES OF BIOLOGIC ENDPOINTS
Data describing the type and magnitude of the pulmo-nary inflammatory response (e.g., from the analyses of theBALF) and airway epithelial alteration (e.g., changes inmucosubstances in the airway epithelium) were expressedas the mean group value ± SEM . The data were sub-jected to ANOVA for the type of inhalation exposure (e.g.,CAPs or filtered air) and airway sensitization or challenge(OVA or saline). Significant differences between experi-mental groups were identified using appropriate post-hoctests (e.g., Tukey omega procedure). Transformation of data(e.g., usually log or arcsin�1) was performed, if needed, torender variances homogeneous. When analytical measure-ments were below the level of detection, these sampleswere given a value of zero, and ANOVA on ranks was thestatistical method used to determine differences betweengroups. The criterion for statistical significance was P �
0.05 in all studies.
RESULTS
CHEMICAL AND PHYSICAL CHARACTERIZATION OF AMBIENT PM2.5
In July 2003, the levels of fine particulate matter and gas-eous pollutants (e.g., O3, NOx) were measured in the atmo-sphere of SW Detroit, at the site of the Maybury Elemen-tary School. The arithmetic average and SD of the ambientPM2.5 mass concentration measured by TEOM during theexposure studies in July 2003 was 16.2 ± 10.7 µg/m3.
Figure 6 shows the average mass size distribution ofambient particles measured during our study. AmbientPM2.5 was dominated by submicron particles (PM1). Ourpast studies also found that, on average, PM2.5 in Detroitaccounted for 60% of PM10 (up to 80% on some days).
Detailed chemical characterization of the ambient PM2.5collected during the exposure period was also conducted(Table 1). This allowed us to determine that the CAPs towhich the laboratory rats were exposed reflected the com-plex mixture of ambient PM2.5. Figure 7 illustrates the day-to-day variation of Fe and La in ambient PM2.5 and CAPs.These trace elements measured in CAPs accurately
SD n
18
reflected the concentrations of elements in the ambientparticles, with only minor variability observed as a resultof daily fluctuations in the performance of the concentrator.
Table 2 summarizes the average ultrafine particle num-ber concentrations in ambient air for each day during thetwo 3-day exposure periods. As shown in the table, themaximum number concentrations occurred on July 14 and15. Analyses of ambient gaseous pollutants showed SO2peaked on these days as well (Table 3), while the highestNOx concentration was on July 14. Overall, the ambientconcentrations of pollutant gases were greater during thefirst exposure week than the second.
CHEMICAL AND PHYSICAL CHARACTERIZATION OF CAPS
Daily average ambient PM2.5 and CAPs mass concentra-tions during the two 3-day exposure studies in July areshown in Table 4. The average CAPs mass concentration forthe first and second exposure periods were 596 ± 563 µg/m3
and 356 ± 222 µg/m3, respectively. As discussed in thesection Biologic Changes Related to CAPs Exposures inDetroit, the first 3-day exposure period (July 14–16) wasthe only period during which pathobiologic effects wereidentified in the CAPs-exposed OVA-challenged rats.Therefore, the chemical and physical characteristics of PMand of its sources were investigated to determine if specificcomponents may be responsible for these observed bio-logic effects.
First, the chemical composition of the major componentsof CAPs during the two 3-day exposure studies was exam-ined. As previously observed in SW Detroit, sulfate andOC dominated the CAPs during the summer months (Fig-ure 8). Although, on average, the major components of theCAPs mass during the two 3-day exposure periods in July

19
J. Harkema et al.
Table 1. Ambient PM2.5 Composition During 8-Hour Exposure Periods in SW Detroit
3-Day 8-Hour Exposure Study 1 3-Day 8-Hour Exposure Study 2
7/14 7/15 7/16 TWA 7/21 7/22 7/23 TWA
Mass (µg/m3) 24 41 3 23 ± 19 18 13 6 13 ± 6
Carbon (µg/m3)OC 4.2 3.9 1.2 3.1 ± 1.7 3.0 2.2 2.1 2.4 ± 0.5EC 1.3 0.7 0.3 0.8 ± 0.5 1.2 1.4 0.5 1.1 ± 0.5
Inorganic ions (µg/m3)SO4
2� 5.4 8.5 0.1 4.7 ± 4.3 1.7 1.3 0.2 1.1 ± 0.8NO3
� 3.0 3.2 0.1 2.1 ± 1.7 0.4 0.1 0.2 0.2 ± 0.1NH4
+ 2.6 4.0 0.1 2.2 ± 2.0 1.2 1.0 0.2 0.8 ± 0.5
Elements (ng/m3)Mg 49 44 15 36 ± 18 42 14 20 25 ± 15Al 37 36 10 28 ± 15 34 27 19 27 ± 8S 2149 4146 73 2123 ± 2037 1139 807 193 713 ± 480V 2.2 1.4 0.1 1.2 ± 1.1 0.6 1.8 0.4 0.9 ± 0.8Cr 0.9 1.0 1.2 1.1 ± 0.2 4.4 0.8 0.8 2.0 ± 2.1
Mn 21.5 5.0 1.5 9.3 ± 10.7 11.5 3.8 2.7 6.0 ± 4.8Fe 356 134 38 176 ± 163 181 73 72 109 ± 63Co 0.09 0.05 0.02 0.05 ± 0.04 0.05 0.03 0.03 0.04 ± 0.01Ni 1.2 1.5 0.1 1.0 ± 1 0.5 0.4 0.2 0.4 ± 0.2Cu 9.6 5.0 5.4 6.7 ± 2.5 8.2 5.7 7.0 7.0 ± 1.3
Zn 65 27 8 33 ± 29 77 24 26 43 ± 30As 8.8 4.8 0.8 4.8 ± 4.0 2.9 4.5 2.9 3.4 ± 0.9Se 11.8 18.9 0.4 10.3 ± 9.3 5.0 2.3 1.5 2.9 ± 1.8Rb 0.7 0.2 0.0 0.3 ± 0.3 0.2 0.1 0.0 0.1 ± 0.1Sr 1.1 1.6 0.2 1.0 ± 0.7 0.8 0.3 0.4 0.5 ± 0.3
Mo 1.7 0.4 1.1 1.1 ± 0.7 0.7 0.4 0.2 0.4 ± 0.3Cd 0.3 0.2 0.1 0.2 ± 0.1 0.5 0.1 0.1 0.3 ± 0.2Ba 9.2 3.8 1.9 5.0 ± 3.8 4.5 4.8 4.2 4.5 ± 0.3La 0.37 0.22 0.01 0.20 ± 0.18 0.87 0.05 0.03 0.31 ± 0.48Sm 0.01 0.01 0.00 0.00 ± 0.00 0.01 0.00 0.00 0.00 ± 0.00Pb 9.9 3.7 1.4 5.0 ± 4.4 4.3 2.5 1.9 2.9 ± 1.3
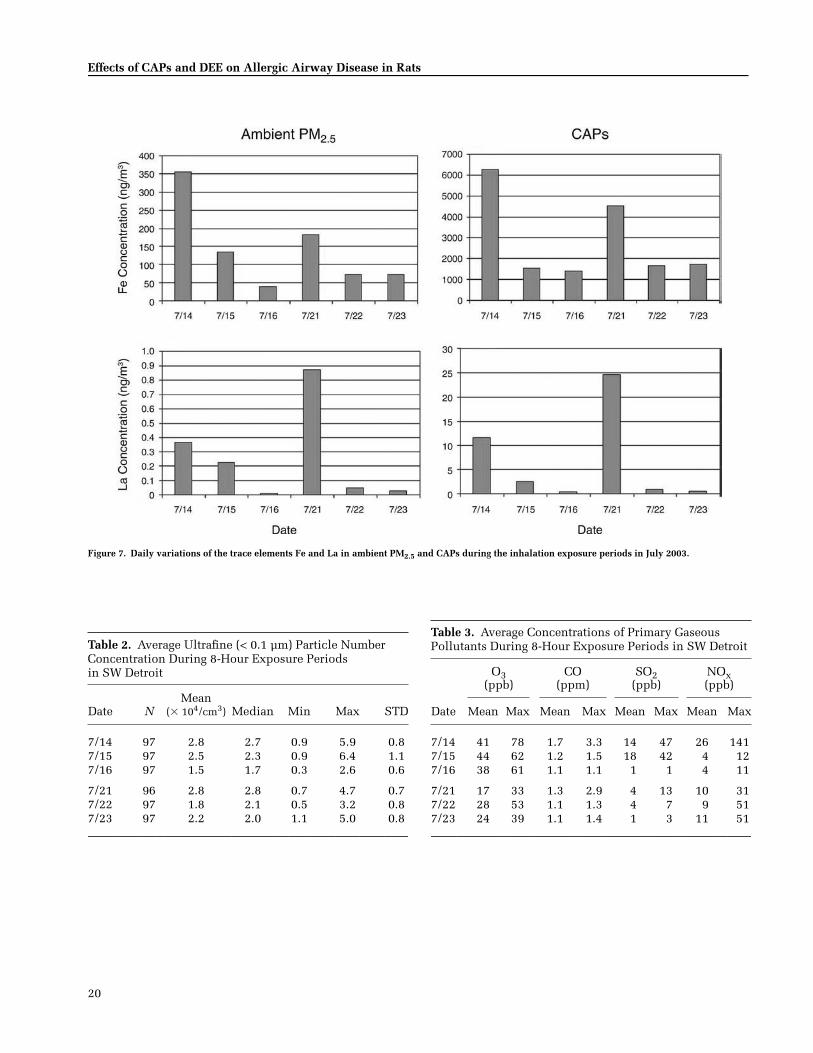
20
Effects of CAPs and DEE on Allergic Airway Disease in Rats
Figure 7. Daily variations of the trace elements Fe and La in ambient PM2.5 and CAPs during the inhalation exposure periods in July 2003.
Table 2. Average Ultrafine (< 0.1 µm) Particle Number Concentration During 8-Hour Exposure Periods in SW Detroit
Date NMean
(� 104/cm3) Median Min Max STD
7/14 97 2.8 2.7 0.9 5.9 0.87/15 97 2.5 2.3 0.9 6.4 1.17/16 97 1.5 1.7 0.3 2.6 0.6
7/21 96 2.8 2.8 0.7 4.7 0.77/22 97 1.8 2.1 0.5 3.2 0.87/23 97 2.2 2.0 1.1 5.0 0.8
Table 3. Average Concentrations of Primary Gaseous Pollutants During 8-Hour Exposure Periods in SW Detroit
O3(ppb)
CO(ppm)
SO2 (ppb)
NOx(ppb)
Date Mean Max Mean Max Mean Max Mean Max
7/14 41 78 1.7 3.3 14 47 26 1417/15 44 62 1.2 1.5 18 42 4 127/16 38 61 1.1 1.1 1 1 4 11
7/21 17 33 1.3 2.9 4 13 10 317/22 28 53 1.1 1.3 4 7 9 517/23 24 39 1.1 1.4 1 3 11 51

J. Harkema et al.
Table 4. CAPs and Ambient PM2.5 Mass Concentrations During the Two 3-Day Exposure Studies in SW Detroit
3-DayExposure
ConcentrationEfficiency Factors
CAPs(µg/m3)
Ambient PM2.5(µg/m3)
7/14 21 495 247/15 30 1202 417/16 26 89 3
TWA 26 596 23
7/21 31 570 187/22 29 372 137/23 20 127 6
TWA 27 356 13
were similar, the details of the trace element compositionand the meteorological data indicated PM2.5 contributionswere from local combustion sources on July 14 and 15,which was during the first 3-day exposure period.
As shown in Table 5, the concentrations of the followingtrace elements in the CAPs reached their highest levels onJuly 14 (week 1): Mg, Al, Cr, Mn, Fe, Co, Ni, As, Rb, Sr, Mo,Cd, Ba, Sm, and Pb. In particular, Rb reached the highestlevel that we have ever observed during our exposure stud-ies in SW Detroit. This element has been found to be asso-ciated with the emissions from sewage-sludge incinerators.
A summary of the concentrations of polycyclic aromatichydrocarbons (PAHs) in the CAPs is shown in Table 6.This list represents a broad range in PAH volatilities (andmolecular weights), from phenanthrene (molecular weight178) to benzo[ghi]perylene (molecular weight 276). Whilethere were detectable amounts of PAHs during all expo-sure periods, the PAH concentrations measured on July 14
Figure 8. Average chemical composition of the major components of CAPs du
and 15 were significantly higher (> 60%) than those duringthe remainder of the exposure days.
TRACE ELEMENTS FROM PARTICLES RETAINED IN LUNG TISSUES OF CAPS-EXPOSED RATS
A suite of trace elements was successfully quantifiedin rat lung tissues after inhalation exposure to CAPs gen-erated from urban Detroit air. During the first 3-dayexposure period in July 2003, elevated amounts of La, Rb,and Mo were recovered from the lungs of rats exposed toCAPs. Figure 9 shows Mo was recovered from lungs ofOVA-challenged rats exposed to CAPs. It is interesting tonote that the concentrations of these anthropogenic traceelements (La, Rb, and Mo) recovered from the lung tissueswere also elevated in ambient PM2.5 on July 14.
BIOLOGIC CHANGES RELATED TO CAPS EXPOSURES IN DETROIT
Nasal and Pulmonary Histopathology
In week 1 and week 2, Air/Saline and CAPs/Saline ratshad no exposure-related histopathology in nasal or pulmo-nary tissue sections examined by light microscopy. OVA-challenged rats had a mild-to-moderate allergic rhinitis.This nasal response was characterized by a mixed inflam-matory response as evidenced by eosinophils, lympho-cytes, plasma cells, and occasional neutrophils found in thenasal mucosa, which were principally lined by transitionalepithelium (in the T1 section) or respiratory epithelium(in the T1 through T4 sections). Interestingly, this inflam-matory response was minimal or absent in the mucosalined by olfactory epithelium (in the T2 through T4 sec-tions). There was mild mucus cell hyperplasia and hyper-trophy in the respiratory epithelium lining the proximal
21
ring the two 3-day exposure studies in SW Detroit.

22
Effects of CAPs and DEE on Allergic Airway Disease in Rats
Table 5. Composition of CAPs During 8-Hour Exposure Periods in SW Detroit
3-Day 8-Hour Exposure Study 1 3-Day 8-Hour Exposure Study 2
7/14 7/15 7/16 TWA 7/21 7/22 7/23 TWA
Mass (µg/m3) 495 1,202 89 596 ± 563 570 372 127 356 ± 222
Carbon (µg/m3)OC 206 186 37 143 ± 92 123 140 62 108 ± 41EC 13 7 4 8 ± 5 8 5 5 6 ± 2
Inorganic ions (µg/m3)SO4
2� 56 355 2 137 ± 190 123 47 7 59 ± 59NO3
� 64 22 6 29 ± 30 45 22 3 23 ± 21NH4
+ 51 75 3 42 ± 37 45 24 7 25 ± 19
Elements (ng/m3)Mg 1,086 377 421 628 ± 397 907 265 507 560 ± 324Al 1,058 348 308 571 ± 422 814 244 461 506 ± 287S 24,906 42,190 1,050 22,715 ± 20,657 34,419 16,697 3,506 18,208 ± 15,512V 26 10 2 12 ± 13 12 31 4 16 ± 14Cr 18 9 5 10 ± 7 13 8 13 12 ± 3
Mn 587 57 47 230 ± 309 316 89 71 158 ± 137Fe 6,268 1,526 1,396 3,063 ± 2,776 4,535 1,650 1,723 2,636 ± 1,645Co 1.7 0.5 1.1 1.1 ± 0.6 1.0 0.5 0.6 0.7 ± 0.3Ni 16 6 1 8 ± 7 10 6 3 7 ± 4Cu 252 47 209 170 ± 108 289 230 259 259 ± 30
Zn 1,494 337 154 662 ± 727 1,811 526 195 844 ± 854As 68 25 4 32 ± 32 44 50 52 49 ± 4Se 130 147 3 93 ± 79 133 41 24 66 ± 59Rb 14 3 1 6 ± 7 5 1 1 2 ± 2Sr 30 18 10 20 ± 10 21 9 10 13 ± 7
Mo 15 4 6 8 ± 6 10 5 2 6 ± 4Cd 4 2 1 2 ± 2 4 1 2 2 ± 1Ba 273 49 76 133 ± 122 134 132 117 128 ± 9La 11.7 2.5 0.4 4.8 ± 6.0 24.6 1.0 0.5 8.7 ± 13.8Sm 0.2 0.1 0.1 0.1 ± 0.1 0.2 0.0 0.1 0.1 ± 0.1Pb 213 54 42 103 ± 95 87 58 36 60 ± 26

23
J. Harkema et al.
Table 6. Average PAH Concentrations in CAPs During 8-Hour Exposure Periods in SW Detroit*
7/14 7/15 7/16 7/21 7/22 7/23
Sum of Measured PAHs 281.9 185.6 29.0 93.9 72.1 108.5
Speciated PAHsPhenanthrene 46.7 31.7 21.7 40.9 28.9 27.9Anthracene 2.2 1.3 0.2 1.8 1.3 17.8
Methylphenanthrenesa-Methylphenanthrene 9.0 6.8 2.1 3.7 4.4 3.8b-Methylphenanthrene 9.0 5.5 2.6 5.2 5.6 6.2c-Methylphenanthrene 1.5 0.3 <1.0 0.6 <1.0 <1.04-Methylphenanthrene 6.0 4.0 1.0 2.6 3.8 4.01-Methylphenanthrene 4.1 3.1 0.3 1.8 3.3 2.3
Dimethylphenanthrenes3,6-Dimethylphenanthrene 8.2 6.8 <1.0 <1.0 <1.0 <1.02,6-Dimethylphenanthrene 4.8 3.5 <1.0 <1.0 <1.0 <1.02,7-Dimethylphenanthrene 3.2 2.2 <1.0 <1.0 <1.0 <1.01,3+2,10+3,9-Dimethylphenanthrene 1.7 1.3 <1.0 <1.0 <1.0 <1.01,6+2,9-Dimethylphenanthrene 35.9 20.5 <1.0 <1.0 <1.0 <1.01,7-Dimethylphenanthrene 4.4 0.0 <1.0 <1.0 <1.0 <1.02,3-Dimethylphenanthrene 0.0 0.0 <1.0 <1.0 <1.0 <1.0
Molecular Weight 202-228 PAHsFluoranthene 20.1 8.5 <1.0 9.7 <1.0 <1.0Pyrene 15.5 7.0 <1.0 8.0 <1.0 <1.0Fluorine 15.4 39.4 <1.0 0.0 <1.0 12.3Benzo[a]anthracene 7.5 5.2 <1.0 4.2 <1.0 <1.0Chrysene/triphenylene 16.1 6.8 <1.0 5.7 17.4 <1.0
Molecular Weight 252-278 PAHsBenzo[b+j+k]fluoranthene 4.8 4.6 <1.0 <1.0 <1.0 <1.0Benzo[e]pyrene 11.3 5.0 <1.0 3.8 <1.0 <1.0Perylene 0.8 0.6 <1.0 0.4 <1.0 <1.0Benzo[a]pyrene 9.0 3.8 <1.0 1.2 4.3 <1.0Indeno[1,2,3-cd]pyrene 31.5 11.8 <1.0 <1.0 0.6 <1.0Benzo[ghi]perylene 8.5 3.0 <1.0 <1.0 <1.0 <1.0
Sulfur-Containing PAHsDibenzothiophene 4.6 3.1 1.2 4.2 2.4 34.2
* Concentration units: ng/m3.

Effects of CAPs and DEE on Allergic Airway Disease in Rats
Figure 9. Amounts of La and Mo in lung tissues of rats exposed to filteredair or CAPs and challenged with saline or OVA during week 1 of the study(July 14–16, 2003). Concentrations are in µg of trace elements per gram ofdry lung tissue. The central line in each box marks the median value; thetop and bottom edges of the box represent the 25th and 75th percentiles.The bars extending from the top and bottom of the boxes show the highestand lowest values.
and distal septum (in the T1 and T2 sections, respectively)and lining the nasopharyngeal meatus (in the T3 and T4sections). In addition, there was marked lymphoid hyper-plasia in the nasal-associated lymphoid tissues lining thenasopharyngeal meatus in the T3 section.
In weeks 1 and 2, the magnitude of all of these OVA-induced nasal lesions was similar in the Air/OVA andCAPs/OVA rats, suggesting that CAPs exposure had nomicroscopically detectable effect on the nasal epithelialand inflammatory responses to OVA.
The principal morphologic lesions in the lungs of BN ratsintranasally challenged with OVA were an allergic bron-chiolitis and alveolitis (allergic bronchopneumonia). Therewas a noticeable proximal to distal decrease in the severityof the bronchopneumonia in the left lung lobe of each ani-mal, with more inflammatory lesions in the proximal lungsection (G5 axial-airway level, closest to the hilus) com-pared to the more distal section (G11 axial-airway level)(Figure 10).
OVA-induced inflammatory and epithelial lesions in theconducting airways involved the large-diameter, proximalaxial airways and the small-diameter, distal preterminal
24
and terminal airways. Inflammatory and epithelial lesionswere usually more severe in the more proximal axial bron-chioles compared to those in the more distal preterminaland terminal bronchioles. OVA-induced bronchiolitis wascharacterized by peribronchiolar edema associated with amixed inflammatory cell influx of eosinophils, lympho-cytes, plasma cells, and occasional neutrophils. Peribron-chiolar inflammation was principally located in the sub-epithelial interstitial tissues (e.g., the lamina propria andsubmucosa) with markedly fewer inflammatory cells in thesurface epithelium lining these airways.
Bronchiole-associated lymphoid tissues in these OVA-exposed airways were also enlarged as a result of lym-phoid hyperplasia. Perivascular, interstitial accumulationof a similar mixture of eosinophils and mononuclear cells,along with perivascular edema, was also present in thelungs of OVA-challenged rats (i.e., surrounding pulmonaryarteries adjacent to bronchioles and pulmonary veins scat-tered throughout the alveolar parenchyma).
OVA-challenged rats exposed either to air or CAPshad MCM and hyperplasia with increased amounts of AB/PAS-stained mucosubstances (i.e., IM) in the surfaceepithelium lining the affected large-diameter bronchioles,including the proximal and distal axial airways (Figure 11;see morphometric results in the first section below entitledChanges in Airway Epithelial Cell Density and LabelingIndices). Saline-challenged rats exposed to filtered air orCAPs had significantly fewer mucus cells and IM com-pared to the OVA-challenged animals. The amounts ofIM in saline-challenged rats exposed to CAPs and saline-challenged rats exposed to filtered air were not signifi-cantly different.
In addition to the perivascular and peribronchiolarlesions, there were varying-sized focal areas of allergicalveolitis in the lung parenchyma (Figure 12). These alve-olar lesions were characterized by accumulation of largenumbers of alveolar macrophages (AM), epithelioid cells,and eosinophils, with lesser numbers of lymphocytes,monocytes, and plasma cells in the alveolar airspace.Often the alveolar septa in these areas of alveolitis werethickened due to type II pneumocyte hyperplasia andhypertrophy, intracapillary accumulation of inflammatorycells, and capillary congestion.
During week 1, OVA-challenged rats exposed to CAPs(CAPs/OVA group) had a more severe allergic broncho-pneumonia than OVA-challenged rats exposed only to fil-tered air (Figure 12). This was reflected in both the severityand distribution of the allergic bronchiolitis and alveolitis.Air/OVA rats had a mild-to-moderate allergic broncho-pneumonia, with inflammatory and epithelial lesions inapproximately one-fourth to one-third of the lung lobe.

25
J. Harkema et al.
Figure 10. Light photomicrographs of tissue sections taken from the left lung lobe perpendicular to the main axial airway (arrows) at the level of the prox-imal airway generation 5 (G5) and the distal airway generation 11 (G11) in rats exposed to filtered air or CAPs and intranasally challenged with saline orOVA during week 1. Allergic bronchopneumonia (represented by an asterisk) is evident only in the lungs of Air/OVA and CAPs/OVA rats. Lung lesions aremore severe in the tissue sections from CAPs/OVA rats compared to those from Air/OVA rats. Tissues were stained with hematoxylin and eosin. Scale barsare 5 mm. AP = alveolar parenchyma.

26
Effects of CAPs and DEE on Allergic Airway Disease in Rats
Figure 11. Light photomicrographs of the respiratory airway epithelium lining the intrapulmonary axial airway (generation 11) in the left lung lobe ofOVA-challenged rats exposed either to air or CAPs during week 1. Tissues were stained with AB/PAS for specific identification of IM (dark magenta stainidentified by arrows). AL = airway lumen; AP = alveolar parenchyma; and BV = blood vessel. Scale bars are 100 µm.

27
J. Harkema et al.
Figure 12. Light photomicrographs of the alveolar parenchyma from the left lung lobe of rats exposed to and challenged with (A) Air/Saline, (B) CAPs/Saline, (C) Air/OVA, or (D) CAPs/OVA during week 1. Focal areas of alveolitis composed mainly of macrophages, epithelioid cells, lymphocytes, and eosi-nophils (indicated with asterisks) that obscure alveolar airspaces, along with increased numbers of inflammatory cells and macrophages in adjacent alveolarlumens (indicated by arrows), are evident in C and D, but not in A and B. The most severe allergic alveolitis is evident in the lungs from the CAPs/OVA rats(D). Tissues were stained with hematoxylin and eosin. pl = pleura; a = alveolus; and ad = alveolar duct. Scale bars are 100 µm.

Effects of CAPs and DEE on Allergic Airway Disease in Rats
In contrast, CAPs/OVA rats had a moderate-to-markedbronchopneumonia, with lesions in approximately one-halfor more of the lung lobe. CAPs/OVA rats also had moresevere MCM in the epithelium lining the large-diameteraxial airways compared to OVA-challenged rats exposedonly to filtered air (Figure 12). This was reflected in themean volume densities of IM in the axial airways (see mor-phometric results in Table 13).
Lung lesions in the OVA-challenged rats of week 1 andweek 2 were similar in character and severity, with themarked exception that CAPs/OVA rats in week two did nothave an enhanced allergic bronchopneumonia as com-pared to the Air/OVA rats. There were no microscopic dif-ferences, between the air-exposed and CAPs-exposed rats,in the severity or distribution of the inflammatory and epi-thelial lesions induced by OVA.
Changes in IM Lining Pulmonary Airways
CAPs exposure during weeks 1 and 2 had no effecton the amounts of IM in the main axial airways ofsaline-challenged rats (Figure 13). In week 1, IM were not
28
Figure 13. IM in pulmonary proximal (top graphs) and distal (lower graphs)or OVA for 3 consecutive days during week 1 (left graphs) or week 2 (right grapAB/PAS for specific identification of IM as described in the text. a = significadifferent from respective group exposed to filtered air; P � 0.05. Clear bars rep
statistically increased in Air/OVA rats compared to thosein the Air/Saline control rats. However, IM in the proximaland distal pulmonary airways of CAPs/OVA rats were sig-nificantly increased compared to those in Air/OVA controlrats (33% and 200% increases, respectively). In week 2,however, CAPs exposure did not enhance the IM inducedby OVA alone.
CAPs exposures of saline-challenged rats had no effectson IM in the epithelium lining the nasal septum (Figure 14).In both studies, OVA challenge induced increases of IM inboth the proximal and distal septum. IM in the proximalnasal septum were not altered by CAPs exposure in eitherweek 1 or 2. IM in the distal septum of CAPs-exposed,OVA-challenged rats were not different from those of air-exposed animals, in either week 1 or 2.
Changes in Airway Epithelial Cell Density and Labeling Indices
The morphometry of the pulmonary airway epitheliumthat reflects cell proliferation (i.e., numeric cell densitiesand the BrdU labeling indices) is presented in Table 7.
conducting airways. Rats were exposed to CAPs and challenged with salinehs). Twenty-four hours later lungs were collected, processed, and stained withntly different from respective group challenged with saline; b = significantlyresent filtered air; black bars represent CAPs.

29
J. Harkema et al.
Figure 14. IM in the proximal and distal nasal septum. Rats were exposed to CAPs and challenged with saline or OVA for 3 consecutive days. Twenty-fourhours later the nasal septum was collected and processed and stained with AB/PAS for specific identification of IM as described in the text. a = significantlydifferent from respective group challenged with saline; P � 0.05. Clear bars represent filtered air; black bars represent CAPs. Note the use of different y-axisscales in the bottom two figures.
Table 7. Effects of CAPs Exposure and OVA Challenge on Epithelial Cell Proliferation in Pulmonary Axial Airways
Group
Proximal Airways Distal Airways
LI(%)
ULLI(%/mm)
Numeric Cell Density(total cells/mmbasal lamina)
LI(%)
ULLI(%/mm)
Numeric Cell Density(total cells/mmbasal lamina)
Week 1Air/Saline 1.93 ± 0.32 2.93 ± 0.56 170.74 ± 12.36 2.58 ± 0.44 5.72 ± 1.11 214.71 ± 11.46CAPs/Saline 1.64 ± 0.31 2.64 ± 0.54 156.95 ± 10.86 2.49 ± 0.83 5.74 ± 2.15 210.03 ± 15.05Air/OVA 9.57 ± 0.95a 17.67 ± 2.74a 178.18 ± 11.77 21.39 ± 3.81a 46.25 ± 7.87a 222.13 ± 12.51 CAPs/OVA 9.42 ± 0.78a 18.05 ± 1.74a 190.37 ± 3.47 20.12 ± 3.35a 41.47 ± 6.78a 208.47 ± 7.15
Week 2Air/Saline 4.08 ± 0.81 6.32 ± 1.30 154.26 ± 9.43 2.85 ± 0.35 6.01 ± 0.87 207.73 ± 8.08CAPs/Saline 3.28 ± 0.53 5.34 ± 1.01 156.77 ± 9.37 2.33 ± 0.42 4.76 ± 1.05 195.01 ± 14.43Air/OVA 11.22 ± 1.75a 20.17 ± 3.90a 175.04 ± 9.14 14.90 ± 2.44a 31.64 ± 4.96a 214.26 ± 9.65 CAPs/OVA 11.75 ± 1.49a 21.17 ± 2.72a 182.04 ± 9.28 15.43 ± 2.87a 32.73 ± 6.52a 209.70 ± 7.40
a Significantly different from respective group challenged with saline alone; P � 0.05.

30
Effects of CAPs and DEE on Allergic Airway Disease in Rats
Figure 15. Protein (top graphs) and mucin glycoprotein (Muc5AC) (lower graphs) in BALF. Rats were exposed to CAPs and challenged with saline or OVAfor 3 consecutive days, and BALF was collected 24 hours later. Protein and mucins in BALF were analyzed as described in the text. a = significantly differentfrom respective group challenged with saline; b = significantly different from respective group exposed to filtered air; P � 0.05. Clear bars represent filteredair; black bars represent CAPs. Note the use of different y-axis scales in the bottom two figures.
Table 8. Effects of CAPs Exposure and OVA Challenge on Bronchoalveolar Lavage Cellularity (cells/mL BALF)
Group Total CellsMacrophageMonocytes Neutrophils Eosinophils Lymphocytes
Week 1Air/Saline 103,928 ± 20,859 89,725 ± 13,867 2,973 ± 1,621 10,353 ± 9,391 890 ± 857CAPs/Saline 117,143 ± 21,407 93,177 ± 13,286 3,159 ± 922 19,743 ± 12,604 1,077 ± 371Air/OVA 237,500 ± 49,654a 125,848 ± 44,499a 65,576 ± 12,297a 43,262 ± 11,978a 2,813 ± 1,030a
CAPs/OVA 319,688 ± 53,969a,b 84,108 ± 11,825 85,810 ± 12,696a 142,849 ± 36,187a,b 7,023 ± 1,670a,b
Week 2Air/Saline 83,125 ± 8,703 73,605 ± 7,952 1,581 ± 428 7,764 ± 4,108 175 ± 174CAPs/Saline 93,571 ± 12,656 73,243 ± 6,372 3,850 ± 858 15,874 ± 8,373 602 ± 323Air/OVA 319,688 ± 65,859a 100,561 ± 17,915 113,357 ± 30,060a 101,534 ± 35,604a 1,818 ± 1,410a
CAPs/OVA 339,687 ± 65,859a 106,180 ± 18,284 123,121 ± 39,510a 108,498 ± 26,881a 1,996 ± 1,106a
a Significantly different from respective group challenged with saline (i.e., not challenged with OVA [control]); P � 0.05.b Significantly different from respective group exposed to filtered air; P � 0.05.

J. Harkema et al.
Table 9. Effects of CAPs Exposure and OVA Challenge on BALF Cytokines (ng/mL)*
Group TNF� IFN IL-4 IL-6 IL-10
Week 1Air/Saline ND ND ND ND NDCAPs/Saline ND ND ND ND NDAir/OVA 13.82 ± 1.87a ND ND 28.88 ± 6.27a NDCAPs/OVA 25.85 ± 5.6a ND ND 25.46 ± 5.17a ND
Week 2Air/Saline ND ND ND ND NDCAPs/Saline ND ND ND ND NDAir/OVA 10.55 ± 3.64a ND ND 10.72 ± 3.35a NDCAPs/OVA 14.72 ± 4.93a ND ND 9.78 ± 3.25a ND
* ND indicates not detected.a Significantly different from respective group challenged with saline
(i.e., not challenged with OVA [control]); P � 0.05.
Compared to the Air/Saline controls, OVA challenge and/or CAPs exposure did not induce changes in the total num-bers of epithelial cells lining the proximal or distal axialairways (G5 and G11, respectively) in the left lung lobe ofexposed rats. OVA-challenged rats, however, in bothweeks 1 and 2, did have significant increases in both theBrdU LI and ULLI in the airway epithelium lining bothproximal and distal axial airways. CAPs exposures did notalter these OVA-induced increases in the BrdU labelingindices in either axial airway location. In addition, CAPsexposures alone did not alter these parameters of airwayepithelial proliferation in saline-challenged rats in weeks1 or 2.
Changes in BALF
Exposure to CAPs during either week 1 or 2 had no sig-nificant effects on the cellularity of the BALF in rats notchallenged with OVA (CAPs/Saline group) (Table 8). Incontrast, OVA challenge caused significant increases intotal cells (250%–300% increase), macrophages (40%),neutrophils (2000%–3000%), lymphocytes (200%–900%),and eosinophils (300%–1000%) in BALF during bothweek 1 and week 2. In week 1, CAPs exposure enhancedOVA-induced total BALF cells (34% increase), eosinophils(250%), lymphocytes (150%), and neutrophils (30%) com-pared to OVA-challenged rats exposed only to filtered air(Air/OVA). Conversely, the number of macrophages in theBALF of CAPs/OVA rats was similar to that of the control ani-mals (Air/Saline). In week 2, CAPs exposures had no effecton OVA-induced increases in the numbers of BALF cells.
Total protein and secreted mucosubstances in BALFwere unaffected by CAPs exposures in saline-challengedrats during both exposure periods (Figure 15). In bothstudies, challenge with OVA caused significant increases
Figure 16. OVA-specific IgE in the BALF. Rats were exposed to CAPs and cha24 hours later. IgE in BALF was analyzed as described in the text. a = significa
in both protein (250%–300% increases) and mucus hyper-secretion (90%–100%). During week 1, CAPs exposureenhanced BALF protein (40%) and secreted mucins (50%)in OVA-challenged rats. By comparison, CAPs exposureduring week 2 had no effects.
BALF concentrations of TNF� and IL-6 were increasedin OVA-challenged rats exposed to filtered air or CAPsduring both weeks 1 and 2 (Table 9). Treatment-relatedeffects were not detected in other BALF cytokines of ratsexposed to CAPs or challenged with OVA.
Sensitization and challenge with OVA induced significantaccumulation of OVA-specific IgE in BALF that was unaf-fected by CAPs exposures in either week 1 or 2 (Figure 16).The BALF IgE levels of animals challenged with salinewere not affected by CAPs exposure.
31
llenged with saline or OVA for 3 consecutive days, and BALF was collectedntly different from respective group challenged with saline; P � 0.05.

Effects of CAPs and DEE on Allergic Airway Disease in Rats
Table 10. Effects of CAPs Exposure and OVA Challenge on Pulmonary Gene Expression*
Group Muc5AC IL-5 IL-10 IL-12p35 IL-12p40 IL-13 IFN TNF�
Week 1Air/Saline 1.000 ± 0.301 1.000 ± 0.302 1.000 ± 0.242 1.000 ± 0.206 1.000 ± 0.344 1.000 ± 0.280 1.000 ± 0.152 1.000 ± 0.242CAPs/Saline 1.325 ± 0.213 0.560 ± 0.095 0.699 ± 0.152 1.041 ± 0.253 1.005 ± 0.312 0.516 ± 0.095 1.657 ± 0.711 0.699 ± 0.128Air/OVA 0.289 ± 0.028a 0.585 ± 0.148 4.343 ± 1.033a 0.692 ± 0.157 0.614 ± 0.171 0.697 ± 0.064 2.988 ± 0.714a 4.343 ± 1.104a
CAPs/OVA 0.318 ± 0.063a 0.344 ± 0.053 1.934 ± 0.962b 0.563 ± 0.150 0.350 ± 0.132a 0.473 ± 0.094 1.092 ± 0.321b 1.943 ± 1.028b
Week 2Air/Saline 1.000 ± 0.401 1.000 ± 0.580 1.000 ± 0.252 1.000 ± 0.211 1.000 ± 0.373 1.000 ± 0.405 1.000 ± 0.233 1.000 ± 0.165CAPs/Saline 1.203 ± 0.386 0.989 ± 0.213 0.715 ± 0.171 1.237 ± 0.241 1.141 ± 0.430 1.112 ± 0.285 0.894 ± 0.224 0.592 ± 0.105Air/OVA 0.655 ± 0.198 0.951 ± 0.391 1.811 ± 0.635 0.723 ± 0.174 0.414 ± 0.144 0.685 ± 0.103 1.333 ± 0.484 0.815 ± 0.222CAPs/OVA 0.368 ± 0.069a 0.707 ± 0.178 1.477 ± 0.447 0.933 ± 0.213 0.467 ± 0.118 0.812 ± 0.196 1.317 ± 0.285 0.689 ± 0.124
* Reported as fold increase relative to Air/Saline control.a Significantly different from respective group challenged with saline (i.e., not challenged with OVA [control]); P � 0.05.b Significantly different from respective group exposed to filtered air; P � 0.05.
Table 11. Particle and Gas Concentrations in Clean Air, Low- (Target 42 µg/m3), and High- (Target 312 µg/m3) DEE Exposure Atmospheres*
Control Low High
Particle mass (µg/m3) 5.6 ± 1.2 38.7 ± 5.4 311.7 ± 11.6DEPsa (µg/m3) NA 33.0 306.0NOx (ppm) ND 0.3 ± 0.1 3.8 ± 0.5CO (ppm) 0.5 ± 0.1 0.4 ± 0.1 3.1 ± 0.5THC (ppm) 0.2 ± 0.1 0.2 ± 0.1 0.5 ± 0.1
* NA indicates not applicable; ND indicates not detected.a DEPs exposure chamber particle mass concentration � concentration
in the clean air chamber (control) (TEOM used to measure particle mass).
Gene Expression of Airway Mucin and Inflammatory Cytokines
During both weeks 1 and 2, CAPs exposures had noeffect on mucin or inflammatory cytokine gene expressionin lung lobes from rats challenged with saline (Table 10).During week 1, we detected an OVA-induced decrease inMuc5AC, and increases in IL-10, IFN, and TNF� in air-exposed rats. Muc5AC and IL-12p40 were also decreasedin OVA-challenged, CAPs-exposed animals, but CAPsinhibited the OVA-induced increase in IL-10, IFN, andTNF�. The only significant treatment-related effect duringweek 2 was suppression of Muc5AC in the lungs of OVA-challenged, CAPs-exposed animals.
RESULTS OF INHALATION STUDIES OF DEE
DEE Exposure Concentrations
The concentrations of DEPs, CO, NOx, and THC areshown in Table 11. The target concentrations for the low-and high-exposure levels were 30 and 300 µg/m3 DEPs,respectively. However, the system operator set a target ofDEPs plus 12 µg/m3, which was an historical value for themass particulate matter concentration in clean air cham-bers that results from animal dander. It was assumed thatthere were DEPs plus clean air control particulate matterin the exposure chambers. To assess the DEPs exposure pre-cisely, the concentrations of particulate matter measureddirectly in the clean air chambers were subtracted from theexposure chamber concentrations. The concentrations ofparticulate matter in the clean air chamber were onlyapproximately 5.6 µg/m3, so after subtraction of the back-ground matter, the concentrations of DEPs were slightlyabove target despite being within a couple percent (on aver-age) of the target of DEPs plus 12 µg/m3.
32
The gaseous copollutants in the exposure chambers hadan exposure-related difference in concentrations betweenthe low and high chambers. However, the differences inthe concentrations of CO and THC between the clean airchamber and the control chamber were not large, becausein both chambers the dilution of DEE was great and thusthe concentrations of its constituents were close to back-ground concentrations. CO was not efficiently scrubbed bythe carbon scrubber on the dilution air, and the most vola-tile portions of the THC, especially methane, might nothave been completely scrubbed, which likely contributedto the bulk of the THC mass. Since speciation of the indi-vidual volatile organics in these chambers was not con-ducted, it was not possible to assess whether the composi-tions of the bulk THC in the low and the control chamberswere different, but it was assumed that they were becauseof the presence of DEE in the low chamber.

J. Harkema et al.
CHEMICAL AND PHYSICAL CHARACTERIZATION OF DEPS
Table 12 summarizes the major chemical composition ofthe DEPs observed in the single-cylinder-engine exposuresystem. DEPs during this study consisted of EC (68%–77%), OC (6%–14%), small amounts of inorganic ions,including , , and (0.3%–1.4%), and tracemetals (0.2%–1.4%). The organic component was esti-mated by applying a correction factor of 1.2 to account forunmeasured hydrogen and oxygen. As other studies havereported, EC and OC composed most of the DEE PM duringthe exposure studies (Rogge et al. 1993; Lowenthal et al.1994; McDonald et al. 2004). Measured elements found tobe above detection limits included Al, P, Ca, Ti, V, Mn, Fe,Co, Cu, Zn, As, Mo, Ba, and Pb. Among these, the mostabundant element was Ca, followed by Zn and then P.These three elements — Ca, P, and Zn — are used as addi-tives in fuel and lubrication oil (EPA 2002).
The particle mass size distribution for the diluted DEEwas measured by an MOI. The mass median diameter was
SO42� NO3
� NH4�
Table 12. Average Chemical Composition of Diluted DEPs During 8-Hour Exposure Periods
High Chamber Low Chamber
Mass (µg/m3) 304.2 ± 19.5 34.9 ± 3.5
Carbon (µg/m3)OC 27.2 ± 9.4 3.0 ± 3.0EC 215.3 ± 16.6 24.4 ± 4.3
Inorganic ions (µg/m3)SO4
2� 0.44 ± 0.21 0.08 ± 0.08NO3
� 0.27 ± 0.11 0.17 ± 0.11NH4
+ 0.08 ± 0.29 0.19 ± 0.02
Trace elements (ng/m3)Al 18.6 ± 17.4 3.6 ± 3.8P 157 ± 91 18 ± 10Ca 425 ± 208 123 ± 11
Ti 0.29 ± 0.20 0.33 ± 0.34V 0.23 ± 0.15 0.02 ± 0.02Mn 1.39 ± 0.67 0.34 ± 0.16
Fe 61 ± 33 52 ± 22Co 0.20 ± 0.01 0.07 ± 0.09Cu 65 ± 70 34 ± 31
Zn 256 ± 111 33 ± 28As 0.11 ± 0.02 0.05 ± 0.02Mo 0.57 ± 0.53 0.20 ± 0.35
Ba 0.86 ± 0.78 0.59 ± 0.23Pb 10.3 ± 12.0 4.0 ± 5.1
determined to be 0.1 µm with a geometric standard devia-tion (GSD) of 1.9. The mass distribution revealed thatapproximately 18% of the total mass was attributed toultrafine particles, and more than 85% of the diesel-engineparticle mass was associated with particles below 1 µm inaerodynamic diameter.
The number size distribution ranged from a median of66 nm (1.5 GSD), for the low-exposure concentration, to79 nm (1.5 GSD) for the high-exposure concentration. Asexpected, the number size distribution of particles wasslightly smaller than that reported for mass. Data wereobtained using a fast mobility particle sizer (FMPS; TSIInc., St Paul, MN) at the DEE concentration of 300 µg/m3
during typical operation of the engine exposure system.
TRACE ELEMENTS IN LUNG TISSUE OF DEE-EXPOSED RATS
Understanding the relationship between what was inthe air and what was deposited in the respiratory system isimportant because this link may show specific chemical orelemental components that could be related to the observedeffects or indicative of the source of those effects. Vincent(1990) assessed the risk posed by considering the total harminflicted by the particles retained in the lungs of aerosol-exposed subjects. Since the severity of the inflammatoryresponses in the lungs depends on the physical and chem-ical characteristics of the retained particles, identificationof the types of retained particles in the lungs is important.During this study, a subset of those elements observed inDEPs was above the detection limits in lung tissues (datanot shown); these included Al, Ba, Cd, C, Cr, Co, Cu, Fe,Pb, Mg, Mn, Mo, Sr, P, Ti, and V. Among these elements,several likely originated from DEPs and not from nutrientsand essential elements in rat chow since the concentra-tions of these elements in the lung tissues of the DEE-exposed groups were significantly different from those ofthe groups exposed to filtered air. Figure 17 shows thatconcentrations of two trace elements, V and Fe, recoveredfrom the lung tissues of DEE-exposed rats are elevatedcompared to concentrations recovered from the lungs ofcontrol rats. The central line in each box marks the medianvalue of the element, and the top and bottom edges of eachbox mark the first (25th percentile) and third quartiles(75th percentile), respectively. Groups 0, 30, and 300 rep-resent rats that were exposed to HEPA-filtered air as thecontrol group, 30 µg/m3 DEPs, and 300 µg/m3 DEPs, re-spectively. A statistically significant difference betweenthe filtered-air control group and the 300 µg/m3 DEP groupwas found based on a P value � 0.05. The data for Mn alsoshowed a statistically significant difference between thecontrol and exposed groups.
33

Effects of CAPs and DEE on Allergic Airway Disease in Rats
Figure 17. Amounts of V and Fe in the lung tissues of OVA-sensitized ratsthat were exposed for 3 days to DEE immediately before challenge withOVA. Groups: 0 = Air/OVA; 30 = 30 µg/m3 DEE/OVA; 300 = 300 µg/m3
DEE/OVA. Concentrations are in �g of trace elements per gram of dry lungtissue. The central line in each box marks the median value; the top andbottom edges of the box represent the 25th and 75th percentiles. The barsextending from the top and bottom of the boxes show the highest and low-est values.
Figure 18. Mass-based size (µm) distribution of V, Mn, and Fe in DEPsmeasured by the MOIDI from the high-exposure chamber (300 µg/m3 DEE).
The data revealed direct evidence of deposition of DEPmetals, primarily V, Fe, and Mn, in the lung. The mass sizedistributions of these elements as measured by a MOUDIare shown in Figure 18, which reveals that over 10% of thetotal mass was attributed to these ultrafine particles, andapproximately 70% of these elements were below 1 µm inaerodynamic diameter. In addition, V, Fe, and Mn are well-known transition metals that could undergo the Fentonreaction, which is a stimulator of oxidant generation inmacrophages (Han et al. 2001; Valko et al. 2005). Althoughfurther studies are required to understand a direct linkbetween the deposited metals and observed health effects,these results suggest specific chemical or elemental com-ponents that may be related to the effects.
34
BIOLOGIC CHANGES RELATED TO DEE EXPOSURES
STUDY 1: EXPOSURE TO DEE DURING ALLERGEN SENSITIZATION
Nasal and Pulmonary Histopathology
In study 1, Air/Saline, 30 µg/m3 DEE/Saline, and300 µg/m3 DEE/Saline rats had no exposure-related histo-pathology in nasal or pulmonary tissue sections, with oneexception: a mild dose-dependent increase in AM andmonocytes scattered throughout the airspaces in the alveo-lar parenchyma of DEE-exposed rats compared to filtered-air-exposed animals.
As in the CAPs inhalation study, OVA-sensitized-and-challenged rats had a mild-to-moderate allergic rhinitis.This nasal response was characterized by a mixed inflam-matory response composed of eosinophils, lymphocytes,plasma cells, and occasional neutrophils in the nasalmucosa lined by transitional or respiratory epithelium.There was also mild mucus cell hyperplasia and hypertro-phy in the respiratory epithelium lining the proximal anddistal septum and the nasopharyngeal meatus. In addition,there was marked lymphoid hyperplasia in the nasal-asso-ciated lymphoid tissues lining the nasopharyngeal meatus.DEE exposures had no affect on any of these OVA-inducednasal lesions.
The principal morphologic lesions in the lungs of OVA-sensitized-and-challenged BN rats were an allergic bron-chiolitis and alveolitis (allergic bronchopneumonia) withmucus cell hyperplasia and hypertrophy in the respiratoryepithelium lining the large-diameter conducting airways,

J. Harkema et al.
similar to that described previously for the OVA-sensi-tized-and-challenged rats in the CAPs inhalation study.The high dose of 300 µg/m3 DEE during sensitization hadno effect on the magnitude of these OVA-induced lunglesions. However, the low dose of 30 µg/m3 DEE duringsensitization caused a slight increase in the severity of thebronchiolitis and alveolitis in most of the OVA-sensitizedrats. This was reflected in the total number of inflamma-tory cells in the BALF from these animals (see resultsbelow).
Changes in BALF
In saline-sensitized rats, inhalation exposure to 30 µg/m3
DEE had no effect on the cellularity of the BALF, but expo-sure to 300 µg/m3 DEE caused significant accumulation ofmacrophages in BALF (Figure 19). OVA sensitization andchallenge in filtered-air-exposed rats (Air/OVA) causedsignificant increases in total inflammatory cells (2.4-fold),eosinophils (20-fold), macrophage/monocytes (1.7-fold),and neutrophils (3.4-fold). In OVA-sensitized rats, expo-sure to 30 µg/m3 DEE significantly enhanced total cells inBALF (62% increase), with contributions from increasedeosinophils (52%), macrophages (35%), and neutrophils
Figure 19. Cellularity of BALF. In DEE study 1, rats were exposed to DEE durinOVA for 3 consecutive days. BALF was collected 24 hours later, and total cellsthe text. a = significantly different from respective group sensitized with salin0.05. Clear bars represent filtered air; striped bars represent 30 µg/m3 DEE; bla
(120%). By contrast, exposure to 300 µg/m3 DEE had noeffect on OVA-induced cellularity.
OVA challenge of OVA-sensitized rats caused signifi-cant increases in total protein (4-fold) and Muc5AC (2-fold) in BALF that was unaffected by DEE at either concen-tration (Figure 20, top-right and top-left panels). Elastaseand �-glucuronidase in BALF were also increased in ani-mals sensitized to OVA (Figure 20, bottom-left and bottom-right panels). However, DEE exposure inhibited OVA-induced increases in �-glucuronidase, and a similar trendwas suggested in elastase levels of DEE-exposed rats.
Levels of IL-6 protein were elevated in animals sensi-tized with OVA and exposed to air, and were furtherincreased (2.2-fold) by exposure to 30 µg/m3 DEE, butunaffected by exposure to 300 µg/m3 DEE (Table 13). Othercytokines analyzed in BALF (TNF�, IFN, IL-4, and IL-10)were not significantly affected by OVA sensitization orDEE exposure.
Sensitization and challenge with OVA induced signif-icant accumulation of OVA-specific IgE in BALF thatwas unaffected by exposure to either 30 or 300 µg/m3 DEE(Figure 21).
35
g sensitization with saline or OVA, and 2 weeks later were all challenged with, eosinophils, macrophages, and neutrophils were determined as described ine; b = significantly different from respective group exposed to filtered air; P �ck bars represent 300 µg/m3 DEE. Note the use of different y-axis scales.

36
Effects of CAPs and DEE on Allergic Airway Disease in Rats
Figure 20. Mucin glycoprotein (Muc5AC), total protein, elastase, and �-glucuronidase content in BALF. In DEE study 1, rats were exposed to DEE duringsensitization to saline or OVA, and 2 weeks later were all challenged with OVA for 3 consecutive days. BALF was collected 24 hours later and analyzed asdescribed in the text. a = significantly different from respective group sensitized with saline. Clear bars represent filtered air; striped bars represent 30 µg/m3
DEE; black bars represent 300 µg/m3 DEE. Note the use of different y-axis scales for the top two figures.
Table 13. Study 1: DEE Exposure During OVA Sensitization — Effects of DEE and OVA on BALF Cytokines (ng/mL)*
Group TNF� IL-4 IFN IL-6 IL-10
Air/Saline 3.41 ± 2.25 ND ND 4.97 ± 2.52 5.77 ± 3.4730 DEE/Saline ND ND ND ND ND300 DEE/Saline ND ND ND ND ND
Air/OVA ND ND ND 13.69 ± 3.41 ND30 DEE/OVA 5.41 ± 2.43 ND ND 30.09 ± 11.16a 3.55 ± 1.70300 DEE/OVA ND ND ND 9.35 ± 3.39a ND
* ND indicates not detected.a Significantly different from respective group sensitized with saline (i.e., the control, which was not sensitized with OVA); P � 0.05.

J. Harkema et al.
Figure 21. OVA-specific IgE in BALF. In DEE study 1, rats were exposed toDEE during sensitization with saline or OVA, and 2 weeks later were allchallenged with OVA for 3 consecutive days. Twenty-four hours after thelast challenge, the lungs were lavaged. IgE in BALF was analyzed asdescribed in the text. a = significantly different from respective group sen-sitized with saline; P � 0.05.
IM in Pulmonary Axial Airways
Both levels of exposure to DEE (30 or 300 µg/m3) had noeffect on the amount of stored IM in axial conducting air-ways of saline-sensitized animals (Figure 22). OVA sensiti-zation and challenge caused an increase in IM in bothproximal (2.4-fold) and distal (9-fold) conducting airways.Apparent decreases of OVA-induced IM in the proximalairways of rats exposed to 30 µg/m3 DEE were not statisti-cally significant. A trend toward increased IM associatedwith 300 µg/m3 DEE exposure was evident in both proxi-mal and distal airways.
Levels of DEE exposure (30 or 300 µg/m3) during sensi-tization had no effect on IM in the nasal septum of the Air/Saline rats (Figure 23). OVA challenge of OVA-sensitizedrats caused significant accumulation of IM in the proximal
Figure 22. IM in pulmonary proximal and distal conducting airways. In DEE s2 weeks later were all challenged with OVA for 3 consecutive days. Twenty-stained with AB/PAS for specific identification of IM as described in the text. anificantly different from respective group exposed to 30 µg/m3 DEE; P � 0.05. Crepresent 300 µg/m3 DEE. Note the use of different y-axis scales.
septum that was unaltered by DEE exposures. Increases ofIM in the distal septum were not statistically significant.
Changes in Airway Epithelial Cell Density and the Labeling Indices
Morphometric changes in the epithelium of the pulmo-nary airway that reflect treatment-induced alterations incell proliferation (as indicated by numeric cell densitiesand BrdU labeling indices) are presented in the top sectionof Table 14. Neither OVA sensitization nor DEE exposuresor both caused significant changes (compared to the con-trol rats sensitized to saline and exposed to air [the Air/Saline controls]) in the total numbers of epithelial cells(numeric cell density) lining the proximal or distal axialairways (G5 and G11, respectively) in the left lung lobe. Inaddition, exposure to either high or low concentrations ofDEE did not alter the BrdU LI or the ULLI of proximal ordistal airway epithelium in rats sensitized with onlysaline. Air/OVA rats did have significant increases in boththe LI and ULLI of the proximal airway epithelium and inthe ULLI of the distal airway epithelium, as compared tothe control Air/Saline rats (Table 14). The level of DEEexposure (i.e., 30 or 300 µg/m3) did not alter these OVA-induced increases in the LI or ULLI for the epithelium lin-ing the proximal axial airway. Interestingly, exposure tothe high, but not the low, concentration of DEE appeared toattenuate the OVA-induced increase in ULLI in the distalairway epithelium.
Gene Expression of Airway Mucin and Inflammatory Cytokines
Exposure to 30 or 300 µg/m3 DEE during sensitiza-tion with saline had no effect on mucin or cytokine gene
37
tudy 1, rats were exposed to DEE during sensitization with saline or OVA, andfour hours after the last challenge, the lungs were collected, processed, and = significantly different from respective group sensitized with saline; b = sig-lear bars represent filtered air; striped bars represent 30 µg/m3 DEE; black bars

38
Effects of CAPs and DEE on Allergic Airway Disease in Rats
Figure 23. IM in the nasal septum. In DEE study 1, rats were exposed to DEE during sensitization with saline or OVA, and 2 weeks later were all challengedwith OVA for 3 consecutive days. Twenty-four hours later the nasal septum was collected, processed, and stained with AB/PAS for specific identification ofIM as described in the text. ND = not detectable; a = significantly different from respective group sensitized with saline; P � 0.05. Clear bars represent filteredair; striped bars represent 30 µg/m3 DEE; black bars represent 300 µg/m3 DEE. Note the use of different y-axis scales.
Table 14. Effects of DEE and OVA in DEE Studies 1 and 2 on Epithelial Cell Proliferation in Pulmonary Axial Airways
Group
Proximal Airways Distal Airways
LI(%)
ULLI(%/mm)
Numeric Cell Density
(total cells/mmbasal lamina)
LI(%)
ULLI(%/mm)
Numeric Cell Density
(total cells/mmbasal lamina)
SensitizationAir/Saline 3.89 ± 0.73 4.80 ± 1.12 121.04 ± 14.43 10.33 ± 1.81 15.32 ± 3.05 144.14 ± 11.0030 DEE/Saline 3.97 ± 0.57 4.92 ± 0.77 124.12 ± 7.44 6.68 ± 1.03 9.89 ± 2.36 151.32 ± 13.30 300 DEE/Saline 4.92 ± 0.72 5.86 ± 0.97 120.07 ± 12.61 7.36 ± 1.38 11.25 ± 2.41 152.44 ± 15.76
Air/OVA 8.62 ± 1.26a 8.91 ± 0.97a 120.84 ± 4.75 14.09 ± 1.29 25.64 ± 2.96a 183.88 ± 17.36
30 DEE/OVA 11.56 ± 1.88a 16.75 ± 3.65a 121.93 ± 8.16 15.66 ± 2.01 24.74 ± 3.66a 156.13 ± 10.01300 DEE/OVA 11.32 ± 1.18a 13.53 ± 1.72a 118.39 ± 7.00 11.49 ± 1.86 16.07 ± 2.40 144.54 ± 10.50
ChallengeAir/Saline 0.35 ± 0.14 0.61 ± 0.20 129.35 ± 15.41 0.00 ± 0.00 0.00 ± 0.00 147.93 ± 23.2930 DEE/Saline 0.60 ± 0.17 0.52 ± 0.13 97.13 ± 8.52 0.17 ± 0.17 0.28 ± 0.28 129.16 ± 20.16300 DEE/Saline 0.08 ± 0.08 0.08 ± 0.08 100.07 ± 15.77 0.17 ± 0.09 0.33 ± 0.17 123.60 ± 19.02
Air/OVA 2.15 ± 0.42a 2.02 ± 0.46a 96.57 ± 10.23 4.05 ± 0.16a 5.29 ± 1.55a 117.63 ± 9.55
30 DEE/OVA 1.46 ± 0.43a 1.53 ± 0.51a 105.10 ± 17.67 7.95 ± 1.59a 9.78 ± 1.84a 129.65 ± 14.85300 DEE/OVA 1.49 ± 0.35a 1.41 ± 0.38a 92.15 ± 7.971 5.16 ± 0.74a 9.15 ± 2.08a 172.27 ± 23.96
a Significantly different from respective group challenged with saline alone; P � 0.05.

J. Harkema et al.
Table 15. Study 1: DEE Exposure During OVA Sensitization — Effects of DEE and OVA on Pulmonary Gene Expression*
Group Muc5AC IL-5 IL-10 IL-12p35 IL-12p40 IL-13 IFN TNF�
Air/Saline 1.000 ± 0.245 1.000 ± 0.148 1.000 ± 0.179 1.000 ± 0.151 1.000 ± 0.362 1.000 ± 0.161 1.000 ± 0.175 1.000 ± 0.16330 DEE/Saline 0.676 ± 0.159 1.148 ± 0.391 1.019 ± 0.130 0.817 ± 0.185 0.940 ± 0.260 0.826 ± 0.211 0.673 ± 0.198 0.628 ± 0.124300 DEE/Saline 0.374 ± 0.093 1.569 ± 0.571 1.602 ± 0.199 1.406 ± 0.224 1.049 ± 0.132 1.330 ± 0.433 1.624 ± 0.324 1.286 ± 0.181
Air/OVA 0.881 ± 0.174 1.670 ± 0.482 6.137 ± 1.306a 0.363 ± 0.091a 0.761 ± 0.275 3.598 ± 0.851a 1.797 ± 0.615 0.905 ± 0.33830 DEE/OVA 0.903 ± 0.203 1.922 ± 0.475 5.656 ± 1.076a 0.599 ± 0.081 0.975 ± 0.165 3.345 ± 0.701a 2.118 ± 0.557a 0.869 ± 0.160300 DEE/OVA 0.858 ± 0.229 1.668 ± 0.589 10.600 ± 2.337a,b,c 0.946 ± 0.295b 0.946 ± 0.266 3.389 ± 1.119a 2.813 ± 0.585 1.149 ± 0.480
* Reported as fold increase relative to Air/Saline controls.a Significantly different from respective group sensitized with saline (i.e., the control, which was not sensitized with OVA); P � 0.05.b Significantly different from respective group exposed to filtered air; P � 0.05.c Significantly different from respective group exposed to 30 DEE; P � 0.05.
expression in lungs from rats challenged with OVA twoweeks later (Table 15). However, trends toward decreasedMuc5AC and an increase in some of the cytokines (e.g.,IL-5, IL-10) were noted. OVA sensitization and challengeinduced significant increases in IL-13 (3.6-fold) and IL-10(6-fold) expression, and significantly depressed expressionof IL-12p35. Enhancement of IL-10 and IL-12p35 in thelungs of rats exposed to 300 µg/m3 DEE and of IFN in thelungs of rats exposed to 30 µg/m3 DEE were the only expo-sure-related alterations of OVA-induced gene responsesdetected in the lungs.
STUDY 2: EXPOSURE TO DEE DURING ALLERGEN CHALLENGE
Nasal and Pulmonary Histopathology
In study 2, Air/Saline, 30 µg/m3 DEE/Saline, and300 µg/m3 DEE/Saline rats had no exposure-related histo-pathology in nasal or pulmonary tissue sections. As instudy 1, OVA-sensitized-and-challenged rats had a mild-to-moderate allergic rhinitis, bronchiolitis, and alveolitis.Exposure to 300 µg/m3 DEE at the time of OVA challengehad no effect on any of the OVA-induced nasal or pulmo-nary lesions. By contrast, rats exposed to 30 µg/m3 DEE atthe time of allergen challenge, as compared to the Air/OVArats, had a mild attenuation of the severity and distribu-tion of the OVA-induced allergic bronchopneumonia. Thiswas reflected in the reduced cellularity and protein concen-trations in the BALF of the 30 µg/m3 DEE/OVA rats com-pared to those in the BALF of Air/OVA control rats (seeresults below).
Changes in BALF
In saline-challenged rats, inhalation exposure to DEEhad no effect on the number or type of cells in the BALF
(Figure 24). OVA sensitization and challenge caused sig-nificant increases in total cells (7-fold), eosinophils (8-fold), macrophage/monocytes (2-fold), and neutrophils(90-fold) as compared to air exposure and saline challenge(Air/Saline controls). In rats exposed to 30 µg/m3 DEE dur-ing OVA challenge, the OVA-induced increase in totalBALF cells was attenuated (60% decrease) and the OVA-induced increase in macrophages showed a similar trendof attenuation (54% reduction). Though not statisticallysignificant, there was some suggestion of a 30 µg/m3 DEE–induced decrease in the elevation of neutrophils (44%reduction) and eosinophils (60% reduction) caused byOVA challenge. Increases in eosinophils in BALF fromOVA-challenged rats exposed to 300 µg/m3 DEE were notsignificant relative to those of the Air/OVA group, andBALF neutrophils were depressed in this group.
OVA challenge of sensitized rats caused significantincreases in total protein (5-fold), mucin glycoprotein(80%), elastase (40%), and �-glucuronidase (70%) inBALF (Figure 25). Exposure to 30 µg/m3 DEE attenuatedthe OVA-induced increase in total protein by 82% and in�-glucuronidase by 40%. A trend toward depressed con-centrations of mucin glycoprotein and elastase in BALFwas also evident after exposure to 30 or 300 µg/m3 DEE.
IL-6 was significantly increased in BALF from Air/OVArats. Exposure of rats to either 30 or 300 µg/m3 DEE mark-edly attenuated this increase in IL-6 (Table 16). No otherchanges in inflammatory cytokines were detected in theBALF of any exposure group.
Exposure to DEE had no effect on OVA-specific IgE inthe BALF from saline-challenged rats. Sensitization andchallenge with OVA induced significant accumulation ofOVA-specific IgE in BALF, but that amount was unaffectedby a DEE exposure of either 30 or 300 µg/m3 (Figure 26).
39

40
Effects of CAPs and DEE on Allergic Airway Disease in Rats
Figure 24. Cellularity of BALF. In DEE study 2, OVA-sensitized rats were exposed to DEE during challenge with saline or OVA for 3 consecutive days. BALFwas collected 24 hours after the last challenge, and the total cells, eosinophils, macrophages, and neutrophils were determined as described in the text. a =significantly different from respective group challenged with saline; b = significantly different from respective group exposed to filtered air; P � 0.05. Clearbars represent filtered air; striped bars represent 30 µg/m3 DEE; black bars represent 300 µg/m3 DEE. Note the use of different y-axis scales.
Figure 25. Mucin glycoprotein (Muc5AC), total protein, elastase, and �-glucuronidase content in BALF. In DEE study 2, OVA-sensitized rats were exposedto DEE during challenge with saline or OVA for 3 consecutive days. BALF was collected 24 hours later and analyzed as described in the text. a = significantlydifferent from respective group challenged with saline; b = significantly different from respective group exposed to filtered air; P � 0.05. Clear bars representfiltered air; striped bars represent 30 µg/m3 DEE; black bars represent 300 µg/m3 DEE. Note the use of different y-axis scales.

J. Harkema et al.
Table 16. DEE Exposure During OVA Challenge — Effects of DEE and OVA on BALF Cytokines (ng/mL)*
Group TNF� IL-4 IFN IL-6 IL-10
Air/Saline ND ND ND ND ND30 DEE/Saline ND ND ND ND ND300 DEE/Saline ND ND ND ND ND
Air/OVA ND ND ND 361.28 ± 113.69a ND30 DEE/OVA ND ND ND 9.24 ± 9.24a,b ND300 DEE/OVA ND ND ND 100.75 ± 33.81a ND
* ND indicates not detected.a Significantly different from respective group challenged with saline
(i.e., the control, which was not challenged with OVA); P � 0.05.b Significantly different from Air/OVA group; P � 0.05.
Figure 26. OVA-specific IgE in BALF. In DEE study 2, OVA-sensitized ratswere exposed to DEE during challenge with saline or OVA for 3 consecutivedays. BALF was collected 24 hours later and analyzed for IgE as describedin the text. a = significantly different from respective group challenged withsaline; P � 0.05.
IM in Pulmonary Axial Airways
Exposure to DEE (30 or 300 µg/m3) had no effect on theamounts of IM in the axial conducting airways of saline-challenged animals (Figure 27). OVA sensitization andchallenge caused an increase in IM in the proximal (2-fold)and distal (11-fold) axial airways. While exposure to DEEhad no effect on IM increases in proximal airways duringOVA challenge, exposures of both 30 and 300 µg/m3 DEEduring OVA challenge decreased OVA-induced increasesin IM by 54% in the distal airways.
DEE exposures during saline challenge had no effect onIM in the nasal septum (Figure 28). In the proximal septum,OVA challenge increased IM, and exposure to DEE at 30 or300 µg/m3 had no effect on OVA-induced increases in IM.In the distal nasal septum, OVA caused minor increases inIM that were not significantly enhanced by DEE.
Figure 27. IM in pulmonary proximal and distal conducting airways. In DEsaline or OVA for 3 consecutive days. Twenty-four hours later lungs were colldescribed in the text. a = significantly different from respective group challengedair; P � 0.05. Clear bars represent filtered air; striped bars represent 30 µg/m3 D
Changes in Airway Epithelial Cell Density and Labeling Indices
Morphometric changes in the epithelium of the pulmo-nary airways reflecting induced alterations in cell prolifer-ation (numeric cell densities and BrdU labeling indices) inrats exposed to DEE during OVA challenge are shown inthe bottom half of Table 14. Similar to study 1, neitherOVA challenge nor DEE exposure caused significantchanges in the numbers of total epithelial cells (numericcell density) lining the proximal or distal axial airways (G5and G11, respectively). In addition, neither exposure tohigh nor low concentrations of DEE during OVA or salinechallenge altered the BrdU LI or ULLI of epithelial cellslining the proximal or distal axial airways of rats. Air/OVArats did have significant increases in both LI and ULLI ofthe proximal and distal airway epithelium, as compared tothe control (Air/Saline) rats.
41
E study 2, OVA-sensitized rats were exposed to DEE during challenge withected, processed, and stained with AB/PAS for specific identification of IM as with saline; b = significantly different from respective group exposed to filteredEE; black bars represent 300 µg/m3 DEE. Note the use of different y-axis scales.

Effects of CAPs and DEE on Allergic Airway Disease in Rats
Figure 28. IM in the nasal septum. In DEE study 2, OVA sensitized rats were exposed to DEE during challenge with saline or OVA for 3 consecutive days.Twenty-four hours later the nasal septum was collected, processed, and stained with AB/PAS for specific identification of IM as described in the text. ND =not detectable; a = significantly different from respective group challenged with saline; P � 0.05. Clear bars represent filtered air; striped bars represent30 µg/m3 DEE; black bars represent 300 µg/m3 DEE. Note the use of different y-axis scales.
Table 17. Study 2: DEE Exposure During OVA Challenge — Effects of DEE and OVA on Pulmonary Gene Expression*
Group Muc5AC IL-5 IL-10 IL-12p35 IL-12p40 IL-13 IFN TNF�
Air/Saline 1.000 ± 0.239 1.000 ± 0.356 1.000 ± 0.329 1.000 ± 0.264 1.000 ± 0.302 1.000 ± 0.412 1.000 ± 0.328 1.000 ± 0.34930 DEE Saline 1.329 ± 0.415 0.937 ± 0.267 0.897 ± 0.260 0.848 ± 0.113 1.379 ± 0.677 0.626 ± 0.158 0.991 ± 0.217 0.918 ± 0.189300 DEE/Saline 1.359 ± 0.302 0.482 ± 0.125 0.443 ± 0.113 0.399 ± 0.054b,c 0.689 ± 0.207 0.549 ± 0.175 0.739 ± 0.167 0.746 ± 0.093
Air/OVA 2.179 ± 0.498 1.009 ± 0.253 2.866 ± 0.877 0.684 ± 0.155 1.684 ± 0.532 1.186 ± 0.212 2.630 ± 0.605a 1.231 ± 0.33530 DEE/OVA 2.232 ± 0.596 1.761 ± 0.482 3.628 ± 1.030a 0.659 ± 0.137 2.290 ± 1.386 1.656 ± 0.659 2.216 ± 0.469a 1.418 ± 0.485300 DEE/OVA 1.801 ± 0.201 0.694 ± 0.116 2.751 ± 0.662a 0.417 ± 0.073 0.360 ± 0.094 0.820 ± 0.111 2.036 ± 0.447a 0.727 ± 0.131
*Reported as fold increase relative to Air/Saline control.a Significantly different from respective group challenged with saline (i.e., the control, which was not challenged with OVA); P � 0.05.b Significantly different from respective group exposed to filtered air; P � 0.05.c Significantly different from respective group exposed to 30 DEE; P � 0.05.
Gene Expression of Airway Mucin and Inflammatory Cytokines
Exposures to DEE during challenge with saline showedtrends for depressed gene expression of cytokines in rats,though only the IL-12p35 protein was significantly decreasedby the DEE exposure of 300 µg/m3 (Table 17). There was asignificant increase in the expression of IFN in the Air/OVA rats compared to the Air/Saline rats, and though not sig-nificant, there was also increased expression of Muc5ACand IL-10. Increases in IL-10 were only observed when ratswere exposed to DEE and challenged with OVA.
DISCUSSION
CAPS INHALATION STUDIES IN SW DETROIT
The principal pathologic features of asthma and otherchronic airway diseases, such as chronic bronchitis, are
42
airway inflammation (e.g., airway infiltration of lympho-cytes and eosinophils in allergic asthma) and excessiveamounts of mucus in the airway lumens, which are associ-ated with increased numbers of mucus (goblet) cells in therespiratory epithelium lining the intrapulmonary conduct-ing airways (Reid 1954; Glynn and Michaels 1960; Esterlyand Oppenheimer 1968; Dunnill et al. 1969; Cutz et al.1978; Reynolds and Merrill 1981; Aikawa et al. 1992).
The results of our CAPs inhalation study in SW Detroitindicated that the high concentrations of CAPs, during thefirst exposure period in July, were likely the result of emis-sions from stationary combustion sources, and that the mag-nitude of airway inflammation was enhanced, as evidencedby the histopathology and changes in BALF (e.g., an in-crease in lavaged eosinophils and lymphocytes) in our lab-oratory rat model of allergic airway disease. CAPs alsoenhanced OVA-induced mucus production, as indicatedby (1) a morphometrically detected increase in IM in theintrapulmonary conducting airways (which is a quantitative

J. Harkema et al.
indicator of MCM and intracellularly stored mucus product)and by (2) an increased concentration of mucin-specificprotein in the BALF (which is an indicator of mucushypersecretion). In these rats, the CAPs-induced enhance-ment of the allergen (OVA)-induced allergic broncho-pneumonia, which results in excessive production of air-way mucus, appeared to be dose-dependent: CAPs-relatedeffects occurred after exposure to a high average mass con-centration of CAPs in week 1 (i.e., 596 µg/m3), but not afterexposure to the markedly lower average mass concentra-tion in week 2 (i.e., 356 µg/m3). These findings confirmedour specific hypothesis in aim 1; namely, that CAPs expo-sure during allergen challenge will exacerbate airway epi-thelial remodeling (e.g., MCM) and airway inflammationin BN rats previously sensitized to the allergen.
We have previously demonstrated that CAPs exposuresin this same SW Detroit community enhanced preexist-ing, allergen-induced, airway epithelial and inflammatorylesions in BN rats (Harkema et al. 2004). The experimentaldesign of this previous study compared to that of ourpresent study differed primarily in when OVA-sensitizedBN rats were exposed to CAPs in relation to the OVA chal-lenges. In our previous study, OVA-sensitized BN ratswere challenged with OVA 48 hours before the start of thedaily CAPs inhalation exposures for 4 or 5 consecutivedays. In that study, the allergic inflammatory and epithe-lial responses in rats were ongoing (they had preexistingairway disease) prior to the CAPs exposure. In contrast,OVA-sensitized rats in our present study were challengedwith OVA on the same days that they were exposed toCAPs. Here we were examining the effects of CAPs onallergen-induced airway disease, rather than its effect onongoing preexisting disease.
Our CAPs inhalation study was not designed to pre-cisely determine the specific toxicologic mechanism(s) bywhich CAPs enhance the allergic hypersensitivity reactionto OVA. However, the physiochemical components ofambient PM and CAPs that we identified, the concurrentmeteorological data, and the profile of trace elements inthe lungs of the CAPs/OVA rats indicated that the CAPsthat induced an exaggerated allergic response in week 1, inmid-July, were predominantly associated with emissionsfrom stationary combustion sources and less with motorvehicle emissions (e.g., diesel or gasoline engine exhaust).
Southeastern Michigan’s air quality is typically domi-nated by air pollution emitted by heavy industry and motorvehicles within the Detroit metropolitan area together withregionally transported secondary pollutants that includeO3 and PM2.5 (Keeler et al. 2002; Morishita et al. 2006). Inour present study, PM2.5 accounted for 60% of PM10 (dailymax 80%) in Detroit, and the temporal correlation between
PM2.5 and PM10 mass was r = 0.90, suggesting that much ofthe larger-particle effects may be driven by temporallycovarying smaller PM2.5 particles (Lippmann et al. 2000).Taken together, these results indicated that the inhalablefraction of PM (PM10) in SW Detroit was driven by muchsmaller particles (PM1), and stationary combustion sourceswere likely the major culprit for the frequent air pollutionevents in this area.
Ultrafine particle concentrations measured in urban areasprovide a good indication of the spatial and temporal scalefor the emissions that are transported (Young and Keeler2004, 2007). Observations of elevated number concentra-tions of these smallest of particles suggest that local com-bustion sources are important, as the lifetimes in the atmo-sphere of these are typically very short. The maximumultrafine number concentrations occurred on July 14 and15 during week 1 of our CAPs inhalation study. The num-ber concentration peaks on July 15 coincided with ele-vated SO2 concentrations, which previously have indicatedcontributions from local combustion sources (Young andKeeler 2004, 2007).
The predominant wind direction during July 22 and 23in week 2 was northerly. Days with northerly winds wereassociated with low pollutant concentrations since therewas only a limited number of large stationary sources tothe north of our site. The average ambient PM2.5 concen-tration was only 11 µg/m3 for the two days with flow fromthe north. The predominant wind direction on July 21 ofthat second week was southwesterly. However, severalrain events, which occurred just prior to this exposure,lowered particulate air pollutant levels through the depo-sition of wet particles and the scavenging of particles. Therelative humidity on that day averaged 81% with a mini-mum of 75%.
As described in the Study Designs, Methods, and Mate-rials section, the highest density of industrial activity inthe city is in SW Detroit and includes iron and steel man-ufacturing plants, coke ovens, chemical plants, refineries,sewage-sludge incinerators, and coal-fired utility plants inand around Zug Island and along the Detroit River (Keeleret al. 2002; Morishita et al. 2006). Meteorological measure-ments on July 14 revealed that the pollution event wasassociated with south-southeast winds. Winds from thesoutherly direction significantly increase the likelihood oflocally generated pollutant transport, which was also evi-dent by the elevated SO2 concentration measured at thesite (Table 3).
A previous study in Detroit reported that Rb and Zn(which were also elevated on July 14) were associated withemissions from sludge incinerators that were located closeto our sampling site (Morishita et al. 2006). The City of
43

Effects of CAPs and DEE on Allergic Airway Disease in Rats
Detroit Water and Sewerage Department operates one ofthe largest sewage-sludge incinerators in the United States.It is located between the site and Zug Island on JeffersonAvenue. The EPA AirData NET Facility Emissions report(EPA, 2000a) estimated that approximately seven tons ofPM2.5 were emitted from this facility in 1999. The observedelevated levels of Pb and Cd on July 14 were likely associ-ated with municipal incinerators. Elevated levels of Mo,Fe, and Mn on that day were most likely associated withemissions from iron and steel manufacturing.
Previous studies have shown that trace elements, in-cluding Zn, Pb, Mg, Al, Fe, Mn, and Ba, are commonlydetected in emissions from mobile sources, including die-sel engine emissions (Cadle et al. 1998; EPA 2000b). Weanticipated that total emissions would include a relativelylarge proportion of motor-vehicle-related particles sincethe SW Detroit community experiences heavy car andtruck traffic because of the presence of two major inter-states and the Ambassador Bridge, the largest internationalborder crossing that connects Detroit to Windsor, Canada.The Michigan Department of Transportation (2002) reportedthat the average daily volume of traffic on major interstatehighways around the Ambassador Bridge in 2002 was closeto 100,000 vehicles/day.
To further evaluate the impact of diesel sources, thelevels of PAHs in CAPs collected during the exposure peri-ods were compared to the values reported for the PAHcomposition of emissions from diesel and other emissionsources. The PAH data indicated strong impacts from thecombustion sources on July 14 and July 15, during the first3-day exposure period.
Studies have shown an increased emission of high-molecular-weight PAHs (PAHs with molecular weightsgreater than or equal to 202) from gasoline-powered anddiesel-powered light-duty vehicles (Cadle et al. 1998),and dimethylphenanthrene measured in motor vehicle ex-haust is typically enriched in the 1,3+2,10+3,9-dimethyl-phenanthrene isomers (McDonald et al. 2000). For ambientPAH concentrations, Adonis and colleagues (2003) inves-tigated 24-hour average concentrations of carcinogenicPAHs adsorbed onto PM10 collected in diesel revisionplants and in an urban area, and they reported that PAHsadsorbed onto PM10 in the diesel plants showed a highloading for low-molecular-weight PAHs, such as pyreneand chrysene, as well as for high-molecular-weight PAHs,such as benzo[a]anthracene and benzo[k]fluoranthene.
Reviews of the available literature summarized the ratiosof PAHs for the characterization of their sources in envi-ronmental samples (Yunker et al. 2002; Vasilakos et al.2007). For example, the ratio of indeno[1,2,3,-cd]pyrene toindeno[1,2,3,-cd]pyrene plus benzo[ghi]perylene is reported
44
to be 0.35 for diesel emissions. In contrast, values in theliterature above 0.5 are associated with wood, grass, andcoal combustion aerosols. For the CAPs samples collectedduring the first 3-day exposure period in SW Detroit, thepredominance of emissions from coal combustion andgasoline-powered motor vehicles, over those from diesel-powered vehicles, was indicated by the ratio of indeno[1,2,3,-cd]pyrene to indeno[1,2,3,-cd]pyrene plus benzo[ghi]perylene, which was > 0.7 (Table 6).
In contrast, during the second 3-day exposure period,most of the PAH concentrations were below detection lim-its, suggesting that fewer combustion sources had an im-pact on the site than during the first 3-day exposure period.In addition, the ratio of benzo[a]anthracene to benzo[a]anthracene plus chrysene was reported to be 0.49 for gaso-line emissions and 0.68 for diesel engines (Vasilakos et al.2007). The corresponding ratio during our Detroit expo-sure periods was less than 0.5, again suggesting that therelative impact of diesel-engine emissions was not strong.The fluoranthene to fluoranthene plus pyrene ratio is below0.5 for gasoline, diesel, and fuel-oil combustion and emis-sions from cars and diesel trucks, but this ratio is above 0.5in most coal- and wood-combustion samples (Yunker et al.2002). The ratio observed during both of the 3-day expo-sure periods was below 0.5. Together, these results suggestthat the higher levels of PAH concentrations observed dur-ing the exposures in this community were more likely tobe attributed to combustion sources (specifically coal com-bustion) than to diesel-emitting sources.
The combined findings related to trace elements, PAHs,gaseous pollutants, meteorological parameters, and ultra-fine particle numbers revealed that emissions from localcombustion sources, including incinerators and coal-combustion sources, were dominant contributors to thePM2.5 during the first 3-day exposure period in SW Detroit.Furthermore, an enhancement of the allergic reaction inthe lungs of the CAPs/OVA rats in week 1 was observedduring this period.
It is interesting that in both this study and our previ-ously reported study of CAPs (Harkema et al. 2004) in thisSW Detroit community, we determined that CAPs enhance-ment of OVA-induced allergic airway disease only oc-curred when the sources of PM2.5 were predominantly coal-combustion utilities, local sewage-treatment facilities, andrefineries, rather than diesel- or gasoline-powered motorvehicles. In both studies, when elevated concentrations ofspecific trace elements (as well as other source indica-tors) associated with these local combustion sources wereobserved in the ambient air pollution, in the CAPs inhala-tion chambers, and in lung tissues, there was a measuredenhancement of allergic airway disease in the CAPs/OVA

J. Harkema et al.
rats. These exposure “dose”/response relationships sug-gested that the enhancement of allergic airway disease wasprincipally due to the rats’ exposures to CAPs derivedfrom anthropogenic combustion sources. Future in vivoand in vitro studies are needed to determine which spe-cific component(s) in the PM from these local combustionsources may be responsible for the enhanced allergic air-way disease.
Though there have been several studies in recent yearsinvestigating the effects of combustion-derived particles col-lected from industrial and motor-vehicle emission sources(e.g., ROFA and DEE particles, respectively) on allergic air-way disease in laboratory animals, there are only a fewreports in the scientific literature of animal inhalationstudies that have investigated the effects of airborne CAPsderived from real-world air pollution on the developmentor exacerbation of allergic airway disease. The presentinvestigation is the first study to demonstrate that expo-sure to airborne CAPs derived from fossil fuel and otherlocal combustion sources can enhance the development ofallergic airway disease in the lungs of rodents (BN rats).
Other studies have shown that ROFA particles enhancethe allergic sensitization of BN rats to house-dust-miteantigen (Lambert et al. 1999, 2000). Goldsmith and associ-ates (1999) tested the hypothesis that, in mice, exposure toCAPs or the leachate of ROFA particles can cause an am-plification of pulmonary inflammation and airway hyper-responsiveness induced by OVA. They found that OVA-challenged mice, when further exposed to CAPs, did notexhibit any additional airway hyperresponsiveness or pul-monary inflammation. However, for OVA-challenged mice,subsequent exposure to the ROFA leachate did result inenhanced airway hyperresponsiveness as compared to thecontrols. Kobzik and colleagues (Kobzik et al 2001; Gold-smith et al. 2002) investigated the effects of the coexposureof O3 and CAPs on mice with and without OVA-inducedallergic airway disease. In these studies, they found thesepollutants had no effect on airway inflammation, but theydid observe an immediate transient increase in airwayhyperresponsiveness in mice with allergic airway diseaseexposed to both O3 and CAPs that was associated with theAl–Si fraction of the particles.
More recently, Kleinman and coworkers (2005), in astudy showing averages over a two-year period, demon-strated that OVA-sensitized BALB/c mice exposed to ultra-fine or fine CAPs along a roadway in southern Californiahad increases in biomarkers that are associated with air-way allergic responses (IL-5, IgE, immunoglobulin G1, andeosinophils). In addition, mice exposed to CAPs 50 mdownwind of the roadway had, on average, greater allergicresponses and showed greater indications of inflammation
than did mice exposed to CAPs 150 m downwind. The in-vestigators concluded that their study was consistent withthe hypothesis that exposure to CAPs close to a heavilytrafficked roadway influenced allergic airway responses.
Unlike murine models of OVA-induced allergic airwaydisease in which inflammatory cell infiltrates are confinedto perivascular and peribronchiolar locations and do notaffect alveolar gas-exchange regions of the lung, the OVA-induced allergic airway disease in our BN rats extendedthe mainly airway-centered disease into adjacent alveolarparenchyma, which caused an allergen-induced broncho-pneumonia. Interestingly, CAPs exposure during OVA chal-lenge in the current study enhanced the allergic inflam-matory response in both the bronchiolar and alveolarcompartments of this hypersensitivity lung disease in rats.
CAPs exposure did not enhance the observed OVA-induced inflammatory or epithelial responses (e.g., allergicrhinitis with MCM along the nasal septum) in the nasal air-ways of rats. Since it is estimated that few inhaled parti-cles in the range of 0.1 to 2.5 microns in diameter are likelyto deposit in the nasal region of the respiratory tract (ICRP1994), it is not surprising that CAPs exposure did not havean effect on the severity of the OVA-induced rhinitis. Wehave previously shown, however, that exposure to O3, acommon gaseous air pollutant that causes both nasal andpulmonary toxicity, did enhance OVA-induced rhinitis inBN rats (Wagner et al. 2002).
There is strong evidence that mucus impaction of thepulmonary airways contributes in an important way tomorbidity and mortality from asthma (Aikawa et al. 1992).Excessive production of sputum is a common symptom inasthma and chronic bronchitis, and mucus plugging of theairways is consistently reported in fatal asthma cases, whenthe airways are examined post-mortem. The results of ourCAPs inhalation study in SW Detroit indicated that expo-sure to high concentrations of CAPs during OVA challengecaused significant OVA-induced increases in the amountof stored mucosubstances in the epithelium of the intra-pulmonary airways and an increase in the concentration ofmucin-specific protein in the BALF of CAPs/OVA rats.
Several animal studies from our laboratory and othershave indicated that common ambient air pollutants (e.g.,O3, SO2, and sulfur oxide particles) can significantly alterthe mucus apparatus of the conducting airways by increas-ing the number of mucus cells in the luminal surface epi-thelium and thereby increasing secreted mucus in the air-way lumen (Reid 1963; Harkema et al. 1987a,b; Gearhartand Schlesinger 1989; Harkema et al. 1989; Schlesinger etal. 1992; Harkema et al. 1997b). Harkema and colleagues(1987a,b) reported MCM in the nasal airways of bonnetmonkeys after acute and chronic exposures (8 hours/day
45

Effects of CAPs and DEE on Allergic Airway Disease in Rats
for 6 or 90 days) to ambient concentrations of O3 (0.15 or0.30 ppm). We have also reported that O3-induced MCM inthe nasal epithelium can be induced in the F344 rat afteracute (6 hours/day for 3 or 7 days) or chronic (6 hours/day,5 days/week, for 20 months) exposures to 0.5–1.0 ppm O3(Harkema et al. 1989, 1994; Hotchkiss et al. 1991; Harkemaand Hotchkiss 1994).
Gearhart and Schlesinger (1989) reported that rabbitsrepeatedly exposed to acidic aerosols (250 µg/m3 sulfuricacid [H2SO4], 1 hour/day, 5 days/week for up to 52 weeks)have marked increases in mucus secretory cells, especiallyin small pulmonary airways, the likely consequence ofwhich would be an increase in production and hypersecre-tion of airway mucus. It has also been reported that ratsexposed to ROFA had conspicuous increases in mucus(goblet) cells in pulmonary airways along with airwayinflammation and epithelial hyperplasia (Dreher et al.1997). Miyabara and associates (1998a,b,c) have also dem-onstrated that diesel exhaust enhances antigen-inducedeosinophilic inflammation and mucus cell proliferation inthe murine airway. Dreher and coworkers (1997) have pre-viously reported that ROFA-induced pulmonary inflam-mation, airway epithelial alterations, and cytokine andchemokine expression are positively correlated with thepresence of several soluble (leachable) metals associatedwith these particles.
We did not determine if CAPs contained measurablelevels of biogenic substances such as endotoxin that mightmodulate allergic responses. Endotoxin has been shown toinhibit allergic responses if administered during sensitiza-tion procedures (Tulic et al. 2000; Delayre-Orthez et al.2004). Conversely, endotoxin given during allergen chal-lenge can either enhance or inhibit responses, dependingon the endpoint or dosing regimen. While most studies in-volve delivery of endotoxin by IN or intraperitoneal routes,Hollingsworth and coworkers conducted aerosol coexpo-sures with OVA and endotoxin, an approach more compa-rable to our CAPs inhalation exposures (Hollingsworth etal. 2006). They found that OVA-induced airway eosino-phils were increased 3-fold when aerosol challenge alsocontained 0.18 µg/m3 endotoxin. While this mass concen-tration would be well within the organic and carbonaceousfractions of our CAPs samples, the Detroit airshed is nottypically rich in biogenic substances such as endotoxin.
In summary, our observations were that Detroit CAPsexposure during OVA challenge enhanced many of thepathologic features of allergic airway disease (e.g., MCM,mucus hypersecretion, and the mixed-cell inflammatoryinflux of eosinophils and lymphocytes) in the lungs ofOVA-sensitized rats. These findings suggest that fine urbanparticulate matter may contribute to the development of
46
human allergic asthma. Future studies are needed to fur-ther identify the specific toxic components in SW DetroitPM2.5, and the underlying biologic mechanisms respon-sible for this particle-induced enhancement of allergicresponses in the lung.
DEE STUDIES
Laboratory-animal models of allergic airway disease, asthat for BN rats, require a sensitization period to the allergenprior to intra-airway challenge, for the animal to developan allergic airway immune response and manifest the fullpathological features of this disease. The aim of our DEEstudies using our BN rat model of allergic airway diseasewas to test our hypothesis that DEE, when delivered to therats during their allergen (OVA) sensitization or challengeperiods, would enhance the allergic inflammatory and epi-thelial responses in the respiratory tract of rats after aller-gen challenge. Unlike our study using this rat model andCAPs inhalation exposure, in which we found a clearenhancement of inflammatory and epithelial responses toOVA when CAPs exposure was during OVA challenge, theeffects of DEE during OVA challenge did not significantlyalter OVA-induced allergic changes in the lungs or nose ofBN rats at the high DEP concentration of 300 µg/m3. At thelow DEP concentration of 30 µg/m3, exposure actuallyattenuated some of the OVA-induced pulmonary inflamma-tory responses (e.g., total inflammatory cells in BALF) andepithelial responses (e.g., amount of IM and MCM in distalaxial airways). When BN rats were exposed to the high-concentration DEE during the sensitization period and thenchallenged with OVA, there were likewise no significantchanges in the measured OVA-induced allergic responsesin the nose or lungs. Though most measured parameters inDEE/OVA rats exposed to the low concentration of DEPsduring sensitization did not indicate an enhanced OVA-induced response, there was a modest increase in totalinflammatory cells in the BALF compared to that in Air/OVA rats. Overall, the results of our DEE inhalation studiesdid not confirm our hypothesis in aim 2, that DEE, givenduring OVA sensitization or challenge, would enhance theOVA-induced allergic airway disease in BN rats.
Previous animal studies have been designed to investi-gate the effects of DEPs on allergic airway disease and notthe effects of DEE, which contains both gaseous and partic-ulate components, as in our present study. This differencein exposures may explain, in part, some of the differencesin our results compared to those of other laboratories.However, there are also major interlaboratory differencesin the methods and experimental designs used in thesestudies, such as the type of rodent used (e.g., differences inspecies or strain), the type, amount, and delivery of the

J. Harkema et al.
allergen, and the time when DEE or DEP exposures weregiven with respect to allergen sensitization or challenge.Therefore, it is extremely difficult to compare the results ofsimilar studies among laboratories that do not use exactlythe same animal models and exposure conditions.
Several rodent studies have shown that DEPs enhanceallergen-induced airway disease (Ichinose et al. 1997,2002; Takano et al. 1997, 1998; Miyabara et al. 1998a,b,c;Dong et al. 2005a,b). Exposure to DEPs was also shown toenhance OVA-induced airway hyperresponsiveness inmice when these animals were challenged with OVA at thesame time as the DEP exposure (Miyabara et al. 1998c;Takano et al. 1998). Inoue and colleagues (2007) havereported that exposure of mice to naphthoquinone, one ofthe extractable chemical compounds of DEPs, aggravatedOVA-induced airway inflammation in a dose-dependentmanner. However, other studies have shown that organiccomponents of inhaled DEPs and other pollutants inhibitallergen-induced airway inflammatory responses (Dong etal. 2005a; Melgert et al. 2004).
Most of the studies on the effect of DEPs on allergic air-way disease in rodents have been done with mice (Ichi-nose et al. 1997, 2002; Takano et al. 1997, 1998; Miyabaraet al. 1998a,b,c). Dong and colleagues (2005a,b) reportedon two studies they performed that used BN rats to exam-ine the effects of DEPs on OVA-induced allergic airwaydisease. Their model of allergic airway disease involved amuch longer OVA-sensitization period than was used inour present study, and they used high concentrations ofnebulized DEPs (22.7 ± 2.5 mg/m3). In their first reportedstudy, these investigators found that DEP exposure prior tothe sensitization period enhanced IgE and immunoglobulinG (IgG) antibody production, but inhibited airway inflam-mation induced by OVA challenge (Dong et al. 2005a). Incontrast, when DEPs were given 1 day prior to the last dayof OVA challenge, the investigators found that the DEPsenhanced both antibody production and pulmonary in-flammatory infiltration characterized by marked increasesin T lymphocytes and infiltration of eosinophils. They alsofound in this study that these in vivo findings correlatedwith the interactive effects of DEPs with OVA: markedlyincreased production of reactive oxygen species (ROS),increased production of nitric oxide (NO) by AM and alve-olar type II cells (ATII cells), enhanced NO levels in BALF,the induction of inducible NO synthase expression in AMand ATII cells, and the depletion of intracellular glu-tathione (GSH) in AM and lymphocytes. They concludedthat DEP-induced enhancement of allergic airway diseasemay be due in part to the elevated generation of ROS inAM and ATII cells, a depletion of GSH in AM and lympho-cytes, and an increase in AM and ATII cell production ofNO. These effects together reflect an enhanced oxidative
stress response in the lungs. This is in agreement withsimilar findings of many other investigators who havesuggested that the enhancement of allergic airway re-sponses caused by DEPs, urban airborne particles, andother combustion-derived airborne particles (e.g., carbonblack) are likely to be a result, at least partially, of an addi-tive or a synergistic increase in the generation of ROS andan attenuation of protective antioxidants such as GSH(Pandya et al. 2002; Li et al. 2004; Donaldson et al. 2005;Nel 2005; Xia et al. 2006).
It is not clear why DEE in our study did not significantlymodify the OVA-induced allergic airway disease in the BNrats as it did in the previously reported DEP study by Dongand coworkers (2005a,b). As mentioned previously, therewere marked differences in the exposure regimens for bothOVA and DEPs. However, the most probable reason for theobserved differences in pulmonary responses between thetwo studies was the amount of DEPs to which the BN ratswere exposed. Dong and colleagues exposed rats to a dailyconcentration of airborne particles that was 76 timeshigher than the highest concentration used in our studies.Even at markedly higher particulate concentrations, Dongand colleagues reported only moderate neutrophilicinflammation and no observable cytotoxicity in the lungsof rats exposed to DEPs alone (without OVA). Our ratswere exposed to much lower daily particulate concentra-tions and had no measurable toxicant-related lung injury.In light of the marked differences in exposure concentra-tions between our studies and those of Dong and col-leagues, it is not surprising that the low, but more environ-mentally relevant, concentrations of DEE used in our studydid not exacerbate OVA-induced allergic airway disease.In addition, the chemical makeup of the DEPs used in ourstudies may have been considerably different and lesstoxic than that used by Dong and colleagues. Our presentfindings and those previously reported by others suggestthat the dose, time of exposure, and chemical compositionof inhaled DEPs are all important factors determiningwhether or not this component of particulate air pollutionwill enhance the development or severity of allergic air-way disease.
Since DEE also contains some NOx and other gases (e.g.,CO), it is possible that these gaseous components may con-tribute to the effects (or lack of effects) of DEE on the rat’sallergic responses to OVA. It has been reported by Hubbardand coworkers (2002) that exposure of OVA-sensitized miceto NO2 (0.7 ppm) markedly attenuated the allergic pulmo-nary inflammation in mice that were exposed 2 hours priorto each daily challenge with OVA. This response was sim-ilar to what we observed in our OVA-sensitized BN ratsthat were exposed to DEE during OVA challenge. However,it is possible that DEE (and DEPs) may exert varied and
47

Effects of CAPs and DEE on Allergic Airway Disease in Rats
complex effects on experimental allergic asthma depend-ing on the animal models, the timing of DEE exposure, andthe allergen sensitization and challenge process.
CONCLUSION
The results of our animal inhalation studies in a SWDetroit community with high ambient PM2.5 concentra-tions demonstrated that exposures to CAPs, derived fromcombustion (point) sources, during allergen challenge,markedly enhanced allergic airway disease in BN rats. Thisfinding suggests that urban airborne PM2.5 derived fromcombustion sources (e.g., refineries, coal-burning powerplants, and waste-treatment plants) may enhance the de-velopment of human allergic airway diseases like child-hood asthma. Previous animal inhalation studies in thiscommunity have also suggested that these fine, ambientcombustion-derived particles may also exacerbate preexist-ing allergic airway diseases.
In contrast to our CAPs studies in Detroit, the controlledDEE exposures of allergen-sensitized BN rats, during eitherallergen sensitization or challenge periods, caused only afew mild modifications in the character of the allergen-induced disease. This finding is in contrast to other re-ported studies that indicate that DEPs alone (withoutgaseous components), but at relatively higher exposuredoses, do enhance allergic airway disease in some rodentmodels. The reasons for these disparities between studiesare not known, but likely reflect differences in exposuredose, animal models, timing of allergen and DEP expo-sures, the methods of allergen sensitization and challenge,or physicochemical differences between DEE and DEPs.
REFERENCES
Abbey DE, Petersen F, Mills PK, Beeson WL. 1993. Long-term ambient concentrations of total suspended particu-lates, ozone, and sulfur dioxide and respiratory symptomsin a nonsmoking population. Arch Environ Health 48:33–46.
Adonis M, Martínez V, Riquelme R, Ancic P, González G,Tapia R, Castro M, Lucas D, Berthou F, Gil L. 2003. Suscep-tibility and exposure biomarkers in people exposed toPAHs from diesel exhaust. Toxicol Letts 144:3–15.
Aikawa T, Shimura S, Sasaki H, Ebina M, Takishima T.1992. Marked goblet cell hyperplasia with mucus accumu-lation in the airways of patients who died of severe acuteasthma attack. Chest 101:916–921.
48
American Lung Association, Epidemiology and StatisticsUnit. 1992. Trends in asthma morbidity and mortality.
Bates DV. 1995. Observations on asthma. Environ HealthPerspect 103 Suppl 6:243–247.
Beggs PJ, Curson PH. 1995. An integrated environmentalasthma model. Arch Environ Health 50:87–94.
Braselton WE, Stuart KJ, Mullaney TP, Herdt TH. 1997.Biopsy mineral analysis by inductively coupled plasma-atomic emission spectroscopy with ultrasonic nebuliza-tion. J Vet Diagn Invest 9:395–400.
Broide DH, Lotz M, Cuomo AJ, Coburn DA, Federman EC,Wasserman SI. 1992. Cytokines in symptomatic asthmaairways. J Allergy Clin Immunol 89:958–967.
Cadle SH, Mulawa P, Hunsanger EC, Nelson K, RagazziRA, Barrett R, Gallagher GL, Lawson DR, Knapp KT,Snow R. 1998. Measurements of exhaust particulate matteremissions from in-use light-duty motor vehicles in the Den-ver, Colorado, area. Report NTIS/PB98-B6401. Coordinat-ing Research Council, Atlanta GA.
Cody RP, Weisel CP, Birnbaum G, Lioy PJ. 1992. The effectof ozone associated with summertime photochemicalsmog on the frequency of asthma visits to hospital emer-gency departments. Environ Res 58:184–194.
Cutz E, Levison H, Cooper DM. 1978. Ultrastructure of air-ways in children with asthma. Histopathology 2:407–421.
Diaz-Sanchez D, Tsien A, Fleming J, Saxon A. 1997. Com-bined diesel exhaust particulate and ragweed allergen chal-lenge markedly enhances human in vivo nasal ragweed-specific IgE and skews cytokine production to a T helpercell 2-type pattern. J Immunol 158:2406–2413.
Diaz-Sanchez D, Garcia MP, Wang M, Jyrala M, Saxon A.1999. Nasal challenge with diesel exhaust particles caninduce sensitization to a neoallergen in the human mucosa.J Allergy Clin Immunol 104:1183–1188.
Delayre-Orthez C, de Blay F, Frossard N, Pons F. 2004.Dose-dependent effects of endotoxins on allergen sensiti-zation and challenge in the mouse. Clin Exp Allergy34:1789–1795.
Dockery DW, Pope CA III. 1994. Acute respiratory effectsof particulate air pollution. Annu Rev Public Health 15:107–132.
Donaldson K, Tran L, Jiminez LA, Duffin R, Newby DE,Mills N, MacNee W, Stone V. 2005. Combustion-derivednanoparticles: A review of their toxicology following inha-lation exposure. Part Fibre Toxicol 2:10.

J. Harkema et al.
Dong CC, Yin XJ, MA JYC, Millecchia L, Barger MW,Roberts JR, Zhang XD, Antonini JM, Ma JKH. 2005a. Expo-sure of Brown Norway rats to diesel exhaust particles priorto ovalbumin (OVA) sensitization elicits IgE adjuvantactivity but attenuates OVA-induced airway inflammation.Toxicol Sci 88:150–160.
Dong CC, Yin XJ, Ma JYC, Millecchia L, Wu ZX, BargerMW, Robers JR, Antonini JM, Dey RD, Ma JKH. 2005b.Effect of diesel exhaust particles on allergic reactions andairway responsiveness in ovalbumin-sensitized Brown Nor-way rats. Toxicol Sci 88:202–212.
Dreher KL, Jaskot RH, Lehmann JR, Richards JH, McGeeJK, Ghio AJ, Costa DL. 1997. Soluble transition metalsmediate residual oil fly ash induced acute lung injury.J Toxicol Environ Health 50:285–305.
Dunnill MD, Massarella GR, Arderson JA. 1969. A compar-ison of the quantitative anatomy of the bronchi in normalsubjects, in status asthmaticus, in chronic bronchitis, andin emphysema. Thorax 24:176–179.
Esterly JR, Oppenheimer EH. 1968. Cystic fibrosis of thepancreas: Structural changes in peripheral airways. Thorax23:670–675.
Fujimaki H, Saneyoshi K, Sharaishi F, Imai T, Endo T. 1997.Inhalation of diesel exhaust enhances antigen-specific IgEantibody production in mice. Toxicology 116:227–233.
Gearhart JM, Schlesinger RB. 1989. Sulfuric acid-inducedchanges in the physiology and structure of the tracheo-bronchial airways. Environ Health Perspect 79:127–136.
Gergen PJ, Mullally DI, Evans R. 1988. National survey ofprevalence of asthma among children in the United States:1976 to 1980. Pediatrics 81:1–7.
Goldsmith CA, Hamada K, Ning Y, Qin G, Catalano P,Krishna Murthy GG, Lawrence J, Kobzik L. 1999. Effects ofenvironmental aerosols on airway hyperresponsiveness ina murine model of asthma. Inhal Toxicol 11:981–998.
Goldsmith CA, Ning Y, Quin G, Imrich A, Lawrence J,Murthy GG, Catalano PJ, Kobzik L. 2002. Combined airpollution particle and ozone exposure increases airwayresponsiveness in mice. Inhal Toxicol 14:325–347.
Glynn AA, Michaels L. 1960. Bronchial biopsy in chronicbronchitis and asthma. Istanbul Tip Fak Mecmuasi 15:142–153.
Gundel LA, Hering SV. 1998. Absorbing Filter Media forDenuder-Filter Sampling of Total Organic Carbon in Air-borne Particles. Lawrence Berkeley National Lab, Berkeley,CA. Record of Invention WIB 1457.
Han JY, Takeshita K, Utsumi H. 2001. Noninvasive detec-tion of hydroxyl radical generation in lung by dieselexhaust particles. Free Radic Biol Med 30:516–525.
Harkema JR, Plopper CG, Hyde DM, St George JA. 1987a.Regional differences in quantities of histochemically detect-able mucosubstances in nasal, paranasal, and nasopha-ryngeal epithelium of the bonnet monkey. J HistochemCytochem 35:279–286.
Harkema JR, Plopper CG, Hyde DM, St. George JA,Dungworth DL. 1987b. Effects of an ambient level of ozoneon primate nasal epithelial mucosubstances: Quantitativehistochemistry. Am J Pathol 127:90–96.
Harkema JR, Hotchkiss JA, Henderson RF. 1989. Effects of0.12 and 0.80 ppm ozone on rat nasal and nasopharyngealepithelial mucosubstances: Quantitative histochemistry.Toxicol Pathol 17:525–535.
Harkema JR, Hotchkiss JA. 1994. Ozone-induced prolifera-tive and metaplastic lesions in nasal transitional and respi-ratory epithelium: Comparative pathology. Inhal Toxicol 6:187–204.
Harkema JR, Keeler G, Wagner J, Morishita M, Timm E,Hotchkiss J, Marsik F, Dvonch T, Kaminski N, Barr E.2004. Effects of Concentrated Ambient Particles on Nor-mal and Hypersecretory Airways in Rats. Research Report120. Health Effects Institute, Boston, MA.
Harkema JR, Morgan KT, Gross EA, Catalano PJ, GriffithWC. 1994. Consequences of Prolonged Inhalation of Ozoneon F344/N rats: Collaborative Studies. Part VII. Effects onthe Nasal Mucociliary Apparatus (pp. 3–34). ResearchReport 65. Health Effects Institute, Cambridge, MA.
Harkema JR, Barr EB, Hotchkiss JA. 1997a. Responses ofrat nasal epithelium to short- and long-term exposures ofozone: Image analysis of epithelial injury, adaptation andrepair. Microsc Res Tech 36:276–286.
Harkema JR, Hotchkiss JA, Griffith WC. 1997b. Mucouscell metaplasia in rat nasal epithelium after a 20-monthexposure to ozone: A morphometric study of epithelial dif-ferentiation. Am J Respir Cell Mol Biol 16:521–530.
Hayashi M, Sornberger GC, Huber GL. 1979. Morphomet-ric analyses of tracheal gland secretion and hypertrophy inmale and female rats after exposure to tobacco smoke. AmRev Respir Dis 119:67–73.
Henderson RF, Hotchkiss JA, Chang IY, Scott BR, HarkemaJR. 1993. Effect of cumulative exposure on nasal responseto ozone. Toxicol Appl Pharmacol 119:59–65.
49

Effects of CAPs and DEE on Allergic Airway Disease in Rats
Hoek G, Brunekreef B. 1995. Effect of photochemical airpollution on acute respiratory symptoms in children. Am JRespir Crit Care Med 151:27–32.
Hogan SP, Koskinen A, Matthaei KI, Young IG, Foster PS.1998. Interleukin-5-producing CD4+ T cells play a pivotalrole in aeroallergen-induced eosinophilia, bronchial hyper-reactivity, and lung damage in mice. Am J Respir Crit CareMed 157:210–218.
Hogg JC. 1997. The pathology of asthma. APMIS 105:735–745.
Hollingsworth JW, Whitehead GS, Lin KL, Nakano H,Gunn MD, Schwartz DA, Cook DN. 2006. TLR4 signalingattenuates ongoing allergic inflammation. J Immunol 176:5856–5862.
Hotchkiss JA, Harkema JR, Kirkpatrick DT, Henderson RF.1989a. Response of rat alveolar macrophages to ozone:Quantitative assessment of population size, morphology,and proliferation following acute exposure. Exp Lung Res15:1–16.
Hotchkiss JA, Harkema JR, Sun JD, Henderson RF. 1989b.Comparison of acute ozone-induced nasal and pulmonaryinflammatory responses in rats. Toxicol Appl Pharmacol98:289–302.
Hotchkiss JA, Harkema JR, Henderson RF. 1991. Effect ofcumulative ozone exposure on ozone-induced nasal epi-thelial hyperplasia and secretory metaplasia in rats. ExpLung Res 17:589–600.
Hotchkiss JA, Harkema JR, Johnson NF. 1997. Kinetics ofnasal epithelial cell loss and proliferation in F344 rats fol-lowing a single exposure to 0.5 ppm ozone. Toxicol ApplPharmacol 143:75–82.
Hubbard AK, Symanowicz PT, Thibodeau M, Thrall RS,Schramm CM, Cloutier MM, Morris JB. 2002. Effect ofnitrogen dioxide on ovalbumin-induced allergic airwaydisease in a murine model. J Toxicol Environ Health A65:1999–2005.
Huntzicker JJ, Johnson RL, Shah JJ, Gray RA. 1982. Analy-sis of organic and elemental carbon in ambient aerosolsby the thermal-optical method. In: Particulate Carbon-Atmospheric Life Cycle (Wolff G, Klimisch RL, eds). Ple-num Press, New York.
Ichinose T, Takano H, Miyabara Y, Yanagisawa R, Sagai M.1997. Murine strain differences in allergic airway inflam-mation and immunoglobulin production by a combinationof antigen and diesel exhaust particles. Toxicol 122:183–192.
50
Ichinose T, Takano H, Miyabara Y, Sadakano K, Sagai M,Shibamoto T. 2002. Enhancement of antigen-induced eosin-ophilic inflammation in the airways of mast-cell deficientmice by diesel exhaust particles. Toxicol 180:293–301.
ICRP. International Commission of Radiological Protection.1994. Human Respiratory Tract Model for RadiologicalProtection. A Report of Committee 2 of the ICRP. PergamonPress, Oxford, UK.
Inoue K, Takano H, Hiyoshi K, Ichinose T, Sadakane K,Yanagisawa R, Tomura S, Kumagai Y. 2007. Naphtho-quinone enhances antigen-related airway inflammation inmice. Eur Respir J 29:259–267.
Joseph CL, Foxman B, Leickly FE, Peterson E, Ownby D.1996. Prevalence of possible undiagnosed asthma and as-sociated morbidity among urban schoolchildren. J Pediatr129:735–742.
Keeler GJ, Spengler JD, Castillo R. 1991. Acid aerosol mea-surements at a suburban Connecticut site. Atmos Environ24A:2915–2923.
Keeler GJ, Dvonch JT, Yip FY, Parker EA, Israel BA, MarsikFJ, Morishita M, Barres JA, Robins TG, Brakefield-CaldwellW, Sam M. 2002. Assessment of personal and community-level exposures to particulate matter among children withasthma in Detroit, Michigan, as part of Community ActionAgainst Asthma (CAAA). Environ Health Perspec 110:173–181.
Kesten SJ, Szalai J, Dzyngel B. 1995. Air quality and the fre-quency of emergency room visits for asthma. Ann AllergyAsthma Immunol 74:269–273.
Kleinman MT, Hamade A, Meacher D, Oldham M, SioutasC, Chakrabarti B, Stram D, Froines JR, Cho AK. 2005. Inha-lation of concentrated ambient particulate matter near aheavily trafficked road stimulates antigen-induced airwayresponses in mice. J Air Waste Manag Assoc 55:1277–1288.
Kobzik L, Goldsmith CA, Ning YY, Qin G, Morgan B,Imrich A, Lawrence J, Murthy GG, Catalano PJ. 2001.Effects of Combined Ozone and Air Pollution ParticleExposure in Mice (pp. 5–29 and 31–38). Research Report106. Health Effects Institute, Boston, MA.
Koenig JQ, Covert DS, Marshall SG, Van-Belle G, PiersonWE. 1987. The effects of ozone and nitrogen dioxide onpulmonary function in healthy and in asthmatic adoles-cents. Am Rev Respir Dis 136:1152–1157.
Koenig JQ, Larson TV, Hanley QS, Rebolledo V, Dumler K,Checkoway H, Wang SZ, Lin D, Pierson WE. 1993. Pulmonary

J. Harkema et al.
function changes in children associated with fine particu-late matter. Environ Res 63:26–38.
Lambert AL, Dong W, Winsett DW, Selgrade MK, GilmourMI. 1999. Residual oil fly ash exposure enhances allergicsensitization to house dust mite. Toxicol Appl Pharmacol158:269–277.
Lambert AL, Dong W, Selgrade MK, Gilmour MI. 2000.Enhanced allergic sensitization by residual oil fly ash par-ticles is mediated by soluble metal constituents. ToxicolAppl Pharmacol 165:84–93.
Lewis TC, Robins TG, Dvonch JT, Keeler GJ, Yip FY, MentzGB, Lin X, Parker EA, Israel BA, Gonzalez L, Hill Y. 2005.Air pollution-associated changes in lung function amongasthmatic children in Detroit. Environ Health Perspect113:1068–1075.
Li N, Alam J, Venkatesan MI, Eiguren-Fernandez A,Schmitz D, Di Stefano E, Slaughter N, Killeen E, Wang X,Huang A, Wang M, Miguel AH, Cho A, Sioutas C, Nel AE.2004. Nrf2 is a key transcription factor that regulates anti-oxidant defense in macrophages and epithelial cells: Pro-tecting against the proinflammatory and oxidizing effectsof diesel exhaust chemicals. J Immunol 173:3467–3481.
Lippmann M, Ito K, Nadas A, Burnett RT. 2000. Associa-tion of Particulate Matter Components with Daily Mor-tality and Morbidity in Urban Populations (pp. 5–72 and73–82). Re-search Report 95. Health Effects Institute, Cam-bridge, MA.
Long SE, Martin TD. 1992. Methods for the determinationof metals in environmental samples. Environmental Moni-toring Systems Laboratory, Office of Research and Devel-opment, U.S. EPA.
Lowenthal DH, Zielinska B, Chow JC, Watson JG, GautamM, Ferguson DH, Neuroth GR, Stevens KD. 1994. Charac-terization of heavy-duty diesel vehicle emissions. AtmosEnviron 28:731–743.
McCreanor J, Cullinan P, Nieuwenhuijsen MJ, Stweart-Evans J, Malliarou E, Jarup L, Harrington R, SvartengrenM, Han IK, Ohman-Strickland P, Chung KF, Zhang J. 2007.Respiratory effects of exposure to diesel traffic in personswith asthma. N Engl J Med 357:2348–2358.
McDonald JD, Zielinska B, Fujita EM, Sagebiel JC, Chow JC,Watson JG. 2000. Fine particle and gaseous emission ratesfrom residential wood combustion. Environ Sci Technol34:2080–2091.
McDonald JD, Barr EB, White RK. 2004. Design, charac-terization, and evaluation of a small-scale diesel exhaustexposure system. Aerosol Sci Technol 38:62–78.
Melgert BN, Postma DS, Geerlings M, Luinge MA, Klok PA,van der Strate BW, Kerstjens HA, Timens W, Hylkema MN.2004. Short-term smoke exposure attenuates ovalbumin-induced airway inflammation in allergic mice. Am J RespirCell Mol Biol 30:880–885.
Michigan Department of Transportation. 2002. Annual aver-age traffic volume map. Lansing, MI.
Miyabara Y, Yanagisawa R, Shimojo N, Takano H, Lim HB,Ichinose T, Sagai M. 1998a. Murine strain differences inairway inflammation caused by diesel exhaust particles. EurRespir J 11:291–298.
Miyabara Y, Ichinose T, Takano H, Lim HB, Sagai M. 1998b.Effects of diesel exhaust on allergic airway inflammationin mice. J Allergy Clin Immunol 102:805–812.
Miyabara Y, Takano H, Ichinose T, Lim HB, Sagai M. 1998c.Diesel exhaust enhances allergic airway inflammation andhyperresponsiveness in mice. Am J Respir Crit Care Med157:1138–1144.
Mori A, Kaminuma O, Suko M, Mikami T, Nishizaki Y,Ohmura T, Hoshino A, Asakura Y, Miyazawa K, Ando T,Okumura Y, Yamamoto K, Okudaira H. 1997. Cellular andmolecular mechanisms of IL-5 synthesis in atopic dis-eases: A study with allergen-specific human helper T cells.J Allergy Clin Immunol 100:S56–S64.
Morishita M, Keeler GJ, Wagner JG, Marsik FJ, Timm EJ,Dvonch TJ, Harkema JR. 2004. Pulmonary retention of par-ticulate matter is associated with airway inflammation inallergic rats exposed to air pollution in urban Detroit. InhalToxicol 16:663–674.
Morishita M, Keeler GJ, Wagner JG, Harkema JR. 2006.Source identification of ambient PM2.5 during summerinhalation exposure studies in Detroit, MI. Atmos Environ40:3823–3834.
Nel AE, Diaz-Sanchez D, Li N. 2001. The role of particulatepollutants in pulmonary inflammation and asthma: Evi-dence for the involvement of organic chemicals and oxida-tive stress. Curr Opin Pulm Med 7:20–26.
Nel A. 2005. Atmosphere. Air pollution-related illness:Effects of particles. Science 308:804–806.
Nelson DA, Johnson CC, Divine GW, Strauchman C, JosephCL, Ownby DR. 1997. Ethnic differences in the prevalenceof asthma in middle class children. Ann Allergy AsthmaImmunol 78:21–26.
Ostro BD, Lipsett MJ, Mann JK, Braxton-Olwens H, WhiteMC. 1995. Air pollution and asthma exacerbations among
51

Effects of CAPs and DEE on Allergic Airway Disease in Rats
African-American children in Los Angeles. Inhal Toxicol7:711–722.
Ostro B, Chestnut L. 1998. Assessing the health benefits ofreducing particulate matter air pollution in the UnitedStates. Environ Res 76:94–106.
Pandya RJ, Solomon G, Kinner A, Balmes JR. 2002. Dieselexhaust and asthma: Hypotheses and molecular mecha-nisms. Environ Health Perpsect 110:103–112.
Peden DB. 1996. Effect of air pollution in asthma and res-piratory allergy. Otolaryngol Head Neck Surg 114:242–247.
Peters A, Dockery DW, Heinrich J, Wichmann HE. 1997.Short-term effects of particulate air pollution on respiratorymorbidity in asthmatic children. Eur Respir J 10:872–879.
Plopper CG, Mariassy A, Lollini LO. 1983. Structure asrevealed by airway dissection: A comparison of mamma-lian lungs. Am Rev Respir Dis 128:S4–S7.
Ponka A. 1991. Asthma and low level air pollution in Hel-sinki [see comments]. Arch Environ Health 46:262–270.
Pope CA III, Dockery DW, Spengler JD, Raizenne ME. 1991.Respiratory health and PM10 pollution. A daily time seriesanalysis. Am Rev Respir Dis 144:668–674.
Rabinovitch N, Strand M, Gelfand EW. Particulate levelsare associated with early asthma worsening in children withpersistent disease. Am J Respir Crit Care Med 173:1098–1105.
Reid LM. 1954. Pathology of chronic bronchitis. Lancet266:274–278.
Reid L. 1963. An experimental study of hypersecretion ofmucus in the bronchial tree. Br J Exp Pathol 44:437–445.
Reynolds H, Merrill WW. 1981. Airway changes in youngsmokers that may antedate chronic obstructive lung dis-ease. Med Clin North Am 65:667–690.
Rogge WF, Hildemann LM, Mazurek MA, Cass GR. 1993.Sources of fine organic aerosol. 2. Noncatalyst and catalyst-equipped automobiles and heavy-duty diesel trucks. EnvironSci Technol 27:636–651.
Romieu I, Meneses F, Sienra MJ, Huerta J, Ruiz VS, WhiteMC, Etzel RA, Hernandez AM. 1995. Effects of urban airpollutants on emergency visits for childhood asthma inMexico City. Am J Epidemiol 141:546–553.
Schlesinger RB, Gorczynski JE, Dennison J, Richards L,Kinney PL, Bosland MC. 1992. Long-term intermittent ex-posure to sulfuric acid aerosol, ozone, and their combina-tion: Alterations in tracheobronchial mucocilary clearanceand epithelial secretory cells. Exp Lung Res 18:505–534.
52
Schwartz J. 1993. Particulate air pollution and chronic res-piratory disease. Environ Res 62:7–13.
Schwartz J, Slater D, Larson TV, Pierson WE, Koenig JQ.1993. Particulate air pollution and hospital emergency roomvisits for asthma in Seattle. Am Rev Respir Dis 147:826–831.
Schwartz J. 1994. Air pollution and hospital admissionsfor the elderly in Detroit, Michigan. Am J Respir Crit CareMed 150:648–655.
Schwartz J. 1995. Short term fluctuations in air pollutionand hospital admissions of the elderly for respiratory dis-ease. Thorax 50:531–538.
Sioutas C, Koutrakis P, Burton RM. 1995. A technique toexpose animals to concentrated fine ambient aerosols.Environ Health Perspect 103:172–177.
Steiger DJ, Fahey JV, Gallup M, Finkbeiner WE, BousheyHA, Basbaum CB. 1992. ELISA- and polymerase chainreaction-based methods for semi-quantitative detection ofmucin and mucin mRNA in vitro in human airways. AmRev Respir Dis 145:A618.
Steiger D, Fahy J, Boushey H, Finkbeiner WE, Basbaum C.1994. Use of mucin antibodies and cDNA probes to quan-tify hypersecretion in vivo in human airways. Am J RespirCell Mol Biol 10:538–545.
Steiger D, Hotchkiss J, Bajaj L, Harkema J, Basbaum C.1995. Concurrent increases in the storage and release ofmucin-like molecules by rat airway epithelial cells inresponse to bacterial endotoxin. Am J Respir Cell Mol Biol12:307–314.
Takafuji S, Suzuki S, Koizumi K, Tadokoro K, Miyamoto T,Ikemori R, Muranaka M. 1987. Diesel-exhaust particulateinoculated by the intranasal route have an adjuvant activ-ity for IgE production in mice. J Allergy Clin Immunol79:639–645.
Takano H, Yoshikawa T, Ichinose T, Miyabara Y, Imaoka K,Sagai M. 1997. Diesel exhaust particles enhance antigen-induced airway inflammation and local cytokine expres-sion in mice. Am J Respir Crit Care Med 156:36–42.
Takano H, Ichinose T, Miyabara Y, Shibuya T, Lim HB,Yoshikawa T, Sagai M. 1998. Inhalation of diesel exhaustenhances allergen-related eosinophil recruitment and air-way hyperresponsiveness in mice. Toxicol Appl Pharmacol150:328–337.
Thurston GD, Ito K, Kinney PL, Lippmann M. 1992. Amulti-year study of air pollution and respiratory hospitaladmissions in three New York State metropolitan areas:
J. Harkema et al.
Results for 1988 and 1989 summers. J Expo Anal EnvironEpidemiol 2:429–450.
Tseng RY, Li CK, Spinks JA. 1992. Particulate air pollutionand hospitalization for asthma. Ann Allergy 68:425–432.
Tsien A, Diaz-Sanchez D, Ma J, Saxon A. 1997. The organiccomponent of diesel exhaust particles and phenanthrene,a major polyaromatic hydrocarbon constituent, enhancesIgE production by IgE-secreting EBV-transformed humanB cells in vitro. Toxicol Appl Pharmacol 142:256–263.
Tulic MK, Wale JL, Holt PG, Sly PD. 2000. Modificationof the inflammatory response to allergen challenge afterexposure to bacterial lipopolysaccharide. Am J Respir CellMol Biol 22:604–612.
U.S. Environmental Protection Agency. 1996. Air QualityCriteria for Particulate Matter. EPA/600/P-95/001aF, bF,and cF. National Center for Environmental Assessment,Research Triangle Park, NC.
U.S. Environmental Protection Agency. 1997. ReferenceMethod for the Determination of Fine Particulate Matteras PM2.5 in the Atmosphere. EPA 40 CFR Pat 50. Washing-ton, DC.
U.S. Environmental Protection Agency. 2000a. AirData NETDatabase. Facility Locator Map. Office of Air and Radia-tion, Washington, DC.
U.S. Environmental Protection Agency. 2000b. Draft Tech-nical Support Document: Control of Emissions of Hazard-ous Air Pollutants from Motor Vehicles and Motor VehicleFuels. EPA/420/D/00/003. Office of Transportation and AirQuality, Washington, DC.
U.S. Environmental Protection Agency. 2002. Health As-sessment Document for Diesel Engine Exhaust. EPA/600/8-90/057F. National Center for Environmental Assessment,Washington, DC, for the Office of Transportation and AirQuality.
Vagaggini B, Taccola M, Cianchetti S, Carnevali S, BartoliML, Bacci E, Dente FL, Di Franco A, Giannini D, PaggiaroPL. 2002. Ozone exposure increases eosinophilic airwayresponse induced by previous allergen challenge. Am JRespir Crit Care Med 166:1073–1077.
Valko M, Morris H, Cronin MTD. 2005. Metals, Toxicityand Oxidative Stress. Current Med Chem 12:1161–1208.
Vanden Heuvel JP, Tyson FL, Bell DA. 1993. Constructionof recombinant RNA templates for use as internal stan-dards in quantitative RT–PCR. Biotechniques 14:395–398.
Vasilakos CH, Levi N, Maggos TH, Hatzianestis J,Michopoulos J, Helmis C. 2007. Gas–particle concentra-tion and characterization of sources of PAHs in the atmo-sphere of a suburban area in Athens, Greece. J HazardMater 140:45–51.
Vincent, JH. 1990. The fate of inhaled aerosols: A review ofobserved trends and some generalizations. Ann Occup Hyg34:623–637.
Wagner JG, Hotchkiss JA, Harkema JR. 2002. Enhancementof nasal inflammatory and epithelial responses after ozoneand allergen coexposure in Brown Norway rats. Toxicol Sci67:284–294.
Wagner JG, Van Dyken SJ, Hotchkiss JA, Harkema JR. 2001.Endotoxin enhancement of ozone-induced mucous cellmetaplasia is neutrophil-dependent in rat nasal epithelium.Toxicol Sci 60:338–347.
Walker C, Virchow, J, Bruijnzeel PL, Blaser K. 1991. T cellsubsets and their soluble products regulate eosinophilia inallergic and nonallergic asthma. J Immunol 146:1829–1835.
Walters S, Griffiths RK, Ayres JG. 1994. Temporal associa-tion between hospital admissions for asthma in Birming-ham and ambient levels of sulphur dioxide and smoke.Thorax 49:133–140.
Weiss KB, Gergen PJ, Crain EF. 1992. Inner-city asthma.The epidemiology of an emerging US public health con-cern. Chest 101:362S–367S.
White MC, Etzel RA, Wilcox WD, Lloyd C. 1994. Exacerba-tions of childhood asthma and ozone pollution in Atlanta.Environ Res 65:56–68.
Xia T, Kovochich M, Nel A. 2006. The role of reactive oxy-gen species and oxidative stress in mediating particulatematter injury. Clin Occup Environ Med 5:817–836.
Young JT. 1981. Histopathologic examination of the ratnasal cavity. Fundam Appl Toxicol 1:309–312.
Young L-H, Keeler GJ. 2004. Characterization of UltrafineParticle Number Concentration and Size Distribution Dur-ing a Summer Campaign in Southwest Detroit. J Air WasteManag Assoc 54:1079–1090.
Young L-H, Keeler GJ. 2007. Summertime ultrafine parti-cles in urban and industrial air: Aitken and nucleationmode particle events. Aerosol Air Qual Res (In press).
Yunker M, Macdonald R, Brewer R, Mitchell R, Goyette S.2002. PAHs in the Fraser river basin: A critical appraisal ofPAH ratios as indicators of PAH source and composition.Org Geochem 33:489–515.
53

Effects of CAPs and DEE on Allergic Airway Disease in Rats
ABBREVIATIONS AND OTHER TERMS
AB/PAS Alcian Blue (pH 2.5)/Periodic Acid Schiff Sequence
ACES Advanced Collaborative Emissions Study
AM alveolar macrophages
ANOVA analysis of variance
ATII alveolar type II cells
BALF bronchoalveolar lavage fluid
BN Brown Norway
BrdU bromodeoxyuridine
CAPs concentrated ambient particles
CO carbon monoxide
CO2 carbon dioxide
DEE diesel engine exhaust
DEP diesel exhaust particle
EC elemental carbon
ELISA enzyme-linked immunosorbent assay
GSD geometric standard deviation
GSH glutathione
H+ hydrogen ion
HEPA high efficiency particulate air
HNO2 nitrous acid
HNO3 nitric acid
H2SO4 sulfuric acid
ICP–MS inductively coupled plasma–mass spectrometry
IgE immunoglobulin E
IgG1 immunoglobulin G
IL interleukin
IM intraepithelial mucosubstances
IN intranasal
INF interferon
IM intraepithelial mucosubstances
LI labeling index
LOD limit of detection
LRRI Lovelace Respiratory Research Institute
MCM mucus cell metaplasia
54
MOI multiorifice impactor
mRNA messenger RNA
MSU Michigan State University
Muc5AC mucin glycoprotein
NH3 ammonia
NH4+ ammonium
NIST National Institute of Standards and Technology
NO2 nitrogen dioxide
NO3� nitrate ion
NOx total nitrogen oxides
O3 ozone
OC organic carbon
OVA ovalbumin
PAH polycyclic aromatic hydrocarbon
PM particulate matter
PM2.5 PM with an aerodynamic diameter � 2.5 µm
PTFE polytetrafluoroethylene (Teflon)
QA quality assurance
QC quality control
ROFA residual oil fly ash
ROS reactive oxygen species
RT–PCR reverse transcriptase–polymerase chain reaction
SD standard deviation
SIF sorbent impregnated filter
SMPS scanning mobility particle sizer
SO2 sulfur dioxide
SO42� sulfate ion
SRM Standard Reference Material
SW southwest
Th2 T-helper cell [interleukin-2]
THC total hydrocarbons
TEOM tapered element oscillating microbalance
TNF tumor necrosis factor
TWA time-weighted average
ULLI unit-length labeling index
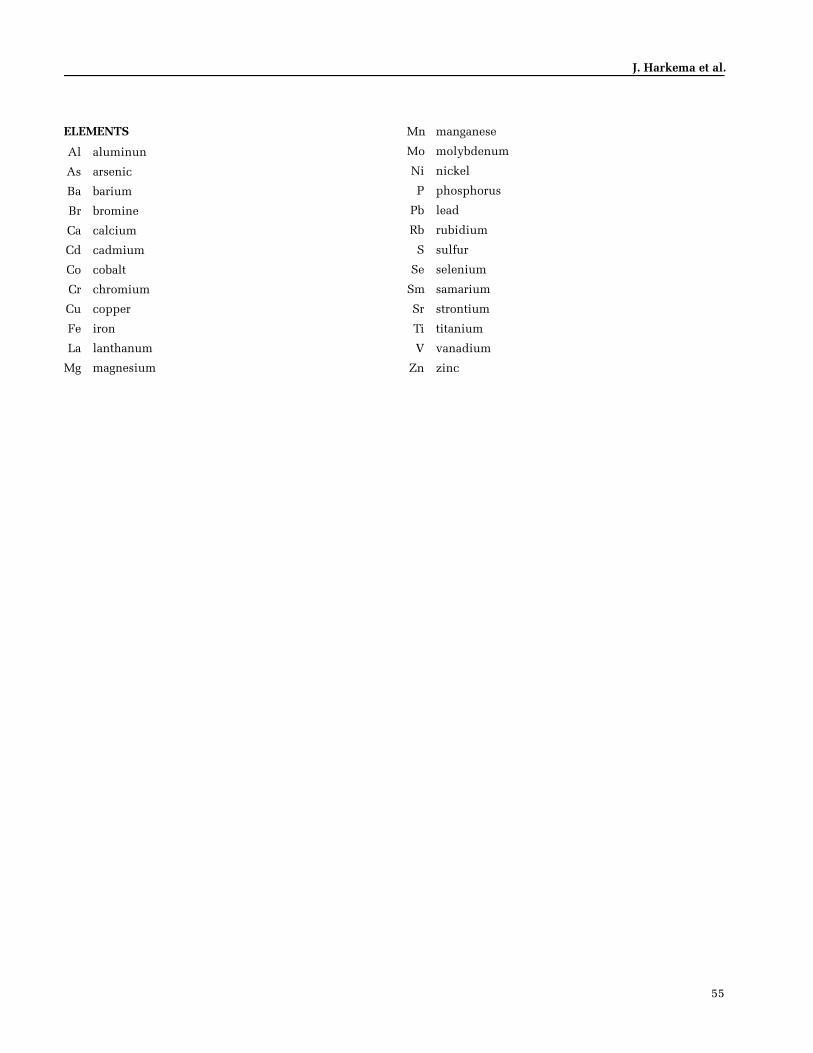
J. Harkema et al.
ELEMENTS
Al aluminun
As arsenic
Ba barium
Br bromine
Ca calcium
Cd cadmium
Co cobalt
Cr chromium
Cu copper
Fe iron
La lanthanum
Mg magnesium
Mn manganese
Mo molybdenum
Ni nickel
P phosphorus
Pb lead
Rb rubidium
S sulfur
Se selenium
Sm samarium
Sr strontium
Ti titanium
V vanadium
Zn zinc
55


CRITIQUEHealth Review Committee
Research Report 145, Effects of Concentrated Ambient Particles and Diesel Engine Exhaust on Allergic Airway Disease in Brown Norway Rats, J.R. Harkema et al.
INTRODUCTION
As outlined in the Preface, epidemiologic studies pub-lished in the 1990s suggested that short-term exposure totraffic in urban areas adversely affected the respiratory andimmune systems, particularly in individuals with asthmaand other allergic diseases. In these studies, diesel engineexhaust (DEE*) was a major contributor to particulate mat-ter (PM) in urban air. In addition, experimental studies inthe 1990s suggested that exposure to diesel exhaust parti-cles (DEPs) affected the respiratory and immune systems ofpeople with asthma. However, the epidemiologic studiesdid not measure ambient concentrations of individual pol-lutants, and many of the experimental studies did not userelevant exposure routes and particle doses. To providea better understanding of whether particles from dieselengines and other sources contribute to the frequency andseverity of asthma attacks and to the exacerbation of aller-gic responses, and if so by what mechanism, HEI issuedRequest for Applications (RFA) 00-1, Effects of Diesel Ex-haust and Other Particles on the Exacerbation of Asthmaand Other Allergic Diseases, in 2001. The RFA sought pro-posals for epidemiologic studies and studies of controlledinhalation exposures to particles in humans and otherspecies, especially in groups considered susceptible toparticle effects.
In response, Dr. Jack R. Harkema, Michigan State Uni-versity (MSU), and colleagues submitted a proposal toevaluate the effects of exposure of rats to concentratedambient particles (CAPs) of particulate matter (PM) withan aerodynamic diameter � 2.5 µm (fine particles, PM2.5);CAPs would be derived from an area in southwest Detroit,Michigan, that had a higher-than-average prevalence of
childhood asthma. Harkema and colleagues had previ-ously evaluated the effects of CAPs from this area in anearlier study of a rodent model of asthma — responses ofrats to the airway-administered allergen ovalbumin (OVA)— that was funded by HEI (Harkema et al. 2004); they nowproposed to use the same model to evaluate the effects inthe airways of rats of exposure to CAPs during differentphases of the administration of allergen. The HEI ResearchCommittee considered Dr. Harkema’s application a logicalextension of his group’s previous study. However, becausethe concentrator would sample PM from a location whereDEE was only one of many sources, the Committee thoughtthe application did not specifically address exposures todiesel. After discussions with HEI, Dr. Harkema includedan evaluation of the effects of exposure to DEE in the samerat model. The diesel study would be carried out at theLovelace Respiratory Research Institute (LRRI) in Albuquer-que, New Mexico, where a system for exposing rodents todiesel exhaust was already in place. The Research Com-mittee recommended the study for funding.
BACKGROUND
ASTHMA
Asthma is a chronic disease of the lower airways charac-terized by inflammation, mucus hypersecretion, reversibleairway obstruction, and airway hyperresponsiveness.There are several subgroups among patients with asthma,each with somewhat different pathologies. In a major sub-group, asthma has an immunologic basis, most frequentlyassociated with allergic reactions to inhaled allergens.Numerous early epidemiologic studies reported that short-term exposure to particulate pollution exacerbates thesymptoms of asthma (e.g., Schwartz et al. 1993; Lipsett etal. 1997) and decreases lung function in people withasthma (e.g., Pope et al. 1991; Peters et al. 1997). Themechanism or mechanisms by which particles exacerbateasthma symptoms were not well defined, however.
EXPOSURE TO CAPS IN ANIMAL MODELS OF HUMAN AIRWAY DISEASE
Harkema and colleagues’ previous HEI study was thefirst to evaluate the effects of exposure to CAPs in
Dr. Jack R. Harkema’s 2-year study, “Fine Airborne Particles and AllergicAirway Disease,” began in February 2003. Total expenditures were $438,886.The draft Investigators’ Report from Harkema and colleagues was receivedfor review in May 2007. A revised report, received in January 2008, wasaccepted for publication in February 2008. During the review process, theHEI Health Review Committee and the investigators had the opportunity toexchange comments and to clarify issues in both the Investigators’ Reportand the Review Committee’s Critique.
This document has not been reviewed by public or private party institu-tions, including those that support the Health Effects Institute; therefore, itmay not reflect the views of these parties, and no endorsements by themshould be inferred.
* A list of abbreviations and other terms appears at the end of the Investi-gators’ Report.
Health Effects Institute Research Report 145 © 2009 57

Critique of Investigators’ Report by Harkema et al.
OVA-sensitized-and-challenged rats, a model with somebut not all of the characteristics of human asthma(Harkema et al. 2004). As in the current study, the inves-tigators used a mobile air research laboratory to collectPM and concentrate CAPs from the air in southwest De-troit, a site where the rate of asthma is three times higherthan the national average. The PM collection site was at aschool located within 2.5 km of a major border crossingbetween the United States and Canada for diesel trucks,steel and chemical refineries, and the intersection of twolarge highways.
In the earlier study, in rats previously sensitized andchallenged with OVA, exposure to CAPs — for either 1 dayor 4 to 5 days in two separate exposure campaigns (Julyand September)—was associated with changes in a limitednumber of airway inflammatory endpoints (Harkema et al.2004). Compared with control animals, more effects werenoted after CAPs exposures in September — includinghigher numbers of leukocytes in bronchoalveolar lavagefluid (BALF) and increased levels of mucus cell metaplasia(levels of intraepithelial mucosubstances [IM] and epithe-lial cell density) in the pulmonary airways — than in July.After the 5-day September exposures, the investigatorsdetected higher levels of the trace metals V and La in lungtissues in CAPs-exposed animals than in animals exposedto filtered air. In a follow-up study (Morishita et al. 2004),the investigators reported increased recovery of the PM2.5trace elements V, La, Mn, and S from the lung tissues ofCAPs-exposed rats, which they attributed to emissionsfrom local refineries and other combustion sources.
In addition to the prior studies of Harkema and col-leagues in the allergen model, other studies had evaluatedthe effects of exposure to CAPs in the airways both inhealthy rodents and in a different model of airway inflam-matory disease, chronic bronchitis. Gordon and colleagues(1998, 2000) found no changes in the airways of a smallnumber of healthy rats inhaling CAPs collected in NewYork City. They did find modest changes in the distributionof peripheral blood leukocytes—an increase in the percent-age of neutrophils and a decrease in the percentage of lym-phocytes (Gordon et al. 1998, 2000). Clarke and colleagues(1999) showed that CAPs derived from Boston air enhancedtidal volume and increased inflammatory cell numbers inhealthy rats and rats with bronchitis; CAPs induced morepotent effects in the rats with bronchitis. The same group(Saldiva et al. 2002) found that exposure to CAPs increasedneutrophil numbers in healthy rats and rats with chronicbronchitis, and it linked these changes with the PM com-ponents V and Br. Batalha and colleagues (2002) reportedthat CAPs exposures induced vasoconstriction of smallpulmonary arteries in healthy and bronchitic rats, which
was correlated particularly with the silicon component ofPM. Using CAPs derived from another site, Research Tri-angle Park, North Carolina, Kodavanti and colleagues(2000) found that inflammatory responses of bronchiticrats varied with different exposure campaigns. In a differ-ent model of chronic bronchitis in rats, induced by admin-istration of endotoxin rather than sulfur dioxide (SO2), aswas used in the studies cited above, Harkema and col-leagues (2004) found no effects of exposure to DetroitCAPs. Moreover, in mice sensitized and challenged withOVA, Kobzik and colleagues (2001) found no effects ofshort-term exposure to Boston-derived CAPs on inflamma-tory endpoints in the airways. CAPs had no effect on con-trol mice that were not sensitized or challenged with OVA.
Overall, these studies indicate that inhalation of CAPshad limited inflammatory effects in the airways and cir-culation of healthy rodents and rodents in differentmodels of airway inflammatory diseases such as asthmaand bronchitis.
EXPOSURE TO DIESEL EXHAUST IN HUMANS AND OTHER SPECIES
Before the current study, studies in both humans androdents suggested that administration of DEPs enhancedfeatures characteristic of an allergic pattern of immuneresponse. Diaz-Sanchez and colleagues (1994) found thatadministering 300 µg of DEPs into the noses of healthy andasthmatic subjects enhanced the total number of immuno-globulin E (IgE)-secreting B cells in the upper airways ofboth groups. They also found (Diaz-Sanchez et al. 1997)that administering DEPs in combination with ragweedallergen enhanced the production of messenger RNA spe-cific for interleukin-4 (IL-4) and IL-13 — cytokines asso-ciated with the Th2 subset of CD4+ T lymphocytes and thedevelopment of key features of an allergic response,including IgE synthesis. Several early studies in rodents(e.g., Takano et al. 1997; Fujimaki et al. 1997) reportedthat the administration of DEPs with allergens such asOVA enhanced Th2-cell cytokine production and antigen-specific IgE synthesis. Mice sensitized to allergen showedincreased inflammatory responses — mucus cell prolifera-tion and enhanced numbers of eosinophils — after expo-sure to DEPs via inhalation (Miyabara et al. 1998).
Some human controlled-exposure studies had evaluatedimmunologic and inflammatory endpoints in healthy andasthmatic human volunteers exposed to diesel exhaust.Salvi and colleagues (1999, 2000) reported an increase inneutrophil and B cell numbers and in levels of IL-8, fibro-nectin, and histamine in BALF from healthy participants.Rudell and colleagues (1999) also found an increase in neu-trophil numbers in BALF of healthy volunteers, but not in
58

Health Review Committee
their fibronectin or myeloperoxidase levels. Nightingale andcolleagues (2000) found a significant increase in sputumneutrophils and myeloperoxidase. In a study of inflamma-tory responses in asthmatic people exposed to DEE, Nor-denhäll and colleagues (2001) found a significant increasein IL-6 but not in myeloperoxidase, eosinophil cationicprotein, or IL-8. Overall, these studies suggested that con-trolled exposure to diesel exhaust had limited inflamma-tory effects in healthy people and people with asthma.
OBJECTIVES AND SPECIFIC AIMS
The goals of the present study were to evaluate theeffects in the airways of rats of exposure to DEE or CAPs atcritical phases in the development of the allergic response,namely during sensitization — the first administration ofallergen — and during challenge — the second administra-tion of the same allergen.
The specific aims tested the following hypotheses:
1. Exposure of rats to CAPs during allergen challengeexacerbates airway epithelial remodeling (measuredby, for example, mucus cell metaplasia) and airwayinflammation.
2. Exposure of rats to DEE during either allergen sensi-tization or challenge exacerbates airway epithelialremodeling and airway inflammation.
STUDY DESIGN
The study was conducted in two different locations: theCAPs study in Michigan (exposures in Detroit and analysisat MSU in East Lansing) and the DEE study at the LovelaceRespiratory Research Institute (LRRI) in Albuquerque,New Mexico. The laboratories followed the same OVAsensitization and challenge regimen for CAPs and DEEstudies: Brown Norway rats were sensitized by intranasalinstillation of a 0.5% solution of OVA (or saline as a con-trol) on days 1 through 3, they rested for days 4 through 14,and were challenged intranasally with a 1.0% solution ofOVA (or saline) on days 15 through 17.
For the CAPs exposures, rats previously sensitized toOVA (or saline) were exposed to CAPs on days 15–17,that is, on the same days the animals were challengedwith OVA. For the DEE exposures, in one experiment(“study 1” in the Investigators’ Report) rats were exposedto DEE on the same days as OVA sensitization (days 1–3),and in a second experiment (“study 2”) previously sensi-tized rats were exposed on the same days as OVA chal-lenge (days 15–17).
CAPS COLLECTION AND EXPOSURES
The investigators used a mobile research facility to col-lect ambient air and expose rats to CAPs. The mobile labo-ratory was located at a school in southwest Detroit, Michi-gan. In addition to concentrating particles approximately30-fold, the mobile lab collected meteorologic measure-ments including temperature, relative humidity, solarradiation, wind speed, and wind direction. Harkema andcolleagues made measurements, in both ambient air andCAPs, of PM mass; elemental carbon and organic carbon(EC and OC); sulfate, nitrate, and ammonium ions; pollut-ant gases (ozone, carbon monoxide [CO], SO2, and totalnitrogen oxides [NOx]); several organic species, includingpolycyclic aromatic hydrocarbons (PAHs); and severaltrace elements.
In the study of CAPs during OVA challenge, groups ofeight rats were exposed via whole-body inhalation to CAPsor filtered air on days 15–17 for 8 hours/day; the OVA chal-lenge was performed on the same days 1 hour after the endof the CAPs exposure. This substudy resulted in fourgroups of rats differing in OVA (or saline) challenge andCAPs (or filtered air) exposure: Air/Saline, CAPs/Saline,Air/OVA, and CAPs/OVA.
CAPs exposures were performed during two differentweeks, July 14–16 and July 21–23, 2003. As describedbelow in the Results section, the investigators found thatCAPs concentration and composition differed in these twoweeks; thus, they considered each week’s 3-day exposure aseparate experiment. Note that the investigators refer tothese in the Investigators’ Report as “week 1” and “week 2.”To avoid confusion, this Critique refers to “CAPs Experi-ment 1” and “CAPs Experiment 2.”
EXPOSURE TO DEE
Whole-body DEE exposure studies were conducted atthe LRRI during February and March 2003. DEE was gener-ated using a single-cylinder, 5500-watt diesel engine gen-erator using number 2 nationally certified diesel fuel. Inaddition to PM mass, the investigators measured totalhydrocarbons and the pollutant gases NOx and CO.
In the study of DEE during OVA sensitization (“study1”), rats were exposed to 30 µg/m3 PM (low concentration)or 300 µg/m3 PM (high concentration) DEE or filtered airfor 8 hours/day on days 1–3 (see Figure 3 in the Investiga-tors’ Report). OVA sensitization was performed on thesame days 1 hour after the end of the DEE exposure. Thusthis substudy resulted in six groups, each with eight treatedrats, that differed in OVA (or saline) sensitization and DEE(or air) exposure: Air/Saline, 30 DEE/Saline, 300 DEE/Saline; Air/OVA, 30 DEE/OVA, 300 DEE/OVA.
59

Critique of Investigators’ Report by Harkema et al.
In the study of DEE during OVA challenge (“study 2”),rats were exposed to filtered air or the same concentrationsof DEE (30 and 300 µg/m3 PM) but on days 15–17 (see Fig-ure 4 in the Investigators’ Report). OVA challenge was per-formed on the same days 1 hour after the end of the DEEexposure. This substudy also resulted in six groups oftreated rats differing in OVA (or saline) challenge and DEE(or air) exposure.
BIOLOGIC ENDPOINTS
Twenty-four hours after the last intranasal OVA chal-lenge, each rat was killed and airway tissues from the noseand lung were removed. The left lung lobe was used to pre-pare BALF, which was assayed for total and differentialcell counts and levels of the secreted mucin glycoprotein(Muc5AC), total protein, elastase, �-glucuronidase, multi-ple cytokines, and other soluble mediators including OVA-specific IgE. The left lung lobe was then fixed and pro-cessed, and Harkema and colleagues dissected out theproximal and distal axial airways. The nasal airways werealso fixed and processed. The right lobe of the lung andmain axial airway were used for isolation of total RNA;using reverse transcriptase–polymerase chain reaction, theinvestigators assessed the expression of airway mucin andmultiple cytokines.
To assess changes in mucus cells in the airways,Harkema and colleagues conducted morphometric analy-ses of IM at four different regions of the respiratory tract:the proximal and distal nasal septum and the proximaland distal axial airway in the left lung lobe. The morpho-metric assessments included quantity and volume densi-ties of stored IM in the surface epithelial lining of nasaland pulmonary airways, and numeric epithelial cell den-sity. The investigators also used bromodeoxyuridine(BrdU) labeling to assess the number of surface epithelialcells synthesizing DNA in the axial airways: Values wereassessed as percent labeled epithelial cells (labeling index[LI]) and labeling index per unit length of epithelium sur-face (unit-length labeling index [ULLI]).
DETECTION OF TRACE ELEMENTS
The investigators measured trace elements in ambientair, the exposure atmospheres, and the lung tissue of ratsusing inductively coupled plasma–mass spectrometry(ICP–MS). Levels of trace elements in lung tissue in Detroitwere determined after CAPs Experiment 1; trace elementsin the lungs at the LRRI were also evaluated after rats hadbeen exposed to 30 or 300 µg/m3 PM DEE for 3 days imme-diately prior to OVA challenge.
STATISTICAL ANALYSIS
Biologic endpoints were expressed as the mean ± theSEM and analyzed by analysis of variance for the type ofpollutant exposure (CAPs, DEE, or air) and airway sensiti-zation (allergen or saline). Samples with no detectablelevel of the molecule measured were analyzed as zerovalues. Significant differences were identified using post-hoc tests such as the Tukey omega procedure. The crite-rion for statistical significance was P � 0.05.
RESULTS
PHYSICAL AND CHEMICAL CHARACTERIZATION OF EXPOSURE ATMOSPHERES
Ambient PM2.5, CAPs, and Gases
The average ambient PM2.5 concentration measured at theDetroit mobile lab site was 16.2 ± 10.7 µg/m3 in July 2003,with over 80% of the particles having a diameter � 1 µm.The CAPs concentration was higher on average during the3-day exposure period in CAPs Experiment 1 (July 14–16)than in CAPs Experiment 2 (July 21–23): 596 ± 563 µg/m3
versus 356 ± 222 µg/m3, respectively. The composition ofthe major identifiable components of CAPs — OC; sulfate,nitrate, and ammonium ions — was similar in both Experi-ments 1 and 2, but the composition of trace elements inCAPs and meteorologic data differed between the two ex-periment weeks. Levels of several trace metals — includingRb, Ni, Fe, and Al — were at their highest during CAPsExperiment 1.
Ambient concentrations of ultrafine particles (diame-ter � 0.1 µm), PAHs, and the pollutant gases SO2 and NOxwere higher during CAPs Experiment 1 than during CAPsExperiment 2.
The concentrator concentrated ambient PM2.5 mass 20-to 31-fold on different days. The investigators showed(Figure 7 in the Investigators’ Report) that for the PMcomponents Fe and La the concentration factor, i.e., theenhancement in CAPs concentration over the concentra-tion in ambient air, was consistent — 10- to 20-fold — overseveral days of concentrator use. However, a comparisonof the data in Tables 1 and 5 of the Investigators’ Reportshows that the concentration factor for OC was approxi-mately 30% to 140% higher than the concentration factorfor PM mass on 5 of 6 days, and the concentration factorsfor EC and Mo were 50% or less than the concentrationfactor for PM mass on all 6 days, and were 67% or less forV, Ni, and As on at least 5 of the 6 exposure days.
60

Health Review Committee
DEE
At the LRRI, the investigators achieved concentrationsclose to the targets of 30 and 300 µg/m3 PM diesel particlemass in the exposure atmospheres. Most of the particleswere in the ultrafine range, contributing approximately18% of the particle mass. The major chemical compo-nents of the diesel particles were EC (68%–77%) and OC(6%–14%), with small amounts of inorganic ions andtrace metals. The investigators indicated that the mostabundant of the detected trace metals — Ca, Zn, and P —were components of additives in fuel and lubrication oils.Levels of NOx and CO in the high-diesel-exhaust expo-sure atmosphere were approximately 4 ppm; these levelswere approximately 10-fold lower in the low-diesel-exhaust atmosphere.
BIOLOGIC ENDPOINTS
Characteristics of the OVA-Sensitization-and-Challenge Model
OVA sensitization and challenge of rats at MSU and atthe LRRI resulted in many similar features:
• a mild-to-moderate rhinitis, characterized by an in-flammatory response in the nasal mucosa comprisinga mixture of leukocytes, with mild mucus cell hyper-plasia and hypertrophy in the respiratory epithelium,and lymphoid hyperplasia in the nasal-associatedlymphoid tissue.
• bronchiolitis and alveolitis in the lungs, which theinvestigators referred to as “allergic bronchopneumo-nia”; the bronchiolitis was characterized as an inflam-matory response of infiltrating leukocytes of differenttypes with mucus cell hyperplasia and hypertrophyin the respiratory epithelium lining the large-diameterconducting airways. Bronchiole-associated lymphoidtissue was also enlarged. Alveolar lesions were char-acterized by accumulation of macrophages, epithelioidcells, and eosinophils, with thickening of alveolarsepta. Increased mucus cells and IM in surface epithe-lial cells lining the large-diameter bronchioles of theaxial airways were also detected, as were increases inBrdU LI and ULLI of the airway epithelial lining ofboth proximal and distal airways.
BALF showed evidence of an inflammatory response:increases in total cells and multiple types of leukocytes(neutrophils, lymphocytes, eosinophils, and macrophages),as well as increases in levels of OVA-specific IgE, total pro-tein, Muc5AC, and IL-6. However, apart from IL-6, levelsof other cytokines assessed in BALF (tumor necrosis factor[TNF]�, IL-4, IL-10, and interferon [IFN]�) were mostlyundetectable. In addition, of the multiple cytokine-specific
RNAs assessed in lung tissue after OVA sensitization andchallenge, levels of only IL-10 were enhanced; levels ofIL-12 and Muc5AC were decreased.
Some responses to OVA differed in the different weeksof the study at MSU and between animals evaluated atMSU and the LRRI; these included differences in numbersof total cells, proportions of various types of leukocytes,and levels of cytokines, cytokine-specific RNAs, and OVA-specific IgE. For example, the mean level of IL-6 measuredin BALF in OVA-sensitized-and-challenged rats exposedto air was approximately 29 ng/mL in CAPs Experiment 1at MSU, 11 ng/mL in CAPs Experiment 2 at MSU, 14 ng/mLin study 1 at the LRRI, and 361 ng/mL (with a large error)in study 2 at the LRRI. In addition, levels of OVA-specificIgE were increased by sensitization and priming onlyabout 3-fold at MSU but over 10-fold at the LRRI.
Changes Associated with Exposure to CAPs or DEE
The focus of the study was to evaluate effects of pollut-ant exposure during OVA sensitization or challenge inrats. Few effects of CAPs or DEE exposure were detected inthe absence of OVA sensitization and challenge. In addi-tion, exposure to CAPs or DEE had no histologic or otherbiologic effects in the nose above those seen in rats sensi-tized and challenged with OVA.
Some effects of CAPs and DEE were detected in thelungs of OVA-sensitized-and-challenged rats, and these aresummarized in Critique Table 1. Overall, Critique Table 1indicates the following:
• Exposure to CAPs during OVA challenge in CAPsExperiment 1 increased some features of the OVA-induced inflammatory response in the lungs — theseverity and distribution of bronchiolitis and alveoli-tis; numbers of cells; levels of total protein, Muc5AC,and TNF� in BALF; and IM in proximal and distalpulmonary airways. Levels of several cytokine-specificRNAs decreased after exposure to CAPs in CAPsExperiment 1. Few, if any, effects of CAPs during OVAchallenge on inflammatory endpoints were detectedin CAPs Experiment 2.
• The effects of DEE exposure on OVA sensitization andOVA challenge were quite mild, and the pattern ofDEE-associated changes was quite complicated. First,in both studies more changes in OVA-associated end-points were observed at the lower exposure concen-tration, 30 µg/m3 PM, than at the higher, 300 µg/m3
PM. Second, exposure to 30 µg/m3 DEE during OVAsensitization predominantly enhanced OVA-associatedinflammatory endpoints, whereas exposure to 30 µg/m3
DEE during OVA challenge attenuated OVA-associatedinflammatory endpoints.
61

62
Critique of Investigators’ Report by Harkema et al.
Cri
tiqu
e Ta
ble
1.
Eff
ects
Ass
ocia
ted
wit
h C
AP
s or
DE
E E
xpos
ure
in
th
e L
un
gs o
f R
ats
Sen
siti
zed
an
d C
hal
len
ged
wit
h O
VA
(E
ffec
t of
Pol
luta
nt
Com
par
ed w
ith
Fil
tere
d A
ir C
ontr
ol)
a
Lu
ng
En
dp
oin
t
CA
Ps
Exp
osu
re D
uri
ng
OV
A C
hal
len
geL
ow D
EE
Du
rin
g O
VA
S
ensi
tiza
tion
Hig
h D
EE
Du
rin
g O
VA
S
ensi
tiza
tion
Low
DE
ED
uri
ng
OV
AC
hal
len
ge
Hig
h D
EE
Du
rin
g O
VA
Ch
alle
nge
Exp
erim
ent
1E
xper
imen
t 2
Bro
nch
ioli
tis
and
al
veol
itis
, se
veri
ty a
nd
d
istr
ibu
tion
↑
No
effe
ct
Sli
ght
↑
N
o ef
fect
M
ild
↓
N
o ef
fect
BA
LF
cel
ls
↑
Tot
al c
ells
(34
%),
p
red
omin
antl
y eo
sin
oph
ils
(200
%),
ly
mp
hoc
ytes
(150
%),
an
d n
eutr
oph
ils
No
effe
ct
↑
Tot
al c
ells
(62
%),
p
red
omin
antl
y n
eutr
oph
ils
(120
%),
eo
sin
oph
ils
(52%
),
and
mac
rop
hag
es
(35%
)
No
effe
ct
↓
Tot
al c
ells
(60
%)
and
mac
rop
hag
es
(54%
)
No
effe
ct
Sol
ubl
e p
rod
uct
s
b
↑
Tot
al p
rote
in (
40%
) an
d M
uc5
AC
(20
%),
T
NF
�
lev
el (
100%
)N
o ef
fect
on
IL
-6 (
all
oth
er c
ytok
ines
ND
)
No
effe
ct o
n t
otal
p
rote
in o
r M
uc5
AC
, or
onIL
-6 a
nd
IL
-10
(all
oth
er
cyto
kin
es N
D)
No
effe
ct o
n t
otal
p
rote
in o
r M
uc5
AC
↓
�
-Glu
curo
nid
ase
↑
IL
-6, T
NF
�
, an
d
IL-1
0
c
No
effe
ct o
n t
otal
p
rote
in o
r M
uc5
AC
↓
�
-Glu
curo
nid
ase
No
dif
fere
nce
fro
m
con
trol
IL
-6 (
all
oth
er c
ytok
ines
ND
)
↓
Tot
al p
rote
in (
82%
),
�
-Glu
curo
nid
ase
(40%
), a
nd
IL
-6
(98%
) (a
ll o
ther
cy
toki
nes
ND
)
No
effe
ct o
n t
otal
p
rote
in, M
uc5
AC
, el
asta
se, o
r
�
-Glu
curo
nid
ase
↓
IL
-6 (
67%
) (a
ll o
ther
cy
toki
nes
ND
)
Gen
e ex
pre
ssio
n
(lu
ng
cell
s)
↓
IL
-10,
IF
N
�
, TN
F
�
, IL
-5, a
nd
IL
-12
No
effe
ct o
n M
uc5
AC
No
effe
ct o
n a
ny
cyto
kin
e
↓
Mu
c5A
C
Sm
all
↑
in
IL
-12p
35
but
no
oth
er
cyto
kin
esN
o ef
fect
on
Mu
c5A
C
↑
IL
-10,
IL
-12p
35, b
ut
no
oth
er c
ytok
ines
or
Mu
c5A
C
No
effe
ct o
n a
ny
cyto
kin
e or
M
uc5
AC
No
effe
ct o
n a
ny
cyto
kin
e or
Mu
c5A
C
Mor
ph
omet
ryIM
in
p
ulm
onar
y ax
ial a
irw
ays
d
↑
No
effe
ct
No
effe
ct
No
effe
ct
No
effe
ct i
n p
roxi
mal
ai
rway
s
↓
in
dis
tal
airw
ays
No
effe
ct i
n
pro
xim
al a
irw
ays
↓
in
dis
tal
airw
ays
Cel
l la
beli
ng
ind
ices
No
chan
ge i
n L
I or
U
LL
I or
nu
mer
ic
den
sity
in
eit
her
p
roxi
mal
or
dis
tal
airw
ays
No
chan
ge i
n L
I or
U
LL
I or
nu
mer
ic
den
sity
in
eit
her
p
roxi
mal
or
dis
tal
airw
ays
Sm
all
↑
in
UL
LI
but
not
LI
or n
um
eric
d
ensi
ty i
n p
roxi
mal
ai
rway
s; n
o ch
ange
s in
dis
tal
airw
ays
Sm
all
↑ in
UL
LI
but
no
effe
ct o
n L
I or
n
um
eric
den
sity
in
p
roxi
mal
air
way
s↓
in U
LL
I bu
t n
o ef
fect
on
den
sity
in
dis
tal
airw
ays
No
effe
ct o
n L
I or
U
LL
I in
pro
xim
al
airw
ays
Sm
all
↑ in
LI
or U
LL
I in
dis
tal
airw
ays
No
effe
ct o
n L
I,
UL
LI,
or
nu
mer
ic
cell
den
sity
in
p
roxi
mal
air
way
sS
mal
l ↑
in U
LL
I an
d n
um
eric
ce
ll d
ensi
ty i
n
dis
tal
airw
ays
a N
D i
nd
icat
es n
ot d
etec
ted
.b
Lev
els
of O
VA
-sp
ecifi
c Ig
E n
ot a
ffec
ted
by
any
pol
luta
nt
exp
osu
re. N
o p
ollu
tan
t ef
fect
s on
ela
stas
e or
�-g
lucu
ron
idas
e u
nle
ss i
nd
icat
ed i
n t
he
tabl
e.
c C
ontr
ol v
alu
es f
or a
ll c
ytok
ines
exc
ept
IL-6
wer
e n
ond
etec
tabl
e.d E
ffec
ts i
n p
roxi
mal
an
d d
ista
l ai
rway
s, u
nle
ss o
ther
wis
e in
dic
ated
.
Health Review Committee
Levels of Trace Elements in Lung After Exposure to CAPs or DEE
The investigators detected slightly higher levels of theelements La and Mo (and Rb—data not shown) in the lungsof rats exposed to CAPs in Experiment 1 than in the lungs ofcontrol rats not exposed to CAPs (Figure 9 in the Investiga-tors’ Report). No data on levels of trace elements wereshown for CAPs Experiment 2.
The investigators also detected increases in severaltrace elements in the lungs of animals exposed to 30 or300 µg/m3 PM DEE for 3 days immediately prior to OVAchallenge (data not shown). Figure 17 in the Investigators’Report shows very small increases in the levels of the traceelements V and Fe in the lungs of rats exposed to 30 or300 µg/m3 PM DEE compared to controls.
HEI EVALUATION
In its independent review of the study, the HEI HealthReview Committee considered that this study addressedan important issue — investigating the effects in the air-ways of rats of exposures to relevant environmental pollut-ants at key stages in the response to an airborne allergen.The experimental design was well conceived and well car-ried out and the investigators’ interpretation of data wasgenerally appropriate.
The investigators made good use of their previously de-veloped OVA-sensitization-and challenge model in rats thatexhibited some characteristics of human asthma (Harkemaet al. 2004). The features of the model were reasonablyconsistent at the two study sites, MSU and the LRRI. How-ever, as the investigators acknowledge, although the modelexhibited some features of human asthma, such as inflam-mation of nasal and bronchial airways and mucus cellmetaplasia, other features — in particular, the observedalveolitis and increases in IL-6 levels — are not character-istic of human asthma. Moreover, the Committee noted thatthe investigators did not investigate submucosal changes,such as smooth muscle cell hyperplasia and hypertrophy,which are important pathologic features of allergic airwaydisease, and they did not detect levels of other cytokinesthat are associated with asthma. Thus, these differenceslimit the ability to extrapolate the results in this model tohuman asthma.
Although exposure to a low level of DEE mildly en-hanced inflammatory responses when exposures were con-ducted concomitantly with allergen sensitization, the mostsurprising findings from the study were the relative lack ofeffect of the higher-level DEE exposure in the OVA modeland findings suggesting that the low-level DEE exposure
attenuated several effects of OVA when the exposuresoccurred during OVA challenge.
The inconsistency of changes after exposure to dieselemissions in this study appears to contrast with studies inhumans and rodents that showed enhancement of differ-ent facets of the allergic response after exposure to diesel(e.g., Diaz-Sanchez et al. 1994, 1997; Fujimaki et al. 1997;Takano et al. 1997). One prior study in this rat OVA model(Dong et al 2005) reported inhibitory effects of inhaledDEPs before sensitization with OVA but used very highlevels (20 mg DEPs, that is, 100- to 1000-fold higher thanused in the current study), so the results are difficult tocompare with those of the current study. As the investiga-tors discuss in the report, some of the differences in find-ings could be the result of the lower levels of diesel emis-sions used in the current study compared with otherstudies; alternatively, differences in findings may possiblyresult from the use of DEPs in previous studies, in contrastto the DEE used in the current study that contained bothparticles and gases. The lack of effects of DEE observed inthe current study could possibly be attributed to an inhib-itory effect of the gaseous components of diesel on thestimulatory effects of DEPs. This possible interpretation issupported by the finding that exposure to nitrogen dioxide(NO2) inhibited eosinophilia and inflammatory responsesin a mouse OVA model (Hubbard et al. 2002). By contrast,in another mouse OVA study, NO2 had no effect on theresponse to OVA (Husain et al 2004).
However, although the Committee considered that theinhibition of OVA effects by exposure to gases in DEE isnot implausible, several controlled exposure studies inhumans that used whole DEE found enhancement of air-way inflammatory responses in healthy people and peoplewith asthma (Rudell et al. 1999; Salvi et al. 1999, 2000;Nightingale et al. 2000; and Nordenhäll et al. 2001). Inaddition, in a real-world study on a street in London,United Kingdom (McCreanor et al. 2007; Zhang et al.2008), people with asthma who were exposed to a diesel-emissions-rich environment showed enhanced inflamma-tory responses (as well as mild impairment of pulmonaryfunction). These findings are inconsistent with the notionthat gases found in diesel emissions might have inhibited adiesel-particulate-mediated enhancement of allergic and in-flammatory responses that would otherwise have occurred.
The Committee also considered that the decreases insome of the endpoints in DEE-exposed animals, such asthe decrease in total numbers of cells recovered in BALF,might have been the result of cell activation, and that theseactivated cells might have adhered to and been seques-tered by airway surfaces or connective tissue components.In the absence of more detailed information in the report
63

Critique of Investigators’ Report by Harkema et al.
about retrieval efficiency and numbers of inflammatorycells remaining in the lungs after lavage, this scenario wasdifficult to evaluate, however.
As in their previous HEI-funded study (Harkema et al.2004), Harkema and colleagues made good use of a valu-able resource at their disposal — the mobile air researchlaboratory — to expose rats to CAPs at a site where theprevalence of asthma is higher than average and whereindividuals may be exposed to high levels of pollutantsfrom stationary and mobile sources. Harkema and col-leagues at MSU and the LRRI also used state-of-the-art ana-lytic methods to characterize the physical and chemicalcomplexity of CAPs and DEE composition.
Overall, the Committee agreed with the investigatorsthat responses to CAPs exposure differed in the two CAPsexperiments, and that in the experiment in which CAPsexposure affected airway endpoints — the week in whichlevels of CAPs mass and some CAPs components werehigher — the reported changes in this experiment wereconsistent with the results of earlier studies (Harkema etal. 2004; Morishita et al. 2004). In addition, the inflamma-tory effects of CAPs on cell numbers in the airways inExperiment 1 were generally consistent with those ofmore recent studies conducted in Los Angeles, California(Kleinman et al. 2005, 2007). Using a mobile research facil-ity similar to the one used in the current study, Kleinmanand colleagues exposed OVA-sensitized–and-challengedmice to CAPs downwind from a major roadway. In contrastto the current study, however, Kleinman and colleaguesfound that CAPs exposure enhanced measures of theimmunologic response to OVA — levels of OVA-specificIgE and IgG1, both of which are associated with allergic,Th2-type responses in mice; however, this enhancement ofthe allergic response was noted only in mice exposed 50 mor less from the roadway (Kleinman et al. 2005, 2007).
Interpretation of the effects of pollutants on levels ofcytokines in the airways in this study was challenging.Presumably the investigators expected to find increases inprotein or RNA levels of at least some cytokines associatedwith the induction of allergic or inflammatory responses.However, exposure to either CAPs or DEE in the OVAmodel increased protein and RNA levels of few of the cyto-kines assessed; protein levels of most cytokines were unde-tectable, and pollutant exposures decreased some cytokineRNA and protein levels compared with controls. The Com-mittee considered that the investigators might have chosena time for cytokine analysis that missed augmentation ofRNA or protein levels; alternatively, the levels of someother unmeasured cytokines might have been enhanced byexposure to pollutants. In this light, the Committee notedHarkema and colleagues’ recent experiments (Heidenfelder
et al. 2009) with CAPs inhalation in the same rat model. Inthat study, rats were exposed to CAPs between sensitiza-tion and challenge with OVA. CAPs-associated changes inhistologic and biochemical endpoints were similar to thosenoted in the current study; however, gene-expressionexperiments using microarrays suggested CAPs-associatedchanges in levels of the cytokine transforming growth fac-tor �, which plays an important role in repair mechanismsand remodeling in the lung, but which was not investi-gated in the current report.
Why effects of CAPs exposure were detected in CAPsExperiment 1 but not CAPs Experiment 2 can only be spec-ulated upon. CAPs mass and levels of some trace elementswere higher on average in CAPs Experiment 1 than inCAPs Experiment 2. Thus, as the investigators argue, thedifferences in biologic endpoints resulting from exposuresin the different weeks of the current study could haveresulted from differences in composition and concentra-tions of individual PM components, sources of emissionsof components, or differences in meteorology between thetwo weeks. However, the Committee was not convinced bythe investigators’ interpretation that the effects of CAPs inExperiment 1 were attributable to local stationary sources— the investigators did not perform analyses to identifysuch sources, and the Committee was not convinced thatthe multiple elements whose levels were elevated in CAPsin Experiment 1 were associated specifically with localstationary sources. In addition, experiments showinglevels of trace elements detected in the lungs after expo-sures to CAPs (or to DEE at the LRRI) were difficult tointerpret because the differences in levels among the expo-sure groups were very small.
The Committee also noted some issues inherent inextrapolating results from the current studies in whichCAPs and DEE emissions from a diesel generator wereused. First, as in all studies that concentrate particles fromambient air, the physical characteristics of the concen-trated particles do not reflect the composition of particlesin ambient air. By definition, the concentrator preferen-tially concentrates fine particles, particularly those in therange of 0.6 to 1 µm in mass median aerodynamic diame-ter, and does not similarly concentrate ultrafine or coarseparticles (� 0.1 µm and � 2.5 µm, respectively), which areoutside the limits of the concentrator’s size range butwhich may also have effects in this system. However, asthe Committee recognized, the investigators used the con-centrator to focus the study on the effects of exposure tohigher-than-ambient levels of fine particles at a site ofinterest, an area in which the prevalence of asthma is high.
A second issue in using a concentrator is that the chem-ical composition of concentrated particles may also differ
64

Health Review Committee
from the composition of ambient particles. For example,although the investigators indicated that some trace ele-ments were concentrated uniformly over several days andwere proportional to their concentrations in ambient air,some constituents of the PM mix (such as OC) were prefer-entially concentrated, whereas other constituents of themix (EC and several trace elements) were reduced in pro-portion to their concentration in ambient air.
In addition, the properties of the particles and gasesemitted by the diesel generator used in the current studydiffer from those emitted by heavy- and light-duty dieselengines, which are of greater public health concern. Forexample, in previous work from the LRRI group (Reed etal. 2004), the emissions from a light-duty diesel engineemitting 300 µg/m3 PM were composed of similar levels ofEC, but 2.5-fold more OC, 5-fold more NOx, and 67%lower CO levels than were in the emissions from the gen-erator used in the current study. The Committee also notedthat the current study was conducted before the UnitedStates (as well as Europe and other countries) introducedlow-sulfur diesel fuel and implemented tighter diesel PMemission standards for both light-duty and heavy-dutyvehicles (reviewed in HEI 2009). These changes haveresulted in the introduction of new PM control devices —primarily filters and catalysts — for diesel vehicles.
Although the particles used in the current study werenot “real world,” the concentrator and diesel generator didgenerate exposure atmospheres with some characteristicsof real-world aerosols. Future studies to explore the effectsof exposure to airborne pollutants will need to use more rel-evant exposure atmospheres and models of human disease.
SUMMARY AND CONCLUSIONS
HEI’s Review Committee thought that Harkema and col-leagues successfully designed and conducted a descriptivestudy to evaluate the effects of two pollutants — DEE andCAPs (concentrated PM2.5) — in a rodent model of asthma.The model had some but not all characteristics of thehuman disease, so caution should be used in extrapolatingdata obtained in the model to humans.
The most surprising findings were the relative lack ofeffect of high-level DEE (300 µg/m3 PM) exposure in themodel, which used rats sensitized and challenged with theairborne allergen OVA. In addition, low-level DEE expo-sure (30 µg/m3 PM) during allergen sensitization mildlyenhanced inflammatory responses, but the same exposureduring allergen challenge attenuated several effects ofexposure to OVA alone.
These findings differ from those of previous diesel-exposure studies, which have reported enhancement of
inflammatory and allergic responses in human exposuresand animal models. Differences in findings could be theresult of the lower levels of diesel emissions used in thecurrent study compared with some previous studies.Another possible explanation is that in some prior diesel-exposure studies rodents and humans were administereddiesel particles, rather than the whole emissions used inthe current study. Thus, the presence of gases in the DEEused in the present study could be hypothesized to haveinhibited responses to the diesel particulate fraction. Onthe other hand, some studies of controlled human exposureto DEE — which clearly contained both gaseous and partic-ulate components — have shown limited enhancement ofallergic and inflammatory responses, findings inconsistentwith the notion that gases found in diesel emissions mighthave inhibited a diesel-particulate-mediated enhancementof allergic and inflammatory responses that would other-wise have occurred.
The Committee also thought that the investigators madegood use of a mobile air research laboratory to expose ratsto CAPs at a site where the prevalence of asthma in thepopulation is higher than average. In CAPs Experiment 1,exposure to CAPs during the 3 days of OVA sensitizationenhanced some allergic and inflammatory endpoints, afinding consistent with data from previous studies, butthat was not observed in CAPs Experiment 2. Differencesin the findings of the two CAPs experiments suggest thatthe observed differences in composition of CAPs andhence sources of PM2.5 in the different weeks CAPs werecollected may be factors in determining the pattern ofresponse obtained. However, the investigators did not per-form analyses to identify sources of pollutants. In addi-tion, in contrast to the investigators, the Committee wasnot convinced that the multiple elements whose levelswere elevated in CAPs in Experiment 1 were associatedspecifically with local stationary sources. Thus, the Com-mittee did not believe that positive effects of CAPs inExperiment 1 could be attributed easily to any one set ofPM components or type of source.
The Committee also cautioned that in this study, as inall others that use CAPs, the concentrated particles maynot be representative of particles in ambient air. Concen-trated and ambient particles may differ in either physicalcharacteristics — selective concentration of a particularsize of particle — or chemical composition — selectiveconcentration of particular components. In a similar noteof caution about the diesel-exposure results, the Commit-tee noted that the diesel emissions emitted by the genera-tor used in the current study differ from emissions derivedfrom new diesel-powered vehicles, which are subject torecent regulations to reduce particulate emissions. Future
65

Critique of Investigators’ Report by Harkema et al.
studies to explore the effects of exposure to airborne pol-lutants will need to use more relevant exposure atmo-spheres and better models of human disease.
ACKNOWLEDGMENTS
The Health Review Committee thanks the ad hoc re-viewers for their help in evaluating the scientific merit ofthe Investigators’ Report. The Committee is also grateful toMaria Costantini for her oversight of the study, to Mei Wangand Geoffrey Sunshine for their assistance in preparing itsCommentary, to Leah Shriro for science editing of this Re-port and its Critique and to Flannery Carey McDermott, VirgiHepner, Carol Moyer, Bernie Jacobson and Ruth Shaw fortheir roles in preparing this Research Report for publication.
REFERENCES
Batalha JRF, Saldiva PHN, Clarke RW, Coull BA, StearnsRC, Lawrence J, Murthy GGK, Koutrakis P, Godleski JJ.2002. Concentrated ambient air particles induce vaso-constriction of small pulmonary arteries in rats. EnvironHealth Perspect 110:1191–1197.
Biswas S, Hu S, Verma V, Herner JD, Robertson WH, Ayala A,Sioutas C. 2008. Physical properties of particulate matter(PM) from late model heavy-duty diesel vehicles operatingwith advanced PM and NOx emission control technolo-gies. Atmos Environ 42:5622–5634.
Clarke RW, Catalano PJ, Koutrakis P, Murthy GGK, SioutasC, Paulauskis J, Coull B, Ferguson S, Godleski JJ. 1999.Urban air particulate inhalation alters pulmonary functionand induces pulmonary inflammation in a rodent model ofchronic bronchitis. Inhal Toxicol 11:637–656.
Diaz-Sanchez D, Dotson AR, Takenaka H, Saxon A. 1994.Diesel exhaust particles induce local IgE production invivo and alter the pattern of IgE messenger RNA isoforms.J Clin Invest 94:1417–1425.
Diaz-Sanchez D, Tsien A, Fleming J, Saxon A. 1997. Com-bined diesel exhaust particulate and ragweed allergen chal-lenge markedly enhances human in vivo nasal ragweed-specific IgE and skews cytokine production to a T helpercell 2-type pattern. J Immunol 158:2406–2413.
Dong CC, Yin XJ, Ma JY, Millecchia L, Barger MW, RobertsJR, Zhang XD, Antonini JM, Ma JK. 2005. Exposure ofBrown Norway rats to diesel exhaust particles prior toovalbumin (OVA) sensitization elicits IgE adjuvant activitybut attenuates OVA-induced airway inflammation. ToxicolSci 88:150–160.
Fujimaki H, Saneyoshi K, Shiraishi F, Imai T, Endo T. 1997.Inhalation of diesel exhaust enhances antigen-specific IgEantibody production in mice. Toxicology 116:227–233.
Gordon T, Nadziejko C, Chen LC, Schlesinger R. 2000.Effects of Concentrated Ambient Particles in Rats and Ham-sters: An Exploratory Study. Research Report 93. HealthEffects Institute, Cambridge MA.
Gordon T, Nadziejko C, Schlesinger R, Chen LC. 1998. Pul-monary and cardiovascular effects of acute exposure to con-centrated ambient particulate matter in rats. Toxicol Lett96-97:285–288.
Harkema JR, Keeler G, Wagner J, Morishita M, Timm E,Hotchkiss J, Marsik F, Dvonch T, Kaminski N, Barr E. 2004.Effects of Concentrated Ambient Particles on Normal andHypersecretory Airways in Rats. Research Report 120.Health Effects Institute, Boston, MA.
HEI Panel on the Health Effects of Traffic-Related AirPollution. 2009. Traffic-Related Air Pollution: A CriticalReview of the Literature on Emissions, Exposure, andHealth Effects. HEI Special Report 17. Health Effects Insti-tute. Boston, MA.
Heidenfelder BL, Reif DM, Harkema JR, Cohen Hubal EA,Hudgens EE, Bramble LA, Wagner JG, Morishita M, KeelerGJ, Edwards SW, Gallagher JE. 2009. Comparative micro-array analysis and pulmonary changes in Brown Norwayrats exposed to ovalbumin and concentrated air particu-lates. Toxicol Sci 108:207–221.
Hubbard AK, Symanowicz PT, Thibodeau M, Thrall RS,Schramm CM, Cloutier MM, Morris JB. 2002. Effect ofnitrogen dioxide on ovalbumin-induced allergic airwaydisease in a murine model. J Toxicol Environ Health A65:1999–2005.
Hussain I, Jain VV, O’Shaughnessy P, Businga TR, Kline J.2004. Effect of nitrogen dioxide exposure on allergicasthma in a murine model. Chest 126:198–204.
Kleinman MT, Hamade A, Meacher D, Oldham M, SioutasC, Chakrabarti B, Stram D, Froines JR, Cho AK. 2005. Inha-lation of concentrated ambient particulate matter near aheavily trafficked road stimulates antigen-induced air-way responses in mice. J Air Waste Manag Assoc 55: 1277–1288.
Kleinman MT, Sioutas C, Froines JR, Fanning E, HamadeA, Mendez L, Meacher D, Oldham M. 2007. Inhalation ofconcentrated ambient particulate matter near a heavily traf-ficked road stimulates antigen-induced airway responsesin mice. Inhal Toxicol 19 Suppl 1:117–126.
66

Health Review Committee
Kobzik L, Goldsmith CAW, Ning YY, Qin G, Morgan B,Imrich A, Lawrence J, Murthy GGK, Catalano PJ. 2001.Effects of Combined Ozone and Air Pollution Particle Ex-posure in Mice. Research Report 106. Health Effects Insti-tute, Boston MA.
Kodavanti UP, Mebane R, Ledbetter A, Krantz T, McGee J,Jackson MC, Walsh L, Hilliard H, Chen BY, Richards J,Costa DL. 2000. Variable pulmonary responses to concen-trated ambient air particles in a rat model of bronchitis.Toxicol Sci 54:441–451.
Lipsett M, Hurley S, Ostro B. 1997. Air pollution andemergency room visits for asthma in Santa Clara County,California. Environ Health Perspect 105:216–222.
Liu ZG, Vasys VN, Kittelson DB. 2007. Nuclei-mode partic-ulate emissions and their response to fuel sulfur contentand primary dilution during transient operations of old andmodern diesel engines. Environ Sci Technol 41:6479–6483.
McCreanor J, Cullinan P, Nieuwenhuijsen MJ, Stewart-Evans J, Malliarou E, Jarup L, Harrington R, SvartengrenM, Han I-K, Ohman-Strickland P, Chung KF, and Zhang J.2007. Respiratory effects of exposure to diesel traffic inpersons with asthma. N Engl J Med 357:2348–2358.
Miyabara Y, Takano H, Ichinose T, Lim HB, Sagai M.1998a. Diesel exhaust enhances allergic airway inflamma-tion and hyperresponsiveness in mice. Am J Respir CritCare Med 157:1138–1144.
Morishita M, Keeler G, Wagner J, Marsik F, Timm E,Dvonch J, Harkema J. 2004. Pulmonary retention of partic-ulate matter is associated with airway inflammation inallergic rats exposed to air pollution in urban Detroit. InhalToxicol 16:663–674.
Nightingale JA, Maggs R, Cullinan P, Donnelly LE, RogersDF, Kinnersley R, Fan Chung K, Barnes PJ, Ashmore M,Newman-Taylor A. 2000. Airway inflammation after con-trolled exposure to diesel exhaust particulates. Am JRespir Crit Care Med 162:161–166.
Nordenhäll C, Pourazar J, Ledin MC, Levin JO, Sandström T,Ädelroth E. 2001. Diesel exhaust enhances airway respon-siveness in asthmatic subjects. Euro Respir J 17:909–915.
Ntziachristos L, Samaras Z, Zervas E, Dorlhène P. 2005.Effects of a catalysed and an additized particle filter on theemissions of a diesel passenger car operating on low sulfurfuels. Atmos Environ 39: 4925–4936.
Peters A, Dockery DW, Heinrich J, Wichmann HE. 1997.Short-term effects of particulate air pollution on respiratory
morbidity in asthmatic children. Eur Respir J 10:872–879.
Pope CA III, Dockery DW, Spengler JD, Raizenne ME. 1991.Respiratory health and PM10 pollution: A daily time seriesanalysis. Am Rev Respir Dis 144:668–674.
Reed MD, Gigliotti AP, McDonald JD, Seagrave JC, SeilkopSK, Mauderly JL. 2004. Health effects of subchronic expo-sure to environmental levels of diesel exhaust. Inhal Toxicol16:177–193.
Ristovski ZD, Jayaratne ER, Lim M, Ayoko GA, Morawska L.2006. Influence of diesel fuel sulfur on nanoparticle emis-sions from city buses. Environ Sci Technol 40:1314–1320.
Rudell B, Blomberg A, Helleday R, Ledin MC, Lundbäck B,Stjernberg N, Hörstedt P, Sandström T. 1999. Bronchoalve-olar inflammation after exposure to diesel exhaust: Com-parison between unfiltered and particle trap filtered exhaust.Occup Environ Med 56:527–534.
Saldiva PH, Clarke RW, Coull BA, Stearns RC, Lawrence J,Murthy GG, Diaz E, Koutrakis P, Suh H, Tsuda A, GodleskiJJ. 2002. Lung inflammation induced by concentratedambient air particles is related to particle composition. AmJ Respir Crit Care Med 165:1610–1617.
Salvi S, Blomberg A, Rudell B, Kelly F, Sandström T, Hol-gate ST, Frew A.1999. Acute inflammatory responses inthe airways and peripheral blood after short-term exposureto diesel exhaust in healthy human volunteers. Am JRespir Crit Care Med 159:702–709.
Salvi S, Nordenhäll C, Blomberg A, Rudell B, Pourazar J,Kelly FJ, Wilson S, Sandström T, Holgate ST, Frew AJ.2000. Acute exposure to diesel exhaust increases IL-8 andGRO-� production in healthy human airways. Am J RespirCrit Care Med 161:550–557.
Schwartz J, Slater D, Larson TV, Pierson WE, Koenig JQ.1993. Particulate air pollution and hospital emergency roomvisits for asthma in Seattle. Am Rev Respir Dis 147:826–831.
Takano H, Yoshikawa T, Ichinose T, Miyabara Y, Imaoka K,Sagai M. 1997. Diesel exhaust particles enhance antigen-induced airway inflammation and local cytokine expres-sion in mice. Am J Respir Crit Care Med 156:36–42.
Zhang J, McCreanor JE, Cullinan P, Chung KF, Ohman-Strickland P, Han I-K, Järup L, Nieuwenhuijsen MJ. 2009.Health Effects of Real-World Exposure to Diesel Exhaust inPersons with Asthma. Research Report 138. Health EffectsInstitute, Boston, MA.
67


PrincipalNumber Title Investigator Date*
RELATED HEI PUBLICATIONS: PARTICULATE MATTER AND DIESEL EXHAUST
Research Reports
138 Health Effects of Real-World Exposure to Diesel Exhaust in Persons with Asthma J. Zhang 2009
136 Uptake and Inflammatory Effects of Nanoparticles in a Human Vascular I.M. Kennedy 2009Endothelial Cell Line
135 Mechanisms of Particulate Matter Toxicity in Neonatal and Young Adult Rat Lungs K.E. Pinkerton 2008
134 Black-Pigmented Material in Airway Macrophages from Healthy Children: J. Grigg 2008Association with Lung Function and Modeled PM10
131 Characterization of Particulate and Gas Exposures of Sensitive Subpopulations P. Koutrakis 2005Living in Baltimore and Boston
129 Particle Size and Composition Related to Adverse Health Effects in Aged, F.F. Hahn 2003Sensitive Rats
128 Neurogenic Responses in Rat Lungs After Nose-Only Exposure to Diesel Exhaust M.L. Witten 2005
126 Effects of Exposure to Ultrafine Carbon Particles in Healthy Subjects and M.W. Frampton 2004Subjects with Asthma
124 Particulate Air Pollution and Nonfatal Cardiac Events 2005
Part I. Air Pollution, Personal Activities, and Onset of Myocardial Infarction A. Petersin a Case–Crossover Study
Part II. Association of Air Pollution with Confirmed Arrhythmias Recorded D. Dockeryby Implanted Defibrillators
120 Effects of Concentrated Ambient Particles on Normal and Hypersecretory J.R. Harkema 2004Airways in Rats
118 Controlled Exposures of Healthy and Asthmatic Volunteers to Concentrated H. Gong Jr. 2003Ambient Particles in Metropolitan Los Angeles
117 Peroxides and Macrophages in Toxicity of Fine Particulate Matter D.L. Laskin 2003
112 Health Effects of Acute Exposure to Air Pollution S.T. Holgate 2003
Part I. Healthy and Asthmatic Subjects Exposed to Diesel Exhaust
Part II. Healthy Subjects Exposed to Concentrated Ambient Particles
110 Particle Characteristics Responsible for Effects on Human Lung Epithelial Cells A.E. Aust 2002
107 Emissions from Diesel and Gasoline Engines Measured in Highway Tunnels
Part I. Real-World Particulate Matter and Gaseous Emissions A.W. Gertler 2002From Motor Vehicles in a Highway Tunnel
Part II. Airborne Carbonyls from Motor Vehicle Emissions in D. Grosjean 2002Two Highway Tunnels
106 Effects of Combined Ozone and Air Pollution Particle Exposure in Mice L. Kobzik 2001
* Reports published since 1998. Copies of these reports can be obtained from the Health Effects Institute and many are available at pubs.healtheffects.org.
69
Continued

RELATED HEI PUBLICATIONS: PARTICULATE MATTER AND DIESEL EXHAUST
PrincipalNumber Title Investigator Date*
105 Pathogenomic Mechanisms for Particulate Matter Induction of Acute Lung G.D. Leikauf 2001Injury and Inflammation in Mice
104 Inhalation Toxicology of Urban Ambient Particulate Matter: R. Vincent 2001Acute Cardiovascular Effects in Rats
101 Epithelial Penetration and Clearance of Particle-Borne Benzo[a]pyrene P. Gerde 2001
98 Daily Mortality and Fine and Ultrafine Particles in Erfurt, Germany H-E. Wichmann 2000
Part I. Role of Particle Number and Particle Mass
96 Acute Pulmonary Effects of Ultrafine Particles in Rats and Mice G. Oberdörster 2000
95 Association of Particulate Matter Components with Daily Mortality M. Lippmann 2000and Morbidity in Urban Populations
91 Mechanisms of Morbidity and Mortality from Exposure to Ambient Air Particles J.J. Godleski 2000
Special Reports
17 A Critical Review of the Health Effects of Traffic-Related Air Pollution In Press
Revised Analyses of Time-Series Studies of Air Pollution and Health 2003
Research Directions to Improve Estimates of Human Exposure and Risk 2002from Diesel Exhaust
Reanalysis of the Harvard Six Cities Study and the American Cancer Society 2000Study of Particulate Air Pollution and Mortality: A Special Report of the Institute’s Particle Epidemiology Reanalysis Project
Diesel Emissions and Lung Cancer: Epidemiology and Quantitative Risk Assessment 1999
HEI Communications
10 Improving Estimates of Diesel and Other Emissions for Epidemiologic Studies 2003
8 The Health Effects of Fine Particles: Key Questions and the 2003 Review 1999(Report of the Joint Meeting of the EC and HEI)
7 Diesel Workshop: Building a Research Strategy to Improve Risk Assessment 1999
HEI Program Summaries
Research on Diesel Exhaust and Other Particles 2003
Research on Diesel Exhaust 1999
Research on Particulate Matter 1999
HEI Perspectives
Understanding the Health Effects of Components of the Particulate Matter Mix: 2002Progress and Next Steps
Airborne Particles and Health: HEI Epidemiologic Evidence 2001
* Reports published since 1998. Copies of these reports can be obtained from the Health Effects Institute and many are available at pubs.healtheffects.org.
70

H E I B OA R D, C O M M I T T E E S , a n d S TA F F
71
Board of Directors
Richard F. Celeste, Chair President, Colorado College
Sherwood Boehlert Of Counsel, Accord Group; Former Chair, U.S. House of Representatives Science Committee
Enriqueta Bond President Emeritus, Burroughs Wellcome Fund
Purnell W. Choppin President Emeritus, Howard Hughes Medical Institute
Michael T. Clegg Professor of Biological Sciences, University of California–Irvine
Jared L. Cohon President, Carnegie Mellon University
Stephen Corman President, Corman Enterprises
Gowher Rizvi Vice Provost of International Programs, University of Virginia
Linda Rosenstock Dean, School of Public Health, University of California–Los Angeles
Henry Schacht Managing Director, Warburg Pincus; Former Chairman and Chief Executive Officer,Lucent Technologies
Warren M. Washington Head, Climate Change Research, National Center for Atmospheric Research
Archibald Cox, Founding Chair 1980–2001
Donald Kennedy, Vice Chair Emeritus Editor-in-Chief Emeritus, Science; President Emeritus and Bing Professor of Biological Sciences, Stanford University
Health Research Committee
Mark J. Utell, Chair Professor of Medicine and Environmental Medicine, University of Rochester Medical Center
Kenneth L. Demerjian Ray Falconer Endowed Chair, Director and Professor, Atmospheric Sciences Research Center and Department of Atmospheric and Environmental Sciences, University at Albany, State University of New York
Joe G.N. Garcia Lowell T. Coggeshall Professor of Medicine, University of Chicago
Uwe Heinrich Professor, Medical School Hannover; Executive Director, Fraunhofer Institute for Toxicology and Experimental Medicine, Hannover, Germany
Grace LeMasters Professor of Epidemiology and Environmental Health, University of Cincinnati College of Medicine
Sylvia Richardson Professor of Biostatistics, Department of Epidemiology and Public Health, Imperial College School of Medicine, London, United Kingdom
Howard E. Rockette Professor, Department of Biostatistics, Graduate School of Public Health, University of Pittsburgh
James A. Swenberg Kenan Distinguished Professor of Environmental Sciences, Department of Environmental Sciences and Engineering, University of North Carolina–Chapel Hill
Ira B. Tager Professor of Epidemiology, School of Public Health, University of California–Berkeley

H E I B OA R D, C O M M I T T E E S , a n d S TA F F
72
Health Review Committee
Homer A. Boushey, Chair Professor of Medicine, Department of Medicine, University of California–San Francisco
Ben Armstrong Reader in Epidemiological Statistics, Public and Environmental Health Research Unit, Department of Public Health and Policy, London School of Hygiene and Tropical Medicine, United Kingdom
Michael Brauer Professor, School of Environmental Health, University of British Columbia, Canada
Bert Brunekreef Professor of Environmental Epidemiology, Institute of Risk Assessment Sciences, University of Utrecht, the Netherlands
Alan Buckpitt Professor of Toxicology, Department of Molecular Biosciences, School of Veterinary Medicine, University of California–Davis
John R. Hoidal Professor of Medicine, Clarence M. and Ruth N. Birrer Presidential Endowed Chair, Department of Medicine, University of Utah Health Sciences
Stephanie London Senior Investigator, Epidemiology Branch, National Institute of Environmental Health Sciences
William N. Rom Sol and Judith Bergstein Professor of Medicine and Environmental Medicine and Director of Pulmonary and Critical Care Medicine, New York University Medical Center
Armistead Russell Georgia Power Distinguished Professor of Environmental Engineering, School of Civil and Environmental Engineering, Georgia Institute of Technology
Lianne Sheppard Professor of Biostatistics, School of Public Health, University of Washington–Seattle
Officers and Staff
Daniel S. Greenbaum President Robert M. O’Keefe Vice PresidentRashid Shaikh Director of ScienceBarbara Gale Director of PublicationsJacqueline C. Rutledge Director of Finance and AdministrationHelen I. Dooley Corporate Secretary
Kate Adams Staff ScientistAaron J. Cohen Principal ScientistMaria G. Costantini Principal ScientistPhilip J. DeMarco Compliance ManagerTerésa Fasulo Science Administration ManagerHope Green Editorial Assistant (part time)L. Virgi Hepner Senior Science EditorSarah Katz Research AssociateAnny Luu Administrative AssistantFrancine Marmenout Senior Executive AssistantFlannery Carey McDermott Editorial AssistantSumi Mehta Senior ScientistNicholas Moustakas Policy AssociateTiffany North Research AssociateHilary Selby Polk Science EditorRobert A. Shavers Operations ManagerGeoffrey H. Sunshine Senior ScientistAnnemoon M.M. van Erp Senior ScientistKatherine Walker Senior Scientist


Janu
ary 2004
R E S E A R C H R E P O R T
H E A L T HE F F E CTSINSTITUTE
101 Federal Street, Suite 500
Boston, MA 02110, USA
+1-617-488-2300
www.healtheffects.org
R E S E A R C HR E P O R T
H E A L T HE F F E CTSINSTITUTE
Number 145
November 2009
Number 145November 2009
Effects of Concentrated Ambient Particles and Diesel Engine Exhaust on Allergic Airway Disease in Brown Norway Rats
Jack R. Harkema, James G. Wagner, Norbert E. Kaminski, Masako Morishita, Gerald J. Keeler, Jacob D. McDonald, and Edward G. Barrett
Copyright © 2022 FDOKUMEN