Determination of cell membrane permeability in concentrated cell ensembles
12
DETERMINATION OF CELL MEMBRANE PERMEABILITY IN CONCENTRATED CELL ENSEMBLES J. ALBERTO OCHOA, STEPHEN WHITAKER, AND PIETER STROEVE Department of Chemical Engineering, University of California at Davis, Davis, California 95616 ABSTRACT The method of volume averaging is used to analyze the process of diffusion in concentrated cell ensembles in which significant resistance to mass transfer is caused by the cellular membrane. A general closure scheme is given that allows for direct theoretical prediction of effective diffusivities for any cellular geometry. Numerical results are presented for the classical parallelepiped arrangement used to model cellular systems, and these results are used in conjunction with experimental studies of concentrated cell ensembles to determine membrane permeabilities for solute diffusion in several cellular systems. Membrane permeabilities are compared with predictions from other models of diffusion in cellular systems. INTRODUCTION Diffusion of organic solutes into cells is a phenomenon fundamental to the physiological processes that occur in organs, tissues, and blood. Cell membranes can play an important role in the overall mass transfer process of organic solutes in ensembles of cells. For example, when the cell permeability is sufficiently low it provides the controlling resistance for mass transfer into cells and limits the flux of solutes into the ensemble. The correlation of the cell membrane permeability with the physical and chemi- cal parameters of the membrane is an important area of study for physiological research (Brahm, 1983) and has important applications in the drying of cellular material (Crapiste et ai., 1984). Therefore, it is important that accurate cell membrane permeability data be available. In this paper, we focus on passive diffusion in ensembles of cells and the effect of cell membranes. A number of experimental techniques have been devised to measure the membrane permeability from mass transfer experiments. The rapid-flow technique was developed by Paganelli and Solomon (1957) and this technique was used to measure the permeability of red cell membranes to water and other small molecules (Sidel and Solomon, 1957; Barton and Brown, 1964; Vieira et aI., 1970). The stopped-flow rapid-reaction apparatus was used by Sha'afi et al. (1970, 1971) to measure the kinetics of osmotic swelling. This technique is preferred for fast permeating solutes. A fast permeation measurement technique using nuclear magnetic resonance (NMR) was used by Conlon and Outhred (1972,1978), but at present this technique is limited to water permeation (Osberghaus et aI., 1982). The above techniques require fairly sophisticated equipment and operation which may inhibit their routine usage. Send correspondence and offprint requests to P. Stroeve. Simpler techniques have been presented by Redwood et al. (1974) and Safford et al. (1978), and the former group deduced the permeabilities of dog red cell membranes from bulk diffusion measurements in packed red blood cells. The red cells were packed by centrifugation inside polyethylene tubes; radiolabeled solute was then applied to one end of the tube, and diffusion was allowed to proceed. The bulk diffusion coefficient, or effective diffusivity, in the cell ensemble was determined from the measurement of the distribution of radioactivity along the tube and the applica- tion of a one-dimensional diffusion model. The cell mem- brane permeability was obtained from a development (RRP model) that modeled the concentrated cell suspen- sion as long parallelepipeds (cells) separated by an extra- cellular phase and packed in a rectangular array. The model was restricted to concentrated cell ensembles. Saf- ford et al. (1978) obtained cell permeabilities for cells from the cat ventricular myocardium on the basis of bulk diffusion coefficients. These were measured by mass trans- fer data in a Ussing-type diffusion cell in which a thin slice of the tissue was mounted. Safford et al. (1978) developed a diffusion model of the tissue (SBB model), which was represented as long square cells forming a cubic array and separated by extracellular medium. In essence, the SBB model is based on the RRP model except that it is not restricted to concentrated cell ensembles. Furthermore, in the SBB model only square cells are considered. In both the RRP and the SBB models, data for the diffusion coeffi- cients in the extracellular and intracellular phase, in addition to the effective diffusivity in the cell ensemble, are required to calculate the cell membrane permeability. It is important to recognize that both models are one- dimensional in the local or point sense. This means that the point concentration is assumed to depend only on one spatial dimension. Since the geometrical structure of cellu- lar systems is inherently three-dimensional, the one-dimen- BIOPHYS. J. ©Biophysical Society • 0006-3495/87/11/763/12 $2.00 Volume 52 November 1987 763-774 763
-
Upload
independent -
Category
Documents
-
view
2 -
download
0
Transcript of Determination of cell membrane permeability in concentrated cell ensembles

DETERMINATION OF CELL MEMBRANE PERMEABILITY
IN CONCENTRATED CELL ENSEMBLES
J. ALBERTO OCHOA, STEPHEN WHITAKER, AND PIETER STROEVE Department of Chemical Engineering, University of California at Davis, Davis, California 95616
ABSTRACT The method of volume averaging is used to analyze the process of diffusion in concentrated cell ensembles in which significant resistance to mass transfer is caused by the cellular membrane. A general closure scheme is given that allows for direct theoretical prediction of effective diffusivities for any cellular geometry. Numerical results are presented for the classical parallelepiped arrangement used to model cellular systems, and these results are used in conjunction with experimental studies of concentrated cell ensembles to determine membrane permeabilities for solute diffusion in several cellular systems. Membrane permeabilities are compared with predictions from other models of diffusion in cellular systems.
INTRODUCTION
Diffusion of organic solutes into cells is a phenomenon fundamental to the physiological processes that occur in organs, tissues, and blood. Cell membranes can play an important role in the overall mass transfer process of organic solutes in ensembles of cells. For example, when the cell permeability is sufficiently low it provides the controlling resistance for mass transfer into cells and limits the flux of solutes into the ensemble. The correlation of the cell membrane permeability with the physical and chemical parameters of the membrane is an important area of study for physiological research (Brahm, 1983) and has important applications in the drying of cellular material (Crapiste et ai., 1984). Therefore, it is important that accurate cell membrane permeability data be available. In this paper, we focus on passive diffusion in ensembles of cells and the effect of cell membranes.
A number of experimental techniques have been devised to measure the membrane permeability from mass transfer experiments. The rapid-flow technique was developed by Paganelli and Solomon (1957) and this technique was used to measure the permeability of red cell membranes to water and other small molecules (Sidel and Solomon, 1957; Barton and Brown, 1964; Vieira et aI., 1970). The stopped-flow rapid-reaction apparatus was used by Sha'afi et al. (1970, 1971) to measure the kinetics of osmotic swelling. This technique is preferred for fast permeating solutes. A fast permeation measurement technique using nuclear magnetic resonance (NMR) was used by Conlon and Outhred (1972,1978), but at present this technique is limited to water permeation (Osberghaus et aI., 1982). The above techniques require fairly sophisticated equipment and operation which may inhibit their routine usage.
Send correspondence and offprint requests to P. Stroeve.
Simpler techniques have been presented by Redwood et al. (1974) and Safford et al. (1978), and the former group deduced the permeabilities of dog red cell membranes from bulk diffusion measurements in packed red blood cells. The red cells were packed by centrifugation inside polyethylene tubes; radiolabeled solute was then applied to one end of the tube, and diffusion was allowed to proceed. The bulk diffusion coefficient, or effective diffusivity, in the cell ensemble was determined from the measurement of the distribution of radioactivity along the tube and the application of a one-dimensional diffusion model. The cell membrane permeability was obtained from a development (RRP model) that modeled the concentrated cell suspension as long parallelepipeds (cells) separated by an extracellular phase and packed in a rectangular array. The model was restricted to concentrated cell ensembles. Safford et al. (1978) obtained cell permeabilities for cells from the cat ventricular myocardium on the basis of bulk diffusion coefficients. These were measured by mass transfer data in a Ussing-type diffusion cell in which a thin slice of the tissue was mounted. Safford et al. (1978) developed a diffusion model of the tissue (SBB model), which was represented as long square cells forming a cubic array and separated by extracellular medium. In essence, the SBB model is based on the RRP model except that it is not restricted to concentrated cell ensembles. Furthermore, in the SBB model only square cells are considered. In both the RRP and the SBB models, data for the diffusion coefficients in the extracellular and intracellular phase, in addition to the effective diffusivity in the cell ensemble, are required to calculate the cell membrane permeability.
It is important to recognize that both models are onedimensional in the local or point sense. This means that the point concentration is assumed to depend only on one spatial dimension. Since the geometrical structure of cellular systems is inherently three-dimensional, the one-dimen-
BIOPHYS. J. ©Biophysical Society • 0006-3495/87/11/763/12 $2.00 Volume 52 November 1987 763-774
763

sional simplification is certain to lead to some error. The extent of this error can be deduced by a multi-dimensional theory such as the one presented in this paper. In discussing the difference between one-dimensional models and multidimensional theories, one must keep in mind that experiments are universally arranged to be one-dimensional in the volume-averaged sense. However, one-dimension, volume-averaged experiments cannot necessarily be treated with confidence by models that are one-dimensional in the point sense.
The RRP model has been extensively used to obtain cell membrane permeabilities from diffusion data in concentrated cell suspensions (Garrick and Redwood, 1977; Garrick et aI., 1980, 1982; Garrick and Chinard, 1982; Osberghaus et aI., 1982). Unfortunately, the reported cell membrane permeabilities are incorrect due to an algebraic error made in the RRP model, as will be discussed later.
Recently Ochoa et al. (1986) presented a general theoretical analysis of the problem of diffusion and reaction in cellular media in which membrane resistances can be important. Volume-averaged transport equations were derived and from these separate equations a one-equation model was obtained. A method of closure was developed to determine effective diffusivities on a purely theoretical basis. The method of volume averaging has several advantages over other techniques for investigating multiphase transport phenomena, and the details have been presented by Whitaker (1986). First, the volume-averaged equations contain an attractive degree of generality because they require no specific geometry for their development. In addition, the constraints that a one-equation model must satisfy are readily identified. Finally the method of volume averaging can be used, with uniform rigor, to attack all types of multiphase transport phenomena including diffusion in cellular media.
In this paper, we compare the corrected RRP model and a modified form of the SBB model with the results obtained from the method of volume averaging. The comparison indicates under what conditions the RRP and SBB models can be used with confidence. Cell permeability data obtained from diffusion experiments in concentrated cell ensembles are re-examined in terms of all three models. Finally, the application of the method of volume averaging to other cell ensemble geometries is discussed.
764
GLOSSARY
.AIM interfacial area between the fJ- and u-phases for the total system (m2)
.A~, macroscopic areas of entrances and exits for the fJphase for the total system (m2)
.A.. macroscopic areas of entrances and exits for the u-
phase in the total system (m2) A A ~ A. + A~ sum of areas (m2) A~ area defined by Eq. 28 (m2) A. area defined by Eq. 27 (m2) a dimension of parallelepiped (m)
A~. interfacial area between fJ- and u-phases for the averaging volume (m2)
b dimension of parallelepiped (m) C concentration (mol/m') C~ point concentration in the fJ-phase (mol/m') C. point concentration in the u-phase (mol/m') C~ local spatial deviation concentration for the fJ-phase
(mol/m') C. local spatial deviation concentration for the u-phase
(mol/m') Ic) equilibrium weighted spatial average concentration
(mol/m') ( C~)~ intrinsic phase average concentration for the fJ-phase
(mol/m') ( C.)' intrinsic phase average concentration for the u-phase
(mol/m') :D diffusivity (m2/s) :D~ diffusivity in the fJ-phase (m2/s) :D. diffusivity in the u-phase (m2/s) D,ff effective diffusivity tensor (m2/s) Dxx effective diffusivity in the x-direction (m2/s) D:x dimensionless effective diffusivity in the x-direction E. activation energy (kcal/mol) ;] function that defines interfacial surfaces
F(r, t), G(r, t) functions that specify the boundary conditions at entrances and exits for C~ and C. (mol/m')
F(r), G(r) functions that specify the boundary conditions at entrances and exits for f and g (m)
f vector that maps vic) to C~ (m) Ix x-component of vectorf (m) g vector that maps vic} to C. (m)
g. x-component of vector g (m) I unit tensor
unit vector in the x-direction j unit vector in the y-direction
K function defined by Safford et al. (I978) K", equilibrium distribution coefficient
9.. dimension in parallelepiped model as shown in Fig. 3 (m)
9.b dimension in parallelepiped model as shown in Fig. 3 (m)
9.; lattice vectors n unit normal vector, n ~ n~.
n~. unit outwardly directed normal for the fJ-phase n.~ unit outwardly directed normal for the u-phase P membrane permeability (m/s)
Po end face membrane permeability (m/s) Q function defined by Safford et at. (I978) r position vector (m) t time (s)
V~ volume of the fJ-phase contained within the averaging volume (m')
V. volume of the u-phase contained within the averaging volume (m')
'V averaging volume (m') W function defined by Eq. 33 w width (m)
x, y rectangular, cartesian coordinates (m) X, Y dimensionless, cartesian coordinates
z function defined by Eq. 23 .
Greek Symbols
a. :D./9..p, dimensionless ratio between the permeability of the dispersed phase and the permeability of the membrane
a: :D./ P, ratio between the diffusivity of the dispersed phase and the permeability of the membrane (m)
l' function defined by Eq. 24
BIOPHYSICAL JOURNAL VOLUME 52 1987

Ep volume fraction of JS-phase E. volume fraction of u-phase () geometric factor for the parallelepiped model given by
Eq.31 K :DuKet:t1 :JJp, ratio of permeabilities of the phases IJ. function defined by Eq. 32
"11"0 parameter defined by Eq. 25.
THEORY
Volume Averaging
The governing differential equations and boundary conditions for diffusion in a two-phase medium consisting of cells suspended in a continuous extracellular phase are given by
- ".P . :D.VC. = P(C. - KeqCp), at .Ap•
a~. = V . (:D. VC.), in V.
Cp = F(r, t), at .Ape
C. = G (r, t), at .A ...
(1)
(2)
(3)
(4)
(5)
(6)
The cellular phase is designated as the IT-phase and the extracellular phase is the {1-phase. The local point concentrations in the {1- and IT-phases are denoted by Cp and Cu ,
whereas the macroscopic areas of entrances and exits for the {1- and IT-phases are denoted by .APe and .A ... The interfacial area between the two phases is designated by .Apu and the unit outwardly directed normal for the (1-phase is represented by Dpu. In the flux boundary condition given by Eq. 3 P represents the membrane permeability and Keq is the equilibrium distribution coefficient. It is important to note that this formulation of the diffusion problem is fully three-dimensional and thus is not limited in the manner of the RRP and SBB models.
In the method of volume averaging we associate with every point in space an averaging volume 'V. This volume is used to define average concentration in terms of both Cp
and Cu and in this way the spatial smoothing of Eqs. 1 and 4 is accomplished. The average of Eq. 1 is given by
(7)
The important length scale constraints required in the method of volume averaging have been discussed by Carbonell and Whitaker (1984) and they are easily satisfied for the systems under consideration. The intrinsic phase average concentration is given as
(8)
OCHOA ET AL. Cell Membrane Permeability in Cell Ensembles
Use of the intrinsic phase average concentration, the spatial averaging theorem (Anderson and Jackson, 1967; Marle, 1967; Slatteriy, 1967; Whitaker, 1967), and Gray's decomposition (Gray, 1975) to define the local spatial deviation concentration
(9)
allows us to express Eq. 7 as
The analogous result for Cp is given by
The derivation of these two diffusion equations is not trivial and the details are available in an earlier work by Ochoa et al. (1986). Eqs. 10 and 11 can be combined to yield a one-equation model for diffusion in a two-phase cellular model if we invoke the principle of local mass equilibrium (Whitaker, 1986). The principle of local mass equilibrium allows the diffusion process to be characterized by a single concentration, which is the dependent variable in the one-equation model that replaces Eqs. 10 and 11. The simplification from two equations to one equation is not automatic and there are several constraints that must be satisfied for the one-equation model to be valid. These constraints are given by Ochoa et al. (1986). A key step in the development of the one-equation model is the choice of the dependent variable, which we refer to as the equilibrium weighted spatial average concentration. This concentration is defined as
(12)
and it can be used, along with derived representation for Cp
and Cu , to combine Eqs. 10 and 11 into the one-equation model given by
a{c} - = Deff : vv{c). at (13)
The tensor V V {C} is symmetric so that only the symmetric part of the effective (or bulk) diffusivity tensor contributes to the diffusive flux. The effective diffusivity, Deff , is
765

conveniently expressed as
1 1 1 + 'V A~ "2 (op.f + fop.) dA, (14)
in which the diffusivity ratio K is given as
(15)
The theoretical value of the effective diffusivity tensor is obtained by solving the vector functions f and g for the appropriate cellular medium. The general boundary value problem for f and g is obtained from the closure scheme and can be expressed as (Ochoa et aI., 1986)
yr2f = 0, in Vp (16)
0p •. Vf = KOp • • Vg + (K - l)op., at Ap. (17)
1 - o.p - o.p • yrg = a' (g - f), at Ap. (18) .
yr2g = 0, in V. (19)
f = F(r), at Ape (20)
g = G(r), at Aut' (21)
For diffusion in porous media, one need only solve for f to obtain the effective diffusivity, and the work of Ryan et aI. (1981) on isotropic systems indicates excellent agreement between theory and experiment. In addition to Eqs. 16-21 we require that the average off and g be zero. Eq. 14 can yield the effective diffusivity for any medium if a solution for the vector functions f and g can be obtained for a specific geometry.
The parameter a: is the ratio of the extracellular diffusivity to the membrane permeability. When the membrane has no resistance to mass transport, P equals infinity and a: is zero. Under these circumstances the effective diffusivity and the boundary value problem for f and g reduce to the equations presented by Nozad et aI. (1985). In that case the diffusion process is analogous to the process of heat conduction in a porous medium, and extensive experimental and theoretical results are presented by Nozad et aI. (1985). In the specific case of circular cylinders in a square array the results of Nozad et aI. (1985) are in exact agreement with the method of the "Extended Rayleigh Formulation" (Perrins et aI., 1979), which is claimed to give exact results for that geometry (McKenzie and McPhedran, 1977).
It is important to recognize that Eqs. 16-21 represent an extremely complex boundary value problem because of the boundary conditions given by Eqs. 20 and 21. Use of these boundary conditions requires that the f and g fields be
766
determined over the entire cellular system and if this course of action were required one would be well advised to return to Eqs. 1-6. Arguments have been put forth elsewhere (Ryan et aI., 1981; Carbonell and Whitaker, 1983; Whitaker, 1986), indicating that the boundary value problem for f and g is really a local problem and the boundary conditions given by Eqs. 20 and 21 can be replaced with a periodicity condition given by
f(r + 2;) = f(r), i = 1,2,3
g(r + 2;) = g(r), i = 1,2,3.
(20a)
(21a)
Here ~i represents the three non-unique lattice vectors that are needed to describe a spatially periodic system.
Because of computational limitations, previous theoretical studies have been restricted to very simple geometries such as those used by Ryan et aI. (1981), Nozad et aI. (1985), and Ochoa et aI. (1986). However, it is important to note that simple geometries are not a limitation of the general theory and in Fig. 1, we have presented a spatially periodic representation of the cellular system shown in Fig. 2. This cellular system is a reconstruction of an electron micrograph of the cellular system studied by Redwood et aI. (1974), which will be discussed later in the Results and Discussion section. With sufficient computing power one can determine the effective diffusivity tensor for these complex systems; however, in this work we have restricted our geometrical model to the case of a suspension of parallelepipeds separated by an extracellular phase and arranged rectangularly such as that shown in Fig. 3. It is important to keep in mind that diffusion in the system illustrated in Figs. 1 and 2 can never be represented using one-dimensional point equations; however, this is possible for the system shown in Fig. 3 provided that certain constraints on the structure of the system are satisfied.
0.6
0.4 1 tb
1 0.2
J.O .. x:: 2....
0.0 0.2 0.4 0.6 0.8 1.0 t,
FIGURE 1 Unit cell for spatially periodic medium of packed cells shown in Fig. 2. The figure shows red blood cells in extracellular phase. The geometric parameters 2a and 2b are 15.5 and 11.6 I'm, respectively, as given by Redwood et al. (1974).
BIOPHYSICAL JOURNAL VOLUME 52 1987

FIGURE 2 Modified electron micrograph of packed red blood cells as given by Redwood et al. (1974). See the Results and Discussion for details.
The RRP and SBB Models
Unlike the volume averaging approach, the RRP and SBB models are restricted to one particular geometry and they carry with them the burden of one-dimensional diffusion in the local or point sense. Redwood et aI. (1974) assumed cells to be packed regularly approximating closely spaced, long parallelepipeds (squares for Safford et aI., 1978) as shown in Fig. 3. The cells have a width w perpendicular to the page, where w is much greater than lengths a or b. Redwood et aI. (1974) derived a relation for the effective diffusivity in the x-direction, Dw but a factor of two was omitted in their derivation for the effective diffusivity (see their Eqs. la and 2a along with Fig. 2 a). The correct
b p - phase
FIGURE 3 (a) Model of aligned, long parallelepipeds packed in a regular array. The cellular phase is the u-phase and the extracellular phase is the J3-phase. A membrane encloses each cell. Length scales are geometric parameters of the model. (b) Unit cell of the spatially periodic medium for the parallelepiped model.
OCHOA ET AL. Cell Membrane Permeability in Cell Ensembles
effective diffusivity in the x-direction, Dw is given by
DxxA ~ [1 + (VpAp/ V,A,)] V,A, 1 + z '
(22)
where
[( VpAp) VpAp (~) r z ~ 2 ?To 1 + ~ + -- ~ coth -,A, V,A, 2
(23)
[ (pa) ( V A ) r2
~ ~ 2 Pob ?To 1 + V;A; (24)
Poa (25) ?To~-
V,
A ~ A, + Ap (26)
A, ~ aw (27)
and
Ap ~ (Qb - b)w. (28)
The factor of two that appears in Eq. 24 was included by Safford et aI. (1978) in their derivation. The permeability of the part of the cell membrane orthogonal to the diffusive flux was designated by Po (end face permeability of the cell membrane) to allow it to be different from P (side face permeability). However, in the application of the theory, the ratio Pol P was taken to be equal to one (Redwood et aI., 1974; Garrick and Redwood, 1977; Garrick et aI., 1980, 1982; Garrick and Chinard, 1982; Osberghaus et aI., 1982). In our work we have also considered a single, constant membrane permeability, but the general theory expressed by Eqs. 16-21 is not restricted in this manner.
The ratio of areas, AI Au> in Eq. 22 was given by Redwood et aI. (p. 718,1974) as
(29)
where () was called the tortuosity factor and was defined as the ratio of the extracellular diffusion length to intracellular diffusion length. Redwood et al. (1974) treated () as an empirical parameter, and in Garrick and Redwood (Eq. 2, 1977) it was used as an adjustable parameter to match the effective diffusivity of inulin in packed cells with the diffusivity of inulin in the extracellular phase. The value for the adjustable parameter was then used in all subsequent calculations. Garrick and Redwood (1977) state that () accounts for less regular packing than depicted in Fig. 3 a. Actually () should not be thought of as a tortuosity in the classical sense (Jackson, 1977), but rather a geometrical parameter given in terms of Fig. 3 a as
(J~~ . E, Qb/ b - 1
(30)
While () can be thought of as an adjustable parameter when
767

either ti3' Qb, or b is unknown, it remains inalterably bound to the geometry illustrated in Fig. 3 a and the assumed one-dimensional nature of the diffusion process. If 0 is used to account for irregular packing of the cells, it becomes an empirical parameter of uncertain reliability.
The expression for the effective diffusivity in the xdirection given by Eq. 22 is limited to small volume fractions of the extracellular phase, ti3' Redwood et al. (1974) did not identify the range of ti3 values where Eq. 22 is applicable. Safford et al. (1978) derived the theory for the case where a = band Qa = Qb, i.e., long square-ended parallelepipeds in a cubic arrangement, and their results did not have a constraint of small values ti3' To compare their model to the volume-averaged model and the RRP model, we rederived their model for the parallelepipeds shown in Fig. 3. The result is
(31)
where
(32)
(33)
Here K and Q are identical to the expressions given by Safford et al. (1978) except that in their paper the length scale, L, is given by a in our nomenclature (see our Fig. 3). To extract the original SBB model from Eqs. 31-33, one need only use a = b = Land Qb = Qa = L + La (see their Fig. 4).
RESULTS AND DISCUSSION
The one-equation model given by Eq. 13 and the effective diffusivity given by Eq. 14 can be applied to any specified geometry. The geometry given by Fig. 3 is a spatially periodic medium, and as a consequence the f and g fields need only be solved for a representative unit cell (Whitaker, 1986). The unit cell for the parallelepipeds shown in Fig. 3 a is depicted in Fig. 3 b. If we are only interested in diffusion in the x-direction, the solution for Ix and gx and its subsequent application in Eq. 14 will give the effective diffusivity in the x-direction, Dxx. The boundary value problem for Ix and gx for this unit cell is given in the Appendix and the computed results are used to determine D:x ,
(34)
Figs. 4 and 5 show the variation of the dimensionless effective diffusivity as a function of the diffusivity ratio
768
100 ,........-----,.---y----,--.....---,-y--T"""T"""I
la 11 b=8,a/b=8
Ep = 0.011
a" =:'2>,,1 la P
10-3L ____ ......l ___ J....._....L_..J....--1_J......L-L.....J
0.1 0.2 0.4 0.6 0.8 1.0
FIGURE 4 Dimensionless effective diffusivity in the x-direction as a function of the dimensionless diffusivity ratio times Keq and the ratio of the dispersed phase permeability to the membrane permeability for Ep ~
0.011. Geometric parameters are those given by Redwood et al. (1974).
times the equilibrium distribution coefficient, K, and the ratio of the dispersed phase permeability to the membrane permeability, au, for a given volume fraction of the extracellular phase, ti3' The ratio of the dispersed phase permeability to the membrane permeability is given by
(35)
The results shown in Figs. 4 and 5 have been calculated for volume fractions and geometric parameters identical to those reported by Redwood et al. (1974) and Garrick and Redwood (1977). The two limiting cases for the membrane permeability can be expressed as P = 0 or au = 00, and P =
1.0
0.8 lal1b = 3.78, alb = 4
0.6 Ep = 0.175
au =:2)pilaP
OJ""" 0.4
",,:f b
OJ
c:l~ 0.2
0.1
0.1 0.2 0.4 0.6 0.8 1.0
iC = ~"Keq ~Il
FIGURE 5 Dimensionless effective diffusivity in the x-direction as a function of the dimensionless diffusivity ratio times Keq and the ratio of the dispersed phase permeability to the membrane permeability for Ep ~
0.175. Geometric parameters are those given by Garrick and Redwood (1977).
BIOPHYSICAL JOURNAL VOLUME 52 1987

co or au = O. For the former, the cellular system consists of impermeable cells (to the solute) suspended in the extracellular phase. This type of problem has been treated by Ryan et al. (1981) and Kim et al. (1987). For the latter case of an infinitely permeable membrane, the membrane offers no resistance to mass transfer and this problem was treated by Nozad et al. (1985).
There is a significant influence of au on the dimensionless effective diffusivity. As the cell membrane permeability decreases, the effective diffusivity decreases and reaches an asymptotic limit at each value of ~fJ' The values for D:x at au = co are in exact agreement with the results of Kim et al. (1987). Curves for au = 0 are not shown as the computer results were not convergent for these small values of ~fJ' For this case, the computational procedure of Nozad et al. (1985) can be used. The effective diffusivity is also dependent on the extracellular volume fraction, especially when the membrane has a low permeability.
The equilibrium distribution coefficient between the (J
and /3-phases, Keq, was not included in the models of Redwood and Safford and presumably for cellular media Keq = 1. If this is not the case, the second term in Eqs. la and 1 b of Redwood et al. (1974) must be altered to be consistent with our Eq. 3. In the work of Safford et al. (1978) the change would take place in their Eqs. m.2 and 111.3. The protein concentration in the intracellular phase is usually larger than the extracellular phase. If the equilibrium distribution coefficient is near one, typical values for K will be somewhat smaller than one. As a consequence we have only shown K in the range of 0.1-1.0 in Figs. 4 and 5.
0:,1 =0.229-1>1--""'-e,p
0.2
1. VA 2. Modified SBB 3. Corrected RRP
!jl=0.175
K = 0.3965 a/b=4, R..IR. b =3.778 8 = 1.60
/2 0:,= 0.174 --"""'---=~~.A! __ _
0.1
o o
II II II II
I I I
10
FIGURE 6 Dimensionless effective diffusivity in the x-direction as a function of the ratio of the dispersed phase permeability for ~p ~ 0.175. Comparison of theoretical models; VA is the volume-averaged model. For other models see text. Geometric parameters are those given by Garrick and Redwood (l977).
OCHOA ET AL. Cell Membrane Permeability in Cell Ensembles
FIGURE 7 Comparison between the method of volume averaging and the RRP model.
Both D:x and K are obtained from experimental measurements and it is advantageous to replot the theoretical results in the form as shown in Fig. 6. In addition to the results from the method of volume averaging, the corrected RRP model and the modified SBB model are shown. The plot corresponds to the diffusion of tritiated water in a medium of endothelial and epithelial rabbit lung cells (Garrick and Redwood, 1977). For a measured value of D:x the value of au can be obtained directly from the graph. As shown, the experimental value of D:x was found to be 0.229 and K was equal to 0.397. In that case the volumeaveraged model yields au = 2.21. The modified SBB model gives a value that is 11.9% higher and the corrected RRP model gives a value that is 5% lower.
For values of au less than one, the agreement between
100
70 --v A model i _. - Safford et. al. .
I 50 i 1(=0.5
a .I. a
20 b =T =4.0
b CX a
10
7 0.55
5
2
o 0.2 0.4 0.6 0.8 1.0
FIGURE 8 Comparison between the method of volume averaging and the SBB model.
769

TABLE I
DIMENSIONLESS RATIO OF CELLULAR PERMEABILITY TO MEMBRANE PERMEABILITY FOR SOLUTES DIFFUSING IN DOG RED BLOOD CELLS*
Solute
Tritiated water (THO) Formamide Acetamide Propianamide
Extracellular phase volume
fraction Ep
0.011 0.0166 0.0109 0.0113
Experiment
Dimensionless Diffusivity
effective ratio
diffusivity K
D:x
0.173 0.650 0.0601 0.697 0.0223 0.573 0.0278 0.520
Theory
Modified Corrected VA SBB RRP
a. a. %Dev a. %Dev
2.06 2.16 4.6 2.14 3.7 14.1 14.4 2.1 14.1 0.0 45.3 45.8 1.1 45.3 0.0 29.1 29.4 1.2 29.1 0.0
*Geometric parameters given by Redwood et al. (1974) are: alb ~ 8, 9.al9.b ~ 8, a ~ 8.5 !Lm, 0 ~ 2.01. The percentage difference between the volume-averaged model (VA) and the other models is indicated by %Dev.
the method of volume averaging and the corrected RRP model is quite good; however, the reader should be warned that the original RRP model gives poor agreement with our work and its usage should be avoided. For smaller values of D:x the calculated value of au illustrates larger differences for the three models. For example, if D:x = 0.174 the corrected RRP model predicts a value of au that is 7% smaller than the method of volume averaging and the SBB model predicts a value that is 21 % higher. These differences are not large and they suggest that the simpler models can be used to estimate membrane permeabilities provided that au is less than five and that the continuous phase volume fraction is sufficiently small, i.e., ~{3 ::5 0.18. This is further illustrated in Fig. 7 where we have presented a more extensive comparison between our work and the corrected RRP model. The comparison is made with the idea that the measured values of D:x , ~{3, and K would be used to determine the membrane permeability in terms of au. From those results one can see that the corrected RRP model can be used with confidence provided ~{3 < 0.2 and au < 2.0. We can also see from the results in Fig. 7 that the corrected RRP model gives very poor results when ~{3 > 0.3 and au > 5.0. In Fig. 8 we have compared our work with the modified SBB model and
there we see generally better agreement; however, one would not want to use the modified SBB model to predict au when ~{3 > 0.3 and au > 5.0.
In considering the comparisons shown in Figs. 6-8, one must keep in mind that all the results are based on the geometrical model shown in Fig. 3. This is a severe limitation of all of the theoretical studies, and a detailed analysis of the system illustrated in Figs. 1 and 2 using our method remains as a worthwhile objective.
The corrected RRP model is compared with the other models in Tables I and II. The tables represent experimental data from Redwood et al. (1974) and Garrick and Redwood (1977). All the geometric parameters in Tables I and II, which are consistent with Fig. 3, were obtained from values given or calculated from the published results. The corrected RRP model compares well with the volumeaveraged model. Differences vary from 4% to ~10%. The corrected RRP model is particularly good at very low volume fractions of the extracellular phase. The modified SSB model varies from 1 to 18% from the volume-averaged results. Similar calculations can be done for the data reported by Garrick et al. (1980, 1982) and Garrick and Chinard (1982). Instead of giving additional comparisons for au, we tabulate the membrane permeabilities as calcu-
TABLE II
DIMENSIONLESS RATIO OF CELLULAR PERMEABILITY TO MEMBRANE PERMEABILITY FOR SOLUTES DIFFUSING IN RABBIT LUNG CELLS*
Solute
Tritiated water (THO) Methanol Ethanol Propanol Hexanol
Extracellular phase \olume
fraction Ep
0.175 0.175 0.175 0.175 0.175
Experiment
Dimensionless Diffusivity
effective ratio
diffusivity K
D:x
0.229 0.397 0.289 0.369 0.252 0.441 0.297 0.441 0.588 0.616
Theory
Modified Corrected VA SBB RRP
a. a. %Dev a. %Dev
2.21 2.48 11.9 2.08 -5.8 0.846 0.962 13.7 0.793 -6.3 1.55 1.74 12.4 1.47 -5.5 1.10 1.24 12.3 1.05 -4.7 0.108 0.127 17.9 0.0996 -10.3
*Geometric parameters given by Garrick and Redwood (1977) are: alb ~ 4, 9.al9.b ~ 3.78, 9.a ~ 10.7 !Lm, a ~ 10.0 !Lm, 0 ~ 1.60. Percentage difference between the volume-averaged model (VA) and the other models is indicated by %Dev.
770 BIOPHYSICAL JOURNAL VOLUME 52 1987
•
TABLE III
CELL MEMBRANE PERMEABILITIES AT T ~ 20°C
Solute
THO Formamide Acetamide Propianamide THO Methanol Ethanol Propanol Hexanol
Cell membrane
DogRBC DogRBC DogRBC DogRBC Rabbit lung Rabbit lung Rabbit lung Rabbit lung Rabbit lung
*Redwood et al. (1974). *Garrick and Redwood (1977).
a.(VA) £.
Ilm 2.06 8.55
14.1 8.57 45.3 8.55 29.1 8.55
2.21 10.7 0.846 10.7 1.55 10.7 1.10 10.7 0.108 10.7
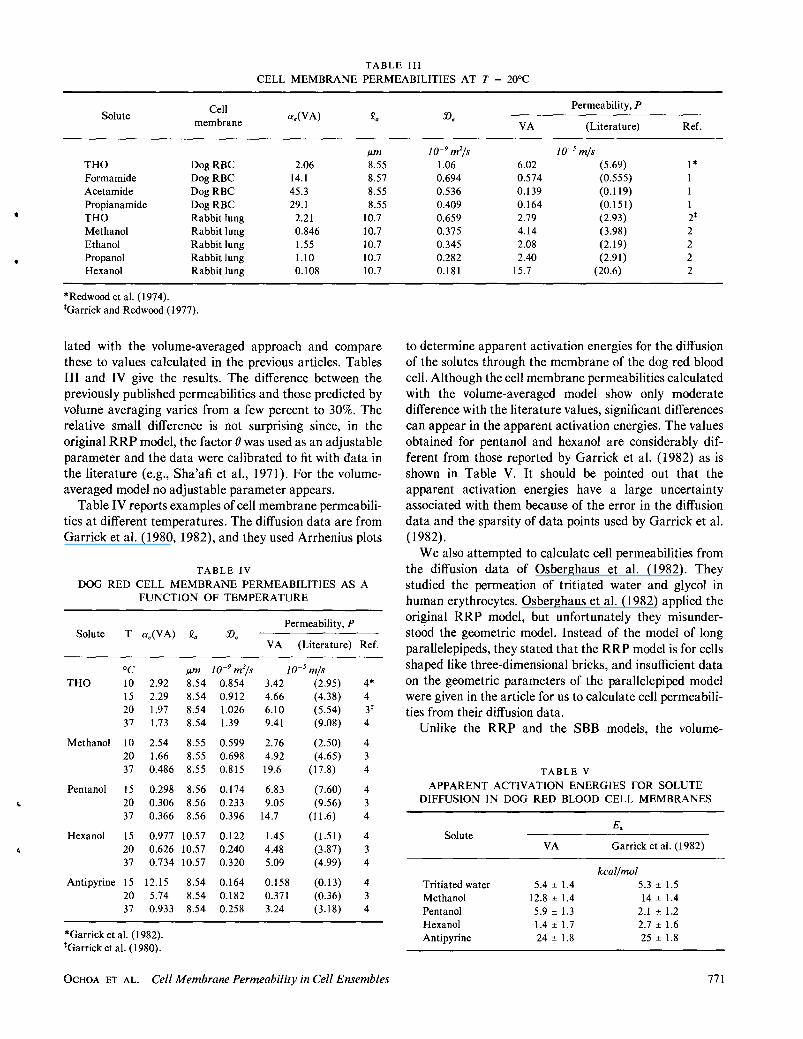
lated with the volume-averaged approach and compare these to values calculated in the previous articles. Tables III and IV give the results. The difference between the previously published permeabilities and those predicted by volume averaging varies from a few percent to 30%. The relative small difference is not surprising since, in the original RRP model, the factor 8 was used as an adjustable parameter and the data were calibrated to fit with data in the literature (e.g., Sha'afi et aI., 1971). For the volumeaveraged model no adjustable parameter appears.
Table IV reports examples of cell membrane permeabilities at different temperatures. The diffusion data are from Garrick et al. (1980, 1982), and they used Arrhenius plots
TABLE IV
DOG RED CELL MEMBRANE PERMEABILITIES AS A FUNCTION OF TEMPERATURE
Permeability, P Solute T a.(VA) £. :D.
VA (Literature) Ref.
°C Ilm 10-9 m2/s 10-5 m/s THO 10 2.92 8.54 0.854 3.42 (2.95) 4*
15 2.29 8.54 0.912 4.66 (4.38) 4 20 1.97 8.54 1.026 6.10 (5.54) 3* 37 1.73 8.54 1.39 9.41 (9.08) 4
Methanol 10 2.54 8.55 0.599 2.76 (2.50) 4 20 1.66 8.55 0.698 4.92 (4.65) 3 37 0.486 8.55 0.815 19.6 (17.8) 4
Pentanol 15 0.298 8.56 0.174 6.83 (7.60) 4 20 0.306 8.56 0.233 9.05 (9.56) 3 37 0.366 8.56 0.396 14.7 (11.6) 4
Hexanol 15 0.977 10.57 0.122 1.45 (1.51) 4 20 0.626 10.57 0.240 4.48 (3.87) 3 37 0.734 10.57 0.320 5.09 (4.99) 4
Antipyrine 15 12.15 8.54 0.164 0.158 (0.13) 4 20 5.74 8.54 0.182 0.371 (0.36) 3 37 0.933 8.54 0.258 3.24 (3.18) 4
*Garrick et al. (1982). *Garrick et al. (1980).
OCHOA ET AL. Cell Membrane Permeability in Cell Ensembles
Permeability, P :D.
VA (Literature) Ref.
10-9 m2/s 10-5 m/s 1.06 6.02 (5.69) 1* 0.694 0.574 (0.555) 1 0.536 0.139 (0.119) 1 0.409 0.164 (0.151) 1 0.659 2.79 (2.93) 2* 0.375 4.14 (3.98) 2 0.345 2.08 (2.19) 2 0.282 2.40 (2.91) 2 0.181 15.7 (20.6) 2
to determine apparent activation energies for the diffusion of the solutes through the membrane of the dog red blood cell. Although the cell membrane permeabilities calculated with the volume-averaged model show only moderate difference with the literature values, significant differences can appear in the apparent activation energies. The values obtained for pentanol and hexanol are considerably different from those reported by Garrick et al. (1982) as is shown in Table V. It should be pointed out that the apparent activation energies have a large uncertainty associated with them because of the error in the diffusion data and the sparsity of data points used by Garrick et al. (1982).
We also attempted to calculate cell permeabilities from the diffusion data of Osberghaus et al. (1982). They studied the permeation of tritiated water and glycol in human erythrocytes. Osberghaus et al. (1982) applied the original RRP model, but unfortunately they misunderstood the geometric model. Instead of the model of long parallelepipeds, they stated that the RRP model is for cells shaped like three-dimensional bricks, and insufficient data on the geometric parameters of the parallelepiped model were given in the article for us to calculate cell permeabilities from their diffusion data.
Unlike the RRP and the SBB models, the volume-
TABLE v APPARENT ACTIVATION ENERGIES FOR SOLUTE
DIFFUSION IN DOG RED BLOOD CELL MEMBRANES
Solute
Tritiated water Methanol Pentanol Hexanol Antipyrine
E.
VA Garrick et al. (1982)
5.4 ± 1.4 12.8 ± 1.4 5.9 ± 1.3 1.4 ± 1.7 24 ± 1.8
kcal/mol 5.3 ± 1.5 14 ± 1.4
2.1 ± 1.2 2.7 ± 1.6 25 ± 1.8
771

averaged model can be applied to other geometries. We have investigated the effect of staggering the cells on the effective diffusivity. Fig. 9 shows a medium of parallelepipeds in a fully staggered array. The term "fully staggered" refers to the maximum possible displacement of cells in one column relative to cells in a neighboring column. The problem of diffusion in a medium with staggered parallelepipeds using the volume-averaged approach has been studied by Kim et al. (1987). Their study involved completely impermeable parallelepipeds in a continuum. We have used their computational program to study the effect of staggering and the aspect ratio. The results are shown in Table VI for geometric parameters consistent with those reported by Redwood and Garrick (1977). When the aspect ratio for the cell, aj b, is greater than 2, there is no significant effect on the dimensionless effective diffusivity for either aligned or fully staggered cells. The results are true only for impermeable cells and consequently are identical for au = 00.
One might assume that the results obtained in Table VI for the aspect ratio are also applicable to permeable cells. Fig. 10 indicates that the variation of the aspect ratio gives significant change in the D:x versus au plots when au increases. The modified RRP and SBB models also give results similar to those predicted by the volume-averaged model shown in Fig. 10. The conclusion to be drawn from this figure is obvious, i.e., the cell membrane permeabilities are very sensitive to the geometric parameters. Likewise, if another morphology of the concentrated suspension is chosen, one would expect that the calculated membrane permeabilities may be different.
Redwood et al. (1974) have given an electron micro-
a .. ': ....... : .. . . " .. ' . . ' . .... ',.:' .. :.
b
FIGURE 9 (a) Model offully staggered, long parallelepipeds packed in a regular array. (b) Unit cell of the spatially periodic medium for the fully staggered parallelepiped model.
772
TABLE VI
EFFECT OF CELL STAGGERING ON THE EFFECTIVE DIMENSIONLESS DIFFUSIVITY FOR E~ ~ 0.175, K ~ 0
Aspect Aspect Dix D:x ratio ratio Aligned Fully alb 9..19.b cells * staggered*
1 0.945 0.118 0.076 2 1.89 0.119 0.114 4 3.78 0.123 0.122 8 7.56 0.123 0.122
The aspect ratio, 9..19.b, was calculated for ,~ ~ 0.175,9.. - a ~ 0.7 /Lm,
and 9.. ~ 10.0 /Lm. *Fig. 1. *Fig.4.
graph of packed red cells from slices of the diffusion tubes containing the cells. They suggested that upon centrifugation of the red cells in the diffusion tubes, a preferred orientation of the cells occurs in the direction of the centrifugal field, and their geometric parameters for the parallelepipeds model, shown in Fig. 3, were obtained from the electron micrograph. Fig. 2 shows a reconstruction of their electron micrograph with some key modifications. The modifications are that the shape of each red blood cell is depicted by a set of straight lines and the arrangement of red blood cells is such that a unit cell can be identified as
0.4
0.3
0.2
0.1
ii = 0.397
Ell = 0.175
10
FIGURE 10 Effect of geometric aspect ratios and the ratio of the dispersed phase permeability to the membrane permeability on the dimensionless effective diffusivity in the x-direction. Results calculated with the volume-averaged model. The modified RRP and SSB models predict a similar dependency.
BIOPHYSICAL JOURNAL VOLUME 52 1987

•
shown in Fig. 1. Solutions of the f and g fields for this complex unit cell can be obtained to generate the effective diffusivity tensor. We have not attempted to solve the fields for this case since it is based on a single electron micrograph. It seems reasonable that a true two-dimensional geometrical representation of packed red blood cells should be represented by a statistical average of a large number of electron micrographs. However, we do outline the procedure of specifying the boundary value problem for the unit cell given in Fig. 1. The details of the procedure are given in the Appendix.
The advantage inherent in the volume-averaged model is that if the micromorphology can be described, the method is exact and the problem reduces to the appropriate solution of the boundary value problem for f and g. The RRP and SBB models are restricted to the model of long parallelepipeds. The problem of correctly describing the microgeometries of complex ht;terogeneous systems has been recognized and has become an important area of research (Whitaker, 1986). An advanced understanding of transport phenomena in heterogeneous systems can only come if scientific protocols are designed that can fully describe mathematically the micromorphologies in three dimensions and when techniques like volume averaging are applied.
APPENDIX I
To set up the boundary value problem for the functions f and g, one must first choose a unit cell that represents the structure of the cellular system under consideration. This procedure specifies the boundary between the dispersed phase particles and the extracellular phase. The position of the boundary can be expressed as
;;(X, Y) ~ 0, (AI)
where X and Yare the local coordinates associated with the unit cell. The governing equations for f and g are given by
V2g ~ 0, in the dispersed phase (A2)
V2f = 0, in the extracellular phase. (A3)
From Eq. Alone can find the unit normal vectors, which are used in Eqs. 17 and 18, by the formula
. (a;;) . (a;;) I ax + J ay
(A4)
If some symmetry axis can be found for the unit cell, it is worthwhile to use this condition to develop symmetry and skew-symmetry conditions for f and g. This allows one to reduce the computational domain and avoid the use of periodicity conditions for f and g, which are given by
f(X ± I, Y) ~ f(X, Y)
g(X ± I, Y) ~ g(X, Y)
f(X, Y ± Qb/Q.) ~ f(X, Y)
g(X, Y ± Qb/Q.) ~ g(X, V).
(AS)
(A6)
(A7)
(AS)
OCHOA ET AL. Cell Membrane Permeability in Cell Ensembles
When applicable, the symmetry and skew-symmetry conditions not only reduce the computational domain, but they also give rise to a much more rapid convergence. Examples are given in Ryan et al. (1981), Nozad et al. (1985), and Ochoa (1987).
To determine Dxx for the system shown in Fig. 3, we need only calculate fx and gx· The boundary value problem for fx and gx is given by
(A9)
a2gx a2gx . --2 + --2 ~ 0, In V. ax ay
(AW)
alx _ agx _ a b b - ~ K - + (K - 1) at x ~ ± - , - -::s; y::s; - (Alia) ax ax 2 2 2
alx _agx b a a -=K-aty~+- --<x<- (Allb) ay ay - 2 ' 2 - - 2
agx I a b b - I - ax ~ a: (gx - Ix) at x = ± 2:' - 2:::S; y::s; 2: (AI2a)
It is sufficient to solve for one-quarter of the unit cell, and the symmetry conditions for fx and gx can be expressed as (Nozad et aI., 1985)
and the skew-symmetry conditions as
Ix ~ 0 at x ~ 0, Q./2
gx ~ 0 at x ~ O.
(Al3)
(AI4)
(AIS)
(AI6)
The boundary value problem for fx and gx was solved numerically using a five-point block finite difference scheme. Because we considered problems where ~~ was small and aspect ratios for the cell were of the order of four, it was necessary to use a much smaller grid size in the extracellular space than in the intracellular phase.
An ISML software subroutine (program LEQTlB from ISML, Inc., Houston, TX) was used as a direct solver to find the solution for the pentadiagonal system of linear equations resulting from the discretization in the full domain. Details of the discretized partial difference equations and boundary conditions are given by Ochoa (1987) .
A problem arises with the interfacial boundary conditions given by Eqs. All and AI2 at the corner point x = Y2 a and y = Y2 b. The problem was avoided by using either Eqs. Alia and AI2a or Eqs. Allb and A12b. The particular choice of the boundary conditions at the corner point was found to be unimportant when the grid size was decreased because the same effective diffusivity was then obtained (Ochoa, 1987).
This work was supported by a grant from the National Science Foundation (CBT-85 13956). J. Alberto Ochoa acknowledges support from the Consejo Nacional de Ciencia y Tecnologia (CONACYT) of the Mexican Government.
Received for publication 2 September 1986 and in final form 27 July 1987.
REFERENCES
Anderson, T. B., and R. Jackson. 1967. A fluid mechanical description of fluidized beds. Ind. Eng. Chem. Fundam. 6:527-538.
773

Barton, T. C., and D. A. J. Brown. 1964. Water permeability to the fetal erythrocyte. J. Gen. Physiol. 47:839-849.
Brahm, J. 1983. Permeability of human red cells to a homologous series of aliphatic alcohols. Limitations of the continuous flow-tube method. J. Gen. Physiol. 81:283-304.
Carbonell, R. G., and S. Whitaker. 1984. Heat and mass transport in porous media. In Mechanics of Fluids in Porous Media. J. Bear and Y. Carapcioglu, editors. Martinus Nijhoff, Brussels. 121-198.
Conlon, T., and R. Outhred. 1972. Water diffusion permeability of erythrocytes using an NMR technique. Biochim. Biophys. Acta. 288:354-361.
Conlon, T., and R. Outhred. 1978. The temperature dependence of erythrocyte water diffusion permeability. Biochim. Biophys. Acta. 511:408-418.
Crapiste, G. H., S. Whitaker, and E. Rotstein. 1984. Fundamentals of drying foodstuffs. Proc. Inti. Drying Symp., 4th. R. Toei and A. S. Majumdar, editors. Kyoto, Japan.
Garrick, R. A., and F. P. Chinard. 1982. Membrane permeability of isolated lung cells to nonelectrolytes at different temperatures. Am. J. Physiol. 243:C285-C292.
Garrick, R. A., B. C. Patel, and F. P. Chinard. 1982. Erythrocyte permeability to lipophilic solutes changes with temperature. Am. J. Physiol. 242:C74-C80.
Garrick, R. A., B. C. Patel, and F. P. Chinard. 1980. Permeability of dog erythrocytes to lipophilic molecules: solubility and volume effects. Am. J. Physiol. 238:CI07-CI13.
Garrick, R. A., and W. R. Redwood. 1977. Membrane permeability of isolated lung cells to nonelectrolytes. Am. J. Physiol. 233:CI04-CIIO.
Gray, W. G. 1975. A derivation of the equations for multiphase transport. Chem. Eng. Sci. 30:229-233.
Jackson, R. 1977. Transport in Porous Catalysts. Elsevier Publishing Co., New York.
Kim, J.-H., J. A. Ochoa, and S. Whitaker. 1987. Diffusion in anisotropic media. Transport in Porous Media. In press.
Marie, C. M. 1967. Ecoulements monophasiques en milieu poreux. Rev. Inst. Francais du Petrole. 22:1471-1509.
McKenzie, D. R., and R. C. McPhedran. 1977. Exact modeling of cubic lattice permittivity and conductivity. Nature (Lond.). 265:128-129.
Nozad, I., R. G. Carbonell, and S. Whitaker. 1985. Heat conduction in multi phase systems-I. Theory and experiment for two-phase systems. Chem. Eng. Sci. 40:843-855.
774
Ochoa, J. A. 1987. Ph.D. Thesis. Department of Chemical Engineering. University of California, Davis.
Ochoa, J. A., P. Stroeve, and S. Whitaker. 1986. Diffusion and reaction in cellular media. Chem. Eng. Sci. 41:2999-3013.
Osberghaus, U., H. Schonert, and B. Deuticke. 1982. A simple technique of measuring high membrane permeabilities of human erythrocytes. J. Membr. Bioi. 68:29-35.
Paganelli, C. V., and A. K. Solomon. 1957. The rate of exchange of tritiated water across the human red cell membrane. J. Gen. Physiol. 41:259-277.
Perrins, W. T., D. R. McKenzie, and R. C. McPhedran. 1979. Transport properties of regular arrays of cylinders. Proc. R. Soc. Lond. A. Math. Phys. Sci. A369:207-225.
Redwood, W. R., E. Rail, and W. Perl. 1974. Red cell membrane permeability deduced from bulk diffusion coefficients. J. Gen. Physiol. 64:706-729.
Ryan, D., R. G. Carbonell, and S. Whitaker. 1981. A theory of diffusion and reaction in porous media. AIChE (Am. Inst. Chemical Eng.) Symp. Ser. Symp. Ser. P. Stroeve and W. J. Ward, editors. No. 202. 77:46-62.
Safford, R. E., E. A. Bassingthwaighte, and J. B. Bassingthwaighte. 1978. Diffusion of water in cat ventricular myocardium. J. Gen. Physiol.72:513-538.
Sha'afi, R. I., G. T. Rich, D. C. Mikulecky, and A. K. Solomon. 1970. Determination of urea permeability in red cells by minimum method. J. Gen. Physiol. 58:259-266.
Sha'afi, R. I., C. M. Gary-Bobo, and A. K. Solomon. 1971. Permeability of red blood cell membranes to small hydrophilic and lipophilic solutes. J. Gen. Physiol. 58:238-258.
Sidel, V. W., and A. K. Solomon. 1957. Entrance of water into human red cell under an osmotic pressure gradient. J. Gen. Physiol. 41 :243-257.
Slattery, J. C. 1967. Flow of viscoelastic fluids through porous media. AIChE (Am. Inst. Chemical Eng.) J. 13:1066-1071.
Vieira, F. L., R. I. Sha 'afi, and A. K. Solomon. 1970. The state of water in human and dog red cell membranes. J. Gen. Physiol. 451-466.
Whitaker, S. 1986. Transport processes with heterogeneous reaction. In Concepts and Design of Chemical Reactors. A. E. Cassano and S. Whitaker, editors. Gordon and Breach, New York. 1-94.
Whitaker, S. 1967. Diffusion and dispersion in porous media. AIChE (Am. Inst. Chemical Eng.) J. 13:420-426.
BIOPHYSICAL JOURNAL VOLUME 52 1987
')
i.