Effects of individual and combinatorial electrolyte solutions ...
Upload
independentCategory
view
1download
0
arX
iv:1
005.
2857
v1 [
cond
-mat
.mtr
l-sci
] 17
May
201
0
Molecular Dynamics simulations of concentrated aqueous electrolyte solutions
Carles Calero∗ and Jordi FaraudoInstitut de Ciencia de Materials de Barcelona (ICMAB-CSIC), Campus de la UAB, E-08193 Bellaterra, Spain
Marcel Aguilella-ArzoBiophysics Group, Department of Physics, Universitat Jaume I, 12080 Castello, Spain.
(Dated: May 18, 2010)
Transport properties of concentrated electrolytes have been analyzed using classical molecular dynamics sim-ulations with the algorithms and parameters typical of simulations describing complex electrokinetic phenom-ena. The electrical conductivity and transport numbers of electrolytes containing monovalent (KCl), divalent(MgCl2), a mixture of both (KCl + MgCl2), and trivalent (LaCl3) cations have been obtained from simulationsof the electrolytes in electric fields of different magnitude. The results obtained for different simulation parame-ters have been discussed and compared with experimental measurements of our own and from the literature. Theelectroosmotic flow of water molecules induced by the ionic current in the different cases has been calculatedand interpreted with the help of the hydration properties extracted from the simulations.
I. INTRODUCTION
Understanding the transport properties of electrolytes inaqueous solution is important in a wide range of electrokineticphenomena such as streaming current experiments1, ionictransport in biological and syntetic nanochannels2,3 or col-loidal electrophoresis4,5.
Traditionally, electrokinetic and ionic transport phenomenahave been described using primitive models in which the sol-vent is approximated as a continuum of dielectric constantǫ.Although such models provide an accurate description of awide variety of phenomena, they fail for cases in which thediscrete nature of the solvent plays a fundamental role, or todescribe phenomena related to specific hydration of ions.
An alternative theoretical approach to understand elec-trokinetic phenomena which circumvents the limitations ofprimitive models is the use of molecular dynamics simula-tions of ions in explicit solvent. Due to recent improve-ments in algorithms and computer power, all-atom moleculardynamics simulatios studies of electrokinetic phenomena insome realistic systems are now possible6,7. From such atom-istic descriptions, one can elucidate the microscopic mech-anisms responsible for macroscopic measurable phenomena.For example, Aksimentiev and Schulten studied at atomicdetail the permeation of individual ions through the trans-membrane channelα-Hemolysin with the help of molecu-lar dynamics simulations6. This approach has also been em-ployed to understand from a microscopic perspective the elec-trophoresis of DNA immersed in multivalent ionic solutionswhen an external electric field is applied8, the transport ofmonovalent and divalent ions through polymeric and silicananopores9,10, and the ionic selectivity of the OmpF porin bi-ological nanochannel11.
The realistic atomic description of such electrokinetic phe-nomena involves complex systems containing large number ofparticles. To be able to cope with such systems using molec-ular dynamics simulations, the use of algorithms which en-hance the computer performance are required. A moleculardynamics simulation package which has been proven to bevery successful in the description of biological moleculesand
elecrokinetic phenomena is NAMD212. To accelerate the cal-culations of such large systems, in NAMD2 the temperatureT of the system is controlled by using the Langevin thermo-stat instead of the more rigorous but much more computation-ally demanding Nose-Hoover thermostat. Also to speed upthe simulations, NAMD2 is usually employed with a multipletime step: a basic timestep for short range interactions andalonger one for the evaluation of k-space contribution to thelong range electrostatic forces in the PME technique.
In this paper we study, under different conditions, the trans-port properties obtained from Molecular Dynamics simula-tions of electrolyte solutions using the same algorithms andconditions employed in simulations of complex systems. Inparticular, we focus our analysis on the transport proper-ties of a monovalent electrolyte (KCl), a divalent electrolyte(MgCl2), the mixture of both (KCl+ MgCl2) and a trivalentelectrolyte (LaCl3) when an external electric field is applied.While the use of the KCl electrolyte is standard in moleculardynamics studies and its transport properties have been brieflyanalyzed from this perspective before6, the reliability of suchsimulations methods in dealing with transport properties ofmultivalent electrolytes have not been tested in detail in spiteof the rich phenomenology that they originate1,2,13,14and theiruse in the simulation of electrokinetic phenomena involvingdivalent and trivalent ions8,15–17.
II. METHODS
A. Simulation Methods
We have studied the transport properties of different elec-trolytes by performing molecular dynamics simulations underexternal electric fields of different magnitudes. The systemsconsidered were ionic solutions of KCl, MgCl2, a mixture ofKCl and MgCl2, and LaCl3, see Table I. To study the effect ofthe system size on the ionic transport properties of bulk elec-trolytes extracted from molecular dynamics simulations, twocubic simulation boxes of different size were used,L ≃ 4nmandL ≃ 8nm.
2
All simulations have been carried out with the moleculardynamics simulation package NAMD212, since it is widelyemployed in the simulation of biological macromolecules.Water was described using the TIP3P water model as imple-mented by the CHARMM force field. The ions were mod-eled as charged Lennard-Jones particles with parameters givenby the CHARMM force field for K+, Mg2+ and for Cl−,while the Lennard-Jones parameters for La3+ were taken fromRef.18.
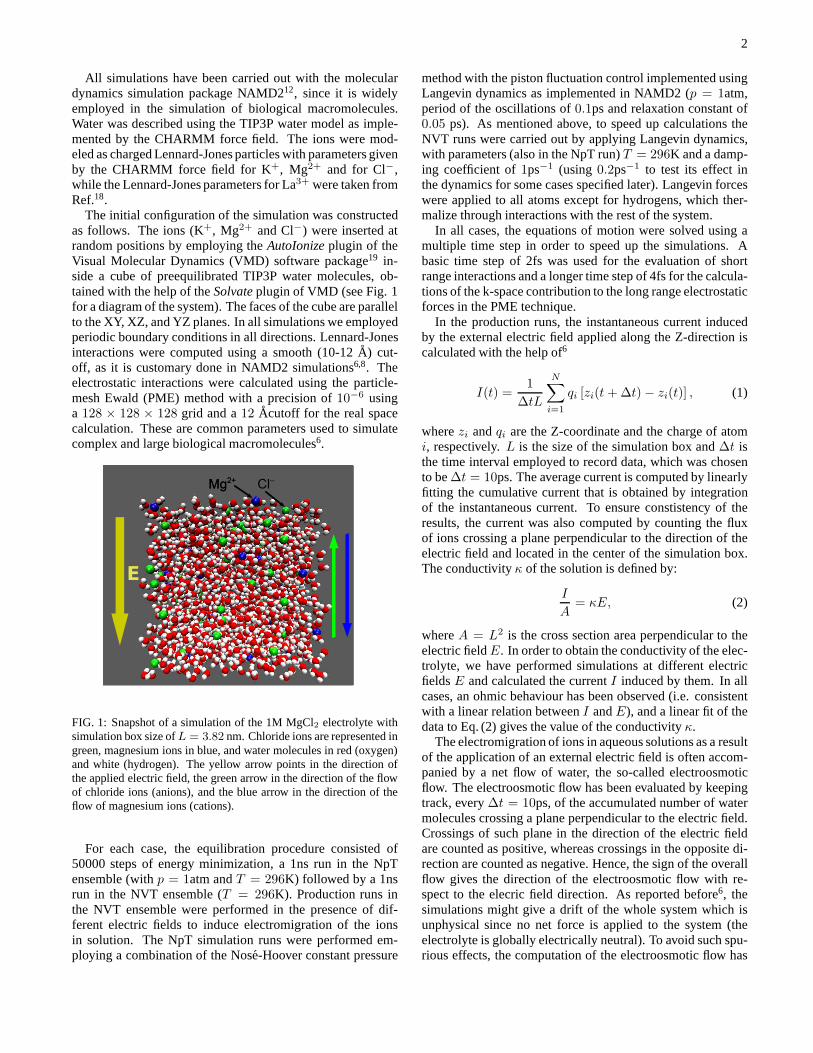
The initial configuration of the simulation was constructedas follows. The ions (K+, Mg2+ and Cl−) were inserted atrandom positions by employing theAutoIonizeplugin of theVisual Molecular Dynamics (VMD) software package19 in-side a cube of preequilibrated TIP3P water molecules, ob-tained with the help of theSolvateplugin of VMD (see Fig. 1for a diagram of the system). The faces of the cube are parallelto the XY, XZ, and YZ planes. In all simulations we employedperiodic boundary conditions in all directions. Lennard-Jonesinteractions were computed using a smooth (10-12A) cut-off, as it is customary done in NAMD2 simulations6,8. Theelectrostatic interactions were calculated using the particle-mesh Ewald (PME) method with a precision of10−6 usinga 128 × 128 × 128 grid and a12 Acutoff for the real spacecalculation. These are common parameters used to simulatecomplex and large biological macromolecules6.
FIG. 1: Snapshot of a simulation of the 1M MgCl2 electrolyte withsimulation box size ofL = 3.82 nm. Chloride ions are represented ingreen, magnesium ions in blue, and water molecules in red (oxygen)and white (hydrogen). The yellow arrow points in the direction ofthe applied electric field, the green arrow in the direction of the flowof chloride ions (anions), and the blue arrow in the direction of theflow of magnesium ions (cations).
For each case, the equilibration procedure consisted of50000 steps of energy minimization, a 1ns run in the NpTensemble (withp = 1atm andT = 296K) followed by a 1nsrun in the NVT ensemble (T = 296K). Production runs inthe NVT ensemble were performed in the presence of dif-ferent electric fields to induce electromigration of the ionsin solution. The NpT simulation runs were performed em-ploying a combination of the Nose-Hoover constant pressure
method with the piston fluctuation control implemented usingLangevin dynamics as implemented in NAMD2 (p = 1atm,period of the oscillations of0.1ps and relaxation constant of0.05 ps). As mentioned above, to speed up calculations theNVT runs were carried out by applying Langevin dynamics,with parameters (also in the NpT run)T = 296K and a damp-ing coefficient of1ps−1 (using 0.2ps−1 to test its effect inthe dynamics for some cases specified later). Langevin forceswere applied to all atoms except for hydrogens, which ther-malize through interactions with the rest of the system.
In all cases, the equations of motion were solved using amultiple time step in order to speed up the simulations. Abasic time step of 2fs was used for the evaluation of shortrange interactions and a longer time step of 4fs for the calcula-tions of the k-space contribution to the long range electrostaticforces in the PME technique.
In the production runs, the instantaneous current inducedby the external electric field applied along the Z-directioniscalculated with the help of6
I(t) =1
∆tL
N∑
i=1
qi [zi(t+∆t)− zi(t)] , (1)
wherezi andqi are the Z-coordinate and the charge of atomi, respectively.L is the size of the simulation box and∆t isthe time interval employed to record data, which was chosento be∆t = 10ps. The average current is computed by linearlyfitting the cumulative current that is obtained by integrationof the instantaneous current. To ensure constistency of theresults, the current was also computed by counting the fluxof ions crossing a plane perpendicular to the direction of theelectric field and located in the center of the simulation box.The conductivityκ of the solution is defined by:
I
A= κE, (2)
whereA = L2 is the cross section area perpendicular to theelectric fieldE. In order to obtain the conductivity of the elec-trolyte, we have performed simulations at different electricfieldsE and calculated the currentI induced by them. In allcases, an ohmic behaviour has been observed (i.e. consistentwith a linear relation betweenI andE), and a linear fit of thedata to Eq. (2) gives the value of the conductivityκ.
The electromigration of ions in aqueous solutions as a resultof the application of an external electric field is often accom-panied by a net flow of water, the so-called electroosmoticflow. The electroosmotic flow has been evaluated by keepingtrack, every∆t = 10ps, of the accumulated number of watermolecules crossing a plane perpendicular to the electric field.Crossings of such plane in the direction of the electric fieldare counted as positive, whereas crossings in the opposite di-rection are counted as negative. Hence, the sign of the overallflow gives the direction of the electroosmotic flow with re-spect to the elecric field direction. As reported before6, thesimulations might give a drift of the whole system which isunphysical since no net force is applied to the system (theelectrolyte is globally electrically neutral). To avoid such spu-rious effects, the computation of the electroosmotic flow has

3
TABLE I: Simulation parameters for the simulations performed of the different electrolytes: cubic box edge length (L),damping constantof the Langevin thermostat (τLan), number of K+ ions, number of Mg2+ ions, number of La3+ ions, number of Cl− ions, number of watermolecules, simulation time, external electric field applied, and potential difference between the edges of the cubic box along the direction ofthe electric field.
Electrolyte L (nm) τLan (ps−1) Num. Num. Num. Num. Num. Simulation Electric ∆V (mV)
K+ Mg2+ La3+ Cl− H2O time (ns) field (mV/nm)
1M KCl 3.88 1.0 37 0 0 37 1907 21.0 14.2 55
3.88 1.0 37 0 0 37 1907 9.0 26.0 109
3.88 1.0 37 0 0 37 1907 9.0 43.3 168
3.88 1.0 37 0 0 37 1907 9.0 86.6 336
7.82 1.0 306 0 0 306 15774 9.0 14.2 111
7.82 1.0 306 0 0 306 15774 9.0 26.0 203
7.82 1.0 306 0 0 306 15774 9.0 43.3 339
7.82 1.0 306 0 0 306 15774 9.0 86.6 677
1M MgCl2 3.82 1.0 0 37 0 74 1870 9.0 14.2 54
3.82 1.0 0 37 0 74 1870 9.0 26.0 99
3.82 1.0 0 37 0 74 1870 9.0 43.3 165
3.82 1.0 0 37 0 74 1870 9.0 86.6 331
7.73 1.0 0 306 0 612 15468 9.0 14.2 110
7.73 1.0 0 306 0 612 15468 9.0 26.0 201
7.73 1.0 0 306 0 612 15468 9.0 43.3 335
7.73 1.0 0 306 0 612 15468 9.0 86.6 669
7.73 0.2 0 306 0 612 15468 9.0 14.2 110
7.73 0.2 0 306 0 612 15468 9.0 26.0 201
7.73 0.2 0 306 0 612 15468 9.0 43.3 335
7.73 0.2 0 306 0 612 15468 9.0 86.6 669
0.11M MgCl2 7.83 1.0 0 31 0 62 16293 9.0 43.3 339
0.33M MgCl2 7.80 1.0 0 93 0 186 16107 9.0 43.3 338
0.54M MgCl2 7.79 1.0 0 155 0 310 15921 9.0 43.3 337
1M MgCl2 7.72 1.0 306 306 0 918 14856 9.0 14.2 110
+ 1MKCl 7.72 1.0 306 306 0 918 14856 9.0 26.0 201
7.72 1.0 306 306 0 918 14856 9.0 43.3 334
7.72 1.0 306 306 0 918 14856 9.0 86.6 668
1M LaCl3 7.71 1.0 0 0 308 924 15154 13.19 14.2 110
7.71 1.0 0 0 308 924 15154 10.87 26.0 201
7.71 1.0 0 0 308 924 15154 10.12 43.3 334
7.71 1.0 0 0 308 924 15154 10.52 86.6 668
been done in the frame of reference of the center of mass ofthe whole system.
The electric current flowing in an electrolyte solution iscaused by the motion of anions and cations moving in oppo-site directions under the applied field. The fraction of the totalcurrent induced by each ion type defines its transport number,which is in general a function of the electrolyte concentration.The fraction of electrical current carried by cations defines thecationic transport number, t+, and the fraction of the electricalcurrent carried by anions the anionic transport number, t−. Acompletely equivalent quantity to transport numbers is thera-tio of the current induced by anions (anionic current) over thecurrent induced by cations (cationic current), which will bebe refered as the ratio of currents throughout the paper. Dueto the global electroneutrality of the system, the total electric
current flowing through an electrolyte as a result of the appli-cation of an external electric field is independent of the frameof reference in which it is measured. The ratio of currents andtransport numbers, however, are frame dependent, and theircomputation must be done carefully. A proper account of thecontribution to the total current from every ion in electrolytesolutions is important to describe phenomena in other morecomplex systems in which not only the total electric currentbut also the flow of each type of ion is relevant (e.g. in thestudy of the selectivity of ionic channels). Experimentally, therelevant frame of reference in which data of transport num-bers and ratio of currents is provided is the frame of referenceof the moving fluid. Therefore, to facilitate the comparisonwith experimental values, transport numbers and ratio of cur-rents will be given in the frame of reference comoving with
4
the fluid.
B. Conductivity measurements
The electrolyte conductivity measurements were performedusing a MeterLab CDM210 (R) conductivity meter, Radiome-ter Analytical SAS (France). The solutions were prepared us-ing water from a Water Purification System Millipore Sim-plicity 185. Magnesium Chloride 6-hydrated (MgCl2) andPotassium Chloride (KCl) from Panreac in all cases followingACS specifications. Weighting of the compounds were donewith a Mettler Toledo AB104-S, in the quantities necessary toachieve a 1M concentration. The conductivity measurementincluded a stirring of the solution with a magnetic stirrer andheater JPSelecta Agimatic-E, with temperature monitoringus-ing a laboratory thermometer at 296.0 K.
III. RESULTS
A. A test case: Transport properties of 1M KCl
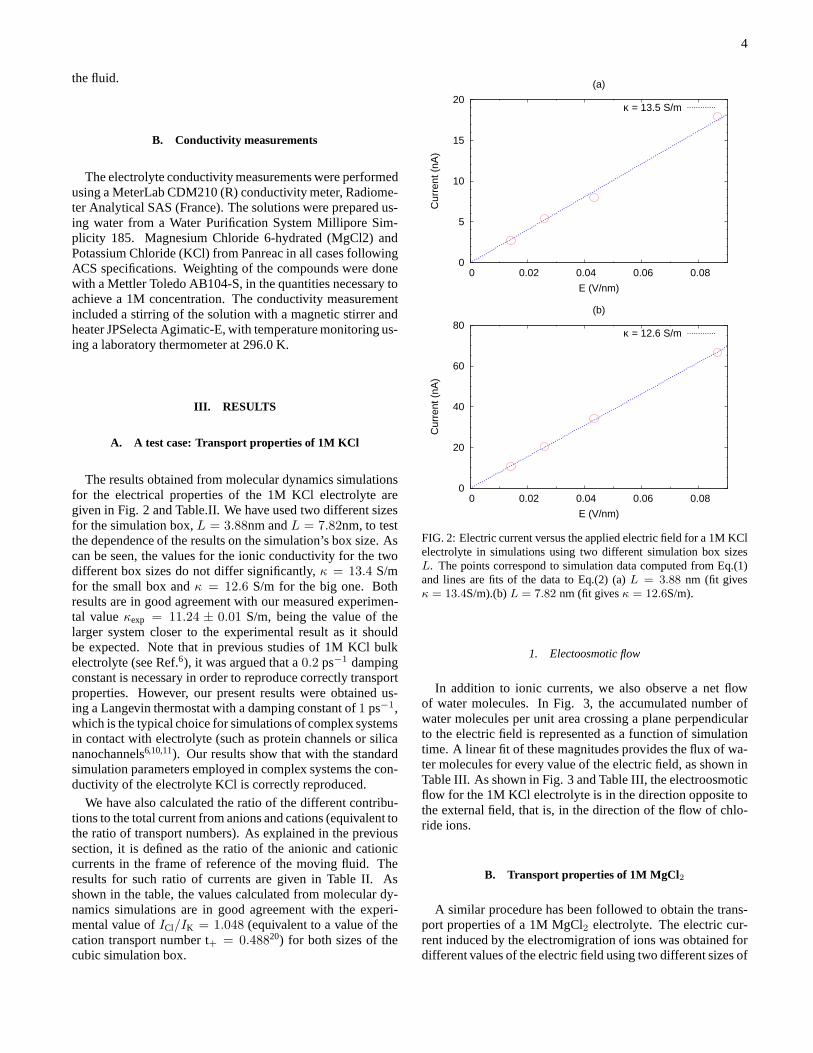
The results obtained from molecular dynamics simulationsfor the electrical properties of the 1M KCl electrolyte aregiven in Fig. 2 and Table.II. We have used two different sizesfor the simulation box,L = 3.88nm andL = 7.82nm, to testthe dependence of the results on the simulation’s box size. Ascan be seen, the values for the ionic conductivity for the twodifferent box sizes do not differ significantly,κ = 13.4 S/mfor the small box andκ = 12.6 S/m for the big one. Bothresults are in good agreement with our measured experimen-tal valueκexp = 11.24 ± 0.01 S/m, being the value of thelarger system closer to the experimental result as it shouldbe expected. Note that in previous studies of 1M KCl bulkelectrolyte (see Ref.6), it was argued that a0.2 ps−1 dampingconstant is necessary in order to reproduce correctly transportproperties. However, our present results were obtained us-ing a Langevin thermostat with a damping constant of1 ps−1,which is the typical choice for simulations of complex systemsin contact with electrolyte (such as protein channels or silicananochannels6,10,11). Our results show that with the standardsimulation parameters employed in complex systems the con-ductivity of the electrolyte KCl is correctly reproduced.
We have also calculated the ratio of the different contribu-tions to the total current from anions and cations (equivalent tothe ratio of transport numbers). As explained in the previoussection, it is defined as the ratio of the anionic and cationiccurrents in the frame of reference of the moving fluid. Theresults for such ratio of currents are given in Table II. Asshown in the table, the values calculated from molecular dy-namics simulations are in good agreement with the experi-mental value ofICl/IK = 1.048 (equivalent to a value of thecation transport number t+ = 0.48820) for both sizes of thecubic simulation box.
0
5
10
15
20
0 0.02 0.04 0.06 0.08
Cur
rent
(nA
)
E (V/nm)
(a)
κ = 13.5 S/m
0
20
40
60
80
0 0.02 0.04 0.06 0.08
Cur
rent
(nA
)
E (V/nm)
(b)
κ = 12.6 S/m
FIG. 2: Electric current versus the applied electric field for a 1M KClelectrolyte in simulations using two different simulationbox sizesL. The points correspond to simulation data computed from Eq.(1)and lines are fits of the data to Eq.(2) (a)L = 3.88 nm (fit givesκ = 13.4S/m).(b)L = 7.82 nm (fit givesκ = 12.6S/m).
1. Electoosmotic flow
In addition to ionic currents, we also observe a net flowof water molecules. In Fig. 3, the accumulated number ofwater molecules per unit area crossing a plane perpendicularto the electric field is represented as a function of simulationtime. A linear fit of these magnitudes provides the flux of wa-ter molecules for every value of the electric field, as shown inTable III. As shown in Fig. 3 and Table III, the electroosmoticflow for the 1M KCl electrolyte is in the direction opposite tothe external field, that is, in the direction of the flow of chlo-ride ions.
B. Transport properties of 1M MgCl2
A similar procedure has been followed to obtain the trans-port properties of a 1M MgCl2 electrolyte. The electric cur-rent induced by the electromigration of ions was obtained fordifferent values of the electric field using two different sizes of

5
TABLE II: Ionic contributions to the total current, ratio ofthe anioniccurrent over the cationic current and cationic transport numbers fordifferent values of the applied electric field in the case of a1M KClelectrolyte. All these quantities are calculated in the frame of refer-ence of the moving fluid.
System SizeElectric field (mV/nm)ICl (nA) IK (nA) ICl/IK t+
L = 3.88 nm
14.2 1.43 1.39 1.03 0.49
25.98 2.80 2.59 1.08 0.48
43.3 4.28 3.83 1.12 0.47
86.6 8.42 8.22 1.02 0.49
L = 7.82 nm
14.2 5.49 5.14 1.07 0.48
25.98 10.35 10.11 1.02 0.49
43.3 17.02 17.16 1.00 0.50
86.6 33.57 33.17 1.01 0.49
-7
-6
-5
-4
-3
-2
-1
0
1
2
3
4
5
0 1 2 3 4 5 6 7 8 9
Cro
ssin
g w
ater
mol
ecul
es/n
m2
Simulation time (ns)
E = 0.0142 V/nmE = 0.02598 V/nm
E = 0.0433 V/nmE = 0.0866 V/nm
FIG. 3: Accumulated number of water molecules per unit area cross-ing a plane perpendicular to the applied electric field versus simula-tion time for the 1M KCl electrolyte. Different lines represent theflow of water for different values of the electric field.
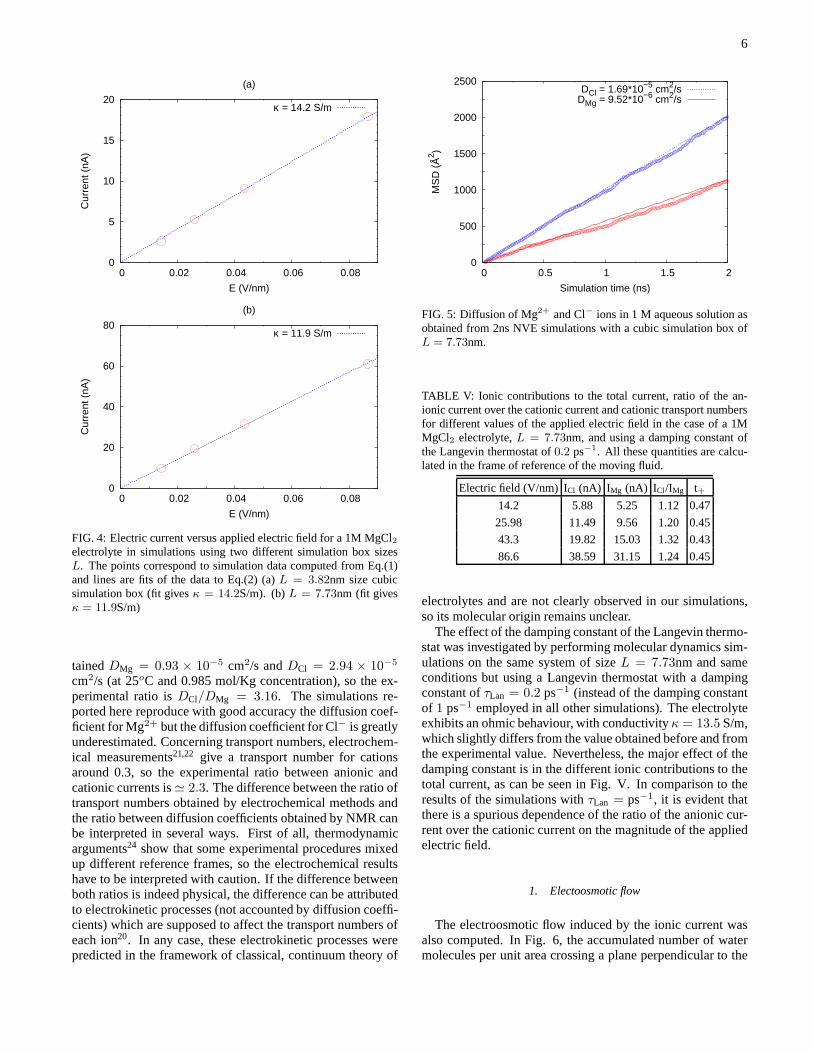
a cubic simulation box,L = 3.82 nm andL = 7.73 nm. Theresults of the simulations are given in Figs. 4 and Table IV.The values for the ionic conductivity of the two different boxsizes do not differ significantly, beingκ = 14.2 S/m for thesmall box andκ = 11.9 S/m for the big one. Both resultsagree well with experimental values, being the result fromthe larger simulation box much more accurate. Accordingto Phang and Stokes21, κexp = 11.4 S/m at [MgCl2]=0.9674M and T = 298.15K. A recent critical review22 providesa sligthly larger value ofκexp = 11.6 S/m at [MgCl2]=1M and T = 25oC. Our own measurements give a value ofκexp = 11.92 S/m.
The ratio between the different contributions of anions andcations to the total current has been evaluated. The resultsforsuch ratio of currents are given in Table IV. These results em-phasize the need for using a large enough simulation box. Thevalues for the ratio of currents and transport numbers obtainedfor the cubic simulation box of sizeL = 3.82nm exhibit a spu-rious dependence on the applied electric field. For the largersimulation box, the results are not field dependent, as should
TABLE III: Flux of water molecules for the different electrolytes anddifferent values of the external electric field.
Electrolyte Electric field (mV/nm)Water flux (nm−2ns−1)
1M KCl 14.2 0.12± 0.13
26.0 -0.13± 0.04
43.3 -0.43± 0.14
86.6 -0.64± 0.07
1M MgCl2 14.2 0.76± 0.04
26.0 1.47± 0.05
43.3 2.30± 0.14
86.6 5.11± 0.09
1M KCl + 1M MgCl2 14.2 0.43± 0.15
26.0 0.88± 0.06
43.3 1.31± 0.07
86.6 2.82± 0.23
1M LaCl3 14.2 -0.25± 0.11
26.0 -0.28± 0.25
43.3 -0.33± 0.08
86.6 -0.89± 0.24
TABLE IV: Ionic contributions to the total current, ratio ofthe an-ionic current over the cationic current and cationic transport numbersfor different values of the applied electric field in the caseof a 1MMgCl2 electrolyte. All these quantities are calculated in the frame ofreference of the moving fluid.
System Electric ICl (nA) IMg (nA) ICl/IMg t+Size field (mV/nm)
L = 3.82 nm
14.2 1.60 0.72 2.23 0.31
25.98 3.09 2.22 1.39 0.42
43.3 5.63 3.56 1.58 0.39
86.6 10.52 7.42 1.42 0.41
L = 7.73 nm
14.2 5.69 4.13 1.38 0.42
25.98 11.31 8.24 1.37 0.42
43.3 18.05 13.66 1.32 0.43
86.6 35.06 26.30 1.33 0.43
be expected. Such results show that the anionic contribution tothe current is significantly larger than the cationic contribution(being a factor of 1.4 between them). In our simulations thesedifferences in the anionic and cationic contributions to the cur-rent can be attributed, to a large extent, to differences in dif-fusion coefficients between both ions. In order to disentanglethe diffusional and correlation contributions to the transportnumber, we have evaluated the translational diffusion coeffi-cient of each ion by computing the mean square displacementof each ion in a 2ns long NVE simulation run with no exter-nal field applied. The results ofDMg = 0.95 × 10⁻⁵ cm2/sandDCl = 1.69 × 10⁻⁵ cm2/s for the diffusion coefficientsof Mg2+ and Cl−, respectively, lead to a ratio between thediffusion coefficients ofDCl/DMg = 1.8.
Experimentally, both diffusion coefficients and transportnumbers can be obtained, so we can compare both simulationresults with experimental data. Using NMR, Struis et al.23 ob-
6
0
5
10
15
20
0 0.02 0.04 0.06 0.08
Cur
rent
(nA
)
E (V/nm)
(a)
κ = 14.2 S/m
0
20
40
60
80
0 0.02 0.04 0.06 0.08
Cur
rent
(nA
)
E (V/nm)
(b)
κ = 11.9 S/m
FIG. 4: Electric current versus applied electric field for a 1M MgCl2electrolyte in simulations using two different simulationbox sizesL. The points correspond to simulation data computed from Eq.(1)and lines are fits of the data to Eq.(2) (a)L = 3.82nm size cubicsimulation box (fit givesκ = 14.2S/m). (b)L = 7.73nm (fit givesκ = 11.9S/m)
tainedDMg = 0.93 × 10⁻⁵ cm2/s andDCl = 2.94 × 10⁻⁵
cm2/s (at 25oC and 0.985 mol/Kg concentration), so the ex-perimental ratio isDCl/DMg = 3.16. The simulations re-ported here reproduce with good accuracy the diffusion coef-ficient for Mg2+ but the diffusion coefficient for Cl− is greatlyunderestimated. Concerning transport numbers, electrochem-ical measurements21,22 give a transport number for cationsaround 0.3, so the experimental ratio between anionic andcationic currents is≃ 2.3. The difference between the ratio oftransport numbers obtained by electrochemical methods andthe ratio between diffusion coefficients obtained by NMR canbe interpreted in several ways. First of all, thermodynamicarguments24 show that some experimental procedures mixedup different reference frames, so the electrochemical resultshave to be interpreted with caution. If the difference betweenboth ratios is indeed physical, the difference can be attributedto electrokinetic processes (not accounted by diffusion coeffi-cients) which are supposed to affect the transport numbers ofeach ion20. In any case, these electrokinetic processes werepredicted in the framework of classical, continuum theory of
0
500
1000
1500
2000
2500
0 0.5 1 1.5 2
MS
D (
Å2 )
Simulation time (ns)
DCl = 1.69*10−5 cm2/sDMg = 9.52*10−6 cm2/s
FIG. 5: Diffusion of Mg2+ and Cl− ions in 1 M aqueous solution asobtained from 2ns NVE simulations with a cubic simulation box ofL = 7.73nm.
TABLE V: Ionic contributions to the total current, ratio of the an-ionic current over the cationic current and cationic transport numbersfor different values of the applied electric field in the caseof a 1MMgCl2 electrolyte,L = 7.73nm, and using a damping constant ofthe Langevin thermostat of0.2 ps−1. All these quantities are calcu-lated in the frame of reference of the moving fluid.
Electric field (V/nm) ICl (nA) IMg (nA) ICl/IMg t+14.2 5.88 5.25 1.12 0.47
25.98 11.49 9.56 1.20 0.45
43.3 19.82 15.03 1.32 0.43
86.6 38.59 31.15 1.24 0.45
electrolytes and are not clearly observed in our simulations,so its molecular origin remains unclear.
The effect of the damping constant of the Langevin thermo-stat was investigated by performing molecular dynamics sim-ulations on the same system of sizeL = 7.73nm and sameconditions but using a Langevin thermostat with a dampingconstant ofτLan = 0.2 ps−1 (instead of the damping constantof 1 ps−1 employed in all other simulations). The electrolyteexhibits an ohmic behaviour, with conductivityκ = 13.5 S/m,which slightly differs from the value obtained before and fromthe experimental value. Nevertheless, the major effect of thedamping constant is in the different ionic contributions tothetotal current, as can be seen in Fig. V. In comparison to theresults of the simulations withτLan = ps−1, it is evident thatthere is a spurious dependence of the ratio of the anionic cur-rent over the cationic current on the magnitude of the appliedelectric field.
1. Electoosmotic flow
The electroosmotic flow induced by the ionic current wasalso computed. In Fig. 6, the accumulated number of watermolecules per unit area crossing a plane perpendicular to the

7
TABLE VI: Hydration of the different ions
Number of attached H2O
Electrolyte Ion Hydration τ = 10 ps τ = 100 ps τ = 1000 ps
1M KClK+ 6.4 1.88 0.070 0.0012
Cl− 7.3 2.41 0.11 0.0033
1M MgCl2Mg2+ 6.0 5.41 5.35 5.31
Cl− 7.3 2.99 0.19 0.005
1M KCl & 1M MgCl 2Mg2+ 6.0 5.33 5.22 5.13
K+ 6.9 1.95 0.11 0.003
Cl− 7.0 3.04 0.25 0.009
1M LaCl3La3+ 8.4 6.98 4.65 0.27
Cl− 6.9 3.50 0.35 0.009
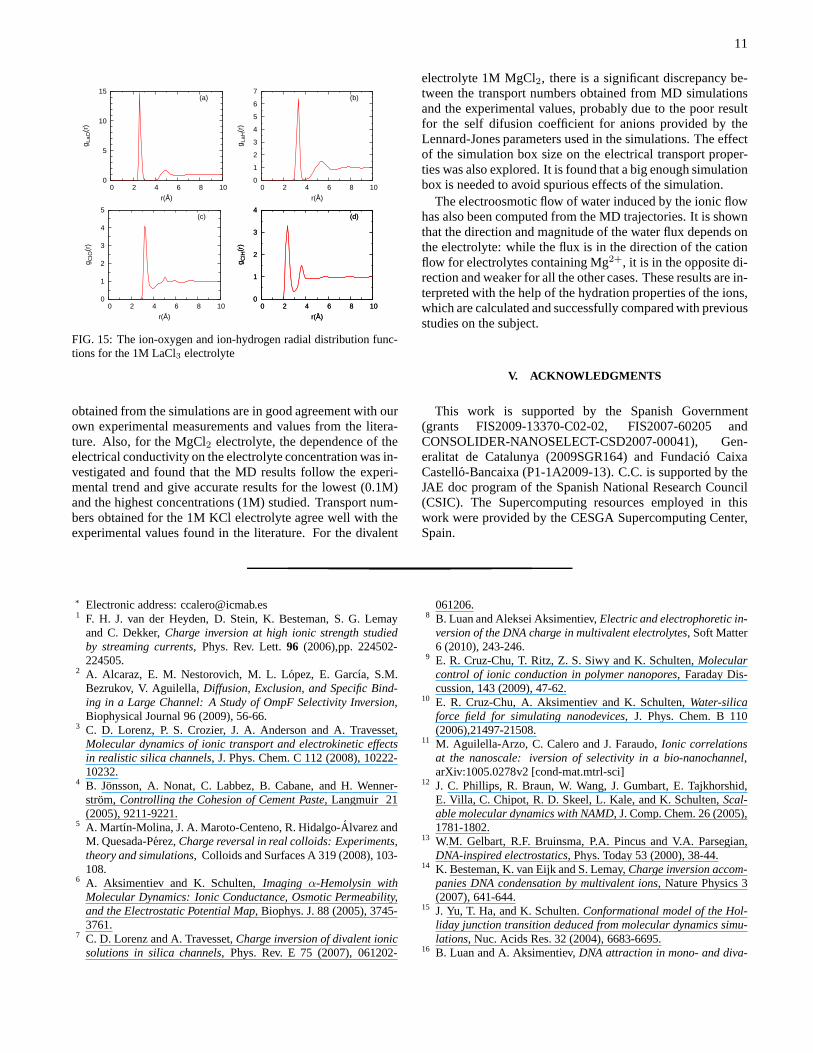
electric field is represented as a function of simulation time.The flux of water molecules for each electric field is given inTable III. It is interesting to note the different directionandmagnitude of the water flow obtained for 1M KCl and for 1MMgCl2 electrolytes. Indeed, while in the presence of 1M KClthe direction of the net flow of water is opposite to the di-rection of the electric field, in the presence of 1M MgCl2 thenet flow of water goes in the direction of the applied field.The magnitude of the net flow of water also differs signifi-cantly in both cases, being much larger (almost an order ofmagnitude) for the 1M MgCl2 electrolyte. These differencescan be understood from the hydration properties of the ionsinvolved. For each ion, we have computed its hydration, i.e.,the average number of water molecules in its first coordinationshell (as defined by the first minimum of the radial distribu-tion function, see Figs. 7 and 8). We have also computedthe average number of water molecules which have remaineda timeτ in the first coordination shell of each ion to test therobustness of the hydration layer, see Table VI. The valuesgiven in Table VI do not show any dependence on the valueof the electric field applied in the simulations. The reportedresults for the hydration values of the different ions agreewithresults from previous molecular dynamics studies25–27and Abinitio calculations28. The results for the average number ofwater molecules that spend a timeτ in the first coordinationshell of the different ions are also in agreement with previ-ous computational studies, in which residence times of watermolecules in the first coordination shell of the order of∼ 10pswere obtained for K+ and Cl− and of the order of∼ 10nsfor Mg2+. Such difference in the robustness of the hydrationlayer of Mg2+ and the other ions is a broadly accepted fact,established by ab initio and DFT calculations28,29 as well asby NMR, Raman spectroscopy, and X-ray adsorption spec-troscopy experiments23,30,31.
Hence, from the analysis of the hydration properties of theions it is possible to understand the difference in the electroos-motic flow between the 1M KCl and 1M MgCl2 electrolytes.For the 1M KCl electrolyte, the anionic current is slightlygreater than the cationic current and the hydration of Cl− ishigher than that of K+ so it exhibits a net electroosmotic flowin the direction of the flow of Cl−. For the 1M MgCl2 elec-trolyte, although the current of Cl− is greater than the current
of Mg2+, the latter ion is much more effective dragging watermolecules (its hydration layer is much more robust over time)so the net electroosmotic flow is in the direction of the flow ofMg2+ along the applied electric field.
0
10
20
30
40
50
0 1 2 3 4 5 6 7 8 9
Cro
ssin
g w
ater
mol
ecul
es/n
m2
Simulation time (ns)
E = 0.0142 V/nmE = 0.02598 V/nm
E = 0.0433 V/nmE = 0.0866 V/nm
FIG. 6: Accumulated number of water molecules per unit area cross-ing a plane perpendicular to the applied electric field versus simula-tion time for the 1M MgCl2 electrolyte. Different lines represent theflow of water for different values of the electric field.

8
0
1
2
3
4
5
0 2 4 6 8 10
g KO
(r)
r(Å)
(a)
0
1
2
3
0 2 4 6 8 10
g KH
(r)
r(Å)
(b)
0
1
2
3
4
0 2 4 6 8 10
g ClO
(r)
r(Å)
(c)
0
1
2
3
4
0 2 4 6 8 10
g ClH
(r)
r(Å)
(d)
0
1
2
3
4
0 2 4 6 8 10
g ClH
(r)
r(Å)
(d)
FIG. 7: The ion-oxygen and ion-hydrogen radial distribution func-tions for the 1M KCl electrolyte
0
5
10
15
20
0 2 4 6 8 10
g MgO
(r)
r(Å)
(a)
0
1
2
3
4
5
6
7
0 2 4 6 8 10
g MgH
(r)
r(Å)
(b)
0
1
2
3
4
5
0 2 4 6 8 10
g ClO
(r)
r(Å)
(c)
0
1
2
3
4
0 2 4 6 8 10
g ClH
(r)
r(Å)
(d)
0
1
2
3
4
0 2 4 6 8 10
g ClH
(r)
r(Å)
(d)
FIG. 8: The ion-oxygen and ion-hydrogen radial distribution func-tions for the 1M MgCl2 electrolyte
2. Concentration dependence of transport properties of MgCl2
For the MgCl2 electrolyte we have also tested the depen-dency of the conduction properties of the electrolyte on itsconcentration,c. We have performed simulations at differ-ent concentrations of MgCl2 for a fixed value of the appliedelectric fieldE = 0.0433V/nm in a cubic simulation box ofsideL ≃ 8nm (see Table I for precise values). The summaryof the results are given in Table VII and Figures 9 and 10.Here, for each value of the electrolyte concentration the con-ductivity has been obtained from a single point(I, E), underthe assumption that the electrolyte exhibits an ohmic behavior(suggested by the studies at 1M concentration, see Fig. 4).As expected, the electrical conductivity,κ, of the MgCl2 so-lution increases with increasing concentration, as can be seen
TABLE VII: Total current, electrical conductivity, ionic contribu-tions to the total current, ratio of the anionic current overthe cationiccurrent and cationic transport numbers for different values of the con-centration of the MgCl2 electrolyte.
c(M) Itot (nA) κ(S/m) IMg (nA) ICl (nA) Ian/Icat t+0.1 8.0 3.01 4.0 4.0 1.00 0.5
0.3 19.97 7.55 9.42 10.54 1.12 0.47
0.5 28.79 10.97 12.90 15.88 1.23 0.45
1.0 31.70 12.25 13.66 18.05 1.32 0.43
in Table VII and Fig. 9. In Fig. 9, the conductivity of theelectrolyte obtained from molecular dynamics simulationsforeach concentration is compared with experimental results21
and the Kohlrausch’s limiting law. The results obtained fromMD simulations reproduce well the dependency of the elec-trolyte conductivity on the concentration, as compared to theexperimental tendency. Besides, the absolute values of theex-perimental and simulated conductivities agree well with eachother, especially for high and low salt conditions. In Fig. 9we represent the ratio of the anionic current over the cationiccurrent as a function of the MgCl2 concentration. The resultsfrom MD simulations indicate that the contribution of the an-ions becomes more prominent with increasing concentrationof electrolyte. This tendency agrees with the experimentalbe-haviour for2 : 1 electrolytes20.
0
5
10
15
20
0 0.2 0.4 0.6 0.8 1 1.2
κ (S
/m)
c(M)
Molecular DynamicsExperimental
Limiting Kohlrausch law
FIG. 9: Electric conductivity of a MgCl2 electrolyte versus its saltconcentration for an electric fieldE = 43.3mV/nm. Blue dots repre-sent results obtained from MD simulations, red crosses experimentaldata21, and the green dashed line is Kohlrausch’s limiting law20.
C. Transport properties of mixture composed of 1M KCl and1M MgCl2
We have also studied the transport properties of an elec-trolyte composed of 1M KCl and 1M MgCl2. The addition ofmonovalent ions to a system immersed in a multivalent elec-trolyte is sometimes used experimentally to screen the elec-tric charge of the multivalent ions1. This effect is also used

9
0.9
1
1.1
1.2
1.3
1.4
1.5
0 0.2 0.4 0.6 0.8 1
Ian/
Icat
Concentration (M)
FIG. 10: Ratio of the contribution to the electric current ofa MgCl2electrolyte by anions and cations versus its bulk concentration whenan electric fieldE = 43.3mV/nm is applied.
in experiment and simulations to determine whether electro-static correlations are responsible for a certain macroscopiceffect11,32,33.
The analysis is similar to the analysis done for the previ-ous electrolytes. The electric currents caused by the driftofions have been obtained for four different values of the ap-plied electric field. In this case, a single cubic box of sizeL = 7.72 nm was employed. The results for the conductivityare summarized in Fig. 11, which results in a value for theconductivityκ = 14.8 S/m. Our own experimental measure-ments giveκ = 16.83± 0.01 S/m. The different contributionto the total current of the different ions, as well as the cationictransport number are given in Table VIII for every value of theapplied electric field.
0
20
40
60
80
0 0.02 0.04 0.06 0.08
Cur
rent
(nA
)
E (V/nm)
κ = 14.8 S/m
FIG. 11: MD results for the electric current versus applied electricfield for an electrolyte composed of 1M KCl and 1M MgCl2 in acubic simulation box ofL = 7.72nm. The points correspond tosimulation data computed from Eq.(1) and lines are fits of thedata toEq.(2) (fit givesκ = 14.8S/m)
TABLE VIII: Ionic contributions to the total current, ratioof the an-ionic current over the cationic current and cationic transport numbersfor different values of the applied electric field in the caseof an elec-trolyte composed by 1M MgCl2 and 1M KCl. All these quantitiesare calculated in the frame of reference of the moving fluid.
Electric field (V/nm) ICl(nA) IK(nA) IMg(nA) Ian/Icat t+14.2 7.6 3.27 2.04 1.43 0.41
25.98 18.14 5.12 4.98 1.30 0.43
43.3 21.69 9.29 7.89 1.26 0.44
86.6 43.36 17.11 15.59 1.32 0.43
1. Electroosmotic flow
The results for the net flow of water induced by the ioniccurrent are given in Fig. 12, in which the accumulated numberof water molecules per unit area crossing a plane perpendicu-lar to the electric field is represented as a function of simula-tion time. The flux of water molecules for each electric fieldis given in Table III. Similarly to the case of the 1M MgCl2
electrolyte, the net electroosmotic flow is in the directionofthe flow of cations, in spite of being smaller than the net flowof anions (see Table VIII). We interpret this result along thesame lines as with the case of 1M MgCl2 electrolyte. As itis shown in Table VI, the hydration layer of Mg2+ is muchmore robust than the hydration of Cl− and K+, so the elec-troosmotic flow induced by the flow of Mg2+ dominates.
-5
0
5
10
15
20
0 1 2 3 4 5 6
Flo
w o
f wat
er m
olec
ules
(nm
-2)
Simulation time (ns)
E = 0.0142 V/nmE = 0.02598 V/nm
E = 0.0433 V/nmE = 0.0866 V/nm
FIG. 12: Accumulated number of water molecules per unit areacrossing a plane perpendicular to the applied electric fieldversus sim-ulation time for an electrolyte composed of 1M MgCl2 and 1M KCl.Different lines represent the flow of water for different values of theelectric field.
D. Transport properties of 1M LaCl3
The lanthanum cation La3+ is a highly charged and polar-izable ion which, for most problems, requires the use of Ab

10
TABLE IX: Ionic contributions to the total current, ratio ofthe an-ionic current over the cationic current and cationic transport numbersfor different values of the applied electric field in the caseof the 1MLaCl3 electrolyte, withL = 7.71nm. All these quantities are calcu-lated in the frame of reference of the moving fluid.
Electric field (V/nm) ICl (nA) ILa (nA) ICl/ILa t+14.2 5.51 5.00 1.10 0.48
25.98 10.72 9.89 1.13 0.47
43.3 17.55 14.94 1.17 0.46
86.6 35.00 31.06 1.12 0.47
initio calculations or polararizable force fields to properly de-scribe its interaction with water and ions34. However, thereare systems for which only its electric charge and size arerelevant to describe certain electrokinetic phenomena33. Forsuch cases, La3+ can be modeled as a charged Lennard-Jonesparticle and one can obtain the transport properties of a LaCl3ionic solution by using classical molecular dynamics calcu-lations. The Lennard-Jones parameters used here to describethe lanthanum cation La3+ were taken from Ref.35
The electrical transport properties of the 1M LaCl3 elec-trolyte in the presence of an external electric field are obtainedusing molecular dynamics simulations which employ a non-polarizable force field (described above). The summary of theresults is given in Fig.13 and Table IX. The electrolyte showsan ohmic behaviour (see Fig.13), with an electrical conduc-tivity of κ = 12.8 S/m. Considering the limitations of thedescription, this value is quite satisfactory compared to theexperimental value ofκexp = 15.3 S/m36. The ionic contri-bution, the ratio of currents and the cationic transport numberare given in Table IX for each value of the external electricfield.
0
20
40
60
80
0 0.02 0.04 0.06 0.08
Cur
rent
(nA
)
E (V/nm)
κ = 12.8 S/m
FIG. 13: MD results for the electric current versus applied electricfield for a 1M LaCl3 electrolyte in a cubic simulation box ofL =
7.71nm. The points correspond to simulation data computed fromEq.(1) and lines are fits of the data to Eq.(2) (fit givesκ = 12.8S/m)
1. Electroosmotic flow
The results for the net flow of water induced by the ioniccurrent are given in Fig. 14, in which the accumulated numberof water molecules per unit area crossing a plane perpendicu-lar to the electric field is represented as a function of simula-tion time. The flux of water molecules for each electric fieldis given in Table III.
The hydration properties of the 1M LaCl3 electrolyte aresummarized in Table VI. In spite of the limitations of thenon-polarizable model used to describe La3+, the values ob-tained for the hydration of La3+ are close to the values givenin the literature (hydration∼ 8 − 9 and a residence time ofhydrated water in the first coordination shell of∼ 1ns34). Asshowed in Fig. 14, the electroosmotic flow obtained for the1M LaCl3 electrolyte is in the direction of the flow of chlo-ride ions, opposite to the direction of the applied electricfield.In this case, the higher hydration of La3+ is not enough tocompensate the higher flow of chloride ions versus the flow oflanthanum cation La3+.
-10
-8
-6
-4
-2
0
2
4
6
0 1 2 3 4 5 6 7 8 9 10 11 12 13 14
Cro
ssin
g w
ater
mol
ecul
es/n
m2
Simulation time (ns)
E = 0.0142 V/nmE = 0.02598 V/nm
E = 0.0433 V/nmE = 0.0866 V/nm
FIG. 14: Accumulated number of water molecules per unit areacrossing a plane perpendicular to the applied electric fieldversussimulation time for an electrolyte composed of 1M LaCl3. Differentlines represent the flow of water for different values of the electricfield.
IV. CONCLUSIONS
Classical molecular dynamics simulations of various elec-trolytes (KCl, MgCl2, KCl + MgCl2, LaCl3) in external elec-tric fields were performed to study their transport properties.We have employed algorithms and parameters typically usedin simulations of complex electrokinetic phenomena to testagainst experimental data their validity in the description oftransport properties of electrolytes. The electrical conductiv-ity and transport numbers (ionic contributions to the totalcur-rent) of electrolytes containing monovalent (1M KCl), diva-lent (1M MgCl2, 1M MgCl2 + 1M KCl ), and trivalent (1MLaCl3) cations were computed from the simulated ion trajec-tories. It is shown that in all cases the electrical conductivities
11
0
5
10
15
0 2 4 6 8 10
g LaO
(r)
r(Å)
(a)
0
1
2
3
4
5
6
7
0 2 4 6 8 10
g LaH
(r)
r(Å)
(b)
0
1
2
3
4
5
0 2 4 6 8 10
g ClO
(r)
r(Å)
(c)
0
1
2
3
4
0 2 4 6 8 10
g ClH
(r)
r(Å)
(d)
0
1
2
3
4
0 2 4 6 8 10
g ClH
(r)
r(Å)
(d)
FIG. 15: The ion-oxygen and ion-hydrogen radial distribution func-tions for the 1M LaCl3 electrolyte
obtained from the simulations are in good agreement with ourown experimental measurements and values from the litera-ture. Also, for the MgCl2 electrolyte, the dependence of theelectrical conductivity on the electrolyte concentrationwas in-vestigated and found that the MD results follow the experi-mental trend and give accurate results for the lowest (0.1M)and the highest concentrations (1M) studied. Transport num-bers obtained for the 1M KCl electrolyte agree well with theexperimental values found in the literature. For the divalent
electrolyte 1M MgCl2, there is a significant discrepancy be-tween the transport numbers obtained from MD simulationsand the experimental values, probably due to the poor resultfor the self difusion coefficient for anions provided by theLennard-Jones parameters used in the simulations. The effectof the simulation box size on the electrical transport proper-ties was also explored. It is found that a big enough simulationbox is needed to avoid spurious effects of the simulation.
The electroosmotic flow of water induced by the ionic flowhas also been computed from the MD trajectories. It is shownthat the direction and magnitude of the water flux depends onthe electrolyte: while the flux is in the direction of the cationflow for electrolytes containing Mg2+, it is in the opposite di-rection and weaker for all the other cases. These results arein-terpreted with the help of the hydration properties of the ions,which are calculated and successfully compared with previousstudies on the subject.
V. ACKNOWLEDGMENTS
This work is supported by the Spanish Government(grants FIS2009-13370-C02-02, FIS2007-60205 andCONSOLIDER-NANOSELECT-CSD2007-00041), Gen-eralitat de Catalunya (2009SGR164) and Fundacio CaixaCastello-Bancaixa (P1-1A2009-13). C.C. is supported by theJAE doc program of the Spanish National Research Council(CSIC). The Supercomputing resources employed in thiswork were provided by the CESGA Supercomputing Center,Spain.
∗ Electronic address: [email protected] F. H. J. van der Heyden, D. Stein, K. Besteman, S. G. Lemay
and C. Dekker,Charge inversion at high ionic strength studiedby streaming currents, Phys. Rev. Lett.96 (2006),pp. 224502-224505.
2 A. Alcaraz, E. M. Nestorovich, M. L. Lopez, E. Garcıa, S.M.Bezrukov, V. Aguilella,Diffusion, Exclusion, and Specific Bind-ing in a Large Channel: A Study of OmpF Selectivity Inversion,Biophysical Journal 96 (2009), 56-66.
3 C. D. Lorenz, P. S. Crozier, J. A. Anderson and A. Travesset,Molecular dynamics of ionic transport and electrokinetic effectsin realistic silica channels, J. Phys. Chem. C 112 (2008), 10222-10232.
4 B. Jonsson, A. Nonat, C. Labbez, B. Cabane, and H. Wenner-strom,Controlling the Cohesion of Cement Paste, Langmuir 21(2005), 9211-9221.
5 A. Martın-Molina, J. A. Maroto-Centeno, R. Hidalgo-Alvarez andM. Quesada-Perez,Charge reversal in real colloids: Experiments,theory and simulations, Colloids and Surfaces A 319 (2008), 103-108.
6 A. Aksimentiev and K. Schulten,Imaging α-Hemolysin withMolecular Dynamics: Ionic Conductance, Osmotic Permeability,and the Electrostatic Potential Map, Biophys. J. 88 (2005), 3745-3761.
7 C. D. Lorenz and A. Travesset,Charge inversion of divalent ionicsolutions in silica channels, Phys. Rev. E 75 (2007), 061202-
061206.8 B. Luan and Aleksei Aksimentiev,Electric and electrophoretic in-
version of the DNA charge in multivalent electrolytes, Soft Matter6 (2010), 243-246.
9 E. R. Cruz-Chu, T. Ritz, Z. S. Siwy and K. Schulten,Molecularcontrol of ionic conduction in polymer nanopores, Faraday Dis-cussion, 143 (2009), 47-62.
10 E. R. Cruz-Chu, A. Aksimentiev and K. Schulten,Water-silicaforce field for simulating nanodevices, J. Phys. Chem. B 110(2006),21497-21508.
11 M. Aguilella-Arzo, C. Calero and J. Faraudo,Ionic correlationsat the nanoscale: iversion of selectivity in a bio-nanochannel,arXiv:1005.0278v2 [cond-mat.mtrl-sci]
12 J. C. Phillips, R. Braun, W. Wang, J. Gumbart, E. Tajkhorshid,E. Villa, C. Chipot, R. D. Skeel, L. Kale, and K. Schulten,Scal-able molecular dynamics with NAMD, J. Comp. Chem. 26 (2005),1781-1802.
13 W.M. Gelbart, R.F. Bruinsma, P.A. Pincus and V.A. Parsegian,DNA-inspired electrostatics, Phys. Today 53 (2000), 38-44.
14 K. Besteman, K. van Eijk and S. Lemay,Charge inversion accom-panies DNA condensation by multivalent ions, Nature Physics 3(2007), 641-644.
15 J. Yu, T. Ha, and K. Schulten.Conformational model of the Hol-liday junction transition deduced from molecular dynamicssimu-lations, Nuc. Acids Res. 32 (2004), 6683-6695.
16 B. Luan and A. Aksimentiev,DNA attraction in mono- and diva-

12
lent electrolytes, J. Am. Chem. Soc. 130 (2008), 15754-15755.17 D. Craig, M. Gao, K. Schulten, and V. Vogel,Structural insights
into how the MIDAS ion stabilizes integrin binding to an RGDpeptide under force, Structure 12 (2004), 2049-2058
18 F. C. J. M. van Veggel and D. N. Reinhoudt,New, AccurateLennard-Jones Parameters for Trivalent Lanthanide Ions, Testedon [18]Crown-6, Chem. Eur. J. 5 (1999), 90-95.
19 W. Humphrey, A. Dalke, and D. J. Schulten,VMD - Visual Molec-ular Dynamics, Molec. Graphics 14 (1996), 33-38.
20 Robinson and Stokes,Electrolyte Solutions, Butterworths, Lon-don, 1959
21 S. Phang and R.H Stokes,Density, Viscosity, Conductance andTransference number of Concentrated Aqueous Magnesium Chlo-ride at 25C, J. Sol. Chem. 9 (1980), 497-505.
22 D.G Miller, J.A Rard, L.B. Eppstein and J.G. Albright,Mu-tual Diffusion Coefficients and Ionic transport Coefficients Iij ofMgCl2-H2O at 25 C, J. Phys. Chem. 88 (1984), 5739-5748.
23 Struis et al.An NMR Contribution to the Interpretation of the Dy-namical Behavior of Water Molecules as a Function of the MgClpConcentration at 25 C, J. Phys. Chem. 93 (1989), 7943-7952.
24 D.G. Miller, Application of Irreversible Thermodynamics to Elec-trolyte Solutions. I Determination of Ionic Transport CoefficientsIij for isothermal Vector Transport Processes in Binary Elec-trolyte Systems, J. Phys. Chem 70 (1966), 2639-2659.
25 S. Chowdhuri and A. Chandra,An NMR Contribution to the In-terpretation of the Dynamical Behavior of Water Molecules as aFunction of the MgClp Concentration at 25 C, J. Chem. Phys. 115(2001), 3732-3741.
26 K. M. Callahan, N. N. Casillas-Ituarte, M. Roeselova, H. C.Allen,and D. J. Tobias,Solvation of Magnesium Dication: Molecu-lar Dynamics Simulation and Vibrational Spectroscopic Study ofMagnesium Chloride in Aqueous Solutions, J. Phys. Chem. A 114(2010), 5141-5148.
27 D. Jiao, C. King, A. Grossfield, T. A. Darden, P. Ren,Simulation
of Ca2+ and Mg2+ Solvation Using Polarizable Atomic MultipolePotentialJ. Phys. Chem. B 110 (2006), 18553-18559.
28 F. C. Lightstone, E. Schwegler, R. Q. Hood, F. Gygi, G. Galli,A first principles molecular dynamics simulations of the hydratedmagnesium ion, Chem. Phys. Lett. 343 (2001), 549-555.
29 K. Waizumi, I. Masuda, N. Fukushima,A molecular approach tothe formation of KC1 and MgCl+ ion-pairs in aqueous solutionby density functional calculations, Chem. Phys. Lett. 205 (1993),317-323
30 C. C. Pye, W. W. Rudolph,A molecular approach to the forma-tion of KC1 and MgCl+ ion-pairs in aqueous solution by densityfunctional calculations, J. Phys. Chem A 102 (1998), 9933-9943.
31 C. D. Cappa, J.D. Smith, B. M. Messer, R. C. Cohen, R. J.Saykally, Effects of Cations on the Hydrogen Bond Network ofLiquid Water: New Results from X-ray Absorption Spectroscopyof Liquid Microjets, J. Phys. Chem. B 110 (2006), 5301-5309.
32 A. Martn-Molina, M. Quesada-Prez, F. Galisteo-Gonzlez andR.Hidalgo-lvarez,Probing charge inversion in model colloids: elec-trolyte mixtures of multi- and monovalent counterions, J. Phys.:Condens. Matter 15 (2003) S3475-S3483 (2003).
33 A. Martın-Molina, C. Rodrıguez Beas, J. Faraudo,Charge Re-versal in Anionic Liposomes: Experimental Demonstration andMolecular Origin, Phys. Rev. Lett. 104 (2010), 168103-168106.
34 C. Clavaguera, R. Pollet, J. M. Soudan, V. Brenner, and J. P.Dognon, Molecular Dynamics Study of the Hydration of Lan-thanum(III) and Europium(III) Including Many-Body Effects, J.Phys. Chem B 109 (2005), 7614-7616.
35 F. C. J. M. van Veggel and D. N. Reinhoudt,New, AccurateLennard-Jones Parameters for Trivalent Lanthanide Ions, Testedon [18]Crown-6, Chem. Eur. J. 5 (1999), 90-95.
36 G. Jones and C. F. Bickford,The Conductance of Aqueous Solu-tions as a Function of the Concentration. I. Potassium Bromideand Lanthanum ChlorideJ. Am. Chem. Soc. 56 (1934), 602-611.
Copyright © 2022 FDOKUMEN