Preparation and characterization of nonaqueous electrolyte ...
96
Preparation and characterizat electrolyte from natural poly double-layer capacitors その他のタイトル 天然高分子を用いた電気二重層キャパシタ用電解質 の調製及びキャラクタリゼーション 著者 Kotatha Ditpon year 2019-03-31 学位授与機関 関西大学 学位授与番号 34416甲第726号 URL http://doi.org/10.32286/00018642
-
Upload
khangminh22 -
Category
Documents
-
view
3 -
download
0
Transcript of Preparation and characterization of nonaqueous electrolyte ...
Preparation and characterization of nonaqueouselectrolyte from natural polymers for electricdouble-layer capacitors
その他のタイトル 天然高分子を用いた電気二重層キャパシタ用電解質の調製及びキャラクタリゼーション
著者 Kotatha Ditponyear 2019-03-31学位授与機関 関西大学学位授与番号 34416甲第726号URL http://doi.org/10.32286/00018642
課程博士
2019 年 3 月
関西大学審査学位論文
Preparation and characterization of nonaqueous
electrolyte from natural polymers for
electric double-layer capacitors
天然高分子を用いた電気二重層キャパシタ用電解質の調製及び
キャラクタリゼーション
研究科・専攻:理工学研究科・総合理工学専攻
研究領域 : 生体材料化学
学籍番号 : 16D6010
氏名 : コタタ ディトポン
博士論文要旨
理工学研究科総合理工学専攻
研究領域:生体材料化学
学籍番号: 16D6010
氏名:コタタ ディトポン
【論題】:Preparation and characterization of nonaqueous electrolyte from natural polymers
for electric double-layer capacitors
(天然高分子を用いた電気二重層キャパシタ用電解質の調製及び
キャラクタリゼーション)
【概要】
Electric double-layer capacitors (EDLCs) are electrochemical devices that have received
much attention in recent years because of their outstanding properties of long cycle lifetime and
high sustained power density. Ionic liquid (IL) is considered to be promising electrolyte for
EDLCs. Many researchers have been trying to prepare IL as solution electrolytes in the EDLCs
due to their excellent properties, for example, near-zero vapor pressure, high thermal stability
and non-flammability. However, the liquid leakage and safety issue are considered for IL
electrolytes in the EDLCs system. Hence, non-aqueous electrolyte is more interesting for
EDLCs. The various gel-electrolyte including IL have been prepare.
Regarding the requirement of sustainable development and non-renewable resources
depletion, application of natural polymers has attracted significant attention. The development of
biomass for polymer electrolytes has been widely studied in these recent year such as chitosan,
alginate, bacterial cellulose, gelatin, carrageen, agar, starch, natural rubber, pectin, or
polysaccharide of gar gum.
In this research, we focus on preparation and characterization of novel electrolytes from
natural polymers including IL of 1-ethyl-3-methylimidazolium tetrafluoroborate (EMImBF4) for
use as non-aqueous electrolytes in EDLC. The new electrolytes in this research were successfully
prepared from 3 systems; (i) bacterial cellulose coated with alternating layers of
chitosan/alginate, (ii) chitosan thin-film and (iii) gelatin nanofiber electrospinning. Moreover,
there obtained samples were fabricated in EDLC test cell for electrochemical properties
measurement by charge–discharge performance, discharge capacitance and alternative
impedance for application test.
【各章の要旨】
In chapter 1, general introduction and background describing about EDLC and IL
including the brief detail of natural polymers which was used for preparing nonaqueous
electrolyte in this research; bacterial cellulose, chitosan, alginate and gelatin.
In chapter 2, A novel gel electrolyte has been prepared using bacterial cellulose (BC)
coated with chitosan (CTS) and alginate (Alg) layers, which contain 1-ethyl-3-
methylimidazolium tetrafluoroborate (EMImBF4). The inoculated BC was oxidized and coated
with alternating layers of CTS and Alg via ionic crosslinking to produce the gel electrolytes. The
CTS content of the obtained gel electrolytes linearly increased with an increase in the number of
CTS and Alg layers on the BC fibers. The results imply that the CTS and Alg layers successfully
bound onto each fiber of BC, which was consistent with FTIR measurements. Based on a
structural analysis, the fabricated gel electrolytes had a nanofibrous structure with a fiber
diameter range of approximately 78.6–99.0 nm, a high thermal stability, and a significantly
improved tensile strength compared to gel electrolytes of only CTS or Alg. In addition, the
EDLCs test cell with a gel electrolyte of BC coated with 15 layers of CTS and Alg containing
EMImBF4 showed a high discharge capacitance, implying that the high affinity of this gel
electrolyte for the activated-carbon electrode leads to reduced electrode/electrolyte interfacial
resistance, which shows the potential of this approach compared with liquid-phase EMImBF4 to
obtain high-performance, safety-oriented EDLCs.
In chapter 3, A novel thin-film electrolyte (TFE) based on chitosan (CS) with EMImBF4
was prepared by a new procedure. In this system, EMImBF4 plays important roles as both a
dissolving solution and a charge carrier for EDLC application. Through analysis and
characterization of the obtained products, the CS-TEFs showed a surface without separation of
phase between CS and EMImBF4. The FT-IR spectra revealed peaks which are characteristic of
CS including EMImBF4 that confirm an effective introduction of EMImBF4 into the CS matrix.
The thermograms and tensile testing results indicated that these CS-TEFs had high thermal
stabilities with good tensile strength, which is a favorable property for solid-electrolyte to be
used in EDLCs. Moreover, the EDLCs test cell with CS-TFE with a calculated dry thin-film
content of 80 wt% EMImBF4 showed a comparable IR drop and higher discharge capacitance
than a liquid-phase EMImBF4 system and also showed low electrode/electrolyte interfacial
resistance. Consequently, this novel CS-TFE is suitable for high-performance EDLCs and
improves the safety of such devices.
In chapter 4, A novel nanofibrous gel electrolyte was prepared via gelatin electrospinning
to be used as a nonaqueous electrolyte in EDLCs. An electrospinning technique with a 25 wt%
gelatin solution was used to produce gelatin electrospun (GES) electrolytes. A structural analysis
of the GES products showed a clearly nanofibrous structure having fiber diameters in the range
of approximately 306.2–428.4 nm, high thermal stability, high tensile strength, and resistance to
damage upon immersion in EMImBF4. After testing a range of spinning times, GES electrolytes
that were electrospun with 25 min of spinning time (GES-25) were used to fabricate EDLC test
cells with EMImBF4. These test cells were compared with test cells using gelatin films
containing EMImBF4 and with testing cells using pure EMImBF4 with a separator as the
electrolyte. The test cell with the GES-25/EMImBF4 gel electrolyte showed a similar IR drop
and discharge capacitance as the liquid-EMImBF4 test cell. However, the electronic contact
resistance in activated carbon electrode at the electrode/electrolyte interface was significantly
better in the GES-25/EMImBF4 test cell compared with the test cell with the gelatin
film/EMImBF4 electrolytes. The results demonstrate that this novel nonaqueous gel electrolyte
can be used for solid-stage electrolyte in EDLCs to improve the safety of such devices.
(1)
Table of Contents
Preparation and characterization of nonaqueous electrolyte from natural polymers for
electric double-layer capacitors
Page
Chapter 1
General Introduction………………………………………………………………………... 1
1.1. Scope of this research…………………………………………………………......... 2
1.2. Electrochemical double layer capacitor (EDLC)…………………………………… 3
1.2.1. Brief overview of EDLC…………………………………………………… 3
1.2.2. EDLC construction…………………………………………………………. 5
1.2.2.1. Electrode materials…………………………………………………. 6
1.2.2.2. Electrolytes…………………………………………………………. 6
1.2.2.3. Separator……………………………………………………………. 7
1.2.2.4. Application and type of EDLC……………………………………... 7
1.3. Ionic liquid (IL)…………………………………………………………………….. 8
1.4. Natural polymers…………………………………………………………………… 9
1.4.1. Bacterial cellulose…………………………………………………………... 10
1.4.2. Chitosan…………………………………………………………………….. 10
1.4.3. Alginate…………………………………………………………………….. 11
1.4.4. Gelatin……………………………………………………………………… 12
1.5. Content of this thesis……………………………………………………………….. 13
1.6. References………………………………………………………………………….. 13
Chapter 2
Preparation and Characterization of Gel Electrolyte with Bacterial Cellulose Coated with
Alternating Layers of Chitosan and Alginate……………………………………………….
19
2.1. Introduction…………………………………………………………………………. 20
2.2. Materials and methods……………………………………………………………… 21
2.2.1. Materials…………………………………………………………………….
21
(2)
Page
2.2.2. Preparation of gel electrolytes of bacterial cellulose coated with alternating
layers of Chitosan (CTS) and Alginate (Alg)………………………………....
21
2.2.2.1. Preparation of bacterial cellulose (BC) gel………………………… 21
2.2.2.2. Preparation of BC coated with alternating layers of CTS and Alg… 22
2.2.3. Characterization of gel electrolyte………………………………………….. 23
2.2.3.1. Fourier transform infrared spectroscopy (FTIR)…………………… 23
2.2.3.2. Determination of CTS content……………………………………… 24
2.2.3.3. Scanning electron microscopy (SEM)……………………………… 24
2.2.3.4. Porosity……………………………………………………………... 25
2.2.3.5. Thermogravimetric analysis (TGA)………………………………... 25
2.2.3.6. Determination of mechanical properties…………………………… 25
2.2.4. Fabrication of EDLCs cells………………………………………………… 26
2.2.5. Electrochemical measurement……………………………………………… 26
2.3. Results and discussion……………………………………………………………… 27
2.3.1. Characterization of gel electrolyte………………………………………….. 27
2.3.1.1. Determination of CTS content……………………………………… 27
2.3.1.2. FTIR………………………………………………………………... 29
2.3.1.3. SEM………………………………………………………………… 30
2.3.1.4. Porosity……………………………………………………………... 32
2.3.1.5. TGA………………………………………………………………… 32
2.3.1.6. Mechanical properties………………………………………………. 34
2.3.2. Electrochemical results……………………………………………………... 35
2.4. Conclusions…………………………………………………………………………. 39
2.5. References…………………………………………………………………………... 40
Chapter 3
Preparation and Characterization of Thin-film Electrolyte from Chitosan………………… 44
3.1. Introduction………………………………………………………………………… 45
3.2. Materials and methods………………………………………………………………
46
(3)
Page
3.2.1. Materials……………………………………………………………………. 46
3.2.2. Preparation of chitosan thin-film electrolyte (CS-TFEs)…………………... 47
3.2.3. Characterization of CS-TFEs……………………………………………….. 48
3.2.3.1. SEM………………………………………………………………… 48
3.2.3.2. FTIR………………………………………………………………… 48
3.2.3.3. TGA……………………………….................................................... 48
3.2.3.4. Determination of mechanical properties……………………………. 48
3.2.3.5. Determination of EMImBF4 content……………………………….. 49
3.2.4. Fabrication of EDLCs cells………………………………………………… 49
3.2.5. Electrochemical measurement……………………………………………… 50
3.3. Results and discussion……………………………………………………………… 50
3.3.1. Preparation of CS-TFEs…………………………………………………….. 50
3.3.2. Characterization of CS-TFEs……………………………………………….. 51
3.3.2.1. SEM………………………………………………………………… 51
3.3.2.2. FTIR………………………………………………………………... 52
3.3.2.3. TGA………………………………………………………………… 53
3.3.2.4. Mechanical properties………………………………………………. 54
3.3.2.5. Determination of EMImBF4 content……………………………….. 55
3.3.3. Electrochemical results……………………………………………………... 55
3.4. Conclusions…………………………………………………………………………. 59
3.5. References…………………………………………………………………………... 60
Chapter 4
Preparation and Characterization of Electrospun Gelatin Nanofiber Electrolyte…………... 64
4.1. Introduction………………………………………………………………………… 65
4.2. Materials and methods……………………………………………………………… 66
4.2.1. Materials……………………………………………………………………. 66
4.2.2. Preparation of gelatin electrospun (GES) electrolytes……………………… 66
4.2.3. Preparation of gelatin films containing EMImBF4 (GF-BF4)………………. 66
4.2.4. Characterization of GES electrolytes……………………………………….. 67
(4)
Page
4.2.4.1. FTIR………………………………………………………………… 67
4.2.4.2. TGA………………………………………………………………… 67
4.2.4.3. SEM………………………………………………………………… 67
4.2.4.4. Membrane thickness and mechanical properties…………………… 68
4.2.4.5. Determination of resistance to EMImBF4 damage…………………. 68
4.2.5. Fabrication of EDLCs cells………………………………………………… 68
4.2.6. Electrochemical measurement……………………………………………… 69
4.3. Results and discussion……………………………………………………………… 69
4.3.1. Characterization of GES electrolytes……………………………………….. 69
4.3.1.1. FTIR………………………………………………………………... 69
4.3.1.2. TGA………………………………………………………………… 70
4.3.1.3. SEM………………………………………………………………… 71
4.3.1.4. Membrane thickness and mechanical properties…………………… 73
4.3.1.5. Determination of resistance to EMImBF4 damage…………………. 74
4.3.2. Electrochemical results……………………………………………………... 74
4.4. Conclusions…………………………………………………………………………. 77
4.5. References…………………………………………………………………………... 78
Chapter 5
Concluding Remarks……………………………………………………………………….. 81
List of Publication…………………………………………………………………………... 84
Acknowledgments………………………………………………………………………….. 87

1
Chapter 1 General Introduction
2
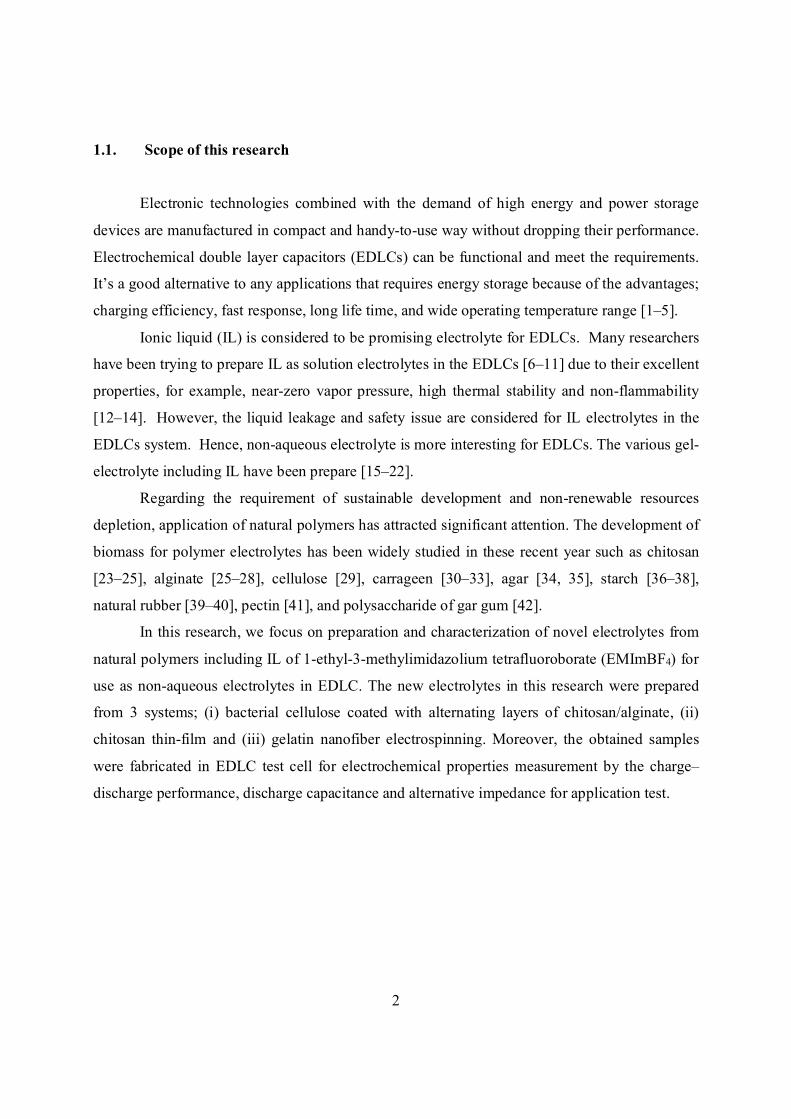
1.1. Scope of this research
Electronic technologies combined with the demand of high energy and power storage
devices are manufactured in compact and handy-to-use way without dropping their performance.
Electrochemical double layer capacitors (EDLCs) can be functional and meet the requirements.
It’s a good alternative to any applications that requires energy storage because of the advantages;
charging efficiency, fast response, long life time, and wide operating temperature range [1–5].
Ionic liquid (IL) is considered to be promising electrolyte for EDLCs. Many researchers
have been trying to prepare IL as solution electrolytes in the EDLCs [6–11] due to their excellent
properties, for example, near-zero vapor pressure, high thermal stability and non-flammability
[12–14]. However, the liquid leakage and safety issue are considered for IL electrolytes in the
EDLCs system. Hence, non-aqueous electrolyte is more interesting for EDLCs. The various gel-
electrolyte including IL have been prepare [15–22].
Regarding the requirement of sustainable development and non-renewable resources
depletion, application of natural polymers has attracted significant attention. The development of
biomass for polymer electrolytes has been widely studied in these recent year such as chitosan
[23–25], alginate [25–28], cellulose [29], carrageen [30–33], agar [34, 35], starch [36–38],
natural rubber [39–40], pectin [41], and polysaccharide of gar gum [42].
In this research, we focus on preparation and characterization of novel electrolytes from
natural polymers including IL of 1-ethyl-3-methylimidazolium tetrafluoroborate (EMImBF4) for
use as non-aqueous electrolytes in EDLC. The new electrolytes in this research were prepared
from 3 systems; (i) bacterial cellulose coated with alternating layers of chitosan/alginate, (ii)
chitosan thin-film and (iii) gelatin nanofiber electrospinning. Moreover, the obtained samples
were fabricated in EDLC test cell for electrochemical properties measurement by the charge–
discharge performance, discharge capacitance and alternative impedance for application test.
3
1.2. Electrochemical double layer capacitor (EDLC)
1.2.1. Brief overview of EDLC
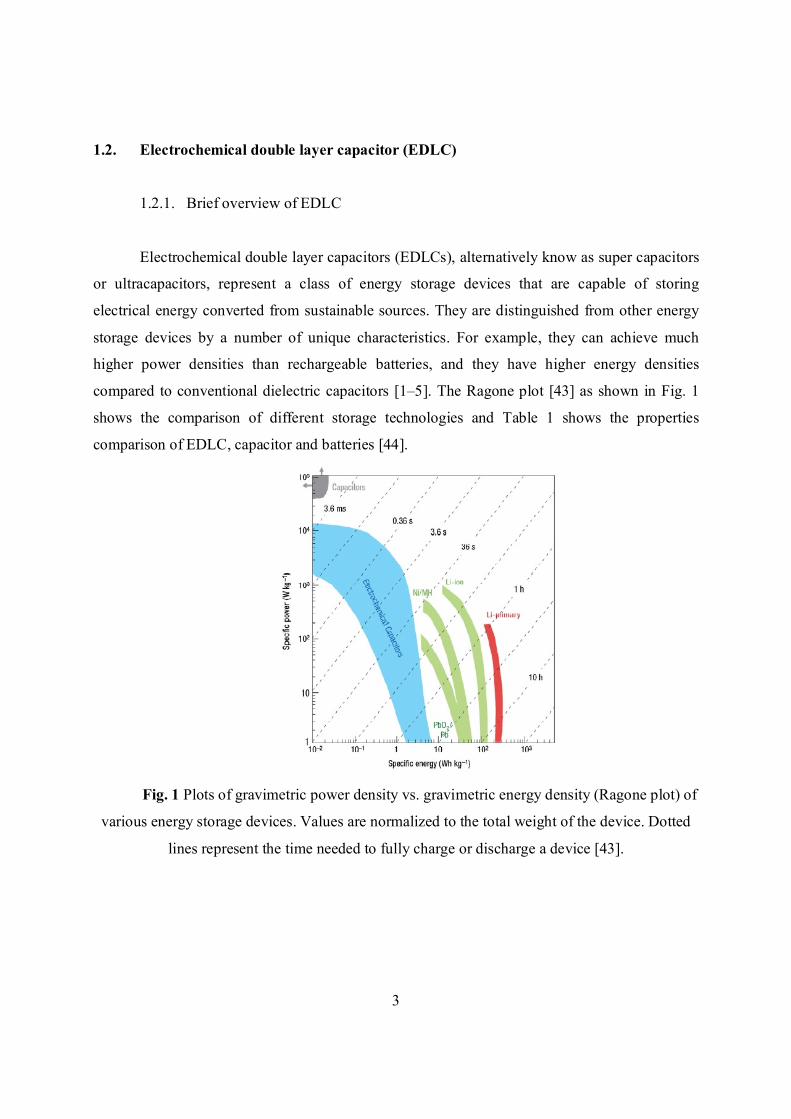
Electrochemical double layer capacitors (EDLCs), alternatively know as super capacitors
or ultracapacitors, represent a class of energy storage devices that are capable of storing
electrical energy converted from sustainable sources. They are distinguished from other energy
storage devices by a number of unique characteristics. For example, they can achieve much
higher power densities than rechargeable batteries, and they have higher energy densities
compared to conventional dielectric capacitors [1–5]. The Ragone plot [43] as shown in Fig. 1
shows the comparison of different storage technologies and Table 1 shows the properties
comparison of EDLC, capacitor and batteries [44].
Fig. 1 Plots of gravimetric power density vs. gravimetric energy density (Ragone plot) of
various energy storage devices. Values are normalized to the total weight of the device. Dotted
lines represent the time needed to fully charge or discharge a device [43].
4
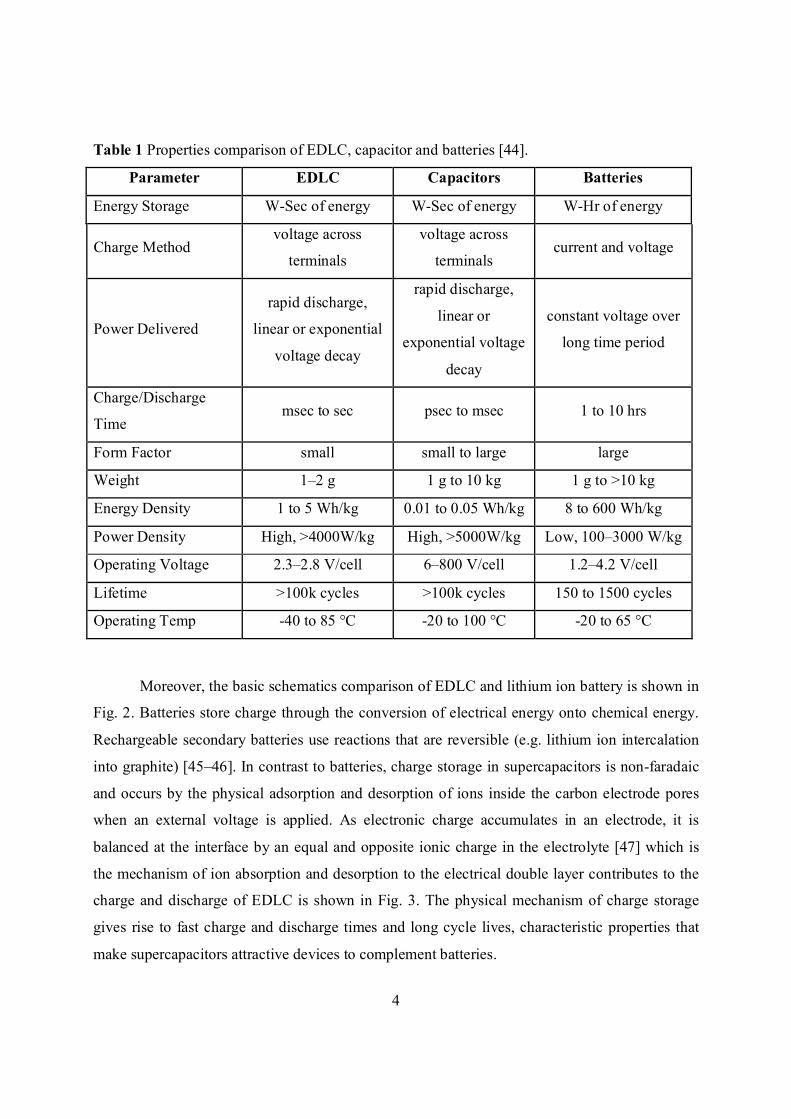
Table 1 Properties comparison of EDLC, capacitor and batteries [44].
Parameter EDLC Capacitors Batteries
Energy Storage W-Sec of energy W-Sec of energy W-Hr of energy
Charge Method voltage across
terminals
voltage across
terminals current and voltage
Power Delivered
rapid discharge,
linear or exponential
voltage decay
rapid discharge,
linear or
exponential voltage
decay
constant voltage over
long time period
Charge/Discharge
Time msec to sec psec to msec 1 to 10 hrs
Form Factor small small to large large
Weight 1–2 g 1 g to 10 kg 1 g to >10 kg
Energy Density 1 to 5 Wh/kg 0.01 to 0.05 Wh/kg 8 to 600 Wh/kg
Power Density High, >4000W/kg High, >5000W/kg Low, 100–3000 W/kg
Operating Voltage 2.3–2.8 V/cell 6–800 V/cell 1.2–4.2 V/cell
Lifetime >100k cycles >100k cycles 150 to 1500 cycles
Operating Temp -40 to 85 °C -20 to 100 °C -20 to 65 °C
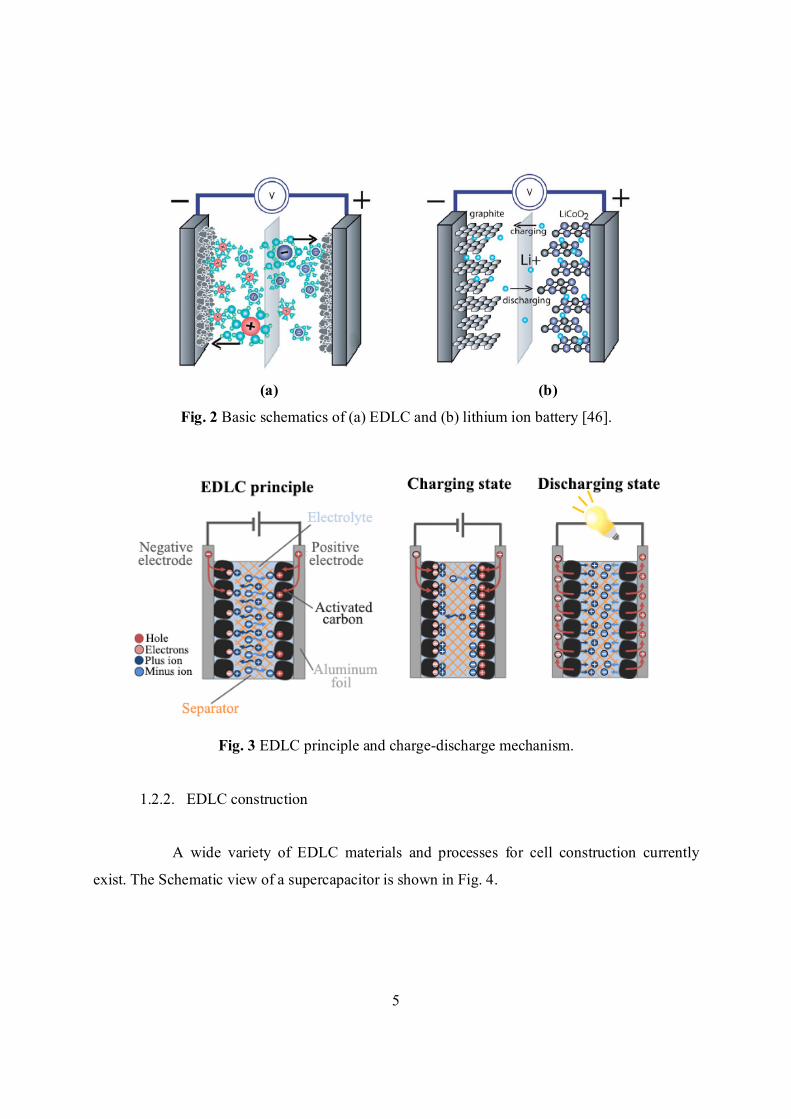
Moreover, the basic schematics comparison of EDLC and lithium ion battery is shown in
Fig. 2. Batteries store charge through the conversion of electrical energy onto chemical energy.
Rechargeable secondary batteries use reactions that are reversible (e.g. lithium ion intercalation
into graphite) [45–46]. In contrast to batteries, charge storage in supercapacitors is non-faradaic
and occurs by the physical adsorption and desorption of ions inside the carbon electrode pores
when an external voltage is applied. As electronic charge accumulates in an electrode, it is
balanced at the interface by an equal and opposite ionic charge in the electrolyte [47] which is
the mechanism of ion absorption and desorption to the electrical double layer contributes to the
charge and discharge of EDLC is shown in Fig. 3. The physical mechanism of charge storage
gives rise to fast charge and discharge times and long cycle lives, characteristic properties that
make supercapacitors attractive devices to complement batteries.
5
(a) (b)
Fig. 2 Basic schematics of (a) EDLC and (b) lithium ion battery [46].
Fig. 3 EDLC principle and charge-discharge mechanism.
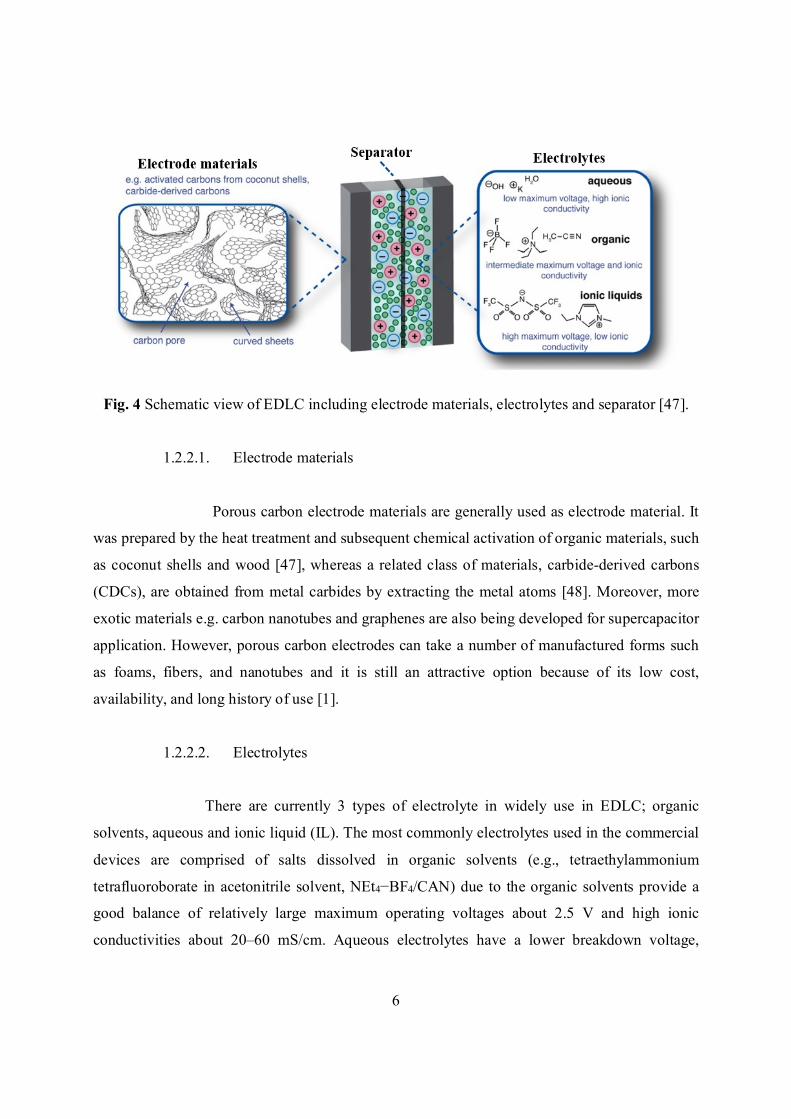
1.2.2. EDLC construction
A wide variety of EDLC materials and processes for cell construction currently
exist. The Schematic view of a supercapacitor is shown in Fig. 4.
6
Fig. 4 Schematic view of EDLC including electrode materials, electrolytes and separator [47].
1.2.2.1. Electrode materials
Porous carbon electrode materials are generally used as electrode material. It
was prepared by the heat treatment and subsequent chemical activation of organic materials, such
as coconut shells and wood [47], whereas a related class of materials, carbide-derived carbons
(CDCs), are obtained from metal carbides by extracting the metal atoms [48]. Moreover, more
exotic materials e.g. carbon nanotubes and graphenes are also being developed for supercapacitor
application. However, porous carbon electrodes can take a number of manufactured forms such
as foams, fibers, and nanotubes and it is still an attractive option because of its low cost,
availability, and long history of use [1].
1.2.2.2. Electrolytes
There are currently 3 types of electrolyte in widely use in EDLC; organic
solvents, aqueous and ionic liquid (IL). The most commonly electrolytes used in the commercial
devices are comprised of salts dissolved in organic solvents (e.g., tetraethylammonium
tetrafluoroborate in acetonitrile solvent, NEt4−BF4/CAN) due to the organic solvents provide a
good balance of relatively large maximum operating voltages about 2.5 V and high ionic
conductivities about 20–60 mS/cm. Aqueous electrolytes have a lower breakdown voltage,
7
typically about 1 V, but have better conductivity than organic electrolytes. Moreover, IL are very
interesting for alternatively electrolytes because of high operating voltages (about 4 V) [49–51].
The capacitance of an EDLC is greatly influenced by the choice of electrolyte.
The ability to store charge is dependent on the accessibility of the ions to the porous surface-
area, so ion size and pore size must be optimal. The best pore size distribution in the electrode
depends upon the size of the ions in the electrolyte, so both electrode and electrolyte must be
chosen together [1].
1.2.2.3. Separator
The separator prevents the occurrence of electrical contact between the two
electrodes, but it is ion-permeable, allowing ionic charge transfer to take place. For best EDLC
performance the separator should have a high electrical resistance, a high ionic conductance, and
a low thickness [1]. Polymer or paper separators are widely used for organic electrolytes, while
ceramic or glass fiber separators are often used with aqueous and IL electrolytes.
1.2.2.4. Application and type of EDLC
Regarding high energy and power density of EDLC, some new applications of
EDLC are being developed at an increasing rate such as memory back-up, electric vehicles,
portable power supplies, electrochemical actuators and adjustable-speed drives.
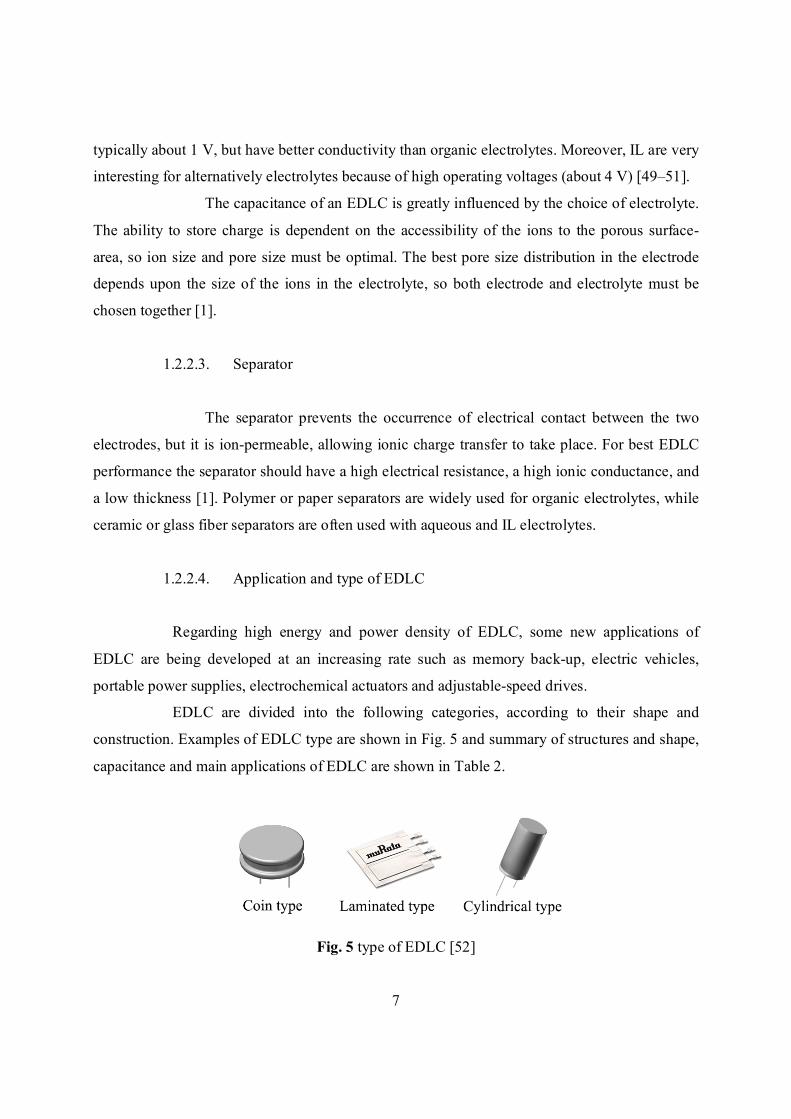
EDLC are divided into the following categories, according to their shape and
construction. Examples of EDLC type are shown in Fig. 5 and summary of structures and shape,
capacitance and main applications of EDLC are shown in Table 2.
Fig. 5 type of EDLC [52]
8
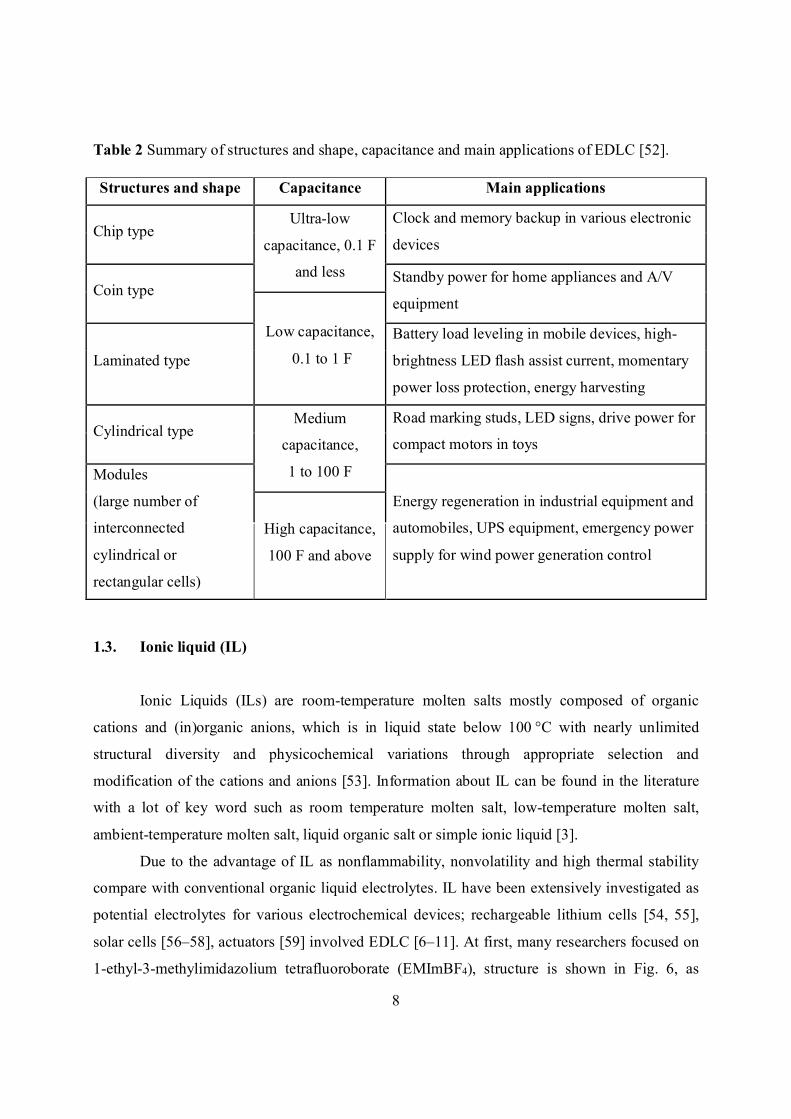
Table 2 Summary of structures and shape, capacitance and main applications of EDLC [52].
Structures and shape Capacitance Main applications
Chip type Ultra-low
capacitance, 0.1 F
and less
Clock and memory backup in various electronic
devices
Coin type Standby power for home appliances and A/V
equipment
Low capacitance,
0.1 to 1 F Laminated type
Battery load leveling in mobile devices, high-
brightness LED flash assist current, momentary
power loss protection, energy harvesting
Cylindrical type Medium
capacitance,
1 to 100 F
Road marking studs, LED signs, drive power for
compact motors in toys
Modules
(large number of
interconnected
cylindrical or
rectangular cells)
Energy regeneration in industrial equipment and
automobiles, UPS equipment, emergency power
supply for wind power generation control
High capacitance,
100 F and above
1.3. Ionic liquid (IL)
Ionic Liquids (ILs) are room-temperature molten salts mostly composed of organic
cations and (in)organic anions, which is in liquid state below 100 °C with nearly unlimited
structural diversity and physicochemical variations through appropriate selection and
modification of the cations and anions [53]. Information about IL can be found in the literature
with a lot of key word such as room temperature molten salt, low-temperature molten salt,
ambient-temperature molten salt, liquid organic salt or simple ionic liquid [3].
Due to the advantage of IL as nonflammability, nonvolatility and high thermal stability
compare with conventional organic liquid electrolytes. IL have been extensively investigated as
potential electrolytes for various electrochemical devices; rechargeable lithium cells [54, 55],
solar cells [56–58], actuators [59] involved EDLC [6–11]. At first, many researchers focused on
1-ethyl-3-methylimidazolium tetrafluoroborate (EMImBF4), structure is shown in Fig. 6, as
9
electrolytes for EDLC because it has a relatively low viscosity and high ionic conductivity [8, 9].
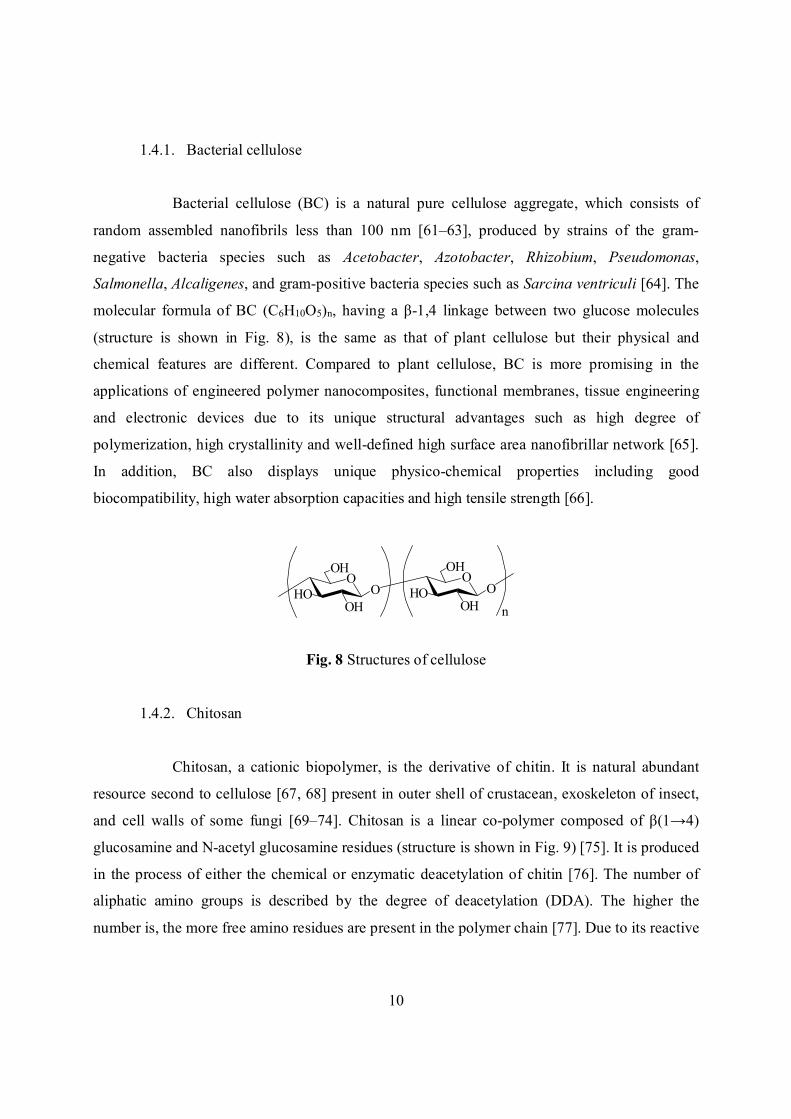
Then, there has been extensive synthesis of different families of IL composed of different anions
and cations as shows in Fig. 7.
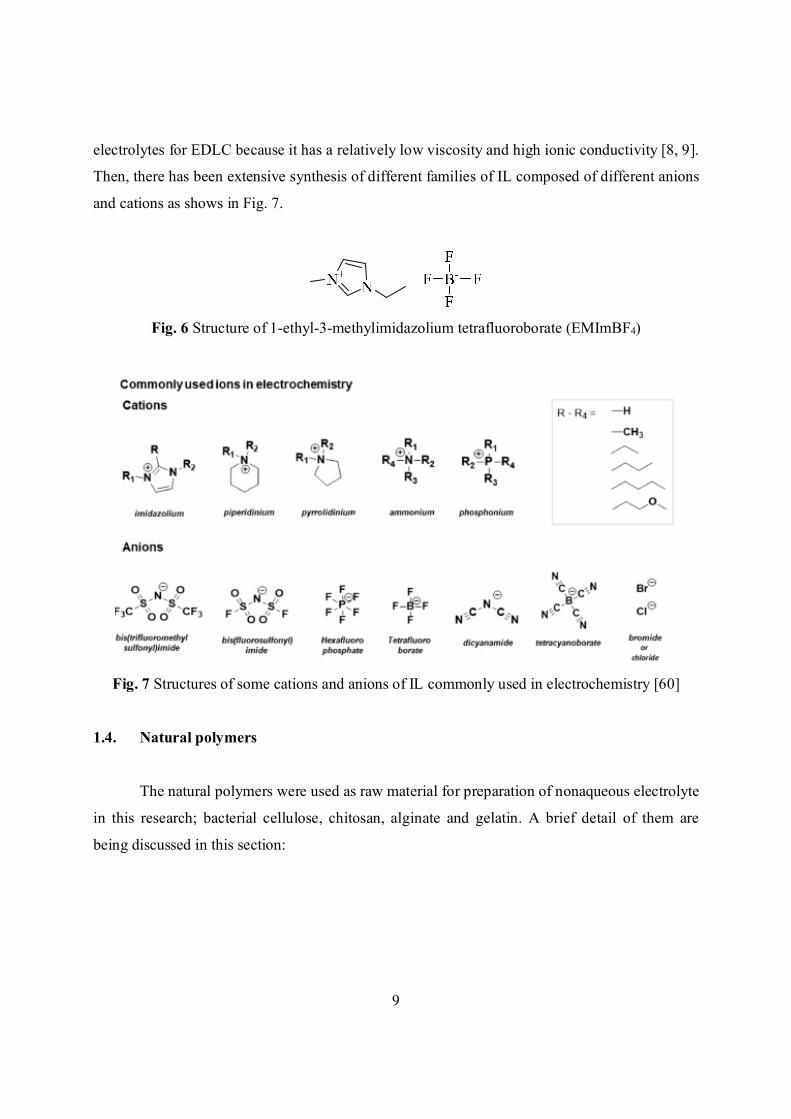
Fig. 6 Structure of 1-ethyl-3-methylimidazolium tetrafluoroborate (EMImBF4)
Fig. 7 Structures of some cations and anions of IL commonly used in electrochemistry [60]
1.4. Natural polymers
The natural polymers were used as raw material for preparation of nonaqueous electrolyte
in this research; bacterial cellulose, chitosan, alginate and gelatin. A brief detail of them are
being discussed in this section:
10
1.4.1. Bacterial cellulose
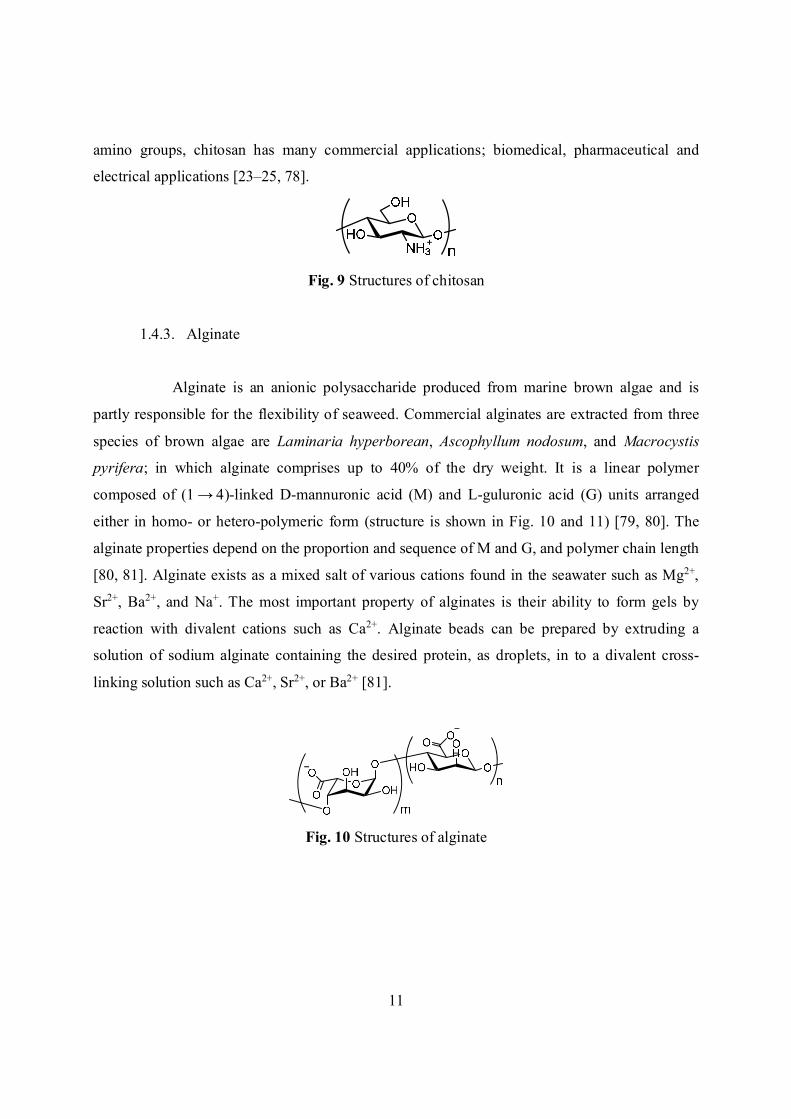
Bacterial cellulose (BC) is a natural pure cellulose aggregate, which consists of
random assembled nanofibrils less than 100 nm [61–63], produced by strains of the gram-
negative bacteria species such as Acetobacter, Azotobacter, Rhizobium, Pseudomonas,
Salmonella, Alcaligenes, and gram-positive bacteria species such as Sarcina ventriculi [64]. The
molecular formula of BC (C6H10O5)n, having a β-1,4 linkage between two glucose molecules
(structure is shown in Fig. 8), is the same as that of plant cellulose but their physical and
chemical features are different. Compared to plant cellulose, BC is more promising in the
applications of engineered polymer nanocomposites, functional membranes, tissue engineering
and electronic devices due to its unique structural advantages such as high degree of
polymerization, high crystallinity and well-defined high surface area nanofibrillar network [65].
In addition, BC also displays unique physico-chemical properties including good
biocompatibility, high water absorption capacities and high tensile strength [66].
OHO
OH
OHO
OHO
OH
OHO
n
Fig. 8 Structures of cellulose
1.4.2. Chitosan
Chitosan, a cationic biopolymer, is the derivative of chitin. It is natural abundant
resource second to cellulose [67, 68] present in outer shell of crustacean, exoskeleton of insect,
and cell walls of some fungi [69–74]. Chitosan is a linear co-polymer composed of β(1→4)
glucosamine and N-acetyl glucosamine residues (structure is shown in Fig. 9) [75]. It is produced
in the process of either the chemical or enzymatic deacetylation of chitin [76]. The number of
aliphatic amino groups is described by the degree of deacetylation (DDA). The higher the
number is, the more free amino residues are present in the polymer chain [77]. Due to its reactive
11
amino groups, chitosan has many commercial applications; biomedical, pharmaceutical and
electrical applications [23–25, 78].
Fig. 9 Structures of chitosan
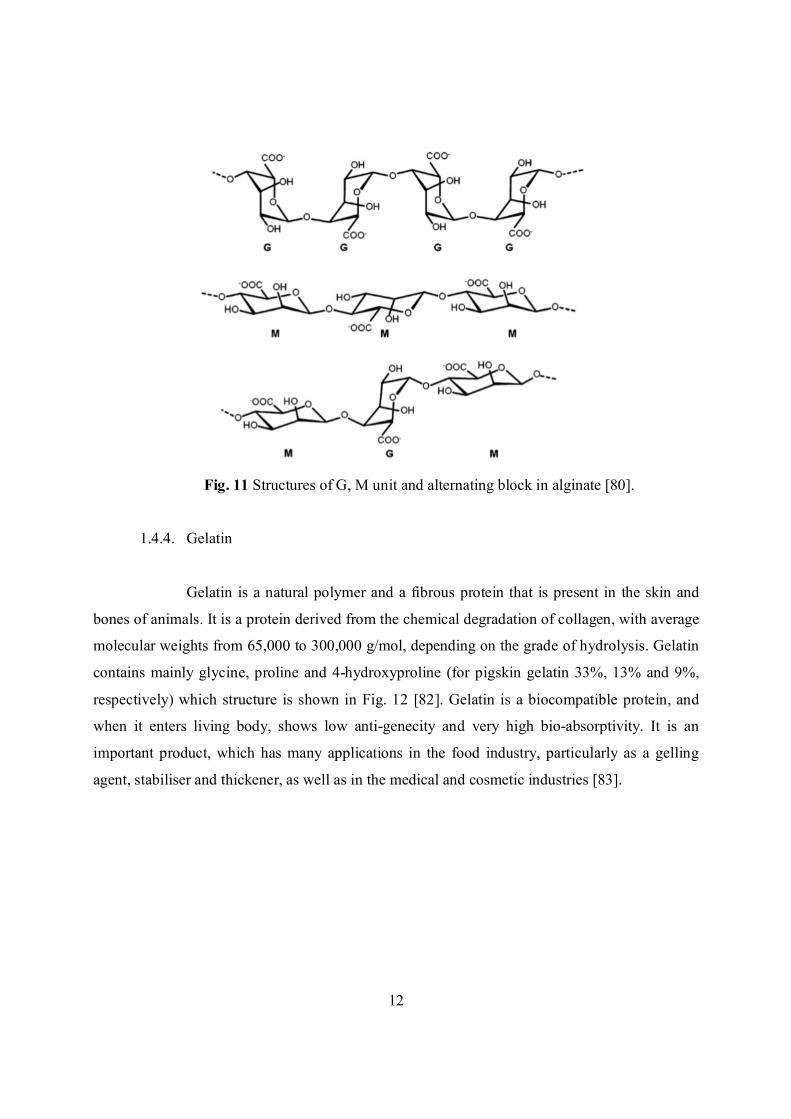
1.4.3. Alginate
Alginate is an anionic polysaccharide produced from marine brown algae and is
partly responsible for the flexibility of seaweed. Commercial alginates are extracted from three
species of brown algae are Laminaria hyperborean, Ascophyllum nodosum, and Macrocystis
pyrifera; in which alginate comprises up to 40% of the dry weight. It is a linear polymer
composed of (1 → 4)-linked D-mannuronic acid (M) and L-guluronic acid (G) units arranged
either in homo- or hetero-polymeric form (structure is shown in Fig. 10 and 11) [79, 80]. The
alginate properties depend on the proportion and sequence of M and G, and polymer chain length
[80, 81]. Alginate exists as a mixed salt of various cations found in the seawater such as Mg2+,
Sr2+, Ba2+, and Na+. The most important property of alginates is their ability to form gels by
reaction with divalent cations such as Ca2+. Alginate beads can be prepared by extruding a
solution of sodium alginate containing the desired protein, as droplets, in to a divalent cross-
linking solution such as Ca2+, Sr2+, or Ba2+ [81].
Fig. 10 Structures of alginate
12
Fig. 11 Structures of G, M unit and alternating block in alginate [80].
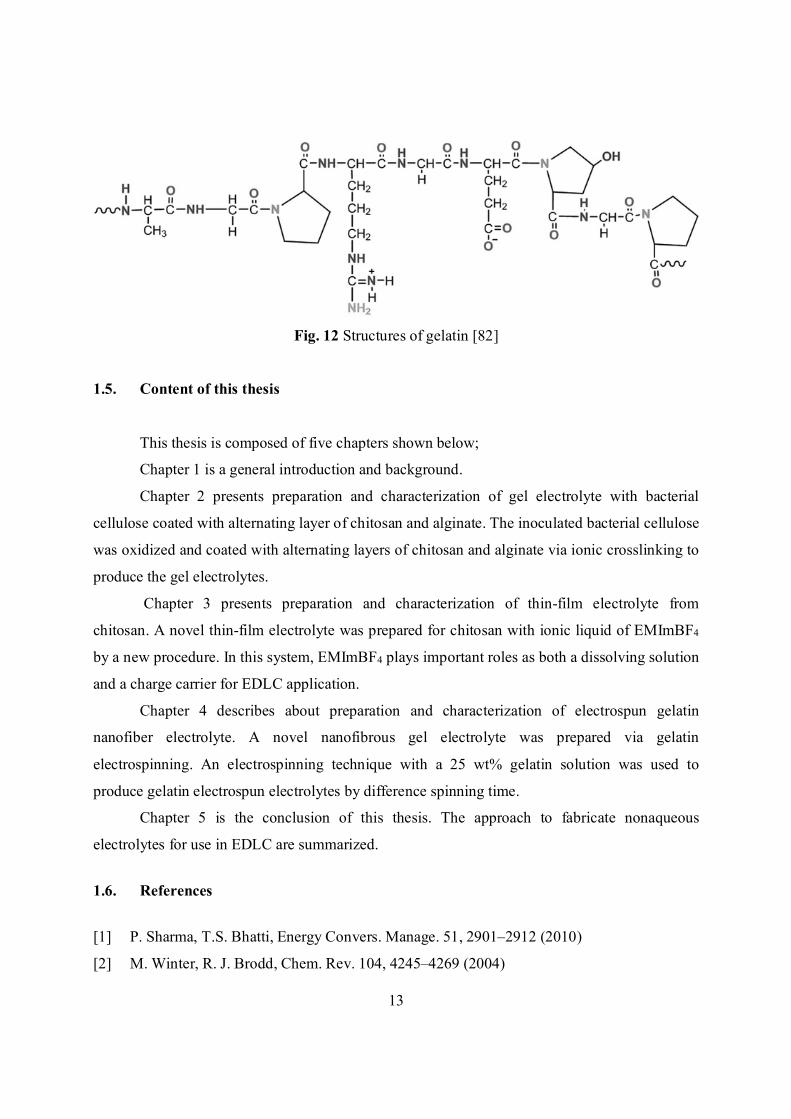
1.4.4. Gelatin
Gelatin is a natural polymer and a fibrous protein that is present in the skin and
bones of animals. It is a protein derived from the chemical degradation of collagen, with average
molecular weights from 65,000 to 300,000 g/mol, depending on the grade of hydrolysis. Gelatin
contains mainly glycine, proline and 4-hydroxyproline (for pigskin gelatin 33%, 13% and 9%,
respectively) which structure is shown in Fig. 12 [82]. Gelatin is a biocompatible protein, and
when it enters living body, shows low anti-genecity and very high bio-absorptivity. It is an
important product, which has many applications in the food industry, particularly as a gelling
agent, stabiliser and thickener, as well as in the medical and cosmetic industries [83].
13
Fig. 12 Structures of gelatin [82]
1.5. Content of this thesis
This thesis is composed of five chapters shown below;
Chapter 1 is a general introduction and background.
Chapter 2 presents preparation and characterization of gel electrolyte with bacterial
cellulose coated with alternating layer of chitosan and alginate. The inoculated bacterial cellulose
was oxidized and coated with alternating layers of chitosan and alginate via ionic crosslinking to
produce the gel electrolytes.
Chapter 3 presents preparation and characterization of thin-film electrolyte from
chitosan. A novel thin-film electrolyte was prepared for chitosan with ionic liquid of EMImBF4
by a new procedure. In this system, EMImBF4 plays important roles as both a dissolving solution
and a charge carrier for EDLC application.
Chapter 4 describes about preparation and characterization of electrospun gelatin
nanofiber electrolyte. A novel nanofibrous gel electrolyte was prepared via gelatin
electrospinning. An electrospinning technique with a 25 wt% gelatin solution was used to
produce gelatin electrospun electrolytes by difference spinning time.
Chapter 5 is the conclusion of this thesis. The approach to fabricate nonaqueous
electrolytes for use in EDLC are summarized.
1.6. References
[1] P. Sharma, T.S. Bhatti, Energy Convers. Manage. 51, 2901–2912 (2010)
[2] M. Winter, R. J. Brodd, Chem. Rev. 104, 4245–4269 (2004)
14
[3] M. Galiński, A. Lewandowski, I. Stępniak, Electrochim. Acta 51, 5567–5580 (2006)
[4] M. Tokita, N. Yoshimoto, K. Fujii, M. Morita, Electrochim. Acta 209, 210–218 (2016)
[5] Y. Song, T. Liu, F. Qian, C. Zhu, B. Yao, E. Duoss, C. Spadaccini, M. Worsley, Y. Li, J.
Colloid Interface Sci. 509, 529–545 (2018)
[6] A. Lewandowski, M. Galiński, J. Phys. Chem. Solids 65, 281–286 (2004)
[7] Z. Zhou, M. Takeda, M. Ue, J. Fluorine Chem. 125, 471–476 (2004)
[8] T. Sato, G. Masuda, K. Takagi, Electrochim. Acta 49, 3603–3611 (2004)
[9] K. Yuyama, G. Masuda, H. Yoshida, T. Sato, J. Power Sources 162, 1401–1408 (2006)
[10] C.O. Ania, J. Pernak, F. Stefaniak, E. Raymundo-Piñero, F. Béguin, Carbon 44, 3126–
3130 (2006)
[11] N. Handa, T. Sugimoto, M. Yamagata, M. Kikuta, M. Kono, M. Ishikawa, J. Power
Sources 185, 1585–1588 (2008)
[12] X. Mu, X. Yang, D. Zhang, C. Liu, Carbohydr. Polym. 146, 46–51 (2016)
[13] W. Wang, J. Zhu, X. Wang, Y. Huang, Y. Wang, J. Macromol. Sci., Part B 49 (3), 528–
541 (2010)
[14] K. Wilpiszewska, T. Spychaj, Carbohydr. Polym. 86, 424–428 (2011)
[15] M.M. Rao, J.S. Liu, W.S. Li, Y. Liang, D.Y. Zhou, J. Membr. Sci. 322, 314–319 (2008)
[16] B. Rupp, M. Schmuck, A. Balducci, M. Winter, W. Kern, Eur. Polym. J. 44, 2986–2990
(2008)
[17] M. Rao, X. Geng, Y. Liao, S. Hu, W. Li, J. Membr. Sci. 399-400, 37–42 (2012)
[18] R. Prasanth, N. Shubha, H.H. Hng, M. Srinivasan, Eur. Polym. J. 49, 307–318 (2013)
[19] K. Karuppasamy, P.A. Reddy, G. Srinivas, A. Tewari, R. Sharma, X.S. Shajan, D. Gupta,
J. Membr. Sci. 514, 350–357 (2016)
[20] P.F.R. Ortega, J.P.C. Trigueiro, G.G. Silva, R.L. Lavall, Electrochim. Acta 188, 809–817
(2016)
[21] M. Safa, A. Chamaani, N. Chawla, B. El-Zahab, Electrochim. Acta 213, 587–593 (2016)
[22] J. Rymarczyk, M. Carewska, G.B. Appetecchi, D. Zane, F. Alessandrini, S. Passerini, Eur.
Polym. J. 44, 2153–2161 (2008)
[23] K. Soeda, M. Yamagata, S. Yamazaki, M. Ishikawa, Electrochemistry 81(10), 867–872
(2013)
15
[24] M. Yamagata, K. Soeda, S. Ikebe, S. Yamazaki, M. Ishikawa, Electrochim. Acta 100, 275–
280 (2013)
[25] M.Yamagata, K. Soeda, S. Ikebe, S. Yamazaki, M. Ishikawa, J. Electrochem. Soc. 41(22),
25–34 (2012)
[26] M. Yamagata, K. Soeda, S. Yamazaki, M. Ishikawa, J. Electrochem. Soc. 25(35), 193–200
(2010)
[27] M. Yamagata, S. Ikebe, Y. Kasai, K. Soeda, M. Ishikawa, J. Electrochem. Soc. 50(43), 27–
36 (2013)
[28] K. Soeda, M. Yamagata, M. Ishikawa, J. Power Sources 280, 565–572 (2015)
[29] R. Ou, Y. Xie, X. Shen, F. Yuan, H. Wang, Q. Wang, J. Mater. Sci. 47, 5978–5986 (2012)
[30] N.N. Mobarak, N. Ramli, A. Ahmad, M.Y.A. Rahman, Solid State Ionics 224, 51–57
(2012)
[31] N.N. Mobarak, F.N. Jumaah, M.A. Ghani, M.P. Abdullah, A. Ahmad, Electrochim. Acta
175, 224–231 (2015)
[32] S. Rudhziah, M.S.A. Rani, A. Ahmad, N.S. Mohamed, H. Kaddami, Ind. Crops Prod. 72,
133–141 (2015)
[33] T.M.D. Palma, F. Migliardini, D. Caputo, P. Corbo, Carbohydr. Polym. 157, 122–127
(2017)
[34] E. Rapharl, C.O. Avellaneda, B. Manzolli, A. Pawlicka, Electrochim. Acta 55, 1455–1459
(2010)
[35] R. Leones, F. Sentanin, L.C. Rodrigues, I.M. Marrucho, J.M.S.S. Esperança, A. Pawlicka,
M.M. Silva, Express Polym. Lett. 6 (12), 1007–1016 (2012)
[36] A.S.A. Khiar, A.K. Arof, Ionics 16, 123–129 (2010)
[37] M. Kumar, T. Tiwari, N. Srivastava, Carbohydr. Polym. 88, 54–60 (2012)
[38] M.F. Shukur, R. Ithnin, M.F.Z. Kadir, Electrochim. Acta 136, 204–216 (2014)
[39] A.M.M. Ali, R.H.Y. Subban, H. Bahron, T. Winie, F. Latif, M.Z.A. Yahya, Ionics 14, 491–
500 (2008)
[40] S.N. Mohamed, N.A. Johari, A.M.M. Ali, M.K. Harun, M.Z.A. Yahya, J. Power Sources
183, 351–354 (2008)
[41] R.K. Mishra, A. Anis, S. Mondal, M. Dutt, A.K. Banthia, Chin. J. Polym. Sci. 27 (5), 639–
646 (2009)
16
[42] Y.N. Sudhakar, M. Selvakumar, D. K. Bhat, Mater. Sci. Eng., B 180, 12–19 (2014)
[43] X. Zhang, H. Zhang, C. Li, K. Wang, X. Sun, Y. Ma, RSC Adv. 4, 45862–45884 (2014)
[44] T. Armstrong, Emergency eCall – Available When You Need It, [online] Available at:
https://www.powersystemsdesign.com/articles/emergency-ecall-available-when-you-need-
it/132/11691, [Accessed 12 Oct. 2018]
[45] V. Etacheri, R. Marom, R. Elazari, G. Salitra, D. Aurbach, Energy Environ. Sci. 4, 3243–
3262 (2011)
[46] K. Jost, G. Dion, Y. Gogotsi, J. Mater. Chem. A 2, 10776–10787 (2014)
[47] A.C. Forse, C. Merlet, J.M. Griffin, C.P. Grey, J. Am. Chem. Soc. 138, 5731–5744 (2016)
[48] V. Presser, M. Heon, Y. Gogotsi, Adv. Funct. Mater. 21, 810–833 (2011)
[49] F. Béguin, V. Presser, A. Balducci, E. Frackowiak, Adv. Mater. 26, 2219–2251 (2014)
[50] A. Brandt, S. Pohlmann, A. Varzi, A. Balducci, S. Passerini, MRS Bull. 38, 554–559
(2013)
[51] A. Lewandowski, A. Olejniczak, M. Galinski, I. Stepniak, J. Power Sources 195, 5814–
5819 (2010)
[52] TDK Techno Magazine Tech Mag., TDK Techno Magazine. [online] Available at:
https://www.global.tdk.com/techmag/electronics_primer/vol8.htm, [Accessed 12 Oct.
2018].
[53] H. Liu, H. Yu, J. Mater. Sci. Technol. (2018), In Press.
[54] N. Nakagawa, S. Izuchi, K. Kuwana, T. Nukuda, Y. Aihara, J. Electrochem. Soc. 150,
A695–A700 (2003)
[55] H. Sakaebe, H. Matsumoto, Electrochem. Commun. 5, 594–598 (2003)
[56] P. Wang, S.M. Zakeeruddin, I. Exnar, M. Grätzel, Chem. Commun. 24, 2972–2973 (2002)
[57] P. Wang, S.M. Zakeeruddin, P. Comte, I. Exnar, M. Grätzel, J. Am. Chem. Soc. 125,
1166–1167 (2003)
[58] H. Matsumoto, T. Matsuda, T. Tsuda, R. Hagiwara, Y. Ito, Y. Miyazaki, Chem. Lett. 30
(1), 26–27 (2001)
[59] D. Zhou, G.M. Spinks, G.G. Wallace, C. Tiyapiboonchaiya, D.R. MacFarlane, M. Forsyth,
J. Sun, Electrochim. Acta 48, 2355–2359 (2003)
[60] V.L. Martins, R.M. Torresi, Curr. Opin. Electrochem. 9, 26–32 (2018)
[61] N. Halib, M. C. I. Amin and I. Ahmad, Sains Malaysiana 41 (2), 205–211 (2012)
17
[62] Y. Kaburagi, M. Ohoyama, Y. Yamaguchi, E. Shindou, A. Yoshida, N. Iwashita, N.
Yoshizawa, M. Kodama, Carbon 55, 371–374 (2013)
[63] E.L. Hult, S. Yamanaka, M. Ishihara and J. Sugiyama, Carbohydr. Polym. 53, 9–14 (2003)
[64] M. Shoda, Y. Sugano, Biotechnol. Bioprocess. Eng. 10, 1–8 (2005)
[65] D. Tian, F. Shen, J. Hu, S. Renneckar, J.N. Saddler, Carbohydr. Polym. 198, 191–196
(2018)
[66] M.H. Kwak, J.E. Kim, J. Go, E.K. Koh, S.H. Song, H.J. Son, H.S. Kim, Y.H. Yun, Y.J.
Jung, D.Y. Hwang, Carbohydr. Polym. 122, 387–398 (2015)
[67] M. Rinaudo, Prog. Polym. Sci. 31, 603–632 (2006)
[68] A. Domard, Carbohydr. Polym. 84, 696–703 (2011)
[69] R. Jayakumar, H. Nagahama, T. Furuike, H. Tamura, Int. J. Biol. Macromol. 42, 335–339
(2008)
[70] A. Anitha, V.V.D. Rani, R. Krishna, V. Sreeja, N. Selvamurugan, S.V. Nair, H. Tamura, R.
Jayakumar, Carbohydr. Polym. 78, 672–677 (2009)
[71] K. Madhumathi, K.T. Shalumon, V.V.D. Rani, H. Tamura, T. Furuike, N. Selvamurugan,
S.V. Nair, R. Jayakumar, Int. J. Biol. Macromol. 45, 12–15 (2009)
[72] H. Nagahama, H. Maeda, T. Kashiki, R. Jayakumar, T. Furuike, H. Tamura, Carbohydr.
Polym. 76, 255–260 (2009)
[73] Y. Saito, V. Luchnikov, A. Inaba, K. Tamura, Carbohydr. Polym. 109, 44–48 (2014).
[74] T. Furuike, D. Komoto, H. Hashimoto, H. Tamura, Int. J. Biol. Macromol. 104, 1620–1625
(2017)
[75] C. Choi, J. Nam, J. Nah, J. Ind. Eng. Chem. 33, 1–10 (2016)
[76] I. Tsigos, A. Martinou, D. Kafetzopoulos, V. Bouriotis, Trends Biotechnol. 18(7), 305–312
(2000)
[77] A. Tiraferri, P. Maroni, D. Caro Rodríguez, M. Borkovec, Langmuir 30, 4980–4988 (2014)
[78] R. Jayakumar, M. Prabaharan, P.T. Sudheesh Kumar, S.V. Nair, H. Tamura, Biotechnol.
Adv. 29, 322–337 (2011)
[79] J.H. Kim, S. Park, H. Kim, H.J. Kim, Y. Yang, Y.H. Kim, S. Jung, E. Kan, S.H. Lee,
Carbohydr. Polym. 157, 137–145 (2017)
[80] K.Y. Lee, D.J. Mooney, Prog. Polym. Sci. 37, 106–126 (2012)
[81] M. George, T.E. Abraham, J. Controlled Release 114, 1–14 (2006)
18
[82] C. Peña, K. Caba, A. Eceiza, R. Ruseckaite, I. Mondragon, Bioresour. Technol. 101, 6836–
6842 (2010)
[83] P. Likitdecharoj, J. Ratanavaraporn, J. Drug Deliv. Sci. Technol. 47, 367–374 (2018)
19
Chapter 2
Preparation and Characterization of Gel Electrolyte with Bacterial
Cellulose Coated with Alternating Layers of Chitosan and Alginate
20
2.1. Introduction
With advances in electronic technologies, there is a demand for high-energy power-
storage devices to be manufactured in a compact and handy-to-use way without a reduction in
their performance. Electric double-layer capacitors (EDLCs), also known as supercapacitors, can
be functional and meet the abovementioned requirements. The energy storage mechanism of
EDLCs arises from non-faradic phenomena between two non-faradic electrodes and an
electrolyte at their interfaces [1–3]. This can provide a higher sustained power density and longer
charge–discharge cycle (>100,000 cycles) as compared with rechargeable battery systems [4, 5].
Owing to their excellent properties such as near-zero vapor pressure, high thermal
stability, and non-flammability, ionic liquids (ILs), which have been widely promoted as green
solvents [6–8], are being studied as electrolytes for EDLCs [9–14]. However, the liquid leakage
and lack of safety associated with IL electrolytes in the EDLCs system must be considered.
Hence, non-aqueous electrolytes are more promising for EDLCs. The various gel electrolytes,
including IL-based electrolytes, have been prepared [15–22].
Considering depletion of nonrenewable resources, sustainable development and
application of biodegradable polymers have attracted significant attention. In recent years,
biomass such as carrageen [23–26], agar [27, 28], starch [29–31], and guar gum polysaccharide
[32] have been developed for gel-polymer electrolytes. In addition, previous studies have
reported successful preparation of gel electrolytes from chitosan (CTS) [33–35] and alginate
(Alg) [35–38], including high-performance ILs for use in EDLCs. However, the low tensile
strength of these gel electrolytes may be attributed to the properties of the materials used.
Bacterial cellulose (BC), which is natural polymer nanofiber, displays unique physical
and chemical properties such as good biocompatibility, high water absorption capacity, high
crystallinity, highly fibrous networks, and a high tensile strength and modulus [39, 40].
Therefore, if BC is used as the scaffold for CTS and Alg as a gel electrolyte, it is possible to
efficiently combine both the higher tensile strength and the electrochemical properties of these
materials.
In this chapter, a novel gel electrolyte was successfully prepared using BC coated with
alternating layers of CTS and Alg including 1-ethyl-3-methylimidazolium tetrafluoroborate
21
(EMImBF4) for the use in EDLCs. The characterization of the gel electrolyte and its
electrochemical properties were discussed.
2.2. Materials and methods
2.2.1. Materials
Gluconacetobacter xylinus ATCC 53582 was purchased from Summit Pharmaceuticals
International Corporation (Japan). Chitosan (FL-80, Mw 90,000, degree of deacetylation (DDA):
89.7%) and sodium Alg (viscosity: 80–120 mPa s for 10 g/L at 20 °C) were supplied from Koyo
Chemical Co., Ltd (Japan) and KIMICA corporation (Japan), respectively. 1-ethyl-3-
methylimidazolium tetrafluoroborate (EMImBF4, 99.0%) was purchased from Toyo Gosei Co.,
Ltd (Japan). Activated carbon (YP-50F), acetylene black (HS-100), sodium carboxymethyl
cellulose (WS-C), and styrene-butadiene rubber (TRD2001) were purchased from Kuraray Co.,
Ltd (Japan), Denka company Ltd (Japan), DKS Co., Ltd (Japan), and JSR corporation (Japan),
respectively. Other reagents were purchased from Wako Pure Chemical Company (Japan) and
used without further purification.
2.2.2. Preparation of gel electrolytes of bacterial cellulose coated with alternating layers
of CTS and Alg
2.2.2.1. Preparation of BC gel
The starting culture of Gluconacetobacter xylinus was inoculated at 30 °C
for 7 days with 1 mL of Gluconacetobacter xylinus in 200 mL of Hestrin–Schramm (HS)
medium containing 2% D-glucose, 0.5% yeast extract, 0.5% peptone, 0.115% sodium hydrogen
phosphate, and 0.27% citric acid in deionized (DI) water (w/v) [41, 42]. The HS medium was
sterilized at 121 °C for 15 min before use [43]. After the incubation period, BC was cultured at
room temperature for 3 days by adding 1 mL of starter culture in 20 mL of HS medium.
Subsequently, the obtained BC gel was washed with DI water to remove the HS medium and
was treated in a 0.5 M sodium hydroxide (NaOH) solution at 90 °C for 1 h to eliminate bacterial
22
cells [40]. Then, the treated BC gel was washed with DI water until the pH of the filtrate was
neutral before using the gel in future processes.
2.2.2.2. Preparation of BC coated with alternating layers of CTS and Alg
The BC nanofiber was oxidized with potassium periodate (KIO4) before
coating it with CTS and Alg. The BC was submerged in 400 mL of a 1-mg/mL KIO4 solution
and was stirred at 60 °C for 1 h [44]. The oxidized BC was then washed with DI water several
times to remove the KIO4; then, it was soaked in DI water overnight at room temperature before
coating with CTS and Alg in the next step. The oxidized BC was coated with layer-by-layer of
CTS and Alg as follows: The CTS and Alg solutions were prepared with a concentration of 0.1%
(w/v). The CTS solution was prepared by adding 0.4 g of CTS powder to a 2% (v/v) aqueous
acetic acid and completing the volume to 400 mL and by subsequent stirring at 60 °C for 1 h.
Meanwhile, the Alg solution was prepared by adding 0.4 g of Alg powder to DI water and
completing the volume to 400 mL and by subsequent stirring at 60 °C for 1 h. Subsequently, the
oxidized BC was submerged in 400 mL of the 0.1% (w/v) CTS solution and was stirred at 60 °C
for 1 h to coat it with a layer of CTS. Then, the CTS-coated oxidized BC was submerged in 400
mL of the0.1% (w/v) Alg solution and was stirred at 60 °C for 1 h to coat it with a layer of Alg.
Accordingly, the sample was coated with additional CTS layers alternated with Alg layers.
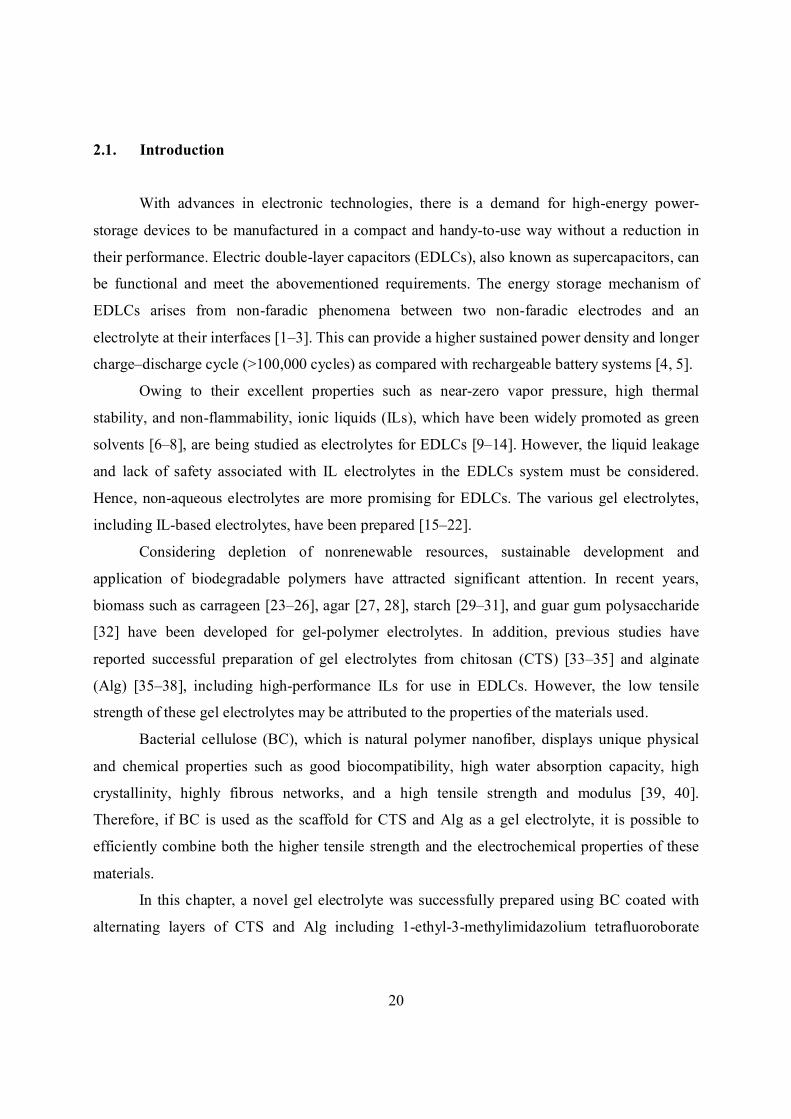
The coated sample was washed in 400 mL of DI water in an ultrasonic
machine twice before repeated CTS or Alg coatings. A schematic of the coating method is shown
in Fig. 1, and the number of coating layers of the samples are shown in Table 1. After coating,
the sample thickness was reduced via pressing with a 2-kg load for 2 h; then, it was soaked in
400 mL of methanol for 3 days; the methanol bath was changed every day. The sample thus
obtained was used in the subsequent steps.
23
Fig. 1 A schematic diagram of the CTS/Alg coating method
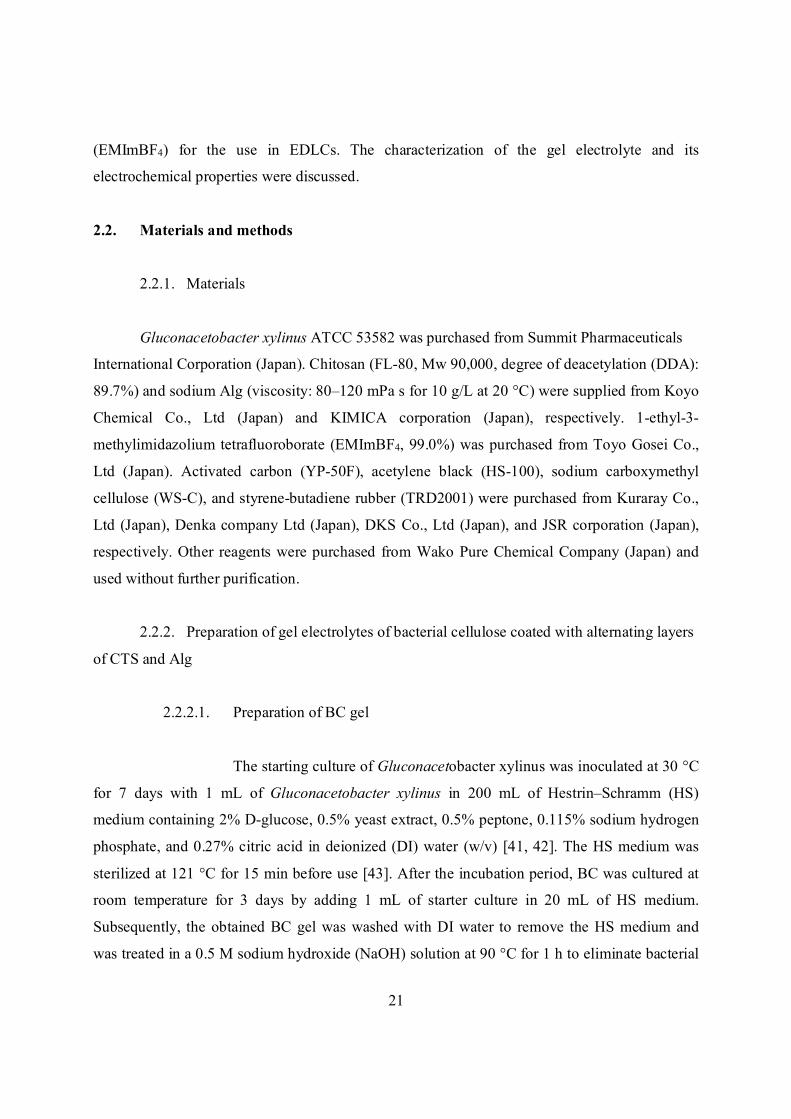
Table 1 A number of the coating layer of the samples
Sample name Number of layer
CTS Alg BC 0 0 BC(CTS/Alg)5 5 5 BC(CTS/Alg)10 10 10 BC(CTS/Alg)15 15 15
2.2.3. Characterization of gel electrolyte
2.2.3.1. Fourier transform infrared spectroscopy (FTIR)
FTIR (FTIR; 670-IR, VARIAN Inc., USA) was used for identification of
the functional groups in the obtained samples.
24
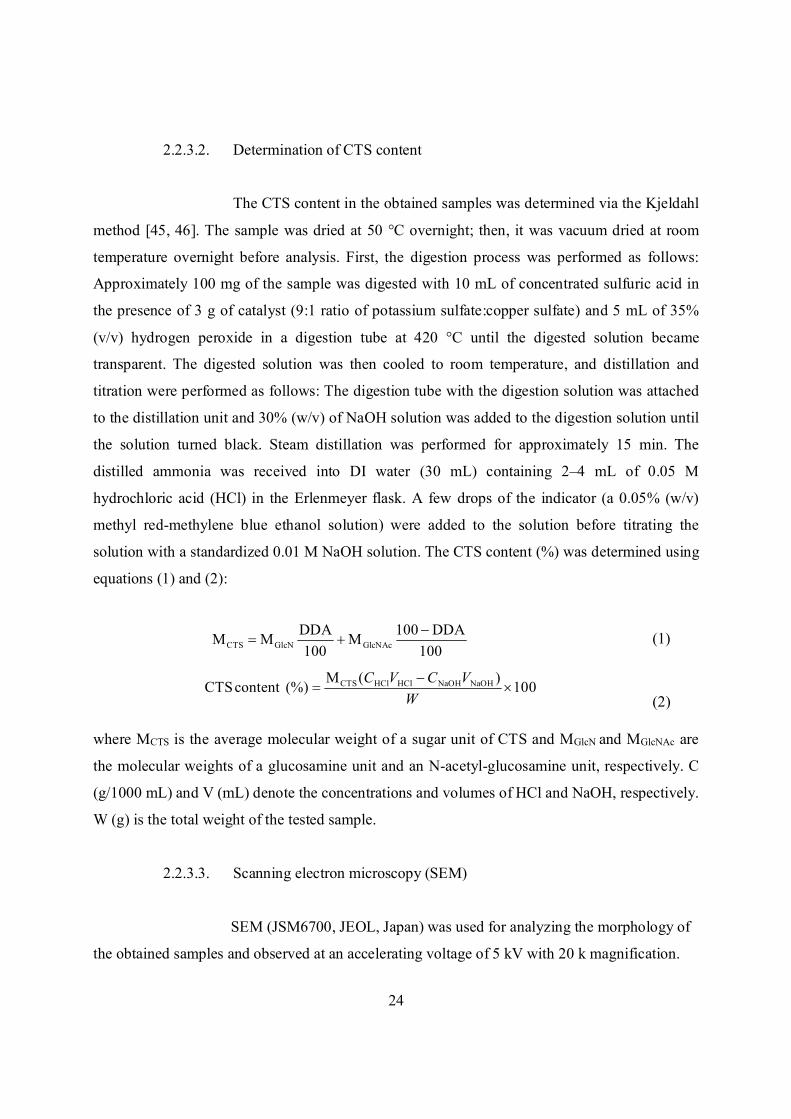
2.2.3.2. Determination of CTS content
The CTS content in the obtained samples was determined via the Kjeldahl
method [45, 46]. The sample was dried at 50 °C overnight; then, it was vacuum dried at room
temperature overnight before analysis. First, the digestion process was performed as follows:
Approximately 100 mg of the sample was digested with 10 mL of concentrated sulfuric acid in
the presence of 3 g of catalyst (9:1 ratio of potassium sulfate:copper sulfate) and 5 mL of 35%
(v/v) hydrogen peroxide in a digestion tube at 420 °C until the digested solution became
transparent. The digested solution was then cooled to room temperature, and distillation and
titration were performed as follows: The digestion tube with the digestion solution was attached
to the distillation unit and 30% (w/v) of NaOH solution was added to the digestion solution until
the solution turned black. Steam distillation was performed for approximately 15 min. The
distilled ammonia was received into DI water (30 mL) containing 2–4 mL of 0.05 M
hydrochloric acid (HCl) in the Erlenmeyer flask. A few drops of the indicator (a 0.05% (w/v)
methyl red-methylene blue ethanol solution) were added to the solution before titrating the
solution with a standardized 0.01 M NaOH solution. The CTS content (%) was determined using
equations (1) and (2):
CTS GlcN GlcNAcDDA 100 DDAM M M100 100
(1)
CTS HCl HCl NaOH NaOHM ( )CTScontent (%) 100C V C VW
(2)
where MCTS is the average molecular weight of a sugar unit of CTS and MGlcN and MGlcNAc are
the molecular weights of a glucosamine unit and an N-acetyl-glucosamine unit, respectively. C
(g/1000 mL) and V (mL) denote the concentrations and volumes of HCl and NaOH, respectively.
W (g) is the total weight of the tested sample.
2.2.3.3. Scanning electron microscopy (SEM)
SEM (JSM6700, JEOL, Japan) was used for analyzing the morphology of
the obtained samples and observed at an accelerating voltage of 5 kV with 20 k magnification.
25
The diameter-size distribution of the BC nanofibers was analyzed using image visualization
software with the SEM images.
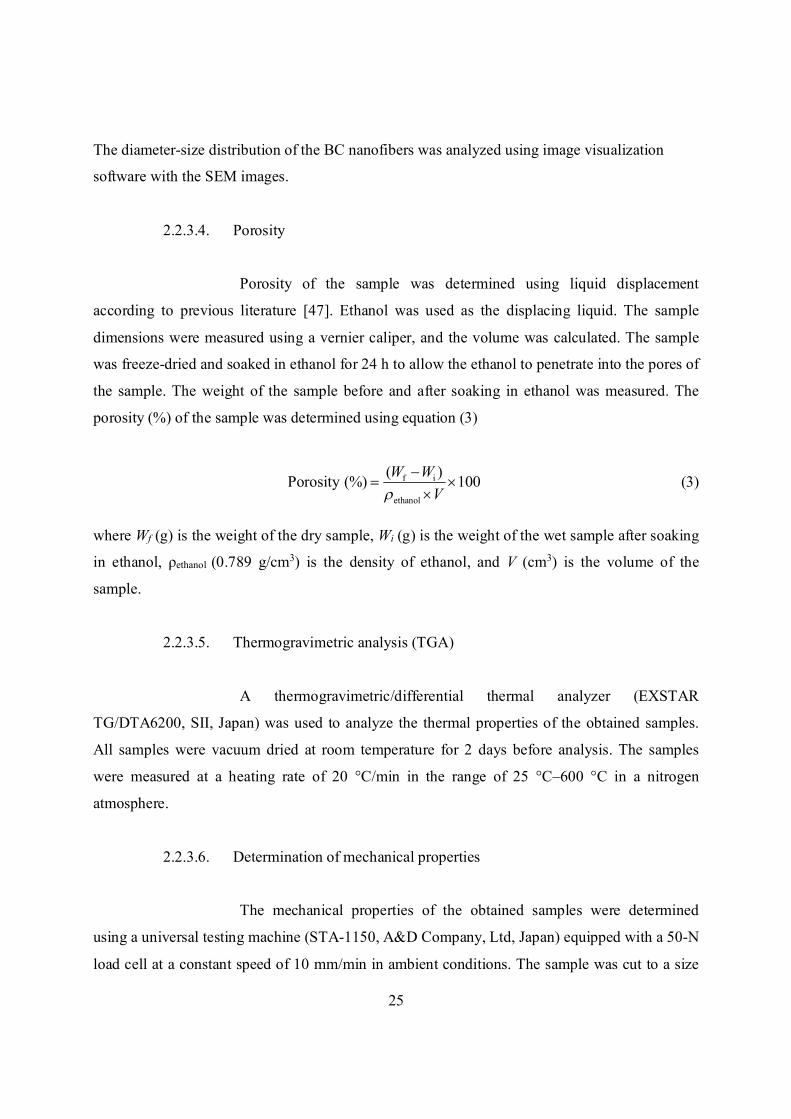
2.2.3.4. Porosity
Porosity of the sample was determined using liquid displacement
according to previous literature [47]. Ethanol was used as the displacing liquid. The sample
dimensions were measured using a vernier caliper, and the volume was calculated. The sample
was freeze-dried and soaked in ethanol for 24 h to allow the ethanol to penetrate into the pores of
the sample. The weight of the sample before and after soaking in ethanol was measured. The
porosity (%) of the sample was determined using equation (3)
f i
ethanol
( )Porosity (%) 100W WV
(3)
where Wf (g) is the weight of the dry sample, Wi (g) is the weight of the wet sample after soaking
in ethanol, ρethanol (0.789 g/cm3) is the density of ethanol, and V (cm3) is the volume of the
sample.
2.2.3.5. Thermogravimetric analysis (TGA)
A thermogravimetric/differential thermal analyzer (EXSTAR
TG/DTA6200, SII, Japan) was used to analyze the thermal properties of the obtained samples.
All samples were vacuum dried at room temperature for 2 days before analysis. The samples
were measured at a heating rate of 20 °C/min in the range of 25 °C–600 °C in a nitrogen
atmosphere.
2.2.3.6. Determination of mechanical properties
The mechanical properties of the obtained samples were determined
using a universal testing machine (STA-1150, A&D Company, Ltd, Japan) equipped with a 50-N
load cell at a constant speed of 10 mm/min in ambient conditions. The sample was cut to a size
26
of 30 mm in length and 5 mm in width, was mounted in tensile grips before the analysis, and was
measured more than 10 times. Tensile parameters, including tensile strength and elongation at
break, were determined from the stress–strain curves obtained from the force–distance data.
2.2.4. Fabrication of EDLCs cells
The BC, BC/(CTS/Alg)5, BC/(CTS/Alg)10 and BC/(CTS/Alg)15 samples were cut
into 16-mm diameter disks and immersed in EMImBF4. The immersed samples were then
vacuumed under 0.3 Pa at room temperature for 48 h to remove impurities such as methanol and
moisture. The thicknesses of the obtained gel electrolytes were approximately 100 µm.
An activated-carbon composite electrode for a test cell was prepared via the
following process. Activated carbon, acetylene black (as a conductive additive), 1.2% (w/w)
sodium carboxymethyl cellulose (as a dispersant), and 48% (w/w) styrene-butadiene rubber (as a
binder) were homogeneously dispersed in DI water with a weight ratio of 90:5:3:2. The obtained
electrode slurry was cast onto an etched aluminum current collector and dried, and the obtained
composite electrode sheet was cut into 12-mm diameter disks.
A pair of activated-carbon electrodes was immersed in EMImBF4 for 10 min
under a vacuum before assembling the test cells. Two-electrode coin cells were assembled using
this pair of electrodes and a gel electrolyte (one of the samples described previously) for
electrochemical measurements. A test cell containing EMImBF4 as a liquid electrolyte with a
cellulose separator (TF4035, Nippon Kodoshi Corporation, Japan) was also fabricated for
comparison. All assembly procedures were conducted in an argon-filled glove box.
2.2.5. Electrochemical measurement
The performances of these EDLC test cells were measured using a battery charge–
discharge apparatus (HJ1001 SM8, Hokuto Denko Corporation, Japan). The charge–discharge
tests were conducted with a voltage range of 0–2.5 V at several current densities in the range of
2.5–100 mA/cm2. The discharge-rate performance of the EDLCs at various discharge current
densities was also estimated after applying a constant-current charge up to 2.5 V. The discharge
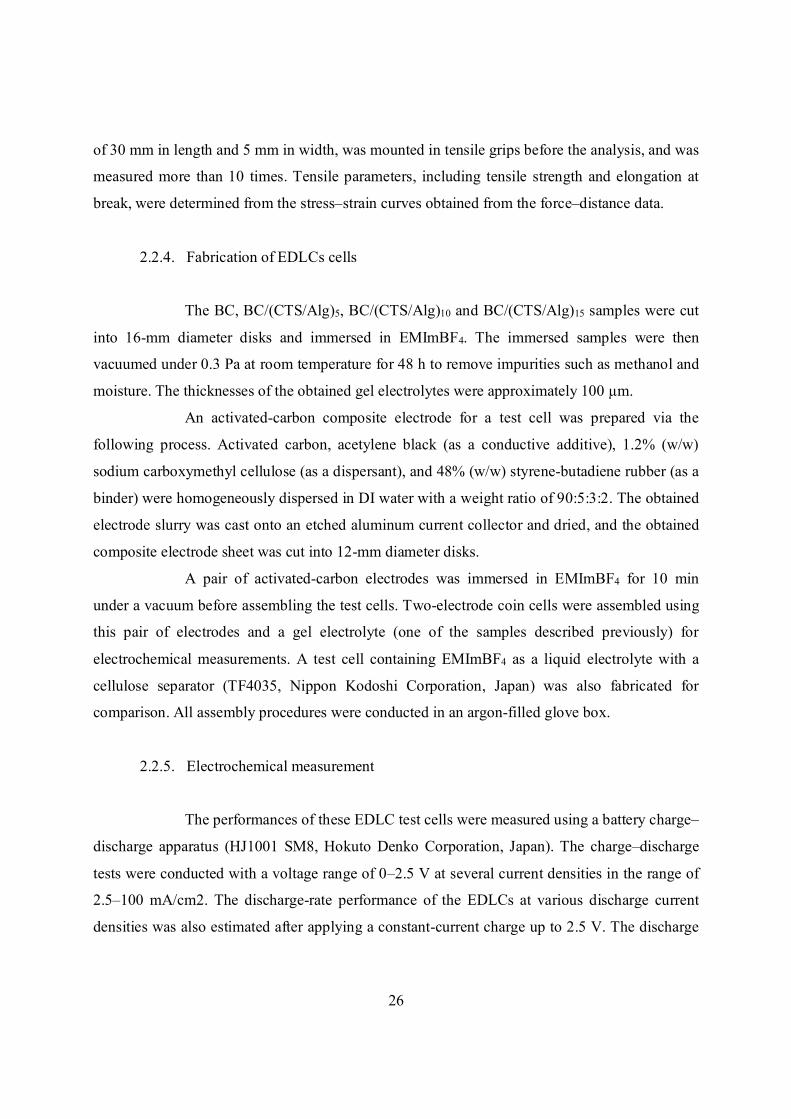
27
capacitance of a single electrode in the present EDLC symmetrical cells was determined using
equation (4):
( / 2)I tC
V W
(4)
where C (F/g) is the discharge capacitance, I (A) is the discharge current, t (s) is the discharge
time, V (V) is the operating voltage, and W (g) is the mass loading of activated carbon at a single
electrode [35–38]. Alternative current (AC) impedance of the test cells was measured using a
potentiogalvanostat (SI 1287 type, Solartron Analytical, UK) and frequency response analyzer
(SI 1260 type, Solartron Analytical, UK). The AC amplitude was 10 mVp-0 and the frequency
range was 500 kHz–10 mHz. All of the electrochemical measurements were carried out at 25 °C.
2.3. Results and discussion
2.3.1. Characterization of gel electrolyte
2.3.1.1. Determination of CTS content
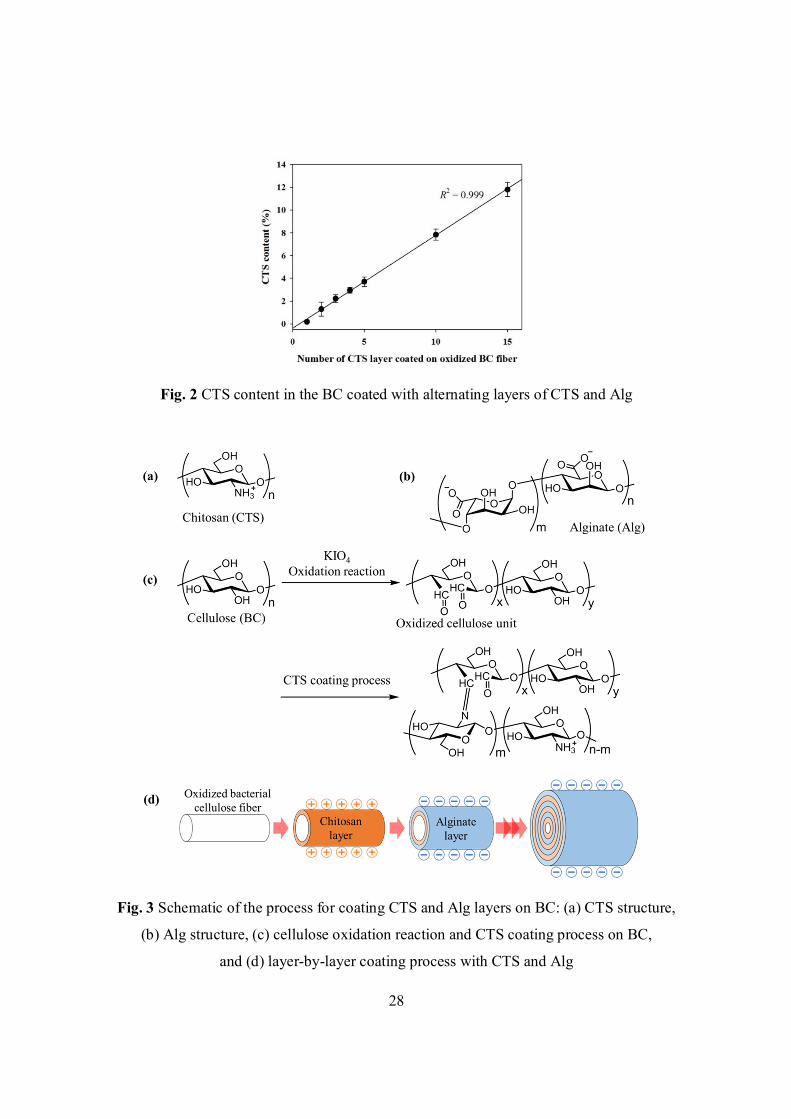
After coating with alternating layers of CTS and Alg, the CTS content (%)
in the BC of several samples is shown in Fig. 2. The results show that the CTS content linearly
increased (R2 = 0.999) when the number of CTS layers on the BC increased, implying that the
layers of CTS and Alg bound to each fiber of BC. A schematic of the coating process is shown in
Fig. 3.
28
Fig. 2 CTS content in the BC coated with alternating layers of CTS and Alg
Fig. 3 Schematic of the process for coating CTS and Alg layers on BC: (a) CTS structure,
(b) Alg structure, (c) cellulose oxidation reaction and CTS coating process on BC,
and (d) layer-by-layer coating process with CTS and Alg
29
2.3.1.2. FTIR
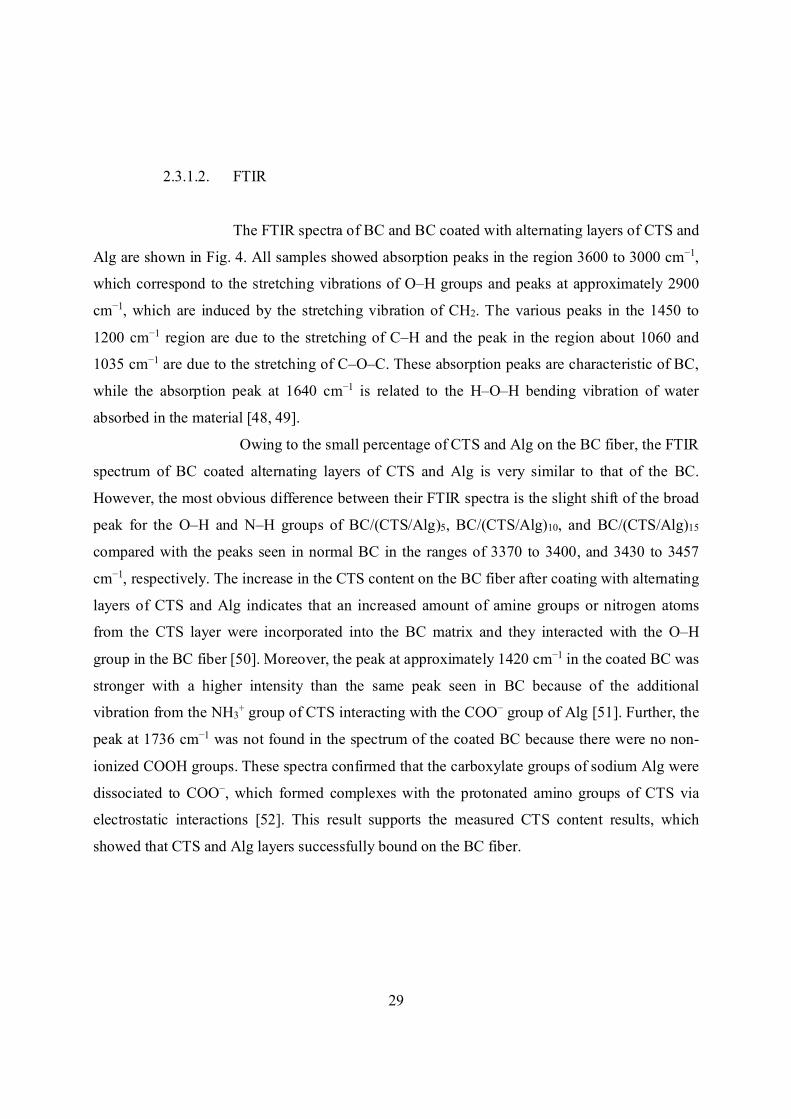
The FTIR spectra of BC and BC coated with alternating layers of CTS and
Alg are shown in Fig. 4. All samples showed absorption peaks in the region 3600 to 3000 cm−1,
which correspond to the stretching vibrations of O–H groups and peaks at approximately 2900
cm−1, which are induced by the stretching vibration of CH2. The various peaks in the 1450 to
1200 cm−1 region are due to the stretching of C–H and the peak in the region about 1060 and
1035 cm−1 are due to the stretching of C–O–C. These absorption peaks are characteristic of BC,
while the absorption peak at 1640 cm−1 is related to the H–O–H bending vibration of water
absorbed in the material [48, 49].
Owing to the small percentage of CTS and Alg on the BC fiber, the FTIR
spectrum of BC coated alternating layers of CTS and Alg is very similar to that of the BC.
However, the most obvious difference between their FTIR spectra is the slight shift of the broad
peak for the O–H and N–H groups of BC/(CTS/Alg)5, BC/(CTS/Alg)10, and BC/(CTS/Alg)15
compared with the peaks seen in normal BC in the ranges of 3370 to 3400, and 3430 to 3457
cm−1, respectively. The increase in the CTS content on the BC fiber after coating with alternating
layers of CTS and Alg indicates that an increased amount of amine groups or nitrogen atoms
from the CTS layer were incorporated into the BC matrix and they interacted with the O–H
group in the BC fiber [50]. Moreover, the peak at approximately 1420 cm−1 in the coated BC was
stronger with a higher intensity than the same peak seen in BC because of the additional
vibration from the NH3+ group of CTS interacting with the COO− group of Alg [51]. Further, the
peak at 1736 cm−1 was not found in the spectrum of the coated BC because there were no non-
ionized COOH groups. These spectra confirmed that the carboxylate groups of sodium Alg were
dissociated to COO−, which formed complexes with the protonated amino groups of CTS via
electrostatic interactions [52]. This result supports the measured CTS content results, which
showed that CTS and Alg layers successfully bound on the BC fiber.
30
Fig. 4 Fourier transform infrared spectroscopy spectra of (a) BC, (b) BC/(CTS/Alg)5,
(c) BC/(CTS/Alg)10, and (d) BC/(CTS/Alg)15
2.3.1.3. SEM
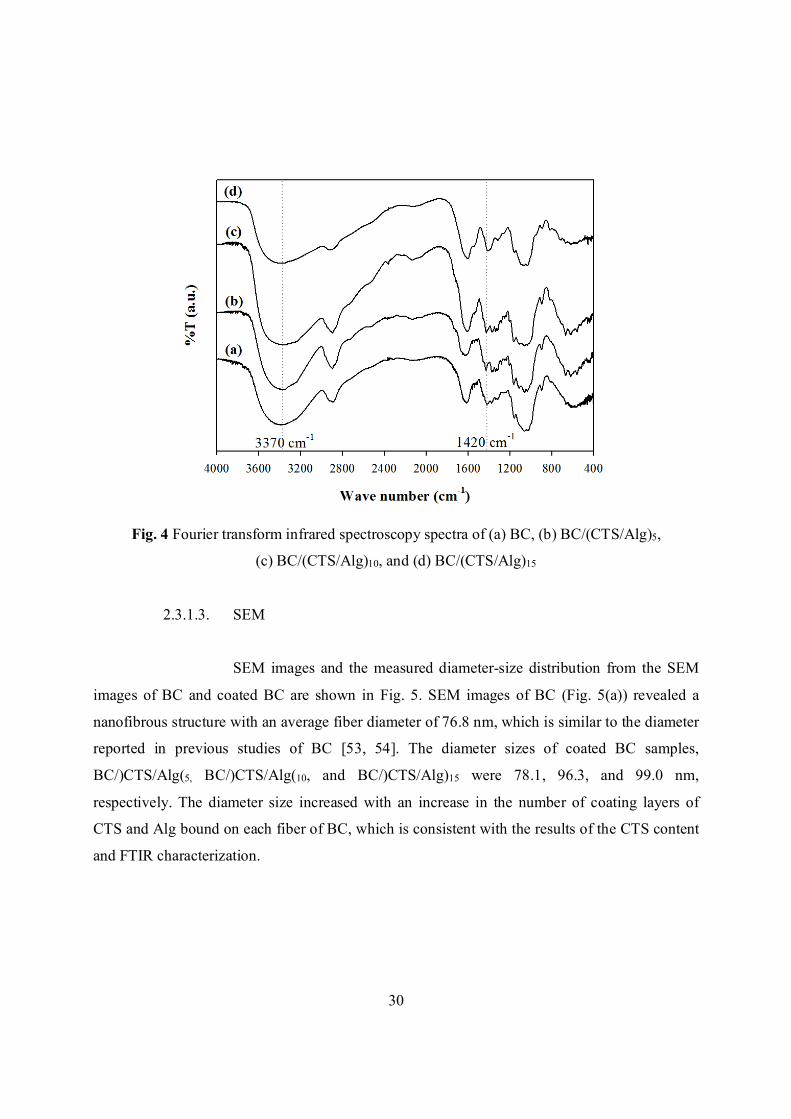
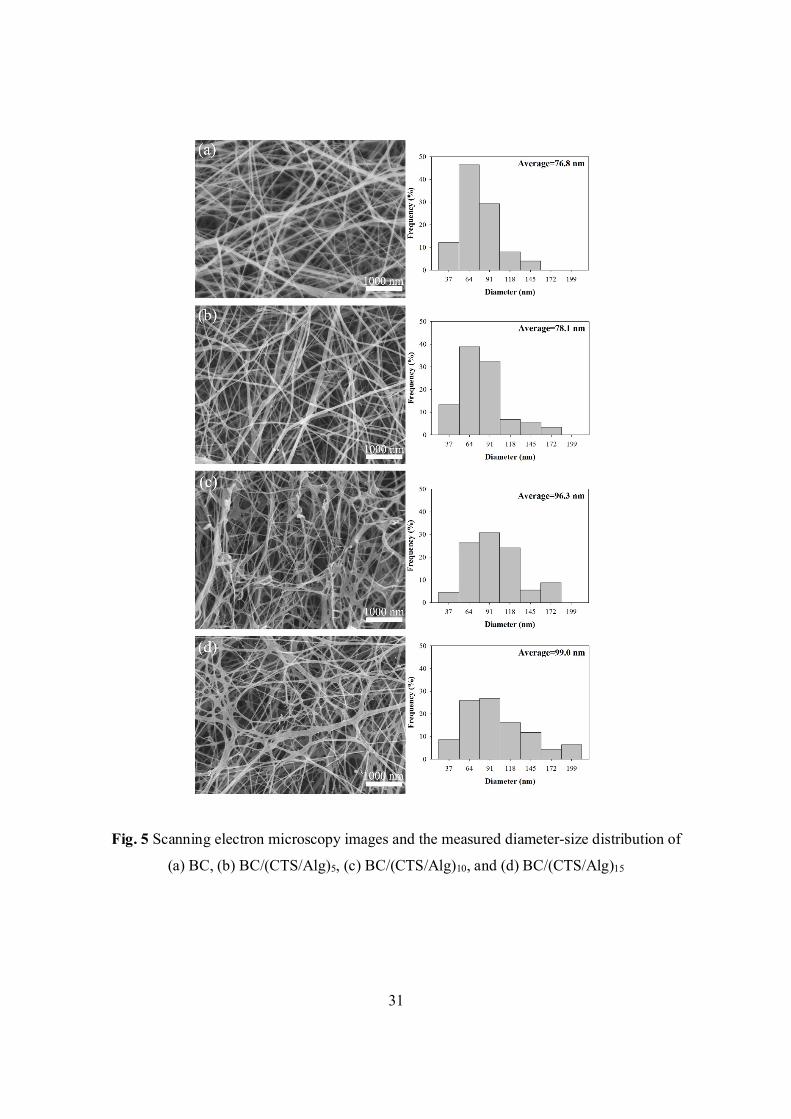
SEM images and the measured diameter-size distribution from the SEM
images of BC and coated BC are shown in Fig. 5. SEM images of BC (Fig. 5(a)) revealed a
nanofibrous structure with an average fiber diameter of 76.8 nm, which is similar to the diameter
reported in previous studies of BC [53, 54]. The diameter sizes of coated BC samples,
BC/)CTS/Alg(5, BC/)CTS/Alg(10, and BC/)CTS/Alg)15 were 78.1, 96.3, and 99.0 nm,
respectively. The diameter size increased with an increase in the number of coating layers of
CTS and Alg bound on each fiber of BC, which is consistent with the results of the CTS content
and FTIR characterization.
31
Fig. 5 Scanning electron microscopy images and the measured diameter-size distribution of
(a) BC, (b) BC/(CTS/Alg)5, (c) BC/(CTS/Alg)10, and (d) BC/(CTS/Alg)15

32
2.3.1.4. Porosity
The porosity at swelling stage of BC, BC/)CTS/Alg(5, BC/)CTS/Alg(10,
and BC/)CTS/Alg)15 were 93.5, 89.9, 88.1, and 83.3%, respectively. The porosity of the obtained
samples decreased with an increase in the number of coating layers of CTS and Alg onto the BC
fiber. This result suggests that the porosity of the BC gel decreased with the increase of the
diameters of BC fibers which were obtained from the SEM observation.
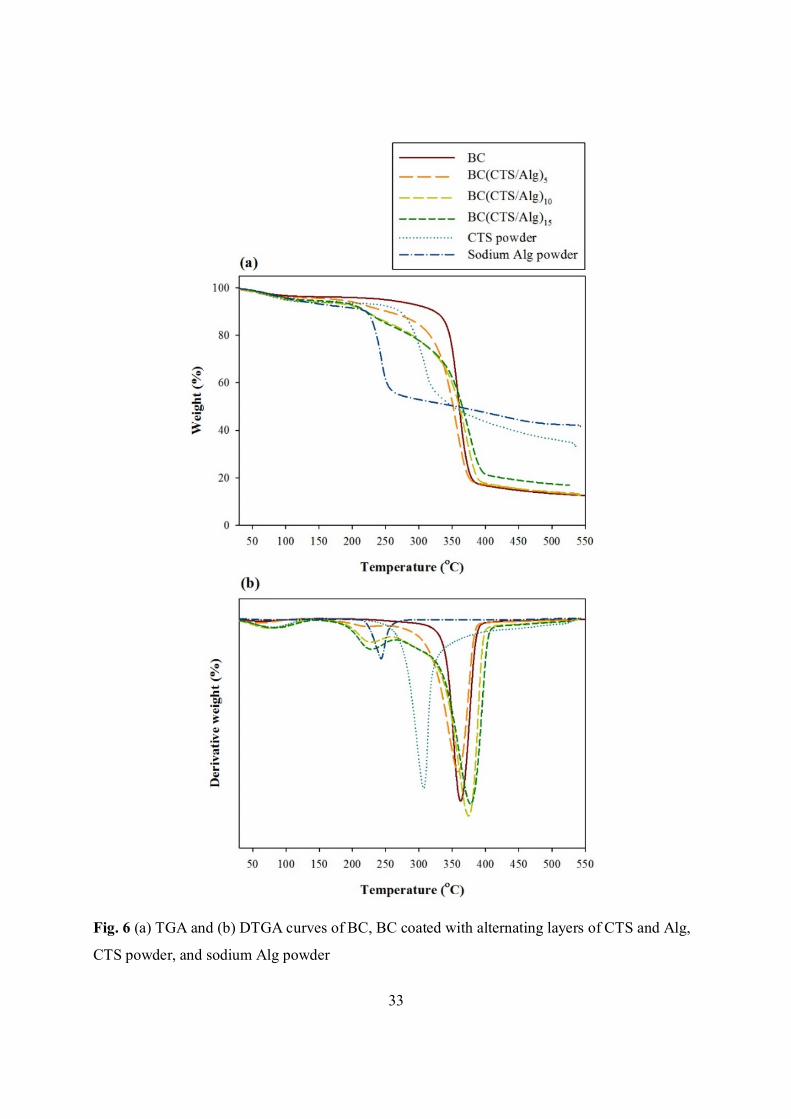
2.3.1.5. TGA
The TGA and differential TGA (DTGA) curves of BC, coated BC, CTS
powder, and sodium Alg powder are shown in Fig. 6. The CTS and sodium Alg powder had
degradation temperatures at 305 °C and 240 °C due to the decomposition of CTS [55] and
sodium Alg [56], respectively. BC and coated BC demonstrated a weight loss due to evaporation
of the volatile content between 30 °C–130 °C; the amount of this evaporated volatile content
increased in the coated BC compared to BC. The BC sample showed mere one step of
degradation at approximately 360 °C owing to the dehydration and the decomposition of
cellulose molecules [57, 58]. The coated BC showed two steps of degradation; the first
degradation step occurred in the range of 180 °C–270 °C, which is in the same range as that of
the degradation of sodium Alg and CTS, and it is therefore possible that this observation is due
to the complex degradation process of Alg and CTS; the second step of degradation occurred in
the range of 360 °C–380 °C, which is similar to the degradation observed in BC due to
dehydration and decomposition of cellulose molecules. Therefore, the results further
demonstrated that the process of coating layers of CTS and Alg on the BC fiber was successful.
In addition, all obtained samples of coated BC showed high thermal
stability; therefore, this material has potential to be used as gel electrolyte in EDLCs at high
operating temperatures.
33
Fig. 6 (a) TGA and (b) DTGA curves of BC, BC coated with alternating layers of CTS and Alg,
CTS powder, and sodium Alg powder
34
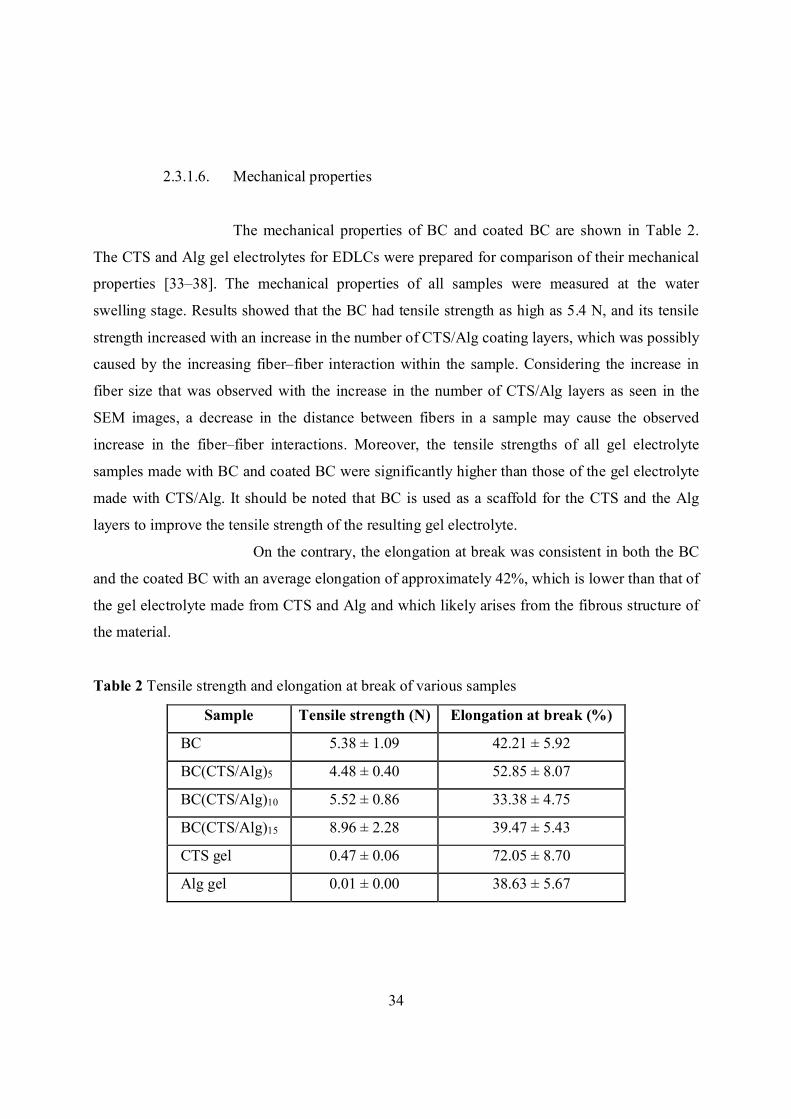
2.3.1.6. Mechanical properties
The mechanical properties of BC and coated BC are shown in Table 2.
The CTS and Alg gel electrolytes for EDLCs were prepared for comparison of their mechanical
properties [33–38]. The mechanical properties of all samples were measured at the water
swelling stage. Results showed that the BC had tensile strength as high as 5.4 N, and its tensile
strength increased with an increase in the number of CTS/Alg coating layers, which was possibly
caused by the increasing fiber–fiber interaction within the sample. Considering the increase in
fiber size that was observed with the increase in the number of CTS/Alg layers as seen in the
SEM images, a decrease in the distance between fibers in a sample may cause the observed
increase in the fiber–fiber interactions. Moreover, the tensile strengths of all gel electrolyte
samples made with BC and coated BC were significantly higher than those of the gel electrolyte
made with CTS/Alg. It should be noted that BC is used as a scaffold for the CTS and the Alg
layers to improve the tensile strength of the resulting gel electrolyte.
On the contrary, the elongation at break was consistent in both the BC
and the coated BC with an average elongation of approximately 42%, which is lower than that of
the gel electrolyte made from CTS and Alg and which likely arises from the fibrous structure of
the material.
Table 2 Tensile strength and elongation at break of various samples
Sample Tensile strength (N) Elongation at break (%)
BC 5.38 ± 1.09 42.21 ± 5.92
BC(CTS/Alg)5 4.48 ± 0.40 52.85 ± 8.07
BC(CTS/Alg)10 5.52 ± 0.86 33.38 ± 4.75
BC(CTS/Alg)15 8.96 ± 2.28 39.47 ± 5.43
CTS gel 0.47 ± 0.06 72.05 ± 8.70
Alg gel 0.01 ± 0.00 38.63 ± 5.67
35
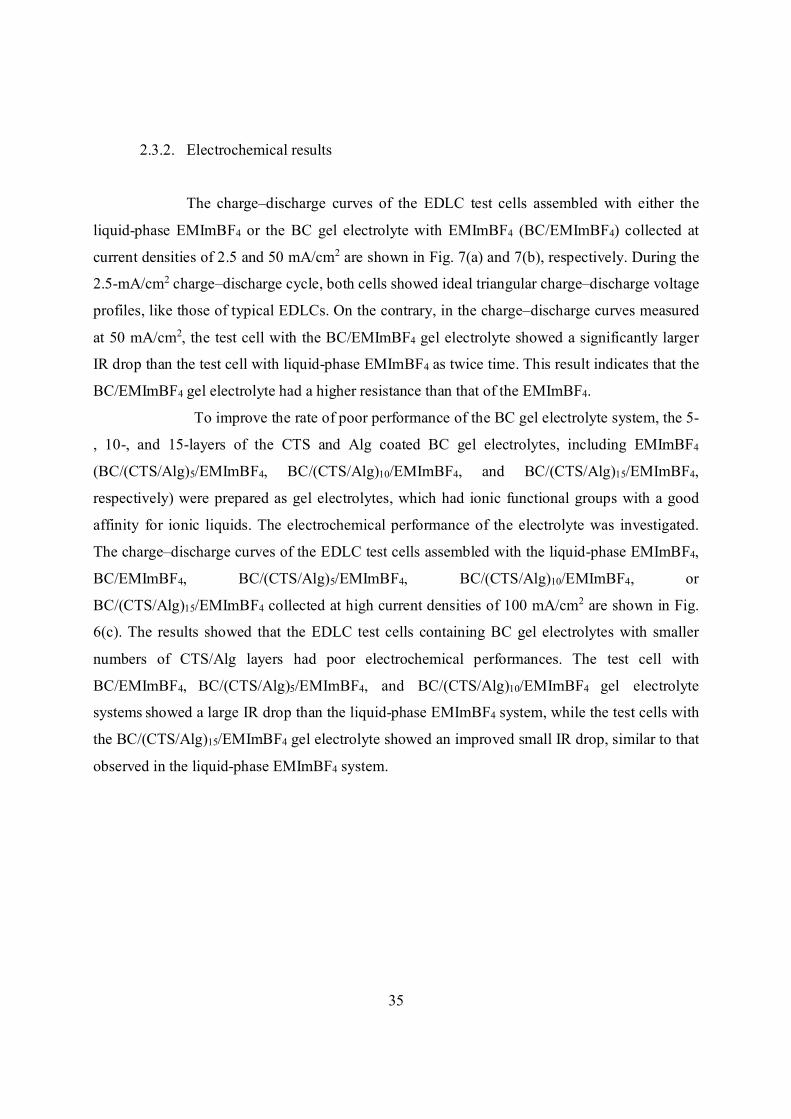
2.3.2. Electrochemical results
The charge–discharge curves of the EDLC test cells assembled with either the
liquid-phase EMImBF4 or the BC gel electrolyte with EMImBF4 (BC/EMImBF4) collected at
current densities of 2.5 and 50 mA/cm2 are shown in Fig. 7(a) and 7(b), respectively. During the
2.5-mA/cm2 charge–discharge cycle, both cells showed ideal triangular charge–discharge voltage
profiles, like those of typical EDLCs. On the contrary, in the charge–discharge curves measured
at 50 mA/cm2, the test cell with the BC/EMImBF4 gel electrolyte showed a significantly larger
IR drop than the test cell with liquid-phase EMImBF4 as twice time. This result indicates that the
BC/EMImBF4 gel electrolyte had a higher resistance than that of the EMImBF4.
To improve the rate of poor performance of the BC gel electrolyte system, the 5-
, 10-, and 15-layers of the CTS and Alg coated BC gel electrolytes, including EMImBF4
(BC/(CTS/Alg)5/EMImBF4, BC/(CTS/Alg)10/EMImBF4, and BC/(CTS/Alg)15/EMImBF4,
respectively) were prepared as gel electrolytes, which had ionic functional groups with a good
affinity for ionic liquids. The electrochemical performance of the electrolyte was investigated.
The charge–discharge curves of the EDLC test cells assembled with the liquid-phase EMImBF4,
BC/EMImBF4, BC/(CTS/Alg)5/EMImBF4, BC/(CTS/Alg)10/EMImBF4, or
BC/(CTS/Alg)15/EMImBF4 collected at high current densities of 100 mA/cm2 are shown in Fig.
6(c). The results showed that the EDLC test cells containing BC gel electrolytes with smaller
numbers of CTS/Alg layers had poor electrochemical performances. The test cell with
BC/EMImBF4, BC/(CTS/Alg)5/EMImBF4, and BC/(CTS/Alg)10/EMImBF4 gel electrolyte
systems showed a large IR drop than the liquid-phase EMImBF4 system, while the test cells with
the BC/(CTS/Alg)15/EMImBF4 gel electrolyte showed an improved small IR drop, similar to that
observed in the liquid-phase EMImBF4 system.
36
Fig. 7 Charge–discharge curves of the EDLC test cells assembled with the liquid-phase
EMImBF4 or the obtained gel electrolytes, collected at current densities of (a) 2.5, (b) 50 and (c)
100 mA/cm2
In addition, the discharge capacitances of the test cells assembled with the
liquid-phase EMImBF4 and various gel electrolytes as a function of the applied current density
(2.5–100 mA/cm2) are shown in Fig. 8. The test cells with BC/EMImBF4,
BC/(CTS/Alg)5/EMImBF4, and BC/(CTS/Alg)10/EMImBF4 gel electrolyte showed lower
discharge capacitance retention than the liquid-phase EMImBF4 system, and their difference
became more significant with an increase in current density, while the test cells with the
BC/(CTS/Alg)15/EMImBF4 gel electrolyte showed a relatively higher discharge capacitance than
the test cells with the liquid-phase EMImBF4 system across the entire current density range. The
calculated capacitance retentions from the initial current density of 2.5 to 100 mA/cm2 of the test
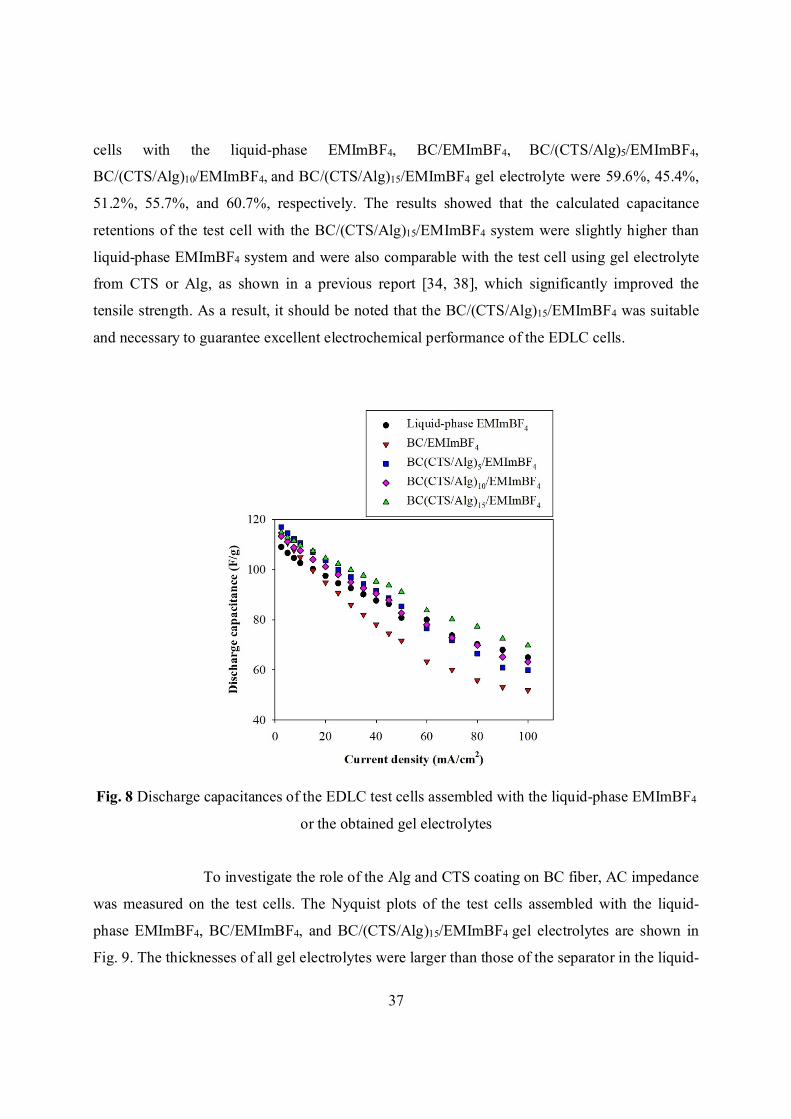
37
cells with the liquid-phase EMImBF4, BC/EMImBF4, BC/(CTS/Alg)5/EMImBF4,
BC/(CTS/Alg)10/EMImBF4, and BC/(CTS/Alg)15/EMImBF4 gel electrolyte were 59.6%, 45.4%,
51.2%, 55.7%, and 60.7%, respectively. The results showed that the calculated capacitance
retentions of the test cell with the BC/(CTS/Alg)15/EMImBF4 system were slightly higher than
liquid-phase EMImBF4 system and were also comparable with the test cell using gel electrolyte
from CTS or Alg, as shown in a previous report [34, 38], which significantly improved the
tensile strength. As a result, it should be noted that the BC/(CTS/Alg)15/EMImBF4 was suitable
and necessary to guarantee excellent electrochemical performance of the EDLC cells.
Fig. 8 Discharge capacitances of the EDLC test cells assembled with the liquid-phase EMImBF4
or the obtained gel electrolytes
To investigate the role of the Alg and CTS coating on BC fiber, AC impedance
was measured on the test cells. The Nyquist plots of the test cells assembled with the liquid-
phase EMImBF4, BC/EMImBF4, and BC/(CTS/Alg)15/EMImBF4 gel electrolytes are shown in
Fig. 9. The thicknesses of all gel electrolytes were larger than those of the separator in the liquid-
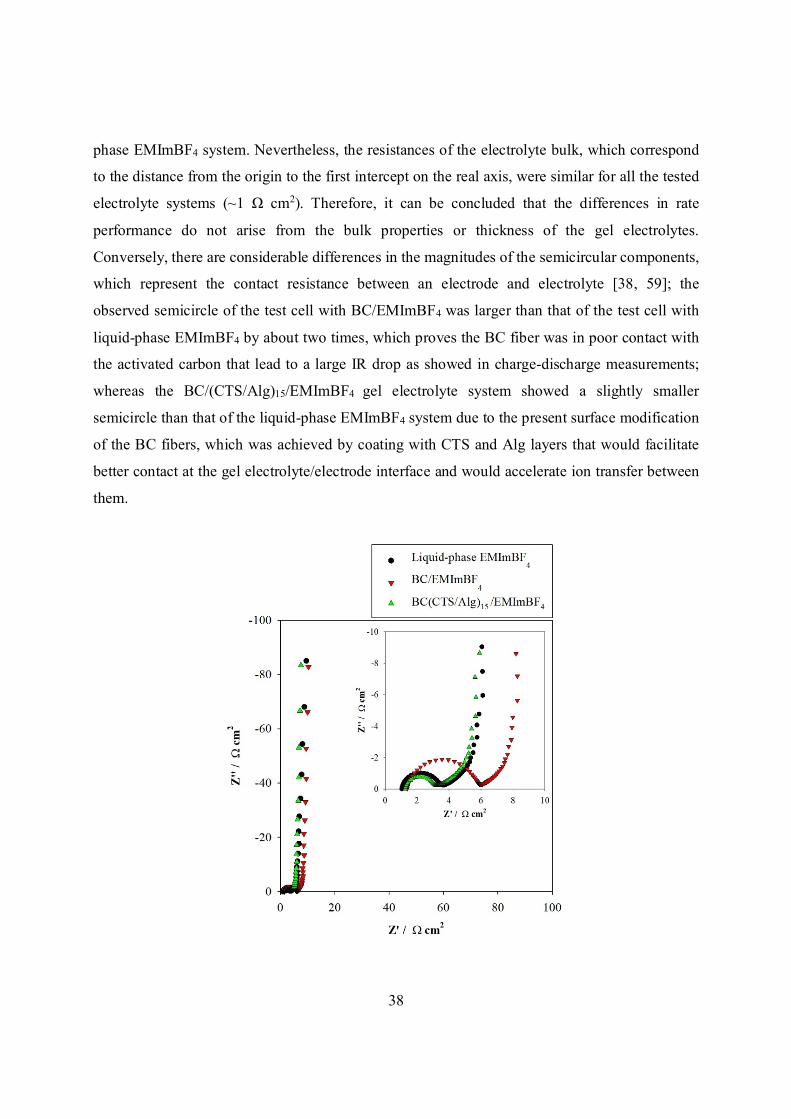
38
phase EMImBF4 system. Nevertheless, the resistances of the electrolyte bulk, which correspond
to the distance from the origin to the first intercept on the real axis, were similar for all the tested
electrolyte systems (~1 Ω cm2). Therefore, it can be concluded that the differences in rate
performance do not arise from the bulk properties or thickness of the gel electrolytes.
Conversely, there are considerable differences in the magnitudes of the semicircular components,
which represent the contact resistance between an electrode and electrolyte [38, 59]; the
observed semicircle of the test cell with BC/EMImBF4 was larger than that of the test cell with
liquid-phase EMImBF4 by about two times, which proves the BC fiber was in poor contact with
the activated carbon that lead to a large IR drop as showed in charge-discharge measurements;
whereas the BC/(CTS/Alg)15/EMImBF4 gel electrolyte system showed a slightly smaller
semicircle than that of the liquid-phase EMImBF4 system due to the present surface modification
of the BC fibers, which was achieved by coating with CTS and Alg layers that would facilitate
better contact at the gel electrolyte/electrode interface and would accelerate ion transfer between
them.
39
Fig. 9 Nyquist plots obtained using AC impedance measurements of the EDLC test cells
assembled with the liquid-phase EMImBF4, BC/EMImBF4, or BC/(CTS/Alg)15/EMImBF4 gel
electrolyte
2.4. Conclusions
In this study, a novel gel electrolyte was successfully prepared using BC coated with
alternating layers of CTS and Alg for employing it as both an electrolyte and a separator in solid-
state EDLCs. These gel electrolytes were produced via inoculation of the BC, oxidation in a
KIO4 solution, and coating with CTS layers alternated with Alg layers. Through analysis and
characterization of the gel electrolytes, the CTS content linearly increased (R2 = 0.999) when the
number of CTS layers on the BC increased, suggesting that the layers of CTS and Alg
successfully bound onto each BC fiber. The FTIR spectra of the coated BC showed a stronger
peak at 1420 cm−1 than unmodified BC due to the vibration of NH3+ groups from CTS
interacting with the COO− groups of Alg. Morphological analysis from SEM images of the
obtained gel electrolyte revealed a nanofibrous structure with diameter sizes of 76.8, 78.1, 96.3,
and 99.0 nm , and the porosity were 93.5, 89.9, 88.1, and 83.3 % for the BC, BC/)CTS/Alg(5,
BC/)CTS/Alg(10, and BC/)CTS/Alg)15 samples, respectively. The TGA and DTGA results
revealed that the all obtained gel electrolytes had high thermal stabilities; the tensile
measurement result showed very high tensile strengths in the coated BC samples as compared
with the gel electrolytes made from raw CTS or Alg.
The electrochemical properties of EDLC test cells, which were assembled from the
obtained gel electrolytes and carbon electrodes, were measured in terms of their charge–
discharge characteristics, discharge capacitances, and AC impedance. The test cell with the
BC/)CTS/Alg)15/EMImBF4 gel electrolyte showed a comparable IR drop to the test cell with
liquid-EMImBF4 at switching point from charge to discharge when tested at a high current
density and a higher discharge capacitance than the test cell with liquid-phase EMImBF4 across
the current density range, indicating that the internal resistance of the test cell decreases when the
coated BC was used as the gel electrolyte. Likewise, the AC impedance results seen in the
Nyquist plot of the test cell with BC/)CTS/Alg)15 represent the decrease in resistance compared
with the resistance of the test cell with liquid-phase EMImBF4, which verified that the high
affinity of the proposed gel electrolyte for activated-carbon electrodes can reduce the charge-
40
transfer resistance at the electrode/electrolyte interface. The device performances demonstrate
that it is possible to design simple high-operating-voltage EDLCs that can replace liquid-based
electrolyte systems, and thus improve the safety of such devices.
2.5. References
[1] Y. Honda, M. Takeshige, H. Shiozaki, T. Kitamura, K. Yoshikawa, S. Chakrabati, O.
Suekane, L. Pen, Y. Nakayama, M. Yamagata, M. Ishikawa, J. Power Sources 185, 1580–
1584 (2008)
[2] S. Yamazaki, T. Ito, M. Yamagata, M. Ishikawa, Electrochim. Acta 86, 297–297 (2012)
[3] S. Yamazaki, K. Obata, Y. Okuhama, Y. Matsuda, M. Yamagata, M. Ishikawa, J. Power
Sources 195, 1753–1756 (2010)
[4] M. Galiński, A. Lewandowski, I. Stępniak, Electrochim. Acta 51, 5567–5580 (2006)
[5] M. Tokita, N. Yoshimoto, K. Fujii, M. Morita, Electrochim. Acta 209, 210–218 (2016)
[6] R.A. Sheldon, Green Chem. 7, 267–278 (2005)
[7] F. Endres, S.Z.E. Abedin, Phys. Chem. Chem. Phys. 8, 2101–2116 (2006)
[8] N.V. Plechkova, K.R. Seddon, Chem. Soc. Rev. 37, 123–150 (2008)
[9] A. Lewandowski, M. Galiński, J. Phys. Chem. Solids 65, 281–286 (2004)
[10] Z. Zhou, M. Takeda, M. Ue, J. Fluorine Chem. 125, 471–476 (2004)
[11] T. Sato, G. Masuda, K. Takagi, Electrochim. Acta 49, 3603–3611 (2004)
[12] 12. K. Yuyama, G. Masuda, H. Yoshida, T. Sato, J. Power Sources 162, 1401–1408 (2006)
[13] C.O. Ania, J. Pernak, F. Stefaniak, E. Raymundo-Piñero, F. Béguin, Carbon 44, 3126–
3130 (2006)
[14] N. Handa, T. Sugimoto, M. Yamagata, M. Kikuta, M. Kono, M. Ishikawa, J. Power
Sources 185, 1585–1588 (2008)
[15] M.M. Rao, J.S. Liu, W.S. Li, Y. Liang, D.Y. Zhou, J. Membr. Sci. 322, 314–319 (2008)
[16] B. Rupp, M. Schmuck, A. Balducci, M. Winter, W. Kern, Eur. Polym. J. 44, 2986–2990
(2008)
[17] M. Rao, X. Geng, Y. Liao, S. Hu, W. Li, J. Membr. Sci. 399-400, 37–42 (2012)
[18] R. Prasanth, N. Shubha, H.H. Hng, M. Srinivasan, Eur. Polym. J. 49, 307–318 (2013)
41
[19] K. Karuppasamy, P.A. Reddy, G. Srinivas, A. Tewari, R. Sharma, X.S. Shajan, D. Gupta,
J. Membr. Sci. 514, 350–357 (2016)
[20] P.F.R. Ortega, J.P.C. Trigueiro, G.G. Silva, R.L. Lavall, Electrochim. Acta 188, 809–817
(2016)
[21] M. Safa, A. Chamaani, N. Chawla, B. El-Zahab, Electrochim. Acta 213, 587–593 (2016)
[22] J. Rymarczyk, M. Carewska, G.B. Appetecchi, D. Zane, F. Alessandrini, S. Passerini, Eur.
Polym. J. 44, 2153–2161 (2008)
[23] N.N. Mobarak, N. Ramli, A. Ahmad, M.Y.A. Rahman, Solid State Ionics 224, 51–57
(2012)
[24] N.N. Mobarak, F.N. Jumaah, M.A. Ghani, M.P. Abdullah, A. Ahmad, Electrochim. Acta
175, 224–231 (2015)
[25] S. Rudhziah, M.S.A. Rani, A. Ahmad, N.S. Mohamed, H. Kaddami, Ind. Crops Prod. 72,
133–141 (2015)
[26] T.M.D. Palma, F. Migliardini, D. Caputo, P. Corbo, Carbohydr. Polym. 157, 122–127
(2017)
[27] E. Rapharl, C.O. Avellaneda, B. Manzolli, A. Pawlicka, Electrochim. Acta 55, 1455–1459
(2010)
[28] R. Leones, F. Sentanin, L.C. Rodrigues, I.M. Marrucho, J.M.S.S. Esperança, A. Pawlicka,
M.M. Silva, Express Polym. Lett. 6(12), 1007–1016 (2012)
[29] A.S.A. Khiar, A.K. Arof, Ionics 16, 123–129 (2010)
[30] M. Kumar, T. Tiwari, N. Srivastava, Carbohydr. Polym. 88, 54–60 (2012)
[31] M.F. Shukur, R. Ithnin, M.F.Z. Kadir, Electrochim. Acta 136, 204–216 (2014)
[32] Y.N. Sudhakar, M. Selvakumar, D. K. Bhat, Mater. Sci. Eng., B 180, 12–19 (2014)
[33] K. Soeda, M. Yamagata, S. Yamazaki, M. Ishikawa, Electrochemistry 81(10), 867–872
(2013)
[34] M. Yamagata, K. Soeda, S. Ikebe, S. Yamazaki, M. Ishikawa, Electrochim. Acta 100, 275–
280 (2013)
[35] M.Yamagata, K. Soeda, S. Ikebe, S. Yamazaki, M. Ishikawa, J. Electrochem. Soc. 41(22),
25–34 (2012)
[36] M. Yamagata, K. Soeda, S. Yamazaki, M. Ishikawa, J. Electrochem. Soc. 25(35), 193–200
(2010)
42
[37] M. Yamagata, S. Ikebe, Y. Kasai, K. Soeda, M. Ishikawa, J. Electrochem. Soc. 50(43), 27–
36 (2013)
[38] K. Soeda, M. Yamagata, M. Ishikawa, J. Power Sources 280, 565–572 (2015)
[39] Z. Wan, L. Wang, X. Yang, J. Guo, S. Yin, Food Hydrocoll. 61, 269–276 (2016)
[40] M.H. Kwak, J.E. Kim, J. Go, E.K. Koh, S.H. Song, H.J. Son, H.S. Kim, Y.H. Yun, Y.J.
Jung, D.Y. Hwang, Carbohydr. Polym. 122, 387–398 (2015)
[41] S. Hestrin, M. Schramm, Biochem. J. 58, 345–352 (1954)
[42] J.K. Park, J.Y. Jung, Y.H. Park, Biotechnol. Lett. 25, 2055–2059 (2003)
[43] J.H. Kim, S. Park, H. Kim, H.J. Kim, Y. Yang, Y.H. Kim, S. Jung, E. Kan, S.H. Lee,
Carbohydr. Polym. 157, 137–145 (2017)
[44] X.D. Liu, N. Nishi, S. Tokura, N. Sakairi, Carbohydr. Polym. 44, 233–238 (2001)
[45] J. Junsomboon, J. Jakmunee, Anal. Chim. Acta 627, 232–238 (2008)
[46] P. Campins-Falco, S. Meseguer-Lloret, T. Climent-Santamaria, C. Molins-Legua, Talanta
75, 1123–1126 (2008)
[47] B.S. Anisha, D. Sankar, A. Mohandas, K.P. Chennazhi, S.V. Nair, R. Jayakumar,
Carbohydr. Polym. 92, 1470–1476 (2013)
[48] G. Bali, M.B. Foston, H.M. O’Neill, B.R. Evans, J. He, A.J. Ragauskas, Carbohydr. Res.
374, 82–88 (2013)
[49] M. Ul-Islam, J.H. Ha, T. Khan, J.K. Park, Carbohydr. Polym. 92, 360–366 (2013)
[50] C. Liu, R. Bai, J. Membr. Sci. 267, 68–77 (2005)
[51] W.S.W. Ngah, S. Fatinathan, Chem. Eng. J. 143, 62–72 (2008)
[52] B. Smitha, S. Sridhar, A.A. Khan, Eur. Polym. J. 41, 1859–1866 (2005)
[53] M.L. Cacicedo, M.C. Castro, I. Servetas, L. Bosnea, K. Boura, P. Tsafrakidou, A. Dima, A.
Terpou, A. Koutinas, G. R. Castro, Bioresour. Technol. 213, 172–180 (2016)
[54] X. Fan, Y. Gao, W. He, H. Hu, M. Tian, K. Wang, S. Pan, Carbohydr. Polym. 151, 1068–
1072 (2016)
[55] I. Corazzari, R. Nistico, F. Turci, M.G. Faga, F. Franzoso, S. Tabasso, G. Magnacca,
Polym. Degrad. Stab. 112, 1–9 (2015)
[56] S. Liu, Y. Li, L. Li, Carbohydr. Polym. 160, 62–70 (2017)
[57] X. Lu, X. Shen, Carbohydr. Polym. 86, 239–244 (2011)
43
[58] J.A. Marins, B.G. Soares, H.S. Barud, S.J.L. Ribeiro, Mater. Sci. Eng., C 33, 3994–4001
(2013)
[59] A. Lewandowski, A. Świderska, Solid State Ionics 161, 243–249 (2003)
44
Chapter 3
Preparation and Characterization of Thin-film Electrolyte
from Chitosan.
45
3.1. Introduction
Electric double-layer capacitors (EDLCs), also known as super capacitors or
ultracapacitors, are electrochemical devices that have received much attention in recent years
because of their outstanding properties of long cycle lifetime and high sustained power density
[1–3]. Likewise, electrolytes based on natural polymers have been developed vigorously for
electric devices because of their biodegradation properties, low cost, non-toxicity, environmental
friendliness, richness in nature, and capacity to satisfy sustainable biopolymer development.
Many natural polymers have been used as polymer electrolytes, such as alginate [4–6], carrageen
[7, 8], agar [9, 10], starch [11–13], natural rubber [14, 15], pectin [16], cellulose [17], and
chitosan (CS) [18–20], the last of which is one of the most abundant biomaterials.
CS is a cationic biopolymer obtained from either fully or partially deacetylated chitin. As
a natural polymer, CS is a copolymer of D-glucosamine and N-acetyl-D-glucosamine connected
via β (1-4) linkage and is present in crustacean shells, insect exoskeletons, and cell walls of some
fungi [21–26]. CS is often identified by its degree of deacetylation (DDA), namely, the ratio of
D-glucosamine to N-acetyl-D-glucosamine. The DDA is typically in the range of 70%–100%
and relates to CS properties such as its surface energy, crystallinity and degradation [27, 28].
Because of its excellent biodegradability, biocompatibility, hemostasis, and antimicrobial
activity and the fact that it is easily processed into various forms (e.g., hydrogels, membranes,
scaffolds, beads, sponges, nanofibers, and nanoparticles), CS is extremely valuable for
biomedical and pharmaceutical applications [29]. Furthermore, many studies have reported that
CS is a promising electrolyte for EDLCs in terms of giving their high operating performance
[30–33].
Often referred to as green solvents [34–36], ionic liquids (ILs) are organic salts whose
melting points are near room temperature. One such IL is 1-ethyl-3-methylimidazolium
tetrafluoroborate (EMImBF4). With its high ionic conductivity and low viscosity, EMImBF4 is
widely used as an electrolyte in EDLCs [37–42]. In addition, ILs exhibit unique physicochemical
properties such as near-zero vapor pressure, high chemical and thermal stabilities, and the facts
that they remain liquid over a broad temperature range and are good at dissolving a variety of
organic and inorganic compounds [34–36]. As such, ILs have been studied recently for their
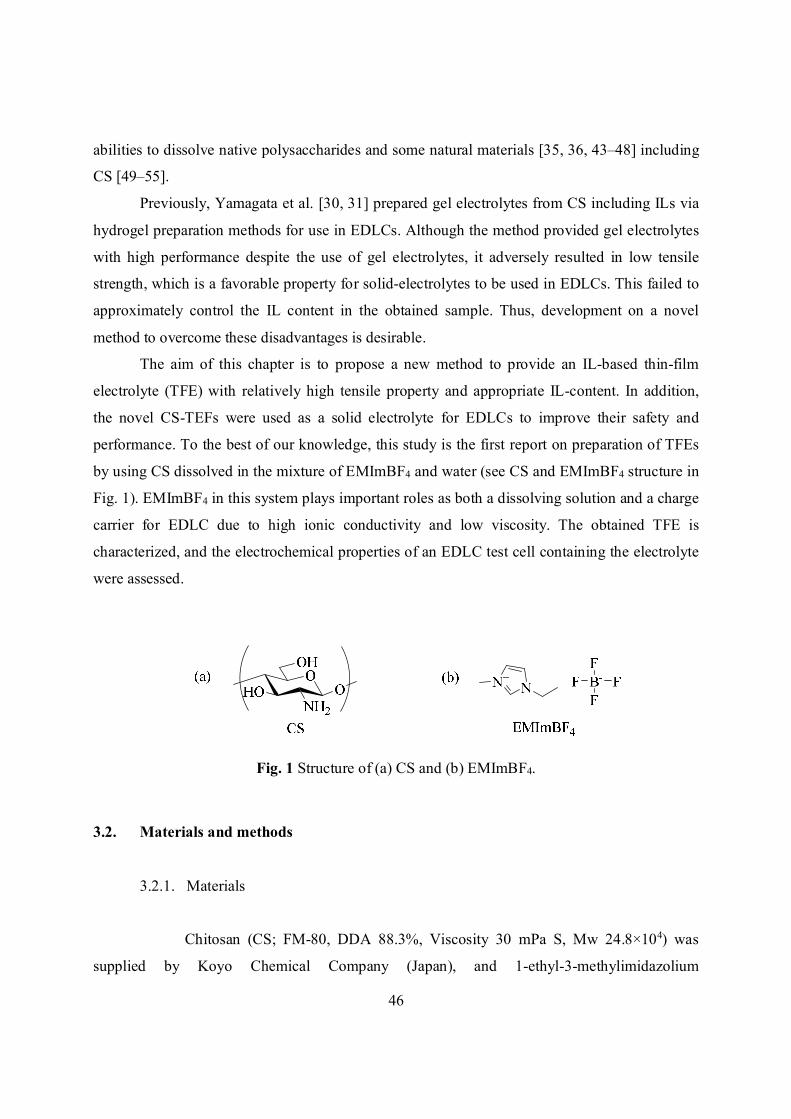
46
abilities to dissolve native polysaccharides and some natural materials [35, 36, 43–48] including
CS [49–55].
Previously, Yamagata et al. [30, 31] prepared gel electrolytes from CS including ILs via
hydrogel preparation methods for use in EDLCs. Although the method provided gel electrolytes
with high performance despite the use of gel electrolytes, it adversely resulted in low tensile
strength, which is a favorable property for solid-electrolytes to be used in EDLCs. This failed to
approximately control the IL content in the obtained sample. Thus, development on a novel
method to overcome these disadvantages is desirable.
The aim of this chapter is to propose a new method to provide an IL-based thin-film
electrolyte (TFE) with relatively high tensile property and appropriate IL-content. In addition,
the novel CS-TEFs were used as a solid electrolyte for EDLCs to improve their safety and
performance. To the best of our knowledge, this study is the first report on preparation of TFEs
by using CS dissolved in the mixture of EMImBF4 and water (see CS and EMImBF4 structure in
Fig. 1). EMImBF4 in this system plays important roles as both a dissolving solution and a charge
carrier for EDLC due to high ionic conductivity and low viscosity. The obtained TFE is
characterized, and the electrochemical properties of an EDLC test cell containing the electrolyte
were assessed.
Fig. 1 Structure of (a) CS and (b) EMImBF4.
3.2. Materials and methods
3.2.1. Materials
Chitosan (CS; FM-80, DDA 88.3%, Viscosity 30 mPa S, Mw 24.8×10⁴) was
supplied by Koyo Chemical Company (Japan), and 1-ethyl-3-methylimidazolium
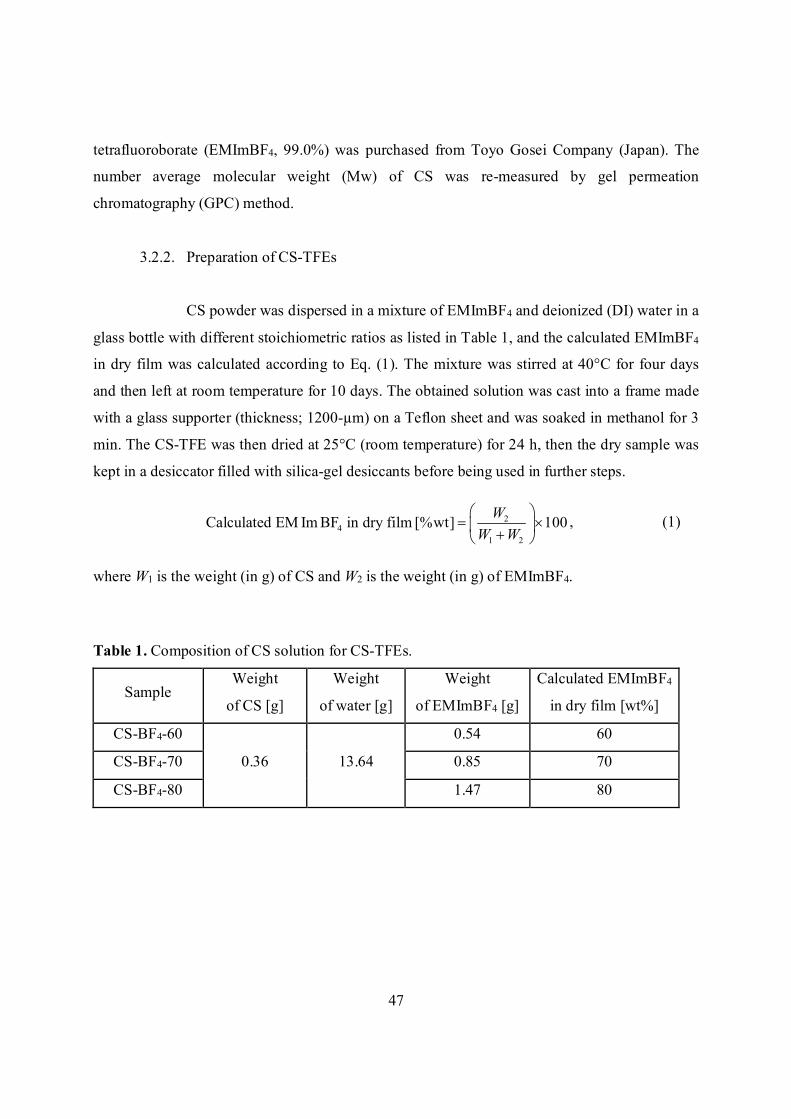
47
tetrafluoroborate (EMImBF4, 99.0%) was purchased from Toyo Gosei Company (Japan). The
number average molecular weight (Mw) of CS was re-measured by gel permeation
chromatography (GPC) method.
3.2.2. Preparation of CS-TFEs
CS powder was dispersed in a mixture of EMImBF4 and deionized (DI) water in a
glass bottle with different stoichiometric ratios as listed in Table 1, and the calculated EMImBF4
in dry film was calculated according to Eq. (1). The mixture was stirred at 40°C for four days
and then left at room temperature for 10 days. The obtained solution was cast into a frame made
with a glass supporter (thickness; 1200-µm) on a Teflon sheet and was soaked in methanol for 3
min. The CS-TFE was then dried at 25°C (room temperature) for 24 h, then the dry sample was
kept in a desiccator filled with silica-gel desiccants before being used in further steps.
24
1 2
Calculated EM Im BF in dry film [%wt] 100WW W
, (1)
where W1 is the weight (in g) of CS and W2 is the weight (in g) of EMImBF4.
Table 1. Composition of CS solution for CS-TFEs.
Sample Weight
of CS [g]
Weight
of water [g]
Weight
of EMImBF4 [g]
Calculated EMImBF4
in dry film [wt%]
CS-BF4-60
0.36 13.64
0.54 60
CS-BF4-70 0.85 70
CS-BF4-80 1.47 80
48
3.2.3. Characterization of CS-TFEs
3.2.3.1. Scanning electron microscopy (SEM)
The structural morphology of each sample was observed using a scanning
electron microscope (SEM; JSM6700, JEOL, Japan) at an accelerating voltage of 5 kV and a
magnification of 5,000.
3.2.3.2. Fourier transform infrared spectroscopy (FTIR)
The functional groups of each sample were characterized using a Fourier-
transform infrared (FT-IR) spectrometer (FT/IR-4200, JASCO, Japan) via the KBr-pellet method
in the wavenumber range of 400–4000 cm−1.
3.2.3.3. Thermogravimetric analysis (TGA)
The thermal decomposition of each sample was tested under a nitrogen
atmosphere using a thermogravimetric analyzer (TGA; EXSTAR TG/DTA6200, SII, Japan). The
sample was heated from 30°C to 550°C at a heating rate of 20°C/min.
3.2.3.4. Determination of mechanical properties
The mechanical properties of each sample were determined in ambient
conditions using a universal testing machine )STA-1150, A&D Company, Ltd., Japan( equipped
with a 50-N load cell and operating at a constant speed of 10 mm/min. Before the analysis, the
sample was cut to be 30 mm long and 5 mm wide and was mounted in tensile grips spaced 10
mm apart. The measurement was repeated more than 10 times. The tensile parameters of tensile
strength and elongation at break were determined from the stress–strain curves obtained from the
force–distance data.
49
3.2.3.5. Determination of EMImBF4 content
The amount of EMImBF4 in an obtained sample was determined as
follows. The sample was weighed, soaked in excess dichloromethane for 24 h to remove
EMImBF4, dried at 60°C for 24 h, and then weighed again. This procedure was repeated until the
sample weighed the same before and after the EMImBF4-removal step. A percentage of the total
EMImBF4 content was calculated according to Eq. (2).
1 24
1
% EM Im BF content 100M MM
, (2)
where M1 is the weight (in mg) of the EMImBF4-bearing sample and M2 is the constant weight
(in mg) of the sample after removing EMImBF4.
3.2.4. Fabrication of EDLCs cells
Each obtained TFE was cut into a 16-mm-diameter disk and soaked in EMImBF4
under 0.3-Pa vacuum at room temperature for 48 h before being assembled in the EDLC test cell.
The test cell was assembled by sandwiching the TFE between two carbon electrodes in a coin-
cell (CR2032, stainless type, Hohsen Corporation, Japan) in an argon-filled glove box. In
addition, a test cell was assembled with liquid-phase EMImBF4 with a cellulose separator
(TF4035, Nippon Kodoshi Corporation, Japan) for comparison.
The symmetrical carbon electrodes were prepared by coating as follows.
Activated carbon (YP-50F, specific surface area: 1500–1800 m2/g, Kuraray Co., Ltd., Japan),
acetylene black (HS-100, Denka Co., Ltd., Japan) as a conductive additive, 1.2 wt% sodium
carboxymethyl cellulose (WS-C, DKS Co., Ltd., Japan) as a dispersant, and 48 wt% styrene–
butadiene rubber (TRD2001, JSR Corporation, Japan) as a binder were mixed in DI water at a
weight ratio of 90:5:3:2. The mixture was stirred until a homogenous slurry with a smooth
surface was obtained. The obtained electrode slurry was coated on an aluminum current collector
to produce a carbon electrode. The obtained carbon electrode was dried in an oven at 100°C for
10 h to eliminate the solvent and was then cut into a 12-mm-diameter disk before being used in
the next steps.
50
3.2.5. Electrochemical measurement
The electrochemical properties of each EDLC test cell were determined in terms
of its charge–discharge performance, discharge capacitance, and alternating-current (AC)
impedance. The charge–discharge performance was measured using a battery charge/discharge
apparatus (HJ1001 SM8, Hokuto Denko Corporation, Japan) at voltages of 0–2.5 V and various
current densities. The discharge rate was estimated at discharge current densities between 2.5–
100 mA/cm2. The discharge capacitance of a single electrode in the symmetrical EDLC cell was
determined using Eq. (3) [30, 31]:
WVtIC
)2/( (3)
where C is the discharge capacitance, I is the discharge current [A], t is the discharge time [s], V
is the operating voltage, and W is the total mass of activated carbon in a single electrode [g].
The AC impedance was measured using a potentiogalvanostat (SI 1287, Solartron
Analytical, UK) and a frequency-response analyzer (SI 1260, Solartron Analytical, UK) with an
AC amplitude of 10 mVp-0 in the frequency range of 500 kHz–10 mHz. All electrochemical
measurements were performed at 25°C.
3.3. Results and discussion
3.3.1. Preparation of CS-TFEs
CS is difficult to dissolve in commonly used solvents because it has strong
hydrogen bonding and a combination of amorphous and crystalline regions. Therefore, for
preparing the CS electrolytes (CS-gel) in the previous reports, CS powder was dissolved in
aqueous acetic acid and the solution was cast to produce the films, later soaking it in IL [30–31].
In this study, we proposed a new method to prepare CS-TFE. CS was dissolved in a mixture of
EMImBF4 and water that could approximately control IL content in obtained product by one-pot
synthesis, and EMImBF4 acts as not only the solvent for the CS but also the charge carrier for the
EDLCs.
51
3.3.2. Characterization of CS-TFEs
3.3.2.1. SEM
SEM images of the surfaces and cross-sectional areas of the CS-TFE
products are shown in Fig. 2. None of the surfaces show phase separation between the CS and
EMImBF4. By contrast, the surface morphology of the sample was influenced by the amount of
EMImBF4 in the dry film. CS-BF4-60 (see Fig. 2(a)) had a grainy structure with unevenly
distributed spots, suggesting that there was insufficient EMImBF4 in the mixture solution to
incorporate it into the CS matrix for complete dissolution. CS-BF4-80 (see Fig. 2(c)) had a rough
surface with a porous structure because of the low wt% of CS and high wt% of EMImBF4 when
the film was prepared. Moreover, the cross-sectional morphology of each sample was considered
and showed that porosity was present throughout. The porosity size increased with the wt% of
EMImBF4 in the dry film, which could be related to the amount of CS and EMImBF4 in the
mixture solution before the film was prepared.
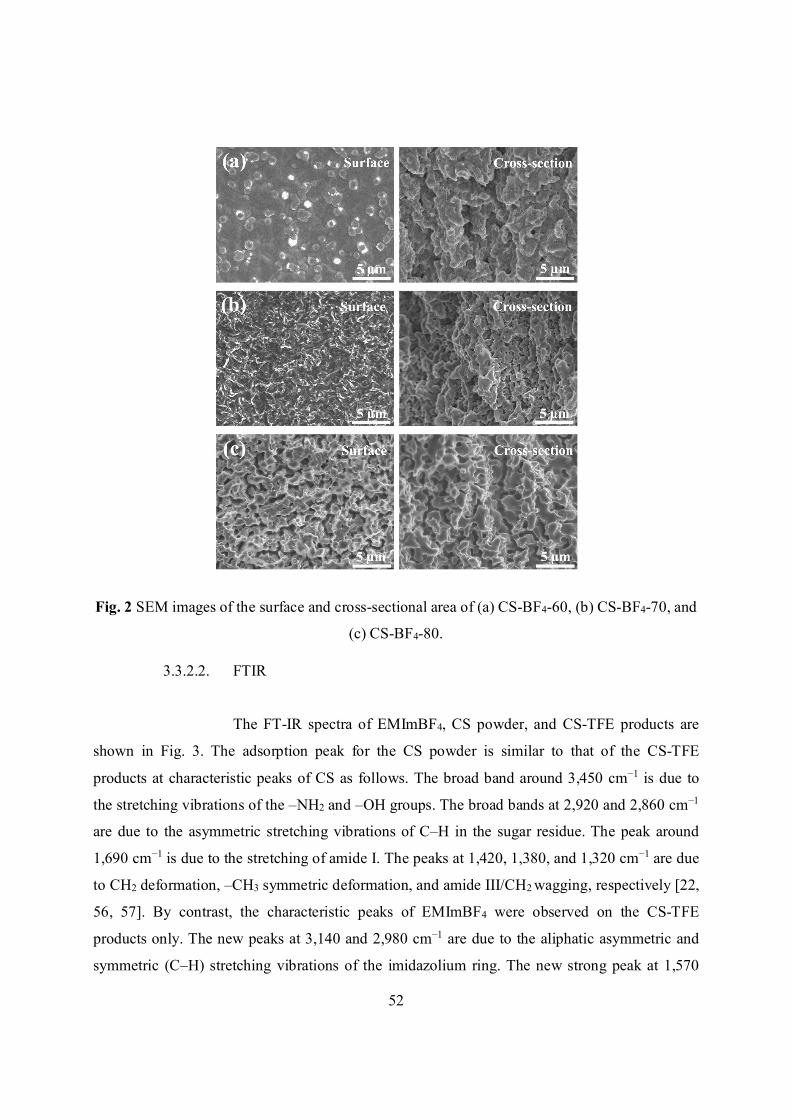
52
Fig. 2 SEM images of the surface and cross-sectional area of (a) CS-BF4-60, (b) CS-BF4-70, and
(c) CS-BF4-80.
3.3.2.2. FTIR
The FT-IR spectra of EMImBF4, CS powder, and CS-TFE products are
shown in Fig. 3. The adsorption peak for the CS powder is similar to that of the CS-TFE
products at characteristic peaks of CS as follows. The broad band around 3,450 cm−1 is due to
the stretching vibrations of the –NH2 and –OH groups. The broad bands at 2,920 and 2,860 cm−1
are due to the asymmetric stretching vibrations of C–H in the sugar residue. The peak around
1,690 cm−1 is due to the stretching of amide I. The peaks at 1,420, 1,380, and 1,320 cm−1 are due
to CH2 deformation, –CH3 symmetric deformation, and amide III/CH2 wagging, respectively [22,
56, 57]. By contrast, the characteristic peaks of EMImBF4 were observed on the CS-TFE
products only. The new peaks at 3,140 and 2,980 cm−1 are due to the aliphatic asymmetric and
symmetric (C–H) stretching vibrations of the imidazolium ring. The new strong peak at 1,570
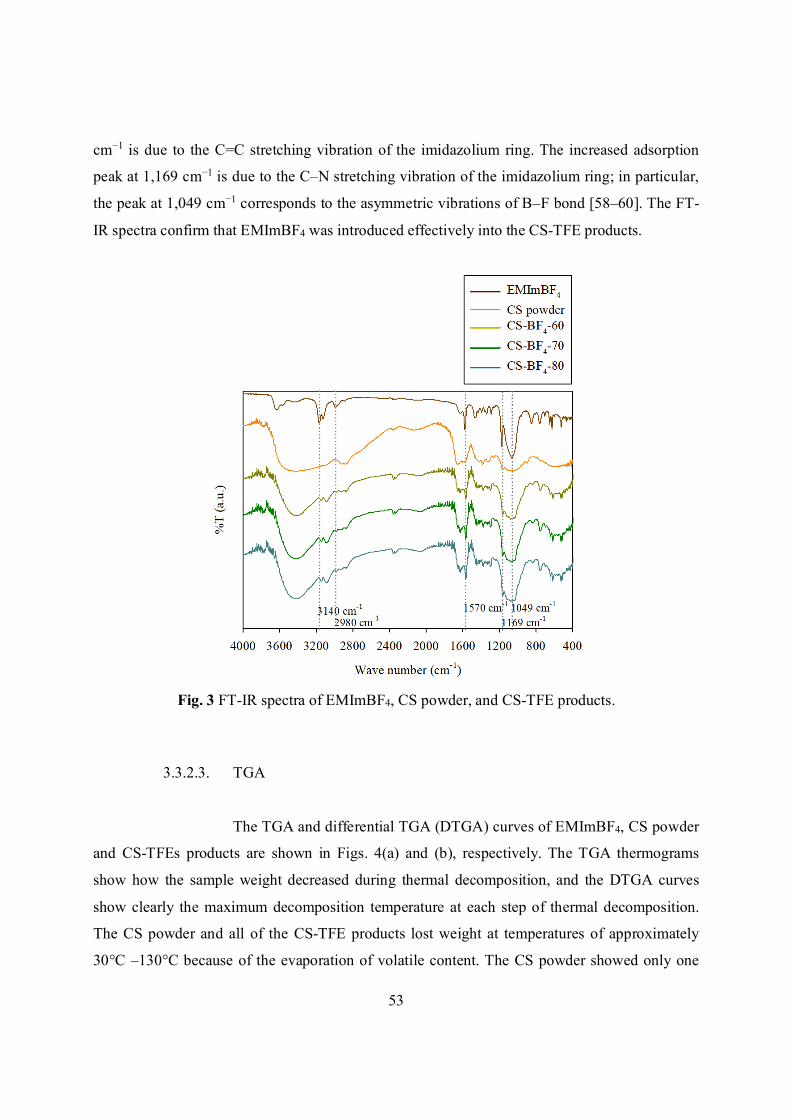
53
cm−1 is due to the C=C stretching vibration of the imidazolium ring. The increased adsorption
peak at 1,169 cm−1 is due to the C–N stretching vibration of the imidazolium ring; in particular,
the peak at 1,049 cm−1 corresponds to the asymmetric vibrations of B–F bond [58–60]. The FT-
IR spectra confirm that EMImBF4 was introduced effectively into the CS-TFE products.
Fig. 3 FT-IR spectra of EMImBF4, CS powder, and CS-TFE products.
3.3.2.3. TGA
The TGA and differential TGA (DTGA) curves of EMImBF4, CS powder
and CS-TFEs products are shown in Figs. 4(a) and (b), respectively. The TGA thermograms
show how the sample weight decreased during thermal decomposition, and the DTGA curves
show clearly the maximum decomposition temperature at each step of thermal decomposition.
The CS powder and all of the CS-TFE products lost weight at temperatures of approximately
30°C –130°C because of the evaporation of volatile content. The CS powder showed only one
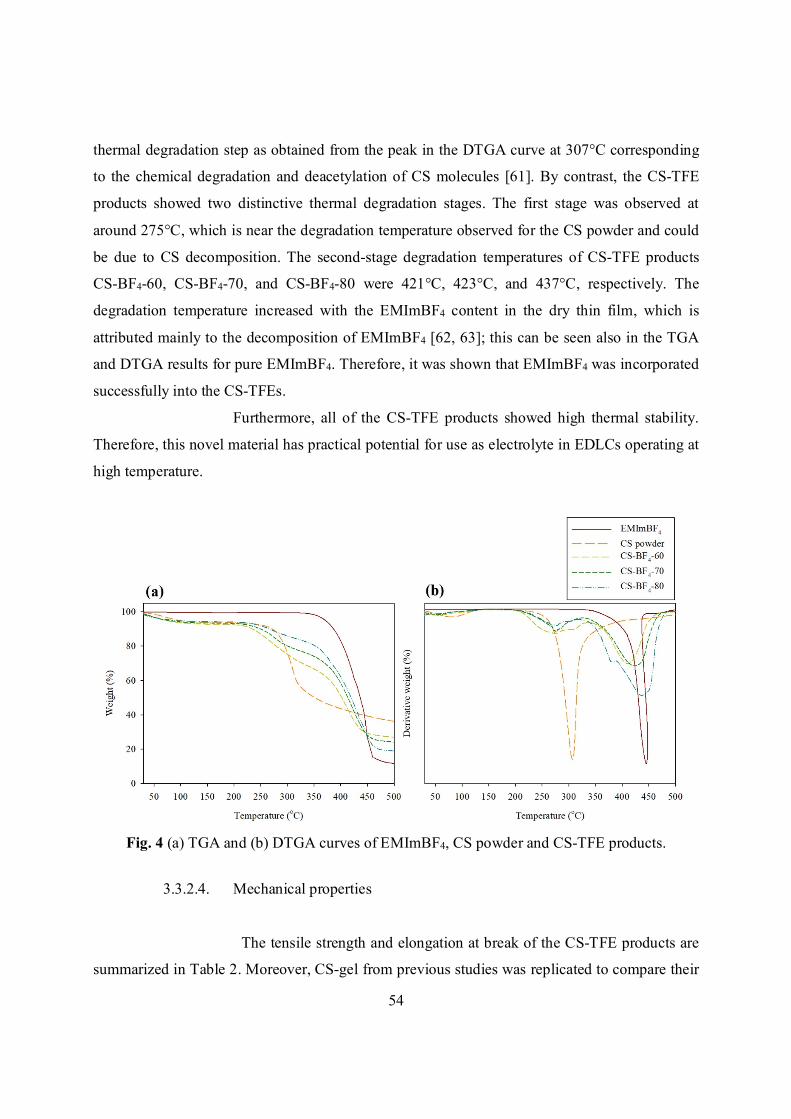
54
thermal degradation step as obtained from the peak in the DTGA curve at 307°C corresponding
to the chemical degradation and deacetylation of CS molecules [61]. By contrast, the CS-TFE
products showed two distinctive thermal degradation stages. The first stage was observed at
around 275°C, which is near the degradation temperature observed for the CS powder and could
be due to CS decomposition. The second-stage degradation temperatures of CS-TFE products
CS-BF4-60, CS-BF4-70, and CS-BF4-80 were 421°C, 423°C, and 437°C, respectively. The
degradation temperature increased with the EMImBF4 content in the dry thin film, which is
attributed mainly to the decomposition of EMImBF4 [62, 63]; this can be seen also in the TGA
and DTGA results for pure EMImBF4. Therefore, it was shown that EMImBF4 was incorporated
successfully into the CS-TFEs.
Furthermore, all of the CS-TFE products showed high thermal stability.
Therefore, this novel material has practical potential for use as electrolyte in EDLCs operating at
high temperature.
Fig. 4 (a) TGA and (b) DTGA curves of EMImBF4, CS powder and CS-TFE products.
3.3.2.4. Mechanical properties
The tensile strength and elongation at break of the CS-TFE products are
summarized in Table 2. Moreover, CS-gel from previous studies was replicated to compare their
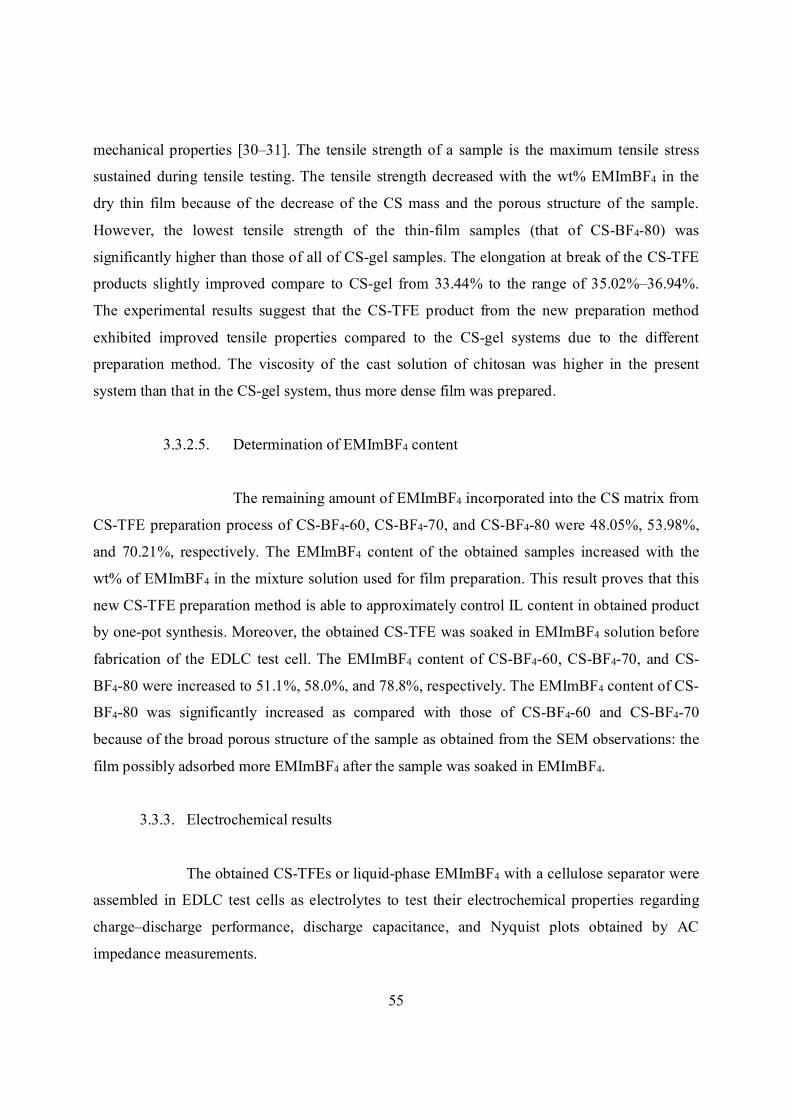
55
mechanical properties [30–31]. The tensile strength of a sample is the maximum tensile stress
sustained during tensile testing. The tensile strength decreased with the wt% EMImBF4 in the
dry thin film because of the decrease of the CS mass and the porous structure of the sample.
However, the lowest tensile strength of the thin-film samples (that of CS-BF4-80) was
significantly higher than those of all of CS-gel samples. The elongation at break of the CS-TFE
products slightly improved compare to CS-gel from 33.44% to the range of 35.02%–36.94%.
The experimental results suggest that the CS-TFE product from the new preparation method
exhibited improved tensile properties compared to the CS-gel systems due to the different
preparation method. The viscosity of the cast solution of chitosan was higher in the present
system than that in the CS-gel system, thus more dense film was prepared.
3.3.2.5. Determination of EMImBF4 content
The remaining amount of EMImBF4 incorporated into the CS matrix from
CS-TFE preparation process of CS-BF4-60, CS-BF4-70, and CS-BF4-80 were 48.05%, 53.98%,
and 70.21%, respectively. The EMImBF4 content of the obtained samples increased with the
wt% of EMImBF4 in the mixture solution used for film preparation. This result proves that this
new CS-TFE preparation method is able to approximately control IL content in obtained product
by one-pot synthesis. Moreover, the obtained CS-TFE was soaked in EMImBF4 solution before
fabrication of the EDLC test cell. The EMImBF4 content of CS-BF4-60, CS-BF4-70, and CS-
BF4-80 were increased to 51.1%, 58.0%, and 78.8%, respectively. The EMImBF4 content of CS-
BF4-80 was significantly increased as compared with those of CS-BF4-60 and CS-BF4-70
because of the broad porous structure of the sample as obtained from the SEM observations: the
film possibly adsorbed more EMImBF4 after the sample was soaked in EMImBF4.
3.3.3. Electrochemical results
The obtained CS-TFEs or liquid-phase EMImBF4 with a cellulose separator were
assembled in EDLC test cells as electrolytes to test their electrochemical properties regarding
charge–discharge performance, discharge capacitance, and Nyquist plots obtained by AC
impedance measurements.
56
The charge–discharge curves of the EDLC test cells assembled with either liquid-
phase EMImBF4 or the obtained CS-TFEs are shown in Figs. 5(a), (b), and (c) for current
densities of 2.5, 50, and 100 mA/cm2, respectively. During the 2.5-mA/cm2 charge–discharge
measurements, all test cells showed a perfectly triangular shape that is a typical shape of the
ideal EDLCs. In the charge–discharge curves measured at high current densities of 50 and 100
mA/cm2, rapid voltage drops during switching (known as IR drops and indicated by arrow in Fig.
5(b)) occurred in all the test cells, showing a clearly larger IR drop with higher current density.
However, the IR drop was reduced in the CS-TFEs with higher EMImBF4 content. The CS-BF4-
60 and CS-BF4-70 test cells showed larger IR drops than that of the test cell with liquid-phase
EMImBF4, whereas the CS-BF4-80 test cell showed an IR drop that was comparable with that of
the liquid-phase EMImBF4 system; that may be because the ionic conductivity and internal
resistance of the test cell were improved by increasing the EMImBF4 content in the TFEs.
Fig. 5 Charge–discharge curves of the EDLC test cell assembled with liquid-phase EMImBF4 or
the obtained CS-TFEs at current densities of (a) 2.5, (b) 50, and (c) 100 mA/cm2.
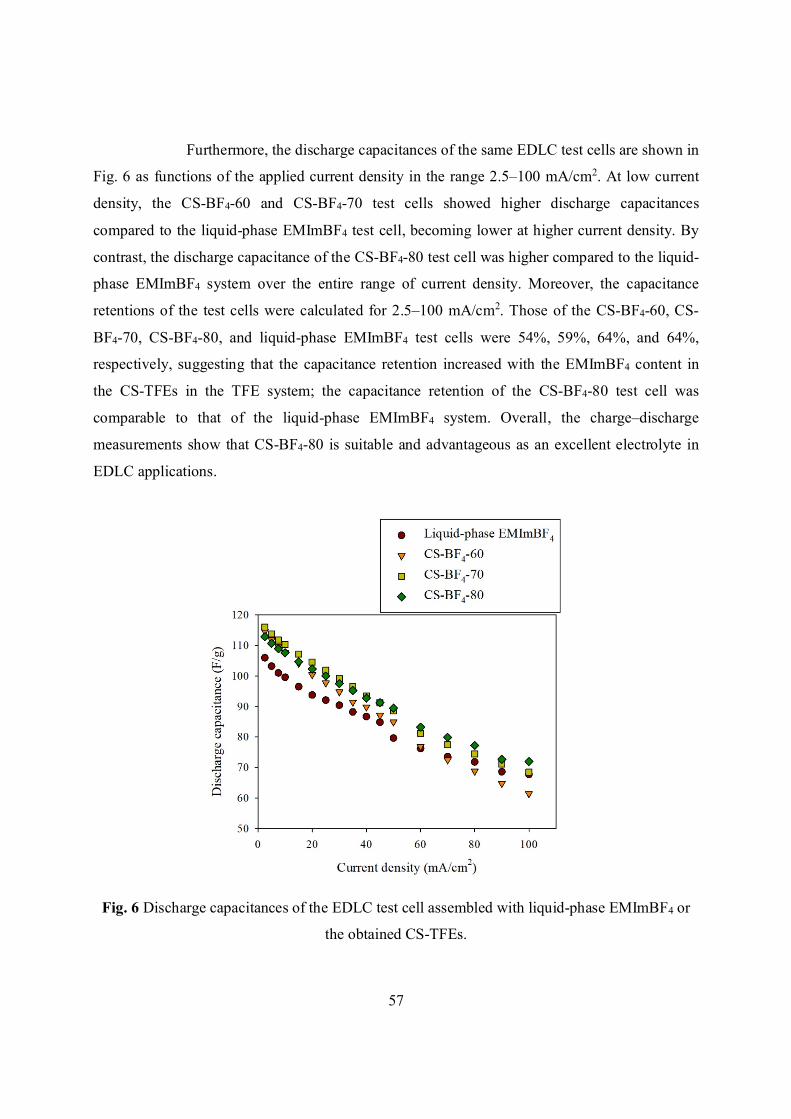
57
Furthermore, the discharge capacitances of the same EDLC test cells are shown in
Fig. 6 as functions of the applied current density in the range 2.5–100 mA/cm2. At low current
density, the CS-BF4-60 and CS-BF4-70 test cells showed higher discharge capacitances
compared to the liquid-phase EMImBF4 test cell, becoming lower at higher current density. By
contrast, the discharge capacitance of the CS-BF4-80 test cell was higher compared to the liquid-
phase EMImBF4 system over the entire range of current density. Moreover, the capacitance
retentions of the test cells were calculated for 2.5–100 mA/cm2. Those of the CS-BF4-60, CS-
BF4-70, CS-BF4-80, and liquid-phase EMImBF4 test cells were 54%, 59%, 64%, and 64%,
respectively, suggesting that the capacitance retention increased with the EMImBF4 content in
the CS-TFEs in the TFE system; the capacitance retention of the CS-BF4-80 test cell was
comparable to that of the liquid-phase EMImBF4 system. Overall, the charge–discharge
measurements show that CS-BF4-80 is suitable and advantageous as an excellent electrolyte in
EDLC applications.
Fig. 6 Discharge capacitances of the EDLC test cell assembled with liquid-phase EMImBF4 or
the obtained CS-TFEs.
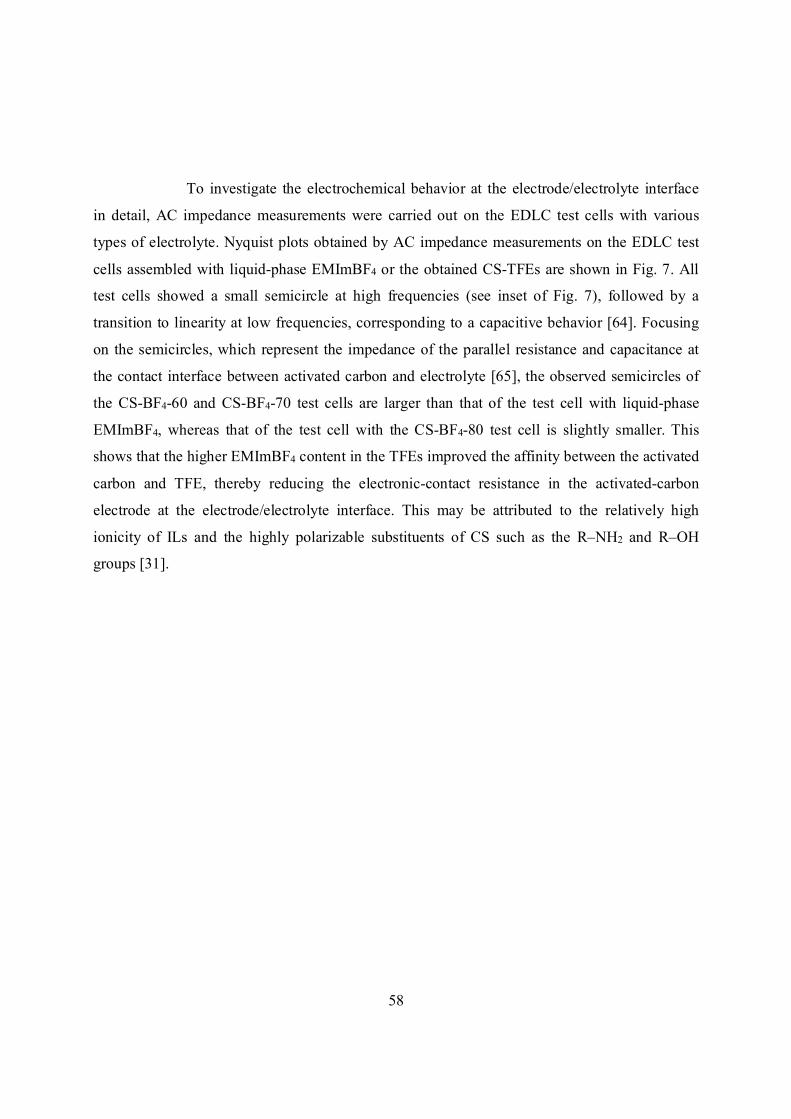
58
To investigate the electrochemical behavior at the electrode/electrolyte interface
in detail, AC impedance measurements were carried out on the EDLC test cells with various
types of electrolyte. Nyquist plots obtained by AC impedance measurements on the EDLC test
cells assembled with liquid-phase EMImBF4 or the obtained CS-TFEs are shown in Fig. 7. All
test cells showed a small semicircle at high frequencies (see inset of Fig. 7), followed by a
transition to linearity at low frequencies, corresponding to a capacitive behavior [64]. Focusing
on the semicircles, which represent the impedance of the parallel resistance and capacitance at
the contact interface between activated carbon and electrolyte [65], the observed semicircles of
the CS-BF4-60 and CS-BF4-70 test cells are larger than that of the test cell with liquid-phase
EMImBF4, whereas that of the test cell with the CS-BF4-80 test cell is slightly smaller. This
shows that the higher EMImBF4 content in the TFEs improved the affinity between the activated
carbon and TFE, thereby reducing the electronic-contact resistance in the activated-carbon
electrode at the electrode/electrolyte interface. This may be attributed to the relatively high
ionicity of ILs and the highly polarizable substituents of CS such as the R–NH2 and R–OH
groups [31].
59
Fig. 7 Nyquist plots obtained by AC impedance measurements of the EDLC test cell assembled
with the liquid-phase EMImBF4 or the obtained CS-TFEs.
3.4. Conclusions
In this present work, a novel TFE as functionalized solid electrolyte was prepared from
CS with EMImBF4 via a new preparation method. CS powder was dissolved in a mixture of
EMImBF4 and DI water to produce CS-TFEs with different wt% of EMImBF4 in the dry sample
for the first time. In this system, EMImBF4 plays important roles as a solvent and a charge
carrier for EDLC applications. From structural characterizations, all of the obtained CS-TFEs
from the new preparation method showed surfaces with no CS/EMImBF4 phase separation, and
the surface morphologies of the samples changed according to the dry-film wt% of EMImBF4.
The FT-IR spectra of the CS-TFE products showed peaks that were characteristic of both CS and
EMImBF4, indicating that EMImBF4 was incorporated efficiently into the CS matrix. The TGA
and DTGA results revealed that the all of the CS-TFE products had high thermal stability. The
results of tensile testing showed that the obtained samples from the new preparation method had
significant higher tensile strength than that of the CS-gel from previous reports. Furthermore, the
60
total EMImBF4 content of the obtained samples (CS-BF4-60, CS-BF4-70, and CS-BF4-80) is
51.1%, 58.0%, and 78.8%, respectively, and could be controlled by the preparation conditions of
the CS solutions.
In addition, the obtained CS-TFEs were fabricated in EDLC test cells to measure their
electrochemical properties in comparison with that of a test cell with a liquid-phase EMImBF4
system. On testing the charge–discharge performance, the CS-BF4-80 test cell exhibited an IR
drop at high current density that was comparable to that of the liquid-phase EMImBF4 test cell,
and the former also showed a higher discharge capacitance over the current-density range of 2.5–
100 mA/cm2. Moreover, the results of the AC impedance measurements on the CS-BF4-80 test
cell showed decreased resistance at the electrode/electrolyte interface compared with the liquid-
phase EMImBF4 test cell. All of the results regarding electrochemical properties showed the CS-
BF4-80 TFE to be suitable and advantageous as an excellent solid electrolyte in the design of
high-performance EDLCs, as well as for improving the safety of such devices.
3.5. References
[1] S. Kumagai, D. Tashima, Biomass Bioenergy 83, 216–223 (2015)
[2] A. Mundy, G.L. Plett, J. Energy Storage 7, 167–180 (2016)
[3] M. Tokita, N. Yoshimoto, K. Fujii, M. Morita, Electrochim. Acta 209, 210–218 (2016)
[4] M. Yamagata, K. Soeda, S. Yamazaki, M. Ishikawa, J. Electrochem. Soc. 25(35), 193–200
(2010)
[5] M. Yamagata, S. Ikebe, Y. Kasai, K. Soeda, M. Ishikawa, J. Electrochem. Soc. 50(43), 27–
36 (2013)
[6] K. Soeda, M. Yamagata, M. Ishikawa, J. Power Sources 280, 565–572 (2015)
[7] N.N. Mobarak, N. Ramli, A. Ahmad, M.Y.A. Rahman, Solid State Ionics 224, 51–57
(2012)
[8] S. Rudhziah, M.S.A. Rani, A. Ahmad, N.S. Mohamed, H. Kaddami, Ind. Crops Prod. 72,
133–141 (2015)
[9] E. Raphael, C.O. Avellaneda, B. Manzolli, A. Pawlicka, Electrochim. Acta 55, 1455–1459
(2010)
[10] R. Leones, F. Sentanin, L.C. Rodrigues, I.M. Marrucho, J.M.S.S. Esperança, A. Pawlicka,
61
M.M. Silva, eXPRESS polym. lett. 6(12), 1007–1016 (2012)
[11] A.S.A. Khiar, A.K. Arof, Ionics 16, 123–129 (2010)
[12] M. Kumar, T. Tiwari, N. Srivastava, Carbohydr. Polym. 88, 54–60 (2012)
[13] M.F. Shukur, R. Ithnin, M.F.Z. Kadir, Electrochim. Acta 136, 204–216 (2014)
[14] A.M.M. Ali, R.H.Y. Subban, H. Bahron, T. Winie, F. Latif, M.Z.A. Yahya, Ionics 14 491–
500 (2008)
[15] S.N. Mohamed, N.A. Johari, A.M.M. Ali, M.K. Harun, M.Z.A. Yahya, J. Power Sources
183, 351–354 (2008)
[16] R.K. Mishra, A. Anis, S. Mondal, M. Dutt, A.K. Banthia, Chin. J. Polym. Sci. 27(5), 639–
646 (2009)
[17] R. Ou, Y. Xie, X. Shen, F. Yuan, H. Wang, Q. Wang, J. Mater. Sci. 47, 5978–5986 (2012)
[18] R. Alves, F. Sentanin, R.C. Sabadini, A. Pawlicka, M.M. Silva, Electrochim. Acta 217
108–116 (2016)
[19] R. Leones, P.M. Reis, R.C. Sabadini, L.P. Ravaro, I.D.A. Silva, A.S.S. de Camargo, J.P.
Donoso, C.J. Magon, J.M.S.S. Esperança, A. Pawlicka, M.M. Silva, Electrochim. Acta 240
474–485 (2017)
[20] R. Leones, R.C. Sabadini, J.M.S.S. Esperança, A. Pawlicka, Electrochim. Acta 232 22–29
(2017)
[21] R. Jayakumar, H. Nagahama, T. Furuike, H. Tamura, Int. J. Biol. Macromol. 42, 335–339
(2008)
[22] A. Anitha, V.V.D. Rani, R. Krishna, V. Sreeja, N. Selvamurugan, S.V. Nair, H. Tamura, R.
Jayakumar, Carbohydr. Polym. 78, 672–677 (2009)
[23] K. Madhumathi, K.T. Shalumon, V.V.D. Rani, H. Tamura, T. Furuike, N. Selvamurugan,
S.V. Nair, R. Jayakumar, Int. J. Biol. Macromol. 45, 12–15 (2009)
[24] H. Nagahama, H. Maeda, T. Kashiki, R. Jayakumar, T. Furuike, H. Tamura, Carbohydr.
Polym. 76, 255–260 (2009)
[25] Y. Saito, V. Luchnikov, A. Inaba, K. Tamura, Carbohydr. Polym. 109, 44–48 (2014)
[26] T. Furuike, D. Komoto, H. Hashimoto, H. Tamura, Int. J. Biol. Macromol. 104, 1620–1625
(2017)
[27] R. Jayakumar, N. Selvamurugan, S.V. Nair, S. Tokura, H. Tamura, Int. J. Biol. Macromol.
43, 221–225 (2008)
62
[28] R. Jayakumar, M. Prabaharan, S.V. Nair, H. Tamura, Biotechnol. Adv. 28, 142–150 (2010)
[29] R. Jayakumar, M. Prabaharan, P.T. Sudheesh Kumar, S.V. Nair, H. Tamura, Biotechnol.
Adv. 29, 322–337 (2011).
[30] M. Yamagata, K. Soeda, S. Ikebe, S. Yamazaki, M. Ishikawa, J. Electrochem. Soc. 41, 25–
34 (2012)
[31] M. Yamagata, K. Soeda, S. Ikebe, S. Yamazaki, M. Ishikawa, Electrochim. Acta 100, 275–
280 (2013)
[32] K. Soeda, M. Yamagata, S. Yamazaki, M. Ishikawa, Electrochemistry 81(10), 867–872
(2013)
[33] J. Chupp, A. Shellikeri, G. Palui, J. Chatterjee, J. Appl. Polym. Sci. 132(26), 42143 (2015)
[34] X. Mu, X. Yang, D. Zhang, C. Liu, Carbohydr. Polym. 146, 46–51 (2016)
[35] W. Wang, J. Zhu, X. Wang, Y. Huang, Y. Wang, J. Macromol. Sci., Part B 49 (3), 528–
541 (2010)
[36] K. Wilpiszewska, T. Spychaj, Carbohydr. Polym. 86, 424–428 (2011)
[37] A. Lewandowski, M. Galiński, J. Phys. Chem. Solids 65, 281–286 (2004)
[38] Z. Zhou, M. Takeda, M. Ue, J. Fluorine Chem. 125, 471–476 (2004)
[39] T. Sato, G. Masuda, K. Takagi, Electrochim. Acta 49, 3603–3611 (2004)
[40] K. Yuyama, G. Masuda, H. Yoshida, T. Sato, J. Power Sources 162, 1401–1408 (2006)
[41] C.O. Ania, J. Pernak, F. Stefaniak, E. Raymundo-Piñero, F. Béguin, Carbon 44, 3126–
3130 (2006)
[42] N. Handa, T. Sugimoto, M. Yamagata, M. Kikuta, M. Kono, M. Ishikawa, J. Power
Sources 185, 1585–1588 (2008)
[43] D.M. Phillips, L.F. Drummy, D.G. Conrady, D.M. Fox, R.R. Naik, M.O. Stone, P.C.
Trulove, H.C. De Long, R.A. Mantz, J. Am. Chem. Soc. 126, 14350–14351 (2004)
[44] O.A.E. Seoud, A. Koschella, L.C. Fidale, S. Dorn, T. Heinze, Biomacromolecules 8(9),
2629–2647 (2007)
[45] I. Kilpeläinen, H. Xie, A. King, M. Granstrom, S. Heikkinen, D.S. Argyropoulos, J. Agric.
Food Chem. 55, 9142–9148, (2007)
[46] R.P. Swatloski, S.K. Spear, J.D. Holbrey, R.D. Rogers, J. Am. Chem. Soc. 124, 4974–4975
(2002)
[47] M.E. Zakrzewska, E. Bogel-Łukasik, R. Bogel-Łukasik, Energy Fuels 24, 737–745 (2010)
63
[48] B. Meenatchi, V. Renuga, A. Manikandan, J. Mol. Liq. 238, 582–588 (2017)
[49] H. Xie, S. Zhang, S. Lib, Green Chem. 8, 630–633 (2006)
[50] W. Xiao, Q. Chen, Y. Wu, T. Wu, L. Dai, Carbohydr. Polym. 83, 233–238 (2011)
[51] S.S. Silva, J.F. Mano, R.L. Reis, Green Chem. 19, 1208–1220 (2017)
[52] G. Santos-López, W. Argüelles-Monal, E. Carvajal-Millan, Y.L. López-Franco, M.T.
Recillas-Mota, J. Lizardi-Mendoza, Polym. 9, 722 (2017)
[53] Q. Chen, A. Xu, Z. Li, J. Wang, S. Zhang, Green Chem. 13, 3446–3452 (2011)
[54] X. Sun, Q. Tian, Z. Xue, Y. Zhang, T. Mu, RSC Adv. 4, 30282–30291 (2014)
[55] Q. Tian, S. Liu, X. Sun, H. Sun, Z. Xue, T. Mu, Carbohydr. Res. 408, 107–113 (2015)
[56] S. Kumari, S.H.K. Annamareddy, S. Abanti, P.K. Rath, Int. J. Biol. Macromol. 104, 1697–
1705 (2017)
[57] R.A. Mauricio-Sánchez, R. Salazar, J.G. Luna-Bárcenas, A. Mendoza-Galván, Vib.
Spectrosc 94, 1–6 (2018)
[58] Y. Wang, X. Gao, R. Wang, H. Liu, C. Yang, Y. Xiong, React. Funct. Polym. 68, 1170–
1177 (2008)
[59] S. Ambika, M. Sundrarajan, J. Mol. Liq. 221, 986–992 (2016)
[60] T. Romann, O. Oll, P. Pikma, H. Tamme, E. Lust, Electrochim. Acta 125, 183–190 (2014)
[61] C.Y. Soon, Y.B. Tee, C.H. Tan, A.T. Rosnita, A. Khalina, Int. J. Biol. Macromol. 108,
135–142 (2018)
[62] G. Min, T. Yim, H.Y. Lee, D.H. Huh, E. Lee, J. Mun, S.M. Oh, Y.G. Kim, Bull. Korean
Chem. Soc. 27(6), 847–852 (2006)
[63] Y. Cao, T. Mu, Ind. Eng. Chem. Res. 53, 8651–8664 (2014)
[64] C. Yang, S. Hsu, W. Chien, J. Power Sources 152, 303–310 (2005)
[65] A. Lewandowski, A. Świderska, Solid State Ionics 161, 243–249 (2003)
64
Chapter 4
Preparation and Characterization of Electrospun Gelatin
Nanofiber Electrolyte
65
4.1. Introduction
Electric double-layer capacitors (EDLCs) are electrochemical devices that provide a high
sustained power density and a long charge–discharge cycle time [1, 2]. Nonaqueous electrolytes
have been proposed in recent years to satisfy the safety requirements for EDLCs [3–7]. Polymer
electrolytes based on natural polymers such as chitosan [8–10], alginate [11–13], agar [14, 15],
carrageen [16–19], starch [20–22] and bacterial cellulose [23] have been widely studied. In
addition to being abundant, low cost, non-toxic, and environmentally friendly, natural polymers
have been reported to have good physical and mechanical properties and high thermal stabilities.
Gelatin is prepared by the hydrolysis of collagen, which is a natural, triple-helix polymer
obtained from mammalian skin and bones [24, 25]. Gelatin has been widely used as a scaffold
for tissue engineering owing to its excellent biodegradability, biocompatibility, ability to
promote cell adhesion and proliferation, resistance to immunogenicity, among other properties
[26–30]. Moreover, many researches have reported that gelatin has potential to be used as an
electrolyte in many applications such as in dye-sensitized solar cells and electrochromic devices
[31–36].
Gelatin is soluble in lukewarm water and forms a heterogeneous mixture. An important
property of gelatin is its gelation transition under aqueous conditions [37]. Gelatin is also
compatible with electrospinning, which is a simple and cost-effective technique that is widely
used to simply and continuously fabricate nanofibers. Electrospun fibers offer small pores, high
surface area, physical stability, and controllable thickness in the membrane form. Thus,
electrospinning is an attractive option for fabricating gel electrolytes to apply in EDLCs.
In this chapter, we fabricate a novel gel electrolyte from gelatin via an electrospinning
technique. We focus on one potential application of the electrolyte in EDLCs for improved
device safety. The novel gel electrolyte was characterized, and the electrochemical properties of
EDLC test cells assembled with the following electrolytes were compared: gelatin electrospun
(GES) electrolytes soaked in 1-ethyl-3-methylimidazolium (EMImBF4), gelatin films containing
EMImBF4 (GF-BF4), which were further soaked in EMImBF4, and pure EMImBF4 including a
separator.
66
4.2. Materials and methods
4.2.1. Materials
Gelatin (JS200, Mw = 100,000, bovine skin type B, Lot No. 120705M), was
purchased in powder form from Koei Chemical Co., Ltd (Japan) and 1-ethyl-3-
methylimidazolium tetrafluoroborate (EMImBF4, 99.0%) was purchased from Toyo Gosei Co.,
Ltd (Japan).
4.2.2. Preparation of GES electrolytes
Gelatin powder was dissolved at 25 wt% in deionized (DI) water and the mixture
was stirred at 50°C until a homogeneous solution was obtained. The solution was left in a water
bath at 50°C for about 1 h to remove entrapped air and was then cooled in an ice bath to induce
gelation. The gelated gelatin was placed in a 5-mL syringe with a metal needle of diameter 1.5
mm, and the syringe was placed in a water bath at 50°C to reverse the gelation; the temperature
of the syringe was thereafter maintained at 45°C–50°C. A high-voltage power supply of 23 kV
was connected to the syringe needle tip and to a stationary collector covered with aluminum foil.
The tip-to-collector distance was set at 7 cm. The electrospun nanofibers were collected as
randomly overlaid mats on the electrically grounded plate. The spinning time was varied to 5, 10,
15 20, and 25 min. The gelatin electrospun samples were then dried at room temperature for 12 h
before being removed from the aluminum foil for use in further testing.
4.2.3. Preparation of GF-BF4
For comparison with the GES electrolytes, GF-BF4 electrolytes were prepared as
follows. In a glass bottle, gelatin powder was mixed at 30 wt% in DI water with EMImBF4 at
different concentrations, as listed in Table 1, in a glass bottle. The mixture was stirred at 50°C
until it became a homogeneous solution. Then, the solution was casted on a Teflon sheet with a
135-μm leveled supporter. The GF-BF4 electrolytes were dried at 60°C before use in further
testing.
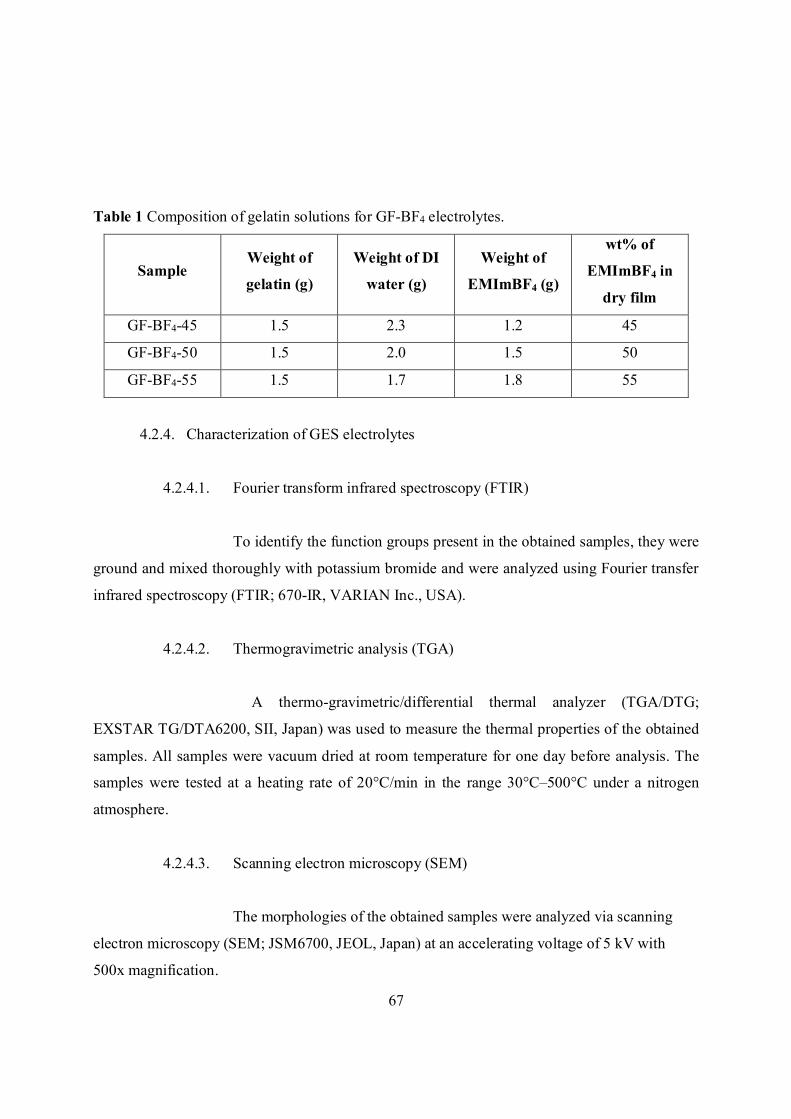
67
Table 1 Composition of gelatin solutions for GF-BF4 electrolytes.
Sample Weight of
gelatin (g)
Weight of DI
water (g)
Weight of
EMImBF4 (g)
wt% of
EMImBF4 in
dry film
GF-BF4-45 1.5 2.3 1.2 45
GF-BF4-50 1.5 2.0 1.5 50
GF-BF4-55 1.5 1.7 1.8 55
4.2.4. Characterization of GES electrolytes
4.2.4.1. Fourier transform infrared spectroscopy (FTIR)
To identify the function groups present in the obtained samples, they were
ground and mixed thoroughly with potassium bromide and were analyzed using Fourier transfer
infrared spectroscopy (FTIR; 670-IR, VARIAN Inc., USA).
4.2.4.2. Thermogravimetric analysis (TGA)
A thermo-gravimetric/differential thermal analyzer (TGA/DTG;
EXSTAR TG/DTA6200, SII, Japan) was used to measure the thermal properties of the obtained
samples. All samples were vacuum dried at room temperature for one day before analysis. The
samples were tested at a heating rate of 20°C/min in the range 30°C–500°C under a nitrogen
atmosphere.
4.2.4.3. Scanning electron microscopy (SEM)
The morphologies of the obtained samples were analyzed via scanning
electron microscopy (SEM; JSM6700, JEOL, Japan) at an accelerating voltage of 5 kV with
500x magnification.
68
4.2.4.4. Membrane thickness and mechanical properties
The thicknesses of the obtained samples were measured by a digital
micrometer (IP65, Mitutoyo, Japan). The mechanical properties of the obtained samples were
analyzed using a universal testing machine (STA-1150, A&D Company, Ltd, Japan) equipped
with a 50-N load cell and elongated at a constant speed of 10 mm/min under ambient conditions.
The test samples were cut to 30 mm in length and 5 mm in width and were mounted in the tensile
grips spaced 10 mm apart before analysis.
4.2.4.5. Determination of resistance to EMImBF4 damage
The resistance of GES samples to EMImBF4 damage was measured after
immersion in EMImBF4 at room temperature, incubation in a desiccator for 10 days, and
washing with ethanol. The structural morphology of the GES samples was observed using SEM
before and after immersion in EMImBF4.
4.2.5. Fabrication of EDLCs cells
Composite carbon electrodes were prepared by mixing activated carbon (YP-50F,
Kuraray Co., Ltd, Japan), acetylene black (HS-100, Denka company Ltd, Japan) as a conductive
additive, 1.2 wt% sodium carboxymethyl cellulose (WS-C, DKS Co., Ltd, Japan) as a dispersant
and 48% wt styrene-butadiene rubber (TRD2001, JSR corporation, Japan) as a binder in DI
water at a ratio of 90:5:3:2 (w/w). The slurry was then cast onto an etched aluminium-foil current
collector and dried, and the obtained composite electrode sheet was cut into 12 mm-diameter
disks. Two carbon electrodes were immersed in EMImBF4 for 10 min under reduced pressure
while the gel electrolyte was soaked in EMImBF4 under a 0.3 Pa vacuum at room temperature
for 48 h. The test cells were then assembled with the prepared carbon electrodes and gel
electrolytes. In addition, test cells were assembled with liquid-phase EMImBF4 and a cellulose
separator (TF4035, Nippon Kodoshi Corporation, Japan) for comparison. The whole assembly
procedure was performed in an argon-filled glove box.
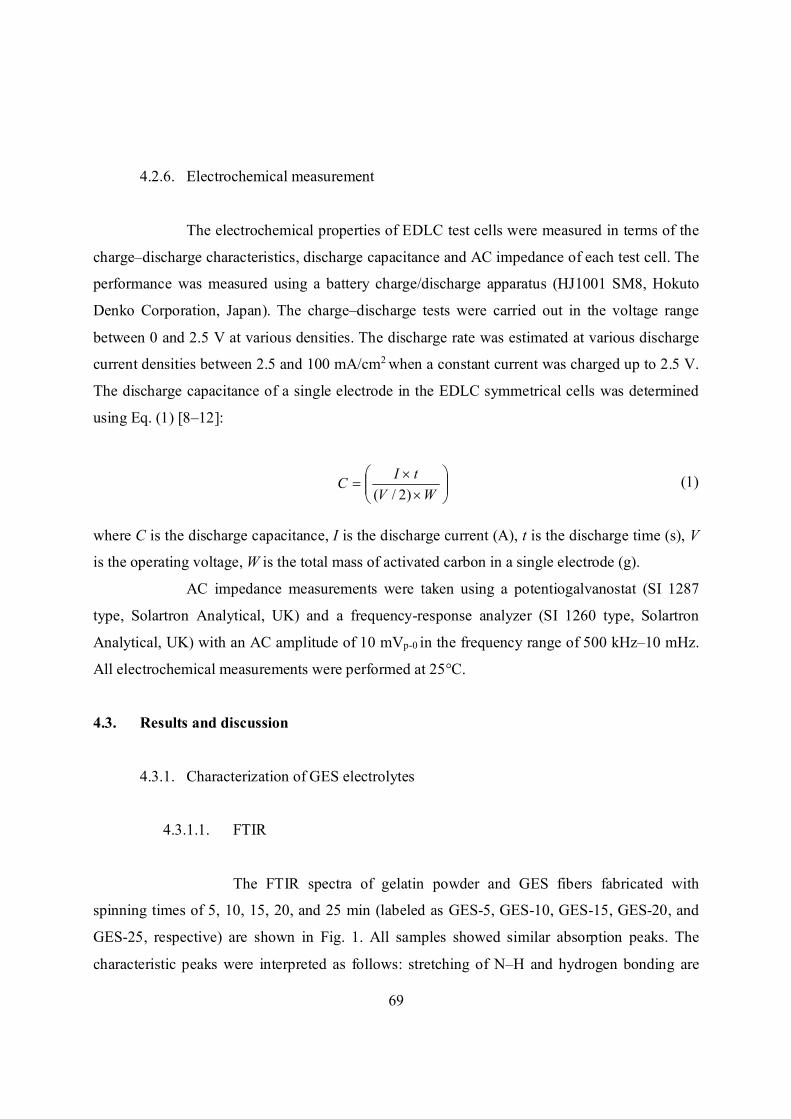
69
4.2.6. Electrochemical measurement
The electrochemical properties of EDLC test cells were measured in terms of the
charge–discharge characteristics, discharge capacitance and AC impedance of each test cell. The
performance was measured using a battery charge/discharge apparatus (HJ1001 SM8, Hokuto
Denko Corporation, Japan). The charge–discharge tests were carried out in the voltage range
between 0 and 2.5 V at various densities. The discharge rate was estimated at various discharge
current densities between 2.5 and 100 mA/cm2 when a constant current was charged up to 2.5 V.
The discharge capacitance of a single electrode in the EDLC symmetrical cells was determined
using Eq. (1) [8–12]:
WVtIC
)2/( (1)
where C is the discharge capacitance, I is the discharge current (A), t is the discharge time (s), V
is the operating voltage, W is the total mass of activated carbon in a single electrode (g).
AC impedance measurements were taken using a potentiogalvanostat (SI 1287
type, Solartron Analytical, UK) and a frequency-response analyzer (SI 1260 type, Solartron
Analytical, UK) with an AC amplitude of 10 mVp-0 in the frequency range of 500 kHz–10 mHz.
All electrochemical measurements were performed at 25°C.
4.3. Results and discussion
4.3.1. Characterization of GES electrolytes
4.3.1.1. FTIR
The FTIR spectra of gelatin powder and GES fibers fabricated with
spinning times of 5, 10, 15, 20, and 25 min (labeled as GES-5, GES-10, GES-15, GES-20, and
GES-25, respective) are shown in Fig. 1. All samples showed similar absorption peaks. The
characteristic peaks were interpreted as follows: stretching of N–H and hydrogen bonding are

70
observed around 3300 cm−1 (amide A), stretching of C=O is observed around 1650 cm−1 (amide
I), bending and stretching of N–H is observed at 1540 cm−1 (amide II) and stretching of C–N and
bending of N–H are observed at 1240 cm−1. These absorption peaks are characteristic of gelatin
[26], [38] so the presence of these peaks proves that the electrospinning process did not alter the
functional groups of the gelatin.
Fig. 1 FTIR spectra of gelatin powder and GES products.
4.3.1.2. TGA
TGA and DTG thermograms of gelatin powder and the GES products are
shown in Fig. 2. All samples demonstrated an initial weight loss due to evaporation of the
moisture on the surface in the temperature range of 40–130°C. The moisture content of the GES
products was higher than that of the gelatin powder because of the comparatively high surface
area of the GES fibers. The onset of the second weight loss occurred around 200°C and the
maximum weight loss occurred at approximately 330°C due to the degradation of the protein
[39, 40]. These results demonstrate high thermal stability and imply that GES fibers may
potentially be used as gel electrolytes in EDLCs under high-temperature operation.
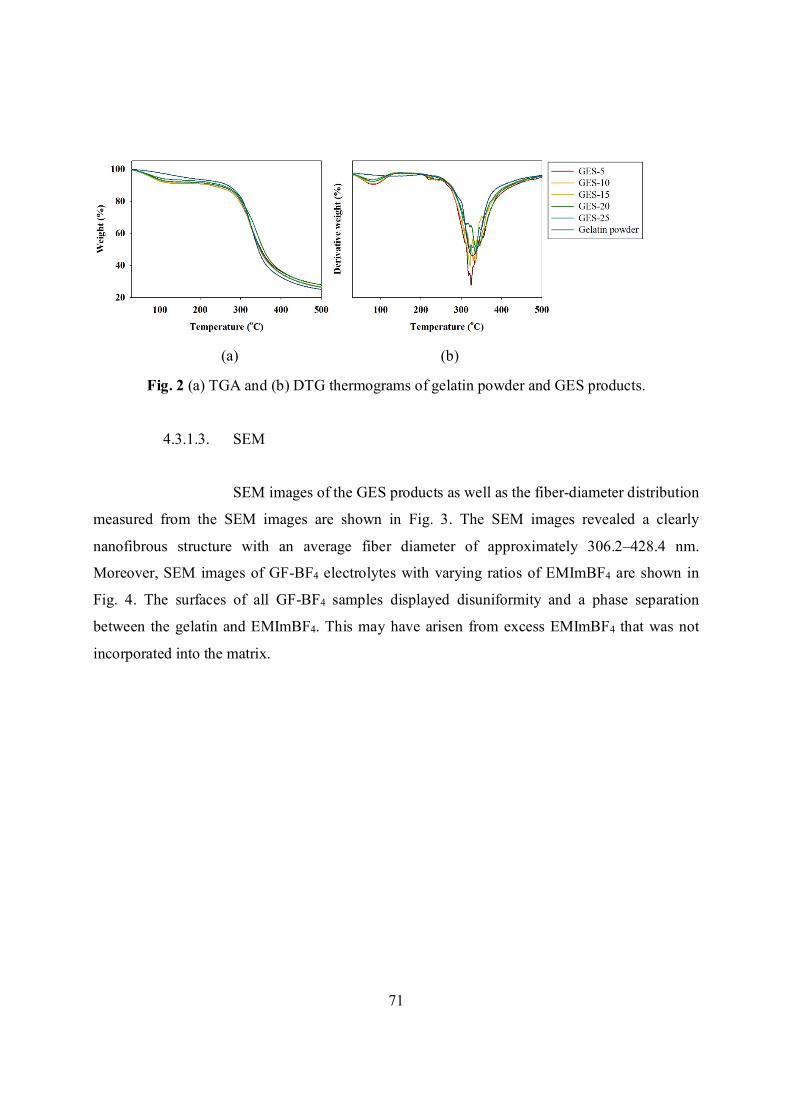
71
(a) (b)
Fig. 2 (a) TGA and (b) DTG thermograms of gelatin powder and GES products.
4.3.1.3. SEM
SEM images of the GES products as well as the fiber-diameter distribution
measured from the SEM images are shown in Fig. 3. The SEM images revealed a clearly
nanofibrous structure with an average fiber diameter of approximately 306.2–428.4 nm.
Moreover, SEM images of GF-BF4 electrolytes with varying ratios of EMImBF4 are shown in
Fig. 4. The surfaces of all GF-BF4 samples displayed disuniformity and a phase separation
between the gelatin and EMImBF4. This may have arisen from excess EMImBF4 that was not
incorporated into the matrix.
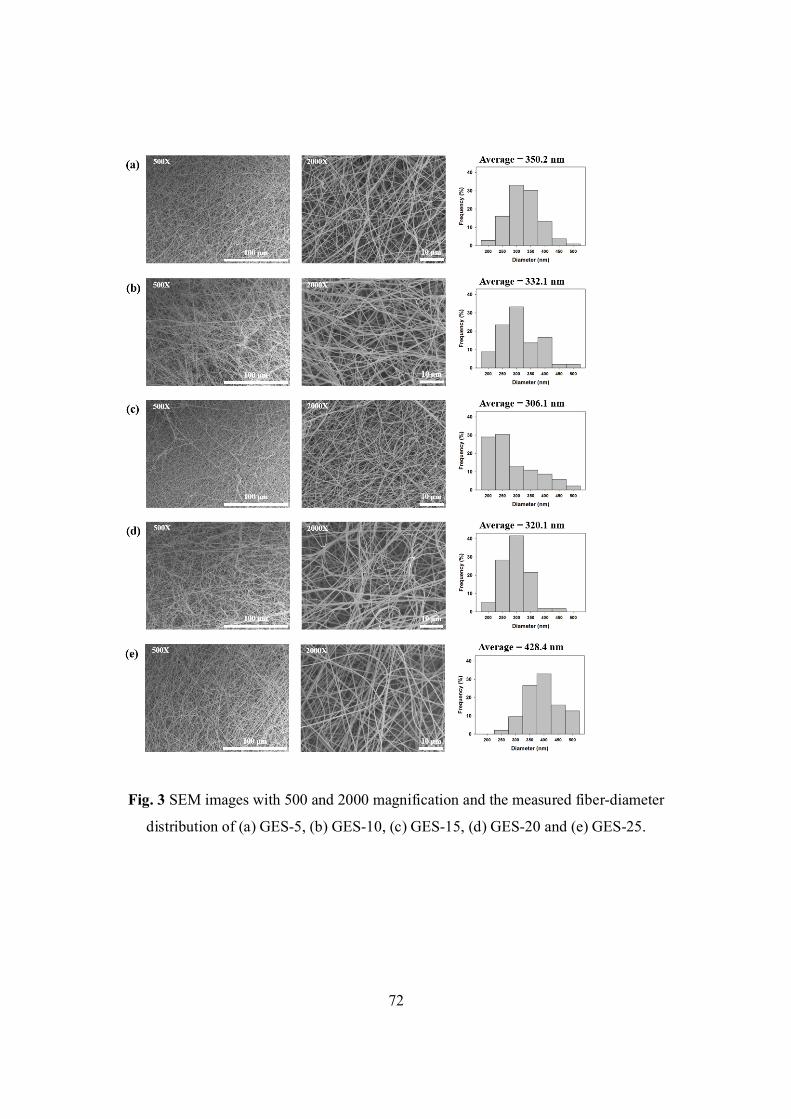
72
Fig. 3 SEM images with 500 and 2000 magnification and the measured fiber-diameter
distribution of (a) GES-5, (b) GES-10, (c) GES-15, (d) GES-20 and (e) GES-25.
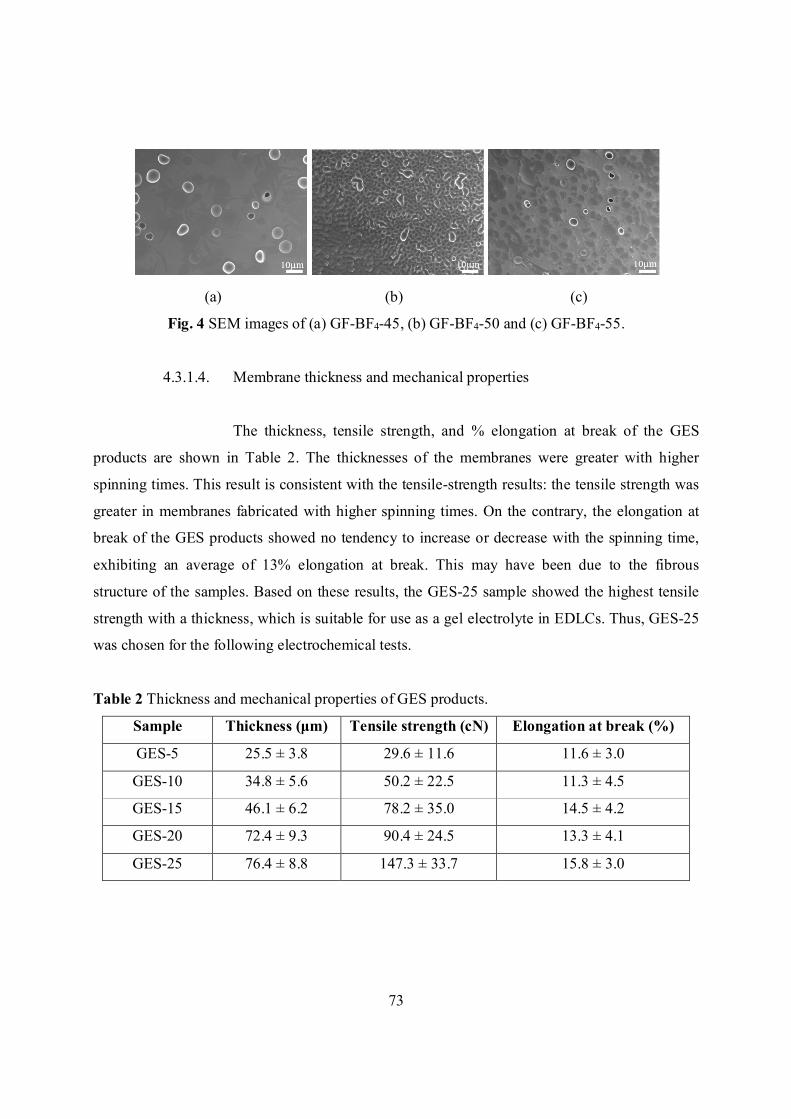
73
(a) (b) (c)
Fig. 4 SEM images of (a) GF-BF4-45, (b) GF-BF4-50 and (c) GF-BF4-55.
4.3.1.4. Membrane thickness and mechanical properties
The thickness, tensile strength, and % elongation at break of the GES
products are shown in Table 2. The thicknesses of the membranes were greater with higher
spinning times. This result is consistent with the tensile-strength results: the tensile strength was
greater in membranes fabricated with higher spinning times. On the contrary, the elongation at
break of the GES products showed no tendency to increase or decrease with the spinning time,
exhibiting an average of 13% elongation at break. This may have been due to the fibrous
structure of the samples. Based on these results, the GES-25 sample showed the highest tensile
strength with a thickness, which is suitable for use as a gel electrolyte in EDLCs. Thus, GES-25
was chosen for the following electrochemical tests.
Table 2 Thickness and mechanical properties of GES products.
Sample Thickness (μm) Tensile strength (cN) Elongation at break (%)
GES-5 25.5 ± 3.8 29.6 ± 11.6 11.6 ± 3.0
GES-10 34.8 ± 5.6 50.2 ± 22.5 11.3 ± 4.5
GES-15 46.1 ± 6.2 78.2 ± 35.0 14.5 ± 4.2
GES-20 72.4 ± 9.3 90.4 ± 24.5 13.3 ± 4.1
GES-25 76.4 ± 8.8 147.3 ± 33.7 15.8 ± 3.0
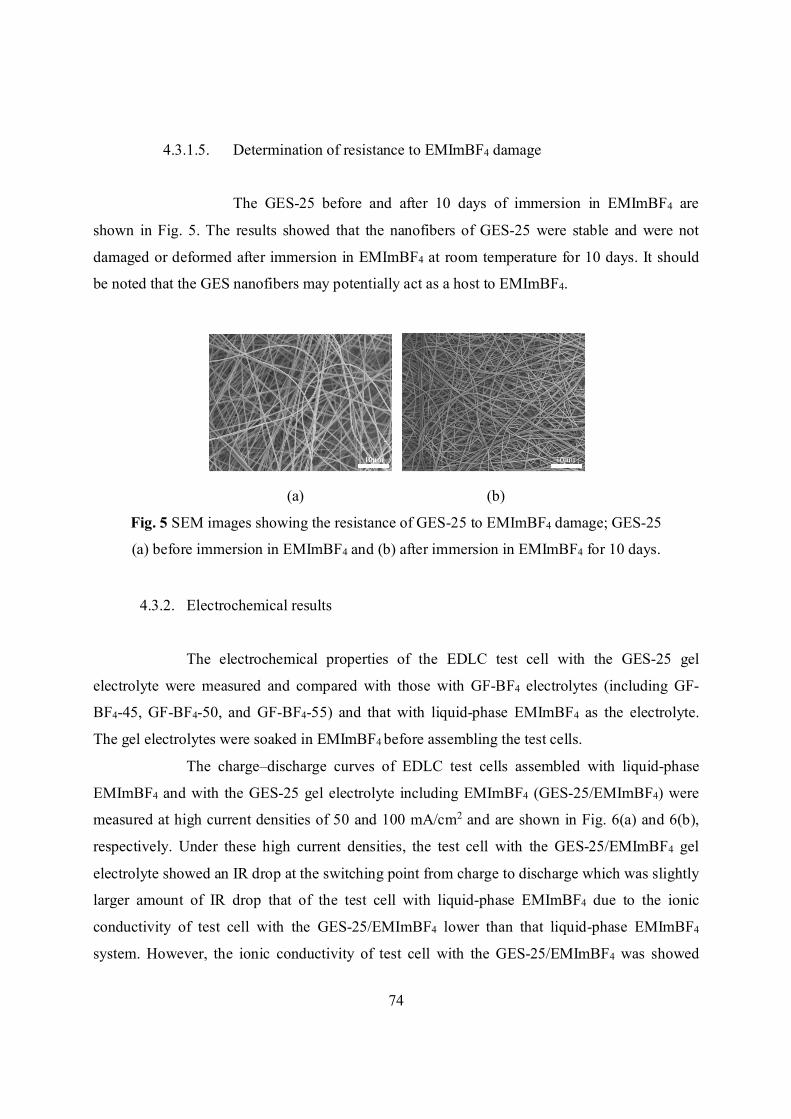
74
4.3.1.5. Determination of resistance to EMImBF4 damage
The GES-25 before and after 10 days of immersion in EMImBF4 are
shown in Fig. 5. The results showed that the nanofibers of GES-25 were stable and were not
damaged or deformed after immersion in EMImBF4 at room temperature for 10 days. It should
be noted that the GES nanofibers may potentially act as a host to EMImBF4.
(a) (b)
Fig. 5 SEM images showing the resistance of GES-25 to EMImBF4 damage; GES-25
(a) before immersion in EMImBF4 and (b) after immersion in EMImBF4 for 10 days.
4.3.2. Electrochemical results
The electrochemical properties of the EDLC test cell with the GES-25 gel
electrolyte were measured and compared with those with GF-BF4 electrolytes (including GF-
BF4-45, GF-BF4-50, and GF-BF4-55) and that with liquid-phase EMImBF4 as the electrolyte.
The gel electrolytes were soaked in EMImBF4 before assembling the test cells.
The charge–discharge curves of EDLC test cells assembled with liquid-phase
EMImBF4 and with the GES-25 gel electrolyte including EMImBF4 (GES-25/EMImBF4) were
measured at high current densities of 50 and 100 mA/cm2 and are shown in Fig. 6(a) and 6(b),
respectively. Under these high current densities, the test cell with the GES-25/EMImBF4 gel
electrolyte showed an IR drop at the switching point from charge to discharge which was slightly
larger amount of IR drop that of the test cell with liquid-phase EMImBF4 due to the ionic
conductivity of test cell with the GES-25/EMImBF4 lower than that liquid-phase EMImBF4
system. However, the ionic conductivity of test cell with the GES-25/EMImBF4 was showed

75
significantly higher than that of conventional gel-electrolytes composed of synthesized polymer
matrix from previous reports [41]. The test cells with GF-BF4 which were immersed in
EMImBF4 before assembly (GF-BF4/EMImBF4), including GF-BF4-45/EMImBF4, GF-BF4-
50/EMImBF4, and GF-BF4-55/EMImBF4, could not be tested at high current densities owing of
the high internal resistance of these electrolytes.
(a) (b)
Fig. 6 Charge–discharge curves of the EDLC test cells with liquid-phase EMImBF4 and with
GES-25/EMImBF4 as the electrolytes at current densities of (a) 50 and (b) 100 mA/cm2.
In addition, the discharge capacitances of the same EDLC test cells as a function
of the applied current density in the range of 2.5–100 mA/cm2 are shown in Fig. 7. The results
demonstrate that the discharge capacitance retention of the test cell with the GES-25/EMImBF4
gel electrolyte differed only slightly with that of the test cell with the liquid-phase EMImBF4
electrolyte within the entire current-density range. Overall, the charge–discharge measurements
indicate that GES-25/EMImBF4 may be more effective as an electrolyte than liquid-phase
EMImBF4 in nonaqueous EDLCs for improving the safety of the devices without reducing the
performance.
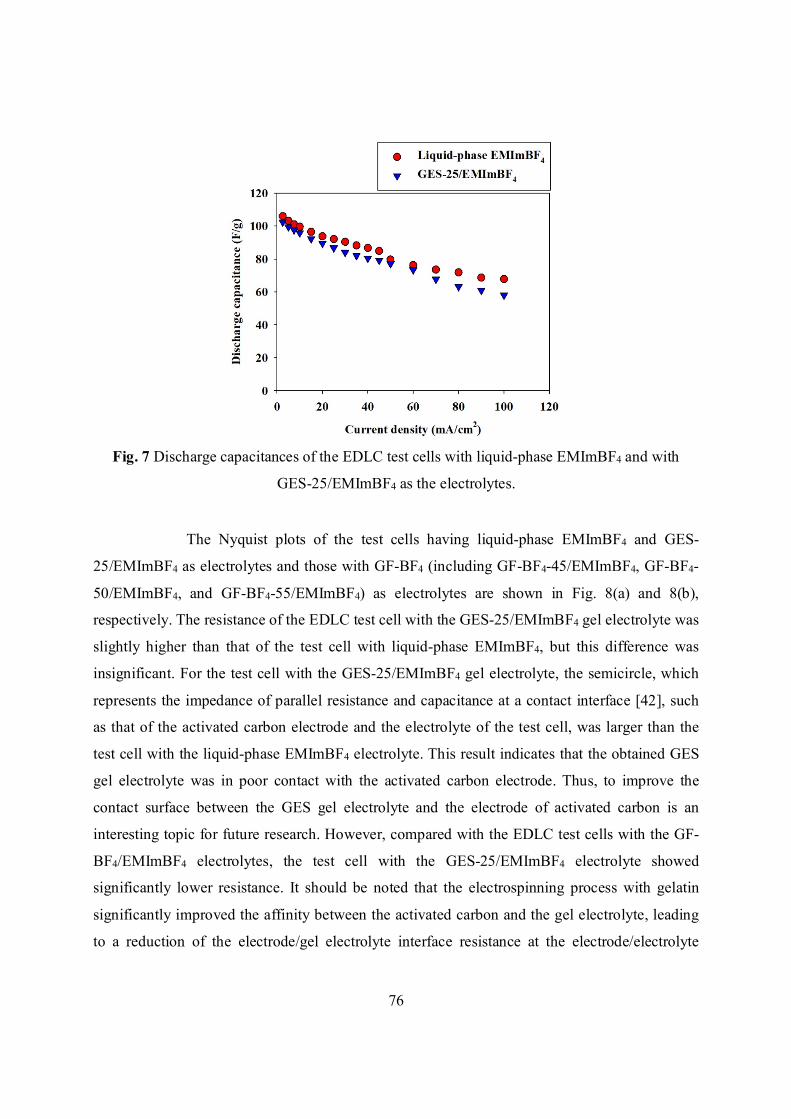
76
Fig. 7 Discharge capacitances of the EDLC test cells with liquid-phase EMImBF4 and with
GES-25/EMImBF4 as the electrolytes.
The Nyquist plots of the test cells having liquid-phase EMImBF4 and GES-
25/EMImBF4 as electrolytes and those with GF-BF4 (including GF-BF4-45/EMImBF4, GF-BF4-
50/EMImBF4, and GF-BF4-55/EMImBF4) as electrolytes are shown in Fig. 8(a) and 8(b),
respectively. The resistance of the EDLC test cell with the GES-25/EMImBF4 gel electrolyte was
slightly higher than that of the test cell with liquid-phase EMImBF4, but this difference was
insignificant. For the test cell with the GES-25/EMImBF4 gel electrolyte, the semicircle, which
represents the impedance of parallel resistance and capacitance at a contact interface [42], such
as that of the activated carbon electrode and the electrolyte of the test cell, was larger than the
test cell with the liquid-phase EMImBF4 electrolyte. This result indicates that the obtained GES
gel electrolyte was in poor contact with the activated carbon electrode. Thus, to improve the
contact surface between the GES gel electrolyte and the electrode of activated carbon is an
interesting topic for future research. However, compared with the EDLC test cells with the GF-
BF4/EMImBF4 electrolytes, the test cell with the GES-25/EMImBF4 electrolyte showed
significantly lower resistance. It should be noted that the electrospinning process with gelatin
significantly improved the affinity between the activated carbon and the gel electrolyte, leading
to a reduction of the electrode/gel electrolyte interface resistance at the electrode/electrolyte
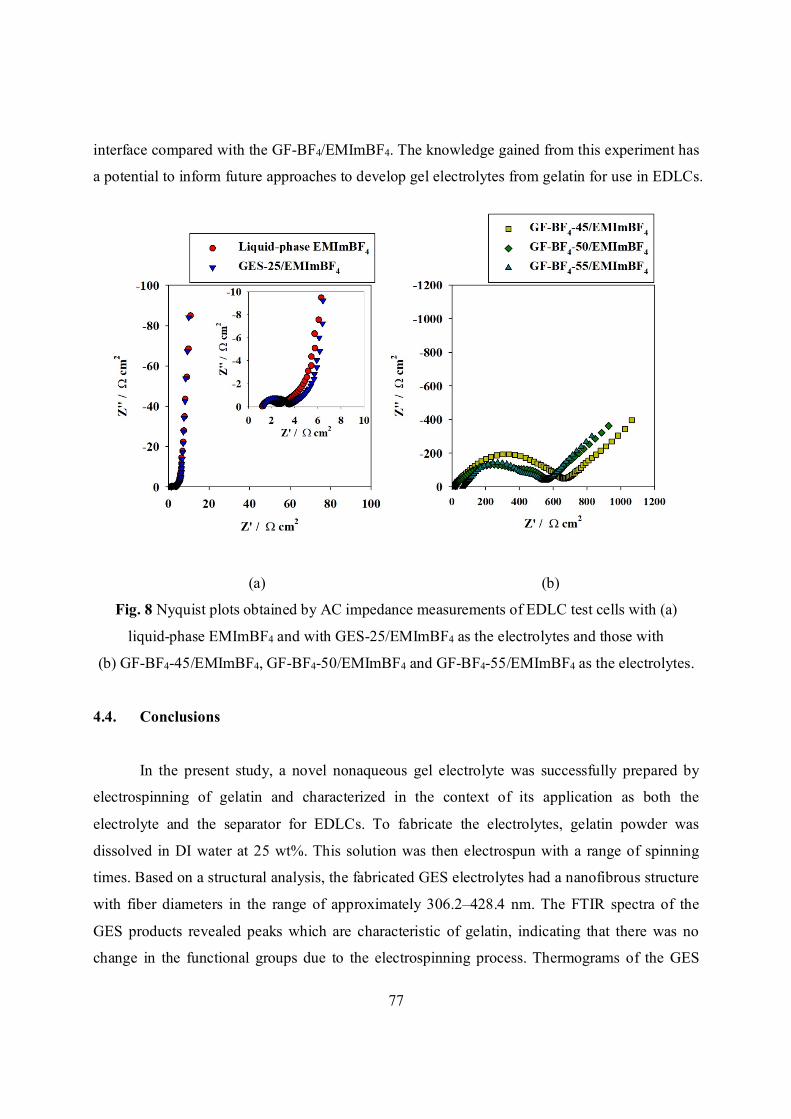
77
interface compared with the GF-BF4/EMImBF4. The knowledge gained from this experiment has
a potential to inform future approaches to develop gel electrolytes from gelatin for use in EDLCs.
(a) (b)
Fig. 8 Nyquist plots obtained by AC impedance measurements of EDLC test cells with (a)
liquid-phase EMImBF4 and with GES-25/EMImBF4 as the electrolytes and those with
(b) GF-BF4-45/EMImBF4, GF-BF4-50/EMImBF4 and GF-BF4-55/EMImBF4 as the electrolytes.
4.4. Conclusions
In the present study, a novel nonaqueous gel electrolyte was successfully prepared by
electrospinning of gelatin and characterized in the context of its application as both the
electrolyte and the separator for EDLCs. To fabricate the electrolytes, gelatin powder was
dissolved in DI water at 25 wt%. This solution was then electrospun with a range of spinning
times. Based on a structural analysis, the fabricated GES electrolytes had a nanofibrous structure
with fiber diameters in the range of approximately 306.2–428.4 nm. The FTIR spectra of the
GES products revealed peaks which are characteristic of gelatin, indicating that there was no
change in the functional groups due to the electrospinning process. Thermograms of the GES
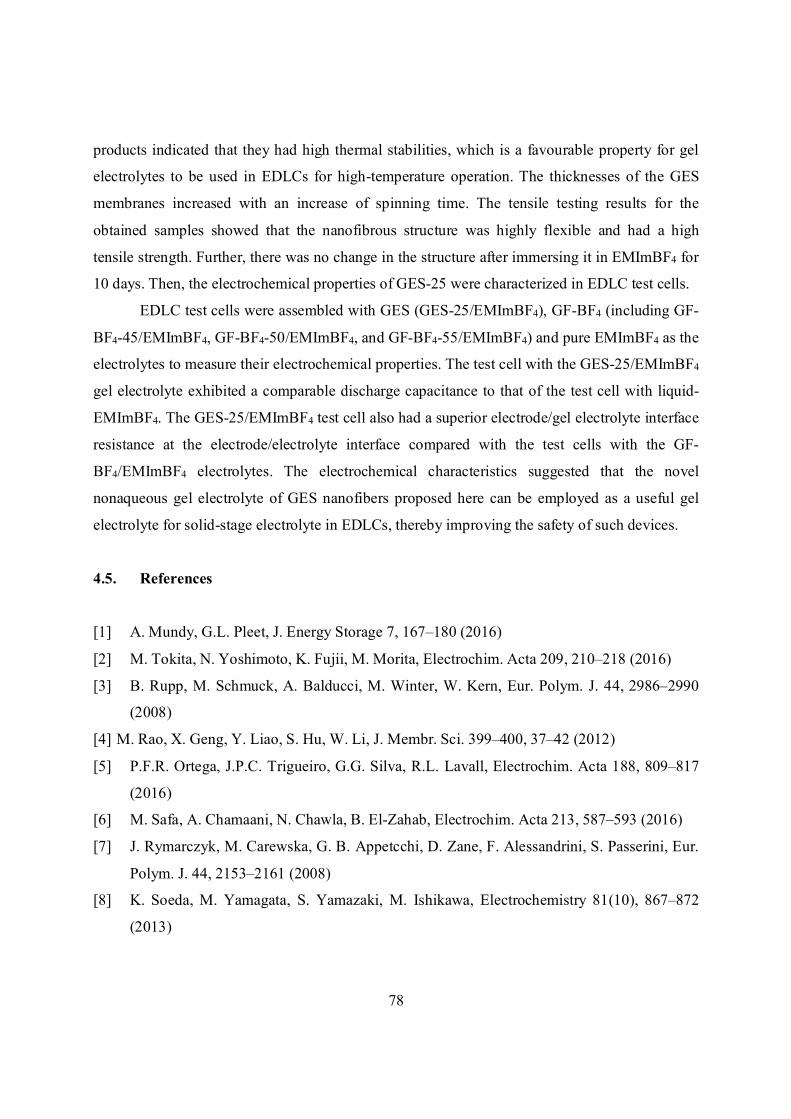
78
products indicated that they had high thermal stabilities, which is a favourable property for gel
electrolytes to be used in EDLCs for high-temperature operation. The thicknesses of the GES
membranes increased with an increase of spinning time. The tensile testing results for the
obtained samples showed that the nanofibrous structure was highly flexible and had a high
tensile strength. Further, there was no change in the structure after immersing it in EMImBF4 for
10 days. Then, the electrochemical properties of GES-25 were characterized in EDLC test cells.
EDLC test cells were assembled with GES (GES-25/EMImBF4), GF-BF4 (including GF-
BF4-45/EMImBF4, GF-BF4-50/EMImBF4, and GF-BF4-55/EMImBF4) and pure EMImBF4 as the
electrolytes to measure their electrochemical properties. The test cell with the GES-25/EMImBF4
gel electrolyte exhibited a comparable discharge capacitance to that of the test cell with liquid-
EMImBF4. The GES-25/EMImBF4 test cell also had a superior electrode/gel electrolyte interface
resistance at the electrode/electrolyte interface compared with the test cells with the GF-
BF4/EMImBF4 electrolytes. The electrochemical characteristics suggested that the novel
nonaqueous gel electrolyte of GES nanofibers proposed here can be employed as a useful gel
electrolyte for solid-stage electrolyte in EDLCs, thereby improving the safety of such devices.
4.5. References
[1] A. Mundy, G.L. Pleet, J. Energy Storage 7, 167–180 (2016)
[2] M. Tokita, N. Yoshimoto, K. Fujii, M. Morita, Electrochim. Acta 209, 210–218 (2016)
[3] B. Rupp, M. Schmuck, A. Balducci, M. Winter, W. Kern, Eur. Polym. J. 44, 2986–2990
(2008)
[4] M. Rao, X. Geng, Y. Liao, S. Hu, W. Li, J. Membr. Sci. 399–400, 37–42 (2012)
[5] P.F.R. Ortega, J.P.C. Trigueiro, G.G. Silva, R.L. Lavall, Electrochim. Acta 188, 809–817
(2016)
[6] M. Safa, A. Chamaani, N. Chawla, B. El-Zahab, Electrochim. Acta 213, 587–593 (2016)
[7] J. Rymarczyk, M. Carewska, G. B. Appetcchi, D. Zane, F. Alessandrini, S. Passerini, Eur.
Polym. J. 44, 2153–2161 (2008)
[8] K. Soeda, M. Yamagata, S. Yamazaki, M. Ishikawa, Electrochemistry 81(10), 867–872
(2013)
79
[9] M. Yamagata, K. Soeda, S. Ikebe, S. Yamazaki, M. Ishikawa, Electrochim. Acta 100, 275–
280 (2013)
[10] M. Yamagata, K. Soeda, S. Ikebe, S. Yamazaki, M. Ishikawa, J. Electrochem. Soc. 41(22),
25–35 (2012)
[11] M. Yamagata, S. Ikebe, Y. Kasai, K. Soeda, M. Ishikawa, J. Electrochem. Soc. 50(43), 27–
36 (2013)
[12] K. Soeda, M. Yamagata, M. Ishikawa, J. Power Sources 280, 565–572 (2015)
[13] M. Yamagata, K. Soeda, S. Yamazaki, M. Ishikawa, J. Electrochem. Soc. 25(35), 193–200
(2010)
[14] E. Raphael, C.O. Avellaneda, B. Manzolli, A. Pawlicka, Electrochim. Acta 55, 1455–1459
(2010)
[15] R. Leones, F. Sentanin, L.C. Rodrigues, I.M. Marrucho, J.M.S.S. Esperança, A. Pawlicka,
M.M. Silval, Express Polym. Lett. 6(12), 1007–1016 (2012)
[16] S. Rudhziah, M.S.A. Rani, A. Ahmad, N.S. Mohamed, H. Kaddami, Ind Crops Prod 72,
133–141 (2015)
[17] N.N. Mobarak, N. Ramli, A. Ahmad and M.Y.A. Rahman, Solid State Ionics 224, 51–57
(2012)
[18] N.N. Mobarak, F.N. Jumaah, M.A. Ghani, M.P. Abdullah and A. Ahmad, Electrochim.
Acta 175, 224–231 (2015)
[19] T.M. Di Palma, F. Migliardini, D. Caputo, P. Corbo, Carbohydr. Polym. 157, 122–127
(2017)
[20] A.S. Ahmad Khiar, A.K. Arof, Ionics 16, 123–129 (2010)
[21] M. Kumar, T. Tiwari, N. Srivastava, Carbohydr. Polym. 88, 54–60 (2012)
[22] M.F. Shukur, R. Ithnin, M.F.Z. Kadir, Electrochim. Acta 136, 204–216 (2014)
[23] D. Kotatha, K. Morishima, S. Uchidd, M. Ogino, M. Ishikawa, T. Furuike, H. Tamura,
Res. Chem. Intermediat. 44(8), 4971–4987 (2018)
[24] T. Furuike, T. Chaochai, T. Okubo, T. Mori, H. Tamura, Int. J. Biol. Macromol. 93, 1530–
1538 (2016)
[25] M. Peter, N. Ganesh, N. Selvamurugan, S.V. Nair, T. Furuike, H. Tamura, R. Jayakumar,
Carbohydr. Polym. 80, 687–694 (2010)

80
[26] L. Ji, W. Qiao, Y. Zhang, H. Wu, S. Miao, Z. Cheng, Q. Gong, J. Liang, A. Zhu, Mater.
Sci. Eng., C 78, 362–369 (2017)
[27] X. Liu, P.X. Ma, Biomaterials 30, 4094–4103 (2009)
[28] M.B. Dainiak, I.U. Allan, I.N. Savina, L. Cornelio, E.S. James, S.L. James, S.V.
Mikhalovsky, H. Jungvid, I.Y. Galaev, Biomaterials 31, 67–76 (2010)
[29] F. Zhang, C. He, L. Cao, W. Feng, H. Wang, X. Mo, J. Wang, Int. J. Biol. Macromol. 48,
474–481 (2011)
[30] T. Billiet, E. Gevaert, T.D. Schryver, M. Cornelissen, P. Dubruel, Biomaterials 35, 49–62
(2014)
[31] R. Ramadan, H. Kamal, H.M. Hashem, K. Abdel-Hady, Sol. Energy Mater. Sol. Cells 127,
147–156 (2014)
[32] M. Khannam, R. Boruah, S.K. Dolui, J. Photochem. Photobiol., A 335, 248–258 (2017)
[33] Z. Tang, J. Wu, Q. Liu, M. Zheng, Q. Tang, Z. Lan, J. Lin, J. Power Sources 203, 282–287
(2012)
[34] R. Leones, F. Sentanin, L.C. Rodrigues, R.A.S. Ferreira, I.M. Marrucho, J.M.S.S.
Esperança, A. Pawlicka, L.D. Carlos, M.M. Silva, Opt. Mater. 35, 187–195 (2012)
[35] D.F. Vieira, C.O. Avellaneda and A. Pawlicka, Electrochim. Acta 53, 1404–1408 (2007)
[36] C.O. Avellaneda, D.F. Vieira, A. Al-Kahlout, S. Heusing, E.R. Leite, A. Pawlicka, M.A.
Aegerter, Sol. Energy Mater. Sol. Cells 92, 228–233 (2008)
[37] H. Nagahama, H. Maeda, T. Kashiki, R. Jayakumar, T. Furuike, H. Tamura, Carbohydr.
Polym. 76, 255–260 (2009)
[38] T. Chaochai, Y. Imai, T. Furuike, H. Tamura, Fibers 4(2), 1–11 (2016)
[39] K. Jalaja, V.S. Sreehari, P.R.A. Kumar, R.J. Nirmala, Mater. Sci. Eng., C 64, 11–19 (2016)
[40] D.M. Correia, J. Padrão, L.R. Rodrigues, F. Dourado, S. Lanceros-Méndez, V. Sencadas
Polym. Test. 32, 995–1000 (2013)
[41] X. Liu, T. Osaka, J. Electrochem. Soc. 144, 3066–3071 (1997)
[42] A. Lewandowski, A. Świderska, Solid State Ionics 161, 243–249 (2003)

81
Chapter 5
Concluding Remarks
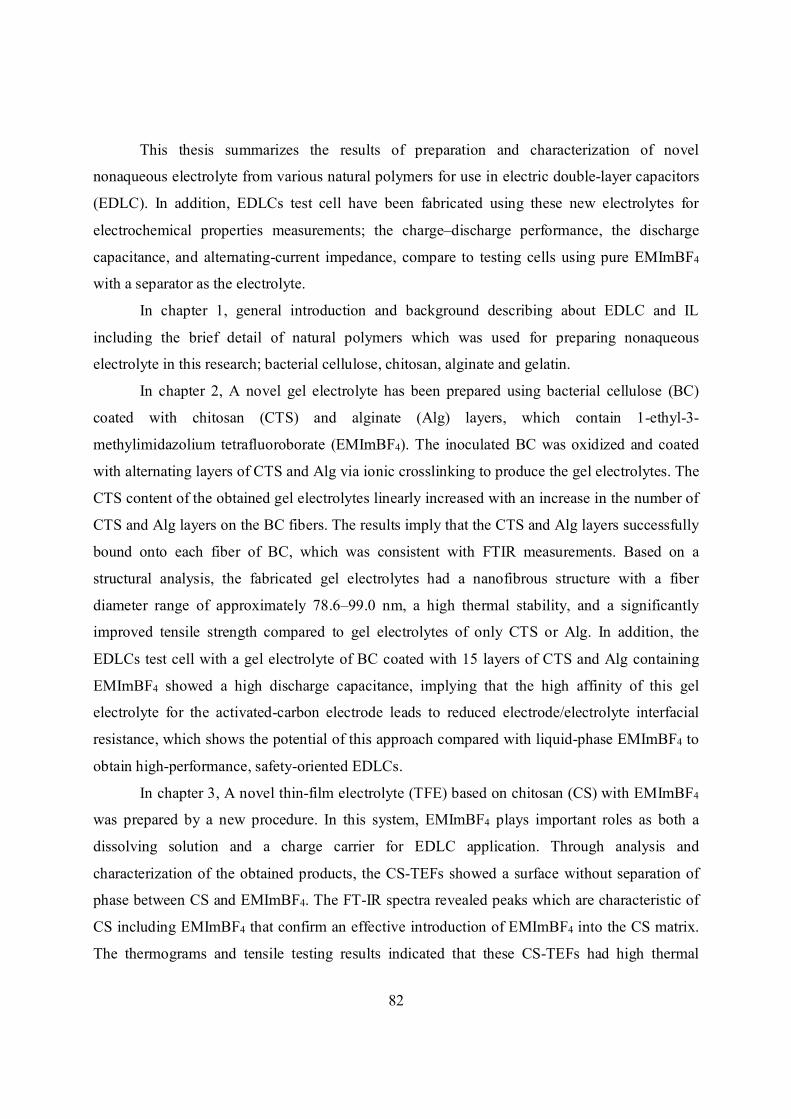
82
This thesis summarizes the results of preparation and characterization of novel
nonaqueous electrolyte from various natural polymers for use in electric double-layer capacitors
(EDLC). In addition, EDLCs test cell have been fabricated using these new electrolytes for
electrochemical properties measurements; the charge–discharge performance, the discharge
capacitance, and alternating-current impedance, compare to testing cells using pure EMImBF4
with a separator as the electrolyte.
In chapter 1, general introduction and background describing about EDLC and IL
including the brief detail of natural polymers which was used for preparing nonaqueous
electrolyte in this research; bacterial cellulose, chitosan, alginate and gelatin.
In chapter 2, A novel gel electrolyte has been prepared using bacterial cellulose (BC)
coated with chitosan (CTS) and alginate (Alg) layers, which contain 1-ethyl-3-
methylimidazolium tetrafluoroborate (EMImBF4). The inoculated BC was oxidized and coated
with alternating layers of CTS and Alg via ionic crosslinking to produce the gel electrolytes. The
CTS content of the obtained gel electrolytes linearly increased with an increase in the number of
CTS and Alg layers on the BC fibers. The results imply that the CTS and Alg layers successfully
bound onto each fiber of BC, which was consistent with FTIR measurements. Based on a
structural analysis, the fabricated gel electrolytes had a nanofibrous structure with a fiber
diameter range of approximately 78.6–99.0 nm, a high thermal stability, and a significantly
improved tensile strength compared to gel electrolytes of only CTS or Alg. In addition, the
EDLCs test cell with a gel electrolyte of BC coated with 15 layers of CTS and Alg containing
EMImBF4 showed a high discharge capacitance, implying that the high affinity of this gel
electrolyte for the activated-carbon electrode leads to reduced electrode/electrolyte interfacial
resistance, which shows the potential of this approach compared with liquid-phase EMImBF4 to
obtain high-performance, safety-oriented EDLCs.
In chapter 3, A novel thin-film electrolyte (TFE) based on chitosan (CS) with EMImBF4
was prepared by a new procedure. In this system, EMImBF4 plays important roles as both a
dissolving solution and a charge carrier for EDLC application. Through analysis and
characterization of the obtained products, the CS-TEFs showed a surface without separation of
phase between CS and EMImBF4. The FT-IR spectra revealed peaks which are characteristic of
CS including EMImBF4 that confirm an effective introduction of EMImBF4 into the CS matrix.
The thermograms and tensile testing results indicated that these CS-TEFs had high thermal

83
stabilities with good tensile strength, which is a favorable property for solid-electrolyte to be
used in EDLCs. Moreover, the EDLCs test cell with CS-TFE with a calculated dry thin-film
content of 80 wt% EMImBF4 showed a comparable IR drop and higher discharge capacitance
than a liquid-phase EMImBF4 system and also showed low electrode/electrolyte interfacial
resistance. Consequently, this novel CS-TFE is suitable for high-performance EDLCs and
improves the safety of such devices.
In chapter 4, A novel nanofibrous gel electrolyte was prepared via gelatin electrospinning
to be used as a nonaqueous electrolyte in EDLCs. An electrospinning technique with a 25 wt%
gelatin solution was used to produce gelatin electrospun (GES) electrolytes. A structural analysis
of the GES products showed a clearly nanofibrous structure having fiber diameters in the range
of approximately 306.2–428.4 nm, high thermal stability, high tensile strength, and resistance to
damage upon immersion in EMImBF4. After testing a range of spinning times, GES electrolytes
that were electrospun with 25 min of spinning time (GES-25) were used to fabricate EDLC test
cells with EMImBF4. These test cells were compared with test cells using gelatin films
containing EMImBF4 and with testing cells using pure EMImBF4 with a separator as the
electrolyte. The test cell with the GES-25/EMImBF4 gel electrolyte showed a similar IR drop
and discharge capacitance as the liquid-EMImBF4 test cell. However, the electronic contact
resistance in activated carbon electrode at the electrode/electrolyte interface was significantly
better in the GES-25/EMImBF4 test cell compared with the test cell with the gelatin
film/EMImBF4 electrolytes. The results demonstrate that this novel nonaqueous gel electrolyte
can be used for solid-stage electrolyte in EDLCs to improve the safety of such devices.

84
List of Publication
85
List of Publication
1. Preparation and characterization of gel electrolyte with bacterial cellulose coated with
alternating layers of chitosan and alginate for electric double-layer capacitors, D. Kotatha,
K. Morishima, S. Uchida, M. Ogino, M. Ishikawa, T. Furuike and H. Tamura, Research on
Chemical Intermediate, 44, 4971–4987 (2018).
2. Preparation and characterizations of thin-film electrolyte from chitosan containing ionic
liquid for application to electric double-layer capacitors, D. Kotatha, K. Shinomiya, Y.
Torii, M. Ogino, S. Uchida, M. Ishikawa, T. Furuike and H. Tamura, International Journal
of Biological Macromolecules, accepted
3. Preparation and characterization of electrospun gelatin nanofibers for used as nonaqueous
electrolyte in electric double-layer capacitor, D. Kotatha, M. Hirata, M. Ogino, S. Uchida,
M. Ishikawa, T. Furuike and H. Tamura, Submitted to Journal of Nanotechnology
(2018.08.31)

86
Acknowledgments
87
Acknowledgements
This thesis would have been impossible without the help form my advisor, Professor Dr.
Hiroshi Tamura of Department of Chemistry and Materials Engineering, Faculty of Chemistry,
Materials, Bioengineering, Kansai University. I would like to express sincere appreciation to
Professor Dr. Hiroshi Tamura as he gave me a precious opportunity to be a PhD student under
his supervision. And thank you for his continuous guidance, discussions and many
encouragements throughout this study. Not only the academic part, he always gives me a lot of
opportunities and many things to my life.
I would like to express my thanks to my co-advisor, Professor Dr. Tetsuya Furuike,
Department of Chemistry and Materials Engineering, Faculty of Chemistry, Materials,
Bioengineering, Kansai University, for his kindness and helpful, useful discussions, advice and
encouragement. Through his much valuable advice, I learned a great deal of scientific thinking.
I would like to express my thanks to Professor Dr. Masashi Ishikawa Department of
Chemistry and Materials Engineering, Faculty of Chemistry, Materials, Bioengineering, Kansai
University. And my team member in Electrochemical laboratory for excellent co-working, good
advice and always support in part of electrochemical proprieties in this thesis.
I would like to express deepest gratitude to Nishimura scholarship foundation and also
other foundations to support me during the past three years for studying in Japan. They are parts
of the successful for my PhD life.
I would also like to thank to all of laboratory member in Biofuntionalize Chemistry
Laboratory for the kindness and helpful in any situation, for stimulating discussions, for working
hard together, and for all the fun in the last three years. It will be in my heart forever. Special
thanks to my team members; Mr. Keito Shinomiya, Mr. Masaharu Hirata and Mr. Yoshiki Torii
for every support and give me more happiness in PhD life.
Last but not least, I am very thankful to my family especially Mrs. Payom Kotatha and
Mr. Jaturapon Kotatha for support, understand and believe me in everything that I choose,
encourage and always beside me.
DITPON KOTATHA