Nanoconfined, dynamic electrolyte gating and memory effects ...
35
1 Nanoconfined, dynamic electrolyte gating and memory effects in multilayered graphene-based membranes Jing Xiao 1,2* , Hualin Zhan 2* , Zaiquan Xu 1,3 , Xiao Wang 2 , Ke Zhang 1 , Zhiyuan Xiong 2 , George P. Simon 1 , Zhe Liu 4 , Dan Li 1,2 † 1 Department of Materials Science and Engineering, Monash University, VIC 3800, Australia 2 Department of Chemical Engineering, The University of Melbourne, VIC 3010, Australia 3 School of Mathematical and Physical Sciences, University of Technology Sydney, NSW, 2007, Australia 4 Department of Mechanical Engineering, The University of Melbourne, VIC 3010, Australia *These authors contributed equally to this work. †Email: [email protected] Multilayered graphene-based nanoporous membranes with electrolyte incorporated between individual sheets is a unique nano- heterostructure system in which nanoconfined electrons in graphene and ions confined in between sheets are intimately coupled throughout the entire membrane. In contrast to the general notion that the electrolyte gating is unlikely to appear in multilayered graphene stacks, it is demonstrated in this work that the electrolyte gating effect in monolayer graphene can be transferred to its corresponding multilayered porous membranes. This gating effect presented on each individual graphene sheets through electrolyte confined in nanopores provides a real-time, electrical approach for probing the complex dynamics of nanoconfined electrical double layer. This has enabled the observation of the ionic memory effect in supercapacitors and produces new insights into the charging dynamics of supercapacitors. Such discoveries may stimulate the design of novel nanoionic devices. Ion transport in nanopores or nanochannels under dynamic conditions is ubiquitous in numerous applications including supercapacitors 1 , capacitive deionization 2 , artificial muscles 3 and nanofluidics 4 . Recent studies in nanoporous carbon-based supercapacitors have revealed that the dynamics of ions in nanoconfined electrical double layers (EDLs) can be very different from that in the bulk electrolyte due to the spatial confinement, ion-ion correlations, and enhanced interactions between ions and pore surfaces in nanopores 5-8 . Obtaining comprehensive understanding of nanoconfined ion dynamics not only provides valuable guidance for optimizing the existing applications of nanoporous materials 1,9 , but can also stimulate the design of novel nanoionic devices. For example, a recent report shows that ion flow across a single nanopore can exhibit a hysteretic response to the applied potential (i.e., memory effect) at high frequency, making it possible to design new memory capacitors or memcapacitors from nanopores 10-12 . Recent simulations also predict that the phase behaviour of ions in porous electrodes with their pore sizes close to that of the ions could exhibit ferroelectric phase behaviours, implying new applications of nanoconfined ions beyond conventional energy storage 13 . An in-depth understanding of nanoconfined ion dynamics requires techniques for real-time probing of the ion movement in nanoporous materials but has proven to be challenging. Methods including nuclear magnetic resonance 7,14 , electrochemical quartz crystal microbalance 15,16 , infrared spectroscopy 17,18 , and X-ray scattering 5,19 have all been used to probe the structure of EDL − a region of polarized ions at electrode-electrolyte interfaces that underpins many electrochemical applications. With these techniques, the information of the global change of ionic concentration and compositions of EDL inside supercapacitor electrodes can be obtained. However, ionic behaviour in EDL could evolve with time differently, depending on the structural, chemical, and electrical conditions, where the overall electrochemical performance of supercapacitors may be affected. Therefore, new in situ techniques are required to monitor the transient response of ions in EDL, where not only insights to their time-dependent behaviour
-
Upload
khangminh22 -
Category
Documents
-
view
3 -
download
0
Transcript of Nanoconfined, dynamic electrolyte gating and memory effects ...
1
Nanoconfined, dynamic electrolyte gating and memory effects in multilayered
graphene-based membranes
Jing Xiao1,2*, Hualin Zhan2*, Zaiquan Xu1,3, Xiao Wang2, Ke Zhang1, Zhiyuan Xiong2, George P.
Simon1, Zhe Liu4, Dan Li1,2 †
1Department of Materials Science and Engineering, Monash University, VIC 3800, Australia
2Department of Chemical Engineering, The University of Melbourne, VIC 3010, Australia
3School of Mathematical and Physical Sciences, University of Technology Sydney, NSW, 2007, Australia
4Department of Mechanical Engineering, The University of Melbourne, VIC 3010, Australia
*These authors contributed equally to this work.
†Email: [email protected]
Multilayered graphene-based nanoporous
membranes with electrolyte incorporated
between individual sheets is a unique nano-
heterostructure system in which
nanoconfined electrons in graphene and ions
confined in between sheets are intimately
coupled throughout the entire membrane. In
contrast to the general notion that the
electrolyte gating is unlikely to appear in
multilayered graphene stacks, it is
demonstrated in this work that the electrolyte
gating effect in monolayer graphene can be
transferred to its corresponding multilayered
porous membranes. This gating effect
presented on each individual graphene sheets
through electrolyte confined in nanopores
provides a real-time, electrical approach for
probing the complex dynamics of
nanoconfined electrical double layer. This
has enabled the observation of the ionic
memory effect in supercapacitors and
produces new insights into the charging
dynamics of supercapacitors. Such
discoveries may stimulate the design of novel
nanoionic devices.
Ion transport in nanopores or nanochannels
under dynamic conditions is ubiquitous in
numerous applications including
supercapacitors1, capacitive deionization2,
artificial muscles3 and nanofluidics4. Recent
studies in nanoporous carbon-based
supercapacitors have revealed that the dynamics
of ions in nanoconfined electrical double layers
(EDLs) can be very different from that in the
bulk electrolyte due to the spatial confinement,
ion-ion correlations, and enhanced interactions
between ions and pore surfaces in nanopores5-8.
Obtaining comprehensive understanding of
nanoconfined ion dynamics not only provides
valuable guidance for optimizing the existing
applications of nanoporous materials1,9, but can
also stimulate the design of novel nanoionic
devices. For example, a recent report shows that
ion flow across a single nanopore can exhibit a
hysteretic response to the applied potential (i.e.,
memory effect) at high frequency, making it
possible to design new memory capacitors or
memcapacitors from nanopores10-12. Recent
simulations also predict that the phase behaviour
of ions in porous electrodes with their pore sizes
close to that of the ions could exhibit
ferroelectric phase behaviours, implying new
applications of nanoconfined ions beyond
conventional energy storage13.
An in-depth understanding of nanoconfined ion
dynamics requires techniques for real-time
probing of the ion movement in nanoporous
materials but has proven to be challenging.
Methods including nuclear magnetic
resonance7,14, electrochemical quartz crystal
microbalance15,16, infrared spectroscopy17,18,
and X-ray scattering5,19 have all been used to
probe the structure of EDL − a region of
polarized ions at electrode-electrolyte interfaces
that underpins many electrochemical
applications. With these techniques, the
information of the global change of ionic
concentration and compositions of EDL inside
supercapacitor electrodes can be obtained.
However, ionic behaviour in EDL could evolve
with time differently, depending on the
structural, chemical, and electrical conditions,
where the overall electrochemical performance
of supercapacitors may be affected. Therefore,
new in situ techniques are required to monitor
the transient response of ions in EDL, where not
only insights to their time-dependent behaviour
2
can be obtained but also the contribution of ion
dynamics to the electrochemical performance at
the device level could be simultaneously
evaluated in a facile manner.
We have recently demonstrated that large-area
multilayered graphene-based membranes
(MGMs) with their average interlayer distance
tuneable from 10 nm down to subnanometre can
be readily prepared by the controlled assembly
of reduced graphene oxide (rGO) sheets20-22.
When MGMs are immersed in an electrolyte
where an external potential is applied, EDLs can
immediately build up between monolayer
graphene sheets, providing high EDL
capacitance for energy storage20. From an
electronic materials point of view, this
membrane presents a unique nano-
heterostructure of electrons and ions, in which
electrons of graphene are restricted in the
atomically thin sheets while ions are confined in
the nanoscale gap between them. In this work,
we demonstrate how the interactions of nano-
confined electrons and ions in this membrane
can lead to a new technique for electrically
monitoring the ion dynamics of EDLs and how
this technique assists in the discovery of a
memcapacitive effect in nanoporous electrodes
and provides new insights into the dynamics of
supercapacitors.
Hypothesis The existing techniques for probing the EDL
dynamics are generally based on monitoring the
ion concentration change within the nanoporous
electrodes9. An alternative strategy to track the
transient response of EDL is to measure in real-
time the impact of EDL on the electrical
property of the electrode material. It has been
reported that when the electrode is made of a
semiconductor such as silicon, the local
electrical field across the EDL can affect the
charge (electrons or holes) density in the
semiconductive material, thereby modulating
the electronic conductance of the electrode;
hence the so-called electrochemical field effect
or electrolyte gating effect23,24. The ion transport
properties at the electrode interface could thus
be indirectly monitored by measuring the
conductance variation of the semiconductor, and
to date has been used for developing chemical
sensors25,26. To our knowledge, the electrolyte
gating effect has been observed only at the
interface of semiconductor and bulk electrolyte
solutions27. We hypothesized that if the pore
walls of a bulk nanoporous material are made of
a semiconducting material and the electrolyte
gating effect can be transferred to the bulk
nanoporous material, the transient response of
EDL could be monitored and read out
electrically through the change of the electronic
conductance of the porous materials.
Unlike graphite, monolayer graphene (primarily
fabricated by mechanical cleavage or chemical
vapour deposition) exhibits semiconductor-like
properties because of the Fermi level is located
near a relatively low electronic density of
states23,28. However, an MGM contains
thousands of chemically reduced graphene
oxide (rGO), where the exact stacking order of
individual monolayers is unclear, not to mention
the presence of residual functional groups and
defects may affect the electronic density of
states. If the rGO sheets in the hydrogel MGM
membranes are significantly separated from
each other, and the contribution of defects to
electronic density of states is not able to make
rGO metallic20,21,29, an electrolyte gating effect
might be observable in MGM. Thus, the MGM
material appears to be a good model system to
verify the above hypothesis.
Real-time monitoring the conductance of MGM during capacitive charging We adopted a conventional symmetric EDL-
type capacitor design with two similar disks of
MGMs serving as the working and counter (or
gate) electrodes to investigate whether a
potential applied to the working MGM electrode,
which immediately leads to the formation of
EDL within the electrode, would result in a
change to its own electronic conductance
(GMGM). A platinum ring was placed on the top
of the working MGM electrode to measure the
GMGM, where a low frequency (1 Hz) sinusoidal
voltage with the amplitude of 1.0 mV is applied
between the ring and current collector (Fig. 1a).
This approach allowed the removal of the ionic
conductance contribution to the measurement,
and hence effectively decouples the electrical
signal from the ion-electron network formed by
the migration of ions in MGMs30,31 (see details
in Methods and Supplementary Fig. S1-S5).
3
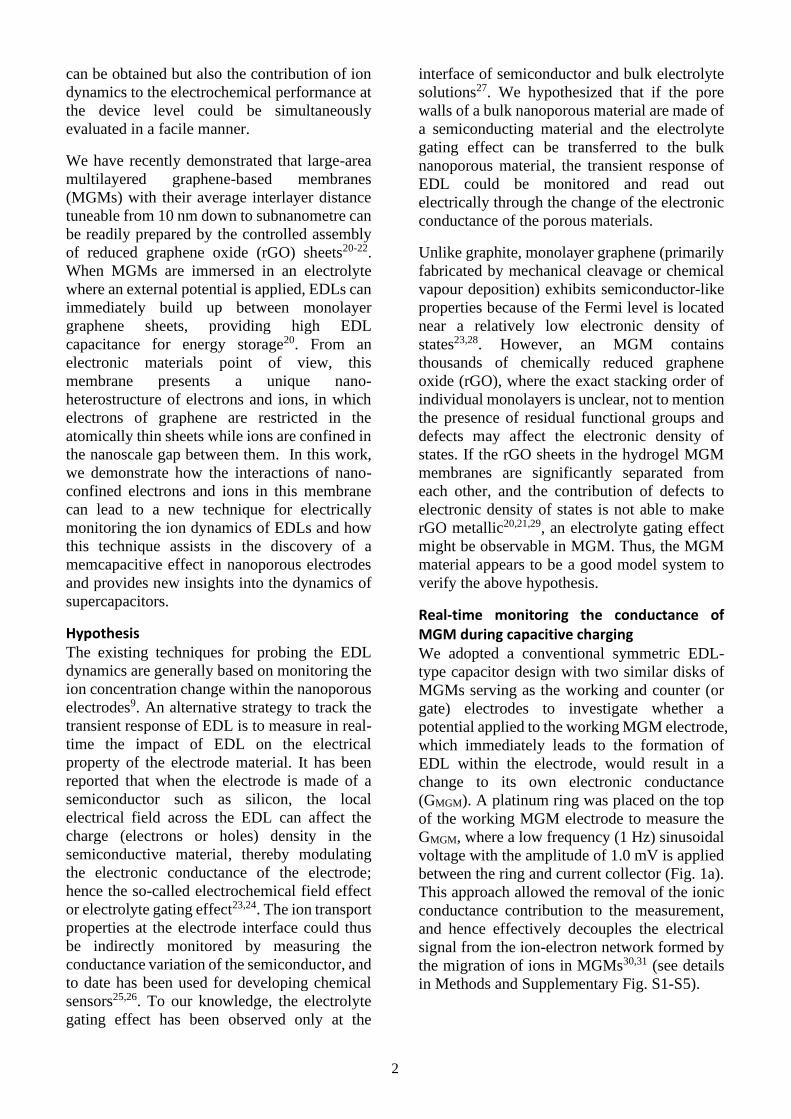
Figure 1 | Characterization of an MGM-10 nm under electrolyte gating in 1.0 M KCl. a, Schematic of the setup
used for characterizing the electrolyte gating effect of MGM. The gate voltage (Vg) is defined as the voltage applied
on the counter (or gate) electrode with respect to the working electrode. b,c, Conductance response of MGMs (GMGM,
trans-membrane conductance) to cyclic voltammetry scan under the voltage window of (b) -0.8~0 V and (c) 0~0.8 V,
respectively. The scan rate is 5 mV s-1. d,e, Conductance response of MGMs to galvanostatic charging-discharging
under the voltage window of (d) -0.8~0 V and (e) 0~0.8 V, respectively. The charging current is 0.5 A g-1. The interlayer
spacing of the MGM is ~10 nm, with a diameter of 1.27 cm and thickness of ~100 μm.
We first monitor the GMGM in operando by
charging the MGM with an interlayer distance
of ~10 nm (MGM-10 nm) in 1.0 M KCl using
the classic two-electrode cyclic voltammetry
(CV) technique. The rectangular CV loops
(black curves) shown in Fig. 1b and c indicate a
typical capacitive behaviour. Note that our
conventional three-electrode electrochemical
measurements confirm that redox reactions are
not involved in the charging process
(Supplementary Fig. S4). When the voltage
applied on the counter MGM (Vg, with respect
to the working MGM electrode) changes from 0
to -0.8 V (Fig. 1b), the measured GMGM
increases monotonically from 1.01 S to 2.17 S.
When Vg is changed from 0 to 0.8 V (Fig. 1c),
the resultant CV curve is similar to that of the
negative charging in terms of both the shape and
area (or the capacitance of the MGM, which is
around 142.3 F g-1 at a scan rate of 5 mV s-1).
However, the variation of GMGM during the
positive charging displays a very different
pattern. It decreases first from ~1.05 S at 0 V to
~0.87 S at 0.6 V, and then rises slightly
afterwards, varying in a non-monotonic manner.
We further characterize the response of GMGM to
Vg by charging MGMs at a constant current
using the method of galvanostatic cycling
potential limitation technique (GCPL), which is
a
0.0 -0.2 -0.4 -0.6 -0.8
0.9
1.2
1.5
1.8
2.1
Vg (V)
GM
GM (
S)
-0.6
-0.3
0.0
0.3
0.6
I W-G
(m
A)
0.0 0.2 0.4 0.6 0.80.85
0.90
0.95
1.00
1.05
Vg (V)
GM
GM (
S)
-0.6
-0.3
0.0
0.3
0.6
I W-G
(m
A)
200 400 600 800 1,000
0.9
1.2
1.5
1.8
t (s)
GM
GM (
S)
0.0
-0.2
-0.4
-0.6
-0.8
Vg (
V)
200 400 600 800 1,000
0.84
0.88
0.92
0.96
1.00
t (s)
GM
GM (
S)
0.0
0.2
0.4
0.6
0.8
Vg (
V)
b c
d e
Pt Current collector
Separator
Graphene membrane
Pt ring
4
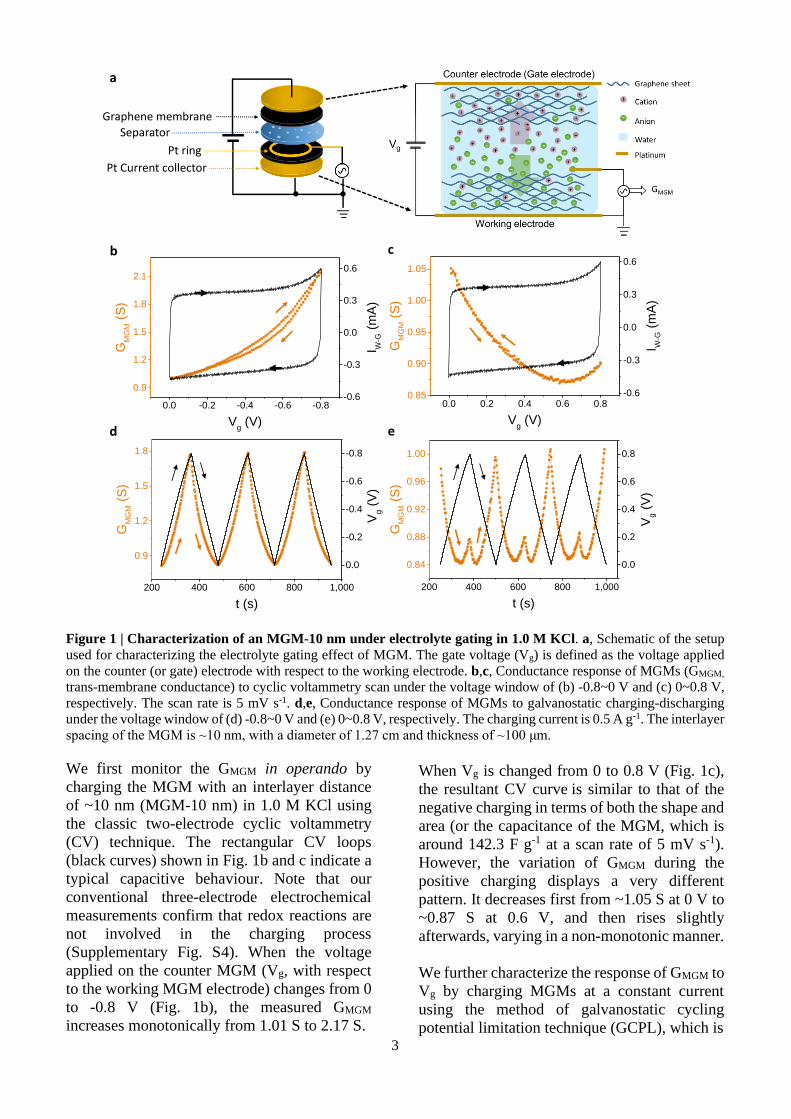
Figure 2 | Comparison of the electrolyte gating effect of MGM with the electric field effect of a single rGO sheet
under back gating. a, on-sheet conductance of rGO (GrGO) as a function of gate voltage (Vg) under back-gating. A
small voltage of 10 mV (Vsd) was applied between the source and drain electrodes. The thickness of SiO2 is around
285 nm. nind is the induced charge carrier density in rGO. Inset: the schematic diagram of the experimental setup. b,
GMGM of MGM-10 nm as a function of Vg in 1.0 M KCl. The scanning rate is 5 mV s-1. The inset is a photograph of
the MGM-10 nm sample.
widely used in characterization of
electrochemical performance of energy storage
devices. Again, the GMGM increases
continuously with charging time when Vg is
negative (Fig. 1d) and shows a non-monotonic
variation when the working MGM is positively
charged (Fig. 1e). Similar potential-dependent
GMGM and its response to the sign of Vg are also
observed in other electrolytes such as aqueous
solutions of potassium
trifluoromethanesulfonimide (KTFSI), 1-ethyl-
3-methylimidazolium tetrafluoroborate
(EMIMBF4) and 1-butyl-3-methylimidazolium
tetrafluoroborate (BMIMBF4) (see
Supplementary Fig. S6).
Electrolyte-gating effect in MGM and potential for ion dynamics study
Our analysis reveals that the potential
dependence of GMGM is unlikely to be caused by
the possible expansion or shrinkage of MGM or
the MGM/Pt contact during the capacitive
charging (see detailed discussion in
Supplementary Fig. S7). Rather, it can be
explained by the electric field or electrolyte
gating effect of the rGO sheets, where the charge
carrier density in rGO is modulated by a local
electrical field from the EDL. Previous studies
have revealed that differing from an ideal
pristine graphene sheet whose Dirac point is
located at Vg=032, rGO behaves like a p-type
semiconductor due to the existence of oxygen-
containing groups and defects, and its Dirac
point is shifted away from Vg=033. To further
confirm the semiconductive nature of our rGO,
we fabricated a back-gated field effect transistor
based on a single layer of rGO sheet as shown in
Fig. 2a (see the characterization in
Supplementary Fig. S8). The measured
conductance was found to vary with the applied
voltage, suggesting that the charge carrier
density (according to the x-axis on the top of the
figure) is modulated by Vg. This gating effect
was further confirmed by the observation of
minimum values of conductance when Vg is
around 30 V, as a result of the lowest intrinsic
electron density near the “Dirac” point23,34
To clearly demonstrate how the GMGM is
modulated by the external potential applied in
our electrochemical setup, the relationship of
GMGM against Vg under both positive and
negative polarisations is combined and plotted
in Fig. 2b. The overall trend of GMGM-Vg looks
very similar to that in Fig. 2a and the minimum
of GMGM appears when Vg>0. In analogy to Fig.
2a where the oxide layer separates graphene and
gate, EDL forms at the interface between each
graphene sheet and the electrolyte where the
gate electrode is immersed, i.e., electrolyte
gating. Similar to Fig. 2a, the occurrence of
minimum of GMGM during the positive
polarisation can be ascribed to the shift of
“Dirac” point of rGO sheets as a result of the
chemical doping and the electrostatic interaction
between electrolyte and rGO described by the
Gerischer model35 (see Supplementary Fig. S15
for more detailed discussion). As a result of the
shift of “Dirac” point to a positive voltage, the
GMGM-Vg relation under negative polarisation is
monotonic (Fig. 1b) while that under positive
90 60 30 0 -30 -60 -90
2.8
3.0
3.2
GrG
O (
S
)
Vg(V)
30 0 -30 -60 -90
nind
(
cm-2)
0.9 0.6 0.3 0.0 -0.3 -0.6 -0.9
0.9
1.2
1.5
1.8
2.1
2.4
GM
GM (
S)
Vg (V)
100 50 0 -50 -100 -150 -200 -250 -300
nind
(
cm-2)
baSource (Au) Drain (Au)
SiO2P-doped Si
VDS
rGO
VG
MGM
5
polarisation is non-monotonic (Fig. 1c). When
Vg is away from the “Dirac” point under
negative polarisation, the number of majority
charge carriers in graphene should be
proportional to the number of ions in EDL.
Therefore, the monotonic GMGM-Vg relationship
suggests that the number of charge carriers in
graphene changes, and hence the number of ions
stored in EDL, with the applied voltage. This
indicates that measurement of GMGM under
negative polarisation could be used to study the
charging/discharging process in EDL.
We have also calculated the density of states in
MGMs under the electrolyte gating, which is
estimated to vary from 7.5×10¹² to -2.8×10¹³
cm-2 between 0.8 and -0.8 V, as opposed to that
from 3×10¹² to -1×1013 cm-2 between 80 and -80
V in conventional back gating (see detailed
calculation and discussion in the Supplementary
document). The significantly smaller value of
Vg in the electrolyte gating is because the EDL
capacitance is several orders of magnitude
greater than the capacitance in the back gating
where SiO2 is used as dielectric24. This in turn
significantly increases the conductance of rGO
in the electrolyte gating setup, while Vg only
changes slightly. Therefore, the technique of
electrolyte gating is well suited for probing the
ionic behaviour in EDL, as the low operation
voltage prevents undesirable redox reactions.
The successful observation of electrolyte gating
effect in MGM demonstrates an effective
technique to electrically modulate charge
carriers in an ensemble of graphene sheets,
regardless of the exact stacking order. The large
number of layers appear not to prevent the
observation of electrolyte gating effect. This
suggests that ions in electrolyte can access
individual rGO sheets. Since the electrolyte
gating effect on bulk graphite is not observable,
as the very small inter-graphene distance (~ 0.34
nm) prevents insertions of ions, Fig. 2b also
confirms that the individual rGO sheets in MGM
remain largely separated.
The finding that the electrolyte gating effect is
transferrable to the multilayered rGO network
suggests that the MGM membrane, when
charged in an electrolyte, could be used to
provide a unique ion/electron nanohybrid
system to understand the dynamics of ions
confined in between individual sheets through a
collective gating effect. The electrical
conductivity of a solid material is proportional
to the product of the mobility and density of
charge carriers (electrons or holes in the case of
graphene). According to the Gauss’ law, the net
number of counter ions stored in EDL and on the
surface of the rGO sheets in MGM (denoted as
QEDL) is the same as the net number of charges
in rGO sheets when they are charged in an
electrolyte. Provided that the electron/hole
mobility of rGO is nearly independent of the
gate potential when the potential applied is away
from the Dirac point36,37, GMGM should be
proportional to QEDL. Since the response of
GMGM to the variation of QEDL is nearly
instantaneous (less than microseconds as a result
of the high mobility of rGO38), any change in
QEDL would be immediately reflected by the
variation of GMGM. Thus, the differential
capacitance of MGM (Cd), which directly
reflects the transient change of QEDL with
respect to voltage, can also be directly
monitored as 𝐶𝑑 = 𝑑𝑄𝐸𝐷𝐿/𝑑𝑉 ∝ 𝑑𝐺𝑀𝐺𝑀/𝑑𝑉 .
Hence, the measurement of GMGM can be used to
in situ monitor the transient state of EDL within
the porous MGM membrane in real time.
Probing nano-confined ion dynamics and memory effect of capacitance The MGM used in the above experiments has a
relatively large average interlayer distance of
~10 nm29. To examine whether the interlayer
distance (d), or the level of nanoconfinement,
has any effect on the electrolyte gating effect,
we prepare a series of MGMs with the interlayer
distance varied from 5.0 nm, 2.0 nm, 0.8 nm, to
0.6 nm (denoted as MGM-5.0 nm, MGM-2.0 nm,
MGM-0.8 nm, MGM-0.6 nm, respectively, see
details in Supplementary Materials and Methods)
and perform the electrolyte gating experiments
in different electrolytes (see Supplementary Fig.
S9 and Fig. S10). The electrolyte gating effect is
observed in all cases examined, though the ratio
of the gating effect is reduced when the
interlayer distance is reduced. Of particular
interest is that new phenomena appear when the
interlayer distance is reduced below 1.0 nm,
particularly when an electrolyte of a larger ionic
size is used. Below we present the typical results
obtained from the 1.0 M aqueous solution of
BMIMBF4 where the bare equivalent spherical
diameters of the cation and anion are reported to
6
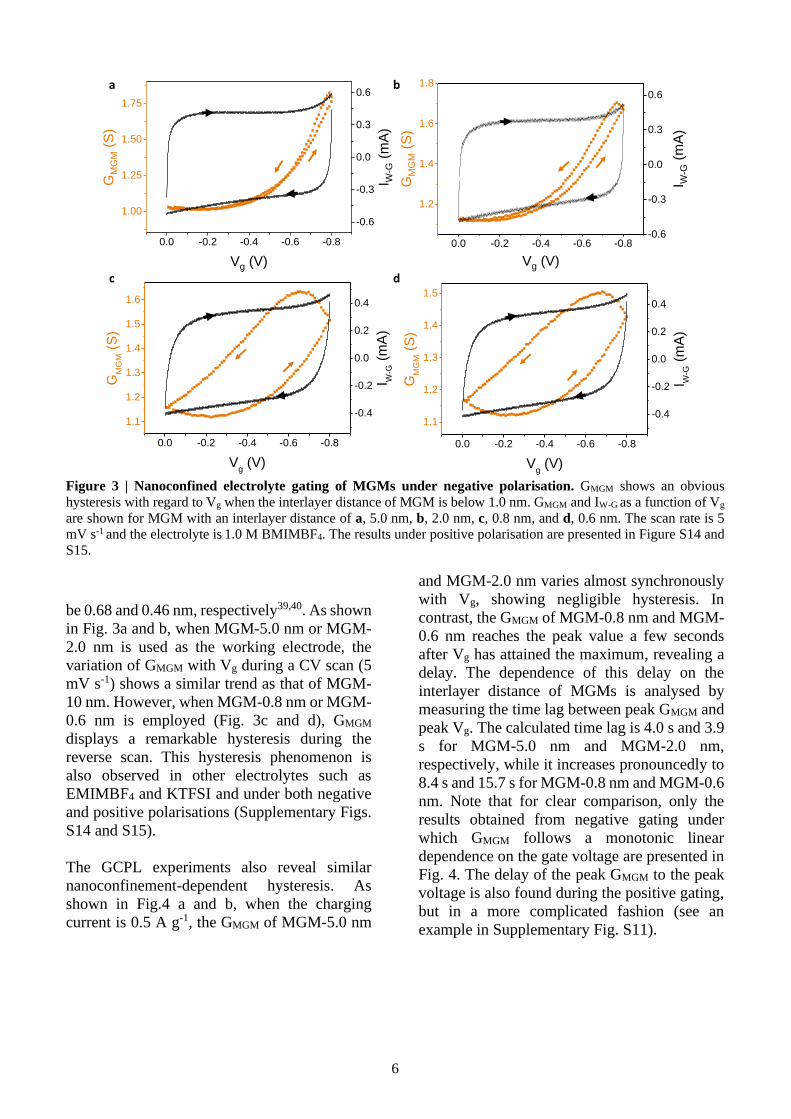
Figure 3 | Nanoconfined electrolyte gating of MGMs under negative polarisation. GMGM shows an obvious
hysteresis with regard to Vg when the interlayer distance of MGM is below 1.0 nm. GMGM and IW-G as a function of Vg
are shown for MGM with an interlayer distance of a, 5.0 nm, b, 2.0 nm, c, 0.8 nm, and d, 0.6 nm. The scan rate is 5
mV s-1 and the electrolyte is 1.0 M BMIMBF4. The results under positive polarisation are presented in Figure S14 and
S15.
be 0.68 and 0.46 nm, respectively39,40. As shown
in Fig. 3a and b, when MGM-5.0 nm or MGM-
2.0 nm is used as the working electrode, the
variation of GMGM with Vg during a CV scan (5
mV s-1) shows a similar trend as that of MGM-
10 nm. However, when MGM-0.8 nm or MGM-
0.6 nm is employed (Fig. 3c and d), GMGM
displays a remarkable hysteresis during the
reverse scan. This hysteresis phenomenon is
also observed in other electrolytes such as
EMIMBF4 and KTFSI and under both negative
and positive polarisations (Supplementary Figs.
S14 and S15).
The GCPL experiments also reveal similar
nanoconfinement-dependent hysteresis. As
shown in Fig.4 a and b, when the charging
current is 0.5 A g-1, the GMGM of MGM-5.0 nm
and MGM-2.0 nm varies almost synchronously
with Vg, showing negligible hysteresis. In
contrast, the GMGM of MGM-0.8 nm and MGM-
0.6 nm reaches the peak value a few seconds
after Vg has attained the maximum, revealing a
delay. The dependence of this delay on the
interlayer distance of MGMs is analysed by
measuring the time lag between peak GMGM and
peak Vg. The calculated time lag is 4.0 s and 3.9
s for MGM-5.0 nm and MGM-2.0 nm,
respectively, while it increases pronouncedly to
8.4 s and 15.7 s for MGM-0.8 nm and MGM-0.6
nm. Note that for clear comparison, only the
results obtained from negative gating under
which GMGM follows a monotonic linear
dependence on the gate voltage are presented in
Fig. 4. The delay of the peak GMGM to the peak
voltage is also found during the positive gating,
but in a more complicated fashion (see an
example in Supplementary Fig. S11).
0.0 -0.2 -0.4 -0.6 -0.8
1.2
1.4
1.6
1.8
Vg (V)
GM
GM
(S
)
-0.6
-0.3
0.0
0.3
0.6
I W-G
(m
A)
0.0 -0.2 -0.4 -0.6 -0.8
1.1
1.2
1.3
1.4
1.5
Vg (V)
GM
GM (
S)
-0.4
-0.2
0.0
0.2
0.4
I W-G
(m
A)
0.0 -0.2 -0.4 -0.6 -0.8
1.1
1.2
1.3
1.4
1.5
1.6
Vg (V)
GM
GM (
S)
-0.4
-0.2
0.0
0.2
0.4
I W-G
(m
A)
0.0 -0.2 -0.4 -0.6 -0.8
1.00
1.25
1.50
1.75
Vg (V)
GM
GM
(S
)
-0.6
-0.3
0.0
0.3
0.6
I W-G
(m
A)
a b
c d

7
Figure 4 | Characterization of the hysteretic response of GMGM under nanoconfinement using the GCPL
technique. Under this condition, IW-G varies in phase with Vg and charges supplied by external circuit attains the
maximum at the peak of Vg41,42. GMGM and IW-G as a function of Vg are shown for MGM with an interlayer distance of
a, 5.0 nm, b, 2.0 nm, c, 0.8 nm, and d, 0.6 nm. The charging rate is 0.5 A g-1 and the electrolyte is 1.0 M BMIMBF4.
As GMGM can be used to monitor the transient
charges stored within the MGM, the time delay
in nonlinear response of the GMGM to voltage
under the extreme nanoconfinement indicates
that the capacitance of the MGM in this case is
history-dependent and exhibits a memory effect.
To the best of our knowledge, this is the first
direct experimental observation of
memcapacitance effect in supercapacitors based
on bulk nanoporous electrodes.
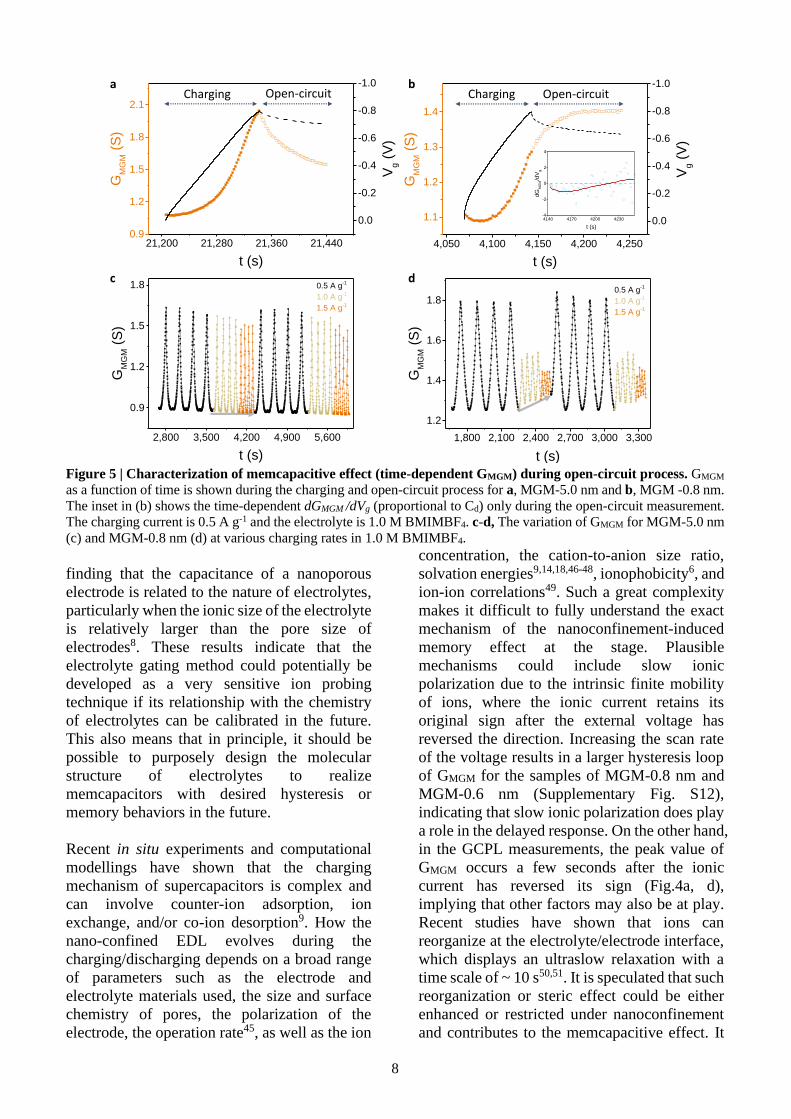
The memory effect can be further evidenced by
the variation of GMGM under the open-circuit
voltage (OCV) test. As shown in Fig. 5a, for
MGM-5.0 nm, while Vg starts to decrease
instantly after the charging is switched off
(black dashed line) due to its self-discharge,
GMGM follows the same trend immediately
(orange dashed line). In contrast, for MGM-0.8
nm, while Vg displays a similar decrease as that
of MGM-5.0 nm during the OCV measurement,
GMGM continues to rise in the first 72 seconds
after the circuit is opened. This means that the
differential capacitance of MGM (Cd) must be
negative in this case as 𝐶𝑑 = 𝑑𝑄𝐸𝐷𝐿/𝑑𝑉 ∝𝑑𝐺𝑀𝐺𝑀/𝑑𝑉. We note that negative differential
capacitance has previously been observed in
some ferroelectric ceramics under non-
equilibrium conditions43,44, which is attributed
to the energy barrier formed between two
degenerate polarization states. The experimental
observation of the negative differential
capacitance in our experiments suggests that
ions confined in nanopores could also exhibit
different states, rendering ferroelectric-like
properties under certain conditions.
We have further tested other electrolytes
including KTFSI which shares the same cation
with KCl and EMIMBF4 which has the same
anion with BMIMBF4 (see Supplementary Fig.
S14 and S15). The GMGM is responsive to the
gating voltage in all cases tested and the overall
trend is similar to the results of KCl and
BMIMBF4. Remarkable hysteresis also appears
in the cases of KTFSI and EMIMBF4 for the
MGM-0.8 nm sample, but it is insignificant for
the MGM-5.0 nm sample. We also notice that
the GMGM-Vg curve is more or less varied among
different electrolytes and depends on the type of
polarisation, suggesting that the nature of
electrolytes play a secondary role in the
electrolyte gating effect. This coincides with the
2000 2200 2400 26001.3
1.4
1.5
1.6
1.7
1.8
t (s)
GM
GM (
S)
0.0
-0.2
-0.4
-0.6
-0.8
Vg (
V)
1000 1200 1400 1600
1.20
1.35
1.50
1.65
t (s)
GM
GM (
S)
0.0
-0.2
-0.4
-0.6
-0.8
Vg (
V)
1500 1800 2100 24001.05
1.20
1.35
1.50
1.65
t (s)
GM
GM (
S)
0.0
-0.2
-0.4
-0.6
-0.8
Vg (
V)
1400 1600 1800 2000
0.9
1.2
1.5
1.8
2.1
t (s)
GM
GM (
S)
0.0
-0.2
-0.4
-0.6
-0.8
Vg (
V)
a b
c d
8
Figure 5 | Characterization of memcapacitive effect (time-dependent GMGM) during open-circuit process. GMGM
as a function of time is shown during the charging and open-circuit process for a, MGM-5.0 nm and b, MGM -0.8 nm.
The inset in (b) shows the time-dependent dGMGM /dVg (proportional to Cd) only during the open-circuit measurement.
The charging current is 0.5 A g-1 and the electrolyte is 1.0 M BMIMBF4. c-d, The variation of GMGM for MGM-5.0 nm
(c) and MGM-0.8 nm (d) at various charging rates in 1.0 M BMIMBF4.
finding that the capacitance of a nanoporous
electrode is related to the nature of electrolytes,
particularly when the ionic size of the electrolyte
is relatively larger than the pore size of
electrodes8. These results indicate that the
electrolyte gating method could potentially be
developed as a very sensitive ion probing
technique if its relationship with the chemistry
of electrolytes can be calibrated in the future.
This also means that in principle, it should be
possible to purposely design the molecular
structure of electrolytes to realize
memcapacitors with desired hysteresis or
memory behaviors in the future.
Recent in situ experiments and computational
modellings have shown that the charging
mechanism of supercapacitors is complex and
can involve counter-ion adsorption, ion
exchange, and/or co-ion desorption9. How the
nano-confined EDL evolves during the
charging/discharging depends on a broad range
of parameters such as the electrode and
electrolyte materials used, the size and surface
chemistry of pores, the polarization of the
electrode, the operation rate45, as well as the ion
concentration, the cation-to-anion size ratio,
solvation energies9,14,18,46-48, ionophobicity6, and
ion-ion correlations49. Such a great complexity
makes it difficult to fully understand the exact
mechanism of the nanoconfinement-induced
memory effect at the stage. Plausible
mechanisms could include slow ionic
polarization due to the intrinsic finite mobility
of ions, where the ionic current retains its
original sign after the external voltage has
reversed the direction. Increasing the scan rate
of the voltage results in a larger hysteresis loop
of GMGM for the samples of MGM-0.8 nm and
MGM-0.6 nm (Supplementary Fig. S12),
indicating that slow ionic polarization does play
a role in the delayed response. On the other hand,
in the GCPL measurements, the peak value of
GMGM occurs a few seconds after the ionic
current has reversed its sign (Fig.4a, d),
implying that other factors may also be at play.
Recent studies have shown that ions can
reorganize at the electrolyte/electrode interface,
which displays an ultraslow relaxation with a
time scale of ~ 10 s50,51. It is speculated that such
reorganization or steric effect could be either
enhanced or restricted under nanoconfinement
and contributes to the memcapacitive effect. It
21,200 21,280 21,360 21,4400.9
1.2
1.5
1.8
2.1
t (s)
GM
GM (
S)
0.0
-0.2
-0.4
-0.6
-0.8
-1.0
Vg (
V)
4,050 4,100 4,150 4,200 4,250
1.1
1.2
1.3
1.4
t (s)
GM
GM (
S)
0.0
-0.2
-0.4
-0.6
-0.8
-1.0
Vg (
V)
a b
1,800 2,100 2,400 2,700 3,000 3,300
1.2
1.4
1.6
1.80.5 A g
-1
1.0 A g-1
1.5 A g-1
GM
GM (
S)
t (s)
2,800 3,500 4,200 4,900 5,600
0.9
1.2
1.5
1.8 0.5 A g-1
1.0 A g-1
1.5 A g-1
GM
GM (
S)
t (s)
c d
4140 4170 4200 4230-4
-2
0
2
4
dG
MG
M/d
Vg
t (s)
Charging Open-circuit Charging Open-circuit
9
would be of great interest to combine the
electrolyte gating method with other techniques
including multiscale modelling to advance the
understanding of nano-confined ion dynamics in
the future.
Potential implications of nano-confined electrolyte gating effect The discovery of the electrolyte gating effect in
the nanoporous membrane may have significant
implications both practically and fundamentally.
This technique provides a new in operando
electrical method to monitor the dynamics of
electrical double layer and is expected to be
useful to gain new fundamental insights in
dynamic electrochemical applications. For
example, it has been observed that
supercapacitors, particularly those made of
extremely small pores, suffer a significant
capacitance degradation at increased charging
rates, which has been previously ascribed to the
loss of accessible surface area52. These
electrolyte gating results suggest that the
memory effect of capacitance could also
contribute. As shown in Fig. 5c and d, MGM-
5.0 nm and MGM-0.8 nm are charged at various
rates and the variation of GMGM are
simultaneously monitored. The peak value of
GMGM for MGM-5.0 nm and MGM-0.8 nm
shows both a decreasing trend with charging
rates, which is in line with the decrease in the
QEDL as well as CEDL (integral capacitance).
When the current density changed from 0.5 A g-
1 to 1.5 A g-1, the CEDL decreased from 148.1 F
g-1 to 141.3 F g-1 for MGM-5.0 nm and from
95.1 F g-1 to 48.5 F g-1 for MGM-0.8 nm.
However, for MGM-0.8 nm, a notable rise of
minimum value of GMGM with charging rates is
also observed. In addition, a similar increase in
the lowest value of GMGM is also found in
various electrolytes (Supplementary Fig. S13).
Considering that the minimum value of GMGM
corresponds to the QEDL at the discharged state
of EDL under a dynamic charging process, this
result clearly indicates that more charges are
retained in the nanopores at increased operation
rates during the discharging process and are
inactive for practical power delivery. It should
be the memory effect-induced detention of
charges rather than the loss of accessible surface
area that has led to the deterioration of
capacitance at increased operation rates.
Supercapacitors based on nanoporous electrodes
have been overwhelmingly exploited for
capacitive energy storage in the past. Our
discoveries may point to some new
unconventional applications for them. As
discussed above, the memory effect and
negative differential capacitance observed in our
experiments suggests that ions restricted in
extremely small pores could exhibit different
states and could display a ferroelectric-like
behaviour under dynamic conditions. The
finding that these properties are dependent on
the chemical nature of electrolytes, their
interactions with graphene as well as the level of
nanoconfinement implies that the memory
effect could be potentially tailored to achieve
desired phase behaviours through fine tuning of
the pore nanostructure and electrolyte chemistry.
We note that memory devices including
memcapacitors are being considered as
candidates for future neuromorphic computing
devices10,53. Given that the electrolyte gating
effect provides a simple electrical approach to
transcribe ionic memory behaviours to an
external circuit, it would be of great interest to
further understand the mechanisms of the
electrolyte gating effects in electroactive
nanopores and examine their potential for future
design of novel ionotronic devices54 such as the
neuromorphic information processors55.
Although only reduced graphene oxide is used
to demonstrate the key concept in this work, our
preliminary results have shown that the
electrolyte gating effect also exists in other
porous materials comprised of single-wall
carbon nanotubes and other 2D nanomaterials
such as MoS2. There appears much opportunity
to exploit the interactions between
nanoconfined electrons and ions in mixed
conductors for both fundamental and applied
applications.
References 1 Salanne, M. et al. Efficient storage mechanisms for building better supercapacitors. Nat. Energy 1, 16070 (2016). 2 Werber, J. R., Osuji, C. O. & Elimelech, M. Materials for next-generation desalination and water purification membranes. Nat. Rev. Mater. 1, 16018 (2016). 3 Foroughi, J. et al. Torsional carbon nanotube artificial muscles. Science 334, 494-497 (2011).
10
4 Koltonow, A. R. & Huang, J. Two-dimensional nanofluidics. Science 351, 1395-1396 (2016). 5 Futamura, R. et al. Partial breaking of the Coulombic ordering of ionic liquids confined in carbon nanopores. Nat. Mater. 16, 1225 (2017). 6 Kondrat, S., Wu, P., Qiao, R. & Kornyshev, A. A. Accelerating charging dynamics in subnanometre pores. Nat. Mater. 13, 387-393 (2014). 7 Forse, A. C. et al. Direct observation of ion dynamics in supercapacitor electrodes using in situ diffusion NMR spectroscopy. Nat. Energy 2, 16216 (2017). 8 Chmiola, J. et al. Anomalous increase in carbon capacitance at pore sizes less than 1 nanometer. Science 313, 1760-1763 (2006). 9 Forse, A. C., Merlet, C., Griffin, J. M. & Grey, C. P. New Perspectives on the Charging Mechanisms of Supercapacitors. J. Am. Chem. Soc. 18, 5731-5744 (2016). 10 Krems, M., Pershin, Y. V. & Di Ventra, M. Ionic memcapacitive effects in nanopores. Nano Lett. 10, 2674-2678 (2010). 11 Wang, D. et al. Transmembrane potential across single conical nanopores and resulting memristive and memcapacitive ion transport. J. Am. Chem. Soc. 134, 3651-3654 (2012). 12 Dias, C., Ventura, J. & Aguiar, P. in Advances in Memristors, Memristive Devices and Systems (eds Sundarapandian Vaidyanathan & Christos Volos) 305-342 (Springer International Publishing, 2017). 13 Kiyohara, K., Soneda, Y. & Asaka, K. Ferroelectric phase behaviors in porous electrodes. Langmuir 33, 11574-11581 (2017). 14 Griffin, J. M. et al. In situ NMR and electrochemical quartz crystal microbalance techniques reveal the structure of the electrical double layer in supercapacitors. Nat. Mater. 14, 812–819 (2015). 15 Levi, M. D. et al. Electrochemical quartz crystal microbalance (EQCM) studies of ions and solvents insertion into highly porous activated carbons. J. Am. Chem. Soc. 132, 13220-13222 (2010). 16 Tsai, W.-Y., Taberna, P.-L. & Simon, P. Electrochemical Quartz Crystal Microbalance (EQCM) Study of Ion Dynamics in Nanoporous Carbons. J. Am. Chem. Soc. 24, 8722-8728 (2014). 17 Richey, F. W., Dyatkin, B., Gogotsi, Y. & Elabd, Y. A. Ion Dynamics in Porous Carbon Electrodes in Supercapacitors Using in Situ Infrared Spectroelectrochemistry. J. Am. Chem. Soc. 135, 12818-12826 (2013).
18 Richey, F. W., Tran, C., Kalra, V. & Elabd, Y. A. Ionic Liquid Dynamics in Nanoporous Carbon Nanofibers in Supercapacitors Measured with in Operando Infrared Spectroelectrochernistry. J. Phys. Chem. C 118, 21846-21855 (2014). 19 Prehal, C. et al. Quantification of ion confinement and desolvation in nanoporous carbon supercapacitors with modelling and in situ X-ray scattering. Nat. Energy 2, 16215 (2017). 20 Yang, X., Cheng, C., Wang, Y., Qiu, L. & Li, D. Liquid-mediated dense integration of graphene materials for compact capacitive energy storage. Science 341, 534-537 (2013). 21 Yang, X. et al. Ordered gelation of
chemically converted graphene for next‐generation electroconductive hydrogel films. Angew. Chem. Int. Edit. 50, 7325-7328 (2011). 22 Li, D., Mueller, M. B., Gilje, S., Kaner, R. B. & Wallace, G. G. Processable aqueous dispersions of graphene nanosheets. Nat. Nanotechnol. 3, 101-105 (2008). 23 Novoselov, K. S. et al. Electric field effect in atomically thin carbon films. Science 306, 666-669 (2004). 24 Das, A. et al. Monitoring dopants by Raman scattering in an electrochemically top-gated graphene transistor. Nat. Nanotechnol. 3, 210-215 (2008). 25 Heller, I. et al. Influence of electrolyte composition on liquid-gated carbon nanotube and graphene transistors. J. Am. Chem. Soc. 132, 17149-17156 (2010). 26 Ohno, Y., Maehashi, K., Yamashiro, Y. & Matsumoto, K. Electrolyte-gated graphene field-effect transistors for detecting pH and protein adsorption. Nano Lett. 9, 3318-3322 (2009). 27 Chhowalla, M., Jena, D. & Zhang, H. Two-dimensional semiconductors for transistors. Nat. Rev. Mater. 1, 16052 (2016). 28 Eda, G., Fanchini, G. & Chhowalla, M. Large-area ultrathin films of reduced graphene oxide as a transparent and flexible electronic material. Nat. Nanotechnol. 3, 270-274 (2008). 29 Cheng, C. et al. Ion transport in complex layered graphene-based membranes with tuneable interlayer spacing. Sci. Adv. 2, e1501272 (2016). 30 Albery, W. J., Elliott, C. M. & Mount, A. R. A transmission line model for modified electrodes and thin layer cells. J. Electroanal. Chem. 288, 15-34 (1990). 31 Saab, A. P., Garzon, F. H. & Zawodzinski, T. A. Determination of ionic and electronic resistivities in carbon/polyelectrolyte fuel-cell composite electrodes. J. Electrochem. Soc. 149, A1541-A1546 (2002).
11
32 Schedin, F. et al. Detection of individual gas molecules adsorbed on graphene. Nat. Mater. 6, 652-655 (2007). 33 Eda, G. & Chhowalla, M. Chemically Derived Graphene Oxide: Towards Large-Area Thin-Film Electronics and Optoelectronics. Adv. Mater. 22, 2392-2415 (2010). 34 He, Q. et al. Transparent, flexible, all-reduced graphene oxide thin film transistors. ACS Nano 5, 5038-5044 (2011). 35 Memming, R. Semiconductor Electrochemistry. Weinheim, Germany: WILEY-VCH (2015). 36 Zhan, H., Cervenka, J., Prawer, S. & Garrett, D. J. Molecular detection by liquid gated Hall effect measurements of graphene. Nanoscale 10, 930-935 (2018). 37 Kim, H., Kim, B. J., Sun, Q., Kang, M. S. & Cho, J. H. Graphene Transistors Gated by Salted Proton Conductor. Adv. Electron. Mater. 2, 1600122 (2016). 38 Wang, S. et al. High mobility, printable, and solution-processed graphene electronics. Nano Lett. 10, 92-98 (2009). 39 Murgia, S., Monduzzi, M., Lopez, F. & Palazzo, G. Mesoscopic structure in mixtures of water and 1-butyl-3-methyl imidazolium tetrafluoborate: a multinuclear NMR study. J. Solution Chem. 42, 1111-1122 (2013). 40 Jin, H. et al. Physical properties of ionic liquids consisting of the 1-butyl-3-methylimidazolium cation with various anions and the bis(trifluoromethylsulfonyl)imide anion with various cations. J. Phys. Chem. B 112, 81-92 (2008). 41 Wen, C. J., Boukamp, B., Huggins, R. & Weppner, W. Thermodynamic and mass transport properties of “LiAl”. J. Electrochem. Soc. 126, 2258-2266 (1979). 42 Weppner, W. & Huggins, R. A. Determination of the kinetic parameters of
mixed‐conducting electrodes and application to the system Li3Sb. J. Electrochem. Soc. 124, 1569-1578 (1977). 43 Catalan, G., Jiménez, D. & Gruverman, A. Ferroelectrics: Negative capacitance detected. Nat. Mater. 14, 137-139 (2015). 44 Khan, A. I. et al. Negative capacitance in a ferroelectric capacitor. Nat. Mater. 14, 182-186 (2015). 45 He, Y. D., Huang, J. S., Sumpter, B. G., Kornyshev, A. A. & Qiao, R. Dynamic Charge Storage in Ionic Liquids-Filled Nanopores: Insight from a Computational Cyclic Voltammetry Study. J. Phys. Chem. Lett. 6, 22-30 (2015).
46 Griffin, J. M. et al. Ion counting in supercapacitor electrodes using NMR spectroscopy. Faraday Discuss. 176, 49-68 (2014). 47 Dyatkin, B. et al. Influence of Surface Oxidation on Ion Dynamics and Capacitance in Porous and Nonporous Carbon Electrodes. J. Phys. Chem. C 120, 8730-8741 (2016). 48 Prehal, C. et al. Tracking the structural arrangement of ions in carbon supercapacitor nanopores using in situ small-angle X-ray scattering. Energ. Environ. Sci. 8, 1725-1735 (2015). 49 Cheng, C., Jiang, G. P., Simon, G. P., Liu, J. Z. & Li, D. Low-voltage electrostatic modulation of ion diffusion through layered graphene-based nanoporous membranes. Nat. Nanotechnol. 13, 685 (2018). 50 Uysal, A. et al. Structural origins of potential dependent hysteresis at the electrified graphene/ionic liquid interface. J. Phys. Chem. C 118, 569-574 (2013). 51 Nishi, N., Hirano, Y., Motokawa, T. & Kakiuchi, T. Ultraslow relaxation of the structure at the ionic liquid| gold electrode interface to a potential step probed by electrochemical surface plasmon resonance measurements: asymmetry of the relaxation time to the potential-step direction. Phys. Chem. Chem. Phys. 15, 11615-11619 (2013). 52 Conway, B. & Pell, W. Power limitations of supercapacitor operation associated with resistance and capacitance distribution in porous electrode devices. J. Power Sources 105, 169-181 (2002). 53 Vaidyanathan, S. & Volos, C. Advances in memristors, memristive devices and systems. Vol. 701 (Springer, 2017). 54 Yang, C. & Suo, Z. Hydrogel ionotronics. Nat. Rev. Mater. 3, 125-142 (2018). 55 Chun, H. & Chung, T. D. Iontronics. Annu. Rev. Anal. Chem. 8, 441-462 (2015).
Acknowledgements
We would like to acknowledge the financial
support from the Australia Research Council
and the University of Melbourne. This work
made use of the facilities at the Monash Centre
for Electron Microscopy (MCEM) and
Melbourne Centre for Nanofabrication (MCN).
Competing interests
The authors declare no competing interests.
Data availability

12
The data that support the findings of this study
are available from the corresponding author
upon reasonable request.
Additional information
1. Materials and methods
Fabrication of MGM and the tuning of its
interlayer distance
Measuring the electrolyte gating effect of
MGM
Exploiting the AC method to measure the
electronic conductance of MGM (Fig. S1- S3)
Investigation into the influence of faradaic
reaction and Ohmic contact on the
conductance measured (Fig. S4, S5)
Examining the nature of electrolyte gating
effect
2. Supplementary Figures (Fig. S6- S15)
3. Supplementary References

1
Supplementary information
Nanoconfined, dynamic electrolyte gating and memory effects in
multilayered graphene-based membranes
Jing Xiao1,2*, Hualin Zhan2*, Zaiquan Xu1, 3, Xiao Wang2, Ke Zhang1, Zhiyuan Xiong2,
George P Simon1, Zhe Liu4, Dan Li1,2†
1 Department of Materials Science and Engineering, Monash University, VIC 3800, Australia.
2 Department of Chemical Engineering, the University of Melbourne, VIC 3010, Australia
3 School of Mathematical and Physical Sciences, University of Technology Sydney, NSW, 2007,
Australia
4Department of Mechanical Engineering, The University of Melbourne, VIC 3010, Australia
*These authors contributed equally to this work.
†Correspondence to: [email protected].
Content
1. Materials and methods
Fabrication of MGM and the tuning of its interlayer distance
Measuring the electrolyte gating effect of MGM
Exploiting the AC method to measure the electronic conductance of MGM (Fig. S1-
S3)
Investigation into the influence of faradaic reaction and Ohmic contact on the
conductance measured (Fig. S4, S5)
Examining the nature of electrolyte gating effect
2. Supplementary Figures (Fig. S6- S15)
3. Supplementary References

2
1. Materials and Methods
Fabrication of MGMs and fine-tuning of their interlayer distance
Reduced graphene oxide (rGO) dispersion was prepared using the method previously reported1.
Briefly, graphene oxide aqueous solution (0.5 mg mL-1, 100 mL), 0.2 mL hydrazine (35 wt%
in water) and 0.35 mL ammonia solution (28 wt% in water) were mixed thoroughly in a glass
vial, and then the vial was placed in a water bath (~100 oC) for 3 hours to reduce the graphene
oxide.
Multilayered graphene hydrogel membranes (MGMs) were prepared using the method we
reported previously2. Specifically, 30 mL of the as-prepared rGO solution was vacuum-filtrated
via an IsoporeTM polycarbonate membrane (Merck Millipore Ltd, 0.1 μm pore size). The
vacuum (50 mPa) was immediately disconnected when no free solution remained. The MGM
was then peeled off from the filter membrane and soaked in deionized water overnight to
remove the residual ammonia and unreacted hydrazine.
Interlayer spacing of the membranes was tuned using the capillary compression method we
reported previously3. The MGM was first thoroughly exchanged with H2SO4 aqueous solution
of controlled concentration. Water inside the gel membranes was then selectively removed
through vacuum evaporation, during which capillary compression force between rGO layers
resulted in the uniform compression of membrane along the thickness direction. With H2SO4
retained in the gel membrane, the average interlayer spacing was readily tuned by controlling
the concentration of H2SO4 aqueous solution. Subsequently, the as-prepared membranes were
washed thoroughly with deionized water to remove the H2SO4 inside the membrane porous
structure and immersed in the testing electrolytes for 3 hours to fully exchange with electrolytes
before testing. In this work, the concentrations of the H2SO4 aqueous solution were 5.0 M, 1.0
M and 0.1 M to make MGMs with interlayer distances of around 5.0 nm, 2.0 nm and 0.8 nm,
respectively. The average interlayer spacing in MGM was estimated from the packing density
of MGM using the method previously reported3-5. The thickness of the MGM membranes was
measured via scanning electron microscopy (FEI Nova Nano SEM450).
Measuring the electrolyte gating effect of MGM
Electrolyte gating experiments were conducted with a customised T-cell (Fig.1 a) in which two
MGMs with a diameter of 12.7 mm were attached onto two separate platinum electrodes. An
electrically insulating glass fibre membrane (ADVANTEC, GA-55) was placed in between the

3
MGMs to avoid short circuit while ions in electrolyte were still allowed to travel through freely.
The device is similar to a conventional supercapacitor design. Since individual rGO sheets in
the MGM remain largely separated with a certain interlayer spacing3, this setup enables ions to
travel to the rGO sheets across the whole MGM upon the application of a voltage to form EDL
on each individual rGO sheets of the MGM (Fig. 1b). To reflect the electrolyte gating nature,
this voltage is referred to as gate voltage in this article. As reported in the main text, the
formation of EDL on the rGO surface would cause its electronic conductance to vary6-8, which
is also known as the electrolyte gating effect. The electronic conductance of MGM as a function
of gate voltage was measured to examine the electrolyte gating effect in the MGM using the
following procedure.
As shown in Fig. 1a, a platinum ring was inserted between one of the MGMs and the glass
fibre membrane to measure the electronic conductance of MGM. The impedance of MGM was
obtained by applying a sinusoidal alternating voltage (amplitude: 1.0 mV, frequency: 1 Hz)
between this ring and the platinum electrode to which the MGM was attached (Fig. 1a).
Previously, a DC voltage is generally applied between the drain and source electrodes and the
metal/graphene contacts are sealed with electrically insulating resins to avoid the direct contact
of metal electrodes to the electrolyte solution, and therefore to decouple the ionic contribution
to the conductance of graphene films 7,9-11. However, in our case, the MGM membranes are
full of electrolyte and can indeed be viewed as a type of mixed electronic-ionic conductor.
Given that the metal (Pt in our case) would inevitably be in contact with the electrolyte solution,
the ionic conductance couldn’t be decoupled if a DC current is applied, which will complicate
the analysis of the electrolyte gating effect. Previous studies have shown that the electronic
conductance of a mixed electronic-ionic conductor can be individually obtained by applying
an AC voltage with low frequencies12-16, with which the influence of the DC current between
the working and gate electrode can be largely separated. Detailed discussions on the validity
of our method to measure the electronic conductance of MGM (GMGM) and its role in examining
the electrolyte gating effect are shown in the following sections.
Exploiting the AC measurement method to measure the electronic conductance of MGM
In order to confirm that the AC measurement method adapted from Ref. 15 for measuring the
electronic conductance of MGM is reliable, we first perform an equivalent circuit model
analysis and then validate it with experiments.
4
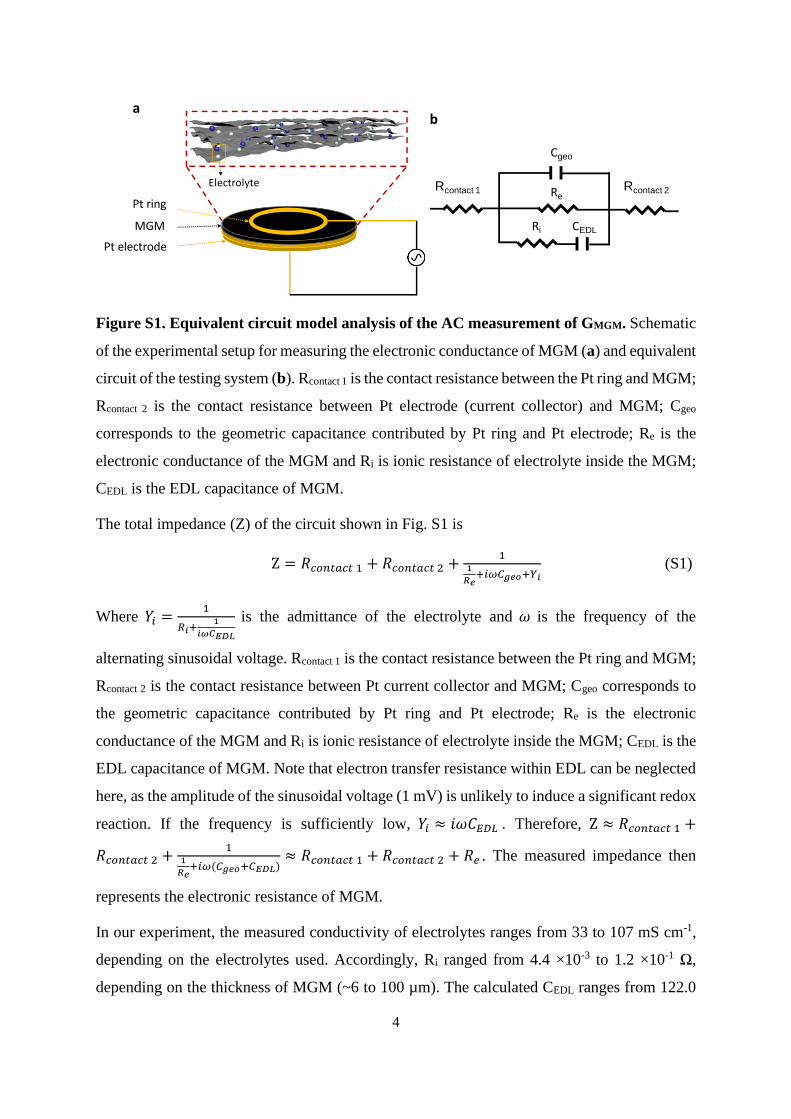
Figure S1. Equivalent circuit model analysis of the AC measurement of GMGM. Schematic
of the experimental setup for measuring the electronic conductance of MGM (a) and equivalent
circuit of the testing system (b). Rcontact 1 is the contact resistance between the Pt ring and MGM;
Rcontact 2 is the contact resistance between Pt electrode (current collector) and MGM; Cgeo
corresponds to the geometric capacitance contributed by Pt ring and Pt electrode; Re is the
electronic conductance of the MGM and Ri is ionic resistance of electrolyte inside the MGM;
CEDL is the EDL capacitance of MGM.
The total impedance (Z) of the circuit shown in Fig. S1 is
Z = 𝑅𝑐𝑜𝑛𝑡𝑎𝑐𝑡 1 + 𝑅𝑐𝑜𝑛𝑡𝑎𝑐𝑡 2 +1
1
𝑅𝑒+𝑖𝜔𝐶𝑔𝑒𝑜+𝑌𝑖
(S1)
Where 𝑌𝑖 =1
𝑅𝑖+1
𝑖𝜔𝐶𝐸𝐷𝐿
is the admittance of the electrolyte and 𝜔 is the frequency of the
alternating sinusoidal voltage. Rcontact 1 is the contact resistance between the Pt ring and MGM;
Rcontact 2 is the contact resistance between Pt current collector and MGM; Cgeo corresponds to
the geometric capacitance contributed by Pt ring and Pt electrode; Re is the electronic
conductance of the MGM and Ri is ionic resistance of electrolyte inside the MGM; CEDL is the
EDL capacitance of MGM. Note that electron transfer resistance within EDL can be neglected
here, as the amplitude of the sinusoidal voltage (1 mV) is unlikely to induce a significant redox
reaction. If the frequency is sufficiently low, 𝑌𝑖 ≈ 𝑖𝜔𝐶𝐸𝐷𝐿 . Therefore, Z ≈ 𝑅𝑐𝑜𝑛𝑡𝑎𝑐𝑡 1 +
𝑅𝑐𝑜𝑛𝑡𝑎𝑐𝑡 2 +1
1
𝑅𝑒+𝑖𝜔(𝐶𝑔𝑒𝑜+𝐶𝐸𝐷𝐿)
≈ 𝑅𝑐𝑜𝑛𝑡𝑎𝑐𝑡 1 + 𝑅𝑐𝑜𝑛𝑡𝑎𝑐𝑡 2 + 𝑅𝑒 . The measured impedance then
represents the electronic resistance of MGM.
In our experiment, the measured conductivity of electrolytes ranges from 33 to 107 mS cm-1,
depending on the electrolytes used. Accordingly, Ri ranged from 4.4 ×10⁻³ to 1.2 ×10⁻¹ Ω,
depending on the thickness of MGM (~6 to 100 µm). The calculated CEDL ranges from 122.0
Pt electrode
Pt ring
MGM
ab
Electrolyte
Cgeo
CEDLRi
ReRcontact 2Rcontact 1
5
~ 142.3 F g-1 (at a scan rate of 5 mV s-1, the mass of one MGM is ~1.0 mg). Thus, the resultant
frequency originating from the time constant, 1
RiCEDL, is in the range from 60 to 1800 Hz, far
larger than the frequency employed in the experiment (1 Hz). Besides, Cgeo is in the order of
10-12 F cm-2 16 which is far smaller than the CEDL of MGM, the Re is ranged from 8.1×10⁻⁴ ~
1.3×10⁻² Ω, and the calculated 1
Re(Cgeo+CEDL) ranges from 550 to 8800 Hz. With all these
considered, the impedance measured through the circuit shown in Fig. S1 at low frequency can
be described as Z ≈ 𝑅𝑐𝑜𝑛𝑡𝑎𝑐𝑡 1 + 𝑅𝑐𝑜𝑛𝑡𝑎𝑐𝑡 2 + 𝑅𝑒. In other words, at low frequencies (e.g. 1 Hz),
the conducting path through ion transport was blocked due to the large capacitive reactance of
the EDL. The measured impedance is mainly contributed by electronic resistance.
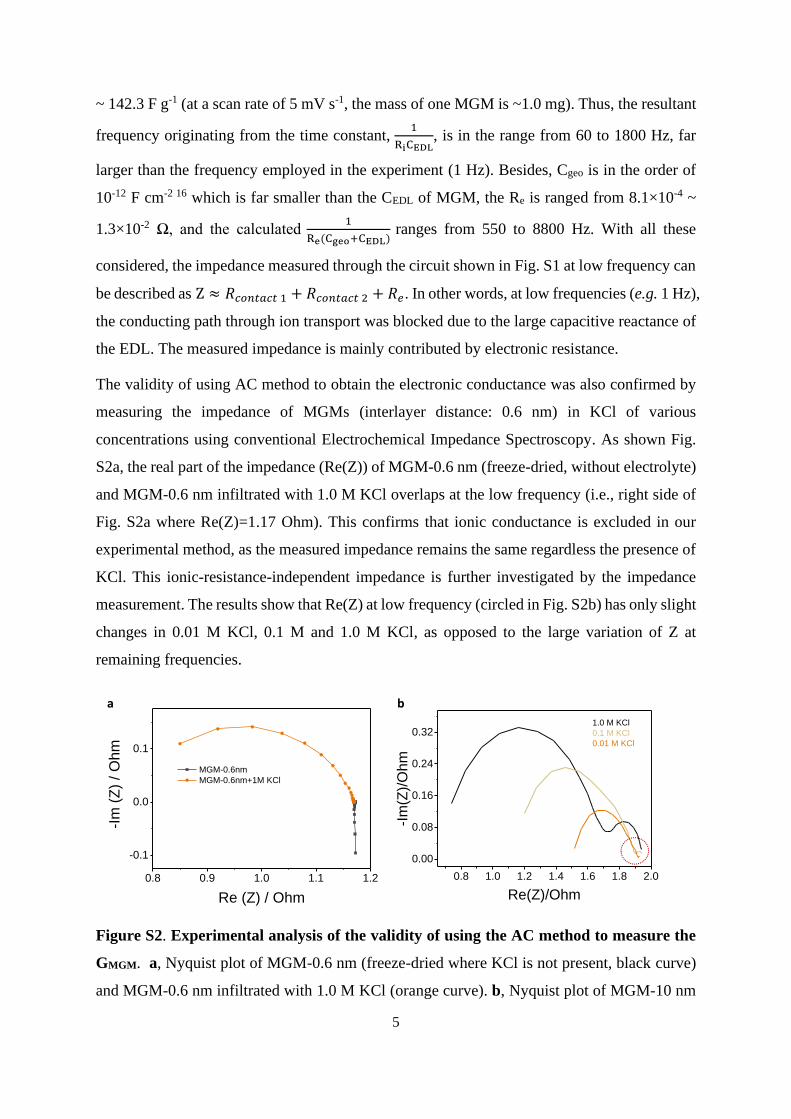
The validity of using AC method to obtain the electronic conductance was also confirmed by
measuring the impedance of MGMs (interlayer distance: 0.6 nm) in KCl of various
concentrations using conventional Electrochemical Impedance Spectroscopy. As shown Fig.
S2a, the real part of the impedance (Re(Z)) of MGM-0.6 nm (freeze-dried, without electrolyte)
and MGM-0.6 nm infiltrated with 1.0 M KCl overlaps at the low frequency (i.e., right side of
Fig. S2a where Re(Z)=1.17 Ohm). This confirms that ionic conductance is excluded in our
experimental method, as the measured impedance remains the same regardless the presence of
KCl. This ionic-resistance-independent impedance is further investigated by the impedance
measurement. The results show that Re(Z) at low frequency (circled in Fig. S2b) has only slight
changes in 0.01 M KCl, 0.1 M and 1.0 M KCl, as opposed to the large variation of Z at
remaining frequencies.
Figure S2. Experimental analysis of the validity of using the AC method to measure the
GMGM. a, Nyquist plot of MGM-0.6 nm (freeze-dried where KCl is not present, black curve)
and MGM-0.6 nm infiltrated with 1.0 M KCl (orange curve). b, Nyquist plot of MGM-10 nm
0.8 0.9 1.0 1.1 1.2
-0.1
0.0
0.1
-Im
(Z
) / O
hm
Re (Z) / Ohm
MGM-0.6nm
MGM-0.6nm+1M KCl
0.8 1.0 1.2 1.4 1.6 1.8 2.0
0.00
0.08
0.16
0.24
0.321.0 M KCl
0.1 M KCl
0.01 M KCl
-Im
(Z)/
Ohm
Re(Z)/Ohm
a b
6
in 0.01 (orange), 0.1 (dark yellow) and 1.0 M (black) KCl. The frequency range is 1 ~100 k
Hz. The Nyquist plot of dry MGM-0.6 nm (without KCl) overlaps with that of MGM-0.6 nm
infiltrated with 1.0 M KCl at low frequency, indicating that ionic conductance contributes little
to the impedance at low frequencies.
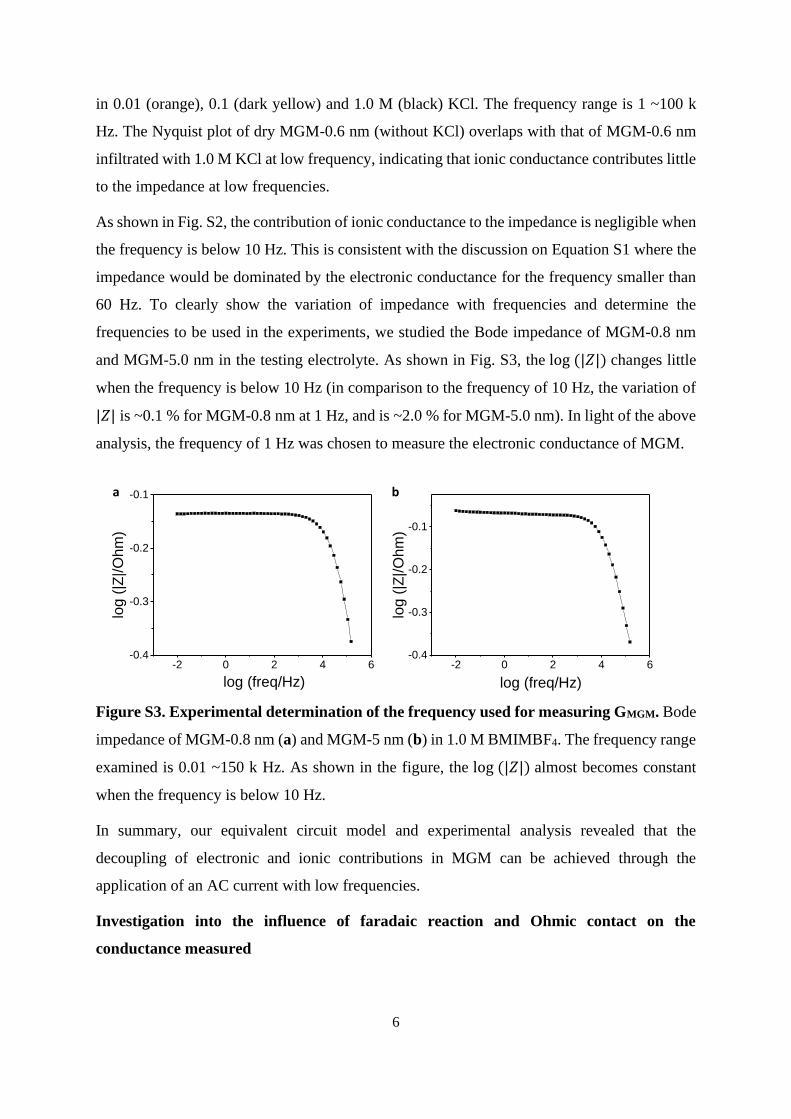
As shown in Fig. S2, the contribution of ionic conductance to the impedance is negligible when
the frequency is below 10 Hz. This is consistent with the discussion on Equation S1 where the
impedance would be dominated by the electronic conductance for the frequency smaller than
60 Hz. To clearly show the variation of impedance with frequencies and determine the
frequencies to be used in the experiments, we studied the Bode impedance of MGM-0.8 nm
and MGM-5.0 nm in the testing electrolyte. As shown in Fig. S3, the log (|𝑍|) changes little
when the frequency is below 10 Hz (in comparison to the frequency of 10 Hz, the variation of
|𝑍| is ~0.1 % for MGM-0.8 nm at 1 Hz, and is ~2.0 % for MGM-5.0 nm). In light of the above
analysis, the frequency of 1 Hz was chosen to measure the electronic conductance of MGM.
Figure S3. Experimental determination of the frequency used for measuring GMGM. Bode
impedance of MGM-0.8 nm (a) and MGM-5 nm (b) in 1.0 M BMIMBF4. The frequency range
examined is 0.01 ~150 k Hz. As shown in the figure, the log (|𝑍|) almost becomes constant
when the frequency is below 10 Hz.
In summary, our equivalent circuit model and experimental analysis revealed that the
decoupling of electronic and ionic contributions in MGM can be achieved through the
application of an AC current with low frequencies.
Investigation into the influence of faradaic reaction and Ohmic contact on the
conductance measured
-2 0 2 4 6-0.4
-0.3
-0.2
-0.1
log (
|Z|/O
hm
)
log (freq/Hz)
-2 0 2 4 6-0.4
-0.3
-0.2
-0.1
log (
|Z|/O
hm
)
log (freq/Hz)
a b
7
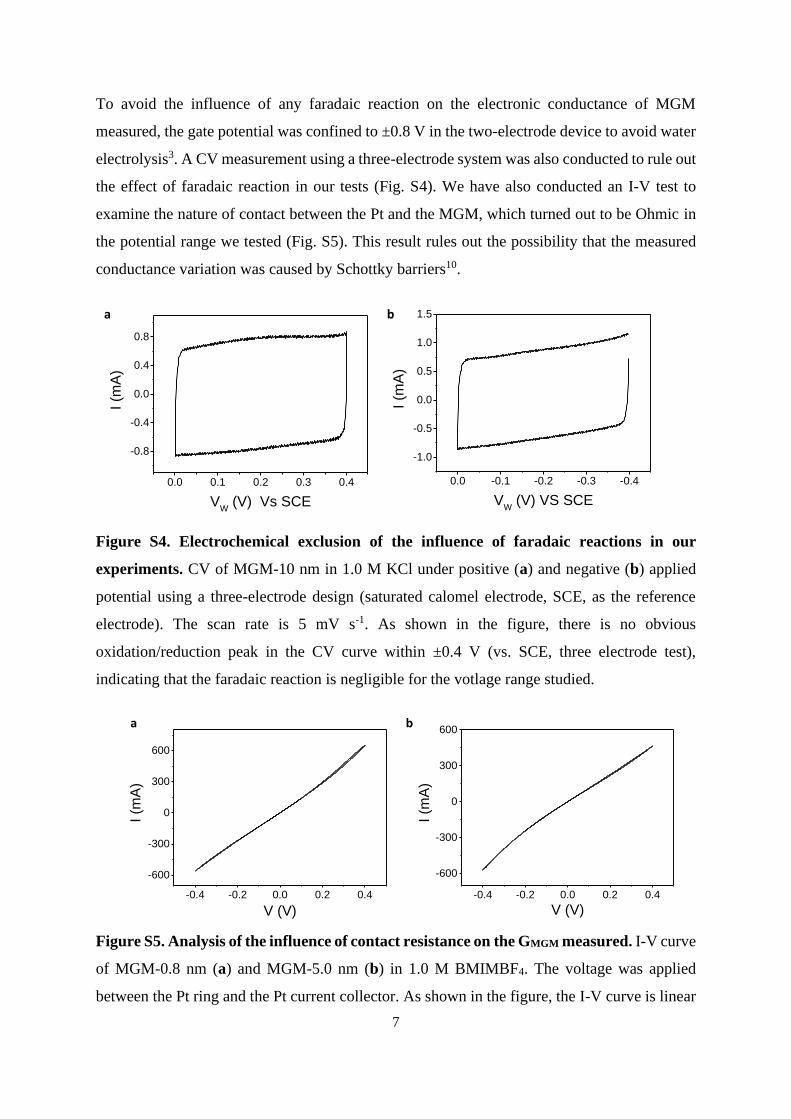
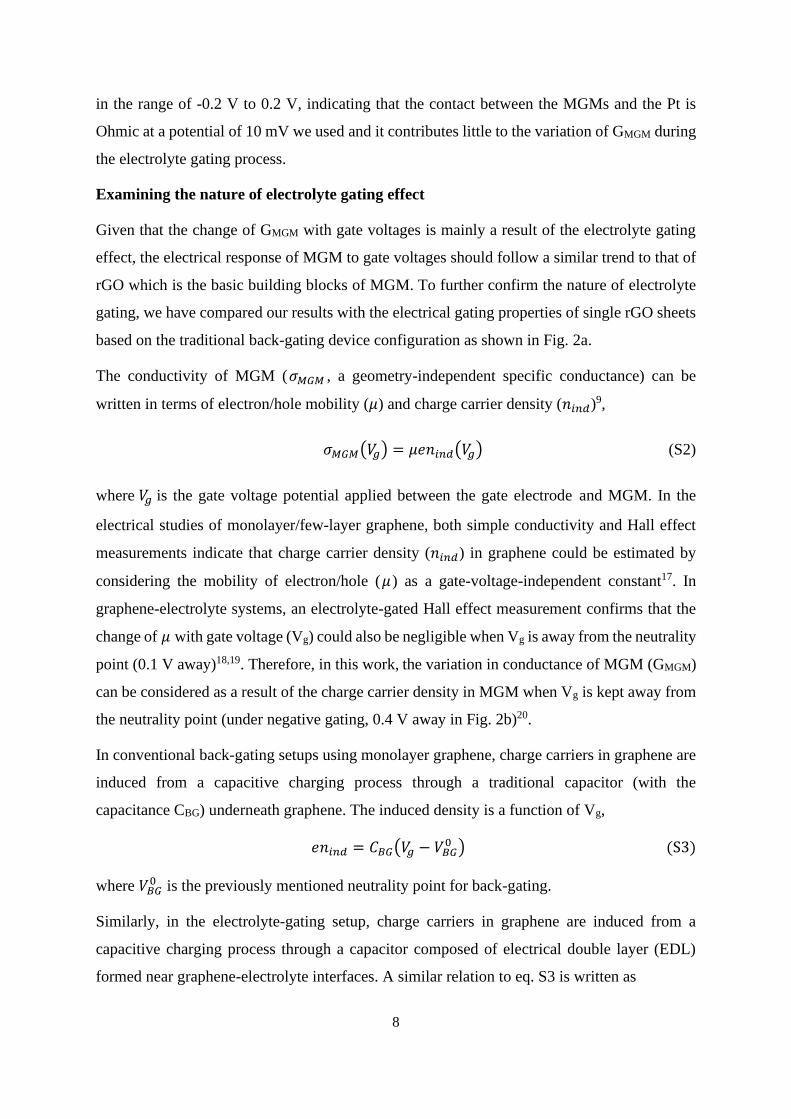
To avoid the influence of any faradaic reaction on the electronic conductance of MGM
measured, the gate potential was confined to ±0.8 V in the two-electrode device to avoid water
electrolysis3. A CV measurement using a three-electrode system was also conducted to rule out
the effect of faradaic reaction in our tests (Fig. S4). We have also conducted an I-V test to
examine the nature of contact between the Pt and the MGM, which turned out to be Ohmic in
the potential range we tested (Fig. S5). This result rules out the possibility that the measured
conductance variation was caused by Schottky barriers10.
Figure S4. Electrochemical exclusion of the influence of faradaic reactions in our
experiments. CV of MGM-10 nm in 1.0 M KCl under positive (a) and negative (b) applied
potential using a three-electrode design (saturated calomel electrode, SCE, as the reference
electrode). The scan rate is 5 mV s-1. As shown in the figure, there is no obvious
oxidation/reduction peak in the CV curve within ±0.4 V (vs. SCE, three electrode test),
indicating that the faradaic reaction is negligible for the votlage range studied.
Figure S5. Analysis of the influence of contact resistance on the GMGM measured. I-V curve
of MGM-0.8 nm (a) and MGM-5.0 nm (b) in 1.0 M BMIMBF4. The voltage was applied
between the Pt ring and the Pt current collector. As shown in the figure, the I-V curve is linear
0.0 -0.1 -0.2 -0.3 -0.4
-1.0
-0.5
0.0
0.5
1.0
1.5
I (m
A)
VW
(V) VS SCE
0.0 0.1 0.2 0.3 0.4
-0.8
-0.4
0.0
0.4
0.8
I (m
A)
VW
(V) Vs SCE
a b
-0.4 -0.2 0.0 0.2 0.4
-600
-300
0
300
600
I (m
A)
V (V)
-0.4 -0.2 0.0 0.2 0.4
-600
-300
0
300
600
I (m
A)
V (V)
a b
8
in the range of -0.2 V to 0.2 V, indicating that the contact between the MGMs and the Pt is
Ohmic at a potential of 10 mV we used and it contributes little to the variation of GMGM during
the electrolyte gating process.
Examining the nature of electrolyte gating effect
Given that the change of GMGM with gate voltages is mainly a result of the electrolyte gating
effect, the electrical response of MGM to gate voltages should follow a similar trend to that of
rGO which is the basic building blocks of MGM. To further confirm the nature of electrolyte
gating, we have compared our results with the electrical gating properties of single rGO sheets
based on the traditional back-gating device configuration as shown in Fig. 2a.
The conductivity of MGM (𝜎𝑀𝐺𝑀 , a geometry-independent specific conductance) can be
written in terms of electron/hole mobility (𝜇) and charge carrier density (𝑛𝑖𝑛𝑑)9,
𝜎𝑀𝐺𝑀(𝑉𝑔) = 𝜇𝑒𝑛𝑖𝑛𝑑(𝑉𝑔) (S2)
where 𝑉𝑔 is the gate voltage potential applied between the gate electrode and MGM. In the
electrical studies of monolayer/few-layer graphene, both simple conductivity and Hall effect
measurements indicate that charge carrier density (𝑛𝑖𝑛𝑑) in graphene could be estimated by
considering the mobility of electron/hole (𝜇 ) as a gate-voltage-independent constant17. In
graphene-electrolyte systems, an electrolyte-gated Hall effect measurement confirms that the
change of 𝜇 with gate voltage (Vg) could also be negligible when Vg is away from the neutrality
point (0.1 V away)18,19. Therefore, in this work, the variation in conductance of MGM (GMGM)
can be considered as a result of the charge carrier density in MGM when Vg is kept away from
the neutrality point (under negative gating, 0.4 V away in Fig. 2b)20.
In conventional back-gating setups using monolayer graphene, charge carriers in graphene are
induced from a capacitive charging process through a traditional capacitor (with the
capacitance CBG) underneath graphene. The induced density is a function of Vg,
𝑒𝑛𝑖𝑛𝑑 = 𝐶𝐵𝐺(𝑉𝑔 − 𝑉𝐵𝐺0 ) (S3)
where 𝑉𝐵𝐺0 is the previously mentioned neutrality point for back-gating.
Similarly, in the electrolyte-gating setup, charge carriers in graphene are induced from a
capacitive charging process through a capacitor composed of electrical double layer (EDL)
formed near graphene-electrolyte interfaces. A similar relation to eq. S3 is written as
9
𝑒𝑛𝑖𝑛𝑑 ≈ 𝐶𝐸𝐷𝐿(𝑉𝑔 − 𝑉𝐸𝐷𝐿0 ) (S4)
where 𝐶𝐸𝐷𝐿is the capacitance of EDL and 𝑉𝐸𝐷𝐿0 is the neutrality point for electrolyte-gating.
Note that although, strictly speaking, 𝑒𝑛𝑖𝑛𝑑 = 𝐶𝐸𝐷𝐿𝜙𝐸𝐷𝐿, where ϕEDL is the potential drop only
across the EDL. Eq. S4 still provides a reasonable approximation for our study of MGM under
electrolyte-gating. Since Vg is the voltage measured across the entire graphene-electrolyte
interface (including both ϕEDL and the potential drop inside monolayer graphene (𝛿)), ϕEDL, can
be written as 𝜙𝐸𝐷𝐿 = 𝑉𝑔 − 𝛿. Note that 𝛿 is proportional to the ratio of CEDL and the quantum
capacitance of graphene (CQ, an intrinsic property), and CQ is much greater than CEDL in
electrolyte-gating setups when Vg is away from the neutrality point21, we obtain 𝜙𝐸𝐷𝐿 ≈ 𝑉𝑔 and
hence eq. S4.
In comparison to the GMGM which is dependent on the geometry of the MGM, such as the
number of rGO sheets composing the MGM, the nind is rather independent of the geometry of
MGM. Then, we apply the above relations to compare the changes in nind of MGM under
electrolyte-gating with that of rGO under conventional back-gating (the latter is commonly
seen in the electrical studies of graphene, e.g., electronic transistors) to further prove the
electrolyte gating effect in MGM.
In order to examine the variation of charge carriers in rGO as a function of gate voltage, a back-
gated device is fabricated using a monolayer reduced graphene oxide (rGO) (inset in Fig. 2a).
Briefly, the aforementioned rGO solution (0.5 mg g-1) was diluted to 0.005 mg g-1 and then
drop-casted onto a marked silicon oxide (285 nm). After being dried at room temperature
overnight, a pair of electrodes (source-drain electrode with a distance of 5 μm) were then
patterned using direct UV-laser writing lithography (SF-100) followed by electron-beam
deposition of Ti/Au (5/50 nm) in the vacuum. Afterwards, the devices were annealed at 200
for 2 h in argon atmosphere prior to testing. The source-drain current was collected using a
two-channel source meter unit (Agilent, B2902A) in ambient condition. While CBG of this
particular device is 1.26×10⁻⁸ F cm-2, CEDL is estimated to be 142.3 F g-1 from CV
measurements. These numbers are then substituted in eqs. S3 and S4 for the calculation of
charge carrier density (nind).
It is worth noting that the exact surface area of the MGM needs to be precisely measured to
obtain the density of charge carriers, which, however, is difficult3. Previous studies reported
that the specific surface area of graphene assemblies can range from 961 3to 3100 m2 g-1

10
2showing a dependence on the preparation and calculation methods. Since the rGO sheets in
the MGM remain mostly separated2,3, a rough estimation can be made to estimate the carrier
density of MGM by assuming the specific surface area to be 2630 m2 g-1 (theoretical value of
graphene). As shown in Fig. 2, when the charge carrier density for MGM and rGO (shown on
top x-axes) increases from 0 to around 90×1011 cm-2 , GMGM rises by 26%, which is close to the
change of GrGO (18%). Note, though, the value of nind in Fig. 2b is only indicative, as the exact
surface area of MGM which contributes to electrical conductance is difficult to estimate. The
consistence in the variation of conductance with gate voltage, as well as the charge carrier
density, indicates that the change of GMGM is mainly a result of the electrolyte gating effect.

11
2. Supplementary Figures (Fig. S6- S15)
Figure S6. The effect of electrolytes on the response of GMGM (MGM-10 nm) to Vg in
different electrolytes. a-d, GMGM and IW-G as a function of Vg in 1.0 M KCl (a), 0.5 M KTFSI
(b), 1.0 M EMIMBF4 (c) and 1.0 M BMIMBF4 (d). The scan rate is 5 mV s-1. For KTFSI, the
concentration of 0.5 M was used due to its limit of solubility. As shown in the figure, GMGM
consistently shows ~100% increase from 0 to -0.8 V in electrolytes of different cations or
anions.
0.0 -0.2 -0.4 -0.6 -0.8
0.6
0.9
1.2
1.5
Vg (V)
GM
GM
(S
)
-0.3
0.0
0.3
0.6
I W-G
(m
A)
0.0 -0.2 -0.4 -0.6 -0.8
0.4
0.6
0.8
1.0
Vg (V)
GM
GM
(S
)
-0.6
-0.3
0.0
0.3
0.6
I W-G
(m
A)
0.0 -0.2 -0.4 -0.6 -0.80.4
0.6
0.8
1.0
Vg (V)
GM
GM
(S
)
-0.6
-0.3
0.0
0.3
0.6
I W-G
(m
A)
a b
c d
0.0 -0.2 -0.4 -0.6 -0.8
0.6
0.9
1.2
1.5
Vg (V)
GM
GM
(S
)
-0.3
0.0
0.3
0.6
I W-G
(m
A)
12
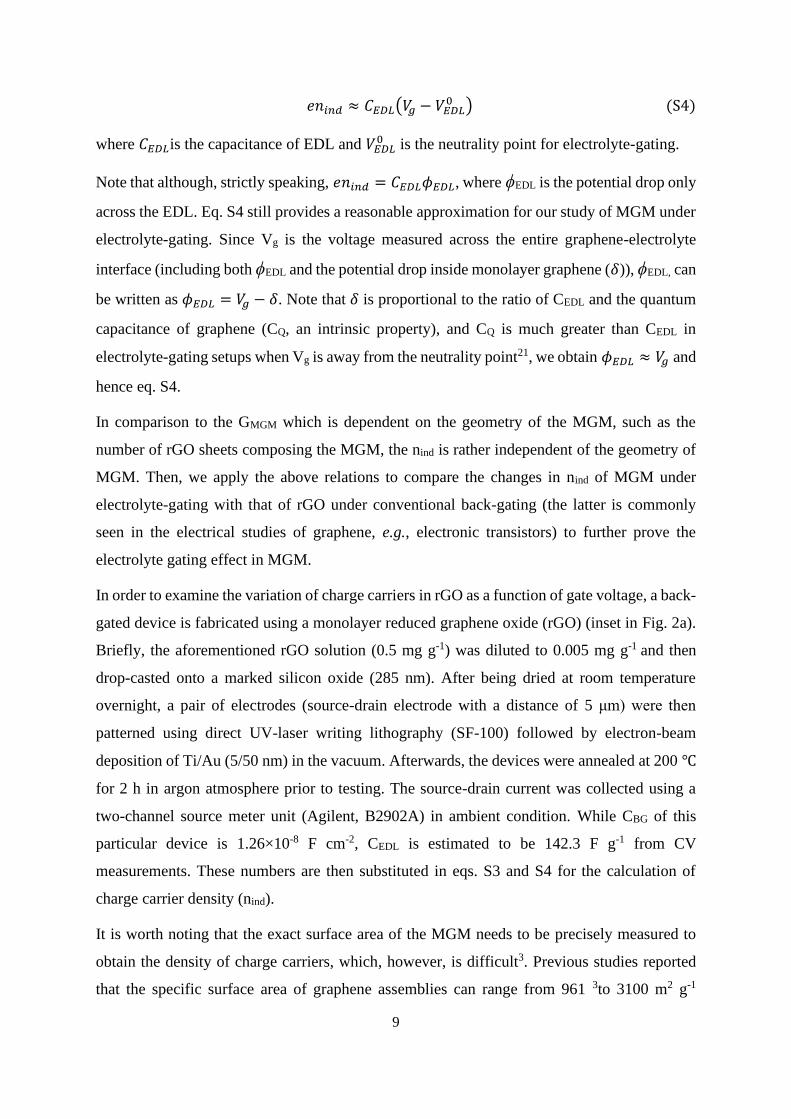
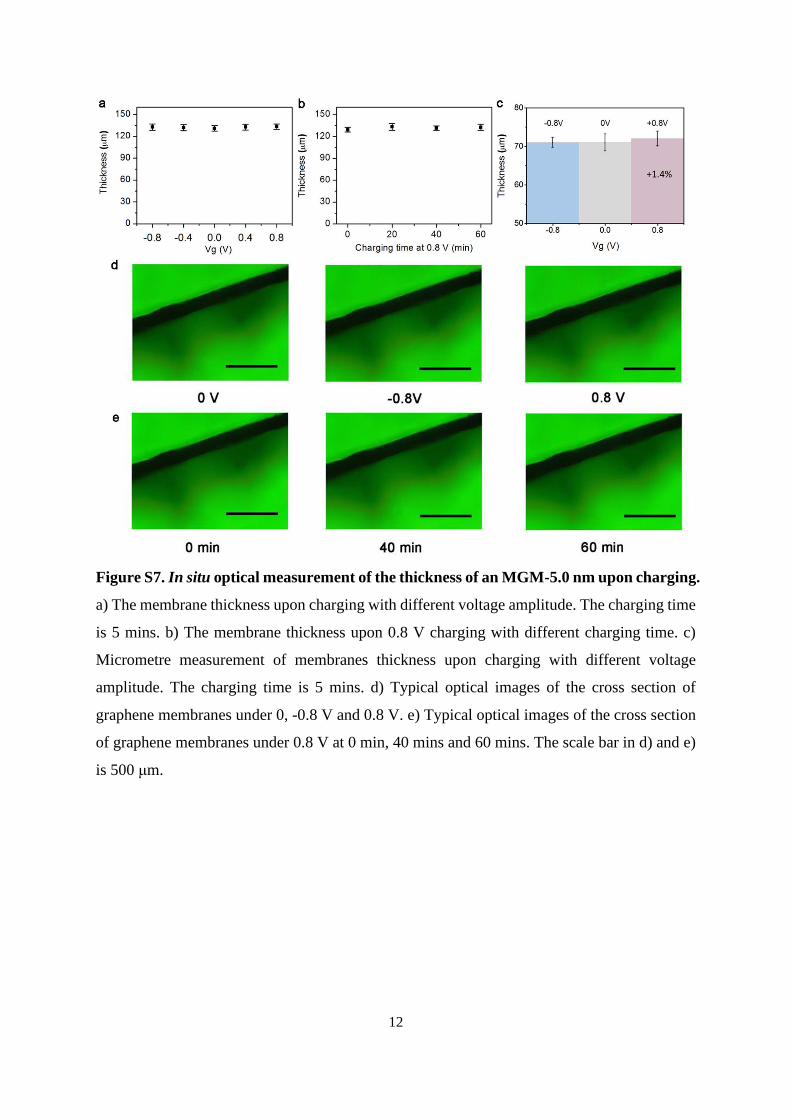
Figure S7. In situ optical measurement of the thickness of an MGM-5.0 nm upon charging.
a) The membrane thickness upon charging with different voltage amplitude. The charging time
is 5 mins. b) The membrane thickness upon 0.8 V charging with different charging time. c)
Micrometre measurement of membranes thickness upon charging with different voltage
amplitude. The charging time is 5 mins. d) Typical optical images of the cross section of
graphene membranes under 0, -0.8 V and 0.8 V. e) Typical optical images of the cross section
of graphene membranes under 0.8 V at 0 min, 40 mins and 60 mins. The scale bar in d) and e)
is 500 μm.

13
Figure S8. Characterization of the rGO used for back gating. A microscope image of the
rGO on silicon oxide (a), An AFM image of the rGO sheet (b). The measured thickness of the
rGO is ~ 1.0 nm, indicating that rGO sheets in dispersion remained separated before vacuum
filtration.
Figure S9. Effect of the type of electrolytes on the response of GMGM (MGM-5.0 nm) to
Vg. a-d, GMGM and IW-G as a function of Vg in 1.0 M KCl (a), 0.5 M KTFSI (b), 1.0 M
EMIMBF4 (c) and 1.0 M BMIMBF4 (d). The scan rate is 5 mV s-1. As shown in the figure,
GMGM shows a consistent variation with Vg in various electrolytes, indicating that the response
0.0 -0.2 -0.4 -0.6 -0.8
1.0
1.2
1.4
1.6
1.8
Vg (V)
GM
GM (
S)
-0.6
-0.3
0.0
0.3
0.6I W
-G (
mA
)
0.0 -0.2 -0.4 -0.6 -0.8
1.0
1.2
1.4
1.6
1.8
Vg (V)
GM
GM
(S
)
-0.6
-0.3
0.0
0.3
0.6
I W-G
(m
A)
0.0 -0.2 -0.4 -0.6 -0.8
1.0
1.2
1.4
1.6
Vg (V)
GM
GM
(S
)
-0.6
-0.3
0.0
0.3
0.6
I W-G
(m
A)
0.0 -0.2 -0.4 -0.6 -0.8
1.5
1.8
2.1
2.4
Vg (V)
GM
GM
(S
)
-0.4
-0.2
0.0
0.2
0.4
I W-G
(m
A)
a b
c d

14
of GMGM to Vg in nanoporous MGM is not ion specific. In comparison to the response of GMGM
to Vg for MGM-10 nm, which shows ~100% increase at -0.8 V, GMGM of MGM-5.0 nm shows
a smaller increase (~ 60%), which can be attributed to the higher stacking level of rGO sheets
in MGM-5.0 nm3,22.
Figure S10. Effect of type of electrolytes on the hysteretic response of GMGM (MGM-0.8
nm) to Vg. a-d, GMGM and IW-G as a function of Vg in 1.0 M KCl (a), 0.5 M KTFSI (b), 1.0 M
EMIMBF4 (c) and 1.0 M BMIMBF4 (d). The scan rate is 5 mV s-1. An obvious hysteretic
response of GMGM with regard to Vg can be also found in 0.5 M KTFSI and 1.0 M EMIMBF4,
in addition to 1.0 M BMIMBF4, implying that the observed hysteresis is not ion specific. The
obvious decrease in the hysteresis from BMIMBF4 to EMIMBF4, KTFSI and finally KCl
implies that the hysteresis is likely correlated to the ionic size of the electrolyte used, i.e., the
spatial confinement of ions. Besides, in comparison to the rise of GMGM for MGM-10 nm
(~100%) and MGM-5.0 nm (~60%) when Vg is varying from 0 to -0.8 V, the increase of GMGM
for MGM-0.8 nm (~40%) further decreases, which can be explained by the additional increase
in the stacking level of rGO sheets within MGM-0.8 nm3,22.
0.0 0.2 0.4 0.6 0.8
0.9
1.0
1.1
1.2
1.3
Vg (V)
GM
GM (
S)
-0.6
-0.3
0.0
0.3
0.6
I W-G
(m
A)
0.0 0.2 0.4 0.6 0.8
1.1
1.2
1.3
1.4
1.5
1.6
Vg (V)
GM
GM (
S)
-0.4
-0.2
0.0
0.2
0.4
I W-G
(m
A)
0.0 0.2 0.4 0.6 0.81.2
1.4
1.6
1.8
Vg (V)G
MG
M (
S)
-0.4
-0.2
0.0
0.2
0.4
I W-G
(m
A)
0.0 0.2 0.4 0.6 0.8
1.4
1.6
1.8
2.0
2.2
Vg (V)
GM
GM
(S)
-0.6
-0.3
0.0
0.3
0.6
I W-G
(m
A)
a b
c d

15
Figure S11. Characterization of the hysteretic response of GMGM under positive
polarisation. a-d, GMGM and Vg as a function of time for MGM with an interlayer spacing of
5.0 nm (a), 2.0 nm (b), 0.8 nm (c) and 0.6 nm (d). The electrolyte is 1.0 M BMIMBF4 and the
charging rate is 0.5 A g-1. As shown in the figure, though GMGM varies in a non-linear way
under positive polarisation, we can still read the hysteresis from the time lag between the peak
of GMGM and the peak of Vg, which is distinct in MGM with sub-nanometre interlayer distance
(Fig. S11c and d).
7,800 8,100 8,400 8,700
1.2
1.3
1.4
1.5
t (s)
GM
GM
(S
)
0.0
0.2
0.4
0.6
0.8
Vg (
V)
6,300 6,600 6,900 7,200
1.2
1.3
1.4
t (s)
GM
GM
(S
)
0.0
0.2
0.4
0.6
0.8
Vg (
V)
5,000 5,200 5,400 5,600
1.04
1.06
1.08
t (s)
GM
GM
(S
)
0.0
0.2
0.4
0.6
0.8
Vg (
V)
7,400 7,600 7,800 8,000
1.04
1.06
1.08
1.10
t (s)
GM
GM
(S
)
0.0
0.2
0.4
0.6
0.8
Vg (
V)
a b
c d
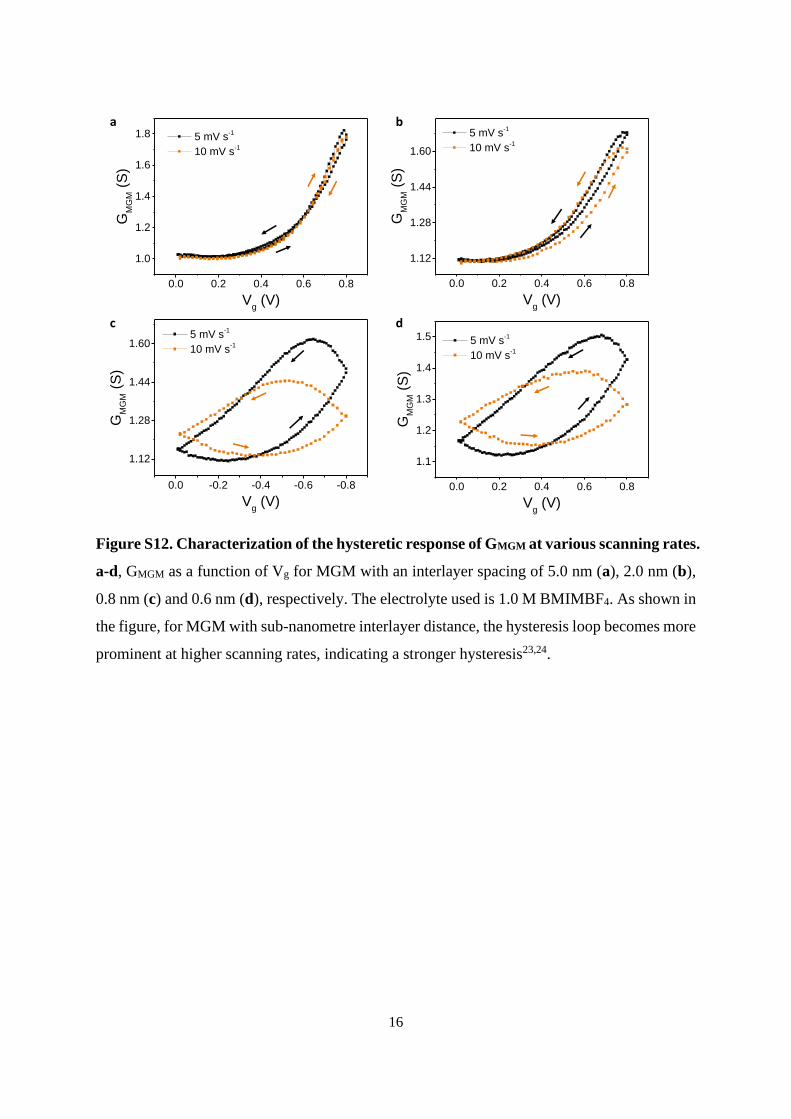
16
Figure S12. Characterization of the hysteretic response of GMGM at various scanning rates.
a-d, GMGM as a function of Vg for MGM with an interlayer spacing of 5.0 nm (a), 2.0 nm (b),
0.8 nm (c) and 0.6 nm (d), respectively. The electrolyte used is 1.0 M BMIMBF4. As shown in
the figure, for MGM with sub-nanometre interlayer distance, the hysteresis loop becomes more
prominent at higher scanning rates, indicating a stronger hysteresis23,24.
0.0 0.2 0.4 0.6 0.8
1.1
1.2
1.3
1.4
1.5 5 mV s-1
10 mV s-1
GM
GM (
S)
Vg (V)
0.0 -0.2 -0.4 -0.6 -0.8
1.12
1.28
1.44
1.60 5 mV s
-1
10 mV s-1
GM
GM (
S)
Vg (V)
0.0 0.2 0.4 0.6 0.8
1.0
1.2
1.4
1.6
1.8 5 mV s-1
10 mV s-1
GM
GM (
S)
Vg (V)
0.0 0.2 0.4 0.6 0.8
1.12
1.28
1.44
1.60
5 mV s-1
10 mV s-1
GM
GM (
S)
Vg (V)
a b
c d

17
Figure S13. The effect of electrolytes on the change of the lowest value of GMGM with
charging rates. a-d, GMGM and Vg as a function of time in 1.0 M KCl (a), 0.5 M KTFSI (b),
1.0 M EMIMBF4 (c) and 1.0 M BMIMBF4 (d). The interlayer spacing of the MGM is 0.8 nm.
The orange curve with solid square denotes a charging rate of 0.5 A g-1 while the curve with
open square signifies a charging rate of 1.0 A g-1. As shown in the figure, the lowest value of
GMGM increases with charging rates in all four electrolytes examined, and the most distinct
increase occurs in 1.0 M BMIMBF4. Thus, this increase in the minimum value of GMGM with
charging rates seems to be generic in MGM with small nanopores.
1,200 1,500 1,800
1.2
1.4
1.6
t (s)
GM
GM
(S
)
0.0
-0.2
-0.4
-0.6
-0.8
Vg (
V)
1,200 1,500 1,800 2,100 2,400
1.4
1.6
1.8
2.0
2.2
t (s)
GM
GM
(S
)
0.0
-0.2
-0.4
-0.6
-0.8
Vg (
V)
900 1,200 1,500 1,800
1.2
1.4
1.6
1.8
t (s)
GM
GM
(S
)
0.0
-0.2
-0.4
-0.6
-0.8
Vg (
V)
2,700 3,000 3,300 3,6001.0
1.2
1.4
1.6
t (s)
GM
GM
(S
)
0.0
-0.2
-0.4
-0.6
-0.8
Vg (
V)
a b
c d

18
Fig. S14. Comparison of the electrolyte-gating effect of the MGM-5.0 nm sample in different
electrolytes under negative (left column) and positive (right column) polarisations. The aqueous
solution of electrolytes used in the measurements are (a,b), 1.0 M KCl, (c,d), 0.5 M KTFSI, (e,f), 1.0
M EMIMBF4, and (g,h) 1.0 M BMIMBF4. Note that KCl and KTFSI share the same cation while
EMIMBF4 and BMIMBF4 contain the same anion. G0 represents the value of GMGM located at Vg=0.
0.0 0.2 0.4 0.6 0.80.9
1.0
1.1
1.2
Vg (V)
GM
GM
/G0
BMIMBF4
-0.6
-0.3
0.0
0.3
0.6I W
-G (
mA
)
0.0 -0.2 -0.4 -0.6 -0.8
1.0
1.2
1.4
1.6
1.8
Vg (V)
GM
GM
/G0
-0.6
-0.3
0.0
0.3
0.6
I W-G
(m
A)
BMIMBF4
0.0 -0.2 -0.4 -0.6 -0.8
1.0
1.2
1.4
1.6
1.8
Vg (V)
GM
GM
/G0
-0.6
-0.3
0.0
0.3
0.6
I W-G
(m
A)
EMIMBF4
0.0 0.2 0.4 0.6 0.80.9
1.0
1.1
1.2
Vg (V)
GM
GM
/G0
-0.6
-0.3
0.0
0.3
0.6
I W-G
(m
A)
EMIMBF4
0.0 -0.2 -0.4 -0.6 -0.8
1.0
1.2
1.4
1.6
1.8
Vg (V)
GM
GM
/G0
-0.6
-0.3
0.0
0.3
0.6
I W-G
(m
A)
KCl
0.0 0.2 0.4 0.6 0.80.9
1.0
1.1
1.2
Vg (V)
GM
GM
/G0
KCl
-0.6
-0.3
0.0
0.3
0.6
I W-G
(m
A)
a b
dc
e
g
f
h
0.0 0.2 0.4 0.6 0.80.9
1.0
1.1
1.2
Vg (V)
GM
GM
/G0
-0.6
-0.3
0.0
0.3
0.6
I W-G
(m
A)
KTFSI
0.0 -0.2 -0.4 -0.6 -0.8
1.0
1.2
1.4
1.6
1.8
Vg (V)
GM
GM
/G0
KTFSI
-0.6
-0.3
0.0
0.3
0.6
I W-G
(m
A)
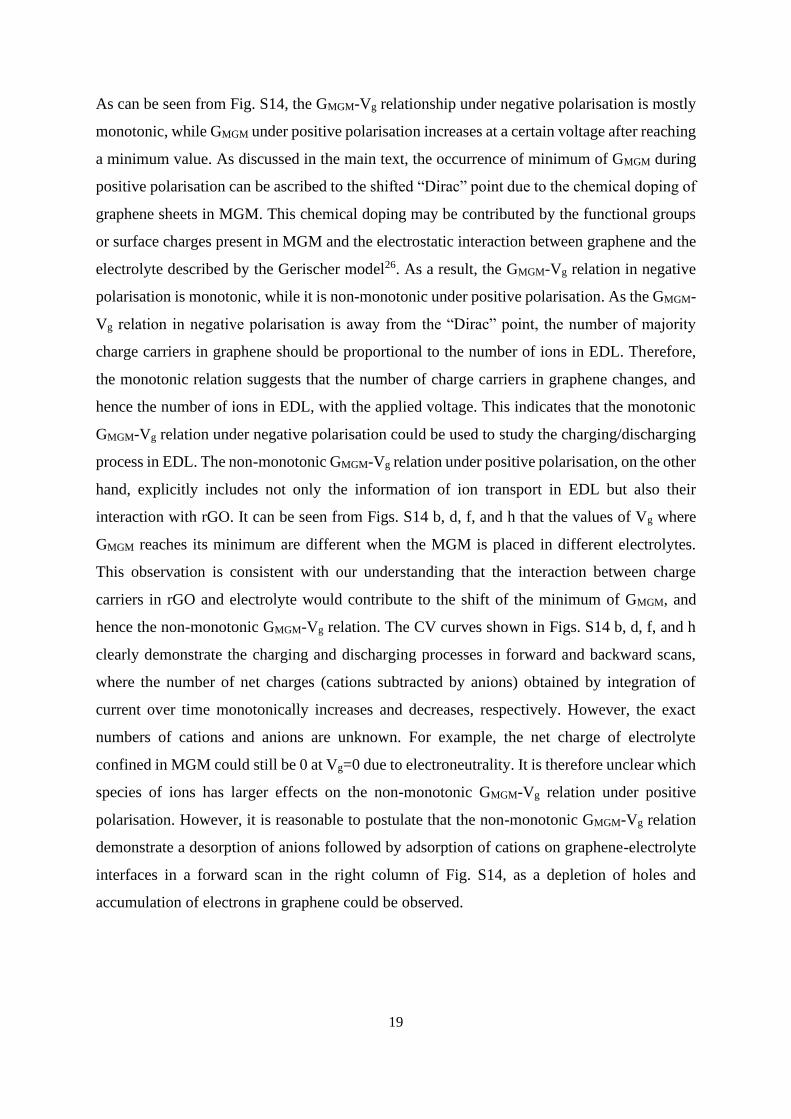
19
As can be seen from Fig. S14, the GMGM-Vg relationship under negative polarisation is mostly
monotonic, while GMGM under positive polarisation increases at a certain voltage after reaching
a minimum value. As discussed in the main text, the occurrence of minimum of GMGM during
positive polarisation can be ascribed to the shifted “Dirac” point due to the chemical doping of
graphene sheets in MGM. This chemical doping may be contributed by the functional groups
or surface charges present in MGM and the electrostatic interaction between graphene and the
electrolyte described by the Gerischer model26. As a result, the GMGM-Vg relation in negative
polarisation is monotonic, while it is non-monotonic under positive polarisation. As the GMGM-
Vg relation in negative polarisation is away from the “Dirac” point, the number of majority
charge carriers in graphene should be proportional to the number of ions in EDL. Therefore,
the monotonic relation suggests that the number of charge carriers in graphene changes, and
hence the number of ions in EDL, with the applied voltage. This indicates that the monotonic
GMGM-Vg relation under negative polarisation could be used to study the charging/discharging
process in EDL. The non-monotonic GMGM-Vg relation under positive polarisation, on the other
hand, explicitly includes not only the information of ion transport in EDL but also their
interaction with rGO. It can be seen from Figs. S14 b, d, f, and h that the values of Vg where
GMGM reaches its minimum are different when the MGM is placed in different electrolytes.
This observation is consistent with our understanding that the interaction between charge
carriers in rGO and electrolyte would contribute to the shift of the minimum of GMGM, and
hence the non-monotonic GMGM-Vg relation. The CV curves shown in Figs. S14 b, d, f, and h
clearly demonstrate the charging and discharging processes in forward and backward scans,
where the number of net charges (cations subtracted by anions) obtained by integration of
current over time monotonically increases and decreases, respectively. However, the exact
numbers of cations and anions are unknown. For example, the net charge of electrolyte
confined in MGM could still be 0 at Vg=0 due to electroneutrality. It is therefore unclear which
species of ions has larger effects on the non-monotonic GMGM-Vg relation under positive
polarisation. However, it is reasonable to postulate that the non-monotonic GMGM-Vg relation
demonstrate a desorption of anions followed by adsorption of cations on graphene-electrolyte
interfaces in a forward scan in the right column of Fig. S14, as a depletion of holes and
accumulation of electrons in graphene could be observed.
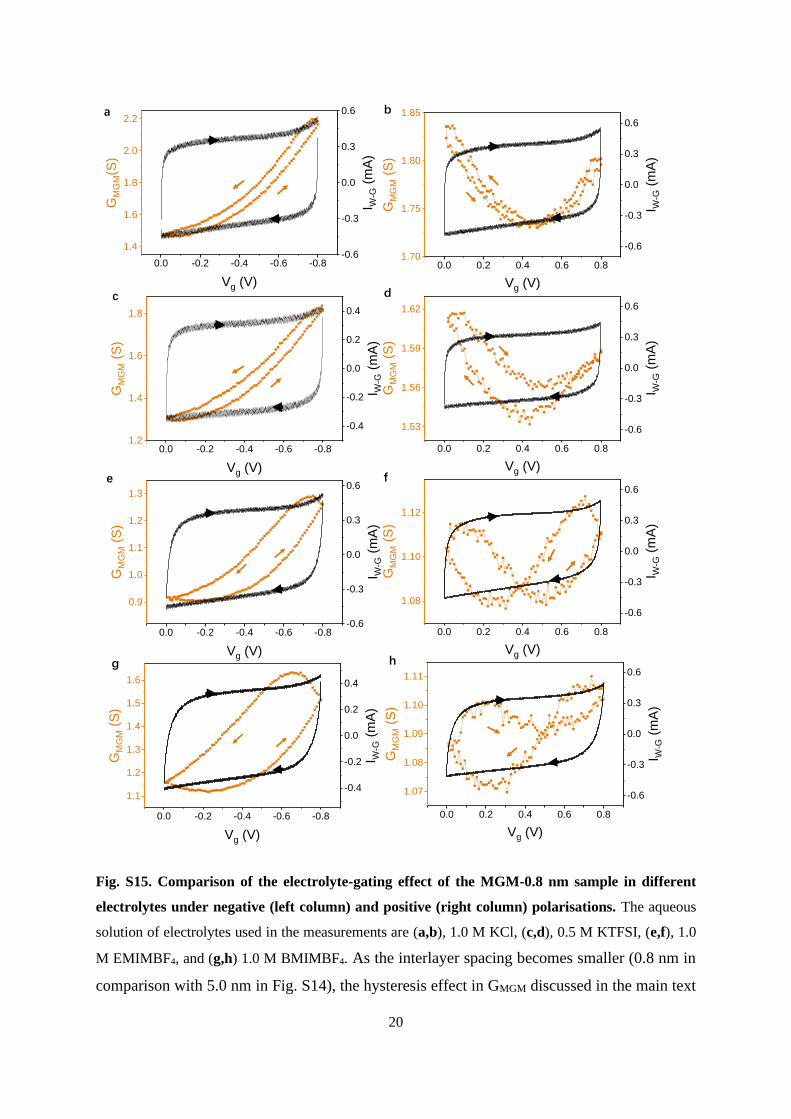
20
Fig. S15. Comparison of the electrolyte-gating effect of the MGM-0.8 nm sample in different
electrolytes under negative (left column) and positive (right column) polarisations. The aqueous
solution of electrolytes used in the measurements are (a,b), 1.0 M KCl, (c,d), 0.5 M KTFSI, (e,f), 1.0
M EMIMBF4, and (g,h) 1.0 M BMIMBF4. As the interlayer spacing becomes smaller (0.8 nm in
comparison with 5.0 nm in Fig. S14), the hysteresis effect in GMGM discussed in the main text
0.0 -0.2 -0.4 -0.6 -0.8
0.9
1.0
1.1
1.2
1.3
Vg (V)
GM
GM
(S
)
-0.6
-0.3
0.0
0.3
0.6
I W-G
(m
A)
0.0 0.2 0.4 0.6 0.81.70
1.75
1.80
1.85
Vg (V)
GM
GM
(S
)
-0.6
-0.3
0.0
0.3
0.6
I W-G
(m
A)
0.0 0.2 0.4 0.6 0.8
1.53
1.56
1.59
1.62
Vg (V)
GM
GM
(S
)
-0.6
-0.3
0.0
0.3
0.6
I W-G
(m
A)
d
b
0.0 0.2 0.4 0.6 0.8
1.08
1.10
1.12
Vg (V)
GM
GM
(S
)
-0.6
-0.3
0.0
0.3
0.6
I W-G
(m
A)
f
0.0 0.2 0.4 0.6 0.8
1.07
1.08
1.09
1.10
1.11
Vg (V)
GM
GM
(S
)
-0.6
-0.3
0.0
0.3
0.6
I W-G
(m
A)
h
0.0 -0.2 -0.4 -0.6 -0.8
1.4
1.6
1.8
2.0
2.2
Vg (V)
GM
GM
(S)
-0.6
-0.3
0.0
0.3
0.6
I W-G
(m
A)
a
0.0 -0.2 -0.4 -0.6 -0.81.2
1.4
1.6
1.8
Vg (V)
GM
GM
(S
)
-0.4
-0.2
0.0
0.2
0.4
I W-G
(m
A)
c
e
0.0 -0.2 -0.4 -0.6 -0.8
1.1
1.2
1.3
1.4
1.5
1.6
Vg (V)
GM
GM
(S
)
-0.4
-0.2
0.0
0.2
0.4
I W-G
(m
A)
g

21
can be observed in both negative and positive polarizations. Again, the shape of the hysteresis
is varied with the type of electrolytes tested. As discussed in the main text, the charging
dynamics of nanopores-based supercapacitors is very complex and depends on a broad range
of parameters such as the electrode and electrolyte materials used, the size and surface
chemistry of pores, the polarization of the electrode, the operation rate, as well as the ion
concentration, the cation-to-anion size ratio, solvation energies, ionophobicity, and ion-ion
correlations. In general, these results appear to be in line with the previous findings obtained
from other techniques.
22
3. Supplementary References:
1 Li, D., Mueller, M. B., Gilje, S., Kaner, R. B. & Wallace, G. G. Processable aqueous dispersions of graphene nanosheets. Nat. Nanotechnol. 3, 101-105 (2008).
2 Yang, X. et al. Ordered gelation of chemically converted graphene for next‐generation electroconductive hydrogel films. Angew. Chem. Int. Edit. 50, 7325-7328 (2011).
3 Yang, X., Cheng, C., Wang, Y., Qiu, L. & Li, D. Liquid-mediated dense integration of graphene materials for compact capacitive energy storage. Science 341, 534-537 (2013).
4 Cheng, C., Jiang, G., Simon, G. P., Liu, J. Z. & Li, D. Low-voltage electrostatic modulation of ion diffusion through layered graphene-based nanoporous membranes. Nat. Nanotechnol. (2018).
5 Cheng, C. et al. Ion transport in complex layered graphene-based membranes with tuneable interlayer spacing. Sci. Adv. 2, e1501272 (2016).
6 Eda, G., Fanchini, G. & Chhowalla, M. Large-area ultrathin films of reduced graphene oxide as a transparent and flexible electronic material. Nat. Nanotechnol. 3, 270-274 (2008).
7 He, Q. et al. Transparent, flexible, all-reduced graphene oxide thin film transistors. ACS Nano 5, 5038-5044 (2011).
8 Wang, S. et al. High mobility, printable, and solution-processed graphene electronics. Nano Lett. 10, 92-98 (2009).
9 Das, A. et al. Monitoring dopants by Raman scattering in an electrochemically top-gated graphene transistor. Nat. Nanotechnol. 3, 210-215 (2008).
10 Heller, I. et al. Influence of electrolyte composition on liquid-gated carbon nanotube and graphene transistors. J. Am. Chem. Soc. 132, 17149-17156 (2010).
11 Ohno, Y., Maehashi, K., Yamashiro, Y. & Matsumoto, K. Electrolyte-gated graphene field-effect transistors for detecting pH and protein adsorption. Nano Lett. 9, 3318-3322 (2009).
12 Albery, W. J., Elliott, C. M. & Mount, A. R. A transmission line model for modified electrodes and thin layer cells. J. Electroanal. Chem. 288, 15-34 (1990).
13 Jamnik, J. & Maier, J. Treatment of the impedance of mixed conductors equivalent circuit model and explicit approximate solutions. J. Electrochem. Soc. 146, 4183-4188 (1999).
14 Riess, I. Mixed ionic–electronic conductors—material properties and applications. Solid State Ion. 157, 1-17 (2003).
15 Saab, A. P., Garzon, F. H. & Zawodzinski, T. A. Determination of ionic and electronic resistivities in carbon/polyelectrolyte fuel-cell composite electrodes. J. Electrochem. Soc. 149, A1541-A1546 (2002).
16 Thangadurai, V., Huggins, R. A. & Weppner, W. Use of simple ac technique to determine the ionic and electronic conductivities in pure and Fe-substituted SrSnO 3 perovskites. J. Power Sources 108, 64-69 (2002).
17 Novoselov, K. S. et al. Electric field effect in atomically thin carbon films. Science 306, 666-669 (2004).
18 Zhan, H., Cervenka, J., Prawer, S. & Garrett, D. J. Molecular detection by liquid gated Hall effect measurements of graphene. Nanoscale 10, 930-935 (2018).
19 Kim, H., Kim, B. J., Sun, Q., Kang, M. S. & Cho, J. H. Graphene Transistors Gated by Salted Proton Conductor. Adv. Electron. Mater. 2, 1600122 (2016).
20 Kim, C.-H. & Frisbie, C. D. Determination of Quantum Capacitance and Band Filling Potential in Graphene Transistors with Dual Electrochemical and Field-Effect Gates. J. Phys. Chem. C 118, 21160-21169 (2014).
21 Zhu, Y. et al. Carbon-based supercapacitors produced by activation of graphene. Science 332, 1537-1541 (2011).
22 Partoens, B. & Peeters, F. From graphene to graphite: Electronic structure around the K point. J. Phys. Rev. B 74, 075404 (2006).
23 Krems, M., Pershin, Y. V. & Di Ventra, M. Ionic memcapacitive effects in nanopores. Nano Lett. 10, 2674-2678 (2010).
23
24 Wang, D. et al. Transmembrane potential across single conical nanopores and resulting memristive and memcapacitive ion transport. J. Am. Chem. Soc. 134, 3651-3654 (2012).
25 Weppner, W. & Huggins, R. A. Determination of Kinetic-Parameters of Mixed-Conducting Electrodes and Application to System Li3sb. J. Electrochem. Soc. 124, 1569-1578 (1977).
26 Memming, R. Semiconductor Electrochemistry. Weinheim, Germany: WILEY-VCH (2015).