Respiratory signal generation for retrospective gating of cone-beam CT images
12
Respiratory Signal Generation for Retrospective Gating of Cone-Beam CT Images Stefan Wiesner a , Ziv Yaniv b a Chair for Computer Aided Medical Procedures (CAMP), Technical University Munich b Imaging Science and Information Systems (ISIS) Center, Dept. of Radiology, Georgetown University Medical Center, Washington, DC, USA ABSTRACT We are currently investigating the acquisition of 4D cone-beam CT data using retrospective gating of the X-ray projection images. This approach requires a respiratory signal that is synchronized with image acquisition. To obtain such a signal we propose to use a spherical fiducial attached to the patient’s skin surface such that it is visible in the images. A region of interest containing the fiducial is manually identified in an initial image and is then automatically detected in all other images. Subsequently, we perform an approximate spatial (3D) reconstruction of the marker location from its 2D locations. Finally, we compute a respiratory signal by projecting the 3D points onto the major axis estimated via principle component analysis. As this respiratory signal was obtained from the fiducial location in each of the images it is implicitly synchronized with image acquisition. We evaluate the robustness of our fiducial detection using an anthropomorphic respiratory phantom. To evaluate the quality of the estimated respiratory signal we use a motion platform that follows the respiratory motion obtained by tracking the skin surface of a volunteer. We show that our method generates a respiratory signal that is in phase with the ground truth signal, but suffers from inaccuracies in amplitude close to the anterior-posterior imaging setup where the primary direction of motion is perpendicular to the image plane. Thus, our method should only be used for phase based retrospective gating. Keywords: image-guided therapy, respiratory motion, respiratory signal, cone-beam CT, trajectory reconstruc- tion 1. INTRODUCTION The use of image-guided navigation systems has grown in popularity in the past decade, as they typically enable procedures that involve substantially less trauma for the patient. To date, these systems have primarily been applied in procedures that involve rigid or semi-rigid structures such as those encountered in neurosurgery and orthopedics. 1 More recently researchers have turned their attention to interventions involving anatomical structures that move and deform due to respiration. Two key components have been identified as enabling technologies for such procedures, motion modeling and intra-operative imaging. 2 Currently, image-guided interventions performed in the thoracic-abdominal region use a gated approach. That is, a single three dimensional CT volume is acquired at breath-hold and the physician advances only during the respiratory phase in which the image was acquired. 3 This has the undesirable effect of increasing the procedure time. To enable a more streamlined workflow we propose to use a 4D, 3D over time, Cone-Beam CT (CBCT) data set. In this manner, we can provide a dynamic image display throughout the respiratory cycle. Our 4D CBCT acquisition approach is based on retrospective binning, similar to that used in 4D CT recon- struction. 4 The X-ray projection images are binned according to their phase in the respiratory cycle, and 3D reconstruction is performed separately for each bin. A prerequisite of this approach is that we have a respiratory signal that is synchronized with image acquisition. A variety of devices exist for generating a respiratory signal. These include, devices based on the temperature of airflow, 5 on direct measurement of airflow, 6 on the tension of a belt placed on the patient, 7 and on tracking E-mail: [email protected] Medical Imaging 2008: Visualization, Image-guided Procedures, and Modeling, edited by Michael I. Miga, Kevin Robert Cleary, Proc. of SPIE Vol. 6918, 691817, (2008) 1605-7422/08/$18 · doi: 10.1117/12.768849 Proc. of SPIE Vol. 6918 691817-1 Copyright 2008 Society of Photo-Optical Instrumentation Engineers. This paper was published in Proc. of SPIE Medical Imaging 2008: Visualization and Image-Guided Procedures, and is made available as an electronic reprint with permission of SPIE. One print or electronic copy may be made for personal use only. Systematic or multiple reproduction, distribution to multiple locations via electronic or other means, duplication of any material in this paper for a fee or for commercial purposes, or modification of the content of the paper are prohibited.
Transcript of Respiratory signal generation for retrospective gating of cone-beam CT images
Respiratory Signal Generation for Retrospective Gating ofCone-Beam CT Images
Stefan Wiesnera, Ziv Yanivb
aChair for Computer Aided Medical Procedures (CAMP), Technical University MunichbImaging Science and Information Systems (ISIS) Center, Dept. of Radiology,
Georgetown University Medical Center, Washington, DC, USA
ABSTRACT
We are currently investigating the acquisition of 4D cone-beam CT data using retrospective gating of the X-rayprojection images. This approach requires a respiratory signal that is synchronized with image acquisition. Toobtain such a signal we propose to use a spherical fiducial attached to the patient’s skin surface such that itis visible in the images. A region of interest containing the fiducial is manually identified in an initial imageand is then automatically detected in all other images. Subsequently, we perform an approximate spatial (3D)reconstruction of the marker location from its 2D locations. Finally, we compute a respiratory signal by projectingthe 3D points onto the major axis estimated via principle component analysis. As this respiratory signal wasobtained from the fiducial location in each of the images it is implicitly synchronized with image acquisition. Weevaluate the robustness of our fiducial detection using an anthropomorphic respiratory phantom. To evaluate thequality of the estimated respiratory signal we use a motion platform that follows the respiratory motion obtainedby tracking the skin surface of a volunteer. We show that our method generates a respiratory signal that is inphase with the ground truth signal, but suffers from inaccuracies in amplitude close to the anterior-posteriorimaging setup where the primary direction of motion is perpendicular to the image plane. Thus, our methodshould only be used for phase based retrospective gating.
Keywords: image-guided therapy, respiratory motion, respiratory signal, cone-beam CT, trajectory reconstruc-tion
1. INTRODUCTION
The use of image-guided navigation systems has grown in popularity in the past decade, as they typicallyenable procedures that involve substantially less trauma for the patient. To date, these systems have primarilybeen applied in procedures that involve rigid or semi-rigid structures such as those encountered in neurosurgeryand orthopedics.1 More recently researchers have turned their attention to interventions involving anatomicalstructures that move and deform due to respiration. Two key components have been identified as enablingtechnologies for such procedures, motion modeling and intra-operative imaging.2
Currently, image-guided interventions performed in the thoracic-abdominal region use a gated approach. Thatis, a single three dimensional CT volume is acquired at breath-hold and the physician advances only during therespiratory phase in which the image was acquired.3 This has the undesirable effect of increasing the proceduretime. To enable a more streamlined workflow we propose to use a 4D, 3D over time, Cone-Beam CT (CBCT)data set. In this manner, we can provide a dynamic image display throughout the respiratory cycle.
Our 4D CBCT acquisition approach is based on retrospective binning, similar to that used in 4D CT recon-struction.4 The X-ray projection images are binned according to their phase in the respiratory cycle, and 3Dreconstruction is performed separately for each bin. A prerequisite of this approach is that we have a respiratorysignal that is synchronized with image acquisition.
A variety of devices exist for generating a respiratory signal. These include, devices based on the temperatureof airflow,5 on direct measurement of airflow,6 on the tension of a belt placed on the patient,7 and on tracking
E-mail: [email protected]
Medical Imaging 2008: Visualization, Image-guided Procedures, and Modeling, edited byMichael I. Miga, Kevin Robert Cleary, Proc. of SPIE Vol. 6918, 691817, (2008)
1605-7422/08/$18 · doi: 10.1117/12.768849
Proc. of SPIE Vol. 6918 691817-1
Copyright 2008 Society of Photo-Optical Instrumentation Engineers. This paper was published in Proc. of SPIE Medical Imaging 2008: Visualization and Image-Guided Procedures, and is made available as an electronic reprint with permission of SPIE. One print or electronic copy may be made for personal use only. Systematic or multiple reproduction, distribution to multiple locations via electronic or othermeans, duplication of any material in this paper for a fee or for commercial purposes, or modification of the content of the paper are prohibited.
zivy
Rectangle
skin surface motion. The later are either monocular camera systems using infrared8, 9 or standard video10 images,and stereo camera systems, again, using infrared11 or standard video.12
In our context, 4D CBCT reconstruction, these systems have two main drawbacks. They introduce additionalhardware that is currently not part of the acquisition protocol, and they require synchronization with the imageacquisition. An alternative approach proposed by several authors is to generate a respiratory signal directly fromthe projection images.13–15 This approach has the added advantage of not requiring additional hardware, andmore importantly it is implicitly synchronized with image acquisition.
In15 the respiratory signal is generated by tracking features in the X-ray projection images. The trackedfeatures are limited to the region of the diaphragm, as this region exhibits the maximal motion due to respiration.The 2D feature locations are projected onto the superior-inferior axis and those with maximal motion are usedto generate the respiratory signal based on their displacement along the superior-inferior direction.
In14 this work was extended. In this case, features are sampled uniformly across the region of the lungs. Theyare then tracked in the 2D images. Features that are only visible for a short period of time or move only slightlyare discarded. For all other features, the 2D locations of each feature are projected onto the least squares line fitto them. This yields a respiratory signal from a single feature. All signals are combined by linearly normalizingtheir magnitude to be in [0, 1] and taking the mean value for each point in time. The authors note that most ofthe feature points retained by their approach are in the region of the diaphragm and are thus in agreement withthe previous approach,15 although some features are located on the lung walls.
In13 a 1mm radio-opaque fiducial is placed on the patients skin and is tracked in the X-ray projection images.The 2D fiducial locations are projected onto the superior-inferior axis and this is the 1D respiratory signal.The primary difference between this approach and the previous two14, 15 is that those approaches track regionsof interest that do not correspond to a consistent spatial anatomical structure, as both the X-ray source andanatomy are moving, and this approach does track a specific spatial point.
Non of these approaches presents an explicit spatial motion model, rather, they empirically show that theirapproach is either correlated with a known respiratory signal or that it can be used for 4D CBCT reconstruction.In this paper we present an explicit spatial motion model, taking into account the anatomical and X-ray sourcemotions. This model is then used to derive a respiratory signal based on the motion of a skin fiducial that isvisible in the projection images.
2. MATERIALS AND METHODS
The CBCT system used in our work is the Axiom Artis dFA system (Siemens AG, Medical Solutions, Erlangen,Germany). This is a floor mounted C-arm CBCT system based on a solid-state flat panel detector. Projectionimages are acquired using a 20sec rotation in which 543 images are uniformly acquired over a rotation of 220o.Image dimensions are 960x1024 pixels. The system is modelled as a distortion-less pinhole camera as this hasbeen shown to be an appropriate approximation of the imaging process.16 The skin adhesive fiducials used inthis work are the 4mm spherical CT-SPOTS markers (Beekley Corp., Bristol CT, USA).
To obtain a respiratory signal that is implicitly synchronized with image acquisition we estimate the approx-imate spatial (3D) location of a skin adhesive radio-opaque fiducial throughout the data acquisition process.The fiducial is localized in each of the 2D CBCT projection images and its 3D location is estimated using alinear approximation of its spatial trajectory. Once the 3D fiducial locations are obtained we perform PrincipleComponent Analysis (PCA), and project the points onto the major axis. This is our one dimensional respiratorysignal. As the signal is based on the 3D fiducial locations which are tied to specific 2D projection images it isimplicitly synchronized with the image acquisition.
We next describe our approach in detail.
2.1 Fiducial localization
Fiducial localization is performed automatically, following manual initialization. In the first image the userindicates a rectangular region of interest containing the fiducial. For each image we perform edge detection inthe region of interest using the Canny edge detector.17 The edge detector’s high and low thresholds are set to
Proc. of SPIE Vol. 6918 691817-2
0.5 and 0.2 (pixel values are in [0, 1]) and the smoothing parameter σ is set to 1.0. On the resulting edge imagewe perform circle estimation using the Random Sample Consensus (RANSAC) algorithm.18
RANSAC is an algorithm for dealing with outliers in a parameter estimation problem. Instead of using thewhole data set to compute a least squares estimate of the model’s parameters, minimal subsets are randomlyselected, and the model parameters are estimated for each subset. For each model a consensus set is obtained bymeasuring the distance of each point to the solution and incorporating it into the set if it is below a user specifiedthreshold. The process is repeated until the model with the largest support has been found. This consensus setis then used to compute a least squares estimate of the model parameters. In our case, circle fitting, the minimalsubset size is three and the circle is parameterized by its center coordinates and radius.
To utilize the RANSAC algorithm we thus need to define the following: 1) a method for parameter estimationwith the minimal number of points; 2) a method for least squares parameter estimation; 3) a distance function;and 4) a function to check for degenerate point configurations.
In our case, estimation of the parameters of a circle, we use the same method to estimate the parametersfrom the minimal number of points and to compute a least squares estimate. We follow the derivation describedin.19 The nonlinear parametric circle equation is linearized and the circle parameters are extracted from thesolution to this modified problem as follows. The circle equation is written as:
axT x + bTx + c = 0 (1)
yielding the following linear equation system⎛⎜⎜⎜⎝x2
11 + x212 x11 x12 1
x221 + x2
22 x21 x22 1...
x2n1 + x2
n2 xn1 xn2 1
⎞⎟⎟⎟⎠⎛⎜⎜⎝
ab1
b2
c
⎞⎟⎟⎠ = 0 (2)
which has an exact solution for three non-collinear points and has a non-trivial least squares solution subjectto the constraint ‖(a, b1, b2, c)‖ = 1. The circle center and radius are then obtained as
xcenter = (− b1
2a,− b2
2a) r =
√‖b‖2
4a2− c
a(3)
This assumes that a �= 0 which in our case is valid, as otherwise the equation would describe a line(bT x + c = 0).
Our distance function describes the distance between a point, x, and a circle model,(xcenter , r) and is
d = |‖xcenter − x‖ − r| (4)
Finally, to ensure that we do not attempt to estimate circle parameters from degenerate subsets, threecollinear points, we evaluate how close the sample set points are to a linear configuration. This is done bycomputing the eigen-values of the covariance matrix of the sample set. If the largest eigen-value is an order ofmagnitude larger than the second largest one, the sample set is discarded, as it is too close to a line.
Once the maximal consensus set is obtained we fit a circle to it, with the circle center being the fiduciallocation that we desire. We then shift the region of interest in the following image so that it is centered onthe previously detected circle center and repeat the process. The distance between 2D fiducial locations in twoconsecutive images is small due to the speed of image acquisition, 0.036sec between image acquisitions with a0.4o C-arm rotation, allowing us to use a small region of interest for fiducial tracking.
Proc. of SPIE Vol. 6918 691817-3
C−arm trajectory
Xm
r1
ri
X1
Xi
L
l1
x1
xi
li
xm
lm
rm
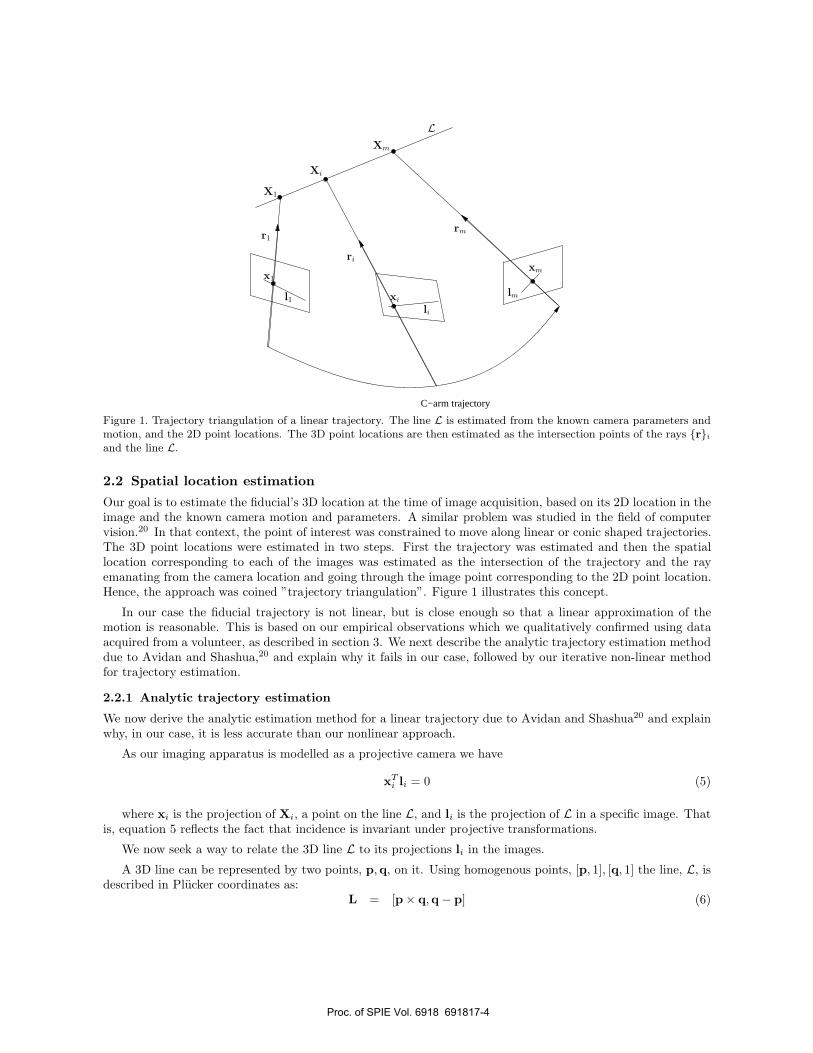
Figure 1. Trajectory triangulation of a linear trajectory. The line L is estimated from the known camera parameters andmotion, and the 2D point locations. The 3D point locations are then estimated as the intersection points of the rays {r}i
and the line L.
2.2 Spatial location estimation
Our goal is to estimate the fiducial’s 3D location at the time of image acquisition, based on its 2D location in theimage and the known camera motion and parameters. A similar problem was studied in the field of computervision.20 In that context, the point of interest was constrained to move along linear or conic shaped trajectories.The 3D point locations were estimated in two steps. First the trajectory was estimated and then the spatiallocation corresponding to each of the images was estimated as the intersection of the trajectory and the rayemanating from the camera location and going through the image point corresponding to the 2D point location.Hence, the approach was coined ”trajectory triangulation”. Figure 1 illustrates this concept.
In our case the fiducial trajectory is not linear, but is close enough so that a linear approximation of themotion is reasonable. This is based on our empirical observations which we qualitatively confirmed using dataacquired from a volunteer, as described in section 3. We next describe the analytic trajectory estimation methoddue to Avidan and Shashua,20 and explain why it fails in our case, followed by our iterative non-linear methodfor trajectory estimation.
2.2.1 Analytic trajectory estimation
We now derive the analytic estimation method for a linear trajectory due to Avidan and Shashua20 and explainwhy, in our case, it is less accurate than our nonlinear approach.
As our imaging apparatus is modelled as a projective camera we have
xTi li = 0 (5)
where xi is the projection of Xi, a point on the line L, and li is the projection of L in a specific image. Thatis, equation 5 reflects the fact that incidence is invariant under projective transformations.
We now seek a way to relate the 3D line L to its projections li in the images.
A 3D line can be represented by two points, p,q, on it. Using homogenous points, [p, 1], [q, 1] the line, L, isdescribed in Plucker coordinates as:
L = [p× q,q − p] (6)
Proc. of SPIE Vol. 6918 691817-4
Note that the Plucker coordinate vector L corresponds to a 3D line only if it satisfies the following twoconstraints:
L1L4 + L2L5 + L3L6 = 0¬(L4 = 0 ∧ L5 = 0 ∧ L6 = 0) (7)
To project the 3D homogenous line representation onto the image we reformulate the projection matrix P .Note that P encodes both the external and internal camera parameters. The 3 × 4 matrix P becomes a 3 × 6line projection matrix P .21
P = [det(P )P−T [P1..3,4]×P ]; (8)
where:P = P1..3,1..3
and
[P1..3,4]× =
⎡⎣ 0 −P3,4 P2,4
P3,4 0 −P1,4
−P2,4 P1,4 0
⎤⎦Substituting the line representation, Equation 6, and the line projection matrix, Equation 8, into Equation 5
yields the following equation system:
xTi PiL = 0; (9)
whose solution yields the desired line, L. For a unique solution to exist five or more images are required.
While this method is elegant it has one flaw, the constraints on the solution (Equation 7) are not explicitlyenforced. That is, Equation 9 admits solutions that do not correspond to a 3D line. Given this flaw, and ourdata, which is only approximately linear this method was found to be less accurate than our nonlinear approach.
2.2.2 Non-linear trajectory estimation
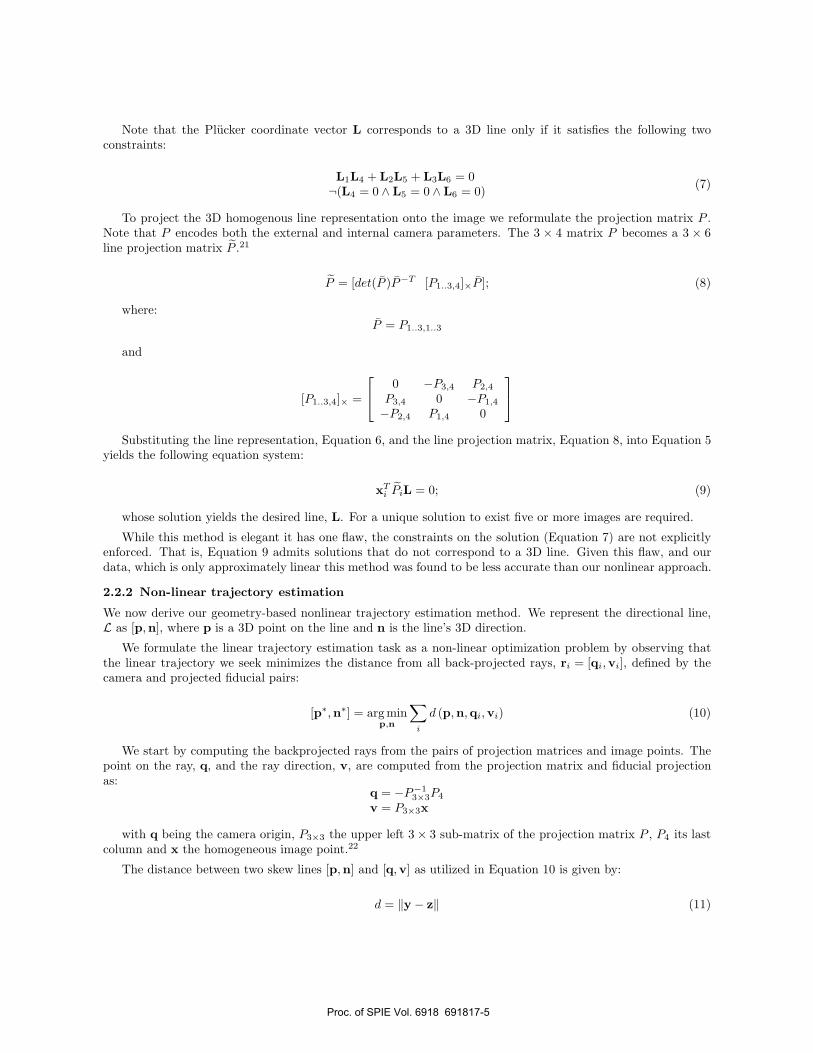
We now derive our geometry-based nonlinear trajectory estimation method. We represent the directional line,L as [p,n], where p is a 3D point on the line and n is the line’s 3D direction.
We formulate the linear trajectory estimation task as a non-linear optimization problem by observing thatthe linear trajectory we seek minimizes the distance from all back-projected rays, ri = [qi,vi], defined by thecamera and projected fiducial pairs:
[p∗,n∗] = argminp,n
∑i
d (p,n,qi,vi) (10)
We start by computing the backprojected rays from the pairs of projection matrices and image points. Thepoint on the ray, q, and the ray direction, v, are computed from the projection matrix and fiducial projectionas:
q = −P−13×3P4
v = P3×3x
with q being the camera origin, P3×3 the upper left 3 × 3 sub-matrix of the projection matrix P , P4 its lastcolumn and x the homogeneous image point.22
The distance between two skew lines [p,n] and [q,v] as utilized in Equation 10 is given by:
d = ‖y − z‖ (11)
Proc. of SPIE Vol. 6918 691817-5
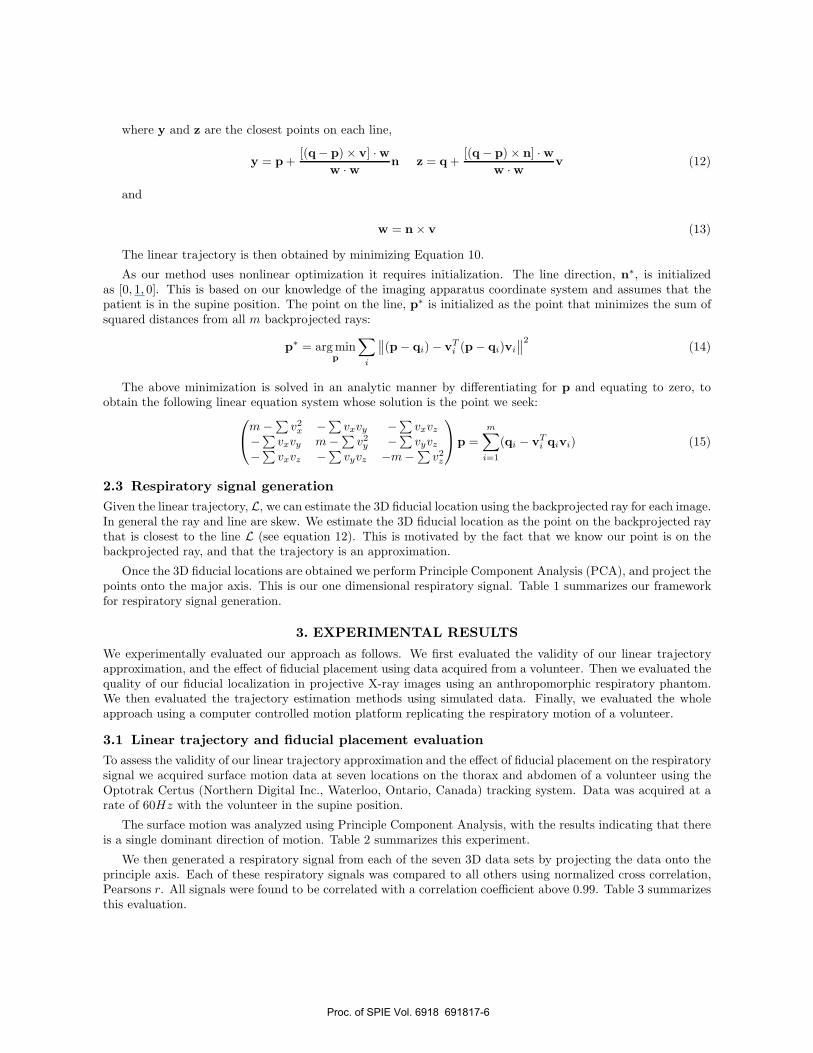
where y and z are the closest points on each line,
y = p +[(q− p) × v] ·w
w · w n z = q +[(q − p) × n] · w
w · w v (12)
and
w = n × v (13)
The linear trajectory is then obtained by minimizing Equation 10.
As our method uses nonlinear optimization it requires initialization. The line direction, n∗, is initializedas [0, 1, 0]. This is based on our knowledge of the imaging apparatus coordinate system and assumes that thepatient is in the supine position. The point on the line, p∗ is initialized as the point that minimizes the sum ofsquared distances from all m backprojected rays:
p∗ = arg minp
∑i
∥∥(p− qi) − vTi (p − qi)vi
∥∥2(14)
The above minimization is solved in an analytic manner by differentiating for p and equating to zero, toobtain the following linear equation system whose solution is the point we seek:⎛⎝m − ∑
v2x −∑
vxvy −∑vxvz
−∑vxvy m − ∑
v2y −∑
vyvz
−∑vxvz −∑
vyvz −m − ∑v2
z
⎞⎠p =m∑
i=1
(qi − vTi qivi) (15)
2.3 Respiratory signal generationGiven the linear trajectory, L, we can estimate the 3D fiducial location using the backprojected ray for each image.In general the ray and line are skew. We estimate the 3D fiducial location as the point on the backprojected raythat is closest to the line L (see equation 12). This is motivated by the fact that we know our point is on thebackprojected ray, and that the trajectory is an approximation.
Once the 3D fiducial locations are obtained we perform Principle Component Analysis (PCA), and project thepoints onto the major axis. This is our one dimensional respiratory signal. Table 1 summarizes our frameworkfor respiratory signal generation.
3. EXPERIMENTAL RESULTS
We experimentally evaluated our approach as follows. We first evaluated the validity of our linear trajectoryapproximation, and the effect of fiducial placement using data acquired from a volunteer. Then we evaluated thequality of our fiducial localization in projective X-ray images using an anthropomorphic respiratory phantom.We then evaluated the trajectory estimation methods using simulated data. Finally, we evaluated the wholeapproach using a computer controlled motion platform replicating the respiratory motion of a volunteer.
3.1 Linear trajectory and fiducial placement evaluationTo assess the validity of our linear trajectory approximation and the effect of fiducial placement on the respiratorysignal we acquired surface motion data at seven locations on the thorax and abdomen of a volunteer using theOptotrak Certus (Northern Digital Inc., Waterloo, Ontario, Canada) tracking system. Data was acquired at arate of 60Hz with the volunteer in the supine position.
The surface motion was analyzed using Principle Component Analysis, with the results indicating that thereis a single dominant direction of motion. Table 2 summarizes this experiment.
We then generated a respiratory signal from each of the seven 3D data sets by projecting the data onto theprinciple axis. Each of these respiratory signals was compared to all others using normalized cross correlation,Pearsons r. All signals were found to be correlated with a correlation coefficient above 0.99. Table 3 summarizesthis evaluation.
Proc. of SPIE Vol. 6918 691817-6

1. Fiducial tracking (2D)
(a) Manually define a rectangular ROI in first frame.
(b) Perform edge detection in the ROI.
(c) Fit a circle to the edge data using the RANSAC algorithm.
(d) Shift ROI to circle center and repeat with next frame.
2. Trajectory estimation (3D)
(a) For each image compute the back-projected ray emanating from the X-ray source and going throughthe fiducial location
(b) Estimate the line that minimizes the distance to all back-projected rays.
3. Respiratory signal generation (1D)
(a) For each back-projected ray compute the 3D point on the ray that is closest to the estimated trajectory.
(b) Project the 3D point locations onto the principle axis, computed using PCA. This is the respiratorysignal.
Table 1. Trajectory based framework for respiratory signal generation.
Marker 1 2 3 4 5 6 7 meaneig X 1.42 1.42 1.16 1.45 1.52 1.23 1.18 1.34eig Y 6.19 7.72 5.5 5.01 3.87 4.77 4.48 5.37eig Z 77.08 81.14 70.29 66.79 48.12 69.18 53.33 66.56
Table 2. Eigenvalues corresponding to magnitude of motion, obtained via PCA.
Marker 1 2 3 4 5 6 71 1.0000 0.9999 0.9994 0.9996 0.9982 0.9991 0.99682 1.0000 0.9995 0.9996 0.9981 0.9992 0.99693 1.0000 0.9992 0.9990 0.9995 0.99854 1.0000 0.9986 0.9995 0.99765 1.0000 0.9992 0.99916 1.0000 0.99897 1.0000
Table 3. Correlation of respiratory signals computed from motion data of optotrak markers placed on the thorax andabdomen of a volunteer.
Proc. of SPIE Vol. 6918 691817-7
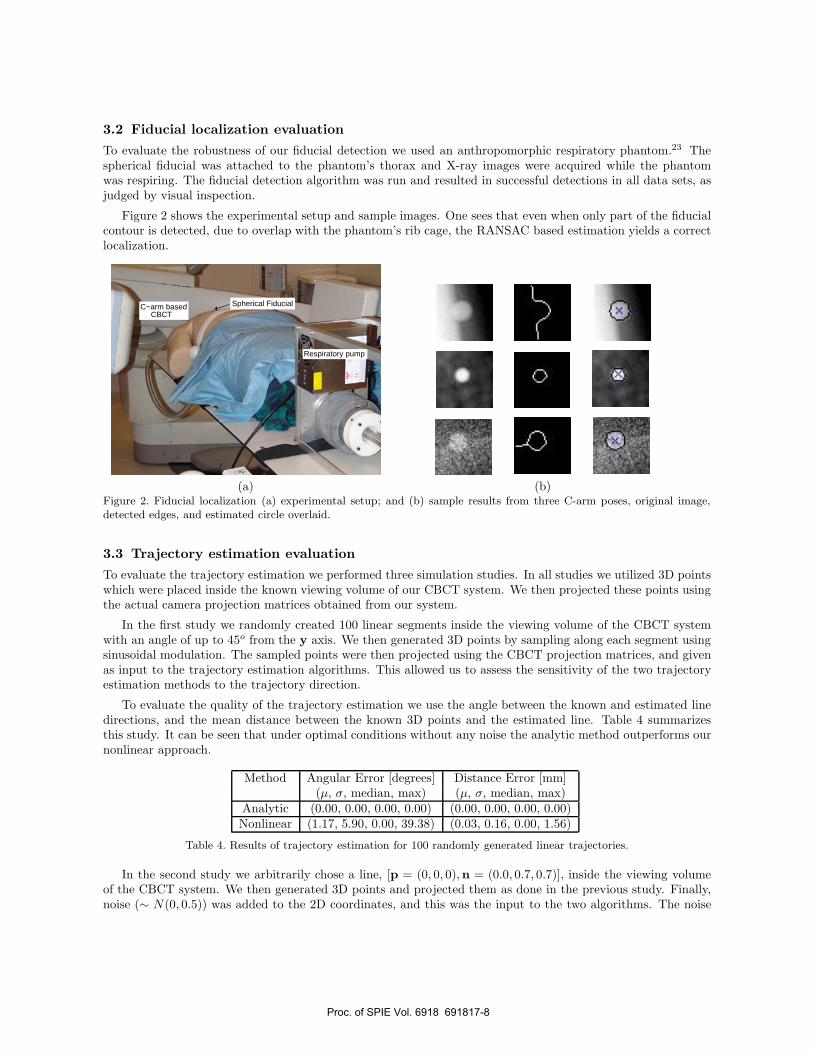
3.2 Fiducial localization evaluation
To evaluate the robustness of our fiducial detection we used an anthropomorphic respiratory phantom.23 Thespherical fiducial was attached to the phantom’s thorax and X-ray images were acquired while the phantomwas respiring. The fiducial detection algorithm was run and resulted in successful detections in all data sets, asjudged by visual inspection.
Figure 2 shows the experimental setup and sample images. One sees that even when only part of the fiducialcontour is detected, due to overlap with the phantom’s rib cage, the RANSAC based estimation yields a correctlocalization.
Respiratory pump
C−arm based Spherical FiducialCBCT
(a) (b)Figure 2. Fiducial localization (a) experimental setup; and (b) sample results from three C-arm poses, original image,detected edges, and estimated circle overlaid.
3.3 Trajectory estimation evaluation
To evaluate the trajectory estimation we performed three simulation studies. In all studies we utilized 3D pointswhich were placed inside the known viewing volume of our CBCT system. We then projected these points usingthe actual camera projection matrices obtained from our system.
In the first study we randomly created 100 linear segments inside the viewing volume of the CBCT systemwith an angle of up to 45o from the y axis. We then generated 3D points by sampling along each segment usingsinusoidal modulation. The sampled points were then projected using the CBCT projection matrices, and givenas input to the trajectory estimation algorithms. This allowed us to assess the sensitivity of the two trajectoryestimation methods to the trajectory direction.
To evaluate the quality of the trajectory estimation we use the angle between the known and estimated linedirections, and the mean distance between the known 3D points and the estimated line. Table 4 summarizesthis study. It can be seen that under optimal conditions without any noise the analytic method outperforms ournonlinear approach.
Method Angular Error [degrees] Distance Error [mm](µ, σ, median, max) (µ, σ, median, max)
Analytic (0.00, 0.00, 0.00, 0.00) (0.00, 0.00, 0.00, 0.00)Nonlinear (1.17, 5.90, 0.00, 39.38) (0.03, 0.16, 0.00, 1.56)
Table 4. Results of trajectory estimation for 100 randomly generated linear trajectories.
In the second study we arbitrarily chose a line, [p = (0, 0, 0),n = (0.0, 0.7, 0.7)], inside the viewing volumeof the CBCT system. We then generated 3D points and projected them as done in the previous study. Finally,noise (∼ N(0, 0.5)) was added to the 2D coordinates, and this was the input to the two algorithms. The noise
Proc. of SPIE Vol. 6918 691817-8
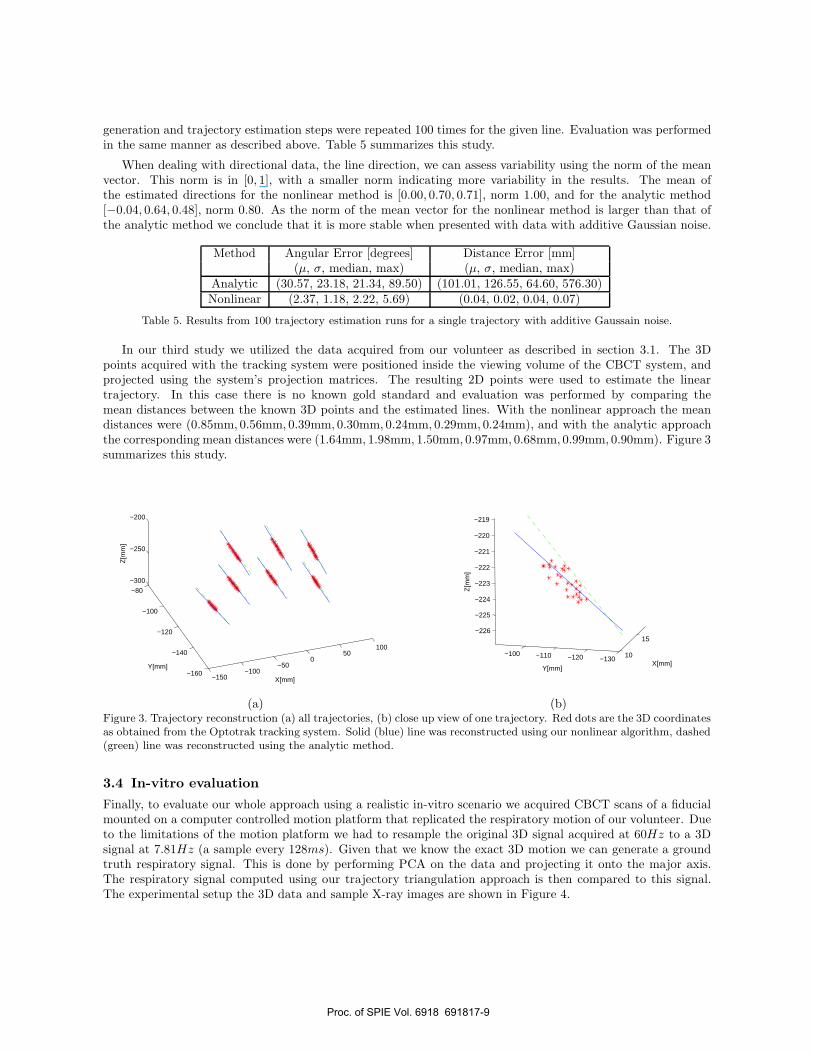
generation and trajectory estimation steps were repeated 100 times for the given line. Evaluation was performedin the same manner as described above. Table 5 summarizes this study.
When dealing with directional data, the line direction, we can assess variability using the norm of the meanvector. This norm is in [0, 1], with a smaller norm indicating more variability in the results. The mean ofthe estimated directions for the nonlinear method is [0.00, 0.70, 0.71], norm 1.00, and for the analytic method[−0.04, 0.64, 0.48], norm 0.80. As the norm of the mean vector for the nonlinear method is larger than that ofthe analytic method we conclude that it is more stable when presented with data with additive Gaussian noise.
Method Angular Error [degrees] Distance Error [mm](µ, σ, median, max) (µ, σ, median, max)
Analytic (30.57, 23.18, 21.34, 89.50) (101.01, 126.55, 64.60, 576.30)Nonlinear (2.37, 1.18, 2.22, 5.69) (0.04, 0.02, 0.04, 0.07)
Table 5. Results from 100 trajectory estimation runs for a single trajectory with additive Gaussain noise.
In our third study we utilized the data acquired from our volunteer as described in section 3.1. The 3Dpoints acquired with the tracking system were positioned inside the viewing volume of the CBCT system, andprojected using the system’s projection matrices. The resulting 2D points were used to estimate the lineartrajectory. In this case there is no known gold standard and evaluation was performed by comparing themean distances between the known 3D points and the estimated lines. With the nonlinear approach the meandistances were (0.85mm, 0.56mm, 0.39mm, 0.30mm, 0.24mm, 0.29mm, 0.24mm), and with the analytic approachthe corresponding mean distances were (1.64mm, 1.98mm, 1.50mm, 0.97mm, 0.68mm, 0.99mm, 0.90mm). Figure 3summarizes this study.
−150−100
−500
50100
−160
−140
−120
−100
−80
−300
−250
−200
X[mm]
Y[mm]
Z[m
m]
10
15
−130−120−110−100
−226
−225
−224
−223
−222
−221
−220
−219
X[mm]Y[mm]
Z[m
m]
(a) (b)Figure 3. Trajectory reconstruction (a) all trajectories, (b) close up view of one trajectory. Red dots are the 3D coordinatesas obtained from the Optotrak tracking system. Solid (blue) line was reconstructed using our nonlinear algorithm, dashed(green) line was reconstructed using the analytic method.
3.4 In-vitro evaluation
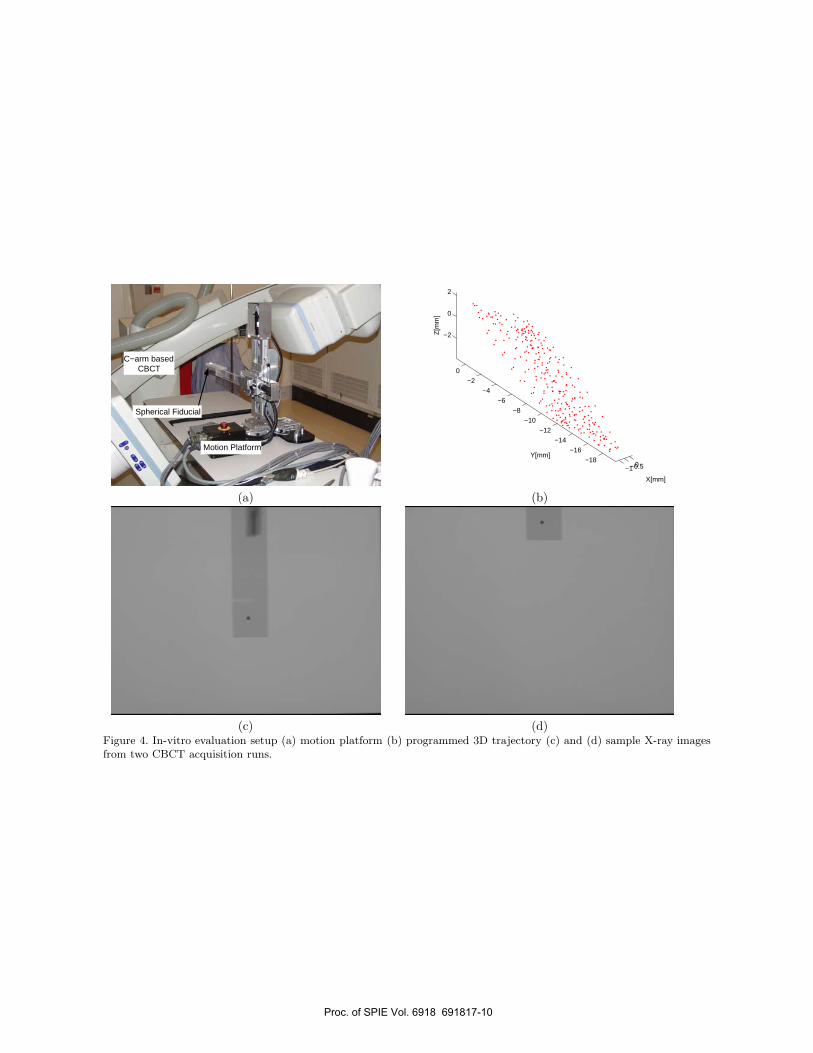
Finally, to evaluate our whole approach using a realistic in-vitro scenario we acquired CBCT scans of a fiducialmounted on a computer controlled motion platform that replicated the respiratory motion of our volunteer. Dueto the limitations of the motion platform we had to resample the original 3D signal acquired at 60Hz to a 3Dsignal at 7.81Hz (a sample every 128ms). Given that we know the exact 3D motion we can generate a groundtruth respiratory signal. This is done by performing PCA on the data and projecting it onto the major axis.The respiratory signal computed using our trajectory triangulation approach is then compared to this signal.The experimental setup the 3D data and sample X-ray images are shown in Figure 4.
Proc. of SPIE Vol. 6918 691817-9
K41. --
Spherical Fiducial
CBCTC−arm based
Motion Platform
−1−0.50−18
−16
−14−12
−10
−8−6
−4−2
0
−2
0
2
X[mm]
Y[mm]
Z[m
m]
(a) (b)
(c) (d)Figure 4. In-vitro evaluation setup (a) motion platform (b) programmed 3D trajectory (c) and (d) sample X-ray imagesfrom two CBCT acquisition runs.
Proc. of SPIE Vol. 6918 691817-10
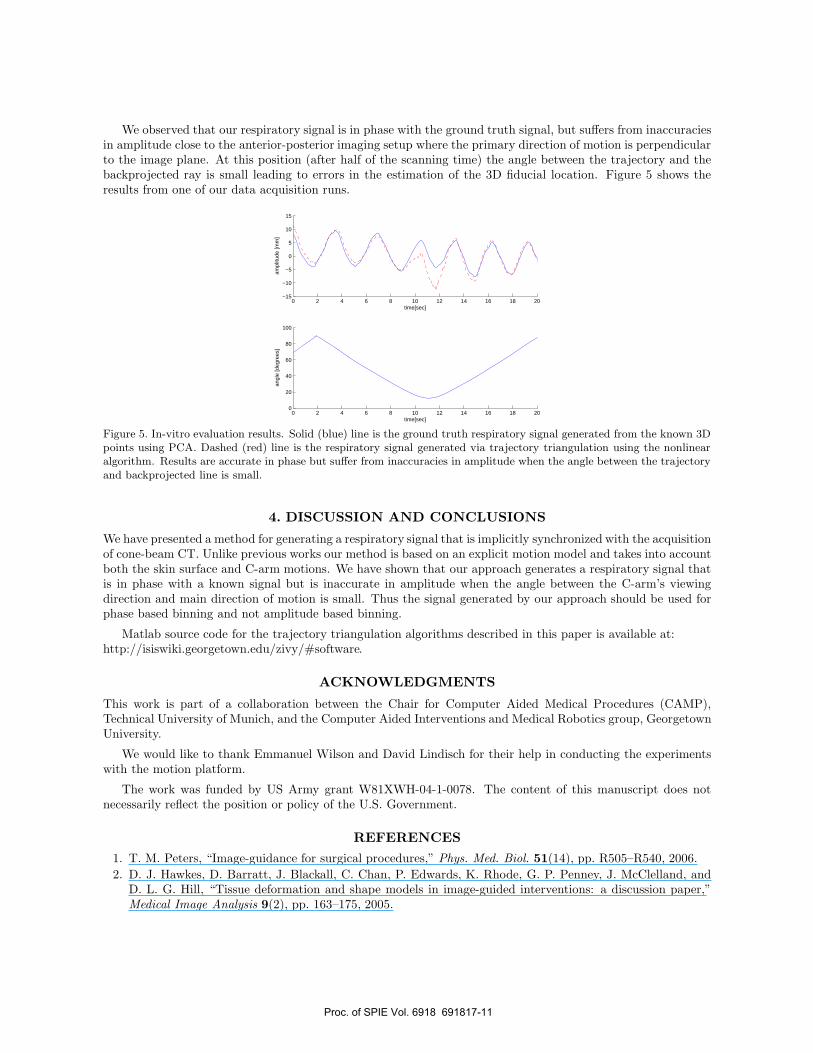
We observed that our respiratory signal is in phase with the ground truth signal, but suffers from inaccuraciesin amplitude close to the anterior-posterior imaging setup where the primary direction of motion is perpendicularto the image plane. At this position (after half of the scanning time) the angle between the trajectory and thebackprojected ray is small leading to errors in the estimation of the 3D fiducial location. Figure 5 shows theresults from one of our data acquisition runs.
0 2 4 6 8 10 12 14 16 18 20−15
−10
−5
0
5
10
15
time[sec]
ampl
itude
[mm
]
0 2 4 6 8 10 12 14 16 18 200
20
40
60
80
100
time[sec]
angl
e [d
egre
es]
Figure 5. In-vitro evaluation results. Solid (blue) line is the ground truth respiratory signal generated from the known 3Dpoints using PCA. Dashed (red) line is the respiratory signal generated via trajectory triangulation using the nonlinearalgorithm. Results are accurate in phase but suffer from inaccuracies in amplitude when the angle between the trajectoryand backprojected line is small.
4. DISCUSSION AND CONCLUSIONS
We have presented a method for generating a respiratory signal that is implicitly synchronized with the acquisitionof cone-beam CT. Unlike previous works our method is based on an explicit motion model and takes into accountboth the skin surface and C-arm motions. We have shown that our approach generates a respiratory signal thatis in phase with a known signal but is inaccurate in amplitude when the angle between the C-arm’s viewingdirection and main direction of motion is small. Thus the signal generated by our approach should be used forphase based binning and not amplitude based binning.
Matlab source code for the trajectory triangulation algorithms described in this paper is available at:http://isiswiki.georgetown.edu/zivy/#software.
ACKNOWLEDGMENTS
This work is part of a collaboration between the Chair for Computer Aided Medical Procedures (CAMP),Technical University of Munich, and the Computer Aided Interventions and Medical Robotics group, GeorgetownUniversity.
We would like to thank Emmanuel Wilson and David Lindisch for their help in conducting the experimentswith the motion platform.
The work was funded by US Army grant W81XWH-04-1-0078. The content of this manuscript does notnecessarily reflect the position or policy of the U.S. Government.
REFERENCES1. T. M. Peters, “Image-guidance for surgical procedures,” Phys. Med. Biol. 51(14), pp. R505–R540, 2006.2. D. J. Hawkes, D. Barratt, J. Blackall, C. Chan, P. Edwards, K. Rhode, G. P. Penney, J. McClelland, and
D. L. G. Hill, “Tissue deformation and shape models in image-guided interventions: a discussion paper,”Medical Image Analysis 9(2), pp. 163–175, 2005.
Proc. of SPIE Vol. 6918 691817-11

3. F. Banovac, J. Tang, S. Xu, D. Lindisch, H. Y. Chung, E. B. Levy, T. Chang, M. F. McCullough, Z. Yaniv,B. J. Wood, and K. Cleary, “Precision targeting of liver lesions using a novel electromagnetic navigationdevice in physiologic phantom and swine,” Med. Phys. 32(8), pp. 2698–2705, 2005.
4. S. S. Vedam, P. J. Keall, V. R. Kini, H. Mostafavi, H. P. Shukla, and R. Mohan, “Acquiring a four-dimensional computed tomography dataset using an external respiratory signal,” Phys. Med. Biol. 48(1),pp. 45–62, 2003.
5. L. Boucher, S. Rodrigue, R. Lecomte, and F. Benard, “Respiratory gating for 3-dimensional PET of thethorax: Feasibility and initial results,” Journal of Nuclear Medicine 45(2), pp. 214–219, 2004.
6. W. Kalender et al., “Measurement of pulmonary parenchymal attenuation: use of spirometric gating withquantitative CT,” Radiology 175(1), pp. 265–268, 1990.
7. S. K. Carlson et al., “Intermittent-mode CT fluoroscopy-guided biopsy of the lung or upper abdomen withbreath-hold monitoring and feedback: System development and feasibility,” Radiology 229(3), pp. 906–912,2003.
8. S. A. Nehmeh et al., “Quantitation of respiratory motion during 4D-PET/CT acquisition,” Med.Phys. 31(6), pp. 1333–1338, 2004.
9. T. Pan, T.-Y. Lee, E. Rietzel, and G. T. Y. Chen, “4D-CT imaging of a volume influenced by respiratorymotion on multi-slice CT,” Med. Phys. 31(2), pp. 333–340, 2004.
10. S. Wiesner and Z. Yaniv, “Monitoring patient respiration using a single optical camera,” in Annual Inter-national Conference of the IEEE EMBS, pp. 2740–2743, 2007.
11. R. D. Beach, H. Depold, G. Boening, P. P. Bruyant, B. Feng, H. C. Gifford, M. A. Gennert, S. Nadella, andM. A. King, “An adaptive approach to decomposing patient-motion tracking data acquired during cardiacSPECT imaging,” 54(1), pp. 130–139, 2007.
12. M. A. Gennert, J. K. Ho, A. C. Quina, J. H. Wang, P. P. Bruyant, and M. A. King, “Feasibility oftracking patient respiration during cardiac SPECT imaging using stereo optical cameras,” in Nuclear ScienceSymposium, 5, pp. 3170–3172, 2003.
13. T. Li, L. Xing, P. Munro, C. McGuinness, M. Chao, Y. Yang, B. Loo, and A. Koong, “Four-dimensionalcone-beam computed tomography using an on-board imager,” Med. Phys. 33(10), pp. 3825–3833, 2006.
14. S. Rit, D. Sarrut, and C. Ginestet, “Respiratory signal extraction for 4D CT imaging of the thorax fromcone-beam CT projections,” in Medical Image Computing and Computer-Assisted Intervention, pp. 556–563,2005.
15. L. Zijp, J. J. Sonke, and M. V. Herk, “Extraction of the respiratory signal from sequential thorax cone-beamx-ray images,” in International Conference on the Use of Computers in Radiation Therapy, pp. 507–509,2004.
16. M. Mitschke and N. Navab, “Recovering the X-ray projection geometry for three-dimensional tomographicreconstruction with additional sensors: Attached camera versus external navigation system,” Medical ImageAnalysis 7(1), pp. 65–78, 2003.
17. J. Canny, “A computational approach to edge detection,” IEEE Trans. Pattern Anal. Machine Intell. 8(6),pp. 679–714, 1986.
18. M. A. Fischler and R. C. Bolles, “Random sample consensus: a paradigm for model fitting with applicationsto image analysis and automated cartography,” Commun. ACM 24(6), pp. 381–395, 1981.
19. W. Gander, G. H. Golub, and R. Strebel, “Least-squares fitting of circles and ellipses,” BIT 34(4), pp. 558–578, 1994.
20. S. Avidan and A. Shashua, “Trajectory triangulation: 3D reconstruction of moving points from a monocularimage sequence,” IEEE Trans. Pattern Anal. Machine Intell. 22(4), pp. 348–357, 2000.
21. A. Bartoli and P. Sturm, “The 3D line motion matrix and alignment of line reconstructions,” InternationalJournal of Computer Vision 57(3), pp. 159–178, 2004.
22. K. Wiesent, K. Barth, N. Navab, P. Durlak, T. Brunner, O. Schutz, and W. Seissler, “Enhanced 3D-reconstruction algorithms for C-arm based interventional procedures,” IEEE Trans. Med. Imag. 19(5),pp. 391–403, 2000.
23. R. Lin, E. Wilson, J. Tang, D. Stoianovici, and K. Cleary, “A computer-controlled pump and realisticanthropomorphic respiratory phantom for validating image-guided systems,” in SPIE Medical Imaging:Visualization and Image-Guided Procedures, 2007.
Proc. of SPIE Vol. 6918 691817-12