Ion Dynamics Study of Potato Starch + Sodium Salts Electrolyte System
9
Hindawi Publishing Corporation International Journal of Electrochemistry Volume 2013, Article ID 670914, 8 pages http://dx.doi.org/10.1155/2013/670914 Research Article Ion Dynamics Study of Potato Starch + Sodium Salts Electrolyte System Tuhina Tiwari, 1 Neelam Srivastava, 1 and P. C. Srivastava 2 1 Department of Physics (MMV), Banaras Hindu University, Varanasi 221005, India 2 Department of Physics, Banaras Hindu University, Varanasi 221005, India Correspondence should be addressed to Neelam Srivastava; neelamsrivastava [email protected] Received 30 May 2013; Accepted 22 October 2013 Academic Editor: Sheng S. Zhang Copyright © 2013 Tuhina Tiwari et al. is is an open access article distributed under the Creative Commons Attribution License, which permits unrestricted use, distribution, and reproduction in any medium, provided the original work is properly cited. e effect of different anions, namely, SCN − ,I − , and ClO 4 − , on the electrical properties of starch-based polymer electrolytes has been studied. Anion size and conductivity are having an inverse trend indicating systems to be predominantly anionic conductor. Impact of anion size and multiplet forming tendency is reflected in number of charge carriers and mobility, respectively. Ion dynamics study reveals the presence of different mechanisms in different frequency ranges. Interestingly, superlinear power law (SLPL) is found to be present at <5 MHz frequency, which is further confirmed by dielectric data. 1. Introduction Potentiality of polymer electrolytes was first recognized by Armand et al. [1]. Since then, extensive work has been carried out in the field resulting in further subdivision of field into different branches, such as gelled polymer electrolyte, polymer-salt complex electrolyte, and composite polymer electrolyte. Biopolymer-based polymer-salt complex electrolytes are relatively new class of material and serving as environment friendly alternates to their synthetic counter parts [2, 3]. Among the biopolymers-based polymer-salt complexes, starch-based materials are gaining much recog- nition. Many leading groups [4–8] are working in the field. A review of natural polysaccharides as electroactive polymers by Finkenstadt summarizes the basics and importance of starch-based electrolytes [4]. Conductivity up to 10 −1.6 S/cm is reported by Ning et al. using ionic liquid as a plasticizer in starch-based polymer electrolytes [8]. Most of the reports on the starch-based electrolytes deals only with the electrical properties of system. is motivated us to understand the ion dynamics in these systems. Earlier we have studied potato starch-based electrolyte systems having iodide anion for two different cations [9, 10] which exhibited good electrolytic nature. Now, we extended our study to comprehend the effect of different anion in starch- based polymer-salt complexes. ClO 4 − ,I − , and SCN − anions are known for making polymer-salt complexes with synthetic polymers. Hence, in present paper, we are reporting starch- based electrolyte systems prepared by doping starch with sodium salt of these anions. Prepared system’s electrical behavior is analyzed using Impedance spectroscopy and by representing the impedance data in different formalism, namely, dielectric, modulus and conductivity. e use of conductivity formalism to investigate the dynamics of charge carrier is quite admired because of its simplicity. In 1977, Jonscher proposed “Universal dielectric response” to deal with dielectric properties of materials [11]. Later in 1978 he proposed conductivity power law = 0 + [12], which is followed by all kind of disordered materials and hence, termed as “Universal dynamic response” which has been further elaborated by Almond et al. in 1983 [13]. In original work of Jonscher, exponent “” was restricted to be <1 (now known as sublinear power law or Jonscher Power law). With the progress of time it has been recognized that if temperature and frequency range is wider then “” may also have values >1 (known as superlinear power law) [14– 18]. ough superlinear power law is proposed to exist at very high frequency but in the present system this is found even in MHz frequency range. Similar behavior is noted by other workers as well [14]. In the present work, a detail investigation is carried out to separate sublinear power law and superlinear power law regions. Number of charge carrier and mobility
Transcript of Ion Dynamics Study of Potato Starch + Sodium Salts Electrolyte System
Hindawi Publishing CorporationInternational Journal of ElectrochemistryVolume 2013 Article ID 670914 8 pageshttpdxdoiorg1011552013670914
Research ArticleIon Dynamics Study of Potato Starch + Sodium SaltsElectrolyte System
Tuhina Tiwari1 Neelam Srivastava1 and P C Srivastava2
1 Department of Physics (MMV) Banaras Hindu University Varanasi 221005 India2Department of Physics Banaras Hindu University Varanasi 221005 India
Correspondence should be addressed to Neelam Srivastava neelamsrivastava bhuyahoocoin
Received 30 May 2013 Accepted 22 October 2013
Academic Editor Sheng S Zhang
Copyright copy 2013 Tuhina Tiwari et al This is an open access article distributed under the Creative Commons Attribution Licensewhich permits unrestricted use distribution and reproduction in any medium provided the original work is properly cited
The effect of different anions namely SCNminus Iminus andClO4
minus on the electrical properties of starch-based polymer electrolytes has beenstudied Anion size and conductivity are having an inverse trend indicating systems to be predominantly anionic conductor Impactof anion size andmultiplet forming tendency is reflected in number of charge carriers andmobility respectively Ion dynamics studyreveals the presence of different mechanisms in different frequency ranges Interestingly superlinear power law (SLPL) is found tobe present at lt5MHz frequency which is further confirmed by dielectric data
1 Introduction
Potentiality of polymer electrolytes was first recognized byArmand et al [1] Since then extensive work has beencarried out in the field resulting in further subdivisionof field into different branches such as gelled polymerelectrolyte polymer-salt complex electrolyte and compositepolymer electrolyte Biopolymer-based polymer-salt complexelectrolytes are relatively new class of material and servingas environment friendly alternates to their synthetic counterparts [2 3] Among the biopolymers-based polymer-saltcomplexes starch-based materials are gaining much recog-nition Many leading groups [4ndash8] are working in the field Areview of natural polysaccharides as electroactive polymersby Finkenstadt summarizes the basics and importance ofstarch-based electrolytes [4] Conductivity up to 10minus16 Scmis reported by Ning et al using ionic liquid as a plasticizer instarch-based polymer electrolytes [8]
Most of the reports on the starch-based electrolytes dealsonly with the electrical properties of system This motivatedus to understand the ion dynamics in these systems Earlierwe have studied potato starch-based electrolyte systemshaving iodide anion for two different cations [9 10] whichexhibited good electrolytic nature Now we extended ourstudy to comprehend the effect of different anion in starch-based polymer-salt complexes ClO
4
minus Iminus and SCNminus anions
are known formaking polymer-salt complexes with syntheticpolymers Hence in present paper we are reporting starch-based electrolyte systems prepared by doping starch withsodium salt of these anions
Prepared systemrsquos electrical behavior is analyzed usingImpedance spectroscopy and by representing the impedancedata in different formalism namely dielectric modulus andconductivityThe use of conductivity formalism to investigatethe dynamics of charge carrier is quite admired because ofits simplicity In 1977 Jonscher proposed ldquoUniversal dielectricresponserdquo to deal with dielectric properties of materials [11]Later in 1978 he proposed conductivity power law 120590 = 120590
0
+
119860120596119899 [12] which is followed by all kind of disorderedmaterials
and hence termed as ldquoUniversal dynamic responserdquo whichhas been further elaborated by Almond et al in 1983 [13] Inoriginal work of Jonscher exponent ldquo119899rdquo was restricted to belt1 (now known as sublinear power law or Jonscher Powerlaw) With the progress of time it has been recognized thatif temperature and frequency range is wider then ldquo119899rdquo mayalso have values gt1 (known as superlinear power law) [14ndash18]Though superlinear power law is proposed to exist at veryhigh frequency but in the present system this is found evenin MHz frequency range Similar behavior is noted by otherworkers as well [14] In the present work a detail investigationis carried out to separate sublinear power law and superlinearpower law regions Number of charge carrier and mobility
2 International Journal of Electrochemistry
are estimated from dielectric data to understand the effectof anion size
2 Experimental Details
21 Material Preparation Potato starch (PS) (C6
H10
O5
)119899
NaI NaSCN NaClO
4
Glutaraldehyde (GA) (C5
H8
O2
) andPolyethylene glycol 300 (PEG) all from Loba Chemie wereused to prepare material with distilled water as solventThreeseries of samples (ie with three different salts) were preparedusing solution cast technique at 30∘C For 1 gm of starchsim10of PEG (017 gm or 5 drops) sodium salt (5 to 50 of PS) and2mLGAwere taken together in distilledwaterMixtureswerestirred at 30∘Conmagnetic stirrer for one hour and heated tillit dry Samples were in film form which was cut in to piecesfor study
22 Devices and Technique AC conductivity is measuredby computer controlled HIOKI HiTester LCR meter (3532-50) in the range 42Hz to 5 times 106Hz Ionic transferencenumber of the material is estimated by dc polarizationmethod using Keithley DMM 2100 Silver foils are used aselectrode Dielectric and Modulus data are estimated fromthe impedance spectra
3 Results and Discussion
31 Transference Number and Electrical Conductivity Thesimplest method to establish electrochemical nature is themeasurement of ionic transference number (119905ion) It repre-sents the fractional contribution of ionic charge carrier tothe total electrical conductivity In the present case thisparameter is estimated by dc polarization method [19]In the procedure 02 V potential was applied across theAgelectrolyteAg and current was monitored as a functionof time On the application of voltage current decreasedwith time and after some time it became constant as theelectrolyte was depleted of charge carrier 119905ion is estimatedusing following formula
119905ion =119894initial minus 119894final119894initial
(1)
where 119894initial is the initial current flown and 119894final is the valueof final saturated current This 119905ion gives the total ioniccontribution to conductivity For all the three systems 119905ionhas value sim099 which indicates the electrolytic nature ofpreparedmaterials To separate cationicanionic transferencenumber combined acdc method [20] was used Themethod is similar to that described above with the onlydifference that the blocking electrodes were replaced bynonblocking one 119905cation can be estimated from the cole-coleplot and polarization curve In the present case anticipatingthe movement of both the ions (sodiumiodide) Na-Hgamalgam was used as a nonblocking electrode to separatethe 119905Na+ The success was not achieved in present case sincewater absorbed in the starch matrix started reacting with theamalgam and the experiment failed But as water is available
Table 1 Values of conductivity and dielectric parameters fordifferent salt (NaClO4 NaI NaSCN) containing systems along withthe salt anion size
Anion Size (pm) 120590max (Scm) 1205761015840
12057610158401015840
ClO4minus 250 719 times 10
minus6 198 597Iminus 220 122 times 10
minus5 318 113SCNminus 213 112 times 10
minus4 452 635
in starchmatrix the effect of proton and hydroxyl ions on theconductivity of the system cannot be fully ruled out
Conductivity (120590) has been calculated using sampledimension ldquo119871rdquo and electrode area ldquo119860rdquo with the help offormula
120590 =
1
1198851015840
119871
119860
(2)
where 1198851015840 is intercept on real axis of 11988510158401015840 versus 1198851015840 plotsobtained in frequency range 42Hz to 5MHz
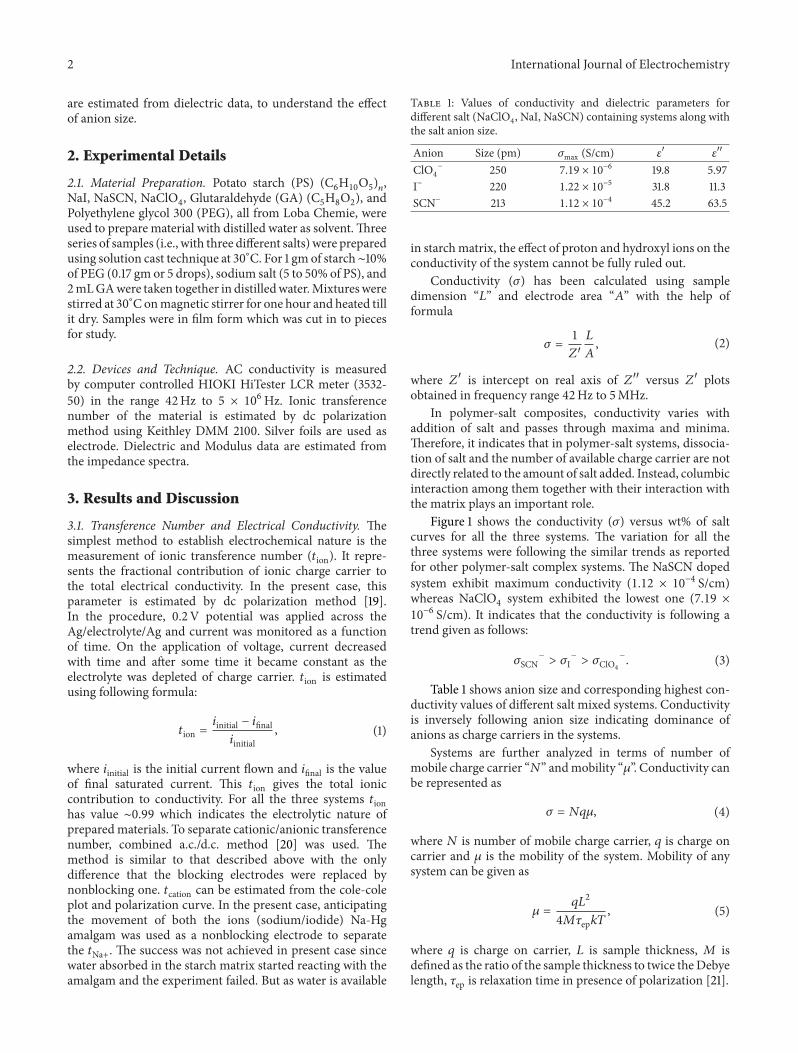
In polymer-salt composites conductivity varies withaddition of salt and passes through maxima and minimaTherefore it indicates that in polymer-salt systems dissocia-tion of salt and the number of available charge carrier are notdirectly related to the amount of salt added Instead columbicinteraction among them together with their interaction withthe matrix plays an important role
Figure 1 shows the conductivity (120590) versus wt of saltcurves for all the three systems The variation for all thethree systems were following the similar trends as reportedfor other polymer-salt complex systems The NaSCN dopedsystem exhibit maximum conductivity (112 times 10minus4 Scm)whereas NaClO
4
system exhibited the lowest one (719 times10minus6 Scm) It indicates that the conductivity is following a
trend given as follows
120590SCNminus
gt 120590Iminus
gt 120590ClO4
minus
(3)
Table 1 shows anion size and corresponding highest con-ductivity values of different salt mixed systems Conductivityis inversely following anion size indicating dominance ofanions as charge carriers in the systems
Systems are further analyzed in terms of number ofmobile charge carrier ldquo119873rdquo andmobility ldquo120583rdquo Conductivity canbe represented as
120590 = 119873119902120583 (4)
where 119873 is number of mobile charge carrier 119902 is charge oncarrier and 120583 is the mobility of the system Mobility of anysystem can be given as
120583 =
1199021198712
4119872120591ep119896119879 (5)
where 119902 is charge on carrier 119871 is sample thickness 119872 isdefined as the ratio of the sample thickness to twice theDebyelength 120591ep is relaxation time in presence of polarization [21]
International Journal of Electrochemistry 3
0
10
20
30
40
0 10 20 30 40 50wt of salt
120576998400 120576
998400998400
120576998400
120576998400998400
120590(S
cm
)
800E minus 06
600E minus 06
400E minus 06
200E minus 06
000E + 00
NaClO4
NaClO4
120590 (NaClO4)
(a)
0
10
20
30
40
50
0 10 20 30 40 50wt of salt
120576998400 120576
998400998400
120576998400 NaI120576998400998400 NaI120590 (NaI)
120590(S
cm
)
100E minus 04
100E minus 05
100E minus 06
(b)
010203040506070
0 10 20 30 40 50wt of salt
120576998400 120576
998400998400
120576998400 NaSCN120576998400998400 NaSCN120590 (Scm)
120590(S
cm
)
100E minus 03
100E minus 04
100E minus 05
100E minus 06
(c)
Figure 1 Variation of conductivity and dielectric parameter with wt of added salt (a) NaClO4
Salt (b) NaI salt and (c) NaSCN salt
Table 2 Values of 120591ep119872 120583 and119873 for different salt (NaClO4 NaIand NaSCN) containing systems
Salt 120591ep (sec) 119872 120583 (cm2Vminus1sminus1) 119873 (cmminus3)NaSCN 243 times 10minus4 381 times 10+3 476 times 10minus7 147 times 10+21
NaI 517 times 10minus3
965 times 10+2
795 times 10minus8
489 times 10+20
NaClO4 258 times 10minus3
416 times 10+2
212 times 10minus7
688 times 10+19
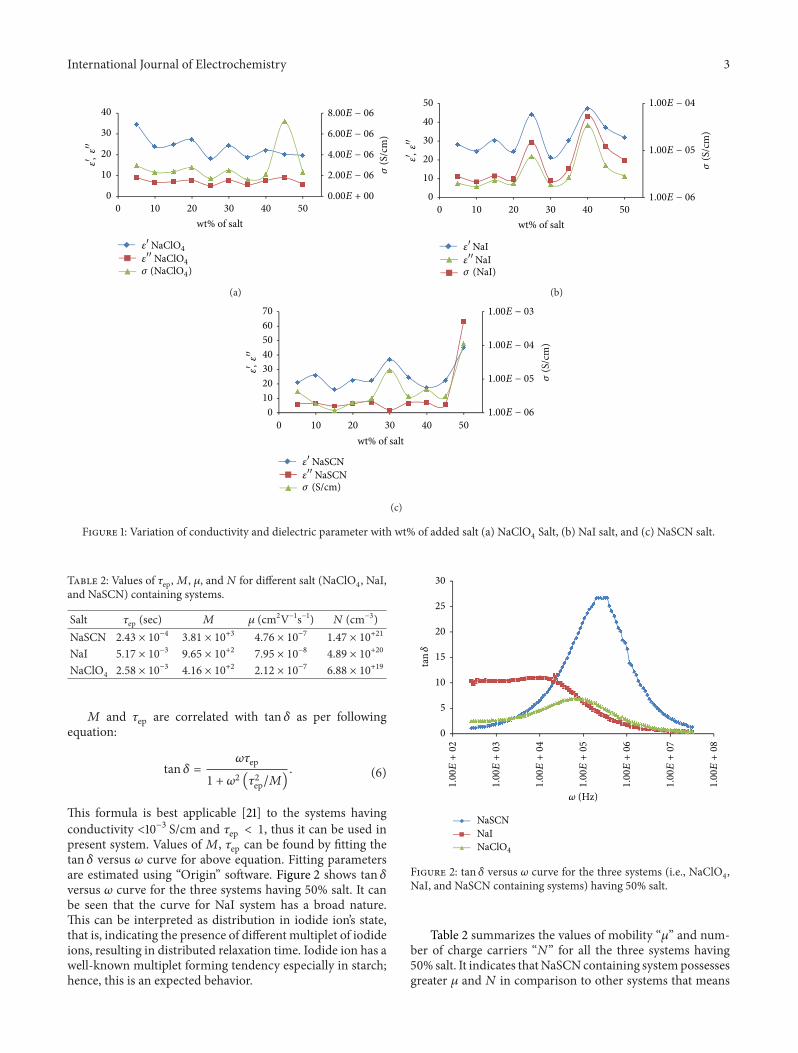
119872 and 120591ep are correlated with tan 120575 as per followingequation
tan 120575 =120596120591ep
1 + 1205962
(1205912
ep119872) (6)
This formula is best applicable [21] to the systems havingconductivity lt10minus3 Scm and 120591ep lt 1 thus it can be used inpresent system Values of119872 120591ep can be found by fitting thetan 120575 versus 120596 curve for above equation Fitting parametersare estimated using ldquoOriginrdquo software Figure 2 shows tan 120575versus 120596 curve for the three systems having 50 salt It canbe seen that the curve for NaI system has a broad natureThis can be interpreted as distribution in iodide ionrsquos statethat is indicating the presence of different multiplet of iodideions resulting in distributed relaxation time Iodide ion has awell-known multiplet forming tendency especially in starchhence this is an expected behavior
0
5
10
15
20
25
30
NaSCNNaI
100E+02
100E+03
100E+04
100E+05
100E+06
100E+07
100E+08
120596 (Hz)
tan120575
NaClO4
Figure 2 tan 120575 versus 120596 curve for the three systems (ie NaClO4
NaI and NaSCN containing systems) having 50 salt
Table 2 summarizes the values of mobility ldquo120583rdquo and num-ber of charge carriers ldquo119873rdquo for all the three systems having50 salt It indicates thatNaSCNcontaining systempossessesgreater 120583 and 119873 in comparison to other systems that means
4 International Journal of Electrochemistry
2 3 4 5 6 7 8
100E minus 03
100E minus 04
100E minus 05
100E minus 06
120590(Scm)
120590 5120590 10120590 15120590 20120590 25
120590 30120590 35120590 40120590 45120590 50
log 120596
(a)
2 3 4 5 6 7 8
100E minus 03
100E minus 02
100E minus 04
100E minus 05
100E minus 06
120590(Scm)
120590 5120590 10120590 15120590 20120590 25
120590 30120590 35120590 40120590 45120590 50
log120596
(b)
2 3 4 5 6 7 8
100E minus 03
100E minus 07
100E minus 04
100E minus 05
100E minus 06
120590(Scm)
120590 5120590 10120590 15120590 20120590 25
120590 30120590 35120590 40120590 45120590 50
log120596
(c)
Figure 3 Conductivity variations with frequency for different system (a) NaClO4
Salt (b) NaI salt and (c) NaSCN salt
the anion size not only controls the mobility of the systembut at the same time it affects the salt dissociation as wellHowever the mobility trend between NaI and NaClO
4
isreversed Though the single ClO
4
minus ion has greater anion sizethan the other two ions (SCNminus and Iminus) hence should havelowest mobility but possibly the greater size of Iminus multipletare responsible for reduced mobility in NaI system
32 Frequency Dependence of Conductivity Impedance datapresented in Conductivity formalism (120590 = 120590
0
+ 119860120596119899) is
a well-accepted technique to understand the ion dynamicsin disordered systems The value of exponent ldquo119899rdquo representsdifferent types of ion motion dominating in the system [22]For a very long period Universal Power Law [12 13 23] hasbeen followed as thumb rule according towhich exponent ldquo119899rdquocan have values lt1 and preferably ≃ 05ndash065 for conductingsystems This law was followed by almost all disorderedmaterials such as glasses conducting polymers and compos-ites [22] Recently many experimental data reported in theliterature have 119899 = 1 or gt1 and are known as Nearly ConstantLoss (NCL) and Super Linear Power Law (SLPL) respectivelyThough theories predicted these phenomena to occur inGHz range but experimentally exponent ldquo119899rdquo were reportedto have ge1 even in MHz range [14] theories for explaining
such behavior are still in their infancy [14ndash18 22] Exponentdepends upon frequency and it designates the ion dynamicsprevailing in that frequency range DC conductivity andion hopping occur at comparatively larger time scale (lowfrequency) whereas NCLSLPL is a lower time scale (higherfrequency) phenomena [24] and are represented by 119899 lt1 and 119899 ge 1 respectively All these are time dependenceand hence the ion movements are statistical in nature withparticular phenomenon dominating in specific frequencyregion and resulting in corresponding value of ldquo119899rdquo in thatfrequency region
Theoretically frequency dependence of conductivity willfollow a trend [15 22] given below from lower to higherfrequency (up to GHz frequency)
polarization 997888rarr dc conductivity (119899 sim 0)
997888rarr ion hopping (119899 sim 05)
997888rarr NCL (119899 = 1) 997888rarr SLPL (119899 gt 1)
(7)
The literature shows thatmoving beyond the SLPL regionconductivity achieves a plateau followed by dispersion infrequency gt GHz [22] which is not discussed here as itis beyond the scope of present work When studies havebeen carried out in wider frequency and temperature range
International Journal of Electrochemistry 5120590(Scm)
120596 (Hz)
1E minus 4
1E minus 5
1E minus 6
1E2 1E5 1E7
(a)
120590(Scm)
120596 (Hz)
1E minus 4
1E minus 5
1E7 2E7 3E7
(b)
120590(Scm)
120596 (Hz)1E4 1E5 1E6
1E minus 5
1E minus 6
(c)
Figure 4 (a) A typical fitting curve for 120590 = 1205900
+ 119860120596119899 along with the experimental points in complete frequency range (b) Fitting for the
same curve in the higher frequency range above the arrow marked in (a) (c) Fitting for the same curve in the lower frequency range belowthe arrow marked in (a)
universality of 120590 = 1205900
+ 119860120596119899 extend to nearly constant loss
type of behavior [14 15 25] But SLPL is reported only infew systems Different theoretical models are being devisedto explain NCLSLPL which are applicable to all material[14ndash18] but with limited success In a recent communicationTiwari and his co-worker [26] referring ADWP modelreported that the NCLSLPL phenomena can exist even atlow frequency decided by glass transition temperature andworking temperature together In the present system 119879
119892
isfound to be sim80∘C [27] hence according to Tiwari andShahi [26] at low temperature the power law exponent (119899 =1 + 119879119879
119892
) comes out to be sim18 which did not exactlymatch with experimental values but confirmed the SLPLtype phenomenon in present system A detail discussion ofconductivity power law in present system is given below
Figure 3 shows log120590 versus log120596 curve for present sys-tems As discussed above the value of exponent ldquo119899rdquo will havedifferent value varying from 0 to 2 in different frequencyregion As indicated by arrow in Figure 3 the polarization ispresent up to quite high frequency
Figure 4(a) shows the fitting curve for 120590 = 1205900
+ 119860120596119899
along with the experimental points in complete frequency
range excluding the polarization region The curve does notexactly fit according to the equation indicating the existenceof different ion dynamics Curve starts deviating at certainfrequency (as marked by arrow in present case) indicatingexistence of different fitting parameters above and below thisfrequency When the fitting was carried out separately intwo different frequency ranges it was quite good as shownin Figures 4(b) and 4(c) This resulted in two sets of fittingparameter in two different regions
Table 3 shows the values of exponent ldquo119899rdquo in differentfrequency ranges for the three salt systems We are gettingtwo different regions higher frequency region with 119899 gt 1indicating SLPL phenomenon mid frequency region with119899 ≃ 05 representing ion hoppingThere are many theoreticalattempts [14ndash18] to provide an explanation to the behavior butnone is completely successful
33 Frequency Dependence of Dielectric and Modulus ValuesDielectric parameters estimated at frequency 5MHz for thethree different salts are listed in Table 1 The anion size effectcould also be seen in these dataThe values are maximum forSCNminus and minimum for ClO
4
minus The variation of dielectric
6 International Journal of Electrochemistry
Table 3 Values of exponent ldquo119899rdquo in different frequencies (Ionhopping and SLPL) range for (a) NaClO4 (b) NaI and (c) NaSCNcontaining systems
(a) NaClO4
wt of SaltValue of exponent ldquo119899rdquo
Higher frequencyrange
Lower frequencyrange
5 177 05310 161 04915 153 05320 151 05125 151 05230 139 05235 147 04740 137 05445 146 03650 139 051
(b) NaI
wt of SaltValue of exponent ldquo119899rdquo
Higher frequencyrange
Lower frequencyrange
5 176 06010 168 06815 150 06520 147 05825 131 06230 140 06235 135 06540 150 04145 136 04150 138 057
(c) NaSCN
wt of SaltValue of exponent ldquo119899rdquo
Higher frequencyrange
Lower frequencyrange
5 146 05210 144 06315 141 05620 146 05425 136 04630 135 03035 147 03640 140 04845 168 05450 148 025
parameters follows the trend of conductivity variation withsalt concentration as shown in Figure 1
Superlinear power law is characterized by presence of ashallow to deep minima in dielectric loss spectra dependingupon the strength of SLPL behavior Hence for a crosscheck
Table 4 Values of relaxation peak frequency in imaginary part ofModulus versus frequency curve
wt of Salt Peak frequency (Hz) in11987210158401015840
NaSCN NaI NaClO4
5 1945000 1945000 246200010 1213000 756200 153600015 1536000 2462000 246200020 1213000 1078000 194500025 1213000 2462000 121300030 2771000 1945000 246200035 1078000 2462000 246200040 1365000 3118000 136500045 419100 2462000 246200050 Out of range 2462000 1078000
of the SLPL region discussed in Section 32 dielectric lossvariations with frequency have been studied Figures 5(a)and 5(b) represent the variation of 1205761015840 12057610158401015840 with frequency forone salt (NaI) These curves represent the typical polymerelectrolyte type of nature Curves in Figure 5(c) indicatetowards presence of a shallow minimum at high frequencywhen plotted in extended view for sodium iodide Similarcurves are also found for other two systems This confirmsour conclusion regarding the ion dynamics discussed inSection 32
The impedance data is further analyzed in terms ofelectrical modulus as depicted in Figures 6(a) and 6(b)Values of Electrical modulus have been calculated usingfollowing formulas
1198721015840
=
1205761015840
(12057610158401015840
2
+ 1205761015840
2
)
11987210158401015840
=
12057610158401015840
(12057610158401015840
2
+ 1205761015840
2
)
(8)
Relaxation peaks observed in 11987210158401015840 versus log120596 curves aresummarized in Table 4 Peaks shift with salt concentration inthe similar fashion as conductivity variation
4 Conclusion
Potato starch-based electrolyte systems doped with sodiumsalts of three different anion namely ClO
4
minus Iminus and SCNminushave been successfully prepared Anion size and conductivityfollow an inverse trend indicating systems to be predomi-nantly anionic conductor Anion size has an inverse effecton number of charge carriers All of the prepared mate-rials have 119905ion gt 099 confirming their electrolytic natureMultiplet formation tendency of iodide ion affected themobility trend SLPL is observed in studied frequency rangeat room temperature Anion size has affected the range of itsdominance which has been further confirmed by dielectricloss parameter variation with frequency
International Journal of Electrochemistry 7
2 3 4 5 6 7 8
100E + 06
100E + 05
100E + 04
100E + 03
100E + 02
100E + 01
120576998400
log120596
120576998400 5120576998400 10120576998400 15120576998400 20120576998400 25
120576998400 30120576998400 35120576998400 40120576998400 45120576998400 50
(a)
2 3 4 5 6 7 8
100E + 06
100E + 07
100E + 05
100E + 04
100E + 03
100E + 02
100E + 01
100E + 00
120576998400998400
log 120596
120576998400 5120576998400 10120576998400 15120576998400 20120576998400 25
120576998400 30120576998400 35120576998400 40120576998400 45120576998400 50
(b)
66 68 7 72 74 76
100E + 03
100E + 02
100E + 01
100E + 00
120576998400998400
log 120596
120576998400 5120576998400 10120576998400 15120576998400 20120576998400 25
120576998400 30120576998400 35120576998400 40120576998400 45120576998400 50
(c)
Figure 5 Variation of (a) real part and (b) imaginary part of dielectric parameter with frequency (c) Extended view of (b) at higher frequencyfor NaI
000050010015002002500300350040045005
2 3 4 5 6 7 8log 120596
M998400
M998400 30M998400 35M998400 40M998400 45M998400 50
M998400 5M998400 10M998400 15M998400 20M998400 25
(a)
0
0005
001
0015
002
0025
2 3 4 5 6 7 8log120596
M998400998400
M998400998400 5
M998400998400 25M998400998400 20M998400998400 15M998400998400 10
M998400998400 30
M998400998400 50M998400998400 45M998400998400 40M998400998400 35
(b)
Figure 6 Variation of (a) real part (b) imaginary part of electric modulus variation with frequency for NaI
8 International Journal of Electrochemistry
Acknowledgments
DST New Delhi is acknowledged for financial supportto the project ldquoDevelopment of sodium ion conductingmdashelectrochemical applicationrdquo (DST reference no SRS2CMP00652007 dated 08042008) Instruments procured inthe project are used in the present work
References
[1] M B Armand J M Chabango andM Duclot Second Interna-tionalMeeting on Solid Electrolytes St Andrews UK Universityof St Andrews edition 1978
[2] T Basu M M Goswami T R Middya and S TarafdarldquoMorphology and ion-conductivity of gelatin-LiClO
4
filmsfractional diffusion analysisrdquo Journal of Physical Chemistry Bvol 116 no 36 pp 11362ndash11369 2012
[3] R Singh B Bhattacharya N A Jadhav S Majmudar and PK Singh ldquoNovel biopolymer gel electrolyte for dye-sensitizedsolar cell applicationrdquo Carbohydrate Polymer vol 91 no 2 pp682ndash685 2012
[4] V L Finkenstadt ldquoNatural polysaccharides as electroactivepolymersrdquo Applied Microbiology and Biotechnology vol 67 no6 pp 735ndash745 2005
[5] V L Finkenstadt and J L Willett ldquoElectroactive materialscomposed of starchrdquo Journal of Polymers and the Environmentvol 12 no 2 pp 43ndash46 2004
[6] D F Vieira C O Avellaneda and A Pawlicka ldquoConductivitystudy of a gelatin-based polymer electrolyterdquo ElectrochimicaActa vol 53 no 4 pp 1404ndash1408 2007
[7] R G F Costa C O Avellaneda A Pawlicka S Heusingand M A Aegerter ldquoOptoelectrochemical characterization ofelectrochromic devices with starch based solid electrolytesrdquoMolecular Crystals and Liquid Crystals vol 447 pp 45ndash53 2006
[8] W Ning Z Xingxiang L Haihui and H Benqiao ldquo1-Allyl-3-methylimidazolium chloride plasticized-corn starch as solidbiopolymer electrolytesrdquo Carbohydrate Polymers vol 76 no 3pp 482ndash484 2009
[9] T Tiwari N Srivastava and P C Srivastava ldquoElectrical trans-port study of potato starch-based electrolyte systemrdquo Ionics vol17 no 4 pp 353ndash360 2011
[10] M Kumar T Tiwari and N Srivastava ldquoElectrical trans-port behaviour of bio-polymer electrolyte system potatostarch + ammonium iodiderdquoCarbohydrate Polymers vol 88 no1 pp 54ndash60 2012
[11] A K Jonscher ldquoThe ldquouniversalrdquo dielectric responserdquo Naturevol 267 no 5613 pp 673ndash679 1977
[12] A K Jonscher The Universal Dielectric Response A Reviewof Data Their New Interpretation Chelsea Dielectrics GroupLondon UK 1978
[13] D P Almond G K Duncan and A R West ldquoThe determi-nation of hopping rates and carrier concentrations in ionicconductors by a new analysis of ac conductivityrdquo Solid StateIonics vol 8 no 2 pp 159ndash164 1983
[14] J P Tiwari and K Shahi ldquoIon dynamics in mechanochemicallysynthesized amorphous fast ionic conductor Ag
2
SndashSb2
S3
rdquo SolidState Ionics vol 176 no 13-14 pp 1271ndash1280 2005
[15] S Ke H Huang S Yu and L Zhou ldquoCrossover from anearly constant loss to a superlinear power-law behavior inMn-doped Bi(Mg
12
Ti12
)O3
ndashPbTiO3
ferroelectricsrdquo Journal ofApplied Physics vol 107 no 8 Article ID 084112 4 pages 2010
[16] C Cramer and M Buscher ldquoComplete conductivity spectra offast ion conducting silver iodidesilver selenate glassesrdquo SolidState Ionics vol 105 no 1ndash4 pp 109ndash120 1998
[17] S R Elliott ldquoFrequency-dependent conductivity in ionicallyand electronically conducting amorphous solidsrdquo Solid StateIonics vol 70-71 no 1 pp 27ndash40 1994
[18] P Lunkenheimer T Gotzfried R Fichtl et al ldquoApparent giantdielectric constants dielectric relaxation and ac-conductivityof hexagonal perovskites La
12
Sr27
BO733
(B =Ru Ir)rdquo Journalof Solid State Chemistry vol 179 no 12 pp 3965ndash3973 2006
[19] S S Sekhon and S Chandra ldquoMixed cation effect in silverborate ion conducting glassrdquo Journal of Materials Science vol34 no 12 pp 2899ndash2902 1999
[20] J Evans C A Vincent and P G Bruce ldquoElectrochemicalmeasurement of transference numbers in polymer electrolytesrdquoPolymer vol 28 no 13 pp 2324ndash2328 1987
[21] R J Klein S Zhang S Dou B H Jones R H Colbyand J Runt ldquoModeling electrode polarization in dielectricspectroscopy ion mobility and mobile ion concentration ofsingle-ion polymer electrolytesrdquo Journal of Chemical Physicsvol 124 no 14 Article ID 144903 8 pages 2006
[22] P Lunkenheimer and A Loidl ldquoResponse of disordered matterto electromagnetic fieldsrdquoPhysical Review Letters vol 91 no 20Article ID 207601 4 pages 2003
[23] A K Jonscher Dielectric Relaxation in Solids ChelseaDielectrics Press London UK 1983
[24] I Sakellis ldquoOn the origin of time-temperature superposition indisordered solidsrdquo Applied Physics Letters vol 98 no 7 ArticleID 072904 3 pages 2011
[25] B Roling C Martiny and S Murugavel ldquoIonic conductionin glass new information on the interrelation between theldquojonscher behaviorrdquo and the ldquonearly constant-loss behaviorrdquofrom broadband conductivity spectrardquo Physical Review Lettersvol 87 no 8 Article ID 085901 4 pages 2001
[26] J P Tiwari and K Shahi ldquoSuper-linear frequency dependenceof ac conductivity of disordered Ag
2
SndashSb2
S3
at cryogenictemperaturesrdquo Philosophical Magazine vol 87 no 29 pp 4475ndash4500 2007
[27] T Tiwari M Kumar N Srivastava and P C SrivastavaldquoElectrical transport study of potato starch-based electrolytesystemmdashIIrdquoMaterials Science and Engineering B 2013
Impact Factor 173028 Days Fast Track Peer ReviewAll Subject Areas of ScienceSubmit at httpwwwtswjcom
Hindawi Publishing Corporation httpwwwhindawicom Volume 2013Hindawi Publishing Corporation httpwwwhindawicom Volume 2013
The Scientific World Journal
2 International Journal of Electrochemistry
are estimated from dielectric data to understand the effectof anion size
2 Experimental Details
21 Material Preparation Potato starch (PS) (C6
H10
O5
)119899
NaI NaSCN NaClO
4
Glutaraldehyde (GA) (C5
H8
O2
) andPolyethylene glycol 300 (PEG) all from Loba Chemie wereused to prepare material with distilled water as solventThreeseries of samples (ie with three different salts) were preparedusing solution cast technique at 30∘C For 1 gm of starchsim10of PEG (017 gm or 5 drops) sodium salt (5 to 50 of PS) and2mLGAwere taken together in distilledwaterMixtureswerestirred at 30∘Conmagnetic stirrer for one hour and heated tillit dry Samples were in film form which was cut in to piecesfor study
22 Devices and Technique AC conductivity is measuredby computer controlled HIOKI HiTester LCR meter (3532-50) in the range 42Hz to 5 times 106Hz Ionic transferencenumber of the material is estimated by dc polarizationmethod using Keithley DMM 2100 Silver foils are used aselectrode Dielectric and Modulus data are estimated fromthe impedance spectra
3 Results and Discussion
31 Transference Number and Electrical Conductivity Thesimplest method to establish electrochemical nature is themeasurement of ionic transference number (119905ion) It repre-sents the fractional contribution of ionic charge carrier tothe total electrical conductivity In the present case thisparameter is estimated by dc polarization method [19]In the procedure 02 V potential was applied across theAgelectrolyteAg and current was monitored as a functionof time On the application of voltage current decreasedwith time and after some time it became constant as theelectrolyte was depleted of charge carrier 119905ion is estimatedusing following formula
119905ion =119894initial minus 119894final119894initial
(1)
where 119894initial is the initial current flown and 119894final is the valueof final saturated current This 119905ion gives the total ioniccontribution to conductivity For all the three systems 119905ionhas value sim099 which indicates the electrolytic nature ofpreparedmaterials To separate cationicanionic transferencenumber combined acdc method [20] was used Themethod is similar to that described above with the onlydifference that the blocking electrodes were replaced bynonblocking one 119905cation can be estimated from the cole-coleplot and polarization curve In the present case anticipatingthe movement of both the ions (sodiumiodide) Na-Hgamalgam was used as a nonblocking electrode to separatethe 119905Na+ The success was not achieved in present case sincewater absorbed in the starch matrix started reacting with theamalgam and the experiment failed But as water is available
Table 1 Values of conductivity and dielectric parameters fordifferent salt (NaClO4 NaI NaSCN) containing systems along withthe salt anion size
Anion Size (pm) 120590max (Scm) 1205761015840
12057610158401015840
ClO4minus 250 719 times 10
minus6 198 597Iminus 220 122 times 10
minus5 318 113SCNminus 213 112 times 10
minus4 452 635
in starchmatrix the effect of proton and hydroxyl ions on theconductivity of the system cannot be fully ruled out
Conductivity (120590) has been calculated using sampledimension ldquo119871rdquo and electrode area ldquo119860rdquo with the help offormula
120590 =
1
1198851015840
119871
119860
(2)
where 1198851015840 is intercept on real axis of 11988510158401015840 versus 1198851015840 plotsobtained in frequency range 42Hz to 5MHz
In polymer-salt composites conductivity varies withaddition of salt and passes through maxima and minimaTherefore it indicates that in polymer-salt systems dissocia-tion of salt and the number of available charge carrier are notdirectly related to the amount of salt added Instead columbicinteraction among them together with their interaction withthe matrix plays an important role
Figure 1 shows the conductivity (120590) versus wt of saltcurves for all the three systems The variation for all thethree systems were following the similar trends as reportedfor other polymer-salt complex systems The NaSCN dopedsystem exhibit maximum conductivity (112 times 10minus4 Scm)whereas NaClO
4
system exhibited the lowest one (719 times10minus6 Scm) It indicates that the conductivity is following a
trend given as follows
120590SCNminus
gt 120590Iminus
gt 120590ClO4
minus
(3)
Table 1 shows anion size and corresponding highest con-ductivity values of different salt mixed systems Conductivityis inversely following anion size indicating dominance ofanions as charge carriers in the systems
Systems are further analyzed in terms of number ofmobile charge carrier ldquo119873rdquo andmobility ldquo120583rdquo Conductivity canbe represented as
120590 = 119873119902120583 (4)
where 119873 is number of mobile charge carrier 119902 is charge oncarrier and 120583 is the mobility of the system Mobility of anysystem can be given as
120583 =
1199021198712
4119872120591ep119896119879 (5)
where 119902 is charge on carrier 119871 is sample thickness 119872 isdefined as the ratio of the sample thickness to twice theDebyelength 120591ep is relaxation time in presence of polarization [21]
International Journal of Electrochemistry 3
0
10
20
30
40
0 10 20 30 40 50wt of salt
120576998400 120576
998400998400
120576998400
120576998400998400
120590(S
cm
)
800E minus 06
600E minus 06
400E minus 06
200E minus 06
000E + 00
NaClO4
NaClO4
120590 (NaClO4)
(a)
0
10
20
30
40
50
0 10 20 30 40 50wt of salt
120576998400 120576
998400998400
120576998400 NaI120576998400998400 NaI120590 (NaI)
120590(S
cm
)
100E minus 04
100E minus 05
100E minus 06
(b)
010203040506070
0 10 20 30 40 50wt of salt
120576998400 120576
998400998400
120576998400 NaSCN120576998400998400 NaSCN120590 (Scm)
120590(S
cm
)
100E minus 03
100E minus 04
100E minus 05
100E minus 06
(c)
Figure 1 Variation of conductivity and dielectric parameter with wt of added salt (a) NaClO4
Salt (b) NaI salt and (c) NaSCN salt
Table 2 Values of 120591ep119872 120583 and119873 for different salt (NaClO4 NaIand NaSCN) containing systems
Salt 120591ep (sec) 119872 120583 (cm2Vminus1sminus1) 119873 (cmminus3)NaSCN 243 times 10minus4 381 times 10+3 476 times 10minus7 147 times 10+21
NaI 517 times 10minus3
965 times 10+2
795 times 10minus8
489 times 10+20
NaClO4 258 times 10minus3
416 times 10+2
212 times 10minus7
688 times 10+19
119872 and 120591ep are correlated with tan 120575 as per followingequation
tan 120575 =120596120591ep
1 + 1205962
(1205912
ep119872) (6)
This formula is best applicable [21] to the systems havingconductivity lt10minus3 Scm and 120591ep lt 1 thus it can be used inpresent system Values of119872 120591ep can be found by fitting thetan 120575 versus 120596 curve for above equation Fitting parametersare estimated using ldquoOriginrdquo software Figure 2 shows tan 120575versus 120596 curve for the three systems having 50 salt It canbe seen that the curve for NaI system has a broad natureThis can be interpreted as distribution in iodide ionrsquos statethat is indicating the presence of different multiplet of iodideions resulting in distributed relaxation time Iodide ion has awell-known multiplet forming tendency especially in starchhence this is an expected behavior
0
5
10
15
20
25
30
NaSCNNaI
100E+02
100E+03
100E+04
100E+05
100E+06
100E+07
100E+08
120596 (Hz)
tan120575
NaClO4
Figure 2 tan 120575 versus 120596 curve for the three systems (ie NaClO4
NaI and NaSCN containing systems) having 50 salt
Table 2 summarizes the values of mobility ldquo120583rdquo and num-ber of charge carriers ldquo119873rdquo for all the three systems having50 salt It indicates thatNaSCNcontaining systempossessesgreater 120583 and 119873 in comparison to other systems that means
4 International Journal of Electrochemistry
2 3 4 5 6 7 8
100E minus 03
100E minus 04
100E minus 05
100E minus 06
120590(Scm)
120590 5120590 10120590 15120590 20120590 25
120590 30120590 35120590 40120590 45120590 50
log 120596
(a)
2 3 4 5 6 7 8
100E minus 03
100E minus 02
100E minus 04
100E minus 05
100E minus 06
120590(Scm)
120590 5120590 10120590 15120590 20120590 25
120590 30120590 35120590 40120590 45120590 50
log120596
(b)
2 3 4 5 6 7 8
100E minus 03
100E minus 07
100E minus 04
100E minus 05
100E minus 06
120590(Scm)
120590 5120590 10120590 15120590 20120590 25
120590 30120590 35120590 40120590 45120590 50
log120596
(c)
Figure 3 Conductivity variations with frequency for different system (a) NaClO4
Salt (b) NaI salt and (c) NaSCN salt
the anion size not only controls the mobility of the systembut at the same time it affects the salt dissociation as wellHowever the mobility trend between NaI and NaClO
4
isreversed Though the single ClO
4
minus ion has greater anion sizethan the other two ions (SCNminus and Iminus) hence should havelowest mobility but possibly the greater size of Iminus multipletare responsible for reduced mobility in NaI system
32 Frequency Dependence of Conductivity Impedance datapresented in Conductivity formalism (120590 = 120590
0
+ 119860120596119899) is
a well-accepted technique to understand the ion dynamicsin disordered systems The value of exponent ldquo119899rdquo representsdifferent types of ion motion dominating in the system [22]For a very long period Universal Power Law [12 13 23] hasbeen followed as thumb rule according towhich exponent ldquo119899rdquocan have values lt1 and preferably ≃ 05ndash065 for conductingsystems This law was followed by almost all disorderedmaterials such as glasses conducting polymers and compos-ites [22] Recently many experimental data reported in theliterature have 119899 = 1 or gt1 and are known as Nearly ConstantLoss (NCL) and Super Linear Power Law (SLPL) respectivelyThough theories predicted these phenomena to occur inGHz range but experimentally exponent ldquo119899rdquo were reportedto have ge1 even in MHz range [14] theories for explaining
such behavior are still in their infancy [14ndash18 22] Exponentdepends upon frequency and it designates the ion dynamicsprevailing in that frequency range DC conductivity andion hopping occur at comparatively larger time scale (lowfrequency) whereas NCLSLPL is a lower time scale (higherfrequency) phenomena [24] and are represented by 119899 lt1 and 119899 ge 1 respectively All these are time dependenceand hence the ion movements are statistical in nature withparticular phenomenon dominating in specific frequencyregion and resulting in corresponding value of ldquo119899rdquo in thatfrequency region
Theoretically frequency dependence of conductivity willfollow a trend [15 22] given below from lower to higherfrequency (up to GHz frequency)
polarization 997888rarr dc conductivity (119899 sim 0)
997888rarr ion hopping (119899 sim 05)
997888rarr NCL (119899 = 1) 997888rarr SLPL (119899 gt 1)
(7)
The literature shows thatmoving beyond the SLPL regionconductivity achieves a plateau followed by dispersion infrequency gt GHz [22] which is not discussed here as itis beyond the scope of present work When studies havebeen carried out in wider frequency and temperature range
International Journal of Electrochemistry 5120590(Scm)
120596 (Hz)
1E minus 4
1E minus 5
1E minus 6
1E2 1E5 1E7
(a)
120590(Scm)
120596 (Hz)
1E minus 4
1E minus 5
1E7 2E7 3E7
(b)
120590(Scm)
120596 (Hz)1E4 1E5 1E6
1E minus 5
1E minus 6
(c)
Figure 4 (a) A typical fitting curve for 120590 = 1205900
+ 119860120596119899 along with the experimental points in complete frequency range (b) Fitting for the
same curve in the higher frequency range above the arrow marked in (a) (c) Fitting for the same curve in the lower frequency range belowthe arrow marked in (a)
universality of 120590 = 1205900
+ 119860120596119899 extend to nearly constant loss
type of behavior [14 15 25] But SLPL is reported only infew systems Different theoretical models are being devisedto explain NCLSLPL which are applicable to all material[14ndash18] but with limited success In a recent communicationTiwari and his co-worker [26] referring ADWP modelreported that the NCLSLPL phenomena can exist even atlow frequency decided by glass transition temperature andworking temperature together In the present system 119879
119892
isfound to be sim80∘C [27] hence according to Tiwari andShahi [26] at low temperature the power law exponent (119899 =1 + 119879119879
119892
) comes out to be sim18 which did not exactlymatch with experimental values but confirmed the SLPLtype phenomenon in present system A detail discussion ofconductivity power law in present system is given below
Figure 3 shows log120590 versus log120596 curve for present sys-tems As discussed above the value of exponent ldquo119899rdquo will havedifferent value varying from 0 to 2 in different frequencyregion As indicated by arrow in Figure 3 the polarization ispresent up to quite high frequency
Figure 4(a) shows the fitting curve for 120590 = 1205900
+ 119860120596119899
along with the experimental points in complete frequency
range excluding the polarization region The curve does notexactly fit according to the equation indicating the existenceof different ion dynamics Curve starts deviating at certainfrequency (as marked by arrow in present case) indicatingexistence of different fitting parameters above and below thisfrequency When the fitting was carried out separately intwo different frequency ranges it was quite good as shownin Figures 4(b) and 4(c) This resulted in two sets of fittingparameter in two different regions
Table 3 shows the values of exponent ldquo119899rdquo in differentfrequency ranges for the three salt systems We are gettingtwo different regions higher frequency region with 119899 gt 1indicating SLPL phenomenon mid frequency region with119899 ≃ 05 representing ion hoppingThere are many theoreticalattempts [14ndash18] to provide an explanation to the behavior butnone is completely successful
33 Frequency Dependence of Dielectric and Modulus ValuesDielectric parameters estimated at frequency 5MHz for thethree different salts are listed in Table 1 The anion size effectcould also be seen in these dataThe values are maximum forSCNminus and minimum for ClO
4
minus The variation of dielectric
6 International Journal of Electrochemistry
Table 3 Values of exponent ldquo119899rdquo in different frequencies (Ionhopping and SLPL) range for (a) NaClO4 (b) NaI and (c) NaSCNcontaining systems
(a) NaClO4
wt of SaltValue of exponent ldquo119899rdquo
Higher frequencyrange
Lower frequencyrange
5 177 05310 161 04915 153 05320 151 05125 151 05230 139 05235 147 04740 137 05445 146 03650 139 051
(b) NaI
wt of SaltValue of exponent ldquo119899rdquo
Higher frequencyrange
Lower frequencyrange
5 176 06010 168 06815 150 06520 147 05825 131 06230 140 06235 135 06540 150 04145 136 04150 138 057
(c) NaSCN
wt of SaltValue of exponent ldquo119899rdquo
Higher frequencyrange
Lower frequencyrange
5 146 05210 144 06315 141 05620 146 05425 136 04630 135 03035 147 03640 140 04845 168 05450 148 025
parameters follows the trend of conductivity variation withsalt concentration as shown in Figure 1
Superlinear power law is characterized by presence of ashallow to deep minima in dielectric loss spectra dependingupon the strength of SLPL behavior Hence for a crosscheck
Table 4 Values of relaxation peak frequency in imaginary part ofModulus versus frequency curve
wt of Salt Peak frequency (Hz) in11987210158401015840
NaSCN NaI NaClO4
5 1945000 1945000 246200010 1213000 756200 153600015 1536000 2462000 246200020 1213000 1078000 194500025 1213000 2462000 121300030 2771000 1945000 246200035 1078000 2462000 246200040 1365000 3118000 136500045 419100 2462000 246200050 Out of range 2462000 1078000
of the SLPL region discussed in Section 32 dielectric lossvariations with frequency have been studied Figures 5(a)and 5(b) represent the variation of 1205761015840 12057610158401015840 with frequency forone salt (NaI) These curves represent the typical polymerelectrolyte type of nature Curves in Figure 5(c) indicatetowards presence of a shallow minimum at high frequencywhen plotted in extended view for sodium iodide Similarcurves are also found for other two systems This confirmsour conclusion regarding the ion dynamics discussed inSection 32
The impedance data is further analyzed in terms ofelectrical modulus as depicted in Figures 6(a) and 6(b)Values of Electrical modulus have been calculated usingfollowing formulas
1198721015840
=
1205761015840
(12057610158401015840
2
+ 1205761015840
2
)
11987210158401015840
=
12057610158401015840
(12057610158401015840
2
+ 1205761015840
2
)
(8)
Relaxation peaks observed in 11987210158401015840 versus log120596 curves aresummarized in Table 4 Peaks shift with salt concentration inthe similar fashion as conductivity variation
4 Conclusion
Potato starch-based electrolyte systems doped with sodiumsalts of three different anion namely ClO
4
minus Iminus and SCNminushave been successfully prepared Anion size and conductivityfollow an inverse trend indicating systems to be predomi-nantly anionic conductor Anion size has an inverse effecton number of charge carriers All of the prepared mate-rials have 119905ion gt 099 confirming their electrolytic natureMultiplet formation tendency of iodide ion affected themobility trend SLPL is observed in studied frequency rangeat room temperature Anion size has affected the range of itsdominance which has been further confirmed by dielectricloss parameter variation with frequency
International Journal of Electrochemistry 7
2 3 4 5 6 7 8
100E + 06
100E + 05
100E + 04
100E + 03
100E + 02
100E + 01
120576998400
log120596
120576998400 5120576998400 10120576998400 15120576998400 20120576998400 25
120576998400 30120576998400 35120576998400 40120576998400 45120576998400 50
(a)
2 3 4 5 6 7 8
100E + 06
100E + 07
100E + 05
100E + 04
100E + 03
100E + 02
100E + 01
100E + 00
120576998400998400
log 120596
120576998400 5120576998400 10120576998400 15120576998400 20120576998400 25
120576998400 30120576998400 35120576998400 40120576998400 45120576998400 50
(b)
66 68 7 72 74 76
100E + 03
100E + 02
100E + 01
100E + 00
120576998400998400
log 120596
120576998400 5120576998400 10120576998400 15120576998400 20120576998400 25
120576998400 30120576998400 35120576998400 40120576998400 45120576998400 50
(c)
Figure 5 Variation of (a) real part and (b) imaginary part of dielectric parameter with frequency (c) Extended view of (b) at higher frequencyfor NaI
000050010015002002500300350040045005
2 3 4 5 6 7 8log 120596
M998400
M998400 30M998400 35M998400 40M998400 45M998400 50
M998400 5M998400 10M998400 15M998400 20M998400 25
(a)
0
0005
001
0015
002
0025
2 3 4 5 6 7 8log120596
M998400998400
M998400998400 5
M998400998400 25M998400998400 20M998400998400 15M998400998400 10
M998400998400 30
M998400998400 50M998400998400 45M998400998400 40M998400998400 35
(b)
Figure 6 Variation of (a) real part (b) imaginary part of electric modulus variation with frequency for NaI
8 International Journal of Electrochemistry
Acknowledgments
DST New Delhi is acknowledged for financial supportto the project ldquoDevelopment of sodium ion conductingmdashelectrochemical applicationrdquo (DST reference no SRS2CMP00652007 dated 08042008) Instruments procured inthe project are used in the present work
References
[1] M B Armand J M Chabango andM Duclot Second Interna-tionalMeeting on Solid Electrolytes St Andrews UK Universityof St Andrews edition 1978
[2] T Basu M M Goswami T R Middya and S TarafdarldquoMorphology and ion-conductivity of gelatin-LiClO
4
filmsfractional diffusion analysisrdquo Journal of Physical Chemistry Bvol 116 no 36 pp 11362ndash11369 2012
[3] R Singh B Bhattacharya N A Jadhav S Majmudar and PK Singh ldquoNovel biopolymer gel electrolyte for dye-sensitizedsolar cell applicationrdquo Carbohydrate Polymer vol 91 no 2 pp682ndash685 2012
[4] V L Finkenstadt ldquoNatural polysaccharides as electroactivepolymersrdquo Applied Microbiology and Biotechnology vol 67 no6 pp 735ndash745 2005
[5] V L Finkenstadt and J L Willett ldquoElectroactive materialscomposed of starchrdquo Journal of Polymers and the Environmentvol 12 no 2 pp 43ndash46 2004
[6] D F Vieira C O Avellaneda and A Pawlicka ldquoConductivitystudy of a gelatin-based polymer electrolyterdquo ElectrochimicaActa vol 53 no 4 pp 1404ndash1408 2007
[7] R G F Costa C O Avellaneda A Pawlicka S Heusingand M A Aegerter ldquoOptoelectrochemical characterization ofelectrochromic devices with starch based solid electrolytesrdquoMolecular Crystals and Liquid Crystals vol 447 pp 45ndash53 2006
[8] W Ning Z Xingxiang L Haihui and H Benqiao ldquo1-Allyl-3-methylimidazolium chloride plasticized-corn starch as solidbiopolymer electrolytesrdquo Carbohydrate Polymers vol 76 no 3pp 482ndash484 2009
[9] T Tiwari N Srivastava and P C Srivastava ldquoElectrical trans-port study of potato starch-based electrolyte systemrdquo Ionics vol17 no 4 pp 353ndash360 2011
[10] M Kumar T Tiwari and N Srivastava ldquoElectrical trans-port behaviour of bio-polymer electrolyte system potatostarch + ammonium iodiderdquoCarbohydrate Polymers vol 88 no1 pp 54ndash60 2012
[11] A K Jonscher ldquoThe ldquouniversalrdquo dielectric responserdquo Naturevol 267 no 5613 pp 673ndash679 1977
[12] A K Jonscher The Universal Dielectric Response A Reviewof Data Their New Interpretation Chelsea Dielectrics GroupLondon UK 1978
[13] D P Almond G K Duncan and A R West ldquoThe determi-nation of hopping rates and carrier concentrations in ionicconductors by a new analysis of ac conductivityrdquo Solid StateIonics vol 8 no 2 pp 159ndash164 1983
[14] J P Tiwari and K Shahi ldquoIon dynamics in mechanochemicallysynthesized amorphous fast ionic conductor Ag
2
SndashSb2
S3
rdquo SolidState Ionics vol 176 no 13-14 pp 1271ndash1280 2005
[15] S Ke H Huang S Yu and L Zhou ldquoCrossover from anearly constant loss to a superlinear power-law behavior inMn-doped Bi(Mg
12
Ti12
)O3
ndashPbTiO3
ferroelectricsrdquo Journal ofApplied Physics vol 107 no 8 Article ID 084112 4 pages 2010
[16] C Cramer and M Buscher ldquoComplete conductivity spectra offast ion conducting silver iodidesilver selenate glassesrdquo SolidState Ionics vol 105 no 1ndash4 pp 109ndash120 1998
[17] S R Elliott ldquoFrequency-dependent conductivity in ionicallyand electronically conducting amorphous solidsrdquo Solid StateIonics vol 70-71 no 1 pp 27ndash40 1994
[18] P Lunkenheimer T Gotzfried R Fichtl et al ldquoApparent giantdielectric constants dielectric relaxation and ac-conductivityof hexagonal perovskites La
12
Sr27
BO733
(B =Ru Ir)rdquo Journalof Solid State Chemistry vol 179 no 12 pp 3965ndash3973 2006
[19] S S Sekhon and S Chandra ldquoMixed cation effect in silverborate ion conducting glassrdquo Journal of Materials Science vol34 no 12 pp 2899ndash2902 1999
[20] J Evans C A Vincent and P G Bruce ldquoElectrochemicalmeasurement of transference numbers in polymer electrolytesrdquoPolymer vol 28 no 13 pp 2324ndash2328 1987
[21] R J Klein S Zhang S Dou B H Jones R H Colbyand J Runt ldquoModeling electrode polarization in dielectricspectroscopy ion mobility and mobile ion concentration ofsingle-ion polymer electrolytesrdquo Journal of Chemical Physicsvol 124 no 14 Article ID 144903 8 pages 2006
[22] P Lunkenheimer and A Loidl ldquoResponse of disordered matterto electromagnetic fieldsrdquoPhysical Review Letters vol 91 no 20Article ID 207601 4 pages 2003
[23] A K Jonscher Dielectric Relaxation in Solids ChelseaDielectrics Press London UK 1983
[24] I Sakellis ldquoOn the origin of time-temperature superposition indisordered solidsrdquo Applied Physics Letters vol 98 no 7 ArticleID 072904 3 pages 2011
[25] B Roling C Martiny and S Murugavel ldquoIonic conductionin glass new information on the interrelation between theldquojonscher behaviorrdquo and the ldquonearly constant-loss behaviorrdquofrom broadband conductivity spectrardquo Physical Review Lettersvol 87 no 8 Article ID 085901 4 pages 2001
[26] J P Tiwari and K Shahi ldquoSuper-linear frequency dependenceof ac conductivity of disordered Ag
2
SndashSb2
S3
at cryogenictemperaturesrdquo Philosophical Magazine vol 87 no 29 pp 4475ndash4500 2007
[27] T Tiwari M Kumar N Srivastava and P C SrivastavaldquoElectrical transport study of potato starch-based electrolytesystemmdashIIrdquoMaterials Science and Engineering B 2013
Impact Factor 173028 Days Fast Track Peer ReviewAll Subject Areas of ScienceSubmit at httpwwwtswjcom
Hindawi Publishing Corporation httpwwwhindawicom Volume 2013Hindawi Publishing Corporation httpwwwhindawicom Volume 2013
The Scientific World Journal
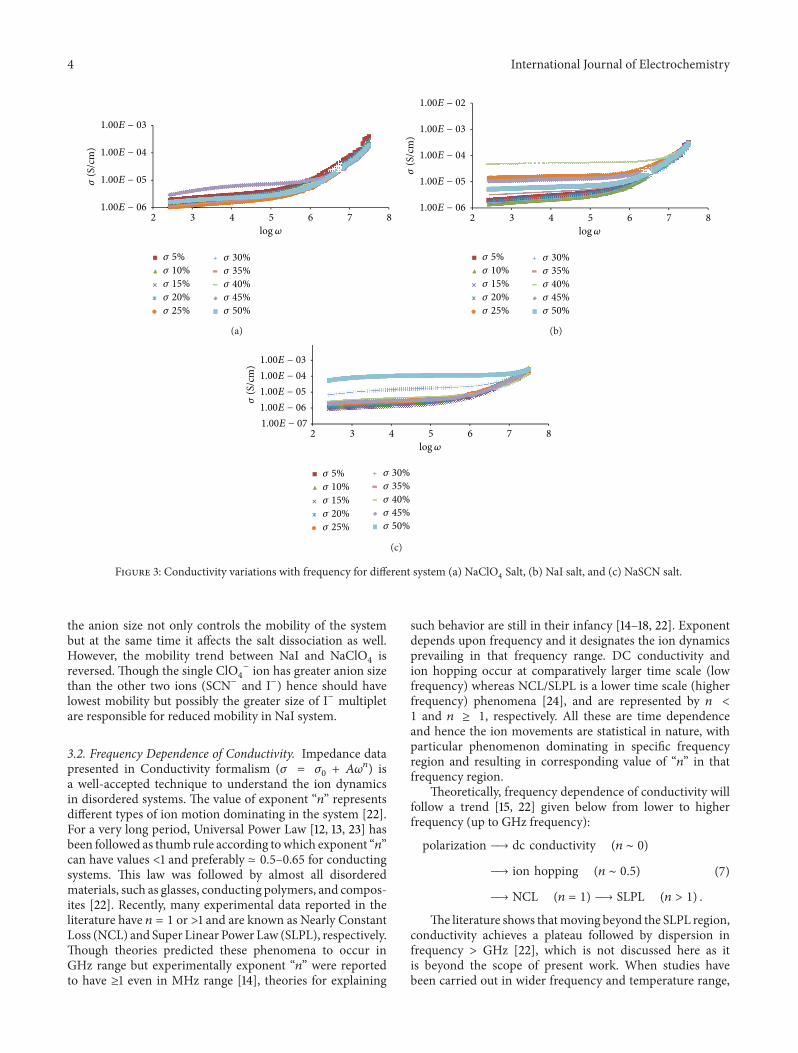
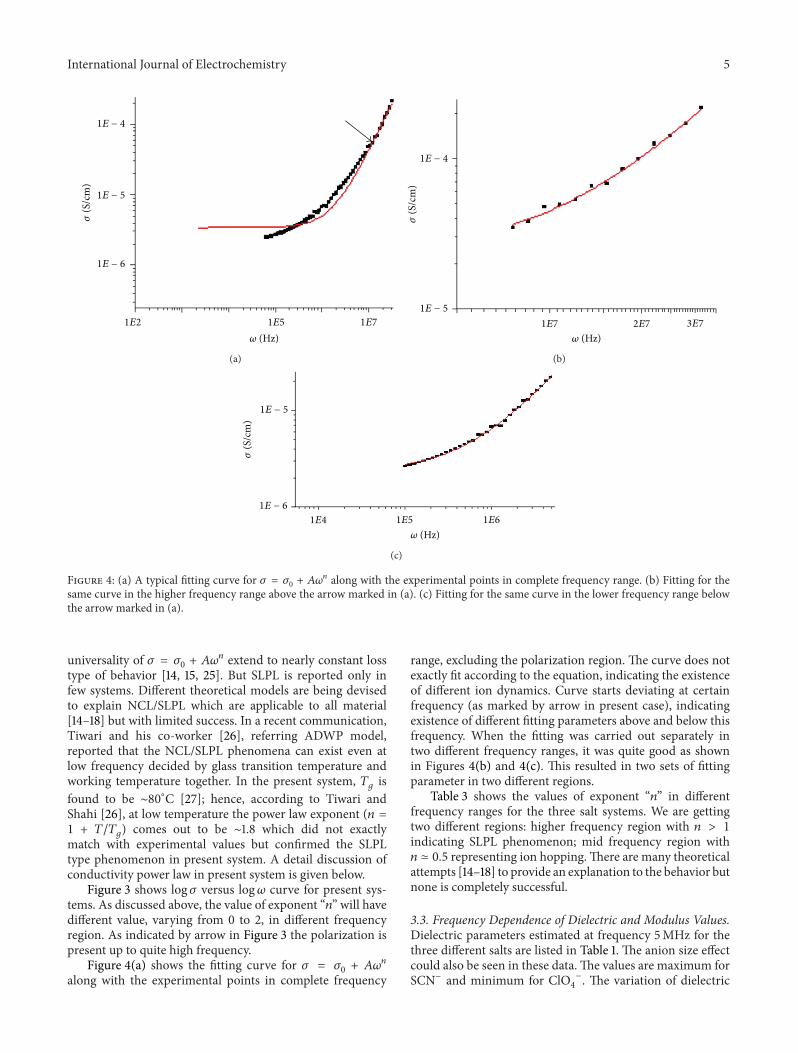
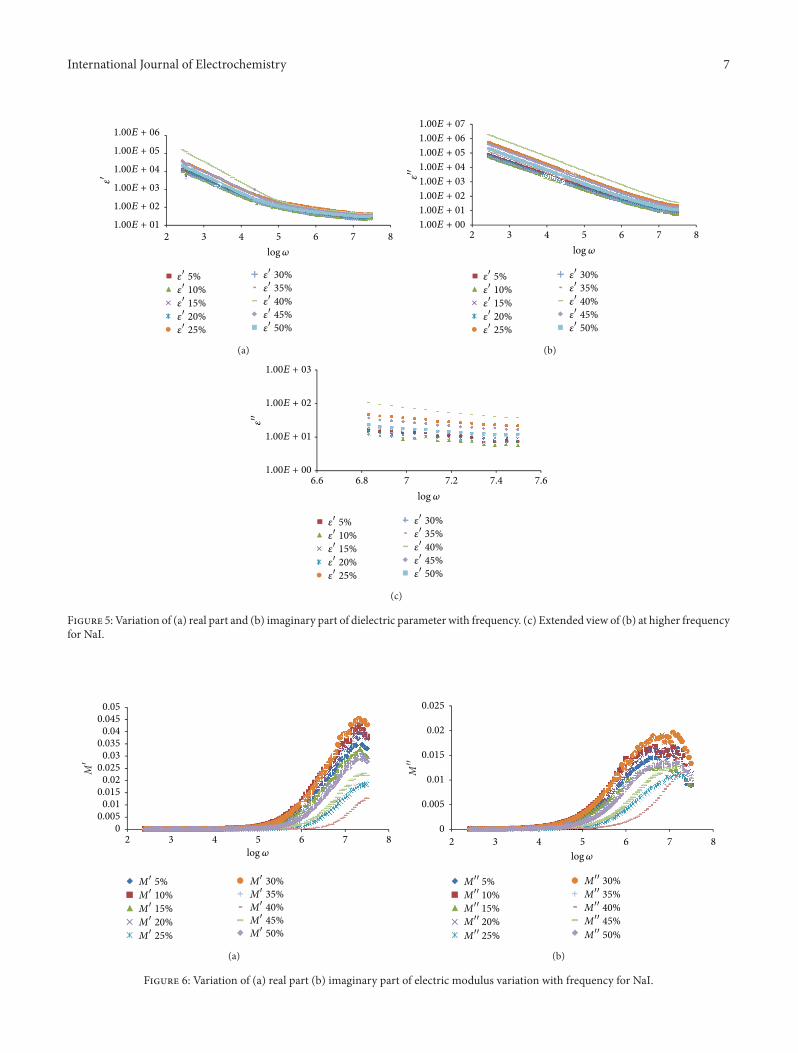

Impact Factor 173028 Days Fast Track Peer ReviewAll Subject Areas of ScienceSubmit at httpwwwtswjcom
Hindawi Publishing Corporation httpwwwhindawicom Volume 2013Hindawi Publishing Corporation httpwwwhindawicom Volume 2013
The Scientific World Journal