Liquid electrolyte development for low-temperature lithium-ion ...
Upload
khangminh22Category
view
1download
0
Mississippi State University Mississippi State University
Scholars Junction Scholars Junction
Theses and Dissertations Theses and Dissertations
5-3-2008
Effects of individual and combinatorial electrolyte solutions Effects of individual and combinatorial electrolyte solutions
comprised of various carbohydrates, salts, and stimulants comprised of various carbohydrates, salts, and stimulants
injected into broiler hatching eggs on subsequent late term injected into broiler hatching eggs on subsequent late term
embryogenesis and post hatch performance through tendays of embryogenesis and post hatch performance through tendays of
age age
Brenna Mariechen McGruder
Follow this and additional works at: https://scholarsjunction.msstate.edu/td
Recommended Citation Recommended Citation McGruder, Brenna Mariechen, "Effects of individual and combinatorial electrolyte solutions comprised of various carbohydrates, salts, and stimulants injected into broiler hatching eggs on subsequent late term embryogenesis and post hatch performance through tendays of age" (2008). Theses and Dissertations. 1756. https://scholarsjunction.msstate.edu/td/1756
This Graduate Thesis - Open Access is brought to you for free and open access by the Theses and Dissertations at Scholars Junction. It has been accepted for inclusion in Theses and Dissertations by an authorized administrator of Scholars Junction. For more information, please contact [email protected].

EFFECTS OF INDIVIDUAL AND COMBINATORIAL ELECTROLYTE
SOLUTIONS COMPRISED OF VARIOUS CARBOHYDRATES, SALTS,
AND STIMULANTS INJECTED INTO BROILER HATCHING EGGS
ON SUBSEQUENT LATE TERM EMBRYOGENESIS AND
POST HATCH PERFORMANCE THROUGH TENDAYS
OF AGE
By
Brenna Mariechen McGruder
A Thesis Submitted to the Faculty of Mississippi State University
in Partial Fulfillment of the Requirements for the Degree of Master of Science
in Agriculture in the Department of Poultry Science
Mississippi State, Mississippi
May 2008

Copyright by
Brenna Mariechen McGruder
2008

EFFECTS OF INDIVIDUAL AND COMBINATORIAL ELECTROLYTE
SOLUTIONS COMPRISED OF VARIOUS CARBOHYDRATES, SALTS,
AND STIMULANTS INJECTED INTO BROILER HATCHING EGGS
ON SUBSEQUENT LATE TERM EMBRYOGENESIS AND
POST HATCH PERFORMANCE THROUGH TEN DAYS
OF AGE
By
Brenna Mariechen McGruder Approved:
________________________
E. David Peebles Professor, Dept. of Poultry Science
(Major Professor and Director of Thesis)
_______________________ Robert Keirs
Associate Professor Emeritus, Dept. of Basic Sciences, College of Veterinary
Medicine (Committee Member)
_________________________ Michael Kidd
Professor, Dept. of Poultry Science (Graduate Coordinator and Department
Head of Poultry Science)
________________________ Dwaine Braasch
Assistant Professor, Dept. of Biochemistry and Molecular Biology
(Committee Member)
__________________________ John Bailey
Associate Professor, Dept. of Clinical Science, College of Veterinary Medicine
(Committee Member)
________________________ Vance H. Watson
Dean of the College of Agriculture and Life Science

Name: Brenna Mariechen McGruder
Date of Degree: May 3, 2008
Institution: Mississippi State University
Major Field: Poultry Science
Major Professor: Dr. E. David Peebles
Title of study: EFFECTS OF INDIVIDUAL AND COMBINATORIAL ELECTROLYTE SOLUTIONS COMPRISED OF VARIOUS CARBOHYDRATES, SALTS, AND STIMULANTS INJECTED INTO BROILER HATCHING EGGS ON SUBSEQUENT LATE TERM EMBRYOGENESIS AND POST HATCH PERFORMANCE THROUGH TEN DAYS OF AGE.
Pages in Study: 118
Candidate for degree of Master of Science
In this study, the effects of individual and combinatorial electrolyte solution
comprised of carbohydrate, salt, and a stimulant injected into broiler hatching eggs on
subsequent late term embryogenesis and post hatch performance up to D 10 were
evaluated in separate trials. The effects of solution concentration and volume on embryo
body weight and yolk reserves were likewise considered, and limited posthatch growth,
body weight, and yolk sac effects of a compound electrolyte solution were evaluated.
The individual and combinatorial effects of injected solutions were examined in an effort
to yield the maximum physiological growth effects on embryogenesis from the metabolic
pathways in which these compounds are involved. Limited effects on embryo and post

hatch mortality were found. However, both post hatch yolk reserves and liver weights
were affected by in ovo injection. These effects could be key in increasing bird weight
by processing day.

ii
DEDICATION
I would like to dedicate this thesis to my parents, Merle and Mariechen
McGruder. Dad, I’m still trying to figure out which came first, the chicken or the egg.

iii
ACKNOWLEDGEMENTS
First I must acknowledge the efforts of Dr. David Peebles. His willingness to
introduce me to the world of poultry science with such patience was a reflection on how
much he enjoys the field. His faith in me as a student and as a scientist is something I
will always remember. I also must acknowledge Rafael Correa and Dr. Mark Dekich,
and all the people at Avitech LLC, without their donation and support this research would
not have been possible. I must also acknowledge, with a whole heart, Dr. John Boyle,
who impacted my life from the first day I set foot on the campus at Mississippi State. His
belief in me is what drives me to be a better scientist and a better person, and I only hope
to one day live up to his example. Ms. Sharon Whitmarsh went above and beyond her
call to duty as an excellent technician, computer master, and a wonderful lab mom. I
would also like to acknowledge a man who knows everything and was more than willing
to share it all with me, Dr. Robert Keirs. I would like to praise Dr. Braasch for all his
help, he is a man of infinite amount of knowledge and wisdom and was always more than
willing to answer questions I only thought I knew the answer to. To Dr. Bailey I extend
my sincerest thanks, your kind words and wonderful ideas helped me find clarity. I
would also like to thank the faculty and staff in the Department of Poultry Science. I

iv
must thank Dr. Holly Parker, who helped me with everything from lab work to school
work, and who was always there to remind me, “This too shall pass.” Also to Dr. Kidd
who was always there with a story about how when he was in graduate school, and
although they never made sense they did distract me for a few minutes, and that was
always worth something. All of you were patient as I slowly began to understand, you
were eager to answer any questions, to share your knowledge with me, and you helped
me learn more about myself. I would like to extend my gratitude to Kristin Viscione, an
excellent peer mentor, friend, and partner in crime, you were a huge help. And to my
friends, especially Anna Oberhoffer and Christine Schudrowitz, who always were there
to support me and to help me work through my ideas.
I must acknowledge the efforts of my family, who were more than willing to
listen to me rant and ramble despite having no idea what I was talking about. I know you
tried to understand. To my mom and dad, Mariechen and Merle McGruder, who
supported me in every way parents can and were tolerant, to an extent, of the fact that I
never called home. They are the reason for my efforts and I can only hope I have made
them proud. To my little sister, Brittany, you were always there to make me laugh and to
go out to lunch with me, as long as I paid. To all of my family, I can only say thank you.
Omnia mea mecum porto. Homo doctus in se divitias semper habet.

v
TABLE OF CONTENTS
Page
DEDICATION.................................................................................................................... ii
ACKNOWLEDGEMENTS............................................................................................... iii
LIST OF TABLES........................................................................................................... viii
LIST OF FIGURES ........................................................................................................... ix
CHAPTER
I. INTRODUCTION.....................................................................................................1
II. REVIEW OF LITERATURE....................................................................................3 In ovo Technologies.....................................................................................4
Uses of Injections In ovo .................................................................4 In ovo Injections of Metabolic Solutions.........................................5
In ovo Development.....................................................................................8 General Development ......................................................................8 Yolk Sac.........................................................................................10
Amnion and Chorion......................................................................12 Allantois.........................................................................................15 Water in the Egg ........................................................................................16
In ovo Water Movement ................................................................16 Electrolytes ....................................................................................18 Effects of Potassium and Sodium ..................................................18 Effects of Carbohydrates and Minerals..........................................19 Effects of Stimulants......................................................................21 Conclusion .................................................................................................25 References..................................................................................................26
III. EFFECTS OF INDIVIDUAL ELECTROLYTE SALTS, ELECTROLYTE WITH A CARBOHYDRATE, AND STIMULANT SOLUTIONS ON EMBRYOGENESIS IN BROILER HATCHING EGGS ...............................................................................................31

v
Abstract ......................................................................................................31 Introduction................................................................................................32 Materials and Methods...............................................................................36 Incubation ......................................................................................36 Preparation of Solutions.................................................................37 Injection Procedure ........................................................................38 Data Collection ..............................................................................39 Statistical Analysis.........................................................................40 Results........................................................................................................41 Discussion..................................................................................................43 References..................................................................................................46
IV. EFFECTS OF COMBINATORIAL ELECTROLYTE WITH CARBOHYDRATE OR ELECTROLYTE AND STIMULANT SOLUTIONS ON EMBRYOGENESIS IN BROILER HATCHING EGGS ...........................................................................................54
Abstract ......................................................................................................54 Introduction................................................................................................55 Materials and Methods...............................................................................58 Incubation ......................................................................................58 Preparation of Solutions.................................................................59 Injection Procedure ........................................................................60 Data Collection ..............................................................................61 Statistical Analysis.........................................................................62 Results........................................................................................................62 Discussion..................................................................................................66 References..................................................................................................67
V. EFFECTS OF INJECTION OF COMBINATORIAL ELECTROLYTE SOLUTIONS ON THE HATCHABILITY AND GROWTH OF BROILERS FROM DAY 0 TO DAY 10 POST HATCH.....................................72
Abstract ......................................................................................................72 Introduction................................................................................................73 Materials and Methods...............................................................................76 Incubation ......................................................................................76 Preparation of Solutions.................................................................77 Injection Procedure ........................................................................78 Growout ..........................................................................................79 Animal Care ....................................................................................80 Data Collection ...............................................................................80 Statistical Analysis..........................................................................81 Results........................................................................................................82 Discussion..................................................................................................83

vi
References..................................................................................................87
VI. SUMMARY.............................................................................................................94 APPENDIX
A. Calculated mOsm for select solutions in Chapters III, IV,
and V................................................................................................................96
B. Significant Data normalized for mOsm in Chapter III....................................100 C. Significant Data normalized for mOsm in Chapter IV ...................................107 D. Significant Data normalized for mOsm in Chapter V.....................................111 E .Cross comparison of stimulants carried in water versus 5.5 mM
potassium chloride ..........................................................................................117
viii
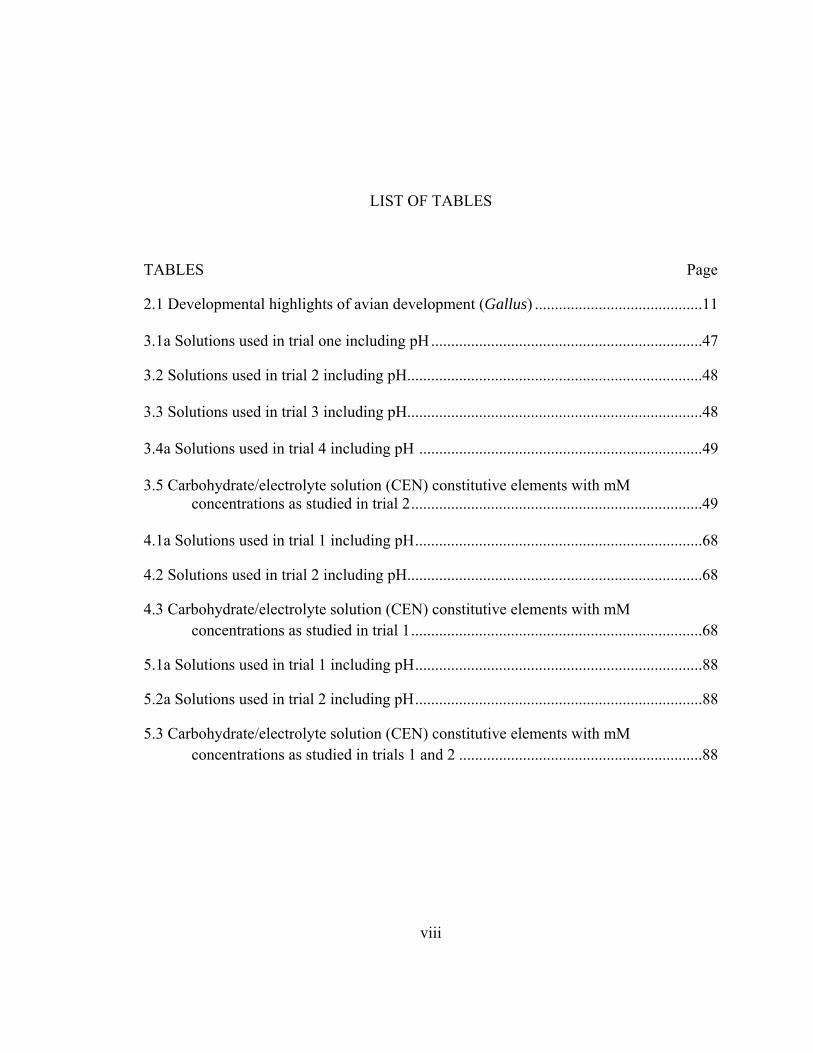
LIST OF TABLES
TABLES Page
2.1 Developmental highlights of avian development (Gallus) ..........................................11
3.1a Solutions used in trial one including pH....................................................................47
3.2 Solutions used in trial 2 including pH..........................................................................48 3.3 Solutions used in trial 3 including pH..........................................................................48 3.4a Solutions used in trial 4 including pH .......................................................................49 3.5 Carbohydrate/electrolyte solution (CEN) constitutive elements with mM
concentrations as studied in trial 2.........................................................................49 4.1a Solutions used in trial 1 including pH........................................................................68
4.2 Solutions used in trial 2 including pH..........................................................................68
4.3 Carbohydrate/electrolyte solution (CEN) constitutive elements with mM concentrations as studied in trial 1.........................................................................68
5.1a Solutions used in trial 1 including pH........................................................................88
5.2a Solutions used in trial 2 including pH........................................................................88
5.3 Carbohydrate/electrolyte solution (CEN) constitutive elements with mM concentrations as studied in trials 1 and 2 .............................................................88

ix
LIST OF FIGURES
FIGURES Page
2.1 Illustration of β-hydroxybutyrate use in the cell (Devlin, 1997) ...................................6
2.2 Diagram of the development of the avian embryo and select extraembryonic membranes. (Parkhurst, 1988) .................................................................................8
2.3 Breakdown of Caffeine (Fredholm et al., 1999)..........................................................22
3.1a Relative yolk sac weight of Day 18 broiler embryos ((wet yolk sac- dry yolk sac)/ wet yolk sac) in the following treatment groups: potassium chloride (KCl) at 4.0, 4.5, 5.0, and 5.5 mM; sodium acetate (Na Acetate) at 110, 118, 125, and 130 mM; sodium dihydrogenphosphate (NaH2PO4) at 0.5, 1.0, 1.5, and 2.0 mM; saline at 117 mM, and a non-injected control (control, ni) in trial 1..................................................................................50
3.2a Percent 0- 18 d incubational egg weight loss (0-18 d water loss(g)/ set egg weight (g)) in the following treatment groups: 5.5 mM potassium
chloride (KCl) at 200, 800, 1000, and 2000 μL volumes; 117 mM saline at 200, 800, 1000, and 2000 μL volumes; and a non-injected control (control, ni) in trial 3..................................................................................51 3.3a Relative embryo body weights of Day18 broiler embryos (wet embryo (g)/dry embryo (g)) in the following treatment groups: 5.5 mM potassium chloride (KCl) at 200, 800, 1000, and 2000 μL volumes; 117 mM saline at 200, 800, 1000, and 2000 μL volumes; and a non-injected control (control) in trial 3.......................................................................................52 3.4a Relative yolk sac weight of Day 18 broiler embryos (wet yolk sac (g)/ D 18 egg weight (g)) in the following treatment groups: 1 mM caffeine,
theophylline, creatine and phosphocreatine; 117 mM saline; and a non- injected control (control, ni) in trial 4 ....................................................................53

x
4.1a Percent 0-18 d incubational egg weight loss (0-18 d water loss (g)/set egg weight (g)) in the following treatment groups carried in 5.5 mM potassium
chloride (KCl): tripostassium citrate (3K Cit), a carbohydrate/ electrolyte solution (CEN), and sodium dihydrogenphosphate (NaH2PO4); and 117 mM saline, and non-injected control (control, ni) treatments in trial 1 .................................................................................................................69 4.2a Relative embryo body weight of Day 18 broiler embryos (wet embryo (g)/ D 18 egg weight (g)) in the following treatment groups carried in 5.5 mM potassium chloride (KCl): tripostassium citrate (3K Cit), a
carbohydrate/electrolyte solution (CEN), and sodium dihydrogenphosphate (NaH2PO4); and 117 mM saline, and non-injected control (control, ni) treatments in trial 1..........................................70 4.3a Percent embryo body moisture of Day 18 broiler embryos ((wet embry- dry embryo) (g)/ wet embryo(g)) in the following treatment groups, where treatments were all carried in 5.5 mM potassium chloride (KCl):
tripostassium citrate (3K Cit), a carbohydrate electrolyte solution (CEN), and sodium dihydrogenphosphate (NaH2PO4); and 117 mM saline, and a non-injected control (control, ni) treatments in trial 1 ........................................71 5.1a Mean hatch weigh (g) of broiler chicks, in the follwong treatment groups carried in 5.5 mM potassium chloride (KCl): tripostassium citrate (3K Cit), a carbohydrate/ electrolyte solution (CEN), creatine 1.0 mM; also a 117 mM saline, and a non-injected control (control, ni) treatment in trial 1 ..................................................................................................................89 5.2a Relative yolk sac weights of Day 3 broiler chicks (wet yolk sac weight (g)/ live chick weight (g)), in the following treatment groups, all were carried in 5.5 mM potassium chloride (KCl): tripostassium citrate (3K Cit), a carbohydrate/ electrolyte solution (CEN), creatine 1.0 mM; and a 117 mM saline, and a non-injected control (control, ni) treatment in trial 1 ..................................................................................................................90 5.3a Relative liver weight of Day 3 broiler chicks (wet liver weight (g)/ live chick weight(g)), in the following groups carried in 5.5 mM potassium chloride (KCl) and 1.0 mM theophylline: tripostassium citrate (3K Cit), a carbohydrate electrolyte solution (CEN), creatine 1.0 mM; also a 117 mM saline, and a non-injected control (control, ni) treatment in trial 2 ................91

xi
5.4a Percent late dead (late dead/ total fertile) in the following groups carried in 5.5 mM potassium chloride (KCl) and 1.0 mM theophylline: tripostassium citrate (3K Cit), a carbohydrate electrolyte solution (CEN), creatine 1.0 mM; also a 117 mM saline, and a non-injected control (control, ni) treatment in trial 2..................................................................................................92 5.5a Cumulative mortality (hatch to Day 3; Hatch- D 3 dead/ total set) of broiler chicks injected with a in the following groups carried in 5.5 mM potassium chloride (KCl) and 1.0 mM theophylline: tripostassium citrate (3K Cit), a carbohydrate electrolyte solution (CEN), creatine 1.0 mM; also a 117 mM saline, and a non-injected control (control, ni) treatment in trial 2 ..................................................................................................................93

1
CHAPTER I
INTRODUCTION
Over the years the poultry industry has practiced selective breeding to achieve the
hardy and productive lines of birds that we have today. However, as we approach a new
generation of genomics and proteomics, it is of interest to know if the genetic potential in
the current commercial lines of poultry is fully realized. There is much potential in
attempting to discover if a higher level of performance may be achieved if birds are
provided optimum nutrition and husbandry. In this current research, materials and
methods are introduced through automated in ovo injection in an effort to evaluate effects
on mortality, body weight gains, and yolk sac reserves of Day 18 embryos and post hatch
chicks up to 10 d. The materials injected at Days 16 or 18 of incubation include various
salts, carbohydrates and stimulants along with the current vaccine regimen. By
considering nutrient metabolic efficiency and energy output, various biochemical
pathways and pathway entry points are utilized to optimize broiler growout performance.
The objective of this study was to explore the use of various metabolic
intermediate solutions, via their proposed mechanisms in cellular cycles and the
responses they invoke in vivo. The relative effectiveness of various salts, carbohydrates,
stimulants, and high energy compounds individually and in combination were
determined. The embryonic evaluation of these solutions, individually and in

2
combination, may allow for their optimal formulation for maximum effectiveness. It is
hypothesized that the electrolyte solutions will have an effect on embryos and post hatch
chicks, positive effects as monitored by body weight, yolk sac reserves, mortality and
post hatch growth. It is also suggested that the injection of one of several stimulants may
have a specific effect on the pipping response of embryos and may thereby increase
hatchability of. Of the parameters which may be affected include decrease late mortality,
decrease length of incubation, and narrow the window of hatch time.
3
CHAPTER II
REVIEW OF LITERATURE
Over the years the poultry industry has worked to select for economic
performance in growth, feed efficiency, and breast muscle yield. As a new generation of
genomics and proteomics approaches one must question whether growth, meat yield, and
livability options have been maximized through the current genetic breeding. While the
genetics continue to be optimized, the care and management needs of the various
developed poultry lines have not undergone as extensive of a review. Physiological
stimulation through better feeding and the emergence of newer in ovo technology may
offer potential for evaluating the contribution of physiology on performance. In ovo
injection, a relatively recent innovation, represents a labor saving enhancement for the
vaccination of poultry against very costly diseases (Johnston et al., 1997). Since its
inception, most of the research in automated in ovo injection has included the optimizing
of mechanical elements or parameters like needle type, needle length, injection site and
deposition of vaccines relative to the embryo. To date, efforts employing in ovo
technology have not focused on the potential for advancing avian physiology and
development. Previous studies have shown that in ovo injections of feeding solutions are
capable of maximizing broiler efficiency through breast meat yield (Uni et al., 2005). It

4
is possible that these injections can be adapted to work synergistically with the current
vaccine regimen.
In ovo Technologies
The current use of in ovo automated mass injection allows mass vaccination in a
manner that is both safe to the workers and the broiler embryos. This methodology is
also cost effective (Williams, 2005). Currently the poultry industry and researchers are
looking for methods to improve current in ovo technologies and to broaden its’ uses in
poultry management.
Uses of Injections In ovo
Automated mass vaccination is currently the main use for in ovo technologies in
the poultry industry. The injection of vaccine into eggs during transfer results in a cost
efficient use of manpower while increasing the number of properly vaccinated animals
(Williams, 2005; Johnston et al., 1997). To date the main vaccine delivered in this
manner is the Marek’s disease vaccine. Marek’s disease is a herpes-like
lymphoproliterative virus that cost the industry $1 billion dollars worldwide in 2000
(Tulman et al., 2000). In ovo injection suggests a delivery that is faster, more uniform,
and less stressful on the animal (Williams et al., 2005). This type of vaccination is
associated with decreases mortality in the first 2 weeks of post hatch growth when
compared to previous injection methods (Johnston, 1997).

5
Recent studies have begun to utilize this technology for more than just
vaccination applications. Studies utilizing the injection of carbohydrates (Uni et al.,
2005; Foye et al., 2006), metabolic intermediates (Uni et al., 2005; Foye et al., 2006),
proteins (Uni et al., 2005; Foye et al., 2006), and amino acids (Zhai, et al., 2008; Foye et
al., 2006; Ohata et al., 2001) have been preformed. Uni et al. (2005) and Foye et al.
(2006) investigated the use of in ovo feeding and its’ application to broilers and turkeys.
In ovo Injections of Metabolic Solutions
U.S. Patent 6,592,878 B2 states that the in ovo feeding is “accomplished by
administering the nutrient composition and/or enteric modulator into the amnion where it
is then orally ingested by the subject”. This claim implies that the only manner through
which feeding solutions enter the embryo’s body is when the amnionic fluid is ingested
by the embryo prior to hatch (Uni et al., 2003). This scenario assumes a static situation,
meaning that the amniotic fluid remains where it is until it begins to be actively ingested
by the embryo. This may not be congruent with research that describes the situation as
more dynamic, whereby there is active fluid exchange throughout the organism
(Jochemsen and Jeurissen, 2002; Rol’nik, 1970; Ragonzia, 1957). Other in ovo research
concluded that substances can be taken into the embryo from the amnionic fluid, and can
be located in various organs prior to hatch (Jochemsen and Jeurissen, 2002). Several
types of solutions were used to track the amniotic fluid uptake by the embryo (soluble,
insoluble and viral solutions). The uptake of the injected materials is more expedient and
dispersive in Day 18 embryos than Day 16. Day 16 embryos required 48 hours for all
embryos tested to show evidence of the injectable, although approximately half showed
positive uptake in the observed organs at 24 hours. Whereas embryos injected at Day 18
showed the injectable in the tested organs 24 hours post injection. For all solutions tested
it was determined that all solutions types were easily assimilated. However, it has not
been conclusively proven that amniotic fluid is actively or passively ingested (Uni et al.,
2005; Uni, et al., 2003; Jochemsen and Jeurissen, 2002; Ragozina, 1957).
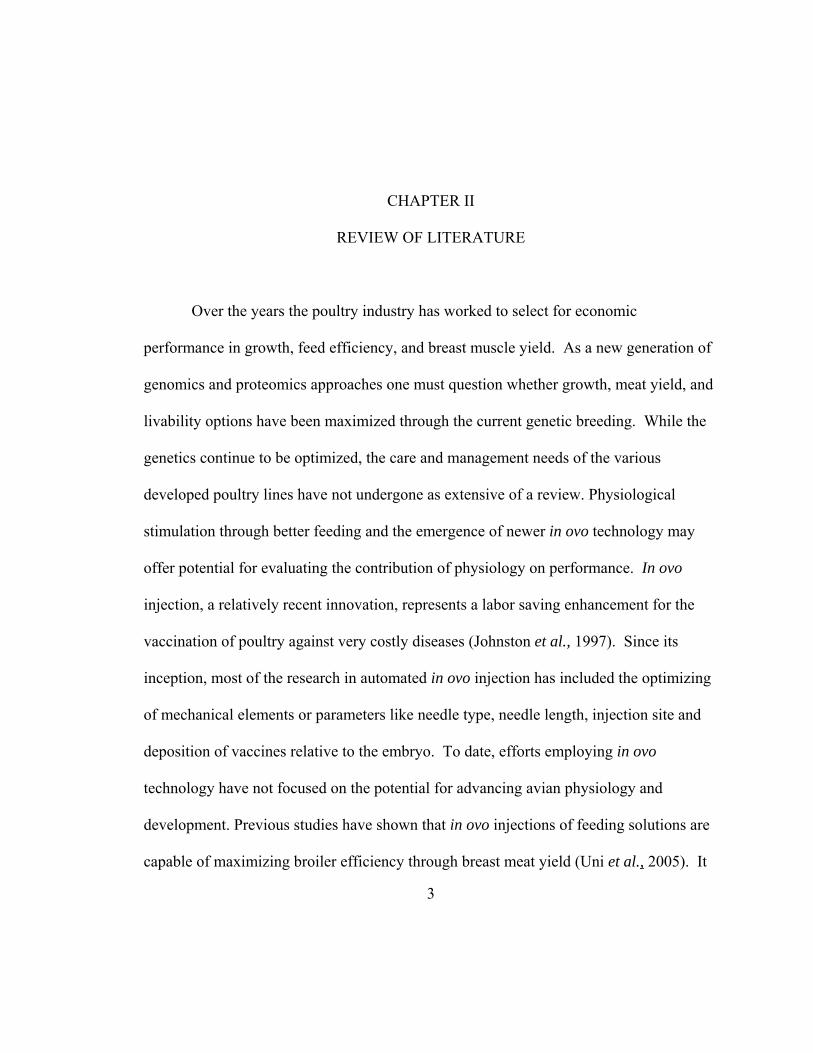
Figure 2.1. Illustration of β-hydroxybutyrate use in the cell (Devlin, 1997).
β-hydroxybutyrate was used as a leucine metabolite that was found to decrease
adult chicken mortality, increase carcass yield, and prevent excessive muscle proteolysis
during metabolic stress by previous investigators (Uni et al., 2005). β-hydroxybutyrate
6

7
is a product of acetoacetate metabolism during ketogeneisis (Figure 1.1). This compound
has been extensively tested in Day 18 injections of embryos, and was found to increase
hatch weight and carcass yield (Foye et al., 2006; Uni et al., 2005; Tako et al., 2004).
Ohtsu et al. (2003) reported that the natural concentration of β-hydroxybutyrate was most
concentrated in the blood at hatch, after which there was a marked decrease from hatch to
3 days post hatch. Muscle to blood ratio of the β-hydroxybutyrate concentrations
immediate to hatch (Day 20 to hatch) were significantly higher than concentrations in the
post hatch chick. The uptake of β-hydroxybutyrate by muscles is substantial.
Ketogenesis, if it occurs, would occurs in muscles immediately before and after the
hatching process. β-hydroxybutyrate is reported to have a greater response when injected
alone than when injected with egg white protein.
However, egg white protein was shown to have a better response than β-
hydroxybutyrate when injected into eggs at Day 18 (Foye et al., 2006). Egg white
contains ovalbumin, ovotransferrin, ovomucoid, globulins, lysozyme, ovomucin, and
avidin (Romanoff, 1960). These proteins could serve various nutritive functions and
supplement the endogenous protein content of the egg. Egg white protein conferred a
better breast growth response than the control, β-hydroxybutyrate (individual), or the β-
hydroxybutyrate + egg white protein injection solutions. Body weight increases due to
the injection of these solutions leveled off at Day 3 posthatch. By Day 7 posthatch all
treatment groups had outgrown the control (Uni et al., 2005). The increase that was
noticed at hatch is attributed to a larger breast muscle, the only muscle independently

weighed. The addition of egg white protein is theorized to conserve any muscle damage
incurred during hatching either by allowing for a buildup of muscle prior to hatch or by
having more products available for muscle regeneration.
In ovo Development
General Development
Figure 2.2. Diagram of the development of the avian embryo and select extraembryonic membranes. (Parkhurst, 1988)
The development of the avian embryo is mainly considered as three major stages: early,
mid, and late. The early developmental period is the time of major organ development
8
9
and some external feature development. It is hallmarked by the formation of the heart on
Day 2 and the complete development of the vascular system by Day 4 (Table 1.1;
Romanoff and Romanoff, 1960). Mid- developmental periods are characterized by rapid
body movement and a more “bird-like” appearance of the embryo. During this period the
digestive tract is fully formed and the small intestines are external to the embryo body
proper. During late developmental period the small intestines are drawn into the
abdomen, on Day 15, and the remainders of the extra embryonic organs (yolk sac and
amnionic fluid; Fig. 2.2) have begun to be taken into the body in preparation for hatch.
By Day 19 of development, all the organs should be internal and most of the
extraembryonic membranes should be gone. On Day 19 an internal pip of the inner
membrane should occur, marking the first time the chick breathes oxygen. Day 20 will
show outer eggshell pipping. Hatching, in the domestic chicken, occurs between late in
Day 20 to 21 (Rol’nik, 1970; Romanoff and Romanoff, 1960).
Development of adult avian organs (i.e. lungs and digestive tract) is considered
slow in comparison to body and extraembryonic membranes (Rol’nik, 1970). Therefore,
for the avian embryo to survive and develop without the use of the adult organs the
embryos must utilize the function of temporary organs, also known as the extraembryonic
membranes. These membranes perform a critical function for the embryo, but would
serve no purpose post hatch and so these membranes atrophy or are ingested before
hatch. The formation of these membranes is semiautonomous in the avian embryo
(Everaet et al., 2006). Development of these membranes continued independently for a

10
short time after the embryo was killed. If membrane synthesis was inhibited chemically
(by amiloride) the embryo still continued to develop for a short time, but then died.
These external organs consist of the yolk sac, amnion/ chorion, and the allantois.
Yolk Sac
The main function of the yolk sac is the absorption of nutrients from the yolk and
transfer of these nutrients to the embryo (Romanoff and Romanoff, 1967; Rol’nik, 1970).
The yolk sac is one of the earliest formed membranes (Rol’nick, 1970). The yolk has a
pH of 6.0 at the time of lay, and this pH increases slightly (6.5) during development
(Stern, 1991). During 2 to 3 days of incubation the yolk sac distinguishes itself from the
embryo, occurring simultaneous to the formation of the head, caudal, and lattice lining
body folds. Also, during this time, the vitelline arteries and veins connect to form the
extraembryonic circulation (Table 1.1). Growth of the yolk sac proceeds up to Day 11, at
which time there is complete closure of the yolk sac (Rol’nik, 1970). During
development, uptake of the yolk is the major source of nutrition for the embryo
(Romanoff, 1960). During incubation the yolk sac absorbs three times its own weight in
food material (Romanoff and Romanoff, 1967). It is important to note that while in the
egg, the embryo has a major dependency on lipids, via the yolk, for metabolic purposes.
Based on 100 g of yolk tested the yolk contains 86 g phospholipids, 4 g triacylglycerols
and 10 g cholesterol (Nielson, 2003). Palmaitic (16:0) and oleic (18:1n-9) are the major

11
Table 2.1. Developmental highlights of avian development (Gallus)
Time of Development D Early (1-7 d) D Mid (8-14 d) D Late (15-21 d)
Embr
yo
D 1 Primitive streak form1 D 2 Heart forms1
D 6 Voluntary movement, beak forms1
D 8 Feather genus appear in tracts1
D 12 Down and scales appear1
D 14 Head moves to large end1
D 17 Beak under right wing, toward lower air sac D 19 Internal pip, pulmonary respiration begins1
D 20 External pip1
Inte
rnal
Org
ans D 1
Foregut forms1
D 2 Heart, brain, eyes, and blood vessels form
D 4 All organs present1
D 11 Abdominal wall and intestines apparent1
D 15 Small intestines taken into abdomen1
Yol
k Sa
c
D 1 Formation1
D2 Vitelline arteries arise and connect extraembryonic circulation2
D 11 Complete closure of sac1
D 19 Remaining yolk taken into the abdomen1
Am
nion
/Cho
rion D 3
Amnion forms and closes2
D 4 Begin to swallow amniotic fluid3
D 5 Contractions begin2
D 13 Albumen influxes in2
D 14 Chorioamnionic duct formed, embryo actively swallows fluid 2
D 19 All fluid swallowed2
Alla
ntoi
s
D3 Appears1
D 5 Allantoic wall fuses with the chorionic mesodermal1 D 6 Allantoic cavity fills with fluid
D10 Maximum weight1
D 11 Lines entire shell membrane1
D 15 Reaches maximum weight1,2
D 19 Embryo pips and pulmonary respiration begins1
Reference Key: 1( Romanoff, 1960), 2(Rol’nik, 1970), 3(Ragozina, 1957)
12
acyl components, and the major poly-unsaturated fatty acid component is linoleic acid
(18:2n-6) (Speake, et al., 1998; Reidy, et al., 1998). It was found that by Day 5 post
hatch, approximately 90% of all lipids associated with the yolk complex had been
absorbed by the chick (Noble et al., 1989). “During the last few days of the
developmental period, the loss of solids by the yolk is very rapid. This can be accounted
for by the structural formation of the embryo, and the fats of the yolk are being utilized
for the rapidly increasing expenditure of energy” (Romanoff and Romanoff, 1967). The
yolk is found to decrease slightly at the midpoint of embryonic development, and then is
somewhat replenished (Romanoff and Romanoff, 1967). It is unknown where this
replenishing source comes from. Only a vestigial amount of yolk is found at 5 to 6 days
post hatch. In the newly hatched chick there was approximately 8 grams of residual yolk
matter containing 1.7 grams of lipid (28%) that remained to be absorbed (Noble et al.,
1989). Post hatch growth of the liver was associated with the fat that was present in the
embryonic chick reserves, and the changes noted in the lipid and fatty acid composition
of the liver were indicative of the rapid alteration of the role of the liver in lipid
metabolism of the new chick (Nobel et al., 1998).
Amnion and Chorion
The amnion is believed to provide mechanical protection, fluid balance for the
external pressure, and it enables the embryo to change shape and spatial position in the
egg without hazard to the newly developing organs (Rol’nik, 1970). The fluid is of a

13
“unique ionic composition” and has a high osmotic pressure which is believed to
contribute to the fluid movement in the egg in the later stages of incubation (Ar, 1991).
The amnion and chorion extraembryonic membranes are formed from the extraembryonic
somatopleure from hour 30 of development (Rol’nik, 1970). The extraembryonic
somatopleure forms the head fold of the chorioamniotic layers after which the lateral
chorioamniotic fold and a caudal fold appears. The lateral chorioamniotic folds flow
towards each other, while the caudal fold grows toward the head. When all folds meet,
the portions of the membrane fuse over the embryo and form a sac (Table 1.1). The outer
walls of the folds move away from the inner walls and form the chorion. The internal
walls form the amnion (Figure 1.2). As the chorion grows it forms a fold and adheres to
the wall of the amnion resulting in a chorio-amniotic fusion. The chorioamniotic fusion
is disrupted on Day 12 and forms a chorioamniotic duct. The amnionic fluid reaches its
maximum volume on Day 13, where its weight is approximately 8-9% of the eggs initial
weight. After Day13 the amount of amnionic fluid increases due to the influx of albumen,
and this albumen and amnionic fluid mixture is what the chick is imbibing during the
latter half of incubation (Ar, 1991; Rol’nik, 1970).
Ion movement plays an important role in early embryo cell differentiation and in
supporting the water movement later in incubation (Ar, 1991; Stern, 1991; Romanoff and
Romanoff, 1967). The amniotic fluids contain mainly chlorides (Romanoff and
Romanoff, 1967; Rol’nik, 1970). Romanoff and Romanoff (1967) noted that between the

14
ages of 11 and 15 days of incubation the ion content in the extraembryonic membranes
shift in a predictable manner. As embryonic age increases, sodium ions decrease while
potassium ions increase in the amnion (Romanoff and Romanoff, 1967).
Another critical function of the amnion is its contractions. These contractions are
believed to improve metabolic reactions and to bathe the embryo by keeping fluids
moving (Rol’nik, 1970). The amnion folds close at Day 3. At Day 5, due to fluid, the
amnion increases in size and begins to contract. At 3 to 4 days of incubation, separate
muscle fibers are visible and these fibers form a common muscle syncytium during 5 to 7
days of incubation. The muscular structure of the amnion develops in order to form a
contractile network. Then as the embryo becomes older and begins to fill the amnionic
space the once highly developed membrane becomes greatly simplified. It is after this
degeneration of the contractile network that the injection would be given. By this time
the contractions would have ceased and the membrane would be simplified in preparation
of hatch.
Swallowing plays an important role in the embryo’s development and on the
proposed success of in ovo vaccination. The fluid that the embryo would have access to
swallow is the fluid immediately surrounding it, amnionic fluid. On Day 9 of
development, the chick begins to swallow amnionic fluid due to the amnion contractions.
Ragozina (1961) discusses swallowing as a transition to an intraintestinal form of
feeding, as well as compensation for fluid deficiency when the embryo is no longer
getting sufficient fluid from the yolk. This swallowing may not have a detectible effect

15
on overall volume of the amnionic fluid. Since there are several compartments pumping
fluid into the amnion it is difficult to tell how much swallowing would decrease the total
fluid volume. On Day 14, the embryo begins to actively swallow amniotic fluid, which is
now mixed with albumen, in preparation for hatch. As a result of this albumen
consumption, protein metabolism of the embryo is activated and this results in increased
weight and plumage formation (Romanoff and Romanoff, 1967). There is no albumen
left by Day 19. This is important because in some cases amnionic vaccinations are given
at Day 19, which would make the site access difficult.
Allantois
The allantois is perceived to function primarily as a respiratory organ. The
allantois oxygenates the blood of the embryo and relieves the carbon dioxide (Patten,
1951). It is the only organ of gas exchange from the end of Day 8 until Day 19, when
internal pipping would initiate pulmonary respiration. The allantois is a highly
vascularized membrane (Table 1.1; Rol’nik, 1970). Little is known about the allantois
other than it must contain fluid (Ar, 1991). The allantoic membrane appears as a distinct
structure on Day 3 of development, fills with fluid, and reaches its maximum wet weight
at Day 10 (Romanoff and Romanoff, 1960; Rol’nik, 1970; Patten, 1951). During this
time the fluid pH drops from 8.0 (at time of formation) to 5.0 to 6.0 (shortly before hatch)
(Rol’nik, 1970). The allantois arises directly from the embryonic tissues as an
excrescence of the posterior wall of the hindgut, moving the chorion aside from the

16
amnion and yolk sac. The allantois then presses tightly to the shell near the small end of
the egg (Rol’nik 1970). By Day 11, the allantois grows to such an extent that it lines the
entire shell membrane, and by Day 15 it reaches it maximum weight and there is almost
no albumen left in the albumen sac because it has all moved into the allantoic membrane.
A second rise in weight occurs near hatching time due to fluid shifts from other areas,
such as the albumen sac. (Romanoff and Romanoff, 1967). The volume of the allantoic
fluid seems to reflect the embryo’s balance of urinary input and reabsorption via the
chorioallantois (Ar, 1991). It was found that when water was available then the
membrane stored a hypo-osmotic solution. The water present in the membrane may be
recycled in dehydrated eggs to prevent large moisture shifts in the embryo (Hoyte, 1979).
The total nitrogen content is found to increase with the growth of the membrane, with a
fivefold increase in nitrogen between 8 to 21 d (Romanoff and Romanoff, 1967). An
inverse relation of sodium and potassium concentration is present in the allantois between
11 and 15 days of incubation (Romanoff and Romanoff, 1976). Sodium decreases while
the potassium content increases.
Water in the Egg
In ovo Water Movements
During incubation avian eggs are never known to gain water from the
environment (Ar, 1991). In terms of water loss fertile eggs do not differ from non fertile
eggs for the first half of incubation, illustrating how partial pressure of water vapor inside

17
the egg plays a role in water loss (Ar, 1991; Romanoff and Romanoff, 1967; Christensen
and McCorkle, 1982). The main source of water for the newly developing embryo is
found in the albumen (85-95%), with the yolk being less (42-65%) (Ar, 1991). This
water is both used for metabolic purposes and is lost as vapor to the atmosphere during
incubation. Many of the water shifts in the egg are believed to be functions of osmotic
pressure.
The albumen is found to pump water into the yolk during the first 20% of
incubation in both fertile and, to a lesser extent, non-fertile eggs (Ar, 1991). This is
thought to occur due to effects of the initial osmotic pressure differences between the two
compartments. This decrease is affected somewhat by continuous evaporation of water
from the albumen. The decrease in fluid is mainly thought to be caused by the ion
pumping action of the blastoderm disc into a space under the newly developing embryo,
which forms a sub-embryonic fluid compartment (New, 1956).
All extraembryonic membranes are reported to reach final size and position
approximately halfway through incubation (Ar, 1991; Romanoff and Romanoff, 1967;
Rol’nik, 1970). After this midway point all embryonic uptake of water from the
different compartments is believed to be osmotically driven (Ar, 1991). Embryo
moisture has been found to decrease sigmoidally between 6 to 21 days. However, this
moisture decrease may be offset by the increase in embryo fat between 12 to 21 days
(Peebles, et al., 1999). It is believed that the allantois serves to store and recycle fluid in
order to prevent any large changes in embryo water content (Hoyt, 1979). Throughout

18
incubation it is believed that while fluid reserves decrease throughout the all
compartments, the embryo will maintain its’ own moisture concentration (Tullet and
Burton, 1982). The total water concentration of the fresh egg has been shown to equal
that of the newly hatched chick (Ar and Rahn, 1980).
Electrolytes
A solution containing free ions that behaves as an electrically conductive medium
is known as an ionic solution, or an electrolyte. These solutions possess many physical,
biological, and medical functions. In the simplest form an electrolyte is water containing
a single salt. However, usually these solutions are more complex and contain many salts,
sugars (i.e. glucose or sucrose), and minerals (Rehrer, 2001; Lima et al., 2002; Snyder,
1991). These electrolytes, if added, may create an effect on water movement in the egg
during incubation.
Effects of Potassium and Sodium
Most animal cells strive to maintain low intracellular sodium and high
intracellular potassium for function (Voet and Voet, 2004; Devlin, 1997; Kernan, 1980).
For example, the concentration of sodium is 10 mM intracellularly and 100 to 140 mM
extracellularly. Conversely, the cell tries to maintain 100 to 140 mM potassium
intracellularly and 5 to 10 mM extracellularly. It is the high intracellular potassium
concentration that helps create and maintain the intracellular gradient charge and allow

19
for the creation of membrane potential (Voet and Voet, 2004; Devlin, 1997; Kernan,
1980). These ions aid in the maintenance of cell volume, cell excitability, active
transport functions, and passive transport regulation. It was found that injected potassium
is rapidly lost from the blood (Kernan, 1980). Potassium becomes most concentrated in
the renal tissue, and approximately 20% is lost in the urine. Lungs and intestines have a
high potassium turnover, whereas muscles have a comparatively lower turnover (Kernan,
1980). In a comparative study it was found that electrolyte solutions containing
potassium, sodium, or sugar all raised plasma volumes after 2 hours of rehydration
(Neilsen et al., 1986). These studies reported that the sodium drink produce a primary
effect in filling the extracellular compartment, where the potassium and sugar drinks
increased intracellular compartment volumes.
Effects of Carbohydrates and Minerals
Glucose is a known electrolyte balancer, functioning by increasing water
absorption (Rehrer, 2001; Snyder, 1991). Also, some electrolyte solutions evaluate the
use of glucolytic amino acids for use in the place of glucose (Zhai et al., 2008; Lima et
al., 2002). Carbohydrate ingestion during prolonged exercise (like hatching) can aid
performance indirectly through increased glucose oxidation but also, importantly,
through enhanced water absorption. It has been found that carbohydrate inclusion in a
solution affects the net rate of water assimilation, and is important to supplement
endogenous reserves as a substrate for exercising muscles (Rehrer, 2001). Glucose and/or

20
glucose-containing carbohydrates (e.g. sucrose, maltose) at concentrations of 3 to 5%
weight/volume are added to electrolyte solutions to enhance water absorption.
Carbohydrate concentrations above this may be advantageous in terms of glucose
oxidation and maintaining exercise intensity. However, if these carbohydrate
concentrations are too high there will be a reduced net rate of water absorption.
In search of a solution that would be beneficial in terms of nutrition and hydration
the potential of the World Health Organization’s (WHO) oral rehydration solution has
been studied (Pulungsih et al., 2006; Islam et al., 2004). WHO promotes two forms of
oral rehydration solution: the standard Oral Rehydration Solution (ORS) and the newer
formula designed for children (ReSoMal). Both solutions include complex (sucrose) and
simple sugars (glucose), as well as physiological salts and minerals (Pulungsih et al.,
2006). However, ORS was reformulated to decrease the concentrations of sodium,
glucose, and chloride, all of which are dangerous if concentrations are too high. Excess
concentrations of these molecules may exacerbate an electrolyte imbalance and induce an
excess loss of water (Islam et al., 2004; Rehrer, 2001). In the new reformulation the
ReSoMal maintains the original ORS concentration of potassium and citrate and decreses
sodium and glucose concentrations. Islam et al. (2004) reported that in dehydrated, but
well-nourished animals, the administration of ReSoMal allowed for less sodium and more
potassium to be absorbed. This reformulation brought about intestinal water absorption,
which allowed the kidney and large intestine to better salvage water and electrolytes.
ReSoMal also contains copper.

21
Copper was found to result in a positive effect on intestinal physiology of broilers,
causing a decrease in villi blunting as compared to subtheraputic antibiotic treatment
(Arias, et al., 2006). An increase in weight at the time of processing was also noticed in
the broilers that were supplemented exogenous copper in the feed (Arias, et al., 2006).
The addition of copper may stimulate growth and general health of broilers if added to
the diet via the comparative lengthening of the villi. This villi lengthening would lead to
increased absorbance during digestion. Although it is unknown if there would be an
effect in embryos or chicks, there is the potential for a positive outcome.
Effects of Stimulants
Stimulants may prove to be important in the poultry industry because of the
potential to stimulate embryos in hatching. In one study there was found 2.0 and 2.8%
mortality in embryos at Day 20 and 21, respectively (Kuurman et al., 2001). It is
unknown why these embryos failed to hatch. It may be assumed that some embryos fail
to hatch because of poor stimulation of the muscles involved in pipping, although there
was no literature found on the topic. This is where the addition of a stimulant may show
an effect.
Caffeine is a well known and well studied stimulant. It is known that cells
respond differentially to caffeine. Where some can utilize it others require or better
utilize one of the metabolic derivatives (Fredholm et al., 1999; Siegal, 1999). Xanthenes

(i.e. caffeine and theophylline) are known to inhibit the activity of phosphodiesterase,
thereby increasing the half-life of cyclic adenosine monophosphate (cAMP) in the cell
Caffeine (1,3,7-trimethylxanthine)
22
Theophylline(4%) Theobromine(12%) Paraxanthine(84%)
(1,3-dimethylxanthine) (3,7-dimethylxanthine) (1,7-dimethylxanthine)
Figure 2.3. Breakdown of Caffeine (Fredholm et al., 1999)
(Siegal, 1999; Fredholm et al., 1999). This increase of cAMP activity further serves to
potentiate agents that act by stimulating adenylyl cyclase. It acts in this manner because
the organic structures of xanthenes are similar to that of adenosine. Theophylline is a
product of the breakdown of caffeine, and both are xanthenes (Fredholm et al., 1999;
Siegal, 1999). Theophylline is a well known drug that causes relaxation of the bronchii
and is used in patients with bronchitis (Devlin, 1997). It is possible that either of the
products of caffeine or theophylline could prove beneficial to the avian species,
especially in regards to the pipping muscles. However, increased intracellular cAMP in
rapidly proliferating cells like those that would be common to a developing embryo is
associated with an inhibition of mitosis (Yokoyama et al., 1983). Yokoyama et al.
(1983) examined the responses of embryonic chicks given 21 mM theophylline. At the

23
concentration of 21 mM aortic aneurysms were induced in these embryos at Day 5 of
development. It is unknown if embryos at later stages of development would be more
tolerant to similar or higher concentrations of theophylline. Most of the rapid cellular
division would be complete by the late stages of development and the embryo would be
focusing energies on general growth rather than rapid proliferation and cell
differentiation.
Phosphocreatine and creatine work together to store energy in vertebrate cells
(Voet and Voet, 2004; Devlin, 1997; Mathews, 1990). Phosphagens, like
phosphocreatine allow for an ATP “buffer” in cells that contain creatine kinase, and
allow for the storage of the high energy compound (Voet and Voet, 2004). Creatine and
phosphocreatine are synthesized by reversible phosphorylation where ATP
phosphorylates creatine yielding phosphocreatine and ADP (creatine + ATP ↔
phosphocreatine + ADP) (Voet and Voet, 2004; Devlin, 1997). Because this reaction
occurs while the cell is resting and ATP concentration is high, the reaction proceeds so
that more phosphocreatine is present. As a result, when the cell is in a state of high
activity, such as during pipping and hatching, the reaction reverses to create more
creatine and ATP. As much as 70% of the immediate high-energy stores contained
within the mammalian skeletal muscle are in the form of phosphocreatine (Clark, 1997).
However, in natural conditions there is only enough phosphocreatine stored for the cell to
be able to exert itself for a few seconds under maximum activity, or a few minutes under
normal activity (Clark, 1997). Therefore, it is possible that additional sources of creatine
24
with added phosphate groups or phosphocreatine would allow for longer period of
cellular activity.
Saks et al. (2000) studied the role of creatine and phosphocreatine in the
regulation of mitochondrial respiration. It was shown that the addition of creatine had no
effect on ADP concentration in the medium. The ADP concentration remained the same.
Concentrations of ATP were not altered in the experiment, just the creatine concentration.
This illustrates that creatine is just a storage molecule and, as such, has no effect on the
total cellular concentration of ATP. However, it was found that the mitochondrial
respiration rate was increased by three fold. It is proposed that creatine, by activating
creatine kinase, can directly control mitochondrial energy production. It was
hypothesized that at higher workloads creatine kinase should be upregulated by
increasing creatine concentrations and decreasing phosophocreatine concentrations. It is
known that the cellular concentration of creatine is determined by specific transporters
and creatine transport into the cell is concurrent with sodium against the concentration
gradient (Clark, 1997).
There is a potential drawback to the addition of phosphocreatine to a solution. If
phosphocreatine is orally administered it is readily broken down in the intestinal tract to
creatine, losing the high energy phosphagen (Clark, 1997). However, if injected
intramuscularly or intravenously the phosphocreatine can last for 2 to 5 hours (Clark,
1997). It would be difficult to determine if the embryo actually would ingest the
phosphocreatine injected in ovo through the digestive tract or if it would be non-

25
destructively taken up through a non-active digestive system, or possibly other organs
(i.e. the lungs). Clark (1997) reported that creatine generates an anabolic effect on
muscle tissues by causing increased protein synthesis. This may allow for the pre-build
up of muscles so that at post hatch, the damage is negated, allowing for increased aerobic
recovery by stimulating mitochondrial respiration and oxidative phosphorylation.
Conclusion
There are many options when it comes to evaluating the potential of broilers. One
option is supplemental in ovo injections that can be administered along with the current
vaccine regimen. There are many metabolic, nutritive, or other soluble molecules that
would be suitable for compatibility to Marek’s, or any other, vaccine regimen. These
additives may serve in increasing the general nutritional health of the newly hatched
chicks along with the additives’ proven ability to stimulate post hatch growth, especially
that of the breast muscle (Uni et al., 2005).
26
References
Ar, A. 1991. Egg water movements during incubation. Avian Incubation. S.G. Tullett, ed. Butterworth-Heinemann Ltd., London, UK. 157-173. Ar, A., H. Rahn. 1980. Water in the Avian Egg: Overall Budget of Incubation. American Zoologist. 20:373-384. Arias, V.J. and E.A. Koutsos. 2006. Effects of Copper Source and Level on Intestinal Physiology and Growth of Broiler Chickens. Poultry Science. 85:999-1007. Christensen, V.L., F.M. McCorkle. 1982. Turkey Egg Weight Loss and Embryonic Mortality During Incubation. Poultry Science. 61: 1209-1213. Christensen, V.L., M.J. Wineland, G.M. Fasenko, W.E. Donaldson. 2001. Egg Storage Effects on Plasma Glucose and Supply and Demand Tissue Glycogen Concentrations of Broiler Embryos. Poultry Science. 80:1729-1735. Clark, J.F. 1997. Creatine and Phosphocreatine: A Review of Their Use in Exercise and Sport. Journal of Athletic Training. 32: 45-51. Devlin, T.M. 1997. Textbook of Biochemistry with Clinical Correlations. Wiley and Sons Printing. New York, New York. 206-208, 388-389, 688-689, 1065-1068. Everaert, N., P.M. Coucke, F. Bamelis, B. Kemps, B. De Ketelaere, V. Bruggeman, J. De Baerdemaeker, E. Ducuypere. 2006. Semiautonomous Development of the Extraembryonic Membranes in the Chicken Embryo. Poultry Science. 85:1626- 1631. Foye. O.T., Z. Uni, P.R. Ferket. 2006. Effects of In Ovo Feeding Egg White Protein, β- Hydroxy-β-Methylbutyrate, and Carbohydrates on Glycogen Status and Nenonatal Growth of Turkeys. Poultry Science. 85:1185-1192. Fredholm, B.B., K. Battig, J. Holmen, A. Nehlig, E.E. Zartau. 1999. Actions of Caffeine

27
in the Brain with Special Reference to Factors that Contribute to its Widespread Use. Pharmacological Reviews. 51:83.
Gal-Garber, O., S.J. Mabjeesh, D. Sklan, Z. Uni. 2003. Nutrient Transport in the Small Intestine: Na+, K+-ATPase Expression and Activity in the Small Intestine of the Chicken as Influenced by Dietary Sodium. Poultry Science. 82:1127-1133. Hayes, V.E., and R.S. Hikida. 1976. Naturally-occurring degeneration in chick muscle development: ultrastructure and the M. complexus. Journal of Anatomy. 122:67- 76. Hoyte, D.F. 1979. Osmoregulation of Avian Embryos: The Allantois Functions Like a Toad’s Bladder. Physiological Zoology. 52:354-362. Huerta, M. and E. Stefani. 1981. Potassium and Caffeine Contractures in Fast and Slow Muscles of the Chicken. Journal of Physiology. 318:181-189. Islam, S., M. Abley, N.H. Alam, F. Doussou, A.K.A. Chowdhury, J.F. Desjeux. 2004. Water and Electrolyte Salvage in an Animal Model of Dehydration and Malnutrition. Journal of Pediatric Gastroenterology and Nutrition. 38: 27-33. Jochemsen, P. and S.H.M. Jeurissen. 2002. The Localization and Uptake of In Ovo Injected Soluble and Particulate Substances in the Chicken. Poultry Science. 81:1811-1817. Johnston, P.A., H. Liu, T. O’Connell, P. Phelps, M. Bland, J. Tyczkowski, A. Kemper, T. Harding, A. Avakian, E. Haddad, C. Whitfill, R. Glidersleeve, C.A. Ricks. 1997. Applications in In Ovo Technology. Poultry Science. 76: 165-178. Kernan, R.P. 1980. Cell Potassium. Wiley and Sons Printing. New York, New York. 120-174 Kuurman, W.W., B.A. Bailey, W.J. Koops, M. Grossman. 2001. Effect of Hatch on the Distribution for Failure of an Embryo to Survive Incubation. Poultry Science. 80:710-717. Lima, G.H.P. Carvalho, A.A. Figuerido, A.R. Gifoni, A.M. Soares, E.A.T. Silva, R.L. Guerrant. 2002. Effects of an Alanyl-Glutamine-Based Oral Rehydration and Nutrition Therapy Solution on Electrolyte and Water Adsorption in a Rat Model of Secretory Diarrhea Induced by Choera Toxin. Nutrition. 18:458-462. New, D.A.T. 1956. The Formation of Sub-Blastodermic Fluid in the Hen’s Egg. Journal

28
of Embryology and Experimental Morphology. 4:221-227. Nielsen, H. and V.K.S. Shukla. 2003, In situ solid phase extraction of lipids from Spray-
dried Egg Yolk by Ethanol with Subsequent Removal of Triacylglycerols by Cold Temperature Crystallization. LWT-Food Science and Technology. 37:613-618.
Noble, R.C. and D. Ogunyemi. 1989. Lipid Changes in the Residual Yolk and Liver of the Chick Immediately after Hatching. Biology of the Neonate. 56:228-236. Ohata, Y., M.T. Kidd, T. Ishibashi. 2001. Embryo Growth and Amino Acid Concentration Profiles on Broiler Breeder Eggs, Embryos, and Chicks After In Ovo Administration of Amino Acids. Poultry Science. 80:1420-1436. Ohtsu, H., K. Sato, H. Nishida, Y. Akibia. 2003. High β-hydroxybutyrate concentration in liver and skeletal muscle of newly hatch chicks. Comparative Biochemistry and Physiology Part A. 134:625-629. Parkhurst, C.R., G.J. Mountney, 1988. Poultry Meat and Egg Production.Van Nostrand Reinhold Company, New York. p80 Patten, B.M. 1951. Early Embryology of the Chick. The Blakiston Company. Philadelphia, Pennsylvania. 124-138. Peebles, E. David, Lumu Li, Sherman L. Miller, Tomas Pansky, Sharon Whitmarsh, Mickey A. Latour, and Patrick D. Gerard, 1999. Embryo and yolk compositional relationships in broiler hatching eggs during incubation. Poultry Science. 78:1435-1442. Pulungsih, S.P., N.H. Punjabi, K. Rafli, A. Rifajati, S. Kumala, C.H. Simanjuntack, Yuwono, M. Lesmana, D. Subekti, Sutoto, O. Fontaine. 2006. Standard WHO- ORS Versus Reduced-osmolarity ORS in the Management of Cholera Patients. Journal of Health Popular Nutrition. 24: 107-112 Ragozina, M.N. 1957. Liberation of the Chick Embryo from the Vitelline Membrane and Chalaze of the Egg. DAN SSSR. 113:716 Rehrer, N.J. 2001, Fluid and Electrolyte Balance in Ultra-endurance Sport. Sports Medicine. 31:701-715. Reidy, T.R., J.L. Atkinson, S. Leeson. 1998. Size and Components of Poult Yolk Sacs. Poultry Science. 77:639-643.

29
Rol’nik, V.V. 1970. Bird Embryology. Keter Press Binding. Jerusalem. 93-108. Romanoff, A.L. 1960. The Avian Embryo. Wiley and Sons Printing. New York, New York. Romanoff, A. L. and A. J. Romanoff. 1967. Biochemistry of the Avian Embryo. Wiley and Sons Printing. New York, New York. 144-257. Saks, V.A., O. Kongas, M. Vendelin, L. Kay. 2000. Role of the creatine/phosphocreatine system in the regulation of mitochondrial respiration. Scandinavian Physiological Society. 168: 635-641. Siegel, G.J., B.W. Agranoff, R.W. Albers, S.K. Fisher, M.D. Uhler. 1999. Basic Neurochemistry Molecular, Cellular, and Medical Aspects, 6th Edition. Lippincott, Williams and Wilkins Publisher. Chapter 17. Snyder, J. D. 1991. Use and Misuse of Oral Therapy for Diarrhea: Comparison of US Practices with American Academy of Pediatrics Recommendations. Pediatrics. 87: 28–33. Speake, B.K., A.M.B. Murray, R.C. Noble. 1998. Transport and Transfomrations of Yolk Lipids During Development of the Avian Embryo. Progress in Lipid Research. 37:1-32. Steel, R. G. D. and J. H. Torrie. 1980. Principles and Procedures of Statistics. A Biometrical Approach. 2nd Ed. McGraw-Hill, New York, NY. Stern, C.D.1991. The Sub-embryonic Fluid of the Egg of the Domestic Fowl and its Relationship to the Early Development of the Embry. Avian Incubation. S.G. Tullett, ed. Butterworth-Heinemann, Ltd. 81-87. Tako, E., P.R. Ferket, Z. Uni. 2004. Effects of In Ovo Feeding of Carbohydrates and β- Hydroxy-β-Methylbutyrate on the Development of Chicken Intestine. Poultry Science. 83:2023-2028. Tullet, S.B. and F.G. Burton. 1982. Factors Affecting the Weight and Water Status of the Chick at Hatch. British Poultry Science. 23:361-369. Tulman, E.R. C.L. Afonso, Z. Lu, L. Zsak, D.L. Rock, G.F. Kutish. 2000. The Genome
of a Very Virulent Marek’s Disease Virus. Journal of Virology. 74:7980-7988. Uni, Z., and P. Ferket. 2003. Enhancement of development of oviparous species by in ovo feeding. US Regular Patent US 6,592,878 B2. North Carolina State Univ., Raleigh and Yissum Res. Dev. Co., Hebrew Univ. Jerusalem, Israel.
30
Uni, Z., P.R. Ferket, E. Tako, O. Kedar. 2005. In ovo Feeding Improves Energy Status of Late-Term Chick Embryos. Poultry Science. 84: 764-770. Uni, Z., E. Tako, O. Gal-Garber, D. Sklan. 2003. Morphological, Molecular, and Functional Changes in the Chicken Small Intestine of the Late-Term Embryo. Poultry Science. 82: 1747-1754. Voet, D. and J.G. Voet. 2004. Biochemistry, 3rd edition. Wiley and Sons Printing. New York, New York. Williams, C.J. 2005. In ovo vaccination and chick quality. International Hatchery Practice. 19:7- 13. Yokoyama, H., R. Matsuoka, H.J. Bruyere, E.F. Gilbert, H. Uno. 1983. Light- and Electron-Microscopic Observations of Theophylline-Induced Aortic Aneurysms in Embryonic Chicks. American Journal of Pathology. 112: 258-266. Zhai, W., S. Neuman, M.A. Latour, P.Y. Hester. 2008. The Effect of In Ovo Injection of L-Carnitine on Hatchability of White Leghorns. Poultry Science. 87:569-572.

31
CHAPTER III
EFFECTS OF INDIVIDUAL ELECTROLYTE SALTS, ELECTROLYTE WITH
CARBOHYDRATE, AND STIMULANT SOLUTIONS ON
EMBRYOGENESIS IN BROILER HATCHING EGGS
Abstract
Effects of the automated in ovo injection of various concentrations and volumes
of a variety of physiological salts, a carbohydrate solution, and various stimulants on the
livability and growth of broiler embryos were investigated. Four trials were conducted
separately. Solutions were injected into the amnion of embryos at Day 16 of incubation.
Embryo mortality; relative embryo weight and moisture content; relative dry embryo
weight; and relative yolk sac weight and yolk moisture content were evaluated on Day 18
of incubation in each trial. Trial 1 was conducted to determine the effects of 4 salt
solutions (sodium acetate, potassium chloride, and sodium dihydrogen phosphate) at
various concentrations. Trial 2 was conducted to determine the effects of 2 metabolic
solutions (tripotassium citrate and a carbohydrate/electrolyte solution) and a stimulant
(caffeine) at various concentrations. Trial 3 was conducted to evaluate the effects of
potassium chloride (5.5 mM) and sodium chloride (117 mM) at 200, 400, 800, and 1200
μL volumes. Trial 4 was conducted to compare the effects of caffeine, theophylline,

32
creatine, and phosphocreatine, all at a concentration of 1 mM. None of the experimental
solutions used in any of the 4 trials had a significant effect on embryo mortality. In trial
1, potassium chloride, at all concentrations, increased relative yolk sac weight in
comparison to non-injected controls. In trial 2, all 3 solutions, and all their
concentrations, had no effect of any kind on the parameters examined. In trial 3, the
1000 and 2000 µL potassium chloride and saline volumes reduced percent incubational
egg weight loss in comparison to controls. Furthermore, the 800 µL volume of saline
reduced relative embryo body weight in comparison to non-injected controls. In general,
any volume over 800 µL reduced incubational egg weight loss. In trial 4, relative yolk
sac weight was reduced by all injected materials in comparison with the non-injected
control. In conclusion, the solutions tested have potential for use separately or in
combination for the commercial injection of broiler hatching eggs in order to promote
subsequent hatchability and post hatch growth.
Introduction
The embryo is protected by a shell, but it also has a limited nutrient supply
because it is not attached to its mother by an umbilical cord. While the enclosed
environment in which avian embryos grow provides the necessary reservoirs for
embryogenesis the one time supply of these resources from the mother may become
limiting under the pressures of commercial production. As the embryo develops it
utilizes, and eventually uses, all of its available sources of nutrition. Over the past few
years, some researchers have utilized in ovo injection in an effort to increase chick hatch

33
weight and bird size at the time of processing. It has been shown by Uni et al. (2005) and
Foye et al. (2005) that the injection of nutritional supplements benefit post hatch growth
and the weight gain of birds. The broiler embryos (Ross) examined by Uni et al. (2005)
showed no significant gain after in ovo feeding on Days 19 and 20 of embryonic
development.
Herein, attempts were made to demonstrate the usefulness of metabolic substrates
in the development of embryos between Days 16 and 18 of incubation. In the following
experiments, the possible use of individual electrolyte solution constituents and
stimulants injected in ovo to promote growth and development of the avian embryo were
explored.
In trial 1, the use of various physiological salt solutions that may serve as more
beneficial substitutes for saline were investigated. Potassium chloride is a commonly
known physiological salt, and has the potential to be used as, or more, effectively as
saline. This potential may become important when considering the cellular pump activity
in cells, in that there is always a continuous effort to expel sodium and retain potassium
intracellularly (Voet and Voet, 2004). Sodium acetate has the potential to provide both
sodium and acetate. More specifically, it may provide a Na+ cation without an associated
Cl-anion, which is harmful in high concentrations. Sodium phosphate has the potential of
contributing additional phosphate to the overall metabolic system, thereby increasing the
percentage production of ATP and other high energy compounds.
The carbohydrate/electrolyte nutrient solution tested in trial 2 was the only
complex solution that was tested. This solution was taken from the World Health

34
Organization’s ReSoMal. It was chosen because previous work has demonstrated the
effectiveness of simple carbohydrate solutions in avian embryos (Uni et al., 2005). Also,
these solutions have been originally used for catch-up feeding of malnourished children,
and they have shown effectiveness in maintaining hydration in animals that were well fed
(Islam et al., 2004). Tripotassium citrate has the potential of not only providing additional
potassium for various cellular functions, but also provides the useful citrate anion as
opposed to the harmful chloride ion. It may also serve as an acidity regulator and an
antioxidant.
In trial 3, the comparative effects of various volumes of potassium chloride and
saline were investigated. It was also utilized in order to establish any potential volume
disparities, as throughout in ovo research the volume of trial solution has varied without
cause (Uni et al., 2005; Foye et al., 2005; Ohata et al., 2001). This trial was important to
determine if the effects of potassium chloride were similar or even better, than those of
saline. It also allowed for an evaluation of the effects of varying solution volume on
embryogenesis. Volume as well as concentration effects must be included in order to
best determine the supportive roles of the various salt and metabolic solutions on
embryogenesis and posthatch growth.
In trial 4, the effects of 2 stimulants were investigated. Caffeine serves as both a
metabolic stimulator and a central nervous system stimulator (Siegel et al., 1999). It is
proposed that the in ovo injection of caffeine would increase metabolic activity (which
may promote growth) and would also stimulate muscle activity (which may aid in the
pipping response). Theophylline was also tested because it is a metabolic product of

35
caffeine catabolism (Siegel et al., 1999). There are certain cell types that respond better
to theophylline than caffeine, and as such each form may cause a distinctive response in
different cells (Devlin, 1997). To determine which would provide the best response in an
avian embryo, both were tested. Also, 2 high energy compounds were examined.
Creatine is a high energy storage compound found in many different cells (Voet and
Voet, 2004; Devlin, 1997). However, phosphocreatine may serve as a phosphate
reservoir, thereby reducing the need for ATP as a source by which to load creatine with
phosphate. Phosphocreatine may be more beneficial than creatine, since it would not
utilize the embryo’s own nutrient and energy sources, and would subsequently reduce
yolk sac absorptive requirements. The addition of phosphocreatine may allow avian
muscle cells that are vital to hatching to exert themselves more during the hatching
process, creating a more uniform hatch time, or even stimulating the muscles of chicks
that would not have had the energy to hatch. If raw creatine is available to the cell, the
individual cell could utilize this new storage capacity. It may prove beneficial to provide
the additional phosphagen and allow the chick to utilize it as needed. There is the
potential that more creatine, if added, would allow for better embryonic muscle
stimulation and would allow for more yolk sac utilization.

36
Materials and Methods
Incubation
Broiler hatching eggs (Ross x Ross) were obtained from a commercial source
(Peco Farms, Inc). All eggs used within a trial were taken from a common flock. Eggs
used within different trials were taken from different flocks. However, all eggs were
taken from flocks that were between 35 and 54 weeks of age. All eggs were held for 3 to
4 days prior to setting. Set weights were taken for individual eggs and the eggs were
arranged randomly in each incubator tray level (experimental block). On each tray level,
all treatments were equally represented and representative replicate groups of eggs for
each treatment were set at random. The number of eggs set within each treatment
replicate group for trials 1, 2, 3, and 4, were 5, 5, 10, and 10, respectively. The number
of individual treatment replicate units in trials 1, 2, 3 and 4, were 4, 4, 2 and 2. In trials 1
and 2, the individual replicate units were represented by 2 tray levels in each of 2 tray
columns, and in trials 3 and 4, the individual replicate units were represented by 2 tray
columns on one tray level. Eggs were incubated in a Jamesway AVN single stage
incubator for all trials. Incubator dry bulb temperatures were set at 37.6°C, with a
variable range of 37.5 to 37.7°C during incubation. Incubator wet bulb temperatures were
maintained between 26.0º and 30.0º C (i.e. 83 and 86% relative humidity).

37
Preparation of Solutions
All injected solutions were prepared within 2 to 5 d of injection. A 117 mM saline
solution (pH 4.2) was used as a standard and there was a non-injected control (control,
ni) in all trials. It trials 1 and 2, solutions were prepared in RhoPure water. In trial 1, all
solutions were prepared to achieve a specific molarity. Solution pH was also recorded
for all solutions (Table 3.1). Sodium acetate trihydrate (NaAce; Sigma-Aldrich)
solutions were prepared at 110, 118, 125, and 130 mM. Potassium chloride (KCl; Fisher
Scientific) solutions were prepared at molarities of 4.0, 4.5, 5.0, and 5.5 mM. Sodium
phosphate monobasic (NaH2PO4; Sigma-Aldrich) solutions were prepared at molarities
of 0.5, 1.0, 1.5, and 2.0 mM. In trial 2, the effectiveness of two metabolic solutions in
various dilutions were evaluated. A volumetric dilution series of 1:20 (concentrate :
water) for both the carbohydrate and the salt solutions was performed to accommodate
lower concentrations of solutions that could not be prepared by hand. The pH was also
recorded for each solution (Figure 3.2). For tripotassium citrate monohydrate (3K Cit;
Sigma-Aldrich) the starting concentration was 0.1 M anda dilution series was used to
achieve the lesser volumes (5.0 mM, 0.25 mM, and 0.25 µM concentrations,
respectively). A carbohydrate/electrolyte solution (CEN) was diluted according to the
following dilution series of full strength, 1:20, 1:40, and 1:60; with a pH range of 7.2 to
7.4. The CEN solution is that used in a recipe for catch-up feeding of malnourished
children by the World Health Organization and has multiple constituents at different
concentrations (Table 3.5). The final solution used in trial 2 was the stimulant caffeine
(anhydrous; Sigma-Aldrich), at 1pM, 1, nM, 1μm, 1mM concentrations. The caffeine

38
solutions were prepared via a 1:100 volumetric dilution series. NanoPure water was used
in trial 3 and the solutions were prepared in the standard method for their select molarity.
In trial 3, KCl (5.5 mM) and physiological saline (117 mM) were tested at 200, 400, 800,
and 1200 μL volumes. The specified concentrations for each solution were maintained at
all 4 volumes tested. The pH was measured for both solutions (Figure 3.3). In trial 4,
solutions were prepared in autoclaved water and were then filtered through a TRP©
single use, gamma sterilized syringe filter (0.22 μm) one day prior to injection.
Osmolarities and pH was recorded for all solutions (Figure 3.4). In trial 4 caffeine
(anhydrous; Sigma-Aldrich), theophylline (anhydrous; Sigma-Aldrich), creatine
monohydrate (creatine; Sigma-Aldrich), and phosphocreatine (Sigma-Aldrich) were all
prepared to achieve a common 1 mM concentration. The solutions were likewise
prepared in the standard method for their select molarity. Osmolarities were calculated
for all solutions using the formula mOsm= Φ n C, where Φ was set equal to 0.95
disassociation, n is the number of dissociated ions, and C is the concentration (mM; Table
b).
Injection Procedure
Injections were performed with an AviTech IntellilabTM Single Egg Injector, in
order to reflect commercial application. Eggs were injected through the air cell. A blunt
headed needle with a bore diameter (i.d.) of 0.6 mm (0.023 inches) was used in order to
ensure that no injections were intramuscular. The total length of the needle was 18.4 mm

39
(7.25 inches), which provided an approximate 2.4 mm (0.98 inches) injection depth from
the top of the large end of the egg. To ensure that the material was being delivered into
the amnion, an intralab validation test was performed using a water soluble dye that was
injected at Day 16 of incubation. The test confirmed that solution was being injected into
the amnion. On Day 16 of development, eggs were weighed and randomly assigned to an
injection treatment group prior to injection. In order to avoid crossover contamination of
solutions, all replicate groups of eggs belonging to a particular treatment were injected
with their corresponding solution before switching to another treatment. Solutions were
first drawn into a syringe and the syringe was then attached to the machine. Three mL of
each solution were pumped into the machine prior to injection in order to prime the
system. Injection volumes of 200 µL were used in trials 1, 2, and 4, and in trial 3, the
volumes were made as previously described (200, 800, 1000, and 2000 μL). The
standard error for injection was + 0.1 µL / 100 µL. Eggs were injected individually and
the needle was disinfected after each injection. Once the treatment groups were
completed, they were placed back into the incubator in their corresponding tray and level.
Data collection
Egg weights at set and at Day 16 (time of injection) were recorded. Egg weights
at these times were determined in order to statistically correct for any possible treatment
bias and to ensure that weight loss was consistent. On Day 18 of development eggs were
weighed, arranged numerically, and then broken out. Embryos were subsequently

40
removed, and yolk sacs and embryos were weighed separately. Any developmental or
positional abnormalities were noted, as well as any obvious physiological anomalies or
contamination. Any data from contaminated eggs was not included in the final data
analysis. Embryos and yolks were placed into a drying oven until there was no more
noted weight loss (at least 2 weeks), and then dry weights of each were recorded. In
trials 1, 2, 3, and 4, all late stage embryos (Days 16 to 18) that showed no evidence of
contamination were considered for analysis. The following parameters were evaluated in
all 4 trials: set egg weight; percent incubational egg weight loss (0-18 d); and relative
embryo body weight, relative yolk sac weight, percent embryo moisture, and percent yolk
sac moisture at Day 18 of incubation. Also, all trials were evaluated in terms of percent
embryo mortality at the early-, mid-, and late- stages were also evaluated in all trials.
Statistical Analysis
A completely randomized block experimental design, with incubation tray level
as a block, was employed. Individual eggs were considered as sub-samples within each
replicate treatment group. Individual trial data were analyzed separately. A non-injected
control treatment and a standard saline (117 mM) –injected treatment were included
among the treatment groups examined. Means were compared in the event of significant
global effects (Steel and Torrie,1980). Global effect means were considered significant at
P < 0.10 and treatment mean separations were considered significant at with P < 0.05.
All data were analyzed using the GLM procedure of SAS software, version 9.1 (SAS

41
Institute, 2003), that contained a random statement to account for sub-sampling. In the
event of statistical set egg weight differences, set egg weight was assigned as a covariate
in the analysis.
Results
In trial 1, set egg weight, percent incubational egg weight loss, relative embryo
body weight, percent embryo moisture, percent yolk sac moisture, and mortality were not
significantly affected by treatment. However, it was found that treatment did affect
relative yolk sac weight (P < 0.10; Figure 3.1). Except for the 130 mM Na Ace
treatment, relative yolk sac weight was statistically increased by all injected solutions in
comparison to non-injected controls. Furthermore, saline significantly increased relative
yolk sac weights compared with 118 and 130 mM Na Ace, and 0.5 and 1.5 mM
NaH2PO4. Upon comparing treatments containing the same solute and within a close
range of molarity, no statistically significant differences were observed. In trial 2, there
were no significant treatment effects for set egg weight, percent incubational egg weight
loss, relative embryo body weight, percent embryo moisture, relative yolk sac weight,
percent yolk sac moisture, or mortality.
In trial 3, there were no significant affects due to treatment for set egg weight,
relative embryo body weight, relative yolk sac weight, percent embryo moisture, percent

42
yolk sac moisture, or mortality. However, there was a significant treatment effect on
percent egg weight loss (P < 0.05; Figure 3.2). The addition of 200 µL of saline, and
1000 and 2000 µL volumes of KCl or saline significantly decreased percent incubational
egg weight loss below that of the non-injected control group. Nevertheless, the 200 μL
and 800 μL volumes of KCl and the 200 μL volumes of saline did not produce an effect
that was statistically different from that of the control group. Upon comparing treatments
containing the same solute and within a close range of molarity, no statistically
significant differences were noted, except for a significant difference between the 800
and 2000 µL volumes of saline. The 2000 µL volume reduced percent incubational egg
weight loss in comparison to that of the 800 μL volume of saline. In trial 3, there was
also a significant effect due to treatment on relative embryo body weight (P < 0.05;
Figure 3.3). It was found that relative embryo body weight in eggs injected with KCl at
the 1000 µL volume and saline at the 200, 800, and 1000 µL volumes were statistically
lower than the control. When comparing treatments containing the same solute and
within a close range of molarity, relative Day 18 embryo body weight was lower for the
1000 μL compared to the 200 µL KCl volume, and was higher for the 2000 μL compared
to the 800 μL volume of saline.
In trial 4, there were no significant treatment effects on set egg weight, percent
egg weight loss, relative embryo body weight, percent embryo moisture, relative yolk sac
weight, percent yolk sac moisture, or mortality. However, there was a significant
treatment effect on relative yolk sac weight (P < 0.05; Figure 3.4). No significant

43
differences occurred between all injected treatments and the non injected control.
However, all were significantly higher than the saline injected control.
All measurements found to be significant were normalized using calculated
miliosmolality (mOSm). The mOsm for the solutions was calculated using the formula
mOsm= Φ n C; where Φ was set equal to 0.95 disassociation, n is the number of
dissociated ions, and C is the concentration. These figures and the numbers used to
achieve them are reported in the Appendix.
Discussion
The results of trial 1 suggest that most of the solution types and concentrations
tested increased Day 18 relative yolk sac weight in comparison to controls. The
exceptions to this were 118 and 130 mM NaAce, and 0.5 and 1.5 mM NaH2PO4. The
KCl at all concentrations (4.0, 4.5, 5.0, and 5.5 mM) tested increased relative yolk sac
weight. Upon comparing the effects of the various concentrations within the NaAce and
NaH2PO4 solutions, it was found that concentration had no effect. However, upon
normalization of the data with calculated mOsm it was found that NaH2PO4 is more
affected by mOsm than the KCl or NaAce (Figure 3.2b). However, unlike KCl, in the
concentration ranges tested, both NaAce and NaH2PO4 lack the effectiveness to increase
relative yolk sac weight. Therefore, it is possible that KCl concentrations between 4.0
and 5.5 mM have the potential to effectively decrease the rate of yolk sac absorption from

44
16 to 18 d of incubation. The possible ramifications of this effect on hatchability and
posthatch growth are considered in subsequent trials.
In trial 3, the reduction of 0 to 18 d percent incubational egg weight loss through
the use of 200, 1000, and 2000 µL volumes of saline (117 mM) or 1000 and 2000 μL
volumes of KCl (5.5 mM) suggest that the higher volumes of both solutions are effective
in reducing incubational egg weight loss. This is further supported by the fact that the
2000 µL volume of saline reduced egg weight loss in comparison to the 800 μL volume.
Added saline or KCl solutions at these volumes apparently significantly replaced the
moisture that is lost through normal egg shell conductive processes during incubation.
However, because eggs must lose on the order of 12 to 15% of their set egg weight prior
to pipping (Ar, 1991), the possible effects of solution replacement on time of hatch and
hatchability must be considered. It was noted that upon normalization for mOsm that with
a constant molarity KCl has a more substantial volume effect than the volume effect of
NaCl (Figure 3.2b, 3.3b). What is also noted is that in both percent egg weight loss and
relative embryo body weight the effects are similar and relative to each other. These
results support an exploration into the effects of solution volumes larger than the
commonly used injection volumes in other trials of this study.
In trial 4, the injection of 117 mM saline at Day 16 significantly reduced Day 18
relative yolk sac weight in comparison to the non-injected control group, as well as the
treatments in which 1 mM concentrations of caffeine, theophylline, creatine or
phosphocreatine were used. This would suggest that 117 mM saline itself caused a

45
reduction in relative yolk sac weight because of the comparatively higher relative yolk
sac weight in the control group. Because of the opposite effect of the 117 mM saline in
comparison to controls was noted in trial 1, further controlled studies should be
conducted to confirm this specific effect on the yolk sac. Furthermore, the results also
indicate that none of the stimulants tested had a negative influence on relative yolk sac
weight. When normalization of the solutions, by mOsm, was applied it was found that
the stimulant solutions maintained their original relativity to the control and to the
original measurements. These stimulants might, therefore, have no effect on yolk
utilization by the embryo between Days 16 and 18 of incubation. If these stimulants were
used for purposes of stimulating the hatching process they might then have no subsequent
affect on yolk energy reserves.

46
References
Devlin, T.M. 1997. Textbook of Biochemistry with Clinical Correlations. Wiley and Sons Printing. New York, New York. 206-208, 688-689. Foye. O.T., Z. Uni, P.R. Ferket. 2006. Effects of In Ovo Feeding Egg White Protein, β- Hydroxy-β-Methylbutyrate, and Carbohydrates on Glycogen Status and Nenonatal Growth of Turkeys. Poultry Sci. 85:1185-1192. Islam, S., M. Abley, N.H. Alam, F. Doussou, A.K.A. Chowdhury, J.F. Desjeux. 2004. Water and Electrolyte Salvage in an Animal Model of Dehydration and Malnutrition. Journal of Pediatric Gastroenterology and Nutrition. 38: 27-33. Ohata, Y., M.T. Kidd, T. Ishibashi. 2001. Embryo Growth and Amino Acid Concentration Profiles on Broiler Breeder Eggs, Embryos, and Chicks After In Ovo Administration of Amino Acids. Poultry Sci. 80:1420-1436. York. Siegel, G.J., B.W. Agranoff, R.W. Albers, S.K. Fisher, M.D. Uhler. 1999. Basic Neurochemistry Molecular, Cellular, and Medical Aspects, 6th Edition. Lippincott, Williams and Wilkins Publisher. Ch 17. Steel, R. G. D. and J. H. Torrie. 1980. Principles and Procedures of Statistics. A Biometrical Approach. 2nd Ed. McGraw-Hill, New York, NY. Uni, Z., P.R. Ferket, E. Tako, O. Kedar. 2005. In ovo Feeding Improves Energy Status of Late-Term Chick Embryos. Poultry Sci. 84: 764-770. Voet, D. and J.G. Voet. 2004. Biochemistry, 3rd edition. Wiley and Sons Printing. New York, New York.

47
Table 3.1a Solutions used in trial 1 including pH.
Trial 1
Solution Molarity
(mM) pH Sodium Acetate (CH3COONa · 3H2O) 110 9.41 Sodium Acetate (CH3COONa · 3H2O) 118 9.31 Sodium Acetate (CH3COONa · 3H2O) 125 9.22 Sodium Acetate (CH3COONa · 3H2O) 130 8.67
Sodium Phosphate (NaH2PO4) 0.5 7.91 Sodium Phosphate (NaH2PO4) 1.0 7.36 Sodium Phosphate (NaH2PO4) 1.5 7.06 Sodium Phosphate (NaH2PO4) 2.0 7.02
Potassium Chloride (KCl) 4.0 8.96 Potassium Chloride (KCl) 4.5 9.34 Potassium Chloride (KCl) 5.0 9.14 Potassium Chloride (KCl) 5.5 9.17

48
Table 3.2 Solutions used in trial 2 including pH.
Trial 2
Solution Molarity
(mM) pH CEN [Sucrose] 73.0 8.19 CEN [Sucrose] 31.6 8.71 CEN [Sucrose] 0.2 8.96 CEN [Sucrose] 9.0x10⁻³ 9.18
Caffeine (C8H10N4O2) 1.0 9.24 Caffeine (C8H10N4O2) 1.0x10⁻³ 9.21 Caffeine (C8H10N4O2) 1.0x10⁻⁶ 9.23 Caffeine (C8H10N4O2) 1.0x10⁻⁹ 9.25 Tripotassium Citrate
(HOC(COOK)(CH2COOK)2 · H2O) 100 8.91 Tripotassium Citrate
(HOC(COOK)(CH2COOK)2 · H2O) 5.0 9.09 Tripotassium Citrate
(HOC(COOK)(CH2COOK)2 · H2O) 0.2 9.09 Tripotassium Citrate
(HOC(COOK)(CH2COOK)2 · H2O) 1.2x10⁻² 9.08
Table 3.3 Solutions used in trial 3 including pH.
Trial 3 Solution Molarity (mM) pH
Potassium Chloride (KCl) 5.5 9.17
Sodium Chloride (NaCl) 117 8.32

49
Table 3.4a Solutions used in trial 4 including pH.
Trial 4 Solution Molarity (mM) pH
Caffeine (C8H10N4O2) 1.0 9.26 Theophylline (C7H8N4O2) 1.0 9.27
Creatine (C4H9N3O2 · H2O) 1.0 9.13 Phosphocreatine
(C4H8N3Na2O5P.4H2O) 1.0 8.59
Table 3.5 Carbohydrate/electrolyte solution (CEN) constitutive elements with mM concentrations as studied in trial 2.
Solution Strength (mM)
CEN,
full strength CEN [1:20] CEN [1:40] CEN [1:60] Potassium Chloride1 22.0 1.1 0.05 2.7x10⁻³
Tripotassium Citrate2 1.0 5.0x10⁻² 2.5x10⁻³ 1.2x10⁻⁵
Magnesium Chloride1 1.5 7.0x10⁻² 3.7x10⁻³ 1.8x10⁻⁴
Zinc Acetate2 0.3 2.0x10⁻² 7.0x10⁻⁴ 3.7x10⁻⁵
Copper (II) Sulfate2 4.0 x 10⁻² 1.7x10⁻³ 8.7x10⁻⁶ 4.4x10⁻⁶
Sodium Citrate2 9.9 0.5 2.0x10⁻² 1.2x10⁻³
Sodium Chloride2 59.9 3.0 0.2 7.5x10⁻³
Glucose1 111.0 5.5 0.3 1.4x10⁻²
Sucrose2 73.0 3.6 0.2 9.1x10⁻⁴
1 Fisher Scientific; 2Sigma-Aldrich
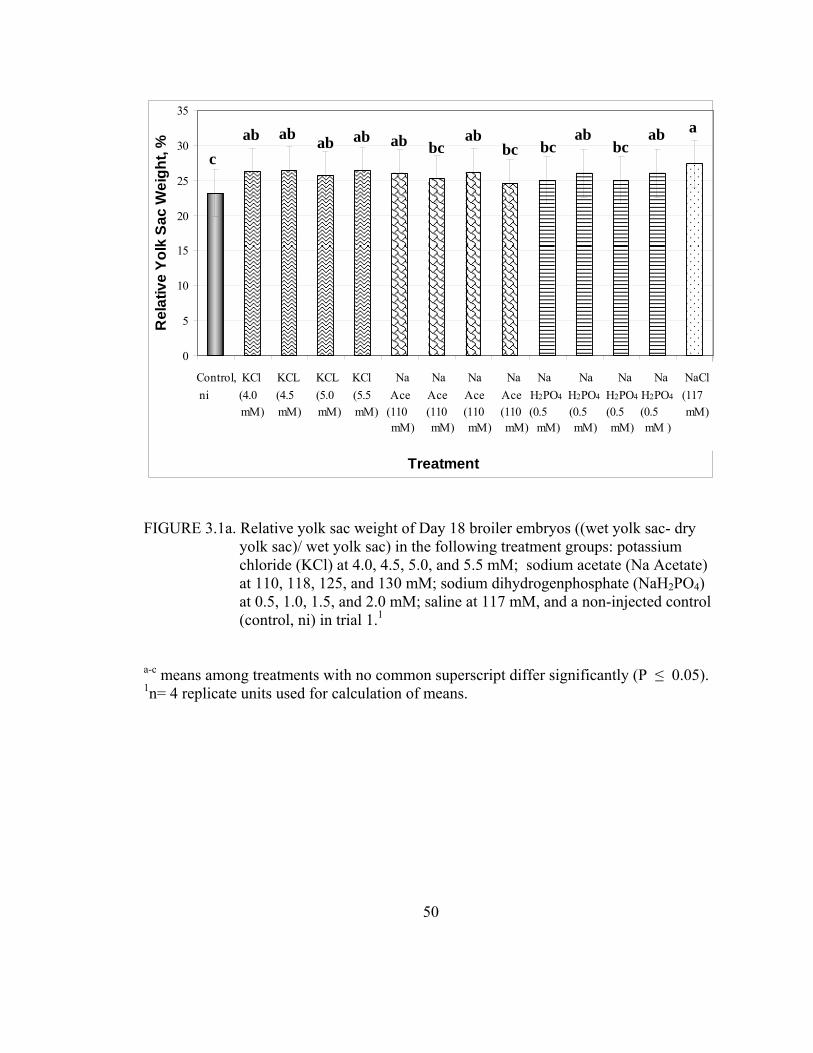
50
0
5
10
15
20
25
30
35
Contro
l, ni
KCl (4.0 m
M)
KCl (4.5 m
M)
KCl (5.0 m
M)
KCl (5.5 m
M)
NaAcet
ate (1
10 m
M)
Na Acet
ate (1
18 mM)
Na Acet
ate (1
25 mM)
Na Acet
ate (1
30 mM)
NaH2P
O4 (0.5
mM)
NaH2P
O4 (1.0
mM)
NaH2P
O4 (1.5
mM)
NaH2P
O4 (2.0
mM)
NaCl (1
17 m
M)
Treatment
Rel
ativ
e Yo
lk S
ac W
eigh
t, %
Control, KCl KCL KCL KCl Na Na Na Na Na Na Na Na NaCl ni (4.0 (4.5 (5.0 (5.5 Ace Ace Ace Ace H2PO4 H2PO4 H2PO4 H2PO4 (117 mM) mM) mM) mM) (110 (110 (110 (110 (0.5 (0.5 (0.5 (0.5 mM) mM) mM) mM) mM) mM) mM) mM) mM )
FIGURE 3.1a. Relative yolk sac weight of Day 18 broiler embryos ((wet yolk sac- dry
yolk sac)/ wet yolk sac) in the following treatment groups: potassium chloride (KCl) at 4.0, 4.5, 5.0, and 5.5 mM; sodium acetate (Na Acetate) at 110, 118, 125, and 130 mM; sodium dihydrogenphosphate (NaH2PO4) at 0.5, 1.0, 1.5, and 2.0 mM; saline at 117 mM, and a non-injected control (control, ni) in trial 1.1
a-c means among treatments with no common superscript differ significantly (P ≤ 0.05). 1n= 4 replicate units used for calculation of means.
c ab ab ab ab ab bc
ab bc bc
ab bc
ab a

51
0
2
4
6
8
10
12
14
16
Control,ni
200 μL KCl
(5.5 mM)
800 μL KCl
(5.5 mM)
1000 μL KCl
(5.5 mM)
2000 μL KCl
(5.5 mM)
200 μL NaCl
(117mM)
800 μL NaCl
(117mM)
1000 μL NaCl
(117 mM)
2000 μL NaCl
(117 mM)Treatment
0-18
d E
gg W
eigh
t Los
s, %
FIGURE 3.2a. Percent 0- 18 d incubational egg weight loss (0-18 d water loss(g)/ set egg
weight (g)) in the following treatment groups: 5.5 mM potassium chloride (KCl) at 200, 800, 1000, and 2000 μL volumes; 117 mM saline at 200, 800, 1000, and 2000 μL volumes; and a non-injected control (control, ni) in trial 31.
a-c means among treatments with no common superscript differ significantly (P ≤ 0.05). 1n= 2 replicate units used for calculation of means.
a aab
bc bc
ab bc
bc
c

52
0
10
20
30
40
50
60
70
Control,ni
200 μL KCl
(5.5 mM)
800 μL KCl
(5.5 mM)
1000 μL KCl
(5.5 mM)
2000 μL KCl
(5.5 mM)
200 μL NaCl
(117 mM)
800 μLNaCl
(117 mM)
1000 μLNaCl
(117 mM)
2000 μLNaCl
(117 mM)Treatment
Rel
ativ
e E
mbr
yo B
ody
Wei
ght,
%
FIGURE 3.3a. Relative embryo body weights of Day18 broiler embryos (wet embryo
(g)/dry embryo (g)) in the following treatment groups: 5.5 mM potassium chloride (KCl) at 200, 800, 1000, and 2000 μL volumes; 117 mM saline at 200, 800, 1000, and 2000 μL volumes; and a non-injected control (control) in trial 31.
a-c means among treatments with no common superscript differ significantly (P ≤ 0.05). 1n= 2 replicate units used for calculation of means.
a a ab bc ab bc c bc ab

53
05
101520253035
Contro
l
Caffein
e (1.0 m
m)
Theoph
ylline (
1.0 m
M)
Creatin
e (1.0
mM)
Phospho
creati
ne (1.0 m
M)
NaCl (1
17 m
M)
Treatment
Rel
ativ
e Y
olk
Sac
Wei
ght,
%
FIGURE 3.4a. Relative yolk sac weight of Day 18 broiler embryos (wet yolk sac (g)/ D
18 egg weight (g)) in the following treatment groups: 1 mM caffeine, theophylline, creatine and phosphocreatine; 117 mM saline; and a non-injected control (control, ni) in trial 41.
a-b means among treatments with no common superscript differ significantly (P ≤ 0.05). 1n= 2 replicate units used for calculation of means.
a a a a ab

54
CHAPTER IV
EFFECTS OF COMBINATORIAL ELECTROLYTE WITH CARBOHYDRATE OR
ELECTROLYTE AND STIMULANT SOLUTIONS ON EMBRYOGENESIS IN
BROILER HATCHING EGGS
Abstract
Effects of automated in ovo injection of 5.5 mM potassium chloride in
conjunction with a carbohydrate, a stimulant or another salt on the livability and growth
of broiler embryos were investigated. Two trials were conducted separately. Solutions
were injected into the amnion of embryos at Day 16 of incubation. Embryo mortality;
relative embryo weight and moisture content; relative dry embryo weight; and relative
yolk sac weight and yolk moisture content were evaluated on Day 18 of incubation in
each trial. Trial 1 was conducted to determine the effectiveness of a 5.5 mM solution of
potassium chloride as a carrier solution for various compounds previously described.
The 5.5 mM potassium chloride solution was tested in combination with a
carbohydrate/electrolyte solution, tripotassium citrate, and sodium dihydrogen
monophosphate. In trial 2, 5.5 mM potassium chloride solutions were also tested in
combination with the addition of 1mM caffeine, theophylline, creatine monohydrate, and
L-arginine. None of the injected solutions had a significant effect on embryo mortality.
In trial 1, relative embryo body weight was significantly reduced by the

55
carbohydrate/electrolyte, sodium monophosphate, and tripotassium citrate solutions. In
trial 1, saline and all injected solutions carried in potassium chloride (5.5 mM) increased
embryo body moisture over that of the control. In trial 2, all 4 solutions had no effect of
any kind on the parameters examined. In conclusion, the solutions tested have potential
for use individually or in combination in the commercial injection of broiler hatching
eggs, however variable effects on embryo body weight and moisture content may result.
Introduction
The embryo is protected by a shell, but it also has a limited nutrient supply
because it is not attached to its mother by an umbilical cord. While the enclosed
environment in which avian embryos grow provides the necessary reservoirs for
embryogenesis, the one-time supply of these resources from the mother may become
limiting under the pressures of commercial production. As the embryo develops, it
utilizes, and eventually uses, all of its available sources of nutrition. Over the past few
years, some researchers have utilized in ovo injection in an effort to increase chick hatch
weight and bird size at the time of processing. It has been shown by Uni et al. (2005) and
Foye et al. (2006) that the injection of nutritional supplements benefit post hatch growth
and the weight gain of birds. The broiler embryos (Ross) examined by Uni et al. (2005)
showed no significant gain after in ovo feeding on Days 19 and 20 of embryonic
development. Herein, attempts were made to demonstrate the usefulness of the addition
of electrolytes in the development of embryos between Days 16 and 18 of incubation. In
the following experiments, the possible use of electrolyte solutions injected in ovo to
56
promote growth and development of the avian embryo were explored. Multiple
electrolyte solutions, all with a 5.5 mM potassium chloride base, and a stimulant carried
in 5.5 mM potassium chloride were evaluated.
In previous studies, the potential use of other physiological salt solutions was
investigated and it was found that they could serve to increase relative yolk sac weight.
This may serve to allow for the conservation of nutritive resources for the embryo. It is
thought that this conservation of the yolk was due to the increase in moisture due to the
injection of a salt electrolyte solution.
In trial 1, 5.5 mM potassium chloride was combined with a carbohydrate based
solution, a stimulant, or another salt. Potassium chloride was selected due to its ability to
retain its effectiveness within a 1 mM concentration. It is possible that potassium
chloride may be useful to conserve the yolk sac without having an adverse effect on the
body weight. It may be able to complement the effects of additional electrolyte salts and
the addition of a stimulant. As shown in Chapter III, trial 1, a concentration of 4.0 to 5.5
mM of potassium chloride were equally effective. Therefore, potassium chlorides may
serve as a non-toxic base, up to 5.5 mM. With regards to the carbohydrate/electrolyte
solution there are several reports that indicate that increasing the potassium chloride
concentration is not detrimental to the overall function of the solution (Islam et al., 2004).
Sodium phosphate (NaH2 ●PO4) has the potential of adding additional phosphate (PO4) to
the overall system, allowing the increase concentration and potential storage in high
energy compounds. Tripotassium citrate has the possibility of providing additional
57
potassium to cellular function, and also citrate rather than a negative chloride ion. It can
also serve as an acidity regulator and an antioxidant.
In trial 2, the effects of stimulants and high energy compounds carried in 5.5 mM
potassium chloride was evaluated. Caffeine serves as both a muscle stimulator, and a
central nervous system stimulator (Voet and Voet, 2005, Fredholm et al., 1999). It is
proposed that the in ovo injection of caffeine would stimulate cellular activity (which
may promote growth) and may also stimulate muscle activity (which may aid in the
pipping response). Theophylline was also tested because it is a product of caffeine
catabolism (Devlin, 1997). There are certain cell types that respond better to
theophylline than caffeine, and as such each form has a distinctive response in different
cells (Devlin, 1997). To see which provided the best response in avian embryos both
were tested. Creatine is a high energy storage compound found in many different cells
(Devlin, 1997). However, phosphocreatine serves as the actual energy reservation
molecule. It is possible that the addition of creatine to the salt solution may encourage
the cells to load the creatine, causing more yolk utilization during incubation and
reducing the “wasted” yolk. L-Arginine was evaluated for its potential as a glycolytic
amino acid and has shown to be effective in turkeys (Foye et al., 2006). Arginine, which
was studied in trial 2, is a known glycolytic amino acid (Voet and Voet, 2004; Devlin,
1997). Glucose is important in electrolyte solutions as an electrolyte balancer,
functioning by increasing water absorption (Rehrer, 2001; Snyder, 1991). Amino acids
that serve glycolytic functions have proven useful in the place of glucose in some tested
electrolyte solutions (Zhai, 2008; Lima, et al., 2002).

58
Materials and Methods
Incubation
Broiler hatching eggs (Ross x Ross) were obtained from a commercial source
(Peco Farms, Inc). All eggs used within a trial were taken from a common flock. Eggs
used within different trials were taken from different flocks. However, all eggs were
taken from flocks that were between 35 and 54 wk of age. All eggs were held for 3 to 4 d
prior to setting. Set weights were taken for individual eggs and the eggs were arranged
randomly in each of two incubator tray (experimental blocks). In each tray, all treatments
were equally represented and representative replicate groups of eggs for each treatment
were set at random. The number of eggs set within each treatment replicate group, and
saline group, for trials 1 and 2, were 10, and 8, respectively. In both trials there were 10
eggs in the 2 control replicate groups. There were 2 individual treatment replicate units
in trials 1 and 2. In trials 1 and 2, the individual replicate units were represented by 2
tray columns on one tray level. Eggs were incubated in a Jamesway AVN single stage
incubator for all trials. Incubator dry bulb temperatures were set at 37.6°C, with a
variable range of 37.5 to 37.7°C during incubation. Incubator wet bulb temperatures were
maintained between 26.0º and 30.0º C (i.e. 83 and 86% relative humidity).

59
Preparation of Solutions
Solutions were prepared within 2 to 5 d of injection. In all trials, a 117 mM saline
treatment was used as a standard and there was a non-injected control (control). In trials
1 and 2, autoclaved water was used to prepare solutions and then the solutions were
filtered through a TRP© single use, gamma sterilized syringe filter (.22 μm) the day
before injection. In trial 1, the following compounds and stimulants were carried in 5.5
mM potassium chloride (KCl; Fisher Scientific): carbohydrate/electrolyte (1:40; CEN),
tripotassium citrate monohydrate (5.0 mM; 3K Cit; Sigma-Aldrich), and sodium
phosphate monobasic (1.0 mM; NaH2PO4; Sigma-Aldrich) were investigated. The
concentrations of the compounds found in the CEN are listed in Table 4.3. In trial 1, the
solutions were made similar to the method described previously (Chapter III, trial 2),
where a dilution was utilized to reach the desired volume. Once the final 1L volume was
attained then the correct amount of KCl was added to create a KCl 5.5 mM concentration.
Solution pH was measured and recorded (Table 4.1). In trial 2, the efficacies of 1 mM
caffeine (anhydrous; C8H10N4O2; Sigma-Aldrich), theophylline (anhydrous), creatine
monohydrate (Creatine; C4H9N3O2 · H2O; Sigma-Aldrich), or L-arginine in solution with
KCl (5.5 mM; Rexall, Inc.) were investigated. The solutions were prepared in the
standard method for their select molarity, and again the correct amount of KCl was added
to ensure a 5.5 mM concentration when the solution was brought to 1 L. Solution pH
was measured (Table 4.2). Osmolarities were calculated for all solutions using the

60
formula mOsm= Φ n C, where Φ was set equal to 0.95 disassociation, n is the number of
dissociated ions, and C is the concentration (mM; Table b).
Injection Procedure
Injections were preformed with an AviTech IntellilabTM Single Egg Injector, in
order to reflect commercial application. Eggs were injected through the air cell. A blunt
headed needle with a bore diameter (i.d.) of 0.6 mm (0.023 inches) was used in order to
ensure that no injections were intramuscular. The total length of the needle was 18.4 mm
(7.25 inches), which provided an approximate 2.4 mm (0.98 inches) injection depth from
the top of the large end of the egg. To ensure that the material was being delivered into
the amnion, an intralab validation test was performed using a water soluble dye that was
injected at Day16 of incubation. The test confirmed that solution was being injected into
the amnion. On Day 16 of development, eggs were weighed and randomly assigned to an
injection treatment group prior to injection. For all replicate groups of eggs, the solutions
belonging to a particular treatment were injected with their corresponding solution before
switching to another treatment in order to avoid crossover contamination. Solutions were
first drawn into a syringe and the syringe was then attached to the machine. Three mL of
each solution were pumped into the machine prior to injection in order to prime the
system. Injection volumes of 200 µL were used in trials 1 and 2. The standard error for
injection was + 0.1 µL / 100 µL. Eggs were injected individually and the needle was

61
disinfected after each injection. Once the treatment groups were completed, they were
placed back into the incubator in their corresponding tray and level.
Data collection
Egg weights at set and at Day 16 of incubation (time of injection) were recorded.
Egg weights at these times were used to ensure that weight loss was consistent and to
account for any possible set egg weight differences in the data analysis of subsequent
observations. On Day 18 of development eggs were weighed, arranged numerically, and
then broken out. Day 18 egg weight was used to calculate 0 to 18 d percent incubational
egg weight loss. Embryos were subsequently removed. Yolk sacs and embryos were
weighed separately. Any developmental or positional abnormalities were noted, as well
as any obvious physiological anomalies or contamination. Any data from contaminated
eggs was not included in the final data analysis. Embryos and yolks were placed into a
drying oven until weight loss ceased (at least 2 wk), and then dry weights of each were
recorded. In trials 1 and 2, all late stage embryos (Days 16 to 18) that lacked evidence of
contamination were considered for analysis. The following parameters were evaluated in
all trials: set egg weight, percent incubational egg weight loss (0 to 18 d); and relative
embryo body weight, relative yolk sac weight, percent embryo moisture, and percent yolk
sac moisture at Day 18 of incubation. Also, all trials were evaluated in terms of percent
embryo mortality at the early-, mid-, and late- stages of development.

62
Statistical Analysis
A completely randomized block experimental design, with incubation trays used
as a block, was employed. Individual eggs were considered as sub-samples within each
replicate treatment group. Individual trial data were analyzed separately. A non-injected
control treatment and a standard saline (117 mM) –injected treatment were included
among the treatment groups examined. Least-squares means were compared in the event
of significant global effects (Steel and Torrie,1980). Global effects were considered
significant at P < 0.10 and differences among least-squares means were considered
significant at with P < 0.05. All data were analyzed using the GLM procedure of SAS
software, version 9.1 (SAS Institute, 2003), that contained a random statement to account
for sub-sampling. In the event of statistical set egg weight differences, set egg weight
was assigned as a covariate in the analysis.
Results
In trial 1, there were no significant treatment effects on set egg weight, relative
yolk sac weight, percent yolk sac moisture, or mortality. There was a significant
treatment effect on Day 0 to 18 percent incubational egg weight loss (P < 0.10; Figure

63
4.1). Percent egg weight loss was significantly lower in all groups receiving an injected
solution in comparison to controls. However, there were no significant differences
between those group injected with a solution. There was a significant treatment effect on
relative embryo body weight (P < 0.10; Figure 4.2). Relative Day 18 embryo body
weight was significantly higher in the control group compared to the CEN, NaH2PO4, and
3K Cit groups with the saline group intermediate. Furthermore, the NaH2PO4 group was
significantly lower than the saline group with the CEN and 3K Cit groups intermediate.
There was also a significant treatment effect on percent Day 18 embryo body moisture (P
< 0.10; Figure 4.3). Embryo body moisture at Day 18 was significantly higher in all
groups injected with a solution compared to controls.
In trial 2, there were no significant treatment effects on set egg weight, percent
incubations egg weight loss (0 to 18 d), relative embryo body weight, percent embryo
moisture, relative yolk sac weight, percent yolk sac moisture, or mortality.
All measurements found to be significant were normalized using calculated
miliosmolality (mOSm). The mOsm for the solutions was calculated using the formula
mOsm= Φ n C; where Φ was set equal to 0.95 disassociation, n is the number of
dissociated ions, and C is the concentration. These figures and the numbers used to
achieve them are reported in the Appendix.
64
Discussion
All the solutions injected in this trial (saline, CEN, NaH2PO4, and 3K Cit)
significantly reduced percent 0 to 18 d incubational egg weight loss. This was associated
with a significant increase in embryo moisture content. The water content of embryos has
been shown by Ar (1991) to be inversely associated with incubation egg weight loss.
Therefore, the results would suggest that the injection of 200 μL of all the solutions at
their various concentrations tested are capable of significantly increasing body moisture.
It would follow that the increase in body moisture was subsequent to the replacement of
moisture levels in the egg that would have normally been lost from 16 to 18 d of
incubation. However, the injection of an individual solution at a 200 µL volume was not
previously shown to impact water loss during incubation (Chapter III).
It is also not clear as to why the injection saline reduced percent incubational egg
weight loss to such an extent, as it has not performed in this manner in previous trials
(Chapter III). The amnion serves to protect the embryo from desiccation and an influx of
water to the amnion and embryo may occur from other compartments in the egg through
a reversal of osmolarity or water potential between the embryo and the rest of the egg
(Ar, 1991). Therefore, it is worth considering that the introduction of electrolytes and
solutes may introduce a concentration gradient that would cause a shift in water
movement to the embryonic tissues. However, as noted in Chapter III, the introduction
of KCl at a similar concentration into the amnion did not have an effect on embryo
65
moisture content. Therefore, the creation of an osmotic gradient between the embryo and
egg through the use of the solutions tested does not seem plausible.
Nevertheless, it is postulated that the additional metabolic activity induced by the
CEN, NaH2PO4, and 3K Cit may have initiated the decrease in body weight. Despite the
associated effects of all the injected solutions on incubation egg weight loss and embryo
moisture content, relative embryo body weight at Day 18 was reduced by all the injected
solutions except for saline. This would suggest that although moisture content was
increased, other tissue contents may have been negatively affected by CEN, NaH2PO4,
and 3K Cit, to cause an overall reduction in relative body weight. It might also be stated
that although there was a loss in dry body matter, embryo weight was compensated for by
the addition of moisture. The affected tissue components are unknown because of the
limited tissue analysis. Further research should be conducted to determine how other
tissue profiles are actually affected. This should include an analysis of body tissue fat,
protein and carbohydrate. Despite natural increases in body tissue lipid and decrease in
body tissue protein and moisture concentrations between 16 and 18 d of incubation
(Peebles et al., 1999), Romanoff and Romanoff (1967) reported that the most extensive
use of lipids, via lipid hydrolysis and β-oxidation, begin after Day 15 of incubation. The
higher percentage of water present in the embryo, therefore, may be a result of more
extensive lipid hydrolysis, which was stimulated by the injected electrolyte solutions. It
was noted that, after data was normalized using mOsm, that the effects across all
significant measurements were similar and relative to each other (Figure 4.1b, 4.2b,
4.3b). This indicates a real response to these solutions in the embryo. Nevertheless,

66
although these embryonic tissue component changes might be exaggerated by the
injection of these electrolyte solutions, they may be later corrected for through proper
posthatch brooding. The possible effects on posthatch performance are further explained
in the subsequent chapter (Chapter V).
In trial 2, no significant treatment effects were noted. This indicates that the
addition of saline does not have a similar effect across trials. In Chapter III, trial 4, it was
found that saline decreased yolk sac weight below that of controls. However, the
stimulant treatments were not statistically different from each other or from the control.

67
References
Ar, A. 1991. Egg water movements during incubation. Avian Incubation. S.G. Tullett, ed. Butterworth-Heinemann Ltd., London, UK. 157-173. Devlin, T.M. 1997. Textbook of Biochemistry with Clinical Correlations. Wiley and Sons Printing. New York, New York. 206-208, 688-689. Foye. O.T., Z. Uni, P.R. Ferket. 2006. Effects of In Ovo Feeding Egg White Protein, β- Hydroxy-β-Methylbutyrate, and Carbohydrates on Glycogen Status and Nenonatal Growth of Turkeys. Poultry Sci. 85:1185-1192. Lima, G.H.P. Carvalho, A.A. Figuerido, A.R. Gifoni, A.M. Soares, E.A.T. Silva, R.L. Guerrant. 2002. Effects of an Alanyl-Glutamine-Based Oral Rehydration and Nutrition Therapy Solution on Electrolyte and Water Adsorption in a Rat Model of Secretory Diarrhea Induced by Choera Toxin. Nutrition. 18:458-462. Peebles, E. David, Lumu Li, Sherman L. Miller, Tomas Pansky, Sharon Whitmarsh, Mickey A. Latour, and Patrick D. Gerard, 1999. Embryo and yolk compositional relationships in broiler hatching eggs during incubation. Poultry Sci. 78:1435- 1442. Romanoff, A. L. and A. J. Romanoff. 1967. Biochemistry of the Avian Embryo. Wiley and Sons Printing. New York, New York. Steel, R. G. D. and J. H. Torrie. 1980. Principles and Procedures of Statistics. A Biometrical Approach. 2nd Ed. McGraw-Hill, New York, NY. Uni, Z., P.R. Ferket, E. Tako, O. Kedar. 2005. In ovo Feeding Improves Energy Status of Late-Term Chick Embryos. Poultry Sci. 84: 764-770. Voet, D. and J.G. Voet. 2004. Biochemistry, 3rd edition. Wiley and Sons Printing. New York, New York. Zhai, W., S. Neuman, M.A. Latour, P.Y. Hester. 2008. The Effect of In Ovo Injection of L-Carnitine on Hatchability of White Leghorns. Poultry Science. 87:569-572.

68
Table 4.1a Solutions used in trial 1 including pH.
Trial 1 Solution Molarity (mM) pH
CEN + KCL 0.18 + 5.5 8.98 3K Cit+ KCl 5.0 + 5.5 9.33
NaH2PO4 + KCl 1.0 + 5.5 7.37 Table 4.2 Solutions used in trial 2 including pH.
Trial 2 Solution Molarity (mM) pH
Caffeine + KCL 1.0 + 5.5 9.08 Theophylline + KCl 1.0 + 5.5 9.43
Creatine + KCl 1.0 + 5.5 9.98 L-Arginine + KCl 1.0 + 5.5 9.33
Table 4.3 Carbohydrate/electrolyte solution (CEN) constitutive elements with mM concentrations as studied in trial 1.
Solution Strength (mM)
CEN [1:40] Potassium Chloride 0.05 Tripotassium Citrate 2.5x10⁻³
Magnesium Chloride 3.7x10⁻³
Zinc Acetate 7.0x10⁻⁴
Copper Sulfate 8.7x10⁻⁶
Sodium Citrate 2.0x10⁻²
Sodium Chloride 0.2 Glucose 0.3 Sucrose 0.2

69
0
2
4
6
8
10
12
14
16
Control, ni CEN [1:40] NaH2PO4 (1.0 mM)
3K Cit (5.0 mM)
NaCl (117 mM)
Treatment
0-18
d E
gg W
eigh
t Los
s, %
NaH2PO4
(1.0 mM)
FIGURE 4.1a. Percent 0-18 d incubational egg weight loss (0-18 d water loss (g)/set egg
weight (g)) in the following treatment groups carried in 5.5 mM potassium chloride (KCl): tripostassium citrate (3K Cit), a carbohydrate/ electrolyte solution (CEN), and sodium dihydrogenphosphate (NaH2PO4); and 117 mM saline, and non-injected control (control, ni) treatments in trial 11.
a-c means among treatments with no common superscript differ significantly (P ≤ 0.05). 1n= 4 replicate units used for calculation of means.
a b b b
b

70
0
10
20
30
40
50
60
70
Control, ni CEN [1:40] NaH2PO4 (1.0 mM)
3K Cit (5.0 mM)
NaCl (117 mM)
Treatment
Rel
ativ
e E
mbr
yo W
eigh
t, %
FIGURE 4.2a. Relative embryo body weight of Day 18 broiler embryos (wet embryo (g)/
D 18 egg weight (g)) in the following treatment groups carried in 5.5 mM potassium chloride (KCl): tripostassium citrate (3K Cit), a carbohydrate/electrolyte solution (CEN), and sodium dihydrogenphosphate (NaH2PO4); and 117 mM saline, and non-injected control (control, ni) treatments in trial 11.
a-c means among treatments with no common superscript differ significantly (P ≤ 0.05). 1n= 4 replicate units used for calculation of means.
a bc c bc ab
NaH2PO4 [1:40] CEN

71
7677787980818283848586
Control, ni CEN [0.025] NaH2PO4 (1.0 mM)
3K Cit (5.0 mM)
NaCl (117 mM)
Treatment
Em
bryo
Bod
y M
oist
ure,
%
FIGURE 4.3a. Percent embryo body moisture of Day 18 broiler embryos ((wet embry-
dry embryo) (g)/ wet embryo(g)) in the following treatment groups, where treatments were all carried in 5.5 mM potassium chloride (KCl): tripostassium citrate (3K Cit), a carbohydrate electrolyte solution (CEN), and sodium dihydrogenphosphate (NaH2PO4); and 117 mM saline, and a non-injected control (control, ni) treatments in trial 11.
a-b means among treatments with no common superscript differ significantly (P ≤ 0.05). 1n= 4 replicate units used for calculation of means.
b
a a aa
72
CHAPTER V
EFFECTS OF INJECTION OF COMBINATORIAL ELECTROLYTE SOLUTIONS
ON THE HATCHABILITY AND GROWTH OF BROILERS FROM DAY 0 TO
DAY 10 POST HATCH
Abstract
Effects of the automated in ovo injection of carbohydrate and stimulatory
solutions, each carried in 5.5 mM potassium chloride, on the livability and growth of
broiler chicks, through Day 10 post hatch, were investigated. Also, the effects of some
solutions in conjunction with the stimulant theophylline, were subsequently investigated.
Both trials were investigated separately. Solutions were injected into the amnion of
embryos at Day 18 of incubation. In trial 1, the potential of 3 electrolyte (1 carbohydrate
containing and 2 stimulant containing) solutions carried in potassium chloride to affect
hatchability and post hatch chick performance was analyzed. The solutions used were a
carbohydrate/electrolyte solution, tripotassium citrate, and creatine. In trial 2, the
effectiveness of each of the aforementioned solutions from trial 1 in conjunction with the
stimulant, theophylline, was investigated. In trial 1, 1.0 mM creatine significantly
reduced chick weight at hatch compared to both non-injected control and 117 mM saline-
injected groups, whereas in comparison to non-injected controls, relative yolk sac weight
73
at Day 3 was increased by 117 mM saline. In trial 2 there was an effect on Day 3 relative
liver weight. Trial 2 was also the only trial in which late embryo mortality and was
increased by all the injection treatments and hatch to Day 3 chick mortality was increased
by the injection of 1.0 mM creatine in solution with 5.5 mM potassium chloride and 1.0
mM theophylline. However, the effects on mortality may have been exacerbated by the
poor brooding conditions that chicks were subjected to in trial 2. Because of this the
solutions tested are believed to have potential for use individually or in combination in
the commercial injection of broiler hatching to promote subsequent hatchability and post
hatch growth.
Introduction
The embryo is protected by a shell, but it also has a limited nutrient supply
because it is not attached to its mother by an umbilical cord. While the enclosed
environment in which avian embryos grow provides the necessary reservoirs for
embryogenesis the one time supple of these resources from the mother may become
limiting under the pressures of commercial production. As the embryo develops it
utilizes, and eventually uses, all of its available sources of nutrition. Over the past few
years, some researchers have utilized in ovo injection in an effort to increase chick hatch
weight and bird size at the time of processing. It has been shown by Uni et al. (2005) and
Foye et al. (2006) that the injection of nutritional supplements benefit post hatch growth
and the weight gain of birds. The broiler embryos (Ross) examined by Uni et al. (2005)
showed no significant gain after in ovo feeding on Days 19 and 20 of embryonic

74
development. Uni et al. (2005) also attributed a statistical growth in Ross birds after 10 d
post hatch.
In previous trials of this study, it has been have shown that certain components of
electrolyte solutions are not harmful in late avian embryogenesis and that there is the
potential that these solutions could promote post hatch growth and development. Herein,
the usefulness of these electrolyte solutions in the development of chicks 0 to 10 d is
demonstrated. The benefits of the individual electrolyte component, as well as the added
potentials when mixed, and combined with a stimulant were investigated. Attempts were
made to demonstrate the usefulness of electrolyte solutions in the development of post
hatch chicks from day of hatch to Day 10 post hatch. In the following experiments, the
possible use of electrolyte solutions, some containing a stimulant, injected in ovo to
promote growth and development of broilers were explored.
The solutions investigated may serve a multitude of purposes. In previous
studies, the potential use of other individual salt solutions was investigated. Potassium
chloride is a commonly known physiological salt, and has the potential to be used as, or
more, effectively as saline. These properties are demonstrated through the cellular pump
activity in cells, in that there is always a continuous effort to expel sodium and retain
potassium intracellularly (Voet and Voet, 2004). Because of potassium chloride’s effect
on the yolk sac in previous chapters it is believed that the conservation of yolk will aid in
the lipid to carbohydrate diet switch. The carbohydrate/electrolyte nutrient solution was
the only complex solution that was tested. It was chosen because previous research using
simple carbohydrates for in ovo application has shown them to be effective in promoting
75
chick development between 10 to 24 d (Uni et al., 2005). Also, because the solution was
originally used in catch-up feeding programs for malnourished children, they may be
potentially used in avian embryos and to promote post hatch growth. It also may allow
for a smoother transition from a lipid to a carbohydrate- based diet. The injection a
complex and simply carbohydrate solution may allow the embryo time to adjust, in the
same manner as a child goes from breast milk to toddler food before progressing to a
more adult diet. Tripotassium citrate has the possibility of allowing additional potassium
to cellular function, and also adding free citrate rather than the chloride ion. It can also
serve as an acidity regulator and an antioxidant, and as such it continued to hold an
interest for growout studies. The current trials were designed to examine the effects of
solutions previously examined as to their effects in embryos, and determine their
subsequent effects on post hatch chick growth and development. Also, to further
determine any correlation between embryo effects and the chick effects due to these
solutions.
In trial 1, the effects of combinatorial electrolyte solutions were evaluated. These
solutions were carried in 5.5 mM potassium chloride: creatine, carbohydrate/electrolyte
solution, and tripotassium citrate. These are the same solutions that were previous tested
in the embryo (Chapter IV, trials 1 and 2) and were found to have a positive effect on
embryonic processes and were considered to be solutions of interest.
In trial 2, effects of the combinatorial electrolyte solutions used in trial 1, with the
addition of a stimulant, were evaluated. Caffeine serves as both a cellular stimulator,
and a central nervous system stimulator. The effects of theophylline were explored
76
because it is a product of the breakdown of caffeine. There are certain cell types that
respond better to theophylline than caffeine (Devlin, 1997). And in previous studies
theophylline had shown a better numerical response than caffeine in embryos (Chapter
III, trial 4). In order to determine if theophylline would have a stimulatory effect on the
pipping muscle, it was tested in conjunction with the solutions from trial 1. Creatine is a
high energy storage compound found in many different cells. The creatine may promote
metabolism and storage of adenosine triphosphate (ATP; Voet and Voet, 2004, Clark,
1997), but the cells would have to load the creatine. This process may not be beneficial,
since it would utilize the embryo’s own nutrient and energy sources, but it may promote
total usage of the yolk. In previous, studies phosphocreatine led to a numerically had a
better response than creatine. However, creatine was chosen for these studies because it
was more available and less expensive than phosphocreatine while maintaining an effect
that was not statistically different from that of phosphocreatine.
Materials and Methods
Incubation
Broiler hatching eggs (Ross x Ross) were obtained from a commercial source
(Peco Farms, Inc). All eggs used within a trial were taken from a common flock. Eggs
used within different trials were taken from different flocks. However, all eggs were
taken from flocks that were between 35 and 54 wk of age. All eggs were held for 3 to 4 d

77
prior to setting. Average set weights were taken for replicate groups and the eggs were
arranged randomly in each incubator tray level (experimental block). On each incubator
level, all treatments were equally represented and representative replicate groups of eggs
for each treatment were set at random. The number of eggs set within each treatment
replicate group for trials 1 and 2, were both 10. The number of individual treatment
replicate units in trials 1 and 2, were both 4. In trials 1 and 2, the individual replicate
units were represented by 4 tray levels in each of 1 tray column. Eggs were incubated in
a Jamesway AVN single stage incubator for both trials. Incubator dry bulb temperatures
were set at 37.6°C, with a variable range of 37.5 to 37.7°C during incubation. Incubator
wet bulb temperatures were maintained between 26.0º and 30.0º C (i.e. 83 and 86%
relative humidity).
Preparation of Solutions
Solutions were prepared within 2 to 5 d of injection. In all trials there was a 117
mM saline and a non-injected control (control, ni) group. Solutions were prepared in
autoclaved water and then were filtered through a TRP© single use, gamma sterilized
syringe filter (0.22 μm) the day before injection. Potassium chloride (5.5 mM; KCl;
Fisher Scientific), was used as a carrier for the injected solutions tested in both trials. In
trial 1, the following compounds and stimulants were tested: a carbohydrate/electrolyte
solution (CEN) at a relative concentration of 1:40; tripotassium citrate monohydrate (3K
Cit; HOC(COOK)(CH2COOK)2 · H2O; Sigma-Aldrich) at a concentration of 5 mM; and
creatine monohydrate (creatine; C4H9N3O2 · H2O; Sigma-Aldrich) at a concentration of

78
1.0 mM. In trial 1 the solutions used were as described in Chapter IV, trial 1, where the
correct amount of KCl was added to create a 1.0 L solution with a final volume that was
5.5 mM. Solution pH was measured for all test solutions (Figure 5.1). In Trial 2,
theophylline (anhydrous; C7H8N4O2; Sigma-Aldrich) was added to each solution. The
solutions were prepared as previously described for their select molarity, and again the
correct amount of KCl and theophylline were added to reach endpoint concentrations of
5.5 mM and 1.0 mM, respectively, in 1.0 L of solution. Solution pH was measured for all
test solutions (Table 5.2). Osmolarities were calculated for all solutions using the
formula mOsm= Φ n C, where Φ was set equal to 0.95 disassociation, n is the number of
dissociated ions, and C is the concentration (mM; Table b).
Injection Procedure
Injections were preformed with an AviTech IntellilabTM Single Egg Injector, in
order to reflect commercial application. Eggs were injected through the air cell. A blunt
headed needle with a bore diameter (i.d.) of 0.6 mm (0.023 inches) was used in order to
ensure that no injections were intramuscular. The total length of the needle was 18.4 mm
(7.25 inches), which provided an approximate 2.4 mm (0.98 inches) injection depth from
the top of the large end of the egg. The test confirmed that solution was being injected
into the amnion. On Day 18 of development, eggs were weighed and randomly assigned
to an injection treatment group prior to injection. In order to avoid crossover
contamination all replicate groups of eggs belonging to a particular treatment were
injected with their corresponding solution before switching to another treatment.

79
Solutions were first drawn into a syringe and the syringe was then attached to the
machine. Three mL of each solution were pumped into the machine prior to injection in
order to prime the system. Injection volumes of 200 µL were used in trials 1 and 2. The
standard error for injection was + 0.1 µL / 100 µL. Eggs were injected individually and
the needle was disinfected after each injection. Once the treatment groups were
completed, they were placed back into the incubator in their corresponding tray and level.
Growout
On Day 18 of development, after injection, the eggs were placed into hatching
baskets in the Jamesway AVN single state incubator. Hatching was monitored every 12
h and number of total chicks in the basket at each interval was recorded (results not
reported). On Day 21/ Day 0 the chicks were removed and tagged with a numerical/color
code. Chicks were assigned to pens which corresponded to their respective incubational
replicate unit. Therefore, all treatments were represented within each of 4 replicate pens.
The chicks were placed into the prepared pens, again by their treatment block. After
hatch the chicks were placed, by block, into pens in a house. There were four pens, one
for each replicate block. Pens were old bedding on cement floors and were warmed prior
to setting. All pens were on the same side of the house. Chicks were shown food and
water and they were monitored closely in the first 24 h to ensure they were in ideal
conditions. All chicks had ad libitium access to food and ground waterers during the 10
day growout. Brooding lights were applied, and for trial 1 the temperature records of the
house were taken bi-daily (not reported). For trial 2 it was found that the house was not

80
maintaining proper temperature under the brooding lights. Both house and brooding
temperatures were recorded, bi-daily, 2 to 10 d (not reported).
Animal Care
All experimental protocols were approved by the Institutional Animal Care and
Use Committees at Mississippi State University. All birds were given ad libitum access
to water and diet formulated to meet or exceed NRC (1994) recommendations in all
experiments.
Data collection
Total weights and numbers of eggs for each treatment replicate group at set and
Day 18 (day of injection) were recorded. Likewise, at Day 0 (hatch), Day 3, and Day 10
of posthatch age, total chick numbers and group weights were recorded for each
treatment replicate group. Subsequent mean egg and chick weights were calculated for
each replicate group within each treatment. Mean body weight gains between Days 0 and
3, 3 and 10, and 0 and 10 posthatch were also examined. At hatch the birds were
renumbered according to their block and treatment groups. Chick hatch weights were
recorded prior to the birds were placement in the growout facility. Any chicks that died
in between sampling dates had dead weights recorded, and a necropsy was preformed to
determine cause of death.
The first sampling was done on Day 3. Chicks, randomly selected the day before,
were collected in the morning and brought from the house to the sampling site. Live

81
weights were taken from the chicks. Chicks were then sacrificed by cervical dislocation
and their chest was opened to collect blood for chem panels (data not shown here). Then
the liver was removed, weight, and a sample was placed into perchloric acid for later
testing. The remaining liver was kept for moisture analysis. The residual yolk sac was
removed, weighed, and kept for moisture analysis.
The last sampling was also done on Day 10. The remaining chicks were collected
from the house and brought to the sampling site. Live weights were taken from all the
chicks. Chicks were then sacrificed by cervical dislocation and their chest was opened to
collect blood for chem. panels (data not shown here). The liver was removed, weighed,
and a sample was placed into perchloric acid for later testing. The remaining liver was
kept for moisture analysis.
Statistical Analysis
A completely randomized block experimental design was employed, with
incubation tray levels and growout pens. Individual eggs or chicks were considered as
sub-samples within each replicate treatment group. Individual trial data were analyzed
separately. A control treatment and a saline (117 mM) –injected treatment were included
among the treatment groups examined. Means were compared in the event of significant
global effects (Steel and Torrie,1980). Global effect means were considered significant at
P < 0.10 and treatment mean separations were considered significant at with P < 0.05.
All data were analyzed using the GLM procedure of SAS software, version 9.1 (SAS
Institute, 2003), that contained a random statement to account for sub-sampling. In the

82
event of statistical set egg weight differences, set egg weight was assigned as a covariate
in the analysis.
Results
In trial 1, there were no significant treatment effects on set egg weight; Day 18
injection egg weight; rate of hatch; chick hatch weight (individual and treatment replicate
mean); Day 3 and 10 treatment replicate pen weight; Day 3 and 10 live necropsy weight;
Day 3 relative yolk sac weight; Day 3 and 10 relative liver weight; 0 (hatch) to 3d, 0
(hatch) to 10 d, and 3 to 10 d body weight gain. There was also no significant effect on
mortality in embryos or post hatch chicks. However, there was a significant treatment
effect on mean hatch chick weight, (P < 0.10; Figure 5.1). Hatch chick weight was
significantly higher in the saline group compared with the control. Hatch chick weight in
the creatine treatment was significantly lower than the controls with the CEN and 3K Cit
intermediate. There was also a significant effect on the relative yolk sac weight of Day 3
chicks (P < 0.05; Figure 5.2). Relative yolk sac weight was higher in the saline-injected
group compared with the control, CEN and 3K Cit groups, with the creatine group
intermediate. Furthermore the creatine treatment was significantly higher than the CEN
treatment, with the control and 3K Cit treatments intermediate.
In trial 2, there were no significant treatment effects on set egg weight; Day18
injection egg weight; rate of hatch; chick hatch weight (individual and treatment replicate
mean); Days 3 and 10 treatment replicate pen weights; Days 3 and 10 live necropsy
weight; Day 3 relative yolk sac weights; Day 3 and 10 relative liver weights; 0 (hatch) to

83
3 d, 0 (hatch) to 10 d, and 3 to 10 d body weight gains. However, there was a significant
effect (P < 0.05; Fig 5.3) on Day 3 relative liver weight. Relative liver weight of Day 3
chicks was higher in controls compared to the 3K Cit group, with the CEN and creatine
groups intermediates. There was no significant effect on early- or mid- mortality in
embryos. However, a significant effect on percent late dead mortality was found in the
residue hatch analysis (P < 0.05; Figure 5.4). All injection treatments resulted in a
statistically higher percent late dead mortality than the controls. A significant treatment
effect was also seen for chick mortality between Day 0 (hatch) and Day 3 (P < 0.05;
Figure 5.5). The creatine injection treatment caused the highest cumulative posthatch
mortality than did the control, CEN and 3K Cit treatments, with the saline treatment
intermediate.
All measurements found to be significant were normalized using calculated
miliosmolality (mOSm). The mOsm for the solutions was calculated using the formula
mOsm= Φ n C; where Φ was set equal to 0.95 disassociation, n is the number of
dissociated ions, and C is the concentration. These figures and the numbers used to
achieve them are reported in the Appendix.
Discussion
Although chick hatch weight was depressed in trial 1, it has been shown in
previous trials that this decrease in weight is often marked by an increase in percent body
moisture (Chapter IV, trial 1). In these previous studies, when embryo body weight was
significantly depressed below that of the control, it was associated with a significant

84
increase in percent body moisture over that of the control (Chapter IV, trial 1). It was
discussed that this loss in body weight may be attributed to the embryo beginning to
extensively utilize lipids during the late stages of growth (Romanoff and Romanoff,
1967). A continued increase in moisture levels in these birds allowed for a normalization
of body weight to that of control levels by Day 3 post hatch. This normalization was also
accompanied by an increase in residual yolk by Day 3 in the saline injected group in
comparison to controls. However, it is noticeable that the CEN solution resulted in a
numerically lower residual yolk weight in comparison to controls. Considering the
constituents of this solution, is also notable that many of them serve as metabolic
intermediaries that are designed to promote body moisture and uptake of water (Lima et
al, 2002; Rehrer, 2001). The addition of theophylline in trial 2 appeared to ameliorate the
positive moisture effect, as it did in Chapter IV, trial 2, when it was combined with a salt.
It was noted that when the data was normalized, using mOsm, that the effects between
trial 1 and 2 were similar and relative, despite the addition and theophylline and the
supposed amelioration of the positive moisture effect (Figure 5.1b, 5.2b, 5.3b).
Although there was no statistically significant effect due to creatine, creatine did
have a numerically positive influence on growth. The creatine treatment caused birds to
gain 10 g more in body weight than the controls, and at Day 10, the creatine treatment
group outweighed the controls by 9 g.
In trial 2, the control birds had the highest relative liver weight, in comparison to
the saline and 3KCit birds. It is unknown in trial 1 why there were yolk sac responses to
treatment, whereas in trial 2 there was an effect on relative liver weight. It has been
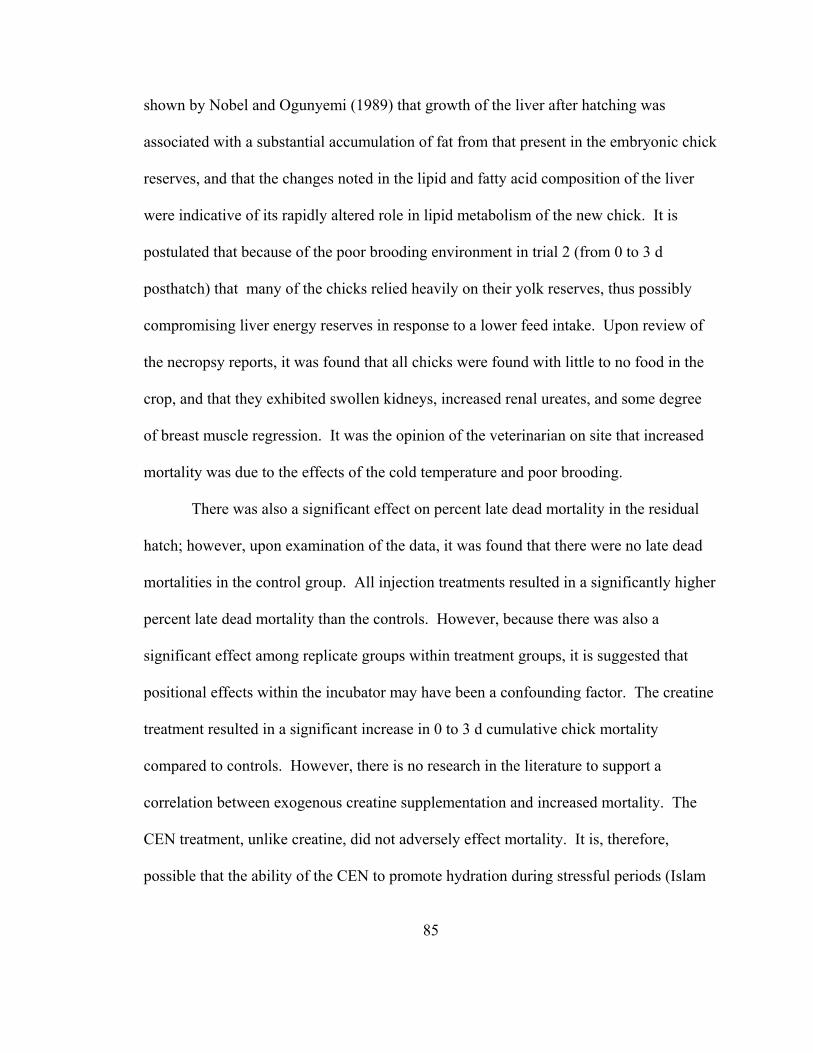
85
shown by Nobel and Ogunyemi (1989) that growth of the liver after hatching was
associated with a substantial accumulation of fat from that present in the embryonic chick
reserves, and that the changes noted in the lipid and fatty acid composition of the liver
were indicative of its rapidly altered role in lipid metabolism of the new chick. It is
postulated that because of the poor brooding environment in trial 2 (from 0 to 3 d
posthatch) that many of the chicks relied heavily on their yolk reserves, thus possibly
compromising liver energy reserves in response to a lower feed intake. Upon review of
the necropsy reports, it was found that all chicks were found with little to no food in the
crop, and that they exhibited swollen kidneys, increased renal ureates, and some degree
of breast muscle regression. It was the opinion of the veterinarian on site that increased
mortality was due to the effects of the cold temperature and poor brooding.
There was also a significant effect on percent late dead mortality in the residual
hatch; however, upon examination of the data, it was found that there were no late dead
mortalities in the control group. All injection treatments resulted in a significantly higher
percent late dead mortality than the controls. However, because there was also a
significant effect among replicate groups within treatment groups, it is suggested that
positional effects within the incubator may have been a confounding factor. The creatine
treatment resulted in a significant increase in 0 to 3 d cumulative chick mortality
compared to controls. However, there is no research in the literature to support a
correlation between exogenous creatine supplementation and increased mortality. The
CEN treatment, unlike creatine, did not adversely effect mortality. It is, therefore,
possible that the ability of the CEN to promote hydration during stressful periods (Islam

86
et al., 2004) may have mitigated the chick’s response to the poor brooding conditions and
thereby improve livability. It was also noted that when the data was normalized to mOsm
that the previously seen relative effects were no longer present. This is believed to
strengthen the argument that the increased mortality in late term embryos and chick
mortality is due to additional factors.

87
References Clark, J.F. 1997. Creatine and Phosphocreatine: A Review of Their Use in Exercise and Sport. Journal of Athletic Training. 32: 45-51. Devlin, T.M. 1997. Textbook of Biochemistry with Clinical Correlations. Wiley and Sons
Printing. New York, New York. 206-208, 688-689. Foye. O.T., Z. Uni, P.R. Ferket. 2006. Effects of In Ovo Feeding Egg White Protein, β- Hydroxy-β-Methylbutyrate, and Carbohydrates on Glycogen Status and Nenonatal Growth of Turkeys. Poultry Sci. 85:1185-1192. Islam, S., M. Abley, N.H. Alam, F. Doussou, A.K.A. Chowdhury, J.F. Desjeux. 2004. Water and Electrolyte Salvage in an Animal Model of Dehydration and Malnutrition. Journal of Pediatric Gastroenterology and Nutrition. 38: 27-33. Lima, G.H.P. Carvalho, A.A. Figuerido, A.R. Gifoni, A.M. Soares, E.A.T. Silva, R.L. Guerrant. 2002. Effects of an Alanyl-Glutamine-Based Oral Rehydration and Nutrition Therapy Solution on Electrolyte and Water Adsorption in a Rat Model of Secretory Diarrhea Induced by Choera Toxin. Nutrition. 18:458-462. Noble, R.C. and D. Ogunyemi. 1989. Lipid Changes in the Residual Yolk and Liver of the Chick Immediately after Hatching. Biology of the Neonate. 56:228-236. Rehrer, N.J. 2001. Fluid and Electrolyte Balance in Ultra-endurance Sport. Sports Medicine. 31:701-715. Romanoff, A. L. and A. J. Romanoff. 1967. Biochemistry of the Avian Embryo. Wiley and Sons Printing. New York, New York. Steel, R. G. D. and J. H. Torrie. 1980. Principles and Procedures of Statistics. A Biometrical Approach. 2nd Ed. McGraw-Hill, New York, NY. Uni, Z., P.R. Ferket, E. Tako, O. Kedar. 2005. In ovo Feeding Improves Energy Status of Late-Term Chick Embryos. Poultry Sci. 84: 764-770. Voet, D. and J.G. Voet. 2004. Biochemistry, 3rd edition. Wiley and Sons Printing. New York, New York.

88
Table 5.1a Solutions used in trial 1 including pH.
Trial 1 Solution Molarity (mM) pH
Creatine + KCl 1.0 + 5.5 9.98 CEN + KCL 0.18 + 5.5 8.98 3K Cit+ KCl 5.0 + 5.5 9.33
Table 5.2a Solutions used in trial 2 including pH
Trial 2
Solution Molarity (mM) pH CEN + KCl + theophylline 0.18 + 5.5 + 1.0 8.12 3kCit + KCl + theophylline 5.0 + 5.5 + 1.0 8.38
Creatine + KCl + theophylline 1 .0 + 5.5 + 1.0 7.85 Table 5.3 Carbohydrate/electrolyte solution (CEN) constitutive elements with mM
concentrations as studied in trials 1 and 2.
Solution Strength (mM) CEN [1:40]
Potassium Chloride 0.05 Tripotassium Citrate 2.5x10⁻³
Magnesium Chloride 3.7x10⁻³
Zinc Acetate 7.0x10⁻⁴
Copper Sulfate 8.7x10⁻⁶
Sodium Citrate 2.0x10⁻²
Sodium Chloride 0.2 Glucose 0.3 Sucrose 0.2
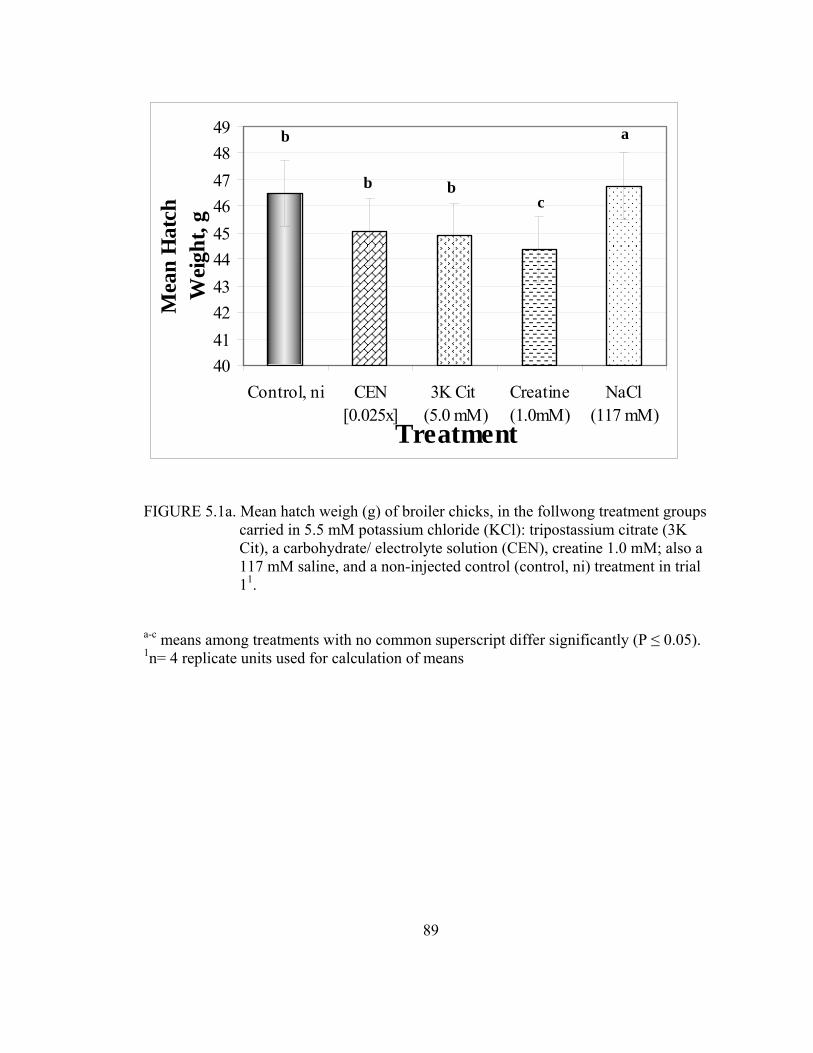
89
40414243444546474849
Control, ni CEN[0.025x]
3K Cit (5.0 mM)
Creatine(1.0mM)
NaCl (117 mM)
Treatment
Mea
n H
atch
Wei
ght,
g
FIGURE 5.1a. Mean hatch weigh (g) of broiler chicks, in the follwong treatment groups
carried in 5.5 mM potassium chloride (KCl): tripostassium citrate (3K Cit), a carbohydrate/ electrolyte solution (CEN), creatine 1.0 mM; also a 117 mM saline, and a non-injected control (control, ni) treatment in trial 11.
a-c means among treatments with no common superscript differ significantly (P ≤ 0.05). 1n= 4 replicate units used for calculation of means
a
cbb
b

90
0
0.5
1
1.5
2
2.5
3
3.5
Control, ni CEN[0.025x]
3K Cit (5.0 mM)
Creatine(1.0 mM)
NaCl (117 mM)
Treatment
D 3
Rel
ativ
e Y
olk
Sac
Wei
ght,
%
FIGURE 5.2a. Relative yolk sac weights of Day 3 broiler chicks (wet yolk sac weight
(g)/ live chick weight (g)), in the following treatment groups, all were carried in 5.5 mM potassium chloride (KCl): tripostassium citrate (3K Cit), a carbohydrate/ electrolyte solution (CEN), creatine 1.0 mM; and a 117 mM saline, and a non-injected control (control, ni) treatment in trial 11.
a-c means among treatments with no common superscript differ significantly (P ≤ 0.05). 1n= 4 replicate units used for calculation of means.
bc c
bcab
a

91
3.2
3.3
3.4
3.5
3.6
3.7
3.8
3.9
Control, ni CEN[0.025x]
3K Cit (5.0 mM)
Creatine(1.0 mM)
NaCl (117 mM)
Treatment
Rel
ativ
e L
iver
Wei
ght,
%
FIGURE 5.3a. Relative liver weight of Day 3 broiler chicks (wet liver weight (g)/ live
chick weight(g)), in the following groups carried in 5.5 mM potassium chloride (KCl) and 1.0 mM theophylline: tripostassium citrate (3K Cit), a carbohydrate electrolyte solution (CEN), creatine 1.0 mM; also a 117 mM saline, and a non-injected control (control, ni) treatment in trial 21.
a-b means among treatments with no common superscript differ significantly (P ≤ 0.05). 1n= 4 replicate units used for calculation of means.
b
ab ab
ab a
92
-15
-10
-5
0
5
10
15
20
25
30
35
3K Cit (5.0mM)
Creatine (1.0mM)
NaCl(117mM)
Treatment
Lat
e M
orta
lity,
%
Control, ni CEN 3K Cit Creatine NaCl [0.025x] (5.0 mM) (1.0 mM) (117 mM)
FIGURE 5.4a. Percent late dead (late dead/ total fertile) in the following groups carried in
5.5 mM potassium chloride (KCl) and 1.0 mM theophylline: tripostassium citrate (3K Cit), a carbohydrate electrolyte solution (CEN), creatine 1.0 mM; also a 117 mM saline, and a non-injected control (control, ni) treatment in trial 21.
a-b means among treatments with no common superscript differ significantly (P ≤ 0.05). 1n= 4 replicate units used for calculation of means.
a a a
a
b

93
-1
-0.5
0
0.5
1
1.5
2
2.5
Control CEN 3K Cit Creatine Saline
Treatment
Dea
d H
atch
to D
3, %
Control, ni CEN 3K Cit Creatine NaCl [0.025x] (5.0 mM) (1.0 mM) (117 mM)
FIGURE 5.5a. Cumulative mortality (hatch to Day 3; Hatch- D 3 dead/ total set) of
broiler chicks injected with a in the following groups carried in 5.5 mM potassium chloride (KCl) and 1.0 mM theophylline: tripostassium citrate (3K Cit), a carbohydrate electrolyte solution (CEN), creatine 1.0 mM; also a 117 mM saline, and a non-injected control (control, ni) treatment in trial 21.
a-b means among treatments with no common superscript differ significantly (P ≤ 0.05). 1n= 4 replicate units used for calculation of means.
a
ab
b b b
94
CHAPTER VI
SUMMARY
These injections of solutions tested may be able to be administered at Day 18,
along with the current vaccine regimen. What was determined was that the electrolyte
solutions had no significant effect on embryo mortality. In the individual trials, it was
shown that salts have affected relative yolk sac weight. It was also shown that lower
concentrations of the electrolyte based solutions had no effect on the embryo. It is only
when the electrolyte with a carbohydrate component are injected that an effect on body
weight is observed, and this effect is consistent with previous reports of a salt and
metabolic solution (Uni et al., 2004).
It is possible that in order to achieve the desired positive effect on body weight
that concentrations need to be increased. Addition of the physiological salt, may, aid in
maintaining a sufficient hydration status and that this hydration effect is what allows the
solution to work more efficiently in the embryo. It was also noticed that when there was
a decrease in body weight there was always a corresponding increase in body moisture.
This effect is important in that although hatch weight may be decreased, the birds were
able to undergo compensatory growth that by Day 3 the weights of birds from treated
eggs were not different from those of controls.
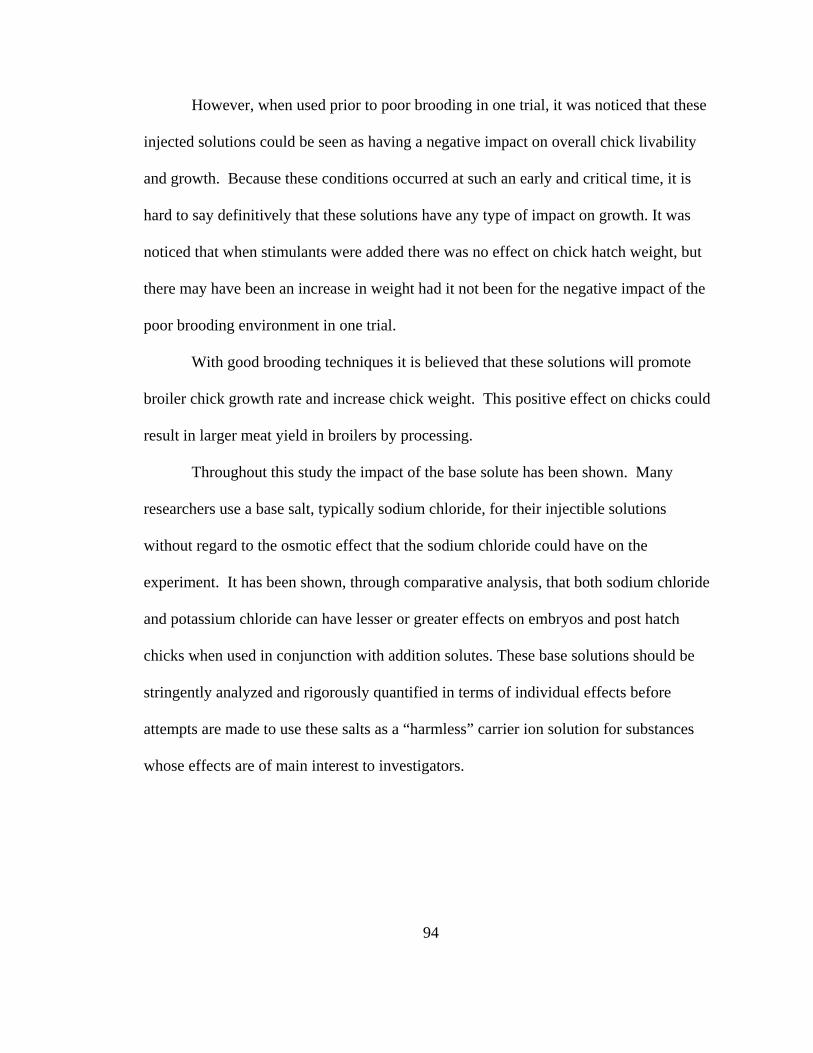
94
However, when used prior to poor brooding in one trial, it was noticed that these
injected solutions could be seen as having a negative impact on overall chick livability
and growth. Because these conditions occurred at such an early and critical time, it is
hard to say definitively that these solutions have any type of impact on growth. It was
noticed that when stimulants were added there was no effect on chick hatch weight, but
there may have been an increase in weight had it not been for the negative impact of the
poor brooding environment in one trial.
With good brooding techniques it is believed that these solutions will promote
broiler chick growth rate and increase chick weight. This positive effect on chicks could
result in larger meat yield in broilers by processing.
Throughout this study the impact of the base solute has been shown. Many
researchers use a base salt, typically sodium chloride, for their injectible solutions
without regard to the osmotic effect that the sodium chloride could have on the
experiment. It has been shown, through comparative analysis, that both sodium chloride
and potassium chloride can have lesser or greater effects on embryos and post hatch
chicks when used in conjunction with addition solutes. These base solutions should be
stringently analyzed and rigorously quantified in terms of individual effects before
attempts are made to use these salts as a “harmless” carrier ion solution for substances
whose effects are of main interest to investigators.

96
APPENDIX A
CALCULATED mOsm FOR SELECT SOLUTIONS IN CHAPTERS III, IV, AND V

97
TABLE 3.1b Calculated mOsm for all solutions tested in trial 1, where miliosmolarities were calculated using the formula mOsm= Φ n C, where Φ was set equal to 0.95 dissacoiation, n is the number of dissociated ions, and C is the concentration.
Solution Conc N mOsm Sodium Acetate 110 2 209 Sodium Acetate 118 2 224.2 Sodium Acetate 125 2 237.5 Sodium Acetate 130 2 247 Sodium Phosphate 0.5 3 1.425 Sodium Phosphate 1 3 2.85 Sodium Phosphate 1.5 3 4.275 Sodium Phosphate 2 3 5.7 Potassium Chloride 4 2 7.6 Potassium Chloride 4.5 2 8.55 Potassium Chloride 5 2 9.5 Potassium Chloride 5.5 2 10.45 Sodium Chloride 117 2 222.3

TABLE 3.4b Calculated mOsm for all solutions tested in trial 4, where miliosmolarities
were calculated using the formula mOsm= Φ n C, where Φ was set equal to 0.95 dissacoiation, n is the number of dissociated ions, and C is the concentration.
Solution Conc n Calculated
mOsm Caffiene 1 1 0.95
Theophylline 1 1 0.95 Creatine 1 1 0.95
Phosphocrreatine 1 1 0.95 Sodium Chloride 117 2 222.3
TABLE 4.1b Calculated mOsm for all solutions tested in trial 1 (Chapter IV), where
miliosmolarities were calculated using the formula mOsm= Φ n C, where Φ was set equal to 00.95 dissacoiation, n is the number of dissociated ions, and C is the concentration.
Solution in potassium
chloride(5.5 mM) mOsm Sodium Phosphate (1.0 mM) 13.3
Tripotassium citrate (5.0 mM) 29.45 Creatine(1.0 mM) 11.4
CEN 11.36673 Sodium Chloride (117 mM) 222.3
98

TABLE 5.1b Calculated mOsm for all solutions tested in trial 1 (Chapter IV), where
miliosmolarities were calculated using the formula mOsm= Φ n C, where Φ was set equal to 00.95 dissacoiation, n is the number of dissociated ions, and C is the concentration.
Solution in potassium
chloride(5.5 mM) mOsm Sodium Phosphate (1.0 mM) 13.3
Tripotassium citrate (5.0 mM) 29.45 Creatine(1.0 mM) 11.4
CEN 11.36673 Sodium Chloride (117 mM) 222.3
TABLE 5.2b Calculated mOsm for all solutions tested in trial 1, where miliosmolarities
were calculated using the formula mOsm= Φ n C, where Φ was set equal to 0.95 dissacoiation, n is the number of dissociated ions, and C is the concentration.
Solution in KCl (5.5 mM) +Theophylline (1.0 mM) mOsm
CEN 12.31673 Tripotassium Citrate (5.0 mM) 30.4
Creatine(1.0 mM) 12.35 Sodium Chloride (117 mM) 222.3
99

100
APPENDIX B
SIGNIFICANT DATA NORMALIZED FOR mOsm IN CHAPTER III

FIGURE 3.1b. Relative yolk sac weight of Day 18 broiler embryos ((wet yolk sac- dry
yolk sac)/ wet yolk sac) normalized by mOsm in the following treatment groups: potassium chloride (KCl) at 4.0, 4.5, 5.0, and 5.5 mM; sodium acetate (Na Acetate) at 110, 118, 125, and 130 mM; sodium dihydrogenphosphate (NaH2PO4) at 0.5, 1.0, 1.5, and 2.0 mM; saline at 117 mM, and a non-injected control (control, ni) in trial 1.1
1n= 4 replicate units used for calculation of means.
101

FIGURE 3.2b. Percent 0- 18 d incubational egg weight loss (0-18 d water loss (g)/ set
egg weight (g)), normalized for calculated mOsm, in the following treatment groups: 5.5 mM potassium chloride (KCl) at 200, 800, 1000, and 2000 μL volumes; 117 mM saline at 200, 800, 1000, and 2000 μL volumes; and a non-injected control (control, ni) in trial 31.
1n= 2 replicate units used for calculation of means.
102

FIGURE 3.2c. Percent 0- 18 d incubational egg weight loss (0-18 d water loss (g)/ set egg
weight (g)), normalized for calculated mOsm and volume injected, in the following treatment groups: 5.5 mM potassium chloride (KCl) at 200, 800, 1000, and 2000 μL volumes; 117 mM saline at 200, 800, 1000, and 2000 μL volumes; and a non-injected control (control, ni) in trial 31.
1n= 2 replicate units used for calculation of means.
103
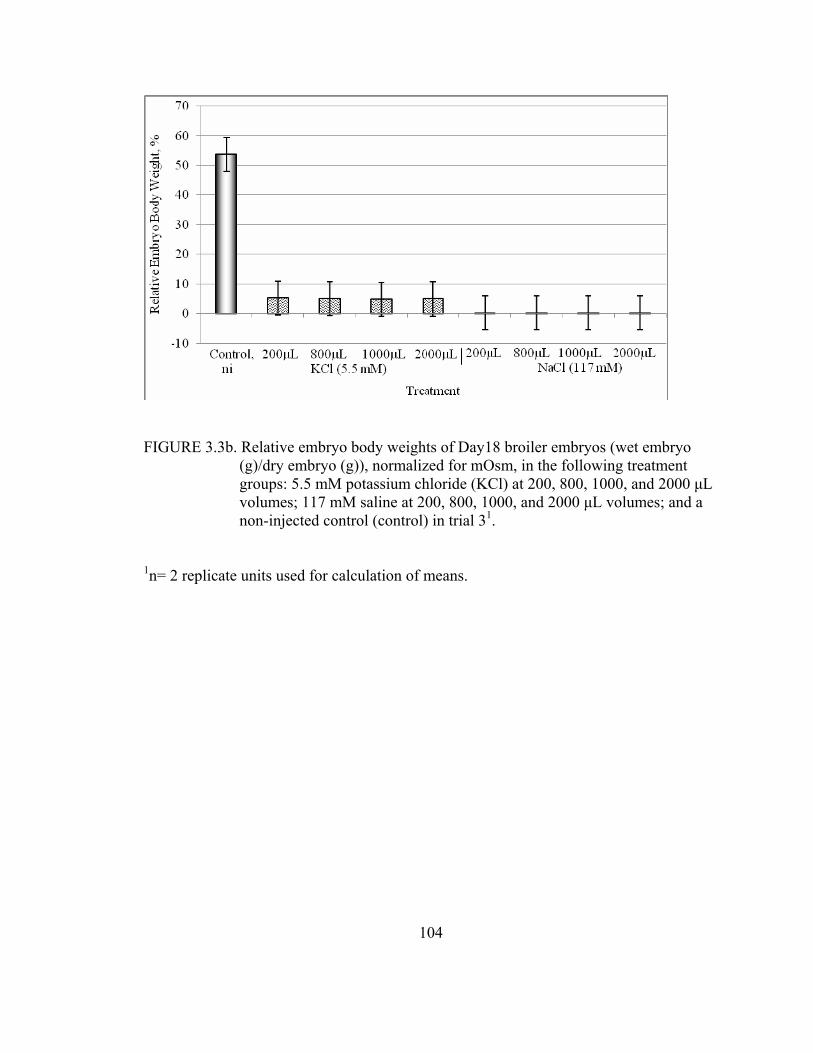
FIGURE 3.3b. Relative embryo body weights of Day18 broiler embryos (wet embryo
(g)/dry embryo (g)), normalized for mOsm, in the following treatment groups: 5.5 mM potassium chloride (KCl) at 200, 800, 1000, and 2000 μL volumes; 117 mM saline at 200, 800, 1000, and 2000 μL volumes; and a non-injected control (control) in trial 31.
1n= 2 replicate units used for calculation of means.
104

FIGURE 3.3c. Relative embryo body weights of Day18 broiler embryos (wet embryo
(g)/dry embryo (g)), normalized for mOsm and volume, in the following treatment groups: 5.5 mM potassium chloride (KCl) at 200, 800, 1000, and 2000 μL volumes; 117 mM saline at 200, 800, 1000, and 2000 μL volumes; and a non-injected control (control) in trial 31.
1n= 2 replicate units used for calculation of means.
105

FIGURE 3.4b. Relative yolk sac weight of Day 18 broiler embryos (wet yolk sac (g)/ D
18 egg weight (g)), normalized for mOsm, in the following treatment groups: 1 mM caffeine, theophylline, creatine and phosphocreatine; 117 mM saline; and a non-injected control (control, ni) in trial 41.
1n= 2 replicate units used for calculation of means.
106

107
APPENDIX C
SIGNIFICANT DATA NORMALIZED FOR mOsm IN CHAPTER IV

FIGURE 4.1b. Percent 0-18 d incubational egg weight loss (0-18 d Δ (g)/0 d (g)),
normalized for mOsm, in the following treatment groups carried in 5.5 mM potassium chloride (KCl): tripostassium citrate (3K Cit), a carbohydrate/ electrolyte solution (CEN), and sodium dihydrogenphosphate (NaH2PO4); and 117 mM saline, and non-injected control (control, ni) treatments in trial 11.
1n= 4 replicate units used for calculation of means.
108
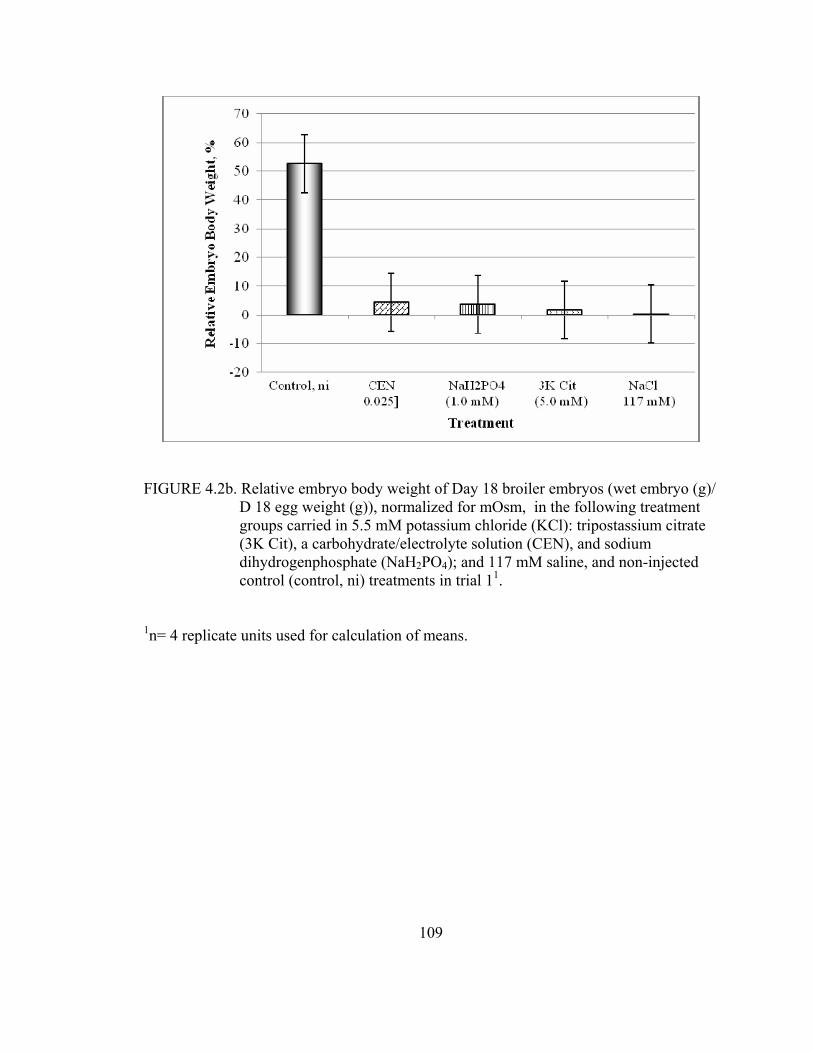
FIGURE 4.2b. Relative embryo body weight of Day 18 broiler embryos (wet embryo (g)/
D 18 egg weight (g)), normalized for mOsm, in the following treatment groups carried in 5.5 mM potassium chloride (KCl): tripostassium citrate (3K Cit), a carbohydrate/electrolyte solution (CEN), and sodium dihydrogenphosphate (NaH2PO4); and 117 mM saline, and non-injected control (control, ni) treatments in trial 11.
1n= 4 replicate units used for calculation of means.
109

FIGURE 4.3b. Percent embryo body moisture of Day 18 broiler embryos ((wet embry-
dry embryo) (g)/ wet embryo(g)), normalized for mOsm, in the following treatment groups, where treatments were all carried in 5.5 mM potassium chloride (KCl): tripostassium citrate (3K Cit), a carbohydrate electrolyte solution (CEN), and sodium dihydrogenphosphate (NaH2PO4); and 117 mM saline, and a non-injected control (control, ni) treatments in trial 11.
1n= 4 replicate units used for calculation of means. 110

111
APPENDIX D
SIGNIFICANT DATA NORMALIZED FOR mOsm IN CHAPTER V
FIGURE 5.1b. Mean hatch weigh (g) of broiler chicks, normalized for mOsm, in the
following treatment groups carried in 5.5 mM potassium chloride (KCl): tripostassium citrate (3K Cit), a carbohydrate/ electrolyte solution (CEN), creatine 1 mM; also a 117 mM saline, and a non-injected control (control, ni) treatment in trial 11.
1n= 4 replicate units used for calculation of means
112

FIGURE 5.2b. Relative yolk sac weights of Day 3 broiler chicks (wet yolk sac weight
(g)/ live chick weight (g)), normalized for mOsm, in the following treatment groups, all were carried in 5.5 mM potassium chloride (KCl): tripostassium citrate (3K Cit), a carbohydrate/ electrolyte solution (CEN), creatine 1 mM; and a 117 mM saline, and a non-injected control (control, ni) treatment in trial 11.
1n= 4 replicate units used for calculation of means.
113

FIGURE 5.3b. Relative liver weight of Day 3 broiler chicks (wet liver weight (g)/ live
chick weight(g)), normalized for mOsm, in the following groups carried in 5.5 mM potassium chloride (KCl) and 1 mM theophylline: tripostassium citrate (3K Cit), a carbohydrate electrolyte solution (CEN), creatine 1 mM; also a 117 mM saline, and a non-injected control (control, ni) treatment in trial 21.
1n= 4 replicate units used for calculation of means.
114

FIGURE 5.4b. Percent late dead (late dead/ total fertile), normalized for mOsm, in the
following groups carried in 5.5 mM potassium chloride (KCl) and 1 mM theophylline: tripostassium citrate (3K Cit), a carbohydrate electrolyte solution (CEN), creatine 1 mM; also a 117 mM saline, and a non-injected control (control, ni) treatment in trial 21.
1n= 4 replicate units used for calculation of means.
115

FIGURE 5.5b. Cumulative mortality (hatch to Day 3; Hatch- D 3 dead/ total set),
normalized for mOsm, of broiler chicks injected with a in the following groups carried in 5.5 mM potassium chloride (KCl) and 1 mM theophylline: tripostassium citrate (3K Cit), a carbohydrate electrolyte solution (CEN), creatine 1 mM; also a 117 mM saline, and a non-injected control (control, ni) treatment in trial 21.
1n= 4 replicate units used for calculation of means. 116

117
APPENDIX E
CROSS COMPARISON OF STIMULANTS CARRIED IN WATER VERSUS 5.5 mM
POTASSIUM CHLORIDE
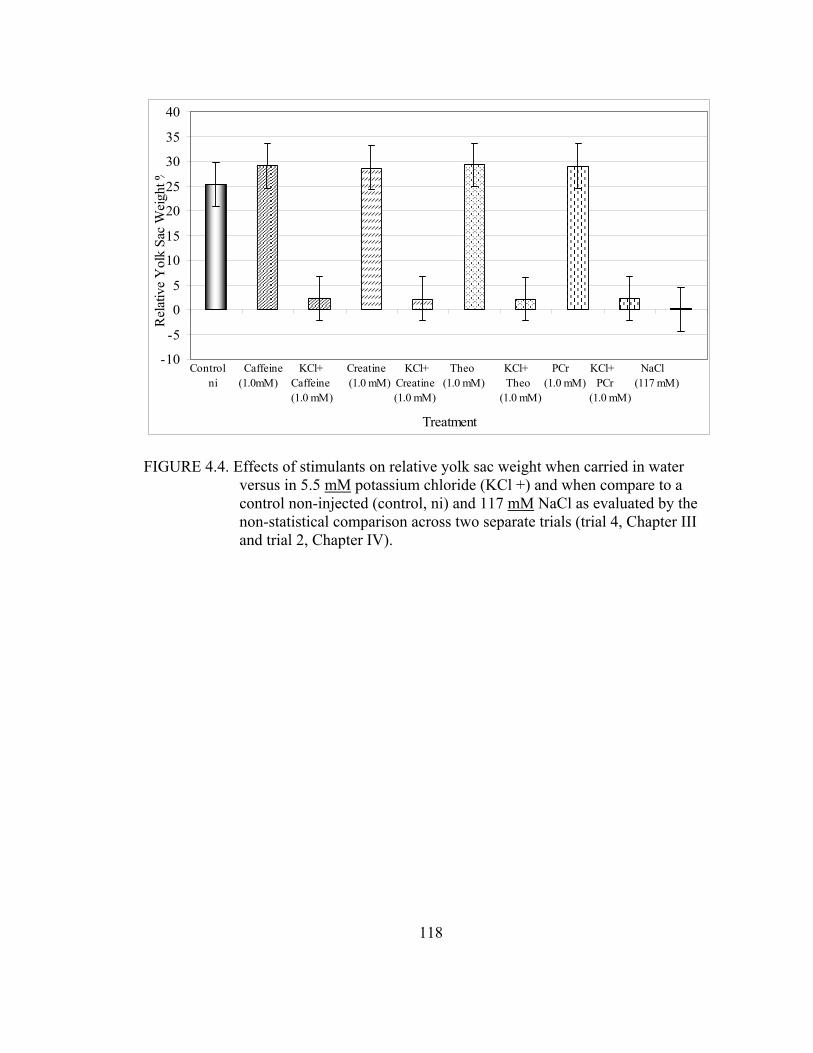
-10
-5
0
5
10
15
20
25
30
35
40
Treatment
Rel
ativ
e Y
olk
Sac
Wei
ght %
Control Caffeine KCl+ Creatine KCl+ Theo KCl+ PCr KCl+ NaCl ni (1.0mM) Caffeine (1.0 mM) Creatine (1.0 mM) Theo (1.0 mM) PCr (117 mM) (1.0 mM) (1.0 mM) (1.0 mM) (1.0 mM)
FIGURE 4.4. Effects of stimulants on relative yolk sac weight when carried in water
versus in 5.5 mM potassium chloride (KCl +) and when compare to a control non-injected (control, ni) and 117 mM NaCl as evaluated by the non-statistical comparison across two separate trials (trial 4, Chapter III and trial 2, Chapter IV).
118
Copyright © 2022 FDOKUMEN