Anionic surfactant remediation of soil columns contaminated by nonaqueous phase liquids
24
Ž . Journal of Contaminant Hydrology 38 1999 465–488 Anionic surfactant remediation of soil columns contaminated by nonaqueous phase liquids V. Dwarakanath a,1 , K. Kostarelos b,2 , Gary A. Pope c, ) , Doug Shotts d,3 , William H. Wade e,4 a Duke Engineering SerÕices, 9111 Research BouleÕard, Austin, TX 78758, USA b Department of CiÕil Engineering, The UniÕersity of Texas at Austin, Austin, TX 78712, USA c Department of Petroleum and Geosystems Engineering, The UniÕersity of Texas at Austin, Austin, TX 78712, USA d ARCO, 2300 West Plano Parkway, PRC-E1503, Plano, TX 75075, USA e Department of Chemistry, The UniÕersity of Texas at Austin, Austin, TX 78712, USA Received 18 November 1997; received in revised form 28 December 1998; accepted 28 December 1998 Abstract A variety of column experiments have been completed for the purpose of selecting and Ž . evaluating suitable surfactants for remediation of nonaqueous phase liquids NAPLs . The various Ž . NAPLs tested in the laboratory experiments were tetrachloroethylene PCE , trichloroethylene Ž . Ž . TCE , jet fuel JP4 and a dense nonaqueous phase liquid from a site at Hill Air Force Base, UT. Both Ottawa sand and Hill field soil were used in these experiments. Surfactant candidates were first screened using phase behavior experiments and only the best ones were selected for the subsequent column experiments. Surfactants which showed high contaminant solubilization, fast coalescence times, and the absence of liquid crystal phases and gels during the phase behavior experiments were tested in soil column experiments. The primary objective of the soil column experiments was to identify surfactants that recovered at least 99% of the contaminant. The secondary objective was to identify surfactants that show low adsorption and little or no loss of hydraulic conductivity during the column experiments. Results demonstrated that up to 99.9% of the contaminants were removed as a result of surfactant flooding of the soil columns. The addition of xanthan gum polymer to the surfactant solution was shown to increase remediation efficiency as a lower volume of surfactant was required for recovering a given volume of NAPL. Based on ) Corresponding author. Fax: q1-512-471-9678; E-mail: gary_[email protected] 1 Fax: q1-512-425-2099; E-mail: [email protected] 2 Fax: q1-512-471-6548; E-mail: dino_[email protected] 3 E-mail: [email protected] 4 Fax: q1-512-471-8696. 0169-7722r99r$ - see front matter q 1999 Published by Elsevier Science B.V. All rights reserved. Ž . PII: S0169-7722 99 00006-6
Transcript of Anionic surfactant remediation of soil columns contaminated by nonaqueous phase liquids

Ž .Journal of Contaminant Hydrology 38 1999 465–488
Anionic surfactant remediation of soil columnscontaminated by nonaqueous phase liquids
V. Dwarakanath a,1, K. Kostarelos b,2, Gary A. Pope c,),Doug Shotts d,3, William H. Wade e,4
a Duke Engineering SerÕices, 9111 Research BouleÕard, Austin, TX 78758, USAb Department of CiÕil Engineering, The UniÕersity of Texas at Austin, Austin, TX 78712, USA
c Department of Petroleum and Geosystems Engineering, The UniÕersity of Texas at Austin, Austin, TX 78712,USA
d ARCO, 2300 West Plano Parkway, PRC-E1503, Plano, TX 75075, USAe Department of Chemistry, The UniÕersity of Texas at Austin, Austin, TX 78712, USA
Received 18 November 1997; received in revised form 28 December 1998; accepted 28 December 1998
Abstract
A variety of column experiments have been completed for the purpose of selecting andŽ .evaluating suitable surfactants for remediation of nonaqueous phase liquids NAPLs . The various
Ž .NAPLs tested in the laboratory experiments were tetrachloroethylene PCE , trichloroethyleneŽ . Ž .TCE , jet fuel JP4 and a dense nonaqueous phase liquid from a site at Hill Air Force Base, UT.Both Ottawa sand and Hill field soil were used in these experiments. Surfactant candidates werefirst screened using phase behavior experiments and only the best ones were selected for thesubsequent column experiments. Surfactants which showed high contaminant solubilization, fastcoalescence times, and the absence of liquid crystal phases and gels during the phase behaviorexperiments were tested in soil column experiments. The primary objective of the soil columnexperiments was to identify surfactants that recovered at least 99% of the contaminant. Thesecondary objective was to identify surfactants that show low adsorption and little or no loss ofhydraulic conductivity during the column experiments. Results demonstrated that up to 99.9% ofthe contaminants were removed as a result of surfactant flooding of the soil columns. The additionof xanthan gum polymer to the surfactant solution was shown to increase remediation efficiencyas a lower volume of surfactant was required for recovering a given volume of NAPL. Based on
) Corresponding author. Fax: q1-512-471-9678; E-mail: [email protected] Fax: q1-512-425-2099; E-mail: [email protected] Fax: q1-512-471-6548; E-mail: [email protected] E-mail: [email protected] Fax: q1-512-471-8696.
0169-7722r99r$ - see front matter q 1999 Published by Elsevier Science B.V. All rights reserved.Ž .PII: S0169-7722 99 00006-6

( )V. Dwarakanath et al.rJournal of Contaminant Hydrology 38 1999 465–488466
these experimental results, guidelines for designing highly efficient and robust surfactant floodshave been developed and applied to a field demonstration. q 1999 Published by Elsevier ScienceB.V. All rights reserved.
Keywords: Groundwater; Microemulsion; Remediation; Surfactant; DNAPL; Contaminants
1. Introduction
Ž .The contamination of groundwater by nonaqueous phase liquids NAPLs is a causefor concern throughout the world. NAPLs can be classified by their density as those
Ž . Ž . Žlighter than water LNAPLs and denser than water DNAPLs Pankow and Cherry,.1996 . NAPLs migrate into aquifers because of gravity and capillary forces and may be
Ž .trapped in the form of immobile blobs or ganglia Kueper, 1989 or when present insufficient volume DNAPLs may form pools above aquitards. DNAPL contamination isespecially significant as typical DNAPLs like PCE, TCE, and 1,1,1-trichloroethaneŽ . Ž . Ž .TCA exhibit 1 low viscosity which enable easy invasion into the subsurface 2 high
Ž .volatilities which enable easy contamination of the vadose zone 3 low absoluteŽ .solubilities which limit pump and treat methods 4 high solubilities with respect to
Ž . Ž .drinking water standards and 4 low biodegradability Pankow and Cherry, 1996 . Forthese reasons, DNAPL can persist in the soil for many decades and present a long term
Ž .threat to groundwater quality Mackay and Cherry, 1989 . Large dissolved plumes cancontinue to form and migrate for decades unless the DNAPL source is removed from theaquifer. Surfactant flooding is one of the few remediation methods that has the potentialto do this quickly and effectively.
The conventional remediation method of pump and treat involves pumping ofcontaminated water followed by treatment at the surface by air stripping, steamstripping, activated carbon filtration and various other means. Pump and treat is limitedby parameters such as flow rates, NAPL composition and mass transfer rates, and thesurface area available for mass transfer of NAPL constituents from the NAPL to the
Ž .water Mackay and Cherry, 1989; Powers et al., 1991; Gellar and Hunt, 1993 .Ž .Furthermore, dilution effects Jackson and Mariner, 1995 caused by hydrodynamic
dispersion and mixing of contaminated and uncontaminated water adversely affect pumpand treat remediation operations. Even in those cases where a pool has formed and hasbeen located and DNAPL pumped out, large amounts of residual NAPL remain to
Ž .dissolve and pollute the water Oolman et al., 1995 . The need for cost effectivealternatives to pump and treat is compelling.
Surfactants can be used to vastly increase the solubility of the NAPL constituents inŽ .water Fountain et al., 1991, 1996 . Surfactants also lower the interfacial tension at the
water–NAPL interface which, if sufficiently low, will result in mobilizing the NAPLŽ .Fountain et al., 1991 . However, mobilization of DNAPL in aquifers is not always
Ž .desirable because of concerns of downward migration Pankow and Cherry, 1996 .Surfactants have been studied for remediating gasoline, polychlorinated biphenyls,
Ždichlorobenzene and automatic transmission fluid in many laboratory studies Ellis et.al., 1986; Ziegenfuss, 1987; Abdul et al., 1990; Ang and Abdul, 1991 . NAPL

( )V. Dwarakanath et al.rJournal of Contaminant Hydrology 38 1999 465–488 467
recoveries varied between 33% and 85% in these early laboratory studies. Peters et al.Ž . Ž .1992 and Bourbonais et al. 1995 have reported recoveries of total petroleumhydrocarbons between 60 and 90%. However they identified problems such as mobiliza-tion of fines, difficulty in removing surfactant residue from soil and surfactant precipita-
Ž . Ž .tion. Pennell et al. 1994 and Shiau et al. 1995 have shown that between 90 and 99%of pure PCE can be removed from Ottawa sand during surfactant column experiments.
Ž .Encouraging field results have been reported by Fountain et al. 1995, 1996 . In thispaper, we report several column experiments with 99% removal of various NAPLs fromOttawa sand and up to 99.9% removal of DNAPL from a Hill AFB field soil. The latterlaboratory data served as the basis for the design of the surfactant remediation field tests
Ž .at the DNAPL site at Hill AFB Brown et al., 1996, 1998; INTERA, 1998 .Although recent laboratory experiments have demonstrated the potential of surfac-
tants to remove almost all the most common chlorinated solvents from soils, there stillŽremain a number of important concerns and problems with their use West and Harwell,
.1992 . For example, some investigators have reported problems with surfactants such asŽ . Žpore plugging Ziegenfuss, 1987; Nash, 1987 and the reduction of permeability Allred
.and Brown, 1995 . Loss of permeability is undesirable during remediation as it willnecessitate lower injection rates and lengthen project life, and in extreme cases, willprevent continuation of the flood. The loss of hydraulic conductivity has been attributed
Žto the adsorption of surfactant by the organic material and clays in the soil Renshaw et.al., 1997 . This behavior is caused by the interaction between the surfactant and soil and
can be manifested in the form of surfactant precipitation and surfactant adsorption, butthe more likely reasons are the formation of liquid crystals, gels or macroemulsionsrather than classical microemulsions, which have lower viscosity and generally better
Ž .transport behavior Pope and Wade, 1995 .The focus of this paper is the selection of surfactants using the approach suggested by
Ž .Pope and Wade 1995 . This approach involves the use of surfactant phase behaviorexperiments which focus on identifying surfactants with quick coalescence and theabsence of liquid crystal formation at ambient aquifer temperatures. Using this approacha procedure for selecting appropriate surfactants and cosolvents that cause little if anyreduction in hydraulic conductivity and recover at least 99% of the NAPL in a few porevolumes of surfactant flooding is presented in this paper. Previous surfactant selectioncriteria for soil remediation were incomplete.
Several phase behavior experiments were conducted to select surfactants with highcontaminant solubilization, low coalescencerequilibration times and minimal liquidcrystal, gel or macroemulsion forming tendencies. Coalescence time is the time requiredfor a surfactant–NAPL mixture to equilibrate into a stable microemulsion. Macroemul-sions and high coalescence times have the potential to cause mass transfer limitationsbetween NAPL and surfactant micelles and greatly impede NAPL removal efficiencyand likely account for observations of mass transfer limitations as reported for investiga-
Ž . Ž .tors such as Pennell et al. 1993 and Mason and Kueper 1996 . Phase behaviorexperiments were also conducted to quantify the effect of additives such as alcohols,polymer and groundwater electrolytes on the behavior of surfactants.
Once surfactants were selected based on phase behavior experiments, they were usedin several column experiments to flood soil columns at residual NAPL saturation. These

( )V. Dwarakanath et al.rJournal of Contaminant Hydrology 38 1999 465–488468
soil column results clearly demonstrate that a proper understanding of surfactant phasebehavior aids in the selection of suitable surfactants that show little or no reduction inhydraulic conductivity, minimal surfactant adsorption and quick equilibration times.This approach resulted in close to equilibrium solubilization of the contaminants duringthe surfactant displacements and up to 99.9% DNAPL recovery after a few porevolumes of surfactant flooding. These experiments also show that xanthan gum polymercan be used as a viscosifier to mitigate aquifer heterogeneities and reduce the volume ofsurfactant required for remediation.
2. Experimental methods
2.1. Materials
The various NAPLs evaluated in this study were PCE, TCE, JP4 and field DNAPLfrom site Operable Unit 2 at Hill Air Force Base, Layton, UT. PCE was obtained fromAldrich Chemical, Milwaukee, WI, TCE was obtained from Fisher Scientific, FairLawn, NJ, the jet fuel was obtained from March Air Force Base, CA and the HillDNAPL was obtained from Hill Air Force Base, Layton, UT. TCE, TCA and PCE arethe three principal components of the Hill DNAPL and account for about 95% of itsmass. The balance consists of small amounts of other chlorocarbons and unidentifiedcomponents thought to be from grease since the Air Force used chlorinated solvents asdegreasers and then disposed of them in trenches above the OU2 DNAPL site where thesample was obtained.
The surfactants used in the study were sodium diamyl sulfosuccinate, sodium dihexylsulfosuccinate and sodium dioctyl sulfosuccinate, which were obtained from CYTECindustries, Wayne, NJ, as Aerosol AY, Aerosol MA-80I and Aerosol OT, respectively.All three are food grade surfactants. In experiment DWa2, sodium dihexyl sulfosucci-nate was purified to 100% active, but otherwise it was used as the 80% activecommercial product as received from CYTEC. Secondary butyl alcohol and isopropylalcohol were used as cosolvents and were obtained from EM Science, Gibbstown, NJ.These surfactants are twin-tailed ester sulfonates. The twin tailed hydrophobe of thesesulfonates partly accounts for their favorable behavior. The dihexyl sulfosuccinate isparticularly well behaved because it has additional branching in each tail consisting oftwo methyl branches.
2.2. Phase behaÕior experiments
Phase behavior experiments are batch experiments performed to understand andevaluate the behavior of a given surfactant in the presence of a NAPL. Theseexperiments were used to determine the optimal salinity and contaminant solubilization
Ž .of various surfactant solutions. Results from Baran et al. 1994a,b,c, 1996a,b,c wereused as a starting point in performing phase behavior experiments necessary for thedesign and interpretation of the column experiments. The objective was to identifysurfactant formulations that were free of problems associated with liquid crystals, gels

( )V. Dwarakanath et al.rJournal of Contaminant Hydrology 38 1999 465–488 469
and macroemulsions. The desired behavior was classical microemulsions of type I orŽ .type III Bourrel and Schechter, 1988 depending on the NaCl and CaCl concentrations2
in the water. A Winsor Type I system consists of an oil in water microemulsion in whichthe oil or a NAPL component is solubilized by the surfactant micelle which resides inthe aqueous phase. A Winsor Type II system is an inverted microemulsion in which themicelle resides in the NAPL and has solubilized water at the center of the micelle. TheWinsor Type III consists of alternating layers of both solubilized oil, water andsurfactant micelles. Both volume fraction and ternary phase diagrams were used tointerpret these data and extract useful parameters such as the solubilization ratios. Theclassical sequence of type I, type III and type II microemulsions was observed as theelectrolyte concentrations increased. Detailed phase behavior results can be found in
Ž . Ž .Shotts 1996 and Dwarakanath 1997 . These data were also used for modeling theŽ .surfactant floods at Hill AFB with UTCHEM Delshad et al., 1996 and were a critical
Ž .component of the field design of the surfactant floods Brown et al., 1996, 1998 .
2.3. Soil column procedures
Ž .The soil column procedures were similar to those of Pennell et al. 1993, 1994 andŽ .Jin 1995 with several important additions and refinements. These include the addition
of pressure gradient measurements, the use of cosolvent with the injected surfactant, theuse of partitioning tracers for performance assessment of the surfactant floods, the use ofxanthan gum polymer to improve the efficiency of the surfactant, the use of field soiland field DNAPL in soil column experiments, and finally the measurement of surfactantadsorption by the field soil. The Ottawa sand used for the column experiments wasrinsed with 4 N hydrochloric acid for 4 h. This was followed by rinsing with deionizedwater until all traces of acid was removed. The sand was dried out in an oven at 628Cfor 24 h. After washing and drying, more than 99% of the sand was observed to be
Ž .between 600 mm and 53 mm a 40 mesh to the a 270 mesh range with an average sizeŽ .of 180 mm a 80 mesh . The column was secured to a vibrating jig and the inlet piece
was removed. The sand was placed in a funnel and affixed to the jig. The apparatus wasŽactivated and the soil column was allowed to fill at a rate of approximately 1 cm of
. Žheight in column per minute for the 2.21 cm diameter columns and 0.5 cm of height in.column per minute for the 4.8 cm diameter column. After the column was full, it was
removed from the jig and the inlet cap was tightened on to the end of the column. TwoŽ . Ž .250 mm a 60 mesh and one 99 mm a 150 mesh stainless steel screens were affixed
to the end pieces to hold the sand in place in the column.Field soil samples from Hill AFB were obtained in SOLINST cores or as loose soil
samples in glass jars. The Hill soil was composed of gravel, cobbles and sand grains.The bulk of the sand grains in the Hill field soil varied between 0.02 mm and 4 mm. Themean diameter varied with the depth of the soil samples and was usually between 0.05mm and 0.42 mm. The average clay content of the Hill soil was between 1 and 2%. Thefractional organic content of the Hill field soil was 0.006.
The glass columns used to pack the Hill soil were 4.8 cm diameter and either 15 cmor 30 cm long with an adjustable plunger to provide confinement. Two 250 mm and one99 mm stainless steel screens were used to hold the sand in place. The contents of the

( )V. Dwarakanath et al.rJournal of Contaminant Hydrology 38 1999 465–488470
SOLINST core were slowly emptied into the glass column using a steel piston. Whenloose soil samples from glass jars were used, a spatula was used to pour the soil into thecolumn. The soil in the glass column was compacted by tapping the glass column
Ž .slowly. Large cobbles and stones greater than 2 cm diameter were removed to ensurethat no large spaces remained in the soil column. Once the desired soil column lengthwas obtained, the end pieces were adjusted into place and the column was ready forwater saturation.
In case of columns with Ottawa sand, a vacuum was pulled to remove most of the airfrom the column. The column was flooded with carbon dioxide for about 30 min. Thiswas followed by flushing with de-aired water for about 5 to 8 pore volumes. The porevolume measurement was made by using the difference in weight between dry and watersaturated soil columns. When field soil was used, the column was flushed with severalpore volumes of de-aired groundwater with a back pressure of about 0.021 MPa to 0.034
Ž .MPa 3 to 5 psi . Once the column was saturated, it was assembled in the flow apparatusshown in Fig. 1. The permeability was measured by flowing the water through thecolumn at various flow rates and measuring the induced pressure drop using a 0 to 0.034
Ž .MPa 5 psid differential pressure transducer.An initial tracer test was performed at 100% water saturation to estimate the pore
volume and determine the homogeneity of the soil pack in columns. Then 1.1 to 1.5 porevolumes of DNAPL were injected from the bottom at an interstitial velocity of 6 to 7mrd. The flow direction was then reversed and about 5 pore volumes of water wereinjected from the top of the column at an interstitial velocity of 6 to 7 mrd until residualDNAPL saturation was reached. In order to reach residual jet fuel saturations, jet fuelwas injected from the top followed by a waterflood from the bottom of the soil column.In each case, the flow direction corresponds to the gravity stable direction. Residual
Fig. 1. Experimental setup for performing soil column experiments.

( )V. Dwarakanath et al.rJournal of Contaminant Hydrology 38 1999 465–488 471
Table 1Surfactant flood column conditions for all the soil columns
Experiment NAPL Length Diameter Soil End Velocity ResidualŽ . Ž . Ž . Ž .cm cm pieces mrd saturation %
DWa2 PCE 30.50 2.21 Ottawa Steel 0.6 19.9DWa3 PCE 30.50 2.21 Ottawa Steel 0.6 17.7DWa4 TCE 30.50 2.21 Ottawa Steel 1.2 17.7DK1 TCE 13.50 4.80 Ottawa Teflon 0.5 21.0DWa5 JP4 15.00 4.80 Ottawa Teflon 1.2 16.7JP4a2 JP4 30.50 2.21 Ottawa Steel 1.7 15.3DK4 TCE 42.7 2.50 Ottawa Teflon 1.8 17.5POLYTCEa1 TCE 26.8 4.80 Ottawa Teflon 1.8 19.6POLYTCEa2 TCE 22.8 4.80 Ottawa Teflon 1.6 18.5POLYTCEa3 TCE 75.0 2.21 Ottawa Steel 1.3 16.4HILLOU2a7 DNAPL 21.6 4.80 Field Teflon 0.5 25.8HILLOU2a8 DNAPL 9.8 4.80 Field Teflon 0.3 8.1
NAPL saturations were calculated based on the difference in weight of the uncontami-nated soil column and the contaminated soil column. The residual saturation estimatebased on weighing the soil column will be referred to as the mass balance estimate ofresidual NAPL saturation. Residual saturations were also estimated from partitioning
Ž .tracer tests Jin et al., 1995 . The surfactant solutions were injected into the column fromthe top for the DNAPLs and from the bottom in case of the LNAPLs since these are thefavorable directions with respect to gravity. A list of the column experiments discussedin this paper is given in Table 1.
The effluent samples during the surfactant flood and partitioning tracer columnexperiments were collected in a fraction collector using volumetrically calibrated testtubes. The samples were immediately transferred into glass vials with aluminum linedcaps and stored at 4 C to ensure preservation. The analysis of the samples was usuallycompleted within 48 h of sample collection. The viscosities of the various injectatesurfactant solutions were measured using a couette viscometer. The interfacial tensionswere measured using a spinning drop tensiometer. A description of these instruments
Ž .and the measurement techniques are given in Dwarakanath 1997 .
3. Results and discussion
3.1. Phase behaÕior
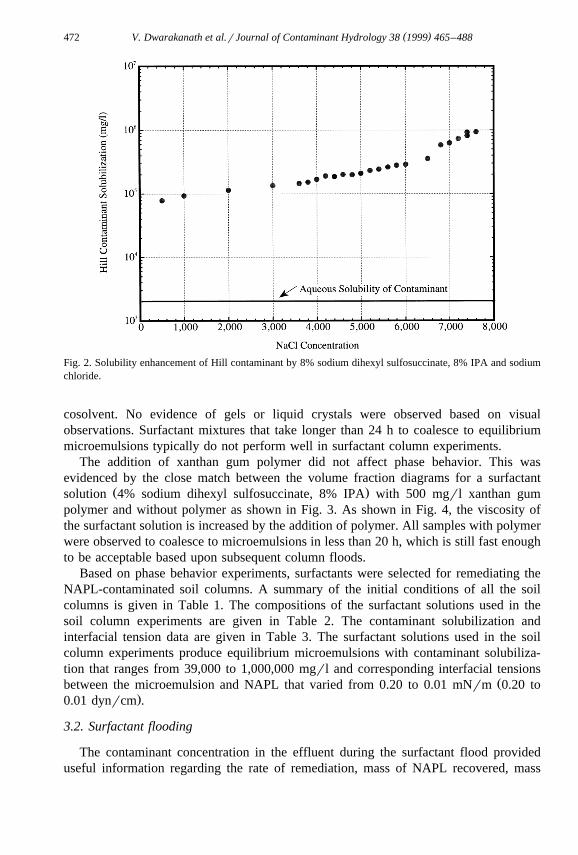
As shown in Fig. 2, the solubility of the contaminants in the DNAPL from Hill AirForce Base is increased from about 1100 mgrl in groundwater to about 625,000 mgrlby a surfactant solution containing 8% by weight sodium dihexyl sulfosuccinate, 4% byweight isopropanol and 7000 mgrl NaCl at 12.28C. All samples coalesced to mi-croemulsions in less than 15 h, and samples close to optimal salinity coalesced in lessthan 4 h. These are very fast coalescence rates compared to most surfactant mixtures andis due in part to the nature of the surfactant and in part to the presence of the IPA
( )V. Dwarakanath et al.rJournal of Contaminant Hydrology 38 1999 465–488472
Fig. 2. Solubility enhancement of Hill contaminant by 8% sodium dihexyl sulfosuccinate, 8% IPA and sodiumchloride.
cosolvent. No evidence of gels or liquid crystals were observed based on visualobservations. Surfactant mixtures that take longer than 24 h to coalesce to equilibriummicroemulsions typically do not perform well in surfactant column experiments.
The addition of xanthan gum polymer did not affect phase behavior. This wasevidenced by the close match between the volume fraction diagrams for a surfactant
Ž .solution 4% sodium dihexyl sulfosuccinate, 8% IPA with 500 mgrl xanthan gumpolymer and without polymer as shown in Fig. 3. As shown in Fig. 4, the viscosity ofthe surfactant solution is increased by the addition of polymer. All samples with polymerwere observed to coalesce to microemulsions in less than 20 h, which is still fast enoughto be acceptable based upon subsequent column floods.
Based on phase behavior experiments, surfactants were selected for remediating theNAPL-contaminated soil columns. A summary of the initial conditions of all the soilcolumns is given in Table 1. The compositions of the surfactant solutions used in thesoil column experiments are given in Table 2. The contaminant solubilization andinterfacial tension data are given in Table 3. The surfactant solutions used in the soilcolumn experiments produce equilibrium microemulsions with contaminant solubiliza-tion that ranges from 39,000 to 1,000,000 mgrl and corresponding interfacial tensions
Žbetween the microemulsion and NAPL that varied from 0.20 to 0.01 mNrm 0.20 to.0.01 dynrcm .
3.2. Surfactant flooding
The contaminant concentration in the effluent during the surfactant flood provideduseful information regarding the rate of remediation, mass of NAPL recovered, mass

( )V. Dwarakanath et al.rJournal of Contaminant Hydrology 38 1999 465–488 473
Fig. 3. Volume fraction diagram for 4% sodium dihexyl sulfosuccinate, 8% IPA and TCE, with and withoutxanthan gum polymer.
transfer characteristics between surfactant micelles and trapped NAPL, and most impor-tantly the final contaminant concentration as a result of surfactant flooding.
Fig. 4. Viscosity enhancement of surfactant with xanthan gum in surfactant solution.

()
V.D
warakanath
etal.r
JournalofC
ontaminantH
ydrology38
1999465
–488
474
Table 2Properties of injected surfactant solutions for all soil columns
Experiment NAPL Surfactant solution Electrolyte Mobilization or Pore volumesŽ .mgrl solubilization of surfactant% C5 % C6 % C8 % SBA % IPA xg mgrl
injected
DWa2 PCE 2 0 2 0 0 0 1300 CaCl Mobilization 14.72
DWa3 PCE 0 4 0 0 0 0 25,000 NaCl Solubilization 12.5DWa4 TCE 0 8 0 0 0 0 2000 NaCl Solubilization 8.7DK1 TCE 0 4 0 0 0 0 10,800 NaCl Mobilization 4.8DWa5 JP4 0 0.6 1.4 2 0 0 6000 NaCl 3.0JP4a2 JP4 0 2 2 8 0 0 11,700 NaCl 5.6
1300 CaCl2
DK-4 TCE 0 4 0 0 8 0 4000 NaCl Solubilization 13.9POLYTCEa1 TCE 0 4 0 0 8 500 4000 NaCl Solubilization 11.9POLYTCEa2 TCE 0 4 0 0 8 0 9350 NaCl Mobilization 1.0POLYTCEa3 TCE 0 4 0 0 8 0 9350 NaCl Mobilization 1.0HILLOU2a7 DNAPL 0 4 0 0 4 500 11,250 NaCl Mobilization 2.1HILLOU2a8 DNAPL 0 8 0 0 8 500 5850 NaCl Mobilization 1.9
C5sSodium diamyl sulfosuccinate.C8sSodium dioctyl sulfosuccinate.xgs xanthan gum.C6sSodium dihexyl sulfosuccinate.SBA sSecondary butyl alcohol.

( )V. Dwarakanath et al.rJournal of Contaminant Hydrology 38 1999 465–488 475
Table 3Surfactant solution properties
Experiment NAPL Interfacial tension Solubilization ViscosityŽ . Ž . Ž .mNrm mgrl mPa s
DWa2 PCE 0.01 1,000,000 36.4DWa3 PCE 0.14 58,000 1.2DWa4 TCE 0.20 52,000 1.5DK1 TCE – 163,000 1.2DWa5 JP4 – 45,000 5.8JP4a2 JP4 – 230,000 1.9DK4 TCE 0.19 39,000 1.2POLYTCEa1 TCE 0.19 39,000 11.8POLYTCEa2 TCE 0.02 516,000 1.2POLYTCEa3 TCE 0.02 516,000 1.2HILLOU2a7 DNAPL 0.01 600,000 11.8HILLOU2a8 DNAPL 0.01 425,000 11.6
Shear rates0.945 sy1.
In mobilization dominated experiments, greater than 80% of the contaminant wasrecovered as free phase NAPL followed by a rapid decline to low concentrations ofcontaminant in the effluent. We illustrate this behavior for four mobilization experimentsusing Ottawa sand. This is observed in Fig. 5 for column experiment POLYTCEa3, inwhich high concentrations on the order of 500,000 mgrl TCE were observed during thefirst pore volume of the surfactant flood. Similar results are shown in Fig. 6 where peakeffluent contaminant concentrations between 500,000 and 1,000,000 mgrl were ob-served at about one pore volume for three other mobilization experiments.
Fig. 5. TCE concentration in effluent during surfactant flood and post surfactant waterflood for experimentPOLYTCEa3.

( )V. Dwarakanath et al.rJournal of Contaminant Hydrology 38 1999 465–488476
Fig. 6. Effluent contaminant concentration during surfactant flood and post surfactant waterflood for threemobilization experiments.
We next illustrate three column experiments using Ottawa sand where little or nomobilization occurred because of the relatively high interfacial tension, or more pre-
Ž .cisely, low trapping number Pennell et al., 1996 . The interfacial tension was high inŽ .these experiments due to the low salinity Table 2 . As shown in Fig. 7, a steady plateau
of the contaminant concentration in the effluent was observed for 5 to 10 pore volumes
Fig. 7. Effluent contaminant concentration during surfactant flood and post surfactant waterflood for threesolubilization experiments.

( )V. Dwarakanath et al.rJournal of Contaminant Hydrology 38 1999 465–488 477
followed by a decline to low concentrations. The effluent contaminant concentration wasclose to the equilibrium solubility of the contaminant as determined by the phasebehavior experiments.
These experiments also illustrate the ease with which the preferred type of floodŽ .solubilization or mobilization can be conducted by simply changing the salinity of theinjected surfactant mixture. Since the salinity can be adjusted continuously and inexpen-sively in the field, this is a very practical approach to controlling a surfactant flood whenanionic surfactants such as sulfosuccinates are used. This is also a significant advantageof using anionic surfactants over nonionic surfactants. The final water flood to flush thesurfactant out of the aquifer should always be low in salinity similar to the groundwaterboth to restore the electrolytes to their original state and because surfactant floods are
Žmore robust and efficient if a negative salinity gradient is imposed Pope and Wade,.1995 .
In experiment DWa3, the peak effluent PCE concentration was 45,000 mgrlcompared to the equilibrium solubilization of 58,000 mgrl. The effluent PCE concentra-tion did not change when the flow rate was increased from 0.6 mrday to 2.4 mrdayduring the surfactant flood. This suggests a close approach to local equilibrium in thesoil pores. Similarly in experiment DK-4, the peak effluent TCE concentration was29,000 mgrl compared to the equilibrium solubilization of 39,000 mgrl. In experimentPOLYTCEa1, the peak effluent TCE concentration was about 37,000 mgrl comparedto the equilibrium solubilization of 39,000 mgrl. These values are the same well withinthe uncertainty of the GC analysis, which is about 10%. This very close approach toequilibrium behavior with polymer is thought to be due to the increased viscosity of thesolution containing polymer, which promotes more uniform transport of the surfactantsolution and thus increases the contact with the trapped DNAPL and causes a moreefficient mass transfer of TCE between the trapped DNAPL and the surfactant micelles.Thus, even in a linear column experiment, with nearly uniform packing, polymerappears to increase the efficiency of the flooding process. In an aquifer, additionalbenefits of the polymer will be manifested in less bypassing of low hydraulic conductiv-ity zones and other effects promoting better sweep of the aquifer, which will reduce theamount of surfactant and time needed to remediate the aquifer and thus reduce the costof the remediation. The cost of the polymer itself is very small since only about 0.05wt.% is needed to generate adequate viscosity.
The higher efficiency due to the presence of polymer translates into a fasterremediation rate. This can be inferred by comparing Fig. 7, which shows that 10.5 porevolumes of surfactant were required to reduce the TCE concentration to less than 100mgrl in experiment POLYTCEa1 compared to 20 pore volumes of surfactant inexperiment DK-4. A more uniform TCE concentration in the effluent was observed forexperiment POLYTCEa1 compared to experiment DK-4.
In general, a comparison of mobilization experiments and solubilization experimentsshowed that the volume required for NAPL removal ranged from about 2 to 4 porevolumes of surfactant for mobilization experiments whereas 11 to 20 pore volumes ofsurfactant were required in solubilization experiments. For example, more than 10 porevolumes of surfactant were needed to recover greater than 95% of the contaminant inexperiments POLYTCEa1 and DK-4 as compared to just 1 pore volume in experiment

( )V. Dwarakanath et al.rJournal of Contaminant Hydrology 38 1999 465–488478
POLYTCEa3. However in typical field sites the average NAPL saturation is muchlower than 18–20% and hence will require fewer pore volumes of surfactant forsolubilization dominated recoveries.
The final contaminant concentration in the effluent varied between 10 mgrl and100 mgrl in most column experiments that used plastic end pieces and tubing. Bothnylon tubing and Teflon end pieces used in several columns absorb TCE and then causea persistent tailing in the effluent as it desorbs. When both nylon tubing and Teflon endpieces were eliminated in experiment POLYTCEa3, the effluent TCE concentrationdeclined to less than of 1 mgrl. Once the surfactant flood has removed all of theDNAPL from the soil as in this experiment, the contaminant concentrations in the watercan become very low, and plastic must be eliminated from the entire apparatus toprevent an artificially high measurement.
3.3. Hydraulic gradient measurements and interpretation
In a typical mobilization experiment, the hydraulic gradient increases until the oilbank reaches the outflow end piece of the column, i.e., until the oil bank breakthrough
Ž .time. Many examples of this behavior can be found in the EOR literature Lake, 1989 .In typical solubilization experiments, the hydraulic gradient increases until surfactantbreakthrough. This is followed by a slow decline to lower values. This behavior isshown in Fig. 8 where the hydraulic gradient during the surfactant flood and post-surfactant waterflood for experiment JP4a2 is plotted. The final hydraulic gradientdeclined to less than 0.2 after surfactant flooding. The hydraulic gradient for asurfactantrpolymer flood is shown in Fig. 9. The hydraulic gradient is higher in this
Fig. 8. Hydraulic gradients across the soil column during surfactant flood and post surfactant waterflood forexperiment JP4a2.
( )V. Dwarakanath et al.rJournal of Contaminant Hydrology 38 1999 465–488 479
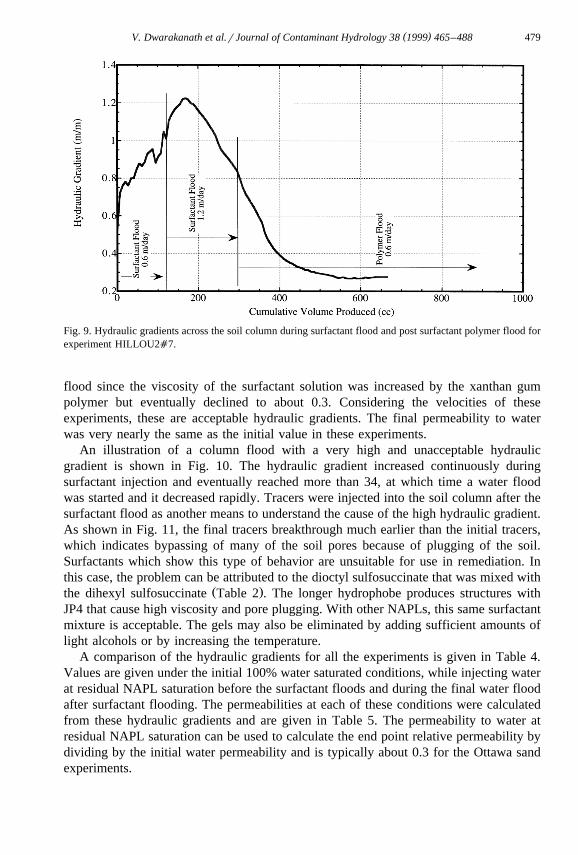
Fig. 9. Hydraulic gradients across the soil column during surfactant flood and post surfactant polymer flood forexperiment HILLOU2a7.
flood since the viscosity of the surfactant solution was increased by the xanthan gumpolymer but eventually declined to about 0.3. Considering the velocities of theseexperiments, these are acceptable hydraulic gradients. The final permeability to waterwas very nearly the same as the initial value in these experiments.
An illustration of a column flood with a very high and unacceptable hydraulicgradient is shown in Fig. 10. The hydraulic gradient increased continuously duringsurfactant injection and eventually reached more than 34, at which time a water floodwas started and it decreased rapidly. Tracers were injected into the soil column after thesurfactant flood as another means to understand the cause of the high hydraulic gradient.As shown in Fig. 11, the final tracers breakthrough much earlier than the initial tracers,which indicates bypassing of many of the soil pores because of plugging of the soil.Surfactants which show this type of behavior are unsuitable for use in remediation. Inthis case, the problem can be attributed to the dioctyl sulfosuccinate that was mixed with
Ž .the dihexyl sulfosuccinate Table 2 . The longer hydrophobe produces structures withJP4 that cause high viscosity and pore plugging. With other NAPLs, this same surfactantmixture is acceptable. The gels may also be eliminated by adding sufficient amounts oflight alcohols or by increasing the temperature.
A comparison of the hydraulic gradients for all the experiments is given in Table 4.Values are given under the initial 100% water saturated conditions, while injecting waterat residual NAPL saturation before the surfactant floods and during the final water floodafter surfactant flooding. The permeabilities at each of these conditions were calculatedfrom these hydraulic gradients and are given in Table 5. The permeability to water atresidual NAPL saturation can be used to calculate the end point relative permeability bydividing by the initial water permeability and is typically about 0.3 for the Ottawa sandexperiments.

( )V. Dwarakanath et al.rJournal of Contaminant Hydrology 38 1999 465–488480
Fig. 10. Hydraulic gradients across the soil column during the surfactant flood and post surfactant waterfloodfor experiment DWa5.
In experiment DWa2, the permeability was decreased from an initial value of 15.4Darcy to a final water flood value of 1.5 Darcy. Column DWa5 was plugged as a resultof surfactant flooding. In both experiments, a surfactant mixture with sodium dioctylsulfosuccinate was used without enough cosolvent to prevent gels. Sodium dihexylsulfosuccinate is less prone to forming gels and less alcohol is needed to eliminate gelwhen it does form. Low pressure gradients are difficult to measure accurately with
Fig. 11. Comparison of initial tracer and post surfactant tracer breakthrough curves for experiment DWa5.

( )V. Dwarakanath et al.rJournal of Contaminant Hydrology 38 1999 465–488 481
Table 4Comparison of gradients before and after surfactant remediation
Experiment NAPL Hydraulic gradient
Initial At Sor Post surfactant water chase
DWa2 PCE 0.04 0.16 0.35DWa3 PCE 0.07 0.21 0.08DWa4 TCE 0.07 0.21 0.08DK1 TCE 0.1 0.39 0.21DWa5 JP4 0.07 0.29 –JP4a2 JP4 0.06 0.24 0.06DK4 TCE 0.07 0.19 0.11POLYTCEa1 TCE 0.13 0.43 0.16POLYTCEa2 TCE 0.10 0.32 0.10POLYTCEa3 TCE 0.07 0.14 0.07HILLOU2a7 DNAPL 0.08 0.51 0.09HILLOU2a8 DNAPL – 0.16 0.06
All gradient readings have been adjusted for an interstitial velocity of 1.2 mrd.
pressure transducers and result in a large uncertainty in the hydraulic gradients andpermeabilities, but for experiments DWa3, DWa4, JP4a2, POLYTCEa2 and POLY-TCEa3, it is clear that a negligible reduction in permeability was observed. Based onthese results, it can be concluded that when sodium dihexyl sulfosuccinate is used withthese soils, there will be no significant loss of permeability. When used with xanthangum polymer as in experiments POLYTCEa1 and HILLOU2a7, the final permeabilitywas somewhat less than the initial value. This may have been due to insufficientremoval of the polymer by the final water flood, but in any case it is still in theacceptable range of behavior and does not offset the value the polymer has for otherreasons.
Table 5Comparison of permeabilities before and after surfactant remediation
Ž .Experiment NAPL Permeability Darcy
Initial At Sor End of Post surfactant,surfactant water chase
DWa2 PCE 15.3 3.3 – 1.5DWa3 PCE 7.3 2.6 1.9 6.9DWa4 TCE 8.3 2.5 1.6 7.1DK1 TCE 4.5 1.2 1.8 2.2DWa5 JP4 7.1 1.8 0.1 –JP4a2 JP4 8.8 2.2 5.8 8.6DK4 TCE 6.5 2.0 1.1 3.2POLYTCEa1 TCE 5.8 1.8 – 4.9POLYTCEa2 TCE 4.4 1.4 3.4 4.2POLYTCEa3 TCE 6.8 3.2 4.8 6.2HILLOU2a7 DNAPL 5.9 0.9 1.9 4.5HILLOU2a8 DNAPL – 3.0 3.8 7.7

( )V. Dwarakanath et al.rJournal of Contaminant Hydrology 38 1999 465–488482
The viscosities of the aqueous surfactant solutions were measured before injectioninto the columns. It can be seen in Table 3 that the solutions injected into DWa3,
Ž .DWa4, DK1, JP4a2, POLYTCEa2 and POLYTCEa3 have low viscosities F1.5 cp ,whereas the solutions injected into DWa2 and DWa5 have higher viscosities. InPOLYTCEa1, HILLOU2a7 and HILLOU2a8, the viscosities of the surfactant solu-tions were about 11.7 cp at a shear rate of 0.945 sy1. This is due to the addition of 500mgrl xanthan gum polymer. The variation of viscosity with shear rate for several of thesurfactant solutions is plotted in Fig. 12. High viscosity and non-Newtonian behaviorwas observed for surfactants used in experiments DWa2 and DWa5 despite theabsence of polymer. In both these experiments, plugging and permeability reduction wasobserved.
Based on the comparison of the viscosities of the surfactant solutions, it can beinferred that the more viscous solutions with non-Newtonian behavior are more likely tocause higher hydraulic gradients and loss of hydraulic conductivity during surfactantflooding. After observing high gradients in DWa5, the amount of secondary butylalcohol was increased to 8% wt. in the surfactant solution in experiment JP4a2. As aresult, lower hydraulic gradients and negligible permeability reduction were observed inexperiment JP4a2. The addition of alcohol helps in melting the gels and lowers theviscosity and density of the surfactant solution. In experiments DK-4, POLYTCEa1,POLYTCEa2, POLYTCEa3 and HILLOU2a8, 8% wt. IPA was used to prevent gelformation.
In the case of DNAPLs, another potential benefit of adding light alcohols such asethanol and IPA which have low densities is the lower density of both the injectedsurfactant solution and the microemulsion that forms in situ as the injected surfactantsolution solubilizes the dense contaminants from the DNAPL. Without alcohol, thedifference between the microemulsion density and the groundwater density may besignificant enough to cause downward movement of the microemulsion. The addition of
Fig. 12. Variation of viscosity with shear rate for surfactant solutions used in column experiments.
( )V. Dwarakanath et al.rJournal of Contaminant Hydrology 38 1999 465–488 483
large amounts of alcohol decreases the density contrast between the microemulsion andgroundwater and minimizes or eliminates downward movement of the microemulsion.When sufficient amounts of alcohol are added to reduce the density to that of water, the
Ž .microemulsion becomes neutrally buoyant and experiments by Kostarelos 1998 haveshown that even without an aquitard downward migration of the dense contaminants canbe completely prevented.
3.4. Surfactant adsorption
Anionic surfactants such as the sulfonates used in this study typically have loweradsorption than nonionic surfactants on silica minerals assuming neutral to high pH.This is because the negative sulfonate head of the surfactant is repelled by the netnegative charge of silica and other typical minerals that make up alluvium aquifers attypical values of groundwater pH. Surfactant sorption experiments can be conducted ineither batch experiments or soil column experiments. When the surfactant adsorption isvery low and the surfactant concentration high as in our experiments, batch surfactantadsorption is very difficult to measure accurately because of the very small changes insurfactant concentration. In addition these experiments do not quantify surfactantbehavior under dynamic conditions in the presence of both field DNAPL and soil, socolumn experiments were preferred in this work.
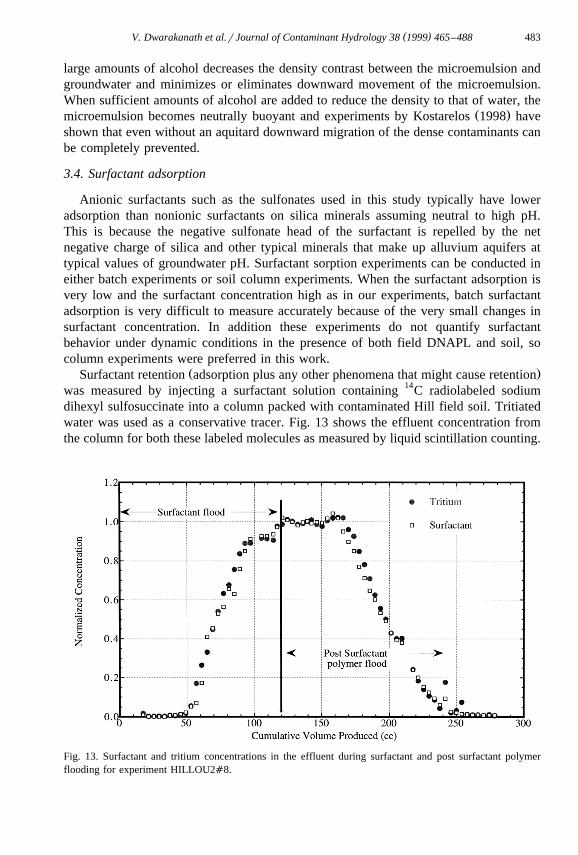
Ž .Surfactant retention adsorption plus any other phenomena that might cause retentionwas measured by injecting a surfactant solution containing 14C radiolabeled sodiumdihexyl sulfosuccinate into a column packed with contaminated Hill field soil. Tritiatedwater was used as a conservative tracer. Fig. 13 shows the effluent concentration fromthe column for both these labeled molecules as measured by liquid scintillation counting.
Fig. 13. Surfactant and tritium concentrations in the effluent during surfactant and post surfactant polymerflooding for experiment HILLOU2a8.

( )V. Dwarakanath et al.rJournal of Contaminant Hydrology 38 1999 465–488484
The almost identical breakthrough and elution of these molecules indicate very lowadsorption of the surfactant on this soil.
A retardation factor was calculated from these data and yielded a distributionŽ .coefficient K of 0.0017, which corresponds to an adsorption of 0.16 mg of surfactantd
per gram of soil, but these values are not significantly different from zero taking theexperimental error into account. Regardless, these values are lower than those reported
Ž .by Rouse and Sabatini 1993 for other surfactants on similar soils. We attribute this inpart to the very favorable characteristics of dihexyl sulfosuccinate and in part to the useof the IPA cosolvent. High values of surfactant retention can be caused by undesirablephases such as gels and liquid crystals or by macroemulsions and the addition ofcosolvent minimizes these effects.
3.5. Performance assessment
A comparison of the residual NAPL saturations after surfactant flooding based onboth partitioning tracers and mass balance measurements is presented in Table 6. Theapparent final residual DNAPL saturation estimates range from y0.0038 to 0.0046 fromthe mass balance and from 0.0001 to 0.005 from the partitioning tracers. The negativevalues from the mass balance are obviously experimental error and indicate that themass balance error is on the order of 0.004 saturation units. This corresponds to onlyabout 0.2 ml of DNAPL.
The last five column experiments represent the best performance since the surfactantsolution contained dihexyl sulfosuccinate and IPA and the DNAPL was either pure TCEor Hill DNAPL. For these best experiments, final residual DNAPL saturations on theorder of 0.0002 were estimated based on partitioning tracers, which corresponds to aremoval of 99.9% of the contaminant. The experimental error in the partitioning tracermethod under these conditions is estimated to be about 10% of the residual saturation or0.0002, whichever is greater. The error is very small due to the use of a partitioning
Table 6Final NAPL saturation after surfactant remediation
Experiment NAPL Final NAPL saturation Final NAPLŽ .conc. mgrlMass balance Tracers
DWa2 PCE 0.0046 – -100DWa3 PCE y0.0009 0.005 -100DWa4 TCE 0.0000 0.005 -50DK1 TCE 0.004 0.016 -10DWa5 JP4 – – –JP4a2 JP4 0.023 0.035 –DK4 TCE 0.01 0.000 -10POLYTCEa1 TCE y0.0023 0.0001 -10POLYTCEa2 TCE 0.0038 0.0010 -10POLYTCEa3 TCE y0.0024 0.0002 -1HILLOU2a7 DNAPL y0.0038 0.0002 –HILLOU2a8 DNAPL – 0.0015 -15

( )V. Dwarakanath et al.rJournal of Contaminant Hydrology 38 1999 465–488 485
tracer with a very high partition coefficient, which in this case was n-heptanol.n-Heptanol has a partition coefficient of approximately 140 for the Hill DNAPL and 90for pure TCE. Within experimental error, all the DNAPL has been removed from thesesoil columns. This is consistent with the final TCE concentration in the water for theexperiment in which a stainless steel column was used. In that column experimentŽ .POLYTCEa3 , the final TCE concentration was less than 1 mgrl, which was thedetection limit on the GC used in this work.
4. Conclusions and recommendations
Laboratory soil column experiments have demonstrated that with a good surfactantformulation based upon good phase behavior, up to 99.9% of the DNAPL can berecovered from a soil column in as little as 1.0 to 2.0 pore volumes of surfactantflooding. Phase behavior experiments are a very important step to select good surfac-tants with high contaminant solubilization, fast coalescence rates and minimal liquidcrystal forming tendencies. The use of xanthan gum polymer as a viscosifier helped inimproving the rate of contaminant removal in solubilization experiments.
The measurement of hydraulic gradients during a surfactant flood is essential forquantifying surfactant transport in a porous medium. Surfactants that are more likely toform gels and liquid crystals will cause high hydraulic gradients during surfactantflooding and should be avoided. Acceptable surfactants will show low hydraulicgradients during the surfactant flood. Low hydraulic gradients and negligible permeabil-ity reduction with both Ottawa sand and Hill field soil were observed when sodiumdihexyl sulfosuccinate was used with isopropanol as a cosolvent in soil columnexperiments.
Based on the results presented in this paper the following guidelines are suggested fordesigning surfactant floods for remediating soils contaminated by NAPLs:
1. Phase behavior experiments should be performed to identify surfactants with highcontaminant solubilization, fast coalescence rates to classical microemulsions and mini-mal liquid crystalrgelrmacroemulsion forming tendencies over the expected range ofconditions of temperature, electrolyte, surfactant, cosolvent and contaminant concentra-tions. The viscosity of both the aqueous surfactant solution that is injected and themicroemulsion that forms when it mixes with and solubilizes the NAPL should be low,
Ži.e., not much greater than the corresponding water or polymer solution if polymer is.added to the water .
2. Pressure gradients should be measured during column experiments to verify thatthe hydraulic gradient during and after the surfactant flood is not too high for the aquiferconditions of interest and surfactant solutions that show unacceptable hydraulic gradi-ents should be not be used to flood aquifers even if the recovery of the NAPL is high.The final water permeability of the soil after surfactant flooding should be close to itsinitial value.
3. The partitioning tracer test is a valuable and accurate complement to mass balancefor estimating the residual NAPL saturation before and after surfactant flooding.

( )V. Dwarakanath et al.rJournal of Contaminant Hydrology 38 1999 465–488486
4. Adding polymer to a surfactant solution to increase its viscosity has the potential togreatly increase the efficiency of surfactant remediation and should be tested in the soilof interest to evaluate its performance and benefit for applications where the aquiferpermeability is sufficiently high and a sufficiently high hydraulic gradient can beimposed during the flood of the aquifer.
Acknowledgements
This research was funded by the Advanced Technology Program of the state ofŽ .Texas. Also, the DOE EMSP Contract DE-FG07-96-ER14720 and the Air Force
Ž .Center for Environmental Excellence Contract No: F41624-95-C-8010 funded parts ofthe partitioning tracer research used for performance assessment of the surfactantcolumn experiments. Additional funds for this study were provided by the TexacoCentennial Chair in Petroleum Engineering held by Gary A. Pope. We would like tothank Bruce Rouse, Vinitha Weerasooriya, Adil Abubakar, Meng Lim and Kiam Ooi fortheir assistance with the laboratory experiments.
References
Abdul, A.S., Gibson, T.L., Rai, D.N., 1990. Selection of surfactants for the removal of petroleum productsŽ .from shallow sandy aquifers. Ground Water 28 6 , 920.
Allred, B., Brown, G.O., 1995. Surfactant-induced reductions of saturated hydraulic conductivity andunsaturated diffusivity. Surfactant-enhanced subsurface remediation emerging technologies. In: Sabatini,
Ž .D.A., Knox, R.C., Harwell, J.H., Eds. , ACS symposium series 594, American Chemical Society,Washington, DC, 216–230.
Ang, C.C., Abdul, A.S., 1991. Aqueous surfactant flushing of residual oil contamination from sandy soil.Ž .GWMR 11 2 , 121.
Baran, J.R. Jr., Pope, G.A., Wade, W.H., Weerasooriya, V., 1994a. Phase behavior of waterrperchloroethyl-Ž .eneranionic systems. Langmuir 10 4 , 1146.
Baran, J.R. Jr., Pope, G.A., Wade, W.H., Weerasooriya, V., Yapa, A., 1994b. Microemulsion formation withŽ .chlorinated hydrocarbon liquids. J. Colloid Interface Sci. 168 1 , 67.
Baran, J.R. Jr., Pope, G.A., Wade, W.H., Weerasooriya, V., Yapa, A., 1994c. Microemulsion formation withchlorinated hydrocarbons of different polarity liquids. Environ. Sci. Technol. 28, 1361–1366.
Baran, J.R. Jr., Pope, G.A., Wade, W.H., Weerasooriya, V., 1996a. Surfactant systems for soil and aquiferŽ .remediation of JP4 jet fuel. J. Dispersion Sci. Technol. 17 2 , 131–138.
Baran Jr., J.R., Pope, G.A., Schultz, C., Wade, W.H., Weerasooriya, V., Yapa, A., 1996b. Toxic spillremediation of chlorinated hydrocarbons via microemulsion formation. In: Chattopadhyay, A.K., Mittal,
Ž .K.L. Eds. , Surfactants in Solution, Marcel Dekker, 393–411.Baran, J.R. Jr., Pope, G.A., Wade, W.H., Weerasooriya, V., 1996c. Waterrchlorocarbon winsor I–III–II
Ž .microemulsion phase behavior with alkyl glucamide surfactants. Environ. Sci. Technol. 30 7 , 2143–2147.Bourbonais, K.A., Compeau, G.C., MacClellan, L.K., 1995. Evaluating effectiveness of in situ soil flushing
Ž .with surfactants. In: Sabatini, D.A., Knox, R.C., Harwell, J.H. Eds. , Surfactant Enhanced SubsurfaceRemediation Emerging Technologies, ACS symposium series 594, American Chemical Society, Washing-ton, DC, 161–177.
Bourrel, M., Schechter, R.S., 1988. Microemulsions and Related Systems, Marcel Dekker, New York.Brown, C.L., Delshad, M., Dwarakanath, V., McKinney, D.C., Pope, G.A., 1996. Design of a Field-Scale
Surfactant Enhanced Remediation of a DNAPL Contaminated Aquifer. Presented at the I&EC SpecialSymposium American Chemical Society Birmingham, AL, September 9–12.

( )V. Dwarakanath et al.rJournal of Contaminant Hydrology 38 1999 465–488 487
Brown, C.L., Delshad, M., Dwarakanath, V., McKinney, D.M., Pope, G.A., Jackson, R.E., Londergan, J.T.,Meinardus, H.W., Wade, W.H., 1998. Demonstration of Surfactant Flooding of an Alluvial Aquifer
Ž .Contaminated with DNAPL. In: Brusseau, M., Annable, M., Gierke, J. Eds. , Innovative SubsurfaceRemediation: Field Testing of Physical, Chemical, and Characterization Technologies, ACS SymposiumSeries 725, American Chemical Society, Washington, DC.
Delshad, M., Pope, G.A., Sepehrnoori, K., 1996. A compositional simulator for modeling surfactant enhancedaquifer remediation: 1. Formulation. J. Cont. Hydrol. 23, 303–327.
Dwarakanath, V., 1997. Characterization and Remediation of Aquifers Contaminated by Nonaqueuous PhaseLiquids Using Partitioning Tracers and Surfactants. PhD dissertation, University of Texas, Austin.
Ellis, W.D., Morgan, D.R., Ranjithan, S.R., 1986. Treatment of Contaminated Soils with Aqueous Surfactants.EPAr600r2-85r129, Hazardous Waste Engineering Research Laboratory.
Fountain, J.C., Klimek, A., Beikirch, M.G., Middleton, T.M., 1991. The use of surfactants for in situŽ .extraction of organic pollutants from a contaminated aquifer. J. Haz. Mater. 28 3 , 295.
Fountain, J.C, Waddel-Sheets, C., Lagowski, A., Taylor, C., Frazier, D., Byrne, M., 1995. Enhanced removalof dense nonaqueous-phase liquids using surfactants capabilities and limitations from field trials. In:
Ž .Sabatini, D.A., Knox, R.C., Harwell, J.H. Eds. , Surfactant-Enhanced Subsurface Remediation EmergingTechnologies, ACS 594, American Chemical Society, Washington, DC, 177–190.
Fountain, J.C., Starr, R.C., Middleton, T., Beikirch, M., Taylor, C., Hodge, D., 1996. A controlled field test ofŽ .surfactant-enhanced aquifer remediation. Ground Water 34 5 , 910–916.
Gellar, J.T., Hunt, J.R., 1993. Mass transfer from nonaqueous phase liquids in water-saturated porous media.Ž .Water Resour. Res. 29 4 , 833–845.
Ž .INTERA now DE&S , 1998. Final Report on The Demonstration of Surfactant Enhanced Aquifer Remedia-tion of Chlorinated Solvent DNAPL at Operable Unit 2, Hill AFB, UT. Prepared for AFCEE TechnologyTransfer Division Brooks AFB, San Antonio, TX.
Jackson, R.E., Mariner, P.E., 1995. Estimating DNAPL composition and VOC dilution form extraction wellŽ .data. Ground Water 33 3 , 407–414.
Jin, M., 1995. Surfactant Enhanced Remediation and Interwell Partitioning Tracer Test for Characterization ofNAPL Contaminated Aquifers. PhD dissertation, University of Texas, Austin.
Jin, M., Delshad, M., Dwarakanath, V., McKinney, D.C., Pope, G.A., Sepehrnoori, K., Tilburg, C., Jackson,R.E., 1995. Partitioning tracer test for detection, estimation and remediation performance assessment of
Ž .subsurface nonaqueous-phase liquids. Water Resour. Res. 31 5 , 1201–1212.Kostarelos, K., 1998. Surfactant Enhanced Recovery of DNAPL using Neutral Buoyancy PhD dissertation,
The University of Texas at Austin.Kueper, B.H., 1989. The Behavoir of Dense, Non-aqueous Phase Liquid Contaminants in Heterogeneous
Porous Media. PhD dissertation, University of Waterloo, Waterloo, Ont.Lake, L.W., 1989. Enhanced Oil Recovery, Prentice Hall, Englewood Cliffs, NJ.Mackay, D.M., Cherry, J.A., 1989. Groundwater contamination: pump and treat remediation. Environ. Sci.
Ž .Technol. 23 6 , 630–635.Mason, A., Kueper, B.H., 1996. Numerical simulation of surfactant-enhanced solubilization of pooled
Ž .DNAPL. Environ. Sci. Technol. 30 11 , 3205–3215.Nash, J.H., 1987. Field Studies of In Situ Washing; EPAr600r2-87r110, U.S. Environmental Protection
Agency, Cincinnati, OH.Oolman, T., Godard, S.T., Pope, G.A., Jin, M., Kirchner, K., 1995. DNAPL flow behavior in a contaminated
Ž .aquifer: evaluation of field data. GWMR 15 4 , 125–137.Pankow, J.F., Cherry, J.A., 1996. Dense chlorinated solvents, Waterloo Press, Portland.Pennell, K.D., Abriola, L.M., Weber, W.J. Jr., 1993. Surfactant enhanced solubilization of residual dodecane
Ž .in soil columns: 1. Experimental investigation. Environ. Sci. Technol. 27 12 , 2332–2340.Pennell, K.D., Jin, M., Abriola, L.M., Pope, G.A., 1994. Surfactant enhanced remediation of soil columns
Ž .contaminated by residual tetrachloroethylene. J. Cont. Hydrol. 16 1 , 35.Pennell, K.D., Pope, G.A., Abriola, L.M., 1996. Influence of viscous and buoyancy forces on the mobilization
Ž .of residual tetrachloroethylene during surfactant flushing. Environ. Sci. Technol. 30 4 , 1328–1335.Peters, R.W., Montemagno, C.D., Shem, L., Lewis, B., 1992. Surfactant screening of diesel contaminated soil.
Ž .Hazardous Waste and Hazardous Materials 9 2 , 113.Pope, G.A., Wade, W.H., 1995. Lessons from enhanced oil recovery research for surfactant enhanced aquifer

( )V. Dwarakanath et al.rJournal of Contaminant Hydrology 38 1999 465–488488
Ž .remediation. In: Sabatini, D.A., Knox, R.C., Harwell, J.H. Eds. , Surfactant-Enhanced SubsurfaceRemediation Emerging Technologies, ACS symposium series 594, American Chemical Society, Washing-ton, DC, 142–160.
Powers, S.E., Loureiro, C.O., Abriola, L.M., Weber, W.J. Jr., 1991. Theoretical study of the significance ofŽ .nonequilibrium dissolution of nonaqueous phase liquids in subsurface systems. Water Resour. Res. 27 4 ,
463–477.Renshaw, C.E., Zynda, G.D., Fountain, J.C., 1997. Permeability reductions induced by sorption of surfactant.
Ž .Water Resour. Res. 33 3 , 371–378.Rouse, J.D., Sabatini, D.A., 1993. Minimizing surfactant losses using twin-head anionic surfactants in
Ž .subsurface remediation. Environ Sci. Technol 27 10 , 2072–2078.Shiau, B., Rouse, J.D., Sabatini, D.A., Harwell, J.H., 1995. Surfactant selection for optimizing surfactant
Ž .enhanced subsurface remediation. In: Sabatini, D.A., Knox, R.C., Harwell, J.H. Eds. , SurfactantEnhanced Subsurface Remediation Emerging Technologies, ACS symposium series 594, AmericanChemical Society, Washington, DC, 65–81.
Shotts, D.R., 1996. Surfactant Remediation of Soils Contaminated with Chlorinated Solvents, MS thesis, TheUniversity of Texas at Austin.
Ž .West, C.C., Harwell, J.H., 1992. Surfactants and subsurface remediation. Environ. Sci. Technol. 26 12 ,2324–2330.
Ziegenfuss, P.S., 1987. The Potential Use of Surfactant and Cosolvent Soil Washing as Adjutant for In SituAquifer Restoration. MS thesis, Rice University, Houston, TX.