
Remediation to improve infiltration into compact soils
12
(This is a sample cover image for this issue. The actual cover is not yet available at this time.) This article appeared in a journal published by Elsevier. The attached copy is furnished to the author for internal non-commercial research and education use, including for instruction at the authors institution and sharing with colleagues. Other uses, including reproduction and distribution, or selling or licensing copies, or posting to personal, institutional or third party websites are prohibited. In most cases authors are permitted to post their version of the article (e.g. in Word or Tex form) to their personal website or institutional repository. Authors requiring further information regarding Elsevier’s archiving and manuscript policies are encouraged to visit: http://www.elsevier.com/copyright
Transcript of Remediation to improve infiltration into compact soils

(This is a sample cover image for this issue. The actual cover is not yet available at this time.)
This article appeared in a journal published by Elsevier. The attachedcopy is furnished to the author for internal non-commercial researchand education use, including for instruction at the authors institution
and sharing with colleagues.
Other uses, including reproduction and distribution, or selling orlicensing copies, or posting to personal, institutional or third party
websites are prohibited.
In most cases authors are permitted to post their version of thearticle (e.g. in Word or Tex form) to their personal website orinstitutional repository. Authors requiring further information
regarding Elsevier’s archiving and manuscript policies areencouraged to visit:
http://www.elsevier.com/copyright
Author's personal copy
Remediation to improve infiltration into compact soils
Nicholas C. Olson a,1, John S. Gulliver a,*, John L. Nieber b,1, Masoud Kayhanian c,2
a St. Anthony Falls Laboratory, Department of Civil Engineering, University of Minnesota, 500 Pillsbury SE, Minneapolis, MN 55414, USAbDepartment of Bioproducts and Biosystems Engineering, University of Minnesota, St. Paul, MN 55108, USAcDepartment of Civil and Environmental Engineering, University of California, Davis, CA 95616, USA
a r t i c l e i n f o
Article history:Received 31 May 2011Received in revised form26 March 2012Accepted 8 October 2012Available online
Keywords:Urban stormwater runoffSoil remediationSaturated hydraulic conductivitySoil strengthBulk densityInfiltrationTillingCompost
a b s t r a c t
Urban development usually involves soil compaction through converting large pervious land intodeveloped land. This change typically increases runoff during runoff events and consequently may add toflooding and additional volume of runoff. The wash off of pollutants may also create numerous waterquality and environmental problems for receiving waters. To alleviate this problem many municipalitiesare considering low impact development. One technique to reduce runoff in an urban area is to improvethe soil infiltration. This study is specifically undertaken to investigate tilling and compost addition toimprove infiltration rate, and to investigate measurement tools to assess the effectiveness of remediatedsoil.
Soil remediation was performed at three sites in an urban area metropolitan area. Each site wasdivided into three plots: tilled, tilled with compost addition, and a control plot with no treatment. Theinfiltration effectiveness within each plot was assessed by measuring saturated hydraulic conductivity(Ksat) using the modified Philip Dunne (MPD) infiltrometer during pre- and post-treatment. In addition,the use of soil bulk density and soil strength as surrogate parameters for Ksat was investigated.
Results showed that deep tillage was effective at reducing the level of soil strength. Soil strength wasapproximately half that of the control plot in the first six inches of soil. At two of the sites, tilling was alsoineffective at improving the infiltration capacity of the soil. The geometric mean of Ksat was 0.5e2.3 timesthat of the control plot, indicating little overall improvement. Compost addition was more effective thantilling by reducing the soil strength and compaction and increasing soil infiltration. The geometric meanof Ksat on the compost plots was 2.7e5.7 times that of the control plot. No strong correlations wereobserved before remediation between either soil bulk density or soil strength and Ksat. Simulationresults showed that the amount of runoff generated from a selection of design storms for treated soilwas less than for untreated soil. The results presented in this study may be used as guidance forurban hydromodification and stormwater management plans.
� 2012 Elsevier Ltd. All rights reserved.
1. Introduction
1.1. Background
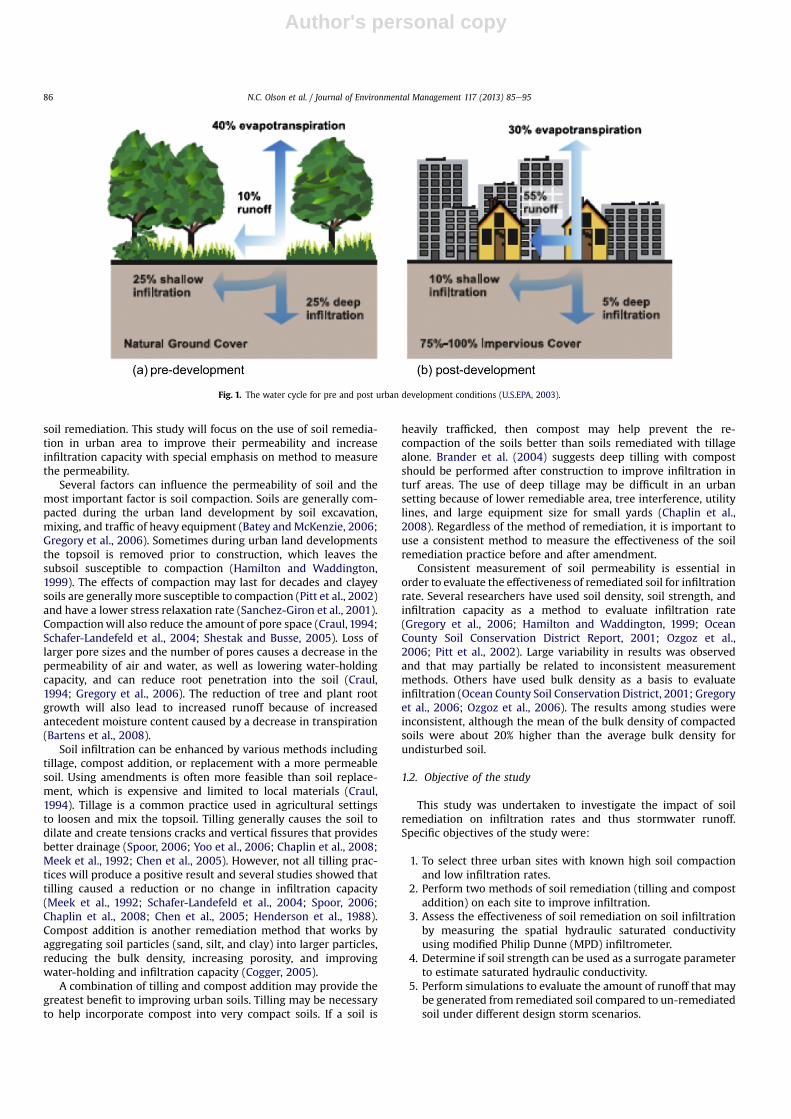
Urban development, due to an increase in impervious surfacesand soil compaction, generally increases the amount of runoffgenerated from a watershed over the pre-development condition.In older urban developments, as shown in Fig. 1, the amount of
runoff generated can increase by a factor of 5 and occasionallycreate flooding. The generated runoff also contains suspendedsediments and associated pollutants such as metals, nutrients, oiland grease, pesticides, herbicides, and PAHs that will impactreceiving waters.
To alleviate the flooding and environmental problems, manynewer urban developments are incorporating the low impactdevelopment (LID) or hydromodification (U.S. EPA, 2003, 1993).Implementations of hydromodification are thus focused on findingways to allow rainwater to infiltrate into the ground to reducerunoff and peak flow. Infiltration of stormwater runoff providesboth benefits, particularly when a combined stormwater andwastewater sewer systems are used. At present, several infiltrationpractices are gaining popularity to manage stormwater in urbanarea including rain gardens, pervious pavements, green roofs, and
* Corresponding author. Tel.: þ1 612 625 4080; fax: þ1 612 626 7750.E-mail addresses: [email protected] (J.S. Gulliver), [email protected]
(J.L. Nieber), [email protected] (M. Kayhanian).1 Tel.: þ1 612 625 6724; fax: þ1 612 625 6286.2 Tel.: þ1 530 752 8957; fax: þ1 530 752 7872.
Contents lists available at SciVerse ScienceDirect
Journal of Environmental Management
journal homepage: www.elsevier .com/locate/ jenvman
0301-4797/$ e see front matter � 2012 Elsevier Ltd. All rights reserved.http://dx.doi.org/10.1016/j.jenvman.2012.10.057
Journal of Environmental Management 117 (2013) 85e95
Author's personal copy
soil remediation. This study will focus on the use of soil remedia-tion in urban area to improve their permeability and increaseinfiltration capacity with special emphasis on method to measurethe permeability.
Several factors can influence the permeability of soil and themost important factor is soil compaction. Soils are generally com-pacted during the urban land development by soil excavation,mixing, and traffic of heavy equipment (Batey and McKenzie, 2006;Gregory et al., 2006). Sometimes during urban land developmentsthe topsoil is removed prior to construction, which leaves thesubsoil susceptible to compaction (Hamilton and Waddington,1999). The effects of compaction may last for decades and clayeysoils are generally more susceptible to compaction (Pitt et al., 2002)and have a lower stress relaxation rate (Sanchez-Giron et al., 2001).Compactionwill also reduce the amount of pore space (Craul, 1994;Schafer-Landefeld et al., 2004; Shestak and Busse, 2005). Loss oflarger pore sizes and the number of pores causes a decrease in thepermeability of air and water, as well as lowering water-holdingcapacity, and can reduce root penetration into the soil (Craul,1994; Gregory et al., 2006). The reduction of tree and plant rootgrowth will also lead to increased runoff because of increasedantecedent moisture content caused by a decrease in transpiration(Bartens et al., 2008).
Soil infiltration can be enhanced by various methods includingtillage, compost addition, or replacement with a more permeablesoil. Using amendments is often more feasible than soil replace-ment, which is expensive and limited to local materials (Craul,1994). Tillage is a common practice used in agricultural settingsto loosen and mix the topsoil. Tilling generally causes the soil todilate and create tensions cracks and vertical fissures that providesbetter drainage (Spoor, 2006; Yoo et al., 2006; Chaplin et al., 2008;Meek et al., 1992; Chen et al., 2005). However, not all tilling prac-tices will produce a positive result and several studies showed thattilling caused a reduction or no change in infiltration capacity(Meek et al., 1992; Schafer-Landefeld et al., 2004; Spoor, 2006;Chaplin et al., 2008; Chen et al., 2005; Henderson et al., 1988).Compost addition is another remediation method that works byaggregating soil particles (sand, silt, and clay) into larger particles,reducing the bulk density, increasing porosity, and improvingwater-holding and infiltration capacity (Cogger, 2005).
A combination of tilling and compost addition may provide thegreatest benefit to improving urban soils. Tilling may be necessaryto help incorporate compost into very compact soils. If a soil is
heavily trafficked, then compost may help prevent the re-compaction of the soils better than soils remediated with tillagealone. Brander et al. (2004) suggests deep tilling with compostshould be performed after construction to improve infiltration inturf areas. The use of deep tillage may be difficult in an urbansetting because of lower remediable area, tree interference, utilitylines, and large equipment size for small yards (Chaplin et al.,2008). Regardless of the method of remediation, it is important touse a consistent method to measure the effectiveness of the soilremediation practice before and after amendment.
Consistent measurement of soil permeability is essential inorder to evaluate the effectiveness of remediated soil for infiltrationrate. Several researchers have used soil density, soil strength, andinfiltration capacity as a method to evaluate infiltration rate(Gregory et al., 2006; Hamilton and Waddington, 1999; OceanCounty Soil Conservation District Report, 2001; Ozgoz et al.,2006; Pitt et al., 2002). Large variability in results was observedand that may partially be related to inconsistent measurementmethods. Others have used bulk density as a basis to evaluateinfiltration (Ocean County Soil Conservation District, 2001; Gregoryet al., 2006; Ozgoz et al., 2006). The results among studies wereinconsistent, although the mean of the bulk density of compactedsoils were about 20% higher than the average bulk density forundisturbed soil.
1.2. Objective of the study
This study was undertaken to investigate the impact of soilremediation on infiltration rates and thus stormwater runoff.Specific objectives of the study were:
1. To select three urban sites with known high soil compactionand low infiltration rates.
2. Perform two methods of soil remediation (tilling and compostaddition) on each site to improve infiltration.
3. Assess the effectiveness of soil remediation on soil infiltrationby measuring the spatial hydraulic saturated conductivityusing modified Philip Dunne (MPD) infiltrometer.
4. Determine if soil strength can be used as a surrogate parameterto estimate saturated hydraulic conductivity.
5. Perform simulations to evaluate the amount of runoff that maybe generated from remediated soil compared to un-remediatedsoil under different design storm scenarios.
Fig. 1. The water cycle for pre and post urban development conditions (U.S.EPA, 2003).
N.C. Olson et al. / Journal of Environmental Management 117 (2013) 85e9586
Author's personal copy
2. Methods
2.1. Site selection
Three sites were selected in the Minneapolis Metropolitan areato perform the soil remediation field investigation. The sites werecovered as turf areas, easily accessible by remediation equipment,differed in soil type, and had a nearby water supply. The descriptionof final three selected sites is presented below.
2.1.1. Lake Minnetonka Regional ParkThe first site was Lake Minnetonka Regional Park. This site had
a difficulty establishing trees, presumably due to the high level ofsoil compaction from equipment during construction. This wasapparent in one area of the park where the tree sizes were rela-tively small. Other areas were tilled before the tree installation andhence the trees in this area were well established and much larger.The soils in this area were designated by the USDAWeb Soil Surveyas Lester Loam and Hammel soil types. Upon visual inspection theturf had dying or bare areas, but was mostly healthy. The texture isa loam from 0 to up to 30 cm and a clay loam from 30 to 91 cm orgreater. The selected area in this site was 2023 m2.
2.1.2. French Regional ParkThe second site was French Regional Park, located on the north
side of Medicine Lake. The area was originally residential propertywith a highway intersecting it. Part of the property was convertedto a large beach and picnic area. The native soils in the picnic areawere mixed and/or filled with peatland soils from an adjacentlagoon area. This indicated a highly disturbed area, which couldresult in significant soil compaction. Similarly to Lake MinnetonkaRegional Park, trees in this area have had difficulty establishingthemselves in the turf areas. Many roots were shallow or exposed.USDA Web Soil Survey classifies the soil in this area as Muskego,Blue Earth, and Houghton soils, as well Glencoe Loam. Muskego,Blue Earth, and Houghton soils are composed of muck, or highlyorganic marshland soil. The texture of these soils is mostly loamwith clay loam layer below 33 cm. The selected site was located inpicnic area adjacent to the beach. Visual inspection revealed thatthe turf in this area was very dry and the grass in many areas wasdying.
2.1.3. Maple Lakes ParkThe third and final site was Maple Lakes Park. The basis for this
site selectionwas its unique construction history and assumed highlevel of compaction. This site was in a newly developed area next toa stormwater pond as well as a groundwater fed pond. The areawasdeveloped from a large sand and gravel extraction area into a largesuburban area with many large residential developments. Most ofthe residential areas were less than ten years old and some newconstructionwas underway within 800 m from the park during thestudy period. The large amount of sand and gravel extraction andgrading operations are believed to have caused a high level of soilcompaction. It is not certain if the turf areas were mechanicallyloosened prior to sod placement, or what type of fill was used inthis area. The USDA Web Soil Survey did not have recent informa-tion on the newly developed area. Visual inspection did not revealany major problems with turf establishment or plant growth. Theselected site was an open field area next to a playground and theponds.
2.2. Soil remediation techniques
Soil remediation was performed in October 2008 after theconclusion of the initial assessment measurements. One control
plot (no treatment) and two treatment plots were establishedwithin the study area at each monitoring site. The first treatmentplot, referred to as the “till” plot was remediated using deep-tillageand a tree-spading machine. Deep-tillage was conducted by usinga subsoiler with two-foot long tines. This machine used largerrubber tires to minimize soil compaction. Ripping was spaced at0.30 m intervals to approximately a 0.55e0.60 m depth. The tree-spading machine was used to comingle the soil to a depth of0.40e0.45 m. The other plot was labeled the “compost” plot. Thisplot was remediated identically to the till plot, but beforespading, an average of 70 mm of compost was added to the soilsurface. The compost was produced locally using yard-waste asthe feedstock material. The treatment plots were then smoothedwith a Harley Rake. The plots were dormant seeded and fenced offfrom the surrounding area.
2.3. Measurement of saturated hydraulic conductivity
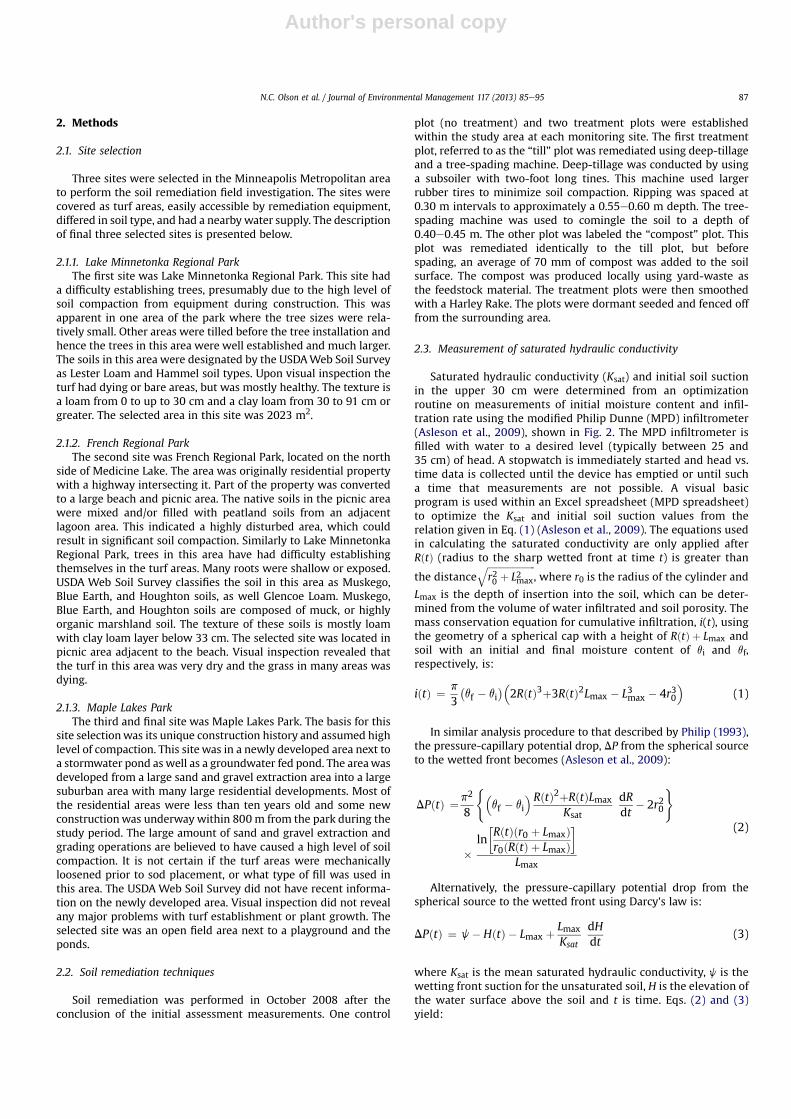
Saturated hydraulic conductivity (Ksat) and initial soil suctionin the upper 30 cm were determined from an optimizationroutine on measurements of initial moisture content and infil-tration rate using the modified Philip Dunne (MPD) infiltrometer(Asleson et al., 2009), shown in Fig. 2. The MPD infiltrometer isfilled with water to a desired level (typically between 25 and35 cm) of head. A stopwatch is immediately started and head vs.time data is collected until the device has emptied or until sucha time that measurements are not possible. A visual basicprogram is used within an Excel spreadsheet (MPD spreadsheet)to optimize the Ksat and initial soil suction values from therelation given in Eq. (1) (Asleson et al., 2009). The equations usedin calculating the saturated conductivity are only applied afterRðtÞ (radius to the sharp wetted front at time t) is greater than
the distanceffiffiffiffiffiffiffiffiffiffiffiffiffiffiffiffiffiffiffiffiffir20 þ L2max
q, where r0 is the radius of the cylinder and
Lmax is the depth of insertion into the soil, which can be deter-mined from the volume of water infiltrated and soil porosity. Themass conservation equation for cumulative infiltration, i(t), usingthe geometry of a spherical cap with a height of RðtÞ þ Lmax andsoil with an initial and final moisture content of qi and qf,respectively, is:
iðtÞ ¼ p
3�qf � qi
��2RðtÞ3þ3RðtÞ2Lmax � L3max � 4r30
�(1)
In similar analysis procedure to that described by Philip (1993),the pressure-capillary potential drop, DP from the spherical sourceto the wetted front becomes (Asleson et al., 2009):
DPðtÞ ¼p2
8
(�qf � qi
�RðtÞ2þRðtÞLmax
Ksat
dRdt
� 2r20
)
�ln�RðtÞðr0 þ LmaxÞr0ðRðtÞ þ LmaxÞ
�Lmax
(2)
Alternatively, the pressure-capillary potential drop from thespherical source to the wetted front using Darcy’s law is:
DPðtÞ ¼ j� HðtÞ � Lmax þ Lmax
Ksat
dHdt
(3)
where Ksat is the mean saturated hydraulic conductivity, j is thewetting front suction for the unsaturated soil, H is the elevation ofthe water surface above the soil and t is time. Eqs. (2) and (3)yield:
N.C. Olson et al. / Journal of Environmental Management 117 (2013) 85e95 87

Author's personal copy
dH ¼ Ksat
Lmax
2664p2
8
(�qf � qi
�RðtÞ2þRðtÞLmax
Ksat
dRdt
� 2r20
)
ln�RðtÞðr0 þ LmaxÞr0ðRðtÞ þ LmaxÞ
�Lmax
� jþ HðtÞ þ Lmax
3775dt
(4)
Eq. (4) can be fit to the measured head vs. time data to deter-mine the Ksat and C. For more accuracy in the computation of Ksatand j the middle points between two consecutive observed headvs. time data was interpolated using a cubic spline approximation.The fitting of these two equations to the interpolated data is ach-ieved by adjusting the values of saturated hydraulic conductivity(Ksat) and soil suction (j) at the saturated wetting front tominimizethe root mean square (rms) of the difference between interpolated
increment and predicted increment of head (dH) starting from aninitial value of Ksat and j.
Other required soil parameters were determined as follows:
1. The initial soil moisture content was measured near the MPDusing the gravimetric measurement method (ASTM D2216-05,2005), which is then converted to volumetric moisture content:
qi ¼ ðrb=rwÞqg (5)
where qi is volumetric initial moisture content [cm3/cm3], qg isgravimetric moisture content [g/g], rb is dry bulk density of the soil[g/cm3] and rw is the density of water [g/cm3].
2. Dry bulk density of the soil is measured by the ratio of the drymass of soil per volume. A drive-cylinder sampler, purchasedfrom ELE International, was used in accordance to the ASTM
Place the permeameter base in an area that permeability (Ksat) is to be measured.
Place ring weight inside the base and use a hammer to force the permeameter base into the soil up to the bottom of upper ring.
Place the permeameter clear tube on the secured base and use gentle force to fully insert clear tube into the base, level it evenly and fill with water.
Wait for water surface to stabilize, read water level and start timing. Continue to read water level and time.
(a) (b)
(c) (d)
Fig. 2. Photo view of the modified Philip Dunne Infiltrometer during operation.
N.C. Olson et al. / Journal of Environmental Management 117 (2013) 85e9588
Author's personal copy
D-2937 standard (2010). The sampler tubewas driven into eachlocation using a slide hammer. During the 28 initial assessmentof each site, measurements of bulk density were taken withinthe study area near MPDmeasurements to compare Ksat to bulkdensity
3. The final moisture content is assumed to be at the fully satu-rated condition, which is estimated through effective porosityof the soil (Rawls et al., 1983).
qf ¼ qS ¼ 1� �rp=rw
�(6)
where qs is saturated volumetric moisture content [cm3/cm3] andrp is the particle density of the soil material [g/cm3].
4. The particle density of soil was estimated based on the amountof mineral matter and organic matter expected to be present inthe soil. These values were not measured, but estimated to beapproximately 95% mineral and 5% organic matter. The organiccontent of compost plots were estimated to be approximately19%, which was determined by taking the depth of the compostlayered on top of the soil divided by the depth of incorporationinto the soil. By knowing the fraction of mineral and organiccontent in soil and assuming mineral and organic densities ofrm ¼ 2.56 g/cm3 and ro 1.30 g/cm3 respectively, the effectivedry particle density was estimated using Eq. (7) (Jury andHorton, 2004):
rp ¼ rmXm þ roXo (7)
where Xm and Xo are the fraction of mineral and organic matter insoil, respectively.
Eq. (6) was then used to compute the saturated moisturecontent of soil for each monitoring site, as summarized in Table 1.
Numerous spatial Ksat tests were conducted on all three sitesfor control and remediated soils. For the pre-remediation, 100e150 Ksat measurements were taken and each measurement wasperformed within a grid space of 2 m by 5 m or 2 m by 3 mdepending on the site. These initial Ksat measurements were thenused to determine the location of soil remediation treatment areasat each site. The goal was to choose a plot area with similar andrelatively low values of Ksat. To assess the effects of differentremediation techniques, post-treatment measurements of Ksatwere taken on each plot at each site during the study period. Forpost-treatment, 30 measurements were taken on each plot. Thegrid space for these measurements was roughly 3 m by 3 m foreach site.
2.4. Soil strength
Soil strengthwasmeasured by a digital hand-held penetrometer(Eijelkamp, model Pentrologger), which uses a small cone attachedto a rod and data logger. The cone had an area of 1 cm2 with a coneangle of 30�, and was pushed into the ground to a depth of 80 cm at2 cm/s. A data logger collected the soil strength at 1 cm intervals.Three measurements within a 1 m radius were averaged at eachmeasurement location, similar to Ozgoz et al. (2006). The pene-trometer was used at nine locations on every plot at each site,except for the control plot at Lake Minnetonka Regional Park,where the penetrometer could not penetrate the ground withoutseverely bending the rod. The measurements were taken withina few days after a recent rainfall to ensure that the soil moistureprofile was close to uniform throughout the depth.
2.5. Statistical methods
Values for Ksat are typically described with a lognormal distri-bution (Asleson, 2007; Munoz-Carpena et al., 2002). To find theproper distribution of Ksat data, the KolmogoroveSmirnov Test,using the procedure given by Ang and Tang (2007), was used todetermine the goodness-of-fit. Both normal and lognormal distri-butionmodels were tested, and the datawas found to be lognormal.The determination of outliers for Ksat values in statistical analysiswas determined using the technique described by Wadsworth(1990). Data which was outside the limit specified by the outlierremoval techniquewere not used in the statistical analyses becausethey would distort the comparison of the mean values.
A two-sample t significance test adapting the procedureprovided by Moore and McCabe (2004) was used: (i) to verify thatthe mean value of Ksat for plot areas within the study area duringyear one are not statistically different, (ii) to verify that themeans ofthe control plots between subsequent years were also not statisti-cally different, and (iii) to show that the treatment plots werestatistically different from the control plots, which would indicatethat the treatment had provided some benefit. The t-test assumesa normal distribution, so the natural log of the datawas taken beforeanalysis. This assumption was reasonable since the measured datawas represented by a lognormal distribution. The following null oralternative hypothesis testswere used to determine if themeans (m)of the Ksat values associated with the plots during a single year arestatistically different (at significant level of 0.01):
Ho : m1 ¼ m2HA : m1sm2
If P (T � t) is greater than the test significance level (alpha) thanthere is insufficient evidence to reject the null hypothesis (Ho) andthe means of the plots are found to be equal. If the opposite is true,the alternative hypothesis (HA) must be accepted, which states thatthe means are statistically different.
The f-test procedure (Moore and McCabe, 2004) was adapted todetermine the soil remediation effectiveness. The f-test alsoassumes a normal distribution, so the natural log of the data wasagain taken. For this statistical analysis, the variances of pre-remediation control areas were compared with the variances ofpost-remediation plots using Ksat values. The following null andalternative hypothesis test was used to determine if the standarddeviations (s) between the Ksat are statistically different:
Ho : S1 ¼ S2HA : S1sS2
If P (F � f) is greater than the test significance level (alpha) thanthere is insufficient evidence to reject the null hypothesis (Ho) and
Table 1Saturated moisture contents (by volume fraction) applied at sites.
Monitoring site qsat
French Regional ParkPre-remediation 0.45Control Plot (years 2 and 3) 0.44Till Plot (years 2 and 3) 0.45Compost Plot (years 2 and 3) 0.52
Lake Minnetonka Regional ParkPre-remediation 0.43Control Plot (year 2) 0.38Till Plot (year 2) 0.43Compost Plot (year 2) 0.53
Maple Lakes ParkPre-remediation 0.46Control Plot (years 2 and 3) 0.43Till Plot (years 2 and 3) 0.48Compost Plot (years 2 and 3) 0.61
N.C. Olson et al. / Journal of Environmental Management 117 (2013) 85e95 89
Author's personal copy
the standard deviations of the populations are presumed to beequal. If the opposite is true, the alternative hypothesis (HA) mustbe accepted, which states that the standard deviations are statis-tically different. An alpha value equal to 0.05 was chosen whenevaluating this hypothesis.
3. Results and discussion
In this study, we used the saturated hydraulic conductivitymeasurement as the basis to evaluate the spatial variability andoverall infiltration within control and remediated soil. Soil bulkdensity and soil strength is also used to verify the results obtainedby saturated hydraulic conductivity. The results of saturatedhydraulic conductivity as well as soil bulk density and soil strengthare presented below.
3.1. Saturated hydraulic conductivity
The results of saturated hydraulic conductivity measurementsare summarized by site. All permeability results for control and
remediated soils are shown on a spatial GIS map. For each site thegeometric mean (“geomean”), which is equivalent to the mean ofthe log values, of the datawere used to compare the effectiveness ofthe soil amendments with respect to their infiltration.
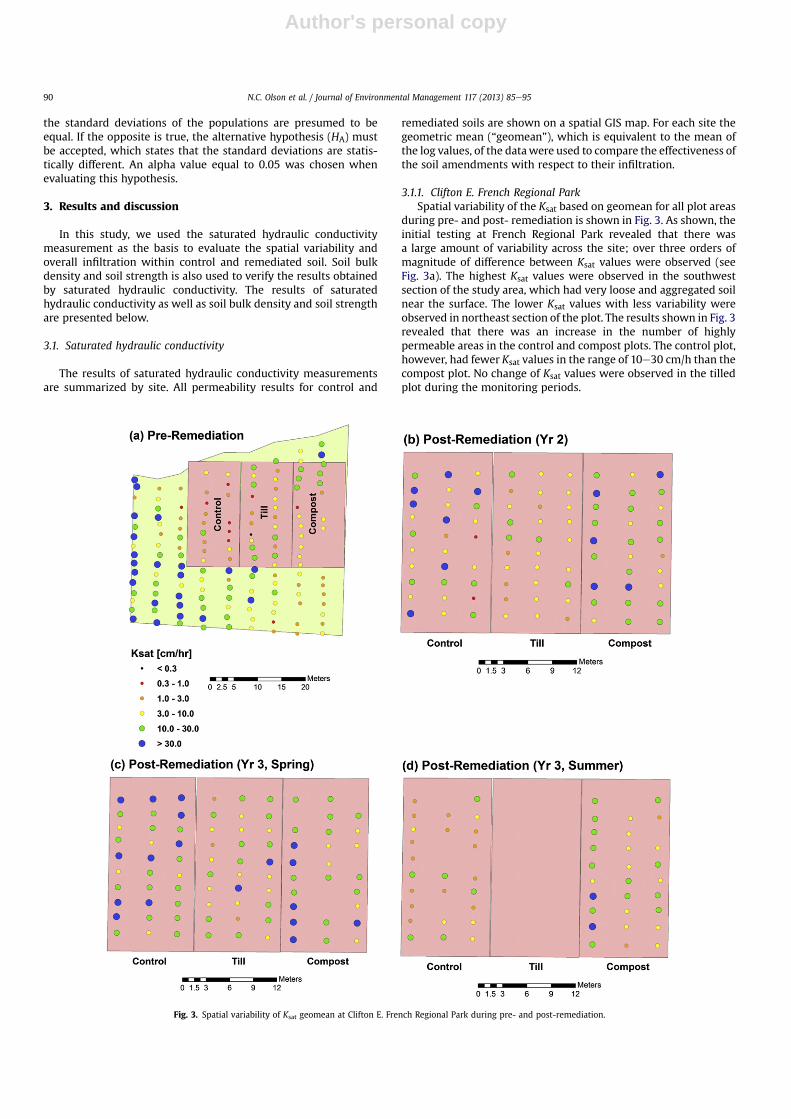
3.1.1. Clifton E. French Regional ParkSpatial variability of the Ksat based on geomean for all plot areas
during pre- and post- remediation is shown in Fig. 3. As shown, theinitial testing at French Regional Park revealed that there wasa large amount of variability across the site; over three orders ofmagnitude of difference between Ksat values were observed (seeFig. 3a). The highest Ksat values were observed in the southwestsection of the study area, which had very loose and aggregated soilnear the surface. The lower Ksat values with less variability wereobserved in northeast section of the plot. The results shown in Fig. 3revealed that there was an increase in the number of highlypermeable areas in the control and compost plots. The control plot,however, had fewer Ksat values in the range of 10e30 cm/h than thecompost plot. No change of Ksat values were observed in the tilledplot during the monitoring periods.
Fig. 3. Spatial variability of Ksat geomean at Clifton E. French Regional Park during pre- and post-remediation.
N.C. Olson et al. / Journal of Environmental Management 117 (2013) 85e9590
Author's personal copy
Summary results of Ksat statistics for post-treatment at Clifton E.French Regional Park site are shown in Table 2. The results of thepost-remediation testing at French Regional Park show largedifferences in Ksat in the compost plots between year 2 and year 3.This may be due to seasonal variation in the soil. It is worthwhile tonote that the geometric mean of the control plot was 2.29 times thegeometric mean of the control area of the previous year and wasstatistically different (P z 0.003). The tilled plot’s geometric meanwas three-fifths of the Ksat geometric mean in the control plot. Themean on the tilled plot was not statistically different (P z 0.02)from the mean of the control plot. The geometric mean of thecompost plot was 13.76 cm/h; the highest of the three plots and 1.5times as permeable as the control plot. However, the mean of thecompost plot was not statistically different from the mean of thecontrol plot (P z 0.08). The f-test results show that the till andcompost plots were significantly less variable than the pre-remediation control area (P ¼ 0.002 and P ¼ 0.014, respectively).
Even though the compost plot had the highest infiltrationcapacity and level of improvement, its effectiveness is masked bythe large change in Ksat in the control plot and the large covariancein all plots. It is hypothesized that there are changes in the soilstructure due to seasonal variation, which can affect the perme-ability. To determine if the large changes in Ksat for the two plotswere due to temporal effects a third year of testing was performed.Measurements were taken in all plots during the spring (April andMay). Another round of testing was performed in the middle ofsummer (August), but was limited to the control and compost plots.The third year testing results are also summarized in Table 2 andthe geomean spatial data is shown in Fig. 3c and d. Differences inthe number of highly permeable locations can be observedbetween year two measurements and the measurements takenduring the spring of the third year. These Ksat values were observedto be 1.61e1.93 times the values of the measurements taken theprevious year. The till plot increased in permeability from theprevious year, but had half the Ksat geometric mean of the controlplot. Ksat was still highest on the compost plot, which had a Ksat of22.14 cm/h, but this was only 1.2 times the control plot geometric
mean. All three plots had the largest Ksat geometric means found forany year and any site during this round of testing. These valuessuggest that French Regional Park may not be considered com-pacted during the spring period.
Testing of the control and compost plot was completed againlater in the summer. A large difference can be seen between thespring and summer results shown in Fig. 3c and d. Table 2 showsthat the Ksat geometric mean of the control plot dropped to3.60 cm/h. This is approximately one-fifth of the value found duringthe spring testing. The compost plot also had decreased infiltrationcapacity. Its geometric meanwas found to be 9.58 cm/h, which wastwo-fifths of the value observed that spring. The compost plot didprove to still be effective over the course of the study. Even thoughthis was the lowest compost geometric mean observed during thepost-remediation testing, it was still 2.7 times the value of thecontrol plot during the summer testing. The compost mean wassignificantly different than the control plot mean (P << 0.01).
The f testing at French Regional Park showed great variability inKsat on the control plot over the season and between years. Thelarge changes in Ksat may be due to seasonal effects such as freezingand thawing. The change in soil permeability due to freeze/thawcycle was confirmed by Chamberlain and Gow (1979) inwhich theyshowed a permeability change of up to two orders of magnitude forsilt and clay soils. This site may have been more susceptible to thisnatural process because of its higher water table (due to theproximity of a lagoon). In general, the compost plot has shown to bemore effective at improving the permeability at this site.
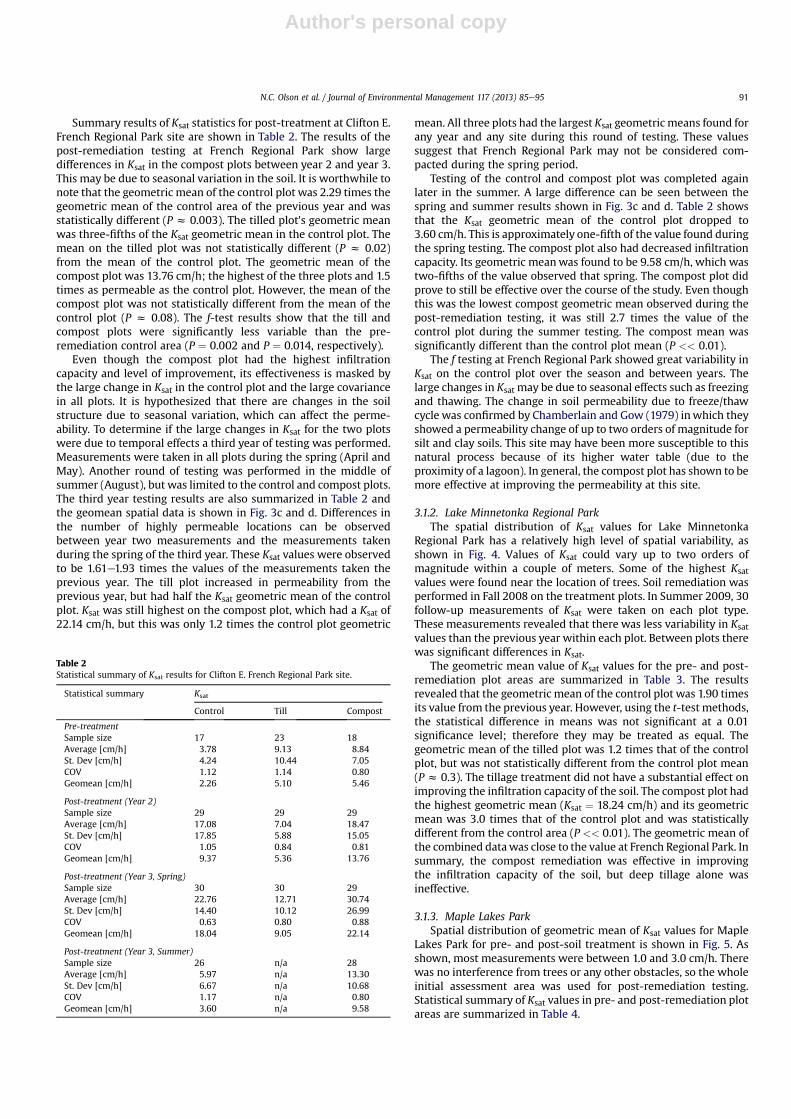
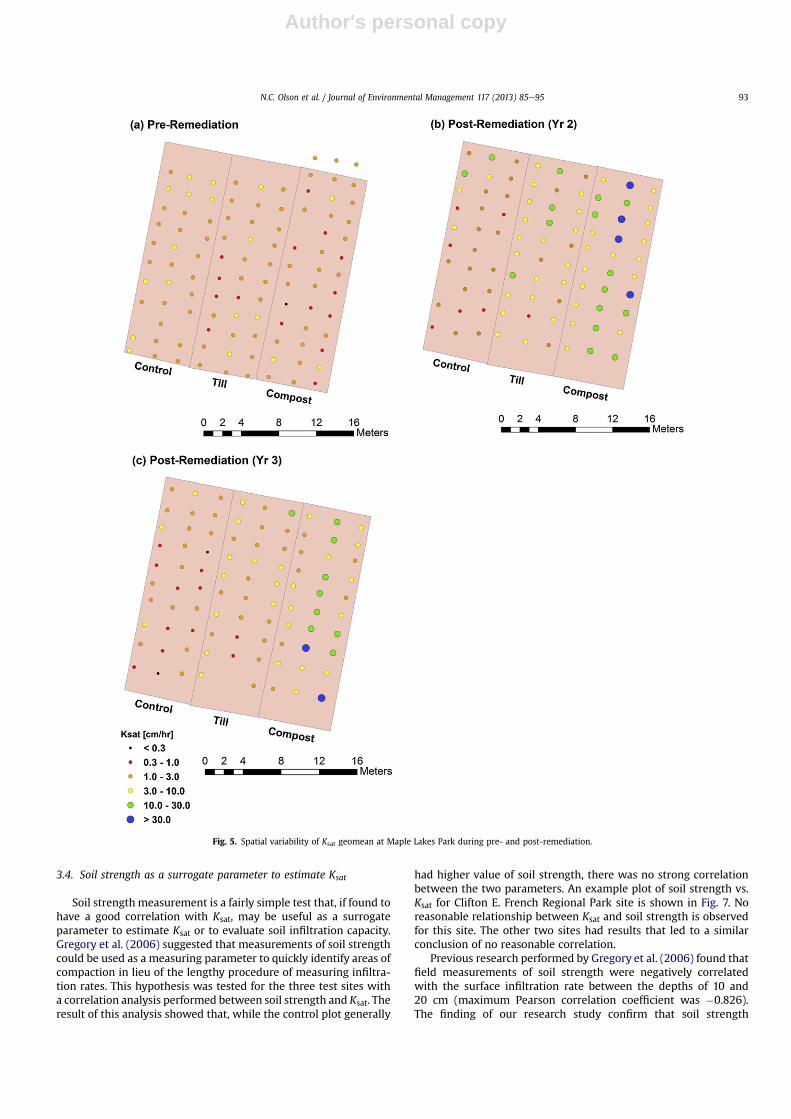
3.1.2. Lake Minnetonka Regional ParkThe spatial distribution of Ksat values for Lake Minnetonka
Regional Park has a relatively high level of spatial variability, asshown in Fig. 4. Values of Ksat could vary up to two orders ofmagnitude within a couple of meters. Some of the highest Ksatvalues were found near the location of trees. Soil remediation wasperformed in Fall 2008 on the treatment plots. In Summer 2009, 30follow-up measurements of Ksat were taken on each plot type.These measurements revealed that there was less variability in Ksatvalues than the previous year within each plot. Between plots therewas significant differences in Ksat.
The geometric mean value of Ksat values for the pre- and post-remediation plot areas are summarized in Table 3. The resultsrevealed that the geometric mean of the control plot was 1.90 timesits value from the previous year. However, using the t-test methods,the statistical difference in means was not significant at a 0.01significance level; therefore they may be treated as equal. Thegeometric mean of the tilled plot was 1.2 times that of the controlplot, but was not statistically different from the control plot mean(P z 0.3). The tillage treatment did not have a substantial effect onimproving the infiltration capacity of the soil. The compost plot hadthe highest geometric mean (Ksat ¼ 18.24 cm/h) and its geometricmean was 3.0 times that of the control plot and was statisticallydifferent from the control area (P << 0.01). The geometric mean ofthe combined datawas close to the value at French Regional Park. Insummary, the compost remediation was effective in improvingthe infiltration capacity of the soil, but deep tillage alone wasineffective.
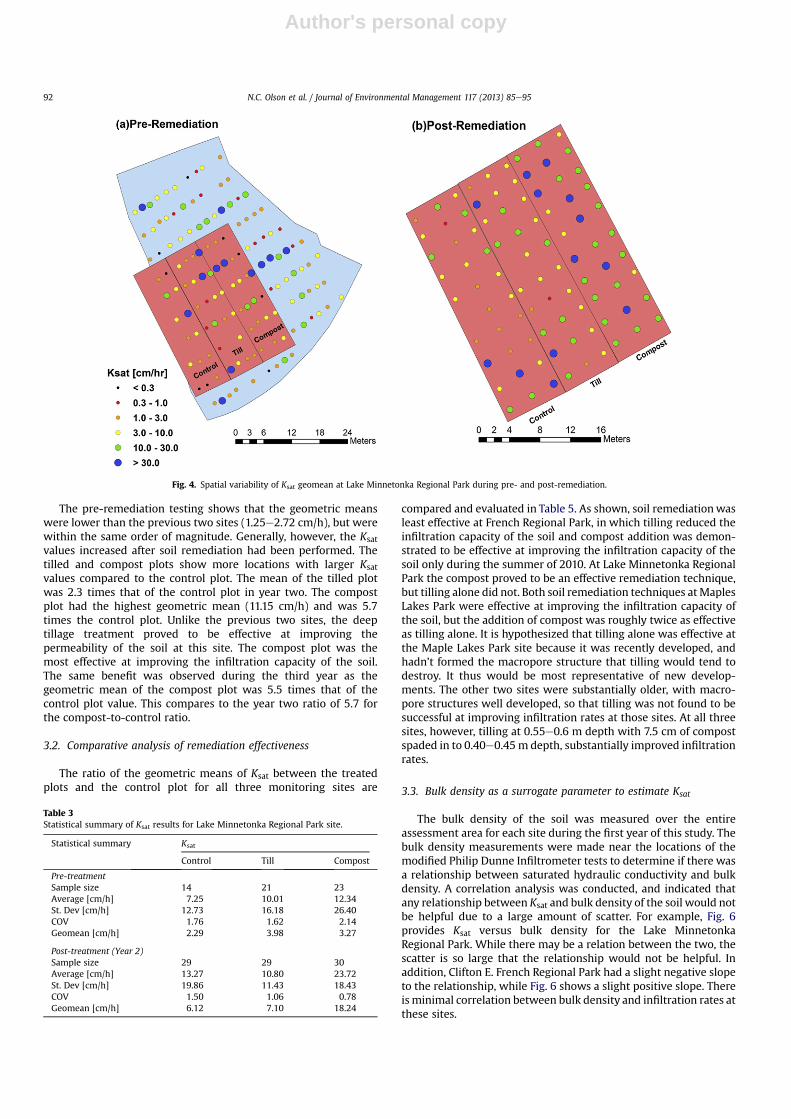
3.1.3. Maple Lakes ParkSpatial distribution of geometric mean of Ksat values for Maple
Lakes Park for pre- and post-soil treatment is shown in Fig. 5. Asshown, most measurements were between 1.0 and 3.0 cm/h. Therewas no interference from trees or any other obstacles, so the wholeinitial assessment area was used for post-remediation testing.Statistical summary of Ksat values in pre- and post-remediation plotareas are summarized in Table 4.
Table 2Statistical summary of Ksat results for Clifton E. French Regional Park site.
Statistical summary Ksat
Control Till Compost
Pre-treatmentSample size 17 23 18Average [cm/h] 3.78 9.13 8.84St. Dev [cm/h] 4.24 10.44 7.05COV 1.12 1.14 0.80Geomean [cm/h] 2.26 5.10 5.46
Post-treatment (Year 2)Sample size 29 29 29Average [cm/h] 17.08 7.04 18.47St. Dev [cm/h] 17.85 5.88 15.05COV 1.05 0.84 0.81Geomean [cm/h] 9.37 5.36 13.76
Post-treatment (Year 3, Spring)Sample size 30 30 29Average [cm/h] 22.76 12.71 30.74St. Dev [cm/h] 14.40 10.12 26.99COV 0.63 0.80 0.88Geomean [cm/h] 18.04 9.05 22.14
Post-treatment (Year 3, Summer)Sample size 26 n/a 28Average [cm/h] 5.97 n/a 13.30St. Dev [cm/h] 6.67 n/a 10.68COV 1.17 n/a 0.80Geomean [cm/h] 3.60 n/a 9.58
N.C. Olson et al. / Journal of Environmental Management 117 (2013) 85e95 91
Author's personal copy
The pre-remediation testing shows that the geometric meanswere lower than the previous two sites (1.25e2.72 cm/h), but werewithin the same order of magnitude. Generally, however, the Ksatvalues increased after soil remediation had been performed. Thetilled and compost plots show more locations with larger Ksatvalues compared to the control plot. The mean of the tilled plotwas 2.3 times that of the control plot in year two. The compostplot had the highest geometric mean (11.15 cm/h) and was 5.7times the control plot. Unlike the previous two sites, the deeptillage treatment proved to be effective at improving thepermeability of the soil at this site. The compost plot was themost effective at improving the infiltration capacity of the soil.The same benefit was observed during the third year as thegeometric mean of the compost plot was 5.5 times that of thecontrol plot value. This compares to the year two ratio of 5.7 forthe compost-to-control ratio.
3.2. Comparative analysis of remediation effectiveness
The ratio of the geometric means of Ksat between the treatedplots and the control plot for all three monitoring sites are
compared and evaluated in Table 5. As shown, soil remediationwasleast effective at French Regional Park, in which tilling reduced theinfiltration capacity of the soil and compost addition was demon-strated to be effective at improving the infiltration capacity of thesoil only during the summer of 2010. At Lake Minnetonka RegionalPark the compost proved to be an effective remediation technique,but tilling alone did not. Both soil remediation techniques atMaplesLakes Park were effective at improving the infiltration capacity ofthe soil, but the addition of compost was roughly twice as effectiveas tilling alone. It is hypothesized that tilling alone was effective atthe Maple Lakes Park site because it was recently developed, andhadn’t formed the macropore structure that tilling would tend todestroy. It thus would be most representative of new develop-ments. The other two sites were substantially older, with macro-pore structures well developed, so that tilling was not found to besuccessful at improving infiltration rates at those sites. At all threesites, however, tilling at 0.55e0.6 m depth with 7.5 cm of compostspaded in to 0.40e0.45m depth, substantially improved infiltrationrates.
3.3. Bulk density as a surrogate parameter to estimate Ksat
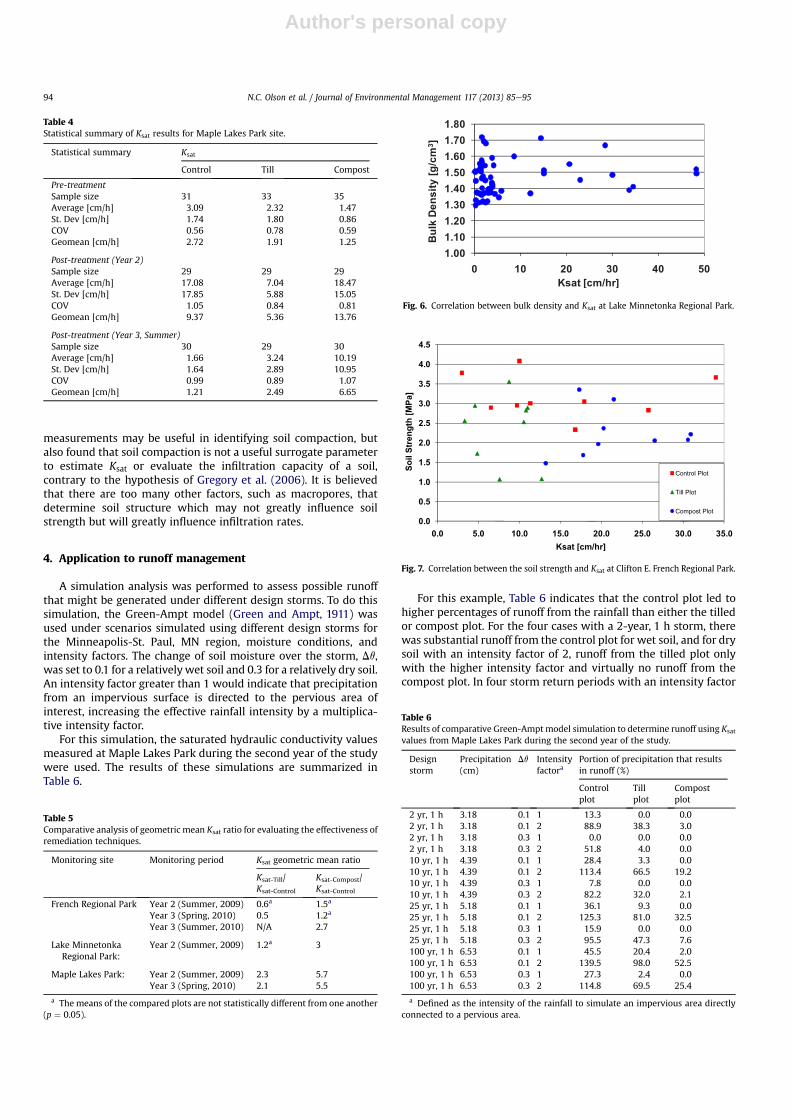
The bulk density of the soil was measured over the entireassessment area for each site during the first year of this study. Thebulk density measurements were made near the locations of themodified Philip Dunne Infiltrometer tests to determine if there wasa relationship between saturated hydraulic conductivity and bulkdensity. A correlation analysis was conducted, and indicated thatany relationship between Ksat and bulk density of the soil would notbe helpful due to a large amount of scatter. For example, Fig. 6provides Ksat versus bulk density for the Lake MinnetonkaRegional Park. While there may be a relation between the two, thescatter is so large that the relationship would not be helpful. Inaddition, Clifton E. French Regional Park had a slight negative slopeto the relationship, while Fig. 6 shows a slight positive slope. Thereisminimal correlation between bulk density and infiltration rates atthese sites.
Fig. 4. Spatial variability of Ksat geomean at Lake Minnetonka Regional Park during pre- and post-remediation.
Table 3Statistical summary of Ksat results for Lake Minnetonka Regional Park site.
Statistical summary Ksat
Control Till Compost
Pre-treatmentSample size 14 21 23Average [cm/h] 7.25 10.01 12.34St. Dev [cm/h] 12.73 16.18 26.40COV 1.76 1.62 2.14Geomean [cm/h] 2.29 3.98 3.27
Post-treatment (Year 2)Sample size 29 29 30Average [cm/h] 13.27 10.80 23.72St. Dev [cm/h] 19.86 11.43 18.43COV 1.50 1.06 0.78Geomean [cm/h] 6.12 7.10 18.24
N.C. Olson et al. / Journal of Environmental Management 117 (2013) 85e9592
Author's personal copy
3.4. Soil strength as a surrogate parameter to estimate Ksat
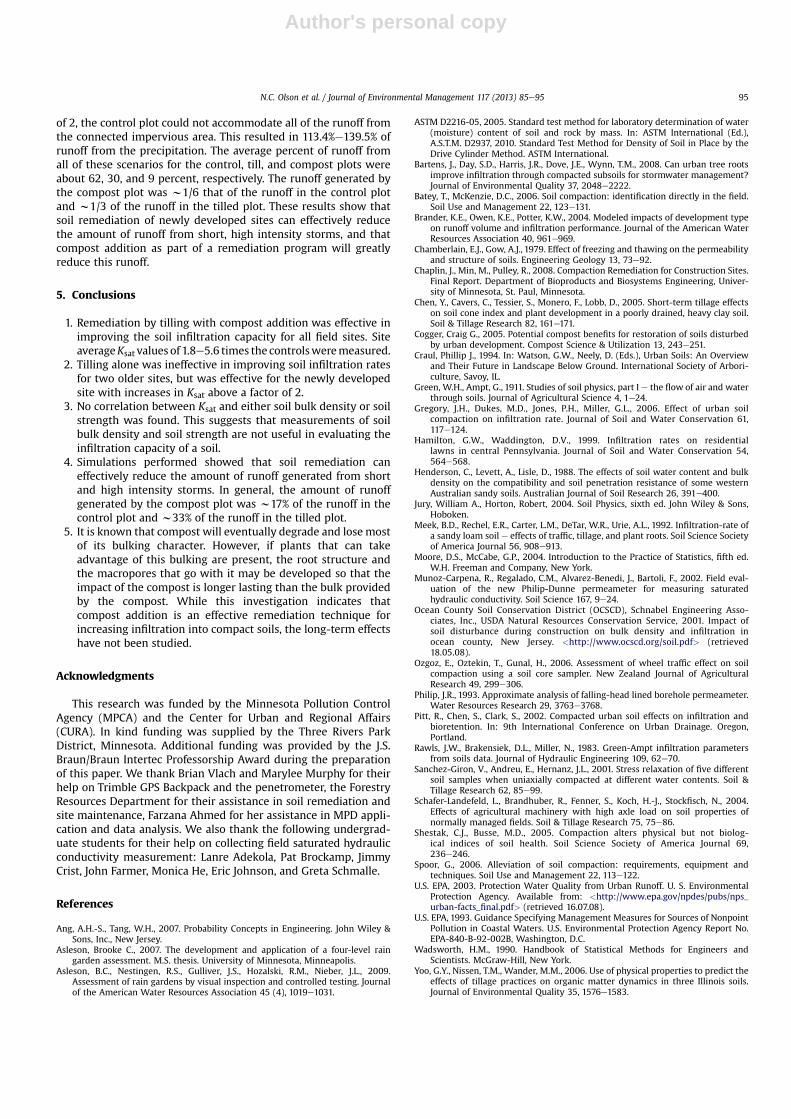
Soil strengthmeasurement is a fairly simple test that, if found tohave a good correlation with Ksat, may be useful as a surrogateparameter to estimate Ksat or to evaluate soil infiltration capacity.Gregory et al. (2006) suggested that measurements of soil strengthcould be used as a measuring parameter to quickly identify areas ofcompaction in lieu of the lengthy procedure of measuring infiltra-tion rates. This hypothesis was tested for the three test sites witha correlation analysis performed between soil strength and Ksat. Theresult of this analysis showed that, while the control plot generally
had higher value of soil strength, there was no strong correlationbetween the two parameters. An example plot of soil strength vs.Ksat for Clifton E. French Regional Park site is shown in Fig. 7. Noreasonable relationship between Ksat and soil strength is observedfor this site. The other two sites had results that led to a similarconclusion of no reasonable correlation.
Previous research performed by Gregory et al. (2006) found thatfield measurements of soil strength were negatively correlatedwith the surface infiltration rate between the depths of 10 and20 cm (maximum Pearson correlation coefficient was �0.826).The finding of our research study confirm that soil strength
Fig. 5. Spatial variability of Ksat geomean at Maple Lakes Park during pre- and post-remediation.
N.C. Olson et al. / Journal of Environmental Management 117 (2013) 85e95 93
Author's personal copy
measurements may be useful in identifying soil compaction, butalso found that soil compaction is not a useful surrogate parameterto estimate Ksat or evaluate the infiltration capacity of a soil,contrary to the hypothesis of Gregory et al. (2006). It is believedthat there are too many other factors, such as macropores, thatdetermine soil structure which may not greatly influence soilstrength but will greatly influence infiltration rates.
4. Application to runoff management
A simulation analysis was performed to assess possible runoffthat might be generated under different design storms. To do thissimulation, the Green-Ampt model (Green and Ampt, 1911) wasused under scenarios simulated using different design storms forthe Minneapolis-St. Paul, MN region, moisture conditions, andintensity factors. The change of soil moisture over the storm, Dq,was set to 0.1 for a relatively wet soil and 0.3 for a relatively dry soil.An intensity factor greater than 1 would indicate that precipitationfrom an impervious surface is directed to the pervious area ofinterest, increasing the effective rainfall intensity by a multiplica-tive intensity factor.
For this simulation, the saturated hydraulic conductivity valuesmeasured at Maple Lakes Park during the second year of the studywere used. The results of these simulations are summarized inTable 6.
For this example, Table 6 indicates that the control plot led tohigher percentages of runoff from the rainfall than either the tilledor compost plot. For the four cases with a 2-year, 1 h storm, therewas substantial runoff from the control plot for wet soil, and for drysoil with an intensity factor of 2, runoff from the tilled plot onlywith the higher intensity factor and virtually no runoff from thecompost plot. In four storm return periods with an intensity factor
Table 4Statistical summary of Ksat results for Maple Lakes Park site.
Statistical summary Ksat
Control Till Compost
Pre-treatmentSample size 31 33 35Average [cm/h] 3.09 2.32 1.47St. Dev [cm/h] 1.74 1.80 0.86COV 0.56 0.78 0.59Geomean [cm/h] 2.72 1.91 1.25
Post-treatment (Year 2)Sample size 29 29 29Average [cm/h] 17.08 7.04 18.47St. Dev [cm/h] 17.85 5.88 15.05COV 1.05 0.84 0.81Geomean [cm/h] 9.37 5.36 13.76
Post-treatment (Year 3, Summer)Sample size 30 29 30Average [cm/h] 1.66 3.24 10.19St. Dev [cm/h] 1.64 2.89 10.95COV 0.99 0.89 1.07Geomean [cm/h] 1.21 2.49 6.65
Table 5Comparative analysis of geometric mean Ksat ratio for evaluating the effectiveness ofremediation techniques.
Monitoring site Monitoring period Ksat geometric mean ratio
Ksat-Till/Ksat-Control
Ksat-Compost/Ksat-Control
French Regional Park Year 2 (Summer, 2009) 0.6a 1.5a
Year 3 (Spring, 2010) 0.5 1.2a
Year 3 (Summer, 2010) N/A 2.7
Lake MinnetonkaRegional Park:
Year 2 (Summer, 2009) 1.2a 3
Maple Lakes Park: Year 2 (Summer, 2009) 2.3 5.7Year 3 (Spring, 2010) 2.1 5.5
a The means of the compared plots are not statistically different from one another(p ¼ 0.05).
1.00
1.10
1.20
1.30
1.40
1.50
1.60
1.70
1.80
0 10 20 30 40 50
Bu
lk
De
ns
ity [g
/c
m3]
Ksat [cm/hr]
Fig. 6. Correlation between bulk density and Ksat at Lake Minnetonka Regional Park.
0.0
0.5
1.0
1.5
2.0
2.5
3.0
3.5
4.0
4.5
0.0 5.0 10.0 15.0 20.0 25.0 30.0 35.0
So
il S
tre
ng
th
[M
Pa
]
Ksat [cm/hr]
Control Plot
Till Plot
Compost Plot
Fig. 7. Correlation between the soil strength and Ksat at Clifton E. French Regional Park.
Table 6Results of comparative Green-Amptmodel simulation to determine runoff using Ksat
values from Maple Lakes Park during the second year of the study.
Designstorm
Precipitation(cm)
Dq Intensityfactora
Portion of precipitation that resultsin runoff (%)
Controlplot
Tillplot
Compostplot
2 yr, 1 h 3.18 0.1 1 13.3 0.0 0.02 yr, 1 h 3.18 0.1 2 88.9 38.3 3.02 yr, 1 h 3.18 0.3 1 0.0 0.0 0.02 yr, 1 h 3.18 0.3 2 51.8 4.0 0.010 yr, 1 h 4.39 0.1 1 28.4 3.3 0.010 yr, 1 h 4.39 0.1 2 113.4 66.5 19.210 yr, 1 h 4.39 0.3 1 7.8 0.0 0.010 yr, 1 h 4.39 0.3 2 82.2 32.0 2.125 yr, 1 h 5.18 0.1 1 36.1 9.3 0.025 yr, 1 h 5.18 0.1 2 125.3 81.0 32.525 yr, 1 h 5.18 0.3 1 15.9 0.0 0.025 yr, 1 h 5.18 0.3 2 95.5 47.3 7.6100 yr, 1 h 6.53 0.1 1 45.5 20.4 2.0100 yr, 1 h 6.53 0.1 2 139.5 98.0 52.5100 yr, 1 h 6.53 0.3 1 27.3 2.4 0.0100 yr, 1 h 6.53 0.3 2 114.8 69.5 25.4
a Defined as the intensity of the rainfall to simulate an impervious area directlyconnected to a pervious area.
N.C. Olson et al. / Journal of Environmental Management 117 (2013) 85e9594
Author's personal copy
of 2, the control plot could not accommodate all of the runoff fromthe connected impervious area. This resulted in 113.4%e139.5% ofrunoff from the precipitation. The average percent of runoff fromall of these scenarios for the control, till, and compost plots wereabout 62, 30, and 9 percent, respectively. The runoff generated bythe compost plot was w1/6 that of the runoff in the control plotand w1/3 of the runoff in the tilled plot. These results show thatsoil remediation of newly developed sites can effectively reducethe amount of runoff from short, high intensity storms, and thatcompost addition as part of a remediation program will greatlyreduce this runoff.
5. Conclusions
1. Remediation by tilling with compost addition was effective inimproving the soil infiltration capacity for all field sites. SiteaverageKsat values of 1.8e5.6 times the controlsweremeasured.
2. Tilling alone was ineffective in improving soil infiltration ratesfor two older sites, but was effective for the newly developedsite with increases in Ksat above a factor of 2.
3. No correlation between Ksat and either soil bulk density or soilstrength was found. This suggests that measurements of soilbulk density and soil strength are not useful in evaluating theinfiltration capacity of a soil.
4. Simulations performed showed that soil remediation caneffectively reduce the amount of runoff generated from shortand high intensity storms. In general, the amount of runoffgenerated by the compost plot was w17% of the runoff in thecontrol plot and w33% of the runoff in the tilled plot.
5. It is known that compost will eventually degrade and lose mostof its bulking character. However, if plants that can takeadvantage of this bulking are present, the root structure andthe macropores that go with it may be developed so that theimpact of the compost is longer lasting than the bulk providedby the compost. While this investigation indicates thatcompost addition is an effective remediation technique forincreasing infiltration into compact soils, the long-term effectshave not been studied.
Acknowledgments
This research was funded by the Minnesota Pollution ControlAgency (MPCA) and the Center for Urban and Regional Affairs(CURA). In kind funding was supplied by the Three Rivers ParkDistrict, Minnesota. Additional funding was provided by the J.S.Braun/Braun Intertec Professorship Award during the preparationof this paper. We thank Brian Vlach and Marylee Murphy for theirhelp on Trimble GPS Backpack and the penetrometer, the ForestryResources Department for their assistance in soil remediation andsite maintenance, Farzana Ahmed for her assistance in MPD appli-cation and data analysis. We also thank the following undergrad-uate students for their help on collecting field saturated hydraulicconductivity measurement: Lanre Adekola, Pat Brockamp, JimmyCrist, John Farmer, Monica He, Eric Johnson, and Greta Schmalle.
References
Ang, A.H.-S., Tang, W.H., 2007. Probability Concepts in Engineering. John Wiley &Sons, Inc., New Jersey.
Asleson, Brooke C., 2007. The development and application of a four-level raingarden assessment. M.S. thesis. University of Minnesota, Minneapolis.
Asleson, B.C., Nestingen, R.S., Gulliver, J.S., Hozalski, R.M., Nieber, J.L., 2009.Assessment of rain gardens by visual inspection and controlled testing. Journalof the American Water Resources Association 45 (4), 1019e1031.
ASTM D2216-05, 2005. Standard test method for laboratory determination of water(moisture) content of soil and rock by mass. In: ASTM International (Ed.),A.S.T.M. D2937, 2010. Standard Test Method for Density of Soil in Place by theDrive Cylinder Method. ASTM International.
Bartens, J., Day, S.D., Harris, J.R., Dove, J.E., Wynn, T.M., 2008. Can urban tree rootsimprove infiltration through compacted subsoils for stormwater management?Journal of Environmental Quality 37, 2048e2222.
Batey, T., McKenzie, D.C., 2006. Soil compaction: identification directly in the field.Soil Use and Management 22, 123e131.
Brander, K.E., Owen, K.E., Potter, K.W., 2004. Modeled impacts of development typeon runoff volume and infiltration performance. Journal of the American WaterResources Association 40, 961e969.
Chamberlain, E.J., Gow, A.J., 1979. Effect of freezing and thawing on the permeabilityand structure of soils. Engineering Geology 13, 73e92.
Chaplin, J., Min, M., Pulley, R., 2008. Compaction Remediation for Construction Sites.Final Report. Department of Bioproducts and Biosystems Engineering, Univer-sity of Minnesota, St. Paul, Minnesota.
Chen, Y., Cavers, C., Tessier, S., Monero, F., Lobb, D., 2005. Short-term tillage effectson soil cone index and plant development in a poorly drained, heavy clay soil.Soil & Tillage Research 82, 161e171.
Cogger, Craig G., 2005. Potential compost benefits for restoration of soils disturbedby urban development. Compost Science & Utilization 13, 243e251.
Craul, Phillip J., 1994. In: Watson, G.W., Neely, D. (Eds.), Urban Soils: An Overviewand Their Future in Landscape Below Ground. International Society of Arbori-culture, Savoy, IL.
Green, W.H., Ampt, G., 1911. Studies of soil physics, part I e the flow of air and waterthrough soils. Journal of Agricultural Science 4, 1e24.
Gregory, J.H., Dukes, M.D., Jones, P.H., Miller, G.L., 2006. Effect of urban soilcompaction on infiltration rate. Journal of Soil and Water Conservation 61,117e124.
Hamilton, G.W., Waddington, D.V., 1999. Infiltration rates on residentiallawns in central Pennsylvania. Journal of Soil and Water Conservation 54,564e568.
Henderson, C., Levett, A., Lisle, D., 1988. The effects of soil water content and bulkdensity on the compatibility and soil penetration resistance of some westernAustralian sandy soils. Australian Journal of Soil Research 26, 391e400.
Jury, William A., Horton, Robert, 2004. Soil Physics, sixth ed. John Wiley & Sons,Hoboken.
Meek, B.D., Rechel, E.R., Carter, L.M., DeTar, W.R., Urie, A.L., 1992. Infiltration-rate ofa sandy loam soil e effects of traffic, tillage, and plant roots. Soil Science Societyof America Journal 56, 908e913.
Moore, D.S., McCabe, G.P., 2004. Introduction to the Practice of Statistics, fifth ed.W.H. Freeman and Company, New York.
Munoz-Carpena, R., Regalado, C.M., Alvarez-Benedi, J., Bartoli, F., 2002. Field eval-uation of the new Philip-Dunne permeameter for measuring saturatedhydraulic conductivity. Soil Science 167, 9e24.
Ocean County Soil Conservation District (OCSCD), Schnabel Engineering Asso-ciates, Inc., USDA Natural Resources Conservation Service, 2001. Impact ofsoil disturbance during construction on bulk density and infiltration inocean county, New Jersey. <http://www.ocscd.org/soil.pdf> (retrieved18.05.08).
Ozgoz, E., Oztekin, T., Gunal, H., 2006. Assessment of wheel traffic effect on soilcompaction using a soil core sampler. New Zealand Journal of AgriculturalResearch 49, 299e306.
Philip, J.R., 1993. Approximate analysis of falling-head lined borehole permeameter.Water Resources Research 29, 3763e3768.
Pitt, R., Chen, S., Clark, S., 2002. Compacted urban soil effects on infiltration andbioretention. In: 9th International Conference on Urban Drainage. Oregon,Portland.
Rawls, J.W., Brakensiek, D.L., Miller, N., 1983. Green-Ampt infiltration parametersfrom soils data. Journal of Hydraulic Engineering 109, 62e70.
Sanchez-Giron, V., Andreu, E., Hernanz, J.L., 2001. Stress relaxation of five differentsoil samples when uniaxially compacted at different water contents. Soil &Tillage Research 62, 85e99.
Schafer-Landefeld, L., Brandhuber, R., Fenner, S., Koch, H.-J., Stockfisch, N., 2004.Effects of agricultural machinery with high axle load on soil properties ofnormally managed fields. Soil & Tillage Research 75, 75e86.
Shestak, C.J., Busse, M.D., 2005. Compaction alters physical but not biolog-ical indices of soil health. Soil Science Society of America Journal 69,236e246.
Spoor, G., 2006. Alleviation of soil compaction: requirements, equipment andtechniques. Soil Use and Management 22, 113e122.
U.S. EPA, 2003. Protection Water Quality from Urban Runoff. U. S. EnvironmentalProtection Agency. Available from: <http://www.epa.gov/npdes/pubs/nps_urban-facts_final.pdf> (retrieved 16.07.08).
U.S. EPA, 1993. Guidance Specifying Management Measures for Sources of NonpointPollution in Coastal Waters. U.S. Environmental Protection Agency Report No.EPA-840-B-92-002B, Washington, D.C.
Wadsworth, H.M., 1990. Handbook of Statistical Methods for Engineers andScientists. McGraw-Hill, New York.
Yoo, G.Y., Nissen, T.M., Wander, M.M., 2006. Use of physical properties to predict theeffects of tillage practices on organic matter dynamics in three Illinois soils.Journal of Environmental Quality 35, 1576e1583.
N.C. Olson et al. / Journal of Environmental Management 117 (2013) 85e95 95