
High Performance Alternative Diesel Engine Fuel using Modi ...
Upload
khangminh22Category
view
3download
0
�����������������
Citation: He, X.; Tan, Q.; Wu, Y.; Wei,
C. Optimization of Marine
Two-Stroke Diesel Engine Based on
Air Intake Composition and
Temperature Control. Atmosphere
2022, 13, 355. https://doi.org/
10.3390/atmos13020355
Academic Editors: Yan Zhang,
Volker Matthias, Huan Liu and
Jana Moldanova
Received: 14 January 2022
Accepted: 17 February 2022
Published: 19 February 2022
Publisher’s Note: MDPI stays neutral
with regard to jurisdictional claims in
published maps and institutional affil-
iations.
Copyright: © 2022 by the authors.
Licensee MDPI, Basel, Switzerland.
This article is an open access article
distributed under the terms and
conditions of the Creative Commons
Attribution (CC BY) license (https://
creativecommons.org/licenses/by/
4.0/).
atmosphere
Article
Optimization of Marine Two-Stroke Diesel Engine Based on AirIntake Composition and Temperature ControlXianzhong He 1, Qinming Tan 1,* , Yuehong Wu 2 and Cunfeng Wei 3
1 Merchant College, Shanghai Maritime University, Shanghai 201306, China; [email protected] China Classification Society, Zhoushan 316004, China; [email protected] China Shipbuilding Power Engineering Institute, Shanghai 200120, China; [email protected]* Correspondence: [email protected]; Tel.: +86-021-3828-2966
Abstract: The influence of gas intake temperature, composition and the volume concentration of eachgas component on diesel engine combustion, emission and the output power was studied by buildinga calculation model of the B&W 6S35ME-B9 marine two-stroke low-speed diesel engine, followed bya comprehensive optimization exploration. The results showed that under 295 K and 18.5% O2 ofintake gas, the engine’s NOx emission is only 4.5 g/kWh and reduced to 58% from the normal air gasintake condition. Moreover, their power output is very similar. In addition, the effect of CO2 or H2Oadded into the intake of the diesel engine on the performance of the diesel engine can be compensatedby reducing the intake temperature. At the intake temperature of 295 K, the engine’s NOx emissionwith 20.58% O2, 77.42% N2 and 2% H2O is 8.62 g/kWh, and 9.06 g/kWh under 20.79% O2, 78.21%N2 and 2% CO2. It is lower than 11.77 g/kWh, which is under normal intake conditions (315 K,21%O2 and 79%N2). The power output is also similar to the normal intake condition. Therefore, thecomprehensive optimization of gas intake temperature, composition and concentration can effectivelyoptimize the diesel engine’s performance in terms of combustion, emission and power output. Theresearch results have an important reference value for the optimization of diesel engine performance.
Keywords: marine diesel engine; combustion; emission; low temperature intake; oxygen reduction
1. Introduction
The two-stroke marine low-speed diesel engine is widely used in ships because of itslow fuel consumption, high efficiency, good economy and power output performance [1,2].With the deterioration of the global environment and the rise of people’s awareness ofenvironmental protection, the emission of the diesel engine has attracted extensive attention,that of the marine diesel engine in particular [3,4]. The International Maritime Organization(IMO) and other maritime organizations have put forward more rigorous legal requirementsregarding marine diesel engine emissions [5–7]. Therefore, the marine diesel engines’emission and power output performance have become the focus of ship owners’ attention,and new technologies are urgently needed to comprehensively optimize diesel engines’performance.
In recent years, the development of new combustion technologies to reduce engineemissions has been very active. The combustion optimization technology of the internalcombustion engine has become a hot topic in the industry at home and abroad [8,9]. Theexamples of such technology are as follows: low temperature intake [10], oxygen-enrichedcombustion [11], free-nitrogen combustion [12], nitrogen-enriched combustion [13], exhaustgas recirculation (EGR) [14], intake with humidification [15], etc. Studies have shownthat the diesel engine’s combustion efficiency improves by using low intake temperatureto reduce the intake air gas density and increase charge coefficient [16,17]. Therefore,modern marine diesel engines mostly use inter-coolers to lower the temperature of engines’intake [18]. The increase of intake temperature can effectively increase the temperature of
Atmosphere 2022, 13, 355. https://doi.org/10.3390/atmos13020355 https://www.mdpi.com/journal/atmosphere
Atmosphere 2022, 13, 355 2 of 13
the end of compression, shorten the period of ignition delay and improve the combustionprocess, although these cause the reduction of the amount of fresh air in the cylinder [19]. Ithas been proven that nitrogen reduction to enrich the oxygen concentration of the engines’air intake can significantly enhance its combustion efficiency and power output [20,21].However, its NOx emissions increase simultaneously. Studies revealed that exhaust gasrecirculation, nitrogen-enriched, or humidification can effectively reduce NOx emissionsat the expense of the diesel engine’s economy [22,23]. As a result, there appears to be atrade-off relationship between diesel engines’ economy and NOx emissions [24,25].
It has been revealed that the optimal no-smoke emission can be lowered by oxygen-enriched and EGR intake at the following full-load conditions: 1600 rpm, 30–40% EGRrate and 21.5–22.5% oxygen concentration; 2200 rpm, 20–45% EGR rate or 22–24% oxygenconcentration [26]. Minimum total emissions can be achieved at 22% O2, 2% CO2 and76% N2 intake conditions [27]. Compared with normal air intake conditions, NOx-sootemissions can be lowered by intake air humidification, EGR and shortened fuel injectiontime, and the indicated specific fuel consumption can be minimized as well [28]. A studyhas shown NOx-soot emission can be effectively reduced by using EGR and optimizingintake air temperature [29]. At present, there are few studies on the optimization of thecombination of intake air temperature, composition and concentration for marine dieselengines, and further systematic research needs to be conducted.
In this paper, based on the working process calculation model of the B&W 6S35ME-B9marine two-stroke diesel engine, the power output and emission characteristics of diesel en-gine are studied by adjusting the intake temperature, intake composition (O2\N2\CO2\H2O),concentration, to find the way of reducing NOx emission with little effect on its poweroutput, and without affecting the external work capacity. It provides an important refer-ence value for the optimization of air pollution emission and combustion performance formarine diesel engines.
2. Calculation Model
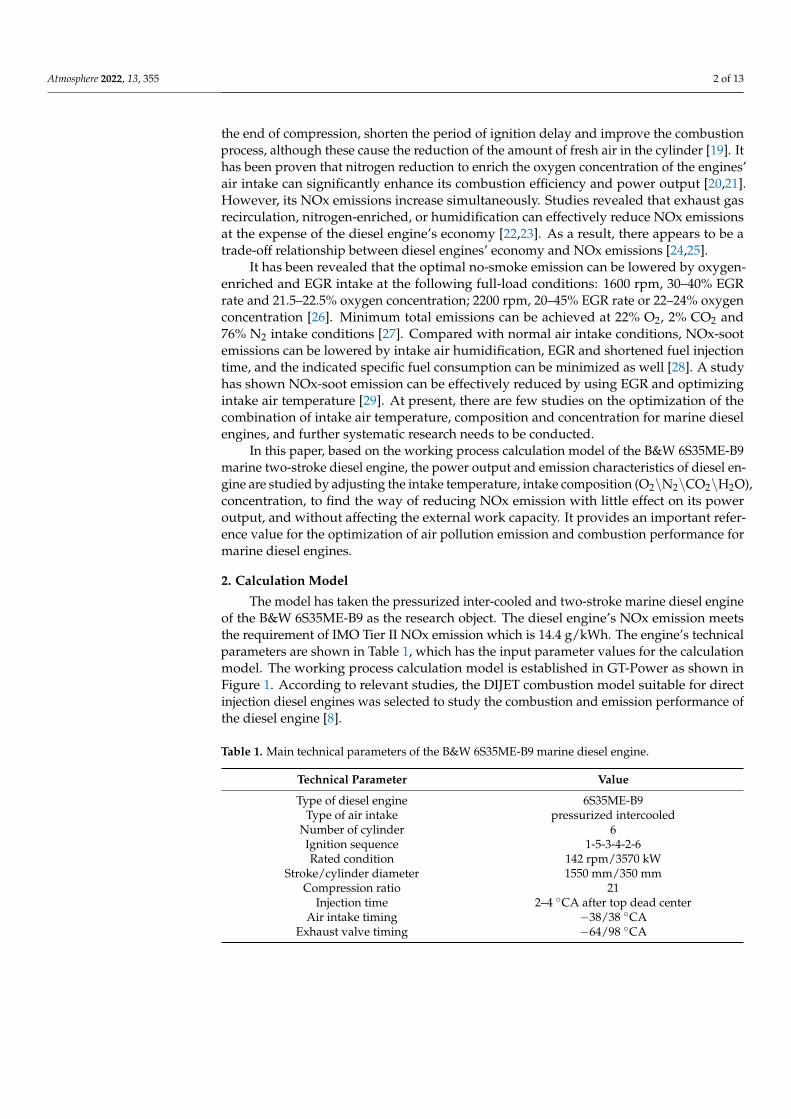
The model has taken the pressurized inter-cooled and two-stroke marine diesel engineof the B&W 6S35ME-B9 as the research object. The diesel engine’s NOx emission meetsthe requirement of IMO Tier II NOx emission which is 14.4 g/kWh. The engine’s technicalparameters are shown in Table 1, which has the input parameter values for the calculationmodel. The working process calculation model is established in GT-Power as shown inFigure 1. According to relevant studies, the DIJET combustion model suitable for directinjection diesel engines was selected to study the combustion and emission performance ofthe diesel engine [8].
Table 1. Main technical parameters of the B&W 6S35ME-B9 marine diesel engine.
Technical Parameter Value
Type of diesel engine 6S35ME-B9Type of air intake pressurized intercooled
Number of cylinder 6Ignition sequence 1-5-3-4-2-6Rated condition 142 rpm/3570 kW
Stroke/cylinder diameter 1550 mm/350 mmCompression ratio 21
Injection time 2–4 ◦CA after top dead centerAir intake timing −38/38 ◦CA
Exhaust valve timing −64/98 ◦CA
Atmosphere 2022, 13, 355 3 of 13Atmosphere 2022, 13, x FOR PEER REVIEW 3 of 12
Figure 1. Calculation model of the B&W 6S35ME-B9 marine diesel engine in GT-Power.
Table 1. Main technical parameters of the B&W 6S35ME-B9 marine diesel engine.
Technical Parameter Value Type of diesel engine 6S35ME-B9
Type of air intake pressurized intercooled Number of cylinder 6 Ignition sequence 1-5-3-4-2-6 Rated condition 142 rpm/3570 kW
Stroke/cylinder diameter 1550 mm/350 mm Compression ratio 21
Injection time 2–4 °CA after top dead center Air intake timing −38/38 °CA
Exhaust valve timing −64/98 °CA
The calculation model was checked and verified by taking the parameters of diesel engine speed, power, cylinder pressure, intake and exhaust temperature, intake and ex-haust pressure and emissions at 100%, 75%, 50% and 25% load conditions. Figure 2 shows the comparison between the actual and simulated cylinder pressure curves of diesel en-gines under various working conditions, indicating that the calculated values are con-sistent with the experimental values. Key thermodynamic and emissions parameters un-der various working conditions are shown in Table 2. The diesel engine’s emission values were collected by AVL i60 detection equipment. The cylinder pressure data were collected by Kistler pressure sensor, and then the average cylinder pressure of 100 cycles was used as the experimental value for this study. Other experimental data were collected by a spe-cial acquisition system. The deviations of pressure, temperature, NOx and CO2 emissions are all less than 5%. Therefore, this calculation model can be used to study the combustion and emission performance of this type of marine diesel engine.
Figure 1. Calculation model of the B&W 6S35ME-B9 marine diesel engine in GT-Power.
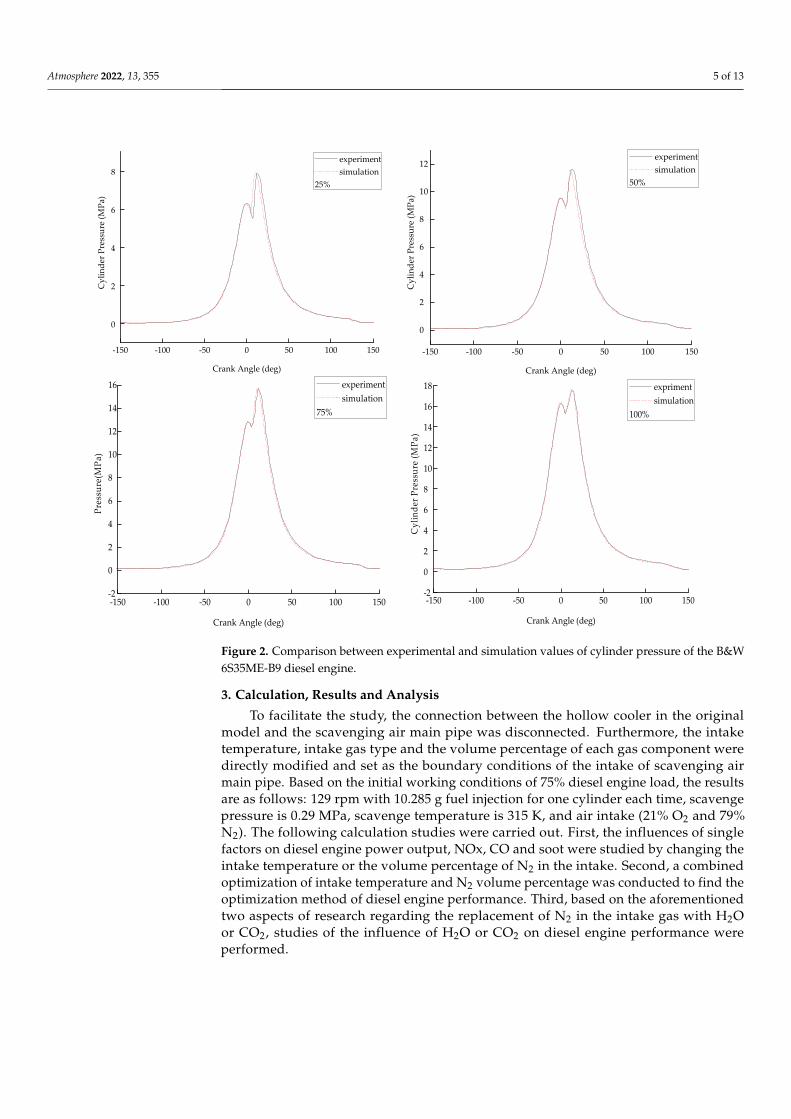
The calculation model was checked and verified by taking the parameters of dieselengine speed, power, cylinder pressure, intake and exhaust temperature, intake and exhaustpressure and emissions at 100%, 75%, 50% and 25% load conditions. Figure 2 shows thecomparison between the actual and simulated cylinder pressure curves of diesel enginesunder various working conditions, indicating that the calculated values are consistent withthe experimental values. Key thermodynamic and emissions parameters under variousworking conditions are shown in Table 2. The diesel engine’s emission values were collectedby AVL i60 detection equipment. The cylinder pressure data were collected by Kistlerpressure sensor, and then the average cylinder pressure of 100 cycles was used as theexperimental value for this study. Other experimental data were collected by a specialacquisition system. The deviations of pressure, temperature, NOx and CO2 emissions areall less than 5%. Therefore, this calculation model can be used to study the combustion andemission performance of this type of marine diesel engine.
Atmosphere 2022, 13, 355 4 of 13
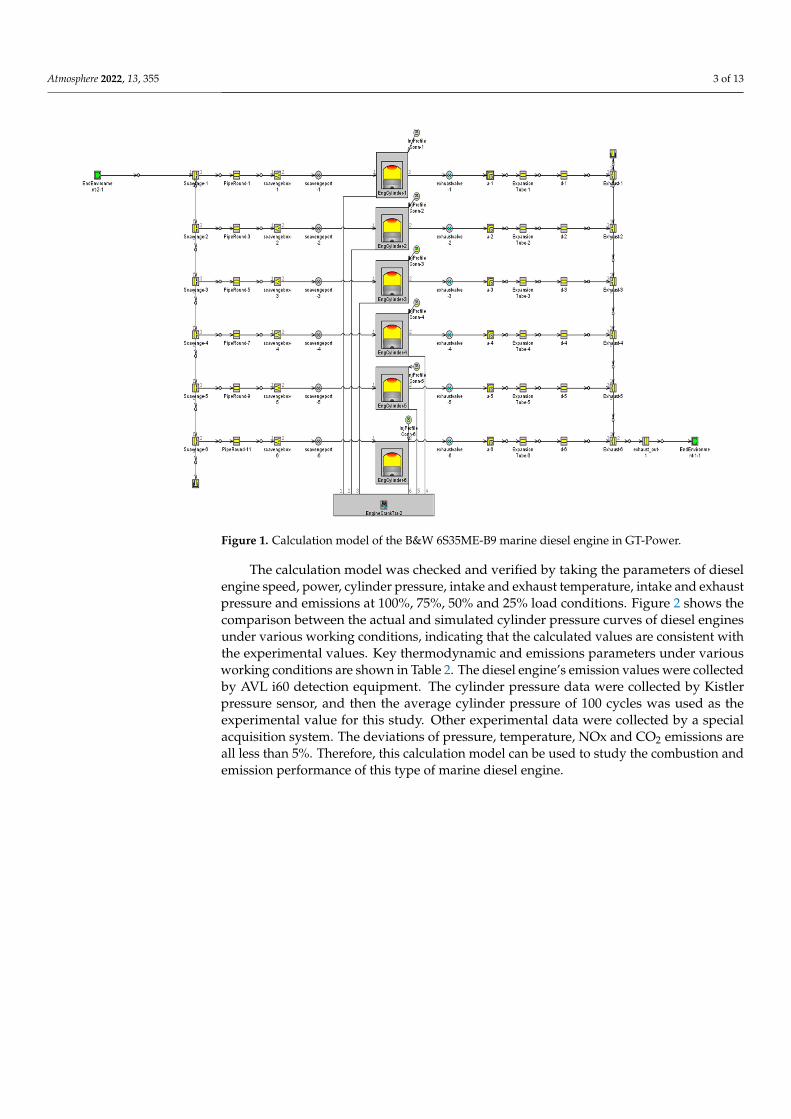
Table 2. Comparison of experimental and simulated parameters of the B&W 6S35ME-B9 diesel engine.
Parameters
Conditions 25% 50% 75% 100%
Experimental Simulated Deviation/% Experimental Simulated Deviation/% Experimental Simulated Deviation/% Experimental Simulated Deviation/%Speed(rpm) 89.5 89.5 0 112.8 112.8 0 129 129 0 142 142 0
Power(kW) 892 912 2.24 1795 1729 −3.6 2677 2547 −4.85 3575 3455 −3.4
Fuel consumption rate(g/kWh) 220.6 215.7 −2.22 190.6 197.8 −3.8 178.3 186.9 +4.82 180 186 +3.3
Scavenging pressure(MPa) 0.045 0.0438 −2.67 0.115 0.119 +3.5 0.188 0.191 +1.6 0.265 0.266 +0.4
Scavenging temperature(K) 314.5 317.6 0.99 311.5 312 +0.2 313.5 313.6 +0.03 318.5 310 −2.7
Compression pressure(MPa) 6.288 6.2 −1.40 9.528 9.56 +0.3 12.8 12.95 +1.2 16.3 16.4 +0.6
Combustion pressure(MPa) 7.891 7.89 −0.01 11.64 11.74 +0.9 15.69 15.84 +0.95 17.52 17.65 +0.7
Exhaust pressure(MPa) 0.039 0.0376 −3.59 0.102 0.105 +2.9 0.172 0.171 +0.58 0.24 0.242 +0.8
Exhaust temperature(K) 50.3 50.2 −0.20 53.35 53.5 +0.3 54.35 54.4 0 55.8 55.6 −0.4
NOX (g/kWh) 15.96 15.31 −4.07 12.58 12 −4.6 12.88 12.3 −4.5 12.6 12.22 −3
CO2(g/kWh) 691.2 674.8 −2.37 597 625 +4.7 559 586.8 +4.9 563.8 590.3 +4.7
Atmosphere 2022, 13, 355 5 of 13
Atmosphere 2022, 13, x FOR PEER REVIEW 4 of 12
Figure 2. Comparison between experimental and simulation values of cylinder pressure of the B&W 6S35ME-B9 diesel engine.
Table 2. Comparison of experimental and simulated parameters of the B&W 6S35ME-B9 diesel en-gine.
Conditions
Parameters
25% 50% 75% 100% Experi-mental
Simu-lated
Devia-tion/%
Experi-mental
Simu-lated
Devia-tion/%
Experi-mental
Simu-lated
Devia-tion/%
Experi-mental
Simu-lated
Devia-tion/%
Speed(rpm) 89.5 89.5 0 112.8 112.8 0 129 129 0 142 142 0 Power(kW) 892 912 2.24 1795 1729 −3.6 2677 2547 −4.85 3575 3455 −3.4 Fuel con-
sumption rate (g/kWh)
220.6 215.7 −2.22 190.6 197.8 −3.8 178.3 186.9 +4.82 180 186 +3.3
Scavenging pressure
(MPa) 0.045 0.0438 −2.67 0.115 0.119 +3.5 0.188 0.191 +1.6 0.265 0.266 +0.4
Scavenging temperature
(K) 314.5 317.6 0.99 311.5 312 +0.2 313.5 313.6 +0.03 318.5 310 −2.7
Compression pressure
(MPa) 6.288 6.2 −1.40 9.528 9.56 +0.3 12.8 12.95 +1.2 16.3 16.4 +0.6
Combustion pressure
(MPa) 7.891 7.89 −0.01 11.64 11.74 +0.9 15.69 15.84 +0.95 17.52 17.65 +0.7
Exhaust pres-sure
(MPa) 0.039 0.0376 −3.59 0.102 0.105 +2.9 0.172 0.171 +0.58 0.24 0.242 +0.8
Exhaust tem-perature
50.3 50.2 −0.20 53.35 53.5 +0.3 54.35 54.4 0 55.8 55.6 −0.4
-150 -100 -50 0 50 100 150
Cyl
inde
r Pre
ssur
e (M
Pa)
Crank Angle (deg)
experiment simulation
25%
0
2
4
6
8
-150 -100 -50 0 50 100 150
Cyl
inde
r Pre
ssur
e (M
Pa)
Crank Angle (deg)
experiment simulation
50%
0
2
4
6
8
10
12
-150 -100 -50 0 50 100 150
Pres
sure
(MPa
)
Crank Angle (deg)
experiment simulation
75%
-2
0
2
4
6
8
10
12
14
16
-150 -100 -50 0 50 100 150
Cyl
inde
r Pre
ssur
e (M
Pa)
Crank Angle (deg)
expriment simulation
100%
-2
0
2
4
6
8
10
12
14
16
18
Figure 2. Comparison between experimental and simulation values of cylinder pressure of the B&W6S35ME-B9 diesel engine.
3. Calculation, Results and Analysis
To facilitate the study, the connection between the hollow cooler in the originalmodel and the scavenging air main pipe was disconnected. Furthermore, the intaketemperature, intake gas type and the volume percentage of each gas component weredirectly modified and set as the boundary conditions of the intake of scavenging airmain pipe. Based on the initial working conditions of 75% diesel engine load, the resultsare as follows: 129 rpm with 10.285 g fuel injection for one cylinder each time, scavengepressure is 0.29 MPa, scavenge temperature is 315 K, and air intake (21% O2 and 79%N2). The following calculation studies were carried out. First, the influences of singlefactors on diesel engine power output, NOx, CO and soot were studied by changing theintake temperature or the volume percentage of N2 in the intake. Second, a combinedoptimization of intake temperature and N2 volume percentage was conducted to find theoptimization method of diesel engine performance. Third, based on the aforementionedtwo aspects of research regarding the replacement of N2 in the intake gas with H2Oor CO2, studies of the influence of H2O or CO2 on diesel engine performance wereperformed.
Atmosphere 2022, 13, 355 6 of 13
3.1. Influence of Intake Temperature or Oxygen Volume Fraction3.1.1. Influence of Intake Temperature
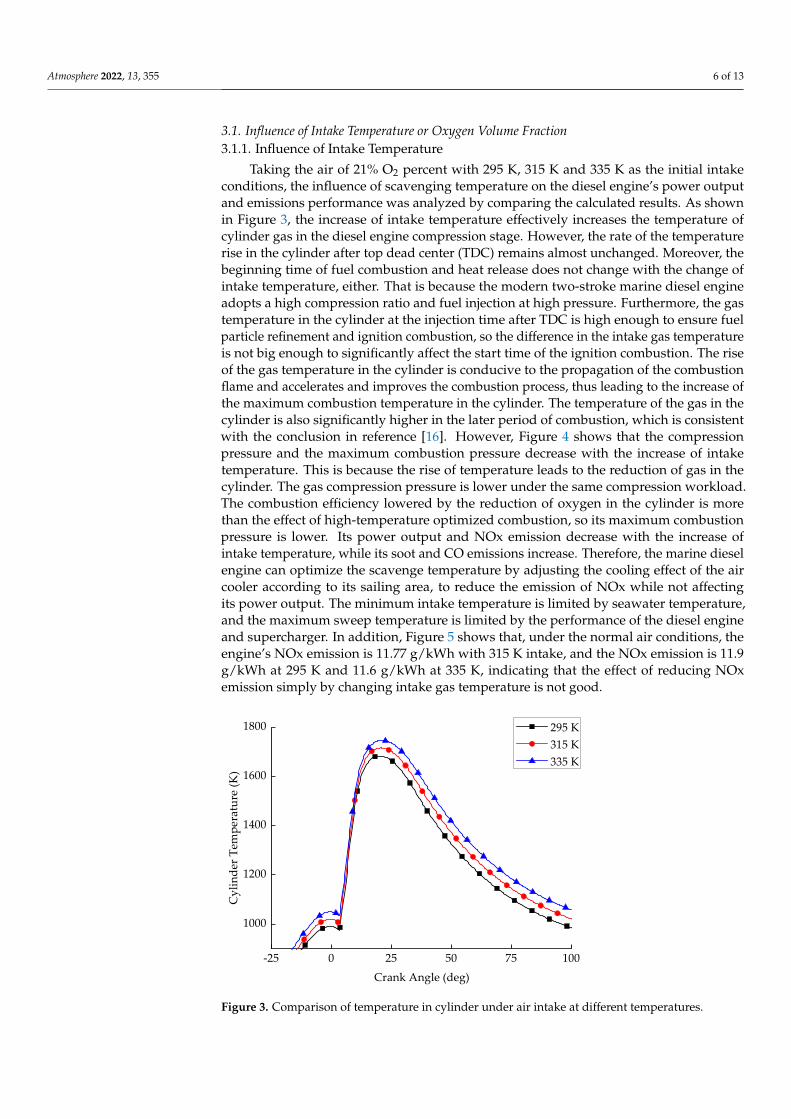
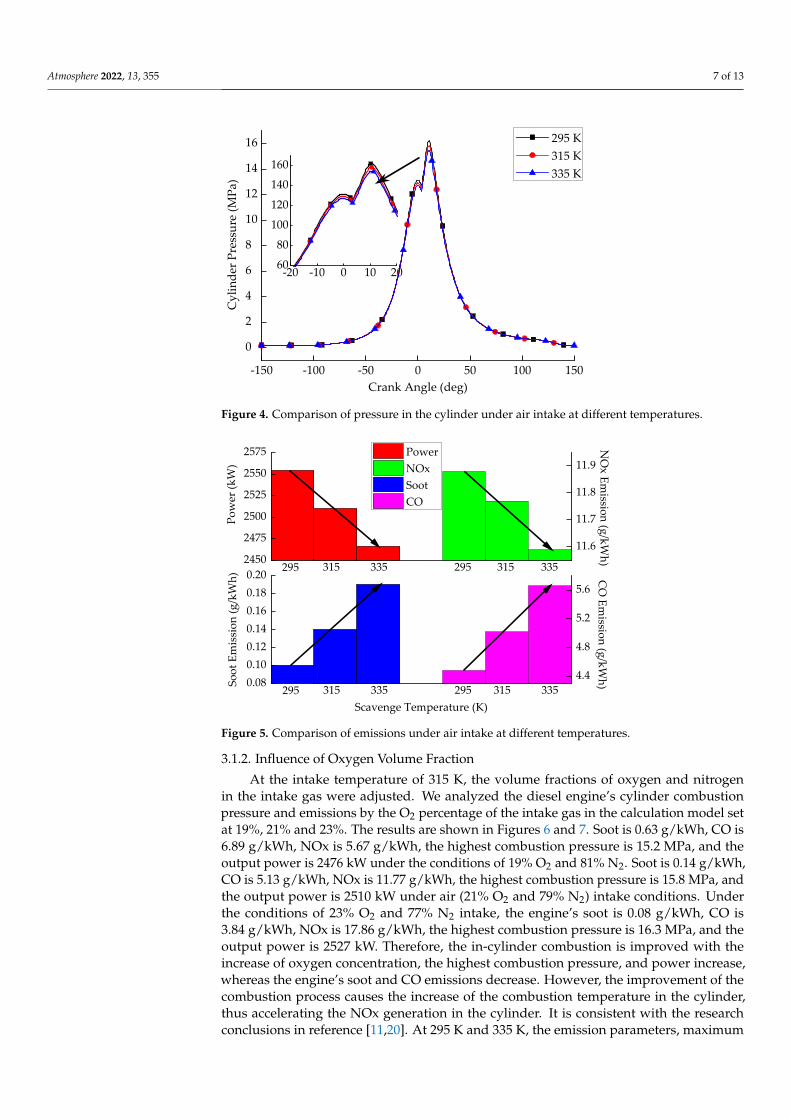
Taking the air of 21% O2 percent with 295 K, 315 K and 335 K as the initial intakeconditions, the influence of scavenging temperature on the diesel engine’s power outputand emissions performance was analyzed by comparing the calculated results. As shownin Figure 3, the increase of intake temperature effectively increases the temperature ofcylinder gas in the diesel engine compression stage. However, the rate of the temperaturerise in the cylinder after top dead center (TDC) remains almost unchanged. Moreover, thebeginning time of fuel combustion and heat release does not change with the change ofintake temperature, either. That is because the modern two-stroke marine diesel engineadopts a high compression ratio and fuel injection at high pressure. Furthermore, the gastemperature in the cylinder at the injection time after TDC is high enough to ensure fuelparticle refinement and ignition combustion, so the difference in the intake gas temperatureis not big enough to significantly affect the start time of the ignition combustion. The riseof the gas temperature in the cylinder is conducive to the propagation of the combustionflame and accelerates and improves the combustion process, thus leading to the increase ofthe maximum combustion temperature in the cylinder. The temperature of the gas in thecylinder is also significantly higher in the later period of combustion, which is consistentwith the conclusion in reference [16]. However, Figure 4 shows that the compressionpressure and the maximum combustion pressure decrease with the increase of intaketemperature. This is because the rise of temperature leads to the reduction of gas in thecylinder. The gas compression pressure is lower under the same compression workload.The combustion efficiency lowered by the reduction of oxygen in the cylinder is morethan the effect of high-temperature optimized combustion, so its maximum combustionpressure is lower. Its power output and NOx emission decrease with the increase ofintake temperature, while its soot and CO emissions increase. Therefore, the marine dieselengine can optimize the scavenge temperature by adjusting the cooling effect of the aircooler according to its sailing area, to reduce the emission of NOx while not affectingits power output. The minimum intake temperature is limited by seawater temperature,and the maximum sweep temperature is limited by the performance of the diesel engineand supercharger. In addition, Figure 5 shows that, under the normal air conditions, theengine’s NOx emission is 11.77 g/kWh with 315 K intake, and the NOx emission is 11.9g/kWh at 295 K and 11.6 g/kWh at 335 K, indicating that the effect of reducing NOxemission simply by changing intake gas temperature is not good.
Atmosphere 2022, 13, x FOR PEER REVIEW 6 of 12
g/kWh at 295 K and 11.6 g/kWh at 335 K, indicating that the effect of reducing NOx emis-sion simply by changing intake gas temperature is not good.
Figure 3. Comparison of temperature in cylinder under air intake at different temperatures.
Figure 4. Comparison of pressure in the cylinder under air intake at different temperatures.
Figure 5. Comparison of emissions under air intake at different temperatures.
3.1.2. Influence of Oxygen Volume Fraction At the intake temperature of 315 K, the volume fractions of oxygen and nitrogen in
the intake gas were adjusted. We analyzed the diesel engine’s cylinder combustion pres-sure and emissions by the O2 percentage of the intake gas in the calculation model set at 19%, 21% and 23%. The results are shown in Figures 6 and 7. Soot is 0.63 g/kWh, CO is 6.89 g/kWh, NOx is 5.67 g/kWh, the highest combustion pressure is 15.2 MPa, and the output power is 2476 kW under the conditions of 19% O2 and 81% N2. Soot is 0.14 g/kWh,
-25 0 25 50 75 100
1000
1200
1400
1600
1800
Cyl
inde
r Tem
pera
ture
(K)
Crank Angle (deg)
295 K 315 K 335 K
-150 -100 -50 0 50 100 150
Cyl
inde
r Pre
ssur
e (M
Pa)
Crank Angle (deg)
295 K 315 K 335 K
-20 -10 0 10 2060
80
100
120
140
160
0
2
4
6
8
10
12
14
16
Power NOx Soot CO
2450
2475
2500
2525
2550
2575 NO
x Emission (g/kW
h)
Pow
er (k
W)
295 295335315 335315
11.6
11.7
11.8
11.9
0.080.100.120.140.160.180.20 C
O Em
ission (g/kWh)
295 295335315Soot
Em
issi
on (g
/kW
h)
Scavenge Temperature (K)335315
4.4
4.8
5.2
5.6
Figure 3. Comparison of temperature in cylinder under air intake at different temperatures.
Atmosphere 2022, 13, 355 7 of 13
Atmosphere 2022, 13, x FOR PEER REVIEW 6 of 12
g/kWh at 295 K and 11.6 g/kWh at 335 K, indicating that the effect of reducing NOx emis-sion simply by changing intake gas temperature is not good.
Figure 3. Comparison of temperature in cylinder under air intake at different temperatures.
Figure 4. Comparison of pressure in the cylinder under air intake at different temperatures.
Figure 5. Comparison of emissions under air intake at different temperatures.
3.1.2. Influence of Oxygen Volume Fraction At the intake temperature of 315 K, the volume fractions of oxygen and nitrogen in
the intake gas were adjusted. We analyzed the diesel engine’s cylinder combustion pres-sure and emissions by the O2 percentage of the intake gas in the calculation model set at 19%, 21% and 23%. The results are shown in Figures 6 and 7. Soot is 0.63 g/kWh, CO is 6.89 g/kWh, NOx is 5.67 g/kWh, the highest combustion pressure is 15.2 MPa, and the output power is 2476 kW under the conditions of 19% O2 and 81% N2. Soot is 0.14 g/kWh,
-25 0 25 50 75 100
1000
1200
1400
1600
1800
Cyl
inde
r Tem
pera
ture
(K)
Crank Angle (deg)
295 K 315 K 335 K
-150 -100 -50 0 50 100 150
Cyl
inde
r Pre
ssur
e (M
Pa)
Crank Angle (deg)
295 K 315 K 335 K
-20 -10 0 10 2060
80
100
120
140
160
0
2
4
6
8
10
12
14
16
Power NOx Soot CO
2450
2475
2500
2525
2550
2575 NO
x Emission (g/kW
h)
Pow
er (k
W)
295 295335315 335315
11.6
11.7
11.8
11.9
0.080.100.120.140.160.180.20 C
O Em
ission (g/kWh)
295 295335315Soot
Em
issi
on (g
/kW
h)
Scavenge Temperature (K)335315
4.4
4.8
5.2
5.6
Figure 4. Comparison of pressure in the cylinder under air intake at different temperatures.
Atmosphere 2022, 13, x FOR PEER REVIEW 6 of 12
g/kWh at 295 K and 11.6 g/kWh at 335 K, indicating that the effect of reducing NOx emis-sion simply by changing intake gas temperature is not good.
Figure 3. Comparison of temperature in cylinder under air intake at different temperatures.
Figure 4. Comparison of pressure in the cylinder under air intake at different temperatures.
Figure 5. Comparison of emissions under air intake at different temperatures.
3.1.2. Influence of Oxygen Volume Fraction At the intake temperature of 315 K, the volume fractions of oxygen and nitrogen in
the intake gas were adjusted. We analyzed the diesel engine’s cylinder combustion pres-sure and emissions by the O2 percentage of the intake gas in the calculation model set at 19%, 21% and 23%. The results are shown in Figures 6 and 7. Soot is 0.63 g/kWh, CO is 6.89 g/kWh, NOx is 5.67 g/kWh, the highest combustion pressure is 15.2 MPa, and the output power is 2476 kW under the conditions of 19% O2 and 81% N2. Soot is 0.14 g/kWh,
-25 0 25 50 75 100
1000
1200
1400
1600
1800
Cyl
inde
r Tem
pera
ture
(K)
Crank Angle (deg)
295 K 315 K 335 K
-150 -100 -50 0 50 100 150
Cyl
inde
r Pre
ssur
e (M
Pa)
Crank Angle (deg)
295 K 315 K 335 K
-20 -10 0 10 2060
80
100
120
140
160
0
2
4
6
8
10
12
14
16
Power NOx Soot CO
2450
2475
2500
2525
2550
2575 NO
x Emission (g/kW
h)
Pow
er (k
W)
295 295335315 335315
11.6
11.7
11.8
11.9
0.080.100.120.140.160.180.20 C
O Em
ission (g/kWh)
295 295335315Soot
Em
issi
on (g
/kW
h)
Scavenge Temperature (K)335315
4.4
4.8
5.2
5.6
Figure 5. Comparison of emissions under air intake at different temperatures.
3.1.2. Influence of Oxygen Volume Fraction
At the intake temperature of 315 K, the volume fractions of oxygen and nitrogenin the intake gas were adjusted. We analyzed the diesel engine’s cylinder combustionpressure and emissions by the O2 percentage of the intake gas in the calculation model setat 19%, 21% and 23%. The results are shown in Figures 6 and 7. Soot is 0.63 g/kWh, CO is6.89 g/kWh, NOx is 5.67 g/kWh, the highest combustion pressure is 15.2 MPa, and theoutput power is 2476 kW under the conditions of 19% O2 and 81% N2. Soot is 0.14 g/kWh,CO is 5.13 g/kWh, NOx is 11.77 g/kWh, the highest combustion pressure is 15.8 MPa, andthe output power is 2510 kW under air (21% O2 and 79% N2) intake conditions. Underthe conditions of 23% O2 and 77% N2 intake, the engine’s soot is 0.08 g/kWh, CO is3.84 g/kWh, NOx is 17.86 g/kWh, the highest combustion pressure is 16.3 MPa, and theoutput power is 2527 kW. Therefore, the in-cylinder combustion is improved with theincrease of oxygen concentration, the highest combustion pressure, and power increase,whereas the engine’s soot and CO emissions decrease. However, the improvement of thecombustion process causes the increase of the combustion temperature in the cylinder,thus accelerating the NOx generation in the cylinder. It is consistent with the researchconclusions in reference [11,20]. At 295 K and 335 K, the emission parameters, maximum

Atmosphere 2022, 13, 355 8 of 13
combustion pressure, and the power output of diesel engines have the same variationtrend. Therefore, the emission parameters and work performance of diesel engines can beeffectively changed by adjusting the oxygen concentration in the cylinder. Or vice versa, thedevelopment of air separation technology, the study of oxygen volume fraction in internalcombustion engine intake is effectively promoted.
Atmosphere 2022, 13, x FOR PEER REVIEW 7 of 12
CO is 5.13 g/kWh, NOx is 11.77 g/kWh, the highest combustion pressure is 15.8 MPa, and the output power is 2510 kW under air (21% O2 and 79% N2) intake conditions. Under the conditions of 23% O2 and 77% N2 intake, the engine’s soot is 0.08 g/kWh, CO is 3.84 g/kWh, NOx is 17.86 g/kWh, the highest combustion pressure is 16.3 MPa, and the output power is 2527 kW. Therefore, the in-cylinder combustion is improved with the increase of oxygen concentration, the highest combustion pressure, and power increase, whereas the engine’s soot and CO emissions decrease. However, the improvement of the combustion process causes the increase of the combustion temperature in the cylinder, thus accelerating the NOx generation in the cylinder. It is consistent with the research conclusions in reference [11,20]. At 295 K and 335 K, the emission parameters, maximum combustion pressure, and the power output of diesel engines have the same variation trend. Therefore, the emission parameters and work performance of diesel engines can be effectively changed by adjust-ing the oxygen concentration in the cylinder. Or vice versa, the development of air sepa-ration technology, the study of oxygen volume fraction in internal combustion engine in-take is effectively promoted.
Figure 6. Cylinder pressure comparison at 315K and different O2 volume fractions.
Figure 7. Emission comparison at 315K and different O2 volume fractions.
Based on the research discussed above, the decrease of intake temperature or the in-crease of intake oxygen volume concentration can effectively improve the in-cylinder combustion process and the power output of diesel engines, though causing the increase in NOx emissions. With the increase of intake temperature or the decrease of intake oxy-gen concentration, the NOx emission of the diesel engine can be reduced, but its power output is lower as well. The intake temperature and the intake oxygen concentration of diesel engine power output and NOx emissions are not the same. We can study the per-formance of diesel engines through either the combination of high intake temperature and oxygen enrichment or low intake temperature and oxygen deficiency.
3.2. Integrated Optimization with Intake Temperature and Oxygen Volume Fraction
-150 -100 -50 0 50 100 150
Cyl
inde
r Pre
ssur
e (M
Pa)
Crank Angle (deg)
O2 19% & N2 81% O2 21% & N2 79% O2 23% & N2 77%
-5 0 5 10 15 20110120130140150160170
0
2
4
6
8
10
12
14
16
19 20 21 22 232470
2480
2490
2500
2510
2520
2530 Power NOx CO Soot
Pow
er (k
W)
Volume Percent of Oxygen (%)
4
6
8
10
12
14
16
18
3
4
5
6
7
CO
Emission (g/kW
h)
0.1
0.2
0.3
0.4
0.5
0.6
NO
x Em
issi
on (g
/kW
h)
Soot Emission (g/kW
h)
Figure 6. Cylinder pressure comparison at 315K and different O2 volume fractions.
Atmosphere 2022, 13, x FOR PEER REVIEW 7 of 12
CO is 5.13 g/kWh, NOx is 11.77 g/kWh, the highest combustion pressure is 15.8 MPa, and the output power is 2510 kW under air (21% O2 and 79% N2) intake conditions. Under the conditions of 23% O2 and 77% N2 intake, the engine’s soot is 0.08 g/kWh, CO is 3.84 g/kWh, NOx is 17.86 g/kWh, the highest combustion pressure is 16.3 MPa, and the output power is 2527 kW. Therefore, the in-cylinder combustion is improved with the increase of oxygen concentration, the highest combustion pressure, and power increase, whereas the engine’s soot and CO emissions decrease. However, the improvement of the combustion process causes the increase of the combustion temperature in the cylinder, thus accelerating the NOx generation in the cylinder. It is consistent with the research conclusions in reference [11,20]. At 295 K and 335 K, the emission parameters, maximum combustion pressure, and the power output of diesel engines have the same variation trend. Therefore, the emission parameters and work performance of diesel engines can be effectively changed by adjust-ing the oxygen concentration in the cylinder. Or vice versa, the development of air sepa-ration technology, the study of oxygen volume fraction in internal combustion engine in-take is effectively promoted.
Figure 6. Cylinder pressure comparison at 315K and different O2 volume fractions.
Figure 7. Emission comparison at 315K and different O2 volume fractions.
Based on the research discussed above, the decrease of intake temperature or the in-crease of intake oxygen volume concentration can effectively improve the in-cylinder combustion process and the power output of diesel engines, though causing the increase in NOx emissions. With the increase of intake temperature or the decrease of intake oxy-gen concentration, the NOx emission of the diesel engine can be reduced, but its power output is lower as well. The intake temperature and the intake oxygen concentration of diesel engine power output and NOx emissions are not the same. We can study the per-formance of diesel engines through either the combination of high intake temperature and oxygen enrichment or low intake temperature and oxygen deficiency.
3.2. Integrated Optimization with Intake Temperature and Oxygen Volume Fraction
-150 -100 -50 0 50 100 150
Cyl
inde
r Pre
ssur
e (M
Pa)
Crank Angle (deg)
O2 19% & N2 81% O2 21% & N2 79% O2 23% & N2 77%
-5 0 5 10 15 20110120130140150160170
0
2
4
6
8
10
12
14
16
19 20 21 22 232470
2480
2490
2500
2510
2520
2530 Power NOx CO Soot
Pow
er (k
W)
Volume Percent of Oxygen (%)
4
6
8
10
12
14
16
18
3
4
5
6
7
CO
Emission (g/kW
h)
0.1
0.2
0.3
0.4
0.5
0.6
NO
x Em
issi
on (g
/kW
h)
Soot Emission (g/kW
h)
Figure 7. Emission comparison at 315K and different O2 volume fractions.
Based on the research discussed above, the decrease of intake temperature or theincrease of intake oxygen volume concentration can effectively improve the in-cylindercombustion process and the power output of diesel engines, though causing the increase inNOx emissions. With the increase of intake temperature or the decrease of intake oxygenconcentration, the NOx emission of the diesel engine can be reduced, but its power outputis lower as well. The intake temperature and the intake oxygen concentration of dieselengine power output and NOx emissions are not the same. We can study the performanceof diesel engines through either the combination of high intake temperature and oxygenenrichment or low intake temperature and oxygen deficiency.
3.2. Integrated Optimization with Intake Temperature and Oxygen Volume Fraction3.2.1. High Intake Temperature and Enriched Oxygen
Under the intake temperature of 335 K and changed volume percentage of O2 and N2with 23% O2, 29% O2 and 40% O2 were used as boundary conditions, which corresponds
Atmosphere 2022, 13, 355 9 of 13
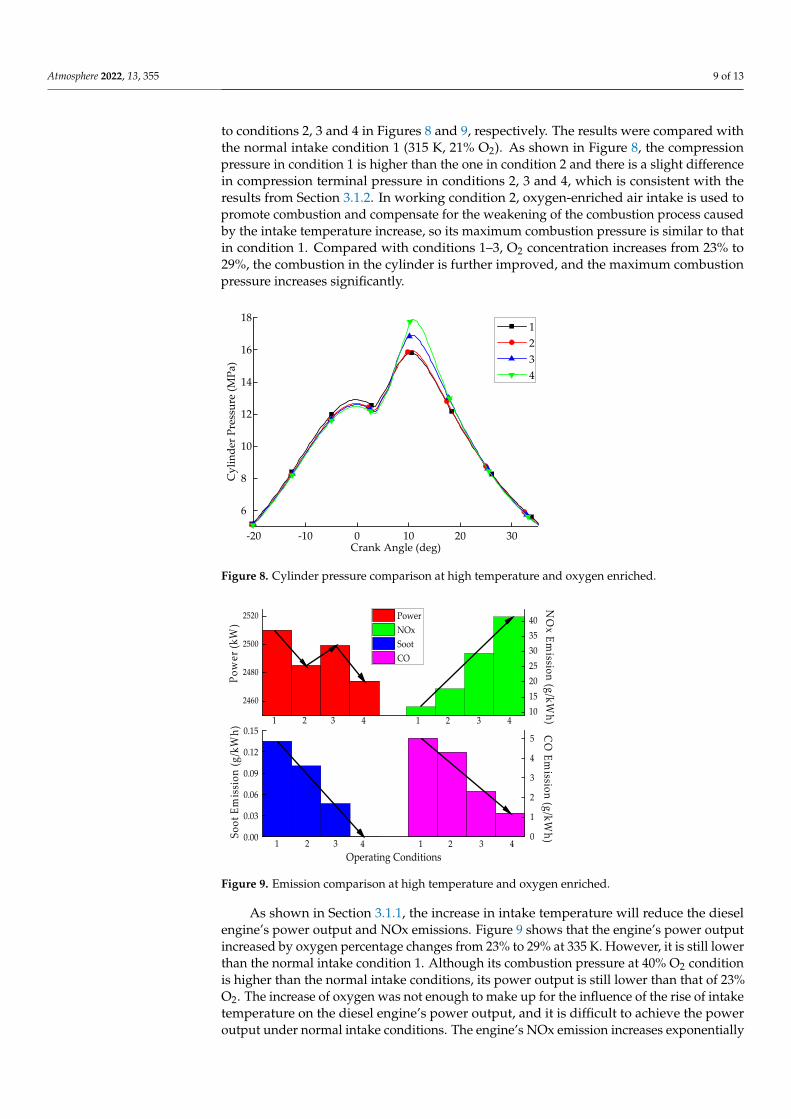
to conditions 2, 3 and 4 in Figures 8 and 9, respectively. The results were compared withthe normal intake condition 1 (315 K, 21% O2). As shown in Figure 8, the compressionpressure in condition 1 is higher than the one in condition 2 and there is a slight differencein compression terminal pressure in conditions 2, 3 and 4, which is consistent with theresults from Section 3.1.2. In working condition 2, oxygen-enriched air intake is used topromote combustion and compensate for the weakening of the combustion process causedby the intake temperature increase, so its maximum combustion pressure is similar to thatin condition 1. Compared with conditions 1–3, O2 concentration increases from 23% to29%, the combustion in the cylinder is further improved, and the maximum combustionpressure increases significantly.
Atmosphere 2022, 13, x FOR PEER REVIEW 8 of 12
3.2.1. High Intake Temperature and Enriched Oxygen Under the intake temperature of 335 K and changed volume percentage of O2 and N2
with 23% O2, 29% O2 and 40% O2 were used as boundary conditions, which corresponds to conditions 2, 3 and 4 in Figures 8 and 9, respectively. The results were compared with the normal intake condition 1 (315 K, 21% O2). As shown in Figure 8, the compression pressure in condition 1 is higher than the one in condition 2 and there is a slight difference in compression terminal pressure in conditions 2, 3 and 4, which is consistent with the results from Section 3.1.2. In working condition 2, oxygen-enriched air intake is used to promote combustion and compensate for the weakening of the combustion process caused by the intake temperature increase, so its maximum combustion pressure is similar to that in condition 1. Compared with conditions 1–3, O2 concentration increases from 23% to 29%, the combustion in the cylinder is further improved, and the maximum combustion pressure increases significantly.
Figure 8. Cylinder pressure comparison at high temperature and oxygen enriched.
Power NOx Soot CO
2460
2480
2500
2520
NO
x Emission (g/kW
h)421 3432
Pow
er (k
W)
110152025303540
0
1
2
3
4
5
Soot
Em
issi
on (g
/kW
h) CO
Emission (g/kW
h)
Operating Conditions421 34321
0.00
0.03
0.06
0.09
0.12
0.15
Figure 9. Emission comparison at high temperature and oxygen enriched.
As shown in Section 3.1.1, the increase in intake temperature will reduce the diesel engine’s power output and NOx emissions. Figure 9 shows that the engine’s power output increased by oxygen percentage changes from 23% to 29% at 335 K. However, it is still lower than the normal intake condition 1. Although its combustion pressure at 40% O2 condition is higher than the normal intake conditions, its power output is still lower than that of 23% O2. The increase of oxygen was not enough to make up for the influence of the rise of intake temperature on the diesel engine’s power output, and it is difficult to achieve the power output under normal intake conditions. The engine’s NOx emission increases exponentially with oxygen percentage from 23% to 29%, and its influence is significantly greater than the one of intake temperature. Therefore, it is difficult to optimize the perfor-mance of diesel engines’ power output and emissions through the combination of high temperature and oxygen-enriched intake.
-20 -10 0 10 20 30
Cyl
inde
r Pre
ssur
e (M
Pa)
Crank Angle (deg)
1 2 3 4
6
8
10
12
14
16
18
Figure 8. Cylinder pressure comparison at high temperature and oxygen enriched.
Atmosphere 2022, 13, x FOR PEER REVIEW 8 of 12
3.2.1. High Intake Temperature and Enriched Oxygen Under the intake temperature of 335 K and changed volume percentage of O2 and N2
with 23% O2, 29% O2 and 40% O2 were used as boundary conditions, which corresponds to conditions 2, 3 and 4 in Figures 8 and 9, respectively. The results were compared with the normal intake condition 1 (315 K, 21% O2). As shown in Figure 8, the compression pressure in condition 1 is higher than the one in condition 2 and there is a slight difference in compression terminal pressure in conditions 2, 3 and 4, which is consistent with the results from Section 3.1.2. In working condition 2, oxygen-enriched air intake is used to promote combustion and compensate for the weakening of the combustion process caused by the intake temperature increase, so its maximum combustion pressure is similar to that in condition 1. Compared with conditions 1–3, O2 concentration increases from 23% to 29%, the combustion in the cylinder is further improved, and the maximum combustion pressure increases significantly.
Figure 8. Cylinder pressure comparison at high temperature and oxygen enriched.
Power NOx Soot CO
2460
2480
2500
2520
NO
x Emission (g/kW
h)421 3432
Pow
er (k
W)
110152025303540
0
1
2
3
4
5
Soot
Em
issi
on (g
/kW
h) CO
Emission (g/kW
h)
Operating Conditions421 34321
0.00
0.03
0.06
0.09
0.12
0.15
Figure 9. Emission comparison at high temperature and oxygen enriched.
As shown in Section 3.1.1, the increase in intake temperature will reduce the diesel engine’s power output and NOx emissions. Figure 9 shows that the engine’s power output increased by oxygen percentage changes from 23% to 29% at 335 K. However, it is still lower than the normal intake condition 1. Although its combustion pressure at 40% O2 condition is higher than the normal intake conditions, its power output is still lower than that of 23% O2. The increase of oxygen was not enough to make up for the influence of the rise of intake temperature on the diesel engine’s power output, and it is difficult to achieve the power output under normal intake conditions. The engine’s NOx emission increases exponentially with oxygen percentage from 23% to 29%, and its influence is significantly greater than the one of intake temperature. Therefore, it is difficult to optimize the perfor-mance of diesel engines’ power output and emissions through the combination of high temperature and oxygen-enriched intake.
-20 -10 0 10 20 30
Cyl
inde
r Pre
ssur
e (M
Pa)
Crank Angle (deg)
1 2 3 4
6
8
10
12
14
16
18
Figure 9. Emission comparison at high temperature and oxygen enriched.
As shown in Section 3.1.1, the increase in intake temperature will reduce the dieselengine’s power output and NOx emissions. Figure 9 shows that the engine’s power outputincreased by oxygen percentage changes from 23% to 29% at 335 K. However, it is still lowerthan the normal intake condition 1. Although its combustion pressure at 40% O2 conditionis higher than the normal intake conditions, its power output is still lower than that of 23%O2. The increase of oxygen was not enough to make up for the influence of the rise of intaketemperature on the diesel engine’s power output, and it is difficult to achieve the poweroutput under normal intake conditions. The engine’s NOx emission increases exponentially
Atmosphere 2022, 13, 355 10 of 13
with oxygen percentage from 23% to 29%, and its influence is significantly greater than theone of intake temperature. Therefore, it is difficult to optimize the performance of dieselengines’ power output and emissions through the combination of high temperature andoxygen-enriched intake.
3.2.2. High Intake Temperature and Low Oxygen
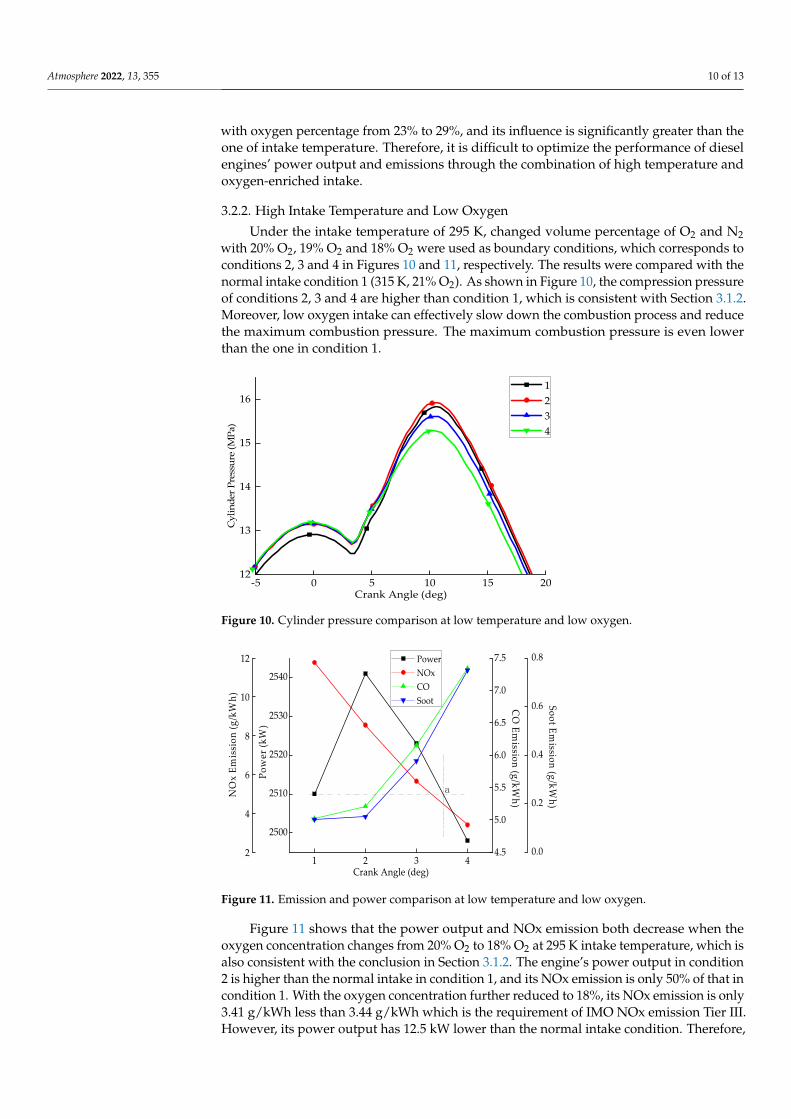
Under the intake temperature of 295 K, changed volume percentage of O2 and N2with 20% O2, 19% O2 and 18% O2 were used as boundary conditions, which corresponds toconditions 2, 3 and 4 in Figures 10 and 11, respectively. The results were compared with thenormal intake condition 1 (315 K, 21% O2). As shown in Figure 10, the compression pressureof conditions 2, 3 and 4 are higher than condition 1, which is consistent with Section 3.1.2.Moreover, low oxygen intake can effectively slow down the combustion process and reducethe maximum combustion pressure. The maximum combustion pressure is even lowerthan the one in condition 1.
Atmosphere 2022, 13, x FOR PEER REVIEW 9 of 12
3.2.2. High Intake Temperature and Low Oxygen Under the intake temperature of 295 K, changed volume percentage of O2 and N2
with 20% O2, 19% O2 and 18% O2 were used as boundary conditions, which corresponds to conditions 2, 3 and 4 in Figures 10 and 11, respectively. The results were compared with the normal intake condition 1 (315 K, 21% O2). As shown in Figure 10, the compression pressure of conditions 2, 3 and 4 are higher than condition 1, which is consistent with Section 3.1.2. Moreover, low oxygen intake can effectively slow down the combustion pro-cess and reduce the maximum combustion pressure. The maximum combustion pressure is even lower than the one in condition 1.
Figure 10. Cylinder pressure comparison at low temperature and low oxygen.
Figure 11. Emission and power comparison at low temperature and low oxygen.
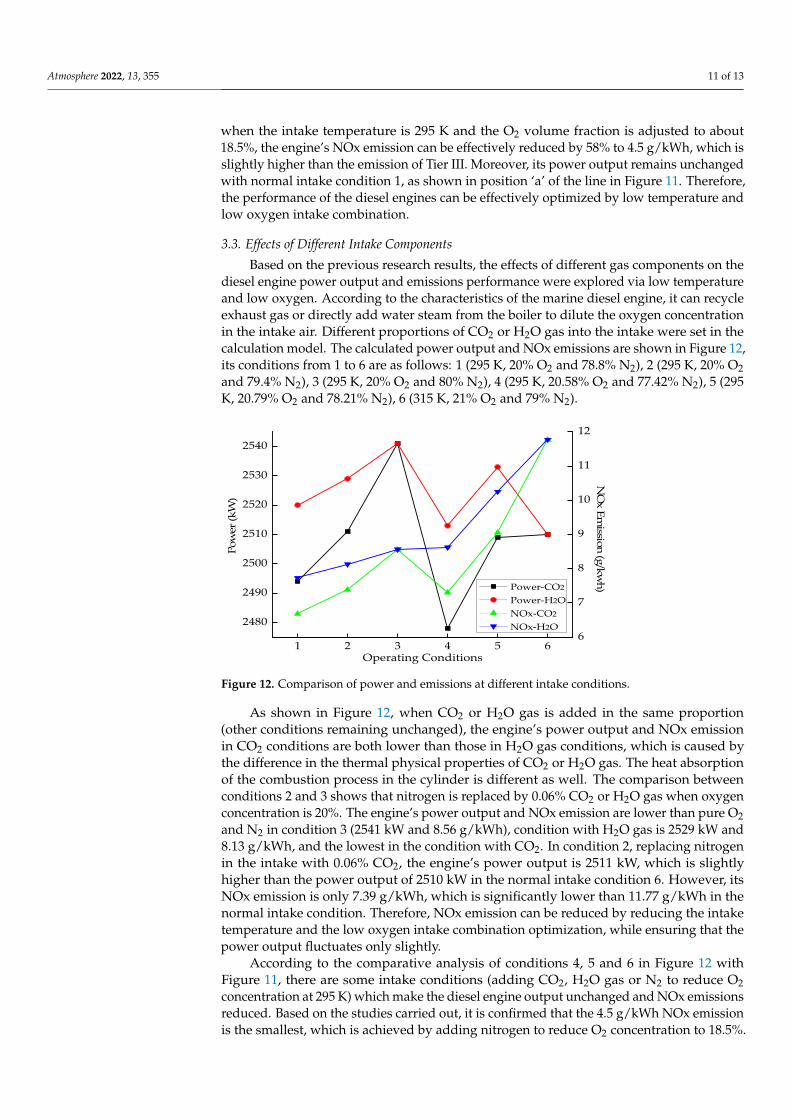
Figure 11 shows that the power output and NOx emission both decrease when the oxygen concentration changes from 20% O2 to 18% O2 at 295 K intake temperature, which is also consistent with the conclusion in Section 3.1.2. The engine’s power output in con-dition 2 is higher than the normal intake in condition 1, and its NOx emission is only 50% of that in condition 1. With the oxygen concentration further reduced to 18%, its NOx emission is only 3.41 g/kWh less than 3.44 g/kWh which is the requirement of IMO NOx emission Tier Ш. However, its power output has 12.5 kW lower than the normal intake condition. Therefore, when the intake temperature is 295 K and the O2 volume fraction is adjusted to about 18.5%, the engine’s NOx emission can be effectively reduced by 58% to 4.5 g/kWh, which is slightly higher than the emission of Tier Ш. Moreover, its power out-put remains unchanged with normal intake condition 1, as shown in position ‘a’ of the line in Figure 11. Therefore, the performance of the diesel engines can be effectively opti-mized by low temperature and low oxygen intake combination.
-5 0 5 10 15 20
Cyl
inde
r Pre
ssur
e (M
Pa)
Crank Angle (deg)
1 2 3 4
12
13
14
15
16
1 2 3 42
4
6
8
10
12
Soot Emission (g/kW
h)
CO
Emission (g/kW
h)
Pow
er (k
W)
NO
x Em
issi
on (g
/kW
h)
Crank Angle (deg)
a
2500
2510
2520
2530
2540
4.5
5.0
5.5
6.0
6.5
7.0
7.5
0.0
0.2
0.4
0.6
0.8
Power NOx CO Soot
Figure 10. Cylinder pressure comparison at low temperature and low oxygen.
Atmosphere 2022, 13, x FOR PEER REVIEW 9 of 12
3.2.2. High Intake Temperature and Low Oxygen Under the intake temperature of 295 K, changed volume percentage of O2 and N2
with 20% O2, 19% O2 and 18% O2 were used as boundary conditions, which corresponds to conditions 2, 3 and 4 in Figures 10 and 11, respectively. The results were compared with the normal intake condition 1 (315 K, 21% O2). As shown in Figure 10, the compression pressure of conditions 2, 3 and 4 are higher than condition 1, which is consistent with Section 3.1.2. Moreover, low oxygen intake can effectively slow down the combustion pro-cess and reduce the maximum combustion pressure. The maximum combustion pressure is even lower than the one in condition 1.
Figure 10. Cylinder pressure comparison at low temperature and low oxygen.
Figure 11. Emission and power comparison at low temperature and low oxygen.
Figure 11 shows that the power output and NOx emission both decrease when the oxygen concentration changes from 20% O2 to 18% O2 at 295 K intake temperature, which is also consistent with the conclusion in Section 3.1.2. The engine’s power output in con-dition 2 is higher than the normal intake in condition 1, and its NOx emission is only 50% of that in condition 1. With the oxygen concentration further reduced to 18%, its NOx emission is only 3.41 g/kWh less than 3.44 g/kWh which is the requirement of IMO NOx emission Tier Ш. However, its power output has 12.5 kW lower than the normal intake condition. Therefore, when the intake temperature is 295 K and the O2 volume fraction is adjusted to about 18.5%, the engine’s NOx emission can be effectively reduced by 58% to 4.5 g/kWh, which is slightly higher than the emission of Tier Ш. Moreover, its power out-put remains unchanged with normal intake condition 1, as shown in position ‘a’ of the line in Figure 11. Therefore, the performance of the diesel engines can be effectively opti-mized by low temperature and low oxygen intake combination.
-5 0 5 10 15 20
Cyl
inde
r Pre
ssur
e (M
Pa)
Crank Angle (deg)
1 2 3 4
12
13
14
15
16
1 2 3 42
4
6
8
10
12
Soot Emission (g/kW
h)
CO
Emission (g/kW
h)Po
wer
(kW
)
NO
x Em
issi
on (g
/kW
h)
Crank Angle (deg)
a
2500
2510
2520
2530
2540
4.5
5.0
5.5
6.0
6.5
7.0
7.5
0.0
0.2
0.4
0.6
0.8
Power NOx CO Soot
Figure 11. Emission and power comparison at low temperature and low oxygen.
Figure 11 shows that the power output and NOx emission both decrease when theoxygen concentration changes from 20% O2 to 18% O2 at 295 K intake temperature, which isalso consistent with the conclusion in Section 3.1.2. The engine’s power output in condition2 is higher than the normal intake in condition 1, and its NOx emission is only 50% of that incondition 1. With the oxygen concentration further reduced to 18%, its NOx emission is only3.41 g/kWh less than 3.44 g/kWh which is the requirement of IMO NOx emission Tier III.However, its power output has 12.5 kW lower than the normal intake condition. Therefore,
Atmosphere 2022, 13, 355 11 of 13
when the intake temperature is 295 K and the O2 volume fraction is adjusted to about18.5%, the engine’s NOx emission can be effectively reduced by 58% to 4.5 g/kWh, which isslightly higher than the emission of Tier III. Moreover, its power output remains unchangedwith normal intake condition 1, as shown in position ‘a’ of the line in Figure 11. Therefore,the performance of the diesel engines can be effectively optimized by low temperature andlow oxygen intake combination.
3.3. Effects of Different Intake Components
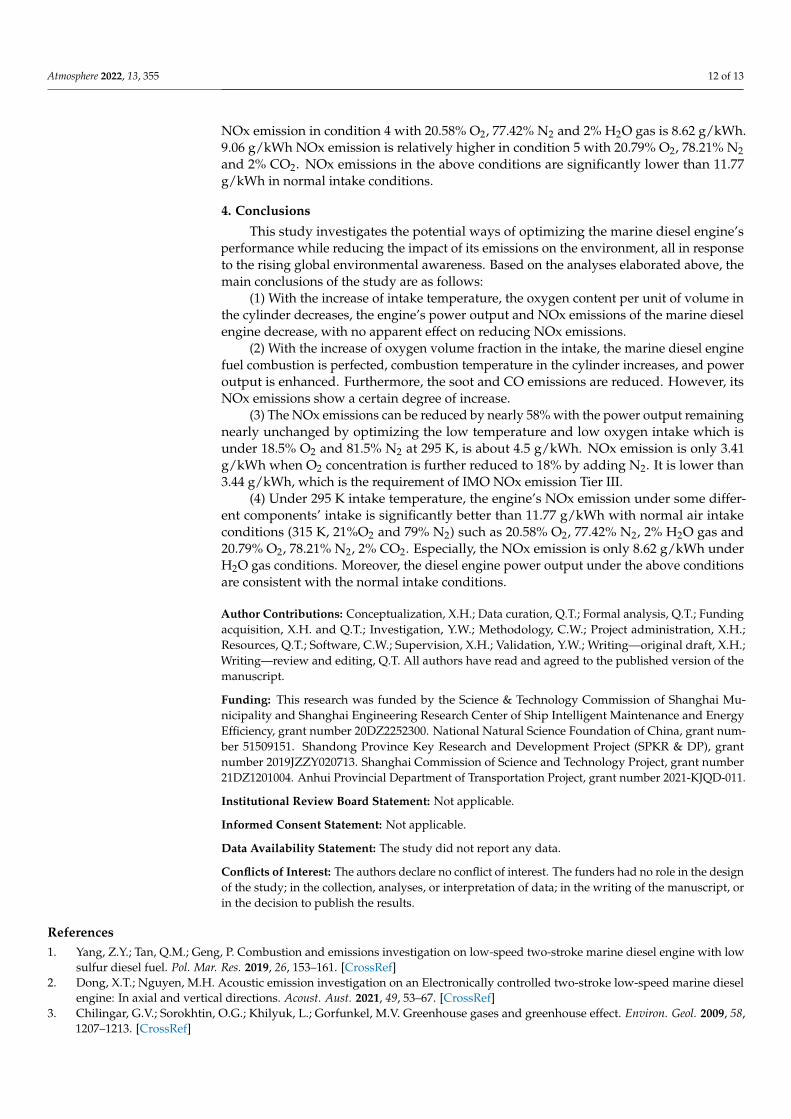
Based on the previous research results, the effects of different gas components on thediesel engine power output and emissions performance were explored via low temperatureand low oxygen. According to the characteristics of the marine diesel engine, it can recycleexhaust gas or directly add water steam from the boiler to dilute the oxygen concentrationin the intake air. Different proportions of CO2 or H2O gas into the intake were set in thecalculation model. The calculated power output and NOx emissions are shown in Figure 12,its conditions from 1 to 6 are as follows: 1 (295 K, 20% O2 and 78.8% N2), 2 (295 K, 20% O2and 79.4% N2), 3 (295 K, 20% O2 and 80% N2), 4 (295 K, 20.58% O2 and 77.42% N2), 5 (295K, 20.79% O2 and 78.21% N2), 6 (315 K, 21% O2 and 79% N2).
Atmosphere 2022, 13, x FOR PEER REVIEW 10 of 12
3.3. Effects of Different Intake Components Based on the previous research results, the effects of different gas components on the
diesel engine power output and emissions performance were explored via low tempera-ture and low oxygen. According to the characteristics of the marine diesel engine, it can recycle exhaust gas or directly add water steam from the boiler to dilute the oxygen con-centration in the intake air. Different proportions of CO2 or H2O gas into the intake were set in the calculation model. The calculated power output and NOx emissions are shown in Figure 12, its conditions from 1 to 6 are as follows: 1 (295 K, 20% O2 and 78.8% N2), 2 (295 K, 20% O2 and 79.4% N2), 3 (295 K, 20% O2 and 80% N2), 4 (295 K, 20.58% O2 and 77.42% N2), 5 (295 K, 20.79% O2 and 78.21% N2), 6 (315 K, 21% O2 and 79% N2).
1 2 3 4 5 6
2480
2490
2500
2510
2520
2530
2540
Pow
er (k
W)
Operating Conditions
NO
x Emission (g/kw
h)
6
7
8
9
10
11
12
Power-CO2
Power-H2O NOx-CO2
NOx-H2O
Figure 12. Comparison of power and emissions at different intake conditions.
As shown in Figure 12, when CO2 or H2O gas is added in the same proportion (other conditions remaining unchanged), the engine’s power output and NOx emission in CO2 conditions are both lower than those in H2O gas conditions, which is caused by the differ-ence in the thermal physical properties of CO2 or H2O gas. The heat absorption of the combustion process in the cylinder is different as well. The comparison between condi-tions 2 and 3 shows that nitrogen is replaced by 0.06% CO2 or H2O gas when oxygen con-centration is 20%. The engine’s power output and NOx emission are lower than pure O2 and N2 in condition 3 (2541 kW and 8.56 g/kWh), condition with H2O gas is 2529 kW and 8.13 g/kWh, and the lowest in the condition with CO2. In condition 2, replacing nitrogen in the intake with 0.06% CO2, the engine’s power output is 2511 kW, which is slightly higher than the power output of 2510 kW in the normal intake condition 6. However, its NOx emission is only 7.39 g/kWh, which is significantly lower than 11.77 g/kWh in the normal intake condition. Therefore, NOx emission can be reduced by reducing the intake temperature and the low oxygen intake combination optimization, while ensuring that the power output fluctuates only slightly.
According to the comparative analysis of conditions 4, 5 and 6 in Figure 12 with Fig-ure 11, there are some intake conditions (adding CO2, H2O gas or N2 to reduce O2 concen-tration at 295 K) which make the diesel engine output unchanged and NOx emissions reduced. Based on the studies carried out, it is confirmed that the 4.5 g/kWh NOx emission is the smallest, which is achieved by adding nitrogen to reduce O2 concentration to 18.5%. NOx emission in condition 4 with 20.58% O2, 77.42% N2 and 2% H2O gas is 8.62 g/kWh. 9.06 g/kWh NOx emission is relatively higher in condition 5 with 20.79% O2, 78.21% N2 and 2% CO2. NOx emissions in the above conditions are significantly lower than 11.77 g/kWh in normal intake conditions.
Figure 12. Comparison of power and emissions at different intake conditions.
As shown in Figure 12, when CO2 or H2O gas is added in the same proportion(other conditions remaining unchanged), the engine’s power output and NOx emissionin CO2 conditions are both lower than those in H2O gas conditions, which is caused bythe difference in the thermal physical properties of CO2 or H2O gas. The heat absorptionof the combustion process in the cylinder is different as well. The comparison betweenconditions 2 and 3 shows that nitrogen is replaced by 0.06% CO2 or H2O gas when oxygenconcentration is 20%. The engine’s power output and NOx emission are lower than pure O2and N2 in condition 3 (2541 kW and 8.56 g/kWh), condition with H2O gas is 2529 kW and8.13 g/kWh, and the lowest in the condition with CO2. In condition 2, replacing nitrogenin the intake with 0.06% CO2, the engine’s power output is 2511 kW, which is slightlyhigher than the power output of 2510 kW in the normal intake condition 6. However, itsNOx emission is only 7.39 g/kWh, which is significantly lower than 11.77 g/kWh in thenormal intake condition. Therefore, NOx emission can be reduced by reducing the intaketemperature and the low oxygen intake combination optimization, while ensuring that thepower output fluctuates only slightly.
According to the comparative analysis of conditions 4, 5 and 6 in Figure 12 withFigure 11, there are some intake conditions (adding CO2, H2O gas or N2 to reduce O2concentration at 295 K) which make the diesel engine output unchanged and NOx emissionsreduced. Based on the studies carried out, it is confirmed that the 4.5 g/kWh NOx emissionis the smallest, which is achieved by adding nitrogen to reduce O2 concentration to 18.5%.
Atmosphere 2022, 13, 355 12 of 13
NOx emission in condition 4 with 20.58% O2, 77.42% N2 and 2% H2O gas is 8.62 g/kWh.9.06 g/kWh NOx emission is relatively higher in condition 5 with 20.79% O2, 78.21% N2and 2% CO2. NOx emissions in the above conditions are significantly lower than 11.77g/kWh in normal intake conditions.
4. Conclusions
This study investigates the potential ways of optimizing the marine diesel engine’sperformance while reducing the impact of its emissions on the environment, all in responseto the rising global environmental awareness. Based on the analyses elaborated above, themain conclusions of the study are as follows:
(1) With the increase of intake temperature, the oxygen content per unit of volume inthe cylinder decreases, the engine’s power output and NOx emissions of the marine dieselengine decrease, with no apparent effect on reducing NOx emissions.
(2) With the increase of oxygen volume fraction in the intake, the marine diesel enginefuel combustion is perfected, combustion temperature in the cylinder increases, and poweroutput is enhanced. Furthermore, the soot and CO emissions are reduced. However, itsNOx emissions show a certain degree of increase.
(3) The NOx emissions can be reduced by nearly 58% with the power output remainingnearly unchanged by optimizing the low temperature and low oxygen intake which isunder 18.5% O2 and 81.5% N2 at 295 K, is about 4.5 g/kWh. NOx emission is only 3.41g/kWh when O2 concentration is further reduced to 18% by adding N2. It is lower than3.44 g/kWh, which is the requirement of IMO NOx emission Tier III.
(4) Under 295 K intake temperature, the engine’s NOx emission under some differ-ent components’ intake is significantly better than 11.77 g/kWh with normal air intakeconditions (315 K, 21%O2 and 79% N2) such as 20.58% O2, 77.42% N2, 2% H2O gas and20.79% O2, 78.21% N2, 2% CO2. Especially, the NOx emission is only 8.62 g/kWh underH2O gas conditions. Moreover, the diesel engine power output under the above conditionsare consistent with the normal intake conditions.
Author Contributions: Conceptualization, X.H.; Data curation, Q.T.; Formal analysis, Q.T.; Fundingacquisition, X.H. and Q.T.; Investigation, Y.W.; Methodology, C.W.; Project administration, X.H.;Resources, Q.T.; Software, C.W.; Supervision, X.H.; Validation, Y.W.; Writing—original draft, X.H.;Writing—review and editing, Q.T. All authors have read and agreed to the published version of themanuscript.
Funding: This research was funded by the Science & Technology Commission of Shanghai Mu-nicipality and Shanghai Engineering Research Center of Ship Intelligent Maintenance and EnergyEfficiency, grant number 20DZ2252300. National Natural Science Foundation of China, grant num-ber 51509151. Shandong Province Key Research and Development Project (SPKR & DP), grantnumber 2019JZZY020713. Shanghai Commission of Science and Technology Project, grant number21DZ1201004. Anhui Provincial Department of Transportation Project, grant number 2021-KJQD-011.
Institutional Review Board Statement: Not applicable.
Informed Consent Statement: Not applicable.
Data Availability Statement: The study did not report any data.
Conflicts of Interest: The authors declare no conflict of interest. The funders had no role in the designof the study; in the collection, analyses, or interpretation of data; in the writing of the manuscript, orin the decision to publish the results.
References1. Yang, Z.Y.; Tan, Q.M.; Geng, P. Combustion and emissions investigation on low-speed two-stroke marine diesel engine with low
sulfur diesel fuel. Pol. Mar. Res. 2019, 26, 153–161. [CrossRef]2. Dong, X.T.; Nguyen, M.H. Acoustic emission investigation on an Electronically controlled two-stroke low-speed marine diesel
engine: In axial and vertical directions. Acoust. Aust. 2021, 49, 53–67. [CrossRef]3. Chilingar, G.V.; Sorokhtin, O.G.; Khilyuk, L.; Gorfunkel, M.V. Greenhouse gases and greenhouse effect. Environ. Geol. 2009, 58,
1207–1213. [CrossRef]
Atmosphere 2022, 13, 355 13 of 13
4. Lalic, B.; Radica, G.; Racic, N. Analysis of exhaust gas emission in the marine two-stroke slow-speed diesel engine. Brodogradnja2016, 67, 17–35. [CrossRef]
5. Koenig, D. Global and regional approaches to ship air emissions regulation: The international maritime organization and theEuropean Union. MARTINUS NIJHOFF 2013, 31, 317–336.
6. Schinas, O.; Stefanakos, C.N. Selecting technologies towards compliance with MARPOL Annex VI: The perspective of operators.Emiss. Control Areas Impact Marit. Transp. 2014, 28, 28–40. [CrossRef]
7. Psaraftis, H.N. Market-based measures for greenhouse gas emissions from ships: A review. Wmu J. Marit. Aff. 2012, 11, 211–232.[CrossRef]
8. Gan, H.; Wang, H.; Tang, Y.; Wang, G. Investigation of the miller cycle on the performance and emission in a natural gas-dieseldual-fuel marine engine by using two zone combustion model. Therm. Sci. 2020, 30, 259–270. [CrossRef]
9. Li, B.; Gao, H.T. Numerical study on NOx emission reduction mechanism of HCCI marine diesel engine for IMO Tier III emissionlimits. Int. J. Marit. Eng. 2017, 159, 139–148. [CrossRef]
10. Pandian, M.; Murugesa Anand, K. Comparison of different low temperature combustion strategies in a light duty air cooleddiesel engine. Appl. Therm. Eng. 2018, 142, 380–390. [CrossRef]
11. Mei, D.; Zhao, X.; Wu, H.; Qian, J. Effects of Enriched Oxygen and Nitrogen Intake on Combustion Process and EmissionsFeatures in a Diesel Engine. J. Energy Eng. 2017, 143, 04016062. [CrossRef]
12. Tan, Q.; Hu, Y.; Zhang, X.; Zhang, H. A Study on the Combustion Performance of Diesel Engines with O2 and CO2 Suction. J.Chem. 2016, 1258314. [CrossRef]
13. Ajhar, M.; Follmann, M.; Matthias, C.; Melin, T. Membranes producing nitrogen-enriched combustion air in diesel engines:Assessment via dimensionless numbers. Appl. Therm. Eng. 2008, 323, 105–112. [CrossRef]
14. Wang, Z.G.; Zhou, S.; Feng, Y.M.; Zhu, Y.Q. Research of NOx reduction on a low-speed two-stoke marine diesel engine by usingEGR (exhaust gas recirculation)-CB (cylinder bypass) and EGB (exhaust gas bypass). Int. J. Hydrogen Energy 2017, 42, 19337–19345.[CrossRef]
15. Zhang, Z.; Zhao, C.; Wang, Y.; Sun, Y.; Zheng, Z. Effects of Intake Air Humidification on Combustion and Emissions in a MarineDiesel Engine. J. Combust. Sci. Technol. 2017, 23, 436–442.
16. Wu, H.; Fan, C.M.; He, J.Y.; Hsu, T. Optimal factors estimation for diesel/methanol engines changing methanol injection timingand inlet air temperature. Energy 2017, 141, 1819–1828. [CrossRef]
17. Kumar, K.S.; Raj, R.T.K. Effect of Fuel Injection Timing and Elevated Intake Air Temperature on the Combustion and EmissionCharacteristics of Dual Fuel operated Diesel Engine. Int. Conf. Des. Manuf. 2013, 64, 1191–1198. [CrossRef]
18. Zhu, S.; Gu, Y.; Yuan, H.; Ma, Z.; Deng, K. Thermodynamic analysis of the turbocharged marine two-stroke engine cycle withdifferent scavenging air control technologies. Energy 2020, 191, 116533. [CrossRef]
19. Pan, W.; Yao, C.; Han, G.; Wei, H.; Wang, Q. The impact of intake air temperature on performance and exhaust emissions of adiesel methanol dual fuel engine. Fuel 2015, 162, 101–110. [CrossRef]
20. Baskar, P.; Senthilkumar, A. Effects of oxygen enriched combustion on pollution and performance characteristics of a dieselengine. Eng. Sci. Technol. Int. J. 2016, 19, 438–443. [CrossRef]
21. Tan, Q.; Hu, Y.; Tan, Z. Study on Diesel Low-Nitrogen or Nitrogen-Free Combustion Performance in Constant Volume CombustionVessels and Contributory. Atmosphere 2021, 12, 923. [CrossRef]
22. He, T.; Chen, Z.; Zhu, L.; Zhang, Q. The influence of alcohol additives and EGR on the combustion and emission characteristics ofdiesel engine under high-load condition. Appl. Therm. Eng. 2018, 140, 363–372. [CrossRef]
23. Zhou, T.; Geng, P.; Lu, X. Numerical Simulation of Marine Diesel Engine Combustion and Emissions Using Intake Air Humidifi-cation at the Different Injection Timing. Combust. Sci. Technol. 2021. [CrossRef]
24. Lähde, T.; Rönkkö, T.; Virtanen, A.; Solla, A.; Kytö, M.; Söderström, C.; Keskinen, J. Dependence between nonvolatile nucleationmode particle and soot number concentrations in an EGR equipped heavy-duty diesel engine exhaust. Environ. Sci. Technol. 2010,44, 3175–3180. [CrossRef] [PubMed]
25. Zhu, H.; Bohac, S.V.; Nakashima, K.; Hagen, L.M.; Huang, Z.; Assanis, D.N. Effect of fuel oxygen on the trade-offs between soot,NOx and combustion efficiency in premixed low-temperature diesel engine combustion. Fuel 2013, 112, 459–465. [CrossRef]
26. Zhao, W.; Chen, Z.; Li, W.; Shu, G.; Xu, B.; Shen, Y. Influence of EGR and oxygen-enriched air on diesel engine NO-Smokeemission and combustion characteristic. Appl. Energy 2013, 107, 304–314.
27. Tan, Q.; Hu, Y. A study on the combustion and emission performance of diesel engines under different proportions of O2 & N2 &CO2. Appl. Therm. Eng. 2016, 108, 508–515.
28. Wang, K.; Zhao, C.; Cai, Y. Effect of Intake Air Humidification and EGR on Combustion and Emission Characteristics of MarineDiesel Engine at Advanced Injection Timing. J. Therm. Sci. 2021, 30, 1174–1186. [CrossRef]
29. Wu, H.; Hsu, T.; He, J.Y.; Fan, C.M. Optimal performance and emissions of diesel/hydrogen-rich gas engine varying intake airtemperature and EGR ratio. J. Ship Res. 2017, 124, 381–392. [CrossRef]
Copyright © 2022 FDOKUMEN