
Pattern recognition system for the discrimination of multiple sclerosis from cerebral...
6
Pattern recognition system for the discrimination of multiple sclerosis from cerebral microangiopathy lesions based on texture analysis of magnetic resonance images Pantelis Theocharakis a, ⁎ , Dimitris Glotsos b , Ioannis Kalatzis b , Spiros Kostopoulos a , Pantelis Georgiadis a , Koralia Sifaki c , Katerina Tsakouridou d , Menelaos Malamas d , George Delibasis c , Dionisis Cavouras b , George Nikiforidis a a Department of Medical Physics, Medical Image Processing and Analysis Laboratory, University of Patras, 26500 Rio-Patras, Greece b Department of Medical Instruments Technology, Technological Educational Institute of Athens, Aigaleo, 12210 Athens, Greece c Department of MRI, 251 General Airforce Hospital, 11525 Athens, Greece d Department of MRI, Medical Diagnostic Center of Athens, 12131 Athens, Greece Received 23 April 2008; revised 17 June 2008; accepted 24 July 2008 Abstract In this study, a pattern recognition system has been developed for the discrimination of multiple sclerosis (MS) from cerebral microangiopathy (CM) lesions based on computer-assisted texture analysis of magnetic resonance images. Twenty-three textural features were calculated from MS and CM regions of interest, delineated by experienced radiologists on fluid attenuated inversion recovery images and obtained from 11 patients diagnosed with clinically definite MS and from 18 patients diagnosed with clinically definite CM. The probabilistic neural network classifier was used to construct the proposed pattern recognition system and the generalization of the system to unseen data was evaluated using an external cross validation process. According to the findings of the present study, statistically significant differences exist in the values of the textural features between CM and MS: MS regions were darker, of higher contrast, less homogeneous and rougher as compared to CM. © 2009 Elsevier Inc. All rights reserved. Keywords: Multiple sclerosis; Cerebral microangiopathy; Probabilistic neural network; Differential diagnosis 1. Introduction Multiple sclerosis (MS) is a demyelinating disease of the central nervous system (CNS) which is characterized by a gradual loss of the myelin [1]. Its diagnosis is based primarily on clinical signs and symptoms; several para- clinical tests can help in its verification, while final decision is made by the neurologist. These tests include lumbar puncture, oligoclonal banding, visual and/or auditory evoked potentials, and magnetic resonance imaging (MRI) [2]. When the clinical signs and symptoms do not fulfill the diagnostic criteria of MS, MRI evaluation is needed in order to support dissemination in space and/or time [3]. The radiologist's diagnosis is based on MS imaging characteristics as depicted on MR images. These include ovoid and hyperintense lesions on T2-weighted (T2-w) and fluid attenuated inversion recovery (FLAIR) images, which occur predominantly in the white matter periven- tricular area. Other favored locations of MS plaques include the corpus callosum, the white matter around the temporal horns of the lateral ventricles, and the middle cerebellar peduncles [4,5]. Several pathologic conditions may produce similar MRI manifestations that can mimic MS, like cerebral micro- angiopathies (CM), which may produce T2-w or FLAIR hyperintensities resembling MS [6]. These hyperintensities Available online at www.sciencedirect.com Magnetic Resonance Imaging 27 (2009) 417 – 422 ⁎ Corresponding author. Medical Image Processing and Analysis (MIPA) Group, Department of Medical Physics, School of Medicine, University of Patras, 26500 Rio, Greece. Tel.: +302610997745. E-mail address: [email protected] (P. Theocharakis). URL: http://mipa.med.upatras.gr (P. Theocharakis). 0730-725X/$ – see front matter © 2009 Elsevier Inc. All rights reserved. doi:10.1016/j.mri.2008.07.014
Transcript of Pattern recognition system for the discrimination of multiple sclerosis from cerebral...
Available online at www.sciencedirect.com
Magnetic Resonance Imagi
ng 27 (2009) 417–422Pattern recognition system for the discrimination of multiple sclerosis fromcerebral microangiopathy lesions based on texture analysis of
magnetic resonance imagesPantelis Theocharakisa,⁎, Dimitris Glotsosb, Ioannis Kalatzisb, Spiros Kostopoulosa,Pantelis Georgiadisa, Koralia Sifakic, Katerina Tsakouridoud, Menelaos Malamasd,
George Delibasisc, Dionisis Cavourasb, George NikiforidisaaDepartment of Medical Physics, Medical Image Processing and Analysis Laboratory, University of Patras, 26500 Rio-Patras, Greece
bDepartment of Medical Instruments Technology, Technological Educational Institute of Athens, Aigaleo, 12210 Athens, GreececDepartment of MRI, 251 General Airforce Hospital, 11525 Athens, Greece
dDepartment of MRI, Medical Diagnostic Center of Athens, 12131 Athens, Greece
Received 23 April 2008; revised 17 June 2008; accepted 24 July 2008
Abstract
In this study, a pattern recognition system has been developed for the discrimination of multiple sclerosis (MS) from cerebralmicroangiopathy (CM) lesions based on computer-assisted texture analysis of magnetic resonance images. Twenty-three textural featureswere calculated from MS and CM regions of interest, delineated by experienced radiologists on fluid attenuated inversion recovery imagesand obtained from 11 patients diagnosed with clinically definite MS and from 18 patients diagnosed with clinically definite CM. Theprobabilistic neural network classifier was used to construct the proposed pattern recognition system and the generalization of the system tounseen data was evaluated using an external cross validation process. According to the findings of the present study, statistically significantdifferences exist in the values of the textural features between CM and MS: MS regions were darker, of higher contrast, less homogeneousand rougher as compared to CM.© 2009 Elsevier Inc. All rights reserved.
Keywords: Multiple sclerosis; Cerebral microangiopathy; Probabilistic neural network; Differential diagnosis
1. Introduction
Multiple sclerosis (MS) is a demyelinating disease of thecentral nervous system (CNS) which is characterized by agradual loss of the myelin [1]. Its diagnosis is basedprimarily on clinical signs and symptoms; several para-clinical tests can help in its verification, while final decisionis made by the neurologist. These tests include lumbarpuncture, oligoclonal banding, visual and/or auditory evokedpotentials, and magnetic resonance imaging (MRI) [2].
⁎ Corresponding author. Medical Image Processing and Analysis(MIPA) Group, Department of Medical Physics, School of Medicine,University of Patras, 26500 Rio, Greece. Tel.: +302610997745.
E-mail address: [email protected] (P. Theocharakis).URL: http://mipa.med.upatras.gr (P. Theocharakis).
0730-725X/$ – see front matter © 2009 Elsevier Inc. All rights reserved.doi:10.1016/j.mri.2008.07.014
When the clinical signs and symptoms do not fulfillthe diagnostic criteria of MS, MRI evaluation is needed inorder to support dissemination in space and/or time [3].The radiologist's diagnosis is based on MS imagingcharacteristics as depicted on MR images. These includeovoid and hyperintense lesions on T2-weighted (T2-w)and fluid attenuated inversion recovery (FLAIR) images,which occur predominantly in the white matter periven-tricular area. Other favored locations of MS plaquesinclude the corpus callosum, the white matter around thetemporal horns of the lateral ventricles, and the middlecerebellar peduncles [4,5].
Several pathologic conditions may produce similar MRImanifestations that can mimic MS, like cerebral micro-angiopathies (CM), which may produce T2-w or FLAIRhyperintensities resembling MS [6]. These hyperintensities
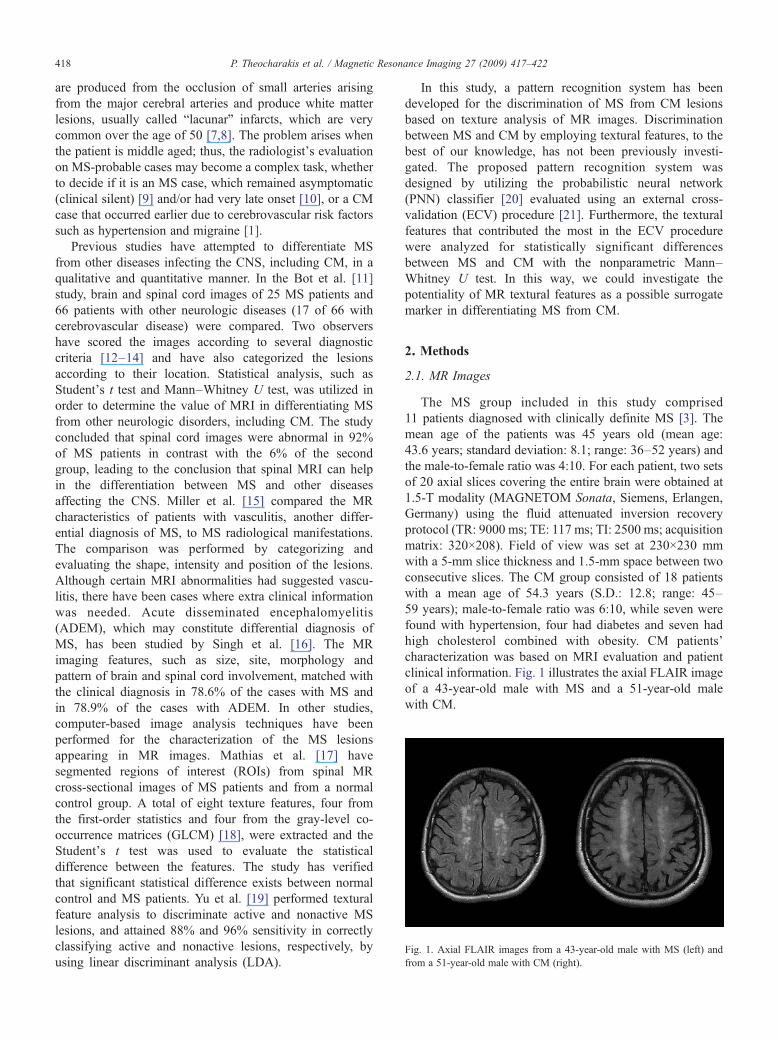
Fig. 1. Axial FLAIR images from a 43-year-old male with MS (left) andfrom a 51-year-old male with CM (right).
418 P. Theocharakis et al. / Magnetic Resonance Imaging 27 (2009) 417–422
are produced from the occlusion of small arteries arisingfrom the major cerebral arteries and produce white matterlesions, usually called “lacunar” infarcts, which are verycommon over the age of 50 [7,8]. The problem arises whenthe patient is middle aged; thus, the radiologist's evaluationon MS-probable cases may become a complex task, whetherto decide if it is an MS case, which remained asymptomatic(clinical silent) [9] and/or had very late onset [10], or a CMcase that occurred earlier due to cerebrovascular risk factorssuch as hypertension and migraine [1].
Previous studies have attempted to differentiate MSfrom other diseases infecting the CNS, including CM, in aqualitative and quantitative manner. In the Bot et al. [11]study, brain and spinal cord images of 25 MS patients and66 patients with other neurologic diseases (17 of 66 withcerebrovascular disease) were compared. Two observershave scored the images according to several diagnosticcriteria [12–14] and have also categorized the lesionsaccording to their location. Statistical analysis, such asStudent's t test and Mann–Whitney U test, was utilized inorder to determine the value of MRI in differentiating MSfrom other neurologic disorders, including CM. The studyconcluded that spinal cord images were abnormal in 92%of MS patients in contrast with the 6% of the secondgroup, leading to the conclusion that spinal MRI can helpin the differentiation between MS and other diseasesaffecting the CNS. Miller et al. [15] compared the MRcharacteristics of patients with vasculitis, another differ-ential diagnosis of MS, to MS radiological manifestations.The comparison was performed by categorizing andevaluating the shape, intensity and position of the lesions.Although certain MRI abnormalities had suggested vascu-litis, there have been cases where extra clinical informationwas needed. Acute disseminated encephalomyelitis(ADEM), which may constitute differential diagnosis ofMS, has been studied by Singh et al. [16]. The MRimaging features, such as size, site, morphology andpattern of brain and spinal cord involvement, matched withthe clinical diagnosis in 78.6% of the cases with MS andin 78.9% of the cases with ADEM. In other studies,computer-based image analysis techniques have beenperformed for the characterization of the MS lesionsappearing in MR images. Mathias et al. [17] havesegmented regions of interest (ROIs) from spinal MRcross-sectional images of MS patients and from a normalcontrol group. A total of eight texture features, four fromthe first-order statistics and four from the gray-level co-occurrence matrices (GLCM) [18], were extracted and theStudent's t test was used to evaluate the statisticaldifference between the features. The study has verifiedthat significant statistical difference exists between normalcontrol and MS patients. Yu et al. [19] performed texturalfeature analysis to discriminate active and nonactive MSlesions, and attained 88% and 96% sensitivity in correctlyclassifying active and nonactive lesions, respectively, byusing linear discriminant analysis (LDA).
In this study, a pattern recognition system has beendeveloped for the discrimination of MS from CM lesionsbased on texture analysis of MR images. Discriminationbetween MS and CM by employing textural features, to thebest of our knowledge, has not been previously investi-gated. The proposed pattern recognition system wasdesigned by utilizing the probabilistic neural network(PNN) classifier [20] evaluated using an external cross-validation (ECV) procedure [21]. Furthermore, the texturalfeatures that contributed the most in the ECV procedurewere analyzed for statistically significant differencesbetween MS and CM with the nonparametric Mann–Whitney U test. In this way, we could investigate thepotentiality of MR textural features as a possible surrogatemarker in differentiating MS from CM.
2. Methods
2.1. MR Images
The MS group included in this study comprised11 patients diagnosed with clinically definite MS [3]. Themean age of the patients was 45 years old (mean age:43.6 years; standard deviation: 8.1; range: 36–52 years) andthe male-to-female ratio was 4:10. For each patient, two setsof 20 axial slices covering the entire brain were obtained at1.5-T modality (MAGNETOM Sonata, Siemens, Erlangen,Germany) using the fluid attenuated inversion recoveryprotocol (TR: 9000 ms; TE: 117 ms; TI: 2500 ms; acquisitionmatrix: 320×208). Field of view was set at 230×230 mmwith a 5-mm slice thickness and 1.5-mm space between twoconsecutive slices. The CM group consisted of 18 patientswith a mean age of 54.3 years (S.D.: 12.8; range: 45–59 years); male-to-female ratio was 6:10, while seven werefound with hypertension, four had diabetes and seven hadhigh cholesterol combined with obesity. CM patients'characterization was based on MRI evaluation and patientclinical information. Fig. 1 illustrates the axial FLAIR imageof a 43-year-old male with MS and a 51-year-old malewith CM.

Table 1Results using the LDA, MD, LR and PNN classifiers
MS CM Accuracy (%
LDA Best features: sum of entropy,difference of variance
MS 24 7 77.41CM 6 41 87.23
Overall accuracy 83.33MD Best features: sum of variance,
S.D.MS 25 6 80.64CM 6 41 87.23
Overall accuracy 84.61LR Best features: sum of variance,
entropy, inverse moment correlationMS 22 9 70.96CM 4 43 91.48
Overall accuracy 83.33PNN Best features: mean value,
sum of variance, runlength nonuniformity
MS 27 4 87.09CM 5 42 89.36
Overall accuracy 88.46
419P. Theocharakis et al. / Magnetic Resonance Imaging 27 (2009) 417–422
2.2. Region of interest and feature extraction
Three expert radiologists (KT, MM and GD) and aradiographer (KS) were asked to specify in consensus ROIswhich included MS or CM lesions, resulting in 47 CM and31 MS ROIs, using a custom-developed software. Thecriteria regarding the ROI selection were as follows: (1) fromeach lesion only one ROI was selected, (2) each selected ROIwas through the slice with the largest lesion diameter, (3)only lesions larger than 5 mm in diameter were used and (4)clustered lesions in a patient were excluded (i.e., onlysingular lesions were considered). From each ROI, a series of23 textural features were extracted, four features from theROI's histogram, 14 from the co-occurrence matrices(GLCM) [18] and five from the run-length matrices [22].All features were normalized to zero mean and unit standarddeviation [23], according to Eq. (1)
xVi ¼ xi � mstd
ð1Þ
where xi and xi' are the ith feature values before and after thenormalization, respectively, and m and std are the meanvalue and standard deviation, respectively, of feature xi overall features and both groups (classes).
2.3. Pattern recognition scheme and statistics
The whole image analysis work was based on processingand analysis of image ROIs. In order to evaluate thediscriminatory power of the textural features calculated fromMS and CM ROIs, the minimum distance (MD) [23], theLDA [24], the logistic regression (LR) [24] and the PNN [20]classifiers were employed.
A description of the PNN is given below, since it wasadopted for the design of the system. The PNN is anonparametric feed-forward neural network classifier withthe discriminant function given in Eq. (2).
gi xð Þ ¼ 1
2pð Þd=2rd1Ni
XNi
j¼1
exp � x� xij� �T
x� xij� �
2r2
" #ð2Þ
The feature vector to be classified is x, xij is the trainingfeature vector (a number of appropriately selected featuresrepresenting each ROI) used to design the PNN classifier, σis the spread of the Gaussian activation function, Ni is thenumber of training feature vectors (or patterns) in class i andd is the dimensionality of the feature vectors.
Subsequently, since the leave-one-out method has beenproven to provoke optimistically biased estimates of theclassifier's performance, the accuracy of the PNN classifierwas evaluated using an ECV process for more reliableestimates as described in Ref. [21]. According to the ECV,the data were randomly split into two main subsets: a trainingsubset comprising two thirds (52 feature vectors) of availableROI samples (training data) and a test subset consisting ofthe remaining one third (26 feature vectors) of available ROI
samples (test data). The training data were used for featureselection and for training of the PNN classifier using theexhaustive search and the leave-one-out methods [23].Following feature selection and PNN design, the perfor-mance of the PNN classifier was then evaluated on theremaining test data. In this way, the dataset involved in theselection of best features and the dataset used in theevaluation differed; thus, any bias was avoided. This processwas repeated 10 times for 10 different random splits of allavailable samples into training and test data. The averageaccuracies were computed. In this way, the ECV estimate ofthe classifiers' performance was determined. ECV providesone of the most unbiased estimators of the generalizationerror, and in order to mark out this attribute, the system wasalso validated without the ECV but employing the leave-one-out method alone.
The features that contributed the most in the ECV werechecked for significant differences by the Mann–WhitneyU test [25]. In this way, the existence of any statisticallysignificant differences was evaluated in order to be able toassess textural differences between MS and CM, andprobably account for their contribution in the differentialdiagnosis of MS from CM.
3. Results
With the use of the leave-one-out method, best overallaccuracy (88.46%) in discriminating MS from CM lesionswas attained by the PNN classifier. The rate of correctidentification was 87.09% (27/31) for MS lesions and89.36% (42/47) for CM lesions. The LDA, MD and LRclassifiers resulted in inferior performances as can be seenin Table 1. Specific (MS and CM) and overall classificationaccuracies for all classifiers are shown in Fig. 2.Considering patient classification, 9 of 11 MS cases and14 of 18 CM cases were correctly classified, where correctcase classification was considered only if all ROIs of thecase were correctly classified. Employing the correlationcoefficient, we found that between image ROIs of the same
)
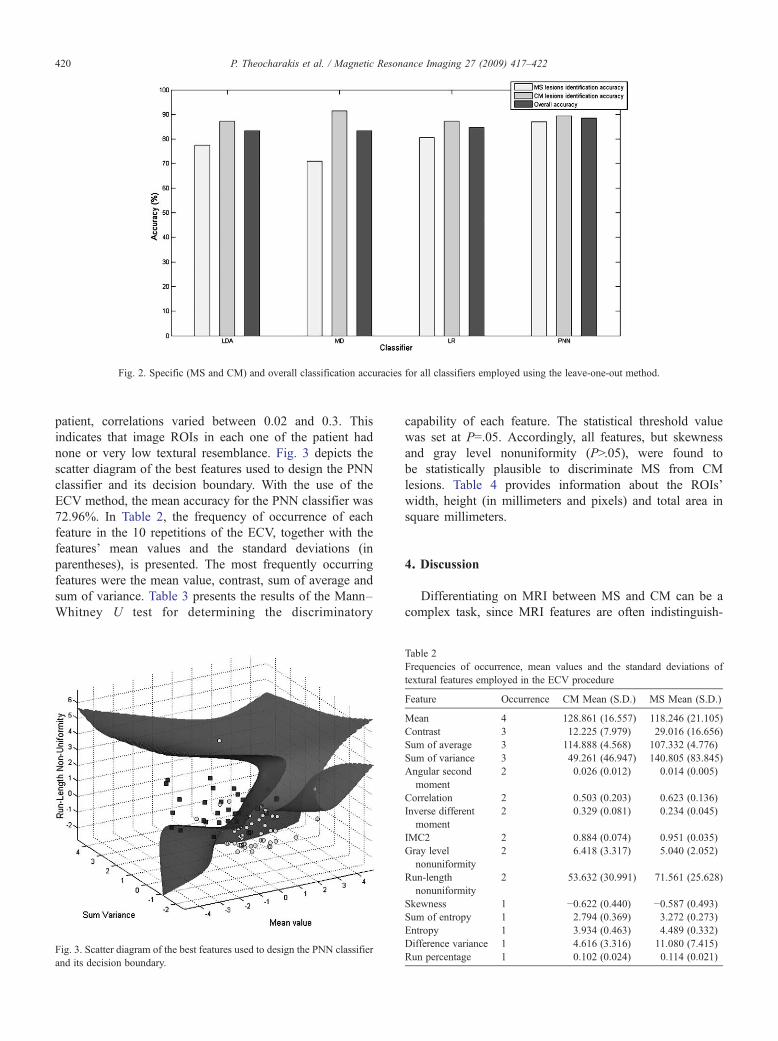
Fig. 2. Specific (MS and CM) and overall classification accuracies for all classifiers employed using the leave-one-out method.
420 P. Theocharakis et al. / Magnetic Resonance Imaging 27 (2009) 417–422
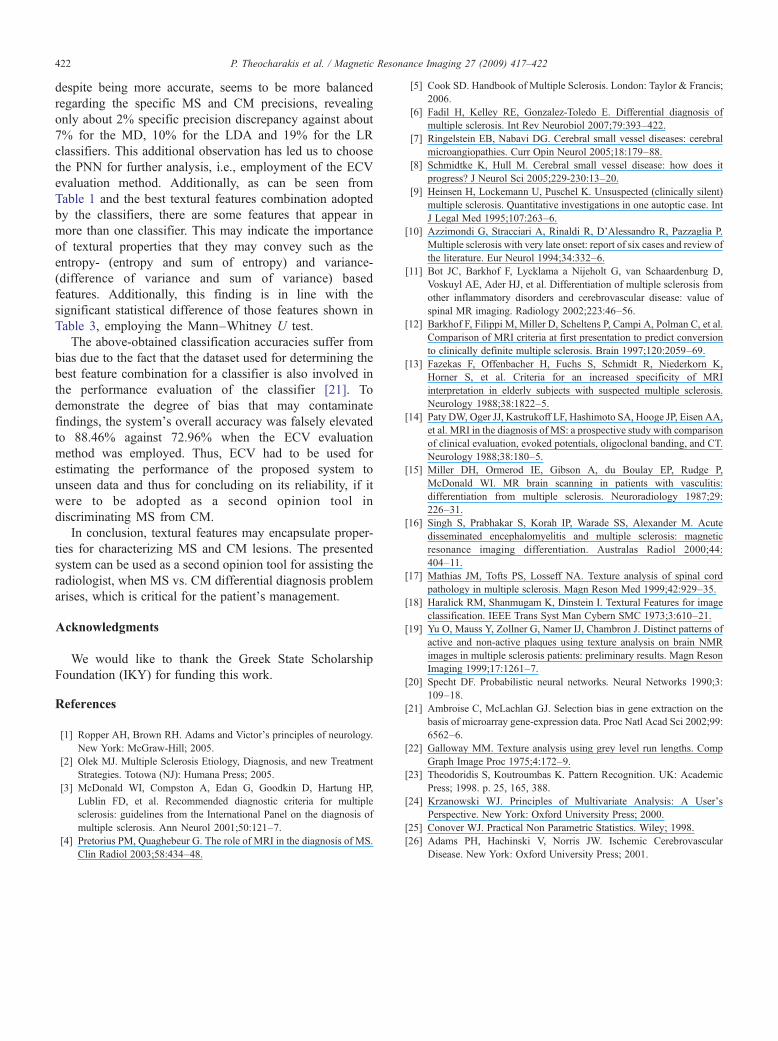
patient, correlations varied between 0.02 and 0.3. Thisindicates that image ROIs in each one of the patient hadnone or very low textural resemblance. Fig. 3 depicts thescatter diagram of the best features used to design the PNNclassifier and its decision boundary. With the use of theECV method, the mean accuracy for the PNN classifier was72.96%. In Table 2, the frequency of occurrence of eachfeature in the 10 repetitions of the ECV, together with thefeatures' mean values and the standard deviations (inparentheses), is presented. The most frequently occurringfeatures were the mean value, contrast, sum of average andsum of variance. Table 3 presents the results of the Mann–Whitney U test for determining the discriminatory
Fig. 3. Scatter diagram of the best features used to design the PNN classifieand its decision boundary.
Table 2Frequencies of occurrence, mean values and the standard deviations oftextural features employed in the ECV procedure
Feature Occurrence CM Mean (S.D.) MS Mean (S.D.)
Mean 4 128.861 (16.557) 118.246 (21.105)Contrast 3 12.225 (7.979) 29.016 (16.656)Sum of average 3 114.888 (4.568) 107.332 (4.776)Sum of variance 3 49.261 (46.947) 140.805 (83.845)Angular second
moment2 0.026 (0.012) 0.014 (0.005)
Correlation 2 0.503 (0.203) 0.623 (0.136)Inverse different
moment2 0.329 (0.081) 0.234 (0.045)
IMC2 2 0.884 (0.074) 0.951 (0.035)Gray level
nonuniformity2 6.418 (3.317) 5.040 (2.052)
Run-lengthnonuniformity
2 53.632 (30.991) 71.561 (25.628)
Skewness 1 −0.622 (0.440) −0.587 (0.493)Sum of entropy 1 2.794 (0.369) 3.272 (0.273)Entropy 1 3.934 (0.463) 4.489 (0.332)Difference variance 1 4.616 (3.316) 11.080 (7.415)Run percentage 1 0.102 (0.024) 0.114 (0.021)
r
capability of each feature. The statistical threshold valuewas set at P=.05. Accordingly, all features, but skewnessand gray level nonuniformity (PN.05), were found tobe statistically plausible to discriminate MS from CMlesions. Table 4 provides information about the ROIs'width, height (in millimeters and pixels) and total area insquare millimeters.
4. Discussion
Differentiating on MRI between MS and CM can be acomplex task, since MRI features are often indistinguish-

Table 3Statistical analysis of the contributing features (significance level seat P=.05)
Feature U value z Value P value Significandifference
Mean 974 2.506 .012 YesSkewness 777 0.495 .620 NoAngular second moment 1245 5.273 1.34E−07 YesContrast 1263 5.457 4.83E−08 YesCorrelation 982 2.588 .009 YesInverse different moment 1252 5.345 9.03E−08 YesSum of average 1283 5.661 1.50E−08 YesSum of variance 1248 5.304 1.13E−07 YesSum of entropy 1243 5.253 1.49E−07 YesEntropy 1221 5.028 4.94E−07 YesDifference of variance 1251 5.334 9.56E−08 YesIMC2 1186 4.671 2.99E−06 YesGray-level nonuniformity 917 1.924 .0544 NoRun-length nonuniformity 1060 3.384 .0007 YesRun percentage 970 2.465 .013 Yes
Table 4MS and CM ROI sizes: mean value (S.D.)
Width
In pixels In millimeters
MS 13.546 (2.276) 9.736 (1.636)CM 12.334 (1.974) 8.865 (1.419)
421P. Theocharakis et al. / Magnetic Resonance Imaging 27 (2009) 417–422
t
t
able and management of patients with MS differs from thatfollowed in patients with CM [5,26]. Additionally, employ-ment of textural features on MRI has been previously usedin differentiating between MS patients and normal controls[17] and between patients with active and nonactive MSlesions [19]. Results obtained have indicated existingtextural differences, and their findings are comparable inaccuracy to ours. They have found classification accuraciesof 96% for nonactive and 88% for active MS lesions, whilein our study best classification accuracy for nonactive MSlesions was about 87.09% as shown in Table 1. However, ithas to be pointed out that the results in Ref. [19] have beenobtained using different classification algorithms to oursand discrimination accuracies in the said study [19] wereachieved by differentiating partly different types of lesionsto ours (active MS vs. non active MS against nonactive MSvs. CM lesions, respectively).
In most previous studies [11,15,16], assessment of MSlesions' nature and corresponding differential diagnosishave been performed by visual evaluation of the lesion'sfeatures such as size, site, morphology and spinal cordinvolvement. Only in Ref. [17] has an attempt been madeto assess the lesion's texture by computer methods. Suchanalysis may be of value since pixel values, pixelinterrelations and lesion texture may be more accuratelyanalyzed by computer methods than they can be visuallyestimated. According to the findings of the present study,there exist significant differences in the values of thetextural features between CM and MS (Table 3).
Hei
In p
11.214.6
Those textural features might encode meaningful inter-pretations regarding the clinical context of MS and CM. Themean value is an index that intuitively shows the brightnessof each ROI. As can be seen from Table 2, MS ROIs are lessbright than CM ROIs. Another important textural feature iscontrast, which is a measure of local variation between pixelintensities. MS regions had higher contrast values than CMregions. Angular second moment (ASM) and inversedifferent moment (IDF) are both related to ROI's homo-geneity [18]. In CM regions, ASM and IDF had highervalues than in MS regions, implying that CM regions weresmoother (more homogeneous). From another perspective,MS ROIs attained higher entropy and sum of entropy valuesthan CM ROIs, indicating that the degree of randomness ofpixel intensities or textural roughness in MS regions washigher. Conclusively, MS regions were darker, of highercontrast, less homogeneous and rougher as compared to CM.These findings are in agreement with observations byMathias et al. [17] regarding MS lesions. The latter werefound with increased entropy and decreased angular secondmoment, implying that MS lesion texture was rough and oflow homogeneity. This loss of homogeneity in MS may beattributed to a number of processes such gliosis, inflamma-tion, demyelination and changes in water content that maydisrupt MR signal intensity uniformity [17].
The computer-based approach we followed consisted ofa PNN classifier and the ECV method for eliminating biasin the classifier's performance [21]. For the selection of thePNN, we followed a trial-and-error procedure, whereby thecommonly employed MD, LDA and LR classifiers werefirst tested, since they are “standard textbook” techniquesin many pattern-recognition applications [23]. Moreover,the LDA classifier has also been used for MS textureanalysis on MR images in a previous study [19]. Byapplying those classifiers on the same dataset of thepresent study, it was found that their classificationaccuracies (84.61%, 83.33%, 83.33%, respectively) werelower than that of the PNN (88.46%), employing forcomparative evaluation purposes the leave-one-out andexhaustive search methods (see Table 1). Fig. 3 shows a3-D scatter diagram and the PNN's decision boundary forthe best textural features used. As it may be seen, depictedpoints represent specific lesions and form two clusterscorresponding to the MS (square points) and CM (circularpoints) classes. These classes are adequately separated bythe PNNs' nonlinear surface. Additionally, as can beobserved from Table 1 and Fig. 2 regarding specific (MSand CM) and overall classification accuracies, the PNN,
ght Area
ixels In millimeters Square millimeters
26 (2.880) 8.069 (2.070) 52.794 (17.681)53 (3.322) 10.532 (2.388) 44.328 (18.456)
422 P. Theocharakis et al. / Magnetic Resonance Imaging 27 (2009) 417–422
despite being more accurate, seems to be more balancedregarding the specific MS and CM precisions, revealingonly about 2% specific precision discrepancy against about7% for the MD, 10% for the LDA and 19% for the LRclassifiers. This additional observation has led us to choosethe PNN for further analysis, i.e., employment of the ECVevaluation method. Additionally, as can be seen fromTable 1 and the best textural features combination adoptedby the classifiers, there are some features that appear inmore than one classifier. This may indicate the importanceof textural properties that they may convey such as theentropy- (entropy and sum of entropy) and variance-(difference of variance and sum of variance) basedfeatures. Additionally, this finding is in line with thesignificant statistical difference of those features shown inTable 3, employing the Mann–Whitney U test.
The above-obtained classification accuracies suffer frombias due to the fact that the dataset used for determining thebest feature combination for a classifier is also involved inthe performance evaluation of the classifier [21]. Todemonstrate the degree of bias that may contaminatefindings, the system's overall accuracy was falsely elevatedto 88.46% against 72.96% when the ECV evaluationmethod was employed. Thus, ECV had to be used forestimating the performance of the proposed system tounseen data and thus for concluding on its reliability, if itwere to be adopted as a second opinion tool indiscriminating MS from CM.
In conclusion, textural features may encapsulate proper-ties for characterizing MS and CM lesions. The presentedsystem can be used as a second opinion tool for assisting theradiologist, when MS vs. CM differential diagnosis problemarises, which is critical for the patient's management.
Acknowledgments
We would like to thank the Greek State ScholarshipFoundation (IKY) for funding this work.
References
[1] Ropper AH, Brown RH. Adams and Victor's principles of neurology.New York: McGraw-Hill; 2005.
[2] Olek MJ. Multiple Sclerosis Etiology, Diagnosis, and new TreatmentStrategies. Totowa (NJ): Humana Press; 2005.
[3] McDonald WI, Compston A, Edan G, Goodkin D, Hartung HP,Lublin FD, et al. Recommended diagnostic criteria for multiplesclerosis: guidelines from the International Panel on the diagnosis ofmultiple sclerosis. Ann Neurol 2001;50:121–7.
[4] Pretorius PM, Quaghebeur G. The role of MRI in the diagnosis of MS.Clin Radiol 2003;58:434–48.
[5] Cook SD. Handbook of Multiple Sclerosis. London: Taylor & Francis;2006.
[6] Fadil H, Kelley RE, Gonzalez-Toledo E. Differential diagnosis ofmultiple sclerosis. Int Rev Neurobiol 2007;79:393–422.
[7] Ringelstein EB, Nabavi DG. Cerebral small vessel diseases: cerebralmicroangiopathies. Curr Opin Neurol 2005;18:179–88.
[8] Schmidtke K, Hull M. Cerebral small vessel disease: how does itprogress? J Neurol Sci 2005;229-230:13–20.
[9] Heinsen H, Lockemann U, Puschel K. Unsuspected (clinically silent)multiple sclerosis. Quantitative investigations in one autoptic case. IntJ Legal Med 1995;107:263–6.
[10] Azzimondi G, Stracciari A, Rinaldi R, D'Alessandro R, Pazzaglia P.Multiple sclerosis with very late onset: report of six cases and review ofthe literature. Eur Neurol 1994;34:332–6.
[11] Bot JC, Barkhof F, Lycklama a Nijeholt G, van Schaardenburg D,Voskuyl AE, Ader HJ, et al. Differentiation of multiple sclerosis fromother inflammatory disorders and cerebrovascular disease: value ofspinal MR imaging. Radiology 2002;223:46–56.
[12] Barkhof F, Filippi M, Miller D, Scheltens P, Campi A, Polman C, et al.Comparison of MRI criteria at first presentation to predict conversionto clinically definite multiple sclerosis. Brain 1997;120:2059–69.
[13] Fazekas F, Offenbacher H, Fuchs S, Schmidt R, Niederkorn K,Horner S, et al. Criteria for an increased specificity of MRIinterpretation in elderly subjects with suspected multiple sclerosis.Neurology 1988;38:1822–5.
[14] Paty DW, Oger JJ, Kastrukoff LF, Hashimoto SA, Hooge JP, Eisen AA,et al. MRI in the diagnosis of MS: a prospective study with comparisonof clinical evaluation, evoked potentials, oligoclonal banding, and CT.Neurology 1988;38:180–5.
[15] Miller DH, Ormerod IE, Gibson A, du Boulay EP, Rudge P,McDonald WI. MR brain scanning in patients with vasculitis:differentiation from multiple sclerosis. Neuroradiology 1987;29:226–31.
[16] Singh S, Prabhakar S, Korah IP, Warade SS, Alexander M. Acutedisseminated encephalomyelitis and multiple sclerosis: magneticresonance imaging differentiation. Australas Radiol 2000;44:404–11.
[17] Mathias JM, Tofts PS, Losseff NA. Texture analysis of spinal cordpathology in multiple sclerosis. Magn Reson Med 1999;42:929–35.
[18] Haralick RM, Shanmugam K, Dinstein I. Textural Features for imageclassification. IEEE Trans Syst Man Cybern SMC 1973;3:610–21.
[19] Yu O, Mauss Y, Zollner G, Namer IJ, Chambron J. Distinct patterns ofactive and non-active plaques using texture analysis on brain NMRimages in multiple sclerosis patients: preliminary results. Magn ResonImaging 1999;17:1261–7.
[20] Specht DF. Probabilistic neural networks. Neural Networks 1990;3:109–18.
[21] Ambroise C, McLachlan GJ. Selection bias in gene extraction on thebasis of microarray gene-expression data. Proc Natl Acad Sci 2002;99:6562–6.
[22] Galloway MM. Texture analysis using grey level run lengths. CompGraph Image Proc 1975;4:172–9.
[23] Theodoridis S, Koutroumbas K. Pattern Recognition. UK: AcademicPress; 1998. p. 25, 165, 388.
[24] Krzanowski WJ. Principles of Multivariate Analysis: A User'sPerspective. New York: Oxford University Press; 2000.
[25] Conover WJ. Practical Non Parametric Statistics. Wiley; 1998.[26] Adams PH, Hachinski V, Norris JW. Ischemic Cerebrovascular
Disease. New York: Oxford University Press; 2001.