Numerical Analysis of Multifunctional Biosensor with ... - MDPI
11
Citation: Lv, J.; Wang, F.; Hu, C.; Yang, L.; Fu, H.; Zeng, Y.; Chu, P.K.; Liu, C. Numerical Analysis of Multifunctional Biosensor with Dual-Channel Photonic Crystal Fibers Based on Localized Surface Plasmon Resonance. Coatings 2022, 12, 742. https://doi.org/10.3390/ coatings12060742 Academic Editor: You Seung Rim Received: 22 April 2022 Accepted: 20 May 2022 Published: 28 May 2022 Publisher’s Note: MDPI stays neutral with regard to jurisdictional claims in published maps and institutional affil- iations. Copyright: © 2022 by the authors. Licensee MDPI, Basel, Switzerland. This article is an open access article distributed under the terms and conditions of the Creative Commons Attribution (CC BY) license (https:// creativecommons.org/licenses/by/ 4.0/). coatings Article Numerical Analysis of Multifunctional Biosensor with Dual-Channel Photonic Crystal Fibers Based on Localized Surface Plasmon Resonance Jingwei Lv 1 , Famei Wang 1 , Chunjie Hu 2 , Lin Yang 1 , Haihao Fu 1 , Yanshu Zeng 1 , Paul K. Chu 3,4,5 and Chao Liu 1, * 1 School of Physics and Electronic Engineering, Northeast Petroleum University, Daqing 163318, China; [email protected] (J.L.); [email protected] (F.W.); [email protected] (L.Y.); [email protected] (H.F.); [email protected] (Y.Z.) 2 Department of Gynaecology and Obstetrics, The Fourth Affiliated Hospital of Harbin Medical University, Harbin 150001, China; [email protected] 3 Department of Physics, City University of Hong Kong, Tat Chee Avenue, Hong Kong 999077, China; [email protected] 4 Department of Materials Science and Engineering, City University of Hong Kong, Tat Chee Avenue, Hong Kong 999077, China 5 Department of Biomedical Engineering, City University of Hong Kong, Tat Chee Avenue, Hong Kong 999077, China * Correspondence: [email protected] Abstract: A multifunctional biosensor composed of a dual-channel photonic crystal fiber (PCF) based on localized surface plasmon resonance (LSPR) is presented to measure dynamic changes in the magnetic field, temperature, and analyte refractive index at mid-infrared wavelengths. The finite-element method (FEM) is used to model and determine the sensing properties of the sensor. The flat dual-channel surface is coated with a gold film, and two nanowires are put on the fan- shaped openings to create directional resonance coupling to detect the analyte refractive index and temperature. By utilizing that the refractive index (RI) of the filled magnetic fluid (MF) is sensitive to the external magnetic field and temperature, a sensor with multi-physical detection functions is obtained. For refractive indexes ranging from 1.47 to 1.52, the maximum sensitivity is as high as 31,000 nm/RIU, with a resolution of 3.22 × 10 -6 RIU. The maximum sensitivities for the magnetic field and temperature are 1970 pm/Oe and -5500 pm/ ◦ C, respectively. Keywords: multifunctional biosensor; PCF-LSPR; magnetic fluid; mid-infrared wavelengths; finite element method 1. Introduction Biosensing is a topic of extensive investigation, suggesting a broad range of possible applications, such as molecular biology, biomedicine, and drug discovery [1–3]. Recent decades have witnessed a growing research interest in the study of optical fiber based on multifunctional biosensors [4–6]. In recent years, sensors comprising photonic crystal fibers based on surface plasmon resonance (PCF-SPR) have attracted considerable attention due to their small volume, rapid detection, high sensitivity, anti-electromagnetic interference, label-free detection, and in situ monitoring of biomolecular interactions. PCF-SPR is mainly based on the coupling of a core-guided mode to the plasmonic mode along with a metalized micro-structure fiber [7,8]. In 2006, A. Hassani and M. Skorobogatiy presented the concept of the PCF-SPR sensor with optimized microfluidics and illustrated that the phase matching and packaging issues could be facilitated with PCF operated in the single-mode regime [9]. Shuai et al., designed a closed-form multi-core holey fiber-based plasmonic sensor in a large dynamic RI range from 1.33 to 1.53 with high sensitivity and linearity [10]. In 2010, Coatings 2022, 12, 742. https://doi.org/10.3390/coatings12060742 https://www.mdpi.com/journal/coatings
-
Upload
khangminh22 -
Category
Documents
-
view
1 -
download
0
Transcript of Numerical Analysis of Multifunctional Biosensor with ... - MDPI
Citation: Lv, J.; Wang, F.; Hu, C.;
Yang, L.; Fu, H.; Zeng, Y.; Chu, P.K.;
Liu, C. Numerical Analysis of
Multifunctional Biosensor with
Dual-Channel Photonic Crystal
Fibers Based on Localized Surface
Plasmon Resonance. Coatings 2022,
12, 742. https://doi.org/10.3390/
coatings12060742
Academic Editor: You Seung Rim
Received: 22 April 2022
Accepted: 20 May 2022
Published: 28 May 2022
Publisher’s Note: MDPI stays neutral
with regard to jurisdictional claims in
published maps and institutional affil-
iations.
Copyright: © 2022 by the authors.
Licensee MDPI, Basel, Switzerland.
This article is an open access article
distributed under the terms and
conditions of the Creative Commons
Attribution (CC BY) license (https://
creativecommons.org/licenses/by/
4.0/).
coatings
Article
Numerical Analysis of Multifunctional Biosensor withDual-Channel Photonic Crystal Fibers Based on LocalizedSurface Plasmon ResonanceJingwei Lv 1, Famei Wang 1, Chunjie Hu 2, Lin Yang 1, Haihao Fu 1, Yanshu Zeng 1, Paul K. Chu 3,4,5
and Chao Liu 1,*
1 School of Physics and Electronic Engineering, Northeast Petroleum University, Daqing 163318, China;[email protected] (J.L.); [email protected] (F.W.); [email protected] (L.Y.);[email protected] (H.F.); [email protected] (Y.Z.)
2 Department of Gynaecology and Obstetrics, The Fourth Affiliated Hospital of Harbin Medical University,Harbin 150001, China; [email protected]
3 Department of Physics, City University of Hong Kong, Tat Chee Avenue, Hong Kong 999077, China;[email protected]
4 Department of Materials Science and Engineering, City University of Hong Kong, Tat Chee Avenue,Hong Kong 999077, China
5 Department of Biomedical Engineering, City University of Hong Kong, Tat Chee Avenue,Hong Kong 999077, China
* Correspondence: [email protected]
Abstract: A multifunctional biosensor composed of a dual-channel photonic crystal fiber (PCF)based on localized surface plasmon resonance (LSPR) is presented to measure dynamic changesin the magnetic field, temperature, and analyte refractive index at mid-infrared wavelengths. Thefinite-element method (FEM) is used to model and determine the sensing properties of the sensor.The flat dual-channel surface is coated with a gold film, and two nanowires are put on the fan-shaped openings to create directional resonance coupling to detect the analyte refractive index andtemperature. By utilizing that the refractive index (RI) of the filled magnetic fluid (MF) is sensitiveto the external magnetic field and temperature, a sensor with multi-physical detection functions isobtained. For refractive indexes ranging from 1.47 to 1.52, the maximum sensitivity is as high as31,000 nm/RIU, with a resolution of 3.22 × 10⁻⁶ RIU. The maximum sensitivities for the magneticfield and temperature are 1970 pm/Oe and −5500 pm/◦C, respectively.
Keywords: multifunctional biosensor; PCF-LSPR; magnetic fluid; mid-infrared wavelengths; finiteelement method
1. Introduction
Biosensing is a topic of extensive investigation, suggesting a broad range of possibleapplications, such as molecular biology, biomedicine, and drug discovery [1–3]. Recentdecades have witnessed a growing research interest in the study of optical fiber based onmultifunctional biosensors [4–6]. In recent years, sensors comprising photonic crystal fibersbased on surface plasmon resonance (PCF-SPR) have attracted considerable attention dueto their small volume, rapid detection, high sensitivity, anti-electromagnetic interference,label-free detection, and in situ monitoring of biomolecular interactions. PCF-SPR is mainlybased on the coupling of a core-guided mode to the plasmonic mode along with a metalizedmicro-structure fiber [7,8]. In 2006, A. Hassani and M. Skorobogatiy presented the conceptof the PCF-SPR sensor with optimized microfluidics and illustrated that the phase matchingand packaging issues could be facilitated with PCF operated in the single-mode regime [9].Shuai et al., designed a closed-form multi-core holey fiber-based plasmonic sensor in alarge dynamic RI range from 1.33 to 1.53 with high sensitivity and linearity [10]. In 2010,
Coatings 2022, 12, 742. https://doi.org/10.3390/coatings12060742 https://www.mdpi.com/journal/coatings

Coatings 2022, 12, 742 2 of 11
Wu et al., described an SPR sensor consisting of an all-solid twin-core photonic bandgapfiber with a maximum sensitivity of 4000 nm/RIU for the sensing range of 1.33–1.34 inaqueous environments [11]. Peng et al., proposed an SPR-based PCF temperature sensorby exploiting the PCF susceptibility to temperature and thermo-optic effects of metallicmaterials. When specific air holes in the PCF were filled with a liquid medium witha large thermo-optic coefficient, a temperature sensitivity of 720 pm/◦C for 0–100 ◦Cwas obtained, and the detection limit was 1.39 × 10⁻² ◦C [12]. More recently, novelmagnetic-field sensors based on magnetic fluid materials have been proposed. In 2018,Chao et al., reported a PCF-based SPR probe with gold nanowires as the plasmonic material,which is easy to produce due to the optimized nanostructure. The spectral sensitivity wascalculated by 6 × 10³ nm/RIU for analyte refractive indices ranging from 1.33 to 1.36,and a sensing resolution of 2.8 × 10⁻⁵ RIU was accomplished [13]. Nevertheless, thesereported PCF-SPR biosensors offer single SPR detection to test performance at one time,thereby limiting the wider application of PCF-SPR. Compared with PCF-SPR biosensors,LSPR-based biosensors have received much attention due to their sensing capability andcompatibility for integration [14].
In recent years, lots of PCF-LSPR sensors have been designed. The D-type sensor hasattracted widespread attention due to its simple coating process and excellent performance.The flat dual-channel surface of the fan-type structure sensor can also be coated with metalfilm so that the difficulty of manufacturing is relatively simple. Compared with the D-type,the area of the gold-plated film of the sensor can be maximized in a fan-shaped, and theresonance strength will also be increased. Inspired by the fan-shaped [15,16] and D-typestructures, we present a multifunctional biosensor based on PCF-LSPR to measure dynamicchanges in the magnetic field, temperature, and analyte refractive index at mid-infraredwavelengths. The gold layer, silver nanowires, and magnetic fluid are introduced intoPCF. The purpose of the gold film is to create directional resonance coupling in refractiveindex and temperature sensing, and the silver nanowires enhance the resonance. Theproperties of the ferromagnetic particles in the magnetic fluid not only depend on theexternal magnetic field but also on the temperature and refractive index of the analyte. Theunique double-sector plasma excitation region and nanowires increase the contact areabetween the sensing region and the sensing medium, which greatly enhances the sensingability. Additionally, its wide resonance region and high resonance wavelength make ithave potential applications in the field of biosensors [17]. The tunable refractive indexcharacteristic can be used as the theoretical base to achieve measurement of the magneticfield intensity, temperature, and analyte refractive index. The advantage of the sensorstructure proposed in this paper is that it can be compatible with the sensing requirements oftwo scenarios or a single scenario. The properties of the biosensor are numerically analyzedby the finite element method with the COMSOL Multiphysics software (COMSOL), andthe results show that the maximum sensitivities for the magnetic field, temperature, andanalyte refractive index are 1970 pm/Oe, −5500 pm/◦C and 31,000 nm/RIU, with thecorresponding resolution being 0.05 Oe, 0.018 ◦C, and 3.22′10−6 RIU, respectively. Owing tothe multifunctional detection characteristics, the sensor has a large potential for biologicaldetection and real-time remote sensing.
2. Model and Method
The structure of the biosensor is shown in Figure 1a,b displays the cross-sectional FEMmesh of the sensor. The perfectly matched layer (PML) is set as a boundary condition toabsorb radiation from the outer surface and to evaluate the SPR properties. The sensor iscomposed of three layers of air holes arranged in a hexagonal lattice to restrict energy fromtransmitting into the fiber core. The diameter of the air holes is d1 = 0.5 µm and na = 1.0 isthe refractive index (RI) of air. The pitch size of the hexagonal lattice is Λ = 2 µm and therefractive index (nc) of the analyte flowing through the channel ranges from 1.47 to 1.52. Therefractive index of the biologic fluid, such as the hemoglobin concentration changes from160 to 260 (g/L), leading to the refractive index of the analyte changing from 1.4 to 1.58 [18].

Coatings 2022, 12, 742 3 of 11
The fiber is side-polished to form flat planes with two fan-shaped openings where a 50 nmthick gold layer is coated and two silver nanowires with a diameter of 50 nm are filled atthe tip end of the fan-shaped openings. One advantage of such silver nanowires comparedwith other plasmonic nanoparticles, for example, spheres or cubes, is because of theirrelatively easy fabrication and controllable structural parameter changes. Gold layer can beproduced by chemical vapor deposition (CVD) and silver nanowires can be fabricated bycombining nanoimprint lithography and lit-off process [19,20]. For the fabrication of metalnanoparticles-based Au layer PCF sensors, the PCF sensor sputtered with metal layer canbe immersed into metal nanoparticle solution in order to form the sensing structure [21]. AnSEM image showing the intersecting surface of the as-fabricated metal nanoparticles-basedAu layer PCF sensor is shown in Figure S1 for reference [22]. In the magnetic sensingoperation, a magnetic fluid (MF) is filled in the big hole at the center of the PCF and thediameter of the central small air hole is d2 = 1 µm. The MF is water-based Fe3O4 synthesizedby chemical co-precipitation [23] and the concentration is 0.85 emu/g. The phase-matchingwavelength between the core-guided mode and plasmonic mode varies when the refractiveindexes of the PCF biosensor elements (fused silica of the cladding material, gold layer,silver nanowires, and MF) change with temperature [24].
Coatings 2022, 12, x FOR PEER REVIEW 3 of 11
the refractive index (nc) of the analyte flowing through the channel ranges from 1.47 to 1.52. The refractive index of the biologic fluid, such as the hemoglobin concentration changes from 160 to 260 (g/L), leading to the refractive index of the analyte changing from 1.4 to 1.58 [18]. The fiber is side-polished to form flat planes with two fan-shaped openings where a 50 nm thick gold layer is coated and two silver nanowires with a diameter of 50 nm are filled at the tip end of the fan-shaped openings. One advantage of such silver nan-owires compared with other plasmonic nanoparticles, for example, spheres or cubes, is because of their relatively easy fabrication and controllable structural parameter changes. Gold layer can be produced by chemical vapor deposition (CVD) and silver nanowires can be fabricated by combining nanoimprint lithography and lit-off process [19,20]. For the fabrication of metal nanoparticles-based Au layer PCF sensors, the PCF sensor sput-tered with metal layer can be immersed into metal nanoparticle solution in order to form the sensing structure [21]. An SEM image showing the intersecting surface of the as-fab-ricated metal nanoparticles-based Au layer PCF sensor is shown in Suppl. 1 for reference [22]. In the magnetic sensing operation, a magnetic fluid (MF) is filled in the big hole at the center of the PCF and the diameter of the central small air hole is d2 = 1 μm. The MF is water-based Fe3O4 synthesized by chemical co-precipitation [23] and the concentration is 0.85 emu/g. The phase-matching wavelength between the core-guided mode and plas-monic mode varies when the refractive indexes of the PCF biosensor elements (fused silica of the cladding material, gold layer, silver nanowires, and MF) change with temperature [24].
(a) (b)
Figure 1. (a) Original cross-sectional structure, and (b) FEM mesh of the PCF plasmonic biosensor.
The PCF is composed of fused silica and the Ghosh model is used to define the dis-persion equation of the fused silica as follows:
( ) ( ) ( )222
11,
λλλ
ED
CBATnsilica −
+−
+= (1)
where λ is the wavelength in nm and T is the temperature in Celsius. The coefficients are given in the following [25]:
TA 510690754.031552.1 −×+=
TB 410235835.0788404.0 −×+=
TC 610584758.00110199.0 −×+=
TD 610548368.091316.0 −×+=
and
Figure 1. (a) Original cross-sectional structure, and (b) FEM mesh of the PCF plasmonic biosensor.
The PCF is composed of fused silica and the Ghosh model is used to define thedispersion equation of the fused silica as follows:
n2silica(λ, T) = A +
B(1− C/λ2)
+D
(1− E/λ2)(1)
where λ is the wavelength in nm and T is the temperature in Celsius. The coefficients aregiven in the following [25]:
A = 1.31552 + 0.690754× 10⁻⁵T
B = 0.788404 + 0.235835× 10⁻⁴T
C = 0.0110199 + 0.584758× 10⁻⁶T
D = 0.91316 + 0.548368× 10⁻⁶T
andE = 100

Coatings 2022, 12, 742 4 of 11
The following Drude model is used to define the dielectric property of the metal [26]:
ε(ω) = ε1 + iε2 = 1−ω2
p
ω(ω + iωc)(2)
The plasma frequency ωp is expressed as follows [27]:
ωp = ωp0 × exp((−T − T0
2
)× αV(T0)
)(3)
where ωp0 is the plasma frequency of the metal at T0 = 298.15 K and αV is the volumet-ric thermal expansion coefficient of metal. The scattering frequency ωc is given by thefollowing [28]:
ωc = ωcp + ωce (4)
The following Lawrence’s electron-electron scattering model is used to express thephonon–electron scattering ωce(T) [29]:
ωce(T) =16
π4 Γ∆hEF
[(kBT)2 +
(hω
4π2
)2]
(5)
ωcp is obtained by the following Holstein’s phonon–electron scattering model [30]:
ωcp(T) = ω0
[25+ 4(
TTD
)5∫ TD/T
0
z4dzez − 1
](6)
Here, ω0 can be calculated from Equations (4)–(6) at 298.15 K and TD is the Debyetemperature [31]. The parameters of gold and silver are given in Table 1 [32].
Table 1. Gold and silver parameters used in the numerical simulation.
Parameters Gold Silver
ωp0 1.36 × 10¹⁶ (rad/s) 1.3724 × 10¹⁶ (rad/s)αV 4.26 × 10⁻⁵ (K−1) 5.67 × 10⁻⁵ (K−1)TD 170 K 215 KEF 5.51 eV 5.48 eVΓ 0.55 0.55∆ 0.77 0.73
Based on the magneto-optical effect of MF, the refractive index is closely related tothe magnetic particles in magnetic fluid. The dispersion equation of MF is given by thefollowing Langevin-function [33]:
nMF(H, T) = [ns − n0]
[coth
(α
H − Hc,n
T
)− T
α(H − Hc,n)
]+ n0, H > Hc,n (7)
here n0 is 1.4620, Hc,n is associated with the concentration of the magnetic fluid, ns repre-sents the saturated value of the refractive index of the MF, H is the field strength in Oe, andα is the fitting parameters. The spectral characteristics can be analyzed by the propagationloss αloss and it is expressed as follows [34]:
αloss =40π
λIn10Im(neff )× 106(dB/m) ≈ 8.686Im(neff )2π/λ (8)
where λ is the wavelength in nm and the effective refractive index is a complex number,which is divided into the real part Re
(neff
)and the imaginary part Im
(neff
). In the wave-
length interrogation mode, the peak sensitivity S is described as the shift in the resonance

Coatings 2022, 12, 742 5 of 11
wavelength corresponding to the variation in the magnetic field intensity, temperature, andRI of the analyte and S is expressed as follows [30]:
S(λ) =∆λpeak
∆H=
∆λpeak
∆T=
∆λpeak
∆n(9)
where ∆λpeak is the shift in the peak wavelength, ∆H is the magnetic field intensity variation,∆T is the temperature variation, and ∆n is the RI of analyte variation. The resolution of thesensor is defined as follows [31]:
R = ∆H∆λmin/∆λpeak = ∆T∆λmin/∆λpeak = ∆n∆λmin/∆λpeak (10)
The wavelength resolution of the detector is set to be ∆λmin = 0.1 nm.
3. Results and Discussion
Figure 2 presents the propagation losses of the core-guided mode in the x−polarizedand y−polarized directions. The structural parameters are Λ = 2 µm, d1 = 0.5 µm,d2 = 1.0 µm, dsilver = 50 nm, tAu = 50 nm, na = 1.0, nc = 1.48, nMF = 1.4620 (H = 0 Oe).The Gaussian-like (HE11−like) modes are used as the core-guided modes, which can bedivided into the HE11x (the predominantly x−polarized) mode and the HE11y (the predom-inantly y−polarized) mode. Figure 2 shows that the resonance intensity is higher, and theenergy on the surface of the gold layer and silver nanowires in the x−polarized direction isgreater than that in the y−polarized direction. Therefore, we analyze the biosensor in thex−polarized direction.
Coatings 2022, 12, x FOR PEER REVIEW 5 of 11
and α is the fitting parameters. The spectral characteristics can be analyzed by the propa-gation loss lossα and it is expressed as follows [34]:
( ) ( ) ( ) λπλ
πα 2Im686.8/10Im10ln
40 6effeffloss nmdBn ≈×= (8)
where λ is the wavelength in nm and the effective refractive index is a complex number, which is divided into the real part ( )effneR and the imaginary part ( )effnIm . In the wave-length interrogation mode, the peak sensitivity S is described as the shift in the resonance wavelength corresponding to the variation in the magnetic field intensity, temperature, and RI of the analyte and S is expressed as follows [30]:
( )nT
S peakpeakpeak
ΔΔ
=Δ
Δ=
ΔΔ
=λλλ
λH
(9)
where peakλΔ is the shift in the peak wavelength, HΔ is the magnetic field intensity var-
iation, TΔ is the temperature variation, and nΔ is the RI of analyte variation. The res-olution of the sensor is defined as follows [31]:
peakpeakpeak nTR λλλλλλ ΔΔΔ=ΔΔΔ=ΔΔΔ= ///H minminmin (10)
The wavelength resolution of the detector is set to be nm1.0min =Δλ .
3. Results and Discussion Figure 2 presents the propagation losses of the core-guided mode in the x−polarized
and y−polarized directions. The structural parameters are Λ = 2 μm, d1 = 0.5 μm, d2 = 1.0 μm, dsilver = 50 nm, tAu = 50 nm, na = 1.0, nc = 1.48, nMF = 1.4620 (H = 0 Oe). The Gaussian-like (HE11−like) modes are used as the core-guided modes, which can be divided into the HE11x (the predominantly x−polarized) mode and the HE11y (the predominantly y−polarized) mode. Figure 2 shows that the resonance intensity is higher, and the energy on the surface of the gold layer and silver nanowires in the x−polarized direction is greater than that in the y−polarized direction. Therefore, we analyze the biosensor in the x−polarized direc-tion.
Figure 2. Loss spectra and the optical near field distribution of the sensor at the corresponding wavelength with the arrows indicating the direction of the electric field in the two polarized direc-tion.
The dual-channel PCF-SPR biosensor is based on SPR between plasmonic modes generated by the interaction between the metal of the inner air holes and the analyte and the core-guided mode. Figure 3 presents the loss spectrum for the core-guided mode and
Figure 2. Loss spectra and the optical near field distribution of the sensor at the correspondingwavelength with the arrows indicating the direction of the electric field in the two polarized direction.
The dual-channel PCF-SPR biosensor is based on SPR between plasmonic modesgenerated by the interaction between the metal of the inner air holes and the analyte andthe core-guided mode. Figure 3 presents the loss spectrum for the core-guided mode andthe real part of neff of the core-guided mode and plasmonic mode. The structural parametersare the following: Λ = 2 µm, d1 = 0.5 µm, d2 = 1.0 µm, dsilver = 50 nm, tAu = 50 nm, na = 1.0,nc = 1.48, and nMF = 1.4620 (H = 0 Oe). The propagation loss of the core-guided mode ispresented by the blue line, and Re (neff)) of the core-guided and plasmonic modes are shownby the black and pink lines, respectively. It can be seen from point (m) in Figure 3 thatthe real part of neff of the core-guided mode (black) and plasmonic mode (pink) shows anoverlap at the resonance wavelength of 1550 nm, where a sharp loss occurs. The peak in theloss spectrum indicates that the maximum energy of the core-guided mode is coupled to theplasmonic mode. Insets A and B exhibit that the near-field energy is mainly concentrated

Coatings 2022, 12, 742 6 of 11
in the fiber core, and the energy is transferred to the surface of the metal outside theresonance wavelength. Inset (C) illustrates the electric field distribution of the core-guidedmode in the x-polarized direction at the phase-matching wavelength of 1550 nm. Thereis a noticeable loss at the phase-matching wavelength, resulting in a significant signal foranalyte monitoring. Therefore, the sensor is sensitive to slight changes in the refractiveindex in the external environment. The loss spectrum is then evaluated to determine thesensor’s performance.
Coatings 2022, 12, x FOR PEER REVIEW 6 of 11
the real part of neff of the core-guided mode and plasmonic mode. The structural parame-ters are the following: Λ = 2 μm, d1 = 0.5 μm, d2 = 1.0 μm, dsilver = 50 nm, tAu = 50 nm, na = 1.0, nc = 1.48, and nMF = 1.4620 (H = 0 Oe). The propagation loss of the core-guided mode is presented by the blue line, and Re (neff)) of the core-guided and plasmonic modes are shown by the black and pink lines, respectively. It can be seen from point (m) in Figure 3 that the real part of neff of the core-guided mode (black) and plasmonic mode (pink) shows an overlap at the resonance wavelength of 1550 nm, where a sharp loss occurs. The peak in the loss spectrum indicates that the maximum energy of the core-guided mode is cou-pled to the plasmonic mode. Insets A and B exhibit that the near-field energy is mainly concentrated in the fiber core, and the energy is transferred to the surface of the metal outside the resonance wavelength. Inset (C) illustrates the electric field distribution of the core-guided mode in the x-polarized direction at the phase-matching wavelength of 1550 nm. There is a noticeable loss at the phase-matching wavelength, resulting in a significant signal for analyte monitoring. Therefore, the sensor is sensitive to slight changes in the refractive index in the external environment. The loss spectrum is then evaluated to de-termine the sensor’s performance.
Figure 3. Dispersion relationship of the plasmonic mode (pink line), core-guided mode (black dotted line), and loss spectrum (blue line) for the core-guided mode.
Figure 4 displays the loss curves of the core-guided mode for different MF hole di-ameters. The resonance wavelength shifts from 1600 to 1530 nm when the MF hole diam-eter d2 changes from 0.6 to 1.2 μm. The core-guided mode loss decreases for refractive index nMF = 1.4620 when the surrounding magnetic field intensity is zero. It can be ex-plained by the fact that a smaller hole in the center effectively reduces the neff of the core-guided mode while matching the neff of the plasmonic mode [35]. As a result, a smaller MF hole in the center improves the coupling of the core-guided mode and plasmonic mode.
Figure 3. Dispersion relationship of the plasmonic mode (pink line), core-guided mode (black dottedline), and loss spectrum (blue line) for the core-guided mode.
Figure 4 displays the loss curves of the core-guided mode for different MF holediameters. The resonance wavelength shifts from 1600 to 1530 nm when the MF holediameter d2 changes from 0.6 to 1.2 µm. The core-guided mode loss decreases for refractiveindex nMF = 1.4620 when the surrounding magnetic field intensity is zero. It can beexplained by the fact that a smaller hole in the center effectively reduces the neff of thecore-guided mode while matching the neff of the plasmonic mode [35]. As a result, a smallerMF hole in the center improves the coupling of the core-guided mode and plasmonic mode.
Coatings 2022, 12, x FOR PEER REVIEW 7 of 11
Figure 4. Loss curves of the core-guided mode for different MF hole diameter d2.
Figure 5 presents the variance in the core−guided mode for different filling states at the same wavelength, and the loss depth is bigger with the two silver nanowires. The structure parameters are the following: Λ = 2 μm, d1 = 0.5 μm, d2 = 0.6 μm, dsilver = 50 nm, tAu = 50 nm, na = 1.0, nc = 1.50, and nMF = 1.4620 (H = 0 Oe). When SPR occurs at a particular wavelength, the plasmonic modes occur on the metal surface [36]. The LSPR is stronger and sharper on the silver nanowires than without them, and hence, the silver nanowires have a large influence on the total resonance of the biosensor [37,38].
Figure 5. Variance in the core−guided mode with and without silver nanowires.
The loss response to different magnetic fields is presented in Figure 6a, where na, nc, and T are 1.0, 1.48, and 298.15 K, respectively, and the other parameters are the same. The sensing properties of the PCF-SPR magnetic field sensor are investigated under an applied magnetic field of between 0 and 271 Oe. Figure 6a shows the red-shifted wavelength and larger peak intensity in the presence of the magnetic field. As the external magnetic field gets stronger, more energy is transported from the core guided mode to the plasmonic mode, resulting in higher coupling efficiency. The resonance wavelength and loss for dif-ferent magnetic fields are plotted in Figure 6b, which shows the maximum peak shift
60 nmpeakλΔ = . Here, the maximum peak magnetic field intensity sensitivity is as large as 1.97 nm/Oe and the resolution of magnetic field detection is 0.05 Oe.
1300 1350 1400 1450 1500 1550 1600 1650 1700 1750 1800 1850
0
200
400
600
800
1000
Loss
(dB/
cm)
Wavelength(nm)
0.6 0.8 1.0 1.2
1600 1650 1700 1750 1800 1850 1900 1950 2000 2050 2100 2150-100
0
100
200
300
400
500
600
700
800
900
1000
Silver nanowires (x-polarized)
None silver nanowires (x-polarized)
Loss
(dB/
cm)
Wavelength(nm)
Figure 4. Loss curves of the core-guided mode for different MF hole diameter d2.
Figure 5 presents the variance in the core−guided mode for different filling statesat the same wavelength, and the loss depth is bigger with the two silver nanowires. The

Coatings 2022, 12, 742 7 of 11
structure parameters are the following: Λ = 2 µm, d1 = 0.5 µm, d2 = 0.6 µm, dsilver = 50 nm,tAu = 50 nm, na = 1.0, nc = 1.50, and nMF = 1.4620 (H = 0 Oe). When SPR occurs at a particularwavelength, the plasmonic modes occur on the metal surface [36]. The LSPR is strongerand sharper on the silver nanowires than without them, and hence, the silver nanowireshave a large influence on the total resonance of the biosensor [37,38].
Coatings 2022, 12, x FOR PEER REVIEW 7 of 11
Figure 4. Loss curves of the core-guided mode for different MF hole diameter d2.
Figure 5 presents the variance in the core−guided mode for different filling states at the same wavelength, and the loss depth is bigger with the two silver nanowires. The structure parameters are the following: Λ = 2 μm, d1 = 0.5 μm, d2 = 0.6 μm, dsilver = 50 nm, tAu = 50 nm, na = 1.0, nc = 1.50, and nMF = 1.4620 (H = 0 Oe). When SPR occurs at a particular wavelength, the plasmonic modes occur on the metal surface [36]. The LSPR is stronger and sharper on the silver nanowires than without them, and hence, the silver nanowires have a large influence on the total resonance of the biosensor [37,38].
Figure 5. Variance in the core−guided mode with and without silver nanowires.
The loss response to different magnetic fields is presented in Figure 6a, where na, nc, and T are 1.0, 1.48, and 298.15 K, respectively, and the other parameters are the same. The sensing properties of the PCF-SPR magnetic field sensor are investigated under an applied magnetic field of between 0 and 271 Oe. Figure 6a shows the red-shifted wavelength and larger peak intensity in the presence of the magnetic field. As the external magnetic field gets stronger, more energy is transported from the core guided mode to the plasmonic mode, resulting in higher coupling efficiency. The resonance wavelength and loss for dif-ferent magnetic fields are plotted in Figure 6b, which shows the maximum peak shift
60 nmpeakλΔ = . Here, the maximum peak magnetic field intensity sensitivity is as large as 1.97 nm/Oe and the resolution of magnetic field detection is 0.05 Oe.
1300 1350 1400 1450 1500 1550 1600 1650 1700 1750 1800 1850
0
200
400
600
800
1000
Loss
(dB/
cm)
Wavelength(nm)
0.6 0.8 1.0 1.2
1600 1650 1700 1750 1800 1850 1900 1950 2000 2050 2100 2150-100
0
100
200
300
400
500
600
700
800
900
1000
Silver nanowires (x-polarized)
None silver nanowires (x-polarized)
Loss
(dB/
cm)
Wavelength(nm)
Figure 5. Variance in the core−guided mode with and without silver nanowires.
The loss response to different magnetic fields is presented in Figure 6a, where na, nc,and T are 1.0, 1.48, and 298.15 K, respectively, and the other parameters are the same. Thesensing properties of the PCF-SPR magnetic field sensor are investigated under an appliedmagnetic field of between 0 and 271 Oe. Figure 6a shows the red-shifted wavelength andlarger peak intensity in the presence of the magnetic field. As the external magnetic fieldgets stronger, more energy is transported from the core guided mode to the plasmonicmode, resulting in higher coupling efficiency. The resonance wavelength and loss fordifferent magnetic fields are plotted in Figure 6b, which shows the maximum peak shift∆λpeak = 60 nm. Here, the maximum peak magnetic field intensity sensitivity is as large as1.97 nm/Oe and the resolution of magnetic field detection is 0.05 Oe.
Coatings 2022, 12, x FOR PEER REVIEW 8 of 11
(a) (b)
Figure 6. (a) Variation of magnetic field intensity and loss and (b) Variation of magnetic field in-tensity and resonance wavelength.
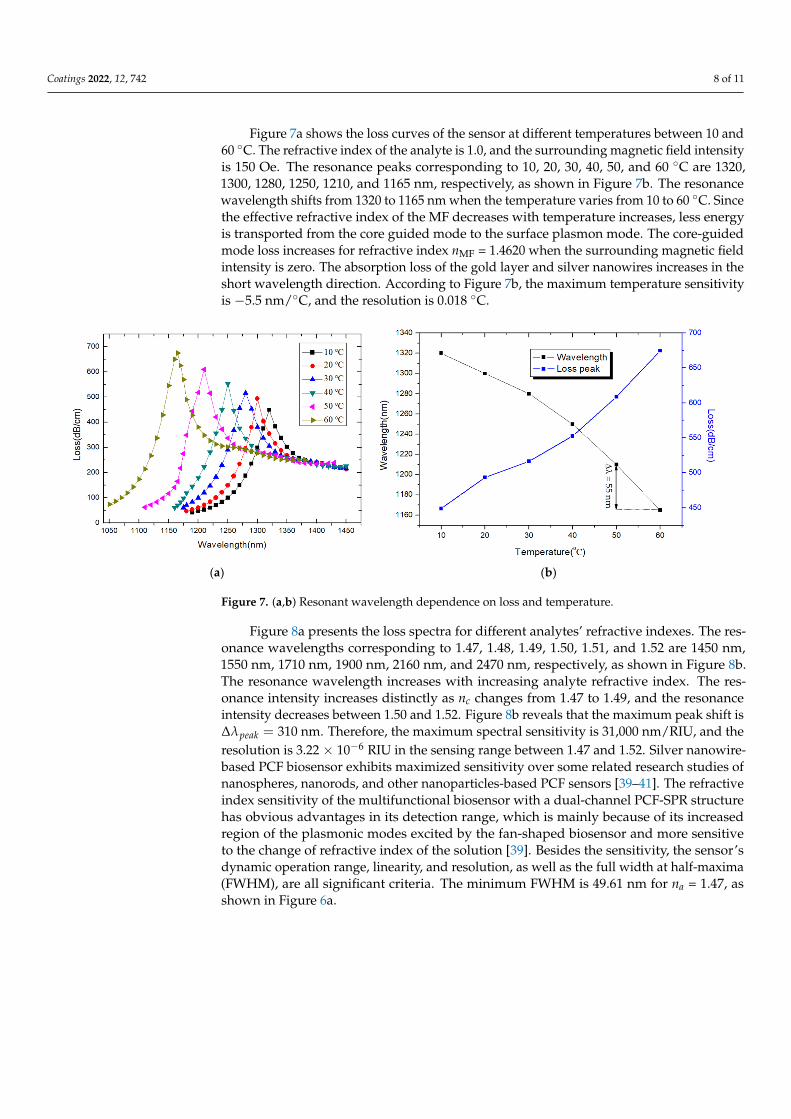
Figure 7a shows the loss curves of the sensor at different temperatures between 10 and 60 °C. The refractive index of the analyte is 1.0, and the surrounding magnetic field intensity is 150 Oe. The resonance peaks corresponding to 10, 20, 30, 40, 50, and 60 °C are 1320, 1300, 1280, 1250, 1210, and 1165 nm, respectively, as shown in Figure 7b. The reso-nance wavelength shifts from 1320 to 1165 nm when the temperature varies from 10 to 60 °C. Since the effective refractive index of the MF decreases with temperature increases, less energy is transported from the core guided mode to the surface plasmon mode. The core-guided mode loss increases for refractive index nMF = 1.4620 when the surrounding magnetic field intensity is zero. The absorption loss of the gold layer and silver nanowires increases in the short wavelength direction. According to Figure 7b, the maximum tem-perature sensitivity is −5.5 nm/°C, and the resolution is 0.018 °C.
(a) (b)
Figure 7. (a,b) Resonant wavelength dependence on loss and temperature.
Figure 8a presents the loss spectra for different analytes’ refractive indexes. The res-onance wavelengths corresponding to 1.47, 1.48, 1.49, 1.50, 1.51, and 1.52 are 1450 nm, 1550 nm, 1710 nm, 1900 nm, 2160 nm, and 2470 nm, respectively, as shown in Figure 8b. The resonance wavelength increases with increasing analyte refractive index. The reso-nance intensity increases distinctly as nc changes from 1.47 to 1.49, and the resonance in-tensity decreases between 1.50 and 1.52. Figure 8b reveals that the maximum peak shift is
310 nmpeakλΔ = . Therefore, the maximum spectral sensitivity is 31,000 nm/RIU, and
900 950 1000 1050 1100 1150 1200 1250 1300 1350 1400 1450
0
100
200
300
400
500
600
700
Loss
(dB/
cm)
Wavelength(nm)
0 Oe 89.9 Oe 120.3 Oe 150.0 Oe 180.4 Oe 210.9 Oe 240.6 Oe 271.0 Oe
Figure 6. (a) Variation of magnetic field intensity and loss and (b) Variation of magnetic field intensityand resonance wavelength.
Coatings 2022, 12, 742 8 of 11
Figure 7a shows the loss curves of the sensor at different temperatures between 10 and60 ◦C. The refractive index of the analyte is 1.0, and the surrounding magnetic field intensityis 150 Oe. The resonance peaks corresponding to 10, 20, 30, 40, 50, and 60 ◦C are 1320,1300, 1280, 1250, 1210, and 1165 nm, respectively, as shown in Figure 7b. The resonancewavelength shifts from 1320 to 1165 nm when the temperature varies from 10 to 60 ◦C. Sincethe effective refractive index of the MF decreases with temperature increases, less energyis transported from the core guided mode to the surface plasmon mode. The core-guidedmode loss increases for refractive index nMF = 1.4620 when the surrounding magnetic fieldintensity is zero. The absorption loss of the gold layer and silver nanowires increases in theshort wavelength direction. According to Figure 7b, the maximum temperature sensitivityis −5.5 nm/◦C, and the resolution is 0.018 ◦C.
Coatings 2022, 12, x FOR PEER REVIEW 8 of 11
(a) (b)
Figure 6. (a) Variation of magnetic field intensity and loss and (b) Variation of magnetic field in-tensity and resonance wavelength.
Figure 7a shows the loss curves of the sensor at different temperatures between 10 and 60 °C. The refractive index of the analyte is 1.0, and the surrounding magnetic field intensity is 150 Oe. The resonance peaks corresponding to 10, 20, 30, 40, 50, and 60 °C are 1320, 1300, 1280, 1250, 1210, and 1165 nm, respectively, as shown in Figure 7b. The reso-nance wavelength shifts from 1320 to 1165 nm when the temperature varies from 10 to 60 °C. Since the effective refractive index of the MF decreases with temperature increases, less energy is transported from the core guided mode to the surface plasmon mode. The core-guided mode loss increases for refractive index nMF = 1.4620 when the surrounding magnetic field intensity is zero. The absorption loss of the gold layer and silver nanowires increases in the short wavelength direction. According to Figure 7b, the maximum tem-perature sensitivity is −5.5 nm/°C, and the resolution is 0.018 °C.
(a) (b)
Figure 7. (a,b) Resonant wavelength dependence on loss and temperature.
Figure 8a presents the loss spectra for different analytes’ refractive indexes. The res-onance wavelengths corresponding to 1.47, 1.48, 1.49, 1.50, 1.51, and 1.52 are 1450 nm, 1550 nm, 1710 nm, 1900 nm, 2160 nm, and 2470 nm, respectively, as shown in Figure 8b. The resonance wavelength increases with increasing analyte refractive index. The reso-nance intensity increases distinctly as nc changes from 1.47 to 1.49, and the resonance in-tensity decreases between 1.50 and 1.52. Figure 8b reveals that the maximum peak shift is
310 nmpeakλΔ = . Therefore, the maximum spectral sensitivity is 31,000 nm/RIU, and
900 950 1000 1050 1100 1150 1200 1250 1300 1350 1400 1450
0
100
200
300
400
500
600
700
Loss
(dB/
cm)
Wavelength(nm)
0 Oe 89.9 Oe 120.3 Oe 150.0 Oe 180.4 Oe 210.9 Oe 240.6 Oe 271.0 Oe
Figure 7. (a,b) Resonant wavelength dependence on loss and temperature.
Figure 8a presents the loss spectra for different analytes’ refractive indexes. The res-onance wavelengths corresponding to 1.47, 1.48, 1.49, 1.50, 1.51, and 1.52 are 1450 nm,1550 nm, 1710 nm, 1900 nm, 2160 nm, and 2470 nm, respectively, as shown in Figure 8b.The resonance wavelength increases with increasing analyte refractive index. The res-onance intensity increases distinctly as nc changes from 1.47 to 1.49, and the resonanceintensity decreases between 1.50 and 1.52. Figure 8b reveals that the maximum peak shift is∆λpeak = 310 nm. Therefore, the maximum spectral sensitivity is 31,000 nm/RIU, and theresolution is 3.22 × 10⁻⁶ RIU in the sensing range between 1.47 and 1.52. Silver nanowire-based PCF biosensor exhibits maximized sensitivity over some related research studies ofnanospheres, nanorods, and other nanoparticles-based PCF sensors [39–41]. The refractiveindex sensitivity of the multifunctional biosensor with a dual-channel PCF-SPR structurehas obvious advantages in its detection range, which is mainly because of its increasedregion of the plasmonic modes excited by the fan-shaped biosensor and more sensitiveto the change of refractive index of the solution [39]. Besides the sensitivity, the sensor’sdynamic operation range, linearity, and resolution, as well as the full width at half-maxima(FWHM), are all significant criteria. The minimum FWHM is 49.61 nm for na = 1.47, asshown in Figure 6a.

Coatings 2022, 12, 742 9 of 11
Coatings 2022, 12, x FOR PEER REVIEW 9 of 11
the resolution is 3.22 × 10⁻⁶ RIU in the sensing range between 1.47 and 1.52. Silver nan-owire-based PCF biosensor exhibits maximized sensitivity over some related research studies of nanospheres, nanorods, and other nanoparticles-based PCF sensors [39–41]. The refractive index sensitivity of the multifunctional biosensor with a dual-channel PCF-SPR structure has obvious advantages in its detection range, which is mainly because of its increased region of the plasmonic modes excited by the fan-shaped biosensor and more sensitive to the change of refractive index of the solution [39]. Besides the sensitivity, the sensor’s dynamic operation range, linearity, and resolution, as well as the full width at half-maxima (FWHM), are all significant criteria. The minimum FWHM is 49.61 nm for na = 1.47, as shown in Figure 6a.
(a) (b)
Figure 8. (a) Loss curve of the core-guided mode and (b) Dependence of resonance wavelengths and loss on the analyte refractive indexes nc between 1.47 and 1.52.
4. Conclusions A dual-channel LSPR sensor based on the MF-filled PCF is described, and mode cou-
pling is numerically analyzed by FEM. The reflectance spectra of the MF-filled sensor are sensitive to the magnetic field and temperature. The sensor not only measures the liquid in the external environment but also determines the intensity of the magnetic field and temperature. A maximum spectral sensitivity of 31,000 nm/RIU and a resolution of 3.22 × 10⁻⁶ RIU are achieved for the sensing range between 1.47 and 1.52. The maximum sensi-tivities for the magnetic field and temperature are 1970 pm/Oe and −5500 pm/°C, respec-tively. The minimum FWHM is 49.61 nm for na = 1.47. This multifunctional PCF-SPR bio-sensor boasting high sensitivity and resolution has great potential in biological analysis and medical monitoring.
Author Contributions: Conceptualization, J.L. and F.W.; methodology, C.H.; software, L.Y.; valida-tion, H.F.; formal analysis, J.L.; investigation, J.L.; resources, Y.Z.; data curation, J.L.; writing—orig-inal draft preparation, F.W.; writing—review and editing, C.L. and P.K.C.; visualization, J.L.; super-vision, C.L.; project administration, C.L.; funding acquisition, J.L. and P.K.C. All authors have read and agreed to the published version of the manuscript.
Funding: Please add: This research was funded by Natural Science Foundation of Heilongjiang Province (No. LH2021F007, J.L.), China Postdoctoral Science Foundation funded project (No. 2020M670881, J.L.), Outstanding Young and Middle-aged Scientific Research Innovation Team Pro-ject of Northeast Petroleum University (No. KYCXTDQ201901, M.L.), Research Initiation Project of Northeast Petroleum University (No. 2019KQ74, J.L.), Scholarship Foundation for Returned Over-
1300 1400 1500 1600 1700 1800 1900 2000 2100 2200 2300 2400 2500 2600
0
100
200
300
400
500
600
700
800
900
1000
Loss
(dB/
cm)
Wavelength(nm)
1.47 1.48 1.49 1.50 1.51 1.52
Figure 8. (a) Loss curve of the core-guided mode and (b) Dependence of resonance wavelengths andloss on the analyte refractive indexes nc between 1.47 and 1.52.
4. Conclusions
A dual-channel LSPR sensor based on the MF-filled PCF is described, and modecoupling is numerically analyzed by FEM. The reflectance spectra of the MF-filled sensorare sensitive to the magnetic field and temperature. The sensor not only measures theliquid in the external environment but also determines the intensity of the magnetic fieldand temperature. A maximum spectral sensitivity of 31,000 nm/RIU and a resolution of3.22 × 10−6 RIU are achieved for the sensing range between 1.47 and 1.52. The maximumsensitivities for the magnetic field and temperature are 1970 pm/Oe and −5500 pm/◦C,respectively. The minimum FWHM is 49.61 nm for na = 1.47. This multifunctional PCF-SPRbiosensor boasting high sensitivity and resolution has great potential in biological analysisand medical monitoring.
Supplementary Materials: The following supporting information can be downloaded at: https://www.mdpi.com/article/10.3390/coatings12060742/s1, Figure S1: (a) Schematic of the SPR PCFsensor proposed in [21,22]. (b) SEM image of gold nano-film on the PCF surface.
Author Contributions: Conceptualization, J.L. and F.W.; methodology, C.H.; software, L.Y.; valida-tion, H.F.; formal analysis, J.L.; investigation, J.L.; resources, Y.Z.; data curation, J.L.; writing—originaldraft preparation, F.W.; writing—review and editing, C.L. and P.K.C.; visualization, J.L.; supervision,C.L.; project administration, C.L.; funding acquisition, J.L. and P.K.C. All authors have read andagreed to the published version of the manuscript.
Funding: This research was funded by Natural Science Foundation of Heilongjiang Province(No. LH2021F007, J.L.), China Postdoctoral Science Foundation funded project (No. 2020M670881,J.L.), Outstanding Young and Middle-aged Scientific Research Innovation Team Project of North-east Petroleum University (No. KYCXTDQ201901, M.L.), Research Initiation Project of NortheastPetroleum University (No. 2019KQ74, J.L.), Scholarship Foundation for Returned Overseas Studentsof Heilongjiang Province (No. 070-719900103, J.L.), and the Local Universities Reformation andDevelopment Personnel Training Supporting Project from Central Authorities, City University ofHong Kong Strategic Research Grant (SRG) (No. 7005505, P.K.C.).
Institutional Review Board Statement: Not applicable.
Informed Consent Statement: Not applicable.
Data Availability Statement: The authors confirm that the data supporting the findings of this studyare available within the article.
Conflicts of Interest: The authors declare no conflict of interest.

Coatings 2022, 12, 742 10 of 11
References1. Wang, X.X.; Wu, Y.; Wen, X.L.; Zhu, J.K.; Bai, X.L.; Qi, Y.P.; Yang, H. Surface plasmons and SERS application of Au nanodisk array
and Au thin film composite structure. Opt. Quant. Electron. 2020, 52, 238. [CrossRef]2. Chen, H.; Chen, Z.H.; Yang, H.; Wen, L.H.; Yi, Z.; Zhou, Z.G.; Dai, B.; Zhang, J.G.; Wu, X.W.; Wu, P.H. Multi-mode surface
plasmon resonance absorber based on dart-type single-layer graphene. RSC Adv. 2022, 12, 7821–7829. [CrossRef] [PubMed]3. Wang, X.X.; Zhu, J.K.; Xu, Y.Q.; Qi, Y.P.; Zhang, L.P.; Yang, H.; Yi, Z. A novel plasmonic refractive index sensor based on
gold/silicon complementary grating structure. Chin. Phys. B 2021, 30, 024207. [CrossRef]4. Liu, C.; Lü, J.; Liu, W.; Wang, F.M.; Chu, P.K. Overview of refractive index sensors comprising photonic crystal fibers based on the
surface plasmon resonance effect. Chin. Opt. Lett. 2021, 19, 102202. [CrossRef]5. Liu, W.; Shi, Y.; Yi, Z.; Liu, C.; Wang, F.M.; Li, X.L.; Lv, J.W.; Yang, L.; Chu, P.K. Surface plasmon resonance chemical sensor
composed of a microstructured optical fiber for the detection of an ultra-wide refractive index range and gas-liquid pollutants.Opt. Express 2021, 29, 40734–40747. [CrossRef]
6. Zheng, Z.P.; Luo, Y.; Yang, H.; Yi, Z.; Zhang, J.G.; Song, Q.J.; Yang, W.X.; Liu, C.; Wu, X.W.; Wu, P.H. Thermal tuning of terahertzmetamaterial properties based on phase change material vanadium dioxide. Phys. Chem. Chem. Phys. 2022, 24, 8846–8853.[CrossRef]
7. Dash, J.N.; Jha, R. Graphene-based birefringent photonic crystal fiber sensor using surface plasmon resonance. IEEE Photonic.Technol. Lett. 2014, 26, 1092–1095. [CrossRef]
8. Zhao, J.; Cao, S.; Liao, C.; Wang, Y. Surface plasmon resonance refractive sensor based on silver-coated side-polished fiber. Sens.Actuat. B-Chem. 2016, 230, 206–211. [CrossRef]
9. Hassani, A.; Skorobogatiy, M. Design criteria for microstructured-optical-fiber-based surface-plasmon-resonance sensors. J. Opt.Soc. Am. B 2007, 24, 1423–1429. [CrossRef]
10. Shuai, B.B.; Li, X.; Zhang, Y.Z.; Liu, D.M. A multi-core holey fiber based plasmonic sensor with large detection range and highlinearity. Opt. Express 2012, 20, 5900–5974. [CrossRef]
11. Wu, Y.; Town, G.E.; Bang, O. Refractive index sensing in an all-solid twin-core photonic bandgap fiber. IEEE Sens. J. 2010, 10,1192–1199.
12. Peng, Y.; Zhao, Y.; Hu, S. Low-cost high-performance temperature sensor based on unsymmetrical U-shaped microfiber. Opt.Fiber Technol. 2021, 65, 102597. [CrossRef]
13. Liu, C.; Yang, L.; Liu, Q.; Wang, F.M.; Sun, Z.J.; Sun, T.; Mu, H.W.; Chu, P.K. Analysis of a surface plasmon resonance probe basedon photonic crystal fibers for low refractive index detection. Plasmonics 2018, 13, 779–784. [CrossRef]
14. He, J.; Brimmo, A.T.; Qasaimeh, M.A.; Chen, P.Y.; Chen, W.Q. Recent advances and perspectives in microfluidics-based single-cellbiosensing techniques. Small Methods 2017, 1, 1700192. [CrossRef]
15. Yang, X.; Lu, Y.; Wang, M.; Yao, J. An exposed-core grapefruit fibers based surface plasmon resonance sensor. Sensors 2015, 15,17106–17114. [CrossRef]
16. Yang, X.C.; Lu, Y.; Wang, M.T.; Yao, J.Q. SPR sensor based on exposed-core grapefruit fiber with bimetallic structure. IEEE Photon.Tech. Lett. 2016, 28, 649. [CrossRef]
17. Homola, J. Present and future of surface plasmon resonance biosensors. Anal. Bioanal. Chem. 2003, 377, 528–539. [CrossRef]18. Rakhshani, M.R.; Mansouri-Birjandi, M.A. Engineering hexagonal array of nanoholes for high sensitivity biosensor and application
for human blood group detection. IEEE Trans. Nanotechnol. 2018, 17, 475–481. [CrossRef]19. Zhou, Z. Laser chemical vapor deposition of film. Laser J. 1985, 4, 45–47.20. Hong, S.H.; Bae, B.J.; Yang, K.Y.; Jeong, J.H.; Kim, H.S.; Lee, H. Fabrication of sub-50 nm Au nanowires using thermally curing
nanoimprint lithography. Electron. Mater. Lett. 2009, 5, 139–143. [CrossRef]21. Wang, B.T.; Wang, Q. Sensitivity-enhanced optical fiber biosensor based on coupling effect between SPR and LSPR. IEEE Sens. J.
2018, 18, 8303–8310. [CrossRef]22. Portosi, V.; Laneve, D.; Falconi, M.C.; Prudenzano, F. Advances on photonic crystal fiber sensors and applications. Sensors 2019,
19, 1892. [CrossRef] [PubMed]23. Ott, J.R.; Heuck, M.; Agger, C.; Rasmussen, P.D.; Bang, O. Label-free and selective nonlinear fiber-optical biosensing. Opt. Express
2008, 16, 20834. [CrossRef] [PubMed]24. Rindorf, L.; Bang, O. Sensitivity of photonic crystal fiber grating sensors: Biosensing, refractive index, strain, and temperature
sensing. J. Opt. Soc. Am. B 2008, 25, 310–324. [CrossRef]25. Ghosh, G. Sellmeier coefficients and chromatic dispersions for some tellurite glasses. J. Am. Ceram. Soc. 1995, 78, 2828–2830.
[CrossRef]26. Hassani, A.; Skorobogatiy, M. Design of themicrostructured optical fiber-based surface plasmon resonance sensors with enhanced
microfluidics. Opt. Express 2006, 14, 11616–11621. [CrossRef] [PubMed]27. Lin, K.; Lu, Y.; Luo, Z.; Zheng, R.; Wang, P.; Ming, H. Numerical and experimental investigation of temperature effects on the
surface plasmon resonance sensor. Chin. Opt. Lett. 2009, 7, 428–431.28. Beach, R.; Christy, R. Electron-electron scattering in the intraband optical conductivity of Cu, Ag, and Au. Phys. Rev. B 1977, 16,
5277. [CrossRef]29. Lawrence, W.E. Electron-electron scattering in the lowtemperature resistivity of the noble metals. Phys. Rev. B 1976, 13, 5316–5319.
[CrossRef]

Coatings 2022, 12, 742 11 of 11
30. Holstein, T. Optical and infrared volume absorptivity of metals. Phys. Rev. 1954, 96, 535. [CrossRef]31. Ujihara, K. Reflectivity of metals at high temperatures. J. Appl. Phys. 1972, 43, 2376–2383. [CrossRef]32. Peng, Y.; Hou, J.; Huang, X.; Lu, Q. Temperature sensor based on surface plasmon resonance within selectively coated photonic
crystal fiber. Appl. Optics 2012, 51, 6361–6367. [CrossRef] [PubMed]33. Rifat, A.A.; Ahmed, R.; Yetisen, A.K.; Butt, H.; Sabouri, A. Photonic crystal fiber based plasmonic sensors. Sens. Actuat. B-Chem.
2017, 243, 311–325. [CrossRef]34. Zhao, Y.; Deng, Z.Q.; Li, J. Photonic crystal fiber based surface plasmon resonance chemical sensors. Sens. Actuat. B-Chem. 2014,
202, 557–567. [CrossRef]35. Zhang, P.P.; Yao, J.Q.; Cui, H.X.; Lu, Y. A surface plasmon resonance sensor based on a multi-core photonic crystal fiber. Opt. Lett.
2013, 35, 1673–1905. [CrossRef]36. Yu, X.; Zhang, Y.; Pan, S.S.; Shum, P.; Yan, M.; Leviatan, Y.; Li, C.M. A selectively coated photonic crystal fiber based surface
plasmon resonance sensors. J. Optics 2010, 12, 015005. [CrossRef]37. Liu, Y.; Wei, J.G.; Wu, B.B.; Wu, X.H.; Lan, F.F.; Zhu, Y.C. Density alteration in non-physiological cells. Nat. Preced. 2011, 47,
533–536.38. Zhao, F.; Lin, J.; Lei, Z.H.; Yi, Z.; Qin, F.; Zhang, J.G.; Liu, L.; Wu, X.W.; Yang, W.X.; Wu, P.H. Realization of 18.97% theoretical
efficiency of 0.9 µm Thick c-Si/ZnO Heterojunction Ultrathin-film Solar Cells via Surface Plasmon Resonance Enhancement.Phys. Chem. Chem. Phys. 2022, 24, 4871–4880. [CrossRef]
39. Xia, F.; Song, H.; Zhao, Y.; Zhao, W.M.; Dai, Z.X. Ultra-high sensitivity SPR fiber sensor based on multilayer nanoparticle and Aufilm coupling enhancement. Measurement 2020, 164, 108083. [CrossRef]
40. Rifat, A.; Mahdiraji, G.; Chow, D.; Shee, Y.; Ahmed, R.; Adikan, F. Photonic Crystal Fiber-Based Surface Plasmon ResonanceSensor with Selective Analyte Channels and Graphene-Silver Deposited Core. Sensors 2015, 15, 11499–11510. [CrossRef]
41. Luan, N.; Yao, J. A Hollow-Core Photonic Crystal Fiber-Based SPR Sensor with Large Detection Range. IEEE Photonics J. 2017, 9,6802107. [CrossRef]