Evaluation of multifunctional properties of graphene based ...
234
EVALUATION OF MULTIFUNCTIONAL PROPERTIES OF GRAPHENE BASED CEMENT COMPOSITES SARDAR KASHIF UR REHMAN FACULTY OF ENGINEERING UNIVERSITY OF MALAYA KUALA LUMPUR 2018 University of Malaya
-
Upload
khangminh22 -
Category
Documents
-
view
1 -
download
0
Transcript of Evaluation of multifunctional properties of graphene based ...

EVALUATION OF MULTIFUNCTIONAL PROPERTIES OF GRAPHENE BASED CEMENT COMPOSITES
SARDAR KASHIF UR REHMAN
FACULTY OF ENGINEERING
UNIVERSITY OF MALAYA KUALA LUMPUR
2018
Univers
ity of
Mala
ya

EVALUATION OF MULTIFUNCTIONAL PROPERTIES OF GRAPHENE BASED CEMENT
COMPOSITES
SARDAR KASHIF UR REHMAN
THESIS SUBMITTED IN FULFILMENT OF THE
REQUIREMENTS FOR THE DEGREE OF DOCTOR OF PHILOSOPHY
FACULTY OF ENGINEERING UNIVERSITY OF MALAYA
KUALA LUMPUR
2018
Univers
ity of
Mala
ya

ii
UNIVERSITY OF MALAYA
ORIGINAL LITERARY WORK DECLARATION
Name of Candidate: Sardar Kashif Ur Rehman,
Registration/Matric No: KHA140023
Name of Degree: Doctor of Philosophy (PhD)
Title of Research Report: Evaluation of multifunctional properties of graphene based
cement composites.
Field of Study: Structural Engineering & Materials
I do solemnly and sincerely declare that:
(1) I am the sole author/writer of this Work; (2) This Work is original; (3) Any use of any work in which copyright exists was done by way of fair dealing
and for permitted purposes and any excerpt or extract from, or reference to or reproduction of any copyright work has been disclosed expressly and sufficiently and the title of the Work and its authorship have been acknowledged in this Work;
(4) I do not have any actual knowledge nor do I ought reasonably to know that the making of this work constitutes an infringement of any copyright work;
(5) I hereby assign all and every rights in the copyright to this Work to the University of Malaya (“UM”), who henceforth shall be owner of the copyright in this Work and that any reproduction or use in any form or by any means whatsoever is prohibited without the written consent of UM having been first had and obtained;
(6) I am fully aware that if in the course of making this Work I have infringed any copyright whether intentionally or otherwise, I may be subject to legal action or any other action as may be determined by UM.
Candidate’s Signature Date: ____________
Subscribed and solemnly declared before,
Witness’s Signature Date: ____________
Name:
Designation:
Univers
ity of
Mala
ya

iii
EVALUATION OF MULTIFUNCTIONAL PROPERTIES OF GRAPHENE
BASED CEMENT COMPOSITES
ABSTRACT
Nanomaterials are being used in the construction industry to improve the microstructural,
mechanical and electrical properties of the building material. These nanomaterials are
incorporated to overcome the shortcomings of conventional construction materials.
Graphene is one of the nanomaterials that has been widely focused due to its extraordinary
properties such as huge specific surface area, high intrinsic strength and high electrical
transport properties. Nowadays, graphene was found to have a potential to enhance the
properties of cement composite. This study evaluates the multifunctional properties of
graphene-cement composites (GCC), aiming at the micro-analytical characterization,
rheological behavior, mechanical and piezo-resistive properties. In this research, three
types of graphene flakes based on surface area and lateral flake thickness were used.
Firstly, dispersion efficiency of graphene was examined by UV-vis spectroscopy. Then,
GCC were characterized by using Thermogravimetric Analysis (TGA), Fourier
Transform Infrared (FTIR) Spectrometry, X-ray Diffraction (XRD) and Field Emission
Scanning Electron Microscopy (FESEM). Afterwards, the rheological properties of fresh
cement paste with various graphene types, graphene content, shear rate cycles, resting
time and geometrical conditions were investigated. The rheological data were fitted by
the Bingham model, Modified Bingham model, Herschel-Bulkley model and Casson
model to estimate the flow properties of GCC. The effectiveness of these rheological
models was expressed by the standard error. Mechanical properties were investigated for
graphene cement mortar. Electrical properties of graphene were employed to evaluate the
damage-sensing characteristics of GCC. Finally, the practical application of GCC was
evaluated by testing the full length reinforced concrete (RC) beam. Various damage levels
Univers
ity of
Mala
ya
iv
were induced in RC beam to monitor the response of GCC. Experimental results
concluded that 40 min magnetic stirring in combination with 3 min ultrasonication gave
the optimum results. Moreover, graphene with the high surface area and less thickness
have stable and uniform dispersion. From TGA and XRD results, it was found that more
hydration occurred due to graphene. FESEM images showed that graphene flakes with
high surface area successfully provide the hindrance to the propagation of cracks;
moreover, hydrated cement products grow in an ordered way. Rheological results showed
that yield stress and plastic viscosity increased by the addition of graphene flakes with
higher flake thickness and more resting time while these values decreased for higher shear
rate cycle. Concentric cylinders estimated lower yield stress and standard error as
compared to parallel plates. Moreover, non-linear models i.e. Herschel-Bulkley and
Modified Bingham were found as best fitted models. In comparison to control sample,
the GCC with more flake thickness showed a 30.5% increase in load carrying capacity
and 113.5% increase in overall failure strain. It was found that electrical resistivity value
for high surface area flakes reduced by 67.8% at the maximum compressive load, and
hence GCC can be used to detect the damages in concrete. Graphene cement composite
determined the electrical resistivity against various damage levels in an accurate manner
in RC beam. In conclusion, GCC has better improved properties and it can successfully
predict the response against cracks propagation. The outcome of this study is as a
precursory development for smart composites to be utilized as construction materials as
well as to monitor the structural health of the concrete structures.
Keywords: graphene cement composite, micro-analytical characterization, rheological
behaviour, piezo-resistive properties, self-sensing
Univers
ity of
Mala
ya

v
MENILAI CIRI-CIRI PELBAGAI FUNGSI BAGI KOMPOSIT SIMEN
BERASASKAN GRAFIN
ABSTRAK
Bahan nano digunakan dalam industri pembinaan untuk meningkatkan sifat
mikrostruktur, mekanikal dan elektrik bahan binaan. Bahan nano ini dicampur untuk
mengatasi kekurangan bahan binaan konvensional. Grafin adalah salah satu bahan
nanomaterial yang telah banyak digunakan kerana sifat luar biasanya seperti kawasan
permukaan spesifik yang besar, kekuatan intrinsik yang tinggi dan sifat pengangkutan
elektrik yang tinggi. Pada masa kini, grafin didapati mempunyai potensi untuk menambah
baik sifat komposit simen. Kajian ini menilai ciri-ciri pelbagai fungsi komposit grafin-
simen (GCC), yang bertujuan untuk pencirian mikro-analitik, sifat rheologi, sifat mekanik
dan piezo-resistif. Dalam kajian ini, tiga jenis serpihan grafin berdasarkan kawasan
permukaan dan ketebalan serpihan sisi digunakan. Pertama sekali, kecekapan taburan
serpihan grafin telah diperiksa oleh spektroskopi UV-vis. Kemudian, GCC dicirikan
dengan menggunakan Analisis Permeteran Gaviti Haba (TGA), Fourier Transform
Spektrometri Inframerah (FTIR), Pembelanan Sinar-X (XRD) dan Medan Pancaran
Mikroskop Pengimbasan Elektron (FESEM). Selepas itu, sifat rheologi pes simen segar
dengan pelbagai jenis grafin, kandungan grafin, kitaran kadar ricih, masa rehat dan
keadaan geometri telah disiasat. Data rheologi dipadankan dengan model Bingham,
model modifikasi Bingham, model Herschel-Bulkley dan model Casson untuk
menganggarkan sifat aliran GCC. Keberkesanan model rheologi ini dinyatakan dengan
ralat piawai. Ciri-ciri mekanikal telah dikaji untuk mortar simen grafin. Sifat-sifat elektrik
grafin telah digunakan untuk menilai ciri-ciri kesan deria-kerosakan GCC. Akhirnya,
aplikasi praktikal GCC telah dinilai dengan menguji rasuk konkrit bertetulang bersaiz
penuh (RC). Pelbagai tahap kerosakan teraruh di dalam rasuk RC untuk memantau tindak
Univers
ity of
Mala
ya

vi
balas GCC. Keputusan eksperimen menyimpulkan bahawa pengaduk magnetik 40 min
dalam kombinasi dengan ultrasonication 3 min memberikan hasil yang optimum. Selain
itu, grafin dengan kawasan permukaan yang tinggi dan kurang ketebalan mempunyai
penyebaran yang stabil dan seragam. Dari hasil TGA dan XRD, didapati penghidratan
yang lebih banyak berlaku disebabkan penggabungan grafin. Imej FESEM menunjukkan
bahawa serpihan grafin dengan permukaan permukaan yang tinggi berjaya memberikan
penghalang kepada penyebaran keretakan; selain itu, produk simen terhidrat tumbuh
dengan cara yang lebih teratur. Keputusan rheologi menunjukkan bahawa tekanan alah
dan kelikatan plastik meningkat dengan penambahan serpihan grafin dengan lebih
ketebalan serpihan dan masa rehat manakala nilai-nilai ini berkurangan untuk kitaran
kadar ricih yang lebih tinggi. Silinder konsentrik menganggarkan tegasan alah dan ralat
piawai yang lebih rendah berbanding dengan plat selari. Lebih-lebih lagi, model bukan
linear iaitu Herschel-Bulkley dan Modifikasi Bingham didapati sebagai model yang
paling sesuai. Sebagai perbandingan kepada sampel kawalan, GCC dengan ketebalan
serpihan yang lebih tinggi menunjukkan peningkatan 30.5% dalam kapasiti menanggung
beban dan peningkatan 113.5% dalam keseluruhan kegagalan terikan. Didapati bahawa
nilai rintangan elektrik untuk serpihan kawasan permukaan tinggi berkurang sebanyak
67.8% pada beban mampatan maksimum, dan oleh itu GCC boleh digunakan untuk
mengesan kerosakan dalam konkrit. Komposit simen grafin telah menentukan resistensi
elektrik terhadap pelbagai tahap kerosakan secara tepat dalam rasuk RC. Sebagai
rumusan, GCC mempunyai ciri-ciri yang lebih baik dan ia dapat meramal dengan
berkesan tindak balas terhadap perambatan retakan. Hasil daripada kajian ini adalah
sebagai prapenanda pembangunan bagi komposit pintar yang boleh digunakan sebagai
bahan binaan disamping dapat juga memantau kondisi struktur bagi struktur konkrit.
Kata kunci: komposit simen grafin, pencirian mikro-analitik, tingkah laku rheologi,
sifat-sifat piezo-resistif, swaderia.
Univers
ity of
Mala
ya

vii
ACKNOWLEDGEMENTS
First of all, I would like to express my gratitude to the Almighty Allah who has created
the whole universe, taught by pen and taught man that he knew not. I would like to extend
my gratefulness to my supervisors Associate Prof. Dr. Zainah Binti Ibrahim, Professor
Dr. Mohammed Jameel as well as Assistant Professor Dr. Shazim Ali Memon (Pakistan)
for their continuous support of my PhD study and research, for their patience, enthusiasm,
motivation and immense knowledge. I am especially grateful to my beloved Parents,
family and friends who have encouraged and supported me with continuous help
throughout the study.
Finally, I would like to acknowledge gratefully the University of Malaya for providing
me with the financial support from Fundamental Research Grant Scheme, Ministry of
Education, Malaysia (FRGS – Project No. FP028/2013A) and Postgraduate Research
Fund (PPP – Project No. PG217–2014B) to accomplish this work. I gratefully
acknowledge the privileges and opportunities offered by the University of Malaya. I also
express my gratitude to the staff of this institute as well as a University that helped directly
or indirectly to carry out my research work.
Univers
ity of
Mala
ya

viii
TABLE OF CONTENT
Abstract ............................................................................................................................ iii
Abstrak .............................................................................................................................. v
Acknowledgements ......................................................................................................... vii
Table of Content ............................................................................................................. viii
List of Figures ................................................................................................................ xiii
List of Tables................................................................................................................ xviii
List of Symbols and Abbreviations ................................................................................. xx
CHAPTER 1: INTRODUCTION .................................................................................. 1
1.1 Background of Study .................................................................................................. 1
1.2 Problem Statement ...................................................................................................... 4
1.3 Research Objectives .................................................................................................... 5
1.4 Scope and Limitation of Study .................................................................................... 6
1.5 Significance of Study .................................................................................................. 7
1.6 Outline of Thesis ......................................................................................................... 8
CHAPTER 2: LITERATURE REVIEW .................................................................... 10
2.1 Introduction ............................................................................................................... 10
2.2 Nanoengineered Materials ........................................................................................ 10
2.2.1 Zero-Dimensional Nanoparticles .................................................................. 12
2.2.2 One-Dimensional Nanoparticles ................................................................... 13
2.2.3 Two-Dimensional Nanoparticles .................................................................. 15
2.3 Dispersion of Nanoparticles ...................................................................................... 17
2.3.1 Dispersion Using Dispersant ........................................................................ 18
2.3.2 Dispersion using Ultrasonication .................................................................. 22
Univers
ity of
Mala
ya

ix
2.3.3 Assessment of Dispersion Efficiency Using UV-vis Spectrometry ............. 24
2.4 Characterization of Graphene Cement Composites .................................................. 26
2.4.1 Thermogravimetric Analysis (TGA) ............................................................ 27
2.4.2 Infrared Spectroscopic Analysis ................................................................... 31
2.4.3 X-ray Diffractometric Analysis .................................................................... 37
2.4.4 Morphological analysis ................................................................................. 41
2.5 Flow Properties of GNDs based Cement Paste ......................................................... 46
2.6 Rheological Models .................................................................................................. 48
2.6.1 Bingham Model ............................................................................................ 48
2.6.2 Herschel-Bulkley Model ............................................................................... 49
2.6.3 Modified Bingham Model ............................................................................ 51
2.6.4 Casson Model ............................................................................................... 51
2.6.5 Standard error ............................................................................................... 52
2.7 Mechanical Properties of Graphene Cement Composites ......................................... 53
2.8 Electrical Properties of Composite Materials ........................................................... 55
2.8.1 Self-sensing Properties of Nanomaterials Based Cement Composites......... 57
2.9 Industrial demand for self-sensing material .............................................................. 62
2.10 Research gap ........................................................................................................... 66
CHAPTER 3: MATERIALS AND METHODS ........................................................ 69
3.1 Introduction ............................................................................................................... 69
3.2 Research Materials .................................................................................................... 69
3.3 Experimental Methodology ....................................................................................... 71
3.3.1 Dispersion of Graphene ................................................................................ 71
3.3.2 Preparation of Graphene Cement Composite ............................................... 72
3.3.3 Preparation of GCC for Micro-scale Characterization ................................. 74
3.3.3.1 Thermogravimetric Analysis ............................................................ 75
Univers
ity of
Mala
ya

x
3.3.3.2 FTIR Spectrometry ........................................................................... 75
3.3.3.3 XRD Analysis .................................................................................. 76
3.3.3.4 FESEM Images ................................................................................ 77
3.3.4 Test Setup for Rheological Measurements ................................................... 78
3.3.5 Mechanical Properties of Graphene Cement Composites ............................ 82
3.3.6 Test Setup for Electrical Properties .............................................................. 83
3.4 Practical Application of Graphene Cement Composite ............................................ 86
3.4.1 Reinforced Concrete (RC) Beam .................................................................. 87
CHAPTER 4: RESULTS AND DISCUSSIONS ........................................................ 93
4.1 Introduction ............................................................................................................... 93
4.2 Dispersion Efficiency of Graphene ........................................................................... 93
4.2.1 Effect of Graphene Type on Dispersion Efficiency ..................................... 94
4.2.2 Effect of Superplasticizer on Dispersion Efficiency .................................... 95
4.2.3 Effect of Magnetic Stirring on Dispersion Efficiency .................................. 97
4.3 Micro-scale Characterization of Graphene Cement Composites ............................ 100
4.3.1 TGA/DTG Curves of Graphene Cement Composite .................................. 100
4.3.2 FTIR Analysis of Graphene Cement Composite ........................................ 109
4.3.3 XRD Analysis of Graphene Cement Composites ....................................... 117
4.3.4 Morphology of Graphene Cement Composites .......................................... 124
4.4 Rheology of Graphene Cement Paste ..................................................................... 127
4.4.1 Influence of Graphene on Yield Stress ....................................................... 128
4.4.2 Influence of Graphene on Plastic Viscosity................................................ 130
4.4.3 Standard Error Values................................................................................. 133
4.5 Dependence of Rheological Characteristics............................................................ 135
4.5.1 Variables Effecting Yield Stress ................................................................. 135
4.5.1.1 Effect of Graphene Percentage on Yield Stress ............................. 136
Univers
ity of
Mala
ya

xi
4.5.1.2 Effect of Shear Rate Range on Yield Stress ................................... 137
4.5.1.3 Effect of Resting Time on Yield Stress .......................................... 138
4.5.1.4 Effect of Superplasticizer on Yield Stress...................................... 139
4.5.1.5 Effect of Test Geometry on Yield Stress ....................................... 140
4.5.2 Variables Effecting Viscosity ..................................................................... 141
4.5.2.1 Impact of Graphene Percentage on Viscosity ................................ 141
4.5.2.2 Impact of Shear Rate Range on Viscosity ...................................... 142
4.5.2.3 Impact of Resting Time on Viscosity ............................................. 143
4.5.2.4 Impact of Superplasticizer on Viscosity......................................... 144
4.5.2.5 Impact of Test Geometry on Viscosity .......................................... 144
4.5.3 Variables Effecting Consistency and Power Rate Index ............................ 145
4.5.3.1 Effect of Graphene Percentage on Consistency and Power Rate Index
.................................................................................................................... 145
4.5.3.2 Effect of Shear Rate Range on Consistency and Power Rate
Index ........................................................................................................... 146
4.5.3.3 Effect of Resting Time on Consistency and Power Rate Index ..... 147
4.5.3.4 Effect of Superplasticizer on Consistency and Power Rate Index . 148
4.5.3.5 Effect of Test Geometry on Consistency and Power Rate Index ... 149
4.5.4 Effectiveness of Rheological Mathematical Models .................................. 149
4.6 Mechanical Properties of Graphene Cement Composite Mortar ............................ 151
4.6.1 Compressive Strength ................................................................................. 152
4.6.2 Flexural Strength ........................................................................................ 155
4.7 Properties of Graphene Cement Paste ..................................................................... 157
4.7.1 Workability ................................................................................................. 157
4.7.2 Hardened Density ....................................................................................... 158
4.7.3 Stress-Strain Curve ..................................................................................... 159
Univers
ity of
Mala
ya

xii
4.7.4 Influence of Graphene on Growth of Cracks .............................................. 163
4.8 Electrical Resistivity Values of Graphene Cement Composite .............................. 164
4.9 Application of Graphene Cement Composite in Laboratory .................................. 171
4.9.1 Reinforced Beam Subjected to Flexural Loading ....................................... 171
4.9.2 Reinforced Concrete Beam Subjected to Various Damage Levels ............ 174
4.10 Advantage of Graphene Cement Specimen .......................................................... 176
4.11 Conclusion ............................................................................................................ 180
CHAPTER 5: CONCLUSIONS AND RECOMMENDATIONS ........................... 183
5.1 Introduction ............................................................................................................. 183
5.2 Conclusions ............................................................................................................. 183
5.3 Recommendations ................................................................................................... 187
References ..................................................................................................................... 189
List of Publications ....................................................................................................... 209
Univers
ity of
Mala
ya

xiii
LIST OF FIGURES
Figure 2.1: Various structural forms of graphene (Kuilla et al., 2010). ......................... 11
Figure 2.2: UV–vis absorption spectra of different kinds of dispersant (Shah et al., 2009). ......................................................................................................... 19
Figure 2.3: Stability test for graphite suspension in various dispersant of liquid (Sixuan, 2012). ......................................................................................................... 20
Figure 2.4: Effect of the presence of water reducing agent to the dispersion of graphene sedimentation. (Wotring, 2014). ................................................................ 21
Figure 2.5: Schematic diagrams of dispersion action for graphite nanoparticles (Sixuan, 2012). ......................................................................................................... 22
Figure 2.6: Mechanism of graphene dispersant after ultrasonication (Sixuan, 2012). ... 23
Figure 2.7: UV-Vis spectroscopy absorbance spectra of GNP suspension with different methylcellulose (MC) concentrations (Wangaomin et al., 2016a). ........... 25
Figure 2.8: UV–vis absorption spectra of different types of CB dispersed in water (Shah., 2009) . ............................................................................................ 26
Figure 2.9: TGA curve of the cement paste (Kakali et al., 2000). .................................. 28
Figure 2.10: TGA curves of the different pastes cured for 28 days (Murugan et al., 2016). ......................................................................................................... 29
Figure 2.11: TGA curves of different samples after 90 days of curing (Sharma & Kothiyal, 2016). ......................................................................................... 30
Figure 2.12: TGA curves of plain and GNP-cement composite at various ages (Wangaomin et al., 2016a). ........................................................................ 31
Figure 2.13: FTIR spectra of control sample (plain cement paste) (Li et al., 2005) and graphene (Aunkor et al., 2015). ................................................................. 33
Figure 2.14: Typical FTIR spectra of 90-day cement matrix composites (Li et al., 2005). ................................................................................................................... 34
Figure 2.15: FTIR spectra of the different pastes cured for 28 days (Murugan et al., 2016). ......................................................................................................... 35
Figure 2.16: FTIR spectra of different samples after 2 min of preparation (Mollah et al., 2000). ......................................................................................................... 36
Figure 2.17: Analysis of XRD for control sample (Wangaomin et al., 2016a). ............. 37
Univers
ity of
Mala
ya

xiv
Figure 2.18: X-ray diffraction (XRD) patterns of plain cement paste and GNP-cement composite (Wangaomin et al., 2016a). ...................................................... 38
Figure 2.19: XRD pattern of the different pastes cured for 28 days (Murugan et al., 2016). ......................................................................................................... 39
Figure 2.20: X-ray diffractograms of different samples after 90 days of curing (Sharma & Kothiyal, 2016). ..................................................................................... 40
Figure 2.21: XRD pattern of graphene cement composites at various curing age (Cao et al., 2016). ................................................................................................... 40
Figure 2.22: SEM image of cement mixed with pristine graphene (Alkhateb et al., 2013). ......................................................................................................... 41
Figure 2.23: SEM images of cement composites at 28 days mixed with GO (Lv et al., 2013a). ....................................................................................................... 42
Figure 2.24: SEM images of cement hydration crystals with 0.03% GO with different hydration times (Lv et al., 2013a). ............................................................. 43
Figure 2.25: Description of flow-like crystal of the surface of sample obtained by method II (Cui et al., 2017). ....................................................................... 44
Figure 2.26: The effect of functionalized graphene flakes (FGN) to the cement composites after 28 days of curing (Cao et al., 2016). .............................. 45
Figure 2.27: Influence of fly ash on flow curves of graphene oxide cement paste (Wangin et al., 2017). ................................................................................ 48
Figure 2.28: The change in fractional resistivity against the time of the cyclic compressive stress (0-15kN) (Li et al., 2007a). ......................................... 59
Figure 2.29: The piezoresistivity behaviour of cement paste enhanced with 0.1% of carboxyl functionalized MWCNTs (Yu & Kwon, 2009). ......................... 60
Figure 2.30: The relationship between the relative crack depth and change in electrical resistance for the GNP reinforced cement mortar (Sixuan, 2012). ............ 61
Figure 2.31: The relationship between the electrical resistivity of the GNP cement mortar composite and its respective GNP content (Le et al., 2014). ......... 62
Figure 3.1: FESEM images of the graphene obtained from Graphene Laboratories, Inc. USA. .......................................................................................................... 70
Figure 3.2: Equipment used for; (a) dispersion of graphene and (b) dispersion measurement. ............................................................................................. 71
Figure 3.3: Equipment used for preparation of graphene-cement composite. ................ 72
Univers
ity of
Mala
ya

xv
Figure 3.4: Flow of hydraulic cement mortar. ................................................................ 73
Figure 3.5: Grinding process for remnant pieces of GCC .............................................. 74
Figure 3.6: TGA apparatus NETZSCH STA 449 F3 Jupiter. ........................................ 75
Figure 3.7: FTIR apparatus Perkin Elmer FTIR-spectrum 400 attached to computer system. ....................................................................................................... 76
Figure 3.8: PANalytical-Empyrean X-ray diffractometer. ............................................. 77
Figure 3.9: Hitachi SU70 Field emission scanning microscope (FESEM). .................... 78
Figure 3.10: Experimental setup for rheological measurements. .................................... 81
Figure 3.11: Testing setup for graphene cement composite. .......................................... 83
Figure 3.12: Dimensions of the graphene-cement composite specimen with wire mesh details. ........................................................................................................ 84
Figure 3.13: Schematic illustration of the electrical connections. .................................. 85
Figure 3.14: Measurement of electrical properties. ........................................................ 88
Figure 3.15: Details of reinforced concrete beam. .......................................................... 89
Figure 3.16: Sample placement and casting of the beam. ............................................... 90
Figure 3.17: Description of test setup in the laboratory. ................................................. 92
Figure 4.1: Absorbance spectra of graphene in aqueous solution. .................................. 94
Figure 4.2: Absorbance values for various graphene types at different time interval observed at 271 nm peak. .......................................................................... 95
Figure 4.3: Effect of superplasticizer on the absorbance values for various graphene types at different time interval observed at 271 nm peak. ......................... 96
Figure 4.4: Agglomeration of graphene in aqueous solution. ......................................... 97
Figure 4.5: Variation of absorbance peaks value of graphene types with different stirring time. ........................................................................................................... 98
Figure 4.6: Influence of superplasticizer on the absorbance peaks value of graphene types with different stirring time. .............................................................. 99
Figure 4.7: TGA/DTG curves for graphene cement composites. ................................. 103
Figure 4.8: TGA/DTA curves for graphene cement composites at 7 and 28 days after casting. ..................................................................................................... 105
Univers
ity of
Mala
ya

xvi
Figure 4.9: TGA/DTA curves for graphene cement composites added with superplasticizer. ....................................................................................... 108
Figure 4.10: FTIR spectra for graphene-cement composites. ....................................... 111
Figure 4.11: FTIR spectra for graphene-cement composites at 7, 28 and 90 days after casting. ..................................................................................................... 115
Figure 4.12: FTIR spectra for graphene cement composites added with superplasticizer. ................................................................................................................. 117
Figure 4.13: XRD spectra for graphene-cement composites. ....................................... 119
Figure 4.14: XRD spectra for cement composites at 7, 28 and 90 days after casting... 122
Figure 4.15: XRD spectra for graphene-cement composite added with superplasticizer. ................................................................................................................. 124
Figure 4.16: FESEM images of graphene-cement paste at 7 days and 28 days............ 126
Figure 4.17: FESEM images of graphene-cement paste. .............................................. 127
Figure 4.18: Effect of addition of graphene to the plastic viscosity of graphene-cement composite. ................................................................................................ 131
Figure 4.19: Determination of compressive stress for graphene cement mortar. ......... 153
Figure 4.20: Determination of flexural strength for graphene cement mortar. ............. 156
Figure 4.21: Effect of percentage of graphene on stress-strain curve of cement composite. ................................................................................................ 162
Figure 4.22: Effect of graphene on propagation of cracks. ........................................... 164
Figure 4.23: Fractional change in electrical resistance against the normalized compressive loading in graphene-cement composite. ............................. 167
Figure 4.24: Influence of graphene type on fractional change in resistance against the normalized compressive loading. ............................................................ 169
Figure 4.25: Fractional change in resistance against normalized compression load for various samples. ....................................................................................... 170
Figure 4.26: Fractional change in resistance of G1M3 specimen against applied flexural loading on the RC beam. .......................................................................... 172
Figure 4.27: Strain produced by applied flexural load. ................................................. 173
Figure 4.28: Resistivity values corresponding to different damage levels. .................. 175
Univers
ity of
Mala
ya

xvii
Figure 4.29: Schematic layout of structural health monitoring procedure, selection of method and potential remedial measure. ................................................. 179
Univers
ity of
Mala
ya

xviii
LIST OF TABLES
Table 2.1: UV-vis absorbance peak (C=C bonds) of reduced graphene oxide (rGO) at different reduction methods reported in previous literature. ........................ 25
Table 2.2: The influence of graphene and its derivatives on mechanical properties of cement based materials modified from Yang et al. (2017). ......................... 55
Table 2.3: Capabilities and limitations of Non-destructive test methods ...................... 63
Table 3.1: Chemical composition of cement................................................................... 70
Table 3.2: Properties of the graphene. ............................................................................ 70
Table 3.3: Mix proportions for graphene-cement paste. ................................................. 73
Table 3.4: Mix proportions for graphene-cement mortar................................................ 74
Table 3.5: Description of rheological samples using parallel plates. .............................. 79
Table 3.6: Description of rheological samples. ............................................................... 81
Table 3.7: Mix proportions for cement paste. ................................................................. 85
Table 3.8: Description of loading protocols and damage levels. .................................... 91
Table 4.1: Weight loss obtained from TGA/DTG and calculation of CH for different percentage of graphene-cement composites. .............................................. 101
Table 4.2: Weight loss obtained from TGA/DTA and calculation of CH for graphene cement composites at 7 and 28 days. ......................................................... 106
Table 4.3: Weight loss obtained from TGA/DTA and calculation of CH for graphene-cement composites added with superplasticizer......................................... 107
Table 4.4: Effect of graphene type on the yield stress values (Pa). .............................. 129
Table 4.5: Variation of yield stress values in terms of percentages. ............................. 129
Table 4.6: Variation of plastic viscosity values in terms of percentages. ..................... 132
Table 4.7: Effect of graphene to rate index and consistency. ....................................... 133
Table 4.8: Standard error of various model. ................................................................. 134
Table 4.9: Variation of standard error values of various models in terms of percentages. .................................................................................................................... 134
Table 4.10: Effect of graphene percentage on yield stress values. ............................... 137
Univers
ity of
Mala
ya

xix
Table 4.11: Effect of shear rate range on yield stress values. ....................................... 138
Table 4.12: Effect of resting time on yield stress values. ............................................. 139
Table 4.13: Effect of superplasticizer on yield stress values. ....................................... 140
Table 4.14: Effect of graphene on plastic viscosity values. ......................................... 142
Table 4.15: Effect of shear rate range on plastic viscosity. .......................................... 143
Table 4.16: Effect of resting time on plastic viscosity. ................................................. 143
Table 4.17: Effect of superplasticizer on plastic viscosity. ........................................... 144
Table 4.18: Effect of graphene on consistency and rate index values calculated by HB model. ......................................................................................................... 146
Table 4.19: Effect of shear rate range on consistency and rate index values. ............... 147
Table 4.20: Effect of resting time on consistency and rate index values. ..................... 148
Table 4.21: Effect of superplasticizer on consistency and rate index values. ............... 148
Table 4.22: Values of standard error for various rheological models. .......................... 150
Table 4.23: Compressive strength values estimated for graphene cement mortar. ....... 154
Table 4.24: Flexural strength values estimated for graphene cement mortar. .............. 157
Table 4.25: Flow diameter, maximum compressive load and corresponding resistivity values. ......................................................................................................... 158
Table 4.26: Detailed description of damage levels. ..................................................... 177
Univers
ity of
Mala
ya

xx
LIST OF SYMBOLS AND ABBREVIATIONS
0D : Zero-dimensional
1D : One-dimensional
2D : Two-dimensional
Ω : Ohm
ρ : Resistivity ohm-cm
ρo : Electrical resistivity at the start of the test
ρt : Electrical resistivity at the given time during the test
AC : Alternating current
AE : Acoustic emission
AFt : Ettringite
ASTM : American society for testing and materials
C2S : Belite
C3S : Alite
C4AF : Tetra calcium aluminate ferrite
CaCO3 : Calcium carbonate
Ca(OH)2 : Calcium hydroxide;
CB : Carbon black
CFRC : Carbon fibre reinforced cement composites
CH : Calcium hydroxide; Portlandite
CNCs : Cement mortar nanocomposites
CNTs : Carbon nanotubes
C-O : Carbon-Oxygen
C-OH : Carbon-hydroxide
CO2 : Carbon dioxide
Univers
ity of
Mala
ya

xxi
CSH : Calcium Silicate Hydrate
DC : Direct Current
DTA : Differential thermal analysis
DTG Differential thermal gravimetric
EDS Energy-dispersive X-ray Spectrometer
EDX : Energy-dispersive X-ray
ER : Electrical resistivity
FCR : Fractional change in resistance
FESEM : Field emission scanning electron microscopy
FGN : Functionalized graphene nanoplatelets
FRC : Fiber reinforced concrete
FTIR : Fourier transform infrared spectroscopy
GC : Graphene cement
GCC : Graphene cement composites
GPa : Giga Pascal = 109 Pa
GNDs : Graphene and its derivatives
GNP : Graphene nanoplatelet
GO : Graphene oxide
GONPs : Graphene oxide nanoplatelets
GPR : Ground penetrating radar
HB : Herschel–Bulkley
H-O-H : Hydrogen-oxygen-hydrogen
I : Electric current
ICDD : International Centre for Diffraction Data
IE : Impact echo
IR : Impulse response
Univers
ity of
Mala
ya

xxii
ITZ : Interfacial transition zone
KBr : Potassium bromide
kHz : Kilo Hartz
MC : Methylcellulose
MW : Molecular weight
MWCNTs : Multiwall carbon nanotubes
n : Power rate index
n-Al2O3 : Nano alumina
n-Fe2O3 : Nano-iron
n-SiO2 : Nano-silica
n-TiO2 : Nano-titania
NaDDBS : Sodium dedecylbenzenesulfonate
NCL : Normalized compressive loading
NDT : Non-destructive tests
OPC : Ordinary Portland Cement
P : Compressive loading at the given time during the test
Pmax : Maximum compressive loading throughout the whole test
PCC : Plain cement concrete
PCNT : Plain CNTs
PEG : Polyethylene Glycol
PGO : Pristine graphene oxide
RGO : Reduced graphite oxide
rGO : Reduced graphene oxide
∆R : Change in resistance
R : Electrical resistance
R0 : Initial resistance
Univers
ity of
Mala
ya

xxiii
∆R/ R0 : Fractional variations of resistance
RC : Reinforced concrete
S : Spacing
SEM : Scanning electron microscope
SHM : Structural health monitoring
Si-O : Silicon-oxygen
SP : Superplasticizer
SPCNT : Functionalized carbon nanotubes
SRC : Sulphate Resistant Cement
SWCNT : Single walled carbon nanotube
TPa : Tera Pascal = 1012 Pa
TGA : Thermogravimetric analysis
Triton X-100 : t-octylphenol decaethylene glycol ether
UV-vis : Ultraviolet-visible
V : Voltage
w/c : Water-cement ratio
WRA : Water reducing agent
XRD : X-ray Diffraction
Univers
ity of
Mala
ya

1
CHAPTER 1: INTRODUCTION
1.1 Background of Study
In civil engineering, almost every discipline encourages the use of cement-based
material to accommodate the ever-increasing demands for structural needs due to the rise
in population. The cementitious materials are mainly used to construct facility structures
such as bridges, houses, dams etc. to meet the needs of the escalating population.
Concrete is one of the major construction materials which has extensively used and
thoroughly studied (Barcelo et al., 2014). Concrete has many credentials which include
but not limited to (1) simple production process (2) rapid placement in any shape (3) low
development cost and (4) high compressive strength which outshined it in the
construction industry (Neville & Brooks, 1987). However, degradation, brittleness,
porosity, low tensile strength, cracks formation and poor resistance to propagation of
cracks are major drawbacks for hardened concrete (Birchall et al., 1981; Chuah et al.,
2014; Gopalakrishnan et al., 2011; Raki et al., 2010; Tyson, 2010).
In addition, consistency, homogeneity, workability and fluidity are the primary
elements that significantly based on the mixing and placing of fresh concrete. A little
inadequacy in these parameters will lead to segregation, bleeding, laitance and cracking
of the concrete (Zhang et al., 2016). Furthermore, the uneven growth of hydration
products formed a complex heterogeneous microstructure that becomes denser over time.
However, this complex structure becomes less dense due to interaction with aggregates
and thus, reduced the bond between cement matrix and subsequently create a platform
for the propagation of cracks (Raki et al., 2010). As a result, building structures
constructed with these cementitious materials will deteriorate over time due to the factors
such as materials ageing, overloading, excessive use, and environmental conditions
(Chong et al., 2003). Cement composite which overrules the above-mentioned
Univers
ity of
Mala
ya

2
shortcomings and integrated with functional applications, such as self-monitoring is the
need of this era. Therefore, with the advancement and application of new technologies,
demands on the innovative, smart and stronger cement composite becomes more intense.
In order to overcome these limitations, many attempts were being carried out to further
enhance the performance of cementitious material by incorporating fibers to manipulate
the properties of the cementitious composite (Juárez et al., 2007; Shah & Ouyang, 1991;
Topçu & Canbaz, 2007; Wang et al., 2012). Typical fibres lengths lie in the range of 3.5-
100 mm and diameters in the range of 0.1-1 mm. Since the 1960s, research works on
Fiber Reinforced Concrete (FRC) began in earnest and currently, FRC is being used
commonly for special applications. Although FRC increased the flexural strength,
fracture toughness and had the capability of replacing large cracks with a dense network
of microcracks, however, the fibres still fail to put a halt to the crack initiation at the
nanoscale (Chuah et al., 2014).
Over the last decade, nanotechnology had been seen as one of the most promising
technology to be incorporated in cement-based materials. Nanoengineered cementitious
composite means the methods of manipulating the structure at nanometre scale in order
to fabricate a new kind of tailored multifunctional cementitious composite. Several
researchers investigated the influence of various engineered nanomaterials on cement
composite (Konsta et al., 2010; Ormsby et al., 2011; Shang et al., 2015). Nanoengineered
cementitious composites have excellent mechanical properties and durability including
other novel properties such as low electrical resistivity, high ductility, self-crack control
and most importantly the capability of self-sensing (Sanchez & Sobolev, 2010). These
cement composites are not only mechanically strong but also brings out its potential
functionalities i.e. stops the initiation of crack at a nanoscale level, which overcomes the
Univers
ity of
Mala
ya

3
limitation of FRC. As a matter of fact, nanotechnology has made a paradigm shift in the
cement-based reinforcing behaviour from macroscopic level to nanoscopic level. In
reality, nano-engineered cementitious composites provided the solution strategies to
overcome the problems faced by the ordinary building materials.
Graphene is one of the nanomaterials that has been widely focused. Graphene
possesses some amazing and extraordinary properties such as huge specific surface area
(2630 m2g− 1), high intrinsic strength (130 GPa), firm Young’s modulus (~1.0 TPa) and
high electrical transport properties (Lee et al., 2008). Therefore, incorporation of
graphene in cement composite will alter the microstructural, mechanical, rheological
characteristics and electrical properties of the composite. The rheological properties of
the cement paste are directly related to the workability, flowability and consistency of the
concrete. Most of the recent researches were focused on the rolled sheets of graphene and
its derivatives (GNDs) i.e. carbon nanotubes (CNTs) and graphene oxide (GO) (Shang et
al., 2015; Wang et al., 2017; Wang et al., 2016). However, the rheological properties of
graphene cement paste remained unexplored and rarely reported. Therefore, an in-depth
knowledge of the connection of graphene and rheology of cement paste is still to be
discovered. It is known that the cement based composite reinforced with conducting
fillers i.e. carbon nanotubes and graphene can observe its own strain by monitoring the
changes in the electrical resistivity values (Chung, 2002). These conducting filler
significantly reduce the electrical resistivity values of the cement composite. Self-sensing
ability is related to the breaking of conducting fibres i.e. when cracks are initiating in the
cement based composite consequently, enhancing the electrical resistivity of the overall
sample. The electrical properties of the graphene cement composites (GCC) are important
and can be used to monitor the damage in a concrete structure for the purpose of
maintaining safe, reliable and sustainable civil infrastructure.
Univers
ity of
Mala
ya
4
Most of the existing researches were focused on the graphene oxide and carbon
nanotubes based cement composites and less emphasize was given to the graphene based
cement composites. Furthermore, it has been found that current studies were engrossed
in the mechanical properties such as compressive strength, flexural strength and tensile
strength of GCC. However, some other important material properties e.g. microstructural
characterization, rheological behaviour, cracks bridging and damage memorizing of
graphene cement composite are yet to be explored to get maximum benefits attributed
from this composite in civil engineering.
Therefore, in this study, characterization of graphene cement composite was explored
by using micro-analytical analysis. Crack bridging phenomena were observed using
microscopic images. Flow properties were determined using rheological mathematical
models. Self-sensing and piezoresistive characteristics were discovered using electrical
properties and; damage-memorization was studied by applying controlled damages to the
specimen.
1.2 Problem Statement
Ordinary cement based construction materials have porosity, brittleness, low tensile
strength, poor resistance to crack formation and propagation (Neville & Brooks, 1987).
Due to this civil infrastructure begins to deteriorate once they are built and used.
Maintaining safe and reliable civil infrastructures for daily use is important for the well-
being of humankind. Operation and maintenance of build structures become more
complex with the increased age. With progress in nanotechnology, the idea of
manufacturing innovative, smart and strong cement composite came into existence i.e.
graphene cement composites (GCC). Recent advances in nanomaterials have led to new
Univers
ity of
Mala
ya

5
possibilities in health monitoring techniques. Before application of GCC in a civil
industry few research questions arise:
Will GCC possess superior characteristics and overcome the deficiencies encountered
by the ordinary cement based building materials?
Will the flow properties of GCC remain same as plain cement?
Is it possible that graphene flakes modify the electrical resistivity of the cementitious
material and introduce the strain sensing functional property in GCC?
Can real-time damage monitoring be easily possible by using these GCC specimens?
Will damage memorization characteristics be present in GCC smart specimens?
Is this demand to develop the novel smart material with self-sensing characteristics
really evolved from construction industry?
In order to provide answers to the above-mentioned questions, there will be a need to
explore the properties of GCC in the laboratory. A comprehensive research study is
required to investigate the influence of graphene on the micro-analytical, mechanical,
rheological and self-sensing characteristics of the composite material.
1.3 Research Objectives
This study is conducted to evaluate the multifunctional properties of graphene based
cement composites. Moreover, development of strong composite materials which possess
sensing capabilities. This research tried to quantify the techniques for damage
memorization by incorporating the graphene cement composite in concrete structures. In
order to achieve the above aims, the specific research objectives are planned as follows:
Univers
ity of
Mala
ya
6
(1) To determine the dispersion efficiency and micro-analytical characteristics of
graphene based cement composites.
(2) To evaluate the rheological properties, compressive and flexural strengths of the
graphene based cement composites.
(3) To investigate the piezoresistivity and self-sensing properties of graphene based
cement composites.
(4) To evaluate the potential application of graphene based cement composite for
structural health monitoring of concrete structures.
1.4 Scope and Limitation of Study
This underlying objective of this research is to evaluate the multifunctional properties
of graphene based cement composites. Therefore, the scope and limitations of this study
are defined as:
1. Only three different types of graphene based on surface area and lateral flake
thickness were used to investigate the characteristics of graphene based cement
composite. Dispersion efficiency of graphene in aqueous solution is studied using
Ultraviolet-visible (UV-vis) spectroscopy only.
2. Characterization of graphene cement composite is performed using only
Thermogravimetric Analysis (TGA), Fourier Transform Infrared (FTIR)
Spectrometry, X-ray Diffraction (XRD) Spectroscopy, Field Emission Scanning
Electron Microscopy (FESEM) images and Energy-Dispersive X-ray (EDX)
analysis.
3. Rheological properties were investigated for the graphene cement paste using
Bingham, Modified Bingham, Herschel–Bulkley (HB) and Casson models. Flow
properties were inspected for all samples using smooth parallel plates. In addition,
Univers
ity of
Mala
ya
7
the different content of graphene, different shear rate cycles, resting time and test
geometries were considered as only factors affecting the rheology of cement paste.
4. Graphene cement mortar was only used to investigate the compressive strength and
flexural strength of the composite. Fresh and hardened properties of cement paste
and mortar are measured according to American Society for Testing and Materials
(ASTM) standards.
5. Piezoresistive properties of graphene cement paste were only investigated for
graphene cement composite. The potential application of graphene cement
composite embedded in the reinforced concrete beam was investigated.
1.5 Significance of Study
This research is performed to explore the multifunctional properties of graphene based
cement composite in civil engineering. It was found that a very few researches have been
done using graphene nanomaterial. Morphology and microstructural characterization
have been reported rarely in literature for graphene based cement composite. Effect of
surface area, lateral size and flake thickness of graphene flakes on cement composite have
not been examined. The rheological properties of graphene cement composite have not
been investigated as yet. Effect of shear rate range, resting time, superplasticizer and
different test geometries on the rheology of graphene cement composite have not been
explored. Therefore, in this study microstructural, rheological and mechanical properties
of GCC were determined. Furthermore, Piezoresistive characteristics of GCC were
investigated for various sizes of graphene flakes. Smart sensors using graphene based
cement composites were developed which possess the damage-sensing characteristics
and can significantly detect the propagation of cracks. This sensor is compatible with the
concrete and can easily embed in concrete structures for the lifetime of the structural
member. It will provide the real-time damage sensing characteristics as well as damage
Univers
ity of
Mala
ya
8
memorizing capability. The development cost of this smart sensor is very minimal hence,
it will provide the economical solution for the health monitoring of concrete structures.
1.6 Outline of Thesis
This thesis consists of five chapters. These chapters are arranged in such a manner that
it provides an easiness for the reader to not only understand the goals and scope of the
research but also provides complete understanding about the method employed along
with materials used to accomplish the research objectives. A brief description of each
chapter is provided as under.
The introductory chapter, i.e. chapter 1 discusses the weaknesses of concrete material
along with techniques used to overcome these weaknesses. Introduction of advanced
nanotechnology in the civil engineering field is also discussed. It mentions the importance
of the health monitoring of concrete structures and highlights the necessity of self-sensing
cementitious material as well. Research question and problem statement are given in this
chapter. Lastly, research objectives and the significance are also included in this chapter.
Literature review i.e. chapter 2 comprises of extensively reviewed academic writings
pertains to the research title. Information regarding the application of nanotechnology and
nanomaterials in civil engineering field has been presented in this chapter. Dispersion
efficiency and its dependence on several parameters have also been provided along with
microscale characteristics of nanomaterial-based cement composite. Moreover, flow
characteristics of GNDs based cement composite and various mathematical models used
to estimate the logical parameters are also presented. Mechanical properties followed by
electrical and piezoresistivity properties of nanomaterial-based cement composite was
Univers
ity of
Mala
ya

9
given. Lastly, GNDs based cement composite sensors and their potential application are
described.
Methods and procedures used to conduct this research have been explained in chapter
3. Materials, different equipment and procedure used in preparing GCC are described.
Specimen preparation for the micro-scale characterization, rheological, mechanical and
electrical properties of the composite material are presented. Moreover, experimental test
protocols and testing standards are given as well. Design mixes and mix proportions are
explained using tabular information. Lastly, the experimental setup for the potential
application of GCC in concrete structures is described.
An in-depth analysis of the obtained results is presented in chapter 4 of this
dissertation. This chapter is designed from the sequence of experimental work.
Experimental and analytical analysis of the GCC has been presented. Effects of graphene
flakes on the microstructural properties of the hydrated cement products have been
explored. Flow properties of the nanomaterial-based cement composite have been
calculated. Electrical and piezoresistivity characteristics of composite material have been
observed. Practical application of the nanomaterial-based composite on the concrete
reinforced beam and concrete-filled steel tubes has been discussed. All the presented
results have been explained and discussed in this chapter.
Overall findings of the experimental work have been summarized in chapter 5. A
correlation has been drawn between the obtained results and objectives of this research.
The outcomes of the research study have been presented and recommendations for
possible future work have been mentioned in this chapter.
Univers
ity of
Mala
ya

10
CHAPTER 2: LITERATURE REVIEW
2.1 Introduction
This chapter provides an overview of other related studies, their mode of approach and
outcomes. The literature has been reviewed through a sound collection of related Ph.D.
and Master thesis, journal articles, reports, conference papers, internet sources and books.
Moreover, a substantial amount of relevant information has been collected through
personal contact via emails, researchgate and at various forums with the key researchers
around the world in this research area.
2.2 Nanoengineered Materials
Construction industry plays a key role in economic development of any country.
Nowadays, concrete is the most widely used construction material (20-35 billion tons
annually) (Barcelo et al., 2014) in the world and its use is increasing day by day because
of its various beneficial properties such as high strength, durability and resistance to fire
(Kodur & Sultan, 2003). However, its low tensile strength and brittleness are the major
drawback of concrete (Birchall et al., 1981). In order to overcome the shortcomings of
the construction field, researchers used different materials and techniques (Bessaies et al.,
2016; Flatt & Houst, 2001; Hanehara & Yamada, 1999; Zhang et al., 2010). Chemical
admixtures (Bessaies et al., 2016; Flatt & Houst, 2001; Hanehara & Yamada, 1999;
Zhang et al., 2010) and supplementary cementitious material (Lothenbach et al., 2011;
Richardson & Groves, 1997; Shi & Qian, 2000) and fibers, (Chung, 2001; Dawood &
Ramli, 2011; Juárez et al., 2007; Topçu & Canbaz, 2007) were used to delay the
development of micro-cracks and improve tensile strength. Size of these fillers
diminished from the macro-scale to micro and now nanoscale. With advancement in
nanotechnology now nano size cracks (pores with diameter < 20 nm) can control before
developing micro size cracks (Konsta et al., 2010). There have been many recent studies
Univers
ity of
Mala
ya

11
on newly produced nanomaterials such as nanosilica, nanotitanium oxide, nanoiron
oxide, carbon nanotubes and graphene oxide sheets (Abrishami & Zahabi, 2016; Cao et
al., 2016; Chuah et al., 2014; Gong et al., 2014; Li et al., 2017). These newly developed
engineered nanomaterials are classified according to their morphology: zero-dimensional
(0D) nanoparticles (spherical shape and low aspect ratio) i.e. nanosilica, nano-alumina
and nano-iron, one-dimensional (1D) fibers (straight and high aspect ratio) i.e. carbon
fibers and CNTs; and two-dimensional (2D) sheets i.e. graphene and graphene oxide
(Chuah et al., 2014). Figure 2.1 shows the schematic diagrams of these nanomaterials.
These engineered materials are used in construction industry to overcome its weaknesses.
Addition of these nanomaterials not only enhance their mechanical properties but also
improves their electrical, thermal and electromagnetic properties as well (Sun et al.,
2013).
(a) Wrapped honeycomb structure of zero-dimensional graphene
(b) Rolled honeycomb structure forms of one-dimensional graphene
(c) Single planar structure of two-dimensional graphene
(d) Stacked honeycomb structure of three-dimensional graphite
Figure 2.1: Various structural forms of graphene (Kuilla et al., 2010).
Univers
ity of
Mala
ya

12
2.2.1 Zero-Dimensional Nanoparticles
Application of zero-dimensional nanoparticles in concrete and mortar are well
explained by Sanchez &Sobolev (2010). Figure 2.1 (a) presents the wrapped honeycomb
structure and schematic diagrams of zero-dimensional graphene nanoparticle. 143%
increment in elastic modulus of mortar was noted by incorporating 5% of nano- alumina
(n-Al2O3) by Li et al. (2006). Nano-alumina also move-down the porosity and move-up
the density degree of the interfacial transition zone (ITZ). It was due to filling ability of
nano-alumina in pores of loose structure around fine aggregate during calcium silicate
hydrate (CSH) gel formation. However, the very limited effect was seen on compressive
strength and no novel properties have been reported. Effect of Nano-iron (n-Fe2O3) in the
mortar was explored by (Li et al., 2004a; Li et al., 2004b). Nano-iron enhanced not only
the mechanical properties of the mortar but also electrical properties. 45% volume
resistance of cement mortar decreases with 5% n-Fe2O3 as compared to that of the plain
cement mortar (Li et al., 2004a). Li et al. (2004a) found that n-Fe2O3 did not decrease the
electrical resistivity of mortar cubes and made them more durable mortar/structures.
However, fractional variations of the resistance (∆R/R0) versus stress (in stress direction)
was sharp with more percentage of nanoparticles which makes it more sensitive to
monitor its own compressive stress. Such sensing capabilities are invaluable for real-time,
structural health monitoring and for the construction of smart structures (which don’t use
embedded or attached sensors) (Sanchez & Sobolev, 2010). Nano-Fe2O3 is a type of
semiconducting material that absorbs energy, and the energy gap of nanoparticles is
narrowed down when a compressive force is applied to the mortar specimen, which
makes the electrons of nanoparticles transit easily to enhance the electrical conductivity
of nanoparticles (Li et al., 2004a).
Univers
ity of
Mala
ya

13
Li et al. (2006b) performed his study on the abrasion resistance of concrete by using
nano-titania (n-TiO2) and nano-silica (n-SiO2). Around 90% abrasion resistance was
enhanced by incorporating 5% binder content of n-TiO2 and n-SiO2. Authors determined
that abrasion resistance, compressive strength and flexural strength of nanoparticles based
concrete was increased as compared to plain concrete, however, with increasing
percentage of nanoparticles degradation in compressive and flexural strength was
observed. It was due to the presence of more micro-cracks and less workability in
concrete (Li et al., 2006b). Senff et al. (2009) and Jo et al. (2007) used n-SiO2 in a cement
matrix. Nano-silica has a low aspect ratio (particle form), with average particle diameter
40 nm (Jo et al., 2007) and with a specific surface area of 300 m2/g (Senff et al., 2009).
This huge surface area greatly affects the cement hydration, workability and flow of
concrete. By containing 2.5 % nano-silica in mortars reduction of 32.8% in the spread
diameter was observed as compared to plain mortar (Senff et al., 2009). Zero-dimensional
nanoparticles lack the ability to arrest micro-cracks due to low aspect ratio, uniform
mixing and weak zones formation in concrete increases especially when used in large
amount.
2.2.2 One-Dimensional Nanoparticles
When compared to zero-dimensional nanoparticles, spherical shape one-dimensional
nanofibers have high aspect ratio i.e. carbon nanotubes. Single wall carbon nanotubes
have normally diameter in the range from 1-3 nm whereas, multi-walled carbon
nanotubes have diameter of 5-50 nm (Agrawal et al., 2007). Length of these nanotubes
varies from micrometre to centimetres, which form aspect ratio more than 1000 also
multi-walled carbon nanotubes (MWCNTs) possessed surface area around 400 m2/g (Han
et al., 2015). Han et al. (2015) in his review paper mentioned that CNTs have high elastic
modulus 1TPa, tensile strength 10-60 GPa and 50-500 GPa for single and multi-walled
Univers
ity of
Mala
ya

14
respectively and electrical resistance 5-50 µΩcm. With these amazing properties, when
CNTs were mixed with cement, it enhanced the properties of cementitious materials
(Konsta et al., 2010). Konsta et al. (2010) noted the 25% increase in flexural strength of
CNT-cement composite. Li et al. (2005) found the increase in compressive strength by
19%, flexural strength by 25% and 64% lower porosity by addition of 0.5%
functionalized CNTs. Moreover, pores with size more than 50 nm diameter were 82%
less as compared to plain cement concrete. Nevertheless, the problem with CNTs is non-
uniform dispersion and weak bonding between CNTs and the cement mix. CNTs are
produced in entanglements consisting of few hundred individual CNTs due to strong Van
der Waals forces between particles cause formation of agglomeration and bundles in the
composite. These agglomerate leads to the formation of defects and limits the
modification effect (Ma et al., 2010). That’s why, even after decades of research on CNTs
its full potential as reinforcement has been severely limited (Ma et al., 2010). Lv et al.
(2013a), Cwirzen et al. (2009) and Cwirzen (2010) found the decline in mechanical
properties of composite due to non-uniform dispersion, worst workability, higher
inhomogeneity and porosity. At the higher concentration of carbon nanotubes, water
demand of the paste increased and a higher concentration of the superplasticizer is
required due to the high surface area and wrapping of CNTs with superplasticizer
(Kowald & Trettin, 2004). Besides this, another problem which limits the use of CNTs is
a weak bond between the CNTs and cement matrix. In a research conducted by Cwirzen
et al. (2009), even by using surfactants and achieving uniform dispersion in the mix, no
major effect was recorded on mechanical properties of the composite mix in contrast with
pure cement mix. It was most probably due to the very low bond strength of the CNT-
cement matrix, and nanotubes were easily pulled out in fractured cement paste specimens.
It was suggested by Cwirzen et al. (2009) that functionalization, use of surfactants,
superplasticizer, polymers and polar impurities should provide chemical bonding with
Univers
ity of
Mala
ya

15
cement beside the uniform dispersion. These nanotubes are considered as graphene sheets
rolled into a tube shape. Rolled honeycomb structure forms one-dimensional graphene
i.e. carbon nanotubes are given in Figure 2.1 (b).
2.2.3 Two-Dimensional Nanoparticles
In contrast to CNTs, graphene and graphene oxide are the two-dimension sheet-like
structure and have large surface area. GO has a thickness of single atomic layer while
lateral dimension up to tens of micrometres, which provide large surface area and high
aspect ratio (Kim et al., 2010). It has been observed by the researchers that by
incorporating GO, polymer properties i.e. electrical, thermal and gas barrier remarkably
enhanced (Kim et al., 2010; Ramanathan et al., 2008). Furthermore, Lv et al. (2013a)
reported that a rise in tensile strength by 78.6%, flexure strength by 60.7% and
compressive strength by 38.9 % with 0.03% dosage of GO with 29.75% oxygen content
in cement mortar. At the microscopic level, they observed the flower-like crystals, which
benefits enhanced toughness. Pan et al. (2015) used 0.05% GO by weight of cement in
the mix design. 41.7 % reduced workability was found in mini-slump test, due to the large
surface area of GO, same as slump reported for the workability of CNT-cement paste
(Collins et al., 2012) i.e. workability reduced to 48.9% by addition of 2% of CNT with
water to cement ratio of 0.5. GO is the antecedent of graphene with a mixture of carboxyl,
epoxy and/or hydroxyl functionalities (Wilson et al., 2009). Furthermore, the interatomic
spacing in GO is, to an accuracy of better than 0.5%, identical to that of graphene (Wilson
et al., 2009). Extensive research has been conducted on GO-based cement composites by
the researchers, however, very less focus is given to graphene cement composite.
In 2004, Novoselov et al. (2004) extracted single atom thick crystallites from bulk
graphite. They pulled graphene layer from graphite and transferred them onto thin silicon
Univers
ity of
Mala
ya

16
dioxide on a silicon wafer in a process called Scotch Tape technique (Novoselov et al.,
2004). This method can achieve the thickness of graphene up to 0.00001 inches as stated
by Zhang et al. (2005). In 2010, Geim and Novoselov received Nobel Prize in Physics
for their research on graphene. Graphene is the thinnest material of the earth (Ferrari et
al., 2006; Lee et al., 2008). It is a plane ribbon of sp2 interacted carbon which is tightly
confined into a honeycomb lattice. Boehm et al. (1962) made a conclusion that the
graphene is one of the allotropes of carbon with two-dimensional properties. Graphene
has a single planar sheet of sp2 and densely packed in a honeycomb. The honeycomb
pattern of graphene is looked similar with another allotrope of carbon (Kuilla et al., 2010).
The structural relationship between graphene and various other forms are shown in Figure
2.1. Figure 2.1 (c) shows that graphene is arranged in a single planar sheet and Figure 2.1
(d) presents the stacked honeycomb structure forms of three-dimensional graphite. Each
atom has four bonds, one σ-bond with each of its three neighbours and one π-bond that is
oriented out of the lace. Graphene’s hexagonal can be regarded as two interleaving
triangular lattices. As mention before, graphene’s stability is due to its high packed carbon
atoms and sp2 orbital hybridization- a combination of orbitals s, px and py that constitute
the σ-bond and pz the π-bond. The reason for the presence of electrical properties of
graphene is the half-filled band that permits free-moving electrons. The π-bonds
hybridize together to form the π-band and π*-band which responsible for the electrical
properties of graphene (Cooper et al., 2012).
Recently, this 2D flat sheet of carbon has conquered huge amount of interest in the
scientific community. Because it possesses some amazing and extraordinary properties
such as huge specific surface area (2630 m2 g− 1) (Zhu et al., 2010), high intrinsic strength
(130 GPa) (Lee et al., 2008), sensitivity to detect single gas molecule (Katsnelson et al.,
2009), firm Young’s module (~1.0 TPa) (Geim & Novoselov, 2007; Lee et al., 2009; Mak
Univers
ity of
Mala
ya
17
et al., 2010) and high thermal conductivity (~5000 Wm-1K-1) (Balandin et al., 2008; Lin
et al., 2010). These unique and tremendous characteristics of graphene opened a new
window for a wide range of applications. The large exposed surface area of graphene
sheets have strong capability to form a strong physical and chemical bond with cement
matrix. Rafiee et al. (2010) mentioned that unzipping the multi-walled carbon nanotubes
into graphene sheets results in significant improvement because of an extraordinary
increase in interfacial area and geometry of graphene sheets as compared to multi-walled
carbon nanotubes. Rafiee et al. (2010) also found that 30% increment in Young’s modulus
and 22% rise in ultimate tensile strength of graphene-composite against the same amount
of multi-walled carbon nanotubes composite. Conversely, graphene has a very high
production cost and also have difficulties in the dispersion. Therefore, application of
graphene is restricted and limited in civil infrastructure especially like bridges, dams and
buildings due to low scale production (Alkhateb et al., 2013). Actually, graphene sheets
are naturally available and only required to exfoliate them from the graphite (Segal,
2009). Exfoliation of graphite into graphene can be obtained by using chemical and
mechanical techniques (Novoselov et al., 2012). For the mass scale production of
graphene, the optimum method will be chemical oxidation and reduction of graphite
(Aunkor et al., 2015). This method is considered as faster, easier, scalable, economic,
facile and dynamic as compared to other methods (Aunkor et al., 2015). Keeping in view
the importance of uniform dispersion of nanomaterials, next section discusses as to how
we would achieve the full benefits of uniformly dispersed graphene in civil engineering.
2.3 Dispersion of Nanoparticles
Dispersion is the major challenge involved in fabricating cementitious nanocomposite
because van de Waals force causes agglomeration of the nanoparticles (Grobert, 2007).
Dispersion of nanomaterials in aqueous solution is an important step and significantly
Univers
ity of
Mala
ya

18
alters the hardened properties (Ubertini et al., 2014). In aqueous solution, nanomaterials
tend to precipitate or float on the surface. Graphene is hydrophobic in nature and it formed
the agglomerates in aqueous solution and caused non-uniform dispersion (Munz et al.,
2015). According to Hamann & Clemens (1973), a poor dispersion will lead to the
formation of a defect in the composite matrix and limit the effect of the nanoparticles.
Most of the research on the dispersion of graphene and graphite nanoparticles was
focused on surface modification, such as oxidation, or inclusion of other nanoparticles in
the suspension. Geng et al. (2009) oxidized the graphene nanoplatelets (GNPs) to make
graphene oxide, then reduced these graphene oxidized particles, and dispersed them in
water. Li et al. (2014) also wrote that the oxygen containing functional groups on the
graphene oxide could lead to stable dispersions due to electrostatic repulsion between the
oxidized graphene oxide particles. As noted by Peyvandi et al. (2013) covalent surface
modification, including oxidation, damages the atomic structure of the graphene flakes
and can reduce the strength. Other methods of dispersion are needed to preserve the
structure of the graphene flakes. This field is yet to be explored as minimal research on
the dispersion of non-covalently modified GNPs in water has been reported. Therefore,
to improve the dispersion of graphene flakes keeping the atomic structure safe in the
cement matrix, different techniques and the effect of different type of solvent has been
reviewed in this section.
2.3.1 Dispersion Using Dispersant
As graphene flakes are hydrophobic and tend to form coagulation in the aqueous
solution, therefore, numerous researchers used different dispersants to obtain stable
suspension. Stankovich et al. (2006) reduced graphite oxide (RGO) flakes in the presence
of polysodium styrenesulfonate. These polysodium styrenesulfonate coated graphite
nanoparticles, which consisted of multiple layers of graphene, remained in suspension.
Univers
ity of
Mala
ya

19
Lu et al. (2010) used polyelectrolytes as dispersal aids with GNPs in water. Lu et al.
(2010) wrote that this method of dispersal preserves the structure of the GNPs and allows
the full exploitation of the properties of these nanoparticles. Shah et al. (2009) studied the
dispersion of carbon black (CB) in the presence of five dispersants including t-
octylphenol decaethylene glycol ether (Triton X-100, MW = 647), sodium
dedecylbenzenesulfonate (NaDDBS, MW = 348.47), Tween 80, Dispex G40 and Dispex
N40. They concluded that optimum dispersant was Triton X-100 as it showed the highest
absorption peak in UV-vis absorption spectra as shown in Figure 2.2. Triton X-100 is a
surfactant molecule containing an aliphatic chain and a short hydrophilic PEG unit.
Binding of surfactant molecules to the surface of carbon nanomaterial is mostly driven
by hydrophobic interactions.
(1) Dispex N40,
(2) Dispex G40,
(3) NaDDBS,
(4) Tween 80,
(5) Triton X-100
Figure 2.2: UV–vis absorption spectra of different kinds of dispersant (Shah et al., 2009).
Sixuan (2012), used the acetone, Gum Arabic and Darex Super 20 solvent as a
dispersant for graphite flakes in water solution. The stability and homogeneity of graphite
suspensions with respect to time using various dispersing agents were tested by visual
inspection. Figure 2.3, presents the dispersion of graphite flakes in different dispersants.
Stability of graphite flakes were assessed by observing the colour of the solution. Usually,
Univers
ity of
Mala
ya

20
the dispersant and distilled water are colourless and after inducing the graphene the colour
changed to black. Based on Figure 2.3, the graphite flakes in Darex Super 20 and Gum
Arabic showed the good stability and colour of the solution remained unchanged after 30
min of mixing. However, in acetone and water solution the graphite deposited at the
bottom of the test tube. Gum Arabic is a natural polysaccharide and available in the form
of white powder. It is extremely soluble in the water. For Gum Arabic, its weak acidity
made it reactive in the alkaline cementitious environment, which resulted in the
generation of excess water during mixing. It brought watery mixture with light graphite
nanoparticles floating on top. Besides, Darex Super 20 is the naphthalene sulfonate based
high water-reducing superplasticizer and exhibited a good stability dispersant with
minimal alteration on the fresh mixture. Therefore, Sixuan (2012) concluded that Darex
Super 20 is the best dispersant for the graphite flakes in cement matrix.
(a) 5 min (b) 30 min
Figure 2.3: Stability test for graphite suspension in various dispersant of liquid (Sixuan, 2012).
In 2014, Wotring (2014) investigated the dispersion behaviour of GNP in water with
high range water reducing admixture. Water-cement (w/c) ratio was kept as 0.5, graphene
dosage was 0.1% by weight of cement paste and AdvaCast 575 polycarboxylates based
high range water reducing admixture in the range of 0-10 times the weight of graphene
Univers
ity of
Mala
ya

21
flakes. According to Wotring (2014), the water reducing agent (WRA) was able to
maintain the stability of graphene in the solvent. When the dosage of water reducing agent
increased, the stability also increased. By visual observations, it was found that the WRA
to GNP ratio of 3% was stable until 7 days as shown in Figure 2.4 (Wotring, 2014). While
good stability was observed after 24 hours for other ratios of WRA to GNP.
0 h 24 h
7 days
From left to right, the vials have WRA/GNP ratios of 0, 1, 1.5, 2, 2.5 and 3
Figure 2.4: Effect of the presence of water reducing agent to the dispersion of graphene sedimentation. (Wotring, 2014).
Recently, Silva et al. (2017) used the analytical grade isopropanol alcohol blended
with the expanded graphite structures in a 1-1 ratio. Authors found that the combination
of multilayer graphene sheets and isopropanol produced the excellent dispersion. Han et
al. (2017) used the polycarboxylate superplasticizer (Sike ViscoCrete 3301E) to disperse
multi layered graphene in aqueous solution and found that the graphene flakes did not
form agglomerations.
Dispersion mechanism for dispersant and graphene flakes was explained by Sixuan
(2012). Sixuan (2012) stated that the organic molecules in the dispersant are negatively-
charged and absorbed mainly at the interface of water and graphite. The graphite surface
Univers
ity of
Mala
ya

22
initially possessed the residual charges on their surfaces. When these graphite
nanoparticles were mixed with liquid solution, they formed the flocculated structures.
The flocculation of the graphite particles occurred due to the electrostatics interactions
exerted by the adjacent graphite particles of the opposite charges as seen in Figure 2.5
(a). After that, the dispersant was used to neutralize these residual charges and made the
entire surface to carry the same charges. Lastly, the particles of graphite flakes remained
fully dispersed in the suspension of the liquid due to the repulsion of the graphite
nanoparticles as seen in Figure 2.5 (b) (Sixuan, 2012).
(a) Flocculated graphite flakes
(b) Uniformly dispersed graphite
Figure 2.5: Schematic diagrams of dispersion action for graphite nanoparticles (Sixuan, 2012).
2.3.2 Dispersion using Ultrasonication
The sonication is the act of applying energy to agitate particles in a sample. The
ultrasonication is referred to the waves having frequency more than 20 kHz. The primary
part of a sonication device is the ultrasonic electric generator. This device creates a signal
(usually around 20 kHz) that powers a transducer and it converts the electric signal to
mechanical vibrations. These vibrations are further amplified by the sonicator and passed
to the probe (Sixuan, 2012). The sonication probe transmits the vibrations to the solution.
The rapid movement of the probe creates cavitation effect. Cavitation occurs when the
vibrations create a series of microscopic bubbles in the solution, pockets of space wedged
Univers
ity of
Mala
ya

23
between the molecules that form and collapse continuously under the weight of the
solution. Constant formation and collapse of thousands of these bubbles create the
powerful waves of vibration that pass through the solution and break apart the particles
(Li et al., 2007). The energy that had been delivered to the graphene flakes respectively
lead to the wreckage of the interlayer π-bond. Hence, exfoliated graphene flakes can be
attained with higher aspect ratio, decreased thickness and improved mobility of particles
as shown in Figure 2.6. The maximum size of the bubble being produced in liquid is
dependent on the frequency of ultrasonication. A low-frequency ultrasonication will
generate large size bubbles and vice versa. Higher energy forces are being produced upon
the collapse of the large-sized bubbles in the solution (Sixuan, 2012).
Figure 2.6: Mechanism of graphene dispersant after ultrasonication (Sixuan, 2012).
In 2014, Mehrali et al. (2014) sonicated graphene flakes in distilled water with a high-
powered probe sonicator. The graphene flakes remained stable in suspension for 600
hours. Han et al. (2017) used the ultrasonication for 1 hour to achieve the uniform
dispersion. Silva et al. (2017) employed the analytical grade isopropanol alcohol blended
with the expanded graphite structures in 1-1 ratio and solution was further ultra-sonicated
for 2 hours and achieve the excellent dispersion.
Univers
ity of
Mala
ya

24
2.3.3 Assessment of Dispersion Efficiency Using UV-vis Spectrometry
Ultraviolet-visible spectroscopy (UV-vis) refers to absorption or reflectance
spectroscopy in the ultraviolet-visible spectral region. Jiang et al. (2003) used the UV-vis
measurements for the quantitative characterization of the colloidal stability of CNTs
dispersion. In UV-vis spectral range carbon nanomaterials showed the absorption
characteristics and it is attributed to the electronic transitions between the bonding and
anti-bonding π orbital. (Liu & Horrocks, 2002). Jäger et al. (1999) stated that the σ–σ*
transitions are anticipated in the ultraviolet range of 60–100 nm, meanwhile the π–π*
transitions observed in 180–280 nm range. Due to this reason application of UV-vis
spectroscopy has been utilized tremendously by the researchers for rGO as shown in
Table 2.1. Wang et al. (2016) used graphene flakes in cement composite with water to
cement ratio of 0.35, GNP-cement ratio of 0.05% by weight of cement with different
concentration of dispersant Methylcellulose (MC) ranging from 0.2 g/L to 1.0 g/L. It was
noted in Figure 2.7 that for different mixes the highest peak of GNP-suspension was
found at 260 nm wavelength in UV-vis spectra. Similarly, an absorption peak at 270 nm
was observed in the UV-vis absorption spectrum of graphene, which is generally regarded
as the excitation of the π-plasmon of the graphitic structure (Aunkor et al., 2015).
Moreover, Aunkor et al. (2015) state that the absorption peak value depends on the
concentration of dispersed graphene sheets. Shah et al. (2009) studied the dispersion of
carbon black using UV-vis spectroscopy and determined the increase in UV-vis
absorption related to the surface area of nanomaterials (Figure 2.8). They used four types
of carbon black with the varying surface area and determined the highest dispersion
values for CB having highest surface area. Chen et al. (2011), Thakur & Karak (2012),
Lei et al. (2011), Li et al. (2013), and Xu et al. (2010) reported the absorbance peaks for
rGO near 271 nm using UV-vis spectroscopy as shown in Table 2.1.
Univers
ity of
Mala
ya

25
Table 2.1: UV-vis absorbance peak (C=C bonds) of reduced graphene oxide (rGO) at different reduction methods reported in previous literature.
π-π* transition of rGO References 275 nm Lei et al., 2011 273 nm Li et al., 2013 273 nm Lei et al., 2011 272 nm Mei & Ouyang, 2011 271 nm Xu et al., 2010 271 nm Wang et al., 2011
270.9 nm Thakur & Karak, 2012 270 nm Chen et al., 2011 269 nm Khai et al., 2013 269 nm Peng et al., 2012 269 nm Tran et al., 2014 267 nm Bose et al., 2012 266 nm Pham et al., 2012 265 nm Gurunathan et al., 2013 264 nm Zhang et al., 2010 263 nm Khanra et al., 2012 261 nm Zhu et al., 2010 260 nm Liu et al., 2011
Figure 2.7: UV-Vis spectroscopy absorbance spectra of GNP suspension with different methylcellulose (MC) concentrations (Wang et al., 2016).
Univers
ity of
Mala
ya
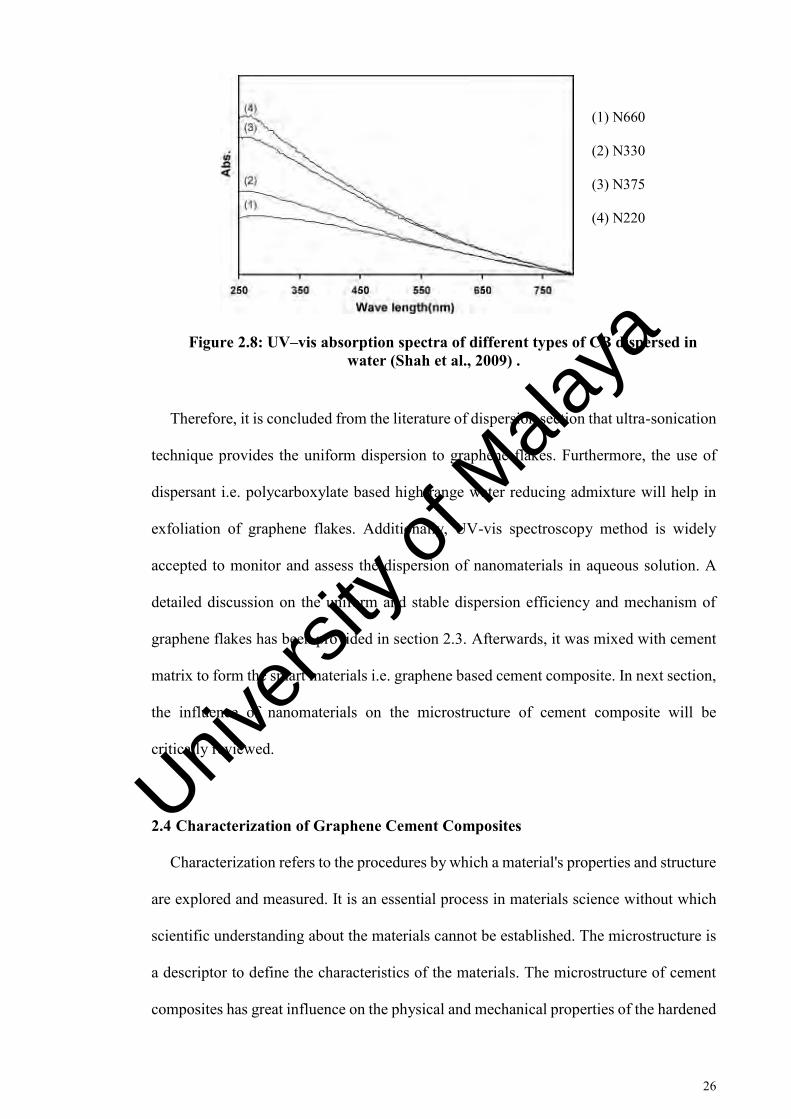
26
(1) N660
(2) N330
(3) N375
(4) N220
Figure 2.8: UV–vis absorption spectra of different types of CB dispersed in water (Shah et al., 2009) .
Therefore, it is concluded from the literature of dispersion section that ultra-sonication
technique provides the uniform dispersion to graphene flakes. Furthermore, the use of
dispersant i.e. polycarboxylate based high range water reducing admixture will help in
exfoliation of graphene flakes. Additionally, UV-vis spectroscopy method is widely
accepted to monitor and assess the dispersion of nanomaterials in aqueous solution. A
detailed discussion on the uniform and stable dispersion efficiency and mechanism of
graphene flakes has been provided in section 2.3. Afterwards, it was mixed with cement
matrix to form the smart materials i.e. graphene based cement composite. In next section,
the influence of nanomaterials on the microstructure of cement composite will be
critically reviewed.
2.4 Characterization of Graphene Cement Composites
Characterization refers to the procedures by which a material's properties and structure
are explored and measured. It is an essential process in materials science without which
scientific understanding about the materials cannot be established. The microstructure is
a descriptor to define the characteristics of the materials. The microstructure of cement
composites has great influence on the physical and mechanical properties of the hardened
Univers
ity of
Mala
ya

27
concrete structure. Any alteration in the microstructure will describe the new
characteristics of materials. Therefore, it is important to investigate the characteristics of
the nanomaterial based cement composite. The characteristics of nanomaterials based
cement composite were explored by (a) Thermogravimetric analysis (TGA); (b) Infrared
spectroscopic analysis; (c) X-ray diffractometric (XRD) analysis; and (d) Morphological
analysis.
2.4.1 Thermogravimetric Analysis (TGA)
Thermal analysis is a technique that measures the change in the properties of materials
as a function of temperature and these changes are called thermal events (Leng, 2009).
Thermogravimetric analysis is mainly used to examine the decomposition of materials by
monitoring mass change with temperature with a constant rate of heating and as a function
of time. TGA was used to determine the behaviour of construction materials at elevated
temperature (Alarcon et al., 2005; Midgley, 1978). In the analysis, TGA curves are able
to provide a quantitative measurement of mass change in materials associated with
thermal degradation. According to available literature, few reactions occur due to heating
of the hardened cement materials (a) 180-300 ᴼC bonded water loss from CSH and
carboaluminate hydrate, (b) 430-480 ᴼC dehydroxylation of portlandite (calcium
hydroxide) and (c) 600-780 ᴼC decarbonation of calcium carbonate (Bernal et al., 2016;
Karim et al., 2016; Khoury, 1992; Nonnet et al., 1999; Ortego et al., 1989; Xu et al., 2015;
Zhou & Glasser, 2001). A typical TGA curve for cement composite at 28-day age is
presented in Figure 2.9. Important regions were marked in Figure 2.9 and weight loss
corresponding to these regions are marked as 1, 2 and 3. Point 1, 2 and 3 are in the region
from 180-300 ᴼC, 430-480 ᴼC and 600-780 ᴼC respectively. Gravimetric changes due to
decomposition of Ca(OH)2 and CaCO3 are indicated by the regions 2 and 3 marked in
TGA plot. The presence of CaCO3 is also ascribed from the conversion of hydrated lime
Univers
ity of
Mala
ya

28
due to carbonation. Region 2 is attributed to the removal of H2O from the Ca(OH)2 while
region 3 corresponds to the removal of CO2 from the CaCO3. Law of conversion of mass
calculations was used to determine the amount of calcium hydroxide (CH) from the mass
changes of TGA plot (Murugan et al., 2016). Chemical reactions are assumed as
𝐶𝑎(𝑂𝐻)2 → 𝐶𝑎𝑂 + 𝐻2 (2.1)
𝐶𝑎𝐶𝑂3 → 𝐶𝑎𝑂 + 𝐶𝑂2 (2.2)
𝐶𝑎(𝑂𝐻)2 + 𝐶𝑂2 → 𝐶𝑎𝐶𝑂3 + 𝐻2𝑂 (2.3)
The molecular mass ratio was used to measure the amount of CH. Values from
Equation 2.1 and Equation 2.3 were added to estimate the total amount of CH (Murugan
et al., 2016).
Figure 2.9: TGA curve of the cement paste (Kakali et al., 2000).
Murugan et al. (2016), performed experimental work by using reduced graphene oxide
(rGO), n-Al2O3 and n-SiO2 in cement composite. Reduced graphene oxide, nano-alumina,
P
1 P
2 P
3
Univers
ity of
Mala
ya

29
and nano-silica were added 0.02, 0.20 and 4.0 % by weight of cement respectively. The
TGA curves of the cement paste with different nanocomposites and the control paste
cured for 28 days are shown in Figure 2.10. It was noted that potential quantity of
portlandite was approximately same in rGO and n-Al2O3 pastes in contrast with the
control matrix. However, in the case of n-SiO2, less amount of portlandite was recorded
due to the pozzolanic reactivity which caused rapid conversion of CH to CSH products.
Figure 2.10: TGA curves of the different pastes cured for 28 days (Murugan et al., 2016).
Effects of pristine graphene oxide (PGO) and graphene oxide flakes (GONPs)
(produced from ball-milling) were investigated by Sharma & Kothiyal (2016). Sharma &
Kothiyal (2016) used 0.10% and 0.125% of PGO and GONPs in mix design with water
cement ratio of 0.45. Figure 2.11 presents the TGA curves for control sample, 0.125% of
PGO-cement mortar nanocomposites (PGO-CNCs) and GONPs-CNCs obtained after 90
days of curing. The weight loss corresponding to CH in control mix, 0.125PGO-CNC and
0.125GONP-CNC were calculated to be 12.7%, 10.8% and 5.3% respectively. The final
Univers
ity of
Mala
ya

30
weight loss in TGA curve for graphene oxide based cement mortar was slightly more as
compared to control mix due to the inherent thermal conductive properties of graphene
oxide as shown in Figure 2.11 (Sharma & Kothiyal, 2016).
Figure 2.11: TGA curves of different samples after 90 days of curing (Sharma & Kothiyal, 2016).
Wang et al. (2016) observed the variation in TGA curve after addition of graphene to
the cement paste. Figure 2.12 showed the TGA curve for plain cement and GNP-cement
composite at 7-day and 28-day after casting as investigated by Wang et al. (2016).
According to Wang et al. (2016), the curves of two samples had a similar trend at various
ages, however, the graphene flakes accelerated the hydration process of cement. At 7-
day, the contents of hydrated cement products i.e. CSH and Ca(OH)2 in GNP-cement
composite was higher than the plain cement phase. After 28 days of curing, the content
of both samples was nearly equal. Therefore, it was concluded that GNPs enhanced the
hydrated cement products at an early age.
Univers
ity of
Mala
ya

31
(a) 7- days
(b) 28-days
Figure 2.12: TGA curves of plain and GNP-cement composite at various ages (Wang et al., 2016).
2.4.2 Infrared Spectroscopic Analysis
Vibrational spectroscopy is a technique to analyse the structure of molecules by
examining the interaction between electromagnetic radiation and nuclear vibrations in
molecules. According to Leng (2009), vibrational spectroscopy used electromagnetic
waves with longer wavelengths, in the order of 10−7 m. Vibrational spectroscopy detects
the molecular vibrations by the absorption of infrared light or by the inelastic scattering
of light by a molecule (Leng, 2009). FTIR is an infrared spectroscopy in which the Fourier
Univers
ity of
Mala
ya

32
transform method is used to obtain infrared spectrum in a whole range of wavenumbers.
It provides the useful information about the possible chemical and physical interaction
(Mollah et al., 2000). FTIR spectra of 28-day cement paste and graphene are given in
Figure 2.13. The spectrum of a control sample (Figure 2.13 (a)) showed peaks at 3375
cm-1 (H-O-H stretching of CSH), 1014 cm-1 (Si-O asymmetric stretching vibrations of
CSH), 460 cm-1 (Si-O in-plane vibration of CSH), 690 cm-1 (Si-O out of plane vibration
of CSH), 1410 cm-1, 874 cm-1 and 712 cm-1(C-O stretching of CO3-2), 1630 cm-1 and
3430 cm-1 (H-O-H stretching of ettringite), 695 cm-1 (S-O bending vibration of SO4-2),
2299 cm-1 and 2075 cm-1 (C=O, C=C, O=O) (Bensted & Varma, 1974; Horgnies et al.,
2013; Mollah et al., 2000; Ortego et al., 1989). In graphene spectra (Figure 2.13 (b))
besides these peaks two further peaks were present at 1570 cm-1 (sp2 hybridized C=C),
2918 cm-1 and 2850 cm-1 (symmetric and asymmetric stretching vibration of –CH2) point
out the sp2 network (Naeimi & Golestanzadeh, 2015). According to Mollah et al. (2000),
FTIR spectra can be divided into three regions; a) water region (>1600 cm-1), the sulphate
region (1100-1150 cm-1), and the material region (<1000 cm-1). Spectral data varies by
the incorporation of different nanomaterials and analyses of these changes will yield the
useful information. Shifting of these bands implies the stronger bonding, formation of
hydrated products and polymerization in hydrated products (Mollah et al., 2000; Smith,
2011). Variation in the absorbance intensities provides the information about the quantity
of material (Smith, 2011). Univers
ity of
Mala
ya
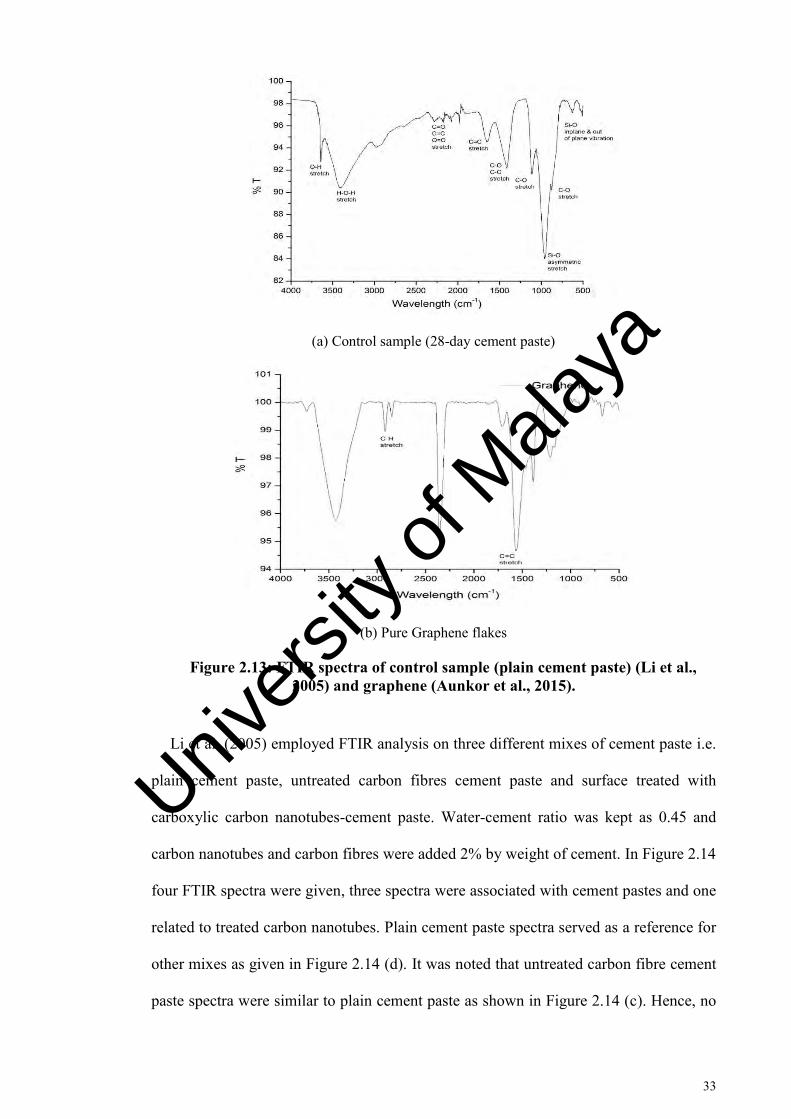
33
(a) Control sample (28-day cement paste)
(b) Pure Graphene flakes
Figure 2.13: FTIR spectra of control sample (plain cement paste) (Li et al., 2005) and graphene (Aunkor et al., 2015).
Li et al. (2005) employed FTIR analysis on three different mixes of cement paste i.e.
plain cement paste, untreated carbon fibres cement paste and surface treated with
carboxylic carbon nanotubes-cement paste. Water-cement ratio was kept as 0.45 and
carbon nanotubes and carbon fibres were added 2% by weight of cement. In Figure 2.14
four FTIR spectra were given, three spectra were associated with cement pastes and one
related to treated carbon nanotubes. Plain cement paste spectra served as a reference for
other mixes as given in Figure 2.14 (d). It was noted that untreated carbon fibre cement
paste spectra were similar to plain cement paste as shown in Figure 2.14 (c). Hence, no
Univers
ity of
Mala
ya

34
chemical interaction and new phase formation were recorded. As surface treatment of
carbon nanotubes involved chemical interaction. Therefore, in Figure 2.14 (a) spectra
displayed the peaks at 1733 cm-1 and 1118 cm-1 corresponds to C=O stretching of
carboxylic acid and C-OH stretch of hydroxyl. These peaks confirmed that various
oxygen containing groups attached to the surface of CNTs. When these surface treated
carbon nanotubes were added to cement paste chemical interaction took place as shown
in Figure 2.14 (b). A positive shift in a spectral peak at 1756 cm-1 by 22 cm-1 indicated
the possible existence of carboxylate and disappearance of a peak at 3643 cm-1 specified
the chemical interaction between hydrated cement products with oxygen groups of
carboxylic acid attached with carbon nanotubes. Also, the variation in spectral shape in
CSH region indicates the variation in CSH phases due to functionalization of carbon
nanotubes.
(a) carboxylic carbon nanotubes ; (b) carboxylic carbon nanotubes-cement paste ; (c) carbon fibres cement paste ; (d) plain cement paste
Figure 2.14: Typical FTIR spectra of 90-day cement matrix composites (Li et al., 2005).
Univers
ity of
Mala
ya

35
The influence of rGO, n-Al2O3 and n-SiO2 in cement composite was investigated by
Murugan et al. (2016). Figure 2.15 presents the IR spectra of these cement pastes. Authors
did not notice any major difference in IR spectra’s. In these spectra’s, free water peak
was found at ∼1645 cm−1 attributed to O-H bend, ettringite peak at ∼1118 cm−1 due to
S-O stretch, silicates peaks at ∼ 950 cm−1 due to Si-O asymmetric stretch in all cement
pastes after 28-days of curing. Calcite peaks which are indicative of carbonation were
recorded at ∼1414 cm−1 and ∼874 cm−1 attributed to C-O stretch and C-O bend vibration
respectively in all mixes.
Figure 2.15: FTIR spectra of the different pastes cured for 28 days (Murugan et al., 2016).
Early age hydration process and influence of superplasticizer (SP) i.e. sodium
lignosulfonate on cement paste was examined using infrared spectroscopic by Mollah et
al. (2000). Specimens were studied immediately in the range of 2 min to 24 hours after
preparation. Water to cement ratio was maintained at 0.4 and SP dosage by 1% of cement
Univers
ity of
Mala
ya

36
weight. When hydration process started for cement then, infrared spectral data altered as
observed in Figure 2.16. Mollah et al. (2000) determined that due to hydration reaction
of cement paste few peaks appeared in water region i.e. > 1600 cm-1. In air cured
specimen (Figure 2.16 (c)) hydrogen-bonded OH species (O-H–O-H) were found at 3405
cm−1, while OH band from Ca(OH)2 was seen at 3645 cm−1. Argon cured cement
specimen (Figure 2.16 (d)) had the same peak pattern as an air cured specimen. In SP
added hydrated cement specimen additional peak appeared due to surface-bonded OH
groups at 3610 cm−1. Authors found that these bands mostly disappeared with the progress
in hydration duration when analysed after 2 min to 24 hours. They also found the shift in
bending vibrational band by 40 cm−1 units at 1,630 cm−1 peak in the presence of SP. The
shifting of the H-O-H bending vibration indicates greater restriction and stronger bonding
between the host structure and water molecules. In sulphate region (1100-1150 cm-1)
spectral peaks gradually shifted to the strong sulphate band due to the formation of
ettringite. The shifting of Si-O asymmetric stretching (ν3), Si-O out-of-plane bending
vibration (ν4) and in-plane bending vibrations (ν2) indicate polymerization of the silicate.
(a) pure dry sodium
lignosulfonate
(b) dry cement
(c) hydrated cement
prepared in the air
(d) hydrated cement
prepared in argon
(e) SP-added hydrated
cement prepared in air.
Figure 2.16: FTIR spectra of different samples after 2 min of preparation (Mollah et al., 2000).
Univers
ity of
Mala
ya

37
2.4.3 X-ray Diffractometric Analysis
X-ray diffractometer was discovered in 1912 and widely used for determining the
crystalline structure of materials (Leng, 2009). It identifies the chemical compounds from
the crystalline structure, meaning that various mixtures having same crystalline structure
but different chemical formulas could be identified. The XRD pattern of control sample
at 28-day age is given in Figure 2.17. These XRD patterns and interpretation of
corresponding crystalline phases were used to evaluate the hydration reactions (Jadhav &
Debnath, 2011). The hexagonal platy crystal of calcium hydroxide (CH) was found in
control sample at 18.3o, 28.9o, 34.5o, 47.1o, 50.8o and 54.3o (Trezza, 2007). It was known
that the amount of CH can be used as an indicator to determine the degree of hydration
(Trezza, 2007). Due to amorphous nature of CSH gel, its detection in XRD spectra is
limited (Sharma & Kothiyal, 2016). Therefore, the presence of unhydrated cement
contents i.e. alite (C3S) and belite (C2S) can be used as an indicator for estimating the
amount of produced CSH gel. The peaks of C3S were observed at 29.4o, 32.2o, and 51.8o
(Jadhav & Debnath, 2011). The peaks of C2S were observed in control sample at 32.6o
and 41.1o. Besides that, the other hydration products such as ettringite were observed at
15.7 o and 23.0 o which can use determined the rate of hydration of cement.
Figure 2.17: Analysis of XRD for control sample (Wang et al., 2016).
Univers
ity of
Mala
ya

38
Wang et al. (2016) investigated the influence of graphene flakes in cement composite
keeping water to cement ratio constant of 0.35 and graphene to cement ratio of 0.05%.
XRD patterns of control sample and cement paste with graphene flakes at age of 7 and
28 days after casting were given in Figure 2.18. Authors observed that no new phases
were found after the incorporation of graphene in the cement mix. Hence, the type and
structure of final hydration products remained same. However, the XRD spectra
characterize the degree of hydration process. Peak intensities of hydrated cement products
i.e. calcium hydroxide and ettringite (AFt) were higher in graphene cement composite as
compared to plain cement. The intensity of unhydrated cement content i.e. alite (C3S) was
also found lower in graphene cement composite. The authors conclude that graphene
flakes accelerated the hydration process of cement paste, especially at an early age.
Nevertheless, final hydration products in type and structure remained unaffected.
(a) 7-day (b) 28-day
Figure 2.18: X-ray diffraction (XRD) patterns of plain cement paste and GNP-cement composite (Wang et al., 2016).
Influence of various nanomaterials i.e. nanosilica, nano alumina and reduced graphene
oxide in cement composite was investigated by Murugan et al. (2016). XRD spectra of
these cement composites were given in Figure 2.19. Murugan et al. (2016) observed that
the XRD spectra of nanomaterials based cement composite were similar to the plain
Univers
ity of
Mala
ya
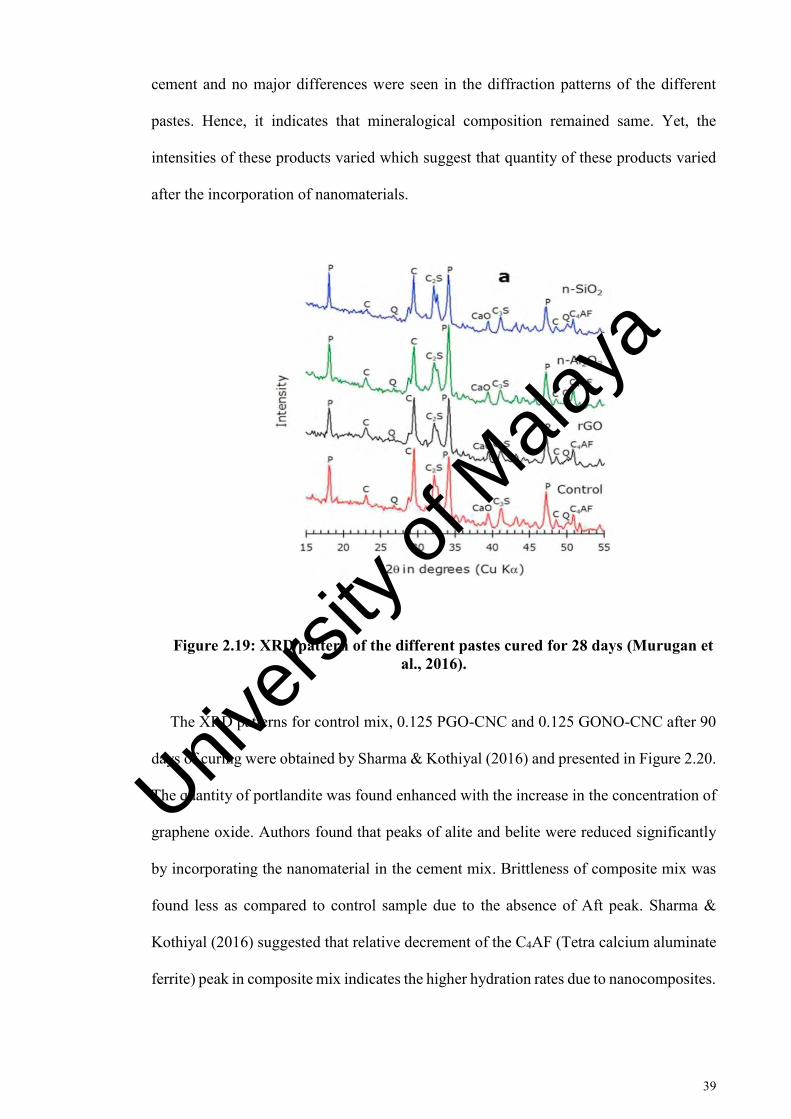
39
cement and no major differences were seen in the diffraction patterns of the different
pastes. Hence, it indicates that mineralogical composition remained same. Yet, the
intensities of these products varied which suggest that quantity of these products varied
after the incorporation of nanomaterials.
Figure 2.19: XRD pattern of the different pastes cured for 28 days (Murugan et al., 2016).
The XRD patterns for control mix, 0.125 PGO-CNC and 0.125 GONO-CNC after 90
days of curing were obtained by Sharma & Kothiyal (2016) and presented in Figure 2.20.
The quantity of portlandite was found enhanced with the increase in the concentration of
graphene oxide. Authors found that peaks of alite and belite were reduced significantly
by incorporating the nanomaterial in the cement mix. Brittleness of composite mix was
found less as compared to control sample due to the absence of Aft peak. Sharma &
Kothiyal (2016) suggested that relative decrement of the C4AF (Tetra calcium aluminate
ferrite) peak in composite mix indicates the higher hydration rates due to nanocomposites.
Univers
ity of
Mala
ya

40
Figure 2.20: X-ray diffractograms of different samples after 90 days of curing (Sharma & Kothiyal, 2016).
Influence of functionalized graphene flakes on mortar composite was explored by Cao
et al. (2016). Functionalized graphene flakes were added 0.02% by the mass fraction of
cement in mix design (labelled as N2) keeping water to cement ratio 0.5 and sand to
cement ratio 3.0. XRD patterns were recorded for the control sample (PO) and N2 sample
at 3-day and 28-day after curing as shown in Figure 2.21.
Figure 2.21: XRD pattern of graphene cement composites at various curing age (Cao et al., 2016).
Univers
ity of
Mala
ya

41
Both XRD patterns were similar to each other and demonstrate that chemical
composition of hydration products remained same, however, peak intensities of these
patterns were varying. Hydrated cement peaks were found higher in the N2 mix as
compared to PO. Therefore, Cao et al. (2016) concluded that functionalized graphene
nanosheets have a significant role in promoting the growth of hydrated products.
2.4.4 Morphological analysis
Lastly, for microscale characterization, the focus was given on the morphological
analysis. For this purpose, field emission scanning electron microscopy was incorporated
which was used in material sciences to investigate molecular surface structures and their
properties.
(a) x 4000
(b) x 6500
Figure 2.22: SEM image of cement mixed with pristine graphene (Alkhateb et al., 2013).
Alkhateb et al. (2013) used SEM images to locate the graphene in cement composite.
Authors observed that high-density CSH was formed near pristine graphene flakes as
shown in Figure 2.22. Therefore, they concluded that high interfacial strength is available
between CSH and graphene flakes. Furthermore, microstructure and pattern of hydrated
crystals of graphene oxide based cement composite were investigated by Lv et al.
(2013a). Figure 2.23 showed the SEM images of fractured surfaces as found by Lv et al.
Univers
ity of
Mala
ya

42
(2013a). Authors reported the disorderly stacked hydration products in plain cement paste
(Figure 2.23 (a)). Whereas, increasing percentage of GO in cement composite resulted in
the formation of flower-like crystals as shown in Figure 2.23 (b) and Figure 2.23 (c).
These flower-like crystals became denser with the increase in graphene oxide percentage
up to 0.03% (Figure 2.23 (d)). For 0.04% dosage of GO irregular polyhedral resembling
shaped appeared for hydrated products (Figure 2.23 (e)) and for 0.05%, it became regular
and complete polyhedral shapes (Figure 2.23 (f)). As per authors, these flower-like
crystals enhanced the toughness while polyhedron like crystals contributed to
compressive strength.
(A) no GO; (B) GO 0.01%; (C) 0.02%; (D) 0.03%; (E) 0.04%; and (F) 0.05%
Figure 2.23: SEM images of cement composites at 28 days mixed with GO (Lv et al., 2013a).
Lv et al. (2013a) concluded that GO regulated the cement hydration process and
formed the regular flower-like and polyhedral like crystals. Furthermore, the effect of
hydration time was also investigated for 0.03% of GO cement composite as shown in
Univers
ity of
Mala
ya

43
Figure 2.24. GO encourage the formation of the flower-like structure after 1 day of casting
and on 28-day these crystals became perfect and large flower-like shape as shown in
Figure 2.24 (d). Therefore, it was confirmed that graphene oxide regulated the hydration
crystals in flower-like shape and these shaped have a tendency to form massive and
compact structure through the cross-linking of flower-like crystals.
(A) 1 day; (B) 3 days; (C) 7 days; (D) 28 days; (E) 60 days; and (F) 90 days
Figure 2.24: SEM images of cement hydration crystals with 0.03% GO with different hydration times (Lv et al., 2013a).
Cui et al. (2017) determined that the chemical composition of flower-like crystal and
polyhedral like hydrated crystal as reported in Lv et al. (2013a). They found that these
are calcium carbonates, which are due to the carbonation of cementitious hydrates and
not the product formed by cement hydration. Cui et al. (2017) anticipated that there might
be a possible pitfall in sample preparation for scanning electron microscope (SEM)
analysis by Lv et al. (2013a), which resulted in the formation of flower-like crystals. To
prove this statement, Cui et al. (2017) performed experimental work using carbon
Univers
ity of
Mala
ya

44
nanotubes with –COOH functional group. They collected two samples for SEM analysis
from the same mother cube using two methods. For method I, obtained sample was oven
dried for 24 hours and then cooled down to room temperature for SEM analysis. For
method II, obtained sample was placed in natural environment for 7 days. After that
sample was oven dried and then cooled for SEM analysis. Figure 2.25 showed the SEM
image and XRD pattern of the specimen obtained from method II. It was clearly
distinguished that calcite peaks were prominent in Figure 2.25 (b). Thus, Cui et al. (2017)
recommended further research on the regulation mechanism of graphene oxide on cement
hydration as proposed by Lv et al. (2013a).
(a) SEM image (b) XRD results
Figure 2.25: Description of flow-like crystal of the surface of sample obtained by method II (Cui et al., 2017).
Cao et al. (2016) stated that the structure of the hydrated cement products showed the
disorderly formation of needle-shaped ettringite and hexagonal calcium hydroxide as
shown in Figure 2.26 (a). After addition of functionalized graphene flakes (FGN) in mix
design, the structure of hydrated cement products become more compact and less needle-
shaped crystals were seen (Figure 2.26 (b)). When graphene percentage increased to
0.02%, it formed the polyhedron shape (Figure 2.26 (c)) and represents the compacted
Univers
ity of
Mala
ya

45
structure and certain space to absorb movement simultaneously. However, when the high
content of graphene was used i.e.0.03% to 0.05%, the degree of hydration product
decreased due to the attachment of hydrophilic groups on the surface of graphene flakes,
which absorbed some part of the available water and prevented the full hydration process
of cement pastes (Figure 2.26 (d)-(f)) (Cao et al., 2016).
(a) No FGN; (b) 0.01% FGN; (c) 0.02% FGN; (d) 0.03% FGN; (e) 0.04% FGN; (f) 0.05% FGN
Figure 2.26: The effect of functionalized graphene flakes (FGN) to the cement composites after 28 days of curing (Cao et al., 2016).
A detailed literature review of micro-scale characterization of nanomaterial based
cement composites has been done. It was found in the literature that, the microstructure
characterization and hardened properties of cement based construction materials depend
on the viscosity and fresh properties of cement. Therefore, flow properties of
nanomaterial based cement composite are investigated in the next section.
Univers
ity of
Mala
ya

46
2.5 Flow Properties of GNDs based Cement Paste
Concrete is the most widely used structural material and usually placed in the plastic
form. Fluidity, homogeneity, consistency and workability are the key elements to be
considered during the mixing and placing of the concrete. Any shortcoming in these
properties will lead to bleeding, segregation, laitance and cracking of the concrete (Zhang,
Yanrong et al., 2016). However, these properties greatly depend on the viscosity of
concrete. Therefore, the rheological properties of concrete are utmost significant to
achieve homogeneity and good workability. Rheology of cement paste has a strong
influence on the overall fresh properties of the concrete (Ferraris, 1999). Usually, the flow
properties of the cement paste are acquired by shear stress and shear rate. Later from the
flow curves, viscosity and other flow parameters are calculated by using mathematical
models. With the advancement in nanotechnology, research emphasis has been moved to
the effect of nanomaterials on cement composite (Kawashima et al., 2013).
Numerous researchers studied the effect of various engineered nanomaterials on flow
characteristics of the cement paste (Konsta et al., 2010; Ormsby et al., 2011; Shang et al.,
2015; Wang et al., 2017; Wang et al., 2016). Ormsby et al. (2011) used the parallel plate
geometry for rheological investigation and found that multi-walled carbon nanotubes
(MWCNTs) meaningfully influenced the rheological behaviour of polymerizing cement.
Konsta et al. (2010) used the long MWCNTs with the content of 0.16 % of water (by
weight) and w/c = 0.5. MWCNTs were treated using with and without sonicated energy.
They observed the shear thinning response of cement paste and at high shear stress (above
70 Pa) approximately constant viscosity independent of sonication energy. Shang et al.
(2015) explored the rheological characteristics of GO and GO encapsulated silica fume
based cement pastes using Bingham model. Graphene oxide reduces the fluidity of the
cement paste by 36.2 % as compared to plain cement paste. They noted that the values of
Univers
ity of
Mala
ya

47
yield stress and plastic viscosity increased with the addition of graphene oxide. Wang et
al. (2016) found that addition of graphene oxide in cement paste results in flocculation
structures. These flocculated structures were depended on the content of GO and as a
result, it enhanced the yield stress, plastic viscosity and area of the hysteresis loop of the
flow curve. Wang et al. (2017) determined the influence of fly ash on flow properties of
graphene oxide cement paste. They observed that for 0.01 % of GO and 20 % of fly ash
(by weight), the yield stress and plastic viscosity of the cement paste decreased in
comparison with control specimen by 85.81 % and 29.53% respectively. For cement
specimen with 0.03 wt% of GO and 20 wt% of fly ash, the yield stress and plastic
viscosity of the cement paste was lowered by 50.33% and 5.58% respectively (Figure
2.27).
Yahia & Khayat (2001) found that flow properties are greatly dependent on the
mathematical model. Various researchers used different mathematical models to estimate
the yield stress and plastic viscosity values. These mathematical models statistically
determined the yield stress (shear stress at zero shear rate) and plastic viscosity
(generalized viscosity for a range of shear rate) and also predict the specific trend of the
flow. As, these mathematical models possess statistical errors (Nehdi & Rahman, 2004),
therefore, one model cannot predict accurately the trend of the flow behaviour of cement
paste (Yahia & Khayat, 2001). Therefore, some of the well-known and commonly used
mathematical models for cement paste are discussed in next section. Univers
ity of
Mala
ya

48
Figure 2.27: Influence of fly ash on flow curves of graphene oxide cement paste (Wang et al., 2017).
2.6 Rheological Models
The rheological properties of the cement paste are directly related to the workability,
flowability and consistency of the concrete. Rheological models consider several factors
which have the great influence on cement paste rheology and are necessary to be
considered to achieve better and realistic approaches. Cement paste has the complex
rheological behaviour as it depends on several parameters like water-cement ratio,
chemical admixtures, shear rate and supplementary cementitious materials (Papo, 1988).
Therefore, due to the influence of several factors in the rheological model for cement
paste, the flow behaviour cannot predict with best fitting curves by using single model
(Yahia & Khayat, 2001). The accuracy and efficiency of the mathematical model depend
on absolutely fitting the experimental data. For that purpose, four rheological models
have been selected from various standards and researchers (Nehdi & Rahman, 2004).
2.6.1 Bingham Model
Bingham (1922) proposed his model in 1919 with the title, “Bingham Model”. He was
the pioneer to introduce the visco-plastic materials and class of non-Newtonian materials
Univers
ity of
Mala
ya

49
(Mitsoulis, 2007). This model requires two parameters, the yield stress (τo) and plastic
viscosity (µp). Yield stress is the critical value of stress below which material does not
flow (Mitsoulis, 2007) and plastic viscosity is the slope of the line in shear stress-shear
rate curve. This model has the characteristics of the Newtonian equation and the only
difference is the yield stress. Mathematical equations for both Newtonian and Bingham
models are given in Equation (2.4) and Equation (2.5) respectively (Ferraris, 1999).
Bingham model was widely used by researchers to determine the yield stress and plastic
viscosity of the cement paste (Rao, 2014; Yahia & Khayat, 2001, 2003). Bingham
mathematical equation is linear as given in Equation (2.5) (Bingham, 1922) and
comparatively convenient to use for an analytical solution (Yahia & Khayat, 2003).
τ = µpϔ (2.4)
τ = τo + µpϔ (2.5)
Where, τ = shear stress (Pa); τo = yield shear stress (Pa); µp = plastic viscosity (Pa.s) and
ϔ = shear rate (s-1)
However, it fails to fit into the nonlinear portion of the flow curve at a low shear rate
and cannot predict yield shear stress accurately especially for shear thickening behaviour
(Yahia & Khayat, 2001). According to Feys et al. (2007) Bingham model underestimates
the shear stress and for their reference mix, it results in the negative yield stress, which
was physically impossible. Therefore, this model is not valid to describe the rheological
properties, especially in nonlinear portion.
2.6.2 Herschel-Bulkley Model
To solve the problem of Bingham model, the nonlinear model can be used. Power
equation was frequently used for the liquids to study the rheological behaviour (Ferraris,
1999). However, it is not valid for the visco-plastic materials. In 1926, Herschel-Bulkley
Univers
ity of
Mala
ya

50
(HB) provides the relationship to determine the rheological properties of Bingham
materials in nonlinear portion (Herschel & Bulkley, 1926). The Herschel-Bulkley
equation is the upgraded form of the power model containing both yield stress and power
equation. This model contains three parameters: yield shear stress ‘τo’, power index ‘n’
and consistency ‘K’. Power index is an important parameter and estimates the degree of
fluid for shear thinning and shear thickening. The mathematical representation of both
power model and Herschel-Bulkley model is given in Equation (2.6) and Equation (2.7)
respectively (Ferraris, 1999). This model is also known as yield power-law because it has
the characteristics of both Bingham and Power models (Yahia & Khayat, 2003),
therefore, it offers an advantage over the Bingham and Power-law models (Hemphill et
al., 1993).
τ = Kϔn (2.6)
τ = τo + Kϔn (2.7)
Where, τ = shear stress (Pa); τo = yield shear stress (Pa); ϔ = shear rate (s-1); K =
consistency (Pa.sn) and n = power index or pseudoplastic index
The Herschel-Bulkley model can quantify the shear thickening behaviour of the
cement paste. If the power index (n) value will be more than 1, the fluid will present the
shear thickening behaviour, whereas, if the value is less than 1, the shear thinning
behaviour will be found. As per the study conducted by Yahia & Khayat (2001) this
model results in the lowest yield stress in shear thinning in contrast to other mathematical
models on the same flow data. This discrepancy was due to mathematical formulation.
Zero shear viscosity (inclination of flow data curve at zero shear rate), is always either
zero or infinite based on power index value. For the shear thickening fluids (n > 1), zero
shear velocity is zero and for shear thinning materials it is infinite. Thus, this model is
Univers
ity of
Mala
ya

51
not the best model to describe the non-linear behaviour of flow curve (Feys et al., 2007;
Yahia & Khayat, 2001).
2.6.3 Modified Bingham Model
To overcome the deficiency of Herschel-Bulkley model, a linear term was added to
the HB mathematical equation. This new model is called Modified Bingham model
because the Bingham equation was modified and second order of the shear rate was used
to fit the model in pseudo-plastic or shear thickening behaviour. As the modified
Bingham model, contains the characteristics of Bingham model and Herschel-Bulkley
model, therefore, it can provide a better description of the nonlinear behaviour (Feys et
al., 2013). The mathematical expression of the modified Bingham model is given in
Equation (2.8) (Yahia & Khayat, 2001).
τ = τo + µpϔ + cϔ2 (2.8)
Where, τ = shear stress (Pa); τo = yield shear stress (Pa); µp = plastic viscosity (Pa.s); ϔ
= shear rate (s-1) and c = regression constant
Although this model has a limitation that fluid should not be highly-shear thickening,
it can only be possible by keeping power index value less than 2 (Feys et al., 2013).
Therefore, it restrained the response of the fluid to second order polynomial, which will
limit its fitting to the flow data.
2.6.4 Casson Model
Casson (1959) proposed the equation to relate the shear stress and shear rate for the
suspensions. Casson suggested a special structure for the suspension in fluid called
“particles” which form flocculates of certain cohesive strength (Scott, 1966). The Casson
model has two adjustable parameters as shown in Equation (2.9) and it can predict the
Univers
ity of
Mala
ya

52
viscosity at a very high shear rate (infinite shear rate) (Papo, 1988). However, this
equation has a limitation in predicting the flow parameters for very concentrated
suspensions (Papo, 1988). As per Scott (1966) observation, Casson equation fits very well
to various types of fluid and is more appropriate to use as compared to Herschel-Bulkley
equation, yet, it is difficult to explain in most cases.
√𝜏 = √𝜏𝑜 + √µ𝑝ϔ (2.9)
Where, τ = shear stress (Pa); τo = yield shear stress (Pa); ϔ = shear rate (s-1) and µp =
plastic viscosity (Pa.s)
2.6.5 Standard error
The ability of an analytical model to accurately match the nonlinear regression at low
shear rate will define its accuracy. As this ability is varying with each mathematical
expression, therefore, the calculated rheological parameters especially yield stress values
can offer different values for different models. Standard error for each rheological model
has been determined using Equation (2.10) (Yahia & Khayat, 2001). It depends on the
normalized standard deviation. Finally, a comparison has been drawn amongst the
calculated values to determine the effective and best-fitted model.
𝑆𝑡𝑎𝑛𝑑𝑎𝑟𝑑 𝑒𝑟𝑟𝑜𝑟 = 1000∗(
∑(𝑚𝑒𝑎𝑠𝑢𝑟𝑒𝑑 𝑣𝑎𝑙𝑢𝑒−𝑐𝑎𝑙𝑐𝑢𝑙𝑎𝑡𝑒𝑑 𝑣𝑎𝑙𝑢𝑒)2
(𝑛𝑢𝑚𝑏𝑒𝑟 𝑜𝑓 𝑑𝑎𝑡𝑎 𝑝𝑜𝑖𝑛𝑡𝑠−2))1/2
(𝑀𝑎𝑥𝑖𝑚𝑢𝑚 𝑚𝑒𝑎𝑠𝑢𝑟𝑒𝑑 𝑣𝑎𝑙𝑢𝑒−𝑀𝑖𝑛𝑖𝑚𝑢𝑚 𝑚𝑒𝑎𝑠𝑢𝑟𝑒𝑑 𝑣𝑎𝑙𝑢𝑒) (2.10)
It was found that most of the existing researches were performed on the CNTs and
graphene oxide. However, the rheological properties of graphene cement paste remained
unexplored. Therefore, one of the objectives of this study is to investigate the flow
properties of the graphene cement paste by using Bingham, Modified Bingham, Herschel-
Bulkley and Casson models. The graphene flakes were utilized to measure the variation
Univers
ity of
Mala
ya

53
in the flow curves of the cement paste. After discussing and reviewing the various
rheological models and influence of different nanomaterials on flow properties of cement
paste, mechanical properties of graphene cement composite will be critically reviewed in
next section from the available literature.
2.7 Mechanical Properties of Graphene Cement Composites
Consumption of cementitious building materials i.e. concrete is increasing every day
because of its various beneficial properties such as high strength, durability and resistance
to fire (Kodur & Sultan, 2003). Sixuan (2012) conducted a study on the mechanical
properties of both cement paste and mortar by adding different concentrations of GNPs.
The study revealed that there was no increment in compressive strength for the cement
paste incorporated with 0.05% and 0.25% of GNPs. However, an increment of 20% in
compressive strength mortar was observed for 0.50% of GNP cement mortar. As for the
flexural strength, the maximum increment up to 82% was observed for the cement paste
with 0.05% of GNP (Sixuan, 2012).The influence of graphene nanomaterials and its
derivatives (GND) on mechanical properties of cement composites is presented in Table
2.2. Addition of nanomaterials significantly increased the mechanical properties of
cement composites at both early and later stages. Li et al. (2017) suggested that due to
the nucleation and filling effect of graphene oxide, GO can help to accelerate the
hydration process at an early age. Yet, the complete mechanisms have not been described
in the literature. For example, the compressive and flexural strength reported by Lv et al.
(2013b) and Mokhtar et al. (2017) are considerably different. Both researchers used the
same water to binder ratio, dosage of GO and similar curing conditions. Moreover, Wang
et al. (2017) and Wang et al. (2016) used the same water to cement ratio and graphene
oxide dosage, however, the difference for increase in compressive strength was found
almost double to each other. Furthermore, increase in compressive strength reported by
Univers
ity of
Mala
ya
54
Kothiyal et al. (2016) and Shang et al. (2015) is twice of the Sharma & Kothiyal (2016)
and Li et al. (2017) respectively, under similar conditions. It is well known that the
influencing factors on mechanical strength in the composite matrix are water/binder (w/b)
ratio, type of nanomaterials, its dosage and curing duration of the specimen (Yang et al.,
2017). Moreover, the effects of dispersion, agglomeration, size and functional groups
attached with nanomaterials have considerable influence on mechanical properties (Yang
et al., 2017). It was observed from Table 2.2 that the nanomaterials have more influence
on the flexural strength of cement composite as compared to compressive strength.
According to Sharma & Kothiyal (2015), the bridging and bonding effect of graphene
oxide with cement matrix and denser microstructure of cement matrix are related factors
contributing to flexural strength. Furthermore, use of dispersant, surface modification,
reduction in size and thickness of graphene have been employed to improve the
effectiveness of GND on mechanical properties of cement based materials (Abrishami &
Zahabi, 2016; Lv et al., 2016; Sharma & Kothiyal, 2015). It is understood that the key
factors controlling the porosity and the mechanical properties of cement based materials
are more hydrated cement products, filling of pores and bonding between hydrated
cement products and nanomaterial (Sharma & Kothiyal, 2015). Nevertheless, the
tremendous increment in the mechanical properties have been recorded however, the role
of GND has not been clearly defined in the literature. Actually, many explanations given
by various researchers are controversial and sparks much debate.
Univers
ity of
Mala
ya

55
Table 2.2: The influence of graphene and its derivatives on mechanical properties of cement based materials modified from Yang et al. (2017).
Matrix Type/dosage (wt.%)
w/b
Increase in
Flexural strength (%)/age
Increase in Compressive
strength (%)/age
Reference
Paste GO/0.05 0.3 90.5/28 d 52.4/3 d (Wang et al., 2015) Paste GO/0.05 0.3 69.4/7 d 66.4/7 d (Lv et al., 2014b) Paste FGON/0.03 0.3 65.5/28 d 51.3/28 d (Lv et al., 2016)] Paste GO/0.03 0.3 55.0/28 d 42.5/28 d (Wang et al., 2017) Paste GO/0.02 0.3 84.5/28 d 60.1/28 d (Lv et al., 2013b) Paste GO/0.04 0.3 43.2/28 d 28.6/28 d (Lv et al., 2014a) Paste GNPs/0.15 0.3 27.5/28 d 49.4/28 d (Metaxa, 2016) Paste GO/0.02 0.3 41.0/28 d 13.0/28 d (Mokhtar et al., 2017) Paste rGO/0.02 0.3 70.0/7 d 22.0/28 d (Murugan et al., 2016) Paste GO/0.03 0.3 56.6/28 d 18.8/28 d (Wang et al., 2016) Paste GNPs/0.03 0.4 16.8/28 d 1.3/28 d (Wang et al., 2016) Paste GO-CNFs/0.05 0.4 25.0/28 d 2.89/28 d (Sun et al., 2017) Paste GO/0.04 0.4 – 15.1/28 d (Shang et al., 2015) Paste GO/0.05 0.4 16.2/15 d 11.0/15 d (Lu et al., 2015) Paste GO/0.04 0.4 14.2/28 d 37.0/28 d (Li et al., 2017) Paste GO-CNT/0.05 0.4 24.1/15 d 21.1/15 d (Lu et al., 2015) Paste GO-CNT/0.06 0.4 16.7/28 d 23.9/28 d (Zhou, C et al., 2017) Paste GO/0.022 0.4 26.7/3 d 27.6/3 d (Zhao et al., 2016) Paste GO/0.03 0.5 – 40.0/28 d (Gong et al., 2014)
Mortar GO/0.03 0.4 70.7/3 d 45.1/3 d (Lv et al., 2013a) Mortar GO/0.05 0.4 106.4/14 d 43.2/3 d (Wang et al., 2015) Mortar GO/0.022 0.4 34.1/7 d – (Zhao et al., 2017a) Mortar GO/0.03 0.4 18.7/7 d – (Qian et al., 2015) Mortar GO/1.0 0.5 – 114.1/14 d (Sharma & Kothiyal, 2015) Mortar GO/0.03 0.5 – 30.0/28 d (Mohammed et al., 2016) Mortar GO/0.125 0.5 – 53.0/3 d (Sharma & Kothiyal, 2016) Mortar GO/0.125 0.5 – 110.7/3 d (Kothiyal et al., 2016) Mortar GO/0.02 0.5 36.7/3 d – (Zhao et al., 2017b) Mortar FGON/0.1 0.5 70.8/15 d 39.0/15 d (Abrishami & Zahabi, 2016) Mortar FGON/0.03 0.5 32.0/28 d 20.3/28 d (Cao et al., 2016) Mortar GNPs/0.8 0.5 – 87.5/28 d (Rhee et al., 2016) Mortar GNPs/0.1 0.5 – 19.9/28 d (Tong et al., 2016) Mortar GNPs/0.08 0.6 – 55.3/7 d (Rhee et al., 2015)
Concrete GO/0.1 0.5 4.0/3 d 14.2/7 d (Devasena & Karthikeyan, 2015) Note: CNT (carbon nanotube), FGON (functionalized graphene oxide nanosheets), GNPs (graphene flakes), CNFs (carbon nanofibers)
2.8 Electrical Properties of Composite Materials
The electrical properties of the cement composites are important and can be used to
monitor the damage in a concrete structure. The cement based composite reinforced with
Univers
ity of
Mala
ya
56
conducting fillers can observe its own strain by monitoring the changes in the electrical
resistivity values. This ability is related to the breaking of conducting fibers when cracks
are initiating in the cement based composite consequently enhancing the resistivity of the
overall sample. If cracks are opening up due to tensile or fracture loading then resistivity
values will be positive while it will be negative when subjected to compressive loading.
Piezo-resistive properties are the effect of a change in electrical resistance in specimen
when it is subjected to mechanical strain (Zhao & Bai, 2015). For this purpose, electrical
resistance of the cement composite is measured. By definition, the electrical resistance is
the strength of a material in opposing the electrical current flowing through it. Based on
Ohm’s law given in Equation 2.11, the material’s electrical resistance at a given constant
temperature is equal to the amount of applied voltage divided by the amount of electrical
current flowing through it. Mathematically it is expressed as:
𝑅 = 𝑉
𝐼 (2.11)
Where: R = electrical resistance of the material in ohms (Ω); V = applied voltage in
volts (V); I = electrical current in amperes (A).
It should be noted that Equation 2.11 can only be used for direct current (DC) circuits
but not for the alternating current (AC) circuits. Four-probe method is mostly used by
researchers to investigate the electoral properties of cement composites. Four-probe
method involves four electrical contact points in which voltage is measured through the
inner two electrical contacts while the current is measured using outer two electrical
contacts (Han et al., 2009). Four-probe method is better than the two-probe method due
to the fact that, measured resistance does not include the contact resistance (Han et al.,
2007).
Univers
ity of
Mala
ya

57
According to Han et al. (2007), the space between the current pole and voltage pole is
very important. However, its influence is marginal if space is more than 7.5 mm. The
various researcher used different spacing in their experimental work. Li et al. (2007) used
the spacing of 10 mm while Le et al. (2014) used 40 mm spacing between current and
voltage measuring probes. Similarly, the distance between the two voltage measuring
probes is not fixed and its value varies. Li et al. (2007) used the 40 mm gap between two
measuring probes while Le et al. (2014) used 80 mm gap. As resistivity values remain
unaffected provided that the spacing is above a threshold value (Han et al., 2007),
therefore, in this research we used 40 mm spacing between the current measuring probe
and voltage measuring probes and 60 mm between two voltage measuring probes.
Electrical resistivity values were calculated by using Equation (2.12) for unequal spacing
(Valdes, 1954).
ρ = 𝑉I ˟ 2𝜋 ˟
1
(1
S1+
1
S3−
1
S1+S2−
1
S2+S3) (2.12)
Where “V” is the floating potential difference between inner two probes; “I” is current
measured by outer two probes; "ρ" is the resistivity in ohm-cm and “S” is the spacing in
cm and was calculated from current carrying probe to the voltage measuring probe. S1 =
S3 = 40 cm and S2 = 60 cm.
2.8.1 Self-sensing Properties of Nanomaterials Based Cement Composites
Nanomaterials are gifted with the amazing characterises and their incorporation in
cement composite brought these characteristics to cement composite as well. Self-sensing
and damage memorizing capability of nanomaterial based cement composite are one of
the characteristics which nanomaterials brought in cement composite. Various
researchers used the piezoresistive characteristics of nanomaterials based cement
Univers
ity of
Mala
ya

58
composite for self-sensing prose (Chung, 2002; Li et al., 2007; Qu & Han, 2008). In the
following section piezoresistive properties of nanomaterial based cement composite will
be reviewed and critically analysed.
It has been reported by Li et al. (2004a) that cement mortar reinforced with nano-Fe2O3
have self-sensing properties which can monitor the produced stresses with the application
of load. For this purpose, changes in the electrical resistance values of cement composite
were recorded. It was found that using 10% of nano-Fe2O3 particles of 30nm size in mix
design with water to binder ratio of 0.5 produce 40% fractional change in electrical
resistance values, meanwhile, control specimen showed slight variation. Therefore, it was
concluded that nano-Fe2O3 based cement mortar successfully monitored the produced
stresses. According to Li et al. (2004a), this self-sensing property of the cement composite
can be used for structural health monitoring (SHM) purposes without the need of any
additionally attached or embedded sensors. It will further open the application of
nanomaterials based cement composites for fabricating smart sensors (Li et al., 2004a).
Li et al. (2007) conducted a research on the functionalization of CNTs using carboxyl.
The effect of functionalization on the piezoresistive and electrical properties of the
cement composite was observed. It was noted that the electrical resistance of cement
composite with 0.5% of carboxyl functionalized CNTs (SPCNT) was 149 Ω.cm and for
plain CNTs (PCNT) was 130 Ω.cm. Afterwards, the fractional change in electric
resistivity for both types of cement composited was recorded against the cyclic
compressive loading and presented in Figure 2.28. It was seen from the Figure 2.28 that
both cement composites were capable of monitoring the applied compressive cyclic
loading, however, SPCNT specimen showed better response as compared to PCNT.
Univers
ity of
Mala
ya

59
Figure 2.28: The change in fractional resistivity against the time of the cyclic compressive stress (0-15kN) (Li et al., 2007).
Yu & Kwon (2009) studied the piezoresistive behaviour of the CNT based cement
composite and investigated its potential application as an embedded sensor in civil
infrastructure. It was found that electrical resistance of CNT based cement composite was
following the same trend as applied compressive loading (Figure 2.29). Yu & Kwon
(2009) proposed that fabrication method needs to be further optimized and response of
these composite materials must be investigated in concrete. Furthermore, they proposed
that if these composite stress sensors were embedded in civil infrastructure e.g.
pavements or bridges then due to their compatibility with concrete they will have a long
service life with least maintenance. Univers
ity of
Mala
ya

60
Figure 2.29: The piezoresistivity behaviour of cement paste enhanced with 0.1% of carboxyl functionalized MWCNTs (Yu & Kwon, 2009).
Sixuan (2012) examined the effect of crack depth on the GNP reinforced mortar with
different shapes i.e. cube and prism. Furthermore, cube sample was labelled as TC307
cube and prism specimen was labelled as 3375 prism. The change in the electrical
resistance of cement composite samples was recorded and it was revealed that specimens
in both shapes (cubes and prism) responded to an increase in electrical resistance with
increase in crack depth as seen in Figure 2.30. The change in electrical resistance for the
TC307 cube showed a nearly linear trend up to the extent of relative crack depth value of
0.6 with 60% corresponding peak value of the change in electrical resistance. On the other
hand, for the 3775 prism, initial decrease in the electrical resistance was observed.
Afterwards, a slight increase in the change of electrical resistance was observed until the
relative crack depth value becomes 0.4. It increased, until the change in electrical
resistance reached to 30% at 0.85 relative crack depth value. Therefore, it was concluded
that TC307 cube specimen determined better response as compared to 3375 prism.
Univers
ity of
Mala
ya

61
Figure 2.30: The relationship between the relative crack depth and change in electrical resistance for the GNP reinforced cement mortar (Sixuan, 2012).
The effect of different concentration of GNPs on the sensing behaviour of the
cementitious composite was studied by Du et al. (2013). Authors found a decrement in
the electrical resistivity of cement composites by adding 2.4% to 3.6% of GNPs. Le et al.
(2014) investigated the electrical resistivity values of cement mortar with increasing
content of graphene flakes. Furthermore, specimen was passed through two different
environmental conditions, i.e. one specimen was air-dried for one year, and another
specimen was oven-dried at 1-day after casting. The author’s proposed a relationship
between the electrical resistivity values of the specimen with increasing content of GNP
as shown in Figure 2.31. It was found that electrical resistivity values decreased with the
increase in GNP content. 2.4% of GNP was estimated as percolation threshold value for
GNP-composite mortar (Le et al., 2014). The decrement of more than 1 order occurred
between 2.4% and 3.6% of GNP content of cement mortar as shown in Figure 2.31 (b).
Univers
ity of
Mala
ya

62
(a) linear scale (b) log scale
Figure 2.31: The relationship between the electrical resistivity of the GNP cement mortar composite and its respective GNP content (Le et al., 2014).
2.9 Industrial demand for self-sensing material
In this section, literature will be reviewed about the shortcoming of existing health
monitoring methods, estimating the space and requirement of self-sensing smart materials
in the construction industry. For this purpose, various Non-destructive test (NDT)
methods were thoroughly reviewed which are applicable especially to concrete structures.
Overall 17 NDT methods were studied and for analysis, they were classified into 5 major
categories i.e. (1) audio-visual methods; (2) stress-wave methods; (3) Electromagnetic
methods; (4) deterministic methods; and (5) Miscellaneous methods. Moreover,
capabilities and limitation of some of the well-known NDT methods is given in Table
2.3.
Univers
ity of
Mala
ya
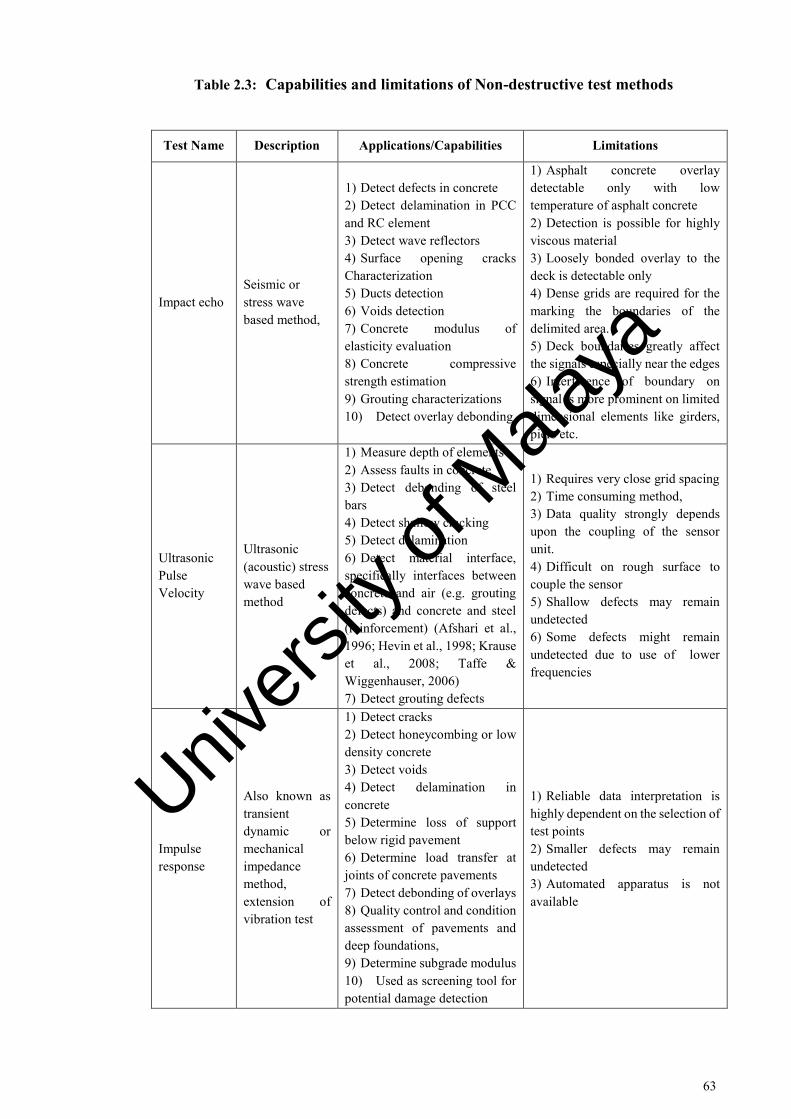
63
Table 2.3: Capabilities and limitations of Non-destructive test methods
Test Name Description Applications/Capabilities Limitations
Impact echo Seismic or stress wave based method,
1) Detect defects in concrete 2) Detect delamination in PCC and RC element 3) Detect wave reflectors 4) Surface opening cracks Characterization 5) Ducts detection 6) Voids detection 7) Concrete modulus of elasticity evaluation 8) Concrete compressive strength estimation 9) Grouting characterizations 10) Detect overlay debonding
1) Asphalt concrete overlay detectable only with low temperature of asphalt concrete 2) Detection is possible for highly viscous material 3) Loosely bonded overlay to the deck is detectable only 4) Dense grids are required for the marking the boundaries of the delimited area. 5) Deck boundaries greatly affect the signals especially near the edges 6) Interference of boundary on signal is more prominent on limited dimensional elements like girders, piers etc.
Ultrasonic Pulse Velocity
Ultrasonic (acoustic) stress wave based method
1) Measure depth of elements 2) Assess faults in concrete 3) Detect debonding of steel bars 4) Detect shallow cracking 5) Detect delamination 6) Detect material interface, specifically interfaces between concrete and air (e.g. grouting defects) and concrete and steel (reinforcement) (Afshari et al., 1996; Hevin et al., 1998; Krause et al., 2008; Taffe & Wiggenhauser, 2006) 7) Detect grouting defects
1) Requires very close grid spacing 2) Time consuming method, 3) Data quality strongly depends upon the coupling of the sensor unit. 4) Difficult on rough surface to couple the sensor 5) Shallow defects may remain undetected 6) Some defects might remain undetected due to use of lower frequencies
Impulse response
Also known as transient dynamic or mechanical impedance method, extension of vibration test
1) Detect cracks 2) Detect honeycombing or low density concrete 3) Detect voids 4) Detect delamination in concrete 5) Determine loss of support below rigid pavement 6) Determine load transfer at joints of concrete pavements 7) Detect debonding of overlays 8) Quality control and condition assessment of pavements and deep foundations, 9) Determine subgrade modulus 10) Used as screening tool for potential damage detection
1) Reliable data interpretation is highly dependent on the selection of test points 2) Smaller defects may remain undetected 3) Automated apparatus is not available
Univers
ity of
Mala
ya

64
Table 2.3: Continued
Acoustic emission
Transient elastic waves
1) Real-time damage detection. 2) Remote monitoring 3) Applicable to both local and global monitoring. 4) Continuous monitoring without interrupting the traffic flow 5) Reliable analysis
1) Background noise problem 2) Difficult to apply analysis to real structure 3) No standard procedure for all types of bridges
Ground Penetrating Radar
Use electromagnetic waves
1) Able to determine the buried objects 2) Produce contour maps of subsurface features 3) Used for condition assessment of civil structures especially related to soil 4) Detect voids and anomalies 5) Evaluate thickness of members 6) Measure thickness of concrete cover 7) Determine rebar configuration 8) Detect delamination and its potential 9) Detect concrete deterioration 10) Sensitive to corrosive environment 11) Estimate concrete properties
1) Inability to direct image 2) Unable to detect delamination in bridge decks, unless they are epoxy-impregnated or filled with water 3) Extreme cold conditions effect the GPR data 4) Completely frozen moisture will remain undetected 5) Frozen moisture influences the acquired signal 6) De-icing salts affect the dielectric constant 7) Unable to estimate mechanical properties of concrete like strength, modulus. 8) Unable to provide absolute information about the presence of corrosion, corrosion rate or rebar section loss 9) Expensive method as compared to other ones
Half-cell potential
Electrochemical method
1) Determine active corrosion 2) Can be used at any time 3) Can be used in any climatic condition
1) Minimum temperature must be higher than 2 degree Celsius (Elsener et al., 2003) 2) Influence of concrete cover depth is still unknown 3) Correcting data for depth is difficult 4) It is not used for moisture or salt content calculation. 5) Cannot take reading on the isolating layer (asphalt, coating and paint) 6) Measurements are often unreliable (concrete is wet, dense or polymer modified)
Univers
ity of
Mala
ya
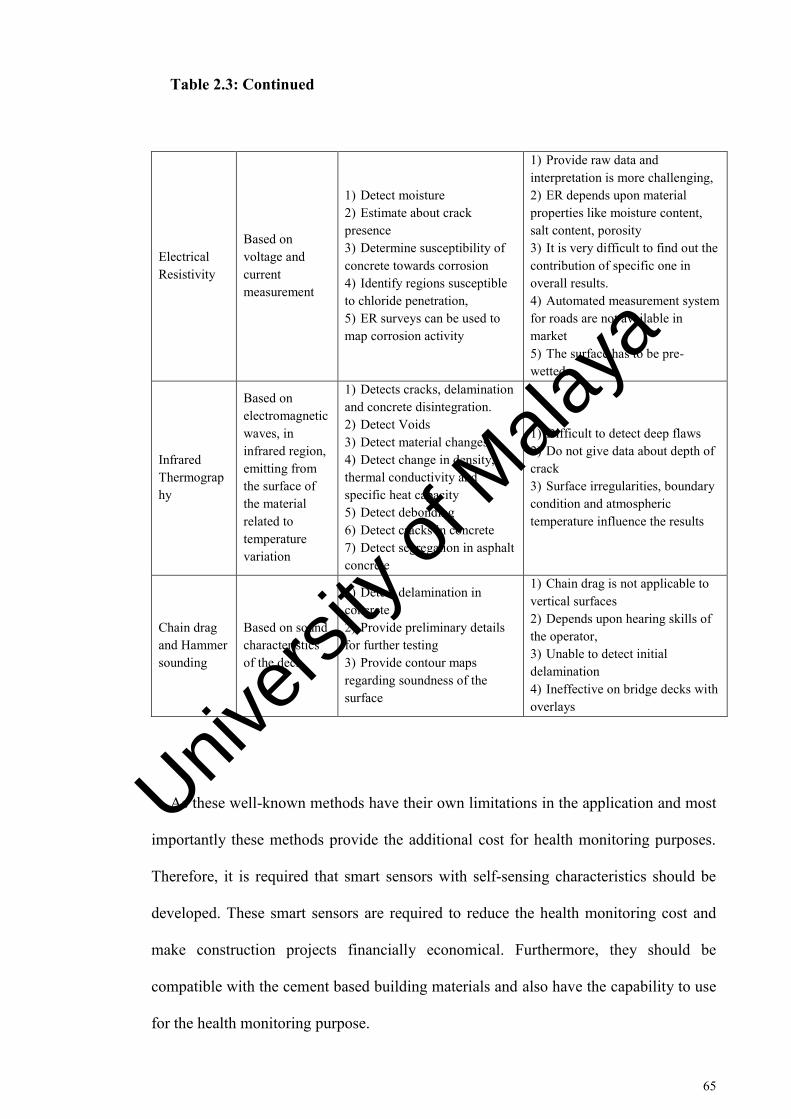
65
Table 2.3: Continued
Electrical Resistivity
Based on voltage and current measurement
1) Detect moisture 2) Estimate about crack presence 3) Determine susceptibility of concrete towards corrosion 4) Identify regions susceptible to chloride penetration, 5) ER surveys can be used to map corrosion activity
1) Provide raw data and interpretation is more challenging, 2) ER depends upon material properties like moisture content, salt content, porosity 3) It is very difficult to find out the contribution of specific one in overall results. 4) Automated measurement system for roads are not available in market 5) The surface has to be pre-wetted.
Infrared Thermography
Based on electromagnetic waves, in infrared region, emitting from the surface of the material related to temperature variation
1) Detects cracks, delamination and concrete disintegration. 2) Detect Voids 3) Detect material changes 4) Detect change in density, thermal conductivity and specific heat capacity 5) Detect debonding 6) Detect cracks in concrete 7) Detect segregation in asphalt concrete
1) Difficult to detect deep flaws 2) Do not give data about depth of crack 3) Surface irregularities, boundary condition and atmospheric temperature influence the results
Chain drag and Hammer sounding
Based on sound characteristics of the deck
1) Detect delamination in concrete 2) Provide preliminary details for further testing 3) Provide contour maps regarding soundness of the surface
1) Chain drag is not applicable to vertical surfaces 2) Depends upon hearing skills of the operator, 3) Unable to detect initial delamination 4) Ineffective on bridge decks with overlays
As these well-known methods have their own limitations in the application and most
importantly these methods provide the additional cost for health monitoring purposes.
Therefore, it is required that smart sensors with self-sensing characteristics should be
developed. These smart sensors are required to reduce the health monitoring cost and
make construction projects financially economical. Furthermore, they should be
compatible with the cement based building materials and also have the capability to use
for the health monitoring purpose.
Univers
ity of
Mala
ya

66
2.10 Research gap
An in-depth literature has been studied about the usage of nanomaterials in the civil
engineering field as construction material. Following research gaps have been identified
from the literature.
1) Nanoengineered material has been classified into three categories zero, one and two-
dimensional nanomaterials. It was found that the nanomaterials have several issues
needs to be resolved before its usage in construction industry e.g. zero-dimensional
nanoparticles have deficiency in seizing the cracks at microscale due to low aspect
ratio. For one-dimensional nanomaterials, weak bond formation and low bond
strength between nanomaterials and hydrated cement products are major concerns.
Two-dimensional nanomaterials have large surface area and high aspect ratio;
however, high production cost is one of the obstacles.
2) Recently (last 3-4 years), an extensive research has been done on the graphene oxide
based cement composite, whereas, less focus is given to graphene based cement
composite. Further, non-uniform mixing of nanomaterial is the primary source of
problem, which leads to the formation of weak zones. Most of the researches on
dispersion of graphene and its derivatives were focused on surface modification,
functionalization and oxidation process. However, these processes damaged the
atomic structure of graphene. Therefore, other methods are indispensably required for
dispersion of GNDs and preserving the atomic structure of graphene.
3) During micro-analytical analysis it was found that nanomaterials enhanced the
hydrated products, however, the enhancement mechanism is not completely described
as yet. Further research is required to study the regulating mechanism of graphene
and its derivatives on hydrated cement crystals.
Univers
ity of
Mala
ya

67
4) It was noted that the available literature on the rheological properties of graphene
based cement composite is very rare. Flow properties of graphene cement composite
and its dependence on various factors are missing in existing literature. Additionally,
the variation of geometric flow with time, dispersing agent, shear rate and various
types of graphene sheets is required to explore the real flow of cement paste in plastic
state. Moreover, the best optimized rheological mathematical model needs to sort out,
as a single rheological model cannot predict the flow behaviour of cement paste
accurately. Thus, graphene cement composite demands further exploration to achieve
maximum benefit from graphene.
5) Besides this, it was found that graphene and its derivatives enhanced the mechanical
properties of cement composites and accelerate the hydration process at an early
stage. Yet, the complete mechanism for accelerating the hydration reactions and
enhancing overall mechanical properties has not been explained. Prominent
differences in mechanical properties were found in experimental work conducted by
various researchers in similar circumstances. Additionally, various explanations
given by the researchers are controversial and sparked much debate.
6) During the literature review section, it was noted that spacing between current pole
and voltage pole is required to be optimized in four-probe method. Piezoresistive
properties of nanomaterials based cement composite can sweep the application of
additionally attached sensors. The response of graphene and its derivatives in concrete
is rarely reported. Furthermore, potential application of graphene based cement
composite as an embedded smart sensor in the real concrete structure was seldom
found in literature. Moreover, the suitability, industrial demand and compatibility of
graphene cement smart sensors with the existing non-destructive health monitoring
methods need to be determined.
Univers
ity of
Mala
ya

68
In this research study dispersion efficiency of graphene, micro-analytical, rheological,
hardened properties, piezoresistive properties and potential application of graphene based
cement composite will be discussed. However, regulating mechanism of hydrated cement
products and graphene will not be covered.
Univers
ity of
Mala
ya

69
CHAPTER 3: MATERIALS AND METHODS
3.1 Introduction
This chapter provides the information regarding materials, equipment, experimental
methodology and various parameters that derived this research. The equipment handling
protocols are also discussed. This chapter starts with details about research materials
followed by the dispersion of nanomaterials in aqueous solution, preparation of
specimens for investigation of physical and mechanical characteristics of graphene
cement composites. Several spectroscopic and microscopic techniques are also explained
which were used to evaluate the micro-analytical properties of the GCC.
3.2 Research Materials
The ordinary Portland cement (OPC) with the 28-day compressive strength of 48 MPa
was used as a binder. The OPC was conforming to MS 522 Part 1 2003 (MS-522: Part 1,
2003) with a specific surface area and specific gravity of 0.351 m2/g and 3.14,
respectively. The chemical composition of cement is given in Table 3.1. A third-
generation polycarboxylate ether based superplasticizer Sika ViscoCrete (Sika
ViscoCrete®-2055, brown liquid), was being used. This admixture is chloride free
according to BS 5075 (BS EN 5075-1, 1985) and is compatible with all types of Portland
cement including sulphate resistant cement (SRC). Local mining sand with fineness
modulus of 2.89, specific gravity of 2.68, water absorption 0.51% and maximum grain
size of 4.75 mm was used as fine aggregate. Meanwhile, graphene was purchased from
Graphene Laboratories, Inc. USA. It is important to mention here that three different
types of graphene were used. The difference was based on the average flake thickness,
lateral size and specific surface area of graphene flakes. The detail properties of graphene
were enlisted in Table 3.2. Detailed FESEM images of these graphene types are given in
Figure 3.1. Normal tap water was used for the preparation of the mixes.
Univers
ity of
Mala
ya

70
Table 3.1: Chemical composition of cement.
Component Content (%) Calcium Oxide (CaO) 63.40 Silicon Dioxide (SiO2) 19.80 Aluminium Oxide (Al2O3) 5.10 Iron Oxide (Fe2O3) 3.10 Magnesium Oxide (MgO) 2.50 Sulphur Trioxide (SO3) 2.40 Potassium Oxide (K2O) 1.00 Sodium Oxide (Na2O) 0.19
Table 3.2: Properties of the graphene.
Parameters G1 G2 G3 Average flake thickness (nm) 12 nm 30 nm 60 nm Average particle (lateral) size (microns) 1.5-10 5-25 3-7 Specific surface area, SSA (m2/g) 80 60 < 40 Purity 99.2% 97% 98.5% Colour Black Black Black
(a) G1 -12 nm
(b) G2 - 30 nm
(c) G3 - 60 nm
Figure 3.1: FESEM images of the graphene obtained from Graphene Laboratories, Inc. USA.
Univers
ity of
Mala
ya

71
3.3 Experimental Methodology
3.3.1 Dispersion of Graphene
The Spectroquant® Pharo 300 UV-vis spectrophotometer with a wavelength range of
190 -1100 nm was used to determine the absorbance of the graphene flakes in aqueous
solution with and without superplasticizer. The aqueous solution was obtained by mixing
dry graphene with deionized water and then sonicated in Fisher Scientific™ Model 505
Sonic dismembrator. To keep the dispersion stable and uniform in solution magnetic
stirring with various time duration was performed as well. FAVORIT Stirring Hotplate
HS0707V2 was used for this purpose as shown in Figure 3.2 (a). Overall time for
sonication was set as 3 min of ultrasonication followed by 40 min of the magnetic stirring.
After that crystal cuvette, which was free from fingerprints and all sort of spot, was used
to determine the absorbance spectrum. Deionized water was used as a reference in a
spectrophotometer. Figure 3.2 shows the magnetic stirrer and Spectroquant® Pharo 300
UV-vis spectrophotometer apparatus used in this study.
(a) Magnetic stirrer FAVORIT Stirring
Hotplate HS0707V2
(b) Spectroquant® Pharo 300 UV-vis
spectrophotometer
Figure 3.2: Equipment used for; (a) dispersion of graphene and (b) dispersion measurement.
Univers
ity of
Mala
ya

72
3.3.2 Preparation of Graphene Cement Composite
The GCC was prepared by mixing of ordinary Portland cement, standard sand, water,
polycarboxylate superplasticizer and graphene. Table 3.3 shows the mix proportion of
cement paste used to carry out for this research work. While Table 3.4 shows the mix
design of GC mortar. It is important to mention here, that cement paste was utilized to
determine the flow properties and self-sensing characteristics of GCC while mortar was
used to investigate the hardened properties. For samples preparation, graphene (by weight
of cement) was dispersed by sonication in deionized water for 3 minutes in the presence
of superplasticizer to form a uniform mix. The obtained aqueous solution of graphene
was then mixed with cement and sand for 5 minutes in spar mixer (SP-800A). Initially,
the speed of the mixer was kept low for 2 minutes then static for 10 seconds and finally
high for remaining time. Figure 3.3 shows the exfoliation of graphene sheets using
ultrasonication and mixing of mortar in spar mixer. The workability of cement mortar
was determined by ASTM C 1437-15 (ASTM C 1437, 2015). Figure 3.4 shows the
apparatus used for measuring flow test of cement mortar and measurement of spread
diameter.
(a) Fisher Scientific™ Model 505 Sonic
dismembrator
(b) Spar mixer (SP-800A)
Figure 3.3: Equipment used for preparation of graphene-cement composite.
Univers
ity of
Mala
ya

73
(a) placement of graphene-cement
composite in the mould
(b) measurement of spread
diameter
Figure 3.4: Flow of hydraulic cement mortar.
Table 3.3: Mix proportions for graphene-cement paste.
Mix Design
W/C ratio
Cement (C) (g)
Water (ml)
GNP (mg)
GNP/C (%)
SP/C (%)
M0 0.4 100 40 0 0 0 M0S 0.4 100 40 0 0 0.1
G1M3 G2M3 G3M3
0.4 100 40 30 0.03 0
G1M3S G2M3S G3M3S
0.4 100 40 30 0.03 0.1
G1M5 G2M5 G3M5
0.4 100 40 50 0.05 0
G1M5S G2M5S G3M5S
0.4 100 40 50 0.05 0.1
G1M10 G2M10 G3M10
0.4 100 40 100 0.10 0
G1M10S G2M10S G3M10S
0.4 100 40 100 0.10 0.1
Univers
ity of
Mala
ya

74
Table 3.4: Mix proportions for graphene-cement mortar.
Mix Design
W/C ratio
Cement (C) (g)
Sand (g)
Water (ml)
GNP (mg)
GNP/C (%)
SP/C (%)
M0-M 0.4 100 200 40 0 0 0.2 G1M3-M G2M3-M G3M3-M
0.4 100 200 40 30 0.03 0.2
G1M5-M G2M5-M G3M5-M
0.4 100 200 40 50 0.05 0.2
G1M10-M G2M10-M G3M10-M
0.4 100 200 40 100 0.10 0.2
3.3.3 Preparation of GCC for Micro-scale Characterization
For micro-scale characterization, small pieces were taken from hardened GCC paste
specimens after 28-days of casting. Afterwards, these pieces were grounded into a fine
powder using grinding machine. Figure 3.5 shows the grinding machine and powdered
samples. These fine powder samples were further used for TGA, FTIR and XRD analysis.
(a) Grinding machine
(b) Finely powdered sample packets
Figure 3.5: Grinding process for remnant pieces of GCC
Univers
ity of
Mala
ya
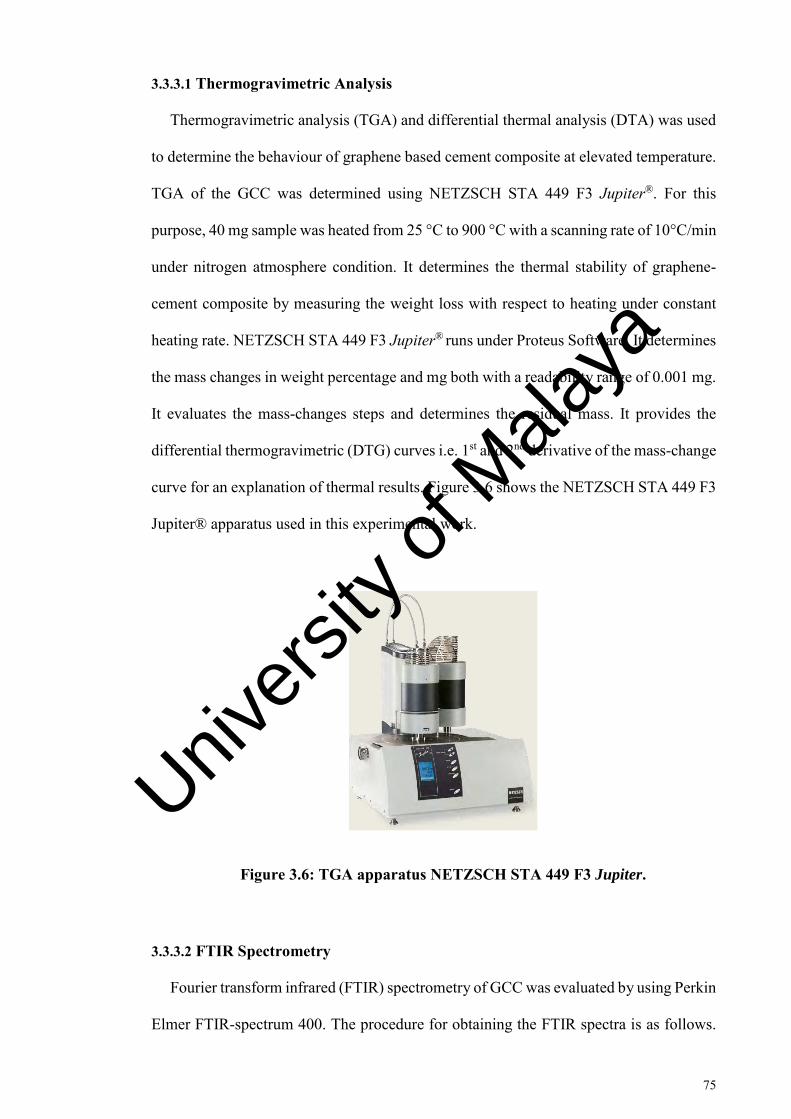
75
3.3.3.1 Thermogravimetric Analysis
Thermogravimetric analysis (TGA) and differential thermal analysis (DTA) was used
to determine the behaviour of graphene based cement composite at elevated temperature.
TGA of the GCC was determined using NETZSCH STA 449 F3 Jupiter®. For this
purpose, 40 mg sample was heated from 25 °C to 900 °C with a scanning rate of 10°C/min
under nitrogen atmosphere condition. It determines the thermal stability of graphene-
cement composite by measuring the weight loss with respect to heating under constant
heating rate. NETZSCH STA 449 F3 Jupiter® runs under Proteus Software. It determines
the mass changes in weight percentage and mg both with a readability range of 0.001 mg.
It evaluates the mass-changes steps and determines the residual mass. It provides the
differential thermogravimetric (DTG) curves i.e. 1st and 2nd derivative of the mass-change
curve for an explanation of thermal results. Figure 3.6 shows the NETZSCH STA 449 F3
Jupiter® apparatus used in this experimental work.
Figure 3.6: TGA apparatus NETZSCH STA 449 F3 Jupiter.
3.3.3.2 FTIR Spectrometry
Fourier transform infrared (FTIR) spectrometry of GCC was evaluated by using Perkin
Elmer FTIR-spectrum 400. The procedure for obtaining the FTIR spectra is as follows.
Univers
ity of
Mala
ya

76
The crushed mortar sample and the Potassium bromide (KBr) were heated for 24 h at
105°C and then mixed in 1:1000 (powder: KBr) ratio in a controlled humidity
environment. Next, the mixed sample was pressed at 10 ton for 1 minute using a Specac
15-Ton Manual Hydraulic Press. Finally, the obtained KBr pellet was placed in the
sample container, and the infrared spectrum was obtained. Spectrum Analysis software
was used to obtain the infrared spectrum. The spectrometer was operated with 4 cm-1
resolution in the region of 400-4000 cm-1. Figure 3.7 shows the FTIR apparatus attached
to the computer.
Figure 3.7: FTIR apparatus Perkin Elmer FTIR-spectrum 400 attached to computer system.
3.3.3.3 XRD Analysis
X-ray diffraction was conducted on the grounded fine powder to see the mineralogical
characteristics of the graphene-cement composite by using PANalytical-Empyrean X-ray
diffractometer with Cu Kα radiation (1.5418 Å) operated at 45 kV and 40 mA and 2θ
scan between 5o and 80o. Scan type was continuous and step time was 148.92 seconds,
divergence slit was fixed type with slit size 0.0573° while receiving slit size was 0.10°.
The measurement temperature was 25°C, scan axis was Gonio with 240 mm Goniometer
radius. The diffraction pattern from International Centre for Diffraction Data (ICDD) was
Univers
ity of
Mala
ya

77
used to identify the chemical phases of the specimens by using “PANalytical X’Pert
HighScore program. Figure 3.8 represents the PANalytical-Empyrean X-ray
diffractometer, which has a perfect XRD platform to the characterization of materials,
was used in this study.
Figure 3.8: PANalytical-Empyrean X-ray diffractometer.
3.3.3.4 FESEM Images
Later, from the remnant pieces of the cubes, small samples of size 1×1×0.5 cm were
randomly picked and used for microstructural analysis. Surface morphology of graphene-
cement composite was investigated by using Field Emission Scanning Electron
Microscope (FE-SEM, Hitachi SU70 with semi-in-lens). FESEM can provide
topographical and element information at a magnification of 10x to 800,000x. FESEM
used a focused beam of a high-energy electron to generate a variety of signals at the
surface of solid specimens. The signals that derive from electron-specimen interactions
discovered information about the specimens. Moreover, it was equipped with Oxford
Energy-dispersive X-ray (EDX) Spectrometer and used to identify the elemental
Univers
ity of
Mala
ya

78
composition of the specimens as shown in Figure 3.9. Samples were Gold/Palladium
coated using the sputtering technique to enhance their conductivity prior to microscopic
analysis.
Figure 3.9: Hitachi SU70 Field emission scanning microscope (FESEM).
3.3.4 Test Setup for Rheological Measurements
Rheological properties were characterized by using Rheometer MCR302 (Anton-Paar)
as shown in Figure 3.10. The Rheoplus software was used to monitor and analyse the data
points. To determine the rheological characteristics of the graphene-cement paste smooth
parallel plates with the gap of 0.6 mm were used as shown in Figure 3.10 (b). GC paste
was prepared according to the mix proportion of Table 3.5. Description of the specimens
is given in Table 3.5. When material got ready it was poured on the plates immediately.
Approximately 15 ml of GC paste was added on the plate having diameter 25 mm at a
fixed temperature of 25 ᴼC. Initially, cement paste was held at rest and after 10 min then
it was pre-sheared at a shear rate of 100 s-1 for 60 seconds. This was done to re-
homogenize the sample as cement paste has thixotropic character (Roussel et al., 2012).
After 5 min, shear rate was applied from 0.6 s-1 -200 s-1 with 40 steps and then back from
Univers
ity of
Mala
ya

79
200 s-1 -0.6 s-1. Downslope curve data was used for calculation of rheological parameters.
Moreover, different content of graphene, different shear rate cycles, resting time,
superplasticizer and test geometries were considered as the factors effecting the rheology
of cement paste. To examine the influence of these variables on rheological properties
only G1 type mix was used. Furthermore, the results of these variables were also
determined by using concentric cylinder geometry. Smooth concentric cylinder with a
gap thickness of 1.2 mm has been used. Figure 3.10 (c) shows the accessories for the
concentric cylinder. The radius of the measuring cup (outer cylinder) and bob (inner
cylinder) was 14.450 mm and 13.331 mm respectively. The active length of the bob was
120.2 mm and gap length was 40 mm. Bob (inner cylinder) rotates with variable rotational
velocities to control the shear rate. Shear stress and shear rate were calculated from torque
and applied rotational velocity. Cement paste samples were prepared according to the mix
design of Table 3.3.
Table 3.5: Description of rheological samples using parallel plates.
Mix Design
W/C ratio
Cement (g)
Water (ml)
GNP (mg)
GNP/cement (%)
Sher rate cycle range
(s-1) M0 0.4 100 40 0 0 200-0.6
G1M3 G2M3 G3M3
0.4 100 40 30 0.03 200-0.6
G1M5 G2M5 G3M5
0.4 100 40 50 0.05 200-0.6
G1M10 G2M10 G3M10
0.4 100 40 100 0.10 200-0.6
When the material was prepared, it was divided into three equal portions. The first
portion was poured immediately while the second and third portion was poured after 30
min and 60 min later. Approximately 15 ml of graphene-cement paste was added at a
Univers
ity of
Mala
ya

80
fixed temperature of 25 ᴼC. Initially, cement paste was held at rest and after 10 min then
it was pre-sheared at a shear rate of 100 s-1 for 60 seconds. After 5 min, shear rate was
applied from 0.6 s-1 to 100 s-1 and then back from 100 s-1 to 0.06 s-1 in 20 decreasing
steps. Downslope curve data was used for calculation of rheological parameters. To
examine the influence of shear rate cycle range on rheological properties only M0 and
G1M3 mix were used. These samples were subjected to three different shear rate cycle
range i.e. 100-0.6 s-1, 200-06 s-1 and 300-0.6 s-1 with 20, 40 and 60 decreasing steps
respectively. Three resting times, the time between sample preparation and casting were
considered in this study to examine their effect on cement-paste rheology. For this
purpose, only M0 and G1M3 mix were used. At different time interval, 0 min, 30 min
and 60 min, samples were manually stirred for 15 seconds before measuring the
rheological data. Influence of superplasticizer on rheological properties and different test
geometries was studied on M0 and G1M3 mixes. The detail description of the graphene
percentage, shear rate cycle range, resting time and superplasticizer of various samples
for measuring rheological data is given in Table 3.6. Apparent viscosity, shear stress and
a shear rate of graphene-cement paste with different proportions were measured by the
rheometer. Yield stress and plastic viscosity of the graphene-cement paste was
determined by using the Bingham, Modified Bingham, Herschel-Bulkley and Casson
models. Besides this, results of the concentric cylinder geometry were compared to the
parallel plate setup. Univers
ity of
Mala
ya

81
(a) Rheometer MCR302
Anton-Paar
(b) Parallel plate
setting
(c) Concentric cylinder
setting
Figure 3.10: Experimental setup for rheological measurements.
Table 3.6: Description of rheological samples.
Sample Sher rate cycle range (s-1) Resting time (min) Effect of graphene percentage
M0 (Control) 200-0.6 0 G1M3 200-0.6 0 G1M5 200-0.6 0 G1M10 200-0.6 0
Effect of shear rate M0a 100-0.6 0 M0b 200-0.6 0 M0c 300-0.6 0
G1M3a 100-0.6 0 G1M3b 200-0.6 0 G1M3c 300-0.6 0
Effect of resting time M0-0 200-0.6 0
M0-30 200-0.6 30 M0-60 200-0.6 60
G1M3-0 200-0.6 0 G1M3-30 200-0.6 30 G1M3-60 200-0.6 60
Effect of SP M0 (Control) 200-0.6 0
M0S 200-0.6 0 G1M3 200-0.6 0
G1M3S 200-0.6 0
Univers
ity of
Mala
ya
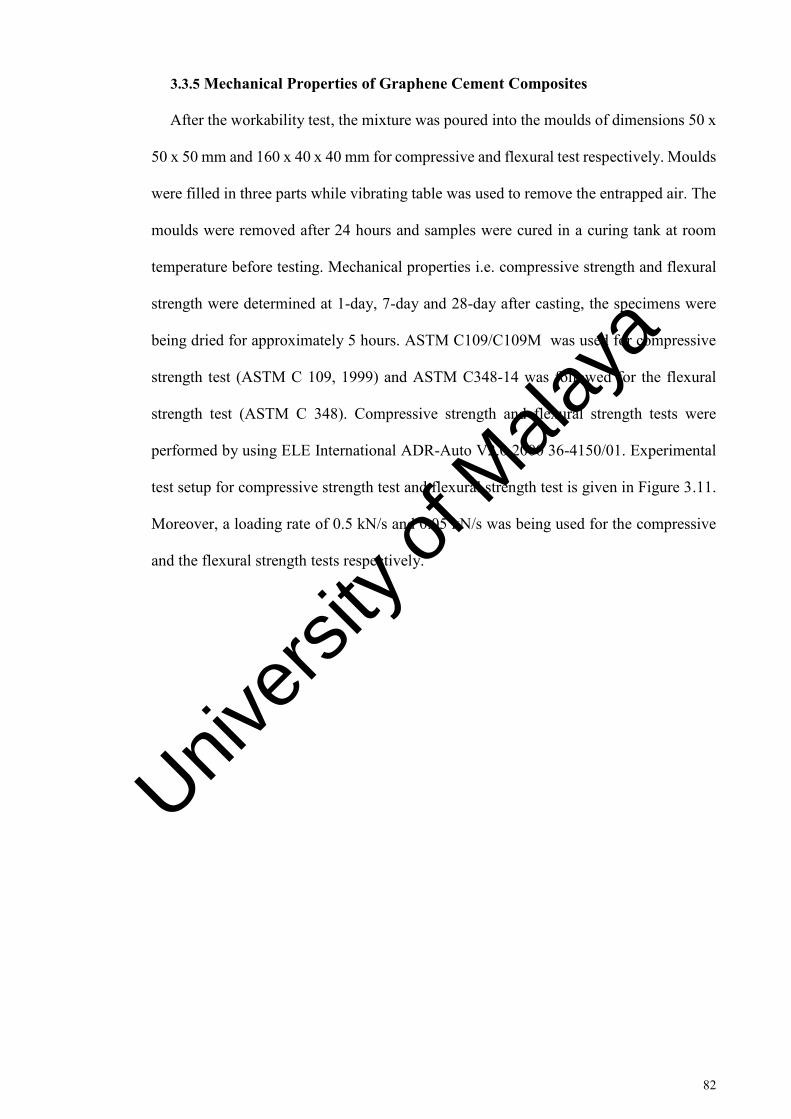
82
3.3.5 Mechanical Properties of Graphene Cement Composites
After the workability test, the mixture was poured into the moulds of dimensions 50 x
50 x 50 mm and 160 x 40 x 40 mm for compressive and flexural test respectively. Moulds
were filled in three parts while vibrating table was used to remove the entrapped air. The
moulds were removed after 24 hours and samples were cured in a curing tank at room
temperature before testing. Mechanical properties i.e. compressive strength and flexural
strength were determined at 1-day, 7-day and 28-day after casting, the specimens were
being dried for approximately 5 hours. ASTM C109/C109M was used for compressive
strength test (ASTM C 109, 1999) and ASTM C348-14 was followed for the flexural
strength test (ASTM C 348). Compressive strength and flexural strength tests were
performed by using ELE International ADR-Auto V2.0 2000 36-4150/01. Experimental
test setup for compressive strength test and flexural strength test is given in Figure 3.11.
Moreover, a loading rate of 0.5 kN/s and 0.05 kN/s was being used for the compressive
and the flexural strength tests respectively.
Univers
ity of
Mala
ya
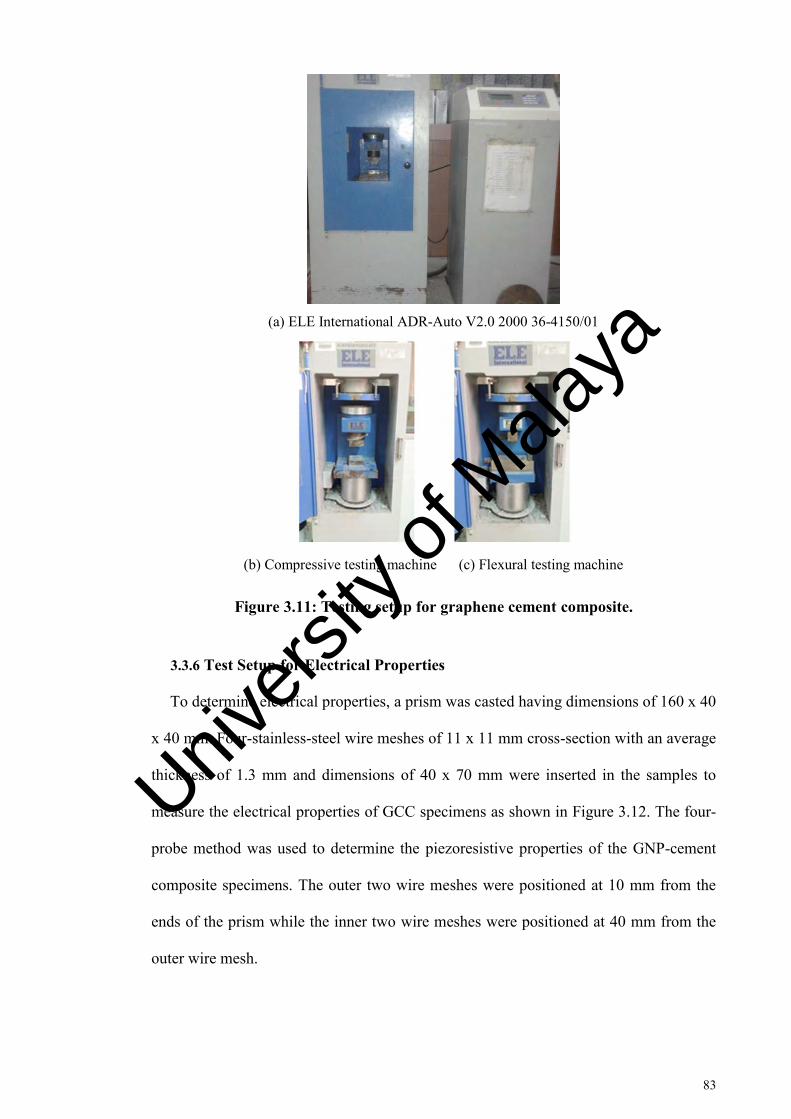
83
(a) ELE International ADR-Auto V2.0 2000 36-4150/01
(b) Compressive testing machine (c) Flexural testing machine
Figure 3.11: Testing setup for graphene cement composite.
3.3.6 Test Setup for Electrical Properties
To determine electrical properties, a prism was casted having dimensions of 160 x 40
x 40 mm. Four-stainless-steel wire meshes of 11 x 11 mm cross-section with an average
thickness of 1.3 mm and dimensions of 40 x 70 mm were inserted in the samples to
measure the electrical properties of GCC specimens as shown in Figure 3.12. The four-
probe method was used to determine the piezoresistive properties of the GNP-cement
composite specimens. The outer two wire meshes were positioned at 10 mm from the
ends of the prism while the inner two wire meshes were positioned at 40 mm from the
outer wire mesh.
Univers
ity of
Mala
ya

84
Figure 3.12: Dimensions of the graphene-cement composite specimen with wire mesh details.
Table 3.7 shows the mix proportions used for determining the piezoresistive properties
of the graphene cement composites. The setup for measuring the electrical resistivity
comprise of Instron 600 kN machine used for applying a compressive load, TDS-530 data
logger to record the voltage measurements, a DC power supply, and 10-ohm resistance.
Specimens were placed in Instron machine and a constant voltage of 15 V through DC
power supply was applied to the samples. Figure 3.13 shows the schematic illustration of
the electrical connection in circuit. Inner wire meshes were connected to the data logger
and measures the voltage drop in V. Meanwhile, one of the outer wire meshes was
connected to the negative terminal of the power supply and the remaining outer wire mesh
was connected to the resistor followed by the connection to the second channel of the
data logger and positive terminal of the power supply forming a series circuit as shown
in Figure 3.13.
Univers
ity of
Mala
ya

85
Table 3.7: Mix proportions for cement paste.
Mix Design
W/C ratio
Cement (g)
Water (ml)
GNP (mg)
GNP/cement (%)
M0 0.4 100 40 0 0 G1M3 G2M3 G3M3
0.4 100 40 30 0.03
G1M5 G2M5 G3M5
0.4 100 40 50 0.05
G1M10 G2M10 G3M10
0.4 100 40 100 0.10
Figure 3.13: Schematic illustration of the electrical connections.
Furthermore, Figure 3.14 (a) shows the overall test setup for the measurement of
electrical properties. The strain gauges were attached to the specimens to monitor the
produced strain (Figure 3.14 (b)). TDS-530 data logger was recording all the
Sample
Univers
ity of
Mala
ya

86
measurements. The stress-strain curves were developed and compared to electrical
properties of the GC specimens. Moreover, these curves were used to explore the
characteristics of smart sensors and further used for SHM of concrete structures.
Furthermore, to observe the sensing ability of the specimens, normalized compressive
loading (NCL) values were calculated. It is the ratio between the applied loads to the
maximum compressive load before specimen failure. For electrical resistance values, the
fractional change in resistance (FCR) was used. Equations 3.1 and Equation 3.2 presents
the calculation procedure for the NCL and FCR values.
NCL = P
Pmax (3.1)
FCR = ρt − ρo
ρo x 100% (3.2)
Where: ρt = electrical resistivity at the given time during the test; ρo = electrical
resistivity at the start of the test; P = compressive loading at the given time during the
test; Pmax = maximum compressive loading for the specimen.
3.4 Practical Application of Graphene Cement Composite
The practical application of the graphene-cement composite specimen was
investigated by testing the graphene-cement composite specimen in reinforced concrete
beam and concrete-filled steel tube beam in the laboratory. Dai et al. (2014) explored the
effect of percentage of graphene flakes on the strain and damage sensing of the
composites. They found that with an increase in the percentage of graphene flakes in
cement based composite, the fractional change in resistance values was also increasing.
Therefore, based on the study of Dai et al. (2014), only M0 and G1M3 specimens were
considered to explore the potential application of composite materials.
Univers
ity of
Mala
ya

87
3.4.1 Reinforced Concrete (RC) Beam
A rectangular beam was casted having a cross-sectional dimension 200 x 300 (mm)
and span length 3200 mm as shown in Figure 3.15. This RC beam was used for
investigating the practical application of smart sensors based on GCC. Details and
dimensions of GCC was already discussed in Figure 3.12. Moreover, Figure 3.15 (a)
shows the placement of GC smart sensors in RC beam. Plain bar of 10 mm diameter was
used as stirrups and main bars of 16 mm diameter were used as main tension
reinforcement. The yield strength of the plain and main bars was ~ 394 MPa and 540 MPa
respectively. Details of the reinforcement bars, stirrups and spacing are mentioned in
Figure 3.15 (a). Figure 3.15 (b) shows the reinforced steel mesh prior to concrete casting.
The strain gauge was attached to the main reinforcement bar to determine the strain values
in steel. Later these values were compared to the readings of GC specimen. For the
preparation of concrete beam, OPC, sand, coarse aggregate and water were used. The
OPC was conforming to MS 522 Part 1 2003 (MS-522: Part 1, 2003) with a specific
surface area and specific gravity of 0.351 m2/g and 3.14, respectively. The chemical
composition of OPC is given in Table 3.1. Local mining sand with fineness modulus of
2.89, specific gravity of 2.68, water absorption 0.51% and maximum grain size of 4.75
mm was used as fine aggregate. Crushed granite aggregate of 20 mm maximum size was
used as the coarse aggregate. The water-cement ratio (w/c) was kept constant as 0.5.
Cement, sand and coarse aggregate were used in the ratio of 1:2:4. Univers
ity of
Mala
ya

88
(a) The overall test set up for four-probe electrical properties testing
(b) placement of specimen with strain gauge into
Instron 600 kN machine
(c) TDS-530 Datalogger
Figure 3.14: Measurement of electrical properties.
To determine the workability of concrete slump cone test was used as per BS EN
12350-2 (BS EN12350-2, 2009). Concrete was found workable with slump value of 35
mm. BS EN 12390-3 (BS EN 12390-3, 2000) was followed to calculate the compressive
DC Battery
Data Logger
Specimen
Instron 600 kN
Strain gauge
Univers
ity of
Mala
ya

89
strength of concrete. Three cubes of 100 x 100 x 100 mm were tested after 28-day of
casting and determined the average compressive strength of ~ 34 MPa.
(a) Schematic layout of longitudinal and cross-sectional details of beam
(b) reinforced steel cage
Figure 3.15: Details of reinforced concrete beam.
ASTM C469 (ASTM C 469, 2014) was used to determine the modulus of elasticity of
concrete and its value was found 28.50 GPa. Figure 3.16 shows the sample placement
and casting of concrete. GC specimens were placed in the middle-third portion of the
concrete beam, in order to observe the propagation of the damages and cracks as shown
in Figure 3.16 (a). Samples were tied with the main reinforcement to remain fix and
unaffected due to vibration and casting of concrete. Spacing between GCC specimens
was 300 mm. Portable vibrator was used to remove the entrapped air during concreting
as shown in Figure 3.16 (b). It was used with extreme care so that the electrical
connections remain in contact. Figure 3.16 (c) represents the casting of concrete in beam
mould.
Univers
ity of
Mala
ya

90
(a) Placement of sample on reinforced bars
(b) Use of vibrator to remove the
entrapped air
(c) Casting of concrete in beam mould
Figure 3.16: Sample placement and casting of the beam.
After 28 days, this beam was subjected to flexural loading. Figure 3.17 (a) shows the
test setup for the testing of the beam. Before testing all the electrical connections were
checked. Two types of flexural loading were applied, one was from zero to failure stage
and other one is profile loading. In profile loading, different damages were introduced in
the beam by applying different loading. It determines the effectiveness of the GC smart
sensor against various damages. Damage-sensing is better and realistic approach as
compared to stress or strain sensing. Damage generation is irreversible upon unloading
however, stresses are reversible upon unloading. Therefore, real-time and continuous
monitoring is not required in case of damage-sensing. It is often called as damage
memorization as well. Therefore, to check the effectiveness of graphene-cement
specimen as damage-sensing instead of stress-sensing, the beam was subjected to profile
loading. Damage levels from 1 to 5 were induced in the beam and response of the GC
specimen was noted. Loading protocols and damage levels are given in Table 3.8. Profile
Univers
ity of
Mala
ya

91
loading was applied to the beam, a 15 kN/min loading rate was used for increase loading
cycle and then at maximum load, it was held for 2 min and then finally reduced back to
zero loads with 25 kN/min loading rate. Experimental setup for reinforced beam testing
is given in 3.17 (a). Four-point loading was applied to the beam. Electric power was
applied through the 15 V DC battery and TDS-530 data logger was used to record the
data. Figure 3.17 (b) shows the electrical connection setup attached with the graphene-
cement sample and battery. The parallel circuit was used to monitor the electrical
resistivity values from the pure cement specimen and graphene-cement composite
specimen. As the beam was subjected to flexural loading, therefore, flexural cracks were
developed in the middle-third region of the beam as shown in Figure 3.17 (c). Due to this
reason, graphene-cement specimens were placed within the middle-third portion of the
RC beam. Figure 3.17 (c) showed the propagation of cracks and failure of the beam.
Table 3.8: Description of loading protocols and damage levels.
Damage Level
Deficiency Level Crack length Loading
(kN) Design
loading (%) 0 None None / 1 µm 0-40 20
1 Marginal Partial / 100 µm 0-80 40 2 Moderate Some/ ≤ 1mm 0-120 60 3 Severe Fair amount / ≤10 mm 0-160 80 4 Severe Large amount / ≤100 mm 0-200 100 5 Failed Large / ≤1m 0-Fail (227) >100
Univers
ity of
Mala
ya

92
(a) Overall test set up for testing of reinforced concrete (RC) beam.
(b) Electrical connections for RC beam enlarge view of the marked area in (a).
(c) Failure of the beam under flexural loading.
Figure 3.17: Description of test setup in the laboratory.
Univers
ity of
Mala
ya

93
CHAPTER 4: RESULTS AND DISCUSSIONS
4.1 Introduction
This chapter focuses on the presentation and analysis of the experimental results. The
data obtained throughout the investigation are interpreted and explained. This chapter
consists of nine sections and several subsections. The outcomes of the results are
discussed technically and elaborately.
4.2 Dispersion Efficiency of Graphene
Ultraviolet-visible (UV-vis) spectrometric measurements were used to determine the
stability of dispersed graphene in aqueous solution. As graphene flakes absorbed light in
aqueous solution therefore, absorbance peak values can represent the concentration of
suspended graphene flakes in solution. Deionized water was used as a reference for
determining the dispersion efficiency of graphene flakes. It is known that graphene is
hydrophobic in nature and its hydrophobicity depends on the thickness of graphene layers
(Munz et al., 2015). Moreover, it formed the flocculated structures in aqueous solution.
Hence, it is important to study the dispersion efficiency of graphene in water. Figure 4.1
shows the absorbed spectra for the graphene solution. It was noted that the highest
absorbance peak appeared at 271 nm, which represents the 𝜋 -𝜋* transition of carbon
bond.
Univers
ity of
Mala
ya

94
Figure 4.1: Absorbance spectra of graphene in aqueous solution.
4.2.1 Effect of Graphene Type on Dispersion Efficiency
The absorbance values for different types of graphene at a wavelength of 271 nm are
given in Figure 4.2. The graphene flakes were dispersed in aqueous solution using
ultrasonication. It was found that absorbance values were decreasing for all graphene
types with the passage of time. Overall peak drop from 0-120 min after ultrasonication
for G1 type graphene was recorded as 18%, however, for G2 and G3 type it was 57% and
56% respectively. It was noted that maximum absorbance value was observed for G1
type, while minimum for G2. According to Munz et al. (2015), the hydrophobicity of
graphene is dependent upon the thickness of the graphene layers and it increases with the
layers of graphene sheets. Therefore, the possible reason for absorbance values may be
attributed to the high surface area and less flake thickness. However, for G2 type
graphene, flake thickness is 2.5 times more than G1, which will make agglomeration
easier and increase its sedimentation. Interestingly, from 30-120 min time interval
absorbance peak drop value for G3 was approximately twice of the G2 and four-time of
Univers
ity of
Mala
ya

95
G1. Main reason is the difference between average flake thickness and surface area.
Average flake thickness is 5 times more than G1 and twice of G2, however, the surface
area is half of G1 and two-thirds of G2. Therefore, it can be deduced from these results
that surface area, flake thickness and average lateral flake size have a strong influence on
the dispersion of graphene in aqueous solution. It may be concluded that graphene flakes
with high surface area, less flake thickness and moderate lateral size have better
dispersion.
Figure 4.2: Absorbance values for various graphene types at different time interval observed at 271 nm peak.
4.2.2 Effect of Superplasticizer on Dispersion Efficiency
Superplasticizer (SP) plays an important role on the dispersion of nanomaterials.
Influence of SP has been widely studied by the various researchers. As superplasticizer
has an electromagnetic charge on it therefore, due to electrostatic repulsion it disperses
the nanomaterials. Figures 4.3 represents the absorbance peak values for different
Univers
ity of
Mala
ya

96
graphene type at 271 nm with and without SP. SP greatly enhanced the dispersion of
graphene flakes and higher absorbance peaks were recorded. Moreover, it was found that
with the passage of time, SP significantly stops the sedimentation of graphene and make
them stable for a long duration. However, for G3 type a continuous drop was observed in
absorbance values and it may be attributed to the thick layer of graphene flakes which is
in conformity of the findings of Munz et al. (2015). Munz et al. (2015) found that two-
layer graphene is more hydrophobic than single-layer graphene. In general, it can be
concluded that superplasticizer greatly influences the dispersion of graphene flakes and
make them stable and uniformly spread in the aqueous solution over long duration.
Figure 4.3: Effect of superplasticizer on the absorbance values for various graphene types at different time interval observed at 271 nm peak.
Univers
ity of
Mala
ya

97
4.2.3 Effect of Magnetic Stirring on Dispersion Efficiency
As graphene is hydrophobic (Munz et al., 2015), therefore, it will form the
agglomerates in aqueous solution as shown in Figure 4.4. The green circular line in Figure
4.4 shows the adhesion of graphene with the walls of beaker while, yellow circles marked
various agglomerates. Materazzi et al. (2013) and Ubertini et al. (2014) used the magnetic
stirring for the dispersion of nanomaterials in deionized water. Materazzi et al. (2013)
performed the dispersion of nanomaterial with a magnetic stirrer, mechanical agitator and
by sonication.
(a) Top view
(b) Side view
Figure 4.4: Agglomeration of graphene in aqueous solution.
Similarly, Ubertini et al. (2014) used 10 min of magnetic stirring, 60 min of sonication
and 15 min of mechanical mixing for the preparation of carbon nanotube cement based
sensor. Thus, in order to exfoliate graphene flakes further in aqueous solution, a
combination of ultrasonication and magnetic stirring were used. In order to determine the
optimum duration of magnetic stirring various stirring time was utilized. Figure 4.5 shows
the variation of absorbance peaks value with different stirring time observed at 271 nm
peak after 120 min of magnetic stirring. It was found from the Figure 4.5 that after
magnetic stirring absorbance peaks increased. The optimum increase in absorbance peak
Univers
ity of
Mala
ya
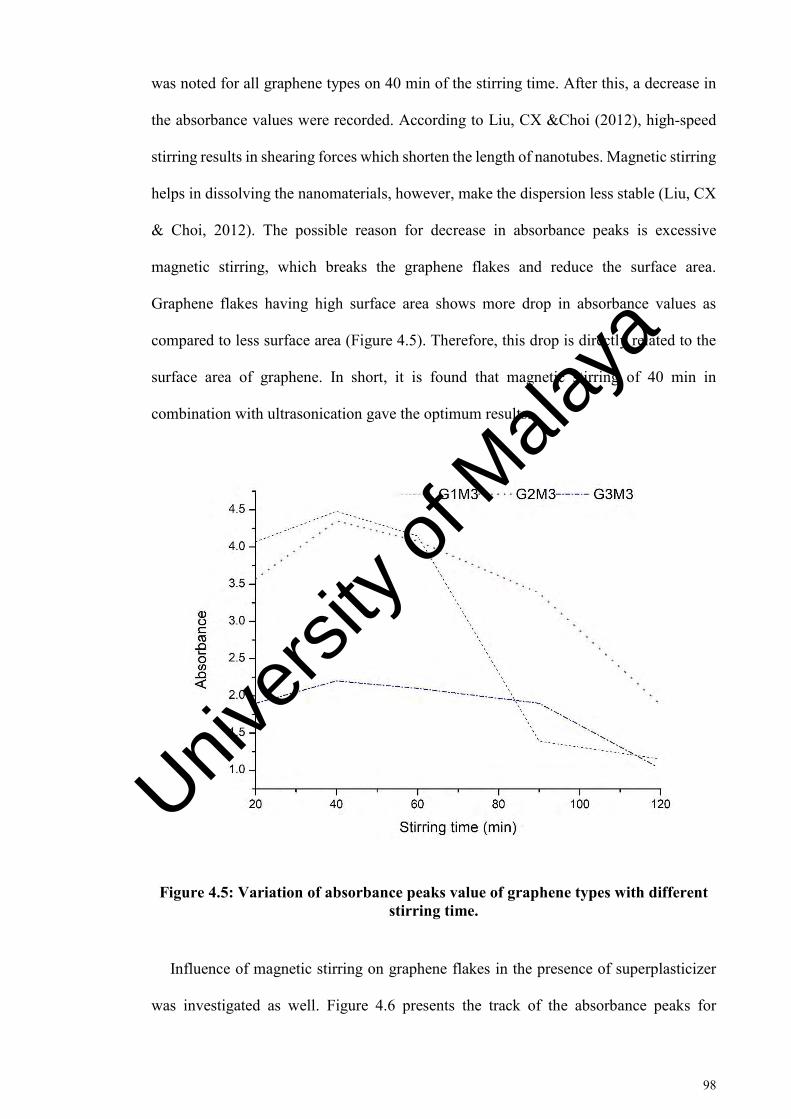
98
was noted for all graphene types on 40 min of the stirring time. After this, a decrease in
the absorbance values were recorded. According to Liu, CX &Choi (2012), high-speed
stirring results in shearing forces which shorten the length of nanotubes. Magnetic stirring
helps in dissolving the nanomaterials, however, make the dispersion less stable (Liu, CX
& Choi, 2012). The possible reason for decrease in absorbance peaks is excessive
magnetic stirring, which breaks the graphene flakes and reduce the surface area.
Graphene flakes having high surface area shows more drop in absorbance values as
compared to less surface area (Figure 4.5). Therefore, this drop is directly related to the
surface area of graphene. In short, it is found that magnetic stirring of 40 min in
combination with ultrasonication gave the optimum results.
Figure 4.5: Variation of absorbance peaks value of graphene types with different stirring time.
Influence of magnetic stirring on graphene flakes in the presence of superplasticizer
was investigated as well. Figure 4.6 presents the track of the absorbance peaks for
Univers
ity of
Mala
ya

99
different graphene types against magnetic stirring duration observed at 271 nm peak after
120 min of magnetic stirring. It was observed that due to superplasticizer the dispersion
was more stable at high magnetic stirring duration. As the flake thickness was more for
G3 type, therefore, at high magnetic stirring time these flakes broke, formed the
agglomerates and made the overall dispersion less stable.
Figure 4.6: Influence of superplasticizer on the absorbance peaks value of graphene types with different stirring time.
In conclusion, graphene is hydrophobic in nature, however, hydrophobicity is
dependent on the thickness, lateral size and surface area of graphene. Graphene flakes
with the high surface area, less thickness and moderate lateral size provide better results.
Additionally, magnetic stirring for 40 min in combination with ultrasonication gave the
optimum results.
Univers
ity of
Mala
ya

100
4.3 Micro-scale Characterization of Graphene Cement Composites
Microanalytical characterization of the graphene-cement composites were
investigated using various techniques. Thermogravimetric analysis was used to
investigate the thermal behaviour. Chemical interaction was examined using Fourier
Transform Infrared spectrometer. X-ray Diffractometer was used to explore the
crystalline structure and phase composition of GCC. Microstructure analysis of graphene-
cement composite was done using field emission scanning electron microscope analysis.
In this section, microanalytical characterization will be discussed in detail.
4.3.1 TGA/DTG Curves of Graphene Cement Composite
TGA/DTG curves for graphene-cement composite was obtained and presented in
Figure 4.7. Table 4.1 shows the weight loss in the region 1, 2 and 3 as mention in Figure
2.9. TGA/DTG curves for G1, G2 and G3 types cement mixes were given in Figure 4.7
(a), (b) and (c) respectively. Each illustration highlights the influence of an increase in
graphene content in the composite material. Percentage weight loss with respect to total
weight loss in three regions were also determined. Moreover, approximate amount of
calcium hydroxide was obtained using molecular mass ratio. The first derivative of the
mass curve was also taken and plotted on the secondary axis in Figure 4.7. Overall 64
different samples were used to obtain the TGA/DTA data for various graphene cement
composite mixes at different curing age time. It is important to mention here that, due to
the limitation of measuring equipment and a huge number of specimens, some samples
were not tested on the exact date. Testing of specimens was started with G1 type mix
followed by G2, G3 type mixes and ended with control (M0) mix. Therefore, slight
variation in results of G1 type and M0 was expected. Generally, the weight loss during
180-300 oC range of cement composites was less for G1 type as compared to control
sample. However, the weight loss for G2 and G3 was found more as compared to M0.
Univers
ity of
Mala
ya

101
This weight loss is associated with the dehydration of bonded water from CSH, hence, it
has higher hydration reaction degree. Increase in production of hydrated cement products
i.e. CSH gel will fill up the micropores and enhance the mechanical properties. In region
2 weight loss is related to the dehydroxylation of portlandite. It gives the estimation of
the presence of hydrated cement products. According to Trezza (2007), the amount of
portlandite (CH) gives an indication of the degree of hydration reaction. It was noted that
higher percentages of graphene yielded a higher amount of CH (Table 4.1). Few
anomalies were observed for G1M3 mix and G3M5. These anomalies may be related to
the delay of testing setup. Therefore, it is concluded that more hydrated cement products
formed in graphene-cement composite material. Moreover, GCC are more packed,
durable and more hydration occurred by incorporating graphene.
Table 4.1: Weight loss obtained from TGA/DTG and calculation of CH for different percentage of graphene-cement composites.
Sample / Temperature
Weight loss (%) / Weight loss with respect to total weight loss (%)
Amount of CH using Molecular Mass ratio (%)
180-300 ᴼC 430-480 ᴼC 600-780 ᴼC 430-
480 ᴼC 600-780
ᴼC Total (dehydration of bonded
water)
(dehydroxylation of portlandite)
(decarbonation of calcium
carbonate) M0 3.17 39.7 2.60 32.5 2.22 27.8 10.68 3.74 14.42
G1M3 2.58 28.7 1.35 15.0 5.05 56.2 5.54 8.486 14.03 G1M5 3.01 38.3 2.91 37.0 1.94 24.7 11.96 3.26 15.22 G1M10 3.00 36.3 3.38 40.9 1.89 22.9 13.91 3.17 17.08 G2M3 3.10 40.2 2.66 34.5 1.95 25.3 10.95 3.28 14.23 G2M5 3.15 40.1 2.66 33.9 2.04 26.0 10.93 3.43 14.36 G2M10 3.29 39.5 2.90 34.8 2.14 25.7 11.93 3.60 15.53 G3M3 3.60 43.4 2.93 35.3 1.76 21.2 12.03 2.96 14.98 G3M5 2.53 36.8 1.98 28.8 2.36 34.4 8.13 3.97 12.09 G3M10 3.29 41.9 2.68 34.1 1.88 23.9 11.03 3.16 14.19
Univers
ity of
Mala
ya

102
(a) G1-cement composites
(b) G2-cement composites
Figure 4.7: Continued
Univers
ity of
Mala
ya

103
(c) G3-cement composites
Figure 4.7: TGA/DTG curves for graphene cement composites.
Table 4.1 is also used to study the influence of different types of graphene on cement
composites with respect to weight loss obtains from TGA/DTG curves. TGA/DTG curves
presented in Figure 4.7 may also be used further to investigate the effect of graphene
surface area and sizes on elevated temperature. It was observed that weight loss
corresponding to region 1 (water loss from the bonded water of CSH gel) was maximum
for G3 type followed by G2 and G1. However, maximum percentage of calcium
hydroxide was noted for G1 cement mixes followed by G2 and G3. Therefore, it is
difficult to mention that’s as to which graphene type yields more hydrated products than
the other. However, it can be stated from observing the trend of TGA curves that graphene
with more surface area produce more amount of CH whereas, graphene flakes with large
lateral size and thickness will affect the amount of CSH gel. Thus, G2 type graphene is
the optimum one and gave the best results. Later, in the mechanical properties section, it
Univers
ity of
Mala
ya

104
was found that G2 type cement mix obtains the maximum values for compressive and
flexural strength. It was found that nanomaterials enhanced the mechanical properties at
an early age more as compared to later age. For this purpose, samples were tested at 7
and 28 days after casting for thermogravimetric analysis. Table 4.2 shows the weight loss
for region 1, 2 and 3 and the approximate amount of CH for cement composites at 7-day
and 28-day. TGA/DTG curves for graphene type G1, G2 and G3 based cement
composites were given in Figure 4.8 (a), (b) and (c). It was observed for G1 type cement
composite that weight loss in region 1 for 28-day specimen was increased by 33% as
compared to the 7-day specimen. In similar region increment of 9% and 17% were found
for G2 and G3 type composites respectively. Generally, it was estimated that the amount
of CH was increasing with curing age. In short, it can be concluded that hydrated cement
products were increasing with increase in curing age, however, graphene flakes enhanced
the growth of CSH gel in the cement composite.
(a) G1-cement composites
Figure 4.8: Continued
Univers
ity of
Mala
ya

105
(b) G2-cement composites
(c) G3-cement composites
Figure 4.8: TGA/DTA curves for graphene cement composites at 7 and 28 days after casting.
Univers
ity of
Mala
ya

106
Table 4.2: Weight loss obtained from TGA/DTA and calculation of CH for graphene cement composites at 7 and 28 days.
Sample / Temperature
Weight loss (%) / Weight loss with respect to total weight loss (%)
Amount of CH using Molecular Mass ratio (%)
180-300 ᴼC 430-480 ᴼC 600-780 ᴼC 430-
480 ᴼC 600-780
ᴼC Total (dehydration of bonded
water)
(dehydroxylation of portlandite)
(decarbonation of calcium
carbonate) M0-7D 1.59 41.4 1.29 33.6 0.96 25.0 5.32 1.61 6.93
M0-28D 3.17 39.7 2.60 32.5 2.22 27.8 10.68 3.74 14.42 G1M3-7D 1.94 21.5 1.04 11.5 6.04 67.0 4.29 10.15 14.44
G1M3-28D 2.58 28.7 1.35 15.0 5.05 56.2 5.54 8.486 14.03 G2M3-7D 2.67 36.7 2.62 36.0 1.98 27.2 10.78 3.34 14.11
G2M3-28D 3.10 40.2 2.66 34.5 1.95 25.3 10.95 3.28 14.23 G3M3-7D 2.30 37.1 2.15 34.7 1.75 28.2 8.83 2.94 11.77
G3M3-28D 3.60 43.4 2.93 35.3 1.76 21.2 12.03 2.96 14.98
Lastly, the TGA/DTG curves were obtained for graphene-cement composite with
superplasticizer (SP) and presented in Figure 4.9. Table 4.3 presents the weight loss and
CH data obtained from these curves. It was noted that cement mixes with
superplasticizers obtained more quantity of calcium hydroxide. CH is the most soluble of
the hydration products, and thus is a weak link in cement and concrete from a durability
point of view. Moreover, if the paste is exposed to fresh water, the CH will leach out
(dissolve), increasing the porosity and thus making the paste more vulnerable to further
leaching and chemical attack.
Univers
ity of
Mala
ya

107
Table 4.3: Weight loss obtained from TGA/DTA and calculation of CH for graphene-cement composites added with superplasticizer.
Sample / Temperature
Weight loss (%) / Weight loss with respect to total weight loss (%)
Amount of CH using Molecular Mass ratio (%)
180-300 ᴼC 430-480 ᴼC 600-780 ᴼC 430-
480 ᴼC 600-780
ᴼC Total (dehydration
of bonded water)
(dehydroxylation of portlandite)
(decarbonation of calcium
carbonate) M0 3.17 39.7 2.60 32.5 2.22 27.8 10.68 3.74 14.42
M0-SP 0.94 14.7 2.62 41.1 2.82 44.2 10.77 4.74 15.50 G1M3 2.58 28.7 1.35 15.0 5.05 56.2 5.54 8.486 14.03
G1M3-SP 2.61 28.0 1.28 13.7 5.43 58.3 5.27 9.13 14.40 G2M3 3.10 40.2 2.66 34.5 1.95 25.3 10.95 3.28 14.23
G2M3-SP 3.11 40.1 2.71 34.9 1.94 25.0 11.12 3.26 14.38 G3M3 3.60 43.4 2.93 35.3 1.76 21.2 12.03 2.96 14.98
G3M3-SP 2.43 39.8 1.83 30.0 1.84 30.2 7.51 3.09 10.59
(a) G1-cement composites
Figure 4.9: Continued
Univers
ity of
Mala
ya

108
(b) G2-cement composites
(c) G3-cement composites
Figure 4.9: TGA/DTA curves for graphene cement composites added with superplasticizer.
Univers
ity of
Mala
ya

109
4.3.2 FTIR Analysis of Graphene Cement Composite
FTIR spectra of the various graphene-cement composites were obtained and presented
in Figure 4.10. Spectra of G1 type cement composite is given in Figure 4.10 (a). It was
observed that a new peak is located in the G1M3 mix at 2918 cm-1, this peak was not
present in control sample spectra as shown in Figure 2.13 and Figure 4.10. This peak was
due to the graphene (Figure 2.13) and proposed a chemical interaction with the hydrated
cement paste. However, this peak becomes more broad and smooth with increasing
percentage of graphene. Few small peaks were found at 2045 cm-1 (C=O stretch).
Moreover, the peak at 1647 cm-1 become broader indicating the chemical interaction.
Similarly, the intensity of calcite peaks at 1428 cm-1 and 875 cm-1 (C-O stretch) was
increased indicating the more hydrated products. Peaks due to Si-O asymmetric stretch
at 956 cm-1 became steeper and shifted to a high number. Water peaks at 3397 cm-1
became broader. For G1M5 and G1M10 mixes the intensity of O-H stretch due to
Ca(OH)2 becomes more indicating the extra amount of hydrated cement products.
Similarly, sp2 hybridized peaks were noted in G2 mixes as well. Peaks at 1647 cm-1 (C-
O stretch) became broader, suggest the chemical interaction. Calcite peaks at 1416 cm-1
and 873 cm-1 were enhanced in intensities indicating more quantity. These calcite peaks
were slightly shifted as compared to control sample indicating the chemical interaction
and polymerization of hydrated products. In G3 mixes, the intensity of the peak at 3641
cm-1 was increased along with the percentage of graphene (Mollah et al., 2000). It
indicates, more quantity of hydrated cement product was formed due to the addition of
graphene flakes. The H-O-H stretching of G3M3 and G3M5 mix shifted from 3397 cm-1
to 3400 cm-1 (Mollah et al., 2000), indicating that the bond is excited in H-O-H. As for
G3M10 specimen, the peak at 3396 cm-1 had higher intensity and broad as well. Similarly,
the peak of G3 mixes at 2932 cm-1 became broad and smooth. The peak of G3 mixes at
1647 cm-1 showed more intensity as compared to control sample, indicating the high
Univers
ity of
Mala
ya

110
amount of ettringite. The peak of C-O was shifted from 1416 cm-1 to 1419 cm-1, suggests
the formation of chemical interaction. The CSH peak in G3M3 and G3M10 mixes at 956
cm-1 (Si-O asymmetric stretch) have more intensities and shifted from 956 cm-1 to 955
cm-1 (Horgnies et al., 2013). This showed that chemical interaction and high amount of
polymerization of silicates occurred in the samples.
(a) G1
Figure 4.10: Continue
Univers
ity of
Mala
ya

111
(b) G2
(c) G3
Figure 4.10: FTIR spectra for graphene-cement composites.
Univers
ity of
Mala
ya

112
G1 and G2 type based cement mixes showed more peaks at 2918 cm-1 and 2985 cm-1
and broad peaks at 1647 cm-1. It may be inferred that, graphene flakes with high surface
area has more chemical interaction than the graphene having less surface area. The G1
type also showed steeper and high-intensity values for 1416 cm-1 and 873 cm-1 which are
related to calcite peaks. It is also observed that, with high surface area, more hydrated
products were formed. For M10 mixes C=C peaks mainly due to graphene were found
smooth. It may be due to agglomeration of graphene due to a huge amount. However, the
peak 1647 cm-1 was broad and shifted indicating the chemical interaction with graphene
flakes.
Effect of curing age was explored the dependence of the physical and chemical
interaction between hydration time. For this purpose, samples were considered on 7, 28
and 90 days after hydration. FTIR spectra of control specimen and graphene cement
composite are given in Figure 4.11. At 7-day the intensity of H-O-H stretch was low,
however, at 28 days and 90 days is enhanced. The intensity of calcite peak increased with
the passage of time. The peak at 1418 cm-1 and 873 cm-1 were increasing. The slight shift
was also recorded. At 7-day 1420 cm-1 then on 28-day it was 1416 cm-1 and 90-day it was
1418 cm-1. This shift indicates that hydration reaction is going on and hydrated products
are forming. In case of the G1M3 mix for 7-day, a very sharp and high-intensity peak was
present at 3395 cm-1 as shown in Figure 4.11 (b). However, at 28-day its intensity reduced
and it becomes broad. Graphene peaks appear at 2918 cm-1 at 28-day suggesting the
chemical interaction took place. Similarly, the intensity of calcite peak (1428 cm-1 and
873 cm-1) was observed more at 90-day as compared to 28-day. Sulphate peak was
becoming smooth at 90-day. FTIR spectra of the G2M3 mix at 7, 28 and 90-day is shown
in Figure 4.11 (c). As G2 type mix is having high surface area and flake thickness,
therefore, more chemical interaction was noted at 7-day and 28-day spectra. Peak
Univers
ity of
Mala
ya

113
intensities were more at 2918 cm-1 and 2985 cm-1 and become smooth at 90-day. The
intensity of calcite peak increased slightly but very less as compared to G1 type mix.
Intensity and broadness of H-O-H stretch peak at 3397 cm-1 were more at 90-day as
compared to 7 and 28-day. Figure 4.11 (d) shows the spectra of the G3M3 mix at 7, 28
and 90-day of hydration. As the surface area of G3 type graphene is less, therefore, peak
at 2918 cm-1 and 2985 cm-1 are disappeared. However, shift and broadness in a peak at
1649 cm-1 suggest the chemical interaction. This chemical interaction is not strong enough
as the shift move towards the lower wave number.
(a) M0 cement mix
Figure 4.11: Continue
Univers
ity of
Mala
ya

114
(b) G1-cement mix
(b) G2 cement mix
Figure 4.11: Continue
Univers
ity of
Mala
ya

115
(d) G3 cement mix
Figure 4.11: FTIR spectra for graphene-cement composites at 7, 28 and 90 days after casting.
Influence of superplasticizer has also been investigated and presented in Figure 4.12.
It was observed for control mix that SP-enhanced the intensity of the peaks and no
distinguishable difference in the shift was found. It indicates that due to SP more
hydration products formed, however, it didn’t contribute to any chemical interaction. For
G1M3 mixes with and without SP more broadness in the peaks was found (Figure 4.12
(a)). Peaks at 3394 cm-1 and 3642 cm-1 became broader. The peak at 1647 cm-1 also
become broader due to SP. It showed that SP did not contribute to the chemical
interaction, however, due to SP chemical interaction of graphene with hydrated cement
products became stronger. Similarly, for G2M3 mixes in Figure 4.12 (b) the intensity of
O-H stretch peak at 3642 cm-1 was more indicating more quantity of calcium hydroxide.
Peaks at 2153 cm-1 (C=O) becomes very smooth. Si-O peaks below 800 cm-1 increased
in intensity. Possible reason for increase in hydrated cement products is related to
Univers
ity of
Mala
ya

116
workability and presence of more amount of water for hydration of cement particles.
Therefore, it can be concluded that due superplasticizer the growth of hydrated cement
products becomes more. However, no chemical interaction was observed due to SP.
(a) G1-cement mix
(b) G2-cement mix
Figure 4.12: Continue
Univers
ity of
Mala
ya

117
(c) G3-cement mix
Figure 4.12: FTIR spectra for graphene cement composites added with superplasticizer.
4.3.3 XRD Analysis of Graphene Cement Composites
XRD analysis of various graphene cement composite samples have been carried out
and presented in Figure 4.13. The most prominent peak of calcium hydroxide CH was
noted at 18.3o and 34.5o. XRD spectra of G1 type cement composite is given in Figure
4.13 (a). It was observed that peak of CH was increasing with the percentage of graphene.
For G1M3 mix it was observed that alite (C3S) peak is high. It is important to mention
here that, when XRD spectra was obtained only for sample holder then sharp peak at
28.6ᴼ was recorded. Therefore, it may be said that peak in G1M3 sample at 28.6ᴼ is
contributing from the sample holder. To further verify this, sample holder was replaced
and no peak was found at 28.6ᴼ in G1M5 and G1M10 specimens. XRD spectra of G2
type cement mix is given in Figure 4.13 (b). It was observed that peak of hydrated cement
content i.e. CH was increased with graphene content.
Univers
ity of
Mala
ya

118
(a) G1-cement mix
(b) G2-cement mix
Figure 4.13: Continued
Univers
ity of
Mala
ya

119
(c) G3- cement mix
Figure 4.13: XRD spectra for graphene-cement composites.
Unhydrated cement content i.e. alite (C3S) and belite (C2S) peaks were found for the
G2M3 mix as well, however, these peaks reduced with an increase in graphene content.
Ettringite peak was increasing by the addition of graphene in cement mix design.
Moreover, Figure 4.13 (c) shows the XRD spectra of G3 type cement composite and
increase in CH and ettringite peak was observed. Therefore, based on the XRD analysis,
it may be inferred that more hydration was occurred by incorporation of graphene in
cement mix design. In addition, Figure 4.13 was used to investigate the influence of
graphene type on XRD spectra. For this purpose, a comparison among the M3, M5 and
M10 mixes was done. M3 mixes includes the G1M3, G2M3 and G3M3 samples with
similar conditions. It was determined that XRD spectra were similar, and no specific trend
was recorded.
Univers
ity of
Mala
ya

120
Furthermore, influence of curing age was investigated on XRD patterns. Figure 4.14
showed the XRD spectra of cement composite at 7, 28 and 90 days after sample casting.
In spectra of M0 mix (Figure 4.14 (a)), it was recorded that at 7 day unhydrated cement
content is more however, its intensities were reduced with curing time. It is noteworthy
that, for G1M3 specimens same sample holder was used which enhanced the peak height
at 28.6ᴼ. For G2 type cement composites, it was observed that unhydrated cement peaks
reduced with the hydration time. Similarly, for G3 type cement mixes more alite and
belite peaks were observed at 7-day after specimen preparations. However, with an
increase in curing age the height of these peaks reduced.
(a) M0 mix
Figure 4.14: Continued
Univers
ity of
Mala
ya

121
(b) G1M3 mix
(c) G2M3 mix
Figure 4.14: Continued
Univers
ity of
Mala
ya

122
(d) G3M3 mix
Figure 4.14: XRD spectra for cement composites at 7, 28 and 90 days after casting.
Effect of superplasticizer (SP) on the crystalline structure was also investigated and
presented in Figure 4.15. It was noted that ettringite peak was enhanced for control mix
after addition of SP, whereas, peaks of CH remained same. As all G1M3 specimens for
XRD analysis were prepared and tested in similar conditions, therefore, due to sample
holder issue unhydrated cement content was found significant. Furthermore, due to the
incorporation of SP in the mix CH peak was found high. For G2 type cement specimens
alite and blite peaks were reduced however, the peak of CH was increased. Similar trend
was noted for G3 type cement specimens.
Univers
ity of
Mala
ya

123
(a) G1M3 mix
(b) G2M3 mix
Figure 4.15: Continued
Univers
ity of
Mala
ya

124
(c) G3M3 mix
Figure 4.15: XRD spectra for graphene-cement composite added with superplasticizer.
4.3.4 Morphology of Graphene Cement Composites
The morphology of the graphene-cement composite at 7th day and 28th day was
investigated and presented in Figure 4.16. It can be seen in Figure 4.16 (a) and (e), that
the hydrated cement products grow over the graphene flakes. Due to the ordered growth,
hydrated crystals were compact and graphene fills up the pores which have great
contribution in improving mechanical strength. Needle form of calcium silicate hydrate
(CSH), hexagonal plates of portlandite and graphene flakes can be observed on 7-day
FESEM image of G1M3 in Figure 4.16 (a). ESB or backscattered image was used to
distinguish the carbon materials. It can be seen in Figure 4.16 (b) that graphene
nanoparticle become completely black. EDX image was also employed to confirm the
presence of graphene and hydrated cement products. Figure 4.16 (c) represents the EDX
for the graphene sheets as indicated in Figure 4.16 (a). It can be seen clearly that carbon
Univers
ity of
Mala
ya

125
content was maximum in it, confirming the presence of graphene. EDX for the needle
shape CSH was shown in Figure 4.16 (d) and location of the EDX point is marked in
Figure 4.16 (b). Oxygen content was maximum in it followed by the silicon and carbon.
Needle form of CSH transformed into honeycomb structure of CSH at 28 days as shown
in Figure 4.16 (e). Backscattered image or ESB of Figure 4.16 (e) displayed that hydrated
products grow over the graphene as shown in Figure 4.16 (f). EDX was also employed in
Figure 4.16 (g) and Figure 4.16 (h) to confirm the presence of graphene and honeycombed
CSH structure.
(a) FESEM image of G1M3 at 7 days
(b) ESB or backscattered image of (a)
(c) EDX of graphene in G1M3 specimen on a
point indicated in (a)
(d) EDX for the hydrated cement product at
crosshair location in (b)
Figure 4.16: Continued
Univers
ity of
Mala
ya

126
(e) FESEM image of G1M3 at 28 days
(f) ESB or backscattered image of (e)
(g) EDX for the marked point in (e)
(h) EDX at cross-hair location in (f)
Figure 4.16: FESEM images of graphene-cement paste at 7 days and 28 days.
Figure 4.17 shows the FESEM images for the G2M10 and G3M10 mixes. Similar to
the G1M3 mix, it was noted that hydrated cement products formed on the graphene flakes.
To identify the graphene and presence of pores ESB or backscattered image of Figure
4.17 (a) were used as given in Figure 4.17 (b). Figure 4.17 (c) and Figure 4.17 (d) provides
the FESEM image and backscattered image of G3M10. CSH gel forms on each side of
graphene flake. It was determined that hydrated cement products and graphene flakes
successfully filled up the pores. Hence, based on above information, it can be determined
that due to the addition of graphene, hydrated products grows in uniform and ordered way
(Cao et al. (2016)), which significantly improves the compressive strength and
mechanical properties.
Univers
ity of
Mala
ya

127
(a) FESEM image of G2M10
(b) ESB or backscattered image of (a)
(c) FESEM image of G3M10
(d) ESB or backscattered image of (c)
Figure 4.17: FESEM images of graphene-cement paste.
4.4 Rheology of Graphene Cement Paste
As the cement based construction materials normally casted in plastic form and various
properties e.g. workability, consistency and homogeneity depend on the viscosity of
cement paste therefore, it is very important to consider the influence of graphene, its size,
surface area and lateral dimension on the viscosity of cement paste. Hence, in this section
rheological properties of the graphene-cement composite were explored. For this purpose,
flow properties of the graphene-cement composite were calculated from flow curve which
obtained from the shear stress and shear rate data. After this, using mathematical models,
plastic viscosity, yield stress, and specific trend of the flow were determined. It is
Univers
ity of
Mala
ya

128
important to mention here that flow properties of graphene type G1 estimated by four
rheological models has already been published.
4.4.1 Influence of Graphene on Yield Stress
Yield stress is an important parameter for determining the flow characteristics of any
substance. According to Barnes & Walters (1985), yield stress concept is an idealization.
In Bingham model, it is defined as the value of shear stress at zero shear rate. However,
BS EN 5168-05 (2005) defines it, stress below which substance will be elastic solid and
above the liquid. As it is a very important parameter therefore, yield stress values for
graphene-cement composite paste were determined by using Bingham model, Modified
Bingham model, Herschel–Bulkley (HB) model and Casson model. Table 4.4 showed the
effects of addition of graphene to the yield stress. It was observed that with the addition
of graphene, yield stress was increased. It was due to the high surface area and an average
thickness of graphene flakes, which increased the overall water demand of the system. It
was noted that yield stress values also enhanced with an increase in graphene content in
the mix design. Maximum yield stress values were recorded for type G3. It was observed
earlier in dispersion section that G3 type graphene flakes formed the agglomerates. These
agglomerates entrapped some water molecules inside and as a result overall free available
water content was reduced (Shan et al., 2015). Maximum yield stress values were found
for G3M10 mix design. For G3M10 Herschel-Bulkley model, Bingham model, modified
Bingham model and Casson model determined the 183%, 70%, 61% and 15% increase
in yield stress value respectively as compared to M0 mix. Table 4.5 highlights the
percentage change rate in yield stress values in contrast to control sample. Furthermore,
variation of yield stress with mathematical model with respect to Bingham model is
calculated as well and presented in Table 4.5. Casson model determined the lowest yield
stress values as compared to other rheological models and modified Bingham model
Univers
ity of
Mala
ya

129
determined the highest yield stress values followed by Bingham and Herschel-Bulkley
(HB) model. Therefore, it is concluded that yield stress values were increased due to the
high surface area and average flake thickness of graphene.
Table 4.4: Effect of graphene type on the yield stress values (Pa).
Sample Bingham
Model (BM)
Modified Bingham
Model
Herschel-Bulkley (HB)
Model
Casson Model
M0 1.53 1.76 1.22 0.52 G1M3 1.67 1.79 1.3 0.62 G1M5 1.84 1.89 1.48 0.79
G1M10 1.9 1.93 1.53 0.8 G2M3 1.46 1.56 1.44 0.7 G2M5 1.56 1.81 1.44 0.7
G2M10 1.59 2.61 1.78 0.86 G3M3 1.98 2.39 2.26 0.53 G3M5 2.3 2.6 2.88 0.54
G3M10 2.6 2.83 3.45 0.6
Table 4.5: Variation of yield stress values in terms of percentages.
Sample
Variation with mathematical models Variation with graphene content
Bingham Model (BM)
Modified Bingham
Model
HB
Model
Casson Model
Bingham Model (BM)
Modified Bingham
Model
HB Model
Casson Model
M0 100 115 80 34 100 100 100 100 G1M3 100 107 78 37 109 102 107 119 G1M5 100 103 80 43 120 107 121 152 G1M10 100 102 81 42 124 110 125 154 G2M3 100 107 99 48 95 89 118 135 G2M5 100 116 92 45 102 103 118 135 G2M10 100 164 112 54 104 148 146 165 G3M3 100 121 114 27 129 136 185 102 G3M5 100 113 125 23 150 148 236 104 G3M10 100 109 133 23 170 161 283 115
Univers
ity of
Mala
ya

130
4.4.2 Influence of Graphene on Plastic Viscosity
Plastic viscosity is one of the important parameters which determines the resistance
of the paste against the flow. It is described as the deformation of the cement due to
external loading (Wang et al., 2016). In Bingham model, it is defined as the slope of the
flow curve obtained from shear stress and shear rate data. Figure 4.18 presented the effect
of the addition of graphene to the plastic viscosity. It was noted that plastic viscosity
values significantly increased with the addition of graphene. This increment in plastic
viscosity values is in correlation with the previous study conducted by Shan et al. (2015).
Shan et al. (2015) determined the plastic viscosity values for graphene oxide. Table 4.6
describes the variation of plastic viscosity values with respect to graphene content and
mathematical models. Approximately 50-107% increase in the plastic viscosity values
were observed. These values were found in direct correlation with the percentage of
graphene content in cement paste. Table 4.6 explains that Bingham model determined the
maximum plastic viscosity values followed modified Bingham and Casson model. The
plastic viscosity values for G3 were almost double of the M0. The maximum increase in
plastic viscosity values of G3M10 mix was 84 %, 83 % and 107% as estimated by
Bingham model, modified Bingham models and Casson model respectively. As the G3
type graphene flakes formed agglomerates structures which increase the resistance
against the flow of cement paste.
Univers
ity of
Mala
ya

131
(a) G1-cement mix
(b) G2-cement mix
(c) G3-cement mix
Figure 4.18: Effect of addition of graphene to the plastic viscosity of graphene-cement composite.
0.00
0.20
0.40
0.60
0.80
1.00
1.20
M0 G1M3 G1M5 G1M10
Plas
tic v
isco
sity
(Pa.
s)
Bingham Modified BM Casson
0.00
0.20
0.40
0.60
0.80
1.00
M0 G2M3 G2M5 G2M10
Plas
tic v
isco
sity
(Pa.
s)
Bingham Modified BM Casson
0.00
0.20
0.40
0.60
0.80
1.00
1.20
M0 G3M3 G3M5 G3M10
Plas
tic v
isco
sity
(Pa.
s)
Bingham Modified BM Casson
Univers
ity of
Mala
ya

132
Table 4.6: Variation of plastic viscosity values in terms of percentages.
Sample
Variation with mathematical models
Variation with graphene content
Bingham Model (BM)
Modified Bingham
Model
Casson Model
Bingham Model (BM)
Modified Bingham
Model
Casson Model
M0 100 94 84 100 100 100 G1M3 100 120 89 160 204 169 G1M5 100 100 93 168 179 186 G1M10 100 99 93 170 179 188 G2M3 100 103 85 144 157 145 G2M5 100 104 89 144 160 152 G2M10 100 90 85 176 168 179 G3M3 100 56 92 170 102 186 G3M5 100 73 98 176 136 205 G3M10 100 93 95 184 183 207
Herschel-Bulkley (HB) model determined the viscosity trend using two parameters i.e.
consistency (K) and power rate index (n). Table 4.7 showed the values estimated by HB
model for consistency and rate index. Power rate index (n) is an important parameter and
provide the information about shear deformation of the flow. If ‘n’ value is more than 1
then the flow has the shear thickening behaviour and for less than 1 it is shear thinning
behaviour (Wang et al., 2016). However, the consistency (K) depends on ‘n’ and has no
physical meaning and difficult to compare due to its dimension (Pa.sn) (Vikan et al.,
2007). Graphene cement paste behaves as shear thinning flow except for G3M10 mix
(Table 4.7). It was deduced that graphene flake thickness had an important role on
rheological properties and can alter the flow behaviour of cement paste. It was noted that
power rate index was increasing with the addition and increase in the content of graphene.
Similar behaviour was observed for the derivatives of graphene i.e. graphene-oxide based
cement materials (Wang et al., 2016). Wang et al. (2016) used graphene-oxide based
cement paste and found shear thinning behaviour at the high shear rate.
Univers
ity of
Mala
ya

133
Table 4.7: Effect of graphene to rate index and consistency.
Sample Consistency, K Power Rate index, n M0 (Control) 0.60 0.96
G1M3 0.97 0.97 G1M5 0.99 0.98 G1M10 0.97 0.98 G2M3 1.74 0.81 G2M5 0.96 0.85 G2M10 0.97 0.98 G3M3 0.87 0.97 G3M5 0.94 0.98 G3M10 0.67 1.19
4.4.3 Standard Error Values
Efficiency and effectiveness of these mathematical models were estimated by using
standard error values. Standard error values were calculated using Equation (2.7). Table
4.8 showed the standard error values for Bingham, modified Bingham, Herschel-Bulkley
(HB) and Casson models. Best-fitting of flow data using these mathematical models to
flow curves is given by the small value of standard error. Standard deviation and average
values for each mathematical model is also calculated and presented in Table 4.8.
Bingham model determined the lower standard error values as compared to other
mathematical models. The standard deviation of Bingham model is less which indicates
that all data points are closed to mean value, however, for Casson model the data points
are staggered. Modified Bingham and Herschel-Bulkley models are both nonlinear
models. Therefore, their standard deviation values are matching as well hence, both
models determined similar standard error values. These models are good for shear
thickening behaviour. Casson model determined the large values of standard error.
According to (Papo, 1988) Casson model has a constraint to predict the flow parameter
more accurately for concentrated suspension. Table 4.9 explained the variation of
standard error values with respect to control sample and mathematical models. G1M10
mix shows very large values as compared to the other mixes. G2 and G3 type mix
Univers
ity of
Mala
ya

134
determined comparatively higher values as compared to G1 type (Table 4.9). It was due
to the higher dosage of graphene content, more thickness of graphene flakes which caused
the increase in agglomerates and flocculated structure.
Table 4.8: Standard error of various model.
Sample Bingham Model
Modified Bingham
Model
HB Model
Casson Model
M0 74.4 74.5 74.4 73.6 G1M3 34.3 89.0 70.5 82.9 G1M5 30.7 30.6 45.1 57.3
G1M10 223.6 233.3 261.6 283.1 G2M3 79.2 87.2 79.6 77.2 G2M5 160.8 153.0 158.6 161.9
G2M10 97.9 104.4 99.7 92.1 G3M3 74.4 91.2 99.4 96.1 G3M5 71.5 99.8 98.3 85.4
G3M10 65.9 199.3 85.0 185.3 Average 91.3 116.2 107.2 119.5 Standard deviation 58.7 61.1 61.7 70.3
Table 4.9: Variation of standard error values of various models in terms of percentages.
Sample
Variation with mathematical models Variation with graphene content
Bingham Model (BM)
Modified Bingham
Model
HB
Model
Casson Model
Bingham Model (BM)
Modified Bingham
Model
HB Model
Casson Model
M0 100 100.1 100.0 98.9 100.0 100.0 100.0 100.0 G1M3 100 259.5 205.5 241.7 46.1 119.4 94.8 112.6 G1M5 100 99.7 146.9 186.6 41.2 41.0 60.6 77.8 G1M10 100 104.3 117.0 126.6 300.5 313.0 351.6 384.5 G2M3 100 110.1 100.5 97.5 106.5 117.0 107.0 104.8 G2M5 100 95.1 98.6 100.7 216.2 205.3 213.2 219.9 G2M10 100 106.6 101.8 94.1 131.5 140.1 134.0 125.1 G3M3 100 122.6 133.6 129.2 100.0 122.3 133.7 130.5 G3M5 100 139.6 137.5 119.4 96.1 133.9 132.2 115.9 G3M10 100 302.4 129.0 281.2 88.5 267.4 114.3 251.7
Univers
ity of
Mala
ya

135
4.5 Dependence of Rheological Characteristics
Variation in rheological characteristics of both cement paste and graphene-cement
paste was observed, which originates due to mixing composition of the paste, shear rate
cycles, resting time and rheological models. The effect of mix composition mainly
includes water to cement ratio, admixture, mixing and testing technique (Shaughnessy &
Clark, 1988). As these parameters are already studied in detail (Nehdi & Rahman, 2004;
Shaughnessy & Clark, 1988), therefore, all these factors were kept the constant and only
effect of graphene/cement ratio, shear rate range, superplasticizer and resting time were
investigated. As rheological methods determined the flow properties from statistical
trials, therefore, several values can be obtained. However, in this study, best curve fitting
and minimizing the standard error was considered in determining the rheological flow
values. These results were further evaluated using concentric cylinder geometry as well.
It is important to mention here that to determine the influence of different variables on
rheological parameters only G1 type was considered. G1 type was selected based on the
standard error values of Table 4.8. Moreover, G1 obtained the stable and uniform
dispersion in aqueous solution. For shear rate range, superplasticizer and resting time only
G1M3 mix was considered. This mix was selected due to more surface area and less
content of graphene to obtain a true and realistic information of these variables on the
rheology of graphene-cement paste.
4.5.1 Variables Effecting Yield Stress
Yield stress values were determined by Casson equation, Bingham method, Herschel-
Bulkley (HB) model and Modified Bingham model. It was observed that yield stress
values increase by the addition of graphene, shear rate range and resting time, however,
decreased with the addition of superplasticizer. Generally, in concentric cylinders,
Bingham model determined the highest yield stress values and HB model determined the
Univers
ity of
Mala
ya

136
lowest values. However, for the parallel plates, Modified Bingham model determined the
highest yield stress values, followed by Bingham, HB and Casson model. It is important
to mention here that; smooth parallel plates and concentric cylinders were used in this
research study. Therefore, due to slippage effect and surface friction (Nehdi & Rahman,
2004), low yield stress values were found. Effect of graphene, shear rate range, resting
time, superplasticizer and test geometry on yield stress were discussed as follows:
4.5.1.1 Effect of Graphene Percentage on Yield Stress
It was observed in Table 4.10 that the yield stress values were increased by the
incorporation of graphene to the cement matrix. By increasing percentage of graphene in
the design mixture, the yield stress values were also increased for all the rheological
models. This increase in yield stress values is in line with the available literature for the
derivatives of graphene. Shan et al. (2015) performed the experimental work to study the
effect of graphene oxide on rheological properties of cement paste. Yield stress values
were found approximately four times of plain cement for 0.08 % of graphene oxide
cement paste. Increase in yield stress values of graphene-cement paste might be due to
the higher surface area of graphene. As explained earlier that graphene (G1) has about 80
times higher surface area compared to cement, therefore, it requires more amount of water
to lubricate graphene flakes (Chuah et al., 2014). Besides that, it was noticed that
negatively charged graphene flakes in water interact with each other by electrostatic
interaction and formed flocculation structures. When this aqueous solution of graphene
was mixed with cement then, the attractive forces become more prominent. These large
agglomerates entrapped the water molecules, which will eventually reduce the content of
free available water (Shan et al., 2015). Furthermore, Wang et al. (2016) also detected the
flocculation structures with a higher dosage of graphene oxide in cement paste. Therefore,
it can be concluded that by keeping the constant water to cement ratio in the mixture will
Univers
ity of
Mala
ya

137
increases the yield stress of the specimens. In addition, by increasing the amount of
graphene in cement paste causes more flocculation, as a result, the yield stress values
were significantly improved.
Table 4.10: Effect of graphene percentage on yield stress values.
Sample Bingham
Modified BM
HB Casson Bingham Modified
BM HB Casson
Parallel Plate Concentric cylinders M0 1.53 1.76 1.22 0.52 0.91 1.21 0.13 0.58
G1M3 1.67 1.79 1.30 0.62 2.42 0.98 0.42 1.48 G1M5 1.84 1.89 1.48 0.79 2.23 0.99 0.34 1.34 G1M10 1.90 1.93 1.53 0.80 2.43 1.00 0.40 1.51
4.5.1.2 Effect of Shear Rate Range on Yield Stress
The variation in shear rate is based on the delivering method of the concrete to the
formwork i.e. by pumping or bucket. The shear rate of the cement paste in ordinary
concrete during mixing and placing is generally found about 70 s-1 (Ferraris, 1999).
However, for high-performance concrete, cement paste bears more shear rate due to
pumping, and researchers used higher shear rate range (Saak et al., 1999; Yahia &
Khayat, 2003). Furthermore, Roussel (2006) reported that while concreting, cement paste
bears the shear rate three to five times higher than that of the concrete. The concept of
yield stress is a very important parameter, however, its value is directly related to the
range of shear rate cycle (Barnes & Walters, 1985). Table 4.11 presents the yield stress
values for three different shear rate range. The range of shear rate cycle from 100-0.6 s-1,
200-0.6 s-1 and 300-0.6 s-1 has a significant effect on the yield stress values, and the
increment was observed for both test geometries. Effect of shear rate range using parallel
plate geometry has been published. Modified Bingham model determined the highest
yield stress values and Casson model determine the lowest value. As the modified
Bingham model has the characteristics of both Bingham and Herschel-Bulkley model
thus, it fits more accurately to the flow data and its standard error value was also found
Univers
ity of
Mala
ya

138
the least amongst others. The yield stress values for the Casson equation was found lowest
amongst other models, however, it precisely fits the flow data curve. Barnes & Walters
(1985) performed the experimental investigation using Bingham model by considering
three different shear rate ranges and determined the increase in yield stress values with
high shear rate range cycle. In short, the effect of shear rate range on the yield stress is
very beneficial for normal and high-performance concretes. Furthermore, this study also
opens a new approach for the use of graphene-cement composite as a self-consolidating
concrete.
Table 4.11: Effect of shear rate range on yield stress values.
Sample Bingham Modified
BM HB Casson Bingham Modified BM HB Casson
Parallel Plate Concentric cylinders M0a 1.46 1.46 1.17 0.45 0.30 0.30 0.04 0.39 M0b 1.53 1.76 1.22 0.52 0.91 1.21 0.13 0.58 M0c 1.60 1.83 1.27 0.55 3.76 0.98 0.42 1.67
G1M3a 1.51 1.61 1.21 0.50 0.76 0.99 0.06 0.98 G1M3b 1.67 1.79 1.30 0.62 2.42 0.98 0.42 1.48 G1M3c 1.74 1.86 1.34 0.64 8.31 0.99 1.60 3.069
4.5.1.3 Effect of Resting Time on Yield Stress
Generally, it was observed that with the passage of time, molecular structure may
change in the cement paste due to chemical interaction, therefore, it is very important to
consider the effect of resting time on the yield stress. Resting time is the time interval
between sample preparation to casting. The results showed that the yield stress was
increased with various resting time (Table 4.12). This increment in the yield stress may
be attributed due to three factors; (a) thixotropic properties of cement (Wang et al., 2016);
(b) hydration reaction of cement paste; and (c) presence of suspended particles
(graphene). As cement paste has thixotropic properties (Wang et al., 2016) and structures
Univers
ity of
Mala
ya

139
change in the cement paste, therefore, high shear stress was observed at the same shear
rate. It was also noted that for 60 min resting time more yield stress was recorded for mix
G1M3 sample as compared to control mix (M0). This shows that graphene has a
significant effect on yield stress. Thus, it can be summarized that with an increase in
resting time of the mixtures the yield stress values also increased.
Table 4.12: Effect of resting time on yield stress values.
Sample Bingham Modified
BM HB Casson Bingham Modified BM HB Casson
Parallel Plate Concentric cylinders M0-0 1.53 1.76 1.22 0.52 0.91 1.21 0.13 0.58
M0-30 1.65 1.85 1.38 1.75 1.39 1.39 0.19 0.93 M0-60 2.54 2.88 3.64 1.93 1.79 1.47 0.35 0.98
G1M3-0 1.67 1.79 1.30 0.62 2.42 0.98 0.42 1.48 G1M3-30 1.72 1.92 1.42 1.81 2.99 1.00 0.46 1.90 G1M3-60 3.78 2.19 1.65 4.91 3.07 1.00 0.52 1.88
4.5.1.4 Effect of Superplasticizer on Yield Stress
Several studies (Nehdi & Rahman, 2004; Wang et al., 2017; Wang et al., 2016)
reported the effect of water reducing agent on the yield stress of the cement paste and
considered a parameter to determine their interface with rheological models and test
geometries. Wang et al. (2017) used the fly ash in graphene oxide cement paste and
determined that yield stress values decrease. In this study, it was observed in Table 4.13
that with the addition of superplasticizer in the mixes, the yield stress was reduced for
both mixes M0 and G1M3 in parallel plates and concentric cylinders. This reduction was
might be due to the hydrophobic groups of poly-carboxylate superplasticizer, which,
absorbed on the surface of cement particles and extend in an outwards direction. Due to
the electrostatic repulsion flocculated structure destroyed as a result free water released
which increases the fluidity and reduce the yield stress (Wang et al., 2016).
Univers
ity of
Mala
ya

140
Table 4.13: Effect of superplasticizer on yield stress values.
Sample Modified
BM Bingham HB Casson
Modified BM
Bingham HB Casson
Parallel Plate Concentric cylinders M0 1.76 1.53 1.22 0.52 1.21 0.91 0.13 0.58
M0S 1.33 1.24 1.17 0.36 0.47 0.73 0.65 0.42 G1M3 1.79 1.67 1.30 0.62 0.98 2.42 0.42 1.48
G1M3S 0.89 0.58 0.67 0.51 0.99 0.62 0.04 0.82
4.5.1.5 Effect of Test Geometry on Yield Stress
It was noted that yield stress values were more in parallel plates as compared to the
concentric cylinder. In parallel plates geometry, the surface area is more as compared to
the concentric cylinder and particles sedimentation would be a key factor to increase the
yield stress values (Nehdi & Rahman, 2004). Moreover, gap thickness is an important
parameter which influences the yield stress values. Gap thickness in parallel plate is 0.6
mm whereas, 1.2 mm in concentric cylinder. Ferraris (1999) computed the gap in concrete
by using the mathematical model developed by Garboczi & Bentz (1997) and found the
average value of gap is between 0.16 to 0.22 mm. However, Concentric cylinders,
normally estimate the rheological properties at large gap i.e. 6-7 times of estimated gap,
therefore, it leads to measurement of the bulk values of cement paste and are not the
correct values in accordance to concrete rheology (Ferraris, 1999). Hung et al. (2015)
performed experimental work on asphalt rubber binder and measured its rheology with
both concentric cylinder and parallel plates. They found no significant difference between
two geometries. It was noticed that the authors used very large gap i.e. 2 mm in parallel
plates, due to which, the difference with concentric cylinders vanishes. Therefore, it can
be concluded that parallel plates are suitable for cement paste as it measures the
rheological properties with the realistic approach (Ferraris, 1999).
Univers
ity of
Mala
ya

141
4.5.2 Variables Effecting Viscosity
Plastic viscosity represents the deformation of cement pastes due to external loading
(Wang et al., 2016). Plastic viscosities for the cement paste and graphene-cement
composite were calculated by using concentric cylinders and parallel plates. The
viscosities were computed from the flow curves proposed in Casson, Bingham and
Modified Bingham Models. Generally, in parallel plates for control mix (M0), Bingham
model predicted higher values of the plastic viscosities, followed by the Casson and
Modified Bingham. Whereas, for sample G1M3, the Modified Bingham model estimated
the highest plastic viscosities values which were about 26% and 17% higher than the
Casson and Bingham models, respectively. Furthermore, in concentric cylinders, the
modified Bingham method showed the highest plastic viscosities values for both M0 and
G1M3 mixes, and Casson method estimated the lowest.
4.5.2.1 Impact of Graphene Percentage on Viscosity
Incorporation of graphene in cement paste increases the plastic viscosities as shown in
Table 4.14. Furthermore, the direct relationship between graphene and plastic viscosity
was observed, as the amount of graphene increases the plastic viscosity was also
increased. These results are in line with the study performed by Shan et al. (2015) on
graphene oxide. They conducted the experimental work with a varying percentage of
graphene oxide and found that the plastic viscosity values increased by 78 % with the
addition of 0.04 % of graphene oxide in the plain cement mix. Increase in plastic viscosity
values might be due to the large surface area of the graphene flakes. Since it requires
more amount of water for lubricating the surface of graphene flakes which results in a
dry mix of the graphene cement paste. Another reason may be that the incorporation of
graphene in cement paste reduces the free available water which increases the frictional
resistance between graphene and cement matrix which resulted in higher viscosities.
Univers
ity of
Mala
ya

142
Therefore, it can be summarized that due to the large surface area of graphene sheets and
reduction in free available water, overall plastic viscosity values increased. In addition,
with the increase of graphene content, the deformation of the cement pastes become
difficult due to external forces.
Table 4.14: Effect of graphene on plastic viscosity values.
Sample Bingham Modified
BM Casson Bingham Modified
BM Casson
Parallel plate Concentric cylinder M0 (Control) 0.50 0.47 0.42 0.24 0.25 0.18
G1M3 0.80 0.96 0.71 0.65 0.66 0.51 G1M5 0.84 0.84 0.78 0.64 0.65 0.51 G1M10 0.85 0.84 0.79 0.64 0.65 0.49
4.5.2.2 Impact of Shear Rate Range on Viscosity
Test results of shear rate range on plastic viscosity for various rheological models
were determined and presented in Table 4.15. When samples were subjected to high shear
rate cycle range, the apparent plastic viscosity was reduced and vice versa. Shan et al.
(2015), reported that the apparent viscosities are dependent on the shear rate, at a low
shear rate, apparent viscosities will be more and at a high shear rate, viscosities will be
low. Shan et al. (2015) used the graphene oxide, silica fume and graphene oxide-silica
fume in cement paste and found that for all mixes apparent viscosity decreases with the
increase of shear rates. Furthermore, the addition of graphene produces the flocculated
suspensions in the cement matrix, thus, with the increase in shear rate cycle range, those
suspended particles were destroyed and resulted in lower apparent viscosity. Hence, due
to high shear rate range deformation of cement pastes become easier under external
forces.
Univers
ity of
Mala
ya

143
Table 4.15: Effect of shear rate range on plastic viscosity.
Sample Bingham Modified BM Casson Bingham Modified
BM Casson
Parallel plate Concentric cylinder M0a 0.46 0.30 0.39 0.29 0.29 0.22 M0b 0.50 0.47 0.42 0.24 0.25 0.18 M0c 0.42 0.39 0.43 0.17 0.17 0.12
G1M3a 0.71 0.93 0.62 0.80 0.80 0.62 G1M3b 0.80 0.96 0.71 0.65 0.68 0.51 G1M3c 0.92 0.99 0.89 0.51 0.54 0.38
4.5.2.3 Impact of Resting Time on Viscosity
The resting time has a direct relationship to the plastic viscosity as well. Table 4.16
shows the values of plastic viscosity for both control mix and graphene cement mix. It
was noted that plastic viscosity was increasing irrespective of the test geometry and
mathematical model. It mainly involves two factors, the hydration of cement particles
and the frictional resistance between cement and graphene flakes. Influence of hydration
of cement particles and fractional resistance was dominant for the resting time of 60 min,
in which plastic viscosity was very high. Cao et al. (2016) reported that the 30 min of
resting time can be considered as a dormant period for the hydration of cement paste.
Therefore, the major contribution for 30 min resting was given by the frictional resistance
between the cement paste and graphene sheets. Hence, it can be summarized that due to
increase in resting time, flow behaviour becomes difficult for the cement paste.
Table 4.16: Effect of resting time on plastic viscosity.
Sample Bingham Modified
BM Casson Bingham Modified
BM Casson
Parallel plate Concentric cylinder M0-0 0.50 0.47 0.42 0.24 0.25 0.18
M0-30 0.90 0.48 0.86 0.31 0.31 0.23 M0-60 1.47 0.87 1.19 0.12 0.12 0.11
G1M3-0 0.80 0.96 0.71 0.65 0.66 0.51 G1M3-30 0.91 0.96 0.89 0.75 0.77 0.58 G1M3-60 1.46 0.99 1.20 0.83 0.84 0.65
Univers
ity of
Mala
ya

144
4.5.2.4 Impact of Superplasticizer on Viscosity
Table 4.17 shows the influence of superplasticizer on the plastic viscosities of the
cement pastes. It was observed that with the addition of superplasticizer fluidity enhances.
As superplasticizers and water reducing agents reduce the internal friction between the
particles which dramatically alter the rheological characteristics of the cement paste
(Ferraris, 1999). Therefore, the fluidity and workability of cement paste were greatly
improved by incorporation of superplasticizer in the cement matrix.
Table 4.17: Effect of superplasticizer on plastic viscosity.
Sample Bingham Modified
BM Casson Bingham Modified
BM Casson
Parallel plate Concentric cylinder M0 (Control) 0.50 0.47 0.42 0.24 0.25 0.18
M0S 0.31 0.21 0.28 0.22 0.20 0.17 G1M3 0.80 0.96 0.71 0.65 0.66 0.51
G1M3S 0.46 0.47 0.40 0.42 0.41 0.30
4.5.2.5 Impact of Test Geometry on Viscosity
Generally, parallel plates determined the higher values for the plastic viscosities as
compared to the concentric cylinders. A possible reason may be the settlement of
suspended particles. As parallel plates have the large surface area as compared to the
concentric cylinders. Thus, suspended cement particles and graphene starts to settle down
and provide great hindrance against the deformation of cement paste. Therefore, it can be
concluded that the sedimentation or creaming will be a key factor in indicating the higher
plastic viscosities for parallel plates (Barnes, 2000; Nehdi & Rahman, 2004).
Univers
ity of
Mala
ya
145
4.5.3 Variables Effecting Consistency and Power Rate Index
The trend of the viscosity data was determined by considering Herschel-Bulkley (HB)
model, which considers two factors such as consistency (K) and the power index (n). By
considering these factors the relationship between viscosity trend and the shear rate can
be determined (Nehdi & Rahman, 2004). It also provides the information about the shear
deformation, i.e. shear thickening or shear thinning based on power index values ‘n’
(Wang et al., 2016). If n > 1 then fluid will be shear thickening and if n < 1 then shear
thinning material. Generally, both consistency and rate index values were increased by
the addition of graphene to the cement mix. The behaviour of the cement paste was found
in shear thinning. Concentric cylinders showed higher values for the consistency (K) and
lower values for the power rate index (n) as compared to the parallel plates.
4.5.3.1 Effect of Graphene Percentage on Consistency and Power Rate Index
Consistency values were increased with the addition of graphene in the mix as shown
in Table 4.18. It was noted that with an increase in the percentage of graphene in the
cement paste, consistency and power index values increased for both parallel plates and
concentric cylinders. However, these values were less than 1 predicting the shear thinning
behaviour of the graphene cement paste. Wang et al. (2016) studied the shear
deformation for graphene oxide in cement paste and found that cement paste curve can
be divided into shear thinning and shear thickening stage based on the inflexion point.
They suggested that cement paste with higher graphene oxide content shows the shear
thinning effect at high shear rates. Govin et al. (2016) studied the effect of guar gum
derivatives on the fresh state cement mortar. They found that power index ‘n’ values were
less than 1, and paste was behaving as shear thinning material. Therefore, it can be said
that incorporation of graphene results in more suspended structures in the paste, which
makes it comparatively thicker to flow and enhance the resistance to flow.
Univers
ity of
Mala
ya

146
Table 4.18: Effect of graphene on consistency and rate index values calculated by HB model.
Sample Consistency,
K Power rate
index, n Consistency,
K Power rate
index, n Parallel Plate Concentric cylinders
M0 (Control) 0.60 0.96 0.59 0.82 G1M3 0.97 0.97 1.49 0.81 G1M5 0.99 0.98 1.45 0.84 G1M10 0.97 0.98 1.53 0.83
4.5.3.2 Effect of Shear Rate Range on Consistency and Power Rate Index
The increment in shear rate cycle range has no significant effect on the trend of
viscosity data. Table 4.19 showed the values for consistency and power rate index for
M0 and G1M3 mix and their dependence on the shear rate cycle range. Although, in
parallel plates, the consistency values were initially increased and later they were
decreased for both M0 and G1M3 mixes. Whereas, the consistency values were
steadily decreased for the concentric cylinders. Consistency (K) has no physical
meaning and difficult to compare because of its dimension (Pa.sn) which is dependent
on ‘n’ (Vikan et al., 2007). However, the rate index (n) values were initially increased
and then decreased for both parallel plates and concentric cylinders. Therefore, it can
be concluded that with the higher shear rate cycle range, the cement paste will observe
more shear thinning behaviour. The flocculated structures will break down with the
higher shear rate thus, cement paste becomes thinner.
Univers
ity of
Mala
ya

147
Table 4.19: Effect of shear rate range on consistency and rate index values.
Sample Consistency,
K Power rate
index, n Consistency,
K Power rate
index, n Parallel Plate Concentric cylinders
M0a 0.29 0.60 0.89 0.74 M0b 0.60 0.96 0.58 0.82 M0c 0.51 0.90 0.76 0.74
G1M3a 0.96 0.99 2.39 0.75 G1M3b 0.97 0.97 1.52 0.83 G1M3c 0.96 0.98 1.49 0.81
4.5.3.3 Effect of Resting Time on Consistency and Power Rate Index
It was observed that with an increase in resting time the behaviour of paste was closer
to the shear thickening as shown in Table 4.20. For 60 min rest time samples, in parallel
plate sample, the rate index ‘n’ was more than 1, indicating the shear thickening
behaviour. Wallevik (2009) performed the experimental work to study the rheological
properties of cement paste at 12 min, 42 min, 72 min and 102 min after initial mixing.
They found that coagulation and links between two cement particles can be reversible
and permanent. Initially, when cement particles come in contact with water, on the
surface of cement particle membrane of gelatinous calcium silicate hydrates forms
(Wallevik, 2009). When cement paste is mixed this membrane break and cement particles
separated and start freely to move. However, with increase in rest time, this link and
membrane become strong and difficult to break. Due to this reason, power rate index
values increased in cement paste. Therefore, it can be concluded that with increase in
resting time reversible coagulation and links between cement particles become
irreversible, permanent and difficult to break which will result in high resistance to flow.
Univers
ity of
Mala
ya

148
Table 4.20: Effect of resting time on consistency and rate index values.
Sample Consistency,
K Power rate
index, n Consistency,
K Power rate
index, n Parallel Plate Concentric cylinders
M0-0 0.60 0.96 0.58 0.82 M0-30 0.96 0.98 0.88 0.80 M0-60 0.22 1.21 0.47 0.72
G1M3-0 0.97 0.97 1.52 0.83 G1M3-30 0.92 0.99 1.88 0.82 G1M3-60 0.99 1.10 1.94 0.83
4.5.3.4 Effect of Superplasticizer on Consistency and Power Rate Index
When water reducing agent was added to the mix, it enhanced the flowability of the
paste. Therefore, it was observed in Table 4.21 that the consistency and rate index values
were reduced by the addition of superplasticizer. It caused more shear thinning behaviour
in all mix designs. Wallevik (2009) stated that van der Waals and electrostatic repulsive
forces generate potential energy interaction between the cement particles. Due to this total
potential energy interaction, cement particles become closer to each other and glued
together in the form of coagulation. The superplasticizer absorbs on the surface of cement
particles and changes the total potential energy in such a manner that dispersion becomes
easier. Hence, it can be stated that superplasticizer greatly enhanced the flowability and
reduce the internal friction between cement paste and graphene by lubricating them
resulting in making the cement pastes thinner and easy to flow.
Table 4.21: Effect of superplasticizer on consistency and rate index values.
Sample Consistency,
K Power rate
index, n Consistency,
K Power rate
index, n Parallel Plate Concentric cylinders
M0 (Control) 0.60 0.96 0.59 0.82 M0S 0.47 0.89 0.49 0.79
G1M3 0.97 0.97 1.49 0.81 G1M3S 0.87 0.82 1.07 0.77
Univers
ity of
Mala
ya

149
4.5.3.5 Effect of Test Geometry on Consistency and Power Rate Index
Concentric cylinders showed higher values of the consistency and lower for rate index.
The main reason might be that in concentric cylinders, inner and outer cylinders both
have different diameter (cup and bob) which make their behaviour as non-linear,
however, in parallel plates, both plates (upper and lower) have the same diameter and its
results are linear (Hung et al., 2015). Another possible reason may be the gap between
the parallel plates, which was small compared to the concentric cylinders. Hung et al.
(2015) reported that an appropriate conversion factor is required for the concentric
cylinders to obtain and convert the large gap to the small one equivalent to the parallel
plate geometry. In brief, test geometry has a significant effect on the rheological
properties.
4.5.4 Effectiveness of Rheological Mathematical Models
Standard error values for the various rheological models were calculated using
Equation (2.7) and given in Table 4.22. A lower value of standard error represents the
best-fitting of the mathematical model to the flow curve. It was observed that HB and
Modified Bingham models showed the lower standard error, whereas, the Bingham and
Casson models displayed higher values. M0c, M0a and G1M10 mixes showed the
maximum standard error values for all mathematical models in the parallel plate.
However, in concentric cylinders, M0S and M0-60 estimated the highest values for the
standard error for all rheological models. Generally, the standard error values predicted
by rheological models were found lower for the concentric cylinders compared to the
parallel plates. Standard deviation values and average values are very less for concentric
cylinders as compared to parallel plates. According to Hung et al. (2015), due to the same
diameter of upper and lower parallel plates, results will be linear. In parallel plates, linear
mathematical models i.e. modified Bingham and Bingham model estimated the lower
Univers
ity of
Mala
ya

150
standard error values in comparison to the Herschel-Bulkley and Casson models. As
modified Bingham model have the characteristics of both Bingham and Herschel-Bulkley
model (Feys et al., 2013) therefore, for parallel plates it predicted the flow behaviour
more accurately. In concentric cylinders, nonlinearity is prominent due to the geometry
of the apparatus. Hence Herschel-Bulkley model and Casson model estimated the lower
standard error values. It can be concluded that, for parallel plates Modified Bingham, and
for concentric cylinder Herschel-Bulkley, is the more appropriate models to predict the
flow behaviour of the graphene based cement pastes
Table 4.22: Values of standard error for various rheological models.
Sample Bingham Modified BM HB Casson Parallel plate
M0 (Control) 74.5 74.3 74.3 73.6 M0S 65.4 42.9 90.5 85.2 M0a 206.5 128.5 453.5 200.0 M0b 74.5 74.3 74.3 73.6 M0c 283.9 242.3 119.0 390.5 M0-0 74.5 74.3 74.3 73.6
M0-30 117.7 65.2 123.0 111.4 M0-60 80.5 52.4 51.5 95.2 G1M3 89.0 34.2 70.5 82.9 G1M5 30.5 30.7 45.0 57.2 G1M10 233.2 223.5 261.5 283.1 G1M3S 178.5 186.3 161.6 177.3 G1M3a 134.9 38.9 27.8 114.8 G1M3b 89.0 34.2 70.5 82.9 G1M3c 88.4 98.3 95.1 98.5 G1M3-0 89.0 34.2 70.5 82.9
G1M3-30 91.3 85.6 95.8 97.7 G1M3-60 92.4 69.0 73.1 111.5 Average 116.3 88.3 112.9 127.3 Standard deviation 66.3 65.4 99.6 86.1
Univers
ity of
Mala
ya

151
Table 4.22: Continued
Sample Bingham Modified BM HB Casson Concentric cylinders
M0 (Control) 37.4 49.2 14.5 16.3 M0S 186.2 194.9 262.3 202.6 M0a 66.3 66.3 15.7 38.1 M0b 37.4 49.2 14.5 16.3 M0c 43.7 68.8 20.3 23.0 M0-0 37.4 49.2 14.5 16.3
M0-30 42.9 42.9 15.7 18.5 M0-60 91.2 80.2 43.9 280.6 G1M3 35.6 37.3 18.3 17.7 G1M5 35.5 35.0 13.3 13.3 G1M10 37.0 38.9 15.5 15.6 G1M3S 52.83 54.3 32.1 31.9 G1M3a 60.3 60.5 14.8 34.0 G1M3b 35.6 37.3 18.3 17.7 G1M3c 34.8 45.2 21.9 20.7 G1M3-0 35.6 45.2 21.9 17.7
G1M3-30 38.6 41.0 17.3 17.8 G1M3-60 35.5 37.8 16.8 16.6 Average 52.4 57.4 32.9 45.3 Standard deviation 36.5 36.5 57.8 73.0
4.6 Mechanical Properties of Graphene Cement Composite Mortar
In this section mechanical properties of graphene-cement mortar were investigated. In
common practice, cement mortar and concrete have been extensively used in construction
industry. By the addition of coarse and fine aggregates in cement paste, the percentage
content of graphene in the overall volume of concrete structure would be very small.
Moreover, it was assumed that if the same percentage of graphene will be used then its
effect will be very minute due to a small amount in comparison to the volume of the
hardened structure. Additionally, the overall amount of graphene in the complete project
will be quite expensive and make the project uneconomical. Thus, mechanical properties
were obtained on the graphene-cement mortar only. For this purpose, the influence of
0.03%, 0.05% and 0.10% of graphene by weight of cement in a mortar was investigated.
Univers
ity of
Mala
ya
152
4.6.1 Compressive Strength
Compressive stress values for the graphene cement mortar was observed at 1, 7 and
28 days after casting. Figure 4.19 shows the overall compressive stress values after the
28 days. Strength gain with the passage of time has been highlighted in Figure 4.19 (a).
Figure 4.19 (b) presents the percentile strength gain at various days and its contribution
for 28 days strength. Influence of different types of graphene and its content on the
compressive strength of cement composites have been made in Table 4.23. It was noted
that graphene significantly enhances the early age strength and contributed to the
hydration reaction of cement (Wang et al., 2016). Minimum increase of 4% in
compressive strength of 1-day was observed for the G3M3-M specimen and maximum
of 79% was noted for G2M5-M specimen. Furthermore, percentage strength contribution
to total strength for 1 day was also high for all graphene cement composites (Table 4.23).
Strength gain between 8-28 days after casting was significantly dropped. Therefore, it
can be stated that graphene has no direct effect on later age strength values. Overall 28-
day compressive strength values were found increasing with the addition of graphene.
The maximum increment of 18% was observed for the G2M5-M mix. The impact of the
lateral size and thickness of graphene flakes is prominent for early age contribution
whereas, surface area role is significant for later age strength as well (Table 4.23). High
surface area helps in hydration reaction and hydrated cement product grows in an ordered
way. Graphene acted as a heterogeneous nucleation site. The activation energy of
hydration reactions decreased and the reaction rate increased, eventually it produced more
hydrated cement products i.e. C-S-H and portlandite (Sedaghat, 2014).
Univers
ity of
Mala
ya

153
(a) Compressive strength values
(b) Percentage gain in compressive strength
Figure 4.19: Determination of compressive stress for graphene cement mortar.
Moreover, two phenomena i.e. obstructing the propagation of flaws and crack bridging
played an important role in strength contribution. These parameters depend upon the
surface area and thickness of graphene flakes. Eventually, when cracks were developed
0
10
20
30
40
50
60
70
Com
pres
sive
stre
ngth
(MPa
)
1-day 7-day 28-day
0%10%20%30%40%50%60%70%80%90%
100%
Com
pres
sive
stre
ngth
(%)
0-1 day 2-7 day 8-28 dayUnivers
ity of
Mala
ya

154
and propagated, graphene flakes hold them together which results in higher strength. It
further able to slow down the initiation of cracks and offers hindrance to the opening of
the existing cracks (AlMuhit, 2015). G2 type graphene-cement composite specimens
obtained the maximum values for compressive strength followed by G3 and G1 type as
shown in Table 4.23. G2 type graphene flakes have more surface area than G3 type and
more lateral size and thickness of graphene flakes than G1 type. Hence, it can be said that
higher surface area, lateral size and thickness of graphene flakes contributed to the
increase in compressive strength. Graphene content also plays a significant role in
strength gain e.g. for M10 mixes, the highest compressive strength values were observed,
which were 57.5, 63.14 and 60.41 MPa, for G1, G2 and G3 type respectively. When the
amount of graphene content increased, more particle size reduced to the nanoscale level.
The large surface area and surface energy of graphene flakes results in better absorption
capability and chemical reactivity in comparison to other conventional materials.
Therefore, large amount of graphene experienced higher compressive strength values.
Table 4.23: Compressive strength values estimated for graphene cement mortar.
Sample
Strength Increment (MPa) / Percentage strength contribution to total strength (%) Total strength-28 Day
0-1 Days 2-7 Days 8-28 Days Strength (MPa)
Percentage rate (%)
M0-M 16.7 30.81 21.7 40.08 15.8 29.10 54.3 100.00 G1M3-M 18.7 35.43 20.2 38.23 13.9 26.34 52.7 97.09 G1M5-M 21.8 37.92 21.1 36.62 14.6 25.46 57.6 106.09
G1M10-M 23.2 40.49 21.2 36.87 13.0 22.64 57.5 105.78 G2M3-M 28.3 47.66 15.5 26.04 15.6 26.30 59.4 109.31 G2M5-M 29.9 46.54 19.4 30.23 14.9 23.23 64.3 118.38
G2M10-M 26.6 42.22 21.2 33.61 15.2 24.17 63.1 116.15 G3M3-M 17.4 33.98 24.1 46.95 9.7 19.08 51.2 94.32 G3M5-M 19.2 34.39 24.0 43.04 12.6 22.57 55.8 102.70
G3M10-M 27.4 45.41 22.6 37.51 10.3 17.08 60.4 111.13
Univers
ity of
Mala
ya

155
4.6.2 Flexural Strength
Flexural strength values were determined for graphene cement mortar. These values
were obtained on 7 and 28 days after casting. Flexural strength values were not recorded
for 1-day as the values were undetectable and sample broke before any reading. The
obtained values of flexural strength were presented in Figure 4.20. Generally, flexural
strength values increased with the addition of graphene. By comparing the percentage of
graphene, the highest flexural strength values were computed for M10 mixes of graphene.
The flexural strength of M10 mix was increased by 20.9%, 38.1%, and 18.5% for G1, G2
and G3respectively as compare to the flexural strength of M0-M at 28-day of casting as
shown in Table 4.24. These results support the findings of Pan et al. (2015) and Murugan
et al. (2016). The authors found 15-33% enhancement in compressive strength and 41-
59% in flexural strength by using 0.05% of GO (Pan et al., 2015). G2 type mortar mixes
have the highest values of flexural strength. A similar trend was observed in a
compressive strength test. Interestingly, it was noted that later age flexural strength was
significantly enhanced by the addition of graphene. In flexural test tensile cracks formed
and these cracks become wider with the application of external loading. Hence, crack
bridging and hindrance to crack propagation by graphene flakes was more prominent. In
short, it can be concluded that flexural strength development was based on the crack
bridging action of graphene and compressive strength development was based on both
hydrated products development and crack bridging action. Univers
ity of
Mala
ya

156
(a) Flexural strength values
(b) Percentage gain in flexural strength
Figure 4.20: Determination of flexural strength for graphene cement mortar.
0
1
2
3
4
5
6
Flex
ural
Str
engt
h (M
Pa)
7-day 28-day
0%10%20%30%40%50%60%70%80%90%
100%
Flex
ural
Str
engt
h (%
)
0-7 day 8-28 day
Univers
ity of
Mala
ya

157
Table 4.24: Flexural strength values estimated for graphene cement mortar.
Sample
Strength Increment (MPa) / Percentage strength contribution to total strength (%)
Overall strength-28 Day
0-7 Days 8-28 Days Strength (MPa)
Percentage rate (%)
M0-M 3.4 84.98 0.6 15.02 4.1 100.00 G1M3-M 3.2 79.60 0.8 20.40 4.0 97.78 G1M5-M 3.8 90.38 0.4 9.62 4.3 104.93
G1M10-M 3.6 74.13 1.3 25.87 4.9 120.94 G2M3-M 3.8 83.15 0.8 16.85 4.6 114.04 G2M5-M 3.9 77.34 1.2 22.66 5.0 123.89
G2M10-M 3.9 69.70 1.7 30.30 5.6 138.18 G3M3-M 3.7 90.64 0.4 9.36 4.1 100.00 G3M5-M 3.6 77.61 1.0 22.39 4.6 113.30
G3M10-M 3.6 76.09 1.2 23.91 4.8 118.47
4.7 Properties of Graphene Cement Paste
In this section influence of graphene flakes on flow diameter, hardened density, stress-
strain curve, hydrated cement products, generation and propagation of cracks of cement
composite paste was investigated.
4.7.1 Workability
For workability, the flow diameter test was performed for the graphene-cement
composite and its obtained values are presented in Table 4.25. The flow diameter values
for graphene-cement composite were found lower as compared to mix M0. Pan et al.
(2015) used 0.05% of graphene oxide in cement paste with w/c = 0.5 and observed the
41.7% reduction in the slump diameter. Similarly, for 2 % carbon nanotubes with w/c =
0.5 in cement paste 48.9% reduction in slump diameter were found (Collins et al., 2012).
A possible reason for the reduction in flow diameter could be the large surface area of the
graphene flakes which required more amount of water for lubrication and decrease the
free available water. As G1 type was having the maximum surface area, therefore, the
9.3% reduction was noted in G1M10 mix. Spread diameter of the G1M3 mix was 5.4%
lowered as compared to the M0 mix. As G3 type was having the lowest surface area thus,
Univers
ity of
Mala
ya

158
for the mix G3M10 only 6.2% reduction was recorded in contrast to M0. Another factor
which may contribute to the reduction of flow diameter is the formation of agglomerates
due to hydrophobic nature of graphene. However, due to a combination of ultrasonication
and magnetic stirring dispersion technique, its effect was observed very minimally. It was
also observed that increase in the percentage of graphene content caused more reduction
in flow diameter of the graphene-cement composite. Therefore, it can be deduced that the
overall workability of the cement paste was reduced by addition of graphene in the
cement paste.
Table 4.25: Flow diameter, maximum compressive load and corresponding resistivity values.
Sample
Flow diameter (mm) /
Percentage rate (%)
Density (kg/m3) /
Percentage rate (%)
Maximum compressive load (kN) / Percentage
rate (%)
Compressive strength (MPa) /
Percentage rate (%)
Compressive strain at
maximum compressive
load (mm/mm) / Percentage
rate (%)
Four probe resistivity at maximum
compressive loading
(kΩ-cm) / Percentage
rate (%) M0 225 / 100 2155.6 / 100 93.6 / 100 58.5 / 100 0.0086 / 100 69.8 / 100
G1M3 213 / 94.6 2045 / 94.9 103.6 / 110.6 64.7 / 110.6 0.012 / 147.2 22.5 / 32.2 G1M5 211 / 93.8 2150.7 / 99.8 109.2 / 116.7 68.3 / 116.7 0.014 / 170.1 28.3 / 40.5 G1M10 204 / 90.7 2077.4 / 96.4 95.4 / 101.9 59.6 / 101.9 0.132 / 153.6 35.4 / 50.8 G2M3 217 / 96.4 2053.7 / 95.3 92.4 / 98.8 57.8 / 98.8 0.0138 / 160 40.4 / 57.8 G2M5 211 / 93.8 2151.9 / 99.8 122.2 / 130.6 76.4 / 130.6 0.015 / 173.4 64 / 91.7 G2M10 209 / 92.9 2038.2 / 94.6 107.2 / 114.5 67 / 114.5 0.012 / 144.2 36.7 / 52.5 G3M3 217 / 96.4 2110.4 / 97.9 114.9 / 122.7 71.8 / 122.7 0.018 / 213.5 49.8 / 71.3 G3M5 210 / 93.3 2114.4 / 98.1 122.1 / 130.5 76.3 / 130.5 0.014 / 160.3 57.3 / 82.2 G3M10 211 / 93.8 2104.8 / 97.6 110.8 / 118.4 69.3 / 118.4 0.0150 / 174 52.4 / 75.1
*Percentage rate is to be compared with M0 mix.
4.7.2 Hardened Density
The density of hardened graphene-cement composites was measured using BS EN
1015-10-1999 (BS EN 1015-10, 1999). A small drop in density values was observed with
the increase in the percentage of graphene. A maximum of 5.4 % drop in density value
was found for G2M10 mix as compared to M0 (Table 4.25). Pan et al. (2015) used the
Univers
ity of
Mala
ya

159
0.05% of graphene oxide by weight of cement in design mix and found 1.86% reduction
in density values, however, 19% increase in compressive strength as compared to plain
cement mix. Similarly, Yakovlev et al. (2006) noted that density values reduced by 6.36%
after the incorporation of 0.05% of carbon nanotubes in the cement mix with 70%
increase in compressive strength. For M5 mixes of graphene, density values were very
close to the M0 mix and have higher compressive strength values (Table 4.25). The
possible reason for the increase in compressive strength and reduction in density was
uniformity and better distributions of small pores. According to Pan et al. (2015) small
and medium size pores (1-45 nm) significantly increase by incorporation of GO in the
cement mix. Furthermore, gel pores (1-10 nm), which are composed of CSH gel pore
system, increased by 109% (Gong et al., 2014). Pan et al. (2015) and Murugan et al.
(2016) found that addition of GO promotes the hydration process (early stages hydration),
achieve a high degree of hydration and yields more proportion of CSH gel. Gong et al.
(2014) also reported that overall pore area was enhanced by 36% as compared to the plain
cement. Therefore, it can be concluded that due to increase in pore area density values of
the graphene-cement composite was reduced, however, increase in gel pore sizes,
uniformity and discontinuity of pores influenced the mechanical properties.
4.7.3 Stress-Strain Curve
The stress-strain curves for the plain cement and graphene-cement composite were
obtained after 28-day of casting and illustrated in Figure 4.21. The compressive strength
of the graphene cement composite was increasing with the addition of graphene. Increase
in compressive strength was attributed mainly to the more hydrated products. The
maximum increase in compressive strength of 30% was found for G2M5 and G3M5 mix.
As it can be seen in Figure 4.21 that graphene not only enhances the load carrying
capacity of the cement paste but exhibited more ductile behaviour as compared to M0
Univers
ity of
Mala
ya

160
(Table 4.25). The maximum increase in strain was 113.5 % observed for the G3M3 mix
as compared to M0. The stress-strain curve for G1 type is given in Figure 4.21 (a). For
G1M3 specimen with a small amount of graphene compressive stress was enhanced by
10.6% and the maximum strain was increased by approximately 47%. Compressive stress
values for G1M10 and M0 were very close to each other, however, the ductility and
compressive strain values were 53.6 % more as compared to M0. Figure 4.21 (b) shows
the stress-strain curve for G2 type graphene. As the lateral size and thickness of this
graphene flakes are more, therefore, it exhibits more ductile behaviour in the start. The
maximum increase in a compressive strain of 73% was noted for G2M5 in contrast to
control mix. For G2M10 mix due to more amount of graphene flakes agglomerates
structures easily formed which reduce the ductility value. As average thickness of G3
flakes is twice of G2, hence it showed more ductile behaviour. G3M3 determined the
maximum compressive strain values amongst all mixes. However, due to increase in
agglomerate structures for G3M5 and G3M10 mixes a decrease in strain value was found.
G3M10 mix exhibits the maximum compressive stress and strain values amongst the M10
mix. The results of this study were further compared to the available stress-strain curve
of graphene-oxide based cement paste, which is derivative of graphene (Pan et al., 2015).
Pan et al. (2015) studied the cement paste containing 0.05% of graphene oxide and
reported significant improvement of about 19% in compressive strength compared to
control specimen. They suggest that due to the presence of graphene oxide, propagation
of micro-cracks was delayed and result as increased in strain capacity. In short, the
increase in compressive strength and compressive strain may be attributed to the higher
strength of graphene, increased hydrated product, template effect, and crack bridging by
graphene flakes (Cao et al. (2016))
Univers
ity of
Mala
ya

161
(a) G1-cement mix
(b) G2-cement mix
Figure 4.21: Continued
Univers
ity of
Mala
ya

162
(c) G3-cement mix
Figure 4.21: Effect of percentage of graphene on stress-strain curve of cement composite.
Later on, a comparison has been drawn amongst the stress-strain curve of various
graphene types. As G3 has more thickness of graphene flakes, therefore, it observed
maximum compressive strain values. G3M3 mix has the maximum compressive stress
and strain value as presented in Table 4.25. It was observed that M5 mixes (containing
0.05% of graphene) obtained the optimum increase in compressive strength of graphene-
cement composites. For M10 mixes a drop in compressive strength was noted. It was due
to an excessive amount of graphene content, which formed agglomerates in cement
mixes. It leads further to the formation of voids and non-uniform distribution of graphene
content in cement paste. Thus, it can be concluded that flake thickness and size play an
important role for an increase in compressive strain and compressive stress of graphene
cement composite.
Univers
ity of
Mala
ya
163
4.7.4 Influence of Graphene on Growth of Cracks
Generation and growth of cracks for the M0 sample were identified using FESEM
images as shown in Figure 4.22 (a). These are the nano size cracks which becomes later
micro size cracks without any interference and play their role in failure mechanism of
material. Graphene flakes successfully interrupt these cracks and stop their growth at
nanoscale level and provide a great obstacle to the continuity of the cracks. As can be
seen in Figure 4.22 (b) that the graphene is blocking the crack in G3M10 specimen.
Furthermore, Figure 4.22 (c) and Figure 4.22 (d) explain this phenomenon more clearly
that graphene flakes are holding the microcracks and preventing their further growth.
Longitudinal growth of cracks is highlighted using green lines and location of graphene
in red circles. Cracks were discontinued and deflected due to the presence of graphene
flakes. The backscattered image was used to confirm the presence of graphene for G3M10
specimen in Figure 4.22 (d). Therefore, G3M10 sample shows the more ductile behaviour
and enhanced compressive strain as compared to the mix M0. Similar phenomena were
observed for G2 and G1 mixes in Figure 4.22 (e) and Figure 4.22 (f). Graphene flakes
successfully provide the hindrance to the propagation of cracks. The thickness of
graphene flakes plays an important role during the crack bridging phenomena. Pan et al.
(2015) made the comparison of crack patterns for plain and graphene-oxide based cement
composite. They found that in plain cement cracks were passing straight through the
dense hydrated product. However, in graphene oxide cement paste cracks were fine and
discontinued. Therefore, it can be summarized that graphene flakes deflected the crack
pattern, make them fine, discontinue and provide hindrance in their growth, which
resulted in enhancing the ductility and compressive strength of the graphene cement
composite.
Univers
ity of
Mala
ya

164
(a) Crack propagation in control specimen
(b) blockage of the cracks by graphene in
G3M10
(c) crack bridging phenomena by graphene in
G3M10
(d) backscattered electron image to identify
the graphene in (c)
(e) blockage of the cracks by graphene in G2M3
(f) blockage of the cracks by graphene in
G1M10
Figure 4.22: Effect of graphene on propagation of cracks.
4.8 Electrical Resistivity Values of Graphene Cement Composite
In this section, results related to the electrical properties of graphene cement composite
will be discussed. Which is mainly based on the fractional change in resistance (FCR) of
Univers
ity of
Mala
ya
165
the specimens when being subjected to compressive loading. Furthermore, the
comparison between different specimens’ results will be made. Last but not least, the
piezoresistive and conductive mechanism of the cementitious nanoparticles composite
will also be discussed in the last part of this section. Piezoresistive properties of control
specimen and graphene-cement composite samples were investigated by using the four-
probe method. Electrical resistivity for unequal spacing between the probes was
calculated by using Equation (2.12) and presented in Table 4.25. It was noted that the
electrical resistivity value for G1M3 sample at maximum compressive load was 67.8 %
less as compared to M0. Graphene-cement composites containing G1 type showed very
small electrical resistivity values as compared to G2 and G3 type (Table 4.25). The
overall reduction in electrical resistivity values for G1, G2 and G3 mixes at maximum
compressive load were recorded as 60%, 33% and 24% respectively as compared to
control mix. Therefore, it can be said that surface area of graphene plays an important
role in investigating the piezoresistivity characteristics of graphene-cement composite
mixes.
The relationship between the fractional change of resistance in percentage and the
normalized compressive load were shown in Figure 4.23. Figure 4.23 (a) presents the
response of G1 type cement mixes. Maximum FCR (%) values were observed for G1M5
and G1M3 specimens at maximum normalized compressive load and found 2.72 and 2.44
times of control specimen respectively. It can be noted that G1M3 mix determines the
fractional change in resistance more rapidly, however, G1M5 mix determined the FCR
values more precisely after 40% of applied maximum loading as compared to the G1M3
mix. Due to the more agglomerates, the response of G1M10 mix was less as compared to
other mixes of G1 type. Figure 4.23 (b) and Figure 4.23 (c) showed the variation in FCR
values as compared to normalized applied compressive loading for G2 and G3 type. It
Univers
ity of
Mala
ya
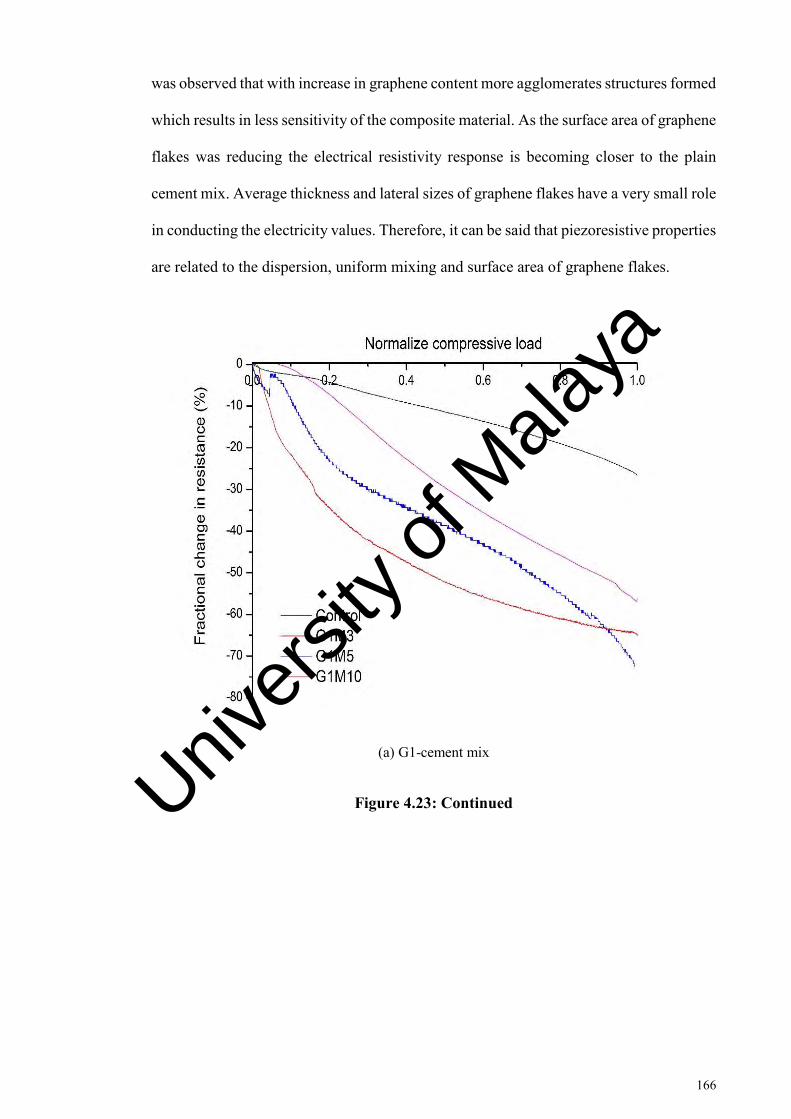
166
was observed that with increase in graphene content more agglomerates structures formed
which results in less sensitivity of the composite material. As the surface area of graphene
flakes was reducing the electrical resistivity response is becoming closer to the plain
cement mix. Average thickness and lateral sizes of graphene flakes have a very small role
in conducting the electricity values. Therefore, it can be said that piezoresistive properties
are related to the dispersion, uniform mixing and surface area of graphene flakes.
(a) G1-cement mix
Figure 4.23: Continued Univers
ity of
Mala
ya

167
(b) G2-cement mix
(c) G3-cement mix
Figure 4.23: Fractional change in electrical resistance against the normalized compressive loading in graphene-cement composite.
Figure 4.24 shows the effect of various graphene type on piezoresistive characteristics
of cement composites. As the surface area of G2 and G3 was less, therefore, the maximum
FCR values against normalized compressive load for G2 and G3 mixes were less as
compared to the G1 mix. Figure 4.24 (b) displayed that FCR curves of G2M5 and G3M5
Univers
ity of
Mala
ya
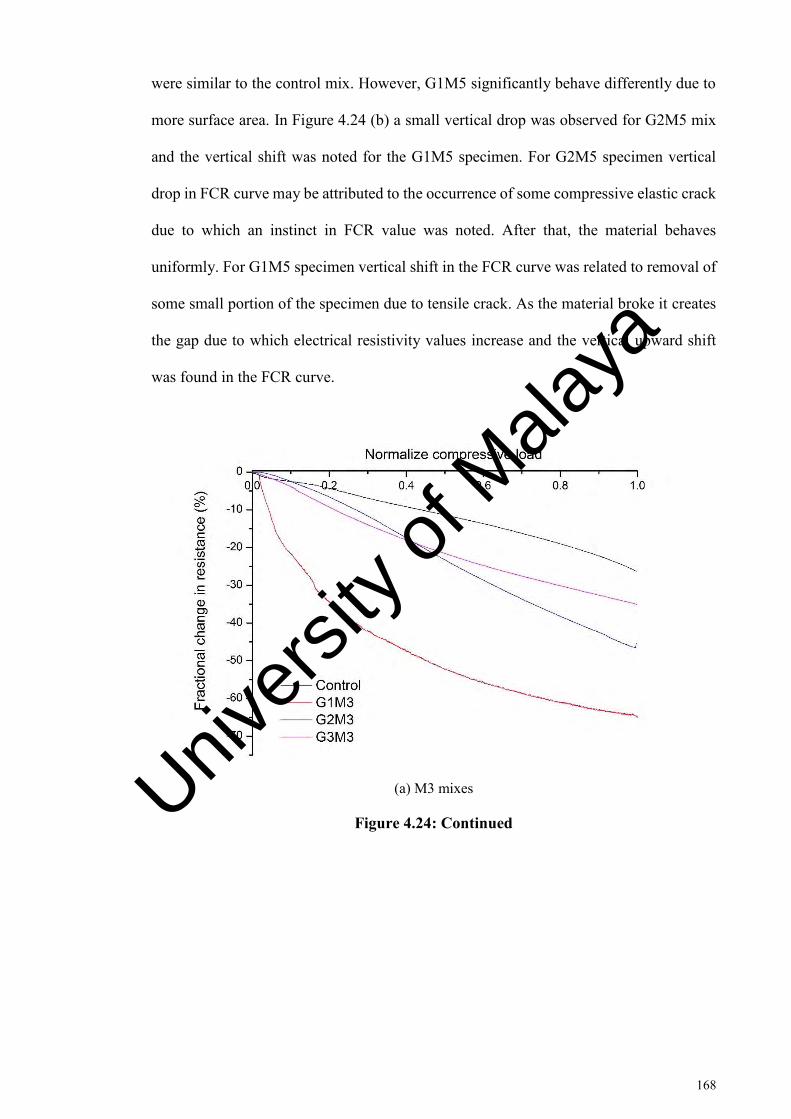
168
were similar to the control mix. However, G1M5 significantly behave differently due to
more surface area. In Figure 4.24 (b) a small vertical drop was observed for G2M5 mix
and the vertical shift was noted for the G1M5 specimen. For G2M5 specimen vertical
drop in FCR curve may be attributed to the occurrence of some compressive elastic crack
due to which an instinct in FCR value was noted. After that, the material behaves
uniformly. For G1M5 specimen vertical shift in the FCR curve was related to removal of
some small portion of the specimen due to tensile crack. As the material broke it creates
the gap due to which electrical resistivity values increase and the vertical upward shift
was found in the FCR curve.
(a) M3 mixes
Figure 4.24: Continued
Univers
ity of
Mala
ya

169
(b) M5 mixes
(c) M10 mixes
Figure 4.24: Influence of graphene type on fractional change in resistance against the normalized compressive loading.
To elaborate and emphasize the significance of graphene mix, G1M3 results were
further compared to the results of two literature studies (Li et al., 2004a, 2006a). Li et al.
(2004a) investigated the self-monitoring capability of cement mortar containing nano
Fe2O3. They observed that fractional change in resistance is the key factor for self-sensing
Univers
ity of
Mala
ya

170
instead of resistivity itself. Li et al. (2006a) investigated the strain sensing characteristics
of carbon black filled cement composite. They observed the linear relationship between
the fractional change in resistivity and compressive strain. It is important to mention here
that FCR curve was considered after 20% of normalizing compressive loading. It was
done primarily to avoid the response of shrinkage, tensile and elastic cracks. As it can be
seen in Figure 4.25 that the control cement mix as determined by Li et al. (2004a) showed
a very low fractional change in resistance. However, the addition of 3% nano Fe2O3 and
15% of Carbon Black (CB) provided a more fractional change in resistance i.e. strain
sensing characteristics. It can be seen that due to high electrical transport characteristics
of graphene, G1M3 sample in a better way correlates the FCR values with NCL at each
point.
Figure 4.25: Fractional change in resistance against normalized compression load for various samples.
Univers
ity of
Mala
ya

171
4.9 Application of Graphene Cement Composite in Laboratory
As graphene is very costly material, therefore, it is very difficult to use the graphene-
cement composite material in mega projects instead of plain cement material. However,
self-sensing properties of graphene cement composite can be used to provide a
sustainable health monitoring of the concrete structures. For this purpose, samples of the
graphene-cement composite with dimension 40 x 40 x 160 mm were placed in the real
concrete structures. As G1M3 mix outshine the electrical resistivity and fractional change
in resistance values therefore, only G1M3 mix was used to evaluate the practical
application and self-sensing characteristics of the graphene-cement composites in real
structures.
4.9.1 Reinforced Beam Subjected to Flexural Loading
In order to strengthen this viewpoint and show its practical application, full-length RC
beam was tested in the laboratory by placing G1M3 specimen at the time of casting. This
beam was subjected to flexural loading and due to applied loading cracks were generated
in the region of the maximum bending moment. Figure 4.26 shows the fractional change
in resistance of G1M3 specimen in RC beam. It can be seen that FCR values varied with
increase in the applied loading on the beam and a sharp response was noted at the time of
beam failure. As the beam was subjected to the flexural loading, therefore, resistance
values were positive. The inset figure (enlarged view) in Figure 4.26 showed that with
the increase in flexural loading, the fractional change in resistance values were also
increasing. It is important to mention here that this response is not linear, however, due
to the occurrence of damage and propagation of cracks, the FCR values varied as shown
in inset figure (enlarged view of Figure 4.26). It was observed that at 22kN load, a sudden
drop in electrical resistivity value occurred. The possible reason is the presence of tensile
cracks in RC beam. Initially, tensile cracks started to occur and electrical resistivity values
Univers
ity of
Mala
ya
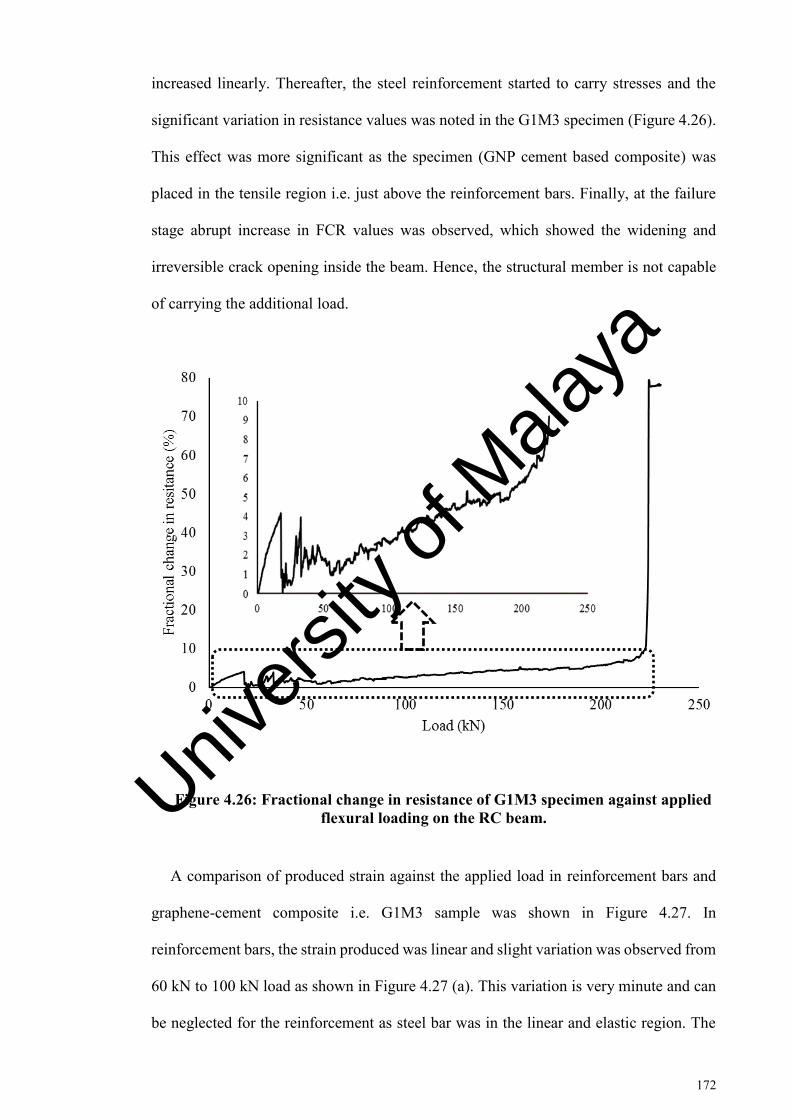
172
increased linearly. Thereafter, the steel reinforcement started to carry stresses and the
significant variation in resistance values was noted in the G1M3 specimen (Figure 4.26).
This effect was more significant as the specimen (GNP cement based composite) was
placed in the tensile region i.e. just above the reinforcement bars. Finally, at the failure
stage abrupt increase in FCR values was observed, which showed the widening and
irreversible crack opening inside the beam. Hence, the structural member is not capable
of carrying the additional load.
Figure 4.26: Fractional change in resistance of G1M3 specimen against applied flexural loading on the RC beam.
A comparison of produced strain against the applied load in reinforcement bars and
graphene-cement composite i.e. G1M3 sample was shown in Figure 4.27. In
reinforcement bars, the strain produced was linear and slight variation was observed from
60 kN to 100 kN load as shown in Figure 4.27 (a). This variation is very minute and can
be neglected for the reinforcement as steel bar was in the linear and elastic region. The
a
Univers
ity of
Mala
ya

173
G1M3 sample also showed variation in strain from 60 kN to 100 kN load as marked in
Figure 4.27 (b). However, in comparison to reinforcement bar, the variation was large
and the strain values for the G1M3 sample decreased significantly. This may be related
to the redistribution of stresses in the RC concrete beam. Similarly, when the applied
loading exceeded 200 kN, the reinforcement bar showed significant variance in strain
values. At the same point, an increase in strain values in graphene cement composite
sample was noted. It may be related to crushing of concrete in RC concrete beam.
(a) Reinforcement bar
(b) Graphene-cement composite specimen (G1M3)
Figure 4.27: Strain produced by applied flexural load.
Univers
ity of
Mala
ya

174
4.9.2 Reinforced Concrete Beam Subjected to Various Damage Levels
Figure 4.28 showed the response of G1M3 specimen against various damage levels.
These damage levels were induced intentionally in the RC beam. At different controlled
damage levels, cracks propagation was highlighted and electrical resistivity (ER) values
of graphene cement composite specimen were noted. The purpose of inducing these
controlled damage levels in RC beam was to monitor the characteristics of graphene
cement composite specimen for damage memorization and damage-sensing. Damage-
sensing is better and realistic approach as compared to stress or strain sensing. Damage
generation is irreversible on unloading however, strain can be reversible on unloading
provided that specimen is within elastic range. Therefore, real-time and continuous
monitoring is not required in case of damage-sensing.
(a) Damage level 1
(b) Damage level 2
Figure 4.28: Continued
Univers
ity of
Mala
ya

175
(c) Damage level 3
(d) Damage level 4
(e) Damage level 5
(f) Failure stage
Figure 4.28: Resistivity values corresponding to different damage levels.
Electrical resistivity values were plotted against the loading and unloading cycles of
the beam in Figure 4.28. Figure 4.28 (a) showed the ER values for damage level 1.
Univers
ity of
Mala
ya

176
Hairline cracks were generating in the RC beam as marked in Figure 4.28 (a). It was
clearly observed that ER values at zero load are different for both loading and unloading
curves. Furthermore, in damage level 2 crack length and width was increased as marked
in Figure 4.28 (b). ER values were overlapping for both loading and unloading cycles.
However, for decreasing load curve the values of ER were higher as compared to
increasing loading cycle. For damage level 3, diagonal shear cracks generated in RC beam
as shown in Figure 4.28 (c). Moreover, length, width and depth of existing cracks also
enhanced. For damage level 4 the crack length progressed in reverse direction as well as
highlighted in Figure 4.28 (d). During unloading cycle, the loading rate was 66.67% high
as compared to increasing loading rate. Due to this reason, the values of ER for unloading
curve fluctuate excessively. Furthermore, this fluctuation also highlights that internally
damages are generating in RC beam, and bong matrix between hydrated cement products
is breaking. For damage level 5 the density of cracks also increased and new diagonal
cracks near the supports were also observed as shown in Figure 4.28 (e). Additionally,
cracks are also converging and forming the bigger and widen cracks, therefore, ER pattern
for both loading and unloading curve is significantly different as compared to other
damage levels. After applying 100 % design loading, the RC beam was further subjected
to flexural loading until failure stage. Failure load was higher as compared to design load
due to various factors of safety. An abrupt increase in ER pattern was noted at failure
stage due to the presence of widened cracks in both beam and G1M3 specimen as seen in
Figure 4.28 (f). Thus, it was concluded that after every damage level electrical resistivity
values were increased and can be used to identify the structural health of the RC beam.
4.10 Advantage of Graphene Cement Specimen
In this section, compatibility and comparison of graphene-cement (GC) specimen with
the well-known non-destructive test (NDT) methods has been made. Selection of any
Univers
ity of
Mala
ya

177
methods based on available time, budget, simplicity and reliability therefore, some
methods are preferred over others. Ideally, the adaptable method should capable to
observe and detect all important defects and anomalies in the concrete structures.
Therefore, preference of any method is based on the yielding of the information.
Reporting and observing the damages is one of the major problems. For this purpose,
damages based on periodic inspection has been classified. The detailed description of
damage levels is given in terms of numbering system which provide better information
and less dependence on inspector judgement. Elaboration of each damage level based on
crack lengths, spalling of concrete cover, applied loading as a percentage of design load,
support settlement, titling of foundation (due to the settlement of subsoil or erosion of
soil) and reinforcement of corrosion is given in Table 4.26.
Table 4.26: Detailed description of damage levels.
Level Crack lengths Spalling Support settlement
Loading (% of design loading)
Tilting of foundation
Reinforcement corrosion
0 None / 1 µm None 100 µm 20%
0° None
1 Partial / 100 µm None 1mm 40%
0.05° Some stains on
surface
2
Some/ ≤ 1mm (NDT limit)
(Vasudevan et al., 2001)
Partial bulge
outward
50 mm 60%
0.1°(Realized) (Deroeck et al.,
2000) Partially stains
3 Fair amount / ≤10 mm
Partial spalling
95 mm
(Realized) 80%
0.3° Fair amount of
stains
4 Large amount / ≤100 mm
Fair amount of bulge and spalling
200 mm (Maximum Allowable) (Deroeck et al., 2000)
100%
0.5° (Max Allowable)
Fair amount of rusts
5 Large / ≤1m
Large amount of bulge and spalling
≥ 200 mm >100%
≥ 0.5° Large amount
of rusts
Univers
ity of
Mala
ya

178
Furthermore, a flow chart has been proposed for the health monitoring of concrete
structures (Figure 4.29). After classifying the damage levels in Table 4.26, several
suitable non-destructive test methods were suggested for detailed investigation of the
concrete structures. Since maintenance activities are the routine interventions which are
applied to the structure to preserve the structural performance and health. Therefore,
subsequently, corrective measures are also proposed to recover the lost strength. It is
worth important to mention here that GC specimen successfully determined and identified
the response of structural member at each damage level. One of the major advantages of
GC specimen is its compatibility with concrete materials. It is placed in the concrete
member at the time of casting of concrete and remains intact for the whole life of the
structure. However, other methods are lacking in this respect. GC specimen also has the
advantage over the other methods in terms of the financial aspect. The cost of 5 g of GNPs
as per Graphene Laboratories, Inc. USA is 50 USD and 25 samples can be casted of the
G1M3 specimen using 5 grams of GNP. Hence, this G1M3 specimen can be used in an
efficient and economical way to predict the damages in concrete structures.
Univers
ity of
Mala
ya

179
Figure 4.29: Schematic layout of structural health monitoring procedure, selection of method and potential remedial measure.
One of the common misperception about the usage of nanomaterials is hazardous
nature. For this purpose, material safety data sheets were obtained. Physically and
environmentally it is not classified as hazards as per Globally Harmonized System (GHS)
of classification. However, it may be harmful if swallowed and can cause eye irritation
and respiratory irritation. Therefore, Personal Protective Equipment (PPE) and the usual
precautionary measures for handling chemicals should be followed. Furthermore, contact
with eyes, skin, food-stuff during practice should be avoided and wash hands after usage.
Univers
ity of
Mala
ya

180
4.11 Conclusion
Three (3) types of graphene have been used in this research which were based on
surface area, flake thickness and lateral size were used in this research. It was found that
flake thickness and surface area have an important role in the dispersion of graphene
flakes in aqueous solution. G1 type with high surface area and least flake thickness
showed the highest absorption values in UV-vis spectroscopy results. It was also noted
that dispersion efficiency was greatly enhanced by using ultrasonication, superplasticizer
and magnetic stirring. Experimental results concluded that magnetic stirring of 40 min in
combination with ultrasonication gave the optimum results for all graphene types.
Furthermore, TGA results determined that more amount of CSH gel was found followed
by portlandite amount. Moreover, hydrated products were found more for G2 type
graphene having a high surface area as well as more lateral size. It was observed from
TGA data that graphene flakes significantly enhanced the growth of hydrated cement
product at an early age. From FESEM images, it was determined that hydrated cement
product grows over the graphene flakes, and found compact and durable due to the
ordered growth. As a result, mechanical properties of graphene cement composite
material enhanced as compared to plain cement specimen.
It was also found that graphene increased the yield stress values of the graphene
cement composite paste. Due to the high surface area and average thickness of graphene
flakes, overall water demand of the system was increased. Furthermore, graphene flakes
formed the agglomerates in the cement paste and entrapped some water molecules inside
it. Hence, the free available water content was reduced, which provoked the yield stress
values for composite materials. Maximum yield stress values were found for G3 type
graphene having more flake thickness. Moreover, the plastic viscosities were found in
correlation with yield stress. In Herschel-Bulkley model, the power rate index values
Univers
ity of
Mala
ya

181
were found less than 1 indicating the shear thinning flow behaviour, however, for G3 type
with higher content shear thickening behaviour was recorded. Power rate index values
were found increasing with the increase in graphene content. It was found that Bingham
model determined the lowest standard error values and provided the best fitted
mathematical model to the flow curve of graphene cement composite. Furthermore, the
dependence of several factors on the rheological properties of cement paste was
determined as well. Yield stress values were enhanced with the increase in shear rate
cycle range and resting time, however, reduced with superplasticizer. Likewise, parallel
plates estimated the higher yield stress values due to less gap and more spread diameter,
however, provided the results with realistic approach. Plastic viscosity was found to be
dependent on various variables. It increases with the increase of graphene content, resting
time and reduces with superplasticizer and high shear rate cycle range. Due to the
settlement of suspended particles in cement paste sample, the parallel plates estimated the
higher values of plastic viscosities as compared to concentric cylinders due to the
settlement of suspended particles in cement paste sample.
Mechanical properties were investigated for graphene cement mortar. For one-day
specimen, maximum increment was found as 79% in compressive strength. High surface
area of graphene contributed towards the growth of hydration products in an ordered way,
while thickness of graphene plays its role in cracks bridging action and blocking the
propagation of cracks. Overall 38.1 % increment was noted for flexural strength at 28-
day of casting for the G2M10-M mix. Furthermore, overall workability of the cement
paste was reduced by addition of graphene in the cement paste and maximum of 9.3 %
reduction was noted for flow diameter values of graphene cement paste samples. 30.5 %
increase in compressive strength values of graphene cement paste was noted. Hardened
density decreased with the incorporation of graphene and 5.4% reduction was noted for
Univers
ity of
Mala
ya

182
G2M10 mix design. The compressive strain was intensely increased and 113.5%
increment was found as compared to control mix. Graphene cement composite showed
the ductile behaviour due to the influence of graphene. It was related to blockage of cracks
at micro level by the graphene flakes. Graphene flakes influenced the electrical resistivity
values of the composites. At maximum compressive load, electrical resistivity values
were calculated using four-probe method and 67.8% reduction was found in graphene
cement composite specimen. Lastly, the application of graphene cement composite as a
smart sensor was evaluated in reinforced concrete. The reinforced concrete beam was
subjected to flexural loading and various damage levels were introduced in a concrete
beam using profile loading. It was found that graphene cement composite successfully
predicted the propagation of damages in RC beam.
Univers
ity of
Mala
ya

183
CHAPTER 5: CONCLUSIONS AND RECOMMENDATIONS
5.1 Introduction
This chapter relates the findings of the results and discussion chapter with the
objectives of this research thesis. This research was performed to explore and evaluate
the multifunctional properties of graphene based cement composites. The extraordinary
properties of graphene flakes opened the new dimension for development of smart
materials and overcoming the weaknesses of existing construction materials. Moreover,
investigation of multifunctional properties provided an overview of the problems and
issues related to utilization of graphene in cement based applications. In the end,
recommendations and suggestions for the future research are also included.
5.2 Conclusions
1. Graphene flakes with the high surface area and less flake thickness have better
dispersion. G1 type flakes obtained the stable and high absorbance values as
compared to G2 and G3. Superplasticizer made the dispersion stable and uniform over
long duration due to electrostatic repulsion, however, for thick graphene flakes (G3
type) its effect was limited. Moreover, magnetic stirring in combination with
ultrasonication breaks the flocculated and agglomerated structures of graphene flakes.
However, excessive magnetic stirring has negative effect on the dispersion and
physical properties of graphene flakes, especially for high surface area graphene type.
The optimum duration of magnetic stirring time was found to be 40 min. The results
of microanalytical characterization of graphene-cement composite indicated that
hydrated products in graphene cement composite were in abundance.
Thermogravimetric analysis revealed the higher hydration reaction degree and
percentage of calcium hydroxide in the graphene-cement composite. TGA results
further found that graphene plays its role in early stage hydration. FTIR spectra
Univers
ity of
Mala
ya

184
exhibited that, due to hydrated products, intensities peaks of various bands were
increased and shifting of these bands suggests the chemical interaction. XRD spectra
showed that more amount of calcium hydroxide was found by incorporating graphene
in cement composite. The FESEM images demonstrated that hydrated cement
products grow in an ordered way over the graphene flakes. Furthermore, graphene
flakes with more flake thickness (G3) restrained the growth of cracks, filled up the
pores at nanoscale and provide an obstacle in the continuity of cracks.
2. Rheological characteristics of the graphene cement paste samples were determined
from the flow curves using a variety of rheological models i.e. Bingham model,
Modified Bingham model, Herschel–Bulkley (HB) model and Casson model using
parallel plate geometry. Generally, Casson model estimated the lowest yield stress
values whereas, Modified Bingham models obtained the highest yield stress values.
Flake thickness have strong impact on yield stress values and G3 type cement paste
estimated the higher values of yield stress as compared to G1 and G2. Maximum yield
stress was recorded for G3M10 mix followed by G3M5 and G3M3 which was 182%,
136% and 85% respectively more as compared to M0 mix estimated by Herschel-
Bulkley model. Plastic viscosity values significantly increase with the addition of
graphene. Bingham model determined the maximum plastic viscosity values followed
by Modified Bingham model and Casson model. Approximately 50-107% increase in
the plastic viscosity values were observed. Maximum plastic viscosity value was
noted for G3M10 mix as compared to M0 mix. Power rate index values estimated by
HB model were less than 1 except for G3M10 mix. Bingham model determined the
lowest standard error and standard deviation values, whereas Casson model obtained
the highest values. Furthermore, effect of graphene/cement ratio, shear rate range,
superplasticizer, resting time and test geometries were investigated. For this purpose,
G1 based cement composites were selected as it estimated the lowest standard error
Univers
ity of
Mala
ya

185
values. Addition of graphene flakes results in the formation of flocculated suspension
in the paste, which mainly alters the flow properties of the paste. Yield stress values
increased by the addition of graphene, shear rate range and resting time, however,
decreased with the addition of superplasticizer. Normally, parallel plates determined
the higher values for the yield stress and plastic viscosities as compared to the
concentric cylinders. Plastic viscosity values were found more for Modified Bingham
model in both test geometries. Concentric cylinders estimated the lower values of
power rate index as compared to parallel plate. Generally, concentric cylinders
estimated the low standard error values for rheological models as compared to parallel
plates. Herschel-Bulkley and modified Bingham models were found to be the best-
fitted model with lowest standard error values for the concentric cylinders and parallel
plates respectively. Moreover, G2 type mortar mixes obtained the maximum values
in mechanical properties whereas, G3 type mixes possessed more ductile behaviour.
Flow diameter of G1M10 mix was reduced by 9.3%, load carrying capacity was
increased by 30% for G2M5 and G3M5 mixes and overall failure strain was increased
by 113% for G3M3 mix. Flexural strength of G2M10-M mix was obtained maximum
with 38 % increment. Graphene plays a significant role in early age hydration and
79% increment in compressive strength was recorded for G2M5-M specimen after 1-
day of casting. Lateral size and thickness of graphene flakes significantly contributes
to early age strength while, surface area of graphene flakes is prominent for both early
and later age strength.
3. Four-probe method was used to determine the piezo-resistive characteristics of the
graphene based cement composites specimen. At maximum compressive load, the
electrical resistivity value of G1M3 specimen was reduced by 67.8%. The overall
reduction in electrical resistivity values at maximum compressive load was recorded
for G1, G2 and G3 mixes as 60%, 33% and 24% respectively in comparison to control
Univers
ity of
Mala
ya

186
sample. The surface area of graphene flakes has a substantial effect on piezoresistive
characteristics of composite specimens. Agglomeration of graphene flakes has an
adverse effect on the electrical properties of graphene cement composites.
Piezoresistive properties depend on the surface area and uniform dispersion of
graphene flakes whereas, thickness and lateral size of graphene flakes have very
minute effect. Fractional change in resistance is the key factor for investigating the
self-sensing characteristics instead of electrical resistance. Furthermore, maximum
FCR values were observed for G1M5 and G1M3 mixes at maximum normalized
compressive load as 2.72 and 2.44 times of control specimen respectively. G1M3
sample behaved in a better way to correlate the FCR and NCL values due to high
electrical transport characteristics. Moreover, G1M3 specimens estimated the FCR
values more accurately and precisely.
4. G1M3 specimen was selected for the practical application of graphene cement
composite specimen in concrete structures. Practical application of G1M3 specimen
was investigated on the reinforced concrete beam and concrete-filled steel tube beam.
It was found that fractional change in resistance values varied with the increase in the
applied flexural load on the reinforced concrete beam. A sudden drop in FCR values
of G1M3 specimen was noted at 22 kN load in RC beam, which is related to
generation and growth of tensile cracks. Afterwards, strain values were successfully
found in correlation with the G1M3 specimen and main reinforcement bar in RC
beam. Furthermore, reinforced concrete beam was subjected to various controlled
damage levels. Various damages were induced in graphene cement specimen to test
the damage sensing and damage memorization characteristics. Damage memorization
is better and realistic approach. Moreover, the graphene–cement composite specimen
successfully predicted the response against crack propagation at various damage
levels. At the end of every damage level and loading-unloading cycle, electrical
Univers
ity of
Mala
ya

187
resistivity values increased. These electrical resistivity values can be used to identify
the structural health of RC beam. Therefore, real-time and continuous monitoring is
not required in case of damage-memorization. Moreover, for better understanding and
simplicity of results electrical resistivity values may be recorded after 20% of
normalized loading. The development cost of the G1M3 specimen is very less and
have no potential hazardous characteristics.
Based on above findings, graphene cement composites provide an economical and
efficient solution for monitoring the structural health of the concrete members throughout
their lifespan.
5.3 Recommendations
Following are some of the recommendations on the basis of research findings.
1. Further research is recommended on dispersion of graphene flakes using various
chemical admixtures and techniques without effecting its chemical structure.
2. Construction materials consume earth natural resources and further studies are
required for development of ultra-super strong and smart material using advance
nanotechnology.
3. An in-depth investigation is recommended for regulating mechanism of graphene on
hydrated cement crystals at atomic level.
4. Research is further needed to investigate the response of graphene-cement smart
sensor subjected to cyclic, dynamic and seismic loadings.
5. Piezoresistive characteristics of graphene-cement smart sensor at elevated
temperature can further be investigated.
Univers
ity of
Mala
ya

188
6. Response of GC smart sensor on the existing infrastructure can be determined. For
this purpose, further work is required on the strong connection between the surfaces
of GC smart sensor and existing building.
Univers
ity of
Mala
ya

189
REFERENCES
Abrishami, M. E., & Zahabi, V. (2016). Reinforcing graphene oxide/cement composite with NH2 functionalizing group. Bulletin of Materials Science, 39(4), 1073-1078.
Afshari, A., Frazer, D., & Creese, R. (1996). Ultrasonic techniques for the bonding of rebar in concrete structures. Paper presented at the Structural Materials Technology—An NDT Conference, San Diego, USA.
Agrawal, S., Raghuveer, M. S., Ramprasad, R., & Ramanath, G. (2007). Multishell Carrier Transport in Multiwalled Carbon Nanotubes. Nanotechnology, IEEE Transactions on, 6(6), 722-726. doi: 10.1109/TNANO.2007.907798
Alarcon, R. L., Platret, G., Massieu, E., & Ehrlacher, A. (2005). The use of thermal analysis in assessing the effect of temperature on a cement paste. Cement and Concrete Research, 35(3), 609-613.
Alkhateb, H., Alostaz, A., Cheng, A. H. D., & Li, X. (2013). Materials genome for graphene-cement nanocomposites. Journal of Nanomechanics and Micromechanics, 3(3), 67-77.
AlMuhit, B. A. (2015). Investigation on the Mechanical, Microstructural, and Electrical Properties of Graphene Oxide-Cement Composite. PhD Dissertation.
ASTM C 109. (1999). Standard Test Method for Compressive Strength of Hydraulic Cement Mortars (using 2-in. or [50-mm] Cube Specimens). ASTM International, West Conshohocken, PA, 2016,.
ASTM C 348. (2014). Standard Test Method for Flexural Strength of Hydraulic-Cement Mortars. ASTM International, West Conshohocken, PA, 2016,.
ASTM C 469. (2014). Standard test method for static modulus of elasticity and Poisson's ratio of concrete in compression. ASTM International, West Conshohocken, PA, 2016,.
ASTM C 1437. (2015). Standard Test Method for Flow of Hydraulic Cement Mortar. ASTM International, West Conshohocken, PA, 2016,.
Aunkor, M., Mahbubul, I., Saidur, R., & Metselaar, H. (2015). Deoxygenation of graphene oxide using household baking soda as a reducing agent: a green approach. RSC Advances, 5(86), 70461-70472.
Univers
ity of
Mala
ya

190
Balandin, A. A., Ghosh, S., Bao, W., Calizo, I., Teweldebrhan, D., Miao, F., & Lau, C. N. (2008). Superior thermal conductivity of single-layer graphene. Nano Letters, 8(3), 902-907.
Barcelo, L., Kline, J., Walenta, G., & Gartner, E. (2014). Cement and carbon emissions. Materials and Structures, 47(6), 1055-1065. doi: 10.1617/s11527-013-0114-5
Barnes, H. (2000). A handbook of elementary rheology, University of Wales Institute of Non-Newtonian Fluid Mechanics, Aberystwyth, First published 2000: ISBN 0-9538032-0-1.[75] AC Thomas, analyse du comportement des élastomères, Thèse de doctorat.
Barnes, H., & Walters, K. (1985). The yield stress myth? Rheologica Acta, 24(4), 323-326.
Bensted, J., & Varma, S. P. (1974). Some applications of infrared and Raman spectroscopy in cement chemistry. Part 3-hydration of Portland cement and its constituents. Cement Technology, 5(5), 440-445 448-450.
Bernal, S. A., Juenger, M. C. G., Ke, X., Matthes, W., Lothenbach, B., De Belie, N., & Provis, J. L. (2016). Characterization of supplementary cementitious materials by thermal analysis. Materials and Structures, 50(1), 26. doi: 10.1617/s11527-016-0909-2
Bessaies, B. H., Baumann, R., Schmitz, M., Radler, M., & Roussel, N. (2016). Organic admixtures and cement particles: Competitive adsorption and its macroscopic rheological consequences. Cement and Concrete Research, 80, 1-9.
Bingham, E. C. (1922). Fluidity and plasticity (Vol. 2): McGraw-Hill Book Compny, Incorporated.
Birchall, J., Howard, A., & Kendall, K. (1981). Flexural strength and porosity of cements.
Boehm, H., Clauss, A., Fischer, G., & Hofmann, U. (1962). Surface properties of extremely thin graphite lamellae. Paper presented at the Proceedings of the Fifth Conference on Carbon.
Bose, S., Kuila, T., Mishra, A. K., Kim, N. H., & Lee, J. H. (2012). Dual role of glycine as a chemical functionalizer and a reducing agent in the preparation of graphene: an environmentally friendly method. Journal of Materials Chemistry, 22(19), 9696-9703.
BS EN12350-2. (2009). Testing fresh concrete-Part 2: Slump test. British Standards Institution, London,16.
Univers
ity of
Mala
ya

191
BS EN 1015-10. (1999). Methods of test for mortar for masonry-Determination of dry bulk density of hardened mortar. British Standards Institution, London,16.
BS EN 5075-1. (1985). Concrete admixtures. Specification for accelerating admixtures, retarding admixtures and water reducing admixtures. British Standards Institution, London,16.
BS EN 5168-05. (2005). Glossary of rheological terms. British Standards Institution, London,16.
BS EN 12390-3. (2000). Testing Hardened Concrete: Compressive Strength of Test Specimens. British Standard Institution, London,16.
Cao, M. l., ZHan, H. x., & ZHan, C. (2016). Effect of graphene on mechanical properties of cement mortars. Journal of Central South University, 23(4), 919-925.
Casson, N. (1959). A flow equation for pigment-oil suspensions of the printing ink type: Pergamon press.
Chen, D., Li, L., & Guo, L. (2011). An environment-friendly preparation of reduced graphene oxide nanosheets via aminoacid. Nanotechnology, 22(32), 325601.
Chong, K. P., Carino, N. J., & Washer, G. (2003). Health monitoring of civil infrastructures. Smart Materials and Structures, 12(3), 483.
Chuah, S., Pan, Z., Sanjayan, J. G., Wang, C. M., & Duan, W. H. (2014). Nano reinforced cement and concrete composites and new perspective from graphene oxide. Construction and Building Materials, 73, 113-124. doi: http://dx.doi.org/10.1016/j.conbuildmat.2014.09.040
Chung, D. D. L. (2001). Comparison of submicron-diameter carbon filaments and conventional carbon fibers as fillers in composite materials. Carbon, 39(8), 1119-1125. doi: http://dx.doi.org/10.1016/S0008-6223(00)00314-6
Chung, D. D. L. (2002). Piezoresistive cement-based materials for strain sensing. Journal of Intelligent Material Systems and Structures, 13(9), 599-609.
Collins, F., Lambert, J., & Duan, W. H. (2012). The influences of admixtures on the dispersion, workability, and strength of carbon nanotube–OPC paste mixtures. Cement and Concrete Composites, 34(2), 201-207. doi: http://dx.doi.org/10.1016/j.cemconcomp.2011.09.013
Univers
ity of
Mala
ya

192
Cooper, D. R., D’Anjou, B., Ghattamaneni, N., Harack, B., Hilke, M., Horth, A., Majlis, N., Massicotte, M., Vandsburger, L., & Whiteway, E. (2012). Experimental review of graphene. ISRN Condensed Matter Physics, 2012.
Cui, H., Yan, X., Tang, L., & Xing, F. (2017). Possible pitfall in sample preparation for SEM analysis - A discussion of the paper “Fabrication of polycarboxylate/graphene oxide nanosheet composites by copolymerization for reinforcing and toughening cement composites” by Lv et al. Cement and Concrete Composites, 77(Supplement C), 81-85. doi: https://doi.org/10.1016/j.cemconcomp.2016.12.007
Cwirzen. (2010). Controlling physical properties of cementitious matrixes by nanomaterials. Paper presented at the Advanced Materials Research.
Cwirzen, Habermehl, C. K., Nasibulin, A. G., Kaupinen, E. I., Mudimela, P. R., & Penttala, V. (2009). SEM/AFM studies of cementitious binder modified by MWCNT and nano-sized Fe needles. Materials Characterization, 60(7), 735-740.
Dai, P. S., Gao, H. J., Xu, C., Quek, S. T., & Du, H. (2014). Strain and damage self-sensing cement composites with conductive graphene nanoplatelet. Paper presented at the SPIE Smart Structures and Materials + Nondestructive Evaluation and Health Monitoring.
Dawood, E. T., & Ramli, M. (2011). High strength characteristics of cement mortar reinforced with hybrid fibres. Construction and Building Materials, 25(5), 2240-2247. doi: http://dx.doi.org/10.1016/j.conbuildmat.2010.11.008
Deroeck, G., Peeters, B., & Maeck, J. (2000). Dynamic monitoring of civil engineering structures. Proceedings of IASS-IACM 2000, Computational Methods for Shell and Spatial Structures, Chania, Greece.
Devasena, M., & Karthikeyan, J. (2015). Investigation on strength properties of graphene oxide concrete. International Journal of Engineering Science Invention Research & Development, 1(8).
Du, H., Quek, S. T., & Dai Pang, S. (2013). Smart multifunctional cement mortar containing graphite nanoplatelet. Paper presented at the SPIE Smart Structures and Materials.
Elsener, B., Andrade, C., Gulikers, J., Polder, R., & Raupach, M. (2003). Half-cell potential measurements—Potential mapping on reinforced concrete structures. Materials and Structures, 36(7), 461-471.
Univers
ity of
Mala
ya

193
Ferrari, A. C., Meyer, J. C., Scardaci, V., Casiraghi, C., Lazzeri, M., Mauri, F., Piscanec, S., Jiang, D., Novoselov, K. S., Roth, S., & Geim, A. K. (2006). Raman Spectrum of Graphene and Graphene Layers. Physical Review Letters, 97(18), 187401.
Ferraris, C. F. (1999). Measurement of the rheological properties of cement paste: a new approach. Paper presented at the Int. RILEM Conf.“The role of admixtures in high performance concrete.
Feys, D., Verhoeven, R., & De Schutter, G. (2007). Evaluation of time independent rheological models applicable to fresh self-compacting concrete. Applied Rheology, 17(5), 56244-57190.
Feys, D., Wallevik, J. E., Yahia, A., Khayat, K. H., & Wallevik, O. H. (2013). Extension of the Reiner–Riwlin equation to determine modified Bingham parameters measured in coaxial cylinders rheometers. Materials and Structures, 46(1-2), 289-311.
Flatt, R. J., & Houst, Y. F. (2001). A simplified view on chemical effects perturbing the action of superplasticizers. Cement and Concrete Research, 31(8), 1169-1176. doi: http://dx.doi.org/10.1016/S0008-8846(01)00534-8
Garboczi, E. J., & Bentz, D. P. (1997). Analytical formulas for interfacial transition zone properties. Advanced Cement Based Materials, 6(3-4), 99-108.
Geim, A. K., & Novoselov, K. S. (2007). The rise of graphene. Nature Materials, 6(3), 183-191.
Geng, Y., Wang, S. J., & Kim.-K. (2009). Preparation of graphite nanoplatelets and graphene sheets. Journal of Colloid and Interface Science, 336(2), 592-598.
Gong, K., Pan, Z., Korayem, A. H., Qiu, L., Li, D., Collins, F., Wang, C. M., & Duan, W. H. (2014). Reinforcing effects of graphene oxide on portland cement paste. Journal of Materials in Civil Engineering, 27(2), A4014010.
Gopalakrishnan, K., Birgisson, B., Taylor, P., & Attoh-Okine, N. O. (2011). Nanotechnology in civil infrastructure: Springer.
Govin, A., Bartholin, M.-C., Biasotti, B., Giudici, M., Langella, V., & Grosseau, P. (2016). Modification of water retention and rheological properties of fresh state cement-based mortars by guar gum derivatives. Construction and Building Materials, 122, 772-780.
Grobert (2007). Carbon nanotubes - becomng clean. Materialstoday, Volume. 10(1-2), 28-35.
Univers
ity of
Mala
ya

194
Gurunathan, S., Han, J., & Kim. H. (2013). Humanin: a novel functional molecule for the green synthesis of graphene. Colloids and Surfaces B: Biointerfaces, 111, 376-383.
Hamann, H., & Clemens, D. (1973). Suspension polymerization of uniform polymer beads: Google Patents.
Han., Guan, X., & Ou, J. (2007). Electrode design, measuring method and data acquisition system of carbon fiber cement paste piezoresistive sensors. Sensors and Actuators A: Physical, 135(2), 360-369. doi: https://doi.org/10.1016/j.sna.2006.08.003
Han., Sun, S., Ding, S., ZHan, L., Yu, X., & Ou, J. (2015). Review of nanocarbon-engineered multifunctional cementitious composites. Composites Part A: Applied Science and Manufacturing, 70, 69-81.
Han., Zheng, Q., Sun, S., Dong, S., ZHan, L., Yu, X., & Ou, J. (2017). Enhancing mechanisms of multi-layer graphenes to cementitious composites. Composites Part A: Applied Science and Manufacturing.
Han. G., Han. Z., & Ou, J. P. (2009). Experimental study on use of nickel powder-filled Portland cement-based composite for fabrication of piezoresistive sensors with high sensitivity. Sensors and Actuators A: Physical, 149(1), 51-55. doi: https://doi.org/10.1016/j.sna.2008.10.001
Hanehara, S., & Yamada, K. (1999). Interaction between cement and chemical admixture from the point of cement hydration, absorption behaviour of admixture, and paste rheology. Cement and Concrete Research, 29(8), 1159-1165. doi: http://dx.doi.org/10.1016/S0008-8846(99)00004-6
Hemphill, T., Campos, W., & Pilehvari, A. (1993). Yield-power law model more accurately predicts mud rheology. Oil and Gas Journal;(United States), 91(34).
Herschel, W., & Bulkley, R. (1926). Measurement of consistency as applied to rubber-benzene solutions. Paper presented at the Am. Soc. Test Proc.
Hevin, G., Abraham, O., Pedersen, H., & Campillo, M. (1998). Characterization of surface cracks with Rayleigh waves: a numerical model. NDT & E International, 31(4), 289-297.
Horgnies, M., Chen, J., & Bouillon, C. (2013). Overview about the use of Fourier Transform Infrared spectroscopy to study cementitious materials. WIT Transactions on Engineering Sciences, 77, 251-262.
Univers
ity of
Mala
ya

195
Hung, S. S., Farshidi, F., Jones, D., & Harvey, J. T. (2015). Comparison of Concentric Cylinder and Parallel Plate Geometries for Asphalt Binder Testing with a Dynamic Shear Rheometer. Transportation Research Record: Journal of the Transportation Research Board(2505), 108-114.
Jadhav, R., & Debnath, N. (2011). Computation of X-ray powder diffractograms of cement components and its application to phase analysis and hydration performance of OPC cement. Bulletin of Materials Science, 34(5), 1137-1150.
Jäger, C., Henning, T., Schlögl, R., & Spillecke, O. (1999). Spectral properties of carbon black. Journal of Non-Crystalline Solids, 258(1), 161-179.
Jiang, L., Gao, L., & Sun, J. (2003). Production of aqueous colloidal dispersions of carbon nanotubes. Journal of colloid and interface science, 260(1), 89-94. doi: http://dx.doi.org/10.1016/S0021-9797(02)00176-5
Jo, B. W., Kim, C. H., Tae, G.-h., & Park, J.-B. (2007). Characteristics of cement mortar with nano-SiO2 particles. Construction and Building Materials, 21(6), 1351-1355.
Juárez, C., Valdez, P., Durán, A., & Sobolev, K. (2007). The diagonal tension behavior of fiber reinforced concrete beams. Cement and Concrete Composites, 29(5), 402-408. doi: http://dx.doi.org/10.1016/j.cemconcomp.2006.12.009
Kakali, G., Tsivilis, S., Aggeli, E., & Bati, M. (2000). Hydration products of C3A, C3S and Portland cement in the presence of CaCO3. Cement and Concrete Research, 30(7), 1073-1077.
Karim, M. R., Hashim, H., & Abdul Razak, H. (2016). Thermal activation effect on palm oil clinker properties and their influence on strength development in cement mortar. Construction and Building Materials, 125, 670-678. doi: http://dx.doi.org/10.1016/j.conbuildmat.2016.08.092
Katsnelson, M. I., Guinea, F., & Geim, A. K. (2009). Scattering of electrons in graphene by clusters of impurities. Physical Review B, 79(19), 195426.
Kawashima, S., Hou, P., Corr, D. J., & Shah, S. P. (2013). Modification of cement-based materials with nanoparticles. Cement and Concrete Composites, 36, 8-15. doi: http://dx.doi.org/10.1016/j.cemconcomp.2012.06.012
Khai, T. V., Kwak, D. S., Kwon, Y. J., Cho, H. Y., Huan, T. N., Chung, H., Ham, H., Lee, C., Dan, N. V., & Tung, N. T. (2013). Direct production of highly conductive graphene with a low oxygen content by a microwave-assisted solvothermal method. Chemical Engineering Journal, 232, 346-355.
Univers
ity of
Mala
ya

196
Khanra, P., Kuila, T., Kim, N. H., Bae, S. H., Yu, D. S., & Lee, J. H. (2012). Simultaneous bio-functionalization and reduction of graphene oxide by baker's yeast. Chemical Engineering Journal, 183, 526-533.
Khoury, G. A. (1992). Compressive strength of concrete at high temperatures: a reassessment. Magazine of Concrete Research, 44(161), 291-309.
Kim., Miura, Y., & Macosko, C. W. (2010). Graphene/Polyurethane Nanocomposites for Improved Gas Barrier and Electrical Conductivity. Chemistry of Materials, 22(11), 3441-3450. doi: 10.1021/cm100477v
Kim., Cote, L. J., Kim, F., Yuan, W., Shull, K. R., & Huang, J. (2010). Graphene Oxide Sheets at Interfaces. Journal of the American Chemical Society, 132(23), 8180-8186. doi: 10.1021/ja102777p
Kodur, V. K. R., & Sultan, M. A. (2003). Effect of temperature on thermal properties of high-strength concrete. Journal of Materials in Civil Engineering, 15(2), 101-107.
Konsta, G. M. S., Metaxa, Z. S., & Shah, S. P. (2010). Highly dispersed carbon nanotube reinforced cement based materials. Cement and Concrete Research, 40(7), 1052-1059.
Konsta, G. M. S., Metaxa, Z. S., & Shah, S. P. (2010). Multi-scale mechanical and fracture characteristics and early-age strain capacity of high performance carbon nanotube/cement nanocomposites. Cement and Concrete Composites, 32(2), 110-115.
Kothiyal, N. C., Sharma, S., Mahajan, S., & Sethi, S. (2016). Characterization of reactive graphene oxide synthesized from ball–milled graphite: its enhanced reinforcing effects on cement nanocomposites. Journal of adhesion science and Technology, 30(9), 915-933.
Kowald, T., & Trettin, R. (2004). Influence of surface-modified carbon nanotubes on ultrahigh performance concrete. Paper presented at the Proceedings of International Symposium on Ultra High Performance Concrete.
Krause, M., Milmann, B., Mielentz, F., Streicher, D., Redmer, B., Mayer, K., Langenberg, K.-J., & Schickert, M. (2008). Ultrasonic imaging methods for investigation of post-tensioned concrete structures: a study of interfaces at artificial grouting faults and its verification. Journal of Nondestructive Evaluation, 27(1-3), 67-82.
Kuilla, T., Bhadra, S., Yao, D., Kim, N. H., Bose, S., & Lee, J. H. (2010). Recent advances in graphene based polymer composites. Progress in Polymer Science, 35(11), 1350-1375.
Univers
ity of
Mala
ya

197
Le, J. L., Du, H., & Dai Pang, S. (2014). Use of 2D Graphene Nanoplatelets (GNP) in cement composites for structural health evaluation. Composites Part B: Engineering, 67, 555-563.
Lee, C., Wei, X., Kysar, J. W., & Hone, J. (2008). Measurement of the elastic properties and intrinsic strength of monolayer graphene. Science, 321(5887), 385-388.
Lee, C., Wei, X., Li, Q., Carpick, R., Kysar, J. W., & Hone, J. (2009). Elastic and frictional properties of graphene. Physica Status Solidi (b), 246(11‐12), 2562-2567.
Lei, Y., Tang, Z., Liao, R., & Guo, B. (2011). Hydrolysable tannin as environmentally friendly reducer and stabilizer for graphene oxide. Green Chemistry, 13(7), 1655-1658.
Leng, Y. (2009). Materials characterization: introduction to microscopic and spectroscopic methods: John Wiley & Sons.
Li, G. Y., Wang, P. M., & Zhao, X. (2005). Mechanical behavior and microstructure of cement composites incorporating surface-treated multi-walled carbon nanotubes. Carbon, 43(6), 1239-1245. doi: https://doi.org/10.1016/j.carbon.2004.12.017
Li, G. Y., Wang, P. M., & Zhao, X. (2007). Pressure-sensitive properties and microstructure of carbon nanotube reinforced cement composites. Cement and Concrete Composites, 29(5), 377-382. doi: https://doi.org/10.1016/j.cemconcomp.2006.12.011
Li., Xiao, H.-g., & Ou, J.-p. (2004a). A study on mechanical and pressure-sensitive properties of cement mortar with nanophase materials. Cement and Concrete Research, 34(3), 435-438. doi: http://dx.doi.org/10.1016/j.cemconres.2003.08.025
Li., Xiao, H.-g., & Ou, J.-p. (2006a). Effect of compressive strain on electrical resistivity of carbon black-filled cement-based composites. Cement and Concrete Composites, 28(9), 824-828.
Li., Xiao, H.-g., Yuan, J., & Ou, J. (2004b). Microstructure of cement mortar with nano-particles. Composites Part B: Engineering, 35(2), 185-189. doi: http://dx.doi.org/10.1016/S1359-8368(03)00052-0
Li., ZHan, M. h., & Ou, J. p. (2006b). Abrasion resistance of concrete containing nano-particles for pavement. Wear, 260(11–12), 1262-1266.
Univers
ity of
Mala
ya

198
Li., Sham, M. L., Kim. K., & Marom, G. (2007). Morphology and properties of UV/ozone treated graphite nanoplatelet/epoxy nanocomposites. Composites Science and Technology, 67(2), 296-305.
Li., Xiao, G., Chen, C., Li, R., & Yan, D. (2013). Superior dispersions of reduced graphene oxide synthesized by using gallic acid as a reductant and stabilizer. Journal of Materials Chemistry A, 1(4), 1481-1487.
Li, P., Yao, H., Wong, M., Sugiyama, H., ZHan, X., & Sue, H. J. (2014). Thermally stable and highly conductive free-standing hybrid films based on reduced graphene oxide. Journal of Materials Science, 49(1), 380-391.
Li., Li, X., Chen, S. J., Liu, Y. M., Duan, W. H., & Shah, S. P. (2017). Effects of graphene oxide on early-age hydration and electrical resistivity of Portland cement paste. Construction and Building Materials, 136, 506-514.
Li, Z., Wang, H., He, S., Lu, Y., & Wang. (2006). Investigations on the preparation and mechanical properties of the nano-alumina reinforced cement composite. Materials Letters, 60(3), 356-359. doi: http://dx.doi.org/10.1016/j.matlet.2005.08.061
Lin, J., Teweldebrhan, D., Ashraf, K., Liu, G., Jing, X., Yan, Z., Li, R., Ozkan, M., Lake, R. K., & Balandin, A. A. (2010). Gating of Single‐Layer Graphene with Single‐
Stranded Deoxyribonucleic Acids. Small, 6(10), 1150-1155.
Liu, C. X., & Choi, J. W. (2012). Improved dispersion of carbon nanotubes in polymers at high concentrations. Nanomaterials, 2(4), 329-347.
Liu., & Horrocks, A. R. (2002). Effect of carbon black on UV stability of LLDPE films under artificial weathering conditions. Polymer Degradation and Stability, 75(3), 485-499.
Liu., Tian, J., Wang, L., & Sun. (2011). A method for the production of reduced graphene oxide using benzylamine as a reducing and stabilizing agent and its subsequent decoration with Ag nanoparticles for enzymeless hydrogen peroxide detection. Carbon, 49(10), 3158-3164.
Lothenbach, B., Scrivener, K., & Hooton, R. D. (2011). Supplementary cementitious materials. Cement and Concrete Research, 41(12), 1244-1256. doi: http://dx.doi.org/10.1016/j.cemconres.2010.12.001
Lu., Do, I., Fukushima, H., Lee, I., & Drzal, L. T. (2010). Stable aqueous suspension and self-assembly of graphite nanoplatelets coated with various polyelectrolytes. Journal of Nanomaterials, 2010, 2.
Univers
ity of
Mala
ya
199
Lu., Hou, D., Meng, L., Sun, G., Lu, C., & Li, Z. (2015). Mechanism of cement paste reinforced by graphene oxide/carbon nanotubes composites with enhanced mechanical properties. RSC Advances, 5(122), 100598-100605.
Lv, S., Deng, L., Yang, W., Zhou., & Cui, Y. (2016). Fabrication of polycarboxylate/graphene oxide nanosheet composites by copolymerization for reinforcing and toughening cement composites. Cement and Concrete Composites, 66, 1-9.
Lv, S., Liu, J., Sun, T., Ma, Y., & Zhou. (2014a). Effect of GO nanosheets on shapes of cement hydration crystals and their formation process. Construction and Building Materials, 64, 231-239.
Lv, S., Ma, Y., Qiu, C., Sun, T., Liu, J., & Zhou. (2013a). Effect of graphene oxide nanosheets of microstructure and mechanical properties of cement composites. Construction and Building Materials, 49, 121-127.
Lv, S., Ma, Y., Qiu, C., & Zhou. (2013b). Regulation of GO on cement hydration crystals and its toughening effect. Magazine of Concrete Research, 65(20), 1246-1254.
Lv, S., Ting, S., Liu, J., & Zhou. (2014b). Use of graphene oxide nanosheets to regulate the microstructure of hardened cement paste to increase its strength and toughness. CrystEngComm, 16(36), 8508-8516.
Ma, P. C., Siddiqui, N. A., Marom, G., & Kim. K. (2010). Dispersion and functionalization of carbon nanotubes for polymer-based nanocomposites: A review. Composites Part A: Applied Science and Manufacturing, 41(10), 1345-1367.
Mak, K. F., Lee, C., Hone, J., Shan, J., & Heinz, T. F. (2010). Atomically thin MoS 2: a new direct-gap semiconductor. Physical Review Letters, 105(13), 136805.
Materazzi, A. L., Ubertini, F., & D’Alessandro, A. (2013). Carbon nanotube cement-based transducers for dynamic sensing of strain. Cement and Concrete Composites, 37, 2-11.
Mehrali, M., Sadeghinezhad, E., Latibari, S. T., Kazi, S. N., Mehrali, M., Zubir, M. N. B. M., & Metselaar, H. S. C. (2014). Investigation of thermal conductivity and rheological properties of nanofluids containing graphene nanoplatelets. Nanoscale Research Letters, 9(1), 15.
Mei, X., & Ouyang, J. (2011). Ultrasonication-assisted ultrafast reduction of graphene oxide by zinc powder at room temperature. Carbon, 49(15), 5389-5397.
Univers
ity of
Mala
ya

200
Metaxa, Z. S. (2016). Exfoliated graphene nanoplatelet cement-based nanocomposites as piezoresistive sensors: Influence of nanoreinforcement lateral size on monitoring capability. Ciência & Tecnologia dos Materiais, 28(1), 73-79.
Midgley, H. G. (1978). The use of thermal analysis methods in assessing the quality of high alumina cement concrete. Journal of Thermal Analysis, 13(3), 515-524.
Mitsoulis, E. (2007). Flows of viscoplastic materials: models and computations. Rheology Reviews, 2007, 135-178.
Mohammed, A., Sanjayan, J., Duan, W., & Nazari, A. (2016). Graphene Oxide Impact on Hardened Cement Expressed in Enhanced Freeze–Thaw Resistance. Journal of Materials in Civil Engineering, 28(9), 04016072.
Mokhtar, M. M., Abo, E., S A, Hassaan, M. Y., Morsy, M. S., & Khalil, M. H. (2017). Mechanical performance, pore structure and micro-structural characteristics of graphene oxide nano platelets reinforced cement. Construction and Building Materials, 138, 333-339.
Mollah, M. Y. A., Yu, W., Schennach, R., & Cocke, D. L. (2000). A Fourier transform infrared spectroscopic investigation of the early hydration of Portland cement and the influence of sodium lignosulfonate. Cement and Concrete Research, 30(2), 267-273. doi: https://doi.org/10.1016/S0008-8846(99)00243-4
MS-522: Part 1. (2003). Specification for Portland cement (ordinary and rapid hardening). Part 1: Standard specification (second revision). Department of Standards Malaysia (SIRIM); Malaysia: .
Munz, M., Giusca, C. E., Myers, W., Rachael L, Gaskill, D. K., & Kazakova, O. (2015). Thickness-dependent hydrophobicity of epitaxial graphene. Acs Nano, 9(8), 8401-8411.
Murugan, M., Santhanam, M., Gupta, S. S., Pradeep, T., & Shah, S. P. (2016). Influence of 2D rGO nanosheets on the properties of OPC paste. Cement and Concrete Composites, 70, 48-59.
Naeimi, H., & Golestanzadeh, M. (2015). Microwave-assisted synthesis of 6, 6′-(aryl (alkyl) methylene) bis (2, 4-dialkylphenol) antioxidants catalyzed by multi-sulfonated reduced graphene oxide nanosheets in water. New Journal of Chemistry, 39(4), 2697-2710.
Nehdi, M., & Rahman, M. A. (2004). Estimating rheological properties of cement pastes using various rheological models for different test geometry, gap and surface friction. Cement and Concrete Research, 34(11), 1993-2007. doi: http://dx.doi.org/10.1016/j.cemconres.2004.02.020
Univers
ity of
Mala
ya

201
Neville, A. M., & Brooks, J. J. (1987). Concrete technology.
Nonnet, E., Lequeux, N., & Boch, P. (1999). Elastic properties of high alumina cement castables from room temperature to 1600 C. Journal of the European Ceramic Society, 19(8), 1575-1583.
Novoselov, K., Fal, V., Colombo, L., Gellert, P., Schwab, M., & Kim, K. (2012). A roadmap for graphene. Nature, 490(7419), 192-200.
Novoselov, K., Geim, A. K., Morozov, S. V., Jiang, D., ZHan, Y., Dubonos, S. V., Grigorieva, I. V., & Firsov, A. A. (2004). Electric field effect in atomically thin carbon films. Science, 306(5696), 666-669.
Ormsby, R., McNally, T., Mitchell, C., Halley, P., Martin, D., Nicholson, T., & Dunne, N. (2011). Effect of MWCNT addition on the thermal and rheological properties of polymethyl methacrylate bone cement. Carbon, 49(9), 2893-2904. doi: http://dx.doi.org/10.1016/j.carbon.2011.02.063
Ortego, J. D., Jackson, S., Yu, G. S., McWhinney, H., & Cocke, D. L. (1989). Solidification of hazardous substances‐a TGA and FTIR study of Portland cement containing metal nitrates. Journal of Environmental Science & Health Part A, 24(6), 589-602.
Pan, Z., He, L., Qiu, L., Korayem, A. H., Li, G., Zhu, J. W., Collins, F., Li, D., Duan, W. H., & Wang. C. (2015). Mechanical properties and microstructure of a graphene oxide–cement composite. Cement and Concrete Composites, 58, 140-147. doi: http://dx.doi.org/10.1016/j.cemconcomp.2015.02.001
Papo, A. (1988). Rheological models for cement pastes. Materials and Structures, 21(1), 41-46.
Peng, H., Meng, L., Niu, L., & Lu, Q. (2012). Simultaneous reduction and surface functionalization of graphene oxide by natural cellulose with the assistance of the ionic liquid. The Journal of Physical Chemistry C, 116(30), 16294-16299.
Peyvandi, A., Soroushian, P., Abdol, N., & Balachandra, A. M. (2013). Surface-modified graphite nanomaterials for improved reinforcement efficiency in cementitious paste. Carbon, 63, 175-186.
Pham, V. H., Pham, H. D., Dang, T. T., Hur, S. H., Kim, E. J., Kong, B. S., Kim, S., & Chung, J. S. (2012). Chemical reduction of an aqueous suspension of graphene oxide by nascent hydrogen. Journal of Materials Chemistry, 22(21), 10530-10536.
Univers
ity of
Mala
ya

202
Qian, Y., Abdallah, M. Y., & Kawashima, S. (2015). Characterization of Cement-Based Materials Modified with Graphene-Oxide Nanotechnology in Construction (pp. 259-264): Springer.
Qu, J., & Han. (2008). Piezoresistive cement-based strain sensors and self-sensing concrete components. Journal of Intelligent Material Systems and Structures.
Rafiee, M. A., Lu, W., Thomas, A. V., Zandiatashbar, A., Rafiee, J., Tour, J. M., & Koratkar, N. A. (2010). Graphene nanoribbon composites. Acs Nano, 4(12), 7415-7420.
Raki, L., Beaudoin, J., Alizadeh, R., Makar, J., & Sato, T. (2010). Cement and concrete nanoscience and nanotechnology. Materials, 3, 918-942.
Ramanathan, T., Abdala, A. A., StankovichS, Dikin, D. A., Herrera Alonso, M., Piner, R. D., Adamson, D. H., Schniepp, H. C., ChenX, Ruoff, R. S., Nguyen, S. T., Aksay, I. A., Prud'Homme, R. K., & Brinson, L. C. (2008). Functionalized graphene sheets for polymer nanocomposites. Nat Nano, 3(6), 327-331. doi: http://www.nature.com/nnano/journal/v3/n6/suppinfo/nnano.2008.96_S1.html
Rao, M. A. (2014). Flow and functional models for rheological properties of fluid foods Rheology of Fluid, Semisolid, and Solid Foods (pp. 27-61): Springer.
Rhee, I., Kim, Y. A., Shin, G. O., Kim. H., & Muramatsu, H. (2015). Compressive strength sensitivity of cement mortar using rice husk-derived graphene with a high specific surface area. Construction and Building Materials, 96, 189-197.
Rhee, I., Lee, J. S., Kim, Y. A., Kim. H., & Kim. H. (2016). Electrically conductive cement mortar: Incorporating rice husk-derived high-surface-area graphene. Construction and Building Materials, 125, 632-642.
Richardson, I. G., & Groves, G. W. (1997). The structure of the calcium silicate hydrate phases present in hardened pastes of white Portland cement/blast-furnace slag blends. Journal of Materials Science, 32(18), 4793-4802.
Roussel, N. (2006). A thixotropy model for fresh fluid concretes: Theory, validation and applications. Cement and Concrete Research, 36(10), 1797-1806. doi: http://dx.doi.org/10.1016/j.cemconres.2006.05.025
Roussel, N., Ovarlez, G., Garrault, S., & Brumaud, C. (2012). The origins of thixotropy of fresh cement pastes. Cement and Concrete Research, 42(1), 148-157.
Saak, A. W., Jennings, H. M., & Shah, S. P. (1999). Characterization of the rheological properties of cement paste for use in self-compacting concrete. Paper presented
Univers
ity of
Mala
ya

203
at the Proceeding of the First International RILEM Symposium on “Self-Compacting Concrete”, Eds. A. Skarendahl & O. Petersson, Stockholm, Sweden.
Sanchez, F., & Sobolev, K. (2010). Nanotechnology in concrete – A review. Construction and Building Materials, 24(11), 2060-2071. doi: http://dx.doi.org/10.1016/j.conbuildmat.2010.03.014
Scott, B. G. W. (1966). The success of Casson's equation. Rheologica Acta, 5(3), 184-187.
Sedaghat, A., Ram, Manoj K ,Zayed, A, Kamal, Rajeev, Shanahan, Natallia. (2014). Investigation of physical properties of graphene-cement composite for structural applications. Open Journal of Composite Materials, 2014.
Segal, M. (2009). Selling graphene by the ton. Nat Nano, 4(10), 612-614.
Senff, L., Labrincha, J. A., Ferreira, V. M., Hotza, D., & Repette, W. L. (2009). Effect of nano-silica on rheology and fresh properties of cement pastes and mortars. Construction and Building Materials, 23(7), 2487-2491. doi: http://dx.doi.org/10.1016/j.conbuildmat.2009.02.005
Shah, M. S., Fard, F. G., Khatibi, E., & Sarpoolaky, H. (2009). Dispersion and stability of carbon black nanoparticles, studied by ultraviolet–visible spectroscopy. Journal of the Taiwan Institute of chemical Engineers, 40(5), 524-527.
Shah, S. P., & Ouyang, C. (1991). Mechanical Behavior of Fiber‐Reinforced Cement‐
Based Composites. Journal of the American Ceramic Society, 74(11), 2727-2953.
SHan, Y., ZHan, D., Yang, C., Liu, Y., & Liu, Y. (2015). Effect of graphene oxide on the rheological properties of cement pastes. Construction and Building Materials, 96, 20-28. doi: http://dx.doi.org/10.1016/j.conbuildmat.2015.07.181
Sharma, S., & Kothiyal, N. C. (2015). Influence of graphene oxide as dispersed phase in cement mortar matrix in defining the crystal patterns of cement hydrates and its effect on mechanical, microstructural and crystallization properties. RSC Advances, 5(65), 52642-52657.
Sharma, S., & Kothiyal, N. C. (2016). Comparative effects of pristine and ball-milled graphene oxide on physico-chemical characteristics of cement mortar nanocomposites. Construction and Building Materials, 115, 256-268.
Shaughnessy, R., & Clark, P. E. (1988). The rheological behavior of fresh cement pastes. Cement and Concrete Research, 18(3), 327-341.
Univers
ity of
Mala
ya

204
Shi, C., & Qian, J. (2000). High performance cementing materials from industrial slags — a review. Resources, Conservation and Recycling, 29(3), 195-207. doi: http://dx.doi.org/10.1016/S0921-3449(99)00060-9
Silva, R. A., de Castro Guetti, P., da Luz, M. S., Rouxinol, F., & Gelamo, R. V. (2017). Enhanced properties of cement mortars with multilayer graphene nanoparticles. Construction and Building Materials, 149, 378-385.
Sixuan, H. (2012). Multifunctional Graphite Nanoplatelets (GNP) Reinforced Cementitious Composites (Doctoral dissertation).
Smith, B. C. (2011). Fundamentals of Fourier transform infrared spectroscopy: CRC press.
Stankovich, S., Piner, R. D., Chen, X., Wu, N., Nguyen, S. T., & Ruoff, R. S. (2006). Stable aqueous dispersions of graphitic nanoplatelets via the reduction of exfoliated graphite oxide in the presence of poly (sodium 4-styrenesulfonate). Journal of Materials Chemistry, 16(2), 155-158.
Sun, S., Yu, X., Han., & Ou, J. (2013). In situ growth of carbon nanotubes/carbon nanofibers on cement/mineral admixture particles: A review. Construction and Building Materials, 49, 835-840. doi: http://dx.doi.org/10.1016/j.conbuildmat.2013.09.011
Sun., Wu, Q., ZHan., Qing, Y., Wu, Y., & Lee, S. (2017). Rheology, curing temperature and mechanical performance of oil well cement: Combined effect of cellulose nanofibers and graphene nano-platelets. Materials & Design, 114, 92-101.
Taffe, A., & Wiggenhauser, H. (2006). Validation for thickness measurement in civil engineering with ultrasonic echo. Paper presented at the Proceedings of the 9th European Conference on NDT.
Thakur, S., & Karak, N. (2012). Green reduction of graphene oxide by aqueous phytoextracts. Carbon, 50(14), 5331-5339.
Tong, T., Fan, Z., Liu, Q., Wang, S., Tan, S., & Yu, Q. (2016). Investigation of the effects of graphene and graphene oxide nanoplatelets on the micro-and macro-properties of cementitious materials. Construction and Building Materials, 106, 102-114.
Topçu, İ. B., & Canbaz, M. (2007). Effect of different fibers on the mechanical properties of concrete containing fly ash. Construction and Building Materials, 21(7), 1486-1491. doi: http://dx.doi.org/10.1016/j.conbuildmat.2006.06.026
Univers
ity of
Mala
ya

205
Tran, D. N., Kabiri, S., & Losic, D. (2014). A green approach for the reduction of graphene oxide nanosheets using non-aromatic amino acids. Carbon.
Trezza, M. A. (2007). Hydration study of ordinary portland cement in the presence of zinc ions. Materials Research, 10, 331-334.
Tyson, B. M. (2010). Carbon nanotube and nanofiber reinforcement for improving the flexural strength and fracture toughness of Portland cement paste. Texas A&M University.
Ubertini, F., Laflamme, S., Ceylan, H., Materazzi, A. L., Cerni, G., Saleem, H., D’Alessandro, A., & Corradini, A. (2014). Novel nanocomposite technologies for dynamic monitoring of structures: a comparison between cement-based embeddable and soft elastomeric surface sensors. Smart Materials and Structures, 23(4), 045023.
Valdes, L. B. (1954). Resistivity measurements on germanium for transistors. Proceedings of the IRE, 42(2), 420-427.
Vasudevan, A. K., Sadananda, K., & Glinka, G. (2001). Critical parameters for fatigue damage. International Journal of Fatigue, 23, 39-53.
Vikan, H., Justnes, H., Winnefeld, F., & Figi, R. (2007). Correlating cement characteristics with rheology of paste. Cement and Concrete Research, 37(11), 1502-1511.
Wallevik, J. E. (2009). Rheological properties of cement paste: thixotropic behavior and structural breakdown. Cement and Concrete Research, 39(1), 14-29.
Wang., Jiang, R., & Wu, Z. (2016). Investigation of the mechanical properties and microstructure of graphene nanoplatelet-cement composite. Nanomaterials, 6(11), 200.
Wang, J. Y., Banthia, N., & ZHan, M. H. (2012). Effect of shrinkage reducing admixture on flexural behaviors of fiber reinforced cementitious composites. Cement and Concrete Composites, 34(4), 443-450.
Wang., Wang, R., Yao, H., Farhan, S., Zheng, S., & Du, C. (2016). Study on the three dimensional mechanism of graphene oxide nanosheets modified cement. Construction and Building Materials, 126, 730-739.
Wang., Cui, X., Wang, J., Li, S., Lv, C., & Dong, Y. (2017). Effect of fly ash on rheological properties of graphene oxide cement paste. Construction and Building Materials, 138, 35-44.
Univers
ity of
Mala
ya

206
Wang., Wang, J., Lu, C. X., Liu, B. W., ZHan, K., & Li, C. Z. (2015). Influence of graphene oxide additions on the microstructure and mechanical strength of cement. New Carbon Materials, 30(4), 349-356.
Wang., Wang, J., Lv, C. X., Cui, X. Y., Li, S. Y., & Wang, X. (2016). Rheological behavior of fresh cement pastes with a graphene oxide additive. New Carbon Materials, 31(6), 574-584.
Wang., Shi, Z., & Yin, J. (2011). Facile synthesis of soluble graphene via a green reduction of graphene oxide in tea solution and its biocomposites. ACS Applied Materials & Interfaces, 3(4), 1127-1133.
Wilson, N. R., Pandey, P. A., Beanland, R., Young, R. J., Kinloch, I. A., Gong, L., Liu, Z., Suenaga, K., Rourke, J. P., & York, S. J. (2009). Graphene oxide: structural analysis and application as a highly transparent support for electron microscopy. Acs Nano, 3(9), 2547-2556.
Wotring, E. (2014). Dispersion of graphene nanoplatelets in water with surfactant and reinforcement of mortar with graphene nanoplatelets. University of Illinois at Urbana-Champaign.
Xu, L. Q., Yang, W. J., Neoh, K. G., Kang, E. T., & Fu, G. D. (2010). Dopamine-induced reduction and functionalization of graphene oxide nanosheets. Macromolecules, 43(20), 8336-8339.
Xu., Lo, Y. T., Ouyang, D., Memon, S. A., Xing, F., Wang, W., & Yuan, X. (2015). Corrigendum to ‘‘Effect of rice husk ash fineness on porosity and hydration reaction of blended cement’’[Constr. Build. Mater. 89 (2015) 90–101]. Construction and Building Materials, 93, 1249.
Yahia, A., & Khayat, K. (2001). Analytical models for estimating yield stress of high-performance pseudoplastic grout. Cement and Concrete Research, 31(5), 731-738. doi: https://doi.org/10.1016/S0008-8846(01)00476-8
Yahia, A., & Khayat, K. (2003). Applicability of rheological models to high-performance grouts containing supplementary cementitious materials and viscosity enhancing admixture. Materials and Structures, 36(6), 402-412.
Yakovlev, G., Kerienė, J., Gailius, A., & Girnienė, I. (2006). Cement based foam concrete reinforced by carbon nanotubes. Materials Science [Medžiagotyra], 12(2), 147-151.
Yang, H., Cui, H., Tang, W., Li, Z., Han, N., & Xing, F. (2017). A critical review on research progress of graphene/cement based composites. Composites Part A:
Univers
ity of
Mala
ya

207
Applied Science and Manufacturing, 102(Supplement C), 273-296. doi: https://doi.org/10.1016/j.compositesa.2017.07.019
Yu, X., & Kwon, E. (2009). A carbon nanotube/cement composite with piezoresistive properties. Smart Materials and Structures, 18(5), 055010.
Zhan., Yang, H., Shen, G., Cheng, P., ZHan., & Guo, S. (2010). Reduction of graphene oxide via L-ascorbic acid. Chemical Communications, 46(7), 1112-1114.
Zhan, M. H., Sisomphon, K., Ng, T. S., & Sun, D. J. (2010). Effect of superplasticizers on workability retention and initial setting time of cement pastes. Construction and Building Materials, 24(9), 1700-1707.
Zhan, Y., Kong, X., Gao, L., Lu., Zhou, S., Dong, B., & Xing, F. (2016). In-situ measurement of viscoelastic properties of fresh cement paste by a microrheology analyzer. Cement and Concrete Research, 79, 291-300.
Zhan, Y., Tan, Y. W., Stormer, H. L., & Kim, P. (2005). Experimental observation of the quantum Hall effect and Berry's phase in graphene. Nature, 438(7065), 201-204.
Zhao., & Bai, J. (2015). Highly sensitive piezo-resistive graphite nanoplatelet–carbon nanotube hybrids/polydimethylsilicone composites with improved conductive network construction. ACS Applied Materials & Interfaces, 7(18), 9652-9659.
Zhao., Guo, X., Ge, C., Li, Q., Guo, L., Shu, X., & Liu, J. (2016). Investigation of the effectiveness of PCat GO on the reinforcement for cement composites. Construction and Building Materials, 113, 470-478.
Zhao., Guo, X., Ge, C., Li, Q., Guo, L., Shu, X., & Liu, J. (2017a). Mechanical behavior and toughening mechanism of polycarboxylate superplasticizer modified graphene oxide reinforced cement composites. Composites Part B: Engineering, 113, 308-316.
Zhao., Guo, X., Liu, Y., Ge, C., Guo, L., Shu, X., & Liu, J. (2017b). Synergistic effects of silica nanoparticles/polycarboxylate superplasticizer modified graphene oxide on mechanical behavior and hydration process of cement composites. RSC Advances, 7(27), 16688-16702.
Zhou, C., Li, F., Hu, J., Ren, M., Wei, J., & Yu, Q. (2017). Enhanced mechanical properties of cement paste by hybrid graphene oxide/carbon nanotubes. Construction and Building Materials, 134, 336-345.
Univers
ity of
Mala
ya

208
Zhou., & Glasser, F. P. (2001). Thermal stability and decomposition mechanisms of ettringite at <120°C. Cement and Concrete Research, 31(9), 1333-1339. doi: http://dx.doi.org/10.1016/S0008-8846(01)00558-0
Zhu., Guo, S., Fang, Y., & Dong, S. (2010). Reducing sugar: new functional molecules for the green synthesis of graphene nanosheets. Acs Nano, 4(4), 2429-2437.
Zhu., Murali, S., Cai, W., Li, X., Suk, J. W., Potts, J. R., & Ruoff, R. S. (2010). Graphene and graphene oxide: synthesis, properties, and applications. Advanced materials, 22(35), 3906-3924.
Univers
ity of
Mala
ya

209
LIST OF PUBLICATIONS
Accepted Articles
ISI Indexed
1. Rehman, S. K. U., Ibrahim, Z., Memon, S. A., Javed, M. F., & Khushnood, R.
A. (2017). A Sustainable Graphene Based Cement Composite. Sustainability,
9(7), 1229. (ISI Indexed, Q2, IF: 1.789)
2. Rehman, S. K. U., Ibrahim, Z., Memon, S. A., Aunkor, M., Hossain, T., Javed,
M. F., Mehmood, K. & Shah, S. M. A. (2018). Influence of Graphene Nanosheets
on Rheology, Microstructure, Strength Development and Self-Sensing Properties
of Cement Based Composites. Sustainability, 10(3), 822 (ISI Indexed, Q2, IF:
1.789).
3. Rehman, S.K.U., Ibrahim, Z., Memon, S.A. and Jameel, M., (2016).
Nondestructive test methods for concrete bridges: A review. Construction and
Building Materials, 107, pp.58-86. (ISI Indexed, Q1, IF: 2.421)
Refereed Conference Papers
4. Rehman, S. K.U, Ibrahim, Z., Javed, M. F., Hanif, M. U., M., (2017) Piezo-
resistive characteristics of Graphene based cement mWallevik, 2009aterials.
24th International Congress on Sound and Vibration (ICSV 24). July 23-27,
London.
5. Rehman, S. K.U., Ibrahim, Z., Javed, M. F., Hanif, M. U., M., Ghaedi, K., (2017).
Self-Sensing Carbon Based Cement Composite Material. Conference
Univers
ity of
Mala
ya

210
Proceedings 2nd International Conference on Advances in Engineering and
Technology 2017 (RTET-2017). Feb. 9-10, 2017, Penang, Malaysia.
6. Rehman, S. K.U., Ibrahim, Z., Jameel, M., Hanif, M. U., M., Ghaedi, K., Javed,
M. F., Tababalan, V., (2016). Influence of Graphene Oxide Nanosheets on
Properties of Cement Based Materials. Conference Proceedings 13th International
Conference on Concrete Engineering and Technology 2016 CONCET2016. May
31-June 2, 2016, Universiti Teknologi Mara, Shah Alam, Selangor, Malaysia.
In progress/Under review Articles
7. Rehman, S. K. U., Ibrahim, Z., Memon, S. A., Jameel, M., & Javed, M. F. Recent
research on graphene based cement composite: A review (Construction and
Building Materials, ISI Indexed, Q1, IF: 3.169)
8. Rehman, S. K. U., Ibrahim, Z., Memon, S. A., Jameel, M., & Javed, M. F.
Assessment of rheological properties of graphene cement paste using various
models and geometries (International Journal of Concrete Structures and
Materials, ISI Indexed, Q2, IF: 2.031)
Univers
ity of
Mala
ya