Non-invasive determination of plant biomass with microwave resonators
13
-
Upload
independent -
Category
Documents
-
view
3 -
download
0
Transcript of Non-invasive determination of plant biomass with microwave resonators


Non-invasive determination of plant biomass withmicrowave resonators
MARION I. MENZEL1*, SUSANNE TITTMANN1*, JONAS BÜHLER1, STELLA PREIS1, NORBERT WOLTERS2,SIEGFRIED JAHNKE1, ACHIM WALTER1, ANTONIA CHLUBEK1, ARIEL LEON2, NORMEN HERMES3,ANDREAS OFFENHÄUSER2, FRANK GILMER1, PETER BLÜMLER1, ULRICH SCHURR1 &HANS-JOACHIM KRAUSE2
1ICG-3 (Phytosphere), 2IBN-2 (Bioelectronics) and 3ICG-4 (Agrosphere), Forschungszentrum Jülich GmbH, D-52425Jülich, Germany
ABSTRACT
Non-invasive and rapid determination of plant biomasswould be beneficial for a number of research aims. Here, wepresent a novel device to non-invasively determine plantwater content as a proxy for plant biomass. It is based onchanges of dielectric properties inside a microwave cavityresonator induced by inserted plant material. The watercontent of inserted shoots leads to a discrete shift in thecentre frequency of the resonator. Calibration measure-ments with pure water showed good spatial homogeneity inthe detection volume of the microwave resonators and clearcorrelations between water content and centre frequencyshift. For cut tomato and tobacco shoots, linear correlationsbetween fresh weight and centre frequency shift wereestablished. These correlations were used to continuouslymonitor diel growth patterns of intact plants and to deter-mine biomass increase over several days. Interferences fromsoil and root water were excluded by shielding pots withcopper. The presented proof of principle shows that micro-wave resonators are promising tools to quantitatively detectthe water content of plants and to determine plant biomass.As the method is non-invasive, integrative and fast, itprovides the opportunity for detailed, dynamic analyses ofplant growth, water status and phenotype.
Key-words: biomass; cavity resonator; dielectric properties;microwave; non-invasive analysis; water content.
INTRODUCTION
The plant’s capability to produce biomass determines cropyield and plant vigour. Procedures to determine theincrease in plant biomass (growth) or the amount of stand-ing crop biomass have thus been developed and appliedthroughout human history, but they are generally destruc-tive. In parallel to an increasingly refined molecular under-standing of plant growth processes (Nozue & Maloof 2006),
there is a clear need for methods that allow plant growthmonitoring with higher temporal resolution (Schmundtet al. 1998). Consequently, various approaches have beenestablished, allowing non-invasive determination of param-eters serving as a realistic proxy for overall plant growthsuch as LIght Detection And Range (LIDAR)-observationsof tree height (Omasa et al. 2003), electronic registration oftree diameter (Zweifel, Item & Hasler 2001; Cermak et al.2007), interferometric analysis of plant height (Jiang &Staude 1989) or organ surface expansion (Walter & Schurr2005). Yet, non-invasive analysis of fresh weight (FW) ordry weight (DW) increase remains largely unexplored,in particular when data on the whole-plant scale arerequested. Some attempts have been made to determineplant biomass non-invasively via weighing methods(Simonneau et al. 1993; Van Ieperen & Madery 1994)where, in the work of Van Ieperen & Madery (1994), growthof tomato plants was determined by placing two communi-cating vessels filled with a nutrient solution on balances.One of the vessels contained a plant whose fresh weight wasdetermined by the difference of transpiration (summaryloss of weight) and water uptake (weight difference evolv-ing between the two balances).
Tools for non-invasive analysis of plant biomass and itsautomation would contribute not only to ‘online’ detectionof single-plant fresh weight but also to the emerging field ofplant phenotyping (Leister et al. 1999; Granier, Aguirreza-bal & Chenu 2006; Walter, Scharr & Gilmer 2007). For that,it is a central aim to scan the standing biomass or theincrease in biomass of a large number of individual plants atuser-defined intervals to observe either reactions of plantstowards altered environmental conditions (Granier et al.2006; Walter et al. 2007) or to determine developmentaldifferences between genetically different plant lines (Meyeret al. 2004). This clearly can not be achieved via differentialweighing methods. Total projected leaf area extracted fromautomated imaging methods is a good proxy for biomassdetermination as long as plants are in a vegetative rosettestage, such as in Arabidopsis thaliana (Leister et al. 1999)or in young seedlings of Nicotiana tabacum (Walter et al.2007). Yet, the correlation between visible leaf area andplant biomass is questionable for other plant architectures
Correspondence: F. Gilmer. Fax: +49 2461 61 2492; e-mail: [email protected]
*Both authors contributed equally to this work.
Plant, Cell and Environment (2009) 32, 368–379 doi: 10.1111/j.1365-3040.2009.01931.x
© 2009 Blackwell Publishing Ltd368

that do not allow simple, quantitative visualization of totalleaf area. Hence, it was our aim to establish a non-invasiveand easy-to-use method having the potential for automa-tion, based on electromagnetic fields for determining thefresh weight of a plant body.
Nelson and co-workers discussed the ‘variation of dielec-tric properties (of grain and soybeans) as functions of mois-ture content, frequency, temperature, and bulk density’(Nelson 1991); they especially focused on the measurementof dielectric properties of grain and oilseed using free-spacemeasurements in the GHz range (Trabelsi & Nelson 2003).Although this approach has found widespread use in foodprocessing (Hu, Toyoda & Ihara 2008), it has not yet beenadapted to a useful tool in plant biology. Remote airborneactive and passive microwave sensors (Ferrazzoli et al. 1992)were employed to relate biomass to microwave backscatter-ing and emission;however,this approach revealed sensitivityto plant geometry in prediction of water content and hence isapplicable mostly at large plot scales (Wigneron et al. 2003).Jones and co-workers reviewed several approaches whicheither derive the water content of biomaterials from com-parison of unknown materials with test materials of knownpermittivity or correlate transmission differences (Joneset al. 2006). They realized a free space system operating inthe range of 300–900 MHz, but needed sophisticated statis-tical methods to find strong correlations between signalattenuation because of water and reference measurements.
The approach taken here is to use a microwave cavityresonator to determine water content of a plant, a principlethat has proven its applicability in inspection of buildingmaterials (Herrmann, Sikora & Zaage 1997; Leschnik1999). With an appropriate resonator design, differentmodes can preferentially be excited, reacting with high sen-sitivity to changes of the dielectric properties of the reso-nator cavity when a plant is inserted (Krause et al. 2006). Inorder to evaluate possible impact of microwave field geom-etries on measurement accuracy, the spatial distribution ofthe electromagnetic fields inside the resonator was deter-mined systematically using a test sample. Several series ofmeasurements on pure water samples, harvested plant partsand intact plants were performed in order to evaluate theapplicability of the method for water content measurementof plants as a proxy for biomass, fresh or dry weight. Theseparameters can be deduced from plant-specific calibrationswith good reliability. As the presented method is non-invasive and fast, changes in growth patterns of intact plantscan be monitored on a time scale ranging between minutesand days, allowing monitoring of diurnal growth patterns.Examples of such measurements are presented here anddiscussed in terms of future use and potential.
MATERIALS AND METHODS
The measurement system for non-invasive biomass deter-mination with a microwave resonator consists of three maincomponents: the microwave cavity resonator, the micro-wave electronic module (laboratory set-up, miniaturizedversion and software) and correlation libraries for different
plant species. For a description of the theory of microwavesand microwave resonators, the reader is referred to therelevant literature (for instance Zinke & Brunswig 2000) asan extended review of the underlying method is beyond thescope of this paper.
Microwave resonator design
The dielectric permittivity is a measure of the extent towhich a substance concentrates the electrostatic lines offlux. In the case of imposing a static electric field across amedium, the relative dielectric permittivity denotes theratio of the amount of electric energy stored in themedium relative to vacuum. Placing a material with a highdielectric constant (i.e. water) in an electric field leads to areduction of the field amplitude. Therefore, insertingbiomass (which contains high amounts of water) into acavity resonator yields a reduction of the resonance fre-quency of the resonator.
The general design and properties of the cavity resonator(wall thickness:1.8 mm) is depicted in Fig. 1a with propertieslisted in Table 1. The openings of length L2 are chosensmaller in diameter than the main body (D1) of the resonatorin order to stabilize the resonant modes. Plants and samplesinserted via the openings should not exceed L1 in height.Torestrict samples to the most homogeneous part of the field, acylinder of plastic foil (diameter: D2 – not shown in Fig. 1)has been fixed inside the cavity resonator,which also preventplant samples from touching the coupling coils. Inside theresonator, two coupling coils at opposite sides (to minimizedirect spurious coupling) at central height couple the circu-lating electromagnetic field into and out of the resonator.Via SMA-connectors (SubMiniature version A, suited forhigh-frequencies), these coils are connected to the radiofrequency (RF)-electronic module. The lowest mode, thetransversal-magnetic TM010 mode (with lowest resonancefrequency, f010), is preferably excited. To first order approxi-mation, the resonance frequency of the mode is calculatedaccording to the theory of cavity resonators in a completelyclosed cylinder of diameter D1 (see Fig. 1a), surrounded by aperfect electric conductor, according to
f Dc x
DE
010 101
1
( ) = ⋅ε μ πr r
(1)
Here, x01 = 2.4048 denotes the first zero-crossing of theBessel function J0(x), c = 2.9979 ¥ 108 m/s is the velocity oflight in vacuum, mr is the relative magnetic permeability ander is our variable of interest referring to the dielectric per-mittivity of the medium inside the cavity resonator. Table 1compares the theoretically calculated resonance frequen-cies f010 to the experimental result for the given prototype.
Sample container and pot shielding
For sample positioning during calibration, a cylindricalPerspex-container (height, 60 cm; outer diameter, 15 cm;wall thickness, 5 mm) was built (Fig. 1b); its position
Biomass determination with microwave resonators 369
© 2009 Blackwell Publishing Ltd, Plant, Cell and Environment, 32, 368–379

relative to the resonator is adjustable in height. For shootbiomass determination of intact plants, the plant pot, rootsand possibly humid soil were shielded by a cylindricalcopper shield (Fig. 1c) constructed with removable capand feed-through for the plant stem (shielding diameter,13.5 cm; height, 12.5 cm; material thickness, 2.5 mm).Figure 1d depicts the measurement set-up with resonator(P2, see also Table 1) and plant within the pot/soil shield.Perspex distance rings were used to ensure reproduciblepositioning of the plant and shielding within the resonator.
System characterization, data acquisitionand analysis
The transmission characteristics of the empty cavity reso-nator were analysed with a network analyser (ZVB4 Vector
Network Analyzer, Rohde & Schwarz, Cologne, Germany).Initially, within the range of 300 kHz up to 4 GHz, compleximpedance versus frequency was scanned to identify thefirst stable resonance-peak (the TM010 mode). Based onthis stable resonance, measurements of the empty orloaded resonator were conducted within a smaller range of�25 MHz in steps of 2.5 kHz. The following variables wereacquired from the measured complex spectra (see Fig. 2a):the centre or resonance frequency f0, the bandwidth Df (at3 dB loss), the signal quality Q = f0/Df and the resonancefrequency shift, delta centre frequency (DCF).
ΔCF f f CF CF= ( ) − ( ) = −0 0 1 2empty sample (2)
Using a LabView-based (National Instruments Corpora-tion, Austin, TX, USA) programme, the measurement was
Figure 1. Design of the microwaveresonator set-up. (a) Schematic of aresonator with dimensions D1, D2, L1 andL2 listed in Table 1. (b) Schematic of thePerspex-container for water calibrationand cut shoots measurement. (c) Schematicof the copper shield positioning, containingpot with intact plant. (d) Photo of themeasurement setup; top, network analyser;bottom, measurement computer, tomatoplant with copper shield and microwavecavity resonator.
(a) (b) (c)
(d)
Table 1. Resonator dimensions andresonance frequencies of three resonatorprototypes (P2–P4)Prototype version
D1
(mm)D2
(mm)L1
(mm)L2
(mm)f010(theo)(MHz)
f010(exp)(MHz)
P2 300 180 210 126 765.0 812.8P3 250 150 175 100 917.9 976.9P4 180 130 90 65 1274.9 1428.6
The dimensions are illustrated in Fig. 1a. f010(theo) refers to the calculated resonance fre-quency of the primary mode according to Eqn. 1 while f010(exp) shows the experimentalresult for the given prototype.
370 M. I. Menzel et al.
© 2009 Blackwell Publishing Ltd, Plant, Cell and Environment, 32, 368–379

automated and the acquired complex spectra were trans-ferred from the network analyser to the controlling PC andstored. The main part of the measurement duration wasrequired for sample positioning, the complex spectra acqui-sition occurred within seconds, so that a complete measure-ment including positioning could be completed withinapproximately 20 s. By using a Matlab-based (The Math-works, Natick, MA, USA) programme, the spectral datawere analysed. From the complex spectrum, the logarithmicamplitude AdB was calculated according to Eqn. 3:
AdB2 2real part imaginary part= ⋅ +( )20 10log (3)
Depending on the amplitude’s signal to noise ratio, low passfiltering in Fourier space was applied. The maximum of theresonance spectrum in the range of the selected mode wasdetermined via the first derivative and its change of sign,with Q as quality factor. In a series of measurements, theresonance frequency and amplitude, the bandwidth and thequality factor were automatically stored in spreadsheetfiles.
This set-up with resonator P2 indicated that the firststable resonance is located in the range between 750 MHz
and 850 MHz depending on the amount of water or biomasswithin the resonator. Based on this information, the multi-functional network analyser could be replaced by a lessexpensive and miniaturized electronic module. The fre-quency range of further resonator prototypes (P3 and P4)had to be detected accordingly.
Miniaturized electronic module and dataanalysis system
For routine measurements, a miniaturized electronicmodule was developed containing the basic functionalityof the network analyser but reduced to the minimumrequirements of our application. It constitutes a miniatur-ization in size as well as in cost. The electronic modulecomprises a microwave source, a splitter, an amplifier-attenuator chain and a gain and phase demodulator. Asa high-frequency source, a voltage-controlled oscillator(VCO) selected according to the required frequency rangeis used. For frequency adjustment and stabilization, theVCO is phase-locked by a quartz-controlled fractional-Nfrequency synthesizer chip, SKY72302 from SkyworksSolutions Inc. (Woburn, MA, USA). The absolute fre-quency precision of 2 mg g-1 is limited by the stability ofthe quartz reference. The relative frequency precision of70 Hz (i.e. better than 0.1 mg g-1) is determined by thedivider values programmed to the fractional-N divider ofthe synthesizer. The RF output is split; one branch is fed tothe resonator via an adjustable attenuator and a 20 dBamplifier, the other branch is supplied to the demodulatorchip after passing a second adjustable attenuator. Thepower level of the reference signal is adjusted to -30 dBm(1 mW). The demodulator part of the electronic module isbased on the gain and phase detector chip AD8302 fromAnalog Devices (Norwood, MA, USA). The chip yields theamplitude and phase of the RF signal transmitted throughthe resonator, relative to the supplied reference signal. Theamplitude range is 60 dB with a logarithmic gain scale, andthe phase is measured in all four quadrants. The high-frequency section of the electronic module is mounted inan RF-tight aluminium casing.
The RF-electronics module is connected to a touch panelcomputer based on the microcontroller Tiny Tiger fromWilke Technology (Aachen, Germany). The implementedprogramme contains subroutines for setting the frequencyof the synthesizer, for adjusting the RF levels for excitationand reference, and for amplitude and phase signal readoutfrom the demodulator chip via 16-bit Analog/Digital con-verters. The user interface includes a routine for measuringa complete spectrum and for convenient peak tracking.
Because the resonance peak of the cavity resonator iswell described by a Lorentzian peak fL (Eqn. 4), the track-ing programme matches the measured data to such aLorentzian peak which is continuously updated in order totrack the peak position (f0 centre frequency), the peakwidth ( Δf1
2half width half maximum), which also yields the
quality factor, and the peak height (A the transmission lossin the peak).
(b)
(a)
50
0
–50 –50
50
0
775.0
775.5
776.0
776.5
777.0
Cente
rfre
quency (
MH
z)
Y (mm)X (mm)
774.8
775.6
CF CF
(MHz)
–20
–3 dB
–25
–30
–35
–40
Figure 2. Schematics of measurement principle.(a) Transmission curves of microwave resonator P2: empty (solid)and with sample (dashed). Sample causes a relative frequencyshift DCF = CF1 – CF2. (b) Spatial variation of first mode centrefrequency f0 of resonator P2 in xy-plane at position z = 2.44 mm,relative to centre of resonator (z = 0).
Biomass determination with microwave resonators 371
© 2009 Blackwell Publishing Ltd, Plant, Cell and Environment, 32, 368–379

f f f A fA f
f f fL , , ,0
2
02 21
2
12
12
4Δ( ) =
⋅
⋅ −( ) +
Δ
Δ(4)
The tracking routine is implemented as a start routinewhich performs a scan over the total frequency range, asearch for the maximum, and from there a search of the leftand the right -3 dB points (shoulders). This routine is con-tinuously repeated, involving the precise measurement ofthe three characteristic points (maximum and both shoul-ders), averaging, an analytic determination of the Loren-tzian which runs exactly through the measured points, acalculation of the new maximum and the new -3 dB pointsfrom the Lorentz curve, and a calculation of the runningaverage mean value and standard deviation. If the peaktracking routine loses the peak, it automatically starts againwith the measurement of the whole spectrum.
This module functions like a network analyser but isreduced in its frequency range and provides only the essen-tial measuring functions at significantly reduced costs. It isdesigned and built by JSQ GmbH (Jülich, Germany) for theprospective use in biomass determination experiments.
Growth conditions – plant material
Tomato (Lycopersicon esculentum L.) and Tobacco (Nicoti-ana tabacum L.) plants were used as model plants in thisstudy.Plants were germinated in standard soil for cultivation(type ED73 Einheitserde, Balster Einheitserdewerk, Frön-denberg, Germany) and grown under 100–180 mmol m-2 s-1
photosynthetic active radiation in a growing room in-housewith controlled relative humidity (RH; %) and temperature(T; °C). Condensation, leading to measurement artefacts,was not observed inside the resonator under the selectedconditions. If plants were harvested after or prior to a mea-surement, the fresh weight (FW; g) was determined with ananalytical balance (Mettler Toledo, Giessen, Germany).Theplant material was then dried at 75 °C for 72 h in an oven(Heraeus Kulzer, Hanau, Germany) and the dry weight(DW; g) was determined. The relative water content (RWC;%) was determined according to
RWC FW DW FW= −( ) × 100% (5)
The regressions for all statistical analysis were performedusing SigmaPlot 10.0 (Systat Software Inc., San Jose, CA,USA).
RESULTS
Spatial electromagnetic field distribution
Because the electric field distribution varies within theresonator because of position and observed mode, the sen-sitivity of the experimental set-up had to be tested withrespect to these parameters. To characterize the spatialfield distribution of the first four modes within the reso-nator, a reference sample was used to scan the wholemeasurement volume for each mode. These experimentswere carried out using a hollow Perspex cube (outer edgelength: 2.5 cm) filled with 7.3 g of distilled water as areference. The cube was attached to a computer controlledthree-dimensional (3D) moving stage (Owis GmbH,Staufen, Germany) and supported in the volume of inter-est with a Perspex rod (diameter 8 mm). All measure-ments were carried out at room temperature(approximately 22 °C). Two sets of spatial distributionmeasurements, one with and one without the Perspexsample container, were completed by automatically posi-tioning the reference sample on a predefined grid withinthe resonator via the 3D moving stage. The electromag-netic field distribution, that is, the resonance frequencysensitivity towards water, was scanned in horizontalxy-planes for a radius of 55 mm with Perspex sample con-tainer and 75 mm without sample container at differentpositions (step width: 6 mm with sample container, 25 mmwithout sample container) on the z-axis covering a heightof 163 mm with sample container and 200 mm withoutsample container. The full resonance spectrum wasrecorded at each grid position and analysed, resulting in3D data sets representing the spatial distribution of reso-nance frequency, width and amplitude for the first fourmodes of the resonator. Figure 2b shows an example of aplot of the data for the spatial distribution of the firstmode in an xy-plane in the middle plane of the cylindricaldetection volume. Over the full volume, for each verticalslice, the maximal deviations of resonance frequenciesfrom the reference frequency defined at the centre of theresonator are summarized in Table 2. These deviationsdefine the inherent frequency sensitivity and accuracy ofthe measurement. The relative frequency error due tosample position was smaller than 0.3% for the first fourresonance frequencies of resonator P2 (see Table 1). Thehomogeneity of the spatial distribution of resonance
Table 2. Resonance frequencies ofresonator P2 depending on the mode andthe position in the measuring volume
Mode # forg (MHz) fmin (MHz) fmax (MHz) Dfmax (MHz) Dfrel %
1 776.0 774.6 776.9 2.3 0.2962 1143.5 1141.7 1144.7 3.0 0.2623 1481.8 1480.8 1482.4 1.6 0.1084 1812.0 1811.6 1812.3 0.7 0.039
forg, Resonance frequency at origin (centre of resonator); fmin, minimum resonance frequency;fmax, maximum resonance frequency; Dfmax = fmax - fmin, maximum shift of resonance fre-quency inside the measuring volume; Dfrel, shift in resonance frequency relative to frequencyat origin (forg).
372 M. I. Menzel et al.
© 2009 Blackwell Publishing Ltd, Plant, Cell and Environment, 32, 368–379

frequencies can thus be considered to not markedly influ-ence water content determination. All but especially thehigher modes (>second mode) showed a spatially uniformresonance frequency distribution so that modes 1 to 4have been evaluated for further experiments.
Measuring water content in themicrowave resonator
Based on the spatial distribution of the resonance fre-quency sensitivity identified above, a central measurementposition was fixed for all following experiments. Thisensured a reproducible positioning of the water or plantsample.To this end, the Perspex container bottom was posi-tioned in the geometric centre of the resonator. In order toevaluate the dynamic range, that is, the minimal andmaximal water amount being measurable, the Perspex cyl-inder was filled successively with increasing amounts ofwater and the resonance spectrum was recorded for the firstfour modes (Fig. 3). The most noticeable observation is thepresence of discontinuities in the resonance frequency as afunction of the water amount for the higher modes (>1).These discontinuities can be explained as follows: with thepresence of more polarizable material within the resonator– the resonance frequencies of the higher modes shift to ahigher extent and therefore collide and reform with eachother, delivering unreliable results. As the primary mode(TM010 mode) was stable over a wide range of wateramount, it was chosen for further measurements. Theobserved linear correlation between resonance frequencyshift DCF and water content (0–300 g) in the sensitivevolume of the resonator was evaluated using SigmaPlot10.0 (Systat Software) using a linear fit:
f y a x= + ⋅0 (6)
The correlation coefficient was excellent (R2 = 0.9897,P < 0.0001) for mode 1, which proves the capability of amicrowave resonator for precise determination of watercontent.
Measuring fresh weight of cut shoots
Shoots of tomato and tobacco plants of different develop-mental stages were measured in the resonator immediatelyafter harvesting and fresh and dry weights were determinedwith a balance. The tomato and tobacco shoots showed aclear linear correlation between FW and DW (Fig. 4; a =0.05, y0 = -0.01, R2 = 0.97 for tomato and a = 0.07, y0 = -0.12,R2 = 0.98 for tobacco plants) over three orders of magni-tude which provided the basis to simply calculate total andrelative water contents of the plant samples. For a water-stressed population of tomato plants with high freshweights, different correlation coefficients apply (Fig. 4,black triangles, a = 0.18, y0 = 0.65, R2 = 0.87).
The correlation between DCF and FW of tomato shootsin the range of 1–22 g FW (Fig. 5a) is linear. Dependingon plant size, this correlation (DCF versus FW) rangesfrom fair quality for very small plants (FW < 1 g, a = 90.9,y0 = 0.29, R2 = 0.42) plants to good quality for intermediate-sized plants (FW 1–5 g, a = 729.3, y0 = 0.68, R2 = 0.93) whichare within the 95% prediction band (see Fig. 5b).
For the very small plants, the fair correlations could beexplained by the fact that, depending on air humidity,they rapidly lose water through evaporation after beingcut which leads to a significant error in the non-automatedbalance procedure. For very large plants, a significantportion of plant material is scattered in the confined reso-nator space, thus interacting with slightly different fieldstrengths. Furthermore, the presence of extended conduc-tive structures (plant stems) may lead to a distortion of the
Water (g)
(a) (b)
(c) (d)
Δ C
entr
e fre
quency (
kH
z)
Δ C
entr
e fre
quency (
kH
z)
Figure 3. Correlations between water content andcorresponding delta centre frequencies (DCF) for first to fourthmicrowave resonator mode in panels a, b, c and d, respectively.
Figure 4. Correlations between fresh and dry weight of theinvestigated plant species tomato and tobacco. A water-stressedpopulation shows a significantly changed correlation.
Biomass determination with microwave resonators 373
© 2009 Blackwell Publishing Ltd, Plant, Cell and Environment, 32, 368–379

resonator modes. As carbohydrates also constitute polarmolecules, it could be assumed that larger carbohydratecontents in large plants also contribute to the dielectricresonance shift. We assume that all three mechanismscontribute to the observed deviation from the linear corre-lation. Hence, for tomatoes, the sensitive measurementrange of the resonator (P2) is 1–5 g. Smaller or larger plantscould be analysed more beneficially in smaller or largerresonators, respectively. Based on the fit coefficients(Eqn. 6), it is possible to calculate the FW from the DCFwith an error of 10% (R2 = 0.93).
Comparable results were obtained for tobacco plants(FW < 10 g, a = 100.6, y0 = 1.64, R2 = 0.81, see Fig. 6a). Plantswith a fresh weight larger than 10 g are outside of the95% prediction band (Fig. 6a). The measured and thedetermined fresh weight (obtained from the data fittedwith SigmaPlot 10.0,) show a good correlation for plantsfrom 1 g to 10 g fresh weight (R2 = 0.78) (see also Fig. 6b).
With these experiments, we could demonstrate that it ispossible to determine the FW of tomato and tobacco plantswith the help of the resonator, which in turn allows deter-mining of the DW (see Fig. 4), as the calculation of plantbiomass from water content requires a known relativewater content of the plant. From Fig. 4, we can suggestthat relative water content shows better correlation to
R2 = 0.93 P < 0.0001 regression 5g FW
F = 0.6852 + 7.2927E – 007x
(a)
(b)
–
–
Δ Centre frequency (kHz)
R2 = 0.9298 P < 0.0001
F = 3.9659E – 005 + 1.0x
Figure 5. Calibration and testing of tomato fresh weightdetermination. (a) Calibration of the DCF signal for shoots up to22 g of fresh weight. (b) Comparison between determined freshweight calculated from linear regression (up to 5 g, see Fig. 5a)and balance-measured fresh weight.
R2 = 0.81, P < 0.0001, regression for 10g FW
y = 1.1351 + 100.588x
(a)
–
(b)R2
= 0.81, P < 0.0001
F = –7.6711E – 006 + 1.0x
Δ Centre frequency (kHz)
Figure 6. Calibration and testing of tobacco fresh weightdetermination. (a) Calibration of the DCF signal for shoots up to60 g fresh weight. (b) Comparison between determined freshweight calculated from linear regression (up to 10 g, see Fig. 6a)and balance-measured fresh weight.
374 M. I. Menzel et al.
© 2009 Blackwell Publishing Ltd, Plant, Cell and Environment, 32, 368–379
environmental conditions than to developmental stages.Optimal results were obtained under most stringently con-trolled environmental conditions (temperature, humidity,water supply to the root).
Measuring fresh weight in intact plants(soil and pot shielded)
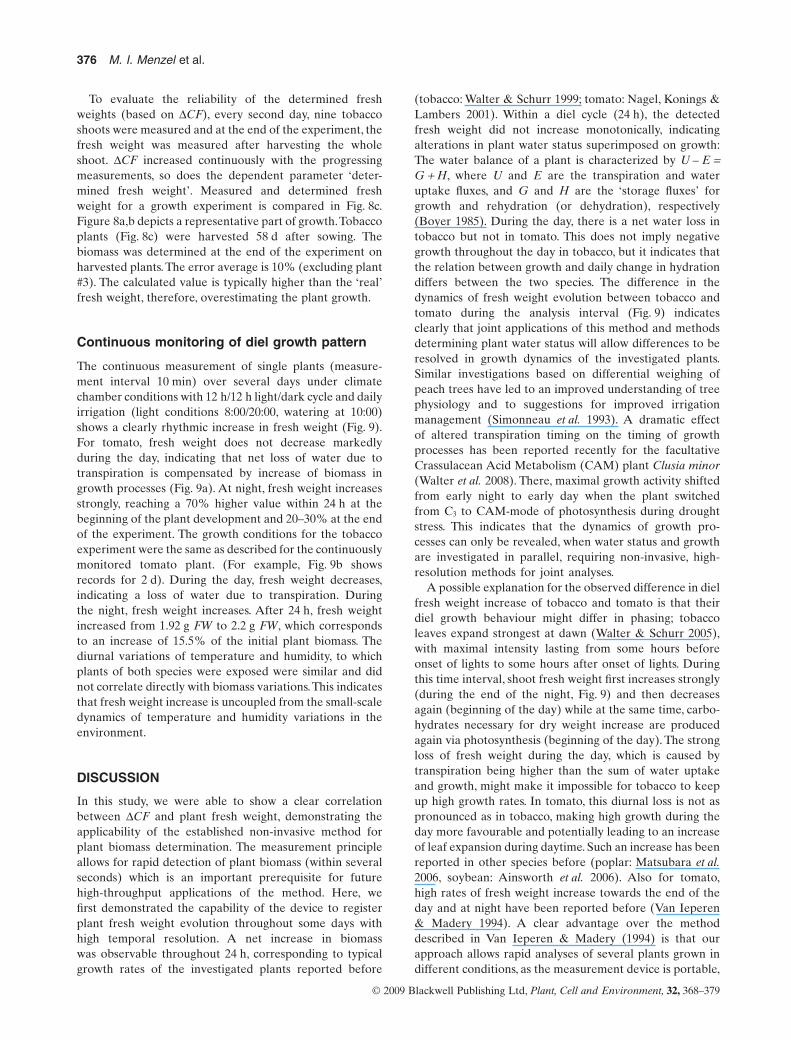
To detect the entire shoot of larger plants while maskingthe root and soil water volume, we tested the set-upwith soil and pot shielded from the resonator. Previousexperiments suggested that reproducible positioning ofthe shield is essential; therefore, we used Perspex ringsdiffering in height to optimize pot positioning towards adetection of all shoot parts. After the measurement theplants were harvested and DW and FW were determinedas above. There is good correlation between measure-ments performed on intact shielded plants (R2 = 0.59)and harvested plants (R2 = 0.47) placed inside the resona-tor without pot or shield (see Fig. 7). Shielded tomatoplants only showed an absolute frequency offset in com-parison to harvested shoots, which is irrelevant for thedetermination of FW through DCF. Using shielding, thebiomass of the aboveground pieces of a plant can bedetermined.
Growth dynamics in intact plants
Repeated measurements of water content in intact plantsallow monitoring of biomass increase over time (growth).Measurements of 20 intact tomato plants over 6 d and 9intact tobacco plants over 10 d show an increasing value of
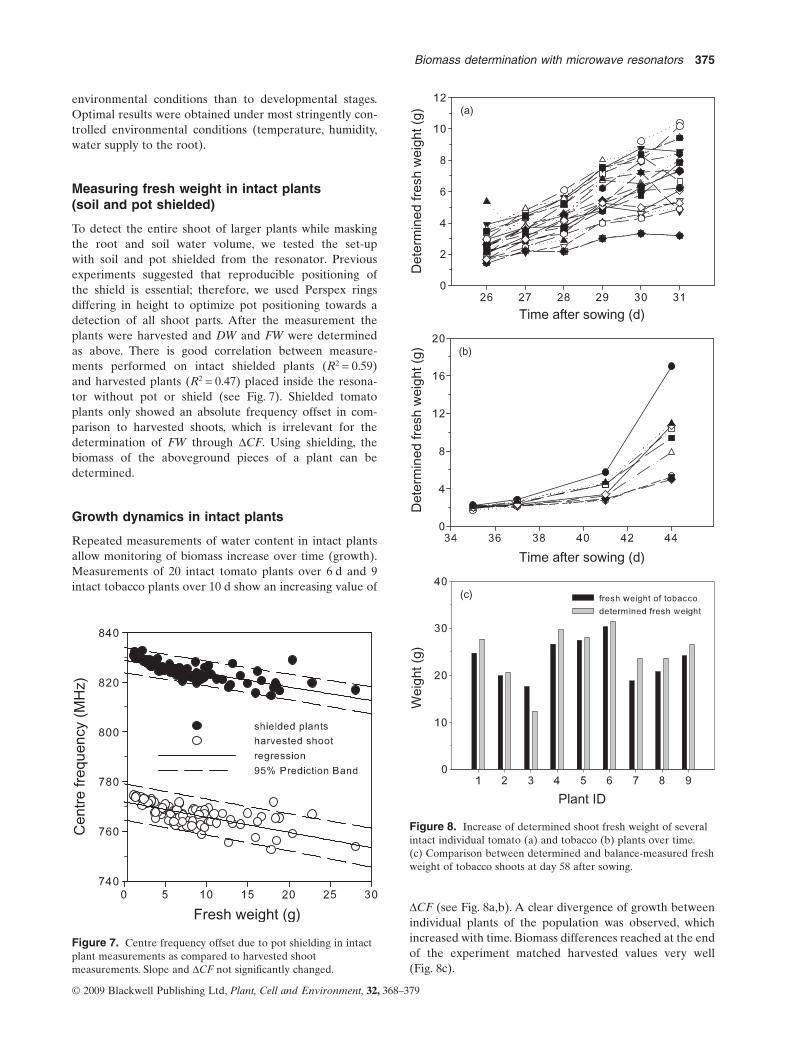
DCF (see Fig. 8a,b). A clear divergence of growth betweenindividual plants of the population was observed, whichincreased with time. Biomass differences reached at the endof the experiment matched harvested values very well(Fig. 8c).
Fresh weight (g)
Ce
ntr
e f
req
ue
ncy (
MH
z)
Figure 7. Centre frequency offset due to pot shielding in intactplant measurements as compared to harvested shootmeasurements. Slope and DCF not significantly changed.
Time after sowing (d)
Time after sowing (d)
Plant ID
Dete
rmin
ed fre
sh w
eig
ht (g
)D
ete
rmin
ed fre
sh w
eig
ht (g
)W
eig
ht (g
)
(a)
(b)
(c)
Figure 8. Increase of determined shoot fresh weight of severalintact individual tomato (a) and tobacco (b) plants over time.(c) Comparison between determined and balance-measured freshweight of tobacco shoots at day 58 after sowing.
Biomass determination with microwave resonators 375
© 2009 Blackwell Publishing Ltd, Plant, Cell and Environment, 32, 368–379
To evaluate the reliability of the determined freshweights (based on DCF), every second day, nine tobaccoshoots were measured and at the end of the experiment, thefresh weight was measured after harvesting the wholeshoot. DCF increased continuously with the progressingmeasurements, so does the dependent parameter ‘deter-mined fresh weight’. Measured and determined freshweight for a growth experiment is compared in Fig. 8c.Figure 8a,b depicts a representative part of growth.Tobaccoplants (Fig. 8c) were harvested 58 d after sowing. Thebiomass was determined at the end of the experiment onharvested plants. The error average is 10% (excluding plant#3). The calculated value is typically higher than the ‘real’fresh weight, therefore, overestimating the plant growth.
Continuous monitoring of diel growth pattern
The continuous measurement of single plants (measure-ment interval 10 min) over several days under climatechamber conditions with 12 h/12 h light/dark cycle and dailyirrigation (light conditions 8:00/20:00, watering at 10:00)shows a clearly rhythmic increase in fresh weight (Fig. 9).For tomato, fresh weight does not decrease markedlyduring the day, indicating that net loss of water due totranspiration is compensated by increase of biomass ingrowth processes (Fig. 9a). At night, fresh weight increasesstrongly, reaching a 70% higher value within 24 h at thebeginning of the plant development and 20–30% at the endof the experiment. The growth conditions for the tobaccoexperiment were the same as described for the continuouslymonitored tomato plant. (For example, Fig. 9b showsrecords for 2 d). During the day, fresh weight decreases,indicating a loss of water due to transpiration. Duringthe night, fresh weight increases. After 24 h, fresh weightincreased from 1.92 g FW to 2.2 g FW, which correspondsto an increase of 15.5% of the initial plant biomass. Thediurnal variations of temperature and humidity, to whichplants of both species were exposed were similar and didnot correlate directly with biomass variations.This indicatesthat fresh weight increase is uncoupled from the small-scaledynamics of temperature and humidity variations in theenvironment.
DISCUSSION
In this study, we were able to show a clear correlationbetween DCF and plant fresh weight, demonstrating theapplicability of the established non-invasive method forplant biomass determination. The measurement principleallows for rapid detection of plant biomass (within severalseconds) which is an important prerequisite for futurehigh-throughput applications of the method. Here, wefirst demonstrated the capability of the device to registerplant fresh weight evolution throughout some days withhigh temporal resolution. A net increase in biomasswas observable throughout 24 h, corresponding to typicalgrowth rates of the investigated plants reported before
(tobacco: Walter & Schurr 1999; tomato: Nagel, Konings &Lambers 2001). Within a diel cycle (24 h), the detectedfresh weight did not increase monotonically, indicatingalterations in plant water status superimposed on growth:The water balance of a plant is characterized by U – E =G + H, where U and E are the transpiration and wateruptake fluxes, and G and H are the ‘storage fluxes’ forgrowth and rehydration (or dehydration), respectively(Boyer 1985). During the day, there is a net water loss intobacco but not in tomato. This does not imply negativegrowth throughout the day in tobacco, but it indicates thatthe relation between growth and daily change in hydrationdiffers between the two species. The difference in thedynamics of fresh weight evolution between tobacco andtomato during the analysis interval (Fig. 9) indicatesclearly that joint applications of this method and methodsdetermining plant water status will allow differences to beresolved in growth dynamics of the investigated plants.Similar investigations based on differential weighing ofpeach trees have led to an improved understanding of treephysiology and to suggestions for improved irrigationmanagement (Simonneau et al. 1993). A dramatic effectof altered transpiration timing on the timing of growthprocesses has been reported recently for the facultativeCrassulacean Acid Metabolism (CAM) plant Clusia minor(Walter et al. 2008). There, maximal growth activity shiftedfrom early night to early day when the plant switchedfrom C3 to CAM-mode of photosynthesis during droughtstress. This indicates that the dynamics of growth pro-cesses can only be revealed, when water status and growthare investigated in parallel, requiring non-invasive, high-resolution methods for joint analyses.
A possible explanation for the observed difference in dielfresh weight increase of tobacco and tomato is that theirdiel growth behaviour might differ in phasing; tobaccoleaves expand strongest at dawn (Walter & Schurr 2005),with maximal intensity lasting from some hours beforeonset of lights to some hours after onset of lights. Duringthis time interval, shoot fresh weight first increases strongly(during the end of the night, Fig. 9) and then decreasesagain (beginning of the day) while at the same time, carbo-hydrates necessary for dry weight increase are producedagain via photosynthesis (beginning of the day). The strongloss of fresh weight during the day, which is caused bytranspiration being higher than the sum of water uptakeand growth, might make it impossible for tobacco to keepup high growth rates. In tomato, this diurnal loss is not aspronounced as in tobacco, making high growth during theday more favourable and potentially leading to an increaseof leaf expansion during daytime. Such an increase has beenreported in other species before (poplar: Matsubara et al.2006, soybean: Ainsworth et al. 2006). Also for tomato,high rates of fresh weight increase towards the end of theday and at night have been reported before (Van Ieperen& Madery 1994). A clear advantage over the methoddescribed in Van Ieperen & Madery (1994) is that ourapproach allows rapid analyses of several plants grown indifferent conditions, as the measurement device is portable,
376 M. I. Menzel et al.
© 2009 Blackwell Publishing Ltd, Plant, Cell and Environment, 32, 368–379

while the hydroponically based setup of Van Ieperen andMadery (as well as the set-up described for tree growthevaluation by Simonneau et al. 1993) requires the plant tobe cultivated within the analysis device. This flexibility ofthe set-up has been utilized for the calibration proceduresdepicted in Figs 5–7, for which several plants were analysedsequentially. It has to be pointed out though, that thecorrelation between DCF and real plant fresh weight has tobe re-evaluated at different points in time throughout
the diel cycle and not only at one point in time (as per-formed here).
Our research plans for the future are twofold. The firstaim is to establish the described method as a tool for plantphenotyping. Here, the technical challenge is the extensionof the method to plant species and organs with pro-nounced differences in water content per tissue volume(e.g. fruits versus sklerenchymatic leaves) and the devel-opment of a reliable data base of underlying correlations.
(a)
(b)
Figure 9. Continuous non-invasive measurement of fresh weight to monitor diurnal growth of (a) an intact tomato plant over a periodof 4 d and (b) an intact tobacco plant over a period of 2 d. Air temperature and relative humidity were monitored in parallel. Grey areasindicate dark periods.
Biomass determination with microwave resonators 377
© 2009 Blackwell Publishing Ltd, Plant, Cell and Environment, 32, 368–379

This application would greatly benefit from multiplexingof the experiments (automated plant screening with mul-tiple and multiplexed resonators) in order to automati-cally scan high replicate numbers of plants for growthanalyses as well as for optimized irrigation schemes.Second, hinged resonators will be constructed, which caneasily be opened, mounted around a plant and closedagain. This will allow easier handling of the device and willhence facilitate, for example, field experiments. Althoughsuch devices are no real technical challenge, their applica-tion will require careful calibrations and constraints insample positioning.
CONCLUSIONS
The measurement of dielectric properties of a cavity reso-nator with inserted plant material provides a novel tool tomeasure the water content of plants which can then berelated to shoot growth under controlled environmentalconditions. Although the method is indirect, relatingdielectric properties of a microwave resonator to freshweight, it is in many aspects superior to weighing proce-dures or other less applicable and less reliable remote-sensing-based non-destructive methods described in theintroduction. In future experiments, this procedure willbe applied for phenotyping of different genetic material,for analysis of fresh weight distribution within the plant(scanning single organs) and it will be developed into afield method, using larger resonators with custom-tailoreddesign.
ACKNOWLEDGMENTS
The authors recognize and appreciate support throughfunding by Technology Transfer Department, Forschung-szentrum Jülich and support through providing a minia-turized electronic module by Jülicher SQUID GmbH.
REFERENCES
Ainsworth E.A., Rogers A., Vodkin L.O., Rogers A., Walter A. &Schurr U. (2006) The effects of elevated CO2 concentration onsoybean gene expression. An analysis of growing and matureleaves. Plant Physiology 142, 135–147.
Boyer J.S. (1985) Water transport. Annual Review of Plant Physi-ology and Plant Molecular Biology 36, 473–516.
Cermak J., Kucera J., Bauerle W.L., Phillips N. & Hinkley T.M.(2007) Tree water storage and its diurnal dynamics related to sapflow and changes in stem volume in old-growth Douglas-fir trees.Tree Physiology 27, 181–198.
Ferrazzoli P., Paloscia S., Pampaloni P., Schiavon G., Solimini D.& Coppo P. (1992) Sensitivity of microwave measurements tovegetation biomass and soil moisture content – a case study.IEEE Transactions on Geoscience and Remote Sensing 30, 750–756.
Granier C., Aguirrezabal L., Chenu K., et al. (2006)PHENOPSIS, an automated platform for reproducible pheno-typing of plant responses to soil water deficit in Arabidopsisthaliana permitted the identification of an accession with low
sensitivity to soil water deficit. The New Phytologist 169, 623–635.
Herrmann R., Sikora J. & Zaage S. (1997) Feuchtemessung mitMikrowellen-Resonatoren. Technisches Messen 64, 11.
Hu L.Z., Toyoda K. & Ihara I. (2008) Dielectric properties ofedible oils and fatty acids as a function of frequency, tempera-ture, moisture and composition. Journal of Food Engineering88, 151–158.
Jiang Z. & Staude W. (1989) An interferometric method for plantgrowth measurements. Journal of Experimental Botany 40, 1169–1173.
Jones C.L., Stone M.L., Maness N.O., Solie J.B. & Brusewitz G.H.(2006) Plant biomass estimation using dielectric properties.ASABE Annual Meeting 2006, 9–12.
Krause H.-J., Dang C., Klein N., Dumat F. & Rath E. (2006) Dielec-tric microwave resonator for non-destructive evaluation ofmoisture and salinity. Deutsche Gesellschaft für ZerstörungsfreiePrüfung, Berlin, Berichtsband BB 103-CD.
Leister D., Varotto C., Pesaresi P., Niwergall A. & Salamini F.(1999) Large-scale evaluation of plant growth in Arabidopsisthaliana by non-invasive image analysis. Plant Physiology andBiochemistry 37, 671–678.
Leschnik W. (1999) Feuchtemessung an Baustoffen – ZwischenKlassik und Moderne. Deutsche Gesellschaft für ZerstörungsfreiePrüfung, Berlin, Berichtsband BB 69-CD.
Matsubara S., Hurry V., Druart N., Benedict C., Janzik I., Chavarria-Krauser A., Walter A. & Schurr U. (2006) Nocturnal changes inleaf growth of Populus deltoides are controlled by cytoplasmicgrowth. Planta 223, 1315–1328.
Meyer R.C., Torjek O., Becher M. & Altmann T. (2004) Heterosisof biomass production in Arabidopsis. Establishment duringearly development. Plant Physiology 134, 1813–1823.
Nagel O.W., Konings H. & Lambers H. (2001) Growth rate andbiomass partitioning of wild type and low-gibberellin tomato(Solanum lycopersicum) plants growing at a high and low nitro-gen supply. Physiologia Plantarum 111, 33–39.
Nelson S.O. (1991) Dielectric properties of agricultural products.IEEE Transaction on Electrical Insulation 26, 845–869.
Nozue K. & Maloof J.N. (2006) Diurnal regulation of plant growth.Plant, Cell & Environment 29, 396–408.
Omasa K., Qui G.Y., Watanuki K., Yoshimi K. & Akiyama Y.(2003) Accurate estimation of forest carbon stocks by 3-Dremote sensing of individual trees. Environmental Science &Technology 37, 1198–1201.
Schmundt D., Stitt M., Jaehne B. & Schurr U. (1998) Quantitativeanalysis of the local rates of growth of dicot leaves at a hightemporal and spatial resolution, using image sequence analysis.The Plant Journal 16, 505–514.
Simonneau T., Habib R., Goutouly J.P. & Huguet J.G. (1993)Diurnal changes in stem diameter depend upon variations inwater-content – direct evidence in peach-trees. Journal ofExperimental Botany 44, 615–621.
Trabelsi S. & Nelson S.O. (2003) Free-space measurement ofdielectric properties of cereal grain and oilseed at microwavefrequencies. Measurement Science and Technology 14, 589–600.
Van Ieperen W. & Madery H. (1994) A new method to measureplant water uptake and transpiration simultaneously. Journalof Experimental Botany 45, 51–60.
Walter A. & Schurr U. (1999) The modular character of growth inNicotiana tabacum plants under steady-state nutrition. Journalof Experimental Botany 50, 1169–1177.
Walter A. & Schurr U. (2005) Dynamics of leaf and root growth:endogenous control versus environmental impact. Annals ofBotany 95, 891–900.
Walter A., Scharr H., Gilmer F., et al. (2007) Dynamics of seedling
378 M. I. Menzel et al.
© 2009 Blackwell Publishing Ltd, Plant, Cell and Environment, 32, 368–379

growth acclimation towards altered light conditions can be quan-tified via GROWSCREEN: a setup and procedure designed forrapid optical phenotyping of different plant species. The NewPhytologist 174, 447–455.
Walter A., Christ M.M., Rascher U., Schurr U. & Osmond B. (2008)Diel leaf growth cycles in Clusia spp. are related to changesbetween C3 photosynthesis and crassulacean acid metabolismduring development and during water stress. Plant, Cell & Envi-ronment 31, 484–491.
Wigneron J.P., Calvet J.C., Pellarin T., Van de Griend A.A.,Berger M. & Ferrazzoli P. (2003) Retrieving near-surface soil
moisture from microwave radiometric observations: currentstatus and future plans. Remote Sensing of Environment 85, 489–506.
Zinke O. & Brunswig H. (2000) Hochfrequenztechnik 1: Hochfre-quenzfilter, Leitungen, Antennen. Springer, Berlin, Germany.
Zweifel R., Item H. & Hasler R. (2001) Link between diurnal stemradius changes and tree water relations. Tree Physiology 21,869–877.
Received 7 October 2008; received in revised form 27 November2008; accepted for publication 10 December 2008
Biomass determination with microwave resonators 379
© 2009 Blackwell Publishing Ltd, Plant, Cell and Environment, 32, 368–379