Nitrogen cycling on the Namibian shelf and slope over the last two climatic cycles: Local and global...
13
Nitrogen cycling on the Namibian shelf and slope over the last two climatic cycles: Local and global forcings Laetitia Pichevin, 1 Philippe Martinez, Philippe Bertrand, Ralph Schneider, and Jacques Giraudeau De ´partement de Ge ´ologie et Oce ´anographie, Universite ´ Bordeaux I, Universite ´ Mixte de Recherche-Centre National de la Recherche Scientifique, Talence, Cedex, France Kay Emeis Institute of Biogeochemistry and Marine Chemistry, University of Hamburg, Hamburg, Germany Received 16 December 2003; revised 12 January 2005; accepted 17 February 2005; published 4 May 2005. [1] In the light of new surface sediment d 15 N data collected over the Namibian shelf and slope, we examined glacial-interglacial variations of N inventory in the area of Lu ¨deritz (25°6S) by deciphering d 15 N signals of three cores distributed from the upper to the lower continental slope. The lower slope cores display low d 15 N during cold periods and high d 15 N during climatic optima, akin to many other records from the world ocean, whereas the upper slope core displays a high-frequency low-amplitude d 15 N signal without obvious glacial-interglacial variability. This dissimilarity results from the segregation of the upwelling structure in two cells, decoupling nutrient dynamics of the shelf from those beyond the shelf-edge. The d 15 N signal of the coastal cell is relatively constant irrespective of wind strength variations and shows that nitrate was never depleted in the surface water. For the deeper cores, comparisons between N isotopic signals and indicators of paleoproductivity (total organic carbon) and upwelling intensity (sea surface temperature and dust grain size) reveal that, over Milankovitch cycles, nitrate delivery to the photic zone was driven by the nutrient richness of the South Atlantic Central Water (depending, in turn, on Aghulas water inflow and denitrification at a global scale) rather than by atmospheric forcing. We propose that the d 15 N signals of the deeper cores do not only mirror changes in relative nitrate utilization, as it seems the case over annual timescales, but are arguably influenced by global ocean changes in middepth nitrate d 15 N. Citation: Pichevin, L., P. Martinez, P. Bertrand, R. Schneider, J. Giraudeau, and K. Emeis (2005), Nitrogen cycling on the Namibian shelf and slope over the last two climatic cycles: Local and global forcings, Paleoceanography , 20, PA2006, doi:10.1029/2004PA001001. 1. Introduction [2] The Benguela upwelling system (BUS) is considered to have played a significant role as a carbon sink, especially since the closing of the Central American Isthmus, about 3 Myr ago [Hay and Brock, 1992]. The BUS is today the world’s most productive eastern boundary current [Carr, 2002]. Whether local productivity in the past was mainly new production or related to processes of nutrient recycling is a tricky issue. Solving this question is, however, an essential prerequisite for estimates of the net CO 2 pumping attributable to this upwelling through the past and, ultimately, for forecasts of the future climate changes. In this regard, the mechanisms that control the local nutrient budget (nutrient loss, supply, utilization and recycling) and their variations with climate changes must be addressed. To date, only a few studies deal with cross-shore distribution of nutrients in the surface water of the modern BUS [Dittmar and Birkicht, 2001; Tyrell and Lucas, 2002; Holmes et al., 2002]. Fewer still are those which attempt to reconstruct past variations of the surface nutrient inventory [Holmes et al., 1999] from nearshore to offshore locations [Lavik, 2001]. [3] In this study, we intend to untangle the d 15 N signals of three sediment cores distributed from the upper to the lower continental slope off Namibia in order to assess changes in marine nitrogen inventory during the last 240 kyr. In the ensuing discussion, we use lithogenic grain size distribution and sea surface temperatures (SSTs) records as additional proxies for wind strength and upwelling intensity, respec- tively, and total organic carbon (TOC) and organic carbon accumulation rates (MARCorg) values as paleoproductivity indicators. Sediment core records are interpreted in the light of new d 15 N measurements from surface sediments which give insights into processes governing N cycling in the modern BUS. 2. Fate of Marine Nitrogen and the D 15 N Signal [4] The d 15 N of the global nitrate pool averages 5% [Sigman et al., 1997]. This value represents the balance PALEOCEANOGRAPHY, VOL. 20, PA2006, doi:10.1029/2004PA001001, 2005 1 Now at Centre Europe ´en de Recherche et d’Enseignement des Ge ´osciences de l’Environnement, Europole Me ´diterrane ´en de l’Arbois, Aix en Provence, France. Copyright 2005 by the American Geophysical Union. 0883-8305/05/2004PA001001$12.00 PA2006 1 of 13
-
Upload
univ-bordeaux -
Category
Documents
-
view
5 -
download
0
Transcript of Nitrogen cycling on the Namibian shelf and slope over the last two climatic cycles: Local and global...
Nitrogen cycling on the Namibian shelf and slope over the last
two climatic cycles: Local and global forcings
Laetitia Pichevin,1 Philippe Martinez, Philippe Bertrand, Ralph Schneider,
and Jacques GiraudeauDepartement de Geologie et Oceanographie, Universite Bordeaux I, Universite Mixte de Recherche-Centre National de laRecherche Scientifique, Talence, Cedex, France
Kay EmeisInstitute of Biogeochemistry and Marine Chemistry, University of Hamburg, Hamburg, Germany
Received 16 December 2003; revised 12 January 2005; accepted 17 February 2005; published 4 May 2005.
[1] In the light of new surface sediment d15N data collected over the Namibian shelf and slope, we examinedglacial-interglacial variations of N inventory in the area of Luderitz (25�6S) by deciphering d15N signals of threecores distributed from the upper to the lower continental slope. The lower slope cores display low d15N duringcold periods and high d15N during climatic optima, akin to many other records from the world ocean, whereasthe upper slope core displays a high-frequency low-amplitude d15N signal without obvious glacial-interglacialvariability. This dissimilarity results from the segregation of the upwelling structure in two cells, decouplingnutrient dynamics of the shelf from those beyond the shelf-edge. The d15N signal of the coastal cell is relativelyconstant irrespective of wind strength variations and shows that nitrate was never depleted in the surface water.For the deeper cores, comparisons between N isotopic signals and indicators of paleoproductivity (total organiccarbon) and upwelling intensity (sea surface temperature and dust grain size) reveal that, over Milankovitchcycles, nitrate delivery to the photic zone was driven by the nutrient richness of the South Atlantic Central Water(depending, in turn, on Aghulas water inflow and denitrification at a global scale) rather than by atmosphericforcing. We propose that the d15N signals of the deeper cores do not only mirror changes in relative nitrateutilization, as it seems the case over annual timescales, but are arguably influenced by global ocean changes inmiddepth nitrate d15N.
Citation: Pichevin, L., P. Martinez, P. Bertrand, R. Schneider, J. Giraudeau, and K. Emeis (2005), Nitrogen cycling on the Namibian
shelf and slope over the last two climatic cycles: Local and global forcings, Paleoceanography, 20, PA2006,
doi:10.1029/2004PA001001.
1. Introduction
[2] The Benguela upwelling system (BUS) is consideredto have played a significant role as a carbon sink, especiallysince the closing of the Central American Isthmus, about3 Myr ago [Hay and Brock, 1992]. The BUS is todaythe world’s most productive eastern boundary current[Carr, 2002]. Whether local productivity in the pastwas mainly new production or related to processes ofnutrient recycling is a tricky issue. Solving this questionis, however, an essential prerequisite for estimates of thenet CO2 pumping attributable to this upwelling throughthe past and, ultimately, for forecasts of the future climatechanges. In this regard, the mechanisms that control thelocal nutrient budget (nutrient loss, supply, utilization andrecycling) and their variations with climate changes mustbe addressed. To date, only a few studies deal with
cross-shore distribution of nutrients in the surface waterof the modern BUS [Dittmar and Birkicht, 2001; Tyrelland Lucas, 2002; Holmes et al., 2002]. Fewer still arethose which attempt to reconstruct past variations of thesurface nutrient inventory [Holmes et al., 1999] fromnearshore to offshore locations [Lavik, 2001].[3] In this study, we intend to untangle the d15N signals of
three sediment cores distributed from the upper to the lowercontinental slope off Namibia in order to assess changes inmarine nitrogen inventory during the last 240 kyr. In theensuing discussion, we use lithogenic grain size distributionand sea surface temperatures (SSTs) records as additionalproxies for wind strength and upwelling intensity, respec-tively, and total organic carbon (TOC) and organic carbonaccumulation rates (MARCorg) values as paleoproductivityindicators. Sediment core records are interpreted in the lightof new d15N measurements from surface sediments whichgive insights into processes governing N cycling in themodern BUS.
2. Fate of Marine Nitrogen and the D15N Signal
[4] The d15N of the global nitrate pool averages 5%[Sigman et al., 1997]. This value represents the balance
PALEOCEANOGRAPHY, VOL. 20, PA2006, doi:10.1029/2004PA001001, 2005
1Now at Centre Europeen de Recherche et d’Enseignement desGeosciences de l’Environnement, Europole Mediterraneen de l’Arbois,Aix en Provence, France.
Copyright 2005 by the American Geophysical Union.0883-8305/05/2004PA001001$12.00
PA2006 1 of 13
between inputs and sinks of marine nitrogen at a globalscale, namely river supply, N2 fixation, burial (followingbiological utilization) and denitrification [Brandes andDevol, 2002]. Fixation of atmospheric nitrogen by diazo-trophic primary producers does not involve observablefractionation and d15N of the fixed nitrogen is close to0% [Brandes et al., 1998]. Meanwhile, in the near absenceof oxygen, water column denitrification transforms avail-able nitrogen species to gaseous products, strongly discrim-inating against 15N. As a result, in areas adjoining oxygenminimum zones (OMZs) in the equatorial and easterntropical North Pacific (ETNP) and equatorial and easterntropical South Pacific (ETSP) and the Indian Ocean, veryhigh d15NNO3� values are measured [Brandes et al., 1998,Ganeshram et al., 2000].[5] Although N fixation can support productivity in some
areas, new production is mainly sustained by advection orupwelling of new nitrate to the photic zone. Duringphytoplankton blooms, nitrate uptake is accompanied byfractionation that leads to an enrichment of the organicproduct in 14N. The phytoplankton biomass is thus depletedin 15N by a factor of e (fractionation factor) relative to theremaining nitrate pool which is symmetrically enriched in15NNO3� approximated by first-order Rayleigh fractionationkinetics.[6] As the nutrient-rich water is advected offshore, the
available nitrate pool becomes progressively consumed byproducers and its isotopic composition shows increasingd15N values. As a result, producers growing on the residualpool will incorporate a greater proportion of 15N thanproducers directly growing in the upwelled source waters.Thus, for a given starting pool of nitrate, a larger degree ofrelative nutrient utilization will produce an enrichment ofsedimentary d15N [Wada, 1980; Mariotti et al., 1982;Altabet and Francois, 1994; Martinez et al., 2000]. Never-theless, many other biochemical mechanisms can affect thed15N signal, i.e., nitrogen transfer through trophic levels[Minagawa and Wada, 1984; Montoya and McCarthy,1995], relative abundance of terrestrial and marine organicmatter (OM) [Sweeney and Kapland, 1980], OM decay inthe water column and during early diagenesis [e.g., Altabet,1991; Francois et al., 1993; Freudenthal et al., 2001;Lehmann et al., 2003].
3. Methods
3.1. Samples and Stratigraphy
[7] The transect studied was recovered in 1996 on theR/V Marion Dufresne during the NAUSICAA cruise. Thecore MD962086 (25.81�S, 12.13�E) is located at 3606 mwater depth and MD962098 (25.59�S, 12.63�E) at 2909 mwater depth, both on the lower slope. MD962087 (25.6�S,13.38�E) lies under 1029 m water depth, on the upper slope.[8] The stratigraphies for MD962086 and 98 are based
on oxygen isotope analyses of the benthic foraminiferaCibicidoides wuellerstorfi [Bertrand et al., 2000]. Theserecords were correlated with the normalized SPECMAPstandard record [Imbrie et al., 1984]. MD962087 stratig-raphy for the last 40 kyr was given by seven AMS 14Cdates (Table 1) determined on mixed planktic foraminifers
[Pichevin et al., 2004]. A 400-year reservoir correctionwas applied and dates were converted into calendar agesby using the Calib 4.3 program [Stuiver et al., 1998]. Aspreviously described in the work of Pichevin et al. [2004],the age model for the oldest part of the core results fromthe correlation between TOC and CaCO3 records ofMD962087 and those of MD962098, MD962086 andbetween SSTs of MD962087 and GEOB 1712-4 (offWalvis Bay, 998 m water depth) published in the workof Kirst et al. [1999]. Surface sediments were collectedin spring 2004 with the R/V Alexander von Humbold(K. Emeis, unpublished data, 2004).
3.2. Experiment
[9] The nitrogen content and isotopic composition ofMD962098 and 87 was analyzed on bulk sediment sampleswith a Micromass mass spectrometer at the DGO (Universityof Bordeaux). For MD962086, N isotopes were measured atthe University of British Columbia (by Tom Pedersen) with aFinnigan delta plus mass spectrometer and some sampleswere also analyzed in Bordeaux to ensure comparability,which was found to be within ±0, 2%. The d15N and TOCmeasurements were performed at average sampling intervalsof 1 kyr. Apparent relative nitrate utilization was estimatedfor the deep cores assuming first-order fractionation kinetics,and by deriving the equation of Altabet and Francois [1994]:
d15NO�3 fð Þ ¼ d15NO�
3 f¼1ð Þ � e� ln fð Þ ð1Þ
d15Nsed fð Þ ¼ d15NO�3 fð Þ � e; ð2Þ
where F is the fraction of unutilized, remaining nitrate,d15NO3(f=1)
� is the isotopic value of initial nitrate (5, 5%),d15NO3(f )
� is the isotopic value of remaining nitrate andd15Nsed(f) is the isotopic value of sedimentary N (instanta-neous product). We chose a fractionation coefficient of 5%,based on recent observations [Holmes et al., 1998].[10] N isotopic signals of surface sediments were measured
in the Institute of Biogeochemistry and Marine Chemistry,University of Hamburg (K. Emeis, unpublished data, 2004).[11] TOC (wt%) was measured by elemental analyses
(LECO). The mass accumulation rate of organic carbon(MARCorg) was calculated as following:
MARCorg g cm�2 kyr�1� �
¼ TOC wt%ð Þ � SR cm kyr�1� �
� DBD g cm�3� �
=100; ð3Þ
where SR is the sedimentation rate calculated between twoidentified isotopic events or radio carbon dates and DBD isthe dry bulk density based on the MST signals measured onboard the Marion Dufresne.[12] The SSTs estimates are based on alkenone measure-
ments. Long-chain unsaturated ketones were extracted andanalyzed by gas chromatography (J. Villanueva, unpub-lished data, 1999) following the methodology described inthe work of Villanueva and Grimalt [1997]. The U37
K values
PA2006 PICHEVIN ET AL: NITROGEN CYCLING NAMIBIA
2 of 13
PA2006
were converted into temperatures by applying the equationof Prahl et al. [1988]. SSTs were estimated with aresolution of 1 to 10 kyr depending on the core and thetime slice.[13] Grain size analyses were performed on the lithogenic
fraction of MD962087. Sampling interval is 700 years onaverage. In order to isolate the terrigenous inorganicmaterial, carbonates, OM and biosilica were successivelyremoved by using HCl (at 20�C), H2O2 (30% at 50�Cduring 3 to 4 days) and NaOH (30% at 80�C for 6–8 hours). Microscopic observations of smear slides showedthat the biogenic constituents were properly removed bythe chemical treatment. The grain size distribution of theremainder was measured with a Laser Malvern Mastersizer[Pichevin et al., 2005].
4. Today’s Water Mass and Nutrient Dynamics
4.1. Setting
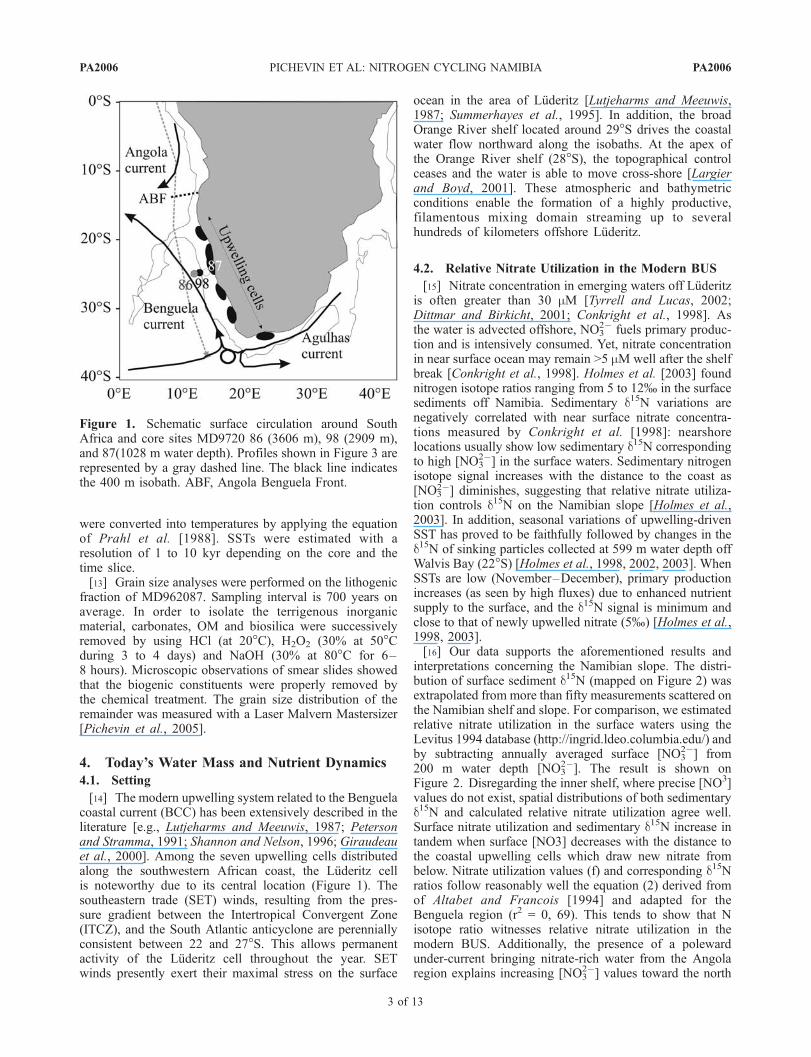
[14] The modern upwelling system related to the Benguelacoastal current (BCC) has been extensively described in theliterature [e.g., Lutjeharms and Meeuwis, 1987; Petersonand Stramma, 1991; Shannon and Nelson, 1996; Giraudeauet al., 2000]. Among the seven upwelling cells distributedalong the southwestern African coast, the Luderitz cellis noteworthy due to its central location (Figure 1). Thesoutheastern trade (SET) winds, resulting from the pres-sure gradient between the Intertropical Convergent Zone(ITCZ), and the South Atlantic anticyclone are perenniallyconsistent between 22 and 27�S. This allows permanentactivity of the Luderitz cell throughout the year. SETwinds presently exert their maximal stress on the surface
ocean in the area of Luderitz [Lutjeharms and Meeuwis,1987; Summerhayes et al., 1995]. In addition, the broadOrange River shelf located around 29�S drives the coastalwater flow northward along the isobaths. At the apex ofthe Orange River shelf (28�S), the topographical controlceases and the water is able to move cross-shore [Largierand Boyd, 2001]. These atmospheric and bathymetricconditions enable the formation of a highly productive,filamentous mixing domain streaming up to severalhundreds of kilometers offshore Luderitz.
4.2. Relative Nitrate Utilization in the Modern BUS
[15] Nitrate concentration in emerging waters off Luderitzis often greater than 30 mM [Tyrrell and Lucas, 2002;Dittmar and Birkicht, 2001; Conkright et al., 1998]. Asthe water is advected offshore, NO3
2� fuels primary produc-tion and is intensively consumed. Yet, nitrate concentrationin near surface ocean may remain >5 mM well after the shelfbreak [Conkright et al., 1998]. Holmes et al. [2003] foundnitrogen isotope ratios ranging from 5 to 12% in the surfacesediments off Namibia. Sedimentary d15N variations arenegatively correlated with near surface nitrate concentra-tions measured by Conkright et al. [1998]: nearshorelocations usually show low sedimentary d15N correspondingto high [NO3
2�] in the surface waters. Sedimentary nitrogenisotope signal increases with the distance to the coast as[NO3
2�] diminishes, suggesting that relative nitrate utiliza-tion controls d15N on the Namibian slope [Holmes et al.,2003]. In addition, seasonal variations of upwelling-drivenSST has proved to be faithfully followed by changes in thed15N of sinking particles collected at 599 m water depth offWalvis Bay (22�S) [Holmes et al., 1998, 2002, 2003]. WhenSSTs are low (November–December), primary productionincreases (as seen by high fluxes) due to enhanced nutrientsupply to the surface, and the d15N signal is minimum andclose to that of newly upwelled nitrate (5%) [Holmes et al.,1998, 2003].[16] Our data supports the aforementioned results and
interpretations concerning the Namibian slope. The distri-bution of surface sediment d15N (mapped on Figure 2) wasextrapolated from more than fifty measurements scattered onthe Namibian shelf and slope. For comparison, we estimatedrelative nitrate utilization in the surface waters using theLevitus 1994 database (http://ingrid.ldeo.columbia.edu/) andby subtracting annually averaged surface [NO3
2�] from200 m water depth [NO3
2�]. The result is shown onFigure 2. Disregarding the inner shelf, where precise [NO3]values do not exist, spatial distributions of both sedimentaryd15N and calculated relative nitrate utilization agree well.Surface nitrate utilization and sedimentary d15N increase intandem when surface [NO3] decreases with the distance tothe coastal upwelling cells which draw new nitrate frombelow. Nitrate utilization values (f) and corresponding d15Nratios follow reasonably well the equation (2) derived fromof Altabet and Francois [1994] and adapted for theBenguela region (r2 = 0, 69). This tends to show that Nisotope ratio witnesses relative nitrate utilization in themodern BUS. Additionally, the presence of a polewardunder-current bringing nitrate-rich water from the Angolaregion explains increasing [NO3
2�] values toward the north
Figure 1. Schematic surface circulation around SouthAfrica and core sites MD9720 86 (3606 m), 98 (2909 m),and 87(1028 m water depth). Profiles shown in Figure 3 arerepresented by a gray dashed line. The black line indicatesthe 400 m isobath. ABF, Angola Benguela Front.
PA2006 PICHEVIN ET AL: NITROGEN CYCLING NAMIBIA
3 of 13
PA2006
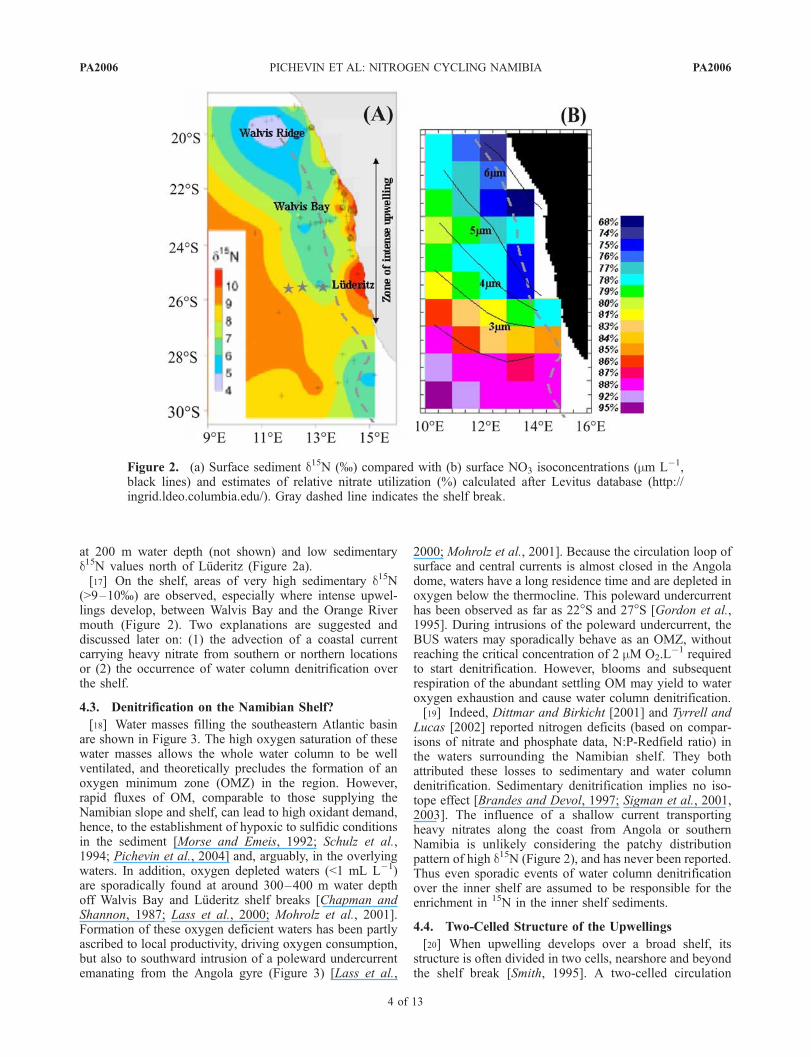
at 200 m water depth (not shown) and low sedimentaryd15N values north of Luderitz (Figure 2a).[17] On the shelf, areas of very high sedimentary d15N
(>9–10%) are observed, especially where intense upwel-lings develop, between Walvis Bay and the Orange Rivermouth (Figure 2). Two explanations are suggested anddiscussed later on: (1) the advection of a coastal currentcarrying heavy nitrate from southern or northern locationsor (2) the occurrence of water column denitrification overthe shelf.
4.3. Denitrification on the Namibian Shelf?
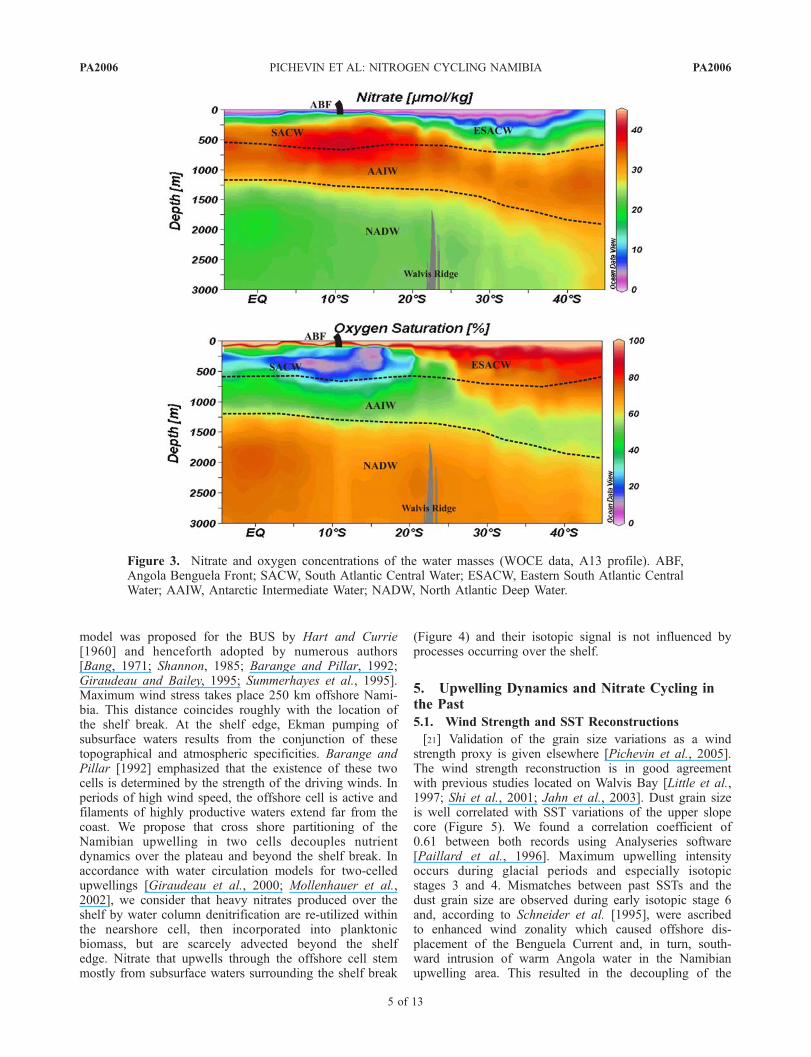
[18] Water masses filling the southeastern Atlantic basinare shown in Figure 3. The high oxygen saturation of thesewater masses allows the whole water column to be wellventilated, and theoretically precludes the formation of anoxygen minimum zone (OMZ) in the region. However,rapid fluxes of OM, comparable to those supplying theNamibian slope and shelf, can lead to high oxidant demand,hence, to the establishment of hypoxic to sulfidic conditionsin the sediment [Morse and Emeis, 1992; Schulz et al.,1994; Pichevin et al., 2004] and, arguably, in the overlyingwaters. In addition, oxygen depleted waters (<1 mL L�1)are sporadically found at around 300–400 m water depthoff Walvis Bay and Luderitz shelf breaks [Chapman andShannon, 1987; Lass et al., 2000; Mohrolz et al., 2001].Formation of these oxygen deficient waters has been partlyascribed to local productivity, driving oxygen consumption,but also to southward intrusion of a poleward undercurrentemanating from the Angola gyre (Figure 3) [Lass et al.,
2000; Mohrolz et al., 2001]. Because the circulation loop ofsurface and central currents is almost closed in the Angoladome, waters have a long residence time and are depleted inoxygen below the thermocline. This poleward undercurrenthas been observed as far as 22�S and 27�S [Gordon et al.,1995]. During intrusions of the poleward undercurrent, theBUS waters may sporadically behave as an OMZ, withoutreaching the critical concentration of 2 mM O2.L
�1 requiredto start denitrification. However, blooms and subsequentrespiration of the abundant settling OM may yield to wateroxygen exhaustion and cause water column denitrification.[19] Indeed, Dittmar and Birkicht [2001] and Tyrrell and
Lucas [2002] reported nitrogen deficits (based on compar-isons of nitrate and phosphate data, N:P-Redfield ratio) inthe waters surrounding the Namibian shelf. They bothattributed these losses to sedimentary and water columndenitrification. Sedimentary denitrification implies no iso-tope effect [Brandes and Devol, 1997; Sigman et al., 2001,2003]. The influence of a shallow current transportingheavy nitrates along the coast from Angola or southernNamibia is unlikely considering the patchy distributionpattern of high d15N (Figure 2), and has never been reported.Thus even sporadic events of water column denitrificationover the inner shelf are assumed to be responsible for theenrichment in 15N in the inner shelf sediments.
4.4. Two-Celled Structure of the Upwellings
[20] When upwelling develops over a broad shelf, itsstructure is often divided in two cells, nearshore and beyondthe shelf break [Smith, 1995]. A two-celled circulation
Figure 2. (a) Surface sediment d15N (%) compared with (b) surface NO3 isoconcentrations (mm L�1,black lines) and estimates of relative nitrate utilization (%) calculated after Levitus database (http://ingrid.ldeo.columbia.edu/). Gray dashed line indicates the shelf break.
PA2006 PICHEVIN ET AL: NITROGEN CYCLING NAMIBIA
4 of 13
PA2006
model was proposed for the BUS by Hart and Currie[1960] and henceforth adopted by numerous authors[Bang, 1971; Shannon, 1985; Barange and Pillar, 1992;Giraudeau and Bailey, 1995; Summerhayes et al., 1995].Maximum wind stress takes place 250 km offshore Nami-bia. This distance coincides roughly with the location ofthe shelf break. At the shelf edge, Ekman pumping ofsubsurface waters results from the conjunction of thesetopographical and atmospheric specificities. Barange andPillar [1992] emphasized that the existence of these twocells is determined by the strength of the driving winds. Inperiods of high wind speed, the offshore cell is active andfilaments of highly productive waters extend far from thecoast. We propose that cross shore partitioning of theNamibian upwelling in two cells decouples nutrientdynamics over the plateau and beyond the shelf break. Inaccordance with water circulation models for two-celledupwellings [Giraudeau et al., 2000; Mollenhauer et al.,2002], we consider that heavy nitrates produced over theshelf by water column denitrification are re-utilized withinthe nearshore cell, then incorporated into planktonicbiomass, but are scarcely advected beyond the shelfedge. Nitrate that upwells through the offshore cell stemmostly from subsurface waters surrounding the shelf break
(Figure 4) and their isotopic signal is not influenced byprocesses occurring over the shelf.
5. Upwelling Dynamics and Nitrate Cycling inthe Past
5.1. Wind Strength and SST Reconstructions
[21] Validation of the grain size variations as a windstrength proxy is given elsewhere [Pichevin et al., 2005].The wind strength reconstruction is in good agreementwith previous studies located on Walvis Bay [Little et al.,1997; Shi et al., 2001; Jahn et al., 2003]. Dust grain sizeis well correlated with SST variations of the upper slopecore (Figure 5). We found a correlation coefficient of0.61 between both records using Analyseries software[Paillard et al., 1996]. Maximum upwelling intensityoccurs during glacial periods and especially isotopicstages 3 and 4. Mismatches between past SSTs and thedust grain size are observed during early isotopic stage 6and, according to Schneider et al. [1995], were ascribedto enhanced wind zonality which caused offshore dis-placement of the Benguela Current and, in turn, south-ward intrusion of warm Angola water in the Namibianupwelling area. This resulted in the decoupling of the
Figure 3. Nitrate and oxygen concentrations of the water masses (WOCE data, A13 profile). ABF,Angola Benguela Front; SACW, South Atlantic Central Water; ESACW, Eastern South Atlantic CentralWater; AAIW, Antarctic Intermediate Water; NADW, North Atlantic Deep Water.
PA2006 PICHEVIN ET AL: NITROGEN CYCLING NAMIBIA
5 of 13
PA2006
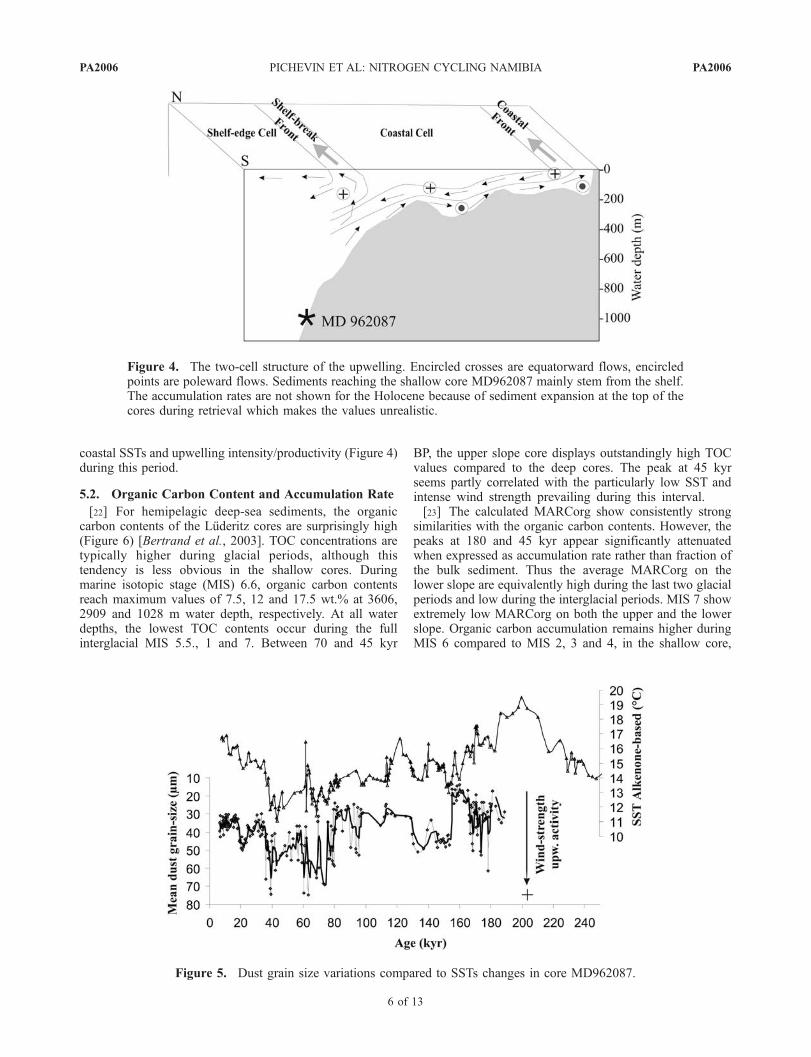
coastal SSTs and upwelling intensity/productivity (Figure 4)during this period.
5.2. Organic Carbon Content and Accumulation Rate
[22] For hemipelagic deep-sea sediments, the organiccarbon contents of the Luderitz cores are surprisingly high(Figure 6) [Bertrand et al., 2003]. TOC concentrations aretypically higher during glacial periods, although thistendency is less obvious in the shallow cores. Duringmarine isotopic stage (MIS) 6.6, organic carbon contentsreach maximum values of 7.5, 12 and 17.5 wt.% at 3606,2909 and 1028 m water depth, respectively. At all waterdepths, the lowest TOC contents occur during the fullinterglacial MIS 5.5., 1 and 7. Between 70 and 45 kyr
BP, the upper slope core displays outstandingly high TOCvalues compared to the deep cores. The peak at 45 kyrseems partly correlated with the particularly low SST andintense wind strength prevailing during this interval.[23] The calculated MARCorg show consistently strong
similarities with the organic carbon contents. However, thepeaks at 180 and 45 kyr appear significantly attenuatedwhen expressed as accumulation rate rather than fraction ofthe bulk sediment. Thus the average MARCorg on thelower slope are equivalently high during the last two glacialperiods and low during the interglacial periods. MIS 7 showextremely low MARCorg on both the upper and the lowerslope. Organic carbon accumulation remains higher duringMIS 6 compared to MIS 2, 3 and 4, in the shallow core,
Figure 4. The two-cell structure of the upwelling. Encircled crosses are equatorward flows, encircledpoints are poleward flows. Sediments reaching the shallow core MD962087 mainly stem from the shelf.The accumulation rates are not shown for the Holocene because of sediment expansion at the top of thecores during retrieval which makes the values unrealistic.
Figure 5. Dust grain size variations compared to SSTs changes in core MD962087.
PA2006 PICHEVIN ET AL: NITROGEN CYCLING NAMIBIA
6 of 13
PA2006
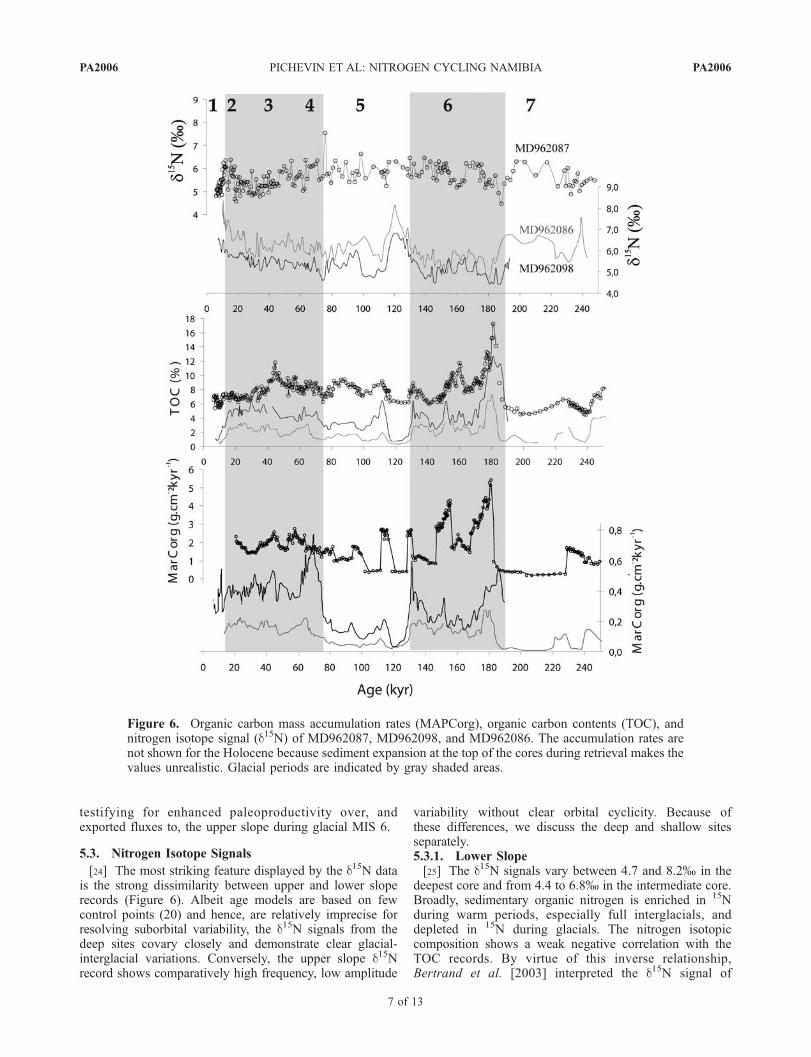
testifying for enhanced paleoproductivity over, andexported fluxes to, the upper slope during glacial MIS 6.
5.3. Nitrogen Isotope Signals
[24] The most striking feature displayed by the d15N datais the strong dissimilarity between upper and lower sloperecords (Figure 6). Albeit age models are based on fewcontrol points (20) and hence, are relatively imprecise forresolving suborbital variability, the d15N signals from thedeep sites covary closely and demonstrate clear glacial-interglacial variations. Conversely, the upper slope d15Nrecord shows comparatively high frequency, low amplitude
variability without clear orbital cyclicity. Because ofthese differences, we discuss the deep and shallow sitesseparately.5.3.1. Lower Slope[25] The d15N signals vary between 4.7 and 8.2% in the
deepest core and from 4.4 to 6.8% in the intermediate core.Broadly, sedimentary organic nitrogen is enriched in 15Nduring warm periods, especially full interglacials, anddepleted in 15N during glacials. The nitrogen isotopiccomposition shows a weak negative correlation with theTOC records. By virtue of this inverse relationship,Bertrand et al. [2003] interpreted the d15N signal of
Figure 6. Organic carbon mass accumulation rates (MAPCorg), organic carbon contents (TOC), andnitrogen isotope signal (d15N) of MD962087, MD962098, and MD962086. The accumulation rates arenot shown for the Holocene because sediment expansion at the top of the cores during retrieval makes thevalues unrealistic. Glacial periods are indicated by gray shaded areas.
PA2006 PICHEVIN ET AL: NITROGEN CYCLING NAMIBIA
7 of 13
PA2006

MD962086 as representing past surface nitrate utilization,lower values indicating lower nitrate utilization by primaryproducers during periods of high rate of nutrient supply andassociated productivity. The same interpretation was putforward by Holmes et al. [1999, 2002, 2003] both in themodern Benguela and ancient Angola systems. Compared tothe deepest core record, the d15N signal of MD962098 isconsistently lighter by almost 1%. The d15N signals increasewith increasing distance from the coast, hence, from theemerging source of new nutrients. This pattern is consistentwith the abovementioned ‘‘utilization scenario’’ proposedfor the modern BUS.5.3.2. Upper Slope[26] The 100-kyr climate cyclicity is not recorded in the
d15N signal of the nearshore core. The d15N values rangeapproximately between 4.5 and 6.5%. This range iscomparable with that of the intermediate core. AssumingRayleigh fractionation kinetics, this would suggest that, onaverage, past nutrient utilization was similar in the surfacewaters overlying both locations despite MD962087 beingmuch closer to the coast. Under a continuous upwellingcell, if the ‘‘utilization scenario’’ were applicable, the d15Nvalues on the upper slope would be expected to covarywith the lower slope records, over a consistently lowerrange of values. Instead, both the variations and the rangeof the d15N values recorded in MD962087 imply adecoupling in the nutrient dynamics between the lowerand upper slope locations. Alternatively, the signal ofMD962087 has been altered by other biochemical pro-cesses than those likely to have affected the deeper cores.
6. Implications
6.1. Explaining the Upper Slope D15N Signal
[27] Differences between upper (1000 m) and lower(>2900 m water depth) slope d15N signals can hardly bedue to biogeochemical reactions (such as OM degradation,diagenesis or denitrification) acting with variable intensitydepending on the water depth:[28] 1. More than 90% of settling OM is degraded
between the surface and 1000 m water depth [Suess,1980]. OM decay is thus negligible below this depth andcan hardly involve any noticeable deviation of the d15Nratio between upper and lower cores.[29] 2. Sedimentary denitrification, although implying
nitrogen isotopes fractionation, results in an isotope effectclose to zero because the nitrate used to remineralize theOM is almost completely consumed in the sediment[Brandes and Devol, 1997; Sigman et al., 2001, 2003].[30] 3. Incubation experiments [Lehmann et al., 2003],
sediment trap [Saino and Hattori, 1980; Altabet, 1991;Altabet et al., 1999a] and sediment core studies [Freudenthalet al., 2001], both in marine and lacustrine environments,give equivocal results concerning the isotope effect inducedby the early diagenetic decay of OM. Sedimentary OMmay undergo either enrichment or depletion in 15Nwhether microbial activity develops under oxic or anoxicconditions [Lehmann et al., 2002]. On the Namibianslope, bottom waters are currently oxygenated and porewater oxygen is rapidly consumed in the first 15 mm
below seafloor at any depth [Hensen et al., 2000]. Besideschanges in bottom water oxygenation which determinesthe ‘‘sign’’ of the fractionation (i.e., 15N enrichment anddepletion), the amount of degradable OM that reachesthe seafloor may influence the intensity of the d15Nshift [Freudenthal et al., 2001]. TOC and MARCorgof the three cores covary roughly. This implies that OMfluxes (and the ensuing diagenesis) increase and decreaseapproximately in phase for the three sites [Pichevin et al.,2004].[31] 4. Finally, terrigenous and inorganic nitrogen con-
tents of the Luderitz slope sediments are negligible, asthe OM is mainly of marine origin [Pichevin et al.,2004], and the N contents converge toward 0 for 0% TOC(Figure 7).[32] The upper slope is supplied by organic particles
originating from the overlying waters and, for a large part,from the outer shelf [Giraudeau et al., 2000]. Whendiscussing today’s nitrate cycling in the BUS, we assumedthat distinct d15N distribution pattern between slope andshelf surface sediments was likely due to the partitioning ofthe upwelling in two cells. We suggest that the decouplingof surface and subsurface water dynamics between near-shore and offshore upwelling cells largely contributes to theinconsistencies observed between the upper slope d15Nrecord and the deeper ones. Upper slope d15N records isassumed to mostly reflect processes occurring in the near-shore cell whereas the lower slope records witness Ncycling within the offshore cell.[33] Excluding isotopic substages 5.3, 5.5 and MIS 7,
TOC contents and accumulation rates are consistentlyvery high on the upper slope, indicating highly productiveconditions. In order to sustain such high productivity,nutrient requirements of the phytoplankton have to becovered. This implies efficient nitrate supply to the photiczone. The narrow amplitude of the d15N variationsrecorded in the upper slope sediments likely results fromthe fact that, even in periods of relatively weak winds andrelaxed upwelling dynamics, nitrate was never severelydepleted over the shelf. Limited OM accumulation onthe upper slope during the last interglacial, compared toMIS 2, has been attributed to reduced exportation incontext of high sea level stand, rather than decreasingpaleoproduction [Mollenhauer et al., 2002]. Thus TOCvariations in MD962087 are more likely caused by shiftsin sedimentation than by drastic changes in nitrate avail-ability and attendant productivity. Perennially consistentnearshore upwelling enables marine nitrogen repletion ofsurface waters and may explain the low amplitude changesof the N isotopic ratio in MD962087 and its mean valueclose to 5.5%.[34] This situation is in clear contradiction with present,
short term studies based on shallow trap sediments, whichshow that d15N and productivity are highly variable andseasonally driven by atmospheric and coastal water dynam-ics [Romero et al., 2002; Holmes et al., 2003, and referencestherein]. Hitherto, few data existed for the Namibian shelfand upper slope area. Further understanding of marinenitrogen cycling and hindcasting of paleoproductivityvariations in the nearshore cell require closer scrutiny
PA2006 PICHEVIN ET AL: NITROGEN CYCLING NAMIBIA
8 of 13
PA2006

through numerous d15N and TOCmeasurements of sedimentcores, trap and water samples.
6.2. Reconstruction of Nitrate Utilization in theDeep Sites
[35] In upwelling regions, it is widely believed thatproductivity is chiefly driven by wind strength. This wasoften shown in the west African coast over seasonal topluriannual timescales [e.g., Holmes et al., 1998, 2002,2003; Giraudeau et al., 2000; Romero et al., 2002].Schematically, as SET wind stress increases, upwelling ofsubsurface waters accelerates, nutrient supply to the photiczone increases and primary production is not limited bynutrient availability. As a consequence, relative nutrientutilization diminishes. In such a context, proxies for upwell-ing dynamics, nutrient availability and productivity varyclosely in tandem with interannual (El Nino/La Nina years)[Altabet, 2001] or seasonal cyclicities [Holmes et al., 2002;Romero et al., 2002]. Yet, such straightforward, causalrelationship between upwelling activity (in physical terms)and paleoproductivity has never been demonstrated on geo-logical timescales in the BUS, nor challenged.[36] The d15N is not a proxy for nutrient supply or
productivity, but for relative nitrate utilization as empha-sized by Altabet [2001]. However, once productivity andutilization changes are assessed, NO3 supply can be inferred.Using d15N records, we calculated the apparent relativeutilization in the two deep cores, assuming Raleigh fraction-ation kinetics [Atlabet and Francois, 1994], in order todetermine whether or not past nitrate availability and utili-zation mirror changes in offshore upwelling intensity (givenby the wind strength proxy).[37] Variations of the unutilized fraction of nitrate (f )
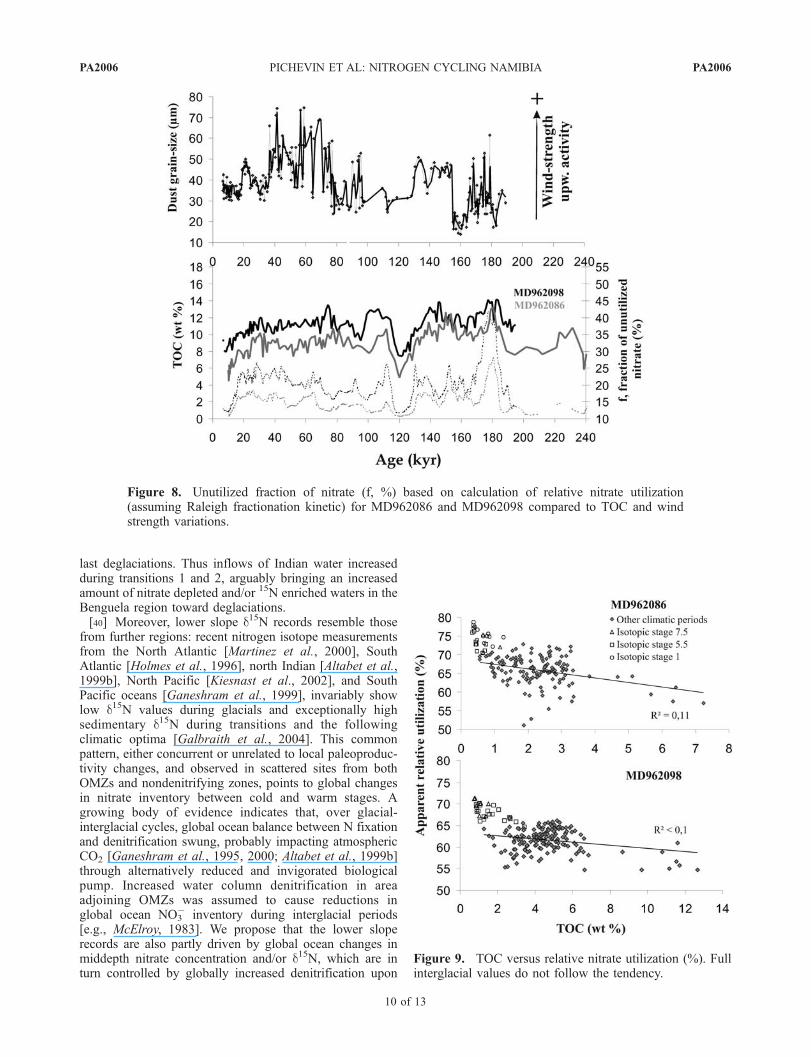
and TOC records from the deeper cores are compared withthe wind strength signal (Figure 8). Broadly, TOC and Fvary in tandem, which gives insights into NO3 availabilitychanges. Nevertheless, fluctuation of nutrient supply and
(un)utilization is largely independent of wind forcing overthe last 200 kyr as demonstrated by very low correlationcoefficient (constantly <0.1, calculated using Analyseries[Paillard et al., 1996]) between the wind strength proxyand both the d15N and F from the deeper cores. Berger etal. [2002] stress the point that, in eastern boundary currentregions, upwelling-induced productivity depends on thewind stress, but also on the nutrient content of thermoclinewaters. In order to explain the lack of correlation betweenupwelling intensity and the other parameters we adduce thepossibility that thermocline water fertility has changed overglacial-interglacial timescales, decoupling atmosphericforcing from NO3 supply and productivity. TOC versusestimated relative nitrate utilization is plotted on Figure 9.Correlation between both parameters is weak, and valuesfor full interglacial periods (namely the Holocene, Eemianand MIS 7.5) are invariably and clearly above the regres-sion line: here, estimates of relative N utilization are greaterthan expected in case d15N faithfully represents relativenitrate utilization alone.[38] This evidence points to variations in the (1) nitrate
content or/and (2) isotopic ratio of upwelled waters as wellas (3) potential changes in thermocline water sources, asadditional factors controlling N inventory and paleoproduc-tivity in the BUS (see below).
6.3. Imprint of Global Ocean Changes in MiddepthNitrate D
15N?
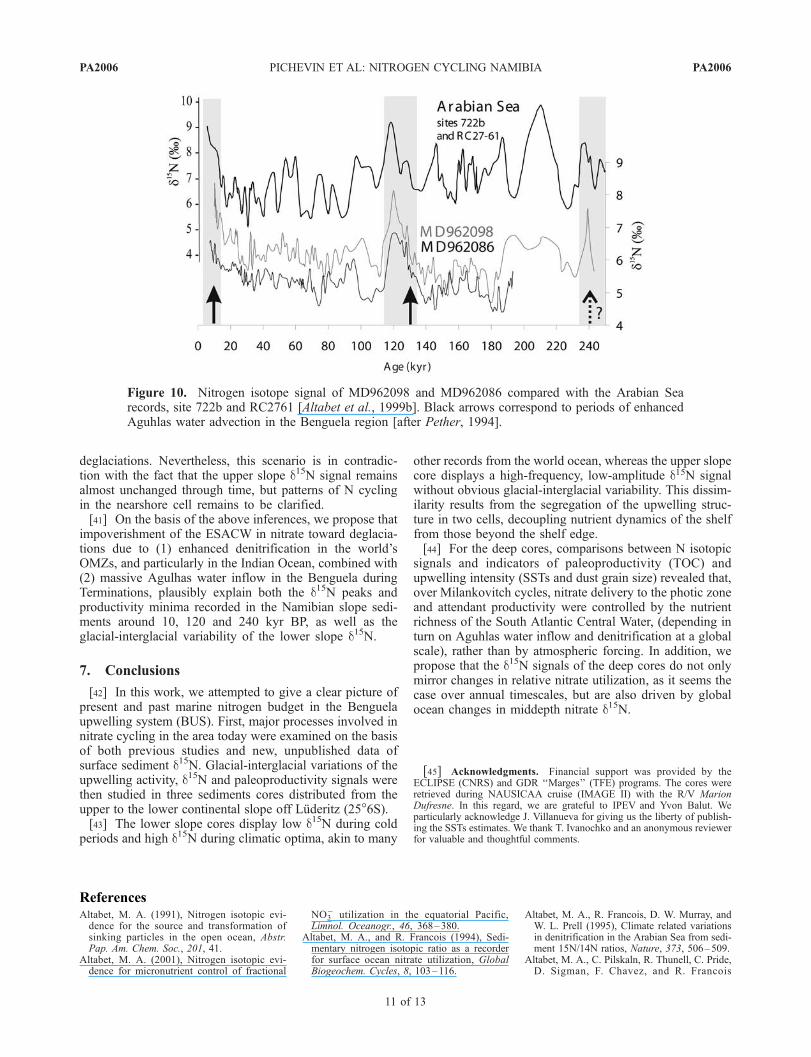
[39] According to Shannon [1985] waters that upwell onthe Namibian shelf are Eastern South Atlantic CentralWaters (ESACW, Figure 3) and stem from 50 to 300 mwater depth, whereas the Antarctic Intermediate Water(AAIW) lies at 600 m water depth. The central water foundin the tropical southeastern Atlantic is formed in large partby Indian Central Water brought into the Atlantic Ocean inthe form of Agulhas rings and filaments [Sprintall andTomczak, 1993]. This implies that South African upwellingcells are principally supplied in nitrate by waters comingfrom the southern South Atlantic and Indian Oceans.Agulhas waters partly originate from the Indian subtropicalgyre (poor in nutrient) and to a lesser extent from thenorthern Indian Basin (Arabian Sea), both through theMozambic Channel and with the poleward current, east ofMadagascar [Donohue and Toole, 2003]. The northernsector of the Indian Ocean has long been recognized asone of the major denitrifying zones [Naqvi, 1987]. Episodesof enhanced N losses through denitrification in the IndianBasin occur during interglacial periods [Altabet et al., 1995,1999b] (Figure 10). Nevertheless, N budget in the ArabianSea seems to respond to precessional (monsoon) forcingand, although the d15N signal shows clear increases duringthe two last deglacial transgressions, denitrification was notat maximum around 240 kyr BP [Altabet et al., 1999b]. TheLuderitz and Arabian Sea d15N variations are reasonably inphase but their respective amplitude differ depending on theperiods. Pether [1994] showed that the rate of Indian Oceanadvection in the South Atlantic Ocean also changed overglacial/interglacial timescales. Owing to Southern Oceanwarming and decreasing austral summer insolation, Agulhasadvection in the Benguela region was enhanced during the
Figure 7. Organic carbon (TOC) versus nitrogen contents(N) in the sediments of MD962098 and MD972087.
PA2006 PICHEVIN ET AL: NITROGEN CYCLING NAMIBIA
9 of 13
PA2006
last deglaciations. Thus inflows of Indian water increasedduring transitions 1 and 2, arguably bringing an increasedamount of nitrate depleted and/or 15N enriched waters in theBenguela region toward deglaciations.[40] Moreover, lower slope d15N records resemble those
from further regions: recent nitrogen isotope measurementsfrom the North Atlantic [Martinez et al., 2000], SouthAtlantic [Holmes et al., 1996], north Indian [Altabet et al.,1999b], North Pacific [Kiesnast et al., 2002], and SouthPacific oceans [Ganeshram et al., 1999], invariably showlow d15N values during glacials and exceptionally highsedimentary d15N during transitions and the followingclimatic optima [Galbraith et al., 2004]. This commonpattern, either concurrent or unrelated to local paleoproduc-tivity changes, and observed in scattered sites from bothOMZs and nondenitrifying zones, points to global changesin nitrate inventory between cold and warm stages. Agrowing body of evidence indicates that, over glacial-interglacial cycles, global ocean balance between N fixationand denitrification swung, probably impacting atmosphericCO2 [Ganeshram et al., 1995, 2000; Altabet et al., 1999b]through alternatively reduced and invigorated biologicalpump. Increased water column denitrification in areaadjoining OMZs was assumed to cause reductions inglobal ocean NO3
� inventory during interglacial periods[e.g., McElroy, 1983]. We propose that the lower sloperecords are also partly driven by global ocean changes inmiddepth nitrate concentration and/or d15N, which are inturn controlled by globally increased denitrification upon
Figure 9. TOC versus relative nitrate utilization (%). Fullinterglacial values do not follow the tendency.
Figure 8. Unutilized fraction of nitrate (f, %) based on calculation of relative nitrate utilization(assuming Raleigh fractionation kinetic) for MD962086 and MD962098 compared to TOC and windstrength variations.
PA2006 PICHEVIN ET AL: NITROGEN CYCLING NAMIBIA
10 of 13
PA2006
deglaciations. Nevertheless, this scenario is in contradic-tion with the fact that the upper slope d15N signal remainsalmost unchanged through time, but patterns of N cyclingin the nearshore cell remains to be clarified.[41] On the basis of the above inferences, we propose that
impoverishment of the ESACW in nitrate toward deglacia-tions due to (1) enhanced denitrification in the world’sOMZs, and particularly in the Indian Ocean, combined with(2) massive Agulhas water inflow in the Benguela duringTerminations, plausibly explain both the d15N peaks andproductivity minima recorded in the Namibian slope sedi-ments around 10, 120 and 240 kyr BP, as well as theglacial-interglacial variability of the lower slope d15N.
7. Conclusions
[42] In this work, we attempted to give a clear picture ofpresent and past marine nitrogen budget in the Benguelaupwelling system (BUS). First, major processes involved innitrate cycling in the area today were examined on the basisof both previous studies and new, unpublished data ofsurface sediment d15N. Glacial-interglacial variations of theupwelling activity, d15N and paleoproductivity signals werethen studied in three sediments cores distributed from theupper to the lower continental slope off Luderitz (25�6S).[43] The lower slope cores display low d15N during cold
periods and high d15N during climatic optima, akin to many
other records from the world ocean, whereas the upper slopecore displays a high-frequency, low-amplitude d15N signalwithout obvious glacial-interglacial variability. This dissim-ilarity results from the segregation of the upwelling struc-ture in two cells, decoupling nutrient dynamics of the shelffrom those beyond the shelf edge.[44] For the deep cores, comparisons between N isotopic
signals and indicators of paleoproductivity (TOC) andupwelling intensity (SSTs and dust grain size) revealed that,over Milankovitch cycles, nitrate delivery to the photic zoneand attendant productivity were controlled by the nutrientrichness of the South Atlantic Central Water, (depending inturn on Aguhlas water inflow and denitrification at a globalscale), rather than by atmospheric forcing. In addition, wepropose that the d15N signals of the deep cores do not onlymirror changes in relative nitrate utilization, as it seems thecase over annual timescales, but are also driven by globalocean changes in middepth nitrate d15N.
[45] Acknowledgments. Financial support was provided by theECLIPSE (CNRS) and GDR ‘‘Marges’’ (TFE) programs. The cores wereretrieved during NAUSICAA cruise (IMAGE II) with the R/V MarionDufresne. In this regard, we are grateful to IPEV and Yvon Balut. Weparticularly acknowledge J. Villanueva for giving us the liberty of publish-ing the SSTs estimates. We thank T. Ivanochko and an anonymous reviewerfor valuable and thoughtful comments.
Figure 10. Nitrogen isotope signal of MD962098 and MD962086 compared with the Arabian Searecords, site 722b and RC2761 [Altabet et al., 1999b]. Black arrows correspond to periods of enhancedAguhlas water advection in the Benguela region [after Pether, 1994].
PA2006 PICHEVIN ET AL: NITROGEN CYCLING NAMIBIA
11 of 13
PA2006
ReferencesAltabet, M. A. (1991), Nitrogen isotopic evi-dence for the source and transformation ofsinking particles in the open ocean, Abstr.Pap. Am. Chem. Soc., 201, 41.
Altabet, M. A. (2001), Nitrogen isotopic evi-dence for micronutrient control of fractional
NO3� utilization in the equatorial Pacific,
Limnol. Oceanogr., 46, 368–380.Altabet, M. A., and R. Francois (1994), Sedi-mentary nitrogen isotopic ratio as a recorderfor surface ocean nitrate utilization, GlobalBiogeochem. Cycles, 8, 103–116.
Altabet, M. A., R. Francois, D. W. Murray, andW. L. Prell (1995), Climate related variationsin denitrification in the Arabian Sea from sedi-ment 15N/14N ratios, Nature, 373, 506–509.
Altabet, M. A., C. Pilskaln, R. Thunell, C. Pride,D. Sigman, F. Chavez, and R. Francois
PA2006 PICHEVIN ET AL: NITROGEN CYCLING NAMIBIA
12 of 13
PA2006
(1999a), The nitrogen isotope biogeochemistryof sinking particles from the margin of theeastern North Pacific, Deep Sea Res., Part I,46, 655–679.
Altabet, M. A., D. W. Murray, and W. L. Prell(1999b), Climatically linked oscillations inArabian Sea denitrification over the past1 m.y.: Implications for the marine N cycle,Paleoceanography, 14, 732–743.
Bang, N. D. (1971), The Southern Benguelaregion in February 1966. Part II. Bathyther-mography and air-sea interactions, Deep SeaRes., 18, 209–224.
Barange, M., and S. C. Pillar (1992), Cross-shelf circulation, zonation and maintenancemechanisms of Nyctiphanes-Capensis andEuphausia-Hanseni (Euphausiacea) in thenorthern Benguela upwelling system, Cont.Shelf Res., 12, 1027–1042.
Berger, W. H., C. B. Lange, and G. Wefer(2002), Upwelling history of the Benguela-Namibia system: A synthesis of leg 175 results,Proc. Ocean Drill. Program, Sci. Results, 175,1–103.
Bertrand, P., T. F. Pedersen, P. Martinez,S. Calvert, and G. Shimmield (2000), Sealevel impact on nutrient cycling in coastalupwelling areas during deglaciation: Evidencefrom nitrogen isotopes, Global Biogeochem.Cycles, 14, 341–355.
Bertrand, P., et al. (2003), Organic-rich sedi-ments in ventilated deep-sea environments:Relationship to climate, sea level, and trophicchanges, J. Geophys. Res., 108(C2), 3045,doi:10.1029/2000JC000327.
Brandes, J. A., and A. H. Devol (1997), Isotopicfractionation of oxygen and nitrogen in coastalmarine sediments, Geochim. Cosmochim.Acta, 61, 1793–1801.
Brandes, J. A., and A. H. Devol (2002), A globalmarine-fixed nitrogen isotopic budget: Impli-cations for Holocene nitrogen cycling, GlobalBiogeochem. Cycles, 16(4), 1120, doi:10.1029/2001GB001856.
Brandes, J. A., A. H. Devol, T. Yoshinari, D. A.Jayakumar, and S. W. A. Naqvi (1998), Isoto-pic composition of nitrate in the central Ara-bian Sea and eastern tropical North Pacific: Atracer for mixing and nitrogen cycles, Limnol.Oceanogr., 43, 1680–1689.
Carr, M. E. (2002), Estimation of potential pro-ductivity in eastern boundary currents usingremote sensing, Deep Sea Res. Part II, 49,59–80.
Chapman, P., and L. V. Shannon (1987), Season-ality in the oxygen minimum layers at theextremities of the Benguela system, S. Afr.J. Mar. Sci., 5, 51–62.
Conkright, M., S. Levitus, T. O’Brien, T. P.Boyer, J. Antonov, and C. Stephens (1998),World Ocean Atlas 1998 Data Set Documen-tation [CD-ROM], Tech. Rep. 15, Natl.Oceanogr. Data Cent., Silver Spring, Md.
Dittmar, T., and M. Birkicht (2001), Regenera-tion of nutrients in the northern Benguelaupwelling and the Angola-Benguela Frontareas, S. Afr. J. Sci., 97, 239–246.
Donohue, K. A., and J. M. Toole (2003), A near-synoptic survey of the southwest IndianOcean, Deep Sea Res. Part II, 50, 1893–1931.
Francois, R., M. P. Bacon, M. A. Altabet, andL. D. Labeyrie (1993), Glacial interglacialchanges in sediment rain rate in the southwestIndian sector of Subantarctic waters asrecorded by Th-230, Pa-231, U, and Delta-N-15, Paleoceanography, 8, 611–629.
Freudenthal, T., T. Wagner, F. Wenzhofer,M. Zabel, and G. Wefer (2001), Early diag-
enesis of organic matter from sediments ofthe eastern subtropical Atlantic: Evidencefrom stable nitrogen and carbon isotopes,Geochim. Cosmochim. Acta, 65, 1795–1808.
Galbraith, E. D., M. Kienast, T. F. Pedersen, andS. E. Calvert (2004), Glacial-interglacial mod-ulation of the marine nitrogen cycle by high-latitude O2 supply to the global thermocline,Paleoceanography, 19, PA4007, doi:10.1029/2003PA001000.
Ganeshram, R. S., T. F. Pedersen, S. E. Calvert,and J. W. Murray (1995), Large changes inoceanic nutrient inventories from glacial tointerglacial periods, Nature, 376, 755–758.
Ganeshram, R. S., S. E. Calvert, T. F. Pedersen,and G. L. Cowie (1999), Factors controllingthe burial of organic carbon in laminated andbioturbated sediments off NW Mexico: Impli-cations for hydrocarbon preservation, Geo-chim. Cosmochim. Acta, 63, 1723–1734.
Ganeshram, R. S., T. F. Pedersen, S. E. Calvert,G. W. McNeill, and M. R. Fontugne (2000),Glacial-interglacial variability in denitrifica-tion in the world’s oceans: Causes and conse-quences, Paleoceanography, 15, 361–376.
Giraudeau, J., and G. W. Bailey (1995), Spatialdynamics of coccolithophore communitiesduring an upwelling event in the SouthernBenguela System, Cont. Shelf Res., 15,1825–1852.
Giraudeau, J., G. W. Bailey, and C. Pujol (2000),A high-resolution time-series analyses of par-ticle fluxes in the Northern Benguela coastalupwelling system: Carbonate record ofchanges in biogenic production and particletransfer processes, Deep Sea Res. Part II, 47,1999–2028.
Gordon, A. L., K. T. Bosley, and F. Aikman(1995), Tropical Atlantic water within the Ben-guela Upwelling System at 27 degrees S, DeepSea Res. Part I, 42, 1–12.
Hart, T. J., and R. I. Currie (1960), The BenguelaCurrent, Disc. Rep., 31, 123–298.
Hay, W. W., and J. C. Brock (1992), Temporalvariation in intensity of upwelling of southwestAfrica, in Upwelling Systems: Evolution Sincethe Early Miocene, Geol. Soc. Spec. Publ.,vol. 63, edited by C. P. Summerhayes et al.,pp. 463–497, Geol. Soc., London.
Hensen, C., M. Zabel, and H. D. Schulz (2000), Acomparison of benthic nutrient fluxes fromdeep-sea sediments off Namibia and Argentina,Deep Sea Res. Part II, 47, 2029–2050.
Holmes, E., G. Lavik, G. Fischer, M. Segl,G. Ruhland, and G. Wefer (2002), Seasonalvariability of delta N-15 in sinking particlesin the Benguela upwelling region, Deep SeaRes. Part I, 49, 377–394.
Holmes, M. E., P. J. Muller, R. R. Schneider,M. Segl, J. Patzold, and G. Wefer (1996),Stable nitrogen isotopes in Angola Basin sur-face sediments, Mar. Geol., 134, 1–12.
Holmes, M. E., P. J. Muller, R. R. Schneider,M. Segl, and G. Wefer (1998), Spatial varia-tions in euphotic zone nitrate utilization basedon delta N-15 in surface sediments, Geo-Mar.Lett., 18, 58–65.
Holmes, M. E., C. Eichner, U. Struck, andG. Wefer (1999), Reconstruction of surfaceocean nitrate utilization using stable nitrogenisotopes in sinking particles and sediments,in Use of Proxies in Paleoceanography:Examples From the South Atlantic, editedby G. Fischer and G. Wefer, pp. 447–468,Springer, New York.
Holmes, M. E., G. Lavik, G. Fisher, and G. Wefer(2003), Nitrogen isotopes in sinking particlesand surface sediments in the central and south-
ern Atlantic, in The South Atlantic in the LateQuaternary: Reconstruction of Material Bud-gets and Current Systems, edited by G. Wefer,S. Mulitzas, and V. Ratmeyer, pp. 143–165,Springer, New York.
Imbrie, J., J. D. Hays, D. G. Martinson,A. McIntyre, A. C. Mix, J. J. Morley, N. G.Pisias, W. L. Prell, and N. J. Shackleton(1984), The orbital theory of Pleistoceneclimate: Support from a revised chronologyof the marine d18O record, in Milankovitchand Climate, edited by A. Berger et al.,pp. 269–305, D. Reidel, Norwell, Mass.
Jahn, B., B. Donner, P. J. Muller, U. Rohl, R. R.Schneider, and G. Wefer (2003), Pleistocenevariations in dust input and marine pro-ductivity in the northern Benguela Current:Evidence of evolution of global glacial-interglacial cycles, Palaeogeogr. Palaeocli-matol. Palaeoecol., 193, 515–533.
Kirst, G. J., R. R. Schneider, P. J. Muller, I. vonStorch, and G. Wefer (1999), Late Quaternarytemperature variability in the Benguela CurrentSystem derived from alkenones, Quat. Res.,52, 92–103.
Largier, J., and A. J. Boyd (2001), Drifter obser-vations of surface water transport in theBenguela Current during winter 1999, S. Afr.J. Sci., 97, 223–229.
Lass, H. U., M. Schmidt, V. Mohrholz, andG. Nausch (2000), Hydrographic and currentmeasurements in the area of the Angola-Benguela front, J. Phys. Oceanogr., 30,2589–2609.
Lavik, G. (2001), Nitrogen isotopes of sinkingmatter and sediments in the South Atlantic,174 pp., Ber. aus dem Fachber. Geowiss. derUniv. Bremen, Bremen.
Lehmann, M. F., S. M. Bernasconi, A. Barbieri,and J. A. McKenzie (2002), Preservation oforganic matter and alteration of its carbonand nitrogen isotope composition during simu-lated and in situ early sedimentary diagenesis,Geochim. Cosmochim. Acta, 66, 3573–3584.
Lehmann, M. F., P. Reichert, S. M. Bernasconi,A. Barbieri, and J. A. McKenzie (2003),Modelling nitrogen and oxygen isotope frac-tionation during denitrification in a lacustrineredox-transition zone, Geochim. Cosmochim.Acta, 67, 2529–2542.
Little, M. G., R. R. Schneider, D. Kroon,B. Price, C. P. Summerhayes, and M. Segl(1997), Trade wind forcing of upwelling, sea-sonality, and Heinrich events as a response tosub-Milankovitch climate variability, Paleo-ceanography, 12, 568–576.
Lutjeharms, J. R. E., and J. M. Meeuwis (1987),The extent and variability of South-East Atlan-tic upwelling, S. Afr. J. Mar. Sci., 5, 51–62.
Mariotti, A., F. Mariotti, M.-L. Champigny,N. Amaner, and A. Moyse (1982), Nitrogenisotope fractionation associated with nitratereductase activity and uptake of NO3
� bypearl millet, Plant Physiol., 69, 880–884.
Martinez, P., P. Bertrand, S. E. Calvert, T. F.Pedersen, G. B. Shimmield, E. Lallier-Verges,and M. R. Fontugne (2000), Spatial variationsin nutrient utilization, production and diagen-esis in the sediments of a coastal upwellingregime (NW Africa): Implications for the pa-leoceanographic record, J. Mar. Res., 58, 809–835.
McElroy, M. B. (1983), Marine biological con-trols on atmospheric CO2 and climate, Nature,302, 328–329.
Minagawa, M., and E. Wada (1984), Stepwiseenrichment of 15N along the food chains:Further evidence and the relation between
PA2006 PICHEVIN ET AL: NITROGEN CYCLING NAMIBIA
13 of 13
PA2006
d15N and animal age, Geochim. Cosmochim.Acta, 48, 1135–1140.
Mohrholz, V., M. Schmidt, and J. R. E.Lutjeharms (2001), The hydrography anddynamics of the Angola-Benguela FrontalZone and environment in April 1999, S. Afr.J. Sci., 97, 199–208.
Mollenhauer, G., R. R. Schneider, P. J. Muller,V. Spieß, and G. Wefer (2002), Glacial/inter-glacial variability in the Benguela upwellingsystem: Spatial distribution and budgets oforganic carbon accumulation, Global Biogeo-chem. Cycles, 16(4), 1134, doi:10.1029/2001GB001488.
Montoya, J. P., and J. J. McCarthy (1995), Iso-topic fractionation during nitrate uptake byphytoplankton grown in continuous-culture,J. Plankton Res., 17, 439–464.
Morse, J. W., and K. C. Emeis (1992), Carbon/sulphur/iron relationships in upwelling sedi-ments, in Upwelling Systems: EvolutionSince the Early Miocene, edited by C. P.Summerhayes et al., Geol. Soc. Spec.Publ., 64, pp. 247–255.
Naqvi, S. W. A. (1987), Some aspects of theoxygen deficient conditions and denitrificationin the Arabian Sea, J. Mar. Res., 45, 1049–1972.
Paillard, D., L. Labeyrie, and P. Yiou (1996),Macintosh program performs time-series anal-ysis, Eos Trans. AGU, 77, 379.
Peterson, R. G., and L. Stramma (1991), Upper-level circulation in the South Atlantic Ocean,Progr. Oceanogr., 26, 1–73.
Pether, J. (1994), Molluscan evidence for en-hanced deglacial advection of AgulhasWater in the Benguela Current, off south-western Africa, Palaeogeogr. Palaeoclimatol.Palaeoecol., 111, 99–117.
Pichevin, L., P. Bertrand, M. Boussafir, andJ.-R. Disnar (2004), Organic matter accumu-lation and preservation controls in a deep-sea modern environment: An example fromNamibian Slope sediments, Org. Geochem.,35, 543–559.
Pichevin, L., M. Cremer, J. Giraudeau, andP. Bertrand (2005), A 190 kyr record of litho-genic grain-size on the Namibian slope:Forging a tight link between past wind-strength and coastal upwelling dynamics,Mar. Geol., in press.
Prahl, F. G., L. A. Muehlhausen, and D. L.Zahnle (1988), Further evaluation of long-chain alkenones as indicators of paleoceano-graphic conditions, Geochim. Cosmochim.Acta, 52, 2303–2310.
Romero, O., B. Boeckel, B. Donner, G. Lavik,G. Fischer, and G. Wefer (2002), Seasonal pro-ductivity dynamics in the pelagic central Ben-guela System inferred from the flux ofcarbonate and silicate organisms, J. Mar.Sys., 37, 259–278.
Saino, T., and A. Hattori (1980), 15N naturalabundance in oceanic suspended particulatematter, Nature, 283, 752–754.
Schneider, R. R., P. J. Muller, and G. Ruhland(1995), Late Quaternary surface circulation inthe east equatorial South Atlantic: Evidencefrom alkenone sea-surface temperatures, Pa-leoceanography, 10, 197–219.
Schulz, H. D., A. Dahmke, U. Schinzel,K. Wallmann, and M. Zabel (1994), Earlydiagenetic processes, fluxes, and reaction-rates in sediments of the South Atlantic, Geo-chim. Cosmochim. Acta, 58, 2041–2060.
Shannon, L. V. (1985), The Benguela ecosystem.Part I. Evolution of the Benguela, physicalfeatures and processes, Oceanogr. Mar. Biol.Annu. Rev., 23, 105–182.
Shannon, L. V., and G. Nelson (1996), The Ben-guela: Large scale features and processes andsystem variability, in The South AtlanticOcean, Present and Past Circulation, editedby G. Wefer et al., pp. 163–210, Springer,New York.
Shi, N., R. Schneider, H. J. Beug, and L. M.Dupont (2001), Southeast trade wind varia-tions during the last 135 kyr: Evidence frompollen spectra in eastern South Atlantic sedi-ments, Earth Planet. Sci. Lett., 187, 311–321.
Sigman, D. M., M. A. Altabet, R. Michener,D. C. McCorkle, B. Fry, and R. M. Holmes(1997), Natural abundance-level measure-ment of the nitrogen isotopic compositionof oceanic nitrate: An adaptation of theammonia diffusion method, Mar. Chem.,57, 227–242.
Sigman, D. M., K. L. Casciotti, M. Andreani,C. Barford, M. Galanter, and J. K. Bohlke(2001), A bacterial method for the nitrogenisotopic analysis of nitrate in seawaterand freshwater, Anal. Chem., 73, 4145 –4153.
Sigman, D. M., R. Robinson, A. N. Knapp,A. van Geen, D. C. McCorkle, J. A.Brandes, and R. C. Thunell (2003), Distin-guishing between water column and sedi-mentary denitrification in the Santa BarbaraBasin using the stable isotopes of nitrate,Geochem. Geophys. Geosyst., 4(5), 1040,doi:10.1029/2002GC000384.
Smith, R. L. (1995), The physical processes ofcoastal ocean upwelling systems, in Upwel-ling in the Ocean: Modern Processes andAncient Records, edited by C. P. Summerhayeset al., pp. 39–64, John Wiley, Hoboken,N. J.
Sprintall, J., and M. Tomczak (1993), On theformation of central water and thermoclineventilation in the Southern Hemisphere, DeepSea Res. Part I, 40, 827–848.
Stuiver, M., P. J. Reimer, E. Bard, J. W. Beck,G. S. Burr, K. A. Hughen, B. Kromer,G. McCormac, J. Van der Plicht, and M. Spurk(1998), INTCAL98 radiocarbon age calibra-tion, 24,000 – 0 cal BP, Radiocarbon, 40,1041–1083.
Suess, E. (1980), Particulate organic carbon fluxin the ocean, Nature, 288, 260–263.
Summerhayes, C. P., D. Kroon, A. Rosell-Mele,R. W. Jordan, H.-J. Schrader, R. Hearn,J. Villanueva, J. O. Grimalt, and G. Eglington(1995), Variability in the Benguela Currentupwelling system over the past 70,000 years,Progr. Oceanogr., 35, 207–251.
Sweeney, R. E., and I. R. Kapland (1980), Nat-ural abundance of 15N as a source indicator fornear-shore marine sedimentary and dissolvednitrogen, Mar. Chem., 9, 81–94.
Tyrrell, T., and M. I. Lucas (2002), Geochemicalevidence of denitrification in the Benguelaupwelling system, Cont. Shelf Res., 22,2497–2511.
Villanueva, J., and J. O. Grimalt (1997), Gas chro-matographic tuning of the U(k0)37 paleother-mometer, Anal. Chem., 69, 3329–3332.
Wada, E. (1980), Nitrogen isotope fractionationand its significance in biogeochemical pro-cesses occurring in marine environments, inIsotope Marine Chemistry, edited by E. D.Goldberg, Y. Horibe, and K. Surahashi,pp. 375–398, Ushida Rokakuho, Tokyo.
�������������������������P. Bertrand, J. Giraudeau, P. Martinez, and
R. Schneider, Departement de Geologie etOceanographie, Universite Bordeaux I, UMR-CNRS 5805, F-33405 Talence Cedex, France.K. Emeis, Institute of Biogeochemistry and
Marine Chemistry, University of Hamburg,Bundesstrasse 53, Hamburg D-20146, Germany.L. Pichevin, CEREGE, Europole Mediterran-
een de l’Arbois, UMR 6635, BP 80, F-13545Aix en Provence Cedex 04, France. ([email protected])