Neuronal adhesion and differentiation driven by nanoscale surface free-energy gradients
10
Neuronal adhesion and differentiation driven by nanoscale surface free-energy gradients Guillaume Lamour a, b , Ali Eftekhari-Bafrooei b , Eric Borguet b , Sylvie Soue `s c , Ahmed Hamraoui a, d, * a Neuro-Physique Cellulaire, Universite´ Paris Descartes, UFR Biome´dicale, 45 Rue des Saints-Pe `res, 75006 Paris, France b Department of Chemistry, Temple University, Philadelphia, Pennsylvania, PA 19122, USA c Re ´gulation de la Transcription et Maladies Ge´ne ´tiques, CNRS UPR2228, Universite´ Paris Descartes, UFR Biome ´dicale, 45 Rue des Saints-Pe `res, 75006 Paris, France d Service de Physique et Chimie des Surfaces et Interfaces, CEA Saclay, 91191 Gif-sur-Yvette, France article info Article history: Received 16 December 2009 Accepted 15 January 2010 Available online 10 February 2010 Keywords: PC12 cells Neuronal differentiation Cell adhesion Self-assembled monolayers (SAMs) Sum-frequency generation (SFG) Surface energy abstract Recent results indicate that, in addition to chemical, spatial and mechanical cues, substrate physical cues such as gradients in surface energy may also impact cell functions, such as neuronal differentiation of PC12 cells. However, it remains to be determined what surface effect is the most critical in triggering PC12 cell differentiation. Here we show that, beyond continuously probing the surface energy landscape of their environment, PC12 cells are highly sensitive to nanoscale chemical heterogeneities. Self- assembled monolayers of alkylsiloxanes on glass were used as a culture substrate. By changing the structure, ordering and chemical nature of the monolayer, the surface energy distribution is altered. While both well-ordered CH 3 terminated substrates and bare glass (OH terminated) substrates did not favor PC12 cell adhesion, PC12 cells seeded on highly disordered CH 3 /OH substrates underwent enhanced adhesion and prompt neuritogenesis by 48 h of culture, without nerve growth factor treat- ment. These data illustrate that surface free-energy gradients, generated by nanoscale chemical heterogeneities, are critical to biological processes such as nerve regeneration on biomaterials. Ó 2010 Elsevier Ltd. All rights reserved. 1. Introduction Neuronal differentiation is critical to nervous tissue regenera- tion after injury, and adhesion on a substrate is critical for neurite extension [1–3]. The initiation and guidance of a neurite rely on extra-cellular signals, such as substrate energy of adhesion (e.g., surface energy, or surface tension) [4], especially local gradients [5]. Hence, it is of great interest to unveil the substrates characteristics that are effectively sensed by the growth cone, and translated into neuritis extension as a response to these physical cues. The ability to spatially control the distribution of the energy of adhesion is of particular interest in many biomedical and tissue-engineering applications. The interactions of cells, especially neurons, with nanoscale topography [6–9], and with surface chemistry [10–12], were reported to be important parameters in controlling cell function. Another parameter, substrate compliance, influences both neu- ritogenesis [13–16] and neurite branching rate [17]. Thus, a combi- nation of spatial, chemical and mechanical inputs, together with the genetic program of the cell, has been recently proposed to control the shape and functions of cells, as well as of tissues [18]. However the exact role of the surface tension and its spatial vari- ation is still unclear and a systematic study may lead to a better understanding of the surface adhesion parameters that drive neuritogenesis. Self-assembled monolayers (SAMs) are surface-active materials with many potential applications in biotechnology [19,20]. SAMs of alkylsiloxanes on glass can exhibit a wide range of properties, including the chemical nature, the surface roughness, and the organization of surface-exposed terminal groups. These combined properties generate, at the nanoscale level, distinct surface energy distributions, and at larger scale, macroscopic surface characteris- tics such as wettability. SAMs of alkylsiloxanes on glass [21,22] or on titanium [23] have been shown to be suitable substrates for controlling cell adhesion, and in particular for controlling neuronal cell differentiation [10,21,23]. PC12 cells, though not primary neuronal cells, express the transmembrane TrkA and p75 receptors to nerve growth factor (NGF) [24,25], and differentiate into a neuronal phenotype when chal- lenged by appropriate NGF concentrations [26]. This ability makes them a well-defined model to study neuronal differentiation mech- anisms, and thus axonal regeneration. Several key inducers of PC12 cell neuronal differentiation in NGF-free medium have been identi- fied: PC12 cell neuritogenesis is observed on soft substrates * Corresponding author. Fax: þ33 (0)14 286 2085. E-mail address: [email protected] (A. Hamraoui). Contents lists available at ScienceDirect Biomaterials journal homepage: www.elsevier.com/locate/biomaterials 0142-9612/$ – see front matter Ó 2010 Elsevier Ltd. All rights reserved. doi:10.1016/j.biomaterials.2010.01.099 Biomaterials 31 (2010) 3762–3771
Transcript of Neuronal adhesion and differentiation driven by nanoscale surface free-energy gradients
lable at ScienceDirect
Biomaterials 31 (2010) 3762–3771
Contents lists avai
Biomaterials
journal homepage: www.elsevier .com/locate/biomater ia ls
Neuronal adhesion and differentiation driven by nanoscale surfacefree-energy gradients
Guillaume Lamour a,b, Ali Eftekhari-Bafrooei b, Eric Borguet b, Sylvie Soues c, Ahmed Hamraoui a,d,*
a Neuro-Physique Cellulaire, Universite Paris Descartes, UFR Biomedicale, 45 Rue des Saints-Peres, 75006 Paris, Franceb Department of Chemistry, Temple University, Philadelphia, Pennsylvania, PA 19122, USAc Regulation de la Transcription et Maladies Genetiques, CNRS UPR2228, Universite Paris Descartes, UFR Biomedicale, 45 Rue des Saints-Peres, 75006 Paris, Franced Service de Physique et Chimie des Surfaces et Interfaces, CEA Saclay, 91191 Gif-sur-Yvette, France
a r t i c l e i n f o
Article history:Received 16 December 2009Accepted 15 January 2010Available online 10 February 2010
Keywords:PC12 cellsNeuronal differentiationCell adhesionSelf-assembled monolayers (SAMs)Sum-frequency generation (SFG)Surface energy
* Corresponding author. Fax: þ33 (0)14 286 2085.E-mail address: [email protected]
0142-9612/$ – see front matter � 2010 Elsevier Ltd. Adoi:10.1016/j.biomaterials.2010.01.099
a b s t r a c t
Recent results indicate that, in addition to chemical, spatial and mechanical cues, substrate physical cuessuch as gradients in surface energy may also impact cell functions, such as neuronal differentiation ofPC12 cells. However, it remains to be determined what surface effect is the most critical in triggeringPC12 cell differentiation. Here we show that, beyond continuously probing the surface energy landscapeof their environment, PC12 cells are highly sensitive to nanoscale chemical heterogeneities. Self-assembled monolayers of alkylsiloxanes on glass were used as a culture substrate. By changing thestructure, ordering and chemical nature of the monolayer, the surface energy distribution is altered.While both well-ordered CH3 terminated substrates and bare glass (OH terminated) substrates did notfavor PC12 cell adhesion, PC12 cells seeded on highly disordered CH3/OH substrates underwentenhanced adhesion and prompt neuritogenesis by 48 h of culture, without nerve growth factor treat-ment. These data illustrate that surface free-energy gradients, generated by nanoscale chemicalheterogeneities, are critical to biological processes such as nerve regeneration on biomaterials.
� 2010 Elsevier Ltd. All rights reserved.
1. Introduction
Neuronal differentiation is critical to nervous tissue regenera-tion after injury, and adhesion on a substrate is critical for neuriteextension [1–3]. The initiation and guidance of a neurite rely onextra-cellular signals, such as substrate energy of adhesion (e.g.,surface energy, or surface tension) [4], especially local gradients [5].Hence, it is of great interest to unveil the substrates characteristicsthat are effectively sensed by the growth cone, and translated intoneuritis extension as a response to these physical cues. The abilityto spatially control the distribution of the energy of adhesion is ofparticular interest in many biomedical and tissue-engineeringapplications.
The interactions of cells, especially neurons, with nanoscaletopography [6–9], and with surface chemistry [10–12], werereported to be important parameters in controlling cell function.Another parameter, substrate compliance, influences both neu-ritogenesis [13–16] and neurite branching rate [17]. Thus, a combi-nation of spatial, chemical and mechanical inputs, together withthe genetic program of the cell, has been recently proposed to
r (A. Hamraoui).
ll rights reserved.
control the shape and functions of cells, as well as of tissues [18].However the exact role of the surface tension and its spatial vari-ation is still unclear and a systematic study may lead to a betterunderstanding of the surface adhesion parameters that driveneuritogenesis.
Self-assembled monolayers (SAMs) are surface-active materialswith many potential applications in biotechnology [19,20]. SAMs ofalkylsiloxanes on glass can exhibit a wide range of properties,including the chemical nature, the surface roughness, and theorganization of surface-exposed terminal groups. These combinedproperties generate, at the nanoscale level, distinct surface energydistributions, and at larger scale, macroscopic surface characteris-tics such as wettability. SAMs of alkylsiloxanes on glass [21,22] oron titanium [23] have been shown to be suitable substrates forcontrolling cell adhesion, and in particular for controlling neuronalcell differentiation [10,21,23].
PC12 cells, though not primary neuronal cells, express thetransmembrane TrkA and p75 receptors to nerve growth factor (NGF)[24,25], and differentiate into a neuronal phenotype when chal-lenged by appropriate NGF concentrations [26]. This ability makesthem a well-defined model to study neuronal differentiation mech-anisms, and thus axonal regeneration. Several key inducers of PC12cell neuronal differentiation in NGF-free medium have been identi-fied: PC12 cell neuritogenesis is observed on soft substrates
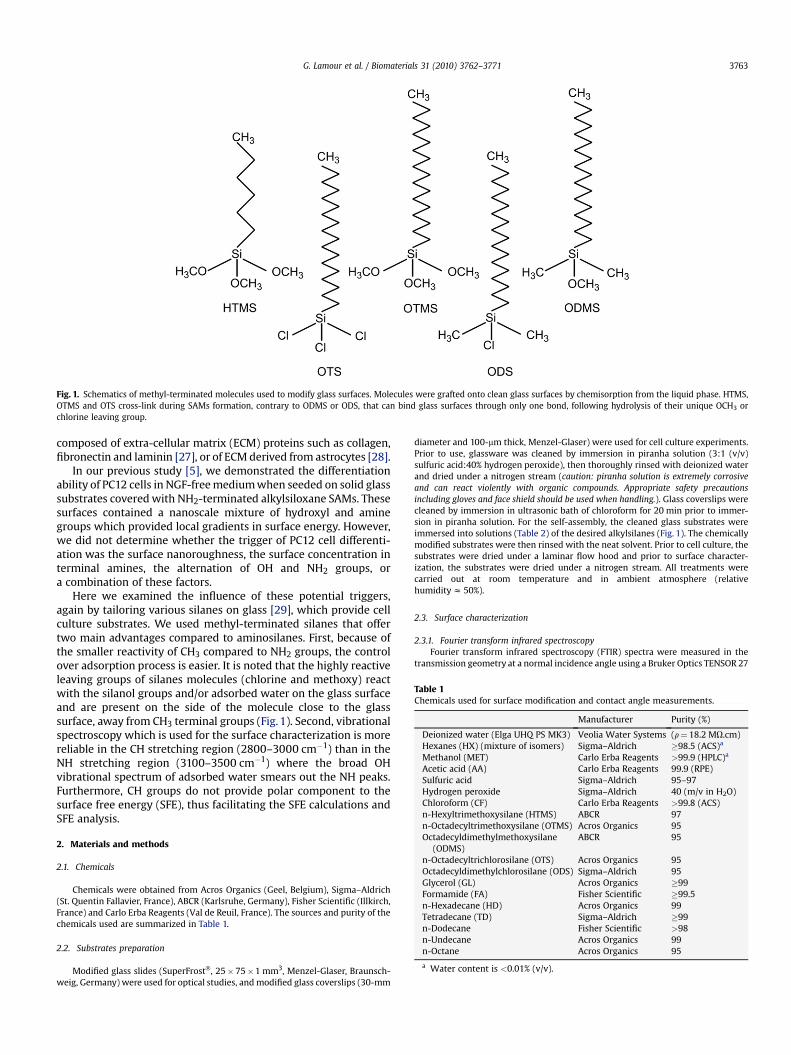
Fig. 1. Schematics of methyl-terminated molecules used to modify glass surfaces. Molecules were grafted onto clean glass surfaces by chemisorption from the liquid phase. HTMS,OTMS and OTS cross-link during SAMs formation, contrary to ODMS or ODS, that can bind glass surfaces through only one bond, following hydrolysis of their unique OCH3 orchlorine leaving group.
able 1hemicals used for surface modification and contact angle measurements.
Manufacturer Purity (%)
Deionized water (Elga UHQ PS MK3) Veolia Water Systems (r¼ 18.2 MU.cm)Hexanes (HX) (mixture of isomers) Sigma–Aldrich �98.5 (ACS)a
Methanol (MET) Carlo Erba Reagents >99.9 (HPLC)a
Acetic acid (AA) Carlo Erba Reagents 99.9 (RPE)Sulfuric acid Sigma–Aldrich 95–97Hydrogen peroxide Sigma–Aldrich 40 (m/v in H2O)Chloroform (CF) Carlo Erba Reagents >99.8 (ACS)n-Hexyltrimethoxysilane (HTMS) ABCR 97n-Octadecyltrimethoxysilane (OTMS) Acros Organics 95Octadecyldimethylmethoxysilane
(ODMS)ABCR 95
n-Octadecyltrichlorosilane (OTS) Acros Organics 95Octadecyldimethylchlorosilane (ODS) Sigma–Aldrich 95Glycerol (GL) Acros Organics �99Formamide (FA) Fisher Scientific �99.5n-Hexadecane (HD) Acros Organics 99Tetradecane (TD) Sigma–Aldrich �99n-Dodecane Fisher Scientific >98n-Undecane Acros Organics 99n-Octane Acros Organics 95
a Water content is <0.01% (v/v).
G. Lamour et al. / Biomaterials 31 (2010) 3762–3771 3763
composed of extra-cellular matrix (ECM) proteins such as collagen,fibronectin and laminin [27], or of ECM derived from astrocytes [28].
In our previous study [5], we demonstrated the differentiationability of PC12 cells in NGF-free medium when seeded on solid glasssubstrates covered with NH2-terminated alkylsiloxane SAMs. Thesesurfaces contained a nanoscale mixture of hydroxyl and aminegroups which provided local gradients in surface energy. However,we did not determine whether the trigger of PC12 cell differenti-ation was the surface nanoroughness, the surface concentration interminal amines, the alternation of OH and NH2 groups, ora combination of these factors.
Here we examined the influence of these potential triggers,again by tailoring various silanes on glass [29], which provide cellculture substrates. We used methyl-terminated silanes that offertwo main advantages compared to aminosilanes. First, because ofthe smaller reactivity of CH3 compared to NH2 groups, the controlover adsorption process is easier. It is noted that the highly reactiveleaving groups of silanes molecules (chlorine and methoxy) reactwith the silanol groups and/or adsorbed water on the glass surfaceand are present on the side of the molecule close to the glasssurface, away from CH3 terminal groups (Fig. 1). Second, vibrationalspectroscopy which is used for the surface characterization is morereliable in the CH stretching region (2800–3000 cm�1) than in theNH stretching region (3100–3500 cm�1) where the broad OHvibrational spectrum of adsorbed water smears out the NH peaks.Furthermore, CH groups do not provide polar component to thesurface free energy (SFE), thus facilitating the SFE calculations andSFE analysis.
2. Materials and methods
2.1. Chemicals
Chemicals were obtained from Acros Organics (Geel, Belgium), Sigma–Aldrich(St. Quentin Fallavier, France), ABCR (Karlsruhe, Germany), Fisher Scientific (Illkirch,France) and Carlo Erba Reagents (Val de Reuil, France). The sources and purity of thechemicals used are summarized in Table 1.
2.2. Substrates preparation
Modified glass slides (SuperFrost�, 25�75�1 mm3, Menzel-Glaser, Braunsch-weig, Germany) were used for optical studies, and modified glass coverslips (30-mm
diameter and 100-mm thick, Menzel-Glaser) were used for cell culture experiments.Prior to use, glassware was cleaned by immersion in piranha solution (3:1 (v/v)sulfuric acid:40% hydrogen peroxide), then thoroughly rinsed with deionized waterand dried under a nitrogen stream (caution: piranha solution is extremely corrosiveand can react violently with organic compounds. Appropriate safety precautionsincluding gloves and face shield should be used when handling.). Glass coverslips werecleaned by immersion in ultrasonic bath of chloroform for 20 min prior to immer-sion in piranha solution. For the self-assembly, the cleaned glass substrates wereimmersed into solutions (Table 2) of the desired alkylsilanes (Fig. 1). The chemicallymodified substrates were then rinsed with the neat solvent. Prior to cell culture, thesubstrates were dried under a laminar flow hood and prior to surface character-ization, the substrates were dried under a nitrogen stream. All treatments werecarried out at room temperature and in ambient atmosphere (relativehumidity z 50%).
2.3. Surface characterization
2.3.1. Fourier transform infrared spectroscopyFourier transform infrared spectroscopy (FTIR) spectra were measured in the
transmission geometry at a normal incidence angle using a Bruker Optics TENSOR 27
TC

Table 2Description of the chemical processes used to modify glassware. The abbreviationsin capital letters refer to the chemicals displayed in Table 1.
Substrate Solution Adsorptiontime
Rinsingsolvent(s)
Note(s)
ots 0.1% OTSþ 20% CFþ 80% HD 15 min CF and MET a
ods 0.1% ODSþ 20% CFþ 80% HD 15 min CF and MET a,b
otms 1% OTMSþ 99% HX 4 h HX and METotmsx 1% OTMSþ 99% HX 4 h HX and MET a
odms1 1% ODMSþ 99% HX w10 h HX and MET a
odms2 1% ODMSþ 99% HX >24 h HX and METhtmsM1 2% HTMSþ 94% METþ 4%
H2Oþ 1 mM AAw16 h MET
htmsM2 2% HTMSþ 94% METþ 4%H2Oþ 1 mM AA
w24 h MET
htmsM3 2% HTMSþ 94% METþ 4%H2Oþ 1 mM AA
>72 h MET
htmsH 1% HTMSþ 99% HX 4 h HX and METhtmsHx 1% HTMSþ 99% HX 4 h HX and MET a
a Solution was slowly agitated with a rotating magnet all along the reaction.b ODS was slightly heated until it reached a liquid phase (at 28–30 �C), just before
being added to the solvent solution.
able 3alues of the surface tension (g, mN m�1) of some test liquids at 20 �C (adapted fromef. [33]). gd and gp are respectively the dispersive and the polar components of therface tension.
Liquid g gd gp
Water 72.8 21.8 51Glycerol 64 34 30Formamide 58 39 19n-Hexadecane 27.47 27.47 w0Tetradecane 26.56 26.56 w0
G. Lamour et al. / Biomaterials 31 (2010) 3762–37713764
spectrometer equipped with a DTGS detector. FTIR spectra were background cor-rected by subtraction of a spectrum of the clean, bare substrate (e.g., SAM-free), andrecorded by integrating 200 scans with a resolution of 4 cm�1.
2.3.2. Vibrational sum-frequency generationSum-frequency generation (SFG) is a surface vibrational spectroscopy based on
a second-order non-linear optical process in which two laser beams with frequen-cies u1 and u2 overlap on the surface and generate a coherent response whosefrequency is the sum of two incident laser (uSFG¼u1þu2). In the electric dipoleapproximation, second-order non-linear optical processes, including SFG, do nottake place in media with inversion symmetry but do occur at interfaces as theinversion symmetry is necessarily broken there. Therefore, by selecting one of theincident beams to be in the IR region (u1¼uIR) and the other in the visible region(u2¼uvis.), SFG can be used as a powerful spectroscopic technique to measuresurface vibrational spectra [30]. A detailed description of our SFG set up can be foundelsewhere [31]. Briefly, IR and visible pulses with energies of 15 and 2 mJ, incident atthe surface with the angles of 72� and 65� respectively, were focused to beam waistsof 250 and 200 mm, respectively. The SFG signal was detected with a CCD (PrincetonInstrument) coupled with a spectrograph (300i, Acton Research Corp.). The polari-zation of visible and SFG were controlled by a combination of polarizers and half-wave plates. In the experiments presented here, the polarization combination ofSFG, visible, and IR were either S,S,P or P,P,P.
2.3.3. Contact angle measurementsContact angles (q) were measured as described in Ref. [5]. Briefly, an image of
the profile of a drop on a solid surface was recorded using a CCD video camera(Sony DXC-101P). The image was then processed with ImageJ software (WayneRasband, National Institutes of Health, Bethesda, MD) using the Contact Angleplug-in (Marco Brugnara, University of Trento, Trento, Italy), which calculates thecontact angle value from the profile of the drop. At least 3 drops per sample wereanalyzed.
2.3.4. Determination of surface free energyThe surface free energies (SFE) of samples were calculated using the Owens–
Wendt theoretical model [32]. This model gives the long-range dispersion (Lifshitz–Van der Waals; gd) and the short-range polar (hydrogen bonding; gp) components ofSFE according to the following equation:
WSL ¼�1þ cos q
�gL ¼ 2
�gd
s�1=2�
gdL�1=2 þ 2
�gp
s�1=2�
gpL
�1=2(1)
where gs is the SFE of the surface, gL is the SFE of the liquid and WSL is the solid–liquid interface energy. Two liquids were used as probes for SFE calculations:n-hexadecane, and H2O. For a liquid, the overall surface tension (gL) is a combinationof dispersive and polar components, whose values are indicated in Table 3 (adaptedfrom Ref. [33]). The contact angles of n-hexadecane and H2O were reported in Eq. (1)for each solid substrate, then sample SFE components were calculated.
The critical surface tension gc was calculated using the Fox–Zismanapproximation. In this work, it can be understood as a first-order approximationof the Good–Girifalco equation [35], for a surface tension of the liquid gL (gL� gc)close to the gc of the solid. Using a linear regression analysis, Zisman plots,cos q¼ f(g), were traced for each substrate by fitting the data obtained with thetest liquids. gc values were read where the line fits intersect cos q¼ 1, asdescribed by Zisman [34].
TVRsu
2.3.5. AFM imagingEach substrate was analyzed using a Bioscope� AFM (Digital Instruments/
Veeco) in air using tapping mode (RTESP tip cantilever, spring constant: 40 N m�1).The root-mean-square (rms) roughness of the surfaces was evaluated for regions ofw1 mm� 1 mm, by AFM software Nanoscope (Veeco). The line scanning frequencywas w0.5 Hz (256 scan lines� 512 pixels). The images were flattened using Nano-scope software before the rms was evaluated.
2.4. PC12 cell manipulation
Unless otherwise specified, the biological products in this section werepurchased from Invitrogen (Fisher Bioblock Scientific, Illkirch, France).
2.4.1. Cell culturePC12 cells (ATCC, CRL 1721) were maintained in Dulbecco’s Modified Eagle
Medium containing horse serum (5%), fetal calf serum (5%, HyClone), non-essentialamino acids (1%) and antibiotics (1%). In the experiments, PC12 cells (passagenumbers 7–17) were seeded onto modified glass coverslips, that had been sterilizedby immersion in a solution of 70% methanol and 30% H2O for 15 min. Cells wereseeded in a small volume of the culture medium (V¼ 335 mL), in order to trap PC12cells on the top of the modified substrates. The cell density at the time of seedingwas w104 cm�2. Experiments never exceeded 48 h. No further addition of culturemedium was made and, in particular, no NGF was added to the culture medium.
2.4.2. Quantification of neuritogenesisThe propensity of PC12 cells to initiate neurites was evaluated on each substrate.
At least 10 pictures (S¼ 0.182 mm2/picture) of the cells cultured on each substratewere taken with a camera mounted on a phase-contrast microscope (Nikon EclipseTS100), using a �20 objective. In order to avoid confusing neurites with cell somaprotrusions or filopodia, only neurites with length greater than 25 mm were counted.This threshold length corresponds to approximately the diameter of a PC12 cellsoma multiplied by 1.5.
2.4.3. ImmunofluorescencePC12 cells were cultured on each substrate, as described above. After 48 h of
culture, cells were fixed with 3.7% formaldehyde in PBS for 15 min and then per-meabilized with 0.1% Triton X-100 in PBS/0.1% bovine serum albumin (BSA) for20 min. All washes, blocking steps, and antibody dilutions were performed using0.1% BSA, 0.01% Triton� X-100 in PBS. After cell fixation and permeabilization, theprimary antibody anti-MAP1B (Sigma–Aldrich; diluted 1:800) was incubated over-night at 4 �C. A secondary Cy3-conjugated antibody (Jackson ImmunoResearch,Cambridgeshire, UK; diluted 1:400) was incubated for 2 h at room temperature. DNAwas stained with 4-6-diamidino-2-phenylindole (DAPI) at 0.5 g/mL for 15 min.F-actin was stained with phalloidin coupled to Alexa Fluor 488 (Molecular Probes) at5 units/mL for 30 min. Finally cells were extensively washed in PBS and mounted ina Fluoromount G� solution (Southern Biotech). Cell observation was done witha Nikon Eclipse E600 epifluorescence microscope coupled to a high resolution colourcamera (Nikon DXM 1200), using �10 and �50 objectives. No threshold processingwas applied to the images.
3. Results and discussion
Molecules (noted in capital letters) of various chain lengthsand chemical nature (Fig. 1) were chosen to generate distinctsurfaces (noted in small letters), according to their mechanism ofadsorption and monolayer formation on glass. The resultingsubstrates were divided into three different classes (Fig. 2) withregard to nanoscale surface organization and hence to distribu-tion of surface energy. Class 1 SAMs are well-ordered with an all-trans conformation of the alkyl chains. Class 2 SAMs, whileeliminating multilayer formation due to the impossibility of themonomers undergoing cross-linking, are disordered. Moreover,

Fig. 2. Sketches representing three distinct organizations of SAMs used as substrates for PC12 cell culture. Class 1 SAMs are well-ordered with an all-trans conformation of alkyl chains.Class 2 SAMs are disordered but limited to monolayer formation. Class 3 SAMs are highly disordered, with possible multilayer formation and higher chemical heterogeneity.
G. Lamour et al. / Biomaterials 31 (2010) 3762–3771 3765
class 2 SAMs likely are accompanied by a significant density ofsubstrate silanol groups (Si–OH), compared to class 1 SAMs. Thisis a consequence of class 2 monolayer adsorption being incom-plete by nature. Class 3 SAMs are the result of chaotic polymeri-zation of a trialkoxysilane. The chemisorption of siloxanes isbelieved to require activation of the siloxane whereby the leavinggroup (e.g., OCH3 in HTMS) is replaced by OH from water. Whenthe solvent solution contains more than the trace amount ofwater necessary for adsorption reaction to occur, methoxy groupsare quickly hydrolyzed before chemical adsorption on the silica
surface. As a result, the molecules polymerize through theirsilanol groups. It is the resultant polymer that chemically bindsthe silica surface.
In view of intrinsic properties of both molecules and solventsolutions (Table 2) it was expected that class 1 SAMs would begenerated by OTS and OTMS molecules, that class 2 SAMs would bethe result of ODS and ODMS adsorption, and that HTMS wouldgenerate either class 1 or class 3 SAMs according to the solventsolution used. The particular properties of each class of substratesare described here after.
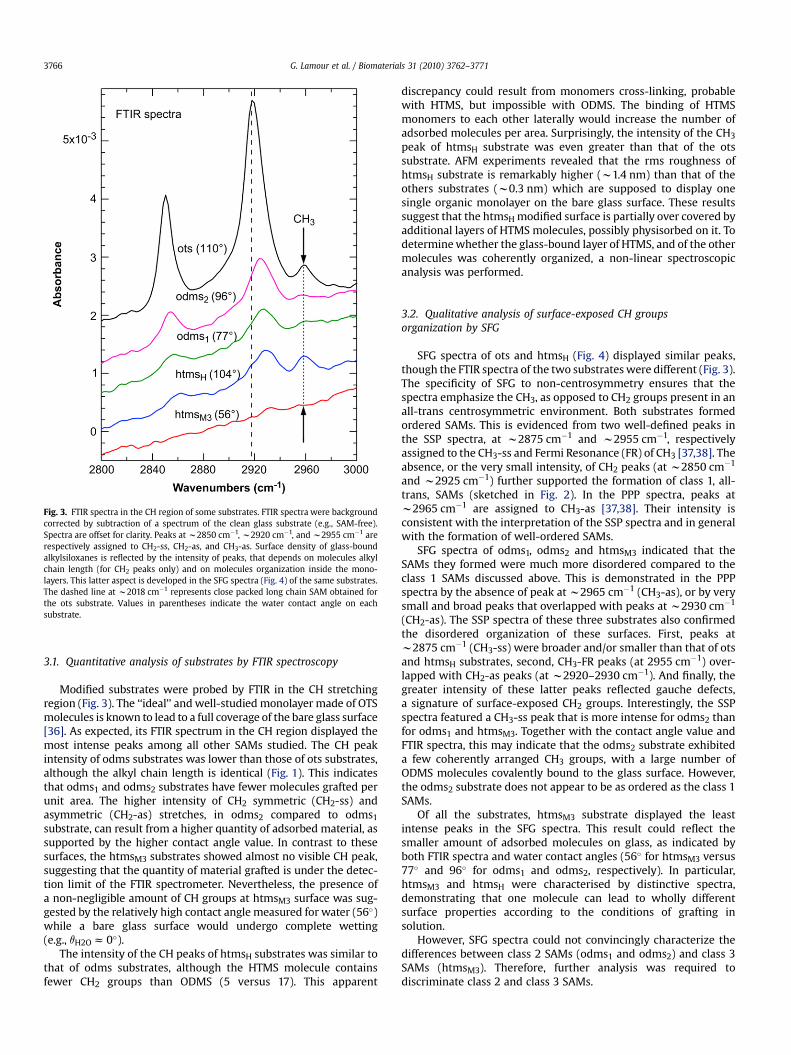
Fig. 3. FTIR spectra in the CH region of some substrates. FTIR spectra were backgroundcorrected by subtraction of a spectrum of the clean glass substrate (e.g., SAM-free).Spectra are offset for clarity. Peaks at w2850 cm�1, w2920 cm�1, and w2955 cm�1 arerespectively assigned to CH2-ss, CH2-as, and CH3-as. Surface density of glass-boundalkylsiloxanes is reflected by the intensity of peaks, that depends on molecules alkylchain length (for CH2 peaks only) and on molecules organization inside the mono-layers. This latter aspect is developed in the SFG spectra (Fig. 4) of the same substrates.The dashed line at w2018 cm�1 represents close packed long chain SAM obtained forthe ots substrate. Values in parentheses indicate the water contact angle on eachsubstrate.
G. Lamour et al. / Biomaterials 31 (2010) 3762–37713766
3.1. Quantitative analysis of substrates by FTIR spectroscopy
Modified substrates were probed by FTIR in the CH stretchingregion (Fig. 3). The ‘‘ideal’’ and well-studied monolayer made of OTSmolecules is known to lead to a full coverage of the bare glass surface[36]. As expected, its FTIR spectrum in the CH region displayed themost intense peaks among all other SAMs studied. The CH peakintensity of odms substrates was lower than those of ots substrates,although the alkyl chain length is identical (Fig. 1). This indicatesthat odms1 and odms2 substrates have fewer molecules grafted perunit area. The higher intensity of CH2 symmetric (CH2-ss) andasymmetric (CH2-as) stretches, in odms2 compared to odms1
substrate, can result from a higher quantity of adsorbed material, assupported by the higher contact angle value. In contrast to thesesurfaces, the htmsM3 substrates showed almost no visible CH peak,suggesting that the quantity of material grafted is under the detec-tion limit of the FTIR spectrometer. Nevertheless, the presence ofa non-negligible amount of CH groups at htmsM3 surface was sug-gested by the relatively high contact angle measured for water (56�)while a bare glass surface would undergo complete wetting(e.g., qH2O z 0�).
The intensity of the CH peaks of htmsH substrates was similar tothat of odms substrates, although the HTMS molecule containsfewer CH2 groups than ODMS (5 versus 17). This apparent
discrepancy could result from monomers cross-linking, probablewith HTMS, but impossible with ODMS. The binding of HTMSmonomers to each other laterally would increase the number ofadsorbed molecules per area. Surprisingly, the intensity of the CH3
peak of htmsH substrate was even greater than that of the otssubstrate. AFM experiments revealed that the rms roughness ofhtmsH substrate is remarkably higher (w1.4 nm) than that of theothers substrates (w0.3 nm) which are supposed to display onesingle organic monolayer on the bare glass surface. These resultssuggest that the htmsH modified surface is partially over covered byadditional layers of HTMS molecules, possibly physisorbed on it. Todetermine whether the glass-bound layer of HTMS, and of the othermolecules was coherently organized, a non-linear spectroscopicanalysis was performed.
3.2. Qualitative analysis of surface-exposed CH groupsorganization by SFG
SFG spectra of ots and htmsH (Fig. 4) displayed similar peaks,though the FTIR spectra of the two substrates were different (Fig. 3).The specificity of SFG to non-centrosymmetry ensures that thespectra emphasize the CH3, as opposed to CH2 groups present in anall-trans centrosymmetric environment. Both substrates formedordered SAMs. This is evidenced from two well-defined peaks inthe SSP spectra, at w2875 cm�1 and w2955 cm�1, respectivelyassigned to the CH3-ss and Fermi Resonance (FR) of CH3 [37,38]. Theabsence, or the very small intensity, of CH2 peaks (at w2850 cm�1
and w2925 cm�1) further supported the formation of class 1, all-trans, SAMs (sketched in Fig. 2). In the PPP spectra, peaks atw2965 cm�1 are assigned to CH3-as [37,38]. Their intensity isconsistent with the interpretation of the SSP spectra and in generalwith the formation of well-ordered SAMs.
SFG spectra of odms1, odms2 and htmsM3 indicated that theSAMs they formed were much more disordered compared to theclass 1 SAMs discussed above. This is demonstrated in the PPPspectra by the absence of peak at w2965 cm�1 (CH3-as), or by verysmall and broad peaks that overlapped with peaks at w2930 cm�1
(CH2-as). The SSP spectra of these three substrates also confirmedthe disordered organization of these surfaces. First, peaks atw2875 cm�1 (CH3-ss) were broader and/or smaller than that of otsand htmsH substrates, second, CH3-FR peaks (at 2955 cm�1) over-lapped with CH2-as peaks (at w2920–2930 cm�1). And finally, thegreater intensity of these latter peaks reflected gauche defects,a signature of surface-exposed CH2 groups. Interestingly, the SSPspectra featured a CH3-ss peak that is more intense for odms2 thanfor odms1 and htmsM3. Together with the contact angle value andFTIR spectra, this may indicate that the odms2 substrate exhibiteda few coherently arranged CH3 groups, with a large number ofODMS molecules covalently bound to the glass surface. However,the odms2 substrate does not appear to be as ordered as the class 1SAMs.
Of all the substrates, htmsM3 substrate displayed the leastintense peaks in the SFG spectra. This result could reflect thesmaller amount of adsorbed molecules on glass, as indicated byboth FTIR spectra and water contact angles (56� for htmsM3 versus77� and 96� for odms1 and odms2, respectively). In particular,htmsM3 and htmsH were characterised by distinctive spectra,demonstrating that one molecule can lead to wholly differentsurface properties according to the conditions of grafting insolution.
However, SFG spectra could not convincingly characterize thedifferences between class 2 SAMs (odms1 and odms2) and class 3SAMs (htmsM3). Therefore, further analysis was required todiscriminate class 2 and class 3 SAMs.
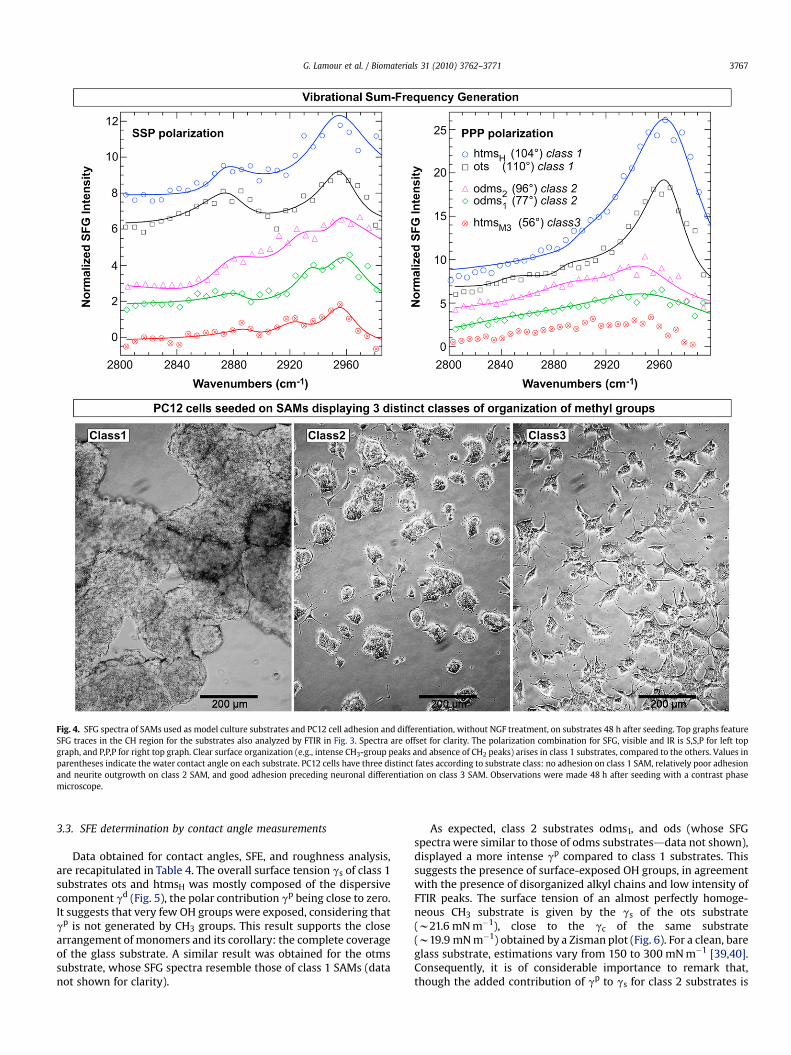
Fig. 4. SFG spectra of SAMs used as model culture substrates and PC12 cell adhesion and differentiation, without NGF treatment, on substrates 48 h after seeding. Top graphs featureSFG traces in the CH region for the substrates also analyzed by FTIR in Fig. 3. Spectra are offset for clarity. The polarization combination for SFG, visible and IR is S,S,P for left topgraph, and P,P,P for right top graph. Clear surface organization (e.g., intense CH3-group peaks and absence of CH2 peaks) arises in class 1 substrates, compared to the others. Values inparentheses indicate the water contact angle on each substrate. PC12 cells have three distinct fates according to substrate class: no adhesion on class 1 SAM, relatively poor adhesionand neurite outgrowth on class 2 SAM, and good adhesion preceding neuronal differentiation on class 3 SAM. Observations were made 48 h after seeding with a contrast phasemicroscope.
G. Lamour et al. / Biomaterials 31 (2010) 3762–3771 3767
3.3. SFE determination by contact angle measurements
Data obtained for contact angles, SFE, and roughness analysis,are recapitulated in Table 4. The overall surface tension gs of class 1substrates ots and htmsH was mostly composed of the dispersivecomponent gd (Fig. 5), the polar contribution gp being close to zero.It suggests that very few OH groups were exposed, considering thatgp is not generated by CH3 groups. This result supports the closearrangement of monomers and its corollary: the complete coverageof the glass substrate. A similar result was obtained for the otmssubstrate, whose SFG spectra resemble those of class 1 SAMs (datanot shown for clarity).
As expected, class 2 substrates odms1, and ods (whose SFGspectra were similar to those of odms substratesddata not shown),displayed a more intense gp compared to class 1 substrates. Thissuggests the presence of surface-exposed OH groups, in agreementwith the presence of disorganized alkyl chains and low intensity ofFTIR peaks. The surface tension of an almost perfectly homoge-neous CH3 substrate is given by the gs of the ots substrate(w21.6 mN m�1), close to the gc of the same substrate(w19.9 mN m�1) obtained by a Zisman plot (Fig. 6). For a clean, bareglass substrate, estimations vary from 150 to 300 mN m�1 [39,40].Consequently, it is of considerable importance to remark that,though the added contribution of gp to gs for class 2 substrates is
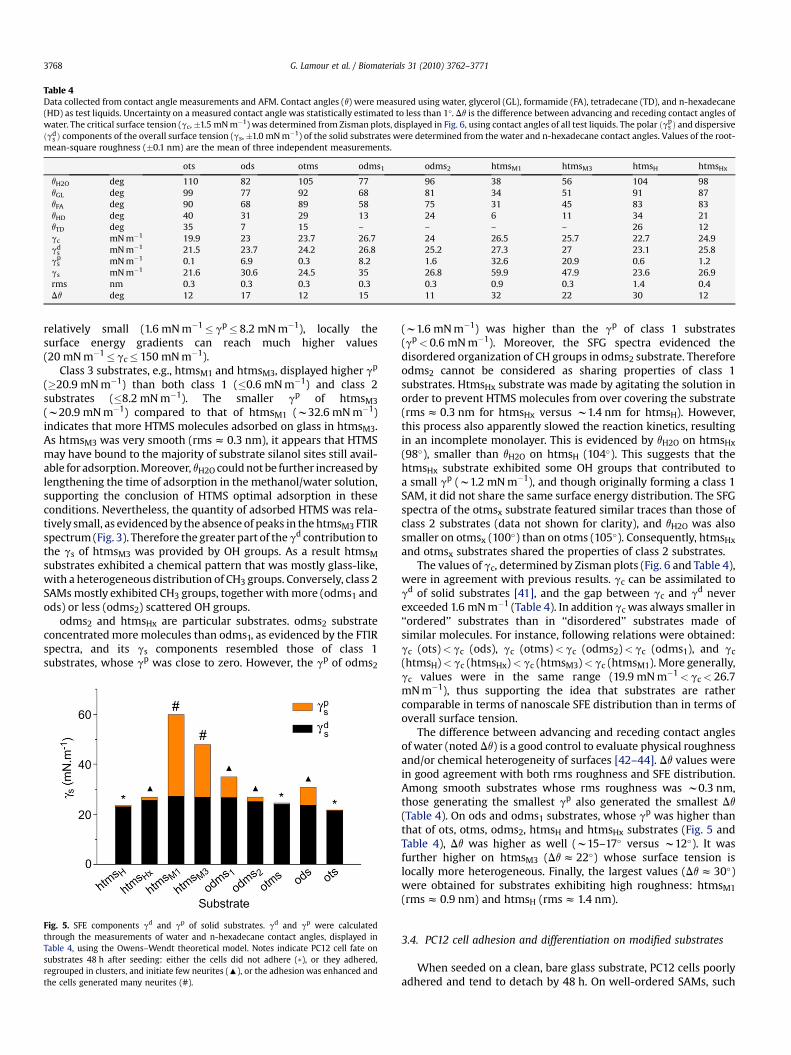
Table 4Data collected from contact angle measurements and AFM. Contact angles (q) were measured using water, glycerol (GL), formamide (FA), tetradecane (TD), and n-hexadecane(HD) as test liquids. Uncertainty on a measured contact angle was statistically estimated to less than 1�. Dq is the difference between advancing and receding contact angles ofwater. The critical surface tension (gc,�1.5 mN m�1) was determined from Zisman plots, displayed in Fig. 6, using contact angles of all test liquids. The polar ðgp
s Þ and dispersiveðgd
s Þ components of the overall surface tension (gs,�1.0 mN m�1) of the solid substrates were determined from the water and n-hexadecane contact angles. Values of the root-mean-square roughness (�0.1 nm) are the mean of three independent measurements.
ots ods otms odms1 odms2 htmsM1 htmsM3 htmsH htmsHx
qH2O deg 110 82 105 77 96 38 56 104 98qGL deg 99 77 92 68 81 34 51 91 87qFA deg 90 68 89 58 75 31 45 83 83qHD deg 40 31 29 13 24 6 11 34 21qTD deg 35 7 15 – – – – 26 12gc mN m�1 19.9 23 23.7 26.7 24 26.5 25.7 22.7 24.9gd
s mN m�1 21.5 23.7 24.2 26.8 25.2 27.3 27 23.1 25.8gp
s mN m�1 0.1 6.9 0.3 8.2 1.6 32.6 20.9 0.6 1.2gs mN m�1 21.6 30.6 24.5 35 26.8 59.9 47.9 23.6 26.9rms nm 0.3 0.3 0.3 0.3 0.3 0.9 0.3 1.4 0.4Dq deg 12 17 12 15 11 32 22 30 12
G. Lamour et al. / Biomaterials 31 (2010) 3762–37713768
relatively small (1.6 mN m�1� gp� 8.2 mN m�1), locally thesurface energy gradients can reach much higher values(20 mN m�1� gc� 150 mN m�1).
Class 3 substrates, e.g., htmsM1 and htmsM3, displayed higher gp
(�20.9 mN m�1) than both class 1 (�0.6 mN m�1) and class 2substrates (�8.2 mN m�1). The smaller gp of htmsM3
(w20.9 mN m�1) compared to that of htmsM1 (w32.6 mN m�1)indicates that more HTMS molecules adsorbed on glass in htmsM3.As htmsM3 was very smooth (rms z 0.3 nm), it appears that HTMSmay have bound to the majority of substrate silanol sites still avail-able for adsorption. Moreover, qH2O could not be further increased bylengthening the time of adsorption in the methanol/water solution,supporting the conclusion of HTMS optimal adsorption in theseconditions. Nevertheless, the quantity of adsorbed HTMS was rela-tively small, as evidenced by the absence of peaks in the htmsM3 FTIRspectrum (Fig. 3). Therefore the greater part of the gd contribution tothe gs of htmsM3 was provided by OH groups. As a result htmsM
substrates exhibited a chemical pattern that was mostly glass-like,with a heterogeneous distribution of CH3 groups. Conversely, class 2SAMs mostly exhibited CH3 groups, together with more (odms1 andods) or less (odms2) scattered OH groups.
odms2 and htmsHx are particular substrates. odms2 substrateconcentrated more molecules than odms1, as evidenced by the FTIRspectra, and its gs components resembled those of class 1substrates, whose gp was close to zero. However, the gp of odms2
Fig. 5. SFE components gd and gp of solid substrates. gd and gp were calculatedthrough the measurements of water and n-hexadecane contact angles, displayed inTable 4, using the Owens–Wendt theoretical model. Notes indicate PC12 cell fate onsubstrates 48 h after seeding: either the cells did not adhere (*), or they adhered,regrouped in clusters, and initiate few neurites (:), or the adhesion was enhanced andthe cells generated many neurites (#).
(w1.6 mN m�1) was higher than the gp of class 1 substrates(gp< 0.6 mN m�1). Moreover, the SFG spectra evidenced thedisordered organization of CH groups in odms2 substrate. Thereforeodms2 cannot be considered as sharing properties of class 1substrates. HtmsHx substrate was made by agitating the solution inorder to prevent HTMS molecules from over covering the substrate(rms z 0.3 nm for htmsHx versus w1.4 nm for htmsH). However,this process also apparently slowed the reaction kinetics, resultingin an incomplete monolayer. This is evidenced by qH2O on htmsHx
(98�), smaller than qH2O on htmsH (104�). This suggests that thehtmsHx substrate exhibited some OH groups that contributed toa small gp (w1.2 mN m�1), and though originally forming a class 1SAM, it did not share the same surface energy distribution. The SFGspectra of the otmsx substrate featured similar traces than those ofclass 2 substrates (data not shown for clarity), and qH2O was alsosmaller on otmsx (100�) than on otms (105�). Consequently, htmsHx
and otmsx substrates shared the properties of class 2 substrates.The values of gc, determined by Zisman plots (Fig. 6 and Table 4),
were in agreement with previous results. gc can be assimilated togd of solid substrates [41], and the gap between gc and gd neverexceeded 1.6 mN m�1 (Table 4). In addition gc was always smaller in‘‘ordered’’ substrates than in ‘‘disordered’’ substrates made ofsimilar molecules. For instance, following relations were obtained:gc (ots)< gc (ods), gc (otms)< gc (odms2)< gc (odms1), and gc
(htmsH)< gc (htmsHx)< gc (htmsM3)< gc (htmsM1). More generally,gc values were in the same range (19.9 mN m�1< gc< 26.7mN m�1), thus supporting the idea that substrates are rathercomparable in terms of nanoscale SFE distribution than in terms ofoverall surface tension.
The difference between advancing and receding contact anglesof water (noted Dq) is a good control to evaluate physical roughnessand/or chemical heterogeneity of surfaces [42–44]. Dq values werein good agreement with both rms roughness and SFE distribution.Among smooth substrates whose rms roughness was w0.3 nm,those generating the smallest gp also generated the smallest Dq
(Table 4). On ods and odms1 substrates, whose gp was higher thanthat of ots, otms, odms2, htmsH and htmsHx substrates (Fig. 5 andTable 4), Dq was higher as well (w15–17� versus w12�). It wasfurther higher on htmsM3 (Dq z 22�) whose surface tension islocally more heterogeneous. Finally, the largest values (Dq z 30�)were obtained for substrates exhibiting high roughness: htmsM1
(rms z 0.9 nm) and htmsH (rms z 1.4 nm).
3.4. PC12 cell adhesion and differentiation on modified substrates
When seeded on a clean, bare glass substrate, PC12 cells poorlyadhered and tend to detach by 48 h. On well-ordered SAMs, such

Fig. 6. Zisman plots used to determine the critical surface tension (gc) of solid substrates. gc values were read where the line fits intersect cos q¼ 1 (numerical values are displayed inTable 4). For each substrates the line fit resulted in R2> 0.99, except for the ods substrate (R2> 0.985). Insets: enlargement of the area where the line fits intersect cos q¼ 1 (e.g., gc).
G. Lamour et al. / Biomaterials 31 (2010) 3762–3771 3769
as class 1 substrates, PC12 cells did not adhere at all, and clusters ofcells were observed that floated over the surface (Fig. 4). Thisreveals the poor affinity of PC12 cells for substrates exclusivelycomposed of OH groups, or of CH3 groups. On the contrary, cellsdid adhere on class 2 and on class 3 SAMs, as well as on incompleteclass 1 SAMs. Therefore, it appears that adhesion is favored as soonas some disorder is introduced in the surface arrangement of CH3
groups. We further hypothesize that is because OH groups,pointing out from the surface, are accessible to the cells. In addi-tion, PC12 cells initiated more neurites (Figs. 4 and 7) on class 3
Fig. 7. Propensity of PC12 cells to initiate neurite outgrowth without NGF treatment,according to the substrate, 48 h after seeding. Several pictures of cells were taken andthe number of grown neurites (L> 25 mm) was counted on each substrate. The data arefrom one experiment representative of at least three independent measurements. Theyreflect typical differences between substrate classes. On class 1 SAMs, cells did notadhere, and thus did not initiate any neuritis. Conversely, on class 2 SAMs andincomplete class 1 SAMs, cells adhered and initiate few neurites. On class 3 SAMs,adhesion was enhanced and cells generated more neurites. The values in parenthesesindicate the water contact angle on each substrate.
SAMs (more than 50 mm�2) than on class 2 SAMs or on incompleteclass 1 SAMs (less than 20 mm�2). All in all, it appears that, themore locally heterogeneous is the surface, the more PC12 cellsgenerate neurites. These results are in complete agreement withthose of our previous study [5], and provide further evidence thatsurface disorder, and thus local gradients in surface energy, cantrigger neuritogenesis in PC12 cells albeit the absence of NGFtreatment.
Our results also indicate that PC12 cells were not highly sensi-tive to the nanoroughness of our substrates. Cell adhesion andneuritogenesis were similar in ots (rms z 0.3 nm) and in htmsH
(w1.4 nm). They were also similar in htmsM1 (w0.9 nm) and inhtmsM3 (w0.3 nm) substrates (Fig. 7). A potential explanation tothis result is that the nanoroughness of our substrates is too low tohave a critical influence on PC12 cell adhesion and differentiation.In addition, neither the hydrophobicity degree, nor the surfaceconcentration of methyl groups seemed to profoundly affect PC12cell behavior. The propensity of cells to adhere and differentiatewere not significantly different in class 2 SAMs odms1 (qH2O¼ 77�)and odms2 (96�), or in class 1 SAMs ots (110�) and htmsH (104�),while differences were obvious between class 2 SAM odms1 (77�)and class 3 SAM htmsM3 (56�), or between class 1 SAM htmsH
(104�) and incomplete class 1 SAM htmsHx (98�). As a result thechemical heterogeneity, that is the alternation between CH3 andOH groups at the nanoscale level, seemed to be the determinantfactor in generating the surface energy gradients that the cells wereable to sense.
The dimension for which these gradients may become effectiveis still questionable, since the gradients can theoretically emergeout from the surface as soon as a few single OH groups becomeaccessible to the cells. However, actin-based processes such aslamellipodial and filopodial activity can probe the substrate ata dimension of w150 mm [5,45], which may indicate the dimen-sional range for which the gradients become effective and thussensed by the cells. Therefore, a potential explanation for thissensing might reside in the translation of the local gradientsthrough lamellipodia and filopodia that can be mediated byexternal factors, such as calcium transients [46,47].

Fig. 8. MAP1B expression and localization in PC12 cells cultured on htmsM and odms substrates, without NGF treatment. MAP1B signal is stronger in isolated cells than in clusteredcells. More cells display a strong signal and cells are more often apart on an htmsM substrate than on an odms one, where cells rather tend to group in clusters. Inset boxes: arrowspoint at higher local concentrations of MAP1B upstream of the growth cones (plain arrows) and at branching/turning points (broken arrows).
G. Lamour et al. / Biomaterials 31 (2010) 3762–37713770
Though PC12 cells adhered on moderately disordered class 2SAMs, they tended to gather in clusters (Figs. 4 and 8), suggestingthat these substrates were not optimal, and that cell–cell interac-tions were favored over cell–substrate adhesive strengths, a typicalfeature of PC12 cells [48]. Conversely, on highly disordered class 3SAMs, cells scattered across the surface, with single cells tended tospread (Figs. 4 and 8). This indicates a strong adhesion to thesubstrate, together with cells showing signs of polarization, whatmay prefigure neuritis extension [49]. This can be correlated withthe higher gs of class 3 substrates (�47.9 mN m�1) over class 2substrates (�35 mN m�1), in agreement with the dependence ofcell-aggregates spreading rate over the substrate adhesivity, thatwas reported in Ref. [50].
A criterion to evaluate neuronal differentiation is a high level ofexpression of neuronal markers proteins like MAP1B. MAP1B isa neuron-specific protein involved in microtubule assembly [51].NGF treatment stimulates MAP1B expression together with PC12cell differentiation [52]. As expected, high levels of fluorescencereflecting MAP1B concentration was detected in cells that under-went neurite outgrowth on class 3 and on class 2 SAMs, typically inisolated cells or at the periphery of cell clusters, rather than in cellstrapped in clusters (Fig. 8). Better adhesiveness allowed more cellsto remain apart, not to cluster, on class 3 substrates, whose abilityto promote adhesion and to trigger neuronal differentiation of PC12cells was thereby stronger than that of class 2 substrates. In view ofthese results, it can be suggested that PC12 cells would adhere butnot differentiate if they were seeded on an NH2-terminated class 1SAM, as observed on smooth substrates such as bare glass coatedwith poly-L-lysine or poly-L-ornithine [5].
MAP1B localization in differentiated cells was similar whetherPC12 cells were seeded on class 2 or on class 3 substrates (Fig. 8;inset boxes). MAP1B was mostly displayed in the cell soma. Inter-estingly, MAP1B was also displayed upstream of growth cones(Fig. 8; plain arrows), and at branching/turning points of the neu-rites (Fig. 8; broken arrows), that is where microtubules are highlydynamic. These results indicate that cell–substrate interactions canmimic NGF effects, leading PC12 cells to start neuritogenesis.
The fact that it only took 48 h for neurites to extend up tow100 mm, compared to 4–6 days in our previous study [5], mightbe related to the reduced volume of medium (V¼ 2 mL to V¼ 335mL) used for cell seeding in these experiments. Considering thatcells might respond to surface energy gradients, by secreting neu-rotrophic factors, like NGF, their concentration in the cell envi-ronment would be higher in this experimental set. Higherconcentrations of NGF, for example, are expected to facilitate theactivation of signalling pathways leading to neurite outgrowth.
4. Conclusions
In this study, we manufactured culture substrates by distinctchemical treatments of bare glass surfaces in order to obtain anacute control of substrate physical and chemical cues that may besensed by the cells. We introduced a new perspective on self-assembled-monolayers (SAMs) used as a culture substrate, byranking them in three distinct classes, including highly orderedsurface (class 1), moderately ordered surface (class 2), and highlydisordered surface (class 3). Highly surface specific techniques havebeen used to characterize the substrates. In addition to commonlyused FTIR and AFM, the analysis combined SFG, a non-linear opticaltechnique that unveils the surface ordering, with wetting experi-ments, using the Owens–Wendt model that distinguishes disper-sive and polar components of the surface free energy. Takentogether, the results harmoniously combined to ascribe to eachsubstrate class a distinct nanostructured organization that gener-ated a specific surface free-energy distribution. Thence, we iden-tified what is the most important parameter involved in generatingthe SFE gradients that the cells were able to sense. Of all the factorsanalyzed, including surface nanoroughness, wettability, chemicalaffinity, terminal-groups concentration, and nanoscale chemicalheterogeneities, we demonstrate that, in our experiments, it isnanoscale chemical heterogeneities that have a critical influence onboth the adhesion and the differentiation of PC12 cells. Moreover,we show that PC12 cells can reach a fully stable state of differen-tiation by 48 h of culture on rigid model surfaces (class 3 SAMs of

G. Lamour et al. / Biomaterials 31 (2010) 3762–3771 3771
alkylsiloxanes on glass), without nerve growth factor treatment.Earlier experimental data demonstrating the influence of substratefactors, such as mechanical, spatial and chemical cues, on neuronalcell functions, would gain in being reappraised in light of this newcriterion (e.g., substrate nanoscale chemical heterogeneities) and,in turn, future experiments will have to challenge it. It is reasonableto assume that other systems, in addition to PC12 cells, such asprimary neurons or astrocytes, may be dramatically affected bynanoscale surface organization. Therefore, future design ofbiomaterials may integrate local gradients in surface free energy asa mean to enhance regeneration of hippocampal or cortical neuronsfor instance. In addition, future experiments should investigate themediators of the nanoscale SFE gradients. In particular, it should bedetermined whether PC12 cells can respond to these substratephysical cues directly or through components of the culturemedium such as calcium and serum proteins.
Acknowledgements
We thank Dr. Sylvain Gabriele for critical reading of themanuscript.
The Descartes group acknowledges the support of the FrenchMinistry of Research, the University of Paris Diderot, the IFR95, andof the University of Paris Descartes. The Temple group acknowl-edges the support of the NSF.
Appendix
Figures with essential colour discrimination. Most of the figuresin this article have parts that are difficult to interpret in black andwhite. The full colour images can be found in the on-line version, atdoi:10.1016/j.biomaterials.2010.01.099.
References
[1] Letourneau PC. Cell-to-substratum adhesion and guidance of axonal elonga-tion. Dev Biol 1975;44:92–101.
[2] Letourneau PC. Possible roles for cell-to-substratum adhesion in neuronalmorphogenesis. Dev Biol 1975;44:77–91.
[3] Suter DM, Forscher P. Substrate–cytoskeletal coupling as a mechanism for theregulation of growth cone motility and guidance. J Neurobiol 2000;44:97–113.
[4] Murnane AC, Brown K, Keith CH. Preferential initiation of PC12 neurites indirections of changing substrate adhesivity. J Neurosci Res 2002;67:321–8.
[5] Lamour G, Journiac N, Soues S,BonneauS,Nassoy P, et al. Influence of surface energydistribution on neuritogenesis. Colloids Surf B Biointerfaces 2009;72:208–18.
[6] Fan YW, Cui FZ, Hou SP, Xu QY, Chen LN, et al. Culture of neural cells on siliconwafers with nano-scale surface topograph. J Neurosci Methods 2002;120:17–23.
[7] Badami AS, Kreke MR, Thompson MS, Riffle JS, Goldstein AS. Effect of fiberdiameter on spreading, proliferation, and differentiation of osteoblastic cellson electrospun poly(lactic acid) substrates. Biomaterials 2006;27:596–606.
[8] Staii C, Viesselmann C, Ballweg J, Shi L, Liu G, et al. Positioning and guidance ofneurons on gold surfaces by directed assembly of proteins using atomic forcemicroscopy. Biomaterials 2009;30:3397–404.
[9] Xiong Y, Lee AC, Suter DM, Lee GU. Topography and nanomechanics of liveneuronal growth cones analyzed by atomic force microscopy. Biophys J2009;96:5060–72.
[10] Stenger DA, Pike CJ, Hickman JJ, Cotman CW. Surface determinants of neuronalsurvival and growth on self-assembled monolayers in culture. Brain Res1993;630:136–47.
[11] Lee MH, Brass DA, Morris R, Composto RJ, Ducheyne P. The effect of non-specific interactions on cellular adhesion using model surfaces. Biomaterials2005;26:1721–30.
[12] Ren Y, Zhang H, Huang H, Wang X, Zhou Z, et al. In vitro behavior of neuralstem cells in response to different chemical functional groups. Biomaterials2009;30:1036–44.
[13] Saha K, Keung AJ, Irwin EF, Li Y, Little L, et al. Substrate modulus directs neuralstem cell behavior. Biophys J 2008;95:4426–38.
[14] Teixeira AI, Ilkhanizadeh S, Wigenius JA, Duckworth JK, Inganas O, et al. Thepromotion of neuronal maturation on soft substrates. Biomaterials2009;30:4567–72.
[15] Janmey PA, Winer JP, Murray ME, Wen Q. The hard life of soft cells. Cell MotilCytoskeleton 2009;66:597–605.
[16] Leipzig ND, Shoichet MS. The effect of substrate stiffness on adult neural stemcell behavior. Biomaterials 2009;30:6867–78.
[17] Flanagan LA, Ju YE, Marg B, Osterfield M, Janmey PA. Neurite branching ondeformable substrates. Neuroreport 2002;13:2411–5.
[18] Schwarz US, Bischofs IB. Physical determinants of cell organization in softmedia. Med Eng Phys 2005;27:763–72.
[19] Senaratne W, Andruzzi L, Ober CK. Self-assembled monolayers and polymerbrushes in biotechnology: current applications and future perspectives. Bio-macromolecules 2005;6:2427–48.
[20] Barrias CC, Martins MCL, Almeida-Porada G, Barbosa MA, Granja PL. The correlationbetween the adsorption of adhesive proteins and cell behaviour on hydroxyl-methyl mixed self-assembled monolayers. Biomaterials 2009;30:307–16.
[21] Kleinfeld D, Kahler KH, Hockberger PE. Controlled outgrowth of dissociatedneurons on patterned substrates. J Neurosci 1988;8:4098–120.
[22] Kapur R, Rudolph AS. Cellular and cytoskeleton morphology and strength ofadhesion of cells on self-assembled monolayers of organosilanes. Exp Cell Res1998;244:275–85.
[23] Sukenik CN, Balachander N, Culp LA, Lewandowska K, Merritt K. Modulationof cell-adhesion by modification of titanium surfaces with covalently attachedself-assembled monolayers. J Biomed Mater Res 1990;24:1307–23.
[24] Wehrman T, He X, Raab B, Dukipatti A, Blau H, et al. Structural and mechanisticinsights into nerve growth factor interactions with the TrkA and p75 recep-tors. Neuron 2007;53:25–38.
[25] Mischel PS, Umbach JA, Eskandari S, Smith SG, Gundersen CB, et al. Nervegrowth factor signals via preexisting TrkA receptor oligomers. Biophys J2002;83:968–76.
[26] Greene LA, Tischler AS. Establishment of a noradrenergic clonal line of ratadrenal pheochromocytoma cells which respond to nerve growth factor. ProcNatl Acad Sci U S A 1976;73:2424–8.
[27] Fujii DK, Massoglia SL, Savion N, Gospodarowicz D. Neurite outgrowth andprotein synthesis by PC12 cells as a function of substratum and nerve growthfactor. J Neurosci 1982;2:1157–75.
[28] Wujek JR, Akeson RA. Extracellular matrix derived from astrocytes stimulatesneuritic outgrowth from PC12 cells in vitro. Brain Res 1987;431:87–97.
[29] Arkles B. Tailoring surfaces with silanes. Chemtech 1977;7:766–78.[30] Shen YR. Sum-frequency generation. In: The principles of nonlinear optics.
New York: Wiley-Interscience; 1984. pp. 67–85.[31] Eftekhari-Bafrooei A, Borguet E. Effect of surface charge on the vibrational
dynamics of interfacial water. J Am Chem Soc 2009;131:12034–5.[32] Owens DK, Wendt RC. Estimation of surface free energy of polymers. J Appl
Polym Sci 1969;13:1741–7.[33] Kwok DY, Li D, Neumann AW. Evaluation of the Lifshitz Van-der-Waals acid–
base approach to determine interfacial-tensions. Langmuir 1994;10:1323–8.[34] Zisman WA. Contact angle, wettability and adhesion. Adv Chem Ser
1964;43:1–51.[35] Good RJ, Girifalco LA. A theory for estimation of surface and interfacial ener-
gies.3. Estimation of surface energies of solids from contact angle data. J PhysChem 1960;64:561–5.
[36] Ulman A. Formation and structure of self-assembled monolayers. Chem Rev1996;96:1533–54.
[37] Porter MD, Bright TB, Allara DL, Chidsey CED. Spontaneously organizedmolecular assemblies .4. Structural characterization of normal-alkyl thiolmonolayers on gold by optical ellipsometry, infrared-spectroscopy, and elec-trochemistry. J Am Chem Soc 1987;109:3559–68.
[38] Guyotsionnest P, Superfine R, Hunt JH, Shen YR. Vibrational spectroscopy ofa silane monolayer at air solid and liquid solid interfaces using sum-frequencygeneration. Chem Phys Lett 1988;144:1–5.
[39] Fisher JC. The fracture of liquids. J Appl Phys 1948;19:1062–7.[40] Degennes PG, Brochard-Wyart F, Quere D. Capillarite: Interfaces mobiles. In:
Gouttes, bulles, perles et ondes. Paris: Belin; 2005. pp. 11–37.[41] Adamson AW, Gast AP. The solid–liquid interface-contact angle. In: Physical
chemistry of surfaces. 6th ed. New York: Wiley-Interscience; 1997. pp. 347–89.[42] Degennes PG. Wetting – statics and dynamics. Rev Mod Phys 1985;57:827–63.[43] Chow TS. Wetting of rough surfaces. J Phys Condens Matter 1998;10:L445–51.[44] Zografi G, Tam SS. Wettability of pharmaceutical solids – estimates of solid-
surface polarity. J Pharm Sci 1976;65:1145–9.[45] Mogilner A, Rubinstein B. The physics of filopodial protrusion. Biophys J
2005;89:782–95.[46] Gomez TM, Robles E, Poo M, Spitzer NC. Filopodial calcium transients promote
substrate-dependent growth cone turning. Science 2001;291:1983–7.[47] Veksler A, Gov NS. Calcium-actin waves and oscillations of cellular
membranes. Biophys J 2009;97:1558–68.[48] Greene LA, Aletta JM, Rukenstein A, Green SH. PC12 pheochromocytoma cells:
culture, nerve growth factor treatment, and experimental exploitation.Methods Enzymol 1987;147:207–16.
[49] Matta LL, Aranda-Espinoza H. Neuronal systems & modeling; strong adhesionidentifies potential neurite extension and polarization sites in PC12 cells.Biophys J 2008;94:1055–7.
[50] Ryan PL, Foty RA, Kohn J, Steinberg MS. Tissue spreading on implantablesubstrates is a competitive outcome of cell-cell vs. cell-substratum adhesivity.Proc Natl Acad Sci USA 2001;98:4323–7.
[51] Gordonweeks PR. Growth cones – the mechanism of neurite advance. Bio-Essays 1991;13:235–9.
[52] Drubin DG, Feinstein SC, Shooter EM, Kirschner MW. Nerve growth factor-in-duced neurite outgrowth in PC12 cells involves the coordinate induction ofmicrotubule assembly and assembly-promoting factors. J Cell Biol 1985;101:1799–807.