Tripalmitin and monoacylglycerols as modifiers in the crystallisation of palm oil
Upload
independentCategory
view
0download
0
Advances in Colloid and Interface Science104 (2003) 53–74
0001-8686/03/$ - see front matter� 2003 Elsevier Science B.V. All rights reserved.doi:10.1016/S0001-8686(03)00036-8
Polyelectrolytes as adhesion modifiers
Per M. Claesson *, Andra Dedinaite , Orlando J. Rojasa,b, a,b a,b,c
Department of Chemistry, Surface Chemistry, Royal Institute of Technology,a
Drottning Kristinas vag 51, SE-100 44 Stockholm, Sweden¨Institute for Surface Chemistry, Box 5607, SE-114 86 Stockholm, Swedenb
Escuela de Ingenierıa Quımica, Lab. FIRP, Universidad de Los Andes, Merida 5101, Venezuelac ´ ´ ´
Abstract
Adsorbed layers of polyelectrolytes have been studied with atomic force microscopy(AFM) and the interferometric surface force apparatus(SFA). Particular emphasis was puton determining the effect of the polyelectrolyte charge density on surface topography, andthe effect of the polyelectrolyte coating on the adhesive properties. The AFM was employedto image individual polymer chains at low adsorption densities and to characterize the layertopography and coverage at higher adsorption densities. The adhesive properties betweentwo polyelectrolyte-coated surfaces in air were determined as a function of the number ofcontacts made at any given spot. The data provide evidence for formation of electrostaticbridges, particularly when highly charged polyelectrolytes are used. Further, material transportbetween the surfaces is observed when the polyelectrolyte is either highly charged or have avery low charge density. For intermediate charge densities we could not observe anyindication of material transfer. The adhesion between one polyelectrolyte-coated surface andone bare surface was initially higher than that between two polyelectrolyte-coated surfaces.However, due to material transfer between the two surfaces the adhesion decreasedsignificantly with the number of times that the surfaces were driven into contact. For thepolyelectrolytes of the lowest charge density the results suggest that entanglement effectscontribute to the adhesive interaction. The modification of the adhesion by polyelectrolytesin practical systems such as in the case of dry-strength additives to improve paper resistanceis also considered.� 2003 Elsevier Science B.V. All rights reserved.
Keywords: Adhesion; Polyelectrolytes; AFM imaging; Surface forces; Dry-strength additives; Paperstrength
*Corresponding author. Tel.:q46-8790-9972; fax:q46-8208-998.E-mail address: [email protected](P.M. Claesson).

54 P.M. Claesson et al. / Advances in Colloid and Interface Science 104 (2003) 53–74
1. Introduction
Polyelectrolytes are commonly used as additives to control colloidal stability andadhesive properties of surfaces. One classic example of the latter is the use ofcationic polyelectrolytes as retention aids and as dry and wet strength additives inpaper making. For example, the pretreatment of clay particles with cationicpoly(ethylene imine) increases the clay deposition on pulp fibers at pH)4 w1x. Thisis rationalized in terms of attractive electrostatic interactions. The dry strength ofpaper is often increased by addition of cationic polyelectrolytes such as cationicstarch to the fiber furnish, which is subsequently dried. The cationic polymeradsorbs to the negatively charged fibers and mediates an increased fiber–fiber bondw2x. It has been reported that the dry strength of the paper increases with decreasingcharge density of the polymerw2x, presumably due to increased polymer–polymerinterpenetration and due to increased viscoelastic losses that occur during the ruptureof the paper sheet under strain.In recent years surface measurements have been used to investigate the interactions
between polyelectrolyte-coated surfaces in aqueous solutionsw3–6x. From suchstudies much have been learned about how the polyelectrolyte charge densityw7,8x,ionic strengthw9–11x, substrate characteristicsw12–14x and order of addition ofpolyelectrolytes and other componentsw15,16x influence the adsorbed layer structureand the resulting surface forces. The shear forces between polyelectrolyte-coatedsurfaces have also been quantifiedw17x. Conversely, very little fundamental workhas been done on the adhesion between polyelectrolyte-coated surfaces in air.The theory of adhesion is bounded to many confusions usually related to the
process of bond-forming and bond-breaking which have a very different naturew18x.Pioneering work by Johnson et al.w19x and Derjaguin et al. established some basisfor understanding the influence of molecular forces on adhesion between solidbodies, especially for the case of an elastic particle and a rigid substratew20–24x.The effect of contact deformations on the adhesion of particles has also beenconsideredw25x. Nevertheless, dissipation effects and rate-dependent adhesion hasnot been discussed to a large extent. Note, however, the work by Plunkett et al.w26x.The case of adhesion between solid bodies with adsorbed layers of surfactant and
polymers is even more difficult to characterize and understand. Most of the workaims to solve practical problems in biological and pharmaceutical systemswsee forexample,w27,28x or for instance, in mineral processing and cellulosic(papermaking)systemsx. In many cases the subject has been viewed considering detachment ofparticles under different flow conditionsw29,30x.Interaction forces as measured by the surface force apparatus and the atomic
force microscope have been used to investigate adhesion phenomena betweensurfactant or polymer layers adsorbed on solid surfaces. An interesting fact is thatadhesion in air between two monolayer-coated surfaces depends on atmosphericconditions such as the relative humidity or the presence of organic vaporsw31x. Itis worth noting that Ruths and Granick have described detailed work on the rate-

55P.M. Claesson et al. / Advances in Colloid and Interface Science 104 (2003) 53–74
Fig. 1. Molecular structure of the monomer AM(left) and MAPTAC(right).
dependent adhesion between surfaces coated with polymer and surfactant layers inair w32,33x.The purpose of the present study is to investigate the effect of thin polyelectrolyte
layers on the adhesion force between two polyelectrolyte-coated surfaces andbetween one polyelectrolyte-coated surface and one bare surface. We are particularlyinterested in the effect of the polyelectrolyte charge density. Atomic force microscopyhas been employed to characterize the preadsorbed layers and the interferometricsurface force apparatus has been utilized for the adhesion force measurements.
2. Materials and methods
The polyelectrolytes used in this investigation were random copolymers ofuncharged acrylamide(AM) and positively chargedw3-(2-methylpropionami-do)propylxtrimethylammonium chloride(MAPTAC) (see Fig. 1). By balancing theratio AMyMAPTAC in the (free radical) copolymerization process, macromoleculeswith different charge densities(or percentage molar ratio of cationic monomers)were synthesized and kindly provided by the Laboratoire de Physico-ChimieMacromoleculaire(Paris). In Table 1 a list of the investigated polyelectrolytes alongwith their charge density(or cationicity,t) and molecular weight is provided. Forconvenience, the polyelectrolytes are referred to as ‘AM-MAPTAC-X’ whereX is anumber that indicates the percentage of charged segments.
2.1. Substrate preparation
Muscovite mica from Reliance Co.(NY) was used as substrate. Before anyexperiment, pieces of mica were cleaved several times on both sides in a laminar

56 P.M. Claesson et al. / Advances in Colloid and Interface Science 104 (2003) 53–74
Table 1Charge density(t) and molecular weight of the investigated polyelectrolytes(data provided by Labor-atoire de Physico-Chimie Macromoleculaire, Universite Pierre et Marie Curie, Paris)´
Polyelectrolyte t (%) MW
Theoretical Elemental Potent- NMR(molyg)
analysis iometry
AM-MAPTAC-1 1 0.5 1 – 900 000AM-MAPTAC-10 10 10 9 8.9–9.5 1 000 000AM-MAPTAC-30 30 31 31 24.2–25.6 780 000AM-MAPTAC-100 100 99 95 – 480 000
flow cabinet until an adequate thickness was obtained. All the employed tools werepreviously cleaned, and protective clothing and gloves were worn to minimizecontamination of the high-energy mica surfaces.Adsorption of the studied copolymers of AM-MAPTAC onto oppositely charged
mica planar surfaces was allowed in aqueous solutions at pH 5 at 208C. In atypical experiment an aqueous solution of the polymer(at 0.1 or 20 ppmconcentration) was freshly prepared by dilution with pure water of approximately700 ppm polyelectrolyte stock solution. Freshly cleaved mica pieces(5=2 cm)were then immersed in the solution(contained in a 25-ml glass beaker) forapproximately 6 h during which equilibrium adsorption is reached. At the end ofthis period, the substrate was withdrawn from the polymer solution and immersedin a large vessel filled with pure water in order to remove any non-adsorbedpolymer. Previous studies have demonstrated that the polyelectrolytes adsorb stronglyto most oppositely charged surfaces(e.g. silica, mica, gold) and that hardly anydesorption takes place upon immersion of the polyelectrolyte-coated substrate inpure waterw8,14,34,35x. To reduce the risk of Langmuir–Blodgett deposition at thethree-phase line, the respective liquid surface was aspirated(using a Pasteur pipetteconnected to a water-jet pump) prior to any substrate transfer between the air andthe liquid phases. Finally, the substrate was placed vertically inside a glass hood ina laminar flow cabinet and left to dry overnight. The water used in all experimentswas obtained by using a Milli-Q Plus 185 unit.
2.2. Atomic force microscopy
Imaging of adsorbed polymer on mica was accomplished using a Nanoscope IIIMultiMode� scanning probe microscope(Digital Instruments, Santa Barbara, CA,USA). The tapping mode imaging technique was used to study the sample’stopography by probing the surface with an oscillating tip. In this mode a piezostack excites a cantilever vertically causing the tip to oscillate near its resonantfrequencyw36x. Close to the sample surface the tip tends to be deflected due to itsinteraction with the surface material. However, the amplitude of the oscillation iskept constant by a feedback loop that adjusts the vertical position of the sample(using a piezoelectric tube on which the sample is mounted). The vertical position

57P.M. Claesson et al. / Advances in Colloid and Interface Science 104 (2003) 53–74
of the scanner(z) at each(x,y) location is thus used to reveal the topographicimage of the sample surface.The probe used in the experiments consisted of 125mm length, single-beam
cantilever and a tip(5–10 nm nominal radius of curvature) as an integratedassembly of single crystal silicon produced by etching techniques(TappinngModeetched silicon probe model TESP). The spring constant and resonant frequency arereported by the manufacturer to be 20–100 Nym and 290–346 kHz, respectively.Before imaging, the substrate was cut and gently pressed onto a sticky tab on a
15-mm-diameter metal disk that was then attached to a magnetic sample holder onthe piezoelectric scanner(Model AS-12V, ‘E’ vertical MultiMode SPM scanner).The polyelectrolyte-coated surfaces were imaged in dry air since the use of ambientconditions may introduce a layer of adsorbed water molecules on the sample surfacethat gives rise to extra capillary forces between the tip and the sample(which mayinterfere with the AFM experiment) w37,38x. In order to achieve controlled relativehumidity and temperature, nitrogen from a humidity generator(Model RH-100, VTICorporation) was flowed continuously through the instrument head(where thesample and probe are enclosed). The temperature and relative humidity were set inall cases at 208C and approximately 0%, respectively.
2.3. Surface force apparatus, SFA
A surface force apparatus, Mark II modelw39x, was used for the measurement ofadhesion forces. The mica substrate surfaces were glued onto optically polishedhalf-cylindrical silica discs using Epon 1004. The surfaces were mounted in themeasuring chamber in a crossed cylinder configuration and the adhesion force andthe contact position were determined. The measured force in crossed-cylindergeometry is, according to the Derjaguin approximationw40x, equivalent to the forcebetween a sphere(with the same radius as the geometric mean of the cylinder radii)and a flat surface, provided that the radius of the surfaces(f2 cm in our set-up)is much larger than the range of the surface forces. This condition is fulfilled in ourset-up.The relative humidity in the measuring chamber was controlled to close to zero
by placing a beaker with P O within the sealed chamber. Next, the surfaces were2 5
removed from the measuring chamber and immersed in a beaker containing anaqueous 20mgyml polyelectrolyte solution and no added extra salt. The polyelec-trolyte was allowed to adsorb for 1 h before the surfaces were transferred into abeaker of water and then immediately removed and dried with a gentle stream ofdry nitrogen gas. The samples were remounted in the measuring cell and allowedto equilibrate with the P O -dried atmosphere for 30 min prior to determination of2 5
the adhesion force. To avoid excessive shearing a relatively stiff double cantileverspring was employed. The spring constant was approximately 7500 Nym, andaccurately determined after each experiment. The surfaces were separated slowlyand the negative load was increased step-wise until the surfaces jumped apart. Thus,unlike Ruths and Granickw32x in their work on surfactant and polymer coated
58 P.M. Claesson et al. / Advances in Colloid and Interface Science 104 (2003) 53–74
surfaces, we did not attempt to study the effect of the rate of separation on theadhesion force.The surface separation and the shape of the surfaces were determined using white
light interferometry. White light is directed perpendicularly from below towards thesurface, and multiple-reflected between the silvered backsides of the mica surfaces.Only wavelengths that interfere constructively will be able to exit from the opticalcavity. Fringes of equal chromatic order, FECO, are generated and analyzed in aspectrometer. From the shape and position of the FECO the surface separation andthe shape of the surfaces can be determined.
3. Results and discussion
3.1. AFM-images
Tapping mode AFM images in air of adsorbed copolymers of AM and MAPTACon mica from solutions with polymer concentration of 0.1 ppm are shown in Fig.2. Typical height profiles for the cases of polyelectrolyte charge densities of 1 and100% are also illustrated in Fig. 3. The low polymer concentration used in theseexperiments was chosen so as to avoid surface saturation and allow the resolutionof ‘individual’ adsorbed polymer chains. From large scan images(not shown) itwas noticed that the AM-MAPTAC-100 polymer adsorbs uniformly onto the micasurface. However, as the polyelectrolyte charge density is reduced the numberdensity of adsorbed molecules increased and some ‘aggregates’(or ‘patches’) ofpolymer molecules are formed(see Fig. 2). The increase in the adsorbed amountfor polymers of lower cationicity is explained by the fact that in such cases, morepolymer units are needed to compensate the surface charge. This observation iscorroborated by XPS quantitative measurements on similar systemsw8x.It was observed that as the polyelectrolyte charge density was reduced it became
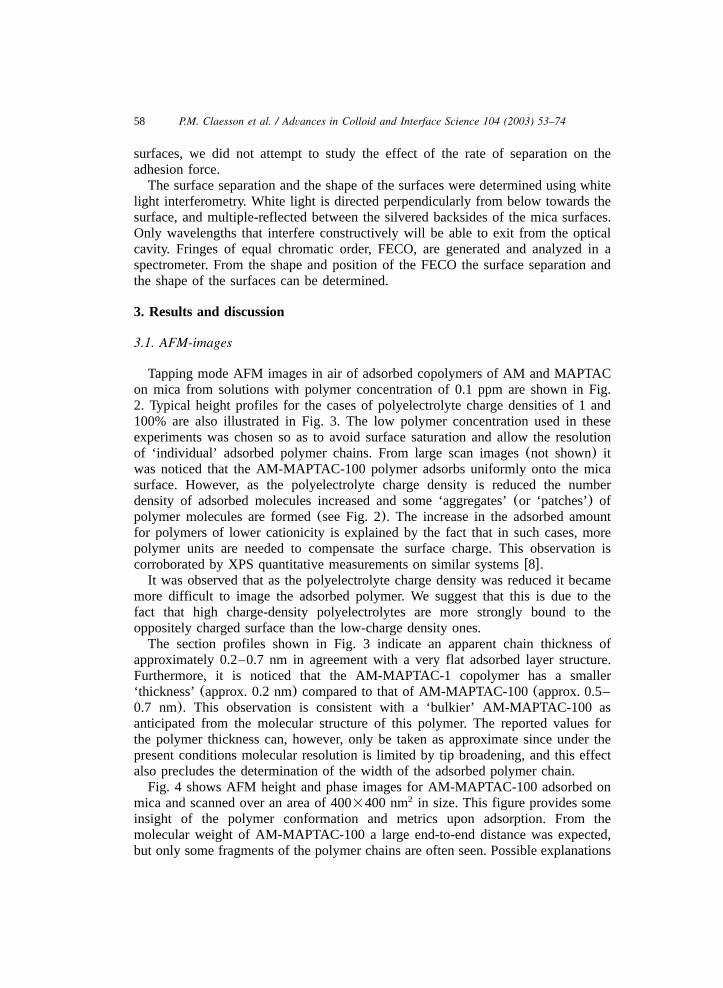
more difficult to image the adsorbed polymer. We suggest that this is due to thefact that high charge-density polyelectrolytes are more strongly bound to theoppositely charged surface than the low-charge density ones.The section profiles shown in Fig. 3 indicate an apparent chain thickness of
approximately 0.2–0.7 nm in agreement with a very flat adsorbed layer structure.Furthermore, it is noticed that the AM-MAPTAC-1 copolymer has a smaller‘thickness’(approx. 0.2 nm) compared to that of AM-MAPTAC-100(approx. 0.5–0.7 nm). This observation is consistent with a ‘bulkier’ AM-MAPTAC-100 asanticipated from the molecular structure of this polymer. The reported values forthe polymer thickness can, however, only be taken as approximate since under thepresent conditions molecular resolution is limited by tip broadening, and this effectalso precludes the determination of the width of the adsorbed polymer chain.Fig. 4 shows AFM height and phase images for AM-MAPTAC-100 adsorbed on
mica and scanned over an area of 400=400 nm in size. This figure provides some2
insight of the polymer conformation and metrics upon adsorption. From themolecular weight of AM-MAPTAC-100 a large end-to-end distance was expected,but only some fragments of the polymer chains are often seen. Possible explanations

59P.M. Claesson et al. / Advances in Colloid and Interface Science 104 (2003) 53–74
Fig. 2. Tapping mode image(0% relative humidity) of adsorbed polyelectrolytes on mica after equilib-rium adsorption in 0.1 ppm aqueous polymer solution(scan range 1=1 mm): (a) AM-MAPTAC-1; (b)AM-MAPTAC-10; (c) AM-MAPTAC-30; and(d) AM-MAPTAC-100.
for this is that the polymer conformation is locally coiled, lowering the end-to-enddistance, or that the AFM-imaging process in fact results in some breakage of thepolymer chain.Tapping mode images of adsorbed polyelectrolytes on mica after equilibrium
adsorption at a higher polymer concentration(20 ppm) (as compared to therespective cases in Fig. 2a–d) are displayed in Fig. 5a–d. It is evident that at thisconcentration the surface becomes almost fully saturated and inter-chain and intra-chain entanglements take place. Hence, under these circumstances the resolution ofindividual polymer molecules becomes very difficult. It is, however, observed that
60 P.M. Claesson et al. / Advances in Colloid and Interface Science 104 (2003) 53–74
Fig. 3. Height profiles for a horizontal scan of the tapping mode images of AM-MAPTAC-1(a) andAM-MAPTAC-100 (b) (under the same conditions as in Fig. 2). Typically, the height images yieldedmaximum thickness(with respect to the mica base line) of approximately 0.2 and 0.5–0.7 nm for AM-MAPTAC-1 and AM-MAPTAC-100, respectively.
at high charge density the polymers adsorb more uniformly(or orderly) whereas atlower charge densities more disordered structures are predominant. Thus, thepresence of polymer aggregates or ‘patches’ occurs more often as the charge densityis reduced. We note that the layer thickness cannot be determined from these AFMimages since no large enough uncoated patches are present on the surface.Intermediate polymer concentrations(data not shown) demonstrated that surface
saturation is reached at rather low polymer concentrations. For example, the surfacecoverage was very similar when the polyelectrolyte was adsorbed from a 1 ppmbulk concentration as compared to the 20 ppm case. This observation confirms thehigh-affinity characteristic of the adsorption isotherm as reported for similar systemsw8x.A difficulty in the application of AFM to imaging of adsorbed polymer layers is
illustrated in Fig. 6 obtained after scanning the tip over a smaller area. Here, theedge of a square ‘window’ that corresponds to the accumulation of polymeric chainsin the slow-scanning direction occurs because the adsorbed polymers are partly

61P.M. Claesson et al. / Advances in Colloid and Interface Science 104 (2003) 53–74
Fig. 4. Tapping mode height(left) and phase(right) images(0% relative humidity) of adsorbed AM-MAPTAC-100 polyelectrolytes on mica after equilibrium adsorption in 0.1 ppm aqueous polymer solu-tion (scan range 400=400 nm).
dragged by the tip in the fast-scanning direction. This problem mainly occurs whenimaging adsorbed low-charge-density polyelectrolytes. In this case, the polymer isattached to the surface by relatively few charged segments, and in solution most ofthe polymer chains extend out from the surface in the form of loops and tailsw11x.These extended structures eventually collapse on the surface during drying, butnevertheless they provide a less strong anchoring compared to the charged segments.
3.2. The mica surface and adsorbed amount of polyelectrolyte
Muscovite mica is a layered aluminosilicate mineral. For a detailed descriptionof the mica crystal see Guvenw41x. The important aspect from the point of view of¨this work is that each aluminosilicate layer is negatively charged due to isomorphoussubstitution of aluminum for silicon. This charge is compensated by small ions,mainly potassium, located between the aluminosilicate sheets. The amount ofnegative charges in the topmost lattice layer is 2.1=10 m . Consequently, this18 y2
is the number of exchangeable cations at the mica basal plane. The cationicpolyelectrolytes thus adsorb to the mica surface through an ion-exchange process.For highly charged polyelectrolytes the exchange is close to stoichiometric whereasfor low charge density polyelectrolytes steric repulsion between the adsorbedpolyelectrolyte chains limits the adsorption. The adsorbed amount of the polyelec-trolytes studied in this work has been quantified by means of XPSw8,42x and foundto be 2.3–2.5 mgym for AM-MAPTAC-1, 1.5–1.7 mgym for AM-MAPTAC-10,2 2
1.1–1.2 mgym for AM-MAPTAC-30 and 0.6–0.8 mgym for AM-MAPTAC-100.2 2

62 P.M. Claesson et al. / Advances in Colloid and Interface Science 104 (2003) 53–74
Fig. 5. Tapping mode image(0% relative humidity) of adsorbed polyelectrolyte on mica after equilibriumadsorption in 20 ppm aqueous polymer solution(scan range 1=1 mm): (a) AM-MAPTAC-1; (b) AM-MAPTAC-10; (c) AM-MAPTAC-30; and(d) AM-MAPTAC-100.
3.3. Adhesion measurements in dry air
For soft, large, homogeneous and elastic surfaces in a crossed cylinder geometrythe pull-off force(F) normalized by the geometric mean radius(R) is related to theinterfacial energy(g) as w19x:
FyRs3pg (1)
where it has been assumed that the contact between the surfaces is ideal, i.e. notassociated with any excess free energy(e.g. due to surface roughness). This lastassumption is hardly ever valid, and even for such smooth substrates as mica the

63P.M. Claesson et al. / Advances in Colloid and Interface Science 104 (2003) 53–74
Fig. 6. Atomic force microscope image of adsorbed AM-MAPTAC-1(20 ppm concentration) on mica(scan range 1=1 mm ). The edge of a ‘window’ that corresponds to a previously scanned area of smaller2
size(400=400 nm) is clearly seen.2
pull-off force reported in the literature varies considerablyw43x. This is partly duenot only to the fact that the relative orientation of the mica crystal in the twosurfaces plays a rolew44x, but also due to adsorption of water vapor and smallamounts of other contaminantsw43x. Further, Eq.(1) is valid only under equilibriumconditions, i.e. rate-dependent viscoelastic effects invalidate the equation. We notethat the SFA set-up consists of a layered system, glass-glue-mica, which complicatesthe adhesion mechanics as discussed by Sridhar et al.w45x. The normalized pull-offforces measured between mica surfaces in dry air in our laboratory typically fallsin the range 800–1200 mNym, consistent with the values reported by Christenssonfor the same conditions. During the separation process the contact radius,r, of theflat surface region decreases, and at the point of separation the value ofryr0decreased to a value of 0.6–0.7, wherer is the contact radius under zero load.0
This is in agreement with predictions based on the JKR-theoryw19x.The normalized pull-off forces measured between two mica surfaces coated with
a preadsorbed polyelectrolyte layer are shown in Figs. 7–10. It should be noted thatthe fact that the polyelectrolytes were adsorbed outside the measuring chamber
64 P.M. Claesson et al. / Advances in Colloid and Interface Science 104 (2003) 53–74
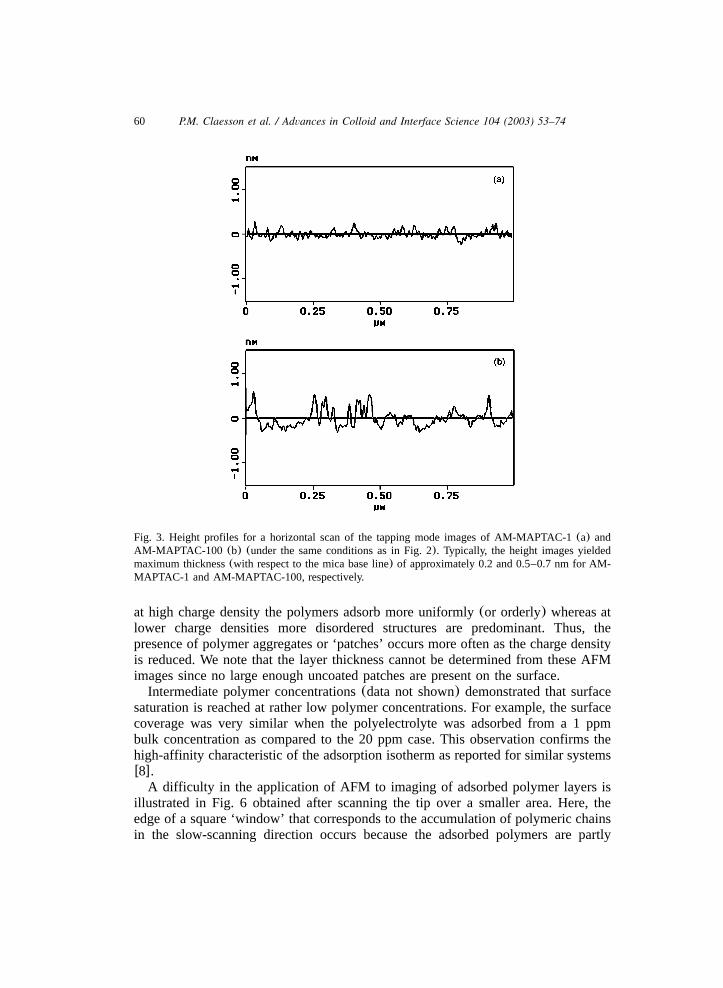
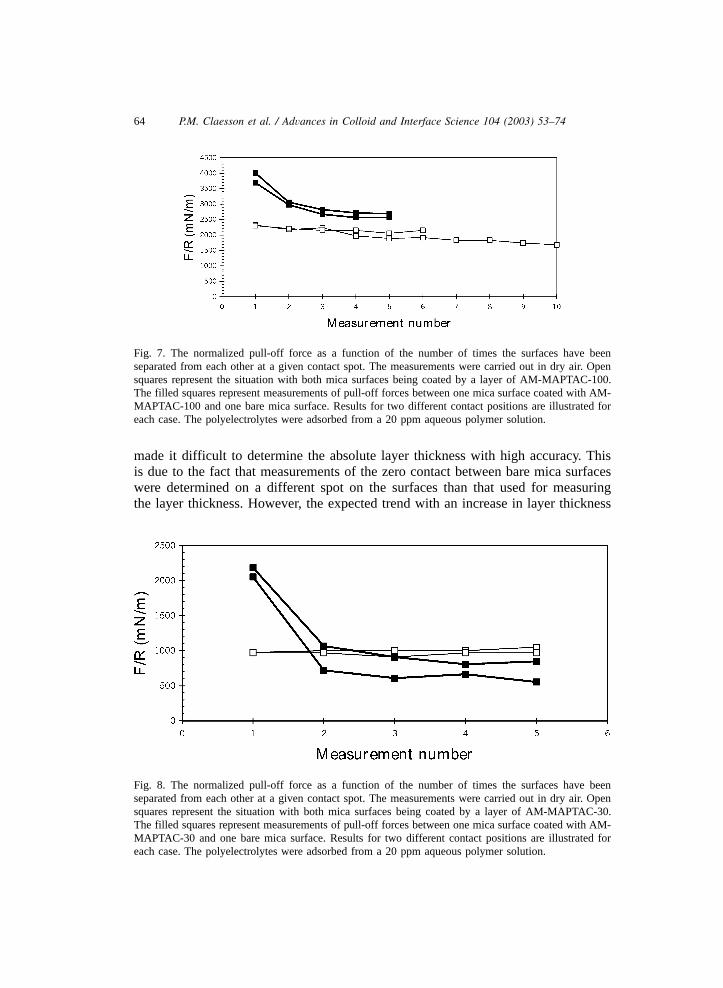
Fig. 7. The normalized pull-off force as a function of the number of times the surfaces have beenseparated from each other at a given contact spot. The measurements were carried out in dry air. Opensquares represent the situation with both mica surfaces being coated by a layer of AM-MAPTAC-100.The filled squares represent measurements of pull-off forces between one mica surface coated with AM-MAPTAC-100 and one bare mica surface. Results for two different contact positions are illustrated foreach case. The polyelectrolytes were adsorbed from a 20 ppm aqueous polymer solution.
Fig. 8. The normalized pull-off force as a function of the number of times the surfaces have beenseparated from each other at a given contact spot. The measurements were carried out in dry air. Opensquares represent the situation with both mica surfaces being coated by a layer of AM-MAPTAC-30.The filled squares represent measurements of pull-off forces between one mica surface coated with AM-MAPTAC-30 and one bare mica surface. Results for two different contact positions are illustrated foreach case. The polyelectrolytes were adsorbed from a 20 ppm aqueous polymer solution.
made it difficult to determine the absolute layer thickness with high accuracy. Thisis due to the fact that measurements of the zero contact between bare mica surfaceswere determined on a different spot on the surfaces than that used for measuringthe layer thickness. However, the expected trend with an increase in layer thickness

65P.M. Claesson et al. / Advances in Colloid and Interface Science 104 (2003) 53–74
Fig. 9. The normalized pull-off force as a function of the number of times the surfaces have beenseparated from each other at a given contact spot. The measurements were carried out in dry air. Opensquares represent the situation with both mica surfaces being coated by a layer of AM-MAPTAC-10.The filled squares represent measurements of pull-off forces between one mica surface coated with AM-MAPTAC-10 and one bare mica surface. Results for two different contact positions are illustrated foreach case. The polyelectrolytes were adsorbed from a 20 ppm aqueous polymer solution.
Fig. 10. The normalized pull-off force as a function of the number of times the surfaces have beenseparated from each other at a given contact spot. The measurements were carried out in dry air. Opensquares represent the situation with both mica surfaces being coated by a layer of AM-MAPTAC-1. Thefilled squares represent measurements of pull-off forces between one mica surface coated with AM-MAPTAC-1 and one bare mica surface. Results for two different contact positions are illustrated foreach case. The polyelectrolytes were adsorbed from a 20 ppm aqueous polymer solution.
66 P.M. Claesson et al. / Advances in Colloid and Interface Science 104 (2003) 53–74
from below 1 nm for the polyelectrolyte with the highest charge density(AM-MAPTAC-100) to 2–3 nm for the polyelectrolyte with the lowest charge density(AM-MAPTAC-1) was observed. Further, changes in layer thickness during repeatedmeasurements on the same spot could be determined accurately to approximately0.2 nm. The layers formed by AM-MAPTAC-100 on mica are very thin and flat,as observed from the shape of the interference fringes and more locally with theAFM (see Figs. 3 and 4). The pull-off force measured during the first separationcycle was very large, 2300 mNym, i.e. approximately twice as large as between theuncoated mica surfaces. This strong increase in adhesion cannot be due to anincrease in the van der Waals force since the refractive index of mica is higher thanthat of the polymer. Instead we suggest that the increased adhesion is due tobridging, i.e. once the surfaces are in contact the conformation of the adsorbedpolymers may change to allow the segments of the same polymer to bind to bothsurfaces. This change in conformation is entropically driven. We note that thecharges on the MAPTAC-polymer are located 0.7–0.8 nm away from the backboneand by a simple rotation the charged groups may change their position in space by1.5 nm. This flexibility is likely to facilitate the bridging process. We note that theAFM images show that the mica surfaces are fully packed with polyelectrolytes,but nevertheless some bridging do occur due to the entropically driven changes inpolymer conformation.When the pull-off force is measured repeatedly at one and the same contact
position, a decrease in adhesion with the number of measurements is observed(twodifferent sets of data are shown in Fig. 7). However, the adhesion force remainshigh, and the lowest value obtained, after 10 measurements, was 1700 mNym. Thedecrease in adhesion force indicates that the act of repeatedly bringing together andseparating the surfaces affects the adsorbed layer. This is also observed as a slightincrease in layer thickness, by some 0.5–1 nm. Hence, we conclude that somepolymer molecules are, due to being bound to both surfaces, stretched out duringthe separation process. When the bridges are broken the polyelectrolytes collapseback onto the surfaces but they are unable to find an equally flat conformation asprior to separation. The increased layer thickness makes formation of bridges slightlymore difficult during the subsequent contact, which explains the reduction inadhesion force. Due to the strong attractive forces between the polyelectrolyte-coated surfaces a large flat contact area is observed once the surfaces are in contact.Upon separation the radius of the flat region decreased untilryr was in the range0
0.65–0.75, which is slightly larger than the value of 0.63 expected from JKR-theory. It was also noted that the contact area did not shrink in a continuous fashionwith increasing negative load, but rather the contact radius decreased in a stepwisefashion related to stick–slip friction behavior and adhesion hysteresisw46x.Some experiments were also carried out using one mica surface coated with AM-
MAPTAC-100 and one bare mica surface. The results from two different experimentsare illustrated in Fig. 7. Clearly, the pull-off force measured during the firstseparation is very high, approximately 4000 mNym. The large value of the adhesionforce is explained by extensive bridging between the polyelectrolyte-coated surface
67P.M. Claesson et al. / Advances in Colloid and Interface Science 104 (2003) 53–74
and the bare mica surface. The adhesion force decreased with the number of contactsand reached a plateau value of 2600–2700 mNym. Similarly, the layer thicknessincreased by 0.6–0.8 nm. These results give strong support for the view that as thesurfaces are separated polymer molecules are transferred from the polyelectrolytecoated surface to the initially bare surface, and as a result the number of bridgesformed are reduced. We note, however, that the adhesion force remains higher thanthat between two mica surfaces coated with AM-MAPTAC-100, indicating that evenafter the polyelectrolytes have been distributed between the two surfaces morebridges are formed in the, at least initially, asymmetric system as a result of a lesscomplete surface coverage. Thus, it is clear that the surfaces should be less thanfully covered with polyelectrolytes if the goal is to obtain maximum adhesion.However, from these measurements the optimum coverage cannot be determined.Finally, we note that in the majority of the measurements the decrease in contactradius prior to separation was close to that expected from JKR-theory, but in a fewcases a significantly smaller decrease in contact radius was observed.The results for the adhesion force measurements between AM-MAPTAC-30
coated mica surfaces are displayed in Fig. 8. The pull-off force is significantlysmaller than for AM-MAPTAC-100 coated mica, and it is independent of thenumber of measurements at a given spot. This indicates that the number of bridgesformed is significantly less and thus the layer is not disturbed by the measurement.This conclusion is supported by the observation that the layer thickness isindependent of the number of measurements. The reason why less bridges areformed as compared to AM-MAPTAC-100 is that less charged segments are presentand that the uncharged segments constitute a steric barrier counteracting thereconformation needed in order for a polymer chain to cross from one surface andbind to the other. In fact, the adhesion force observed between AM-MAPTAC-30coated mica surfaces is rather similar to that between two bare mica surfaces,indicating that the van der Waals force is a major cause for the observed adhesion.In order to determine whether more bridges were formed if the surfaces were leftin contact for a prolonged time we made one experiment where the surfaces wereleft in contact for 16 h prior to separation. The result was a 5% increase in adhesioncompared to the previous measurement with the typical short contact time(5–10min). This increase is within the scatter of the measurements and one may concludethat the contact time(t)5 min) does not affect the pull-off force significantly.Finally, we note that the contact radius of the flat region decreased until the ratioryr reached a value of 0.7–0.8 at which point the surfaces jumped apart. This is0
slightly larger than predicted by JKR-theory. One may speculate that this is due tothe discontinuous decrease in contact radius during the separation process and thusrelated to stick–slip friction.For the asymmetric system, one AM-MAPTAC-30 coated mica and one bare
mica surface, the adhesion during the first separation is significantly higher, 2200–2100 mNym, than between two AM-MAPTAC-30 coated surfaces. This demon-strates that a significant number of bridges are formed. Just as for AM-MAPTAC-100the pull-off force decreases with the number of contacts. However, for AM-

68 P.M. Claesson et al. / Advances in Colloid and Interface Science 104 (2003) 53–74
MAPTAC-30 the pull-off force after several contacts is lower for the asymmetriccase compared to for two AM-MAPTAC-30 coated surfaces. When inspecting theFECO fringes after the first separation it was noted that the contact region no longerappeared absolutely flat. Clearly, the redistribution of polyelectrolytes between thetwo surfaces results in formation of a less homogeneous coating, and the increasedsurface roughness contributes to the relatively low value of the adhesion force foundin the asymmetric system after the first separation. Support for this conclusioncomes from the observation that by leaving the surfaces in contact for a prolongedtime resulted in a more flat contact and an increase in the pull-off force by 50%.As a result of the increased surface roughness we observed that the value ofryr0decreased to a value of 0.6–0.4, slightly lower than expected by the JKR theory.The tendency was that the contact radius decreased to lower values with increasingnumber of separations, i.e. with increasing roughness of the polymer layer. A smallerthan expected contact radius at the point of separation in air has also been observedfor surfaces coated with uncharged polymersw32x.The results for AM-MAPTAC-10, displayed in Fig. 9, are qualitatively similar to
those obtained for AM-MAPTAC-30. However, the adhesion forces observed, bothbetween two polyelectrolyte-coated surfaces and between one AM-MAPTAC-10coated surface and a bare mica surface, is lower than for the more highly chargedpolyelectrolytes. Clearly, the bridging mechanism becomes less important as thecharge density of the polyelectrolyte is decreased. The decrease in contact radiusprior to the jump out was found to be consistent with predictions of the JKR-theoryfor the symmetric system. However, for the asymmetric system it was observed,just as for AM-MAPTAC-30, that the contact became less homogeneous withincreasing number of contacts and the value ofryr decreased to lower values than0
expected from the JKR theory.Some measurements were also carried out using AM-MAPTAC-1. The pull-off
force as a function of the number of contacts is illustrated in Fig. 10. For two AM-MAPTAC-1 coated surfaces we observe an adhesion force that is significantly largerthan for the AM-MAPTAC-10 coated surface. Further, a slight decrease in the pull-off force with increasing number of separations was observed. The decrease inadhesion force was accompanied by an increased inhomogeneity of the contactregion. Clearly, unlike the situation with AM-MAPTAC-30 and AM-MAPTAC-10,but similarly to AM-MAPTAC-100, we now have material transfer between the twosurfaces. Due to the low charge density of the adsorbed polymer, this cannot beexplained by formation of electrostatic bridges. Rather, we suggest that the layerfor the low charge density AM-MAPTAC-1 is less compact than for the otherpolymers. This promotes the possibility of chain interpenetration and entanglementbetween the two polymer layers. During the separation process, even though it iscarried out slowly, the polymer layers do not have time to disentangle but the chaininterlocking contributes to viscoelastic losses that increases the measured adhesion.The resulting material transfer process is facilitated by the relatively low affinitybetween AM-MAPTAC-1 and the mica surface due to the low number of electrostaticbonds between the surface and the polyelectrolyte. The relatively low polyelectro-

69P.M. Claesson et al. / Advances in Colloid and Interface Science 104 (2003) 53–74
Fig. 11. The normalized pull-off force between two polyelectrolyte-coated surfaces measured during thefirst (filled squares) and fifth (open circles) separation as a function of the charge density of the poly-electrolyte. The polyelectrolytes were adsorbed from a 20 ppm aqueous polymer solution.
lyte–surface affinity for this system was also observed during the AFM-imaging(see Fig. 6).For the asymmetric system, AM-MAPTAC-1 coated mica vs. bare mica, the
adhesion during the first separation is lower than for the other polyelectrolytes. Thisis a consequence of the lower number of electrostatic bridges formed. However,material transfer does still occur due to attractive interactions between the unchargedacrylamide segments and the bare mica surface. This is clearly observed as anincrease in layer thickness and a less homogeneous contact region with increasingnumber of separations. The adhesion force after the first separation is higher thanbetween one AM-MAPTAC-10 and one bare mica surface. We attribute this to anincreased importance of viscoelastic losses due to chain entanglement.The effect of the charge density of the polyelectrolyte on the pull-off force
between two polyelectrolyte-coated surfaces is summarized in Fig. 11 that showsthe mean pull-off force for the first and fifth separation, respectively. First, we notethat when the charge density is decreased from 100% to 10% the adhesion forceduring the first separation is reduced. This is a result of a decreasing importance ofelectrostatic bridges. However, when the charge density is decreased further to 1%,the adhesion force is increased again, an observation that strongly indicates thatanother contribution comes into play. We argue that the adhesion due to chaininterpenetration and entanglement increases as the charge density of the polyelectro-lyte is decreased and at this very low charge density makes a significant contribution.For the most highly charged polyelectrolyte and the lowest charge density polyelec-

70 P.M. Claesson et al. / Advances in Colloid and Interface Science 104 (2003) 53–74
Fig. 12. The normalized pull-off force between one polyelectrolyte-coated surface and one bare micasurface measured during the first(filled squares) and fifth (open circles) separation as a function of thecharge density of the polyelectrolyte. The polyelectrolytes were adsorbed from a 20 ppm aqueous poly-mer solution.
trolyte the pull-off force decreases significantly with the number of contacts. Thefact that the layer thickness increases and the contact becomes less homogeneousstrongly suggests that the decrease in pull-off force is due to the fact that the layeris disrupted during the separation process. For the intermediately charged polyelec-trolytes, no indication of disruption of the polymer layer is observed, and converselythe adhesion force is not strongly affected by the number of separations.The effect of the charge density on the adhesion between one polyelectrolyte-
coated surface and one bare mica surface is summarized in Fig. 12. In this case,the adhesion between the two surfaces decreases with the number of contacts forall polyelectrolytes studied, and this is due to material transfer from the polyelectro-lyte-coated surface to the initially bare surface. We further suggest that the relativelylow decrease in adhesion force for AM-MAPTAC-1 is due to a relatively largecontribution of polymer entanglements to the adhesion force.We note that in our experiments the polyelectrolyte with the highest charge
density increases the adhesion in air the most whereas the opposite trend is observedwhen polyelectrolytes are used as dry-strength additivesw2x. This may be due toseveral effects. First, the charge density of mica is larger than that of the pulp fiber,which leads to a decreased importance of electrostatic bridges in the latter case.Further, in our case the polyelectrolyte layer was preadsorbed and the surfaces weredried before they were brought into contact. On the other hand, in real papermakingsystems these additives are added to the paper furnish(fiber suspension) which issubsequently dried in the drier section(after water removal in the forming and presssections). Thus, when paper is made the fibers are dried in a condition of closeproximity between each other due to surface tension and capillarity effects. In this

71P.M. Claesson et al. / Advances in Colloid and Interface Science 104 (2003) 53–74
case, there are much larger chances for the adsorbed polymer layers to interpenetrateand interlock. As a result, the viscoelastic losses during the eventual course of paperrupture are expected to be much larger in the latter case. Such experiments can alsobe carried out with the surface force apparatus, and we note that studies with theSFA have shown that the adhesion between model cellulose surfaces that are broughtinto contact in water and subsequently dried is larger by a factor of three than theadhesion between dried cellulose surfacesw47x. This is due to increased chaininterpenetration that increases the viscoelastic losses occurring during the separationprocess.
3.4. Comparison between adhesion forces between polyelectrolyte-coated surfacesin air and water
There are several molecular contributions to the adhesion force. The van derWaals attraction is always present, and this force contribution is approximately afactor of five-fold larger in air than in water. This is a consequence of the fact thatthe difference in dielectric properties of the surface and air is larger than betweenthe surface and water.A second contribution comes from formation of electrostatic surface–polyelectro-
lyte–surface bridges. This effect increases with the number of bridges formed andthe strength of each bridge. Since the electrostatic force is reduced when thedielectric constant is increased, the strength of each electrostatic bridge will behigher in air than in water. On the other hand, the mobility of the polyelectrolytechain will be higher in contact with water as compared to the case of contact withair, which may favor formation of more bridges in water. Furthermore, thepolyelectrolyte layer swells in water and this will oppose the formation of surface–polyelectrolyte–surface bridges.A third contribution arises from bridges formed by uncharged segments. This
contribution is considerably smaller in water since in this case both the surface andthe acrylamide units have to be dehydrated in order to form a mica-acrylamidebond.A fourth contribution arises from entanglement effects. The more open layer
structure in water favors chain interpenetration, but it also makes it easier for thechains to disentangle during the separation process. It is difficult to a priori state ifthis effect will be more important in water or in air since(in an intricate way) itwill depend on the structure of the polyelectrolyte layer, chain relaxation rate andthe deformation rate during rupture of the adhesive joint. Some recent work onuncharged polymers has shown that the solvency of the polymer chain greatlyinfluences the role of chain interpenetration for the adhesion between polymer-coated surfaces in liquid mediaw26,48x.The experimental observation is that the adhesion force is significantly stronger
in air than in water, much more so than expected from consideration of only vander Waals forces(see Table 2). This is the case also for hydrophilic surfaces suchas mica without any polymer coating, and this is related to the hydration of thesurface that reduces the interfacial tension. The adsorption of AM-MAPTAC-100

72 P.M. Claesson et al. / Advances in Colloid and Interface Science 104 (2003) 53–74
Table 2The pull-off force in air and in water
Surface Pull-off force Pull-off forcein dry air in water(mNym) (mNym)
Bare mica 800–1200 20–40AM-MAPTAC-100 coated mica 2300 100–200AM-MAPTAC-30 coated mica 1000 2–5AM-MAPTAC-10 coated mica 800 0.5–1AM-MAPTAC-1 coated mica 1100 0
on mica surfaces increases the adhesion force in water significantly, and this hasbeen related to bridgingw9x. However, the adhesion between AM-MAPTAC-100coated surfaces in air is significantly stronger providing evidence that this forcecontribution is even stronger in the low dielectric media due to the increasedstrength of each electrostatic bridge.The adhesion force in water, just as in air, decreases with decreasing polyelectro-
lyte charge density. This is partly due to a decreased importance of electrostaticbridges but also due to the development of a steric repulsion between the surfacesin water as the charge density of the polyelectrolyte is decreased. This, in turn, isrelated to the hydration of the polymer segments for which water is a good solvent.
4. Conclusions
Tapping mode AFM-imaging are able to resolve adsorbed individual polyelectro-lyte chains at low coverage. However, at high coverage this is not possible, but theimages demonstrate that smooth and homogeneous layers are formed. The findingthat adsorbed low-charge density polyelectrolytes(e.g. AM-MAPTAC-1) were partlydragged along the surface during scanning suggests that the binding strength of thepolyelectrolyte to the surface is reduced when the charge density of the polyelectro-lyte decreases. This is due to formation of less electrostatic binding points.The adhesion force measurements carried out with the SFA show that thin
polyelectrolyte layers are effective adhesion modifiers in air. In particular, strongadhesion forces were found with AM-MAPTAC-100 and this strongly suggests thatelectrostatic surface–polyelectrolyte–surface bridges are the cause of the adhesion.At low charge density another force contribution due to entanglement of polymerchains gives rise to a significant contribution to the adhesion force. This is clearlyseen for AM-MAPTAC-1. The disruption of the contact leads to irreversible changesin the adsorbed layers when either the number of electrostatic bridges formed arelarge(AM-MAPTAC-100) or when entanglement effects are important for polymerswith a relatively low binding strength to the surface(AM-MAPTAC-1).The adhesion force between one polyelectrolyte-coated surface and one bare mica
surface during the first separation was generally higher than that found betweentwo polyelectrolyte-coated surfaces. It is suggested that this is due to formation of

73P.M. Claesson et al. / Advances in Colloid and Interface Science 104 (2003) 53–74
a larger number of bridges. The adhesion force in the asymmetric system decreasedwith decreasing charge density of the polyelectrolyte, and with increasing numberof separations. The latter observation is due to material transfer between thepolyelectrolyte-coated surface and the initially bare surface.The decrease in contact radius during the separation process was in many cases
consistent with the predictions of JKR-theory. However, a smaller than expecteddecrease was observed in some cases and related to stick–slip friction and adhesionhysteresis occurring during the shrinkage of the contact radius. For less homogeneouslayers, such as those obtained after repeated separations, the contact radius shrankto lower values than predicted by JKR-theory prior to surface–surface separation.
Acknowledgments
O.R. acknowledges financial support from the SSF program ‘Colloid and InterfaceTechnology’. This work constitutes a contribution to the program of the BiofibreMaterials Center(BiMaC) at the Royal Institute of Technology, Stockholm.
References
w1x B. Alince, Colloids Surf. 39(1989) 39–51.w2x J. Zhang, R. Pelton, L. Wagberg, M. Rundlof, Nord. Pulp Pap. Res. J 15(2000) 440–445.¨˚w3x P.M. Claesson, A. Dedinaite, E. Poptoshev, in: T. Radeva(Ed.), Physical Chemistry of
Polyelectrolytes, 99, Marcell Dekker Inc, New York, 2001, pp. 447–507.w4x M.A.G. Dahlgren, P.M. Claesson, R. Audebert, J. Colloid Interface Sci. 166(1994) 343–349.w5x E. Poptoshev, M.W. Rutland, P.M. Claesson, Langmuir 15(1999) 7789–7794.w6x E. Poptoshev, M.W. Rutland, P.M. Claesson, Langmuir 16(2000) 1987–1992.w7x P.M. Claesson, M.A.G. Dahlgren, L. Eriksson, Colloids Surf. 93(1994) 293–303.w8x O.J. Rojas, M. Ernstsson, R.D. Neuman, P.M. Claesson, Langmuir 18(2002) 1604–1612.w9x M.A.G. Dahlgren, A. Waltermo, E. Blomberg, P.M. Claesson, L. Sjostrom, T. Akesson, et al., J.˚ ˚¨ ¨
Phys. Chem. 97(1993) 11769–11775.w10x M.A.G. Dahlgren, Langmuir 10(1994) 1580.w11x O.J. Rojas, P.M. Claesson, D. Muller, R.D. Neuman, J. Colloid Interface Sci. 205(1998) 77–88.w12x M. Osterberg, J. Colloid Interface Sci. 229(2000) 620–627.¨
w13x E. Poptoshev, P.M. Claesson, Langmuir 18(2002) 2590–2594.w14x O. Rojas, M. Ernstsson, R.D. Neuman, P.M. Claesson, J. Phys. Chem. B 104(2000) 10032–10042.w15x M.A.G. Dahlgren, H.C.M. Hollenberg, P.M. Claesson, Langmuir 11(1995) 4480–4485.w16x A. Dedinaite, P.M. Claesson, M. Bergstrom, Langmuir 16(2000) 5257–5266.¨w17x M. Ruths, S.A. Sukhishvili, S. Granick, J. Phys. Chem. B 105(2001) 6202–6210.w18x B.V. Derjaguin, Progr. Surface Sci. 45(1994) 223–231.w19x K.L. Johnson, K. Kendall, A.D. Roberts, Proc. R. Soc. Lond. A 324(1971) 301–313.w20x V.M. Muller, V.S. Yushchenko, B.V. Derjaguin, J. Colloid Interface Sci. 77(1980) 91–101.w21x B.V. Derjaguin, Y.P. Toporov, V.M. Muller, I.N. Aleinikova, J. Colloid Interface Sci. 58(1977)
528–533.w22x V.M. Muller, V.S. Yushchenko, B.V. Derjaguin, J. Colloid Interface Sci. 92(1983) 92–101.w23x V.M. Muller, B.V. Derjaguin, Y.P. Toporov, Colloids Surf. 7(1983) 251–259.w24x B.V. Derjaguin, V.M. Muller, Y.P. Toporov, I.N. Aleinikova, Prog. Surf. Sci. 45(1994) 192–198.w25x B.V. Derjaguin, V.M. Muller, Y.P. Toporov, Prog. Surf. Sci. 45(1994) 131–143.w26x M.A. Plunkett, M.W. Rutland, J. Adhes. Sci. Technol. 16(2002) 983–996.w27x Y.P. Huang, W. Leobandung, A. Foss, N.A. Peppas, J. Controlled Release 65(2000) 63–71.

74 P.M. Claesson et al. / Advances in Colloid and Interface Science 104 (2003) 53–74
w28x E.R. Beach, G.W. Tormoen, J. Drelich, R. Han, J. Colloid Interface Sci. 247(2002) 84–99.w29x M.A. Hubbe, Colloids Surf. 25(1987) 325–339.w30x M.L. Janex, R. Audebert, V. Chaplain, J.L. Counord, Colloid Polym. Sci. 275(1997) 352–363.w31x Y.L. Chen, J.N. Israelachvili, J. Phys. Chem. 96(1992) 7752–7760.w32x M. Ruths, S. Granick, Langmuir 14(1998) 1804–1814.w33x M. Ruths, S. Granick, J. Phys. Chem. B 102(1998) 6056–6063.w34x O.J. Rojas, R.D. Neuman, P.M. Claesson, J. Colloid Interface Sci. 237(2001) 104–111.w35x M.A. Plunkett, P.M. Claesson, M.W. Rutland, Langmuir 18(2002) 1274–1280.w36x Q. Zhong, D. Innins, K. Kjoller, V.B. Elings, Surf. Sci. Lett. L688(1993) 290.w37x A.L. Weisenhorn, P.K. Hansma, T.R. Albrecht, C.F. Quate, Appl. Phys. Lett. 54(1989) 2651–2653.w38x B. Drake, C.B. Prater, A.L. Weisenhorn, S.A.C. Gould, T.R. Albrecht, C.F. Quate, et al., Science
243 (1989) 1586–1589.w39x J.N. Israelachvili, G.E. Adams, J. Chem. Soc. Faraday Trans. 1 74(1978) 975–1001.w40x B. Derjaguin, Kolloid. Zeits 69(1934) 155–164.w41x N. Guven, Z. Kristallogr 134(1971) 196–212.¨w42x M.A. Plunkett, P.M. Claesson, M. Ernstsson, M.W. Rutland, in press.w43x H.K. Christensson, J. Phys. Chem. 97(1993) 12034–12041.w44x P.M. McGuiggan, J.N. Israelachvili, J. Mater. Res. 5(1990) 2232–2243.w45x I. Sridhar, K.L. Johnson, N.A. Fleck, J. Phys. D 30(1997) 1710–1719.w46x J. Israelachvili, in: B. Bhushan(Ed.), Handbook of MicryNano Tribology, CRC Press, Boca
Raton, 1995, pp. 267–319.w47x R. Neuman, J. Berg, P.M. Claesson, Nord. Pulp Pap. Res. J 8(1993) 96–104.w48x M.A. Plunkett, S. Rodner, L. Bergstrom, M.W. Rutland, J. Adhesion Sci. Technol. 16(2002)¨ ¨
965–981.
Copyright © 2022 FDOKUMEN