Differential Cell Adhesion on Mesoporous Silicon Substrates
9
Differential Cell Adhesion on Mesoporous Silicon Substrates Francesco Gentile, †,‡ Rosanna La Rocca, ‡ Giovanni Marinaro, ‡ Annalisa Nicastri, † Andrea Toma, ‡ Francesco Paonessa, ‡ Gheorghe Cojoc, § Carlo Liberale, ‡ Fabio Benfenati, ‡ Enzo di Fabrizio, †,‡ and Paolo Decuzzi* ,†,⊥ † Laboratory of Proteomics and Mass Spectrometry, Department of Experimental and Clinical Medicine, University of Magna Graecia, Catanzaro 88100, Italy ‡ Italian Institute of Technology Nanostructure and NBT Departments, Via Morego, 30, 16163 Genova, Italy § Max Planck Institute of Molecular Cell Biology and Genetics, Pfotenhauerstrasse 108, 01307 Dresden, Germany ⊥ Departments of Translational Imaging & Nanomedicine, The Methodist Hospital Research Institute, Houston, Texas 77030, United States * S Supporting Information ABSTRACT: Porous silicon (PSi) is a promising material in several biomedical applications because of its biocompatibility and biodegrad- ability. Despite the plethora of studies focusing on the interaction of cells with micrometer and submicro geometrical features, limited information is available on the response of cells to substrates with a quasi-regular distribution of nanoscopic pores. Here, the behavior of four different cell types is analyzed on two mesoporous (MeP) silicon substrates, with an average pore size of ∼5 (MeP1) and ∼20 nm (MeP2), respectively. On both MeP substrates, cells are observed to spread and adhere in a larger number as compared to flat silicon wafers. At all considered time points, the surface density of the adhering cells n d is larger on the PSi substrate with the smaller average pore size (MeP1). At 60 h, n d is from ∼1.5 to 5 times larger on MeP1 than on MeP2 substrates, depending on the cell type. The higher rates of proliferation are observed for the two neuronal cell types, the mouse neuroblastoma cells (N2A) and the immortalized human cortical neuronal cells (HCN1A). It is speculated that the higher adhesion on MeP1 could be attributed to a preferential matching of the substrate topography with the recently observed multiscale molecular architecture of focal adhesions. These results have implications in the rational development of PSi substrates for supporting cell adhesion and controlling drug release in implants and scaffolds for tissue engineering applications. KEYWORDS: mesoporous silicon, nanoscale topography, cell adhesion, optimal pore size, silicon implants, tissue engineering 1. INTRODUCTION The growing interest in porous silicon (PSi) for several biomedical applications is justified by its distinctive advantages over other more traditional materials, such as polymers. PSi can be produced using top-down and quite inexpensive fabrication strategies. 1 In addition, robust protocols are available for its surface modification with a variety of functional groups and biomolecules. 2,3 Also, the pore size, pitch, and shape (pore geometry) can be accurately tuned, during the fabrication process, by judiciously choosing parameters such as the etching time, current intensity, active etchant concentration, temper- ature and silicon doping. 1 According to the IUPAC definition, surfaces with a pore size smaller than 2 nm are referred to as microporous; whereas mesoporous PSi (MeP) exhibits pores with an average size ranging between 2 and 50 nm; and, eventually, for pores larger than 50 nm, the term macroporous PSi (MaP) is used. Differently from bulk silicon, PSi is biodegradable under physiological conditions and it dissolves progressively into nontoxic silicic acid. The dissolution rate is dependent on the pore geometry and surface modification, and it grows as the pore size increases. 4 Several studies have demonstrated the biocompatibility of PSi under different conditions. 5−8 In addition to this, PSi offers very interesting photoluminescence properties which are dependent on pore geometry and disappear for pores larger than a few tens of nanometers. 9,10 For all this, PSi has been proposed and is currently used for the fabrication of diverse micro- and nanodevices of interest to the biomedical community. Microchips made out of PSi for the controlled release of drugs were already demonstrated in the '90s, 11 and thereafter by several researchers. 12,13 With the advent of more sophisticated miniaturization techniques, PSi nanoparticles have been fabricated and used for the systemic administration of therapeutic and imaging agents. 14−16 Because of its inherent optical properties, biosensors and bio- optoelectronic devices are also generated out of PSi. 17 MiP Received: January 16, 2012 Accepted: May 14, 2012 Published: May 14, 2012 Research Article www.acsami.org © 2012 American Chemical Society 2903 dx.doi.org/10.1021/am300519a | ACS Appl. Mater. Interfaces 2012, 4, 2903−2911
Transcript of Differential Cell Adhesion on Mesoporous Silicon Substrates

Differential Cell Adhesion on Mesoporous Silicon SubstratesFrancesco Gentile,†,‡ Rosanna La Rocca,‡ Giovanni Marinaro,‡ Annalisa Nicastri,† Andrea Toma,‡
Francesco Paonessa,‡ Gheorghe Cojoc,§ Carlo Liberale,‡ Fabio Benfenati,‡ Enzo di Fabrizio,†,‡
and Paolo Decuzzi*,†,⊥
†Laboratory of Proteomics and Mass Spectrometry, Department of Experimental and Clinical Medicine, University of Magna Graecia,Catanzaro 88100, Italy‡Italian Institute of Technology Nanostructure and NBT Departments, Via Morego, 30, 16163 Genova, Italy§Max Planck Institute of Molecular Cell Biology and Genetics, Pfotenhauerstrasse 108, 01307 Dresden, Germany⊥Departments of Translational Imaging & Nanomedicine, The Methodist Hospital Research Institute, Houston, Texas 77030, UnitedStates
*S Supporting Information
ABSTRACT: Porous silicon (PSi) is a promising material in severalbiomedical applications because of its biocompatibility and biodegrad-ability. Despite the plethora of studies focusing on the interaction ofcells with micrometer and submicro geometrical features, limitedinformation is available on the response of cells to substrates with aquasi-regular distribution of nanoscopic pores. Here, the behavior offour different cell types is analyzed on two mesoporous (MeP) siliconsubstrates, with an average pore size of ∼5 (MeP1) and ∼20 nm(MeP2), respectively. On both MeP substrates, cells are observed tospread and adhere in a larger number as compared to flat siliconwafers. At all considered time points, the surface density of the adhering cells nd is larger on the PSi substrate with the smalleraverage pore size (MeP1). At 60 h, nd is from ∼1.5 to 5 times larger on MeP1 than on MeP2 substrates, depending on the celltype. The higher rates of proliferation are observed for the two neuronal cell types, the mouse neuroblastoma cells (N2A) andthe immortalized human cortical neuronal cells (HCN1A). It is speculated that the higher adhesion on MeP1 could be attributedto a preferential matching of the substrate topography with the recently observed multiscale molecular architecture of focaladhesions. These results have implications in the rational development of PSi substrates for supporting cell adhesion andcontrolling drug release in implants and scaffolds for tissue engineering applications.
KEYWORDS: mesoporous silicon, nanoscale topography, cell adhesion, optimal pore size, silicon implants, tissue engineering
1. INTRODUCTIONThe growing interest in porous silicon (PSi) for severalbiomedical applications is justified by its distinctive advantagesover other more traditional materials, such as polymers. PSi canbe produced using top-down and quite inexpensive fabricationstrategies.1 In addition, robust protocols are available for itssurface modification with a variety of functional groups andbiomolecules.2,3 Also, the pore size, pitch, and shape (poregeometry) can be accurately tuned, during the fabricationprocess, by judiciously choosing parameters such as the etchingtime, current intensity, active etchant concentration, temper-ature and silicon doping.1 According to the IUPAC definition,surfaces with a pore size smaller than 2 nm are referred to asmicroporous; whereas mesoporous PSi (MeP) exhibits poreswith an average size ranging between 2 and 50 nm; and,eventually, for pores larger than 50 nm, the term macroporousPSi (MaP) is used. Differently from bulk silicon, PSi isbiodegradable under physiological conditions and it dissolvesprogressively into nontoxic silicic acid. The dissolution rate isdependent on the pore geometry and surface modification, and
it grows as the pore size increases.4 Several studies havedemonstrated the biocompatibility of PSi under differentconditions.5−8 In addition to this, PSi offers very interestingphotoluminescence properties which are dependent on poregeometry and disappear for pores larger than a few tens ofnanometers.9,10
For all this, PSi has been proposed and is currently used forthe fabrication of diverse micro- and nanodevices of interest tothe biomedical community. Microchips made out of PSi for thecontrolled release of drugs were already demonstrated in the'90s,11 and thereafter by several researchers.12,13 With theadvent of more sophisticated miniaturization techniques, PSinanoparticles have been fabricated and used for the systemicadministration of therapeutic and imaging agents.14−16 Becauseof its inherent optical properties, biosensors and bio-optoelectronic devices are also generated out of PSi.17 MiP
Received: January 16, 2012Accepted: May 14, 2012Published: May 14, 2012
Research Article
www.acsami.org
© 2012 American Chemical Society 2903 dx.doi.org/10.1021/am300519a | ACS Appl. Mater. Interfaces 2012, 4, 2903−2911

and MeP substrates have been shown to be extremelypromising in developing new plasma fractionation techniquesfor proteomic analysis.18,19 PSi-based scaffolds for orthopedicimplants20 and for controlling the adhesion and proliferation ofdifferent cell types, including neurons21 and hepatocytes,22 havebeen proposed too. Eye implants for the controlled and long-term release of drugs within the ocular bulb have also beenreported.23
Substrate topography has been known for a long time toaffect crucial cell functions, such as adhesion, proliferation,migration and differentiation.24 This has been extensivelycharacterized on different materials and on substrates exhibitingdiverse topographical features, such as pits, holes, ridges, at themicrometer and submicrometer scale (>100 nm).25−29 Despiteall this, most of the studies on PSi have focused on the effect ofsurface chemistries on cell adhesion and proliferation.21,22,30,31
Recently, a hand-full of manuscripts have started interrogatingon how pore geometry could affect the cellular response. InSapelkin et al., rat hippocampal neurons were observed topreferentially adhere on MaP surfaces, with a pore size rangingbetween 50 and 100 nm, rather than on flat silicon surfaces.32 Abroader range of pore sizes was considered in Khung et al.,where neuroblastoma cells (SK-N-SH) were cultured overcontinuous porous gradient substrates spanning across the MePand MaP regimes.33 It was shown that substrates with anaverage pore sizes in the few hundreds of nanometers restrictcell proliferation and adhesion within the first 24 h. This wasconfirmed in a more recent study, with osteoblasts, culturedover substrates with pore sizes of 100, 300, and 500 nm.34
In this manuscript, the adhesive behavior of four distinct celltypes is analyzed up to 60 h post seeding on oxidized PSisubstrates presenting a pore size ranging between ∼5 and 20nm. This indeed is the more relevant pore size for biomedicalapplications pertaining to the in vivo controlled delivery ofdrugs from PSi implants and the in vitro harvesting of lowmolecular weight proteins from plasma. The four cell types aremouse 3T3 fibroblasts and human vascular endothelial cells(HUVECs), often used as reference cells in biocompatibilityand proliferation studies; mouse neuroblastoma cells (N2A)and immortalized human cortical neuronal cells (HCN1A),which are relevant for neurological applications and arecharacterized by low proliferation rates. Using siliconanodization, two classes of PSi substrates are fabricated withinthe MeP regime: MeP1 with a pore size of ∼5 nm and MeP2with a pore size of ∼20 nm. After a through characterization ofthe silicon substrates, the distinctive cell adhesion behavior isdocumented using confocal and electron microscopy. Thenumber density of adhering cells over the two PSi substratesand the flat unetched silicon, used as a control, is quantified atthe different time points and compared across the different cellslines.
2. MATERIALS AND METHODS2.1. Fabrication and Characterization of the PSi Substrates.
A boron-doped, p type (100) silicon wafer (resistivity 5−10 Ω/cm)was used as a substrate. The silicon wafer was cleaned with acetoneand ethanol to remove possible contaminants and then etched with a4% wet HF (by Carlo Erba) solution. The wafer was rinsed with waterand dried with N2. PSi substrates with a pore diameter lower or equalto 10 nm were obtained by Si anodization using an electrolyte mixtureof HF, D.I. water, and ethanol (by Sigma-Aldrich) (1:1:2, v/v/v). Aconstant current density of 20 mA/cm2 for 5 min at 25 °C was applied.PSi substrates with a pore diameter larger than 10 and lower than 50nm were obtained setting a constant current density of 4 mA/cm2 for
5 min at 25 °C. An electrolyte mixture of HF, D.I. water, and methanol(by Sigma-Aldrich) (5:3:2, v/v/v) was used. The samples were finallyrinsed in D.I. water, ethanol, and pentane with 4 min steps. The PSisubstrates were finally oxidized in oven at 200 °C for 2 h.
The photoluminescence properties of the PSi substrate was directlyverified using an ultraviolet lamp (from Spectroline), in the long waveultraviolet limit (365 nm). The lamp was positioned at 25 cm from thesample, a distance that guarantees a typical peak intensity density of1000 μm W/cm2. The UV illumination was maintained for 10 s, andthe samples were photographed with a commercial camera (Canon)setting 2 s integration time.
Surface hydrophilicity of the samples was determined by measuringthe water contact angle with one drop of about 5 μL of D.I. waterusing an automatic contact angle meter (KSV CAM 101, KSVINSTRUMENTS LTD, Helsinki, Finland) at room temperature. Fourmeasurements were performed on each substrate to evaluate theaverage contact angle θ, at 5 s.
2.2. Cell Culture and Staining. The four cell lines used, namelyprimary human endothelial (HUVEC-C), mouse mesenchymal normal(NIH-3T3), mouse neuroblastoma (Neuro-2a, N2A) and humancortical neuron cell line (HCN-1A) were obtained from the AmericanType Culture Collection (ATCC). The HUVECs were cultured inM199 medium containing 20% newborn calf serum (NCS, GIBCO-BRL), 5% human serum (Gemini Bio-Products, Inc.), 50 mg/mLascorbic acid, 1.6 mmol/L L-glutamine, 5 mg/mL bovine brain extract(Clonetec Corp), 7.5 mg/mL endothelial growth supplement (Sigma),100 U/mL penicillin, 100 mg/mL streptomycin, and 10 U/mLheparin. HUVECs at the third to fifth passage were used for allexperiments. The 3T3, N2A and HCN-1A cells were cultured inDulbecco’s Modified Eagle’s Medium (DMEM) with high glucose andGlutaMAXTM-I (Invitrogen, Carlsbad, California), supplementedwith 10% fetal bovine serum (Invitrogen), penicillin G (100 U/ml)and streptomycin sulfate (100 mg/mL) (Invitrogen). PSi waferspecimens (15 × 15 mm approximately) were treated under UV lightovernight for sterilization, then they were individually placed intosingle wells of a 6-well plate (Corning Incorporated). The waferspecimens were washed with phosphate-buffered saline solution (PBS,Invitrogen). The cells were finally seeded in complete cell culturemedium and incubated for 24, 36, 48, and 60 h, at 37 °C in ahumidified 5% CO2/air atmosphere. After incubation, the cell culturemedium was removed and the cells were washed twice in PBS andfixed with BD Cytofix (BD Biosciences). 100 μL of Cytofix were puton each sample and were incubated in dark for 30 min at 4 °C. Thecells were washed twice with Cytoperm (a permeabilization solution,BD Biosciences). All cells fixed upon the Si substrates were labeledwith 100 μL DAPI (40, 6-Diamidino-2-phenylindole, SigmaeAldrich)solution for 30 min at 4 °C. Finally, the DAPI solution was removedand each sample was washed with PBS. The total number of cells ntotinitially deposited in each well for incubation was 3.0 × 10⁴, 1.5 × 104,5.0 × 105, and 1.0 × 10⁴ for the mouse 3T3 fibroblasts, the HUVECs,the N2A and the HCN-1A experiments, respectively. The cells weresubconfluent throughout the duration of the experiment. Note that,although the number of originally seeded cells varies with the cell line,the area covered by the cells is smaller than about 1%, at time zero,and well below 80%, at 60 h post incubation. Therefore, the effect ofthe originally seeded number of cells on their viability and proliferationcan be neglected.
Cells were washed twice in PBS and permeabilized with 0.5% TritonX-100 (SIGMA Aldrich, St. Louis, MO) for 15 min at roomtemperature. Then, cells were washed again twice in PBS, labeled withVinculin primary antibody (Abcam) for 30 min at 4 °C and asecondary antibody (Alexa Fluor 488 chicken antimouse fromInvitrogen) was added. After 40 min of incubation, the cells werewashed twice with PBS and incubated with Alexa Fluor 635 phalloidin(Invitrogen). The samples were washed twice with PBS. After this,cells were labeled with 100 μL of DAPI solution (Sigma Aldrich) 30min at 4 °C. And finally, each sample was washed three times withPBS.
2.3. Cell Microscopy and Counting. An inverted Leica TCS-SP2laser scanning confocal microscopy system was used to image cells
ACS Applied Materials & Interfaces Research Article
dx.doi.org/10.1021/am300519a | ACS Appl. Mater. Interfaces 2012, 4, 2903−29112904
adhering on the substrates. Confocal images of blue (DAPI)fluorescence were collected using a 405 nm excitation line and a10× dry objective, so that cells with a characteristic size of a fewmicrometers could be clearly observed. The number of cells adheringto the substrate within the region of interest at different roughness andtime steps was measured. The cells were analyzed over time after 24,36, 48, and 60 h in culture. The number of adhering cells (n) wasnormalized with respect to the total number of cells initially depositedin each well (ntot) and divided by the well area to derive the surfacedensity of adhering cells as nd = n/(ntotA) with A ≈ 707 mm2.The fluorescence distribution of actin and vinculin was analyzed for
cells deposited on flat and PSi substrates using an inverted NikonTE2000-C1 confocal microscope. All images were acquired using a 60× /1.49 NA TIRF oil immersion objective. The pinhole (30 μm) wasmaintained throughout each experiment, thus yielding the maximumconfocality for the system. Sample fluorophores were excited using a488 nm Ar Laser (for vinculin) and a 543 nm HeNe laser (for actin).The images were digitized into 512 × 512 pixels and conveyed to acomputer for storage.2.4. SEM Characterization of the PSi Substrates and Cells.
SEM images of the wafers were captured using a Dual Beam (SEM-FIB) - FEI Nova 600 NanoLab system. During acquisition, the beamenergy and the corresponding electron current were fixed to 15 keVand 0.14 nA, respectively. The PSi morphology was imaged byemploying the mode 2 configuration, whereby images can bemagnified over 2500 × 103 times and ultrahigh resolution can beachieved.For cell characterization, the Si specimens were positioned inside
each well in a 6 well micro plate. The cells were cultured for 48 h using
normal conditions, as described above. The medium was removed bysuction. The cells were then washed twice with PBS buffer and fixedwith 4% of paraphormaldehyde for 30 min at 4 °C. The samples werewashed twice with 0,1 M Cacodylate Buffer with 10 min wait betweeneach washing. The sample were finally dehydrated using alcohol steps10 min long, with a concentration in D.I. water ranging from 50 to100% in volume. Several SEM images of the cells were captured toassess the dependence of cells morphology upon the different poroussubstrate. A JEOL JSM-7500F scanning electron microscope was usedfor the measurements. During acquisition, the beam energy of 5 keVand corresponding electron current of 0.98 pA was used.
The surface porosity of the substrates was determined by properimaging analysis of several SEM micrographs, as described in theSupporting Information.
2.5. Cell Protein Extracts and Western Blot. The expression ofvinculin, a major component of adhesion plaques and cell−celljunctions, is markedly up regulated in cells during growth activation,differentiation, motility and cell transformation. Therefore, experi-ments were performed to verify the expression of vinculin in cellsgrowing on flat and MeP Si substrates. Neuro2a neuroblastoma cellswere seeded on the different substrates and, after 48 h, the totalprotein was collected and subjected to Western blotting assay. Totalprotein extracts were obtained as follow: a 5 × 10⁵ cell pellet wasresuspended in 50 μL of RIPA buffer (50 mM Tris-cl pH 7.4; 150 mMNaCl; 1% NP40; 0.25% Na-deoxycholate; 1 mM PMSF; 1x Rochecomplete mini protease inhibitor cocktail; 1x Sigma phosphataseinhibitor 1 cocktail) and maintained for 20 min on ice with constantrocking. Samples were centrifuged 20 min at 12,000 rpm 4 °C andsupernatant was collected in new tubes. Proteins were quantified by
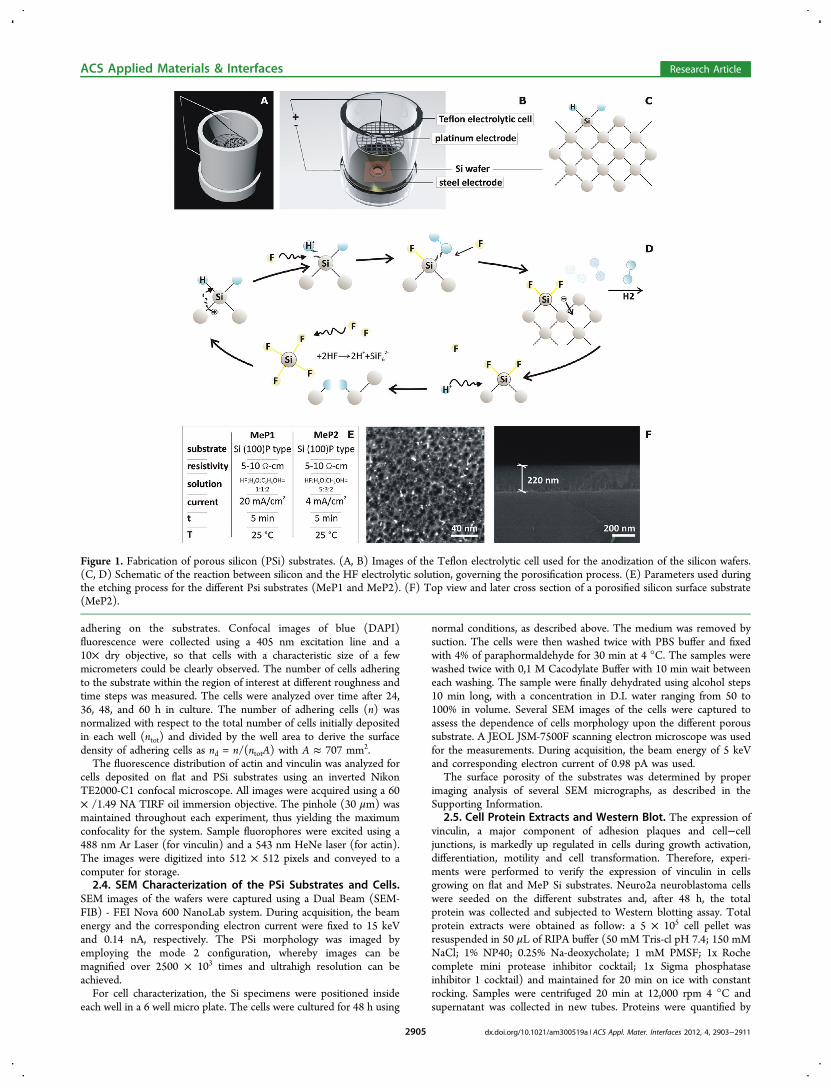
Figure 1. Fabrication of porous silicon (PSi) substrates. (A, B) Images of the Teflon electrolytic cell used for the anodization of the silicon wafers.(C, D) Schematic of the reaction between silicon and the HF electrolytic solution, governing the porosification process. (E) Parameters used duringthe etching process for the different Psi substrates (MeP1 and MeP2). (F) Top view and later cross section of a porosified silicon surface substrate(MeP2).
ACS Applied Materials & Interfaces Research Article
dx.doi.org/10.1021/am300519a | ACS Appl. Mater. Interfaces 2012, 4, 2903−29112905

Lowry method (Bio-Rad Laboratories Inc., Hercules, CA, USA).Twenty μg of protein were subjected to Western blot in 10% SDS-PAGE. Antibodies were antivinculin (Abcam, Cambridge, UK), anti-βIII tubulin (Santa Cruz Biotechnologies, Santa Cruz, CA, USA).2.6. Statistical Analysis. Results are presented as mean ± SD. A
student t test was used to compare two groups, fixing statisticalsignificance at p < 0.05. p values smaller than 0.05 between two groupsimply no statistically significant difference.
3. RESULTS
3.1. Fabrication and Characterization of PorousSilicon (PSi) Substrates. PSi substrates were generatedfrom a bulk boron-doped p-type (100) silicon wafer viaanodization.1 The original silicon wafer was placed in a Teflonelectrolytic cell, where a platinum cathode and the silicon wafer(anode) are immersed in a hydrogen fluoride (HF) solution(Figure 1A−C). The mechanism for pore formation isschematically reported in Figure.1D. Substrates with various
pore sizes were obtained by tailoring the etching conditions(Table in Figure.1E), and treating the silicon wafers for 5 minat room temperature (25 °C). Mesoporous silicon substrateswith an average pore diameter of 5 nm (MeP1) and 20 nm(MeP2) were obtained by applying a constant current densityof 20 mA/cm2 and 4 mA/cm2, respectively. This anodizationprocess introduced a thin porous layer over the original flat Sisubstrate with a thickness of a few tens of nanometers (Figure1F). In this work, three substrates are used for the analysis ofcell behavior: MeP1, MeP2 and flat unetched silicon (Si), as areference.The surface topography of the three substrates was analyzed
using scanning electron microscopy (SEM) and atomic forcemicroscopy (AFM). Also, photoluminescence was used toconfirm indirectly the characteristic pore size in the MePsubstrates; and contact angle measurements were employed toquantify the substrate hydrophobicity. Figure 2A−C showsrepresentative SEM and AFM images of the three substrates,
Figure 2. Characterization of the porous silicon (PSi) substrates. Surface topography of the silicon substrates imaged with (A) scanning electronmicroscopy and (B) atomic force microscopy. (C) Power spectrum of the silicon surfaces with the values for surface roughness Ra and fractaldimension D. (D) Pore size distribution for the porous silicon substrates, with the mean pore size. (E) Photoluminescence analysis for the twoporous substrates. (F) Contact angle measurements for the two porous substrates before (left) and after (right) oxidation.
ACS Applied Materials & Interfaces Research Article
dx.doi.org/10.1021/am300519a | ACS Appl. Mater. Interfaces 2012, 4, 2903−29112906

together with a power spectrum analysis of the surface profile.Distinctive geometrical features can be easily depicted whencomparing the three substrates (Figure 2A): the Si substrateappears as almost uniformly flat; the MeP1 and MeP2substrates are quite uniformly porosified with a characteristicpore size in the few nanometers and few tens of nanometers,respectively. Such differences are also reflected by the surfaceAFM profiles (Figure.2B) and by the surface power spectra(Figure 2C). In particular, the surface roughness Ra is low for allthree substrates being equal to 0.1, ∼1, and ∼1.3 nm for the Si,MeP1, and MeP2 substrates, respectively. On the other hand,larger differences arise for the surface fractal dimension D,when comparing Si and MeP2 (D = 2.35 and 2.39, respectively)with the MeP1 substrate (D = 2.81).A detailed analysis of the pore geometry is presented in
Figure 2D where the pore size distribution, photoluminescentbehavior and surface contact angle are presented for the twoPSi substrates. For MeP1 substrates, most of the pores have asize falling in the 5 nm range and no pores larger than 20 nmare detected; whereas for the MeP2 substrates, most of thepores exhibit a characteristic size ranging between 10 and 20
nm and very few pores are larger than 50 nm (Figure 2D).These pore size distributions are confirmed by the photo-luminescence analysis where the silicon substrates are exposedto a UV light (λ ≈ 365). As expected,35 the images show astronger luminescence for the MeP1 as compared to the MeP2substrates, in that the former have a higher occurrence of poresin the nanometer range (Figure.2E). Both MeP substrates areoriginally hydrophobic exhibiting a contact angle of θ ≈ 135°,but becomes hydrophilic (θ ∼ 30°) upon oxidation(Figure.2F). The flat Si substrates are hydrophilic with acontact angle θ = 60° (see Figure S1 in the SupportingInformation). By imaging postprocessing of several SEMmicrographs, the surface porosity of the two Si substrates wasestimated as the ratio between total area of the pores and thearea of the considered region of interest. As shown in theSupporting Information, the surface porosities were 20.1 ± 4%for MeP1 and 25.0 ± 6% for MeP2.
3.2. Cell Adhesion and Proliferation on Porous Silicon(PSi) Substrates. The propensity to adhere and grow of thefour cell types was analyzed by incubating them over fragmentsof silicon substrates (∼15 × 15 mm). Note that none of the
Figure 3. Cell proliferation on porous silicon (PSi) substrates. (A) Surface density nd for the four cells types (mouse 3T3 fibroblasts; HUVECs;N2A and HCN1A) as a function of the incubation time. Flat silicon (Si; blue line), mesoporous silicon MeP1 (pore size ∼5 nm; green line) andmesoporous silicon MeP2 (pores size ∼20 nm; red line). Four time points are considered: 24 h, 36 h, 48 h and 60 h post deposition. (B) Ratiobetween the surface density of cells growing on MeP1 and Si substrates (MeP1/Si) and on MeP2 and Si substrates (MeP2/Si), at 60 h postdeposition.
ACS Applied Materials & Interfaces Research Article
dx.doi.org/10.1021/am300519a | ACS Appl. Mater. Interfaces 2012, 4, 2903−29112907
substrates was pretreated to support cell adhesion. At each timepoint, namely 24, 36, 48, and 60 h, the silicon substrates werefirst washed to remove loosely adhering and death cells; then,the remaining cells were fixed and labeled with DAPI. The cellsadhering within a region of interest (ROI) of ∼1 × 1 mm2 werecounted using fluorescent microscopy. For each substrate, morethan 40 ROIs were considered to provide a meaningful samplesize for statistical analysisThe number of adhering cells per unit surface normalized by
the total number of seeded cells (i.e., the cell surface density,nd) is shown in Figure 3A as a function of time. As expected,
the cell surface density nd increases with time. Moreinterestingly, Figure 3A shows that the maximum cell surfacedensity nd occurs over the MeP1 substrates, at all time pointsand for all cell types. The contribution of the MeP1 substratesin supporting cell adhesion and proliferation is even moreevident in the bar chart of Figure 3B, where the ratios betweenthe cell surface densities nd, measured at 60 h, over the MeP1and Si substrates (MeP1/Si) and the MeP2 and Si substrates(MeP2/Si) are presented. For the first ratio, MeP1/Si substrate(dark bars in Figure 3B), values larger than 50 are observed forthe neuronal N2A cells. These are followed by the mouse 3T3
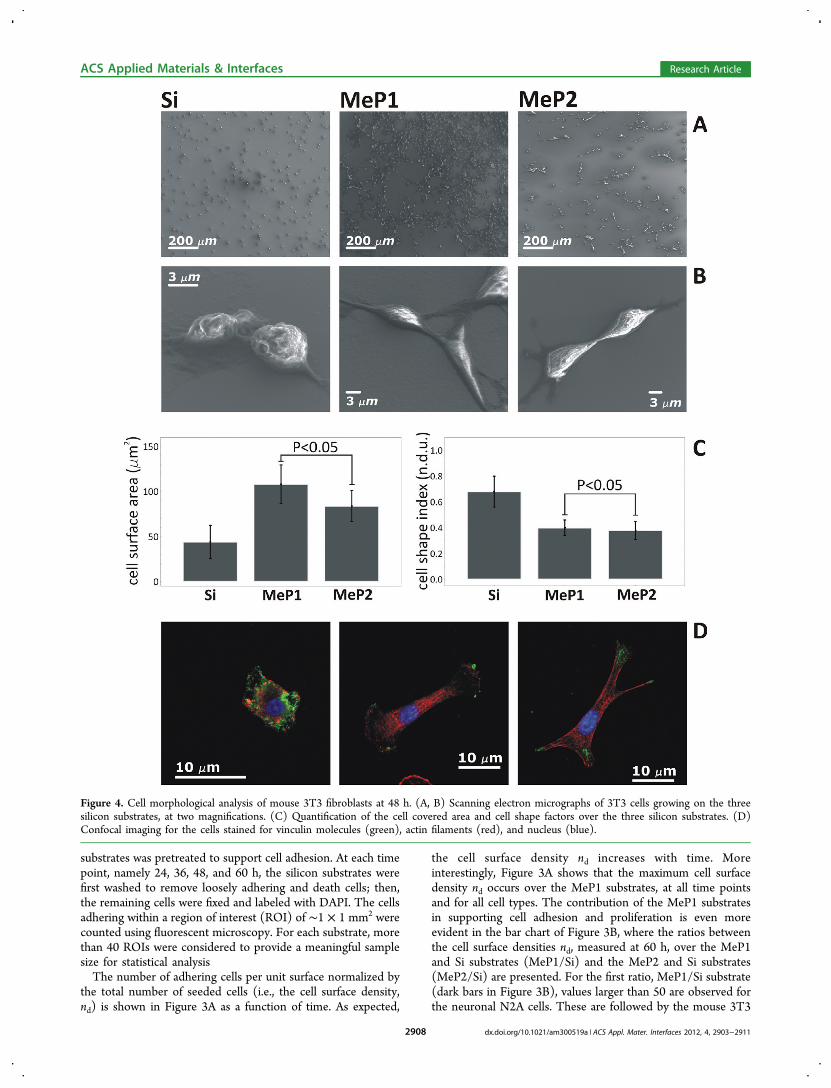
Figure 4. Cell morphological analysis of mouse 3T3 fibroblasts at 48 h. (A, B) Scanning electron micrographs of 3T3 cells growing on the threesilicon substrates, at two magnifications. (C) Quantification of the cell covered area and cell shape factors over the three silicon substrates. (D)Confocal imaging for the cells stained for vinculin molecules (green), actin filaments (red), and nucleus (blue).
ACS Applied Materials & Interfaces Research Article
dx.doi.org/10.1021/am300519a | ACS Appl. Mater. Interfaces 2012, 4, 2903−29112908

fibroblasts, with a ratio larger than 10; HUVECs, with a ratio of∼7; and by the HCN-1A cells, with a ratio of ∼5. The MeP2/Siratios are smaller but still significantly larger than unity (lightbars in Figure.3B). Comparing directly the surface density ofcells on the two PSi substrates, it appears that cells are from∼1.5 to 5 times more numerous on MeP1, at 60 h. It is hereimportant to recall that human cortical neuronal cells (HCN-1A) proliferate very slowly but, interestingly, they do exhibit agrowth rate significantly larger than zero on MeP1 substrates.This experimental evidence supports the notion that cellspreferentially adhere and grow over substrates with nanometerpore size (MeP1) rather than on flat Si substrates or substrateswith a larger pore size (MeP2).A direct comparison of the adhesion of 3T3 mouse
fibroblasts and HUVECs on nominally flat silicon substrate(Si) and glass cell culture dish (Glass) has been included inFigure S2 in the Supporting Information. The data show minordifferences in terms of the number density of cells adheringover 4 different times points, namely 24, 36, 48, and 60 h. Thesurface of the two substrates (Si and Glass) has also beencharacterized using Atomic Force Microscopy and ContactAngle measurements (see Figure S3 in the SupportingInformation). These data show that the considered cell lineshave fairly similar behaviors on Si and Glass, thus suggestingthat the difference observed with the porous substrates issignificant and practically relevant.To gain additional information on the distinctive cell
behavior over the three different substrates, the 3T3 andN2A cells were fixed and observed with scanning electron andconfocal microscopy. SEM and fluorescent confocal microscopyimages for the mouse 3T3 fibroblast cells are given in Figure 4.Similar images for the N2A cells are presented in Figure S4 inthe Supporting Information. On both MeP substrates, the cellbody appears elongated with a well spread cytoskeleton and theformation of long protrusions out of the cell membrane (Figure4B, D). Differently, on the Si substrate, cells appear morerounded with a few short and squat protrusions (Figure 4B).Noticeably, and in accordance with these findings, a similarbehavior was observed for stromal cells that, when adhering onmesoporous silicon or polymer fiber composites, exhibitelongated morphologies.36 From the SEM images, twoimportant parameters for characterizing the cell morphologycan be derived: the cell area A (in μm2), defined as the areacovered by the cell projected over the substrate; the cell shapeindex (CSI), defined as the ratio between the shorter and thelonger axis of the cell. Both parameters, A and CSI, arepresented in the bar chart of Figure 4C. For both MePsubstrates, no significant difference is observed in cell adhesionarea and morphology, whereas cells on flat Si substrates aremore rounded and less spread. Note that flat Si substratesshowed a slightly larger contact angle as compared to the MePsubstrates, which could in part be responsible for the observedlower cell adhesion and spreading.Similar morphological observations can be drawn from the
confocal fluorescent images of Figure 4D. Here, however,additional information can be gained by looking at the actinnetwork (red labeled) and the pattern distribution of thevinculin molecules (green labeled). Actin filaments appearmore elongated and aligned along the major axis of the cell onthe MeP substrates. Also, vinculin tends to form more distinctand ordered clusters, preferentially expressed at the head of cellmembrane protrusions (Figure.4D). The higher expressionlevels of vinculin in cells growing on MeP substrates are also
confirmed by Western blotting analysis: as shown in Figure S5in the Supporitng Information, the signal given by antivinculinantibody appeared 2 times higher in Neuro2A proliferating onMeP1 substrate, compared to Si and MeP2. No difference wasrevealed in beta-III tubulin expression, used as calibrator. Takentogether, these results indicate that cells growing on MeP1substrates can better activate molecular pathways directlyrelated to the active proliferation.It should here be noted that in a biological environment (pH
> 5.5), porous silicon is generally biodegradable over time.43−46
The dissolution process is strongly dependent on the porosityof the layer and surface modification. The substrates used hereexhibit a porosity not exceeding 60% and a protective coating ofnative silicon dioxide layer (SiO2); and no substratedegradation was observed over the whole period of theexperiments (60 h).
4. DISCUSSIONPSi implants for long-term drug release have been demon-strated for quite a few applications. This includes devices forthe release of antibiotics in bone implants,20,37,38 for supportingthe differentiation and proliferation of stem cells,23 hepato-cites,22 and improving the biomechanical connectivity betweenman-made electrodes and neuronal cells.21 Drugs and smallmolecules can be effectively loaded into the porous network ofPSi, using different approaches.39,40 Capillary action is certainlythe simplest. In this case, a concentrated solution of the activeagent to be loaded is either dropped directly on the PSi layer orthe latter is fully immersed in the solution. The pore geometry,as well as the surface chemical modification, are importantdeterminants in controlling the loading, first, and then therelease of the active agent.41,42 Drugs, microbicidal formula-tions, proteins and small molecules are more effectively trappedin pores exhibiting a size smaller than ∼10 nm. Indeed, thismanuscript focuses on the behavior of cells that would adhereand proliferate over MeP1 (pore diameters <10 nm) and MeP2(pore diameters = 10−50 nm) substrates.The results presented clearly support the notion that cells
can sense nanoscopic features on PSi substrates down to just afew nanometers (∼ 5 nm) and react differently to distinctivenanotopographical cues. This has been demonstrated for fourdistinct cell types, namely mouse 3T3 fibroblasts, HUVECs,N2A and HCN-1A cells. They all manifested a higher adhesionon MeP1 substrates as compared to flat silicon or MeP2surfaces, at all the considered time points. The largestenhancement in cell adhesion is observed for the N2A, amurine neuroblastoma cell line, for which 50 times more cellsadhered, at 60 h, over the MeP1 substrates. But even the HCN-1A cells, which are characterized by a very slow proliferationrate, were observed to grow 5 times faster at 60 h. At authors’knowledge, such a behavior has never been reported, so far,since studies on cell adhesion over PSi have mostly focused onsubstrates with larger pores (>20−30 nm up to a fewmicrometers), showing either a decrease in adhesion(substrates with 100−500 nm pore size) or similar adhesion(>1000 nm), with respect to flat silicon wafers.32−34
It is still not yet clear, however, why cells would preferentiallyadhere and grow on MeP substrates. Recently, it has beenshown that focal adhesions (FAs) exhibit a complex multiscalearchitecture where nanoscopic, doughnut-shaped complexes(∼25 nm in diameter and spaced at ∼45 nm intervals) aredistributed within the adhesion area and are associated toaligned bundles of actin filaments.47 Given their characteristic
ACS Applied Materials & Interfaces Research Article
dx.doi.org/10.1021/am300519a | ACS Appl. Mater. Interfaces 2012, 4, 2903−29112909

size, these complexes could better conform to clusters of ∼5nm pores over MeP substrates. In other words, it can bespeculated that the nanoscopic complexes in FAs would moreintimately interact with the porous structure of the MePsubstrates. More studies are needed to verify this hypothesis aswell as to elucidate the role played by the nanoscopiccomplexes in FAs. In future works, the attention should focuson the systematic analysis of (i) the cytoskeleton organizationvia fluorescent confocal microscopy, (ii) the architecture of FAsby cryo-electron tomography; and (iii) the dynamics offormation for FXs and FAs. It should also be noted that anaccurate dissection of the mechanisms regulating cellinteraction with mesoporous structures would require the useof substrates that are transparent to light. Nonetheless, the MePsilicon substrates and the presented results help in sheddingnew lights on the biophysics of cell adhesion on trulynanoscopic substrates and stimulate additional work on thisimportant subject.
5. CONCLUSIONSThe adhesion of four cell types, mouse 3T3 fibroblasts,HUVECs, N2A and HCN-1A cells, were monitored up to 60 hon three different silicon substrates: two PSi substrates, with apore size falling in the mesoporous regime (MeP1: pore size ∼5nm; MeP2: pore size ∼20 nm), obtained via anodization ofsilicon wafers and a unetched Si substrate.Cells on MeP1 were documented to grow from 5 to 50 times
faster as compared to Si substrates, at 60 h. For the MeP2substrates, the growth rate was still larger than for the Sisubstrate and ranged between 1.5 and 8, at 60 h. The growthrate was higher for the N2A, a murine neuroblastoma cell line,and smaller for the HCN-1A, a human neuronal cell line whichis known to have a very low duplication rate.A large difference in adhesion between MeP1 and MeP2 was
observed, although cell spreading and morphology appearedsimilar. We speculate that there could be an “optimal matching”between the multiscale molecular architecture of focaladhesions and the porous structure of MeP1 substrates thatcould facilitate adhesion.These results have implications in the rational development
of PSi substrates in implants and scaffolds for the controlledrelease of drugs, nerve repair, and tissue engineeringapplications.
■ ASSOCIATED CONTENT*S Supporting InformationAdditional data on the characterization of the PSi substratesand on cell adhesion, and complementary information to theMaterials and Methods section. This material is available free ofcharge via the Internet at http://pubs.acs.org/.
■ AUTHOR INFORMATIONCorresponding Author*E-mail [email protected]. Phone: +1 713 441 7316.NotesThe authors declare no competing financial interest.
■ ACKNOWLEDGMENTSThis research activity has been supported by the EuropeanScience Foundation EUROCORES Programme FANAS,through funds by the Consiglio Nazionale delle Ricerche andthe EC Sixth Framework Programme under Contract ERAS-
CT-2003-980409FANAS, and by the EU Commission, theEuropean Social Fund and the Calabria Region (POR CalabriaFSE 2007-2013).
■ REFERENCES(1) Foll, H.; Christophersen, M.; Carstensen, J.; Hasse, G. Mater. Sci.Eng. 2002, 39, 93−141.(2) Salonen, J.; Lehto, V. P. Chem. Eng. J. 2008, 137, 162−172.(3) Buriak, J. M. Chem. Rev. 2002, 102, 1271−1308.(4) Anderson, S. H. C.; Elliott, H.; Wallis, D. J.; Canham, L. T.;Powell, J. J. Phys. Status Solidi 2003, 197, 331−335.(5) Canham, L. T.; Stewart, M. P.; Buriak, J. M.; Reeves, C. L.;Anderson., M.; Squire, E. K.; Allcock, P.; Snow, P. A. Phys. Status SolidiA. 2000, 182, 521−525.(6) Bayliss, S. C.; Heald, R.; Fletcher, D. I.; Buckberry, L. D. Adv.Mater. 1999, 11, 318−321.(7) Ainslie, K. M.; Tao, S. L.; Popat, K. C.; Desai, T. A. ACS Nano2008, 2, 1076−1084.(8) Lin, V. S. Y.; Motesharei, K.; Dancil, K. P. S.; Sailor, M. J.;Ghadiri, M. R. Science 1997, 278, 840−843.(9) Canham, L. T. Appl. Phys. Lett. 1990, 57, 1046−1048.(10) Cullis, A. G.; Canham, L. T.; Calcott, P. D. J. J. App. Phys. 1997,82, 909−966.(11) Desai, T. A.; Hansford, D. J.; Kulinsky, L.; Nashat, A. H.; Rasi,G.; Tu, J.; Wang, Y.; Zhang, M.; Ferrari, M. Biomed. Microdevices 1999,2, 11−40.(12) Anglin, E. J.; Cheng, L.; Freeman, W. R.; Sailor, M. J. Adv. DrugDelivery Rev. 2008, 60, 1266−1277.(13) Perelman, L. A.; Pacholski, C.; Li, Y. Y.; Van Nieuwenhze, M. S.;Sailor, M. J. Nanomedicine 2008, 3, 31−43.(14) Park, J. H.; Gu, L.; von Maltzahn, G.; Ruoslahti, E.; Bhatia, S.N.; Sailor, M. J. Nat. Mater. 2009, 8, 331−336.(15) Tanaka, T.; Mangala, L. S.; Vivas-Mejia, P. E.; Nieves-Alicea, R.;Mann, A. P.; Mora, E.; Han, H. D.; Shahzad, M. M. K.; Liu, X.;Bhavane, R.; Gu, J.; Fakhoury, J. R.; Chiappini, C.; Lu, C.; Matsuo, K.;Godin, B.; Stone, R. L.; Nick, A. M.; Berestein, G. L.; Sood, A. K.;Ferrari, M. Cancer Res. 2010, 70, 3687−96.(16) Ananta, J. S.; Godin, B.; Sethi, R.; Moriggi, L.; Liu, X.; Serda, R.E.; Krishnamurthy, R.; Muthupillai, R.; Bolskar, R. D.; Helm, L.;Ferrari, M.; Wilson, L. J.; Decuzzi, P. Nat. Nanotechnol. 2010, 5, 815−821.(17) Jane, A.; Dronov, R.; Hodges, A. Trends Biotechnol. 2009, 27,230−239.(18) Hu, Y.; Bouamrani, A.; Tasciotti, E.; Li, L.; Liu, X.; Ferrari, M.ACS Nano 2010, 4, 439−451.(19) Chan, S.; Fauchet, P. M.; Li, Y.; Rothberg, L. J.; Miller, B. L.Phys. Status Solidi A 2000, 182, 541−546.(20) Wang, M.; Coffer, J. L.; Dorraj, K.; Hartman, P. S.; Loni, A.;Canham, L. T. Mol. Pharm. 2010, 7, 2232−42.(21) Moxon, K. A.; Hallman, S.; Aslani, A.; Kalkhoran, N. M.; Lelkes,P. I. J. Biomater. Sci., Polym. Ed. 2007, 18, 1263−1281.(22) Chin, V.; Collins, B. E.; Sailor, M. J.; Bhatia, S. N. Adv. Mater.2001, 13, 1877−1880.(23) Low, S. P.; Voelcker, N. H.; Canham, L. T.; Williams, K. A.Biomaterials 2009, 30, 2873−80.(24) Curtis, A.; Wilkinson, C. Biomaterials 1997, 18, 1573−1583.(25) Dalby, M. J.; Riehle, M. O.; Yarwood, S. J.; Wilkinson, C. D. W.;Curtis, A. S. G. Exp. Cell. Res. 2003, 284, 274−282.(26) Andersson, A. S.; Backhed, F.; von Euler, A.; Richter-Dahlfors,A.; Sutherland, D.; Kasemo, B. Biomaterials 2003, 24, 3427−36.(27) Choi, C. H.; Hagvall, S. H.; Wu, B. M.; Dunn, J. C. Y.; Beygui,R. E.; Kim, C. J. Biomaterials 2007, 28, 1672−79.(28) Brunetti, V.; Maiorano, G.; Rizzello, L.; Sorce, B.; Sabella, S.;Cingolani, R.; Pompa, P. P. Proc. Natl. Acad. Sci. U.S.A. 2010, 107,6264−9.(29) Gentile, F.; Tirinato, L.; Battista, E.; Causa, F.; Liberale, C.; DiFabrizio, E. M.; Decuzzi, P. Biomaterials 2010, 31, 7205−12.
ACS Applied Materials & Interfaces Research Article
dx.doi.org/10.1021/am300519a | ACS Appl. Mater. Interfaces 2012, 4, 2903−29112910

(30) Low, S. P.; Williams, K. A.; Canham, L. T.; Voelcker, N. H.Biomaterials 2006, 27, 4538−46.(31) Zhao, Y.; Lu., X.; Wang, Z.; Huang, Y.; Jiang, Z.; Li, X. Biomed.Mater. 2009, 4, 065004−9.(32) Sapelkin, A. V.; Bayliss, S. C.; Unal, B.; Charalambou, A.Biomaterials 2006, 27, 842−6.(33) Khung, Y. L.; Barritt, G.; Voelcker, N. H. Exp. Cell. Res. 2008,314, 789−800.(34) Orita, T.; Tomita, M.; Kato, K. Colloids Surf., B 2011, 84, 187−97.(35) Godefroo, S.; Hayne, M.; Jivanescu, M.; Stesmans, A.; Zacharias,M.; Lebedev, O. I.; Van Tendeloo, G.; Moshchalkov, V. V. Nat.Nanotechol. 2008, 3, 174−8.(36) Fan, D.; Akkaraju, G. R.; Couch, E. F.; Canham, L. T.; Coffer, J.L. Nanoscale 2011, 3, 354−61.(37) Perez, L. M.; Lalueza, P.; Monzon, M.; Puertolas, J. A.; Arruebo,M.; Santamaría, J. Int. J. Pharm. 2011, 409, 1−8.(38) Gultepe, E.; Nagesha, D.; Sridhar, S.; Amiji, M. Adv. DrugDelivery Rev. 2010, 62, 305−15.(39) Anglin, E. J.; Cheng, L; Freeman, W. R.; Sailor, M. J. Adv. DrugDelivery Rev. 2008, 60, 1266−77.(40) Salonen, J.; Kaukonen, A. M.; Hirvonen, J.; Lehto, V. P. J.Pharm. Sci. 2008, 97, 632−53.(41) Leoni, L.; Boiarski, A.; Desai, T. A. Biomed. Microdev. 2002, 4,131−139.(42) Tasciotti, E.; Liu, X.; Bhavane, R.; Plant, K.; Leonard, A. D.;Price, B. K.; Cheng Cheng, M. M.; Decuzzi, P.; Tour, J. M.; Robertson,F.; Ferrari, M. Nat. Nanotechnol. 2008, 3, 151−157.(43) Canham, L. T. Adv. Mater. 1995, 7, 1033−37.(44) Canham, L. T.; Reeves, C. L.; Newey, J. P.; Houlton, M. R.;Cox, T. I.; Buriak, J. M.; Stewart, M. P. Adv. Mater. 1999, 11, 1505−07.(45) Steinem, C.; Janshoff, A.; Lin, V. S. Y.; Volcker, N. H.; Ghadiri,M. R. Tetrahedron 2004, 60, 11259−11267.(46) Canham, L. T. Properties of Porous Silicon; Institute ofEngineering and Technology: Stevenage, U.K., 1997.(47) Patla, I.; Volberg, T.; Elad, N.; Hirschfeld-Warneken, V.;Grashoff, C.; Fassler, R.; Spatz, J. P.; Geiger, B.; Medalia, O. Nat. CellBiol. 2010, 12, 909−15.
ACS Applied Materials & Interfaces Research Article
dx.doi.org/10.1021/am300519a | ACS Appl. Mater. Interfaces 2012, 4, 2903−29112911