Natural variation in photosynthetic capacity, growth, and yield in 64 field-grown wheat genotypes
15
Journal of Experimental Botany, Vol. 65, No. 17, pp. 4959–4973, 2014 doi:10.1093/jxb/eru253 Advance Access publication 24 June, 2014 This paper is available online free of all access charges (see http://jxb.oxfordjournals.org/open_access.html for further details) RESEARCH PAPER Natural variation in photosynthetic capacity, growth, and yield in 64 field-grown wheat genotypes S. M. Driever 1, *, T. Lawson 1, * ,† , P. J. Andralojc 2 , C. A. Raines 1 and M. A. J. Parry 2 1 School of Biological Sciences, University of Essex, Wivenhoe Park, Colchester, Essex CO4 3SQ, UK 2 Plant Biology & Crop Science, Rothamsted Research, West Common, Harpenden, Hertfordshire AL5 2JQ, UK * These authors contributed equally to this paper. † To whom correspondence should be addressed. E-mail: [email protected] Received 13 December 2013; Revised 24 April 2014; Accepted 8 May 2014 Abstract Increasing photosynthesis in wheat has been identified as an approach to enhance crop yield, with manipulation of key genes involved in electron transport and the Calvin cycle as one avenue currently being explored. However, natural variation in photosynthetic capacity is a currently unexploited genetic resource for potential crop improve- ment. Using gas-exchange analysis and protein analysis, the existing natural variation in photosynthetic capacity in a diverse panel of 64 elite wheat cultivars grown in the field was examined relative to growth traits, including biomass and harvest index. Significant variations in photosynthetic capacity, biomass, and yield were observed, although no consistent correlation was found between photosynthetic capacity of the flag leaf and grain yield when all cultivars were compared. The majority of the variation in photosynthesis could be explained by components related to maxi- mum capacity and operational rates of CO 2 assimilation, and to CO 2 diffusion. Cluster analysis revealed that cultivars may have been bred unintentionally for desirable traits at the expense of photosynthetic capacity. These findings sug- gest that there is significant underutilized photosynthetic capacity among existing wheat varieties. Our observations are discussed in the context of exploiting existing natural variation in physiological processes for the improvement of photosynthesis in wheat. Key words: Biomass, natural variation, photosynthetic capacity, Rubisco, wheat, yield. Introduction Globally, wheat is one of the most important crops, providing over 20% of the calories consumed by the world’s popula- tion and a similar proportion of protein for about 2.5 billion people (Braun et al., 2010). Current increases in global wheat productivity are only 1.1% per annum (Dixon et al., 2009) or even static in some regions (Brisson et al., 2010), while the predicted global demand is likely to increase by 1.7% per annum until 2050 (Rosegrant and Agcaoili, 2010). It is clear that the current yield gain per annum in wheat is insufficient to meet the growing demand, and that new approaches to increasing productivity are essential to avoid shortfalls of growing severity (Hawkesford et al., 2013). Employing more land for the production of food is not a sustainable option, and thus the productivity of existing arable land will have to be improved. The general consen- sus is that the only way to improve yield potential in crops, including wheat, is through the improvement of radiation- use efficiency. In the absence of chronic environmental stress, © The Author 2014. Published by Oxford University Press on behalf of the Society for Experimental Biology. Abbreviations: A, CO 2 assimilation; ANOVA, analysis of variance; CABP, 2′-carboxyarabinitol-1, 5-bisphosphate; C i , intercellular CO 2 concentration; C i , intercel- lular CO 2 concentration; ERYCC, Earliness & Resilience for Yield in a Changed Climate; g m , mesophyll conductance; h 2 , heritability; J max , maximum rate of electron transport demand for RuBP regeneration; PC, principle component; PCA, principle components analysis; PEG, polyethylene glycol; PPFD, photosynthetic photon flux density; R d , respiration rate; Rubisco, ribulose-1,5-bisphosphate carboxylase/oxygenase; RuBP, ribulose-1,5-bisphosphate; SBPase, sedoheptulose-1,7-bi- phospatase; V cmax , maximum velocity of Rubisco for carboxylation. This is an Open Access article distributed under the terms of the Creative Commons Attribution License (http://creativecommons.org/licenses/by/3.0/), which permits unrestricted reuse, distribution, and reproduction in any medium, provided the original work is properly cited.
-
Upload
independent -
Category
Documents
-
view
2 -
download
0
Transcript of Natural variation in photosynthetic capacity, growth, and yield in 64 field-grown wheat genotypes

Journal of Experimental Botany, Vol. 65, No. 17, pp. 4959–4973, 2014doi:10.1093/jxb/eru253 Advance Access publication 24 June, 2014This paper is available online free of all access charges (see http://jxb.oxfordjournals.org/open_access.html for further details)
ReseaRch PaPeR
Natural variation in photosynthetic capacity, growth, and yield in 64 field-grown wheat genotypes
S. M. Driever1,*, T. Lawson1,*,†, P. J. Andralojc2, C. A. Raines1 and M. A. J. Parry2
1 School of Biological Sciences, University of Essex, Wivenhoe Park, Colchester, Essex CO4 3SQ, UK2 Plant Biology & Crop Science, Rothamsted Research, West Common, Harpenden, Hertfordshire AL5 2JQ, UK
* These authors contributed equally to this paper.† To whom correspondence should be addressed. E-mail: [email protected]
Received 13 December 2013; Revised 24 April 2014; Accepted 8 May 2014
Abstract
Increasing photosynthesis in wheat has been identified as an approach to enhance crop yield, with manipulation of key genes involved in electron transport and the Calvin cycle as one avenue currently being explored. However, natural variation in photosynthetic capacity is a currently unexploited genetic resource for potential crop improve-ment. Using gas-exchange analysis and protein analysis, the existing natural variation in photosynthetic capacity in a diverse panel of 64 elite wheat cultivars grown in the field was examined relative to growth traits, including biomass and harvest index. Significant variations in photosynthetic capacity, biomass, and yield were observed, although no consistent correlation was found between photosynthetic capacity of the flag leaf and grain yield when all cultivars were compared. The majority of the variation in photosynthesis could be explained by components related to maxi-mum capacity and operational rates of CO2 assimilation, and to CO2 diffusion. Cluster analysis revealed that cultivars may have been bred unintentionally for desirable traits at the expense of photosynthetic capacity. These findings sug-gest that there is significant underutilized photosynthetic capacity among existing wheat varieties. Our observations are discussed in the context of exploiting existing natural variation in physiological processes for the improvement of photosynthesis in wheat.
Key words: Biomass, natural variation, photosynthetic capacity, Rubisco, wheat, yield.
Introduction
Globally, wheat is one of the most important crops, providing over 20% of the calories consumed by the world’s popula-tion and a similar proportion of protein for about 2.5 billion people (Braun et al., 2010). Current increases in global wheat productivity are only 1.1% per annum (Dixon et al., 2009) or even static in some regions (Brisson et al., 2010), while the predicted global demand is likely to increase by 1.7% per annum until 2050 (Rosegrant and Agcaoili, 2010). It is clear that the current yield gain per annum in wheat is insufficient
to meet the growing demand, and that new approaches to increasing productivity are essential to avoid shortfalls of growing severity (Hawkesford et al., 2013).
Employing more land for the production of food is not a sustainable option, and thus the productivity of existing arable land will have to be improved. The general consen-sus is that the only way to improve yield potential in crops, including wheat, is through the improvement of radiation-use efficiency. In the absence of chronic environmental stress,
© The Author 2014. Published by Oxford University Press on behalf of the Society for Experimental Biology.
Abbreviations: A, CO2 assimilation; ANOVA, analysis of variance; CABP, 2′-carboxyarabinitol-1, 5-bisphosphate; Ci, intercellular CO2 concentration; Ci, intercel-lular CO2 concentration; ERYCC, Earliness & Resilience for Yield in a Changed Climate; gm, mesophyll conductance; h2, heritability; Jmax, maximum rate of electron transport demand for RuBP regeneration; PC, principle component; PCA, principle components analysis; PEG, polyethylene glycol; PPFD, photosynthetic photon flux density; Rd, respiration rate; Rubisco, ribulose-1,5-bisphosphate carboxylase/oxygenase; RuBP, ribulose-1,5-bisphosphate; SBPase, sedoheptulose-1,7-bi-phospatase; Vcmax, maximum velocity of Rubisco for carboxylation.
This is an Open Access article distributed under the terms of the Creative Commons Attribution License (http://creativecommons.org/licenses/by/3.0/), which permits unrestricted reuse, distribution, and reproduction in any medium, provided the original work is properly cited.

4960 | Driever et al.
parameters such as harvest index are already close to the theoretical limit (Foulkes et al., 2011; Reynolds et al., 2012a). Photosynthesis appears to be a process for which significant improvement in radiation-use efficiency is still possible, both for wheat (Parry et al., 2011) and for other crop species (Long et al., 2006; Zhu et al., 2010; Raines, 2011). In wheat, evidence for increased yield in response to CO2 enrichment (Ainsworth and Long, 2005), and the positive relationship between pho-tosynthesis and biomass (Kruger and Volin, 2006) and yield (Fischer et al., 1998), support this contention. In principle, improved photosynthesis could be achieved by increasing photosynthetic rate per unit leaf area and by optimizing light interception and utilization through modification of canopy architecture and photosynthetic duration.
For wheat, several strategies have been proposed for increasing photosynthetic rate per unit leaf area. As reviewed by Parry et al. (2011), these include improvement of ribulose-1,5-bisphosphate carboxylase/oxygenase (Rubisco) activity, faster regeneration of ribulose-1,5-bisphosphate (RuBP), and the introduction of carbon-concentrating mechanisms. These strategies all require modification of the photosynthetic components, which can only be achieved through genetic manipulation. However, although modern techniques allow the extensive manipulations that are necessary for the intro-duction of complex processes such as a carbon-concentrating mechanism, there is still much to be learned from the natural variation in photosynthetic capacity and performance that already exists between species and within cultivars, as well as their ability to survive or thrive under specific environmental stresses. The physiological or genetic mechanisms that under-lie such natural variation in species or cultivars are largely untapped resources that may provide not only valuable infor-mation on the capacity and performance of different cultivars under different environmental conditions but also an invalu-able genetic resource that can be used to improve yield (Flood et al., 2011; Lawson et al., 2012). Knowledge of this natural diversity will encourage the use of new cultivar backgrounds (with desirable traits) onto which additional genetic modifica-tions can be targeted in a bid to improve crop yields. Work by Wullschleger (1993) was one of the first large-scale studies that showed significant variation in photosynthetic capacity in a range of species. CO2 assimilation and intercellular CO2 concentration analysis of 109 species (ranging from woody perennials to herbaceous annuals) revealed that species-spe-cific differences in CO2 assimilation rate were due to differ-ences in underlying biochemistry including carboxylation capacity and RuBP regeneration (via electron transport).
Despite photosynthesis being the primary determinant of plant productivity, previous research has seldom provided good evidence for a strong positive relationship between the rate of photosynthesis per unit leaf area and yield. Most pre-vious studies assessing variation in wheat have involved lim-ited measurements on small sets of germplasm. For example, past efforts to investigate photosynthetic variation in wheat used up to 48 different genotypes (Fischer et al., 1981, 1998; Blum, 1990; Watanabe et al., 1994; Reynolds et al., 2000; Xue et al., 2002; Chytyk et al., 2011; Sadras et al., 2012). However, the information available across these studies is not directly
comparable, due to the application of different experimental approaches. For example, some studies assessed photosyn-thetic characteristics in response to changes in light and CO2 concentration (Blum, 1990; Chytyk et al., 2011), while oth-ers relied on steady-state measurements taken under a variety of different conditions (Fischer et al., 1981, 1998; Watanabe et al., 1994; Reynolds et al., 2000; Xue et al., 2002; Sadras et al., 2012). Therefore, the extent to which photosynthetic characteristics vary in existing wheat cultivars remains unclear.
The aims of this study were to explore the naturally exist-ing variation in photosynthetic characteristics in wheat, to identify any possible correlations with yield. The longer-term aim would be to exploit this information to assist in the iden-tification of targets for the improvement of crop yield. To achieve this, a diverse panel of 64 modern elite wheat culti-vars differing in geographical location, year of introduction, and intended end use (feed and bread varieties being repre-sented) were grown in the field and a range of growth, yield, and photosynthetic parameters determined. Analysis of these data has provided an insight in the variation in physiological processes, which are discussed together with the possibilities for improving photosynthesis in wheat.
Materials and methods
Plant material, field conditions, and harvestThe 64 wheat cultivars used in this study were from the Earliness & Resilience for Yield in a Changed Climate (ERYCC) panel that were generated as part of a Department for Environment, Food and Rural Affairs and HGCA sponsored sustainable Arable LINK project (‘Adapting Wheat to Global Warming’; Project LK0992) by Clarke et al. (2012). Within the ERYCC LINK project, wheat culti-vars were selected on the basis of phenology (for example, lodging resistance) and yield (Table 1). Certain cultivars also contained spe-cific yield-related genes, such as Rht genes, determining stature and grain number; Ppd1 and Ppd2, photoperiod genes governing floral growth rate and apex morphology; Lr37 and Pch1, conferring resist-ance to leaf rust and eyespot disease, respectively; Sm1, conferring resistance to orange wheat blossom midge; and 1RS, a rye chromo-some arm, which is a source of genes for both insect and disease resistance in wheat (Table 1).
Within the panel, all cultivars were introduced after 1975, with the exception of cultivars 62 (Maris Widgeon, 1964) and 47 (Capelle Desprez, 1953). Thirty-four of the chosen cultivars have been intro-duced since 2000 (Supplementary Fig. S1 available at JXB online). However, although consisting predominantly of modern varieties, a consistent increase in yield with year of introduction has been observed from the cultivars within this panel (Clarke et al., 2012).
The field in which the material was grown (Great Field 1 and 2) was composed of a moderately well drained flinty loam on clay with flints and/or chalk, which had been used for oilseed rape production in the preceding season. The ground was prepared by application of systemic herbicide, followed 3 weeks later by plough-ing, with cultipressing and power harrowing at intervals of 1 week thereafter, to produce a suitable seed bed. Immediately afterwards (5 October 2011), the wheat seed was drilled at a rate of 350 seeds m–2 and the plots rolled. Three (2 × 1 m) plots of each cultivar were arranged in separate, randomized blocks, each block containing eight rows with eight plots per row, and three blocks in total (three blocks of 64 cultivars each=192 plots) with 1.0 m between rows and 0.5 m between adjacent plots. The plots were treated periodically, pre- and post-emergence, with herbicides, insecticides, and fun-gicides to promote weed- and disease-free development. Nitrogen and sulfur (Doubletop: GrowHow UK) and nitrogen alone (F34

Natural variation in photosynthetic capacity, growth | 4961
Table 1. List of cultivars grown in the field in the current study with specification of common names, indication of landmark variety, year of introduction, indication of bread or feed variety (for landmark varieties), and presence of genes of interest
These cultivars were chosen based on the ERYCC LINK project (‘Adapting wheat to global warming’, Sustainable Arable LINK Programme Project LK0992).
Cultivar Name Year of introduction
Landmark variety (Y/N)
Bread/feed variety (Landmark)
Genes
1 Equinox 1997 N – Rht2 Rht8 Lr37 Sm1 1RS
2 Cordiale 2004 Y Bread Rht2 Rht8 Sm1
3 Robigus 2003 Y Feed Rht1 Rht8 Sm1
4 Access 2002 N – Rht2 Rht8 Lr37 Sm1 1RS
5 Oakley 2007 Y Feed Rht1 Rht8 Sm1
6 Humber 2007 N – Rht2 Rht8 Lr37 Sm1 1RS
7 Malacca 1999 Y Bread Rht2 Rht8 Sm1
8 Dover 2007 N – Rht2 Rht8 Lr37 Sm1
9 Beaver 1990 Y Feed Rht2 Rht8 Sm1
10 Andalou 2002 N – Ppd1 Rht2 Rht8 Sm1
11 Royssac 2003 N – Ppd1 Rht2 Rht8 Sm1
12 Exotic 2006 N – Ppd1 Rht2 Rht8 Lr37 Sm1
13 Rialto 1995 Y Bread Rht2 Rht8 Sm1 1RS
14 Exsept 2001 N – Rht2 Rht8 Sm1
15 Einstein 2003 Y Bread Rht2 Rht8 Sm1
16 Ambrosia 2005 N – Rht2 Rht8 Sm1
17 Claire 1999 Y Feed Rht2 Rht8 Lr37 Sm1 1RS
18 Glasgow 2005 N – Rht2 Rht8 Sm1
19 Alchemy 2006 Y Feed Rht2 Rht8 Sm1
20 Istabraq 2004 N – Rht2 Rht8 Sm1
21 Soissons 1995 N – Ppd1 Rht1 Rht8 Sm1
22 Sankara 2005 N – Rht2 Rht8 Lr37 Pch1 Sm1
23 Mendel 2005 N – Ppd2 Rht2 Rht8 Sm1
24 Mercato 2006 N – Ppd1 Rht1 Rht8 Lr37 Sm1
25 Deben 2001 N – Rht2 Rht8 Sm1
26 Xi19 2002 N – Rht2 Rht8 Sm1
27 Solstice 2002 Y Bread Rht2 Sm1
28 Gladiator 2004 N – Rht2 Rht8 Lr37 Sm1 1RS
29 Brompton 2005 N – Rht2 Rht8 Sm1 1RS
30 Mascot 2006 N – Rht2 Rht8 Lr37 Sm1
31 Zebedee 2007 N – Rht2 Rht8 Sm1
32 Gatsby 2006 N – Rht1 Rht8 Sm1 1RS
33 Hyperion 2006 N – Rht2 Rht8 Lr37 Pch1 Sm1
34 Gulliver 2008 N – Rht2 Rht8 Lr37 Sm1
35 Timber 2007 N – Rht2 Rht8 Sm1
36 Consort 1995 Y Feed Rht2 Rht8 Sm1
37 Battalion 2007 N – Rht2 Rht8 Lr37 Pch1 Sm1
38 Marksman 2008 N – Rht2 Rht8 Lr37 Pch1 Sm1
39 Musketeer 2008 N – Rht2 Rht8 Lr37 Pch1 Sm1
40 Recital 1986 N – Ppd1 Ppd2 Rht1 Rht8 Sm1
41 Hereward 1991 Y Bread Rht2 Rht8 Sm1
42 Apache 1998 N – Ppd1 Rht8 Lr37 Sm1
43 Caphorn 2002 N – Ppd1 Rht2 Rht8 Lr37 Sm1
44 Galahad 1983 Y Feed Rht2 Rht8 Sm1
45 Alixan 2005 N – Rht2 Rht8 Sm1
46 Avalon 1980 Y Bread Rht2 Rht8 Sm1
47 Cappelle Desprez 1953 Y Feed Rht8 Sm1
48 Haven 1990 N – Rht2 Rht8 Sm1 1RS
49 Cezanne 1998 N – Ppd1 Rht1 Rht8 Sm1
50 Savannah 1998 N – Rht2 Rht8 Lr37 Sm1 1RS
51 Maris Huntsman 1998 N – Rht8 Sm1
52 Paragon 1999 N – Rht8 Sm1
53 Riband 1989 Y Feed Rht2 Rht8 Sm1

4962 | Driever et al.
Nitram: GrowHow UK) were applied in mid-March and mid-May, respectively (185 kg ha–1 on each occasion). The tall cultivars 62 and 47 (Maris Widgeon and Cappelle Desprez) were staked to reduce lodging.
Harvest took place (17 August 2012) once all the cultivars had reached physiological maturity and the kernels were hard (Zadoks scale 9.1–9.2). Grain yields were obtained with a Haldrup plot com-bine, the straw being weighed on the back of the combine by means of a supplementary load cell. The straw was immediately subsam-pled, bagged, and chopped for determination of moisture content by oven drying. A fresh grain subsample was also taken for moisture determination.
Development according to the Zadoks scale of all 64 cultivars is shown in Supplementary Fig. S2 available at JXB online.
A/Ci photosynthetic gas-exchange measurementsPhotosynthesis measurements were performed on flag leaves that had fully emerged, between the flag leaf sheath extension and boot (sheath) swelling (Zadoks growth stages 4.1–4.5). Measurements were made pre-anthesis to ensure that differences in sink size did not influence photosynthetic capacity. In order to ensure that all genotypes were measured under identical conditions, whole shoots were collected before dawn by cutting the base of the stem, fol-lowed by immediate recutting of the shoot (5–10 cm above the origi-nal incision) under water. Shoots were promptly transferred to the laboratory in tubes containing demineralized water and stored in a controlled environment cabinet providing darkness, low tempera-ture, and high humidity (10 °C and 90% relative humidity), which simulated prevailing night-time conditions. Prior to gas-exchange measurements, while still in darkness, the flag leaf was cut under water at the base of the lamina and the cut base placed in a tube con-taining demineralized water to a depth of approximately 3 cm. It was then transferred to a second controlled environment room and left to acclimate for 1 h at 15 °C and 60% relative humidity, with an irra-diance [photosynthetic photon flux density (PPFD)] of 500 µmol m–2 s–1, which was sufficient for light adaptation. Daily mean light levels in the field for the period of photosynthetic measurements are given in Supplementary Table S1 available at JXB online.
The response of photosynthesis to changes in Ci was meas-ured in the middle of the flag leaf with a near-saturating irradi-ance of 1500 μmol of photons m−2 s−1, using an open infrared gas-exchange system and a 2 cm2 leaf chamber with an integral blue–red LED light source (LI-6400–40; LI-COR, Lincoln, NE). Leaves were clamped in the leaf chamber and complete sealing of the gaskets around the leaf was assured to prevent possible diffu-sion leakage. Leaf temperature was maintained at 20 ± 1 °C with a vapour pressure deficit of 0.9 kPa and an ambient CO2 concentra-tion (Ca) of 400 μmol mol−1. Subsequently, Ca was decreased to
300, 200, 100, and 75 μmol mol−1 before returning to the initial concentration. This was followed by an increase to 550, 700, 1000, and 1200 μmol mol−1. Readings were recorded when CO2 assimila-tion (A) had stabilized to the new conditions (after about 2 min). The maximum velocity of Rubisco for carboxylation (Vcmax), the maximum rate of electron transport demand for RuBP regenera-tion (Jmax), mesophyll conductance (gm), and respiration rate (Rd) were derived by curve fitting as described by Sharkey et al. (2007) using the Rubisco kinetic constants for wheat (Carmo-Silva et al., 2010). Operational assimilation rate under ambient conditions (A400) and maximal carboxylation rate (Amax) were determined from assimilation values recorded at 400 and 1200 μmol mol−1 CO2 concentration, respectively.
Protein extraction, Rubisco quantification, and carboxylation efficiencyImmediately after measurement of leaf photosynthesis, a 3–4 cm leaf sample encompassing the area within the leaf chamber was taken by cutting with a razor blade perpendicular to the central vein. The length and width at both ends of the leaf section were measured, followed by snap freezing in liquid N2 and storage at –80 °C, awaiting extraction of soluble leaf protein. These samples (leaf area 6–8 cm2) were ground with an ice-cold pestle and mortar to a particle-free homogenate (in ≤90 s) immediately after addition to 1.5 ml of ice-cold buffer, containing 50 mM MES/NaOH (pH 7.0), 10 mM MgCl2, 1 mM EDTA, 1 mM EGTA, 50 mM 2-mercap-toethanol, 2 mM benzamidine, 5 mM ε-aminocaproic acid, 10 mM dithiothreitol, 10 mM NaHCO3, 1 mM PMSF, 1/100 vol. plant Protease Inhibitor Cocktail (Sigma), 20 mg of insoluble polyvi-nylpyrrolidone, and 100 mg acid-washed sand. (The last six compo-nents were added just before extraction, either from concentrated stock solutions or in solid form.) The homogenate was clarified by centrifugation (14 700g, 5 min, 4 °C). Rubisco in the superna-tant was quantified and carboxylation efficiency was determined by a modification of the method of Yokota and Canvin (1985). Duplicate 150 μl aliquots of the supernatant were mixed imme-diately with 150 μl of [14C]2′-carboxyarabinitol-1, 5-bisphosphate (CABP)-binding solution at 0 °C, containing 200 mM Bicine/NaOH (pH 8.0), 40 mM MgCl2, 20 mM NaHCO3, 100 mM 2-mercaptoeth-anol, 200 mM Na2SO4, and 15 nmol (0.56 kBq) [2’-14C]CABP. (The remaining supernatant was snap frozen immediately in liquid N2 and stored at –80 °C.) After 20 min at 0 °C, 60% (w/v) polyethylene glycol (PEG) 4000 was added with thorough mixing, to give a final concentration of 25% PEG, causing the precipitation of Rubisco and Rubisco-bound [14C]CABP. After 30 min at 0 °C, the precipitate was sedimented by centrifugation (14 700g, 10 min, 4 °C), the super-natant discarded, and the pellet washed by repeated vortexing with 500 μl of 20% (w/v) PEG 4000, containing 100 mM Bicine/NaOH
Cultivar Name Year of introduction
Landmark variety (Y/N)
Bread/feed variety (Landmark)
Genes
54 Norman 1981 Y Feed Rht2 Rht8 Sm1
55 Buster 1995 N – Rht2 Rht8 Sm1
56 Spark 1993 N – Rht8 Sm1
57 Mercia 1986 Y Bread Rht8 Sm1
58 Cadenza 1994 N – Rht8 Sm1
59 Hobbit 1977 N – Rht2 Rht8 Sm1
60 Hustler 1978 N – Rht2 Rht8 Sm1
61 Longbow 1983 N – Rht2 Rht8 Sm1
62 Maris Widgeon 1964 Y Bread Rht8 Sm1
63 Virtue 1979 N – Rht2 Rht8 Sm1
64 Bacanora 1988 N – Ppd1 Rht1 Rht8 Sm1 1RS
Table 1. Continued

Natural variation in photosynthetic capacity, growth | 4963
(pH 8.0), 20 mM MgCl2, 10 mM NaHCO3,and 50 mM 2-mercap-toethanol. After 15 min at 0 °C, the pellet was consolidated by centrifugation (14 700g, 10 min, 4 °C) and the wash/centrifugation procedure repeated once more. The final pellet was redissolved in 500 μl of 1% (v/v) Triton X-100. The 14C content was determined by liquid scintillation counting, after addition to 4 ml of scintillation cocktail (Ultima Gold; Perkin Elmer, UK). Total protein content of extracted soluble protein samples was determined according to Bradford (1976).
Statistical analysisCorrelations between all possible pairs of measured parameters were analysed by Spearman’s rank correlation test (Spearman, 1987), using observations of all cultivars. All parameters were tested for normal distribution using a Shapiro–Wilk test (Shapiro and Wilk, 1965), and for each parameter (or trait), differences between culti-vars were determined by analysis of variance (ANOVA). Principal component analysis (PCA) was applied to the cultivar by trait (C×T) matrix of means with standardized data transformation, similar to a genotype by environment (G×E) analysis. Hierarchical cluster-ing was performed using Ward’s minimum variance method (Ward, 1963) with standardized data transformation of the C×T matrix of means and a cut-off of four cluster groups. Differences between clusters were determined with ANOVA and a Siegel–Tukey’s post-hoc rank test (Siegel and Tukey, 1960). Variance and residual vari-ance, determined by restricted maximum-likelihood analysis using a linear mixed model, were used to calculate heritability in the narrow sense (h2) according to Nyquist (1991). All analysis was done using R software (R Core Team, 2012).
Results
The response of photosynthetic rates to increasing CO2 con-centration under light-saturated conditions (A/Ci response curve) was determined for the 64 cultivars of field-grown wheat. Typical A/Ci response curves of four of these wheat
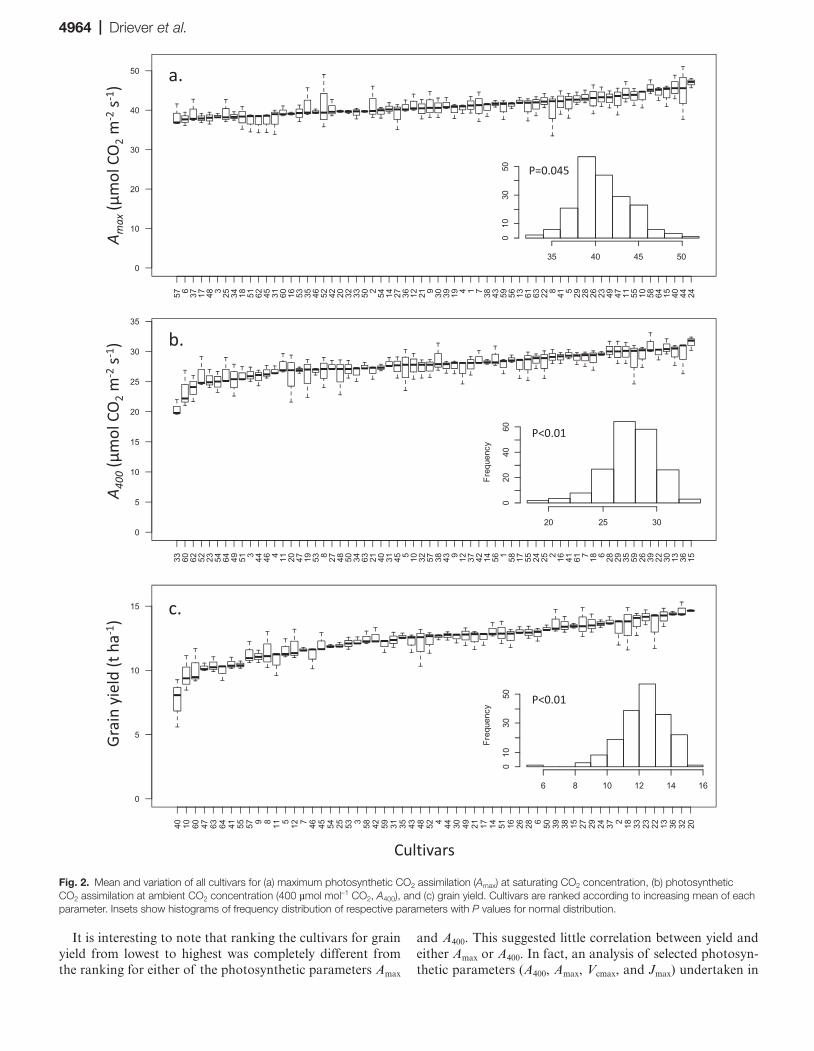
cultivars highlighted the differences in the CO2 saturated rate of photosynthesis (Amax; Fig. 1). Significant differences in Amax illustrated the variation in maximum photosynthetic capacity among cultivars. This variation was significantly greater than the within-cultivar variation, as demonstrated by the tight error bars. The small errors associated with these measurements also demonstrated the robustness of the technique. Cultivar-specific values of Amax (Fig. 2a) showed significant differences, with mean values ranging from 38.4 µmol m–2 s–1 for cultivar 57 (Mercia) to 47.0 µmol m–2 s–1 for cultivar 24 (Mercato). Differences among cultivars were highly significant (P<0.01), and the observations of Amax for the 64 cultivars were normally distributed (P=0.045, inset in Fig. 2a). Similar significant variation was observed in A400 values (P<0.01, Fig. 2b), which were also normally distrib-uted (P<0.01; inset in Fig. 2b), and provided an indication of the highest operational carbon assimilation performed by these plants at current atmospheric (400 µmol mol–1) CO2 concentration, at saturating PPFD. Under these conditions, the lowest mean value of 20.5 µmol m–2 s–1 was found for cul-tivar 33 (Hyperion) and the highest for cultivar 15 (Einstein) with a mean value of 31.5 µmol m–2 s–1. However, although the relative variation of Amax and A400 between the cultivars was similar, the ranking of cultivars based on their means were different between the operational assimilation rates (A400, Fig. 2b) and the maximum assimilation rates (Amax, Fig. 2a), suggesting that operational and maximum rates of photosynthesis were influenced by different factors. A com-parable degree of variation was also found in the grain yield (Fig. 2c) with mean values ranging between 7.6 and 14.7 t ha–1. The values were normally distributed (P<0.01, inset in Fig. 2c) and differences among cultivars were highly signifi-cant (P<0.01).
Fig. 1. Example of variation observed in data of the response of photosynthetic CO2 assimilation (A) to different internal CO2 concentrations (Ci), or A/Ci curve, for four different cultivars. Means of three replicates with standard deviations are shown.
4964 | Driever et al.
It is interesting to note that ranking the cultivars for grain yield from lowest to highest was completely different from the ranking for either of the photosynthetic parameters Amax
and A400. This suggested little correlation between yield and either Amax or A400. In fact, an analysis of selected photosyn-thetic parameters (A400, Amax, Vcmax, and Jmax) undertaken in
Fig. 2. Mean and variation of all cultivars for (a) maximum photosynthetic CO2 assimilation (Amax) at saturating CO2 concentration, (b) photosynthetic CO2 assimilation at ambient CO2 concentration (400 µmol mol–1 CO2, A400), and (c) grain yield. Cultivars are ranked according to increasing mean of each parameter. Insets show histograms of frequency distribution of respective parameters with P values for normal distribution.

Natural variation in photosynthetic capacity, growth | 4965
this study revealed that no significant correlations could be drawn between photosynthetic parameters of the flag leaf determined on a leaf area basis and either biomass or yield (Fig. 3). A complete correlation analysis including all meas-ured parameters showed no significant correlations between photosynthetic parameters and growth or yield-related parameters (Supplementary Fig. S3 available at JXB online).
The maximum rate of carboxylation by Rubisco (Vcmax) and the maximum electron transport demand for RuBP regenera-tion (Jmax) determined from the A/Ci analysis (Fig. 4a, circles) varied between 124–161 and 233–280 μmol m–2 s–1, respec-tively. The lowest Vcmax values were observed in cultivar 62
(Maris Widgeon) and the highest in cultivar 23 (Mendel). For Jmax, the lowest values were observed for cultivar 62 (Maris Widgeon) and highest for cultivar 44 (Galahad). Despite dif-ferences among cultivars in parameters such as Amax, Vcmax and Jmax and the lack of correlation between photosynthetic and measured growth parameters, a strong correlation was nonetheless found between Vcmax and Jmax (rs=0.73, P<0.01) and between Vcmax and Amax (rs=0.68, P<0.01) (Fig. 4a). Carboxylation efficiency calculated from the gradient of the A/Ci curves for Ci values below 300 ppm (mean gradient R2=0.979) also showed a significant correlation with A400 val-ues (rs=0.52, P<0.01) (Fig. 4b).
Fig. 3. Correlations of photosynthetic parameters operational assimilation rate (A400), maximum carboxylation rate (Amax), maximum velocity of Rubisco carboxylation (Vcmax) and the maximum rate of electron transport demand for RuBP regeneration (Jmax) with grain yield and total aboveground biomass. Correlation (rs), significance (P value), and regression line are given for each figure.

4966 | Driever et al.
The natural variation in photosynthesis within the cultivars was further explored using PCA. This uses a multi-dimen-sional dataset and reduces the dimensions into the smallest number of components that account for the most variation. Eleven photosynthetic parameters measured from all 64 culti-vars were included in the PCA, which showed that 81% of the observed variation could be explained by four principal com-ponents (Table 2). Each principal component (PC) accounted for a proportion of the variation and was correlated to differ-ent degrees to the measured parameters. The first PC (PC1) accounted for the majority of the variation (33.6%), while PC4 accounted for the least at around 10.2%. Photosynthetic parameters that correlated with each PC are indicated as a
heat map in Table 2. Briefly, Amax and Jmax correlated most with PC1, gm and Rubisco with PC2, Ci
400 and A400 with PC3, and Rd with PC4.
Based on the PCA and accounting for a large propor-tion of the observed variation, hierarchical clustering was performed, yielding four groups (clusters) with common overall sources of variation, although different sources of variation were expected between clusters (Fig. 5a). Clusters 1 and 2 predominately consisted of modern cul-tivars, while clusters 3 and 4 contained the oldest culti-vars 62 (Maris Widgeon, 1964) and 47 (Cappelle Deprez, 1953), as well as several more recently introduced varieties (Fig. 5b).
Fig. 4. (a) Relationship between the maximum rate of electron transport demand for RuBP regeneration (Jmax) and maximum velocity of Rubisco for carboxylation (Vcmax) and the relationship between maximum photosynthetic CO2 assimilation at saturating CO2 concentration (Amax) and Vcmax. (b) Relationship between the photosynthetic CO2 assimilation at ambient CO2 concentration (A400) and the in vitro carboxylation efficiency of Rubisco.

Natural variation in photosynthetic capacity, growth | 4967
Several significant differences in photosynthetic parameters among clusters were identified. Significant differences for A400 were observed between clusters 2 and 3, while mean values for clusters 1 and 4 did not differ (Fig. 6a). Clusters 2 and 4 had sig-nificantly higher mean values for Amax, Vcmax, and Jmax compared with clusters 1 and 3 (Fig. 6b–d). Rubisco content was signifi-cantly greater in the cultivars of clusters 1 and 2 compared with
clusters 3 and 4 (Fig. 6e). It is noteworthy that the highest Vcmax was found within cluster 4, although this cluster also contained the cultivars with the lowest amount of Rubisco. The opposite situation was found for cluster 1, which contained the cultivars with the lowest Vcmax and with the greatest amount of Rubisco. This indicates a relatively minor contribution of Rubisco com-pared with other traits under the prevailing conditions.
Table 2. Correlations of photosynthetic parameters with each principal component (PC)
Strongest correlations are indicated in red, with weakest correlations as white. Standard deviation, proportion of variance explained, and cumulative proportion of variance explained for each PC are given below. Amax, maximum photosynthetic CO2 assimilation; Jmax, maximum rate of electron transport demand for RuBP regeneration; Vcmax, maximum velocity of Rubisco for carboxylation; Carboxylation efficiency, the in vitro carboxylation efficiency of Rubisco; Rubisco content, Rubisco content of the flag leaf; Vc
Rubisco, velocity of Rubisco for carboxylation in vitro; A400, CO2 assimilation at ambient CO2 concentration (400 µmol mol–1 CO2); Rd, day respiration rate; gm, mesophyll conductance for CO2 diffusion; Ci
400, internal CO2 concentration at ambient CO2 concentration (400 µmol mol–1 CO2); Cimax, internal CO2 concentration at maximum
photosynthetic CO2 assimilation.
PC1 PC2 PC3 PC4
Amax –0.434 0.235 –0.099 0.039
Jmax –0.433 0.201 –0.235 –0.174
Vcmax –0.412 0.255 –0.160 0.082
Carboxylation efficiency –0.403 –0.070 –0.019 0.391
Rubisco content –0.299 –0.380 0.309 –0.355
VcRubisco –0.299 –0.380 0.309 –0.355
A400 –0.245 –0.356 –0.463 0.155
Rd –0.025 0.288 –0.174 –0.664
gm 0.003 –0.484 –0.162 0.129
Ci400 0.137 –0.318 –0.499 –0.231
Cimax 0.184 0.017 –0.445 –0.148
060.1593.1664.1129.1noitaiveddradnatS
Proportion of variance 0.336 0.195 0.177 0.102
Cumulative proportion 0.336 0.531 0.708 0.810

4968 | Driever et al.
Discussion
The products of photosynthesis are the primary determi-nants of plant productivity, and increasing photosynthesis
has been widely recognized as a key trait to increase yields (Long et al., 2006; Zhu et al., 2010; Parry et al., 2011; Raines, 2011). While biomass is a function of the total photosyn-thesis of the canopy over time, the flag leaves have, in the
Fig. 5. (a) Hierarchical clustering of cultivars for photosynthetic parameters, based on Euclidian distances. (b) Histograms of frequency distribution of year of introduction for cultivars per cluster.

Natural variation in photosynthetic capacity, growth | 4969
UK, been identified as the major contributor to grain yield (Thorne, 1973). Our analysis of flag leaf photosynthesis of 64 wheat cultivars revealed large variation in photosyn-thetic parameters as well as in yield and biomass and related traits. This is, to our knowledge, the largest systematic study of photosynthetic gas-exchange and agronomic parameters conducted on field-grown wheat to date. Although natural variation in photosynthetic capacity is known to exist among species (Wullschleger, 1993; Wright et al., 2005; Hikosaka and Shigeno, 2009; Hikosaka, 2010; Lawson et al., 2012) relatively few studies have examined natural variation either within spe-cies (Flood et al., 2011) or in crop species (Pettigrew, 2004; Gilbert et al., 2011; Gu et al., 2014).
In this study, no consistent correlation was found between pre-anthesis flag leaf photosynthetic capacity and either grain yield or biomass when all cultivars were compared. Cultivars with the highest photosynthetic performance did not equate with the highest yields. Previous studies, using a range of different cultivars, have observed relationships between
photosynthesis and yield (Fischer et al., 1981; Blum, 1990; Fischer et al., 1998; Reynolds et al., 2000), while others have not (Chytyk et al., 2011; Sadras et al., 2012) or have refrained from drawing a definitive conclusion (Watanabe et al., 1994). Most previous studies have demonstrated a positive relation-ship between photosynthesis and crop yield when measure-ments of operational or maximum photosynthesis rates were performed on flag leaves, at the time of grain filling under high-light conditions (Blum, 1990; Fischer et al., 1998; Reynolds et al., 2000; Furbank et al., 2013). It is perhaps not surpris-ing that we were unable to directly correlate photosynthetic capacity with yield, given that the measurements presented here were taken under conditions of saturating light, optimal to high CO2 concentrations, and without any stomatal limita-tion. In the field environment, even on days of full sunlight, conditions are rarely optimal and leaves will experience sun and shade flecks across the canopy due to changes in cloud cover, sun angle, self-shading, and shading from neighbouring plants (Way and Pearcy, 2012), and wind-driven movements
Fig. 6. Means and variation for four clusters of (a) operational assimilation rate (A400), (b) maximum velocity of Rubisco carboxylation (Vcmax), (c) maximum velocity of Rubisco carboxylation (Vcmax), (d) the maximum rate of electron transport demand for RuBP regeneration (Jmax), and (e) Leaf Rubisco content. Significant differences are indicated (P<0.05)

4970 | Driever et al.
(Lawson et al., 2010). In this naturally fluctuating environ-ment, stomata and photosynthesis respond continually to changing environmental cues, especially light and tempera-ture and therefore lags in stomatal behaviour can limit pho-tosynthesis through restricted CO2 diffusion (Lawson et al., 1998; Lawson et al., 2010; Lawson & Blatt, 2014). On top of these fluctuations in light, there are alterations in water status and local differences in humidity that will influence stomatal behaviour on short (minutes) and long (daily) timescales. This means that even instantaneous ‘snapshot’ measurements of gas exchange in the field rarely represent the average values achieved by the plant over a longer time period, and almost certainly will not provide a cumulative rate of photosynthesis over the season unless a large number of samples are obtained on different leaves and under all weather conditions covering diurnal and temporal variation within the canopy. Although no correlation could be drawn between photosynthetic capac-ity of the flag leaf and yield, we demonstrated considerable variability in capacity (33%) and growth parameters (includ-ing yield), illustrating the potential to exploit natural variation in existing wheat lines to improve photosynthesis in addition to the traits already selected.
Another interesting finding was that, although there were some large differences in Vcmax among clusters, comparable ranges of Rubisco content were found. For example, compare Vcmax and Rubisco ranges in clusters 1 and 2 and clusters 3 and 4 (see Fig. 6). Carboxylation efficiency of the measured flag leaves cannot be explained by Rubisco content, as the two parameters were only weakly correlated (correlation=0.12). This implies that other factors, for example Rubisco activase activity, determines carboxylation efficiency, as demonstrated by the significant correlation between functional Rubisco con-tent and carboxylation efficiency (correlation= 0.36, P<0.01). This gives rise to the contention that the content of Rubisco, which typically accounts for 50% of soluble leaf protein (Ishimaru et al., 2001), could potentially be reduced to ben-efit investment of nitrogen into other Calvin cycle enzymes and increase photosynthesis in this way, as has been proposed
previously (Zhu et al., 2010; Parry et al., 2011). Increased light-saturated leaf CO2 assimilation rate (Asat) has been observed with a reduction in Rubisco content and a redistribution of nitrogen from Rubisco towards RuBP regeneration in both rice and wheat genotypes grown at elevated CO2 concentra-tion (Makino et al., 1997; Aranjuelo et al., 2013). Similarly, high levels of variation have also been observed in Rubisco content, Amax, stomatal conductance, and total leaf protein content in 10 rice varieties grown under identical conditions, some of which correlated with harvest index (Hubbart et al., 2007). In the current study, however, as indicated in Table 3, the critical period between April and August 2012 was char-acterized by unusually low daytime irradiances (between 11 and 53% lower than the monthly 30-year averages) owing in large part to the uncharacteristically high rainfall (over 79% higher than the 30-year averages in April, June, and July). The extent to which Rubisco is limiting to photosynthesis depends largely on irradiance, being of greatest significance at high irradiances, with diminishing influence at lower irra-diances (Stitt and Schulze, 1994). Owing to the uncharacter-istically low irradiance over the growing season, a significant proportion of the Rubisco is likely to have been function-ally redundant. Comparison of Vcmax predicted from direct measurement of Rubisco (by applying the rate constant for wheat Rubisco of Carmo-Silva et al., 2010) with that derived from our photosynthesis measurements supports this notion, as the values based on the measured Rubisco content (mean Vcmax=163 ± 15 μmol m–2 s–1) were consistently higher than those derived from our photosynthesis measurements (mean Vcmax=141 ± 8 μmol m–2 s–1). It seems likely that, with higher ambient field irradiances, these alternative estimates would converge. Furthermore, canopy cover was larger under these field conditions than is normally found for many cultivars. This is likely to be due to the lower amount of sunshine but abundant rainfall received in the most important part of the growing season, which together facilitated increased canopy cover. This in turn would increase light interception, compen-sating for lower photosynthetic rates per unit leaf area.
Table 3. Monthly averages of sunshine, air temperature and rainfall for the growing season 2012
Deviations from 30-year averages are shown in parentheses.
Month Sunshine Mean temperatures (°C) Rainfall Total
MJ m–2 d–1 Hours (%) Max Min mm (%)
January 2.8 82.2 (+20) 8.5 (+1.8) 2.5 (+1.3) 58.0 (–12)February 5.3 109.3 (+29) 6.4 (–0.1) 0.1 (–0.8) 24.7 (–25)March 10.2 193.5 (+79) 12.8 (+2.9) 3.1 (+0.4) 34.7 (–16)April 12.2 150.1 (–11) 11.5 (–1.1) 3.3 (–0.7) 168.6 (+114)May 15.3 175.6 (–19) 16.1 (+0.1) 7.9 (+1.0) 52.6 (–2)June 15.2 144.9 (–53) 17.6 (–1.5) 10.0 (+0.3) 166.5 (+113)July 15.6 172.3 (–33) 19.8 (–2.0) 11.6 (–0.2) 128.4 (+79)August 14.3 176.5 (–20) 21.7 (+0.2) 12.8 (+0.9) 54.9 (–9)September 11.8 179.6 (+36) 18.3 (+0.0) 8.4 (–1.5) 40.4 (–17)October 5.8 86.0 (–26) 12.7 (–1.4) 6.7 (–0.5) 115.8 (+34)November 3.2 76.9 (+6) 9.4 (–0.3) 3.6 (–0.2) 100.4 (+24)December 2.1 68.2 (+14) 7.5 (+0.6) 1.4 (–0.2) 114.2 (+45)

Natural variation in photosynthetic capacity, growth | 4971
There are arguments that natural selection has already maximized photosynthesis and that further manipulation of photosynthesis would not lead to further gains. However, as highlighted by Leister (2012), natural selection has not selected for agronomic yield but has maximized plant fitness for survival in an environment vastly different to our ‘resource- rich’ arable fields. Figures 5 and 6 of this study also illustrate that previous breeding strategies may have unintentionally selected for traits other than those associated with photosynthesis. From the cluster analysis, we can see that the clusters that contained the highest Vcmax values (Fig. 6c, cluster 4) contained some of the oldest varieties (Fig. 5d), while low values of Amax, Vcmax, and Jmax (Fig. 6, clusters 1 and 3) were made up of mainly modern varieties (Fig. 5, cluster 1) and a broad range of recent and early introduced cultivars (Fig. 5, cluster 3). The cluster analy-sis strongly suggests that selective breeding programmes have unintentionally selected for cultivars with low capacities. The aim of this study was to quantify the degree of natural varia-tion in existing wheat cultivars with the expectation that such information could be incorporated into future breeding pro-grammes to aid in the selection of traits associated with pho-tosynthetic capacity and performance. The question remains as to how the observed natural variation in photosynthetic capacity could be exploited to improve photosynthetic perfor-mance and yield. Conventional breeding approaches could be applied for selection of, for example, higher Jmax, but the herit-ability for this particular trait in the current study was not very high (h2=0.32). However, large-scale phenotyping approaches for photosynthetic traits, such as used in the current study, are the first step towards the genetic dissection of these traits. It is widely accepted that phenotyping to discover dependable lev-els of expression for traits and associated genetic markers can facilitate their use in breeding (Reynolds et al., 2009, 2012b; Rebetzke et al., 2013). Marker-assisted selection for these and other photosynthetic traits should be possible, as the wheat genome has been sequenced and gene families associated with crop productivity are being identified (Brenchley et al., 2012). Moreover, varietal single-nucleotide polymorphisms are now available for over half of the 64 cultivars used in this study and are freely accessible (Wilkinson et al., 2012). This information will assist the breeding for improved photosynthetic perfor-mance in wheat. Although such improvements may be difficult to achieve through conventional breeding, genetic manipula-tion of RuBP regeneration capacity has been accomplished in tobacco by increasing the levels of sedoheptulose-1,7-bi-phospatase (SBPase), which has been shown to increase Jmax, photosynthetic performance, and increased plant growth and yield (Lefebvre et al., 2005). These tobacco lines demonstrated that modest differences in the CO2 dependence of photosyn-thesis (which were considerably smaller than the differences highlighted in the A/Ci responses of Fig. 2) can translate into very significant differences in growth over the lifetime of the plant. Mathematical modelling and numerical simulations have been used to identify several enzymes, including SBPase, as being potentially limiting to photosynthesis (Poolman et al., 2000; Zhu et al., 2007).
Whether achieved through the selection of naturally occur-ring photosynthetic genetic markers or by means of genetic
manipulation, the extent to which improved photosynthetic potential impacts on yield will depend upon prevailing abiotic and biotic environmental conditions, together with the genetic background of the cultivars in question (which will influence the ability to thrive in suboptimal environments, including variations/extremes of temperature, water, sunlight, nutrient availability, herbivory, and/or fungal pathogens). Yield is an important criterion in the selection of all commercial wheat cul-tivars, although other performance-related characteristics have also been represented, to differing extents, in the chosen geno-types. Apart from major genes that control photoperiod sensi-tivity (Ppd) and height (Rht) and are directly related to yield, several resistance genes were present among the chosen cultivars. Of the leaf rust resistance genes, Lr37 is found in 18 recent cul-tivars (earliest year of introduction 1997) and Pch1 is found in only five modern cultivars (earliest year of introduction 2005). In the former group, half of the cultivars were assigned to cluster 1, and of the latter group, cultivars were only present in clusters 1 and 2. These clusters showed a generally lower photosynthetic performance. Although these resistance genes clearly have an advantage in the protection against pathogens, they may not benefit the photosynthetic performance of the plant.
However, as the example of SBPase overexpression (above) illustrates, when discrete, appropriate and specific genetic changes are made to plants growing under similar conditions, very clear yield benefits can accrue. As highlighted by Lawson et al. (2012), potential maximum photosynthetic capacity is rarely achieved in the field even under favourable conditions. Such observations can be explained by stomatal limitation due to limited water availability and to a lag in stomatal behaviour relative to changes in photosynthesis under fluctuating environ-mental (mostly PPFD) conditions. Additionally, factors such as defence against biotic and abiotic stress and nitrogen availability and distribution may play a role, for example if the expression of resistance genes were to impact negatively on photosynthetic performance. To assess these limitations in terms of potential versus operational photosynthetic capacity, further measure-ments under field and controlled conditions are necessary.
Using a simulation analysis, Gu et al. (2014) determined the contribution of natural variation in photosynthetic rate (A) to productivity in rice. Genetic variation (25%) in both Rubisco-limited and electron transport-limited photosyn-thesis increased rice yields by 22–29% across different loca-tions and years. This illustrates that rice production could be significantly improved by exploiting existing variation in germplasm (Gu et al., 2014). Variation in photosynthetic capacity and stomatal conductance in soybean genotypes has also been reported (Gilbert et al., 2011), which resulted in differences in intrinsic water-use efficiency, leading to the suggestions that a breeding strategy could be employed to produce ‘water-saving soybeans with high photosynthetic capacities’, that would ultimately benefit crop yields. These studies and others illustrate the potential of exploiting natu-ral variation in photosynthesis as an approach to increasing crop yield, and similar increases in crop yield are expected for wheat.
The current study is, to our knowledge, the largest study of photosynthetic gas-exchange and growth parameters for

4972 | Driever et al.
wheat to date, and demonstrates significant natural variation in photosynthetic capacity, growth, and yield between exist-ing wheat cultivars, providing an invaluable resource for the improvement of photosynthetic capacity and yield in wheat.
Supplementary data
Supplementary data are available at JXB online.Supplementary Fig. S1. Frequency distribution (histo-
gram) of cultivars for years of introduction as used in the current study.
Supplementary Fig. S2. Development of cultivars over time (Zadoks scale).
Supplementary Fig. S3. Meta-analysis of all cultivars for relationships between measured parameters with correlation and significance, frequency distribution per parameter and regression plots.
Supplementary Table S1. Daily mean light levels during the period of photosynthetic measurements.
AcknowledgementsThis work was financially supported by the BBSRC grant ‘Manipulation of photosynthetic carbon metabolism in wheat to improve yield’ (BB/I017372/1) which is part of the Crop Improvement Research Club. PJA and MAJP are also supported by the BBSRC 20:20 Wheat Institute Strategic Program (BBSRC BB/J/00426X/1 20:20 Wheat) and BBSRC BB/I002545/. We would like to thank Dr Steven Yates for help with the statistical analysis and Mr Remi Delassus for able assistance in data acquisition and processing.
ReferencesAinsworth EA, Long SP. 2005. What have we learned from 15 years of free-air CO2 enrichment (FACE)? A meta-analytic review of the responses of photosynthesis, canopy. New Phytologist 165, 351–371.
Aranjuelo I, Sanz-Saez A, Jauregui I, Irigoyen JJ, Araus JL, Sanchez-Diaz M, Erice G. 2013. Harvest index, a parameter conditioning responsiveness of wheat plants to elevated CO2. Journal of Experimental Botany 64, 1879–1892.
Blum A. 1990. Variation among wheat cultivars in the response of leaf gas-exchange to light. Journal of Agricultural Science 115, 305–311.
Bradford MM. 1976. A rapid and sensitive method for the quantitation of microgram quantities of protein utilizing the principle of protein-dye binding. Analytical Biochemistry 72, 248–254.
Braun HJ, Atlin G, Payne T. 2010. Multi-location testing as a tool to identify plant response to global climate change. In: Reynolds MP, ed. Climate change and crop production. Surrey, UK: CABI Climate Change Series, 115–138.
Brenchley R, Spannagl M, Pfeifer M, et al. 2012. Analysis of the breadwheat genome using whole-genome shotgun sequencing. Nature 491, 705–710.
Brisson N, Gate P, Gouache D, Charmet G, Oury FX, Huard F. 2010. Why are wheat yields stagnating in Europe? A comprehensive data analysis for France. Field Crops Research 119, 201–212.
Carmo-Silva AE, Keys AJ, Andralojc PJ, Powers SJ, Arrabaca MC, Parry MAJ. 2010. Rubisco activities, properties, and regulation in three different C-4 grasses under drought. Journal of Experimental Botany 61, 2355–2366.
Chytyk CJ, Hucl PJ, Gray GR. 2011. Leaf photosynthetic properties and biomass accumulation of selected western Canadian spring wheat cultivars. Canadian Journal of Plant Science 91, 305–314.
Clarke S, Sylvester-Bradley R, Foulkes J, Ginsburg D, Gaju O, Werner P, Jack P, Flatman E, Smith-Reeve L. 2012. Adapting wheat to global warming or ‘ERYCC’—earliness and resilience for yield in a
changing climate. HGCA Project Report 496. http://www.hgca.com/publications/2012/july/18/adapting-wheat-to-global-warming-(erycc).aspx.
Dixon J, Braun HJ, Kosina P, Crouch J. 2009. Wheat facts and futures 2009. Mexico: CIMMYT.
Fischer RA, Bidinger F, Syme JR, Wall PC. 1981. Leaf photosynthesis, leaf permeability, crop growth, and yield of short spring wheat genotypes under irrigation. Crop Science 21, 367–373.
Fischer RA, Rees D, Sayre KD, Lu ZM, Condon AG, Saavedra AL. 1998. Wheat yield progress associated with higher stomatal conductance and photosynthetic rate, and cooler canopies. Crop Science 38, 1467–1475.
Flood PJ, Harbinson J, Aarts MGM. 2011. Natural genetic variation in plant photosynthesis. Trends in Plant Science 16, 327–335.
Foulkes MJ, Slafer GA, Davies WJ, Berry PM, Sylvester-Bradley R, Martre P, Calderini DF, Griffiths S, Reynolds MP. 2011. Raising yield potential of wheat. III. Optimizing partitioning to grain while maintaining lodging resistance. Journal of Experimental Botany 62, 469–486.
Furbank R, Castañeda C, Condon T, et al. 2013. Phenotypic selection for photosynthetic capacity and efficiency. In: Reynolds M, Braun HJ, eds. 3rd International Symposium of the Wheat yield Consortium , 5–9.
Gilbert ME, Zwieniecki MA, Holbrook NM. 2011. Independent variation in photosynthetic capacity and stomatal conductance leads to differences in intrinsic water use efficiency in 11 soybean genotypes before and during mild drought. Journal of Experimental Botany 62, 2875–2887.
Gu J, Yin X, Stomph T-J, Struik PC. 2014. Can exploiting natural genetic variation in leaf photosynthesis contribute to increasing rice productivity? A simulation analysis. Plant, Cell & Environment 37, 22–34.
Hawkesford MJ, Araus J-L, Park R, Calderini D, Miralles D, Shen T, Zhang J, Parry MAJ. 2013. Prospects of doubling global wheat yields. Food and Energy Security 2, 34–48.
Hikosaka K. 2010. Mechanisms underlying interspecific variation in photosynthetic capacity across wild plant species. Plant Biotechnology 27, 223–229.
Hikosaka K, Shigeno A. 2009. The role of Rubisco and cell walls in the interspecific variation in photosynthetic capacity. Oecologia 160, 443–451.
Hubbart S, Peng S, Horton P, Chen Y, Murchie EH. 2007. Trends in leaf photosynthesis in historical rice varieties developed in the Philippines since 1966. Journal of Experimental Botany 58, 3429–3438.
Ishimaru K, Kobayashi N, Ono K, Yano M, Ohsugi R. 2001. Are contents of Rubisco, soluble protein and nitrogen in flag leaves of rice controlled by the same genetics? Journal of Experimental Botany 52, 1827–1833.
Kruger EL, Volin JC. 2006. Reexamining the empirical relation between plant growth and leaf photosynthesis. Functional Plant Biology 33, 421–429.
Lawson T, Blatt M. 2014. Stomatal size, speed and responsiveness impact on photosynthesis and water use efficiency. Plant Physiology 164, 1556–1570.
Lawson T, Kramer DM, Raines CA. 2012. Improving yield by exploiting mechanisms underlying natural variation of photosynthesis. Current Opinion in Biotechnology 23, 215–220.
Lawson T, von Caemmerer S, Baroli I. 2010. Photosynthesis and stomatal behaviour. In: Luttge U, Beyschlag W, Budel B, Francis D, eds. Progress in Botany , Vol. 72. Heidelberg: Springer, 265–304.
Lawson T, Weyers J, A. Brook R. 1998. The nature of heterogeneity in the stomatal behaviour of Phaseolus vulgaris L. primary leaves. Journal of Experimental Botany 49, 1387–1395.
Lefebvre S, Lawson T, Zakhleniuk OV, Lloyd JC, Raines CA, Fryer M. 2005. Increased sedoheptulose-1,7-bisphosphatase activity in transgenic tobacco plants stimulates photosynthesis and growth from an early stage in development. Plant Physiology 138, 451–460.
Leister D. 2012. How can the light reactions of photosynthesis be improved in plants? Frontiers in Plant Science 3, 199.
Long SP, Zhu XG, Naidu SL, Ort DR. 2006. Can improvement in photosynthesis increase crop yields? Plant, Cell & Environment 29, 315–330.

Natural variation in photosynthetic capacity, growth | 4973
Makino A, Shimada T, Takumi S, et al. 1997. Does decrease in ribulose-1,5-bisphosphate carboxylase by antisense RbcS lead to a higher N-use efficiency of photosynthesis under conditions of saturating CO2 and light in rice plants? Plant Physiology 114, 483–491.Nyquist WE. 1991. Estimation of heritability and prediction of selection response in plant populations. Critical Reviews in Plant Sciences 10, 235–322.Parry MAJ, Reynolds M, Salvucci ME, Raines C, Andralojc PJ, Zhu XG, Price GD, Condon AG, Furbank RT. 2011. Raising yield potential of wheat. II. Increasing photosynthetic capacity and efficiency. Journal of Experimental Botany 62, 453–467.Pettigrew WT. 2004. Cotton genotypic variation in the photosynthetic response to irradiance. Photosynthetica 42, 567–571.Poolman MG, Fell DA, Thomas S. 2000. Modelling photosynthesis and its control. Journal of Experimental Botany 51, 319–328.R Core Team. 2012. R: a language and environment for statistical computing. Vienna, Austria: R Foundation for Statistical Computing. http://www.R-project.org/.Raines CA. 2011. Increasing photosynthetic carbon assimilation in C3 plants to improve crop yield: current and future strategies. Plant Physiology 155, 36–42.Rebetzke GJ, Rattey AR, Farquhar GD, Richards RA, Condon AG. 2013. Genomic regions for canopy temperature and their genetic association with stomatal conductance and grain yield in wheat. Functional Plant Biology 40, 14–33.Reynolds M, Foulkes J, Furbank R, Griffiths S, King J, Murchie E, Parry M, Slafer G. 2012a. Achieving yield gains in wheat. Plant, Cell & Environment 35, 1799–1823.Reynolds M, Manes Y, Izanloo A, Langridge P. 2009. Phenotyping approaches for physiological breeding and gene discovery in wheat. Annals of Applied Biology 155, 309–320.Reynolds M, Pask A, DM. M. 2012b. Physiological breeding I: interdisciplinary approaches to improve crop adaptation. Mexico: CIMMYT.Reynolds MP, Delgado MI, Gutierrez-Rodriguez M, Larque-Saavedra A. 2000. Photosynthesis of wheat in a warm, irrigated environment—I: genetic diversity and crop productivity. Field Crops Research 66, 37–50.Rosegrant MW, Agcaoili M. 2010. Global food demand, supply, and price prospects to 2010. Washington, DC: International Food Policy Research Institute.Sadras VO, Lawson C, Montoro A. 2012. Photosynthetic traits in Australian wheat varieties released between 1958 and 2007. Field Crops Research 134, 19–29.
Shapiro SS, Wilk MB. 1965. An analysis of variance test for normality (complete samples). Biometrika 52, 591–611.
Sharkey TD, Bernacchi CJ, Farquhar GD, Singsaas EL. 2007. Fitting photosynthetic carbon dioxide response curves for C-3 leaves. Plant, Cell & Environment 30, 1035–1040.
Siegel S, Tukey JW. 1960. A nonparametric sum of ranks procedure for relative spread in unpaired samples. Journal of the American Statistical Association 55, 429–445.
Spearman C. 1987. The proof and measurement of association between two things. American Journal of Psychology 100, 441–471.
Stitt M, Schulze D. 1994. Does Rubisco control the rate of photosynthesis and plant growth—an exercise in molecular ecophysiology. Plant, Cell & Environment 17, 465–487.
Thorne NG. 1973. Physiology of grain yield of wheat and barley. Rothamsted Experimental Station Report for 1973 , Vol. 2. Harpenden, UK: Rothamsted Experimental Station.
Ward JH. 1963. Hierarchical grouping to optimize an objective function. Journal of the American Statistical Association 58, 236–244.
Watanabe N, Evans JR, Chow WS. 1994. Changes in the photosynthetic properties of Australian wheat cultivars over the last century. Australian Journal of Plant Physiology 21, 169–183.
Way DA, Pearcy RW. 2012. Sunflecks in trees and forests: from photosynthetic physiology to global change biology. Tree Physiology 32, 1066–1081.
Wilkinson P, Winfield M, Barker G, Allen A, Burridge A, Coghill J, Edwards K. 2012. CerealsDB 2.0: an integrated resource for plant breeders and scientists. BMC Bioinformatics 13, 219.
Wright IJ, Reich PB, Cornelissen JHC, et al. 2005. Assessing the generality of global leaf trait relationships. New Phytologist 166, 485–496.
Wullschleger SD. 1993. Biochemical limitations to carbon assimilation in C3 plants—a retrospective analysis of the A/Ci curves from 109 species. Journal of Experimental Botany 44, 907–920.
Xue QW, Soundararajan M, Weiss A, Arkebauer TJ, Baenziger PS. 2002. Genotypic variation of gas exchange parameters and carbon isotope discrimination in winter wheat. Journal of Plant Physiology 159, 891–898.
Yokota A, Canvin D. 1985. Ribulose bisphosphate carboxylase/oxygenase content determined with [14C]carboxypentitol bisphosphate in plants and algae. Plant Physiology 77, 735–739.
Zhu XG, de Sturler E, Long SP. 2007. Optimizing the distribution of resources between enzymes of carbon metabolism can dramatically increase photosynthetic rate: a numerical simulation using an evolutionary algorithm. Plant Physiology 145, 513–526.
Zhu XG, Long SP, Ort DR. 2010. Improving photosynthetic efficiency for greater yield. Annual Review of Plant Biology 61, 235–261.