Unclassified CCNM/DEELSA(98)64 - OECD
74
Unclassified CCNM/DEELSA(98)64 Organisation de Coopération et de Développement Economiques OLIS : 15-Dec-1998 Organisation for Economic Co-operation and Development Dist. : 17-Dec-1998 __________________________________________________________________________________________ English text only CENTRE FOR CO-OPERATION WITH NON-MEMBERS DIRECTORATE FOR EDUCATION, EMPLOYMENT, LABOUR AND SOCIAL AFFAIRS LABOUR MARKET AND SOCIAL POLICY IN BULGARIA Seminar held in Sofia on 5 March 1998 72903 Document complet disponible sur OLIS dans son format d’origine Complete document available on OLIS in its original format Unclassified CCNM/DEELSA(98)64 English text only
-
Upload
khangminh22 -
Category
Documents
-
view
3 -
download
0
Transcript of Unclassified CCNM/DEELSA(98)64 - OECD

Unclassified CCNM/DEELSA(98)64
Organisation de Coopération et de Développement Economiques OLIS : 15-Dec-1998Organisation for Economic Co-operation and Development Dist. : 17-Dec-1998__________________________________________________________________________________________
English text onlyCENTRE FOR CO-OPERATION WITH NON-MEMBERSDIRECTORATE FOR EDUCATION, EMPLOYMENT, LABOUR AND SOCIAL AFFAIRS
LABOUR MARKET AND SOCIAL POLICY IN BULGARIA
Seminar held in Sofia on 5 March 1998
72903
Document complet disponible sur OLIS dans son format d’origine
Complete document available on OLIS in its original format
Unclassified
CC
NM
/DE
EL
SA(98)64
English text only

CCNM/DEELSA(98)64
2
FOREWORD
The costs of resistance to reform in Bulgaria have been prolonged and painful. GDP declinedsubstantially in the initial years of the transformation from a command to a market economy -- a commonphenomenon during the early stages of transition, but one that was more pronounced in Bulgaria thanelsewhere. After a short and fragile burst of growth in 1994 and 1995, in late 1996 the Bulgarianeconomy relapsed into deep recession, hyper-inflation re-emerged, and the currency collapsed. The crisispersisted through 1997 and precipitated a radical change in the country’s approach to reform -- and animproved prognosis for economic and political stability.
Although this report was drafted prior to the implementation of emergency measures to helpstabilise the Bulgarian economy, the discussion of labour market and social policy issues in this reportremains valid. These stabilisation measures resulted in a modest improvement in economic performanceby the first two quarters of 1998, but the level of most economic indicators remained below those of theperiod that preceded the crisis. Moreover, major structural reforms have yet to be implemented.
Nor are the hardships faced by individuals and households likely to be eliminated rapidly. Thefall in employment, real wages, the erosion in the value of the public benefits, and the growth in the sizeof the population in severe poverty have been substantial, and more job losses are likely as enterpriserestructuring accelerates. Moreover, economic stabilisation measures compel the government to adhere toa very tight fiscal envelope, with limited flexibility to respond to social needs.
This report reviews the macroeconomic context in Bulgaria since the early years of the transitionprocess, documents the situation in labour market, and the efficacy and costs of the system of socialprotection. It examines possible policy and administrative changes which could improve the resultsobtained -- without significant increases in expenditure.
The report is part of the programme of assistance which the OECD has been providing toeconomies in transition since 1990. This programme is managed by the Centre for Co-operation withNon-Members, in collaboration with the various bodies of the Organisation, including the Directorate forEducation, Employment, Labour and Social Affairs which was responsible for this project. The reportwas discussed with the Bulgarian authorities in March 1998 at a meeting of the Employment, Labour andSocial Affairs Committee in Sophia.
Elizabeth Duskin was the main contributor to this report, in collaboration with Nils Bjorkstenand Stojan Zavisic. Hartmut Lehmann and Tito Boeri contributed to the report as Consultants; the expertassistance of Georgi Shopov, Jordan Hristoskov, Theodora Noncheva, and Stephan Ivanov is gratefullyacknowledged.
This report is published on the responsibility of the Secretary-General of the OECD.

CCNM/DEELSA(98)64
3
TABLE OF CONTENTS
FOREWORD.................................................................................................................................................. 1
SUMMARY AND CONCLUSIONS............................................................................................................. 6
The labour market ....................................................................................................................................... 6Passive labour market policies ................................................................................................................ 6Active labour market policies ................................................................................................................. 7
The social protection system ...................................................................................................................... 7Pensions................................................................................................................................................... 8Sickness benefits ..................................................................................................................................... 8Family benefits........................................................................................................................................ 8
Social assistance ......................................................................................................................................... 9
CHAPTER 1................................................................................................................................................. 10
THE MACROECONOMIC CONTEXT...................................................................................................... 10
Introduction............................................................................................................................................... 10Recurrent crisis ......................................................................................................................................... 12Fiscal policy and the budget envelope ...................................................................................................... 13Structural reform....................................................................................................................................... 16
Domestic priorities ................................................................................................................................ 16External policies.................................................................................................................................... 17
Labour market and social policies ............................................................................................................ 17
CHAPTER 2................................................................................................................................................. 20
LABOUR MARKET TURBULENCE......................................................................................................... 20
Employment and unemployment .............................................................................................................. 20Labour shedding.................................................................................................................................... 20
The composition of employment change.................................................................................................. 22Wages, productivity, and unit labour costs............................................................................................... 24
Unemployment and labour market flows .............................................................................................. 26Long-term unemployment..................................................................................................................... 29Regional differences.............................................................................................................................. 31
Labour market policies ............................................................................................................................. 31Passive policies ..................................................................................................................................... 32Active policies....................................................................................................................................... 33
CHAPTER 3................................................................................................................................................. 35
THE SOCIAL PROTECTION SYSTEM .................................................................................................... 35
Household income .................................................................................................................................... 35Social expenditure, revenue collections, and contribution rates .............................................................. 37Overview of the benefit system ................................................................................................................ 39
Pensions................................................................................................................................................. 40Retirement age and early retirement ................................................................................................. 42Years of service ................................................................................................................................. 43Determination of benefit amounts ..................................................................................................... 44

CCNM/DEELSA(98)64
4
Pension indexing................................................................................................................................ 45Unemployment benefits ........................................................................................................................ 45Sickness benefits ................................................................................................................................... 46Family benefits...................................................................................................................................... 47
Maternity and parental leave, and birth grants .................................................................................. 47Child allowances................................................................................................................................ 48
How generous are benefit levels? ............................................................................................................. 49Social expenditures, benefit generosity, and financing revisited ............................................................. 52
CHAPTER 4................................................................................................................................................. 54
SOCIAL ASSISTANCE: LOCAL PROVISIONS AND RESPONSIBILITIES........................................ 54
The growth of poverty .............................................................................................................................. 55The composition of poverty ...................................................................................................................... 56The evolution of social assistance ............................................................................................................ 56Local expenditure on social assistance ..................................................................................................... 58Assessment of benefit regimes ................................................................................................................. 60
Benefit levels versus the financial returns to work ............................................................................... 60Targeting benefits.................................................................................................................................. 64
Financing responsibility for local social expenditure ............................................................................... 65
ANNEX 1 ..................................................................................................................................................... 71
Table A.1. Institutional description of main social protection programmes in Bulgaria 1997 ............... 71
LIST OF CHARTS AND TABLES
CHAPTER 1Tables
Table 1.1 Main economic indicators, 1993-98............................................................................................ 10Table 1.2 Selected social expenditures in Bulgaria as a per cent of GDP compared with CEE countries,circa 1996 ..................................................................................................................................................... 11
Charts
Chart 1.1 GDP growth in Bulgaria and in selected CEE countries, 1990-97 ............................................. 12Chart 1.2 Consolidated budget revenue and expenditure structure, 1996................................................... 14Chart 1.3 Consolidated budget revenue and expenditure structure, 1992-96 ............................................. 15Chart 1.4 Share of population aged 60 years and over, 1970-2050 ............................................................ 19
CHAPTER 2
Tables
Table 2.1 Labour shedding in Bulgaria, 1990-97........................................................................................ 21Table 2.2 Trends in employment, unemployment, and labour force participation, 1989-1996.................. 22Table 2.3 Employment by sector, 1989-1995 ............................................................................................. 23Table 2.4 Wages, productivity and unit labour costs, 1996 ........................................................................ 25Table 2.5 Labour market transition probabilities, by sex, age, and education ............................................ 28Table 2.6 Characteristics of the unemployed, 1996 .................................................................................... 30

CCNM/DEELSA(98)64
5
Charts
Chart 2.1a Changes in the employment structure in Bulgaria, 1990-95: employment by sector .............. 24Chart 2.1b Changes in the employment structure in Bulgaria, 1990-95: public and private sectoremployment .................................................................................................................................................. 24Chart 2.2 Real wages and the consumer price index, 1991-97 ................................................................... 26Chart 2.3 Unemployment inflows and the unemployment rate, 1992-97 ................................................... 27Chart 2.4 Long-term unemployment by duration, 1993-96 ........................................................................ 30
CHAPTER 3
Tables
Table 3.1 Household monthly income, earnings and cash benefits, 1991-97............................................. 36Table 3.2 Social expenditures in Bulgaria as a per cent of GDP, 1991-96................................................. 37Table 3.3 Real social expenditures in Bulgaria, 1991-96 ........................................................................... 38Table 3.4 Public pension dependency ratios in Bulgaria, 1989-1996......................................................... 38Table 3.5 Social security contribution rates in Bulgaria and in selected OECD countries, circa 1995 ...... 39Table 3.6 Old-age pension rules in brief, 1996 ........................................................................................... 42Table 3.7 Standard age of retirement in Bulgaria and in selected countries, by sex, 1997 ........................ 43Table 3.8 The distribution of pensioners, by monthly pension amounts, 1994, 1996, 1997 ...................... 51Table 3.9 Simulated benefit replacement rates in Bulgaria, relative to the purchasing power of averagewages in selected other countries, 1994 ....................................................................................................... 52
Charts
Chart 3.1 Distribution of child allowances by household income, 1995 .................................................. ..50Chart 3.2 Comparative social expenditures, benefit generosity, and financing in Bulgariaand selected other countries, 1993 ............................................................................................................... 53
CHAPTER 4
Tables
Table 4.1 Minimum incomes as a per cent of the “existence minimum” in Bulgaria 1992-97.................. 59Table 4.2 Local social assistance expenditure, 1991-1996 ......................................................................... 60Table 4.3 Potential net monthly household income, by household type andand income source, October 1997 ................................................................................................................ 62Table 4.4 Net benefit replacement rate by household type and income source, October 1997 .................. 63Table 4.5 Distribution of municipalities by size of transfers and of own revenues per capita, 1996 ........ 68
Chart
Chart 4.1 Trends in real monthly income measures, 1991-97 .................................................................... 65

CCNM/DEELSA(98)64
6
SUMMARY AND CONCLUSIONS
The transition to a market economy in Bulgaria has been unusually slow and extremely arduous.After a 25 per cent fall in GDP between 1989 and 1993, the moderate but fragile economic growth in 1994and 1995 ended abruptly in late 1996 with a severe economic crisis and further declines in output. Sincethe beginning of the transition, real GDP declined by nearly 30 per cent -- a situation which is worse thanin most other Central European transition economies. The outlook for the Bulgarian economy appearsincreasingly positive, but the challenges to be overcome in 1998 remain as formidable as those that werefaced in 1997.
The labour market
Bulgaria has experienced deep and prolonged labour market difficulties. Employment fell bynearly one-third by 1995, a steeper and more rapid decline than in most other transition economies. Theaggressive shedding of labour in the early years of the transition, however, does not mean that Bulgariaengaged in more rapid restructuring than did other transition economies. Instead, employment losses werelargely related to the collapse in demand, and to the lack of competitiveness of Bulgarian enterprises withthe advent of trade liberalisation.
Much of the labour released in 1991 flowed into inactivity rather than into higher measuredunemployment. While this has softened the impact on unemployment, it has shifted some of the burden topensions and other income transfers. Unemployment nevertheless remains a central problem forBulgarian policy makers. The rate of registered unemployment jumped to more than 16 per cent by theend of June 1997 -- close to the peak rate reached in 1993. Nearly two-thirds of the unemployed hadspells exceeding one year by 1996.
Since 1993, labour shedding in industry also has been accompanied by very substantial falls inreal wages. Both the downsizing of the industrial sector and the decreases in real wages have contributedto a deep fall of national income giving the government little room for manoeuvre in the area of labourmarket policies.
Passive labour market policies
Both “active” and “passive” labour market programmes have played a relatively modest role.Total spending in 1996 was only 0.5 per cent of GDP, of which less than 0.2 per cent was spent for activemeasures.
Declining numbers of the registered unemployed receive cash unemployment benefits each year-- only one-third by 1994. This is largely because of the spread of long-term unemployment, and theexhaustion of benefit eligibility. The average duration of benefits also is relatively low: 25 years ofrecorded service are required to receive benefits for a full 12 months. The minimum duration of benefitswas six months until January 1998, when it was reduced to four months for workers with three or feweryears of work; voluntary quits; and the unemployed who have had a previous unemployment spell within

CCNM/DEELSA(98)64
7
the past three years. The restriction on the latter group may be an attempt to limit the effects of “financialchurning”, that is, the shifting of responsibility by municipalities from locally-financed social assistanceto benefits financed from the extra-budgetary Unemployment Fund for the unemployed who becomerequalified through public works activities. This problem reflects the difficulties in the allocation offinancing responsibilities among levels of government, and cannot be resolved by changes in theunemployment benefit system alone.
A special long-term unemployment assistance programme was implemented in 1995. Itprovided up to 6 months of flat-rate means-tested assistance in the amount of 60 per cent of the minimumwage, financed by the Unemployment Fund. Eligibility required a worker be registered as unemployedfor twelve months and household income be below the social assistance eligibility threshold. Iteffectively duplicated the function of social assistance provided and paid for by municipalities, and waseliminated in April of 1997. In its place, workers who remained unemployed six months after they haveexhausted benefits now were eligible for a benefit in the same amount, but without a means-test. Theduration of eligibility was reduced to three months in August 1997. In effect, the unemployment benefitperiod was selectively extended by three months at a reduced flat-rate amount. It is of advantage only tothose households which are not eligible for social assistance, and it adds unnecessary complications andcosts to the benefit system.
In response to the economic crisis of 1996/97, and the planned speed up of enterpriserestructuring, a temporary income support scheme was implemented until the end of 1997 to make iteasier for workers to accept collective lay-offs. Workers made redundant because of a mass layoff couldchoose between standard unemployment benefits or a lump-sum severance payment. If the lump sum waschosen, a waiting period of 18 months was required before an unemployed worker could claimunemployment benefits. But not everyone will find a job quickly, and the waiting period of 18 months forunemployment benefit eligibility many be too severe for the long-term unemployed.
Active labour market policies
Despite limited resources, a broad array of active labour market policies exists in Bulgaria,including most programmes in place in OECD countries. The largest programmes concern retraining andtemporary job creation. Evaluation of active measures in OECD countries suggests that not all measureswork equally well, but it is generally believed that counselling and job search assistance are effective formost groups; the effects of training programmes are less certain. Moreover, the ability of active measuresto help very large numbers of the unemployed is limited. Therefore particular care in targeting is neededto avoid wasting the limited resources available for active measures. The scale and severity of the labourmarket problems in Bulgaria suggest that the potential success of active labour market policies maydepend in large part on improved labour market performance more generally.
The social protection system
The social insurance system is comprehensive -- and expensive relative to what Bulgaria cancurrently afford, despite the severe erosion of real benefits across programmes. Contribution rates aredisturbingly high; in part, the erosion of the tax base and tax compliance problems are at fault. But this issymptomatic of even larger difficulties encountered in the transition to a market economy in Bulgaria.Eventual achievement of a sustainable growth path obviously will help to alleviate many problems, but thetransition process and the well-being of individuals and families in the interim could be helped byimprovements in the system of social protection. Solutions, however, should not be for expedience alone;they must be consistent with longer term interests as well.

CCNM/DEELSA(98)64
8
Benefits are not unusually high relative to OECD experience; in an absolute sense, they are low.Therefore, caution is needed in the way expenditures are restrained. A general problem is that access tobenefits, particularly pensions, is too easy. The cost of easy access is low benefits. Moreover, the benefitsystem is complex, difficult to administer, and, at times, unfair. Simplification is needed to avoidduplication and high administrative costs, and to enhance the public’s understanding and perception offairness.
Pensions
Under the pension system as currently structured, there are numerous ways to limit eligibilityand increase fairness: by raising the standard age of entitlement to full benefits to a uniform age foreveryone; eliminating categorical eligibility to early retirement without reduced benefits, but permittingeveryone limited earlier retirement with actuarial reductions in benefits; and increasing the years ofservice for a full pension to a uniform requirement. Consideration should be given to shifting financingresponsibility for earlier retirement for special occupational categories to employers. Benefits should beindexed, but should reflect the capacity of the economy to pay for benefit increases by the use ofmovements in total wages rather than average wages. What should be of less concern is the dispersion ofbenefits. Changes in the dispersion of the wage distribution will increase the distance between the lowestand highest benefits in a way that is less costly than changing the structure of the system to increasebenefit differentiation.
Sickness benefits
Sickness benefits provide a clear case of the need for change: there is no limit on the duration ofbenefits; benefits are close to previous wages; eligibility is lax and is open to manipulation by workersand by employers. Employer responsibility to pay for the early days of sick leave, and a maximumnumber of paid sick days permitted per year would limit abuse of the system.
Family benefits
Family benefits (maternity and parental leave, birth grants, and child allowances) for anemployed parent are paid for from an extra-budgetary fund [social insurance fund (SIF)]; a parallelsystem, paid for by municipalities, provides the full range of benefits to uninsured families if both parents(or a lone parent) are (is) unemployed or not in the labour force. Registration at the employment office isrequired if both parents are unemployed.
Expenditure on family benefits at all levels of government is relatively low -- 1.0 per cent ofGDP in 1996, of which central expenditures accounted for the large majority. Spending on childallowances dominated central spending; parental leave accounted for three-fourths of local spending onthis benefit category. Benefits are not means-tested at either level of government. It is effectively a singlebenefit system that is virtually universal, but which is administered and financed in a fragmented manner.
Child allowances often are held to be an effective tool in alleviating poverty. But the evidencein Bulgaria suggests that they are only slightly redistributive, even when a per capita measure whichexaggerates the importance of household size is used to rank households by income. The potential forchild allowances to ameliorate low income also is constrained by the small and declining amounts ofexpenditure, which is spread across all families with children. Yet it may not be politically feasible toeliminate them, nor would it be feasible to apply a means-test because of the potentially large number of

CCNM/DEELSA(98)64
9
applicants and the high administrative cost. It would be more efficient to have state financing of all childallowances, and to include them in the taxable income of a parent 1.
Maternity and parental leave partially replaces earnings lost because of child-birth or child careresponsibilities. These benefits provided at the local level to individuals without earnings are notappropriate, and should be eliminated. Support for poor parents can be provided by means-tested socialassistance.
Social assistance
There has been a dramatic increase in poverty in Bulgaria since the beginning of the transition.Most of the responsibility for assisting low-income households has been shifted to municipalities-- means-tested cash transfers, non-means tested family benefits for the uninsured, and in-kind benefits, all of whichare considered social assistance. Nevertheless, as all public benefits eroded in value, and as real wagesdeclined and jobs were lost, it is troubling that the role of means-tested social assistance for the pooresthouseholds did not become a larger share of local social spending.
That the global grant from the state budget to municipalities is not of sufficient help inequalising their capacity to meet benefit promises is one explanation. A bloc grant earmarked forspecified social purposes, with an improved allocation formula, matching requirements, and maintenanceof effort provisions, would increase the accountability of local authorities and their incentive to use themoneys efficiently.
Second, increases in unemployment have raised the share of total family benefits paid for bymunicipalities, which, in turn, has crowded out spending on means-tested cash benefits.
But spending more on the poorest households inevitably means spending less on others -- although all who receive help from local authorities undoubtedly suffer from some degree of materialhardship. Nevertheless, extensive use of means testing is not a feasible solution. The sophisticatedinformation required to determine eligibility, and to subsequently monitor family circumstances generallyis not available in most transition economies, including in Bulgaria. The existence of a sizeable shadoweconomy, and a culture of non-compliance with income reporting requirements and tax regulations alsomitigates against widespread use of means testing. The most helpful change would be to minimise theresources that are lost because of unnecessary complexity and duplication in the mix of programmes andin their financing. Despite the fiscal stringency that is unavoidable in the face of economic crisis, ageneral reduction in benefit levels for low-income households does not appear to be justified.
The effect on work incentives of social programmes is important for those unemployed forwhom a job is a viable option. But the returns to work are the most important influence on them. Whenboth wages and benefits are low, the incentive is to engage in informal (and untaxed) activities -- evenwhen receiving public income support. Thus, there is a cost to society of low benefits and low wages. Amore competitive labour market and higher wages are an important part of the solution to both workincentives and income adequacy. Appropriate macroeconomic policy and structural reforms are asimportant to the objectives of social policy as they are to the economy at large.
1. The individual rather than the family is the unit of taxation in Bulgaria. If child allowances were included
in the income of the higher earner, a majority of families would be affected since the taxable incomethreshold of 600 000 Lev per annum in 1997 represented only about 29 per cent of average wages.

CCNM/DEELSA(98)64
10
CHAPTER 1
THE MACROECONOMIC CONTEXT
Introduction
Progress in the transition to a market economy in Bulgaria has been slower than in many othereconomies in transition. Some of the costs of resistance to reform became more apparent in late 1996,when the economy relapsed into a deep recession, hyperinflation re-emerged, and the currency collapsed(Table 1.1). These dramatic developments precipitated a radical change in the country’s approach toreform, and rapid moves have begun to stabilise the economy and to lay a foundation for sustainablegrowth in the future.
Table 1.1 Main economic indicators, 1993-98Annual percentage change
1993 1994 a 1995 1996 1997 b 1998 c
GDP (growth in %) -1.5 1.8 2.1 -10.9 -7.5 3.0
Consumption (growth in %) -3.6 -4.5 -2.9 -7.4 -6.0 0.0
Fixed capital investment (growth in %) -17.5 1.1 8.8 -13.5 -9.0 5.0
Inflation (CPI Dec./Dec. in %) 64 122 33 311 579 20
Registered unemployment (%) 16.4 12.8 10.8 12.5 13.7 14.0
Consolidated government budget balance -11.0 -6.0 -6.0 -10.0 -2.8 -3.0 (in % of GDP)Trade balance (US$ million) d -885 33 131 188 396 300
Current account balance (US$ million) -153 -30 82 446 500
a) The NSI began excluding holding gains from GDP figures only in 1994.
b) Preliminary.
c) Projections.
d) Reported on a fob-fob basis.
Sources: National Statistical Institute (NSI); Ministry of Finance; Bulgarian National Bank (BNB); OECD.
While the outlook for the Bulgarian economy appears increasingly positive, the challenges to beovercome in 1998 remain as formidable as those that were faced in 1997. Recent improvements in themacroeconomic environment, together with an ambitious agenda for banking and state enterprise reform,should enable Bulgaria to climb out of the steep economic decline suffered during the past two years. Theinitial results of the recent stabilisation and reform programme have exceeded earlier expectations.

CCNM/DEELSA(98)64
11
However, sufficient time for the effective implementation of the new policy agenda must be allowedbefore a reliable assessment of its achievements can be made.
Among the challenges facing the government is the need to maintain the momentum for change.After years of preserving and protecting loss-making enterprises, the government now finds itself severelypressured from two directions. First, real incomes have declined, poverty has increased, andunemployment is likely to rise further as enterprises finally engage in restructuring under conditions ofsevere credit tightness. Second, macroeconomic stabilisation measures compel the government to adhereto a very tight fiscal envelope, with limited flexibility to respond to social needs. The difficult challengetherefore entails ameliorating economic hardship in a way that is perceived as fair -- without significantincreases in expenditure.
Total social expenditure declined from a peak of 26 per cent of GDP in 1993 to a low of 16 percent of GDP in 1996 -- despite the dramatic decline in output recorded in that year (see Table 3.2.).Expenditure on the major benefit categories had been reduced to modest levels compared with mostmiddle-income countries by 1996 (Table 1.2) in large part because of the severe erosion of real benefits.It is unlikely that this trend can be sustained politically: it contributes to the very fragile nature of thecurrent policy environment.
T a b le 1 .2 S e le c te d s o c ia l e x p e n d itu r e s in B u lg a r ia a s a p e r c e n to f G D P c o m p a r e d w ith C E E c o u n tr ie s , c ir c a 1 9 9 6
B u lg a r ia a R o m a n ia a S lo v a k ia b C z e c h R e p u b lic b
P e n s io n s c 7 .3 6 .7 8 .5 8 .6H e a lth 3 .2 2 .8 6 .1 7 .6F a m ily d 1 .0 0 .7 2 .7 2 .2H o u s in g ..U n e m p lo y m e n t e 0 .5 0 .6 1 .3 0 .3T o ta l 1 2 .2 1 0 .8 1 8 .6 1 8 .7
a ) 1 9 9 6 .
b ) 1 9 9 5
c ) P e n s io n s in c lu d e o ld a g e , d i s a b i li ty a n d s u rv iv o rs b e n e fi ts .
d ) In c lu d e s o n ly c a s h e x p e n d itu re s .
e ) U n e m p lo y m e n t in c lu d e s a ll a c t iv e p ro g ra m m e s a n d u n e m p lo y m e n t c o m p e n s a t io n .
M e m o ra n d u m i te m s : G D P p e r c a p i ta in U S $ u s in g P P P s .
B u lg a r ia (1 9 9 6 ) = 3 7 5 0
R o m a n ia (1 9 9 6 ) = 3 6 7 4
S lo v a k (1 9 9 5 ) = 4 9 5 3
C z e c h R e p u b lic (1 9 9 5 ) = 9 9 3 2
S o u r c e s : O E C D S o c ia l E x p e n d itu re d a ta b a s e ; B u lg a r ia n M in is try o f L a b o u r a n d S o c ia l A f fa i rs ; U N IC E F
T ra n s M o n e e d a ta b a s e .

CCNM/DEELSA(98)64
12
Recurrent crisis
Despite above-average living standards relative to many other centrally planned economies inCentral and Eastern Europe at the outset of the transition, the inherited conditions of Bulgaria were worsethan average with regard to fiscal and financial institutions, the accumulation of bad debt, and confidencein economic policy. Bulgaria also was more highly integrated into the distortionary Comecon tradingsystem than any other country, with the ratio of Bulgarian CMEA-related imports plus exports to GDPbeing over 60 per cent. The deterioration and collapse of Comecon markets, and the breakdown of thepayments systems in the 1980s, contributed to severe disruptions in Bulgarian industry, with associateddeclines in output and employment. A policy of foreign borrowing in the late 1980s, which tripled grossforeign debt from USD 2.9 billion in 1984 to USD 10.7 billion in 1989 even as exports stagnated, led to adebt crisis. Encumbered with a foreign debt burden of well over 100 per cent of GDP in 1990, Bulgariasuspended the servicing of foreign debt.
The initial macroeconomic crisis of the early 1990s was dealt with through bold stabilisation andprice and trade liberalisation measures, which are documented in the 1992 OECD publication, Bulgaria:An Economic Assessment. Privatisation and the building of institutions required for a market economysubsequently led to a reorientation of trade toward OECD countries, and to a private sector which, despiteits modest size, was responsible for close to 50 per cent of value added in the economy.
Bulgaria also has suffered from considerable political instability throughout the transitionperiod. Rapidly changing governments during the course of the transition have led to policyinconsistencies and reversals. Political changes impeded implementation of difficult reform measures,such as the restructuring or liquidation of loss-making enterprises, reform of the banking sector,privatisation of many state assets, and attraction of foreign investment. With little progress made in thesecrucial sectors, budgetary pressures grew and macroeconomic stability proved to be unattainable. After aninitial 25 per cent drop in GDP between 1989 and 1993, the moderate economic growth in 1994 and 1995(1.8 and 2.1 per cent, respectively) ended abruptly with a severe economic crisis and further declines inoutput. Since the beginning of the transition, real GDP was estimated to have declined by 38 per cent,although revised data suggest that the fall in real GDP was about 27 per cent. Nevertheless, this situationwas worse than in most other Central European transition economies (Chart 1.1).
C h a r t 1 . 2 G D P g r o w th in B u lg a r ia a n d in s e le c t e d C E E c o u n t r ie s , 1 9 9 0 - 9 7
1 9 9 0 1 9 9 1 1 9 9 2 1 9 9 3 1 9 9 4 1 9 9 5 1 9 9 6 1 9 9 76 0
7 0
8 0
9 0
1 0 0
1 1 0
1 2 0
1989
= 1
00
P o la n d R o m a n ia B u lg a r ia S lo v e n ia C z e c h R e p u b l ic
S o u r c e : E B R D .
Chart 1.1

CCNM/DEELSA(98)64
13
Bulgaria remained one of the most heavily indebted countries in the region in early 1996, withforeign and domestic debt at 80 and 35 per cent of GDP, respectively. Fiscal plus quasi-fiscal deficitstotalled around 15 per cent to 18 per cent of GDP, as the National Bank increasingly provided credits toproblem banks without requiring collateral (European Bank for Reconstruction and DevelopmentTransition Report, 1997). Although the current account was roughly in balance, a lack of confidenceemerged in the ability of the government to refinance the maturing foreign debt. Associated loses ofinternational reserves and runs on the banks and the currency precipitated a complete collapse ofmacroeconomic stability and a crushing decline in real GDP by almost 11 per cent in 1996, continuinginto 1997 with a further 10 per cent decline during the first half of the year. The Lev plummeted fromLev 70 to the Dollar at the start of 1996 to a depth of Lev 3000 to the Dollar in early 1997, with slightrecovery by the end of 1997 at under Lev 2000 per Dollar. Prices rose in parallel to hyperinflationarylevels and effectively wiped out large amounts of savings.
The government announced its resignation in December 1996. In early 1997, under pressurefrom opposition parties as well as country-wide protests and strikes, new parliamentary elections werecalled and a caretaker government was formed under the initiative of the newly-elected President. Aprilparliamentary elections resulted in a strong victory by the opposition, and the new government proceededto implement a comprehensive stabilisation programme which had been negotiated between the caretakergovernment and the International Monetary Fund (IMF). A fundamental element of this programme, theintroduction of a currency board (implemented on 1 July, 1997), had a dramatic impact on inflationaryexpectations. While cumulative annual inflation in September stood at 561.8 per cent, June inflation was0.8 per cent; it increased to between 3.6 per cent and 5.5 per cent in subsequent months, before subsidingagain to 0.5 per cent in October and November2. Consumer price inflation was projected to be in therange of 16 per cent on an annual basis at the end of 1997 and remain in this range for 19983 -- a dramaticstabilisation after a year-on-year rate of 826 per cent in October (see Table 1.1).
Fiscal policy and the budget envelope
This method of stabilisation can carry a considerable cost, however. The currency boardarrangement effectively prevents discretionary monetary policy, which places a much heavier burden onthe management of government spending. The fiscal regime since the implementation of the currencyboard is necessarily highly disinflationary, requiring, in Bulgaria’s case, a rapid balancing of theconsolidated budget. The 1997 budget deficit was estimated to be about 2.8 per cent of GDP. The mainsources of financing for this deficit are expected to be privatisation revenues and net external finance, thusallowing for a potential slight reduction of government debt in 1997. The 1998 budget frame, agreed inOctober with the IMF, envisages a 2.7 per cent deficit in the consolidated budget, and the governmentplans to have a balanced budget in 1999 (Reuters, 20 October 1997).
In the short term, the pressure on public expenditure has been reduced by the recent sharp dropin interest payments due on public debt. The government plans to rationalise public administration, and toinvite private participation in the crucial education and health sectors in order to ease future publicexpenditure constraints. In 1997 alone, around 60 000 jobs in public administration, education and healthcare were scheduled to be cut. Nevertheless, with 1997 tax revenue at less than 20 per cent of GDP,
2 The temporary surge in inflation is believed to have resulted from an administrative increase in utility
prices in August, a depreciation of the DM relative to the US Dollar in July/August, as well as acuteshortages of some basic foods.
3 The Bulgarian authorities and the IMF agreed in October 1997 on a target rate of inflation of 16.4 per centin 1998.

CCNM/DEELSA(98)64
14
annual debt servicing requirements of around 10 per cent of GDP4, and the necessity to resolve past quasi-fiscal deficits, there is little room for manoeuvre by simply adjusting the public expenditure structure (seelower panel of Chart 1.2 and, for a historical perspective, see also lower panel of Chart 1.3.).
Non-tax revenue
Profit tax
Income tax
VAT
Customs dutiesPension fund
Unemp. fund
Other tax rev.
16%
13%
14%
25%
7%20%
2%
3%
Revenues1996
Unemp and sev.
Social expenditure
Wages & salaries
Maint. and oper.
Defence and security
Subsidies
Extrabudget accts.
4%
40%
16%
19%
14%
3%
4%
Expenditures1996
Chart 1.2 Consolidated budget revenue and expenditure structure, 1996
Source: IMF
4 Although the domestic currency debt was eroded by the 1997 hyperinflationary episode, much of the debt
was denominated in foreign currency. Nonetheless, interest payments on government debt alone reached 20per cent of GDP in 1996 because of risk-associated high interest rates and the devaluation of the Lev.These problems were alleviated with the implementation of the currency board.

CCNM/DEELSA(98)64
15
Consolidated budget revenue
1992 1993 1994 1995 19960
10
20
30
40
Per
cent
age
of G
DP
Non-tax revenue Profit tax Income tax VAT and excise taxesCustoms duties Pension fund Unemployment fund Other tax revenue
Consolidated budget non-interest expenditure
1992 1993 1994 1995 19960
10
20
30
40
Per
cent
age
of G
DP
Unemployment and severance Social expenditure Wages and salaries Maintenance and operationsDefence and security Subsidies Extrabudgetary accounts
Chart 1.4 Consolidated budget revenue and expenditure structure, 1992-96
Source: IMF.
Easing the tight fiscal envelope will require increased revenue collections, in large part through areduction of the substantial shortfalls which occur in the collection of planned revenue. This has beenaccorded a high priority by the Bulgarian government. The “hidden” economy, composed for the mostpart of small family firms, also poses a major barrier to effective tax collection. The size of the shadoweconomy is estimated by the Ministry of Finance to be as much as 20 to 25 per cent of GDP (see upperpanels of Charts 1.3 and 1.4 for a description of the revenue structure).
Acceleration of the inflow of revenues from privatisation also would help to ease fiscalconstraints, but only in the short term. Given recent turbulence in international debt markets, as well asBulgaria's recent financial crisis and remaining high debt levels, further borrowing on internationalmarkets is not likely to take place on a large scale in the near future.
In conjunction with raising revenues from privatisation, the government is actively working to encourageforeign direct investment for at least three reasons. First, there are very few domestic buyers for severallarge industries because of the difficult domestic credit situation. Second, foreign capital inflows are
Chart 1.3

CCNM/DEELSA(98)64
16
needed to finance an expected growth in imports as enterprises engage in (overdue) restructuring, and toprovide the economy with more liquidity. Finally, it is believed that foreign investment will providevaluable technical and managerial expertise, as well as increased competition in several sectors.Compared with most other transition economies, Bulgaria has not been successful in attracting muchforeign direct investment, largely because of the slow pace of reforms.
Privatisation is critical, not only because it is a pivotal element in the transition process, but alsobecause it will be used to finance over half of the budget deficit. As a pre-condition for the World Bank’sFinancial and Enterprise Sector Adjustment Loan (FESAL), Bulgaria agreed to privatise 40 per cent of theassets of the public enterprise sector by the end of 1997. (For the purposes of FESAL monitoring,privatisation requires the sale of at least 67 per cent of a firm’s assets.) Bulgaria divested only 18 per centof state-owned long-term assets to the private sector by November 1997, of which one half were soldthrough the mass privatisation programme. This is nonetheless a substantial increase from the 6 per centdivested by the end of 1996.
Structural reform
Domestic priorities
While inflationary pressure has been reduced and increases in the fiscal deficit have beencontained, the macroeconomic situation remains fragile. A particularly high priority has been placed onrapid privatisation and restructuring in order to consolidate progress into a sound basis for sustainablefuture growth. The recent crisis has served to highlight the close linkages between long-termmacroeconomic stability, progress in market-oriented industrial and institutional restructuring, and thewell-being of the Bulgarian people.
The privatisation of state enterprises and financial sector reform are key elements of structuralreform. Consistent with practices in other transition economies, the Bulgarian Ministry of Industry willdirectly privatise smaller firms, that is, those with less than a 70 million Levasset base at the 1991valuation. The Agency for Privatisation will handle large state enterprises, including public utilities.Presently, 71 large state enterprises account for over 80 per cent of the total losses incurred by publicenterprises. Enterprise restructuring will remain the responsibility of new owners, as will dealing withpast debt. The government has also appointed a number of working groups to study restructuringproblems in difficult industries -- primarily steel, mining and heavy metallurgical concerns.
An important new departure in Bulgarian privatisation is the use of outside commercial agents tohandle the sale of 96 large firms on a no-return basis. Contracts have already been signed with agentswho will be handling the privatisation of 30 enterprises, which is expected to be completed by the end of1998. The full privatisation of the 30 largest companies would account for about 13 per cent of long-termassets of state owned entreprises, and the privatisation of the remaining 66 companies for about 6 per cent.In 1998, a new wave of mass privatisation is planned.
The government also has decided to liquidate several enterprises. Liquidation is expected toaffect 28 per cent of total losses of the state enterprise sector, and will significantly ease the budgetaryburden of financing the continued operation of these enterprises.

CCNM/DEELSA(98)64
17
External policies
The Bulgarian economy has retained its orientation toward a high volume of foreign trade.Despite the collapse of traditional export markets in the early stages of the transition, a preliminaryforecast of foreign trade turnover in 1997 indicated that it would represent about 84 per cent of GDP.Increases in exports played a key role in the revival of moderate output growth prior to the 1996/1997crisis, and are expected to remain an engine for growth in the foreseeable future.
A growing share of Bulgarian trade has been oriented to OECD countries, which now accountfor roughly one-half of all imports and exports. The Russian Federation remains Bulgaria’s largest tradingpartner and primary supplier of energy imports. Community of independent states (CIS) countries, andparticularly Russia, have accounted for roughly 80 per cent of imports and 50 per cent of exports tocentral and eastern European countries.
In the longer term, success in industrial restructuring will be crucial to the resumption andsustainability of economic growth. While initial steps taken are promising, serious challenges remainbecause of the relatively undeveloped system of commercial and property law and a limited administrativecapacity to implement legislation. The importance of rapid progress on these fronts is enormous, as largeinflows of foreign capital are less likely to occur and to establish deep roots in the local Bulgarianeconomy until commercial risks have been reduced.
Labour market and social policies
The adverse economic circumstances in Bulgaria, aggravated by earlier resistance to change,have had disastrous social costs. These costs have been borne by the large majority of the Bulgarianpopulation.
A striking feature of the transition process in Bulgaria is the very long average duration of unemploymentand the prevalence of long-term unemployment. More than two-thirds of the unemployed were withoutwork for more than one year by 1996. This gives Bulgaria the unfortunate distinction of being the leaderamong transition economies in this category. Bulgaria also has the distinction of sharper declines inemployment than in most other transition economies.
Poverty, no matter how it is measured, increased dramatically, and disparities in income widened. Thefall in GDP was accompanied by a decline in real income per capita of nearly 50 per cent between 1989and 1995 [National Statistical Institute (NSI), 1996]. The recent economic crisis brought further declines,particularly as inflation accelerated to hyperinflationary levels in the early months of 1997 (Table 1.1).Real incomes are estimated to have fallen by an additional 26 per cent in 1996 alone. This decline appearsto have been partially reversed by the end of 1997 when average wage rates rebounded to a levelequivalent to approximately USD 100 per month from an average of USD 30 in 1996.
The income distribution also widened. The gini coefficient rose steadily from 0.217 to 0.378 between1989 and 1995 (NSI, 1996) -- higher than the average income inequality in OECD countries. The ratio ofincome received by the richest 20 per cent of the population relative to the lowest quintile climbed from3.5 to 6.5, and surpassed the ratio in Japan and in most of the countries in Western Europe. The result ofthe decline in real incomes and the changes in its distribution has been the emergence of widespreadpoverty, with about one-third of the population currently subsisting on a purchasing power of less than4 USD per day [United Nations Development Programme (UNDP), 1997, reported in the European Bankfor Reconstruction and Development (EBRD) Transition Report 1997].

CCNM/DEELSA(98)64
18
And the Bulgarian population is ageing and shrinking (see Box 1 and Chart 1.5). Although thislong-term demographic trend is not related to the economic and social difficulties associated with thetransition process in Bulgaria, it will not help them either. Population ageing is likely to affect pensionand health care costs, potential labour supply, and other aspects of the economy -- often in unfavourableways.
The current fragile macroeconomic context complicates the role of labour market and socialpolicies. These policies by themselves cannot solve the basic problems related to maintaining areasonable standard of living for everyone during the course of the transition -- when the poor state of theeconomy is a large part of the difficulty. But they can help to ameliorate hardship, encourage and rewardself-sufficiency through work, and facilitate the necessary structural reforms by making it easier for theBulgarian people to accept temporary, short-term disruptions. The following chapters review existinglabour market and social policies, and consider the changes that might improve their performance -- within the budgetary limitations that must be respected.
BOX 1. 1 Demographic Characteristics of the Population
The population of the Republic of Bulgaria is ageing and declining in absolute numbers. Thisis attributable to decreases in the fertility rate, and increases in the mortality rate. The total fertility ratein 1996 of 1.24 was lower than that of OECD countries and well below the rate needed to stabilise thepopulation. Life expectancy at birth for a man in 1996 was 67.1 years (1.3 years less than in 1990); fora woman, 74.6 years (0.3 years less than in 1990). As of the end of 1996, there were 8.34 millionpeople. This represented a decline of nearly 45 000 inhabitants in only one year.
The composition of households in 1996 reflects the ageing of the Bulgarian population. Of thetotal number of households (2.8 million), 60 per cent contained no children; 20.6 per cent included onechild under 18 years of age; 17.1 per cent contained two children aged less than 18 years; only 2.1 percent of households included three or more children under age 18. The average household size was 2.95.
Chart 1.4 shows that slightly more than one-fifth of the Bulgarian population was over age 60in 1996, but nearly one-third of the population is projected to be over this age by 2050. Thedemographic path is similar to that of the Ukraine, but the share of the population over 60 years of agein Bulgaria exceeds that of Romania until after the year 2030 when convergence occurs. The speed ofthe ageing process is less dramatic than in Japan (the most rapidly ageing OECD country), but is takingplace more rapidly than in the United Kingdom, where the rate of change is modest compared withother OECD countries.
Source: Statistical Yearbooks, National Statistical Institute, Sofia

CCNM/DEELSA(98)64
19
Chart 1.5 Share of population aged 60 years and over, 1970-2050
1970 1990 2010 2030 20505
10
15
20
25
30
35
40
% o
f tot
al p
opul
atio
n ag
ed 6
0 ye
ars
and
over
Bulgaria United Kingdom Japan Ukraine Romania
Data for the years 1970 to 1990 are United Nations demographic estimates.Data for the years 2000 to 2050 are from United Nations Population Division’s mediumvariant population projections.
Source: World Population Prospects 1950-2050 (1996 revision).
Chart 1.4

CCNM/DEELSA(98)64
20
CHAPTER 2
LABOUR MARKET TURBULENCE
The difficulties which can affect the labour markets of countries that move from a centrallyplanned system towards a market economy have all occurred in Bulgaria: sharp losses in employment,high unemployment, low turnover among the unemployed, increasing long-term unemployment, anddeclining real wages. These adverse developments in the labour market have been particularly deep andprolonged, and have contributed to the impoverishment of large sections of society since reforms began in1991.
Employment and unemployment
Labour shedding
Total employment fell precipitously, from an annual average of more than four millionemployed in 1990 to slightly over three million by 1995 -- more than a 25 per cent decline. No othercountry in transition, apart from Romania, experienced a fall in employment on such a large scale. Themore aggressive shedding of labour, however, does not mean that Bulgaria has engaged in more rapidrestructuring than other transition economies. Instead, it is in large part related to a collapse in demandacross all sectors because of strong exogenous shocks (see Chapter 1).
Labour shedding is continuing, but as a matter of policy. The Bulgarian government elected inthe Spring of 1997 intends to speed up the pace of enterprise restructuring and privatisation. A 10 per centstaff reduction in the budgetary sphere was planned as of September 1997. Additional mass layoffsinvolving about 25 000 workers are expected in loss-making state enterprises.
As Table 2.1 shows, gross flows into unemployment were large from the beginning of thetransition period -- almost twice as large as in other economies in transition. But only a fraction of thelarge employment losses were reflected in the flows into unemployment. Gross job destruction rates alsowere significantly above those of other Central and Eastern European countries in the early 1990s, andseparation rates involved about one-third of workers in state enterprises. The massive labour sheddingwas a result of the severe difficulties encountered by state-owned enterprises during the initial phase ofreforms in 1991 and 1992: direct subsidies were virtually eliminated and trade liberalisation coincidedwith the break-up of the Former Soviet Union (FSU) and the disruption of CMEA links and of tradingroutes to the West.

CCNM/DEELSA(98)64
21
Table 2.1 Labour shedding in Bulgaria, 1990-97
1990 1991 1992 1993 1994 1995 1996 1997a
Change in employmentb
Bulgaria -6.1 -13.0 -8.1 -8.5 -4.2 5.7 1.2CCETc -2.7 -7.4 -1.6 -1.5 -0.9 -0.1 1.0
Unemployment inflows as percentage of working age populationBulgaria 17.4 14.4 11.2 10.5 11.2 12.8 18.9CCETd 9.1 6.9 8.4 8.3 8.9 8.8 9.0
Job destruction ratese
Bulgaria 13.2 15.2 10.7 6.5 .. .. ..CCETf 9.1 8.1 8.5 6.6 .. .. ..
Separations as a percentage of state sector employmentBulgariag 36.2 30.8 29.1 24.8 22.1 26.2
a) Secretariat estimates.
b) Balance of labour resources data prior to 1992 for Bulgaria, the Czech and Slovak Republics and prior
to 1991 for Hungary and Poland. Labour force survey data were used after these dates.
c) CCET includes the Czech Republic, Hungary, Poland, and Slovakia.
d) Hungary excluded from 1991 and 1992 figures; Poland excluded from 1991 figures.
e) Job destruction rates are defined as the sum of employment contractions in shrinking units as a per cent of total
employment in the initial year. The rates are estimated based on data from comparable establishment surveys from
Bulgaria, Hungary, Poland and Romania. (Konings et al. 1996).
f) Sum of first differences in employment levels of shrinking units as a percentage of the beginning of the period
employment. (Estimated on the basis of an enterprise survey carried out in Bulgaria, Romania, Poland and Hungary).
g) Figure for 1996 is a Secretariat estimate; public sector only.
Sources : OECD-CCET Labour Market database for data on employment and unemployment.
The dramatic decline in the employment rate was accounted for in part by the significant drop inthe activity rate of Bulgarian women. However, only about 36 per cent of employment losses appeared asan increase in unemployment, compared with 72 per cent of such losses showing up as unemployment inother transition economies (see Table 2.2). Obviously, the majority of workers released from stateenterprises left the labour force -- or they left recorded employment in the informal economy foremployment in the informal economy.
A 1.0 per cent decline in GDP was associated with almost a 9 per cent decline in employment inBulgaria compared with an average elasticity of 6 per cent in other Central and Eastern Europeancountries. The greater responsiveness of employment to output changes in Bulgaria may be facilitated bythe less restrictive Bulgarian Labour Code5 the weak enforcement of regulations, and the heavy use of“civil contracts” which can be terminated at the discretion of the employer6.
5. The 1994 Labour Code requires advance notice of layoffs only in the case of mass redundancies; the notice
period of 30 to 90 days is shorter than in many other countries; statutory redundancy pay also is lowerthan in most other transition economies and is unrelated to seniority. See OECD, 1994 for discussion ofregulations on collective redundancies in transition economies.
6. “Civil contracts” accounted for 10 per cent of employment in some years. Until March 1995, payment ofsocial security contributions was waived for this type of employment contract.

CCNM/DEELSA(98)64
22
Table 2.2 Trends in employment, unemployment and labour force participation, 1989-1996
Employment as a Unemployment Unemployment-% of the working- as a % of the Labour force employment
age population labour force participation rate variationa
1989 1996 1996 1996 1996-90 Bulgaria Female 70.3 49.2 15.1 57.9 Male 68.9 56.6 15.4 66.9 Total 69.6 52.9 15.3 62.4 0.36
CCETb
Female 62.6 57.8 10.3 64.4 Male 74.7 72.0 8.6 78.7 Total 68.6 64.8 9.3 71.5 0.72
Middle-income countries 57.9 5.6 63.5
a) Change in unemployment from 1990 to 1996 divided by the change in employment from 1990 to 1996.
Employment data for 1996 are from labour force surveys; data for 1990 are entreprise survey data.
b) Includes the Czech Republic, Hungary, Poland, Romania and the Slovak Republic.
Sources : National statistical yearbooks; OECD-CCET Labour Market database; ILO Yearbook of Labour Statistics,
several issues.
The composition of employment change
Almost all sectors experienced employment reductions until 1992, after which the pattern ofgrowth and decline by sector became more divergent. Declines were most heavily concentrated inindustry, where employment fell by nearly one-half by 1995 (Table 2.3). This sector accounted forone-third of total employment in 1990. Financial services showed growth over the period, but this sectorwas virtually non-existent earlier -- it accounted for less than 1 per cent of employment in 1990.
Labour was shed in agriculture on a large scale between 1989 and 1991, but employment laterrecovered to its 1990 level. Privatisation of collective farms was slow: a restitution scheme was usedwhich was very time consuming, and ownership of a large part of arable land remained uncertain for sometime (Bobeva and Hristoskov, 1995). By 1994, however, 70 per cent of all arable land was privatelyowned. Despite the substantial early declines in agricultural employment, the share of employment in theagricultural sector increased from 18.5 per cent in 1990 to 23.3 per cent by 1994. The rising employmentshare in agriculture was attributable to large declines in other sectors, rather than to significant growth inthe agricultural sector itself. Although probably a transitory phenomenon, it does suggest that agriculturalemployment was used to absorb some redundant workers in the initial years of transition, that is, someworkers shed by industry returned to their place of origin to find employment on farms. The evidence,although scant, seems to support this hypothesis. Since agricultural exports decreased and real incomesfell dramatically after 1989, additional output must have been consumed by producers.
CCNM/DEELSA(98)64
23
Table 2.3 Employment by sector, 1989-1995a
Annual growth rates
PercentageStock (000s) change
Economic activity 1989 1990-89 1991-90 1992-91 1993-92 1994-93 1995-94 1995-1989
Agriculture 814 -7.0 -8.1 -0.4 2.7 5.5 4.2 -3.8 Industry 1646 -9.0 -19.2 -14.2 -6.6 -4.4 -2.2 -44.0 Construction 361 -6.8 -25.0 -19.1 2.3 -8.1 -2.4 -48.1 Trade and catering 395 -5.8 -8.0 -4.0 0.9 11.1 -3.3 -9.7 Transport and communication 290 -1.3 -6.7 -11.4 1.8 -3.5 7.9 -13.5 Financial services 26 -3.7 10.0 29.8 5.1 19.4 16.0 100.3 Health and education 491 0.5 -3.7 -1.7 -0.9 -2.8 -0.1 -8.5 Public administration 61 -10.1 -7.4 2.6 29.7 12.1 1.1 25.5 Other services 281 -2.8 -18.5 -15.4 -3.8 1.6 11.4 -27.0Total 4365 -6.1 -13.0 -8.1 -1.6 0.6 1.3 -24.8
Coefficient of variation of growth rates across nine sectorsb
Bulgaria 0.7 1.1 4.0 3.2 2.6 1.9 CCETc 1.1 10.9 4.5 3.7 2.1
a) Enterprise survey data.
b) The standard deviation of growth rates across sectors as a percentage of the average growth rate across sectors.
c) An average of the Czech and Slovak Republics, Hungary and Poland; Hungary excluded from 1991 average.
Sources: Bulgarian Statistical Yearbook, 1996.
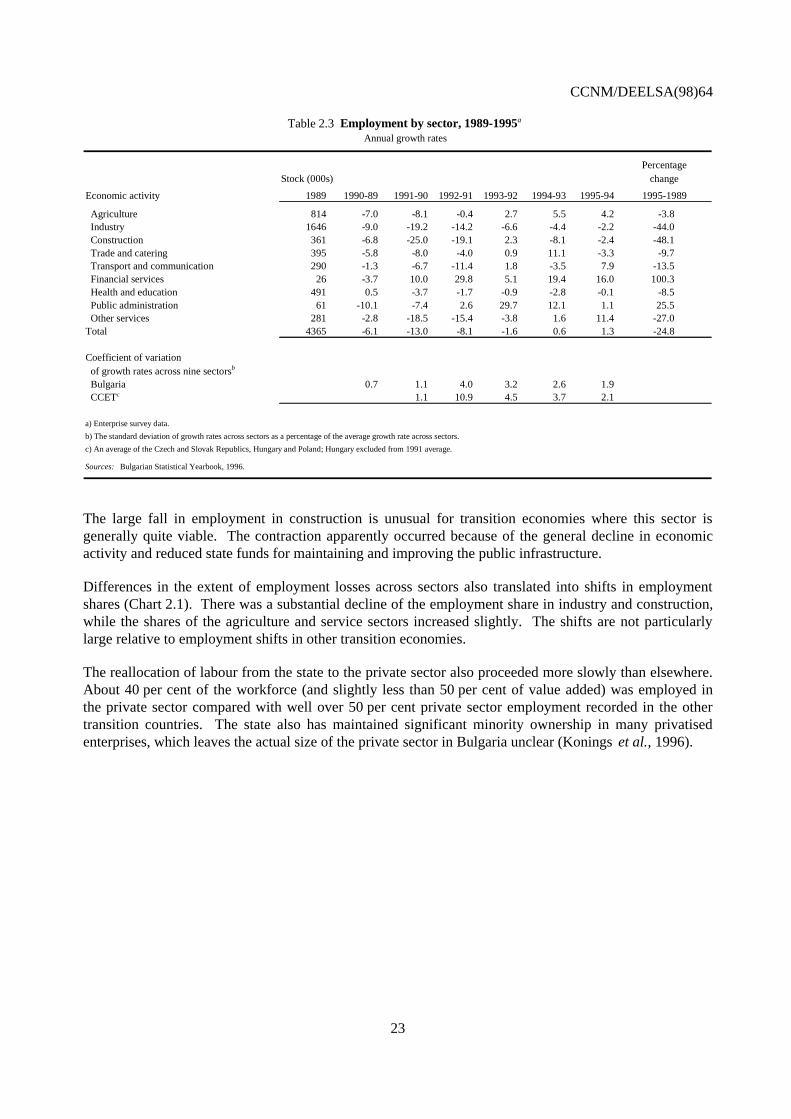
The large fall in employment in construction is unusual for transition economies where this sector isgenerally quite viable. The contraction apparently occurred because of the general decline in economicactivity and reduced state funds for maintaining and improving the public infrastructure.
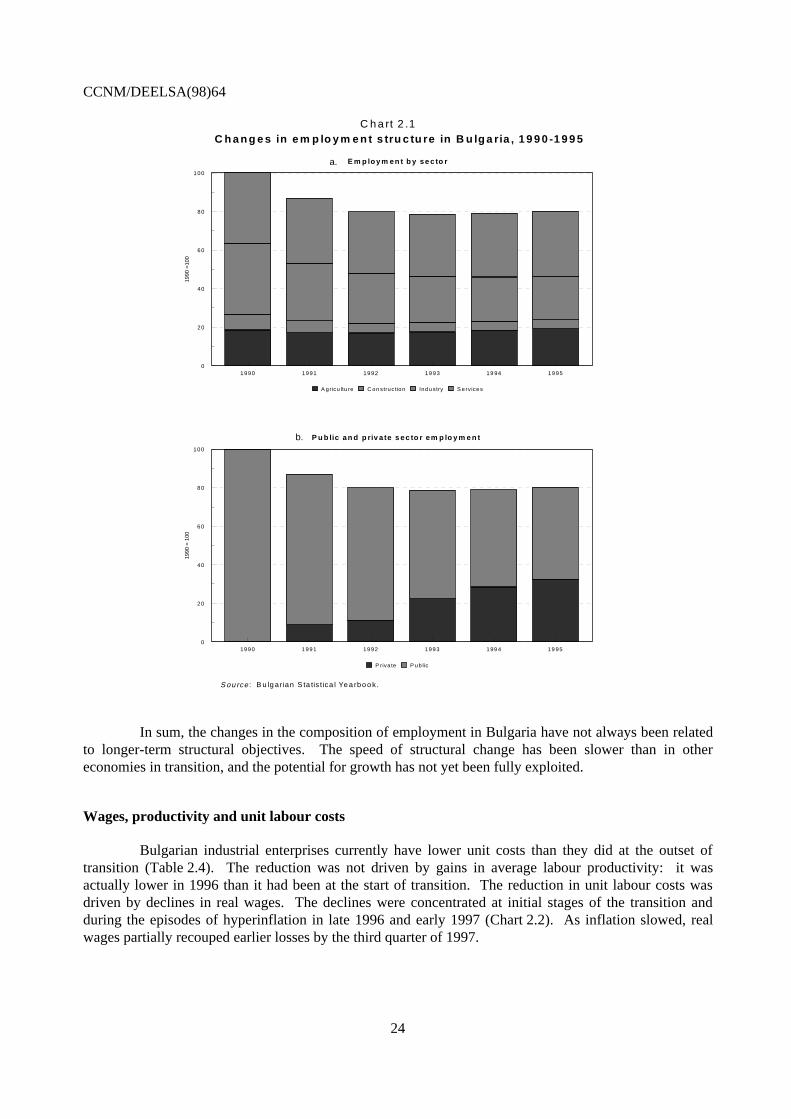
Differences in the extent of employment losses across sectors also translated into shifts in employmentshares (Chart 2.1). There was a substantial decline of the employment share in industry and construction,while the shares of the agriculture and service sectors increased slightly. The shifts are not particularlylarge relative to employment shifts in other transition economies.
The reallocation of labour from the state to the private sector also proceeded more slowly than elsewhere.About 40 per cent of the workforce (and slightly less than 50 per cent of value added) was employed inthe private sector compared with well over 50 per cent private sector employment recorded in the othertransition countries. The state also has maintained significant minority ownership in many privatisedenterprises, which leaves the actual size of the private sector in Bulgaria unclear (Konings et al., 1996).
CCNM/DEELSA(98)64
24
P u b lic an d p riv a te s ec to r em p lo y m e n t
1990 1991 1992 1993 199 4 19 950
20
40
60
80
100
1990
= 1
00
P riva te P ub lic
S ou rce : B u lg arian S ta tis tica l Ye a rbo o k.
C h a n g e s in e m p lo y m e n t s tru c tu re in B u lg a ria , 1 9 9 0 -1 9 9 5C h a rt 2 .1 a
E m p loy m en t b y se c to r
1990 1991 1992 19 93 19 94 19950
20
40
60
80
100
1990
=10
0
A g r icu ltu re C on struc tion Indu stry S e rvices
C h a rt 2 .1 b
In sum, the changes in the composition of employment in Bulgaria have not always been relatedto longer-term structural objectives. The speed of structural change has been slower than in othereconomies in transition, and the potential for growth has not yet been fully exploited.
Wages, productivity and unit labour costs
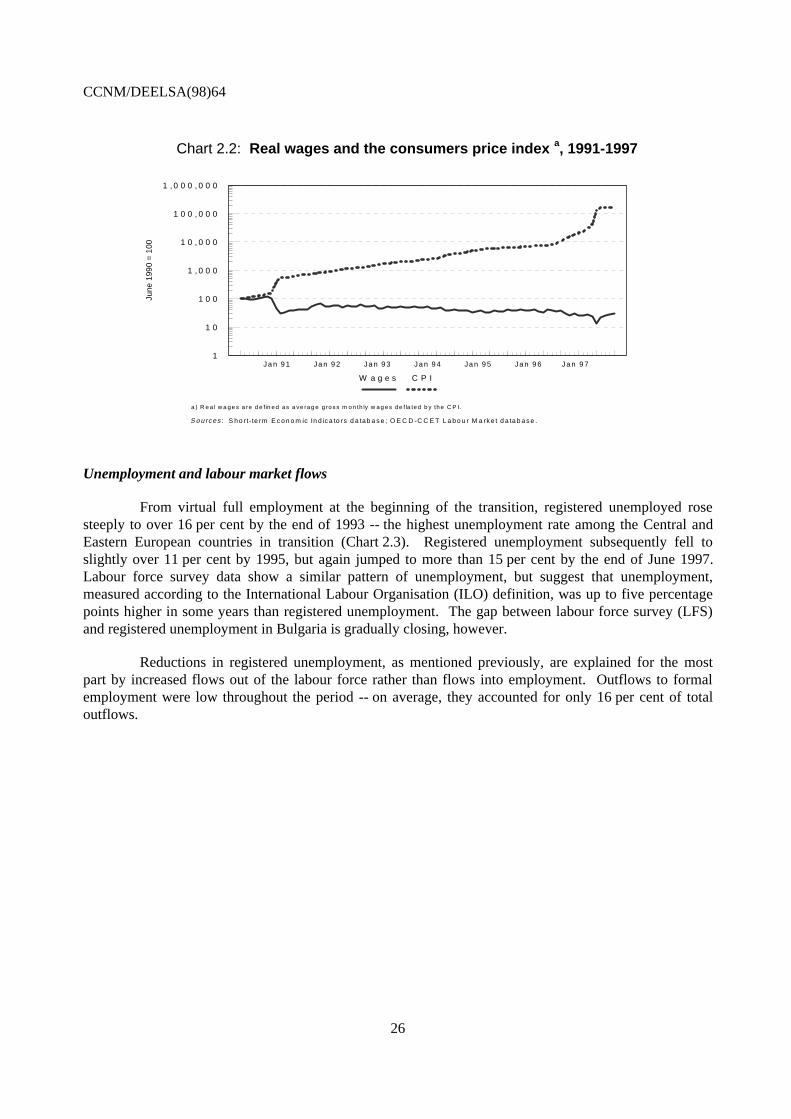
Bulgarian industrial enterprises currently have lower unit costs than they did at the outset oftransition (Table 2.4). The reduction was not driven by gains in average labour productivity: it wasactually lower in 1996 than it had been at the start of transition. The reduction in unit labour costs wasdriven by declines in real wages. The declines were concentrated at initial stages of the transition andduring the episodes of hyperinflation in late 1996 and early 1997 (Chart 2.2). As inflation slowed, realwages partially recouped earlier losses by the third quarter of 1997.
a.
b.

CCNM/DEELSA(98)64
25
Table 2.4 Wages, productivity and unit labour costs, 1996(1990 = 100)
Bulgaria CCETab
Average labour productivity 94.1 112.3Real consumption wages 35.1 94.8CPI/GDP deflator wedge 208.5 122.2Employers’ contributions 107.0 104.1
Real production wages bc 78.3 119.7
Unit labour costs bc 83.3 107.7
a) Includes the Czech and Slovak Republics, Hungary and Poland; base year is 1989 for Poland.
b) Using GDP deflator.
c) Changes in employers’ contributions have only taken into account contribution rates
to unemployment benefits.
Sources: Secretariat estimates based on data in Havlik, Peter, "Labour Cost Competitiveness of Central
and Eastern Europe", The Vienna Institute for Comparative Economic Studies (WIIW), forthcoming.
Only a fraction of real wage declines affected unit labour costs, and hence improvements inprofitability. Producers’ prices rose much less than the Consumer Price Index (CPI)7; the increase insocial charges increased the wedge between total compensation and take-home pay. Because of thesefactors, there was only a 20 per cent decline in wages paid by employers at the end of 1996 relative to1990, compared with a 65 per cent reduction in consumption wages (see Table 2.4). Labour costs remainfavourable in Bulgaria compared with the situation in other central and eastern European countries, but thefavourable position could deteriorate. Larger gains in productivity and containment of increasing socialcharges would help to maintain Bulgaria’s comparative advantage.
7. The wedge between the CPI and the GDP deflation increased dramatically in 1997 before the institution of
the currency board. One interpretation of the large wedge between the CPI and the GDP deflation inBulgaria is that it reflects a hidden transfer mechanism to the private sector (Miller, 1994). Most privatefirms are in the trade sector, while state enterprises are concentrated in industry.
CCNM/DEELSA(98)64
26
S o u rc e s : S h o rt- te rm E c o n o m ic In d ic a to rs d a ta b a s e ; O E C D -C C E T L a b o u r M a rk e t d a ta b a s e .
a
Ja n 9 7Ja n 9 1 Ja n 9 2 Ja n 9 3 Ja n 9 4 Ja n 9 5 Ja n 9 6
a ) R e a l w a g e s a re d e fin e d a s a ve ra g e g ro s s m o n th ly w a g e s d e f la te d b y th e C P I.
C h a r t 2 . 2R e a l w a g e s a n d t h e c o n s u m e r p r i c e i n d e x
L o g s c a le
1
1 0
1 0 0
1 , 0 0 0
1 0 , 0 0 0
1 0 0 , 0 0 0
1 , 0 0 0 , 0 0 0
June
199
0 =
100
W a g e s C P I
Unemployment and labour market flows
From virtual full employment at the beginning of the transition, registered unemployed rosesteeply to over 16 per cent by the end of 1993 -- the highest unemployment rate among the Central andEastern European countries in transition (Chart 2.3). Registered unemployment subsequently fell toslightly over 11 per cent by 1995, but again jumped to more than 15 per cent by the end of June 1997.Labour force survey data show a similar pattern of unemployment, but suggest that unemployment,measured according to the International Labour Organisation (ILO) definition, was up to five percentagepoints higher in some years than registered unemployment. The gap between labour force survey (LFS)and registered unemployment in Bulgaria is gradually closing, however.
Reductions in registered unemployment, as mentioned previously, are explained for the mostpart by increased flows out of the labour force rather than flows into employment. Outflows to formalemployment were low throughout the period -- on average, they accounted for only 16 per cent of totaloutflows.
Chart 2.2: Real wages and the consumers price index a, 1991-1997

CCNM/DEELSA(98)64
27
Jan Apr Jul Oct Jan Apr Jul Oct Jan Apr Jul Oct Jan Apr Jul Oct Jan Apr Jul Oct Jan Apr May June July-1
0
1
2
3
0
3
6
9
12
15
18
(Per
cen
t - p
ourc
enta
ge)
(Per
cen
t of l
abou
r for
ce -
pour
cent
age
de p
opul
atio
n ac
tive)
Outflows to jobs left scale
bUnemployment rateright scale
Inflowsleft scale
1992 1993 1994 1995 1996 1997
Unemployment inflows and the registered unemployment rate, 1992-1997a
Chart 2.3
Source: OECD-CCET Labour Market database.
a) The above rates have been estimated by the OECD Secretariat using estimated monthly labour force figures, whereby end-of-year estimates are based upon the sum of end-of-year employment and unemployment. Within-the-year labour force estimates are derived from the linear interpolation of the end-of-year figures. b) Outflows to jobs are represented in negative percentages.
Not all types of individuals are equally likely to move into or out of a given labour market state.Characteristics such as age, sex and education can make a difference. Transition probabilities, that is,movements of individuals, between their original state and employment (E), or unemployment (U), orinactivity (N) over a four-month period in 1995 using data drawn from matched records across labourforce surveys are examined in Table 2.5. The results show that the probability of moving from one stateto another within a four month period is small for most groups. Approximately 90 per cent of those whowere employed or inactive remained so, regardless of gender, with only slightly more variation by age andlevel of educational attainment. More than one-half of the unemployed remained in that state, except forthose aged 55 and over who were significantly more likely than others to leave the labour market.
Bulgarian women are not more likely to lose their jobs than are men -- a result common tovirtually all countries in transition. But they do have worse job prospects once they become unemployed,and are slightly more likely than men to leave the labour market. The flow of women fromunemployment to inactivity, however, is not large enough to compensate for the much lower female flowsrelative to males from unemployment to employment. As a consequence, more women remain inunemployment longer than men. Men also are slightly more likely than women to return to the labourmarket from inactivity.

CCNM/DEELSA(98)64
28
Table 2.5 Labour market transition probabilities by sex, age, and educationJune to October 1995
EE EU EN UE UU UN NE NU NN
Gender
Total 92.4 2.8 4.8 22.5 59.1 18.4 3.8 2.7 93.5Male 92.7 2.9 4.4 26.2 57.0 16.9 4.2 3.1 92.8Female 92.0 2.7 5.2 18.4 61.5 20.1 3.4 2.5 94.1
Age
15 to 24 84.3 6.5 9.2 16.8 60.2 22.9 3.6 5.2 91.225 to 39 93.7 3.0 3.3 25.6 60.0 14.4 14.2 11.4 74.440 to 54 95.0 2.3 2.8 24.6 59.6 15.8 13.9 10.4 75.755 and older 78.4 1.2 20.4 14.9 42.6 42.6 1.6 0.3 98.2
Educational attainment
Higher 97.3 0.6 2.2 32.2 55.9 11.9 5.7 2.6 91.7Secondary vocational 95.4 2.1 2.6 25.7 60.9 13.3 8.0 5.0 87.0Secondary general 92.9 3.3 3.8 25.2 57.1 17.7 6.1 4.7 89.2Primary and less 86.5 4.4 9.1 18.4 60.1 21.5 2.6 2.1 95.3
Regions
Sofia metropolitan areaa 94.9 2.0 3.2 25.2 62.8 12.0 2.2 3.0 94.8Russeb 92.4 1.8 5.8 28.6 51.5 19.9 5.2 2.5 92.3Montanac 92.6 3.6 3.8 17.1 68.1 14.8 3.5 2.7 93.7Rest of Bulgaria 91.7 3.2 5.1 21.4 58.7 19.9 3.7 2.7 93.5
a) Includes the okrugs of Sofia, Sofia city and Pernik.
b) Includes the okrugs of Russe, Razgrad and Silystra and Targoviste.
c) Includes the okrugs of Montana, Vidin and Vratza.
Note: E = employment, U = unemployment and N = Not in the labour force
Origin stock: Male: E = 5951, U = 1032, N = 4766; Female: E = 5105, U = 912, N = 6307.
15-24: E = 860, U = 493, N = 2087; 25-39: E = 4311, U = 723, N = 739.
40-54: E = 5052, U = 633, N = 864; 55+: E = 833, U = 94, N = 7383.
Higher: E = 2110, U = 118, N = 614; Secondary vocational: E = 2497, U = 338, N = 802.
Secondary general: E = 3156, U = 571, N = 1758; Primary: E = 3293, U = 917, N = 7899.
Source : Bulgarian labour force survey.
Bulgarian prime-age workers, as in most other countries, enjoy greater employment stability andlabour force attachment than other age groups. Older workers have separation rates three times as high asprime-age workers, and virtually all older workers leave the labour force when they lose a job. Thisaccounts for the low unemployment rate among older workers.
Younger workers also have higher separation rates than prime-age ones. Many younger workers becomeunemployed, but even more leave the labour force. This, too, is common in other transition countries. Incontrast with other countries, the hiring rates of young unemployed in Bulgaria are eight percentage pointslower than those of prime-age workers, and their flows from unemployment to inactivity are relativelyhigh. Large inflows into education are a partial explanation, but flows into the informal economyprobably are significant as well.
Transition probabilities by educational attainment show a common pattern: the higher the levelof educational attainment, the less likely is a job loss, and if unemployed, the easier it is to becomeemployed. Particularly striking, however, is the gap between individuals with primary education or lessand the higher educational levels. Those with the lowest level of educational attainment are the mostlikely to loose their job and least likely to re-enter employment by a significant margin. Because theyhave a higher probability of leaving the labour force, individuals with low educational attainment have an

CCNM/DEELSA(98)64
29
average completed duration of unemployment that is only marginally higher than other unemployed. Inabsolute numbers, however, the least educated are disproportionately represented among the unemployed.
Long-term unemployment
Bulgaria has a high and growing share of long-term unemployment (Chart 2.4). The share rosefrom about one-half in 1993 to nearly two-thirds of total unemployment by 1996, substantially more thanin many other transition economies. The pattern of exit probabilities from unemployment across durationsis not surprising: more than half leave unemployment within the first two months (28 per cent of the totalstock leave for employment, 23.8 per cent leave the labour force). The large proportion who leave thelabour force makes the Bulgarian case unusual. The duration category six to 12 months shows higher exitprobabilities than the category three to five months, but this can be explained by the average duration ofunemployment benefit receipt of about seven months. As in most countries, the long-term unemployed,that is, those with an unemployment spell of more than one year, have lower exit probabilities than theshort-term unemployed.
There are significant variations in the share of long-term unemployment among different groupsof unemployed in Bulgaria because of differences in the strength of their attachment to the labour forceand their chances of moving into employment. Although the difference in the shares of long-termunemployment by sex were small in 1996, differences in shares by other characteristics were large (seeTable 2.6.). Despite relatively better prospects among prime-age workers of finding a new job, nearly60 per cent of them who became unemployed remained so for more than one year -- a proportion that wassubstantially higher than that of any other group in Bulgaria. (By 1996, the proportion of this age groupwho remained unemployed for more than one year in Hungary and Poland ranged from about 9 to 11 percent, respectively.) This picture reflects the generally unfavourable labour market conditions in Bulgariasix years after the beginning of the transition.

CCNM/DEELSA(98)64
30
S o u rce : B u lg a r ia n la b o u r fo rce su rve y.
S to ck o f LT U (0 0 0 s) In c id e n ce o f LT U (% )S e p te m b e r 1 9 9 3 : 4 2 7 .6 5 2 .5Ju n e 9 4 : 4 3 1 .1 5 8 .7Ju n e 9 5 : 3 7 1 .4 6 5 .8M a rch 9 6 : 3 3 4 .2 6 2 .3
C h a rt 2 .4 L o n g -te rm u n e m p lo y m e n t b y d u ra tio n , 1 9 9 3 -9 6
L F S d a ta
S e p te m b e r 9 3 J u n e 9 4 Ju n e 9 5 M a rch 9 6
1 2 -1 7 m o n th s 1 8 -2 3 m o n th s 2 -3 ye a rs m o re th a n 3 ye a rs
0
2 0
4 0
6 0
8 0
1 0 0
Per
cen
t of t
otal
M e m o ra n d u m ite m :
Table 2.6 Characteristics of the unemployed, 1996
LFS data
Bulgaria Hungary Poland Slovak Republic
Rate of Share of Rate of Share of Rate of Share of Rate of Share of
unemployment LTU unemployment LTU unemployment LTU unemployment LTU
Female 14.1 46.7 8.8 35.7 13.9 56.4 12.5 50.4
Male 14.2 53.3 10.9 64.3 11.0 43.5 10.0 49.6
Youtha 34.4 21.7 19.2 20.2 28.5 21.2 20.6 22.4
Prime-ageb 12.2 57.9 8.8 .. 11.1 .. 9.8 68.4
Older c 9.5 4.3 6.2 9.0 7.2 9.5 5.9 7.9
Higher education 5.1 6.1 2.8 .. 4.2 .. 2.7 1.8
Secondary general education 13.9 28.7 7.2 .. 11.6 .. 12.7 4.8
Vocational education 11.1 15.4 11.7 .. 15.3 .. 9.9 55.1
Primary education or lessd 23.3 49.9 15.7 77.6 13.7 26.6 25.0 38.3
Total 14.1 100.0 10.0 100.0 12.3 100.0 11.1 100.0
a) 15-24 years old.
b) 25-49 years old.
c) 50 to retirement age.
d) Primary education and less figures include vocational long-term unemployed for Hungary and Poland.
Source: OECD-CCET Labour Market database.

CCNM/DEELSA(98)64
31
Regional differences
In Bulgaria, as in other Central and Eastern European countries, there are large regionaldifferences in labour market performance. The situation in selected regions (oblasts) is shown inTable 2.5. The city of Sofia has a much lower unemployment rate than the rest of the country. Its U/Vratio also is substantially lower than those of other regions. The inverse of this ratio is a rough measure ofthe average re-employment probability of an unemployed person, and Sofia apparently offers more jobopportunities to the unemployed than any other part of the country. It has a relatively dynamic labourmarket with a large (privately owned) service sector where most job creation occurs during the initialphase of economic transition). In contrast, Montana, Plovdiv and Russe have higher unemployment thanmost regions and the highest U/V ratios in the country. They have a high share of employment inagriculture (Montana) or industrial employment in declining sectors of heavy industry (Plovdiv andRusse). Areas with such an employment structure adjust more slowly to the shocks brought about by thecollapse of the former regime, and the introduction of liberalisation and stabilisation policies by reformgovernments.
Since the beginning of the reforms, the dispersion of regional unemployment rates has beenincreasing, even during periods when the national unemployment rate was declining. The continuedincrease, largely because the regions Montana and Russe did not experience as large a reduction inunemployment rates as the other regions, is unusual for transition economies. The dispersion of U/Vratios rose as well through 1995, even though the overall ratio fell after 1993, again because of the poorperformance of Montana and Russe. Montana and Russe clearly are the two regions with the worst labourmarket prospects in Bulgaria.
There also are important differences in labour market adjustment between the four geographicregions in Bulgaria: the metropolitan area of Sofia, the oblasts Russe and Montana, and the rest of thecountry. Five years into the transition, the labour markets of the metropolitan area of Sofia and Russe hadrelatively low inflows into unemployment and high job accession rates. In contrast, the labour market ofthe oblast of Montana seems to be plagued by large inflows into unemployment and by greater difficultiesfor the unemployed to find work than in the rest of the country.
Labour market policies
Both “active” and “passive” labour market programmes have played a relatively modest role.Total spending in 1996 was only 0.5 per cent of GDP, of which 0.1 per cent was spent for active measures.This is far less than is spent in most Central and Eastern European countries other than Romania.
The National Employment Service (NES) was established in 1989 with 122 local employmentoffices across the country. The main functions of the NES are the registration of the unemployed,counselling, and job brokerage. Its responsibilities were enlarged in 1993 to include participation in thedevelopment of labour market policy and other administrative tasks. The NES initially was responsiblefor the disbursement of unemployment benefits, but payments now are made by mail.
An extra-budgetary fund, the Professional Training and Unemployment Fund (hereafter referredto as the “Unemployment Fund”) was established in December 1989 to finance active and passive labourmarket policies. The NES administers the fund. Revenues came from compulsory employer contributionsuntil 1998, when employees were required to participate; transfers from the central budget, whileforeseen, have not occurred thus far (see Chapter 3).

CCNM/DEELSA(98)64
32
Passive policies
The unemployment benefit system has undergone important changes since 1989, most of whichhave tightened access and benefit levels. Because of more strict eligibility requirements, shorter benefitduration, and the spread of long-term unemployment, the share of the unemployed who receive benefitshas been declining. By the end of 1994, less than one-third of the registered unemployed were receivingunemployment benefits.
The standard unemployment benefit amount is 60 per cent of the average of gross monthlyearnings over the last nine months. Minimum and maximum benefits are 85 and 140 per cent of theminimum wage8. The maximum duration of benefits of 12 months requires over 25 years of service. Theminimum duration is four months, subject to the general requirement of) at least nine months of serviceduring the last 15 calendar months (see Chapter 3 for further details).
In January 1995, a special long-term unemployment assistance (LTUSA) scheme wasimplemented. It offered up to six months of flat-rate means-tested assistance to eligible householdscontaining an unemployed person who had been registered for at least 12 months. This introduced acomplicated sequence of potential eligibility for income support: centrally-financed unemploymentbenefits for up to 12 months; for the majority of unemployed workers who have a shorter period ofeligibility, locally-financed means-tested social assistance until 12 months of registered unemploymenthad been completed; centrally-financed LTUSA up to its maximum duration of six months; and ifeligibility for means-tested social assistance continued, a return to locally-financed income support.LTUSA was phased out in April 1997 by a decree of the then caretaker Government, and was replaced byan allowance of the same amount as the former LTUSA for a duration of three months instead of sixmonths, available to every unemployed person who had exhausted their individual maximum benefitduration -- without a means-test. In effect, it became an extension of the unemployment benefit system ata reduced, flat amount for all the unemployed. However, it did not remove all of the problems and costsassociated with recurrent flows into and out of multiple benefit regimes. (This process is discussed ingreater detail in the following chapters.)
The economic crisis which emerged in 1996 and persisted into 1997 provided a clear signal thatmore rapid restructuring of inefficient enterprises was needed. A temporary income support scheme untilthe end of 1997 was implemented to make it easier for workers to accept the collective layoffs thataccompany firm restructuring or liquidation. Workers made redundant could choose between standardunemployment benefits or a lump-sum severance payment, which was initially established at 250 USD -- roughly three times the average wage in July 1997. It was increased to a maximum of the Lev equivalentof 380 USD in September 1997, with the amount dependent upon previous gross wages, job tenure, andage of the worker. If the lump-sum is chosen, there is a waiting period of 18 months before anunemployed worker can claim unemployment benefits.
One of the desirable features of a lump-sum payment from a policy perspective, and from theperspective of the recipient, is that as long as the full amount may be retained even if a job is found, thereis a strong incentive accept the payment and to find work quickly. But not everyone will find a jobquickly, and the waiting period of 18 months for unemployment benefit eligibility may be too severe forthe long-term unemployed.
8. The minimum benefit was 90 per cent of the minimum wage prior to August 1997.

CCNM/DEELSA(98)64
33
Active policies
A broad menu of active labour market policies (ALMP) exists in Bulgaria, including mostprogrammes in place in OECD countries. But the scale of active measures is extremely modest. Manyprogrammes, such as the measure to start a business, mobility grants, and wage subsidies have very fewparticipants. The largest programmes concern retraining and temporary job creation, particularly in crisisregions. Since April 1997, grants to facilitate greater geographic mobility among the unemployed havebeen introduced. The grants cover up to 50 per cent of transportation costs for a maximum of six monthsif the workplace is far from home. There also is a subsidy for the unemployed who must relocate to adifferent region to work, up to a maximum amount of twice the minimum wage. Evidence from OECDcountries on the effectiveness of efforts to enhance mobility has not been encouraging: the schemes oftenare not sufficiently generous to substantially relieve the costs incurred in moving -- or they are open toabuse.
Retraining programmes in Bulgaria suffer from a common problem: candidates who have thebest change of finishing the course usually are chosen9. Courses are offered after skill profiles desired bylocal enterprises have been determined. Therefore, it is not surprising that the unemployed who haveparticipated in a retraining course have higher re-employment probabilities than those who have notparticipated (Jones and Kato, 1993). Bearing the cost of such training through the public purse at a timewhen firms may not be able to provide training in the workplace could be constructive. But selecting theunemployed most likely to succeed also is controversial: they might have found employment without thetraining, and the costs of training may not bring commensurate benefits. But it also may be sub-optimal tospend scarce resources on individuals who may not be hired, even with the training.
Temporary job creation is the largest programme10. It was initially targeted on the long-termunemployed, but the unemployed who have a continuous spell of more than six months now are included.Initially, only the municipality or a firm financed from the municipal budget could participate, but it wasextended in 1996 to state and private firms which fire workers to engage in “socially useful activities”.According to regulations in existence since 1994, the Unemployment Fund pays the minimum wage andsocial security contribution for workers hired under this programme. The jobs created under the schemeare intended to be short term (up to five months), with only one additional month of work required to re-qualify participants for unemployment compensation rather than social assistance paid for by themunicipality. In this sense, the temporary job creation programme provides income support which isanalogous to social assistance; only the financing source is different11.
There have been no attempts to evaluate the direct impact of the scheme on outflows fromunemployment into regular employment. However, experience in Hungary, Poland, and the CzechRepublic indicates that the chance of getting a regular job often is lowered by participation in publicworks. One explanation relates to the effects of stigma 12.
9. In all the labour offices visited by the OECD mission, this pattern of choosing course participants was
dominant. Kotzeva et al. (1996) also find such “creaming” in retraining programmes.
10. The average number of participants per month in the job creation programme between June 1994 andSeptember 1995 was nearly 17 times larger than the number of participants in training measures (26 030versus 1 548, respectively).
11. Staff in local employment offices and in local social care centres indicated that the programme was targetedon ethnic minorities whose probability of finding regular employment was small, and whose need forincome support was large.
12. An overview of evaluation studies in these countries is given in Lehmann (1995).

CCNM/DEELSA(98)64
34
Public works nevertheless are believed to encourage the labour market attachment ofmarginalised groups. They also respond to equity concerns: individuals who are particularlydisadvantaged in the labour market receive earnings, albeit temporarily.
A primary objective of active labour market policies is to facilitate stable re-employment forunemployed workers. Evaluation of active measures in OECD countries suggests that not all measureswork equally well, or affect all types of participants in a consistent way (Fay, 1996). It is generallybelieved that counselling and job-search assistance is effective for most groups, but the effects of trainingprogrammes are less certain. The gains to individuals often are modest. Moreover, the ability of activemeasures to help large numbers of the unemployed is limited. Therefore, particular care in targeting isneeded to avoid wasting the limited resources available for active measures. The scale and severity of thelabour market problems in Bulgaria suggest that the potential success of active labour market policies maydepend in large part on improved labour market performance more generally.

CCNM/DEELSA(98)64
35
CHAPTER 3
THE SOCIAL PROTECTION SYSTEM
The turbulent process of transformation to a market economy in Bulgaria has resulted insignificant declines in real household income. Since the beginning of the reforms in 1991, the level andduration of open unemployment has increased, employment has fallen dramatically, and real wages haveeroded in value. While the economic status of a small minority of people may have improved, poverty(however measured) has become more prevalent. As result, reliance on social transfers increased at thesame time as the revenue capacity of the state and tax collections declined. Although the value of socialtransfers as a share of average household income grew, reaching over 20 per cent by 1994, theirpurchasing power fell dramatically.
This chapter looks at the social protection system and the issues that have emerged: reductionsin income security, increased pressures on social expenditures and social charges, and the structuralreforms that might help to smooth the transition process and improve the efficiency and effectiveness ofsocial expenditures. The new group that is swelling the ranks of the poor, the long-term unemployed, area particular focus.
Household income
All households have been affected by some combination of a drop in real wages, a loss ofearnings, declines in the real value of public income transfers, and the removal of price subsidies. Themost dramatic declines in household income occurred during 1996, with some improvement noticeable bythe fourth quarter of 1997. The value of the average wage declined by more than 60 per cent by the end of1996, but subsequently rose from 40 to 75 per cent of the level of real wages in 1991. Other incomesources fared worse: the average pension in 1996 was worth only one-third as much as in 1991, andshowed only a slight improvement in 1997; the child allowance fell to one-quarter of its earlier value; thevalue of unemployment benefits eroded by more than one-half (Table 3.1).
The composition of household income also changed. Wages and salaries as a share of averagegross household income declined from about 57 per cent in 1990 to 38 per cent by 1994, and rose to44 per cent by 1997. Although unemployment benefits were a negligible part of average householdincome in all income deciles, they became relatively more important as a component of income in thelowest deciles. The distribution of unemployment benefits, however, does not reflect the incidence ofunemployment or the severity of its effects: only about one-quarter of the registered unemployed areeligible to receive benefits; even fewer receive them for the full 12 month period of eligibility. Inaddition, most of the unemployed had exhausted their benefits (more than one-half of the unemployed by
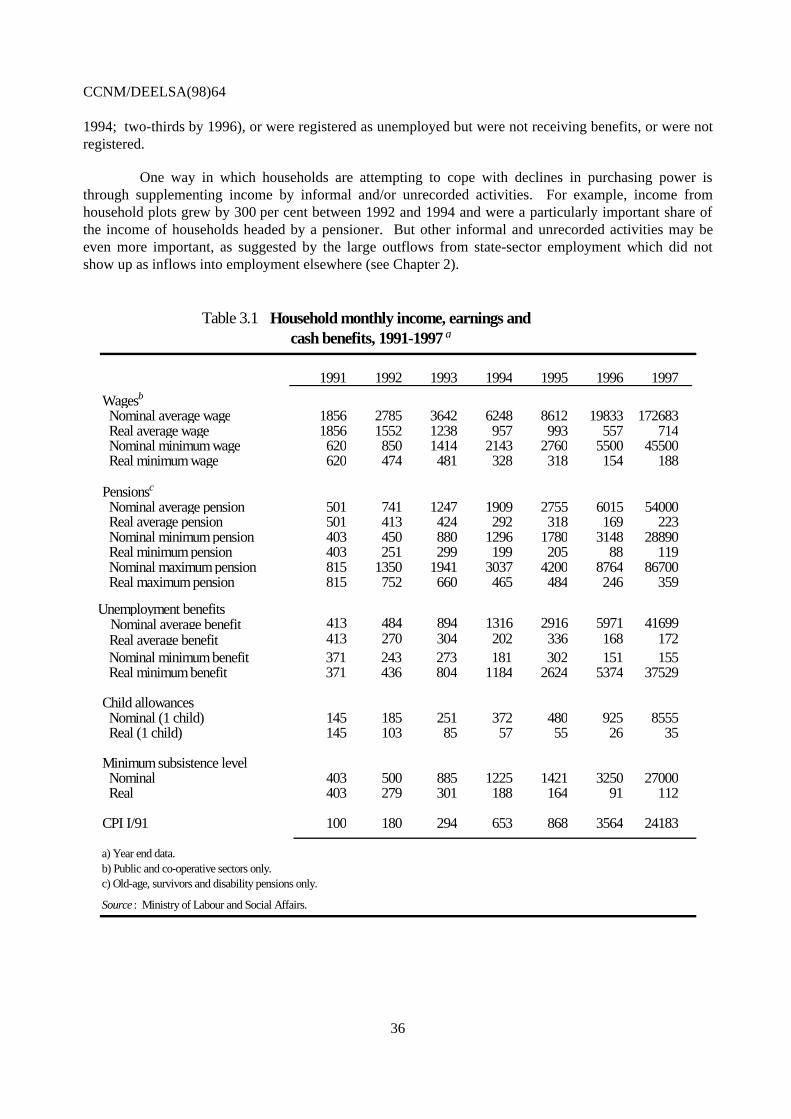
CCNM/DEELSA(98)64
36
1994; two-thirds by 1996), or were registered as unemployed but were not receiving benefits, or were notregistered.
One way in which households are attempting to cope with declines in purchasing power isthrough supplementing income by informal and/or unrecorded activities. For example, income fromhousehold plots grew by 300 per cent between 1992 and 1994 and were a particularly important share ofthe income of households headed by a pensioner. But other informal and unrecorded activities may beeven more important, as suggested by the large outflows from state-sector employment which did notshow up as inflows into employment elsewhere (see Chapter 2).
Table 3.1 Household monthly income, earnings andcash benefits, 1991-1997 a
1991 1992 1993 1994 1995 1996 1997
Wagesb
Nominal average wage 1856 2785 3642 6248 8612 19833 172683 Real average wage 1856 1552 1238 957 993 557 714 Nominal minimum wage 620 850 1414 2143 2760 5500 45500 Real minimum wage 620 474 481 328 318 154 188
Pensionsc
Nominal average pension 501 741 1247 1909 2755 6015 54000 Real average pension 501 413 424 292 318 169 223 Nominal minimum pension 403 450 880 1296 1780 3148 28890 Real minimum pension 403 251 299 199 205 88 119 Nominal maximum pension 815 1350 1941 3037 4200 8764 86700 Real maximum pension 815 752 660 465 484 246 359
Unemployment benefits
413 270 304 202 336 168 172 Nominal minimum benefit 371 243 273 181 302 151 155 Real minimum benefit 371 436 804 1184 2624 5374 37529
Child allowances Nominal (1 child) 145 185 251 372 480 925 8555 Real (1 child) 145 103 85 57 55 26 35
Minimum subsistence level Nominal 403 500 885 1225 1421 3250 27000 Real 403 279 301 188 164 91 112
CPI I/91 100 180 294 653 868 3564 24183
a) Year end data.b) Public and co-operative sectors only.c) Old-age, survivors and disability pensions only.
Source : Ministry of Labour and Social Affairs.
413 484 894 1316 2916 5971 41699 Nominal average benefit Real average benefit
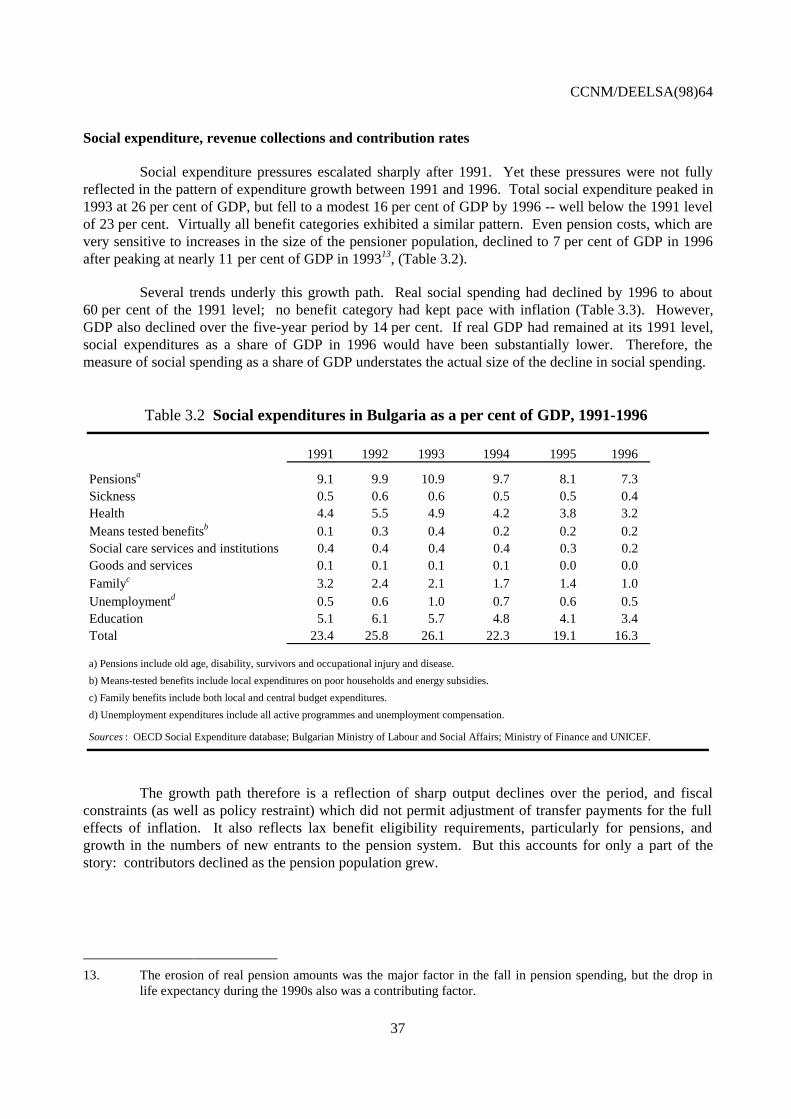
CCNM/DEELSA(98)64
37
Social expenditure, revenue collections and contribution rates
Social expenditure pressures escalated sharply after 1991. Yet these pressures were not fullyreflected in the pattern of expenditure growth between 1991 and 1996. Total social expenditure peaked in1993 at 26 per cent of GDP, but fell to a modest 16 per cent of GDP by 1996 -- well below the 1991 levelof 23 per cent. Virtually all benefit categories exhibited a similar pattern. Even pension costs, which arevery sensitive to increases in the size of the pensioner population, declined to 7 per cent of GDP in 1996after peaking at nearly 11 per cent of GDP in 199313, (Table 3.2).
Several trends underly this growth path. Real social spending had declined by 1996 to about60 per cent of the 1991 level; no benefit category had kept pace with inflation (Table 3.3). However,GDP also declined over the five-year period by 14 per cent. If real GDP had remained at its 1991 level,social expenditures as a share of GDP in 1996 would have been substantially lower. Therefore, themeasure of social spending as a share of GDP understates the actual size of the decline in social spending.
Table 3.2 Social expenditures in Bulgaria as a per cent of GDP, 1991-1996
1991 1992 1993 1994 1995 1996
Pensionsa 9.1 9.9 10.9 9.7 8.1 7.3Sickness 0.5 0.6 0.6 0.5 0.5 0.4Health 4.4 5.5 4.9 4.2 3.8 3.2Means tested benefitsb 0.1 0.3 0.4 0.2 0.2 0.2Social care services and institutions 0.4 0.4 0.4 0.4 0.3 0.2Goods and services 0.1 0.1 0.1 0.1 0.0 0.0Familyc 3.2 2.4 2.1 1.7 1.4 1.0Unemploymentd 0.5 0.6 1.0 0.7 0.6 0.5Education 5.1 6.1 5.7 4.8 4.1 3.4Total 23.4 25.8 26.1 22.3 19.1 16.3
a) Pensions include old age, disability, survivors and occupational injury and disease.
b) Means-tested benefits include local expenditures on poor households and energy subsidies.
c) Family benefits include both local and central budget expenditures.
d) Unemployment expenditures include all active programmes and unemployment compensation.
Sources : OECD Social Expenditure database; Bulgarian Ministry of Labour and Social Affairs; Ministry of Finance and UNICEF.
The growth path therefore is a reflection of sharp output declines over the period, and fiscalconstraints (as well as policy restraint) which did not permit adjustment of transfer payments for the fulleffects of inflation. It also reflects lax benefit eligibility requirements, particularly for pensions, andgrowth in the numbers of new entrants to the pension system. But this accounts for only a part of thestory: contributors declined as the pension population grew.
13. The erosion of real pension amounts was the major factor in the fall in pension spending, but the drop in
life expectancy during the 1990s also was a contributing factor.

CCNM/DEELSA(98)64
38
Table 3.3 Real social expenditures in Bulgaria 1991-1996 (1991 levs)
1996/911991 1992 1993 1994 1995 1996 % change
Pensionsa 12 352 11 104 11 099 7 815 8 084 3 406 -72.4Sickness 722 699 617 433 483 179 -75.2Health 5 919 6 126 5 004 3 361 3 829 1 510 -74.5M eans-tested benefitsb 172 318 396 182 159 108 -37.5Social care services and institutions 560 429 390 284 301 116 -79.3Goods and services 83 76 74 56 41 14 -83.7Familyc 4 310 2 737 2 179 1 365 1 406 484 -88.8Unemploymentd 718 692 970 568 628 248 -65.4Education 6 980 6 784 5 829 3 837 4 096 1 559 -77.7Total 31 815 28 965 26 558 17 901 19 027 7 623 -76.0
CPI/91 100 180 294 653 868 3564
See Table 3.2 for notes and sources.
As Table 3.4 shows, the ratio of pensioners to contributors rose dramatically from 53 per cent in1989 to a peak of 82 per cent in 1994, and declined slightly in subsequent years. Changes in the numberof contributors to the pension system were the dominant factor underlying the trends both before and after1994. Between 1989 and 1994, the number of pensioners grew by 10 per cent, and the number ofcontributors declined by 30 per cent; between 1994 and 1996, the pensioner population declined by 3 percent, while contributors increased by 6 per cent.
Table 3.4 Public pension dependency ratios in Bulgaria, 1989-1996a
1989 1990 1991 1992 1993 1994 1995 1996
52.8 55.1 64.9 78.0 80.5 82.3 77.9 76.4
a) Number of pensioners as a per cent of the total number of pension contributors.
Source: World Bank, Social Challenges of Transition database.
Reduced revenue collections because of declines in employment and earnings, coupled with theexistence of a shadow economy and tax compliance problems14, created a vicious circle: as the revenuebase shrank, social security contributions15 had to be raised; this discourages employment and encouragestax avoidance and evasion, which, in turn, creates pressure for further rate increases.
Contribution rates were increased from 26 to 35 per cent in 1991, and higher rates wereimplemented for occupations with earlier retirement privileges at 45 per cent and 50 per cent.
14. Revenue collection declines were reinforced by the practice of permitting some enterprises to forgo
payment of social charges. The effects of this practice cumulated with the declines in revenue resultingfrom the growth in short-term “civil” contracts, under which employers were exonerated from paying socialcharges (see footnote 5). As a result, firms in difficulty were effectively being subsidised by the socialinsurance system.
15. In addition to pensions, social insurance contributions are used to finance work injury, sickness, familybenefits, among other benefits. A separate contribution rate is earmarked for unemployment benefits.

CCNM/DEELSA(98)64
39
Nevertheless, deficits in the Social Insurance Fund (SIF) persist: they reached more than 10 per cent ofexpenditures in 1993, and remained close to that level in subsequent years. Payment of benefits requiredinfusions from general tax revenues and from the surplus revenues of the Unemployment Fund.Contribution rates were again raised in 1996, to 39 per cent (49 per cent to 54 per cent of payroll for theone-third of workers entitled to earlier retirement) 16.
The separate contribution rate for the Unemployment Fund was reduced from 7 per cent to 5 percent in 1996, and to 4.5 per cent in 1998 -- 3.6 per cent to be paid by the employer; 0.9 per cent, by theemployee (effective as of 1 July). Contribution rates therefore range from 44 per cent to 59 per cent oftotal payroll until mid-1998 when they are set to decline by 0.5 per cent. They nevertheless remainalarmingly high relative to most other countries (see Table 3.5).
T a b l e 3 . 5 S o c i a l s e c u r i t y c o n t r i b u t i o n r a t e s i n B u l g a r i a a n di n s e l e c t e d O E C D c o u n t r i e s , c i r c a 1 9 9 5 a b
E m p l o y e e E m p l o y e r T o t a l
B u l g a r i a c
T o t a l 2 . 9 4 0 . 6 - 5 5 . 6 4 3 . 5 - 5 8 . 5 P e n s i o n s 2 . 0 3 7 - 5 2 3 9 - 5 4
C z e c h R e p u b l i c T o t a l 1 3 . 3 3 5 . 3 4 8 . 5 P e n s i o n s 6 . 8 0 . 0 6 . 8
H u n g a r y T o t a l 1 1 . 5 4 8 . 2 5 9 . 7 P e n s i o n s 6 . 0 2 4 . 5 3 0 . 5
A u s t r i a T o t a l 1 8 . 2 2 4 . 3 4 2 . 5 P e n s i o n s 1 0 . 3 1 2 . 6 2 2 . 8
F r a n c e T o t a l 2 4 . 3 3 7 . 8 6 2 . 1 P e n s i o n s 6 . 6 8 . 2 1 4 . 8
G e r m a n y T o t a l 1 9 . 7 1 9 . 7 3 9 . 3 P e n s i o n s 9 . 3 9 . 3 1 8 . 6
P o r t u g a l T o t a l 1 1 . 0 2 3 . 8 3 4 . 8
S w e d e n T o t a l 4 . 0 3 0 . 5 3 4 . 5 P e n s i o n s 1 . 0 1 9 . 1 2 0 . 1
U n i t e d K i n g d o m T o t a l 1 2 . 0 1 0 . 2 2 2 . 2 P e n s i o n s 1 0 . 0 1 0 . 2 2 0 . 2
a ) C o n t r i b u t i o n r a t e s i n B u l g a r i a f i n a n c e o l d - a g e , s u r v i v o r s , d i s a b i l i t y , w o r k i n j u r y a n d m o s t f a m i l y b e n e f i t s .b ) M a x i m u m c o n t r i b u t i o n r a t e s a r e p r e s e n t e d e x c e p t i n B u l g a r i a w h e r e t h e m i n i m u m a n d m a x i m u m a r e g i v e n .c ) R a t e s e f f e c t i v e a s o f 1 J u l y 1 9 9 8 ; t o t a l r a t e s w e r e 0 . 5 p e r c e n t h i g h e r u n t i l t h a t d a t e .S o u r c e s : M i n i s t r y o f L a b o u r a n d S o c i a l A f f a i r s , O E C D ( 1 9 9 8 ) , T h e T a x / B e n e f i t P o s i t i o n
o f E m p l o y e e s 1 9 9 5 - 1 9 9 6 .
Overview of the benefit system
Bulgaria currently provides a comprehensive system of social insurance and social assistance(see Annex, Table A.1) In the former regime, guaranteed employment for people of working age was the 16. Contribution rates for 1996 and after include a 2 per cent levy on employees. In earlier years, only
employers contributed.

CCNM/DEELSA(98)64
40
primary mechanism for income protection, and pensions for those not expected to work were available,along with an array of family benefits and other income support and goods and services provided by thestate as employer. These benefits exist today, although some changes have occurred. In the post-1989period, unemployment and social assistance benefits were added or altered with the disappearance ofemployment guarantees. Other benefits were modified or eliminated, or new ones created, often inresponse to immediate problems, either through direct policy measures or from the effects of inflation.Among the benefits eliminated were an array of price subsidies.
Most social insurance benefit entitlements are related to employment. They are financed largelyby employer contributions, and since 1996, by employee contributions of 2 per cent of earnings to the SIF.The global contribution rate is intended to finance all but unemployment benefits, for which a separatecontribution is paid to the Unemployment Fund. No specific assignment of revenues to benefit sub-categories is made.
These Funds, however, are not independent of the state budget, nor of each other: interest-freetransfers from the state budget and from the Unemployment Fund to make up shortfalls in the SIF haveoccurred repeatedly in recent years; transfers of surplus moneys in the Unemployment Fund to the statebudget to finance unrelated spending also have occurred.
Most benefits for low-income households are administered and paid for by local government.This includes the responsibility for delivery and financing of family benefits for uninsured parents. Localrevenue in almost all municipalities, however, includes a global transfer from the central budget; thetendency to earmark central funds for a particular benefit has emerged in recent years.
Further reforms in benefit structures and their financing are desirable, not only because of theneed for fiscal restraint, but also because the benefit system and its financing has become unnecessarilycomplex, administratively cumbersome, and inefficient. As a consequence, it is difficult monitorprogramme performance, to satisfy the need for public understanding of individual and familyentitlements, or to maintain a high level of public satisfaction.
Pensions
The pension system provides old-age, survivors, disability, and work injury pensions and coversall occupations and sectors of the economy. Many features of the system favour easy and early eligibilityfor benefits. The resulting widespread distribution of pensions, among other factors, has led to highercosts than might otherwise be the case and to low benefits. Further ageing of the population willexacerbate this situation over the longer term, unless reforms are introduced quickly.
A comprehensive pension system should set the stage for equitable access to the replacement ofearnings that are lost because of retirement, disability, or death of a family provider. In practice, old-agepensions are effectively composed of multiple systems which treat occupational categories differentlyaccording to the risks to health of working conditions or the arduous nature of the job. Occupations areclassified according to three categories: the more risk associated with an occupation, the lower the ageand the years of service required for entry into retirement. Although not an uncommon feature ofpensions in former command economies, it defines early retirement as a privilege for certain workers andinvites abuse, particularly since benefits are not reduced on an actuarial basis when lower age or years ofservice are permitted17, (see Table 3.6).
17. An increase in retirement age is under consideration by the Parliament.
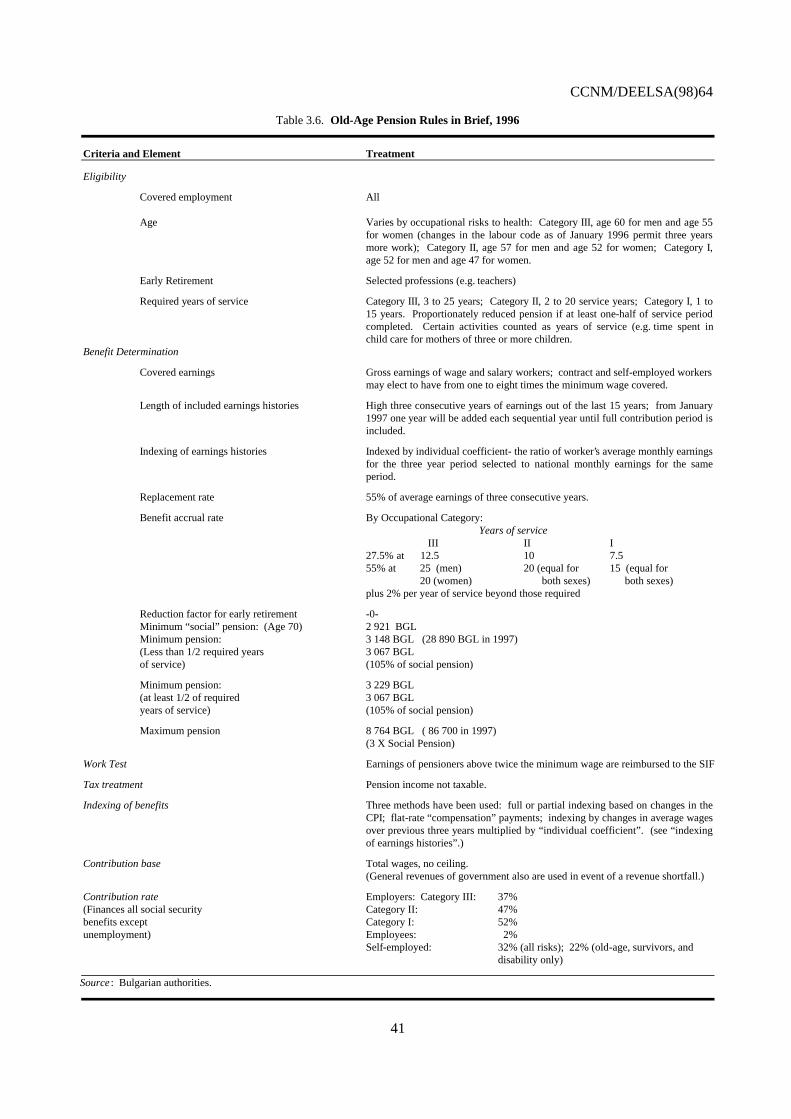
CCNM/DEELSA(98)64
41
Table 3.6. Old-Age Pension Rules in Brief, 1996
Criteria and Element Treatment
Eligibility
Covered employment All
Age Varies by occupational risks to health: Category III, age 60 for men and age 55for women (changes in the labour code as of January 1996 permit three yearsmore work); Category II, age 57 for men and age 52 for women; Category I,age 52 for men and age 47 for women.
Early Retirement Selected professions (e.g. teachers)
Required years of service Category III, 3 to 25 years; Category II, 2 to 20 service years; Category I, 1 to15 years. Proportionately reduced pension if at least one-half of service periodcompleted. Certain activities counted as years of service (e.g. time spent inchild care for mothers of three or more children.
Benefit Determination
Covered earnings Gross earnings of wage and salary workers; contract and self-employed workers may elect to have from one to eight times the minimum wage covered.
Length of included earnings histories High three consecutive years of earnings out of the last 15 years; from January1997 one year will be added each sequential year until full contribution period isincluded.
Indexing of earnings histories Indexed by individual coefficient- the ratio of worker’s average monthly earningsfor the three year period selected to national monthly earnings for the sameperiod.
Replacement rate 55% of average earnings of three consecutive years.
Benefit accrual rate By Occupational Category:Years of service
III II I27.5% at 12.5 10 7.555% at 25 (men) 20 (equal for 15 (equal for
20 (women) both sexes) both sexes)plus 2% per year of service beyond those required
Reduction factor for early retirement -0-Minimum “social” pension: (Age 70) 2 921 BGLMinimum pension: 3 148 BGL (28 890 BGL in 1997)(Less than 1/2 required years 3 067 BGLof service) (105% of social pension)
Minimum pension: 3 229 BGL(at least 1/2 of required 3 067 BGLyears of service) (105% of social pension)
Maximum pension 8 764 BGL ( 86 700 in 1997)(3 X Social Pension)
Work Test Earnings of pensioners above twice the minimum wage are reimbursed to the SIF
Tax treatment Pension income not taxable.
Indexing of benefits Three methods have been used: full or partial indexing based on changes in theCPI; flat-rate “compensation” payments; indexing by changes in average wagesover previous three years multiplied by “individual coefficient”. (see “indexingof earnings histories”.)
Contribution base Total wages, no ceiling.(General revenues of government also are used in event of a revenue shortfall.)
Contribution rate Employers: Category III: 37%(Finances all social security Category II: 47%benefits except Category I: 52%unemployment) Employees: 2%
Self-employed: 32% (all risks); 22% (old-age, survivors, and disability only)
Source : Bulgarian authorities.

CCNM/DEELSA(98)64
42
Retirement age and early retirement
The standard age of entitlement to full benefits at retirement for “normal” (Category III)occupations is low (age 60 for men; age 55 for women) relative to those of most OECD countries, but notin comparison to most Central and Eastern European countries in transition, (Table 3.7).
Table 3.7. Standard age of retirement in Bulgaria and in selectedcountries, by sex, 1997
Men Women Men Women
Bulgaria 60 55 Iceland 67 67Poland 65 60 Ireland 66 66Romania 62 57 Italyb 63 58
Australia 65 61 Japanc,d 60 58Austria 65 60 Luxembourg 65 65Belgium 65 61 a Netherlands 65 65Canada 65 65 New Zealand 61 61Czech Republic 60 53-57 Norway 67 67Denmark 67 67 Portugal 65 62 e
Finland 65 65 Spain 65 65France 65 65 Sweden 65 65Germany 65 65 Switzerland 65 62Greece 65 60 United Kingdom 65 60Hungary 60 56 United Statesf 65 65
a) Will be raised to age 65 by the year 2009.
b) Will be raised by one year every two years until age 65 for men and age 60 for women are attained in 2001.
c) The age for women will be raised to 60 years by the year 2000.
d) Earnings-related scheme only; age of eligibility for flat-rate scheme is 65.
e) Will be raised to age 65 in 1999.
f) Will be raised to age 67 between the years 2000 and 2027.
Source : OECD-CCET Labour Market database.
As in other countries, there is no minimum age requirement for disability or work injurybenefits18. The effective age of retirement, however, is well below the standard one in Bulgaria. This is inpart because of the earlier retirement permitted the two high-risk occupational categories (age 57 for menand age 52 for women; age 52 for men and age 47 for women). In addition, the Labour Code specifiesthat individuals who have reached, or are close to the age of eligibility for a pension, must be the firstselected for involuntary retirement if a layoff occurs. Additional efforts also were made in the early 1990sto facilitate earlier retirement in order to offset burgeoning unemployment: an ad hoc change in 1991
18. The disability pension population is relatively old, since disability is highly correlated with age. The modal
age bracket of disability pension beneficiaries in 1995 was age 50 to age 60. Required years of service varywith age, from zero years up to age 20 to 15 years above age 55.

CCNM/DEELSA(98)64
43
gave the right to early retirement at age 57 for men and age 52 for women to everyone dismissed becauseof closure or a risk of closure of an enterprise. Benefits were reduced by 10 per cent of the amount thatwould have been received at standard ages. However, the increase in pensioners forced the government toeliminate the provision barely one year later. The age of eligibility for occupations in the first twocategories also was raised by two years to their current levels in 1992 in order to stem the inflows.
The numbers of old-age pensioners grew by 12 per cent between the mid-1980s and 1996. Thepeak size of the pensioner population occurred during 1991 to 1993 -- a period of massive labourshedding; it declined slightly after 1993, in large part because of the eligibility changes made in 1992 19.
In contrast to old-age pension inflows, disability pensions have not been a major path into earlyretirement. A relatively small proportion of the pensioner population receives disability benefits (about7 per cent in 1996), and no increase occurred in the stock of disability pensioners in the post-1990 period.The special categories of early retirement, however, may serve as a de facto substitute for disabilitypensions.
Years of service
The number of years of work needed to qualify for a full pension at retirement in normaloccupations is 25 years for men and 20 years for women (Category III); 20 and 15 years in categories IIand I, respectively, without any distinction by sex. At least one-half of the required years of service ineach occupational category is needed to receive a proportionately reduced pension. Vesting requirementsof 15 to 25 years are not uncommon elsewhere, but there is diversity across countries: from 40 to 45 years(for example, Belgium) to as few as three years (for example, Canada). But the length of the averagework-life generally exceeds 30 years20. Moreover, the tendency in OECD countries has been to movetowards longer vesting periods (for example, in France, Hungary, Sweden, and the United States).
A relatively short vesting period allows near-universal eligibility, but at the cost of highexpenditures or low benefits -- or, as in Bulgaria, both. A longer work requirement reduces both theeligible population and costs. It does this by indirectly raising the standard retirement age, sinceindividuals with shortfalls in vesting requirements can acquire the needed years of work by retiring later.
The average length of service required of old-age pensioners in Bulgaria is well below 25 years.In part, this occurs because of the preferential treatment of certain occupational groups. (About 30 percent of employees in the state sector have jobs which allow for early retirement.) But it is also reduced bypermitting partial pensions with reduced years of service. The option of a partial pension as low as one-half of the full amount has an added disadvantage -- lowered monthly benefits for all the years ofretirement.
Although some flexibility in the age of retirement is desirable, it need not be done at the highcost that results from a very short vesting period in the primary pension system. It may be helpful, evennecessary, to facilitate an exit from unemployment for people who are near retirement age when labourmarket conditions are bad. But using the pension system as an extension of unemployment benefits is not
19. The growth in the number of pensioners from 1991 to 1993 relative to 1990 exceeded that of the population
aged 60 years and over by about 5 per cent.
20. In Hungary, for example, the average worklife for employed men in 1992 was 36 years, and one-half ofthem worked more than 40 years; for women, the average was 28 years of work (OECD, 1995).

CCNM/DEELSA(98)64
44
appropriate: it is too difficult (and unfair) to change pension policy frequently, and short-term policiesthat are not consistent with long-term considerations, such as population ageing, may alleviate oneproblem at the cost of creating another. As mentioned previously, this was the reason why the option toretire three years below the standard age of eligibility, enacted for labour market reasons in 1991, waseliminated in 1992.
The alternative could include the creation of a temporary programme for redundant workers,who are near retirement age and who have poor labour market prospects, to help them bridge the gap untilretirement. The eligibility conditions should be stringent, and the benefits should be less generous thanretirement pensions. This, in combination with social assistance for families with inadequate income,would be a more efficient use of limited resources.
Determination of benefit amounts
Before January 1997, benefits were determined on the basis of an average of three consecutiveyears of highest earnings out of the previous 15 years of work. After that date, the averaging period willincrease each year so that an individual’s full contribution period eventually will be included. This willprovide a better reflection of average earnings; minimise the sometimes inequitable influence ofdifferences in employment patterns on benefit amounts; and limit the possibilities of collusion withemployers to gain higher pension amounts.
The pensioner receives 55 per cent of the average wage calculated over the relevant period if allconditions relating to age and years of service are satisfied; an additional amount of 2 per cent per year ofservice beyond those required is granted. The “social” pension defines the minimum; the maximum isthree times the minimum (see Table 3.6).
All three categories of occupations, despite differences in requirements with respect to age andyears of service, have the same formula applied to determine benefits. In practice, this means that theunderlying benefit accrual rates per year of service differ substantially among categories of workers. Theeffective accrual rates are 2.20 per cent per year with 25 years of service (men, category III); 2.75 percent per year for 20 years (women category III, men and women, category II); 3.67 per cent per year for15 years (category I). In that further years of work are valued at a lower yearly accrual rate of 2 per cent,the incentive to work beyond the required years also is reduced, particularly in the privileged categories.The higher costs associated with elevated accrual rates are reflected in the higher contribution rate paid byemployers for higher risk categories. But this differentiation does not change the work incentives ofindividuals since they pay a uniform contribution rate in all occupational categories.
The concerns are not limited to the cost of earlier retirement and to work disincentives: thefairness of the procedure is arguable. A pension system which recognises privileged categories candamage taxpayer support, and it reinforces pressures to extend privileges to other job categories. If someworking conditions pose a risk to health, the incentive to improve those conditions will be increased if theemployer bears the full cost for earlier retirement rather than workers or taxpayers21.
21. In Poland, for example, transfer of the responsibility for special occupational categories with early
retirement privileges to employer-sponsored pension plans in the private sector has been proposed. To theextent that the employer cannot shift costs through lower wages or higher prices, earlier retirement could bereduced. This result also depends upon integration rules between public and private pensions (see OECD,1992a).

CCNM/DEELSA(98)64
45
Pension indexing
Indexing earnings histories, benefits when awarded, or benefits in payment were not majorconcerns before the 1990s: the wage-averaging period was only three years, and inflation was not aproblem. With the upsurge of inflation and the rapid erosion of real benefits, indexing became critical.Flat-rate “compensation” for inflation was added to pension benefits several times after the inflationaryshock of 1991. This resulted in compression of the benefit distribution. Periodic attempts were made todirectly increase the benefit dispersion by formulae, which raised the ratio between minimum andmaximum benefits. However, neither the goal of increased benefit differentiation, nor the goal ofprotection against benefit erosion was well served. The benefit dispersion remained narrow, and by 1996,the average pension had declined in real terms by two-thirds, and the minimum pension, by nearly 80 percent. The benefit dispersion, in particular, became a source of policy concern.
In 1996, the decision was taken to recalculate pensions by an “individual coefficient” whichreflects movements in average wages. The change was more significant than an adjustment for inflation.This procedure may avoid any further compression of the benefit distribution, and may permit evenfurther benefit dispersion as the variance of the wage distribution itself increases. But it does notadequately address the issue of the capacity of the economy to pay for such increases.
The extent to which benefits should be indexed, the mechanism for doing so, and the extent towhich indexation should be automatic is a difficult decision. Since 1991, growth in real expenditure ontransfers in Bulgaria has been restrained by partial indexing of benefits. The disadvantage of this hasbeen, of course, that many of those reliant on benefits have experienced considerable hardship. But fullyautomatic indexation of benefits may be inappropriate: inflation can be a symptom of a general excessdemand on a nation's resources, and pensioners cannot be immune in all circumstances from the need toreduce those demands.
Moreover, neither indexing based on changes in consumer prices nor on average wagemovements operate as intended under all circumstances. Movements in wages generally are related to theway pensions are financed, and therefore may be the more stable option - but only if indexing is related tothe total wage bill and not simply to average wages. Total wages reflect both movements in the averagewage and in the level of employment, both of which are important elements of the capacity of theeconomy to pay for benefit increases.
Unemployment benefits
The unemployment benefit system, modified several times by decree since 1989, has now beencodified in the Unemployment Security and Employment Incentives Act of 1997, effective as of 1 January1998. Several significant changes in the unemployment benefit programme were made in addition to thereduction in the contribution rate and, for the first time, requires employees to contribute.
Previous employment of at least nine months during the last 15 calendar months is required, or ifin seasonal employment, six months during the previous year, registration at the local labour office, andwillingness to accept training and a job, if offered. (Old-age and disability pensioners are not eligible forunemployment benefits.) The current provisions continue the basic benefit amount of 60 per cent of theworker's previous gross wage if unemployment is involuntary. An additional allowance of 60 per cent ofthe unemployment benefit is granted for time spent in training (slightly more than previously offered).Workers entitled to unemployment benefits who accept part-time employment at less than the minimumwage are entitled to receive one-half of their unemployment benefit.

CCNM/DEELSA(98)64
46
There is no waiting period, and the duration of benefits is between 4 and 12 months, with themaximum requiring at least 25 years of recorded service. The former requirement was a seven-daywaiting period; the minimum benefit duration was six months. Workers who voluntarily quit their jobs orwho are dismissed for breach of discipline are provided benefits for a maximum of four months at 80 percent of the minimum wage after a waiting period of three months.
If previous entitlement to an unemployment benefit occurred within the past three years, thecurrent duration of entitlement is limited to a maximum of four months regardless of years worked. Theintent of this provision is puzzling, particularly since an even more restrictive provision exists whichaddresses voluntary quits. Speculatively, the limitation on unemployment benefit duration when repeatedspells occur may be an attempt to restrict local avoidance of financial responsibility for the long-termunemployed. The flow of responsibility between the resources of the state (unemployment benefitsfinanced from the Unemployment Fund) and of municipalities (social assistance financed from the localbudget) creates an incentive for financial “churning”. Conversations with local employment and socialassistance office staff indicated that there is a strong incentive on the part of municipalities to foster publicworks programmes, not simply for their potential value to the community, but often to requalify theunemployed for benefits paid from the Unemployment Fund rather than from local resources.
An “unemployment allowance” provides a second benefit tier for workers who remainunemployed six months beyond the expiration of unemployment benefits. The flat-rate allowance is60 per cent of the minimum wage and is available for a maximum of three months. It replaced the means-tested “unemployment assistance” benefit of the same amount which was paid for up to six months. Thechange removed some of the administrative complexity and cost associated with means-testing; therequirement that a worker remains unemployed for six months after the expiration of unemploymentbenefits may be an effective substitute. The new condition also is an improvement on the uniformrequirement that eligibility commence after 12 months of registered unemployment, given that theduration of the unemployment benefit itself is not uniform for all of the unemployed. However, it doesnot resolve the difficulties associated with discontinuous periods of time without benefits, and potentialrepetitive movement into and out of social assistance benefit rolls. Nor does the change in structureremove the effective duplication of function between the unemployment allowance and social assistance.It is difficult to justify this allowance, just as it was difficult to justify the former programme ofunemployment assistance.
Some benefits and provisions in place prior to passage of the new Act were eliminated. The10 per cent benefit supplement per child for up to two children under 16 years of age is no longer offered.This benefit also was difficult to justify, since it duplicated the function of child allowances and createdinequities. The unemployed who became entitled to benefits prior to the implementation of the new lawin January 1998, however, retain a right to those benefits and provisions which are most favourable tothem.
Sickness benefits
Sickness benefits cover short-term incapacity to work. Eligibility criteria are generous: onlythree months of continuous employment are required, except if illness results from an accident in theworkplace; eligibility continues for 45 days after termination of employment. There is no limit on theduration of benefits. Benefits are relatively close to previous wages: they range from 70 to 90 per cent ofthe basic wage depending on the length of service; if the illness lasts for more than 15 days, benefits areincreased slightly up to the maximum permitted. If leave is taken to care for a sick child under nine years

CCNM/DEELSA(98)64
47
of age, 100 per cent of basic pay is guaranteed for up to 60 days per year22. If less strenuous employmentat reduced pay is called for, part of the earnings reduction is compensated for up to six months.
Since the insurance period covers the first day of illness, the frequency of cases is relativelyhigh. Although the frequency fell from 85 to 75 cases per 100 workers during the massive job lossesduring 1991, it rose to 88 per 100 workers by 1994. This suggests that employers took advantage of thesystem to save wage expenditures during a difficult period (Noncheva, 1995). Given the low ages ofeligibility for retirement pensions and favourable sickness benefit levels relative to unemploymentbenefits, sickness benefits not only serve as a substitute for short-term layoffs, but also to bridge the gapuntil retirement for some workers.
The incentives for employers to abuse the system are obvious. If employers had to bear the costof several early days of sick leave, fewer claims would be submitted. (This is the trend in OECDcountries, for example in Germany and Sweden.) If the duration of benefits were limited by imposing amaximum number of days with pay per year, benefits for extended incapacity to work would be subject tothe more stringent eligibility determination process of long-term disability or work injury benefits.
Family benefits
The loss of guaranteed employment after 1991 also broke the link between the workplace andeligibility for family benefits. The traditional broad eligibility for such benefits was maintained, however,by requiring localities to provide comparable benefits for the uninsured at local expense. Benefits forinsured individuals (those who are employed or whose insured status derives from an employed familymember) are a national responsibility and are financed from the SIF; benefits for the uninsured(households with two unemployed parents or an unemployed lone mother) are the responsibility of localbudgets and are considered to be part of social assistance although there is no means-test. The system hadnot actually been reformed: it had been fragmented.
Maternity and parental leave, and birth grants
Maternity leave benefits are provided for insured women by the Labour Code. The benefitsinclude a guarantee of 100 per cent of earnings 45 days prior to delivery and up to 180 days after birth,depending on the number of children23. Parental leave for insured and uninsured mothers is provided bythe 1968 Decree for Encouraging the Birth Rate24; the benefits are equal to the minimum wage, which ispaid until the child reaches two years of age. Parental leave benefits commence at the end of maternityleave for insured mothers, and 45 days before the birth of the child for uninsured mothers. A third year ofleave without pay and with guaranteed re-employment rights is available for insured mothers. In practice,
22. Sick leave to care for a child may be taken by either parent or by grandparents.
23. For uninsured mothers, the Labour Code provides 120 days of paid leave for the first child; 150 days forthe second child; 180 days for the third child; 45 days of leave may be taken prior to delivery. Theduration of leave extends until a child reaches two years of age for each of the first three children, and untilten months of age for each subsequent child. The allowances is 100 per cent of earnings for the first threechildren; the minimum wage is paid if there are subsequent children.
24. Uninsured mothers include non-working women who give birth within six months after terminating studentstatus or an employment contract, or who are lone mothers.

CCNM/DEELSA(98)64
48
although not de jure, a benefit in the amount of the child allowance compensation amount is paid to theuninsured in the third year of parental leave (Noncheva, 1997).
Lump-sum birth grants are made at the birth of a child in increasing amounts for the firstthrough the third child, 1.0, 2.0, and 2.5 times the minimum wage, and in the amount of the minimumwage for each subsequent child.
Child allowances
Eligibility for child allowances is not universal. Only families with insured (employed) parents,those who are pensioners, and those with two unemployed parents are eligible to receive benefits. Certainother categories of non-working mothers also are entitled to receive child allowances25. Monthly childallowances are paid in amounts which vary by family size and employment status. In principle,allowances per child increase up to the third child, and decline per additional child, but in practice,benefits now are virtually uniform per child because of periodic flat-rate compensation for inflation 26.
Parents of disabled children as of 1996 receive 36 per cent of the minimum wage -- nearlydouble the standard amount (Act for Protection, Rehabilitation and Social Integration of Disabled People).If only one parent works, the allowance per child is increased. Families which are uninsured and eligible,that is, in which both parents are unemployed and registered at the labour office, receive child allowancesfrom a parallel system paid for by localities. Unemployed families headed by lone mothers also arecovered by the local system.
Family benefits therefore are not uniform. Nor are some of the current provisions logical. Forexample, maternity leave benefits are intended to replace earnings lost by absence from work because ofchild-birth. This type of benefit is not generally considered relevant for individuals without currentemployment. Parental leave also is an earnings replacement scheme; those without current employmentshould not qualify. Yet the unemployed and non-participants receive a benefit comparable to maternityleave in the amount of the minimum wage, which is extended to cover the period of paid parental leavegranted to the insured. The intent may be to provide a source of income support for individuals without ajob, but this is also the aim of unemployment benefits and means-tested social assistance 27.
Child allowances often are believed to be a valuable tool in alleviating poverty on theassumption that low-income families have more children than higher income families. But the tendencyfor families with numerous children to be concentrated in lower deciles of the income distribution isexaggerated by the use of per capita income to rank households. The use of an “equivalent” incomeschedule, which compensates for economies of scale with increases in family size, attenuates this result.
25. Non-working mothers who are eligible for parental leave also are eligible for child allowances. See
footnote 23.
26. The total flat-rate compensation payments for inflation reached 8 540 Lev by October 1997; the basicamounts remained at 15, 30, and 55 Lev for the first through the third child and 15 Lev for each subsequentchild.
27. A second and important advantage acquired from parental leave granted to individuals without work is thatthe benefit years are counted as years of service for pension purposes. The same objective can be achievedmore directly without the payment of parental leave benefits: certain years of child care can be counted asyears of service at designated earnings such as the minimum wage, or a specified number of years of low orzero earnings may be dropped from the base period used to calculate benefits.

CCNM/DEELSA(98)64
49
Nevertheless, even when per capita household income is used, the distribution of child allowances is onlyslightly redistributive (Chart 3.1 shows that the distribution is nearly equal by household income decile.Perfect equality is indicated by the diagonal line). The potential for child allowances to ameliorate lowincome also is constrained by the small and declining amounts of money spent on this benefit category,which are spread across the entire income spectrum (Table 3.2).
Chart 3.1 Distribution of child allowances by household income, 1995Averages per household
0
10
20
30
40
50
60
70
80
90
100
0 10 20 30 40 50 60 70 80 90 100
Gross income Child allowances
Cum
ulat
ive
shar
e of
gro
up s
peci
fic h
ouse
hold
inco
me
Source: Bulgarian Statistical Yearbook, 1996.
How generous are benefit levels?
The generosity of benefit levels usually is approximated by the ratio of the average benefit(assuming it is not taxed) to the average net wage. This provides a rough indication of the value of thebenefits relative to previous earnings, and on average, the incentive to work -- if a job is available. It alsois used as an indicator of benefit generosity, that is, the extent to which a previous or an adequate standardof living could be maintained if there is no other income. Many other factors affect work behaviour andthe ability to maintain a previous standard of living, so the measure must be interpreted with somecaution.
Replacement rates in Bulgaria are relatively modest and, given the dearth of job vacancies, thereis little reason a priori to fault average benefit levels as a significant disincentive to work. Thereplacement rates of benefits in Bulgaria are not high when compared with other transition countries, norare they high relative to OECD countries. The average pension was 37 per cent of the average wage in1994, rose to 45 per cent in 1996, and dropped to 30 per cent by October 199728. (Most pensionbeneficiaries, two-thirds in 1996 and nearly one-half by late 1997, received less than the average amount.See Table 3.8.). In 1997, the replacement rate was 50 per cent for the maximum pension. Thereplacement rate of the maximum unemployment benefit was 60 per cent; the average unemployment 28. The year-to-year volatility of this and other replacement rates reflects the larger changes in real wages
compared with changes in benefit values. See Table 3.1

CCNM/DEELSA(98)64
50
benefit, about 25 per cent; and the minimum unemployment benefit, less than 24 per cent. The allowancefor each child provided about 5 per cent of the average wage.
Table 3.8. The distribution of pensioners,by m onthly pension am ounts, 1994, 1996 and 1997
Pension amount Per cent of Pension amount Per cent of(Levs) pensioners (Levs) pensioners
1994Total 100 1811-1910 10.80 - 1210 2.3 1911-2010 10.51211-1310 3.8 2011-2110 12.31311-1410 3.2 2111-2275 14.71411-1510 2.8 2276-2440 4.51511-1610 7.7 2441-2605 1.71611-1710 12.8 2606-2770 0.81711-1810 9.7 2771-3028 2.4
1996Total 100 4891-5240 5.40 - 2867 2.3 5241-5590 5.52868-3148 2.2 5591-5940 5.03149-3490 4.8 5941-6500 7.83491-3840 8.0 6501-7070 7.53841-4190 7.8 7071-7635 5.54191-4540 7.1 7636-8200 4.44541-4890 9.7 8201-8764 12.6
8765- 4.5
1997Total 100 59 001-63 000 6.80-36 010 2.9 63 001-67 000 5.836 011-38 900 2.5 67 001-71 000 5.338 901-43 000 7.6 71 001-76 000 5.943 001-47 000 18.3 76 001-81 000 4.447 001-51 000 11.1 81 001-86 000 3.651 001-55 000 6.2 86 001-91 000 2.755 001-59 000 6.3 91 001-96 700 7.2
96 701 or more 3.4
M em orandum item : M onthly average pension am ounts:
1994 = 1909 levs
1996 = 6015 levs
1997 = 54 000 levs
Sources : M inistry of Labour and Social Affairs and National Social Security Institute.
However, comparisons of benefit replacement levels in Bulgaria with those in other countries,particularly higher income OECD countries, as a basis for indicating the relative adequacy of benefitamounts can be misleading. Average wages (the denominator of the ratio) vary considerably acrosscountries, and therefore do not represent an equivalent standard. This means that the amount of money abenefit replacement rate provides in a middle-income country may not buy as much as could be paid for ina different country with the same replacement ratio: a replacement rate that is comparatively “high” in amiddle-income country may not provide a market basket of items which is deemed socially desirable oressential for life.

CCNM/DEELSA(98)64
51
Therefore, gross replacement rates in Bulgaria which are within the range of OECD experiencenevertheless may provide low benefits in an absolute sense. This is illustrated by comparing Bulgarianbenefit levels with average wages elsewhere. Table 3.9 shows what replacement rates in Bulgaria wouldbe if average wages were at the purchasing power parity levels that exist in selected middle or high-income countries. Replacement rates in Bulgaria drop dramatically in these scenarios. For example, thereplacement rate of the average pension declines by about one-fifth when the average wage in the SlovakRepublic or Poland is substituted; by nearly one-fourth when the net wage levels of the Czech Republicor Hungary are substituted; by one-half using net wages in Portugal, and by three-fourths when theaverage wage level in Germany is used. Similar results obtain with respect to other benefit replacementrates. Therefore, despite serious concerns about the manageability of current expenditure levels inBulgaria, caution is needed in the way they are restrained.
Table 3.9. Simulated gross replacement rates in Bulgaria relative to the
purchasing power of average wages in selected countries, 1994a
Average Average AverageMinimum unemployment Average old-age disability Maximum
wage benefit pension pension pension pension
Bulgaria 37.8 42.6 b 36.6 38.9 44.1 59.6Czech Republic 26.1 29.4 25.3 26.9 30.5 41.2Hungary 26.1 29.4 25.3 26.8 30.4 41.1Poland 30.2 34.1 29.2 31.1 35.2 47.6Portugal 18.7 21.1 18.1 19.2 21.8 29.4Germany 9.4 10.6 9.1 9.7 11.0 14.9Slovakia 31.1 35.1 30.1 32.0 36.3 49.0
a) The numerator in every case is the amount of each benefit in US dollars for Bulgaria; the denominator is the average
wage in US dollars adujusted using purchasing powers of parity for the country mentioned.
b) The number of unemployment benefit recipients was estimated using the 1995 ratio of UB recipients to those eligible to
receive both UBs and social assistance.
Memorandum item:
Per capita GDP in US dollars in 1994 using PPPs:
Bulgaria - $2 548
Czech Republic - $8 965
Hungary - $3 579
Poland - $3 900
Portugal - $12 140
Germany - $ 19 735
Slovakia - $5 772
Source : Ministry of Labour and Social Affairs; OECD Short-term Economic Indicators .

CCNM/DEELSA(98)64
52
Social expenditures, benefit generosity and financing revisited
A synthesis of the situation is show by Chart 3.2., panels (a), (b), and (c). Panel (a) shows thelevel of social expenditures29 in Bulgaria as a per cent of GDP at its peak level in 199330 and those ofselected OECD countries in the same year. Expenditure in Bulgaria as a share of GDP is shown to berelatively modest: at its peak, it was only slightly higher than the shares in the Czech Republic and inPortugal, and was substantially below expenditure shares in other countries.
S o c ia l p ro te c tio n e x p e n d itu re s b y s o u rc e o f f in a n c e , 1 9 9 3
B u lg a r ia C z e c h H u n g a ry A u s tr ia F ra n c e G e rm a n y P o r tu g a l S w e d e n U K0
2 0
4 0
6 0
8 0
1 0 0
Per
cen
t of t
ota
l
S o c ia l s e c u r i tyc o n tr ib u tio n s
O th e rta x e s
4 4 -5 9% 4 8 % 5 8 % 5 5 % 3 9 % 36 % 2 0% 4 2 %6 2 %
S o c ia l e x p e n d itu re s p e r c a p ita in U S d o l la rs , 1 9 9 3
B u lg a r ia C z e c h H u n g a ry A u s tr ia F ra n c e G e rm a n y P o rtu g a l S w e d e n U K0
1
2
3
4
5
6
7
US
dol
lars
adj
uste
d us
ing
PP
Ps
S o u rc e s : M in is try o f L a b o u r a n d S o c ia l A ffa irs , O E C D T h e Ta x /B e n e f it P o s itio n o f P ro d u c tio n W o rk e rs , 1 9 9 5 ; O E C D R e v e n u e S ta tis tic s 1 9 6 5 -1 9 9 5 , O E C D S o c ia l E x p e n d itu re d a ta b a s e ; U N P o p u la tio n d a ta b a s e .
N o te : F ig u re s b e lo w c o u n try n a m e s a re s o c ia l s e c u ri ty c o n tr ib u tio n ra te s .
S o c ia l e x p e n d i tu re s a s a p e rc e n ta g e o f G D P, 1 9 9 3
B u lg a ria C z e c h H u n g a ry A u s tr ia F ra n c e G e rm a n y P o rtu g a l S w e d e n U K0
1 0
2 0
3 0
4 0
Per
cen
t of G
DP
C h a r t 3 .2 C o m p a ra tiv e s o c ia l e x p e n d itu re s , b e n e f it g e n e ro s ity a n d f in a n c in g in B u lg a r ia a n d s e le c te d c o u n tr ie s , 1 9 9 3
29. Education expenditures are excluded to maintain comparability across countries.
30. The peak expenditure year of 1993 was used because the most recent year for which four quarters of dataare available, 1996, may not be a representative year. The low social spending in 1996 (10 percentagepoints below that of 1993) in large part reflects exceptional economic circumstances.
(a)
(b)
(c)

CCNM/DEELSA(98)64
53
Panel (b) indicates the level of social expenditures per capita (in USD) to permit comparisons ofthe real level of the benefit packages across countries. The benefit package in Bulgaria is the leastgenerous one; it has a lower purchasing power than that of Portugal which spends less as a per cent ofGDP than does Bulgaria. Benefit values per capita between Bulgaria and other countries differ more thando the expenditure ratios shown in Panel (a): for example, although Sweden spends more than twice asmuch as Bulgaria’s GDP share, the value of the per capita benefit package in Sweden is more than sixtimes higher.
Finally, panel (c) looks at the financing of benefits by source of revenue, and shows total socialsecurity contribution rates for each country. Contribution rates in Bulgaria are relatively high, as is theshare of social expenditures financed by this revenue source -- roughly comparable to the picture inFrance. Only Hungary had a higher contribution rate in 1993, and only in the Czech Republic didcontributions from earnings provide nearly all of the required revenues.
Looking across all of the charts, what is striking is that Bulgaria’s high level of tax effort -- asindicated by the high contribution rate, is unable to provide sufficient revenues to support benefits that arecommensurate with that tax effort. This conundrum relates to underlying differences in the tax base, intax compliance, and in revenue collection efforts. If problems with respect to earnings reporting and taxcollections could be resolved, Bulgaria would have a much more manageable situation: it is thisgovernance problem and not overly generous benefits which are the key to the current crisis.

CCNM/DEELSA(98)64
54
CHAPTER 4
SOCIAL ASSISTANCE: LOCAL PROVISIONS AND RESPONSIBILITIES
Prior to 1991, extreme economic hardship was limited by employment guarantees. Socialassistance had a relatively small role: it catered for the needs of the “socially disadvantaged” who werenot expected to work -- the elderly and disabled with low income, and children at risk. When thetransition to a market economy produced growing unemployment and declining real incomes, the focus ofsocial assistance on inactive groups proved insufficient. As a result, the provision of monthly cashbenefits for all households with income and assets below a specified level was added to the existingresponsibilities of local government.
Local responsibility was further extended because of a particular problem created by the adventof open unemployment. Not only could a worker lose a job and earnings, but if there were children in thehousehold and both parents were unemployed, family benefits linked to the workplace also were lost -- asdiscussed in Chapter 3. The problem of loss of benefit coverage was resolved by the creation of parallelbenefits for the uninsured provided at the local level of government. National and local provisions, inprinciple, are part of a single system: the benefits provided by each level of government are the same;neither the benefits at the national level, nor those provided by localities are means-tested. Nevertheless,the same benefits received under the same conditions by the employed (financed by employercontributions to the SIF), or by those who are not employed (financed by local budgets), are distinguishedas social insurance or social assistance -- not because of different financing, but to justify that difference.The partnership between the state and localities in the provision of family benefits is an awkward one.
The tendency since the early transition years has been to try to retain wide access to all existing benefitsand to address problems by the creation of new programmes. The result has been duplication ofprogramme functions, rather than selective additions or reforms. Moreover, the multiple programmeswith a shared objective of reducing hardship often serve the same client groups. The resultinginefficiency is an important issue in light of severe resource constraints. But rationalising the benefitmenu is not simply a matter of removing programme duplication. Which programmes to alter oreliminate are not necessarily obvious; the most obvious candidates may not be politically viable options.
Which level of government should pay for benefits, is a separate issue from deciding on theaffordable level of benefits. In the face of high social charges and a growing budget deficit, financingresponsibility for many new benefits devolved to local government. Most localities, however, cannotafford added responsibility without receiving transfers from central government in amounts that will help

CCNM/DEELSA(98)64
55
to equalise their capacity to meet benefit promises. This suggests that the central authorities cannot avoidsharing the financing burden without impeding benefit entitlements.
But local dissatisfaction rests not only on financing issues: new mandates may not be consistentwith local social policy priorities. At the same time, there is potential for the exercise of local discretionto clash with the intent of central laws and decrees. The relative responsibilities of central and localauthorities suffer from lack of clear and logical assignment of the authority to make policy, the duty toimplement and administer it, and the obligation to pay for it -- and to enforce accountability for theresults.
Changes in a benefit system are always contentious. Nevertheless, changes that lead to moreeffective use of resources and to improved public understanding of rights and obligations are essential.The tolerance for further structural reforms in the near term may well depend in part on the ability of thesystem of social protection to cope with serious hardship, and to do so within the boundaries of existingfiscal constraints.
The growth of poverty
Poverty increased dramatically in Bulgaria during the 1990s. A variety of measures suggest thatthe size of the poverty population grew at least threefold by the mid-1990s; by some estimates, economicdeprivation affected the majority of the population. This situation was aggravated by the economic crisiswhich emerged in late 1996 and persisted into 1997.
An almost threefold increase in poverty between 1992 and 1995 (from 12 to 30 per cent ofhouseholds) was estimated by Dobrinsky (1996), using an absolute poverty line fixed in relation to 1992median household income. Similar increases were found over a range of poverty thresholds andequivalence scales. Milanovich (1996) estimates a larger increase in poverty in Bulgaria, from 2 per centin 1989 to 33 per cent by 1993/9431.
Shopov (1993) reports that the share of the population with less than 50 per cent of averageincome in Bulgaria rose between 1990 and 1992 from 8 to 13 per cent. The share with incomes below the“social minimum” rose from 29 per cent in 1989 to more than 70 per cent by the end of 1992; by thebeginning of 1992, over one-third of the population had an income below the “existence minimum”32.Moreover, the income share of the poorest 10 per cent of all households declined continuously. Povertynot only became wider, but also deeper.
A survey of Bulgarian households indicated that by 1995, 18 per cent reported they were “in direneed”, 36 per cent were in “difficult” circumstances, 44 per cent had “satisfactory” circumstances, while2 per cent said they were in a “very good” situation (UNDP, 1996, Chart 10.1).
31. The poverty line used was an annual amount of $120 per capita, adjusted by purchasing power parities in
1990 prices. By this measure, in comparison with Bulgaria, the increase in poverty in, for example, Poland,Hungary, and the Czech Republic during the same period, was much smaller, while the Russian Federationand the Ukraine experienced sharper increases.
32. The “social minimum” (SM) is defined by the income level at which expenditures on food accounts for50 per cent of income. The “existence minimum” (EM) is an absolute measure based on a market basket ofgoods and services deemed essential for survival. The monthly EM in October 1997 was 78 766 Lev; theSM is estimated by the Secretariat to have been about 110 000 Lev (monthly). Neither is an officialmeasure of poverty.

CCNM/DEELSA(98)64
56
In sum, while a precise estimate of the population in poverty at present cannot be made, there isno doubt that a large and growing proportion of the Bulgarian population is experiencing hardship.
The composition of poverty33
There are at least two ways in which the composition of the population in poverty can change.The first is related to changes in the incidence of poverty within groups such as the unemployed,pensioners, or households with children. The second concerns changes in the size of the contribution ofdifferent groups to the total poverty population. This distinction is important for policy purposes, since alarge group with a low or declining poverty rate nevertheless may constitute a large proportion of the totalpoverty population. This means that the size of a group is important, as well as the average risk faced bymembers of the group of being poor.
Changes within groups since 1992 have been significant34 Among pensioner households, 30 percent were poor in 1992, but the proportion declined to 20 per cent by 1995. Households with childrenfared worse in 1995 than in 1992: 15 per cent were poor in 1992, compared with 20 per cent in 1995.There was a higher rate of poverty among households with an unemployed member than in householdswith children or in pensioner households over the entire period, and their prevalence among the poor grewbetween 1992 and 1995: about 9 per cent of poor households contained an unemployed member in 1992,but increased to 15 per cent by 1995.
A different picture emerges when the size of the contribution of each group to the povertypopulation is considered. In 1992, pensioners were the largest proportion of the poverty population; thesecond-largest group were households with children, and households with an unemployed member rankedthird in size among the poor. In 1995, the rankings remained similar to the 1992 pattern 35.
The evolution of social assistance
The starting point for the response to increasing poverty after 1991 was the benefit system forthe disadvantaged that had been in place for 40 years. Low income determined eligibility, with widelatitude for local discretion. There was no assets test. The benefits included occasional cash assistanceand free or subsidised goods and services, such as drugs, transportation, meals, and access to a network ofinstitutions for the aged and disabled. The modifications and additions to these benefits -- and policylearning -- have followed a winding road.
33. The results reported are those of Dobrinsky et al., 1996.
34. These groups are not mutually exclusive.
35. After 1992, the prevalence of poverty within groups of different size changed, and the rankings becamemore sensitive to how poverty is measured. A per capita income scale exaggerates poverty in largerhouseholds, that is, those with children. If it is used, households with children dominate pensionerhouseholds as contributors to poverty. If a different equivalence scale is used which takes account ofeconomies of scale when living arrangements are shared (for example, 1.0 for the first adult; 0.7 for thesecond adult; 0.5 for each child under 14 years of age), pensioners remain the largest group in poverty inmost years. Regardless of the scale used, pensioners were the dominant group in the bottom decile.

CCNM/DEELSA(98)64
57
The 1951 social assistance law is still in force36; all additions and changes to the benefit systemfor low-income households have been made by decree. In 1991, central decrees established monthly cashbenefits for poor households, financed by municipal budgets, and set eligibility criteria and benefit levels.Per capita income of 65 per cent of the minimum wage and specified limits on property ownership definedthe eligibility threshold. Municipalities retained authority to set priorities and conditions for other cashand in-kind benefits. Responsibility for the network of social welfare institutions and social services forthe elderly and disabled was transferred from the Ministry of Health to the Ministry of Labour and SocialAffairs. Benefit administration, controls and financing remained largely within the domain ofmunicipalities.
Shortly thereafter, a link was made between the cost of certain necessary consumption items foran adult and a monthly benefit per capita, converted into a percentage of the minimum wage. The benefitfor the household was differentiated according to its size and age composition. The relationship to theminimum wage was intended to serve as an ad hoc automatic indexation mechanism which was absentwith the previous flat amount per family member. Assets were extended to include potential income-producing property such as rentable living space, and the unemployed were required to register with thelocal employment service. But linking eligibility and benefit amounts to the minimum wage led toproblems: not only did real benefits erode as the minimum wage declined in value, but the eligibilitythreshold as a proportion of the minimum wage also increased because of rising consumer prices.Particularly troubling was the increase in eligibility among unintended beneficiaries, such as students.
The link to the minimum wage was discarded in 1992, in part to curtail inflows. In its place, abasic minimum income (BMI) for an adult was introduced as a more stringent benchmark for determiningeligibility and monthly benefit amounts. The BMI was not intended as an official poverty line. The BMIis based on the cost of a limited market basket of essential food and energy products and is below the“existence minimum” (the amount needed to purchase items deemed essential for survival), the minimumwage, and the minimum unemployment benefit (Table 4.1). The BMI is adjusted by family size andcomposition to obtain the differentiated minimum income (DMI), that is, the total benefit for a family.The “individual coefficients” or weights used to calculate the family benefit also have been changed sincethe BMI was introduced.
Monthly benefits are intended to serve as a minimum income floor, but benefits are not actuallyguaranteed to all who are eligible. The Local Social Assistance Centres (LSACs) do not always haveresources sufficient to pay full benefit amounts and since, a decree does not have the full force of law,they can, for example, substitute in-kind benefits, pay less than the full benefit amount, or delay payment.Deficits in social assistance budgets emerged for the first time in 1993, and amounted to 14 per cent ofawarded benefits by 1996 (Noncheva, 1997).
In addition to monthly cash benefits, the network of institutions and social care services and cashbenefits established by the 1951 social assistance law remain available. According to rules in force sinceNovember 1997, periodic cash payments (up to three payments a year), one-time lump sums foremergency needs, and free or subsidised goods and services are provided at the discretion ofmunicipalities. Eligibility for monthly cash assistance is not a requirement for short-term cash ornon-cash benefits.
36. New social assistance legislation will be considered in 1998.

CCNM/DEELSA(98)64
58
T a b l e 4 . 1 M i n i m u m i n c o m e s a s a p e r c e n t o f t h e " e x i s t e n c e m i n i m u m " i n B u l g a r i a , 1 9 9 2 - 9 7 a
B a s i c m i n i m u m M i n i m u m
i n c o m e u n e m p l o y m e n t M i n i m u m( B M I ) b e n e f i t w a g e
1 9 9 2 4 8 7 5 8 01 9 9 3 5 3 7 6 8 41 9 9 4 3 9 6 0 6 61 9 9 5 3 2 4 9 5 51 9 9 6 3 3 5 1 5 71 9 9 7 b 3 4 5 2 5 8
M e m o r a n d u m i t e m s : I n O c t o b e r 1 9 9 7 t h e B M I w a s 2 7 0 0 0 l e v s ;
t h e m i n i m u m u n e m p l o y m e n t b e n e f i t w a s 4 0 9 5 0 l e v s ; a n d t h e
m i m i m u m w a g e w a s 4 5 5 0 0 l e v s .
a ) T h e " e x i s t e n c e m i n i m u m " i s b a s e d o n t h e c o s t o f a m a r k e t
b a s k e t c o n t a i n i n g i t e m s e s s e n t i a l f o r s u r v i v a l . I t i s n o t a n
o f f i c i a l m e a s u r e o f p o v e r t y . I n 1 9 9 7 i t w a s 7 8 7 6 6 l e v s .
b ) O c t o b e r 1 9 9 7 .
S o u r c e : M i n i s t r y o f L a b o u r a n d S o c i a l W e l f a r e .
Local expenditure on social assistance37
The trend in local expenditure on social assistance as a per cent of GDP has followed a pathsimilar to the national one, but at relatively low levels of spending. Spending peaked in 1993 at just over1 per cent of GDP, and declined by 1996 to 0.7 per cent of GDP -- slightly below the 1991 level. Realsocial spending by localities declined by nearly 70 per cent between 1991 and 1996 -- a larger fall thanthat recorded for combined social spending at all levels of government (see Table 4.2).
37. Local social assistance expenditure includes means-tested cash transfers, non-means-tested family benefits
to the uninsured, and in-kind benefits.

CCNM/DEELSA(98)64
59
T ab le 4 .2 L o ca l so c ia l a ss ista n ce exp en d itu res , 1 9 9 1 -9 6(B illio n s o f lev s, 1 9 9 1 lev s fo r rea l se rie s)
1 9 9 6 /9 11 9 9 1 1 9 9 2 1 9 9 3 1 9 9 4 1 9 9 5 1 9 9 6 % ch an g e
T o ta l N o m in al 1 0 7 4 1 9 3 6 3 4 6 4 5 0 1 8 6 9 7 5 1 1 9 1 9 R ea l 1 0 7 4 1 0 7 9 1 1 7 7 7 6 9 8 0 4 3 3 4 -6 8 .9 % o f G D P 0 .7 9 0 .9 6 1 .1 6 0 .9 5 0 .8 0 0 .7 2 -9 .3U n in su red p a ren tsa
N o m in al 2 5 9 4 5 9 9 3 5 1 6 1 0 2 6 3 0 3 4 6 4 R ea l 2 5 9 2 5 6 3 1 8 2 4 7 3 0 3 9 7 -6 2 .5 % o f G D P 0 .1 9 0 .2 3 0 .3 1 0 .3 1 0 .3 0 0 .2 1 9 .3P o o r h o u seh o ld s N o m in al 1 7 2 5 7 1 1 1 6 4 1 1 8 9 7 9 6 1 1 3 2 R ea l 1 7 2 3 1 8 3 9 6 1 8 2 9 2 3 2 -8 1 .5 % o f G D P 0 .1 3 0 .2 8 0 .3 9 0 .2 3 0 .0 9 0 .0 7 -4 6 .2S o c ia l ca re se rv ices an d in s titu tio n s N o m in al 5 6 0 7 7 0 1 1 4 6 1 8 5 6 2 6 1 2 4 1 4 0 R ea l 5 6 0 4 2 9 3 9 0 2 8 4 3 0 1 1 1 6 -7 9 .3 % o f G D P 0 .4 1 0 .3 8 0 .3 8 0 .3 5 0 .3 0 0 .2 5 -3 9 .6G o o d s an d se rv ices N o m in al 8 3 1 3 6 2 1 9 3 6 3 3 5 7 4 8 3 R ea l 8 3 7 6 7 4 5 6 4 1 1 4 -8 3 .7 % o f G D P 0 .0 6 0 .0 7 0 .0 7 0 .0 7 0 .0 4 0 .0 3 -5 2 .4E n ergy a llo w an ceb
N o m in al 5 8 0 2 7 0 0 R ea l 6 7 7 6 % o f G D P 0 .0 7 0 .1 6
C P I/9 1 1 0 0 1 8 0 2 9 4 6 5 3 8 6 8 3 5 6 4
M em o ra n d u m item s:
L o n g -te rm u n em p lo ym en t a ssis tan ce (F in an ced fro m U n em p lo ym en t F u n d ) N o m in al 0 .4 2 0 .6 6 R ea l 0 .0 5 0 .0 2 % o f G D P - -U n em p lo ym en t b en efits (F in an ced fro m U n em p lo ym en t F u n d ) N o m in al 0 .7 2 1 .1 6 2 .0 5 2 .6 6 2 .8 6 4 .1 7 R ea l 0 .7 2 0 .6 5 0 .7 0 0 .4 1 0 .3 3 0 .1 2 -8 3 .7 % o f G D P - - - - - - -5 2 .4O th er u n em p lo ym en t cash b en efits (F in an ced fro m U n em p lo ym en t F u n d ) c
N o m in al 0 .3 0 0 .3 1 0 .6 8 1 .2 9 R ea l 0 .1 0 0 .0 5 0 .0 8 0 .0 4 % o f G D P - - - -F am ily b en efits (F in an ced fro m S o c ia l In su ran ce F u n d ) N o m in al 3 .9 6 4 .4 5 5 .4 8 7 .3 8 9 .4 9 1 3 .2 8 R ea l 3 .9 6 2 .4 8 1 .8 6 1 .1 3 1 .0 9 0 .3 7 -9 0 .6 % o f G D P - - - - - - -7 2 .6
- L es s than 0 .0 1 pe r c ent.
a ) F inanced fro m an ex tra -b ud ge ta ry fund a s o f 19 9 7 .
b ) F inanced fro m an ex tra -b udge ta ry fund a s o f 1 9 9 6 .
c ) Inc lud es m a in ly unem p loym ent a s s is tance fo r scho o l le ave rs , child sup p lem en t to the unem p loym en t b ene fits
and s eve rance p ay.
d ) Inc lud es ch ild a llo w ances , m a te rnity b ene fits , p a renta l bene fits , b irth g rant and b ene fits fo r c a re o f s ick ch ild .
S o ur ce s : M in is try o f L ab our and S o c ia l A ffa irs ; M in is try o f F inance .

CCNM/DEELSA(98)64
60
Most local social assistance expenditure has not necessarily been focused on the pooresthouseholds. In 1996, the largest share (35 per cent) was spent on social care institutions and servicescreated in earlier years, with a client population composed for the most part of the elderly and disabled,and the determination of need at the discretion of municipalities. Almost one-third of the total was spenton family benefits for the uninsured, without the requirement of a means test. More than one-fifth wasconsumed by the energy allowance, with eligibility at a higher income threshold than applicable formonthly benefits. Monthly, occasional, and emergency cash benefits for the poorest householdsaccounted for only 10 per cent of total local spending on social assistance. Nor did expenditure onlong-term unemployment assistance, with eligibility determined by the same criteria as monthly benefits,change the picture significantly. Expenditure from the Unemployment Fund on this benefit was less thanone-half of the amount spent by municipalities for the poorest households.
Changes in expenditure patterns between 1991 and 1996 also may have adversely affectedspending on the poorest households. As the economic situation worsened, there was a shift fromexpenditure on family benefits for insured parents financed from the SIF to local expenditure on uninsuredparents. The local share of spending on family benefits as a per cent of total spending at all levels ofgovernment rose from 6 per cent in 1991 to over 20 per cent in 1995 and 1996. The pressure for relativelymore spending on benefits for uninsured parents created budgetary pressures which affected other benefitsprovided by localities. Although the number of poor households also was rising, there was a fall in realspending for these households which was much larger than the real decline in spending on uninsuredparents. According to Noncheva (1997), a possible reason why the poorest households fared worse thanuninsured parents relates to the administration of eligibility criteria: while a degree of subjectivity canand often does affect the determination of eligibility for means-tested benefits, there is little room formanoeuvre in the determination of eligibility for family benefits.
Those who receive benefits from local authorities undoubtedly suffer from some degree ofmaterial deprivation, which is why they are deemed eligible for help. Nevertheless, as the real value of allpublic benefits declined, and as real wages declined and jobs were lost, it is very surprising that means-tested social assistance did not become a larger share of social spending 38.
Assessment of benefit regimes
Local expenditure of less than 1 per cent of GDP for low-income individuals and households isrelatively very low, but there are problems of affordability nevertheless -- as demonstrated by significantarrears in monthly benefit payments. Nor are benefits high: in absolute terms, minimum benefit amountsare disturbingly low. But low benefit levels and severe fiscal constraints make it even more important toassess how efficiently and effectively the limited resources are used to meet the basic social policyobjective of alleviating poverty.
Benefit levels versus the financial returns to work
An area of concern frequently raised is the work incentive effects of benefit regimes. In order toarrive at a considered response, these effects cannot be assessed by examining each benefit programme inisolation. A benefit usually interacts with other sources of household income and with earnings and the
38. A significant but temporary increase in means-tested spending occurred in the context of the energy
allowance during the crisis of 1996/1997. It was financed by the PHARE programme of the EuropeanCommission.

CCNM/DEELSA(98)64
61
rules of the tax system, and may vary according to family size and composition. Work incentive effectsdepend upon the combined results.
A useful way to explore how benefit regimes work is to examine their effect on the income offamilies in varied situations. Table 4.3 depicts several family types which differ by the number ofworking-age adults, the presence of children, and family size; each row follows the changes in householdincome for a specific family type with changes in earnings level, employment status, and income source;each column depicts the variations in income of different types of families with the same income source39.Table 4.4 presents similar information in the form of net replacement rates: it shows household incomefrom cash-transfers relative to the income the household would have if earnings were the main source ofincome.
The first observation from Table 4.3 is that working at the average wage, regardless of familysize or composition, is substantially superior to the other situations depicted. Working at the minimumwage, however, can be less advantageous than receiving unemployment benefit.
Table 4.3 Potential net monthly household incomea , by household type and income source, October 1997
UnemploymentAverage Minimum Unemployment benefit assistance / Social
wage wage Minimum Average Unemployment assistanceallowance
One adult no children 143 040 45 500 38 675 43 743 27 300 f 27 000 f
2 childrenb 160 180 62 640 f 63 550 f 69 632 44 440 e,f 67 500 f
(55 815) d,f (60 883) d,f
3 childrenc 168 790 71 250 e,f 72 160 e,f 78 242 e,f 53 050 e,f 89 100 f
(64 425) d,f (69 493) d,f
Two adults no children 286 080 91 000 77 350 87 486 54 600 f 51 300 f
2 childrenb 303 220 108 140 102 225 122 123 71 740 e,f 86 400 f
(94 490) d (104 626) d
3 childrenc 311 830 116 750 110 835 130 733 80 350 e,f 108 000 f
(103 100) d,e (113 236) d
a) Net wage levels in two-adult households assume that both work at the specified wage; benefit levels assume that both adults are
unemployed. All benefit and wage amounts include any child allowances for which the family is eligible.
Income amounts at or below 50 000 Lev per adult are not taxable; all social protection benefits are excluded from taxable income.
b) Children of age 0-3 years and 3-7 years (.7% +.6% of BMI).
c) Children of age 0-3 years, 3-7 years and 7-18 years (.7% + .6% + .8% of BMI).
d) Includes child supplement of 10% per child, maximum of two children, plus child allowance of 17 140 Lev for two children; 25 750 Lev f
three children. Figures in parenthesis show the hypothetical effects on 1997 unemployment benefits of a change in the law implemented
as of January 1998 when child supplement is no longer in effect.
e) Eligible for social assistance; amount not included.
f) Eligible for heating assistance; amount not included.
Sources : Ministry of Labour and Social Affairs; Secretariat calculations.
39. See footnotes, Table 4.3 for assumptions underlying the determination of household income.

CCNM/DEELSA(98)64
62
The child supplement to unemployment benefits resulted in higher household income forfamilies with children when the adults were unemployed relative to working at the minimum wage.Suppression of the child supplement as of 1998 reduced replacement rates relative to the minimum wageto below 100 per cent (see figures in parentheses, Table 4.4). But a second problem area remains.Monthly social assistance in lone-parent households is more generous than working at the minimum wageand receiving standard child allowances. There are two explanations for this unemployment trap. Onerelates to the higher weight or “individual coefficient” given to a head of household who is a lone parent(1.2 instead of 1.0). If, however, the standard individual coefficient for an adult of 1.0 were used, there isless financial gain to receiving a benefit instead of working at the minimum wage, but the advantage doesnot disappear. The way in which the child allowance is calculated for monthly social assistance benefitsalso creates a significant bias, since the amounts calculated are more than double the standard allowanceper child40. The bias exists for all household types, but is magnified in lone-parent households because thechild benefit represents a larger share of household income.
Table 4.4 Neta benefit replacement rates by household type and income source, October 1997
Unemployment assistance / Unemployment benefitSocial assistance Unemployment allowance Minimum Average
% of % of % of % of % of % of % of % ofminimum average minimum average minimum average minimum average
wage wage wage wage wage wage wage wageOne adult no children 59.3 18.9 60.0 19.1 85.0 27.0 96.1 30.6 2 children 107.8 42.1 70.9 27.7 101.5 39.7 111.2 43.5
(89.1) a (34.8) a (97.2) a (38.0) a
3 children 125.1 52.8 74.5 31.4 101.3 42.8 109.8 46.4(90.4) a (38.2) a (97.5) a (41.2) a
Two adults no children 56.4 17.9 60.0 19.1 85.0 27.0 96.1 30.6 2 children 79.9 28.5 66.3 23.7 94.5 33.7 112.9 40.3
(87.4) a (31.2) a (96.8) a (34.5) a
3 children 92.5 34.6 68.8 25.8 94.9 35.5 112.0 41.9(88.3) a (33.1) a (97.0) a (36.3) a
See notes, Table 4.3.
a) Figures in parenthesis show the hypothetical effects on 1997 unemployment benefits of a change in the law implemented as of January 1998
when child supplement is no longer in effect.
Source: Secretarial calculations derived from Table 4.3.
40. The standard child allowance for one child in 1997 was 8 555 Lev per month with equivalent amounts for
additional children. The monthly child benefit based on the BMI for a child aged 0-3 was 18 900 Lev; fora child aged 3-7, 16 200 Lev; and for a child aged 7-18, 21 600 Lev. The disparity between the two typesof child allowance calculations was aggravated by the increase in the individual coefficient for childrenfrom 0.4 to the current levels of 0.6 to 0.8 depending on age, although the previous coefficient of 0.4 alsoresulted in a child benefit higher than the standard one.

CCNM/DEELSA(98)64
63
Table 4.4 also shows that both minimum and average unemployment benefits provide an incomelevel very close to what earnings at the minimum wage would provide. Monthly social assistancebenefits, although not as high as unemployment benefits, also have high replacement rates relative to theminimum wage for families with children. But a high replacement rate does not necessarily indicate thatbenefit levels are the primary problem. In Bulgaria, low returns to work may be the most importantinfluence on work incentives, and concern a larger share of the population than the share which receivespublic income transfers.
Benefit levels that are high, relative to wages, can make not working more attractive, particularlyfor workers who can command only low wages. But low wages (and low benefits), particularly if they arenot adequate to pay for the basic needs of life, can affect work behaviour in other undesirable ways. Theycan lead to unrecorded (and untaxed) earnings or to illegal activities, not only instead of low pay in theformal economy, but also as a supplement to it or to benefits from public income support schemes. Thus,the disadvantages to individuals of low wages or benefits can redound upon society.
For example, social assistance benefit amounts for a household with two adults, with or withoutchildren, are higher than the income the household would receive if one adult worked for the minimumwage and the other was inactive (Table 4.3). But a simple conclusion that the absolute level of the benefitis too high is difficult to justify. The monthly minimum wage in October 1997 (45 500 Lev), althoughslightly less than the benefit that a couple without children would have received from social assistance(51 300 Lev), was sufficient to purchase, for example, no more than a few loaves of bread a day. Theminimum wage and other minimum income measures are below the “existence minimum” -- the amountrequired to purchase items deemed essential for survival (Table 4.1).
A household with two adults and only one earner may be unusual in practice, particularly if thereare no children. Nevertheless, a household may be better off with only one recorded earner even at lowwages, and another with unrecorded and untaxed income. In addition, receipt of a means-tested benefitinhibits the formal work effort of a second household earner because of the marginal benefit reductionswhen earnings are present. This suggests that there may be an important work disincentive, but it is mostlikely to be related to work in the formal economy. And the cause may be low wages per se, not simplyhigh taxes or high benefit replacement rates. Under such circumstances, reducing replacement rates onlyby cutting benefit levels might not achieve the desired results.
The alternative of reducing replacement rates by increasing wages would be optimal, but only ifit is pursued through the restructuring of uncompetitive firms. To counter the erosion of the real value ofwages and benefits (Chart 4.1), reliance on the vicious circle of wage and benefit indexing in the face ofgalloping inflation is not helpful. Instead, it is essential to implement policies which improve theperformance of the economy. Appropriate macroeconomic policy and structural reforms clearly are asimportant to the objectives of social policy as they are to the economy at large.

CCNM/DEELSA(98)64
64
Chart 4.1Trends in real monthly incomes measures, 1991-97
Source: Ministry of Labour and Social Affairs.
1991 1992 1993 1994 1995 1996 19970
200
400
600
800
1,000
1,200
1991
Lev
s
BMI Min UB Min wage Average wage
Targeting benefits
The mix of social programmes that are the responsibility of localities is targeted on individualsand households with low incomes, but only loosely so. Eligibility criteria for the various cash and in-kindbenefits vary. There is a stringent means test for access to monthly cash benefits, and a similar procedurewith a higher income threshold to obtain eligibility for the energy allowance; eligibility for familybenefits for uninsured parents is categorical and without a means-test; local discretion prevails withrespect to eligibility for the variety of social care services and access to the network of institutions and toother goods and services. Although these latter benefits account for more than one-third of total localexpenditure on low-income households, their distribution by income category is uncertain. It is notuncommon to have less demanding benefit eligibility requirements for priority groups, for example, theaged and the disabled. It is a problem, however, when there are severe fiscal constraints and expenditureon benefits for the poorest households is crowded out, as has occurred in Bulgaria.
Spending more on the very poor in the presence of severe fiscal constraints requires that less bespent elsewhere. But significant increases in the use of means-testing is not a feasible solution. Not onlywould the administrative costs be high, but the reliability of means-testing is questionable. Thesophisticated information required to determine eligibility, and to monitor family circumstancessubsequently is not available in Bulgaria. The existence of a sizeable shadow economy, and a culture ofnon-compliance with income reporting requirements and tax regulations mitigates against widespreadreliance on means-testing, particularly if the number of poor households is large. But reliance on means-testing to determine eligibility for some benefits is inevitable. The main concern, however, is not simply

CCNM/DEELSA(98)64
65
how to target resources on the poor with greater accuracy within the current array of programmes -- it maynot be possible to achieve more than “rough justice” under existing circumstances. The most helpfulchange would be to minimise the resources that are lost because of unnecessary complexity in the mix ofprogrammes and in their administration and financing, such as the provisions for maternity and parentalleave, among others. More assistance then would be available for the poorest households.
Parental benefits, which account for three-quarters of local expenditure on family benefits, areintended to replace earnings lost because of child-birth or child-care responsibilities for the unemployed.Earnings replacement, however, makes little sense for a person without a job and, therefore, withoutearnings. Poor families can apply for monthly cash benefits; for those eligible, the amount of assistanceis reduced by the amount of other benefits received. Therefore, nothing extra is received by the poorestbecause of family benefits, and only those who are not eligible for monthly cash assistance gain fromthem. Consideration should be given to eliminating parental benefits for the unemployed.
Despite the limited redistribution achieved by child allowances (Chart 3.1), it may not bedesirable to eliminate them because of the large number of households involved, and the potential effectson confidence in government. Nor would it be efficient to means-test child allowances, again because ofthe large number of households that might apply and the high administrative costs. It would be moreefficient to have all child allowances provided from central resources, and when feasible, subject toincome taxation41.
Consideration of possible changes in the mix of cash and in-kind benefits also might lead togreater efficiency in the allocation of resources. For example, expenditure on institutional care for the ill,the aged, and the disabled is partially supply-driven. This is because central transfers to localities aremainly determined by the need to match the costs of existing institutional capacity, rather than demandfactors. This, in turn, is not independent of the many difficulties in the fiscal relationship between centraland local government, which is discussed below.
Financing responsibility for local social expenditure
The share of total local expenditure in the consolidated budget was 20 per cent in 1991, andincreased to nearly 30 per cent in 1992; by 1996, it had fallen to less than 15 per cent. Local socialspending also declined, despite the devaluation of responsibility to localities since 1991 to help poorfamilies. Severe declines in the state of health of the economy is an important reason why local socialspending fell, but it may not be the only one.
There are wide variations in the economic base of municipalities, in social needs, and in theconsequent availability of local revenues to pay for social programmes. Central mandates to localities toprovide certain benefits therefore have not always been matched by the ability of local authorities tofinance them42. Transfers from the central budget do help to reduce revenue disparities among
41. Experience reported in Hungary, where means-testing of child allowances was implemented, suggests that
the savings from taxing benefits would have been equivalent to the savings from means-testing them. Thisis because of the high administrative costs of means-tests.
42. One problem is the as yet incomplete evolution of local tax and spending structures: clear and workablelines of demarcation between central and local rights and responsibilities to tax and spend have yet to bedrawn.

CCNM/DEELSA(98)64
66
municipalities in the aggregate, but less can be said about their effect on disparities in social welfarespending capacity (see Box 4.1).
BOX 4.1. Local budgets and central transfers
Local revenues are derived from three main sources: own (local taxes and user fees), which usually are a minorcomponent of the local budget, revenues from the company profit tax and the personal income tax, which areshared with the central government43, and subsidies from the central government.
In the large majority of municipalities, central transfers in 1996 accounted for more than one-third of local revenues-- significantly more in some cases44. Local budgets and their responsiveness to changing needs are influenced bythe central government in other ways as well.
A global municipal budget is negotiated with the Ministry of Finance by each municipality and determines, interalia the amount of any transfers from the central budget. Revenue and expenditure estimates for the forthcomingyear are made by the municipality, but are subject to revision by the Ministry of Finance. (The Ministry of SocialAffairs does not have control over programme moneys, except for administrative expenses.) A formula is appliedto determine the central government subsidy, but it is biased towards supply factors, which reflect the legacy ofprevious years rather than demand factors. The formula is:
-- Subsidy = C1 + C2 + A + C3, where-- C1 = share of previous year’s subsidy-- C2 = need for public services to all municipalities assessed on the basis of 21 variables, (e.g. hospital
beds, places in institutions for the aged and disabled, number of pupils in kindergarten, housing units, number of cash benefit recipients, etc.)
-- A = Adjustment factor (per capita revenues relative to national average)-- C3 = transfers for capital investment (at discretion of central government)
Current service capacity also has a strong influence in the formula. This can lead to the inefficient use of resourcesby, for example, encouraging admissions to hospitals and institutions for the aged and disabled, which can limit theability of municipalities to meet competing social needs.
The “objective” factors in the allocation formula are intended to reflect “need”; they have grown in number fromfive to 21, in an attempt to improve the accuracy of the measure of need. Instead, the application of the formula hasbecome complicated and difficult to administer. This deficiency and the rapidly changing national and localcircumstances have led to “manual steering” and an allocation largely based on the principle of “a little foreverybody”, (Ivanov et al., 1997).
The capacity of municipalities to pay for all obligations, roughly measured by own-sourcerevenues per capita, is very unevenly distributed: nearly three-fourths of the municipalities had per capitaown-source revenues which were at or below the average in 1996. Less than 60 per cent of municipalities,however, received transfers from central government that were above the average per capita level. Yet the 43. The tax base and tax rates for own and shared revenues are set by the central government. See, for
example, Martinez-Vazquez, 1996, for a description of the intergovernmental tax structure in Bulgaria andthe relevant public finance issues.
44. Data from the Ministry of Finance indicate that only two out of 255 municipalities received no centralsubsidy in 1994 (Devnya and Radnevo); in 1996, seven municipalities received no central subsidy(Devnya, Radnevo, Etropole, Mirkovo, Bobovdol, Galabovo, and Beloslav), of which six made transfers tothe national budget.

CCNM/DEELSA(98)64
67
distribution of the 255 municipalities according to the size of the per capita transfers received from centralgovernment and the level of their own local per capita revenues does show that some redistribution istaking place45 46 (see Table 4.5). As the difference in the distributions of revenues and transfers suggest,there also are striking exceptions: six municipalities with low own revenues per capita received below-average levels of per capita transfers, while eight municipalities with above-average per capita ownrevenues received transfer amounts that were above average. In addition, the importance of transfers fromthe central government to local budgets has been changing. As local responsibilities for the poorincreased, the tax base narrowed and transfers from central government as a share of municipal budgetsdeclined from 44 per cent in 1994 to 33 per cent in 1996. During the same period, the dispersion oftransfers as a share of municipal budgets increased.
T a b le 4 .5 D is t r ib u t io n o f m u n ic ip a l i t i e s b y s iz e o f t r a n s f e r sa n d o f o w n r e v e n u e s p e r c a p it a , 1 9 9 6
N u m b e r o f m u n ic ip a l i t ie sO w n r e v e n u e s p e r c a p i ta
0 -3 2 5 8 3 2 5 9 -6 5 1 7 6 5 1 8 -9 7 7 7 9 7 7 8 + T o ta lT r a n s fe r s p e r c a p i ta (L e v s )≤ 0 0 0 0 7 71 - 2 9 1 8 0 0 0 1 2 1 22 9 1 9 - 5 8 3 5 6 3 9 3 3 1 3 9 15 8 3 6 - 8 7 5 4 5 4 5 4 6 1 1 1 58 7 5 5 - 1 5 1 1 5 1 6 1 3 1 0 3 0T o ta l 7 6 1 0 6 4 0 3 3 2 5 5
P e r c e n t o f m u n ic ip a li t ie sO w n r e v e n u e s p e r c a p i ta
0 -3 2 5 8 3 2 5 9 -6 5 1 7 6 5 1 8 -9 7 7 7 9 7 7 8 +T r a n s fe r s p e r c a p i ta (L e v s )≤ 0 0 .0 0 .0 0 .0 2 .71 - 2 9 1 8 0 .0 0 .0 0 .0 4 .72 9 1 9 - 5 8 3 5 2 .4 1 5 .3 1 2 .9 5 .15 8 3 6 - 8 7 5 4 2 1 .2 2 1 .2 2 .4 0 .48 7 5 5 - 1 5 1 1 5 6 .3 5 .1 0 .4 0 .0
M e m o r a n d u m i te m :
A v e ra g e p e r c a p i ta re v e n u e w a s 1 2 3 5 4 le v s , o f w h ic h :
a v e ra g e p e r c a p i ta o w n re v e n u e s w a s 6 5 1 8 le v s .
a v e ra g e p e r c a p i ta t r a n s fe r s w e re 5 8 3 6 le v s .
S o u r c e s : D a ta f ro m th e M in is t ry o f F in a n c e ; S e c re ta r ia t c a lc u la t io n s .
45. The correlation between transfers and own revenues was -0.89.
46. Own revenue, unfortunately, is a flawed indicator of capacity to raise revenue and of the willingness to doso on the part of municipalities in Bulgaria. Municipalities have extremely limited discretion indetermining revenue sources and tax rates.
CCNM/DEELSA(98)64
68
The global allocation is intended to serve multiple purposes, some at the discretion of theMinistry of Finance, and others according to national mandates and local preferences. Strict equalisationof per capita revenues therefore is not the appropriate objective. Nor might it serve the purpose ofenabling and encouraging municipalities to spend for social purposes in accordance with nationalpriorities and local needs. The recent proposal to create an extra-budgetary fund for family benefits foruninsured parents, and to channel moneys from central budget revenues directly to Local SocialAssistance Centres (LSACs) to pay for these benefits, clearly was intended to remove this programmefrom municipal control. But the amount of the earmarked bloc grant to the LSACs is to be determined bythe process which determines the global transfer, with the global transfer reduced by the same amount.The allocation of transfers therefore is unlikely to change. But the priority enforced on municipalities toprovide these family benefits also has affected social spending for other purposes in unintended ways: ithas crowded out spending on the poorest households, as discussed previously.
There are alternative ways of centralising some control over the provision of social welfarebenefits, encouraging municipalities to meet the needs of the poor and other groups, and enabling them todo so. A global allocation for all purposes of local government is not the best mechanism. A bloc grant,earmarked for specified social purposes, would increase the accountability of local authorities whilepermitting a desired degree of local discretion within the boundaries of the grant. The allocation acrossmunicipalities could be simplified and made more transparent by replacing the current multiple and ofteninappropriate criteria. For example, a measure of the proportion of the local population in poverty(however measured), adjusted by the size of the target population, could be used.
Efficient use of the resources provided by the bloc grant should be encouraged. This requiresthat the resources of both the central and municipal governments be involved. Therefore, considerationshould be given to an earmarked grant with matching requirements. The matching requirements need not,and probably should not, be uniform in order to accommodate the local capacity to pay 47.
The bloc grant should be designed so that the money provided from the central budget does notsubstitute for resources spent voluntarily by municipalities. The municipalities with above-average socialspending include both wealthy municipalities which can afford to spend more, and poor municipalitieswith high needs. A requirement that certain municipalities maintain some level of previous socialspending in addition to the spending financed by the bloc grant would be appropriate.
But little will be accomplished if other transfers are reduced by the amount of the earmarkedbloc grant, or if the array of programmes which help to prevent or ameliorate poverty are not rationalised.
47. The measurement of the capacity of a municipality to pay requires information on potential rather than
actual revenues. This requires data on the income and wealth of the residential and business community inthe taxing jurisdiction and local discretion in designating the tax base and rates.

CCNM/DEELSA(98)64
69
REFERENCES
BELEVA, I., D., HRISTOSKOV, I. and SHOPOV, G. (1997), “Informal Employment and Self-Employment”, Sofia, (mimeo, in Bulgarian).
Bulgarian National Assembly (1997), Unemployment Security and Employment Incentives Act of 1997,Thirty-Eighth National Assembly, Committee on Labour and Social Policy, Sofia.
DOBRINSKY, R., NIKOLAY, M. and PUDNEY S. (1996), “Poverty and Social Security in Bulgariaduring the Transition” (Mimeo).
European Bank for Reconstruction and Development (1997) Transition Report, EBRD, London.
FAY, G.R. (1996), “Enhancing the Effectiveness of Active Labour Market Policies: Evidence fromProgramme Evaluations in OECD Countries”, Labour Market and Social Policy Occasional PapersNo. 18, OECD, Paris.
ILO-CEET (1994), The Bulgarian Challenge: Reforming Labour Market and Social Policy, ILO-CEET,Budapest.
ILO (1994), The Bulgarian Challenge: Reforming Labour Market and Social Policy, ILO, Budapest.
IVANOV, S., et al. (undated), “Quantitative Analysis and Evaluation of Municipal Budgets in Bulgaria”,Sofia (mimeo).
JONES, D.C. and KATO, T. (1993), “The Nature and Determinants of Labor Market Transition in FormerSocialist Economies: Evidence from Bulgaria”, Working Paper 93/5, Department of Economics,Hamilton College, New York.
KOTZEVA, M., MIRCHEVA, D. and WÖRGÖTTER, A. (1996), “Evaluation of Active and PassiveLabour Market Policy in Bulgaria, in Labour Market Policies in the Transition Countries: Lessonsfrom their Experience, OECD, Paris.
LEHMANN, H., (1995) “Active labour Market Policies in OECD and in Selected Transition Countries”Economic Policy working paper No. 1502, World Bank, Washington.
IVANOV, S. (undated), “Finances Locales en Bulgaria”, Sofia (mimeo).
MARTINEZ-VAZQUEZ, J. (1995), “Central and Local Government Tax Relations”, FinancingGovernment in the Transition: Bulgaria, (HILLMAN, A.L. and Z. BOGETIC, eds.), World Bank,Washington.

CCNM/DEELSA(98)64
70
MARTINEZ-VAZQUEZ, J. (1996), “Intergovernmental fiscal relations in Bulgaria”, Decentralisation ofthe Socialist State: Intergovernmental Finance in Transition Economies, (BIRD, R., R.D. EBEL,and C. I. WALLICH, eds.) World Bank, Washington.
MILANOVIC, BRANCO (1996), Income, Inequality and Poverty During the Transition, World Bank,Washington.
NSI (1995, 1996), Statistical Yearbook, Sofia.
NONCHEVA, T. (1995), “The Winding Road to the Market: Transition and the Situation of Children inBulgaria”, UNICEF, Innocenti Occasional Paper No. 51, Florence.
NONCHEVA, T. (1997), “Social Assistance Schemes in Bulgaria: Diversity and Co-ordination”, paperpresented at OECD Technical Workshop, 27-28 November, Stockholm.
OECD (1992), Bulgaria: An Economic Assessment, OECD, Paris.
OECD (1992a), Private Pensions and Public Policy, OECD, Paris.
OECD (1995), Social and Labour Market Policy in Hungary, OECD, Paris
OECD (1997), Economic Survey of Bulgaria, OECD, Paris
OECD (March 1997), Short-term Economic Indicators in Transition Economies, OECD, Paris.
OECD (1998), The Tax/Benefit Position of Employees, 1995-1996
SHOPOV, G. (1993), “Unemployment, Poverty, Social Security: The Bulgarian Experience”, RRTBulgarian Document No. 8, Centre for the Study of Democracy, Sofia.
SHOPOV, G. and DANOV, I. (1993) “Impoverishment of the Population and Social Assistance”,Bulgaria and the European Community: The Transformation of the Labour Market and SocialPolicy -- A View Towards Europe, Sofia.
United National Development Programme (1996), Human Development Report: Bulgaria, UNDP, Sofia.

CCNM/DEELSA(98)64
71
ANNEX 1
Table A.1. Institutional description of main social protection programmes in Bulgaria 1997
Type of benefit Eligibility criteria Benefit formula and duration Financing
Pensions
• Old-age pension - Standard retirement age (category III) is 60 years for men and 55 forwomen. Required years of service is 25 years for men and 20 years forwomen.Persons working in selected occupations can retire earlier:- Category I: retirement age is 57 years for men and 52 years forwomen, if 20 years of service;- Category II: retirement age is 52 years for men and 47 years forwomen if 15 years of service;- Military personnel can retire after 20 years of service;- Pilots, divers and navy personnel can retire after ten years of service.
55% of average monthly gross earnings from three best consecutiveyears: from January 1997 one year will be added each sequential yearuntil full contribution period is included. For service longer thanvesting requirement, the pension is increased by 2% for each extra yearof service. Minimum old-age pension is 115% of social pension;maximum pension is three times social pension.
1. Pensions are paid fromSocial Insurance Fund (SIF),and State budget.
2. Contribution rates:Employers pay:- 37% of payroll;- 47% of payroll (if categoryII);- 52% of payroll (if category I).Employees pay 2% ofearnings.
• Disability pension
Insured employees with full or partial loss of work ability, dependingon age and length of service:- All insured up to 20 years are eligible;- Employees in the age 20-25 years are eligible if they have at leastthree years of service;- Employees older than 25 years are eligible if they have at least fiveyears of service.For certain professional occupations, eligibility depends on age andlength of service.The loss of work ability must have occurred during or up to two yearsafter employment period. Disability pensions are divided into threecategories; category I is the highest degree of work incapacity.
Pensions are based on average monthly gross earnings during the last12 months before losing work ability.- Category I: 55%;- Category II: 40%;- Category III 25% .Minimum benefit is related to social pensions. It amounts to 140% forcategory I, 130% for category II, and 105% for category III workers.Pensions may be increased by 5% to 25% depending on length ofservice and degree of disability.

CCNM/DEELSA(98)64
72
Type of benefit Eligibility criteria Benefit formula and duration Financing
• Survivor pensions
Surviving dependent persons:- Children, brothers and sisters, and grandchildren aged under 18;- Aged or disabled parent or spouses;- Widowed parent caring for orphan aged under 16;- Needy grandparents.
one survivor: 50% of disability pension;two survivors: 75% of disability pension;three survivors: 100% of disability pension.
• Social pensions
Income-tested:- Unemployed more than three months due to liquidation of enterprise,over age 57 (men) or age 52 (women) and qualified for old-agepension;- Labour category III workers with annual income of household headless than 50% of minimum wage;- Over 70 years and annual income of household head less than 50% ofminimum wage;- Disabled persons aged over 16.
Determined periodically by government.
Occupational injury &disease
All insured employees. Benefits are based on average monthly gross earnings during the last12 months before loosing work ability.- Category I: 70%;- Category II: 55%;- Category III: 35%.Minimum benefit is related to social pensions. It amounts to 150% forcategory I, 140% for category II, and 115% for category III workers.
Sickness benefits All insured employees with at least three months of continuousemployment (no minimum duration of employment required if under18).
1. Benefit rates depend on length of service. During first 15 days,70% of earnings if less than three months of service; 80% if threemonths to ten years of service; a maximum of 90% if more than 15years of service.
2. Benefit rates for care of sick child under nine years are 100% ofearnings. Duration: maximum 60 days per year.
1. Sickness benefits are paidfrom SIF.
2. Contribution rate: includedin pension contribution rateabove.
Family allowances
• Child allowance All resident children under age 16 (18 if a student). Base amounts are 15, 30, and 55 Levs for the first through the thirdchild and 15 Levs for each subsequent child. Added to these amountsis an inflation compensation payment of 8 540 Levs (as of October1997). Families with disabled children receive 36 per cent of theminimum wage.
1. Family allowances for theinsured (employed) are paidfrom the SIF; localgovernments pay for benefitsfor the uninsured (both parentsunemployed; lone mothers;students.)

CCNM/DEELSA(98)64
73
Type of benefit Eligibility criteria Benefit formula and duration Financing
• Maternity benefit
Employed mothers.
100% of earnings. Duration: 45 days prior to delivery up to 180 daysafter birth, depending on number of children.
- parental benefit: SIF (theinsured) and local governments(the uninsured)
- birth grant: SIF (the insured)and local governments (theuninsured)
• Parental benefit
Employed and uninsured (unemployed, single and full-time student)mothers.
Minimum wage. Duration: for insured mothers, parental benefits arepaid after maternity benefits end and up to two years after birth. Foruninsured mothers, 45 days prior to delivery and up to two years afterbirth.
2. Contribution rates: for theinsured, see pensioncontribution above.Contributions for the uninsuredare made out of generaltaxation.
• Birth grant Birth grant is provided for each child born. 1st child: one minimum wage;2nd child: two minimum wages;3rd child: 2.5 minimum wages;4th and subsequent children: one minimum wage.
Unemployment
• Unemployment benefit - Unemployed;- Minimum nine months of employment in the last 15 months;- Registration at local labour office;- Willingness to accept training or job, if offered.
Full-time employment: 60% of average earnings during last sixmonths. Not less than 85% not more than 140% of minimum wage.Part-time employment: proportionately reduced benefit. Special rulesfor students. Duration: 4-12 months depending on age and length ofservice.
1. All unemploymentprogrammes are paid from theUnemployment Fund.
2. Contribution rates:employers pay5% and employees pay 2% ofpayroll (3.6% and 1.9% as ofJuly 1998)
• Unemployment assistancefor long-term unemployed(terminated 31.12.97)
Means-test, after 12 months of unemployment and exhaustion ofunemployment benefits.
60% of minimum wage. Duration: six months.
• Unemployment assistancefor school leavers(terminated 31.12.97)
Unemployed with three months waiting period. 80% of minimum wage. Duration: three months for school leaversand six months for new graduates with skills or professionalqualifications.
• Unemployment allowance
(implemented 1.1.98)
Unemployed six months after expiration of
unemployment benefits (no means-test)
60% of minimum wage. Duration: three months.
• Child supplement(terminated in July 97)
Households where both parents are unemployed received a supplementfor the first two children.
10% of unemployment benefit per child, up to two children.

CCNM/DEELSA(98)64
74
Type of benefit Eligibility criteria Benefit formula and duration Financing
• Severance payment Persons redundant from state-owned enterprises in liquidation andpersons redundant from jobs in the budget sector.
Lump-sum: amount depending on age and work experience.
Support for low incomefamilies
• Monthly benefit Income and means-tested: average monthly income for the last sixmonths lower than differentiated basic minimum income (DMI)1.Means-test requirements are:(a) no more than one dwelling;(b) maximum amount of savings equal to six basic minimum incomes(BMI);(c) no assets which can be profitable.Unemployed persons in active working age must also register in labouroffice at least six months prior to application.
Benefit equals the difference between DMI (see footnote 1) for thehousehold and total income of the household.
Paid from local budgets.
• Occasional benefits Means-tested. Vary, depending on the needs estimated by case worker.
• Energy benefit Means-tested. Provided as earmarked vouchers.
• Free drugs Income-tested. Free receipts for patients whose income is below BMI per person inhousehold. Patients with income below 130% of BMI per person inhousehold pay 50% of cost.
• EC Phare emergencyprogramme (March-June1997)
Same as energy benefits. five ECU per child or handicapped person in a household .
Disability benefits
• Goods and services (cashand/or in-kind)
Disabled persons older than 16 years. Cash benefits are paid as a monthly allowance for social integration,which, depending on the degree of disability, amounts to 15-25% ofminimum wage.
Programmes are paid fromRehabilitation and SocialIntegration Fund, State budget,Local budgets and othersources.
Note:1 DMI is determined by the number of household members, their age and health condition. It is calculated by applying following coefficients to the basic minimum income (BMI):(a) 0.1 BMI for a single person;(b) 0.9 BMI for an adult living in the household;(c) 1.2 BMI for a single pensioner, single parent with children up to 16 years (18 if studying) and disabled children;(d) 0.7 BMI for a child up to three years of age;(e) 0.6 BMI for a child aged three to seven years;(f) 0.8 BMI for a child aged 7-16 years (18 if studying).