National Bus Strategy - Lancashire County Council
224
Credit: Gareth Gardner National Bus Strategy Lancashire County Council & Blackburn with Darwen Council Joint Bus Service Improvement Plan October 2021
-
Upload
khangminh22 -
Category
Documents
-
view
0 -
download
0
Transcript of National Bus Strategy - Lancashire County Council
Credit: Gareth Gardner
National Bus Strategy
Lancashire County Council &
Blackburn with Darwen Council
Joint Bus Service Improvement Plan
October 2021
Lancashire and Blackburn with Darwen Joint Bus Service Improvement Plan Page 2 of 90
Notice
This document and its contents have been prepared and are intended solely as information for and use in relation to the Lancashire and Blackburn with Darwen BSIP
Atkins Limited assumes no responsibility to any other party in respect of or arising out of or in connection with this document and/or its contents.
This document has 90 pages including the cover.
Document history Document title: Lancashire and Blackburn with Darwen Council Joint Bus Service Improvement Plan
Document reference:
Revision Purpose description Originated Checked Reviewed Authorised Date
Final BSIP CW MG CW MG 26 Oct 21
Client signoff
Client Lancashire County Council and Blackburn with Darwen Council
Project Lancashire County Council and Blackburn with Darwen Borough Council
Job number
Client signature/date
Lancashire and Blackburn with Darwen Joint Bus Service Improvement Plan Page 3 of 90
Contents
Chapter Page
Introduction 5
Foreword 6
What We Want to Achieve 7
1. Overview 8
1.1. Introduction 8
1.2. Local Transport Plans 9
2. Current Bus Offer to Passengers 13
2.1. Analysis of Existing Local Bus Services Compared to BSIP Outcomes 13
2.2. LTA Financial Support for Bus Services 30
2.3. Other Factors that Affect the Use of Local Bus Services 32
3. Headline Targets 33
3.1. Bus Journey Times 33
3.2. Bus Journey Time Reliability 33
3.3. Passenger Numbers 34
3.4. Passenger Satisfaction 35
4. Delivery 36
4.1. Make Improvements to Bus Services and Planning: More Frequent and Reliable Services 37
4.2. Improvements to Planning / Integration with Other Modes 39
4.3. Improvements to Fares and Ticketing 41
4.4. Higher Specification Buses 42
4.5. Improvements to Passenger Engagement 44
4.6. Other 45
4.7. Summary 46
Chapter Page
5. Reporting 48
6. Overview Table 49
Appendices 54
Appendix A. List of Bus Services 55
Appendix B. Proposed Bus Priority Interventions 67
Appendix C. Letters of Support 84
Appendix D. Lancashire and Blackburn with Darwen BSIP Baseline Evidence Base 90
Tables Table 1-1 - Lancashire and Blackburn with Darwen emerging LTP4 Objectives and Key Challenges 11
Table 2-1 - Bus Operators by Lancashire District 13
Table 2-2 - Sample Adult Bus Fares 22
Table 2-3 - Sample Ticket Products and Payment Types 22
Table 2-4 - Bus Emission Standards 25
Table 2-5 - Bus Facilities 25
Table 2-6 - Parking charges in Blackburn with Darwen 32
Table 4-1 - Summary of our plans to improve bus services 46
Table A-1 - List of bus services 55
Table B-1 - Identified Major Schemes (High Cost and High Benefit for buses) 67
Table B-2 - Countywide schemes for definite inclusion in BSIP 67
Lancashire and Blackburn with Darwen Joint Bus Service Improvement Plan Page 4 of 90
Table B-3 - Schemes identified as being a high priority for delivery and for inclusion in BSIP 67
Table B-4 - Specific schemes identified on Superbus routes for inclusion in BSIP 67
Table B-5 - Specific schemes identified on Support, urban and rural routes for inclusion in BSIP 69
Table B-6 - Improvements to Bus interchanges (mainly infrastructure schemes but some bus priority schemes) 69
Table B-7 - Key schemes that should be funded by external sources 70
Figures Figure 1-1 - Lancashire County Council / Blackburn with Darwen Borough Council Administrative Area 8
Figure 1-2 - 464 service to Rochdale 9
Figure 1-3 – The Blackburn Bus Company 10
Figure 1-4 - Bus stands in Preston Bus Station and Blackburn Bus Station 12
Figure 2-1 - X43 buses at East Lancashire Railway 14
Figure 2-2 - Pilkingtonbus bus 15
Figure 2-3 - Coastliner bus 16
Figure 2-4 - Bus operators’ routes within Lancashire and Blackburn with Darwen >= 1bph (September 2021) 17
Figure 2-5 - Accrington Bus Station 21
Figure 2-6 - Blackpool Transport bus 21
Figure 2-7 - Operator fare zones, all of Lancashire and Blackburn with Darwen 23
Figure 2-8 - Examples of bus passenger information 24
Figure 2-9 - Stagecoach single-deck buses 26
Figure 2-10 - Existing Bus Priority Locations Summary 27
Figure 2-11 - Satisfaction with Bus Services 29
Figure 2-12 - Transdev minibus in Leyland 31
Figure 2-13 - Bus services provided with financial support 31
Figure 3-1 - Preston Bus at Preston Bus Station 35
Figure 4-1 - Key BSIP interventions 36
Figure 4-2 - Stagecoach double-deck bus 40
Figure 4-3 - Blackpool Transport bus on Service 14 43
Figure 4-4 - LCC love your bus campaign logo 44
Figure 4-5 - Onboard passenger information screen 45
Figure 5-1 - Bus stop in Blackburn with Darwen 48
Figure B-1 - Proposed bus priority interventions in Accrington 71
Figure B-2 - Proposed bus priority interventions in Blackpool & Fylde 72
Figure B-3 - Proposed bus priority interventions in Burnley 73
Figure B-4 - Proposed bus priority interventions in Darwen 74
Figure B-5 - Proposed bus priority interventions in Garstang 75
Figure B-6 - Proposed bus priority interventions in Lancaster 76
Figure B-7 - Proposed bus priority interventions in Leyland and Chorley 77
Figure B-8 - Proposed bus priority interventions in Preston 78
Figure B-9 - Proposed bus priority interventions in Blackburn 79
Figure B-10 - Proposed bus priority interventions in Carnforth 80
Figure B-11 - Proposed bus priority interventions in Longridge 81
Figure B-12 - Proposed bus priority interventions in Rawtenstall 82
Figure B-13 - Proposed bus priority interventions in Skelmersdale 83
Figure C-1 - Letter of support from Coastliner Buses 84
Figure C-2 - Letter of support from Prestonbus 85
Figure C-3 - Letter of support from Stagecoach 87
Figure C-4 - Letter of support from Transdev 89

Lancashire and Blackburn with Darwen Joint Bus Service Improvement Plan Page 5 of 90
Introduction

Lancashire and Blackburn with Darwen Joint Bus Service Improvement Plan Page 6 of 90
Foreword
Councillor Charlie Edwards, Cabinet Member for Highways and Transport, Lancashire County Council
Lancashire's public transport network is absolutely vital to ensure that everyone, wherever they live and whatever their circumstances, can maintain connections with their friends and family, reach essential services, and access opportunities for employment.
This Bus Service Improvement Plan has been developed in partnership with Blackburn with Darwen Borough Council and local bus operators across Lancashire, and sets out our shared ambition to improve the bus network over the coming years. Our aim is to make the bus a more attractive option for everyone, including car owners, for their regular travel in order to reduce congestion, better look after our environment, and improve our health and wellbeing.
The Government's National Bus Strategy "Bus Back Better" provides a strong framework for improving services across England, and our plan focusses on how these improvements can be delivered locally. The Covid-19 pandemic has hit many services, so our initial priority is to grow patronage back to where it was, while beginning to deliver new and improved services, and introduce initiatives to speed up journeys and reduce costs. This is an exciting time to be involved in the development of public transport in the county and I look forward to collaborating with bus operators and bus users to make the most of this opportunity to deliver a network which works better for everyone.
Councillor Phil Riley, Executive Member for Growth and Development, Blackburn with Darwen Borough Council
We recognise the important role buses play in supporting our residents and value the close relationship we have with our local bus operators. Developing this Bus Service Improvement Plan will help to identify improvements required and set out our vision to promote the use of our buses; encouraging the residents of Blackburn with Darwen (BwDBC) back to bus. Collaborating with colleagues at Lancashire County Council and our bus service providers has been an integral part of the wider thinking and planning for public and private sector transport service priorities in BwDBC, Pennine and beyond, and we will continue to work with all transport partners to secure step-by-step improvements.
Lancashire and Blackburn with Darwen Joint Bus Service Improvement Plan Page 7 of 90
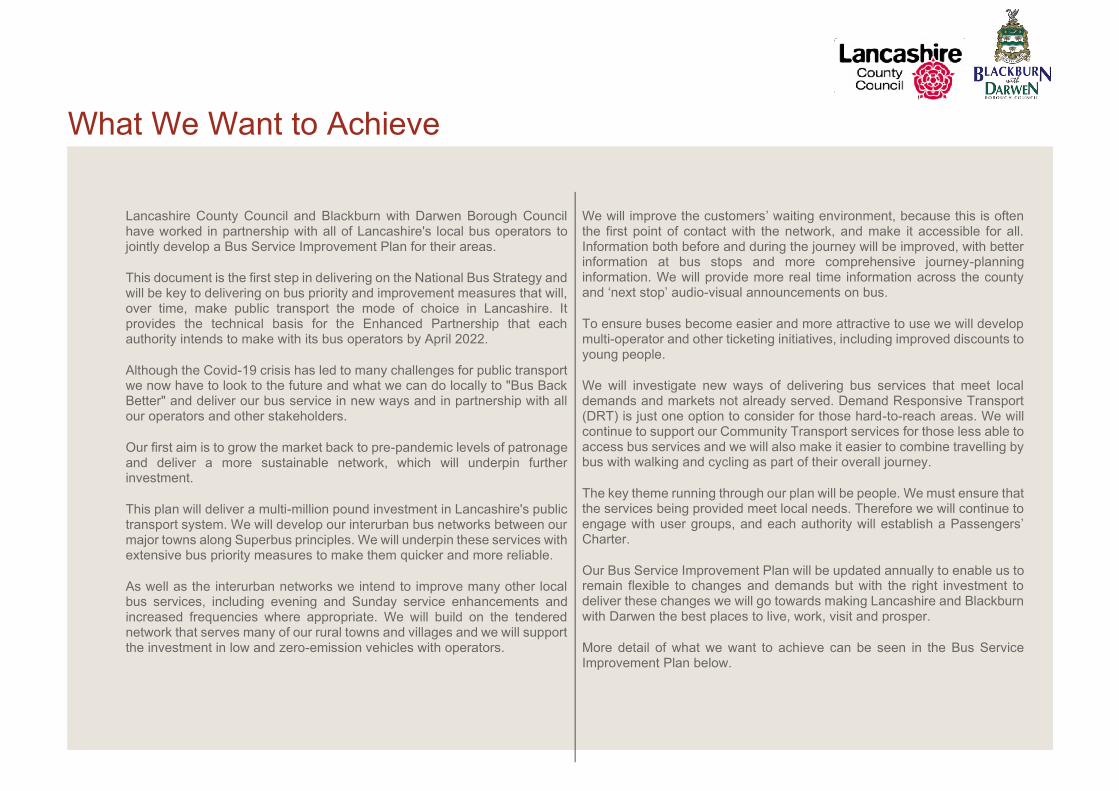
What We Want to Achieve
Lancashire County Council and Blackburn with Darwen Borough Council have worked in partnership with all of Lancashire's local bus operators to jointly develop a Bus Service Improvement Plan for their areas.
This document is the first step in delivering on the National Bus Strategy and will be key to delivering on bus priority and improvement measures that will, over time, make public transport the mode of choice in Lancashire. It provides the technical basis for the Enhanced Partnership that each authority intends to make with its bus operators by April 2022.
Although the Covid-19 crisis has led to many challenges for public transport we now have to look to the future and what we can do locally to "Bus Back Better" and deliver our bus service in new ways and in partnership with all our operators and other stakeholders.
Our first aim is to grow the market back to pre-pandemic levels of patronage and deliver a more sustainable network, which will underpin further investment.
This plan will deliver a multi-million pound investment in Lancashire's public transport system. We will develop our interurban bus networks between our major towns along Superbus principles. We will underpin these services with extensive bus priority measures to make them quicker and more reliable.
As well as the interurban networks we intend to improve many other local bus services, including evening and Sunday service enhancements and increased frequencies where appropriate. We will build on the tendered network that serves many of our rural towns and villages and we will support the investment in low and zero-emission vehicles with operators.
We will improve the customers’ waiting environment, because this is often the first point of contact with the network, and make it accessible for all. Information both before and during the journey will be improved, with better information at bus stops and more comprehensive journey-planning information. We will provide more real time information across the county and ‘next stop’ audio-visual announcements on bus.
To ensure buses become easier and more attractive to use we will develop multi-operator and other ticketing initiatives, including improved discounts to young people.
We will investigate new ways of delivering bus services that meet local demands and markets not already served. Demand Responsive Transport (DRT) is just one option to consider for those hard-to-reach areas. We will continue to support our Community Transport services for those less able to access bus services and we will also make it easier to combine travelling by bus with walking and cycling as part of their overall journey.
The key theme running through our plan will be people. We must ensure that the services being provided meet local needs. Therefore we will continue to engage with user groups, and each authority will establish a Passengers’ Charter.
Our Bus Service Improvement Plan will be updated annually to enable us to remain flexible to changes and demands but with the right investment to deliver these changes we will go towards making Lancashire and Blackburn with Darwen the best places to live, work, visit and prosper.
More detail of what we want to achieve can be seen in the Bus Service Improvement Plan below.

Lancashire and Blackburn with Darwen Joint Bus Service Improvement Plan Page 8 of 90
1. Overview
1.1. Introduction
This Bus Service Improvement Plan (BSIP) covers the entire administrative areas of Lancashire County Council and Blackburn with Darwen Borough Council illustrated at Figure 1-1. Blackburn with Darwen is a unitary authority; Lancashire is two-tier – and Figure 1-1 shows the ‘lower tier’ district council areas within Lancashire.
Lancashire County Council and Blackburn with Darwen Borough Council have a record of successful delivery of public transport initiatives including the Pennine Reach bus rapid transit which was a c. £40m DfT- funded major scheme. The two councils are also producing a combined Local Transport Plan 4, alongside Blackpool Council to replace the existing LTPs. Blackpool Council has chosen to submit an individual BSIP but has been working closely with the two councils in the preparation of its plan.
Both Lancashire County Council and Blackburn with Darwen Borough Council intend to enter into Enhanced Partnerships with local bus operators. Both councils chose to follow this route due to the positive relationships held with operators and the small teams currently employed by the authorities and the timescales required to undertake the statutory process, as neither area is a Mayoral Combined Authority.
Lancashire County Council’s notice can be found here: Notice of intent to prepare an Enhanced Partnership Plan and Schemes - Lancashire County Council.
Blackburn with Darwen Borough Council’s notice can be found here: Bus | Blackburn with Darwen Connect (bwdconnect.org.uk).
This Bus Service Improvement Plan will be published on 29 October 2021 and each authority’s Enhanced Partnership will enter force on 1 April 2022. The two authorities will publish a joint review of the BSIP by 31 October of each subsequent year along with the twice-yearly monitoring review.
Figure 1-1 - Lancashire County Council / Blackburn with Darwen Borough Council Administrative Area
Lancashire and Blackburn with Darwen Joint Bus Service Improvement Plan Page 9 of 90
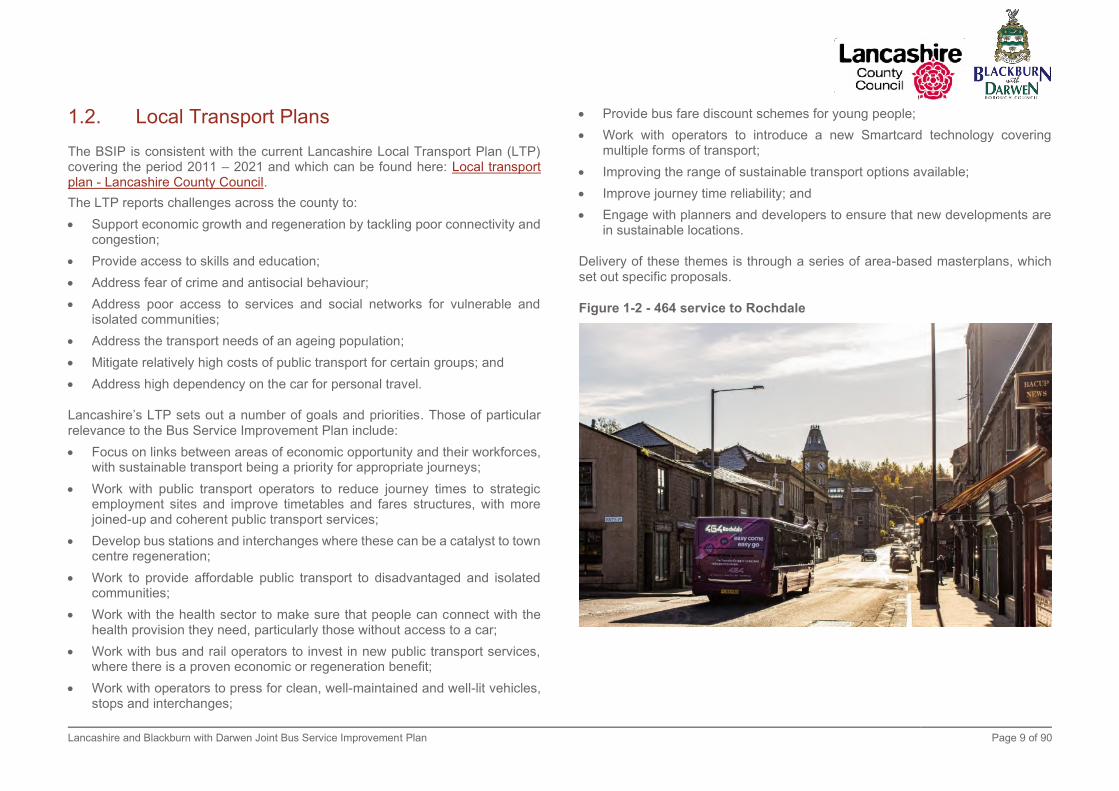
1.2. Local Transport Plans
The BSIP is consistent with the current Lancashire Local Transport Plan (LTP) covering the period 2011 – 2021 and which can be found here: Local transport plan - Lancashire County Council.
The LTP reports challenges across the county to:
• Support economic growth and regeneration by tackling poor connectivity and congestion;
• Provide access to skills and education;
• Address fear of crime and antisocial behaviour;
• Address poor access to services and social networks for vulnerable and isolated communities;
• Address the transport needs of an ageing population;
• Mitigate relatively high costs of public transport for certain groups; and
• Address high dependency on the car for personal travel.
Lancashire’s LTP sets out a number of goals and priorities. Those of particular relevance to the Bus Service Improvement Plan include:
• Focus on links between areas of economic opportunity and their workforces, with sustainable transport being a priority for appropriate journeys;
• Work with public transport operators to reduce journey times to strategic employment sites and improve timetables and fares structures, with more joined-up and coherent public transport services;
• Develop bus stations and interchanges where these can be a catalyst to town centre regeneration;
• Work to provide affordable public transport to disadvantaged and isolated communities;
• Work with the health sector to make sure that people can connect with the health provision they need, particularly those without access to a car;
• Work with bus and rail operators to invest in new public transport services, where there is a proven economic or regeneration benefit;
• Work with operators to press for clean, well-maintained and well-lit vehicles, stops and interchanges;
• Provide bus fare discount schemes for young people;
• Work with operators to introduce a new Smartcard technology covering multiple forms of transport;
• Improving the range of sustainable transport options available;
• Improve journey time reliability; and
• Engage with planners and developers to ensure that new developments are in sustainable locations.
Delivery of these themes is through a series of area-based masterplans, which set out specific proposals.
Figure 1-2 - 464 service to Rochdale
Lancashire and Blackburn with Darwen Joint Bus Service Improvement Plan Page 10 of 90
Blackburn with Darwen Borough Council’s Local Transport Plan 3 (2011 – 2021) can be found here: Local transport plan (LTP3) | Blackburn with Darwen Borough Council. This LTP identifies broadly similar challenges to Lancashire’s LTP, with a high reliance on cars for travel despite a high level of accessibility to the public transport network. This is against a background of a high level of social deprivation.
The LTP3 notes that employment in the Manchester City Region is forecast to grow, but that relatively few employees live in Pennine Lancashire. As with the Lancashire LTP3, the Blackburn with Darwen LTP3 sets out of a series of goals, many of which are relevant to bus strategy. Notably, these include:
• Improving public transport connectivity with Preston and Manchester to enable Blackburn with Darwen (BwDBC) residents to benefit from increased employment in these locations;
• Improving connectivity with strategic employment sites at Freckleton Street, Whitebirk and Salmesbury;
• Improving public transport accessibility to rural areas;
• Improved public transport to deliver a reduction in carbon;
• Reduce crime and anti-social behaviour on public transport; and
• Develop ticket incentives and improve passenger transport information.
The two authorities are currently collaborating with Blackpool Council on the production of a joint LTP4 to replace the current ones. At present 10 key challenges have been identified, which have been mapped against 10 objectives. The delivery of this Bus Service Improvement Plan will help address a number of the key challenges, and help deliver against the objectives. Table 1-1 maps the challenges against objectives currently being drafted, and highlights those where it is considered that the proposals of the BSIP will make a material contribution.
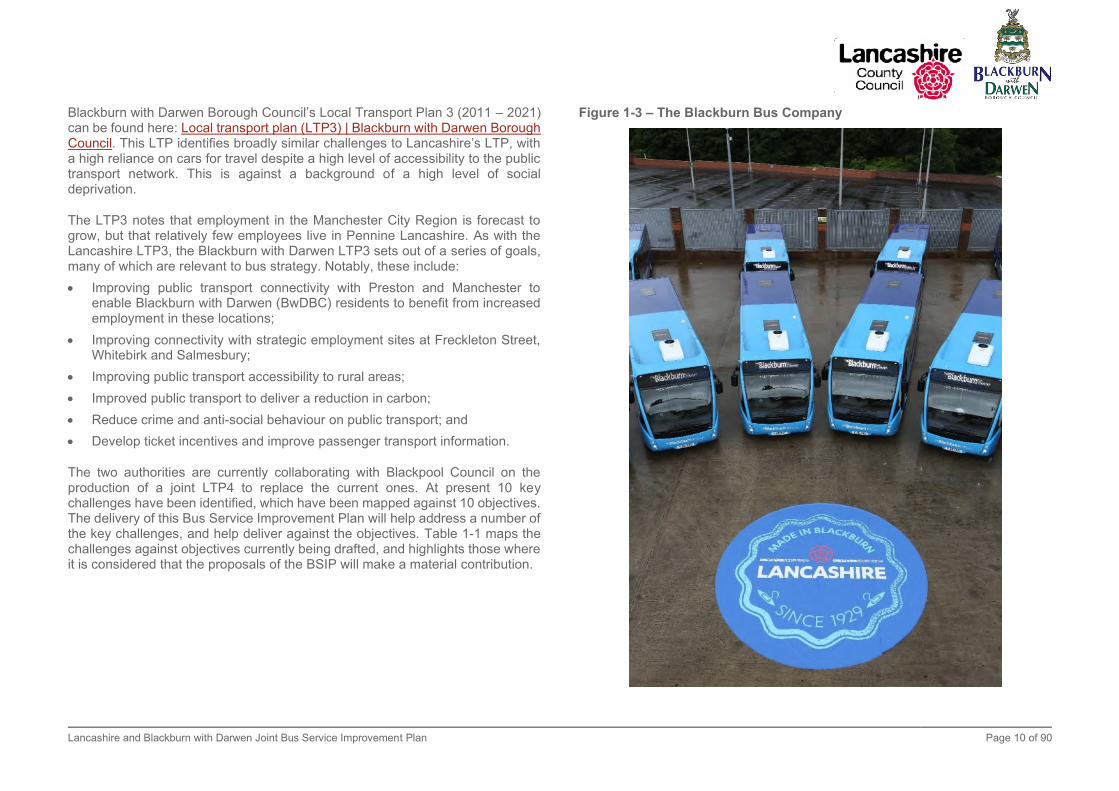
Figure 1-3 – The Blackburn Bus Company
Lancashire and Blackburn with Darwen Joint Bus Service Improvement Plan Page 11 of 90
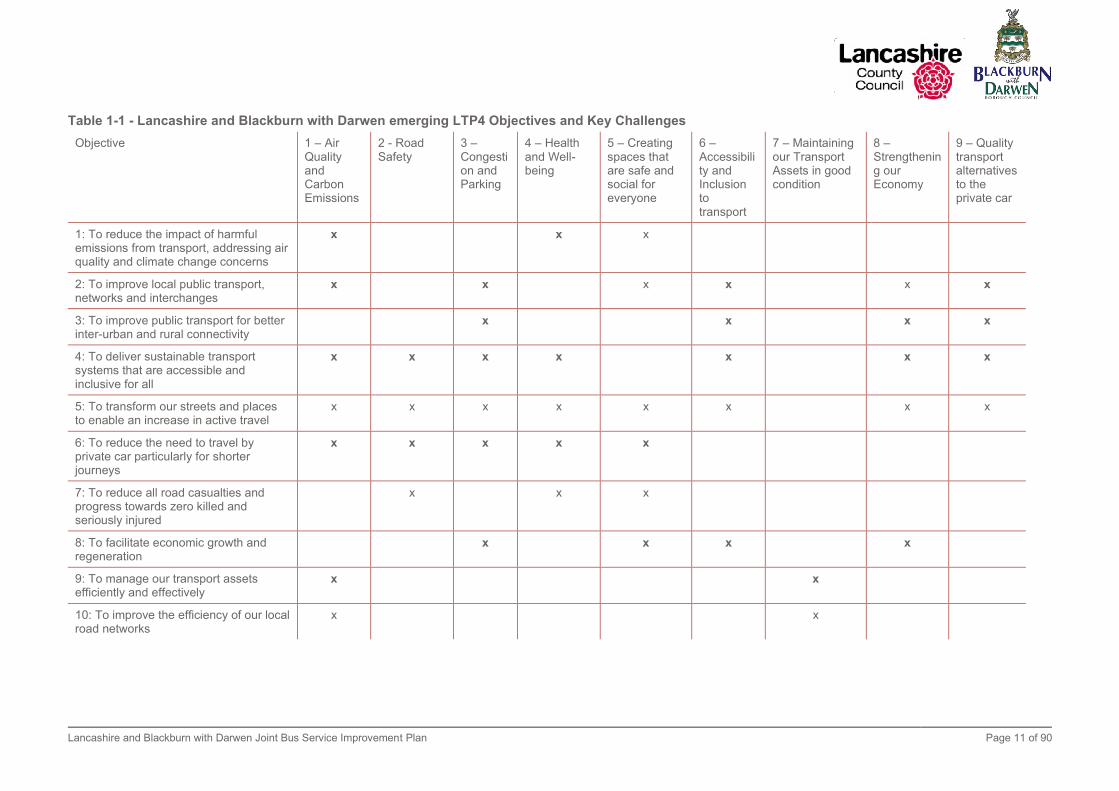
Table 1-1 - Lancashire and Blackburn with Darwen emerging LTP4 Objectives and Key Challenges
Objective 1 – Air Quality and Carbon Emissions
2 - Road Safety
3 – Congestion and Parking
4 – Health and Well-being
5 – Creating spaces that are safe and social for everyone
6 – Accessibility and Inclusion to transport
7 – Maintaining our Transport Assets in good condition
8 – Strengthening our Economy
9 – Quality transport alternatives to the private car
1: To reduce the impact of harmful emissions from transport, addressing air quality and climate change concerns
x x x
2: To improve local public transport, networks and interchanges
x x x x x x
3: To improve public transport for better inter-urban and rural connectivity
x x x x
4: To deliver sustainable transport systems that are accessible and inclusive for all
x x x x x x x
5: To transform our streets and places to enable an increase in active travel
x x x x x x x x
6: To reduce the need to travel by private car particularly for shorter journeys
x x x x x
7: To reduce all road casualties and progress towards zero killed and seriously injured
x x x
8: To facilitate economic growth and regeneration
x x x x
9: To manage our transport assets efficiently and effectively
x x
10: To improve the efficiency of our local road networks
x x

Lancashire and Blackburn with Darwen Joint Bus Service Improvement Plan Page 12 of 90
Consistent with the themes and objectives of the LTP documents, Lancashire County Council and Blackburn with Darwen Borough Council have each invested heavily in public transport infrastructure and development in recent years. As mentioned above, they collaborated on the design and delivery of the Pennine Reach bus rapid transit scheme, which included the provision of bus priority measures, construction of modern, covered, safe bus station facilities in the heart of Blackburn and Accrington town centres, improved bus shelters, bus stops upgraded to give full Equality Act access, and real-time passenger information.
Lancashire County Council has invested over £40m in developing, refurbishing and improving transport interchanges in the last 20 years. This investment included the refurbishment of the iconic and Grade II-listed Preston Bus Station. Ongoing investment will see Ormskirk bus station refurbished and it currently has in hand a process of replacing over 800 shelters in its direct control at a cost of £3.5m over 3-4 years.
It recently reversed many of the budget reductions that it made to tendered bus services in 2015/16, and now expects to spend around £7.8 million net providing revenue support to services carrying 2.5 million passengers a year.
Blackburn with Darwen provides small sums of support for local bus services, though this support increased during the Covid-19 pandemic. Its ‘connect project’ is a ‘smarter travel choices’ project to encourage healthier and more sustainable ways of travelling. Established in 2012 as part of DfT’s Local Sustainable Transport Fund, the project has developed and expanded, working in partnership with Lancashire County Council as part of the more recent Access Fund. The project primarily focuses on linking people to employment, skills sites, education establishments and leisure/social sites. Through a variety of dedicated initiatives the project promotes and enables sustainable travel and addresses issues of physical inactivity and barriers to sustainable transport. The project has over the years developed its own website portal promoting and supporting the Blackburn with Darwen Council website by hosting all public transport, active travel and car sharing information, news and activities. The Connect brand is and will continue to be used across the Borough and BwDBC has more recently broadened its social media horizons with the establishment of Facebook and Twitter accounts.
Figure 1-4 - Bus stands in Preston Bus Station and Blackburn Bus Station

Lancashire and Blackburn with Darwen Joint Bus Service Improvement Plan Page 13 of 90
2. Current Bus Offer to Passengers
This section describes the bus service offer to Lancashire and Blackburn with Darwen, assesses its quality and suitability for residents, and analyses the impact of background highway and socio-demographic conditions on buses. At a number of points it refers to “Lancashire and Blackburn BSIP Baseline Evidence Base” (LBBEB) which addresses these issues in some detail and to which the reader is referred for more detail. This is provided alongside this BSIP document in Appendix D.
At the end of each section is a brief commentary on the existing situation and how it relates to the aspirations of the National Bus Strategy.
2.1. Analysis of Existing Local Bus Services Compared to BSIP Outcomes
2.1.1. Operator Context
A full list of services operating within Lancashire is provided in Appendix A.
Table 2-1 summarises the distribution of bus operators by district council area within Lancashire, and the unitary authority of Blackburn with Darwen.
Table 2-1 - Bus Operators by Lancashire District
District Main Operator(s)
Other Operator(s) Minor Operator(s)
Blackburn with Darwen
Transdev Blackburn PH, Moving People, Pilkingtonbus, Preston Bus, Stagecoach M&SL, Travel
Assist
Vision Buses
Burnley Transdev First West Yorkshire
Chorley Stagecoach M&SL Arriva NW, Holmeswood, Transdev, Tyrers
Diamond Bus NW
Fylde Blackpool Transport
Stagecoach M&SL
Coastal Coaches, Coastliner Buses, Stagecoach C&NL
Hyndburn Transdev Pilkingtonbus Stagecoach M&SL
Lancaster Stagecoach C&NL Kirkby Lonsdale Coaches
Pendle Transdev Pilkingtonbus, Stagecoach M&SL
Preston Preston Bus Stagecoach M&SL
Blackpool Transport, Holmeswood, Stagecoach C&NL, Transdev, RS Tyrer
Ribble Valley Stagecoach M&SL, Transdev
Holmeswood, Moving People, Pilkingtonbus, Preston Bus
Rossendale Transdev
South Ribble Stagecoach M&SL Holmeswood, Preston Bus, Transdev, RS Tyrer
West Lancashire
Arriva North West Stagecoach M&SL
Charlton MiniCoaches, Holmeswood, Huyton Travel,
Preston Bus
Stagecoach Manchester,
Warrington's Own Buses
Wyre Blackpool Transport
Stagecoach C&NL
Coastal Coaches, Coastliner Buses, Kirkby Lonsdale
Coaches
Stagecoach M&SL

Lancashire and Blackburn with Darwen Joint Bus Service Improvement Plan Page 14 of 90
Main Operators
Arriva North West operates cross-boundary services linking Chorley with Wigan, and Skelmersdale and Ormskirk with Liverpool, Southport and Wigan.
Blackpool Transport is the arm’s length operation of Blackpool Council and provides high frequency links from Blackpool into the neighbouring parts of Fylde and Wyre including Fleetwood, Cleveleys and Lytham St Anne’s. Blackpool Transport also operates the Blackpool Tramway which runs to Fleetwood.
Preston Bus is the former municipal operator now owned by Rotala. It has a core network of high and medium frequency services within the Preston urban area. Preston Bus has also expanded through contracted services including local services in Ormskirk and links into the Ribble Valley from Preston.
Stagecoach Cumbria & North Lancashire (C&NL) is the northern part of the former Ribble Motor Services. Within Lancashire it operates a core network of services in and around Lancaster including high frequency links between Lancaster University, Lancaster, Morecambe and Heysham. It also operates longer distance services from Lancaster to Blackpool and Preston via Wyre District, and from Lancashire into Cumbria and North Yorkshire.
Stagecoach Merseyside & South Lancashire (M&SL) covers the Preston based operations of the former Ribble Motor Services. Core services are interurban routes from Preston to Longridge, Blackburn, Chorley, Leyland, Longton, Ormskirk and Southport. Stagecoach M&SL do operate a number of tendered services around Chorley as well as the Preston – Clitheroe – Skipton route.
Transdev’s operation is a mixture of former municipals in Blackburn, Hyndburn and Rossendale; the eastern part of Ribble Motor Services and former independent Northern Blue. Services are provided by three operating companies with many routes being branded:
• The Blackburn Bus Company is based in Blackburn with a main network of interurban services to Darwen, Bolton, Chorley, Preston, Clitheroe, Accrington and Burnley;
• The Burnley Bus Company’s core network is within Burnley and Pendle with commercial local services and interurban links to Accrington and Clitheroe as well as cross-boundary services into Greater Manchester, North Yorkshire
and West Yorkshire. Recent tender wins have seen the takeover of supported services into Ribble Valley under the ‘Ribble County’ brand; and
• Rosso is the former Rossendale Transport operation with a core network of higher frequency commercial services linking Rossendale with Accrington, Blackburn, Burnley and Greater Manchester. Supported services provide local services around Rawtenstall and Haslingden as well as cross boundary links into West Yorkshire.
Figure 2-1 - X43 buses at East Lancashire Railway

Lancashire and Blackburn with Darwen Joint Bus Service Improvement Plan Page 15 of 90
Smaller Operators
A network of smaller operators provides lower frequency and supported services:
• Blackburn Private Hire, Moving People and Travel Assist operate supported services within the Blackburn with Darwen area;
• Charlton MiniCoaches operates two Ormskirk town services;
• Coastal Coaches operate two supported services linking north and south Fylde District as well as to Blackpool;
• Coastliner Buses' core service links Fleetwood with Poulton-le-Fylde. Other services provide a tourist focus, linked into and around Blackpool;
• Holmeswood Coaches is one of the larger operators of supported services within Lancashire. These include services within Blackburn, Chorley, Hyndburn, Preston, Ribble Valley, South Ribble and West Lancashire;
• Kirkby Lonsdale Coaches shares the Lancaster – Lune Valley – Cumbria / North Yorkshire corridor with Stagecoach. It also operates supported services within Lancaster and into Wyre District;
• Pilkingtonbus provides a small network of weekday-only commercial services within Accrington. It also operates tendered services within Blackburn with Darwen, Pendle and Ribble Valley districts; and
• RS Tyrer Coaches expanded into the provision of local bus services in Lancashire by winning a number of tendered services in Chorley. It also operates a supported route linking Chorley and Preston via central South Ribble.
Figure 2-2 - Pilkingtonbus bus

Lancashire and Blackburn with Darwen Joint Bus Service Improvement Plan Page 16 of 90
Other Operators
In brief:
• Diamond Bus North West provides a Sunday-only extension of its Bolton – Horwich service to Rivington;
• First West Yorkshire provides a service linking Burnley with Halifax via Todmorden;
• Huyton Travel operates a low frequency service from Ormskirk to St Helens;
• Stagecoach Manchester and Warrington’s Own Buses cross from Greater Manchester into West Lancashire principally to serve Wrightington Hospital; and
• Vision Bus operates a supported service from Bolton to Belmont in the south of Blackburn with Darwen.
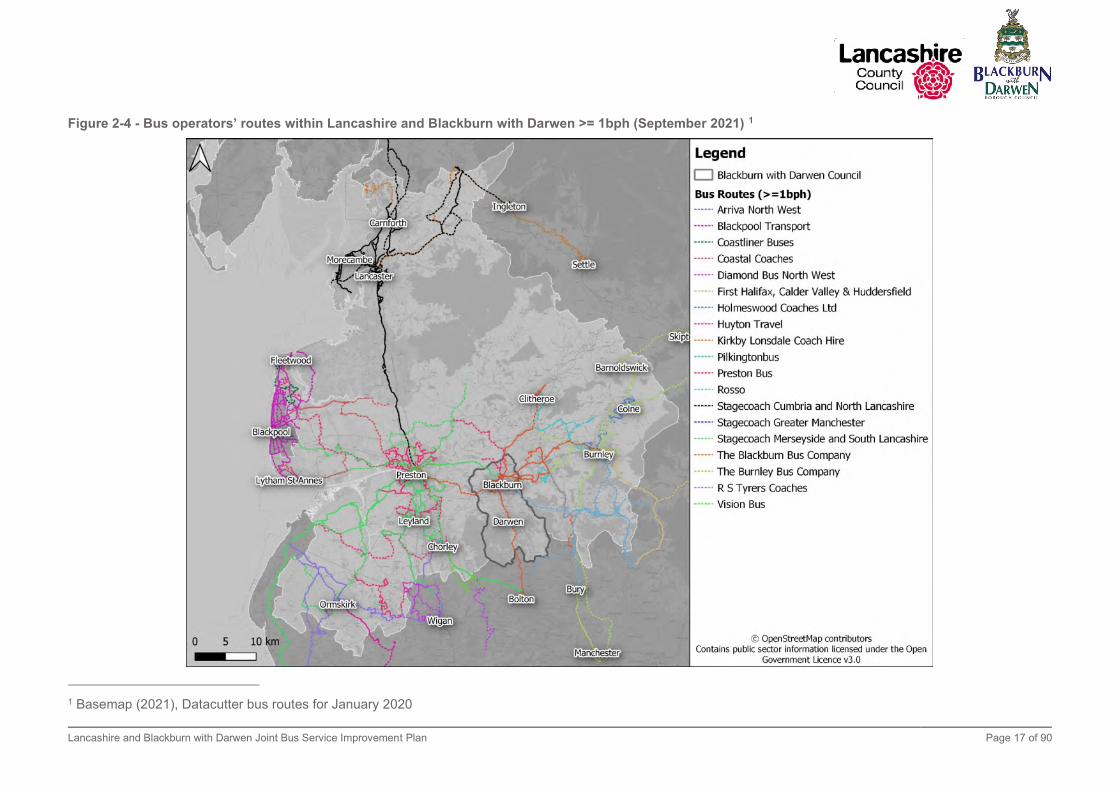
Figure 2-4 illustrates those services in Lancashire and Blackburn with Darwen with a frequency of one bus per hour or more.
Figure 2-3 - Coastliner bus
Lancashire and Blackburn with Darwen Joint Bus Service Improvement Plan Page 17 of 90
Figure 2-4 - Bus operators’ routes within Lancashire and Blackburn with Darwen >= 1bph (September 2021) 1
1 Basemap (2021), Datacutter bus routes for January 2020

Lancashire and Blackburn with Darwen Joint Bus Service Improvement Plan Page 18 of 90
2.1.2. Bus Service Supply
The analysis below briefly summarises the existing bus services in the distinct geographies presented by the Lancashire district areas.
Blackburn with Darwen (BwDBC)
Services 1, 6 and 7 are the most frequent in BwDBC. Route 1 links the borough’s main towns of Blackburn and Darwen. Routes 6/6A and 7/7A operate between Blackburn Bus Station and the towns of Accrington, Great Harwood, Oswaldtwistle and Rishton in the neighbouring borough of Hyndburn. These services are the only services in the borough that provide a ‘walk-up’ frequency of 5 to 6 buses per hour. At least seven buses an hour link Blackburn Bus Station with the Royal Blackburn Hospital.
There are several other inter-urban services operating within the borough although these tend to be less frequent, generally running half-hourly or hourly during the daytime. These include services to Preston, Clitheroe, Chorley, Burnley, and Bury via Rawtenstall. A number of other local bus services also operate although these tend to be less frequent with limited service provision during the morning and evening peak periods.
Burnley
Alongside Burnley the main urban area includes the town of Padiham. Burnley General Teaching Hospital is located in the north of the district, while there are a number of business and industrial parks located around the district, principally located for the ease of access to the M65.
A high frequency core set of services runs between Padiham, Burnley town centre and into Pendle. Local services within Burnley are a mixture of commercial services running every 20-30 minutes and lower frequency tendered routes. Commercial cross-boundary services are provided to Halifax, Manchester, Skipton and into Pendle and Rossendale. Tendered routes into Pendle and Ribble Valley have recently been relaunched with new vehicles under the Ribble County brand.
Chorley
As well as Chorley itself, the district also contains the towns of Adlington, Coppull, Croston, Eccleston and Euxton. Clayton-le-Woods and Buckshaw Village (with its business parks) sit on the border with South Ribble and are sites of new housing with proximity to the M6 and the Preston – Manchester Railway. Whittle-le-Woods, Clayton Brook and Clayton Green form an urban belt along the A6/M61 corridor. Chorley Hospital is located on the A6 to the north of the town.
A high-frequency service 125 runs along the A6 corridor linking Preston, Chorley, Adlington and Bolton. Other commercial cross boundary services run to Blackburn, South Ribble and Wigan. The bulk of Chorley’s ‘town network’ is tendered as are links through the rural west of the borough, the former with some financial support from Chorley Town Council.
Fylde
Fylde District is split with the urban belt being along the River Ribble of Lytham St Anne’s, Warton and Freckleton. The north of the district is more rural with the town of Kirkham and Wesham in the middle. Most journey attractors are located in neighbouring Blackpool and Preston, but BAE has an employment site at Warton and is part of the Warton Enterprise Zone.
Commercial services are cross-boundary, inter-urban in nature on an east–west axis linking Blackpool with Lytham St Anne’s, Preston and Lancaster. North-south links within the borough are provided by tendered services which generally cross into Blackpool, Preston and Wyre.
Hyndburn
Hyndburn is made up of the towns of Accrington, Clayton-le-Moors, Great Harwood, Oswaldtwistle and Rishton. A number of business parks and industrial estates are dotted along the M65 corridor which runs through the heart of the district.
Core service 6/7 links the main towns of Hyndburn together as well as providing cross boundary links to Blackburn. Other commercial services provide links into Blackburn (and onto Preston), Burnley, Greater Manchester and Rossendale. Lower frequency services include a small town network within Accrington and links into Ribble Valley.
Lancashire and Blackburn with Darwen Joint Bus Service Improvement Plan Page 19 of 90
Lancaster
Urban development in Lancaster District is dominated by Morecambe and Heysham alongside Lancaster city itself. The A6 corridor between Lancaster and the town of Carnforth has a number of urban areas along it, whilst a collection of small towns is dotted along the Lune Valley eastward from Lancaster. Lancaster University and Royal Lancaster Infirmary are located to the south of the city.
The highest frequency services are on the Morecambe – Lancaster – University corridor, whilst medium and low frequency local services are provided within Lancaster and Morecambe. Some short-distance interurban services provide services mainly northwards from Lancaster and Morecambe to Carnforth. Longer distance interurban links including cross-boundary services towards Preston and Blackpool via Wyre district, Cumbria via Carnforth, and North Yorkshire via the Lune Valley.
Pendle
The main urban area of Pendle covers Nelson and Colne at the southern end of the district. The towns of Barnoldswick and Earby are located at the northern end. Boundary Mill Outlet in Colne is a popular destination, but many facilities are within Burnley to the south.
Many services cross the border from Burnley including the high frequency Brierfield – Nelson – Colne link. There is also a small town network within Barnoldswick. As well as Ribble Valley, a number of interurban services also cross into North and West Yorkshire.
Preston
Whilst dominated by the Preston urban area, Preston district also includes a number of villages to the north and north east. Housing growth is mainly concentrated at Cottam and on the M55 corridor to the north of the city. Main traffic generators include the City Centre, University of Central Lancashire (UCLan), Royal Preston Hospital (RPH) and employment sites located along the M6 corridor and around the docks to the west of the city.
Preston has a core network of high and mid-frequency services, a number of which provide links to RPH and UCLan. There are also frequent services into Fylde and across the river into South Ribble. whilst a high frequency service runs to Longridge just across the border in Ribble Valley. A number of tendered
services provide links to the surrounding villages on the way towards Ribble Valley, Fylde and Wyre.
Ribble Valley
Urban development is restricted to the south and east of the district. The town of Longridge sits on the border with Preston where most services run to, although there are also tendered routes through the south west of the district to Chipping, Clitheroe and Blackburn.
Langho, Whalley, Clitheroe and Chatburn sit along the A59 corridor with interurban services linking them together with Preston, Blackburn and North Yorkshire. Clitheroe also has a tendered town network along with a number of interurban links to Burnley and Pendle of varying frequency.
Rossendale
Settlements in Rossendale are strung out along the Irwell and Spodden valleys. The main towns are Haslingden, Rawtenstall and Bacup; however, residents have to travel to neighbouring areas including Greater Manchester for some facilities.
The core network of higher frequency services link the main towns together and also provide cross- boundary links to Blackburn, Burnley, Hyndburn and Greater Manchester. There are also a number of lower frequency tendered services within the district which also provide a cross-boundary link to West Yorkshire.
South Ribble
The core of South Ribble comprises the towns of Bamber Bridge, Leyland, Longton, Lostock Hall and Penwortham which sit on the historic routes south from Preston. Higher frequency routes link these towns with Preston and also provide some in-borough links. Services also provide links from the west of the borough into South Lancashire, and from the centre and east into Chorley. Leyland has a large business park to the north and part of the Buckshaw development to the south, as well as being home to the main campus of Runshaw College.
The north east of the borough includes Higher Walton and Samlesbury on various Preston – Blackburn corridors; the latter is also home to a BAE Systems site and Enterprise Zone.
Lancashire and Blackburn with Darwen Joint Bus Service Improvement Plan Page 20 of 90
West Lancashire
West Lancashire shares borders with Merseyside to the south and west, and with Greater Manchester to the east. The larger settlements are Skelmersdale and Ormskirk to the south. The latter is home to Edge Hill University. Interurban routes link these towns together and to Merseyside and Greater Manchester. There are also supported services providing links within the towns and to the neighbouring settlements of Burscough and Parbold. Wrightington Hospital sits near the border with Greater Manchester and is served by routes from both within West Lancashire and Greater Manchester.
To the north of the borough the core routes link the towns of Tarleton and Banks to Preston (via South Ribble) and Merseyside, although Tarleton also has frequent links to Ormskirk via Rufford. The latter location is also served by tendered services on the east-west axis between Chorley and Merseyside.
Wyre
Wyre is a borough of many parts. West of the River Wyre, Poulton-le-Fylde, Thornton-Cleveleys and Fleetwood form part of the Blackpool urban area with frequent bus services on a mainly north-south axis. Whilst there are employment sites such as Red Marsh Industrial Estate and leisure destination such as Affinity Outlet, there are also a lot of destinations within Blackpool itself.
East of the River Wyre, Knott End and Hambleton, both located next to the river, are the largest towns before reaching the A6 corridor. This part of Wyre is made up of smaller towns and villages in a largely rural area. Bus routes are primarily tendered apart from the Knott End to Blackpool and Blackpool – Garstang – Lancaster interurban routes.
The A6 corridor forms an urban spine through the east of the district with the main towns being Catterall and Garstang. The core Preston to Lancaster interurban services link these settlements together. Myerscough College is a large employer and educational facility located on the border with Preston. A number of services provide links from throughout Lancashire for students.
Current situation compared to National Bus Strategy aspiration:
• A number of services in the urban areas of Blackburn, Burnley, Preston and Lancaster provide ‘walk-up’ frequencies of at least 5-6 bph.
• Consistent with the geography particularly in east Lancashire and Blackburn with Darwen, there are a number of regular interurban bus routes.
• Variable connectivity to major employment areas, with only some having a regular weekday daytime service.
• Variable service provision during evenings and Sundays, with only main connections provided.
Low frequency services to and within the rural north-east of the county in particular, and strong reliance on local authority funding for many bus services.
2.1.3. Bus Service Infrastructure
Lancashire County Council manages and staffs a number of bus station facilities:
• Preston – large facility recently refurbished Grade II-listed building with 36 bays and 5-bay coach station with passenger information screens;
• Accrington – 11-bay modern facility under 6 years old with wifi and passenger information screens;
• Chorley – interchange with 14 bays approaching 15 years old with no wifi or information screens; and
• Nelson – interchange with 10 bays over 10 years old with information screens but no wifi.
Bus stations at Burnley, Lancaster and Rossendale are owned by the borough council concerned and managed under a facilities management contract or by the local bus operator.
Table 5-2 of the LBBEB provides more information.
Blackburn with Darwen Borough Council manages and staffs Blackburn Bus Station. This has 14 stands and was opened in 2016. It has information screens and wifi. There is an unstaffed bus station at Darwen Circus.
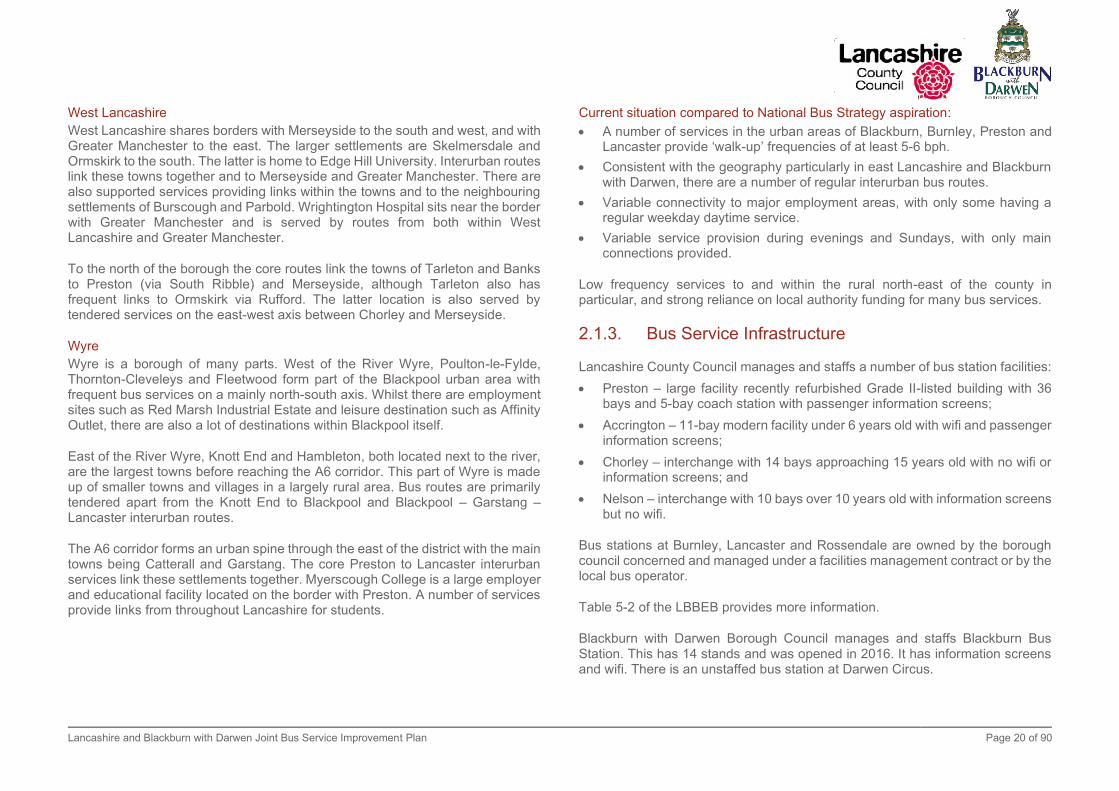
Lancashire and Blackburn with Darwen Joint Bus Service Improvement Plan Page 21 of 90
There are around 8,000 roadside bus stops in Lancashire and just under 1,000 in Blackburn with Darwen. Section 5-2 of the LBBEB contains more detail.
Figure 2-5 - Accrington Bus Station
2.1.4. Bus Fares Bus fares vary substantially across the area. As would be expected for authorities of the combined size and diversity of Lancashire and Blackburn with Darwen, the complexities of the bus network means that cash single and return fares vary by operator and even operator sub-area, while different operators have different ticketing products. These complications of fares, and overlapping fare zones make difficulties in providing clear and comprehensive fares information to users and potential passengers.
LBBEB Section 5-3 provides a summary of published fares. From this it is clear that there is substantial variation in fares and the offers to different groups, notably younger people.
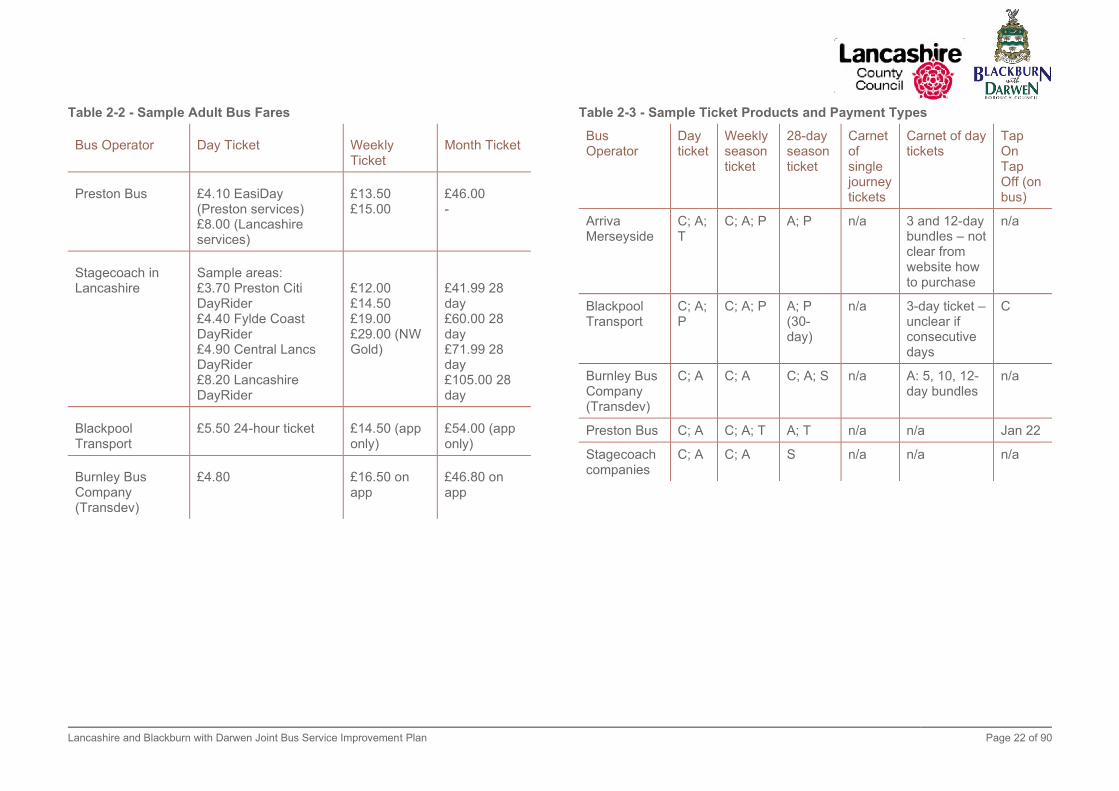
Table 2-2 illustrates some key fares charged and benchmarks these against other nearby towns.
Table 2-3 shows the variation in the product types and payment media made available by different operators, and payment media accepted. The following acronyms are used:
• C = on-bus cash or contactless bank card;
• A = mobile phone app;
• S = Smartcard;
• P = Paypoint; and
• T = Travel Office.
In addition, Blackpool Transport until recently offered a 60-minute ‘HOPPA’ fare available on-bus, mobile phone or at Paypoint.
In one sense, this variation between operators may not matter to many bus users. However, it is a significant source of confusion where bus company boundaries overlap. For instance, on the Fylde Coast, one operator offers a 28-day season, one 30-days; for the same ticket one operator accepts payment by mobile phone app or Paypoint; the other only by Smartcard.
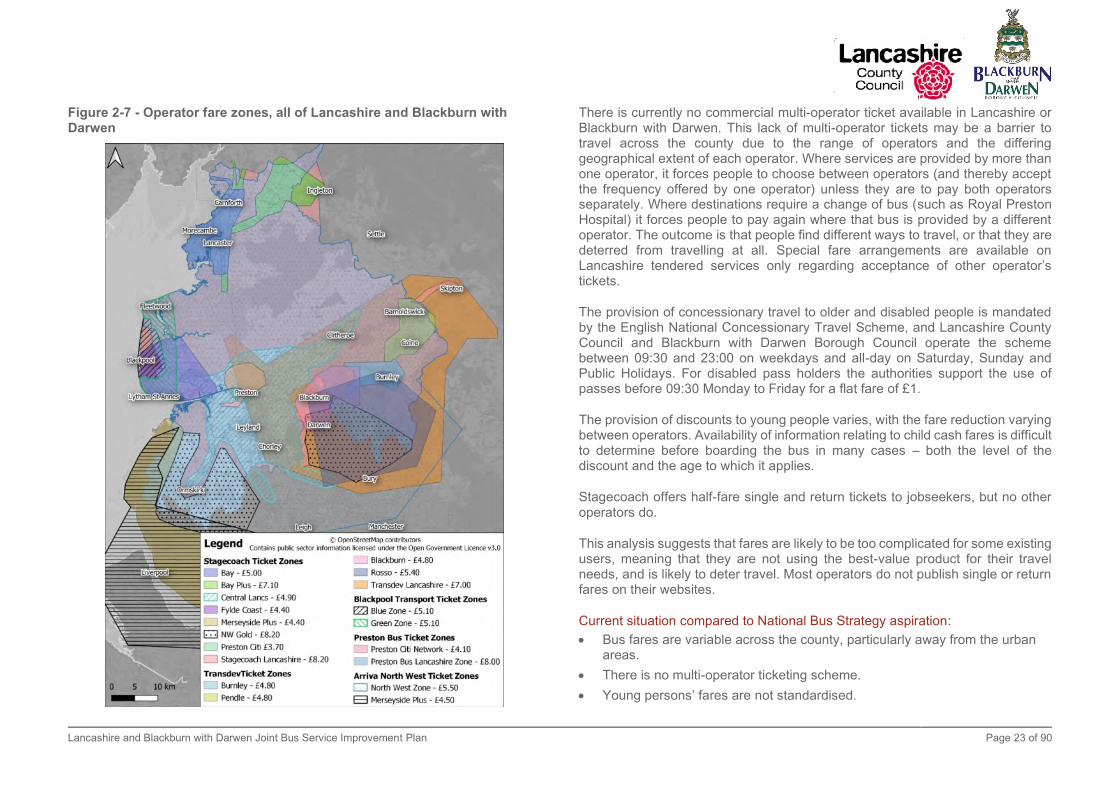
Adding to this complexity, fare boundaries vary by operators. Figure 2-5 provides an illustration of the overlapping areas for different operators ticketing products across Lancashire, including day ticket prices.
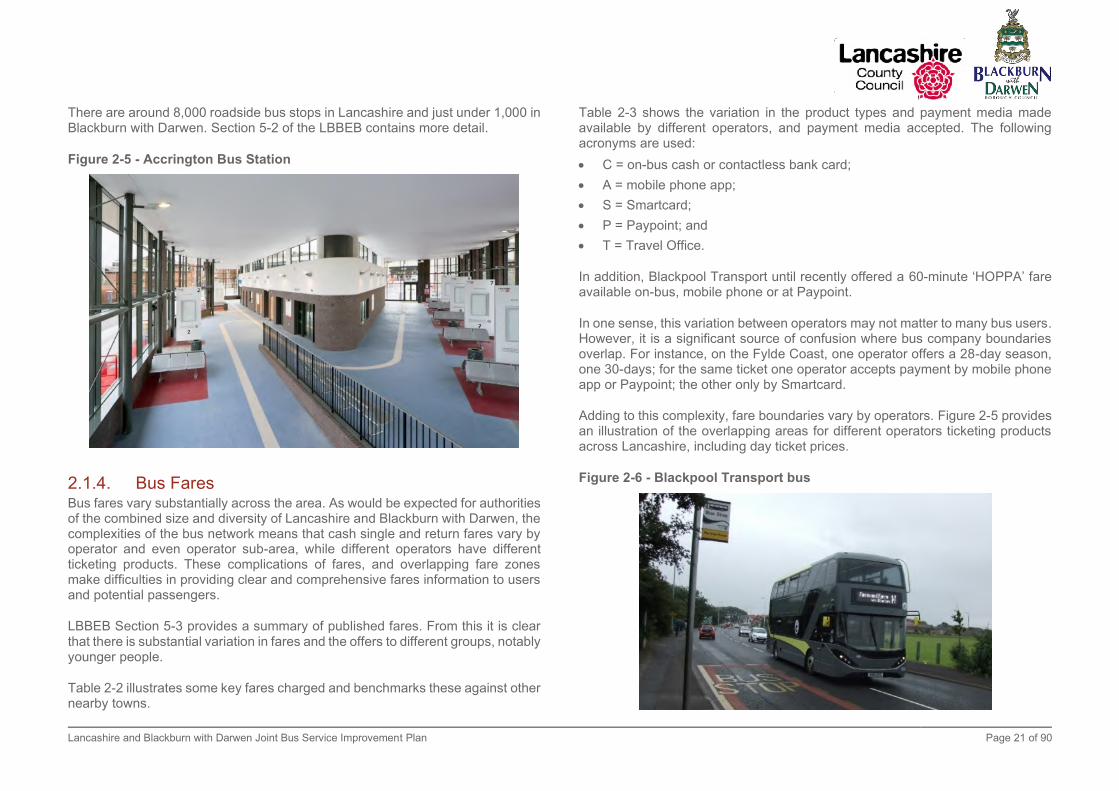
Figure 2-6 - Blackpool Transport bus
Lancashire and Blackburn with Darwen Joint Bus Service Improvement Plan Page 22 of 90
Table 2-2 - Sample Adult Bus Fares
Bus Operator Day Ticket Weekly Ticket
Month Ticket
Preston Bus £4.10 EasiDay (Preston services) £8.00 (Lancashire services)
£13.50 £15.00
£46.00 -
Stagecoach in Lancashire
Sample areas: £3.70 Preston Citi DayRider £4.40 Fylde Coast DayRider £4.90 Central Lancs DayRider £8.20 Lancashire DayRider
£12.00 £14.50 £19.00 £29.00 (NW Gold)
£41.99 28 day £60.00 28 day £71.99 28 day £105.00 28 day
Blackpool Transport
£5.50 24-hour ticket £14.50 (app only)
£54.00 (app only)
Burnley Bus Company (Transdev)
£4.80 £16.50 on app
£46.80 on app
Table 2-3 - Sample Ticket Products and Payment Types
Bus Operator
Day ticket
Weekly season ticket
28-day season ticket
Carnet of single journey tickets
Carnet of day tickets
Tap On Tap Off (on bus)
Arriva Merseyside
C; A; T
C; A; P A; P n/a 3 and 12-day bundles – not clear from website how to purchase
n/a
Blackpool Transport
C; A; P
C; A; P A; P (30-day)
n/a 3-day ticket – unclear if consecutive days
C
Burnley Bus Company (Transdev)
C; A C; A C; A; S n/a A: 5, 10, 12-day bundles
n/a
Preston Bus C; A C; A; T A; T n/a n/a Jan 22
Stagecoach companies
C; A C; A S n/a n/a n/a
Lancashire and Blackburn with Darwen Joint Bus Service Improvement Plan Page 23 of 90
Figure 2-7 - Operator fare zones, all of Lancashire and Blackburn with Darwen
There is currently no commercial multi-operator ticket available in Lancashire or Blackburn with Darwen. This lack of multi-operator tickets may be a barrier to travel across the county due to the range of operators and the differing geographical extent of each operator. Where services are provided by more than one operator, it forces people to choose between operators (and thereby accept the frequency offered by one operator) unless they are to pay both operators separately. Where destinations require a change of bus (such as Royal Preston Hospital) it forces people to pay again where that bus is provided by a different operator. The outcome is that people find different ways to travel, or that they are deterred from travelling at all. Special fare arrangements are available on Lancashire tendered services only regarding acceptance of other operator’s tickets.
The provision of concessionary travel to older and disabled people is mandated by the English National Concessionary Travel Scheme, and Lancashire County Council and Blackburn with Darwen Borough Council operate the scheme between 09:30 and 23:00 on weekdays and all-day on Saturday, Sunday and Public Holidays. For disabled pass holders the authorities support the use of passes before 09:30 Monday to Friday for a flat fare of £1.
The provision of discounts to young people varies, with the fare reduction varying between operators. Availability of information relating to child cash fares is difficult to determine before boarding the bus in many cases – both the level of the discount and the age to which it applies.
Stagecoach offers half-fare single and return tickets to jobseekers, but no other operators do.
This analysis suggests that fares are likely to be too complicated for some existing users, meaning that they are not using the best-value product for their travel needs, and is likely to deter travel. Most operators do not publish single or return fares on their websites.
Current situation compared to National Bus Strategy aspiration:
• Bus fares are variable across the county, particularly away from the urban areas.
• There is no multi-operator ticketing scheme.
• Young persons’ fares are not standardised.

Lancashire and Blackburn with Darwen Joint Bus Service Improvement Plan Page 24 of 90
• Lack of consistent fare offers for key groups, including students and job-seekers.
• Large variation in the type of ticket products available and payment methods accepted.
2.1.5. Bus Passenger Information Much information is available on channels which are universally available across the UK: Traveline, Google Maps, and a variety of open-source websites such as Citymapper.
Lancashire County Council provides timetable information on its website, including information on departure stands in its bus stations, and also allows for searching by broad and then refined area (with mapping to provide a visual search tool). The county council also provides printed timetable leaflets for those tendered bus services operated on behalf of the authority, which are also downloadable from its website.
It provides bus stop information at key stops and stations with approximately 40% coverage of all bus stops across the county, and in partnership with bus operators. Similarly, Blackburn with Darwen Borough Council provides a series of timetable leaflets and a bus network map on its website, the leaflets being organised around local services in Blackburn, Darwen, Ribble Valley, Out-of-Borough and Hospital access.
LCC provides an online Mapping information system – MARIO, on which all the bus stops are marked. By selecting a stop all the bus services serving that stop are presented and by further clicks the current timetable can be displayed. All the bus routes are mapped and can be selected and highlighted to display the routes taken, by the whole timetabled route.
For other journey planning purposes, all operators provide websites with service information, with some then providing fares information. Paper timetable leaflets are now only offered by some operators, with travel and enquiry shop facilities now fewer in number than previously, with Lancashire County Council information offices closed some years ago as an austerity measure.
Real-time information is available at some key stops in Lancashire and also using the Traveline shortcode text message service. It is provided at key interchange and hub stops in Blackburn with Darwen. Real-time information is also available
on many operators’ own mobile phone apps, allowing tracking of vehicles along the route.
Current situation compared to National Bus Strategy aspiration:
• The environment of different operators providing services results in a potentially confusing presentation of information to passengers.
• Information on fares is particularly opaque, with different operators providing different levels of information, and very limited information provided at stops.
• Limited provision of at-stop real time passenger information across Lancashire and away from transport interchanges and major hubs in Blackburn with Darwen.
Figure 2-8 - Examples of bus passenger information

Lancashire and Blackburn with Darwen Joint Bus Service Improvement Plan Page 25 of 90
2.1.6. Bus Fleet Table 2-4 shows a breakdown of vehicle emission standards for major operators in Lancashire and Blackburn with Darwen. It can be seen that around two in five buses currently conform to the latest Euro VI emission standard.
Table 2-4 - Bus Emission Standards
Bus Operator Number of vehicles in
fleet
Euro III Euro IV Euro V Euro VI
Coastliner Buses
10 8 0 2 0
Stagecoach North
92 6 9 39 38
Coastal Coaches
8 0 0 5 3
Blackpool Transport
115 0 0 0 115
Pilkingtonbus 31 0 23 3 2
Stagecoach Merseyside
123 4 12 96 11
Rotala 104 29 24 34 17
Transdev 193 43 0 72 78
Total 676 90 68 251 264
percent 13% 10% 37% 39%
Table 2-5 shows the provision of passenger facilities. Around half the fleet has ‘next stop’ announcements in some form and on-board wifi, while around a third of buses have USB chargers.
Table 2-5 - Bus Facilities
Bus Operator Number of
vehicles in fleet
Next stop audio
announcements
Next stop visual
announcements
WIFI USB chargers
Coastliner Buses 10 0 0 0 0
Stagecoach North 92 32 114 0 35
Coastal Coaches 8 0 8 0 0
Blackpool Transport
115 115 115 115 115
Pilkingtonbus 31 0 0 0 0
Stagecoach Merseyside
123 0 0 123 11
Rotala 104 12 12 12 13
Transdev 193 109 109 124 70
Total 676 268 358 374 244
percent 40% 53% 55% 36%
Current situation compared to National Bus Strategy aspiration:
• Around 2 in 5 buses conform to the latest emission standards for diesel buses, but there are no zero-emission buses.
• A high proportion of vehicles provide next stop announcements and other passenger benefits such as on-board wifi and USB chargers.

Lancashire and Blackburn with Darwen Joint Bus Service Improvement Plan Page 26 of 90
Figure 2-9 - Stagecoach single-deck buses
2.1.7. Bus Priority Measures Lancashire has extensive physical priority measures, having implemented and invested in several packages of targeted interventions on key bus routes, listed below:
• Fishergate and Fishergate Hill bus lane
• Tithebarn Street (Bus station, Preston)
• Ringway, right turn only into Friargate
• Broughton bus gate (Southern extent of the by-pass)
• Greyhound Bridge – bus lane on the bridge
• Morecambe Road – inbound bus lane, Lancaster
• Skerton Bridge – bus gate, Lancaster
• Lancaster (Spring Garden Street, bus and access only)
• Lancaster (Chapel Street and Damside Street, bus and access only)
• Owen Road/Parliament Street (Lancaster)
• Accrington town centre bus lane (on Whalley Road)
• Accrington bus station, bus gate on the viaduct roundabout
• A678 (Whitebirk approach) bus lane straddles BwDBC and LCC
• Pennine Reach bus lane, Whalley Road on approach to Sparth House/Road
• Westway, Burnley Bus lane (junction 10)
• Church Street (Burnley near Sainsbury’s)
• Padiham Road, on approach to Gannow Top Roundabout towards Burnley
In Blackburn with Darwen there are approximately 3.3km of bus lanes and several junctions incorporating bus priority. Many of these were delivered as part of the Pennine Reach scheme and most of the bus priority measures are in operation throughout the day. Bus lane locations include:
• Green Street, Darwen
• Bolton Road, Blackburn
• Saint Pauls Street, Blackburn
• 3 stretches on Bolton Road, Blackburn
• 2 stretches on Bolton Road, Darwen
• Lark Hill, Blackburn
• Preston Old Road, Blackburn
• Copy Nook, Blackburn
• Bottomgate, Blackburn
• Furthergate, Blackburn
• Burnley Way, Blackburn
• Accrington Road, Blackburn
• Eanam, Blackburn
• Jubilee Street, Blackburn
• 2 stretches in Penny Street, Blackburn
• Railway Road, Blackburn
Most of these bus lanes operate on a ’24-7’ basis. The vehicle classes permitted to use them vary by location, but most are restricted to local scheduled bus services and cyclists.
These locations are summarised at Figure 2-10.
Lancashire and Blackburn with Darwen Joint Bus Service Improvement Plan Page 27 of 90
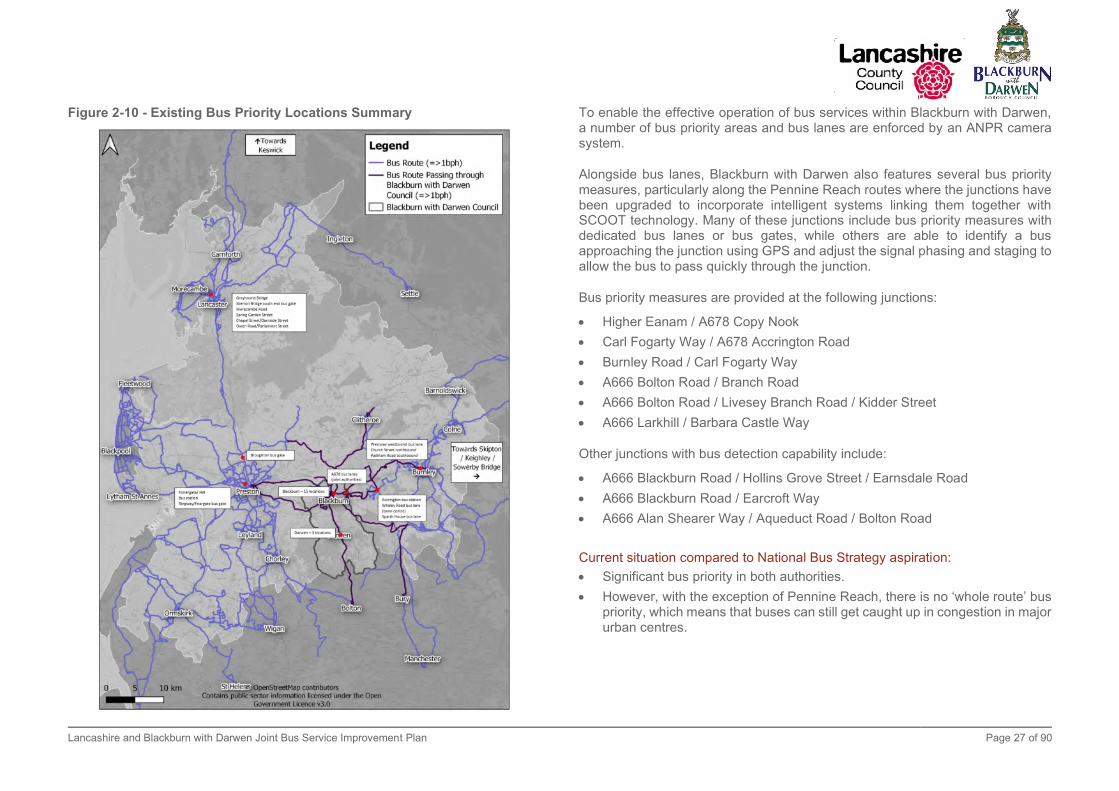
Figure 2-10 - Existing Bus Priority Locations Summary
To enable the effective operation of bus services within Blackburn with Darwen, a number of bus priority areas and bus lanes are enforced by an ANPR camera system.
Alongside bus lanes, Blackburn with Darwen also features several bus priority measures, particularly along the Pennine Reach routes where the junctions have been upgraded to incorporate intelligent systems linking them together with SCOOT technology. Many of these junctions include bus priority measures with dedicated bus lanes or bus gates, while others are able to identify a bus approaching the junction using GPS and adjust the signal phasing and staging to allow the bus to pass quickly through the junction.
Bus priority measures are provided at the following junctions:
• Higher Eanam / A678 Copy Nook
• Carl Fogarty Way / A678 Accrington Road
• Burnley Road / Carl Fogarty Way
• A666 Bolton Road / Branch Road
• A666 Bolton Road / Livesey Branch Road / Kidder Street
• A666 Larkhill / Barbara Castle Way
Other junctions with bus detection capability include:
• A666 Blackburn Road / Hollins Grove Street / Earnsdale Road
• A666 Blackburn Road / Earcroft Way
• A666 Alan Shearer Way / Aqueduct Road / Bolton Road
Current situation compared to National Bus Strategy aspiration:
• Significant bus priority in both authorities.
• However, with the exception of Pennine Reach, there is no ‘whole route’ bus priority, which means that buses can still get caught up in congestion in major urban centres.
Lancashire and Blackburn with Darwen Joint Bus Service Improvement Plan Page 28 of 90
2.1.8. Local Transport Authority Staffing The Public Transport team at Lancashire County Council covers a wide remit of public transport activity and is split into 5 teams overseen by the Head of Service for Public and Integrated Transport and Fleet and managed by the Public Transport Manager.
The teams are;
• Smart Ticketing and Concessionary Travel, which incorporates, pass production and administrative processes, ENCTS and schools, data, technology and ticketing development, management and delivery. 7 team members;
• School Transport, which includes school bus service contract management, DBS, revenue protection, payments and administration. 6 team members;
• Bus Services and Development, management and delivery of the tendered bus network, bus infrastructure and scheme development and information provision and monitoring. 10 team members, including 4 inspectors, bus services and publicity;
• Interchanges and bus stations, managing our bus station and interchanges sites and staff. 25 team members which includes Customer Services and Security staff; and
• Rail Development, managing the county’s rail development programme and schemes. 1 team member, currently.
As would be expected with a smaller unitary authority, Blackburn with Darwen has a much smaller team:
• Head of Highways, Transportation and Networks;
• Senior Transport Planner; and
• Public Transport Officer, responsible for bus station co-ordination; roadside passenger information; timetables and publicity; network inspections; highway and utility liaison; periodic vehicle and driver checks and school transport support.
In addition there are five members in the school transport team.
Current situation compared to National Bus Strategy aspiration:
• LCC has a relatively large team in numbers but it should be borne in mind that it covers a geographical wide area with a broad range of operational responsibilities such as bus station supervision and security which is the largest team area.
• BwDBC has a much smaller team that is more thinly-spread.
2.1.9. Views of Passengers and Stakeholders
Public Consultation
Lancashire County Council undertook a survey of residents in September 2021. This received 2,552 responses. A third of respondents were from Lancaster district, with Hyndburn and Rossendale representing only 1% and 2% of respondents respectively. A fifth of respondents had a concessionary ‘NoWcard’. Around 60% of respondents were female. Thirteen percent reported that they had a disability. Only 10% of respondents were under the age of 25, which is likely to be an under-representation of this group in the sample. Most respondents were of working age, with around 70% between 25 and 64.
Just over 60% of respondents reported that they currently travel by bus in Lancashire. Two-thirds reported that they travelled for leisure purposes, with half travelling for shopping, 40% for commuting and around a third to attend medical appointments.
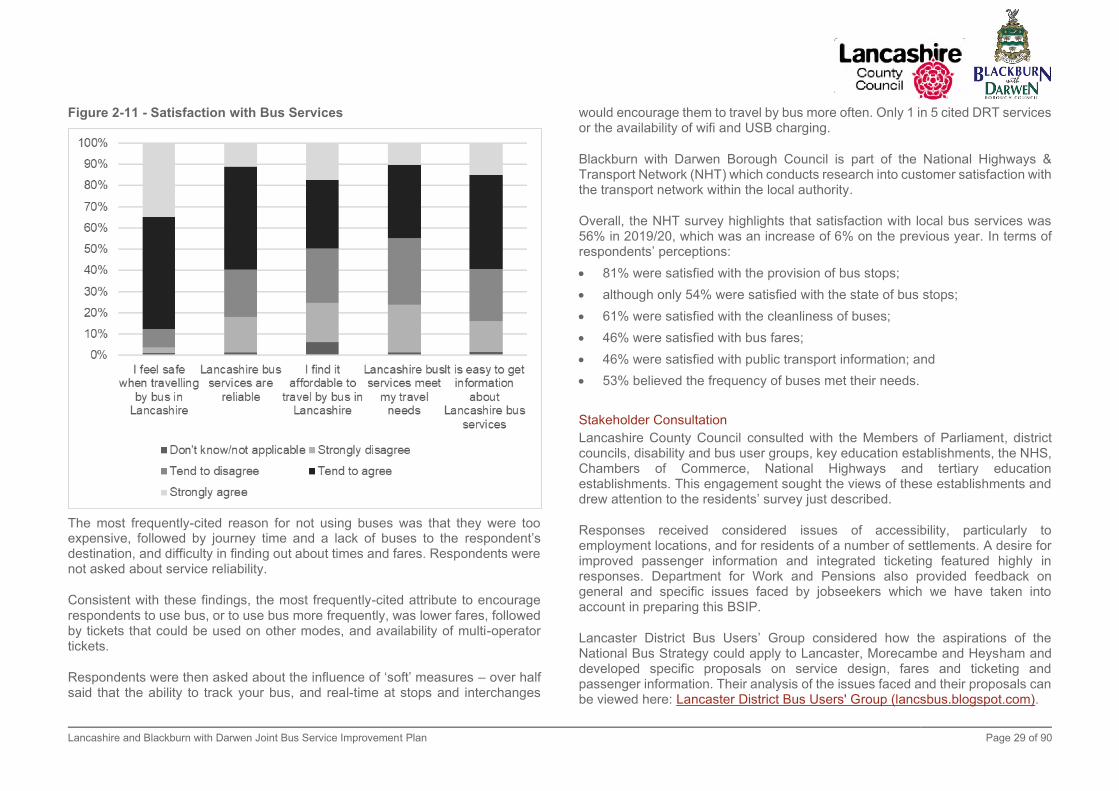
In terms of respondents’ perceptions:
• 88% agreed that they felt safe when travelling by bus;
• 59% agreed that bus services are reliable – though only 11% strongly agreed;
• 50% agreed that they found it affordable to travel by bus;
• A small majority – 54% - disagreed that Lancashire bus services met their needs; and
• 59% agreed that it was easy to get information about Lancashire bus services – though only 15% strongly agreed.
Lancashire and Blackburn with Darwen Joint Bus Service Improvement Plan Page 29 of 90
Figure 2-11 - Satisfaction with Bus Services
The most frequently-cited reason for not using buses was that they were too expensive, followed by journey time and a lack of buses to the respondent’s destination, and difficulty in finding out about times and fares. Respondents were not asked about service reliability.
Consistent with these findings, the most frequently-cited attribute to encourage respondents to use bus, or to use bus more frequently, was lower fares, followed by tickets that could be used on other modes, and availability of multi-operator tickets.
Respondents were then asked about the influence of ‘soft’ measures – over half said that the ability to track your bus, and real-time at stops and interchanges
would encourage them to travel by bus more often. Only 1 in 5 cited DRT services or the availability of wifi and USB charging.
Blackburn with Darwen Borough Council is part of the National Highways & Transport Network (NHT) which conducts research into customer satisfaction with the transport network within the local authority.
Overall, the NHT survey highlights that satisfaction with local bus services was 56% in 2019/20, which was an increase of 6% on the previous year. In terms of respondents’ perceptions:
• 81% were satisfied with the provision of bus stops;
• although only 54% were satisfied with the state of bus stops;
• 61% were satisfied with the cleanliness of buses;
• 46% were satisfied with bus fares;
• 46% were satisfied with public transport information; and
• 53% believed the frequency of buses met their needs.
Stakeholder Consultation
Lancashire County Council consulted with the Members of Parliament, district councils, disability and bus user groups, key education establishments, the NHS, Chambers of Commerce, National Highways and tertiary education establishments. This engagement sought the views of these establishments and drew attention to the residents’ survey just described.
Responses received considered issues of accessibility, particularly to employment locations, and for residents of a number of settlements. A desire for improved passenger information and integrated ticketing featured highly in responses. Department for Work and Pensions also provided feedback on general and specific issues faced by jobseekers which we have taken into account in preparing this BSIP.
Lancaster District Bus Users’ Group considered how the aspirations of the National Bus Strategy could apply to Lancaster, Morecambe and Heysham and developed specific proposals on service design, fares and ticketing and passenger information. Their analysis of the issues faced and their proposals can be viewed here: Lancaster District Bus Users' Group (lancsbus.blogspot.com).

Lancashire and Blackburn with Darwen Joint Bus Service Improvement Plan Page 30 of 90
Blackburn with Darwen Borough Council has engaged with members throughout the BSIP process and has recently held their first Bus Operator Forum following on from a recently conducted operator survey.
Current situation compared to National Bus Strategy aspiration:
• A high level of satisfaction with safety, but lower levels of satisfaction for reliability, affordability and ease of getting information.
• Respondents report that lower fares, better integrated between buses and with rail modes, and real-time information, are most likely to make them want to use buses more.
2.1.10. Bus Service Outcomes According to DfT bus statistics, there are around 23 bus passenger journeys a year for every resident in Blackburn with Darwen and around 34 in Lancashire. This bus passenger trip rate has fallen substantially in both authorities, from high points of 33 in BwDBC and 53 in Lancashire in 2009/10 (just after the introduction of the English National Concessionary Travel Scheme). Figure 6-2 of LBBEB shows that the decline in bus passenger trip rate is significantly steeper than in England as a whole or for the North West region – though the decline in Blackburn with Darwen is broadly on a par with that observed in Blackpool.
Figure 6-3 of the LBBEB compares the bus passenger trip rate against zero household car availability. It suggests that at the rate of zero car ownership observed in Lancashire at the 2011 Census, the projected bus passenger trip in Lancashire should be around ten percentage points higher at around 40, and in Blackburn with Darwen roughly three times higher at around 70.
The reasons for this are various and are not fully understood but include:
• Rail service upgrades saw increased demand at some rail stations, notably at Burnley and Accrington (LBBEB Table 2-2);
• LCC saw the loss of most of its tendered bus services – though these have been reinstated, a long-term loss of patronage can be expected as a result;
• Variable levels of traffic congestion exacerbated by planning decisions to locate residential and employment development in locations which are hard to serve by public transport – for example by motorway junctions;
• Abundance of free or cheap parking in town centres, retail parks and employment areas (although overspill on-street parking is now an issue in most employment areas);
• The decline in town centre-based retail activity with more activity taking place on-line and in the major city centres of Manchester and Liverpool which for the most part are more easily accessible by rail. Footfall in Blackburn town centre fell by 6% between 2017 and 2019;
• Lack of services in large employment areas adjacent to motorway junctions; and
• Anecdotally, high levels of private hire taxi use in some areas.
2.2. LTA Financial Support for Bus Services Figure 2-13 shows the network of services provided with financial support across the authorities’ areas. Note that this figure shows the full extent of the supported network. It is likely that a number of the routes shown are overlaid by commercial services.
Lancashire County Council currently has 39 contracts for tendered local bus services on 64 different services. Some of these are for the operation of evening or Sunday services on otherwise commercial services, but around three quarters of the contracts are for the operation of entire daytime services, with a focus on fulfilling mobility needs across the county.
These contracts are expected to carry around 2.5m passengers or around 6% of the total passengers. The net cost – after fare-paying revenue and concessionary travel reimbursement – is expected to be around £7.8m. The county council has also introduced additional services, as part of the DfT's "A Better Deal for Bus Users" funding allocation which are contained within the costs above.
Before the Covid-19 pandemic, Blackburn with Darwen provided support to five services at a total cost of around £33,000 per annum.

Lancashire and Blackburn with Darwen Joint Bus Service Improvement Plan Page 31 of 90
Figure 2-12 - Transdev minibus in Leyland
Figure 2-13 - Bus services provided with financial support
Lancashire and Blackburn with Darwen Joint Bus Service Improvement Plan Page 32 of 90
2.3. Other Factors that Affect the Use of Local Bus Services
Blackburn with Darwen Borough Council charge for the parking of motor vehicles in a number of on-street and off-street locations throughout the borough.
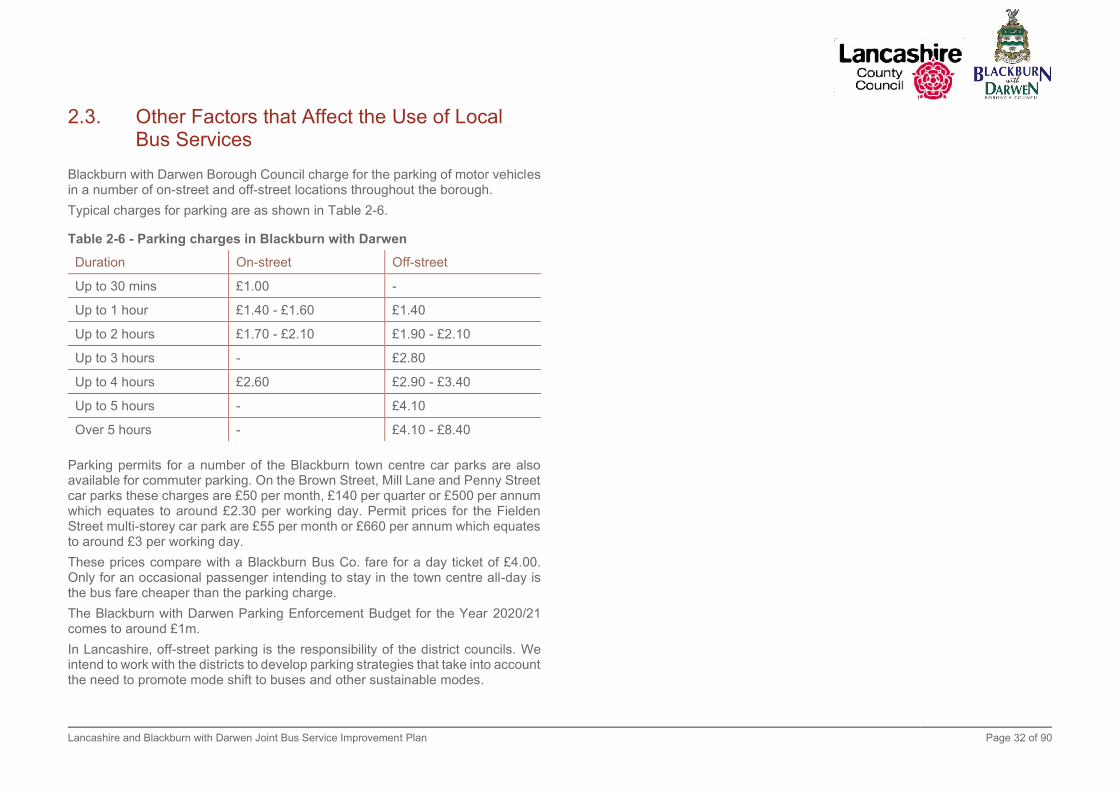
Typical charges for parking are as shown in Table 2-6.
Table 2-6 - Parking charges in Blackburn with Darwen
Duration On-street Off-street
Up to 30 mins £1.00 -
Up to 1 hour £1.40 - £1.60 £1.40
Up to 2 hours £1.70 - £2.10 £1.90 - £2.10
Up to 3 hours - £2.80
Up to 4 hours £2.60 £2.90 - £3.40
Up to 5 hours - £4.10
Over 5 hours - £4.10 - £8.40
Parking permits for a number of the Blackburn town centre car parks are also available for commuter parking. On the Brown Street, Mill Lane and Penny Street car parks these charges are £50 per month, £140 per quarter or £500 per annum which equates to around £2.30 per working day. Permit prices for the Fielden Street multi-storey car park are £55 per month or £660 per annum which equates to around £3 per working day.
These prices compare with a Blackburn Bus Co. fare for a day ticket of £4.00. Only for an occasional passenger intending to stay in the town centre all-day is the bus fare cheaper than the parking charge.
The Blackburn with Darwen Parking Enforcement Budget for the Year 2020/21 comes to around £1m.
In Lancashire, off-street parking is the responsibility of the district councils. We intend to work with the districts to develop parking strategies that take into account the need to promote mode shift to buses and other sustainable modes.

Lancashire and Blackburn with Darwen Joint Bus Service Improvement Plan Page 33 of 90
3. Headline Targets The targets set out below are initial targets developed by LCC and BwDBC. They will be reviewed with each iteration of the BSIP, with the first review taking place in October 2022. The targets will be reviewed against funding, the delivery of schemes and measures, and the monitoring results.
This section refers to the interventions that we expect to develop to deliver these targets. These are described in more detail at Section 4.
3.1. Bus Journey Times
3.1.1. Target Development A number of interventions are proposed to improve bus journey times in Lancashire and Blackburn with Darwen. There are four pillars to this strategy:
• Developing bus priority measures in line with the National Bus Strategy, including a range of interventions such as bus lanes and traffic light priority. These interventions will focus on whole routes, with design and implementation of measures on a sequential basis starting with the urban and interurban Superbus routes;
• Combining the development of bus priority measures with reviews of highway infrastructure, kerbside parking and loading regulations and bus stop geometries. Again, we will maximise the value of this investment by treating whole routes, where possible in co-ordination with neighbouring authorities;
• In conjunction with bus operators, progressively rolling out ‘Tap on Tap off’ account-based ticketing; and
• Bus network design, seeking on a case-by-case basis opportunities to accelerate services through more direct routeings.
Across the Lancashire and Blackburn with Darwen areas we target a 10% reduction in bus journey times over the lifetime of this BSIP. This reflects the different extent to which the interventions will influence bus journey times on different types of services. Overall, we target reductions in journey times of:
• Interurban Superbus routes – 12%;
• Secondary Interurban routes – 8%;
• Urban Superbus routes – 17%; and
• Other services – 2%.
3.1.2. Monitoring Proposal We propose to measure these outputs in the following ways:
• Analysis of published scheduled journey times (baseline 2018/19);
• Analysis of achieved journey times, utilising data from real-time passenger information systems where available; and
• Analysis of both these metrics in comparison to general traffic journey times, using Bluetooth data. This will enable us to take account of changes in car journey times in assessing the effectiveness of the bus priority and other measures implemented.
3.2. Bus Journey Time Reliability
3.2.1. Target Development The measures put forward above will also deliver greater consistency of journey times, which will translate into improvements in reliability.
In 2018/19, on-time performance for non-frequent bus services was, according to DfT Statistics:
• 83.8% in Blackburn with Darwen; and
• 81% in Lancashire.
These figures utilised a combination of real-time passenger information (where available) and on-street monitoring results. Lancashire County Council recorded an excess wait time of 0.9 minutes on frequent services – meaning that on average, a passenger has to wait almost a minute longer than they would be

Lancashire and Blackburn with Darwen Joint Bus Service Improvement Plan Page 34 of 90
expected to if they arrived at a bus stop randomly and bus service headways were as scheduled.
Assuming that all the measures set out above and as detailed in Section 4 of this BSIP are implemented, we target:
• 90% ‘on time’ performance for non-frequent services in both authorities; and
• Excess wait time of 0.8 minutes for frequent services in both authorities.
3.2.2. Monitoring Proposal The baseline available to us is as for bus journey times.
For services where frequency is fewer than 6 buses per hour, we will use the ‘percent on-time’ metric, using the standard definition of between 1 minute and 59 seconds early and 5 minutes and 59 seconds late, which we propose to measure at designated timing points. We will exclude early arrivals at the final destination from the analysis.
For those services where frequency is 6 buses per hour or more, we propose to use the metric of excess wait time, subject to this being practical within the constraints of the data. This is because, using the ‘on time’ metric, buses on a 10-minute headway service could run together in pairs, passengers would be presented in effect with half the advertised frequency, yet according to the metric of schedule adherence they would count as running on-time. Similarly though, if each bus is 10 minutes late, but the service is delivering consistent 10-minute headways, the passenger will receive a perfect service.
It can be seen that the use of the excess wait time metric deals with the shortcomings of the on-time measure, but for accuracy relies on each bus being recorded, so we will only use it if we are confident in having complete datasets available. Again, we will measure performance at timing points.
3.3. Passenger Numbers
We expect patronage to respond positively in response to:
• Reduced journey times;
• Improved reliability;
• Improved passenger information;
• Consistent branding;
• Fares reduced for under-19s on a consistent basis;
• Other fare reductions;
• Ease of use arising from multi-operator ticketing schemes and account-based ticketing.
3.3.1. Target Development If all the interventions outlined at Section 4 are delivered, our target is:
• A return to pre-Covid (2018/19) patronage levels by March 2025. This represents an increase of between 25% and 40% over the patronage levels that operators currently (October 2021) report; and
• 10% increase in patronage by March 2030 over 2018/19 levels.
3.3.2. Monitoring Proposal We propose to request data on the number of boardings in the Lancashire and Blackburn with Darwen administrative areas from operators to enable us to present one aggregated patronage figure for each LTA in each six-monthly BSIP update.
Lancashire and Blackburn with Darwen Joint Bus Service Improvement Plan Page 35 of 90
3.4. Passenger Satisfaction
3.4.1. Target Development This aligns with our LTP4 performance indicator of improving the user perception of public transport. The LCC residents’ survey forms a possible basis for establishing a baseline of current satisfaction. The five measures are listed together with the target increase in people agreeing strongly or tending to agree with each statement:
• I feel safe when travelling by bus in Lancashire – 5%;
• Lancashire bus services are reliable – 20%
• I find it affordable to travel by bus in Lancashire – 20%
• Lancashire bus services meet my travel needs – 20%
• It is easy to get information about Lancashire bus services – 20%
3.4.2. Monitoring Proposal We propose to repeat the survey each year to inform the annual review of the BSIP. We will extend it to Blackburn with Darwen and seek to gain a more representative sample by district, age and gender.
Figure 3-1 - Preston Bus at Preston Bus Station
Lancashire and Blackburn with Darwen Joint Bus Service Improvement Plan Page 36 of 90
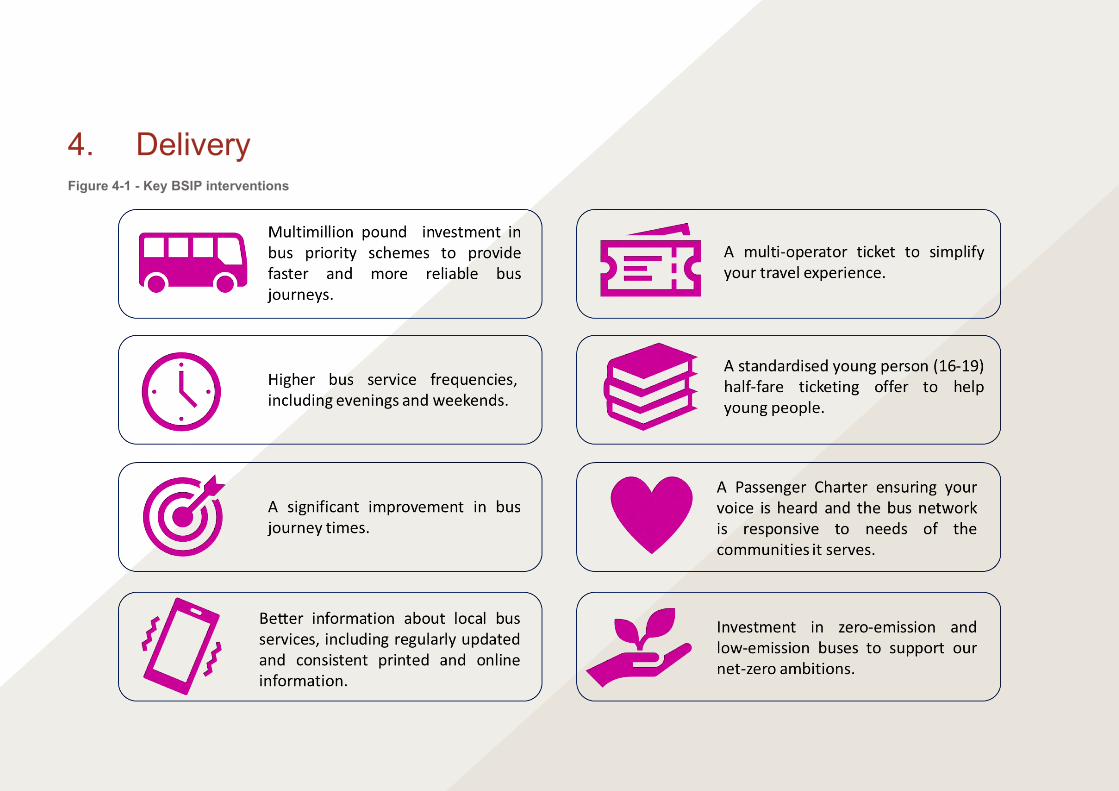
4. Delivery Figure 4-1 - Key BSIP interventions

Lancashire and Blackburn with Darwen Joint Bus Service Improvement Plan Page 37 of 90
4.1. Make Improvements to Bus Services and Planning: More Frequent and Reliable Services
4.1.1. Review Service Frequency
Improving Existing Bus Services
Many bus service frequencies between and within major settlements in Lancashire and Blackburn with Darwen are already at ‘walk up’ standards or operate to a regular frequency. Discussions and engagement with bus operators suggest a number of opportunities to further improve frequencies.
Consistent with the National Bus Strategy, these opportunities include increases in daytime bus service frequencies, and improvements to early morning, evening and Sunday services in order to improve the usefulness of these services in accessing shift-working employment opportunities and the evening economy.
These improvements are in three service categories:
• Urban ‘Superbus’ networks in Preston and on the Fylde Coast;
• Interurban ‘Superbus’ services; and
• Secondary interurban services.
The Superbus concept is described in more detail under ‘Superbus networks’.
In urban areas, ‘Superbus’ in effect means a bus operating to a ‘walk up’ (at least 5 buses per hour, evenly spaced) frequency during Monday to Saturday daytimes, with at least 2 buses per hour during evenings and on Sundays. Interurban Superbus services operate at least twice an hour throughout the week. The Superbus concept is described more fully in Section 4.1.4, but in essence these services form the focus of where we and the bus operators believe investments in frequency, passenger information and marketing will provide the best payback.
In most cases these improvements will require additional resource and hence will be subject to additional revenue support funding being made available – and the feasibility of disbursing these funds. In some cases, particularly in urban areas
such as Preston, the Fylde Coast and Blackburn, we will seek to achieve increases in frequency by co-ordinating service headways between services, and in some cases between operators. In these cases we will wish to negotiate Qualifying Agreements.
Superbus is not the sole focus, however, and we are seeking funding to improve other local services and introduce new ones to provide more comprehensive coverage within the urban areas, including greater penetration of employment areas.
Our bus service enhancement proposals include increases in evening and Sunday services and where possible increases in our supported rural bus network.
New Bus Services
Responding to new opportunities for bus, new bus service proposals include:
• A new fast service between Skelmersdale and Liverpool, to address currently very unattractive bus journey times and as a precursor to rail line re-opening; and
• New and improved links to various large hospital sites across Lancashire.

Lancashire and Blackburn with Darwen Joint Bus Service Improvement Plan Page 38 of 90
4.1.2. Increase Bus Priority Measures Blackburn with Darwen Borough Council and Lancashire County Council have a joint track record in investment in bus priority as part of the Pennine Reach scheme, which implemented bus priority measures between Blackburn and Accrington in 2016. It saw the percentage of buses recorded as running on-time increase by 4% and patronage increase by 12%.
More recently, LCC applied to the Transforming Cities Fund (TCF) to implement a range of improvements in Preston, including bus priority measures to be implemented on four strategic corridors to the city centre.
Engagement with bus operators has identified the potential to undertake a range of bus priority schemes, many of which will directly support the Superbus networks described in section 4.2.4. Scheme proposals focus on the urban areas of Preston, Lancaster, Morecambe and Heysham, but also with a number in East Lancashire and the Fylde Coast. The Preston proposals pick up those schemes proposed in the TCF bid but which are currently unfunded.
Appendix B shows the proposed scheme locations plotted on existing bus services, and summarises these proposals. Proposals range in scale, from double yellow lines to enable buses to exit bus stops more easily, to lengths of bus lane on the highway.
Subject to funding being made available and further investigation as required into feasibility, Table 4-2 summarises the number of schemes and the source of funding.
Table 4-2 - Bus Priority Schemes Summary
Local Authority Number of schemes
Funding sought from
BSIP
Already funded or funding agreed
from other sources
Total
Lancashire 41 £40.0m £26.0m £66.0m
Blackburn with Darwen
26 £5.5m £10.3m £15.0m
Of the total estimated spend of £83m, £78m (or 94% of the total) will benefit bus services that are designated as ‘Superbus’. Of the total funding sought from the BSIP of £46m, £44m is for measures that benefit Superbus bus services.
Route Reviews
In addition to the proposals for bus priority, each authority will, subject to funding, undertake route reviews in partnership with our operators. These will identify small-scale measures which will improve bus journey times and reliability. Typical areas include reviewing waiting and loading restrictions or amending the geometry at bus stops, and identifying locations where greater enforcement of current restrictions is required. This is a particular focus in business parks where overflow parking and goods vehicles parked on-street make it difficult for buses to access.
4.1.3. Increase Demand Responsive Services LCC and BwDBC recognise the scope for DRT to provide improved accessibility in certain circumstances, such as first and last-mile links to employment sites and in very rural locations.
We recognise that technology and connectivity to it, particularly mobile, has advanced greatly since we ceased support for DRT schemes that had not been sustainable. Likewise travel patterns have changed and may strengthen the role of DRT. We will engage with local businesses and communities to develop DRT propositions where these fill real gaps in the local bus network in partnership with providers in both the commercial and voluntary sectors.
One opportunity is to investigate provision to the large market garden farms particularly in West Lancashire and Fylde, and other rural businesses, where many of the requirements are likely to be seasonal. Here we think community transport or brokerage models may be appropriate and low-risk responses to localised and seasonal requirements, which could nonetheless assist in addressing problems of labour supply.
With BSIP funding we will develop options for DRT to out of town industrial estates that may not be well served. This includes areas like Skelmersdale, Burnley, Pendle with large employment sites not suitable for large bus operations.
Lancashire and Blackburn with Darwen Joint Bus Service Improvement Plan Page 39 of 90
It is possible that DRT may be beneficial in some of the more remote villages that cannot be easily served by through bus services. We will consider opportunities for community transport involvement in serving these and we will work with community transport sector, who have some experience of developing community led services, including car schemes and will support the development of rural transport services in partnership.
We will utilise NBS resource funding to employ a Transport Officer to focus on community engagement and rural and DRT transport options and we will work with internal Public Health partners to understand these local needs and whether public transport is the right solution. We provide and support community transport (CT) for many who are isolated: CT provides access to social and leisure activity as well as health and shopping.
4.1.4. Consideration of Bus Rapid Transport Networks Our proposals for Superbus, described below in Section 4.2.4, contain many elements of bus rapid transit. In particular, the proposals for ‘whole route’ priority, designed and delivered in partnership with neighbouring local transport authorities, are a key signifier of BRT delivered on-street, and are a key feature of the successful Glider BRT in Belfast.
We are also seeking from the BSIP funding to undertake feasibility studies on the conversion of a redundant rail corridor in east Preston, between Longridge and Preston, to an off-street BRT that would support some key residential, employment and retail areas more directly. If feasible, delivery of this scheme will require funding as part of a future Bus Service Improvement Plan.
4.2. Improvements to Planning / Integration with Other Modes
4.2.1. Integrate Services with Other Transport Modes Proposals to integrate fares and ticketing are dealt with elsewhere in the document. We will keep under review opportunities to improve integration between bus and rail services. One example is at Lancaster where under our Superbus proposals some interurban services that provide strategic links to the rail network would be extended to operate to and from the rail station.
Lancashire is well-served by a number of national coach services. Many use our bus station facilities across Lancashire. We will continue to support the use of these facilities for those passengers making longer inter-urban trips across the UK, and the ability of passengers to access these services by local bus.
4.2.2. Simplify Services Route variations and letter suffixes are fairly limited in Lancashire and Blackburn with Darwen. Operators and the LTAs have tried where possible to simplify routes. We will review where it is possible that routes cover too much ground, and where splitting or merging services might make the passenger proposition simpler and more direct. We will identify where this may have revenue or resource impacts.
We will work with bus operators to standardise service change dates on a small number of pre-determined dates per year in order to minimise the potential for confusion and disruption to passengers.
4.2.3. Review Socially Necessary Services Lancashire County Council has recently restored a number of tendered services withdrawn a few years previously in the wake of austerity-related budget reductions. Its net spend on socially necessary services is now around £7.8m a year, and these services carry around 2.5 million passengers.
Nonetheless, we will continue to review provision of socially-necessary services. A key plank of the Superbus proposals outlined below is the provision of service levels during evenings and at weekends, and a key focus of the DRT proposal is similarly to expand opportunities to travel to where these cannot be met by fixed-route bus services.
4.2.4. Invest in Superbus Networks As identified in the National Bus Strategy, Lancashire and Blackburn with Darwen have an extensive network of interurban bus routes. Almost all of these are operated on a commercial basis (pre-pandemic) by a small number of bus operators, with relatively high frequencies on many routes seven days a week. A number of these routes have peak weekday frequencies in excess of half-hourly, which is significantly better than the typical rail service frequencies in operation on their fixed limited corridors. There is in addition a high-frequency urban network in Preston and on the Fylde Coast.
Lancashire and Blackburn with Darwen Joint Bus Service Improvement Plan Page 40 of 90
Reliability is a key factor for customers when travelling by bus and whilst certain interurban routes have benefited from specific bus priority measures such as Pennine Reach, improvements are needed to both interurban and urban routes to make bus journeys more reliable.
Similarly, with bus stop infrastructure, both authorities have undertaken significant improvements in recent years, and LCC has begun a programme of installing new shelters, but there are many bus stops capable of improvement and sufficient funds need to be made available for cleaning, maintenance and refurbishment of existing facilities.
Many existing interurban services form part of major bus operators' premium route brands with enhanced environmental engine specifications and a high standard of on-board services, such as free Wi-Fi, usb charging, leather seats, extra leg room, luggage space and audio announcements.
Although reasonably competitive fare structures are in place, these are focused purely on individual bus operators’ routes and networks. A proposal to introduce multi-operator ticketing as part of the Enhanced Partnership will create the opportunity to boost attractiveness of the interurban network, enabling greater customer choice with the ability to utilise local urban and rural bus services to act as feeders aiding public transport access a wider areas of the county, while multi-operator ticketing will also improve the reach of buses in urban areas.
It is fundamental that Lancashire's important interurban bus services are initially as a minimum maintained at their current frequency levels, enabling more time to stabilise the existing and assess the future customer demand levels across the network.
The core aims of the interurban network will be to offer a network of routes that are linked under a uniformed brand identifier with agreed minimum service standards in terms of vehicles, frequencies, and fares.
As described above, it is proposed that Interurban Superbus routes will operate at least every 30 minutes throughout the day and evening on Mondays to Saturdays. The standard will be at least every 30 minutes during the day on Sundays and every 60 minutes on Sunday evenings.
Urban Superbus services will operate at least every 10 minutes during Monday to Saturday daytimes, and at least every 20 minutes at other times.
These standards are based on existing (pre-Covid) frequencies, enhanced where operators and the authorities believe that there is a medium or long-term prospect for routes to become commercial and in response to development opportunities. We will consider opportunities for 24-hour operation where this might be feasible.
Both types of Superbus services will be supported by bus priority measures described at section 4.1.2, which will be designed and implemented on a ‘whole route’ basis to maximise their effectiveness.
Delivering suitable customer waiting environments is a key component for improved bus services. The Enhanced Partnership will agree a suitable specification for bus stops served by Superbus routes, with focuses on passenger accessibility, the ability of buses to manoeuvre to and from bus stops easily, suitable standards for waiting bus passengers and information including static and real-time, and shelters installed at all locations required. Real Time Information screen and totems to be deployed at many bus station/hubs stops, town and city centre stops and other key stops along all routes.
All vehicles in use across both types of Superbus network will comply with Euro 6 emission standards and we will pursue means of decarbonisation, recognising the challenges associated with converting longer routes to zero-emission technologies. We will develop as standard a passenger specification including USB charging points, free Wi-Fi, and audio-visual next stop announcements.
Figure 4-2 - Stagecoach double-deck bus

Lancashire and Blackburn with Darwen Joint Bus Service Improvement Plan Page 41 of 90
Park and Ride
There are currently three bus-based Park and Ride sites in Lancashire, two serving Preston and one serving Lancaster. Park and Ride continues to help reduce the number of cars entering our city centres and therefore we will continue to promote and market them to encourage sustained use. We will also consider further enhancements to the sites and bus services to ensure better utilisation is made.
A further Park and Ride site is proposed for South Lancaster, as part of the HIF-funded remodelling of the M6 junction 33 and the development of the Bailrigg Garden Village. It is proposed that this site will be served by the enhanced Superbus routes serving the Lancaster University and the Garden Village, where a variety of bus priority measures will also be introduced and where the bus service will operate to Bus Rapid Transport standards. It is currently anticipated this will be introduced in 2027.
We will assess opportunities for smaller scale park and rides sites that will support Superbus and other local bus services.
4.3. Improvements to Fares and Ticketing
4.3.1. Lower Fares As outlined in Section 2, many bus fares in Lancashire and Blackburn with Darwen offer good value. However, there are opportunities to expand the value proposition, particularly for those groups whose incomes are constrained and are reliant on buses, and for whom car ownership is unlikely to be an option. These include young people aged under 19, recognising that young people aged 16-19 make more use of buses than any other age group, and for whom an improved fare offer is likely to generate improved mobility. At present Blackpool Transport and the Transdev companies extend discounted fares to under 19s. The same objective applies to jobseekers, to whom Stagecoach currently provides a discount.
We recognise that the journey to school is a prime opportunity to effect mode shift. We will therefore review the fares charged for children on home-to-school (and college) transport arranged by LCC and BwDBC on both local bus services and special schools services.
We see an opportunity to reduce fares at off-peak times. The first is in the evenings, where patronage is traditionally lower but where opportunities exist to develop the leisure market for travel. The second is to offer free travel on a Sunday or Bank Holiday when travel is purchased on the preceding Saturday.
Subject to funding we intend to implement lower fares for targeted groups and in specific circumstances. These are:
• A standardised half-fare ticket offer for under 19s, building on the commercial discounts offered by some operators to young people aged 16-19s;
• A standardised half-fare ticket offer for job seekers. This is intended to be provided to those unemployed claiming Jobseekers Allowance for 3-9 months (18-24 year olds) or 3-12 months (over 25s). Other benefit recipients may receive a Jobcentre Plus Travel Discount Card from 3 months of their claim and if they are actively engaged with a Jobcentre Plus adviser;
• A standardised half-fare ticket offer for recipients of Universal Credit, on the same terms as for job seekers;
• A standardised unlimited travel ticket in the evenings; and
• ‘Buy one get one free’ – applying to free travel being offered on Sundays when the user has purchased a ticket on the preceding Saturday.
Multi-Operator Ticketing
Another plan is to reduce fares more widely. Our proposals for a multi-operator ticketing scheme, described in section 4-3-2 below, will reduce the fares paid by those who currently have to use more than one operator’s services to complete their journey. This will be available in daily, 7-day and 28-day formats, with validity to 03:59 the day after they expire to allow journeys to be completed after midnight. But we also recognise that many people wish to make occasional but repeated use of buses. We will therefore introduce these multi-operator products as carnets of 3, 5 or 10 days.
Some of the initiatives described below under ‘simplify fares’ will also make travel cheaper in specific circumstances.
We will work in consultation with neighbouring authorities to ensure, as far as possible, that the fares offers and ticketing initiatives pursued by LCC and BwDBC apply to journeys that residents make across boundaries, notably to Blackpool, West Yorkshire, Merseyside, Greater Manchester and Cumbria.
Lancashire and Blackburn with Darwen Joint Bus Service Improvement Plan Page 42 of 90
4.3.2. Simplify Fares Figure 2-7 shows some of the complexity of fares in Lancashire and Blackburn with Darwen, with different operators having different products, different offers to different groups and different boundaries within which these apply.
The first step is to standardise operators’ fare zone boundaries, such that both Preston Bus and Stagecoach have the same fare zone boundary for Preston, for example. This will make it possible to introduce a coherent multi-operator ticketing proposition which we intend to do across Lancashire, Blackburn with Darwen and Blackpool. This will serve two key purposes:
• Maximise the benefit of the proposals to co-ordinate bus service headways in urban locations such as Preston, by enabling passengers to board any bus, regardless of operator; and
• Enable passengers to change between buses at no extra cost. This will help in particular to enable passengers to reach edge-of-town employment sites like regional hospitals.
Some operators in the area have plans to migrate to ‘Tap On Tap Off’ (TOTO) ticketing, and we will encourage this by seeking funding through the BSIP for second-card readers on the buses. This will have the significant benefit of removing the need for the passenger to have before they board the bus - or to acquire through interaction with the driver – knowledge of the ticket product they wish to purchase.
One issue that the extension of a discounted fare offer to 16-19 year-olds has is that this group will by default be excluded from the ability both to TOTO and to obtain the discount. The workaround to this is to enable people aged under 20 to pre-register whichever means (or travel token) they wish to use. This might take the form of a pre-registered bank card, or a ‘white’ EMV (contactless) card, and we will seek funding from the NBS to establish and maintain the necessary back office function.
Initially we will offer multi-operator tickets through a variety of various tokens, including mobile apps, QR tickets, ITSO smartcards and ITSO on mobile.
We want to migrate this multi-operator ticketing initiative to a contactless EMV and fare capping system as soon as a back office becomes available. This is in effect ‘tap on tap off’ ticketing in a multi-operator environment. We note the DfT’s
assurance that a nationwide proposition will be in place. Nonetheless, we will separately seek funding through the BSIP to complete the provision of second-card readers and to create the administrative infrastructure for the multi-operator scheme (including operator reimbursement) and to deal with passenger queries.
We will review the concessionary travel scheme to try and speed boarding and remove the need for ticket issuance, from 2023. We will also consider extending the current 23:00 Monday to Friday restriction to allow for later night travel to pass holders.
4.3.3. Integrate Ticketing Between Operators and Transport
Bus/tram ticketing is feasible within Lancashire and Blackpool. and we will seek for Blackpool tram to be included in any multi-operator ticketing scheme.
We will promote electronic PlusBus as a means of delivering integrated bus travel with rail at start and end of journeys.
4.4. Higher Specification Buses
4.4.1. Invest in Accessible and Inclusive Bus Services We will agree an appropriate set of specifications for bus stop upgrades as a technical activity undertaken during development of the Enhanced Partnership. We are seeking funding from the NBS to undertake upgrades at 2,780 bus stops in LCC and 120 bus stops in BwDBC, focusing initially on the Superoute network. These upgrades will include:
• Review bus stop geometry to ensure that buses can access and egress quickly and efficiently. This may include the provision of bus stop boarders and filling in laybys;
• Review kerb heights and provision for accessible boarding and alighting;
• Review the provision of passenger facilities, including shelter and information;
• Provision of real-time passenger information at 10% of stops; and
• Review walk access routes, including dropped kerbs, pedestrian crossing points, footways and footpaths.
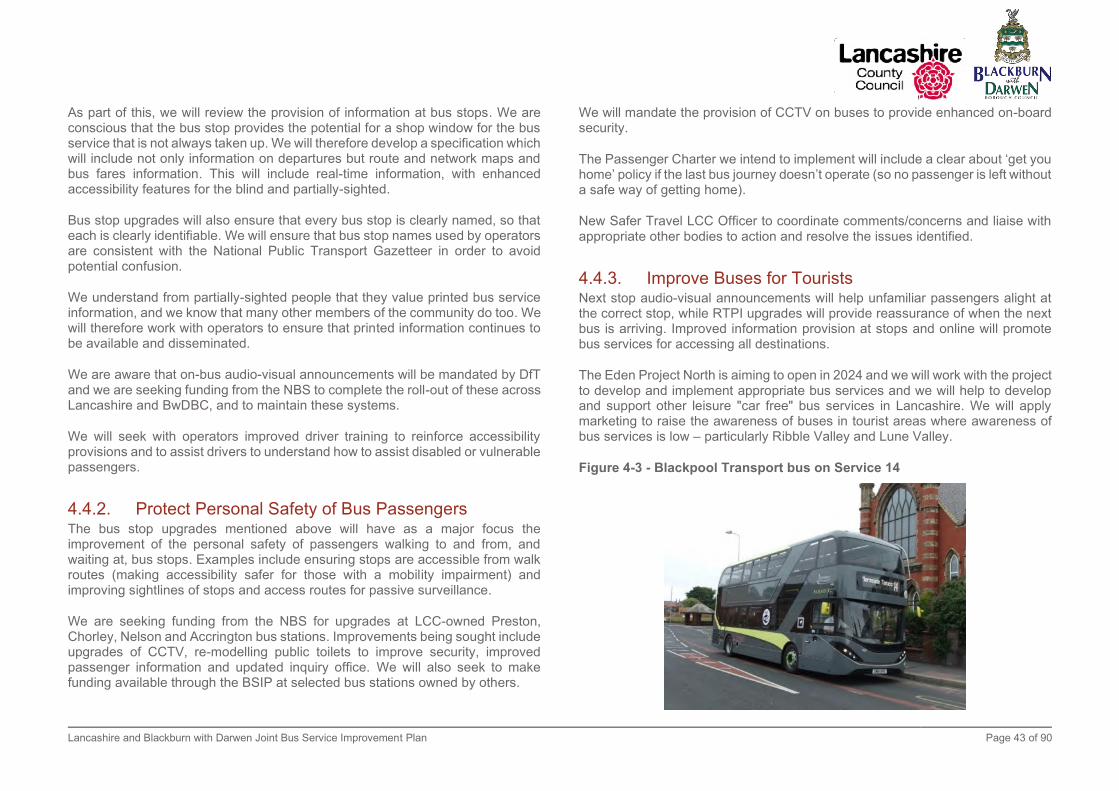
Lancashire and Blackburn with Darwen Joint Bus Service Improvement Plan Page 43 of 90
As part of this, we will review the provision of information at bus stops. We are conscious that the bus stop provides the potential for a shop window for the bus service that is not always taken up. We will therefore develop a specification which will include not only information on departures but route and network maps and bus fares information. This will include real-time information, with enhanced accessibility features for the blind and partially-sighted.
Bus stop upgrades will also ensure that every bus stop is clearly named, so that each is clearly identifiable. We will ensure that bus stop names used by operators are consistent with the National Public Transport Gazetteer in order to avoid potential confusion.
We understand from partially-sighted people that they value printed bus service information, and we know that many other members of the community do too. We will therefore work with operators to ensure that printed information continues to be available and disseminated.
We are aware that on-bus audio-visual announcements will be mandated by DfT and we are seeking funding from the NBS to complete the roll-out of these across Lancashire and BwDBC, and to maintain these systems.
We will seek with operators improved driver training to reinforce accessibility provisions and to assist drivers to understand how to assist disabled or vulnerable passengers.
4.4.2. Protect Personal Safety of Bus Passengers The bus stop upgrades mentioned above will have as a major focus the improvement of the personal safety of passengers walking to and from, and waiting at, bus stops. Examples include ensuring stops are accessible from walk routes (making accessibility safer for those with a mobility impairment) and improving sightlines of stops and access routes for passive surveillance.
We are seeking funding from the NBS for upgrades at LCC-owned Preston, Chorley, Nelson and Accrington bus stations. Improvements being sought include upgrades of CCTV, re-modelling public toilets to improve security, improved passenger information and updated inquiry office. We will also seek to make funding available through the BSIP at selected bus stations owned by others.
We will mandate the provision of CCTV on buses to provide enhanced on-board security.
The Passenger Charter we intend to implement will include a clear about ‘get you home’ policy if the last bus journey doesn’t operate (so no passenger is left without a safe way of getting home).
New Safer Travel LCC Officer to coordinate comments/concerns and liaise with appropriate other bodies to action and resolve the issues identified.
4.4.3. Improve Buses for Tourists Next stop audio-visual announcements will help unfamiliar passengers alight at the correct stop, while RTPI upgrades will provide reassurance of when the next bus is arriving. Improved information provision at stops and online will promote bus services for accessing all destinations.
The Eden Project North is aiming to open in 2024 and we will work with the project to develop and implement appropriate bus services and we will help to develop and support other leisure "car free" bus services in Lancashire. We will apply marketing to raise the awareness of buses in tourist areas where awareness of bus services is low – particularly Ribble Valley and Lune Valley.
Figure 4-3 - Blackpool Transport bus on Service 14

Lancashire and Blackburn with Darwen Joint Bus Service Improvement Plan Page 44 of 90
4.4.4. Invest in Decarbonisation In implementing measures to promote and attract patronage growth on buses, this BSIP will contribute to reduced carbon through modal shift to bus.
Our partners are enthusiastic for zero-emission buses. Blackpool Council and Blackpool Transport Services have a ZEBRA bid for 115 buses which would benefit Fylde and Wyre.
We will work with operators in Lancashire to pursue ZEBRA bids, and we are seeking funding through this BSIP to undertake feasibility assessments and engage with the Distribution Network Operators to gain early sight of issues associated with, and costs of, upgrading energy supplies to bus depots. Part of this process will be to assess the suitability of the different available technologies to different types of bus routes in Lancashire and Blackburn with Darwen.
We are also seeking through the BSIP the funding to allow us to fund conversion of bus fleets to ultra-low and zero-emission standards ourselves. We would envisage disbursing these funds through a ‘challenge’ fund administered by ourselves. A number of operators are keen to work with us on developing cleaner vehicles and are already sharing proposals.
New bus stop infrastructure, where relevant, will be low-energy (e.g. LED lights in shelters) to reduce revenue carbon costs.
4.5. Improvements to Passenger Engagement
4.5.1. Passenger Charter We will develop passenger charters in conjunction with operators. This will include commitments around:
• Ensuring that passengers can find out about their journeys in an impartial manner. With the introduction of a multi-operator ticketing scheme, and operators (in effect) retailing tickets that are used on other operators’ services, we will require operators to provide information on each others’ services;
• Ensuring that accurate bus service information will be provided at bus stops;
• Ensuring that buses are clean and conform to an agreed specification for that service;
• Ensuring suitable redress for when things go wrong, including provision of a taxi if the last bus on a route is cancelled; and
• Regular reporting of key bus service performance metrics such as reliability.
Figure 4-4 - LCC love your bus campaign logo
4.5.2. Strengthen Network Identity Lancashire County Council and Blackburn with Darwen Borough Council have always maintained a standard brand across the respective authority areas on our publicity and bus stop infrastructure. As these are recognised locally we are not proposing to change this identity, however to ensure a sense of ownership there will be a need, in some locations, to update and renew some of the stop infrastructure and replace stop names so they are consistent across the area.
4.5.3. Improve Bus Information Ensuring people can find out when, where and how much bus journeys are, is critical. We propose a suite of measures to overcome the opaqueness that arises from a complex operator landscape and the multiplicity of information sources:
1. Ensure operators share more service information on each others’ services on websites and apps. This happens to an extent now in operators’ journey planners and is likely to become more practical as operators begin to retail tickets for travel on each other’s services under multi-operator ticketing schemes;
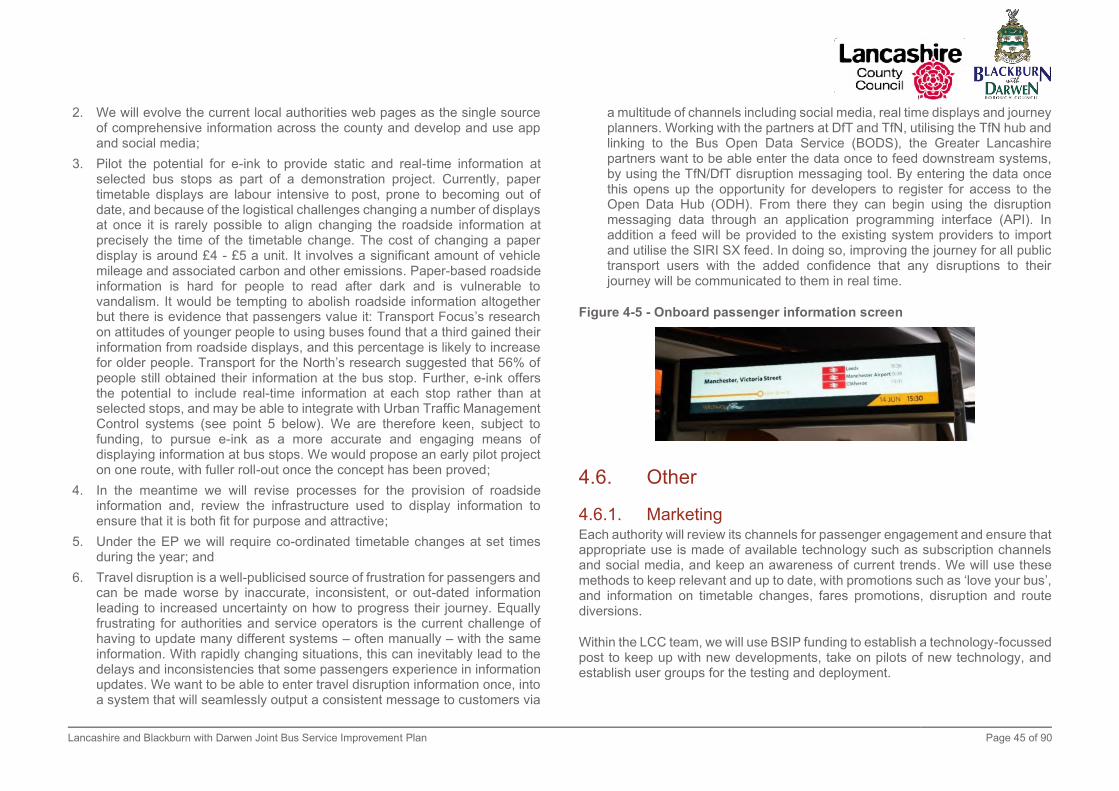
Lancashire and Blackburn with Darwen Joint Bus Service Improvement Plan Page 45 of 90
2. We will evolve the current local authorities web pages as the single source of comprehensive information across the county and develop and use app and social media;
3. Pilot the potential for e-ink to provide static and real-time information at selected bus stops as part of a demonstration project. Currently, paper timetable displays are labour intensive to post, prone to becoming out of date, and because of the logistical challenges changing a number of displays at once it is rarely possible to align changing the roadside information at precisely the time of the timetable change. The cost of changing a paper display is around £4 - £5 a unit. It involves a significant amount of vehicle mileage and associated carbon and other emissions. Paper-based roadside information is hard for people to read after dark and is vulnerable to vandalism. It would be tempting to abolish roadside information altogether but there is evidence that passengers value it: Transport Focus’s research on attitudes of younger people to using buses found that a third gained their information from roadside displays, and this percentage is likely to increase for older people. Transport for the North’s research suggested that 56% of people still obtained their information at the bus stop. Further, e-ink offers the potential to include real-time information at each stop rather than at selected stops, and may be able to integrate with Urban Traffic Management Control systems (see point 5 below). We are therefore keen, subject to funding, to pursue e-ink as a more accurate and engaging means of displaying information at bus stops. We would propose an early pilot project on one route, with fuller roll-out once the concept has been proved;
4. In the meantime we will revise processes for the provision of roadside information and, review the infrastructure used to display information to ensure that it is both fit for purpose and attractive;
5. Under the EP we will require co-ordinated timetable changes at set times during the year; and
6. Travel disruption is a well-publicised source of frustration for passengers and can be made worse by inaccurate, inconsistent, or out-dated information leading to increased uncertainty on how to progress their journey. Equally frustrating for authorities and service operators is the current challenge of having to update many different systems – often manually – with the same information. With rapidly changing situations, this can inevitably lead to the delays and inconsistencies that some passengers experience in information updates. We want to be able to enter travel disruption information once, into a system that will seamlessly output a consistent message to customers via
a multitude of channels including social media, real time displays and journey planners. Working with the partners at DfT and TfN, utilising the TfN hub and linking to the Bus Open Data Service (BODS), the Greater Lancashire partners want to be able enter the data once to feed downstream systems, by using the TfN/DfT disruption messaging tool. By entering the data once this opens up the opportunity for developers to register for access to the Open Data Hub (ODH). From there they can begin using the disruption messaging data through an application programming interface (API). In addition a feed will be provided to the existing system providers to import and utilise the SIRI SX feed. In doing so, improving the journey for all public transport users with the added confidence that any disruptions to their journey will be communicated to them in real time.
Figure 4-5 - Onboard passenger information screen
4.6. Other
4.6.1. Marketing Each authority will review its channels for passenger engagement and ensure that appropriate use is made of available technology such as subscription channels and social media, and keep an awareness of current trends. We will use these methods to keep relevant and up to date, with promotions such as ‘love your bus’, and information on timetable changes, fares promotions, disruption and route diversions.
Within the LCC team, we will use BSIP funding to establish a technology-focussed post to keep up with new developments, take on pilots of new technology, and establish user groups for the testing and deployment.
Lancashire and Blackburn with Darwen Joint Bus Service Improvement Plan Page 46 of 90
Sustained marketing support is also required for "the bus" alongside campaigns to engage with users and potential users in encouraging growth.
It is proposed that the authorities work closely with bus operators marketing teams to develop initiatives and jointly promote the networks and offers being made available, building on their commercial expertise. There is a need for traditional marketing activity along with further development of social media applications and platforms across the area.
There is learning to be had from how successful bus operators have promoted growth and also from other LTAs and MCAs who have traditionally had more resources available to develop initiatives with the end user in mind. We will develop an Information and Marketing Strategy for the Partnership and engage in relevant activity that may form part of the Centre of Excellence, where we would hope to gain further national insight into the development of the local bus market.
4.6.2. Resources In the Bus Service Improvement Plan we have already highlighted a number of additional roles that will be required to deliver on our ambition, and for which we are seeking funding from the National Bus Strategy. As well as these, we will also review the wider functions within the authorities’ public transport teams in order to build expertise and capacity and to maximise the funding opportunities being made available.
This will also include the development of IT solutions, to enable the better use of data for the planning of services and infrastructure. These resources will also be utilised to deliver schemes, develop and run back office solutions and resources for ticketing and information developments, and partnership officers to work with bus and community transport operators, local district councils, businesses and transport planning teams to help raise the profile of and priority for bus services across the county. Finally, significant requirements for monitoring and reporting are associated with implementing the National Bus Strategy.
4.7. Summary Table 4-1 below sets out a summary of how we plan to deliver improved bus services. This follows the structure of the Department for Transport’s summary reporting form shown at Section 6.
Table 4-1 - Summary of our plans to improve bus services
National Bus Strategy Objective
How We Will Deliver This
Review Service Frequency
“More buses, More Often”
• Increased frequencies, including evenings and weekends
• New services
• Superbus Network
Increase Bus Priority Measures
“Getting buses moving”
• 64 bus priority measures identified
• Route reviews
Increase Demand Responsive Services
• Develop innovative solutions for locations that are hard to reach by conventional buses in conjunction with the commercial and community sectors
Consideration of Bus Rapid Transport Networks
• Intensive bus priority enables services with BRT characteristics
• Urban and interurban Superbus network
Integrate Services with Other Transport Modes
• Bus and rail integration
Simplify Services • Consider re-planning routes
• Specific service change dates
Review Socially Necessary Services
• Evening and weekend service increases
• DRT proposals
• Identify opportunities to enhance supported services
Invest in Superbus Networks
• Urban Superbus – at least every 10 minutes
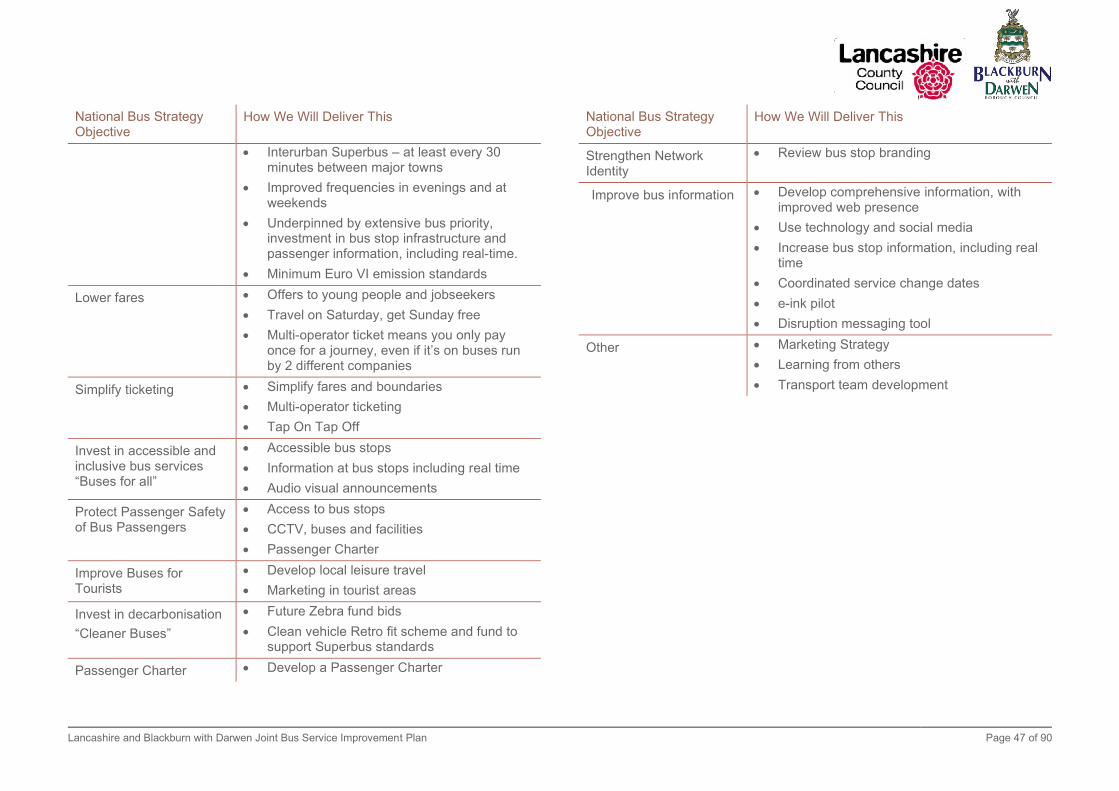
Lancashire and Blackburn with Darwen Joint Bus Service Improvement Plan Page 47 of 90
National Bus Strategy Objective
How We Will Deliver This
• Interurban Superbus – at least every 30 minutes between major towns
• Improved frequencies in evenings and at weekends
• Underpinned by extensive bus priority, investment in bus stop infrastructure and passenger information, including real-time.
• Minimum Euro VI emission standards
Lower fares • Offers to young people and jobseekers
• Travel on Saturday, get Sunday free
• Multi-operator ticket means you only pay once for a journey, even if it’s on buses run by 2 different companies
Simplify ticketing • Simplify fares and boundaries
• Multi-operator ticketing
• Tap On Tap Off
Invest in accessible and inclusive bus services “Buses for all”
• Accessible bus stops
• Information at bus stops including real time
• Audio visual announcements
Protect Passenger Safety of Bus Passengers
• Access to bus stops
• CCTV, buses and facilities
• Passenger Charter
Improve Buses for Tourists
• Develop local leisure travel
• Marketing in tourist areas
Invest in decarbonisation
“Cleaner Buses”
• Future Zebra fund bids
• Clean vehicle Retro fit scheme and fund to support Superbus standards
Passenger Charter • Develop a Passenger Charter
National Bus Strategy Objective
How We Will Deliver This
Strengthen Network Identity
• Review bus stop branding
Improve bus information • Develop comprehensive information, with improved web presence
• Use technology and social media
• Increase bus stop information, including real time
• Coordinated service change dates
• e-ink pilot
• Disruption messaging tool
Other • Marketing Strategy
• Learning from others
• Transport team development

Lancashire and Blackburn with Darwen Joint Bus Service Improvement Plan Page 48 of 90
5. Reporting We propose to publish performance against the four key targets on our website every six months. These will include:
• Bus journey times on a sample of routes, controlled against car journey times so that the context for changes in journey times can be properly understood;
• Reliability on the same sample of routes;
• Patronage as measured by the number of passengers boarding buses in LCC and BwDBC, using figures provided by operators; and
• Bus passenger satisfaction and perceptions, using results of rolling surveys administered by the authorities.
The reporting will also summarise changes made to the bus product such as the implementation of bus lanes, service development and fare changes.
The reporting process will be overseen by the Enhanced Partnership Boards which we will constitute in the coming months. These bodies will be responsible for updating this Bus Service Improvement Plan and will meet on a periodic basis to manage the development of outputs, monitor outcomes against targets and hold delivery partners to account. The frequency of these meetings will be such to ensure that any risks to delivery can be identified and raised in a timely manner to resolve.
Figure 5-1 - Bus stop in Blackburn with Darwen
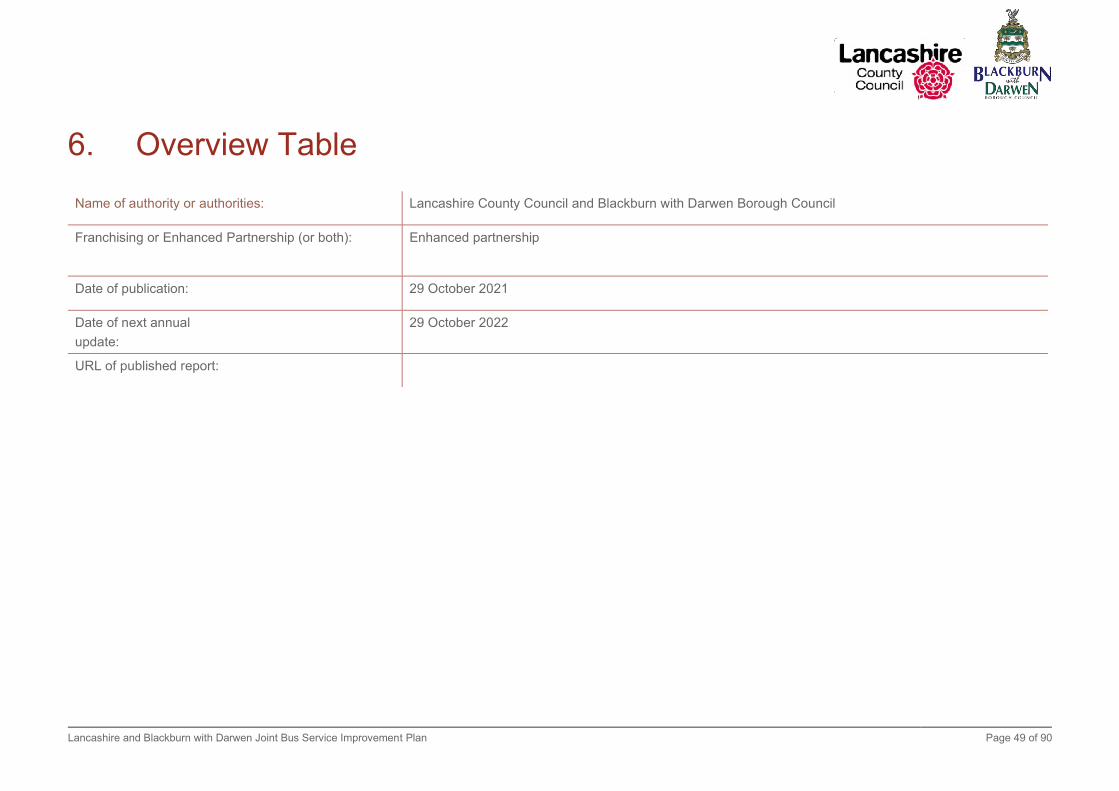
Lancashire and Blackburn with Darwen Joint Bus Service Improvement Plan Page 49 of 90
6. Overview Table
Name of authority or authorities: Lancashire County Council and Blackburn with Darwen Borough Council
Franchising or Enhanced Partnership (or both): Enhanced partnership
Date of publication: 29 October 2021
Date of next annual
update:
29 October 2022
URL of published report:
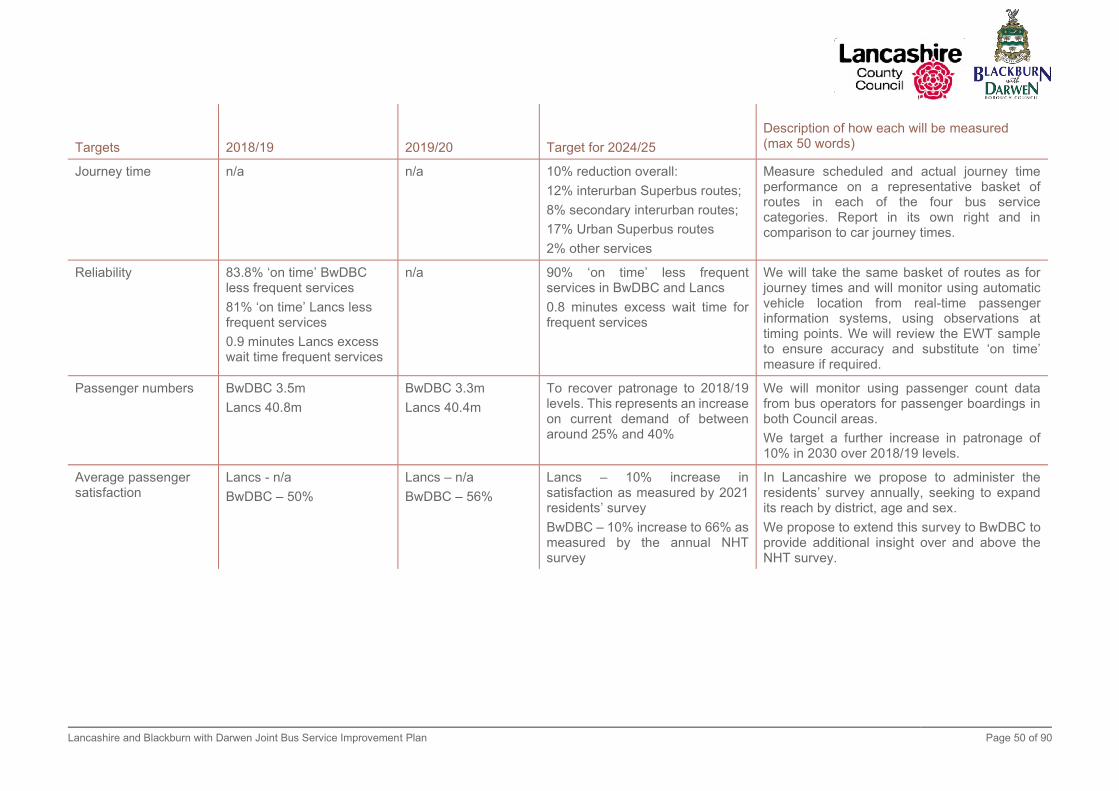
Lancashire and Blackburn with Darwen Joint Bus Service Improvement Plan Page 50 of 90
Targets
2018/19
2019/20
Target for 2024/25
Description of how each will be measured (max 50 words)
Journey time n/a n/a 10% reduction overall:
12% interurban Superbus routes;
8% secondary interurban routes;
17% Urban Superbus routes
2% other services
Measure scheduled and actual journey time performance on a representative basket of routes in each of the four bus service categories. Report in its own right and in comparison to car journey times.
Reliability 83.8% ‘on time’ BwDBC less frequent services
81% ‘on time’ Lancs less frequent services
0.9 minutes Lancs excess wait time frequent services
n/a 90% ‘on time’ less frequent services in BwDBC and Lancs
0.8 minutes excess wait time for frequent services
We will take the same basket of routes as for journey times and will monitor using automatic vehicle location from real-time passenger information systems, using observations at timing points. We will review the EWT sample to ensure accuracy and substitute ‘on time’ measure if required.
Passenger numbers BwDBC 3.5m
Lancs 40.8m
BwDBC 3.3m
Lancs 40.4m
To recover patronage to 2018/19 levels. This represents an increase on current demand of between around 25% and 40%
We will monitor using passenger count data from bus operators for passenger boardings in both Council areas.
We target a further increase in patronage of 10% in 2030 over 2018/19 levels.
Average passenger satisfaction
Lancs - n/a
BwDBC – 50%
Lancs – n/a
BwDBC – 56%
Lancs – 10% increase in satisfaction as measured by 2021 residents’ survey
BwDBC – 10% increase to 66% as measured by the annual NHT survey
In Lancashire we propose to administer the residents’ survey annually, seeking to expand its reach by district, age and sex.
We propose to extend this survey to BwDBC to provide additional insight over and above the NHT survey.
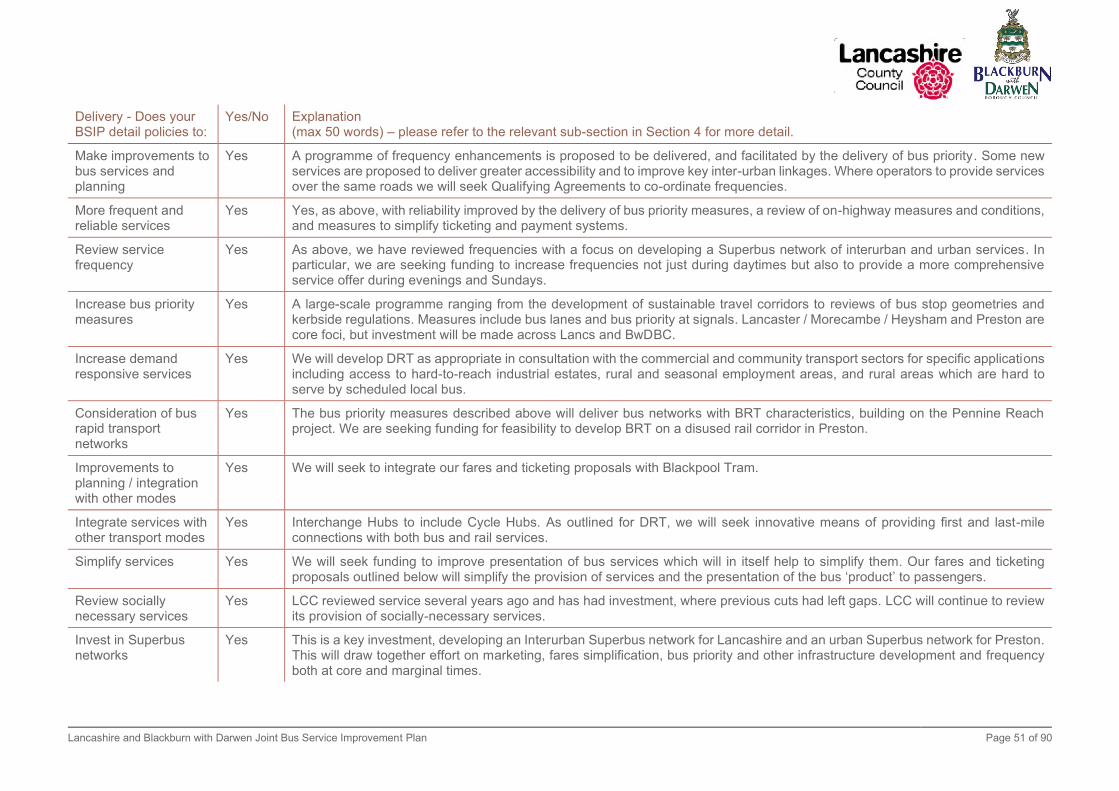
Lancashire and Blackburn with Darwen Joint Bus Service Improvement Plan Page 51 of 90
Delivery - Does your BSIP detail policies to:
Yes/No Explanation (max 50 words) – please refer to the relevant sub-section in Section 4 for more detail.
Make improvements to bus services and planning
Yes A programme of frequency enhancements is proposed to be delivered, and facilitated by the delivery of bus priority. Some new services are proposed to deliver greater accessibility and to improve key inter-urban linkages. Where operators to provide services over the same roads we will seek Qualifying Agreements to co-ordinate frequencies.
More frequent and reliable services
Yes Yes, as above, with reliability improved by the delivery of bus priority measures, a review of on-highway measures and conditions, and measures to simplify ticketing and payment systems.
Review service frequency
Yes As above, we have reviewed frequencies with a focus on developing a Superbus network of interurban and urban services. In particular, we are seeking funding to increase frequencies not just during daytimes but also to provide a more comprehensive service offer during evenings and Sundays.
Increase bus priority measures
Yes A large-scale programme ranging from the development of sustainable travel corridors to reviews of bus stop geometries and kerbside regulations. Measures include bus lanes and bus priority at signals. Lancaster / Morecambe / Heysham and Preston are core foci, but investment will be made across Lancs and BwDBC.
Increase demand responsive services
Yes We will develop DRT as appropriate in consultation with the commercial and community transport sectors for specific applications including access to hard-to-reach industrial estates, rural and seasonal employment areas, and rural areas which are hard to serve by scheduled local bus.
Consideration of bus rapid transport networks
Yes The bus priority measures described above will deliver bus networks with BRT characteristics, building on the Pennine Reach project. We are seeking funding for feasibility to develop BRT on a disused rail corridor in Preston.
Improvements to planning / integration with other modes
Yes We will seek to integrate our fares and ticketing proposals with Blackpool Tram.
Integrate services with other transport modes
Yes Interchange Hubs to include Cycle Hubs. As outlined for DRT, we will seek innovative means of providing first and last-mile connections with both bus and rail services.
Simplify services Yes We will seek funding to improve presentation of bus services which will in itself help to simplify them. Our fares and ticketing proposals outlined below will simplify the provision of services and the presentation of the bus ‘product’ to passengers.
Review socially necessary services
Yes LCC reviewed service several years ago and has had investment, where previous cuts had left gaps. LCC will continue to review its provision of socially-necessary services.
Invest in Superbus networks
Yes This is a key investment, developing an Interurban Superbus network for Lancashire and an urban Superbus network for Preston. This will draw together effort on marketing, fares simplification, bus priority and other infrastructure development and frequency both at core and marginal times.

Lancashire and Blackburn with Darwen Joint Bus Service Improvement Plan Page 52 of 90
Delivery - Does your BSIP detail policies to:
Yes/No Explanation (max 50 words) – please refer to the relevant sub-section in Section 4 for more detail.
Improvements to fares and ticketing
Lower fares Yes We are seeking funding to deliver a consistent fares offer to young people under the age of 19 and to particular groups including adult carers and jobseekers. The delivery of a multi-operator product will reduce fares where people to need make journeys across more than operator.
Simplify fares Yes We will seek to make operators’ fare zones and products consistent with each other. We are seeking funding to introduce tap on and tap off and we are seeking funding to create a multi-operator ticketing product.
Integrate ticketing between operators and transport
Yes We will seek to integrate developing ticketing products with Blackpool Trams.
Make improvements to bus passenger experience
Higher spec buses
Invest in improved bus specifications
Yes We will seek further improvements to bus specifications in Lancashire.
Invest in accessible and inclusive bus services
Yes We are seeking funding to complete the delivery of Audio Visual announcements on bus. We seek funding to undertake a significant programme to upgrade bus stops on Superbus and other routes to deliver Equality Act-compliant bus services, and we seek funding to upgrade interchanges.
Protect personal safety of bus passengers
Yes As part of our review of bus stop accessibility we will review walking routes to and from bus stops, and pursue changes to the environment where these could make bus stops safer. We mandate provision of CCTV on buses and the Passenger Charter will include provisions on guaranteed last services.
Improve buses for tourists
Yes We will work with the Eden Project North to design appropriate bus services for when it opens in 2024. We will apply marketing to raise awareness of bus in tourist areas such as the Ribble Valley.
Invest in decarbonisation
Yes We are seeking funding to administer a Challenge Fund to enable bus operators to bid for funding for reduced and zero-emission buses. We are also seeking funding to assess the feasibility of converting depots and operations to zero-emission.
Improvements to passenger engagement
Passenger charter Yes We will develop a passenger charter – ensuring the passengers can find out about their journeys in an impartial way, and will include redress for when things go wrong, including if the last bus is cancelled.
Strengthen network identity
Yes We will strengthen the authority branding at bus stops and seek with operators opportunities to improve branding of services in specific geographical areas.
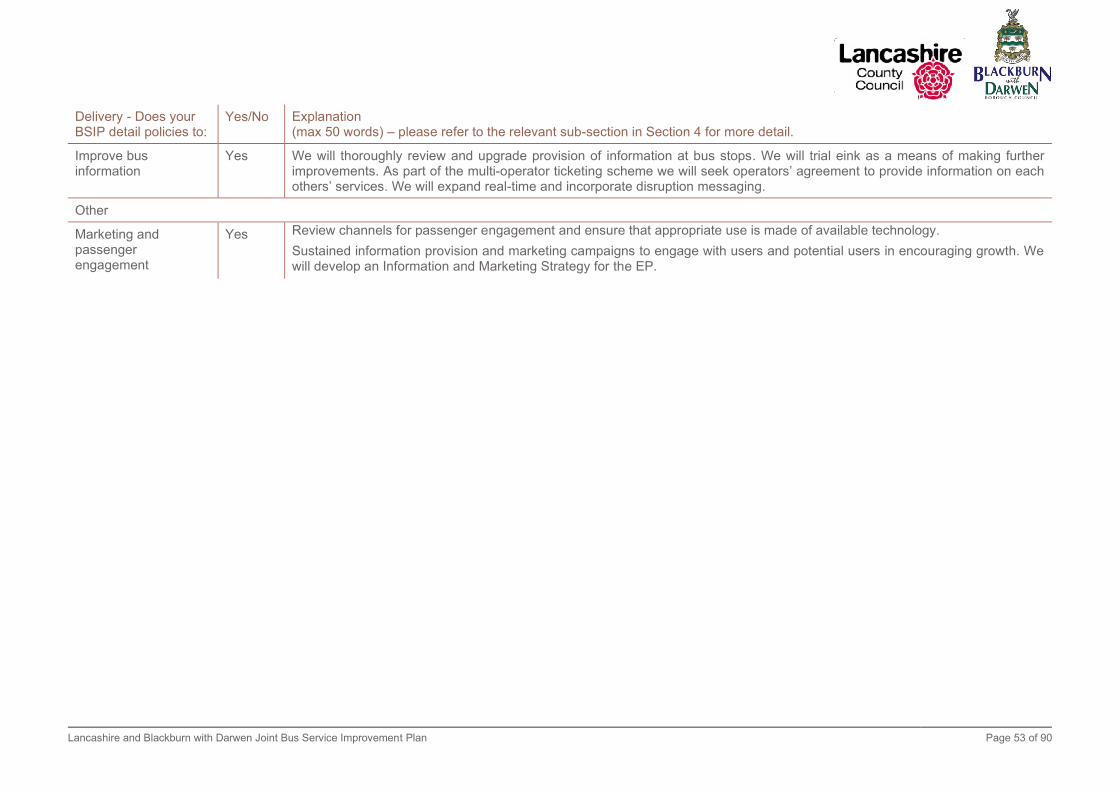
Lancashire and Blackburn with Darwen Joint Bus Service Improvement Plan Page 53 of 90
Delivery - Does your BSIP detail policies to:
Yes/No Explanation (max 50 words) – please refer to the relevant sub-section in Section 4 for more detail.
Improve bus information
Yes We will thoroughly review and upgrade provision of information at bus stops. We will trial eink as a means of making further improvements. As part of the multi-operator ticketing scheme we will seek operators’ agreement to provide information on each others’ services. We will expand real-time and incorporate disruption messaging.
Other
Marketing and passenger engagement
Yes Review channels for passenger engagement and ensure that appropriate use is made of available technology.
Sustained information provision and marketing campaigns to engage with users and potential users in encouraging growth. We will develop an Information and Marketing Strategy for the EP.

Lancashire and Blackburn with Darwen Joint Bus Service Improvement Plan Page 54 of 90
Appendices
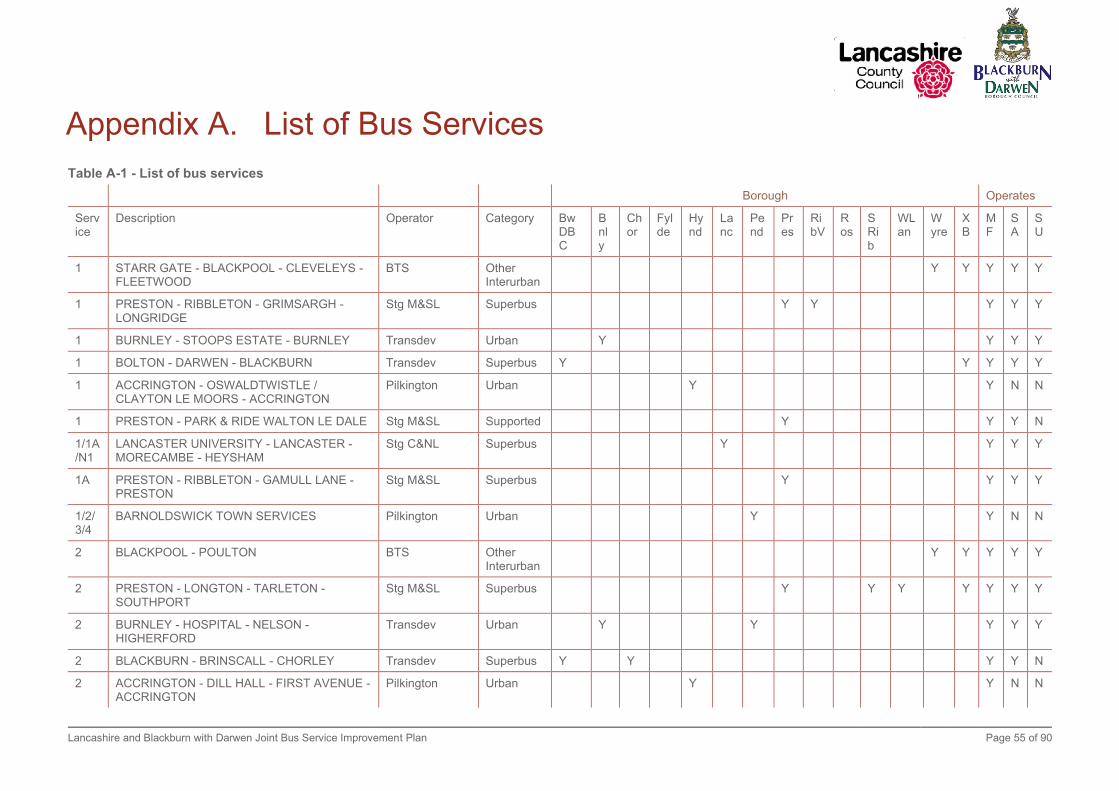
Lancashire and Blackburn with Darwen Joint Bus Service Improvement Plan Page 55 of 90
Appendix A. List of Bus Services
Table A-1 - List of bus services
Borough Operates
Service
Description Operator Category BwDBC
Bnly
Chor
Fylde
Hynd
Lanc
Pend
Pres
RibV
Ros
SRib
WLan
Wyre
XB
MF
SA
SU
1 STARR GATE - BLACKPOOL - CLEVELEYS - FLEETWOOD
BTS Other Interurban
Y Y Y Y Y
1 PRESTON - RIBBLETON - GRIMSARGH - LONGRIDGE
Stg M&SL Superbus
Y Y
Y Y Y
1 BURNLEY - STOOPS ESTATE - BURNLEY Transdev Urban
Y
Y Y Y
1 BOLTON - DARWEN - BLACKBURN Transdev Superbus Y
Y Y Y Y
1 ACCRINGTON - OSWALDTWISTLE / CLAYTON LE MOORS - ACCRINGTON
Pilkington Urban
Y
Y N N
1 PRESTON - PARK & RIDE WALTON LE DALE Stg M&SL Supported
Y
Y Y N
1/1A/N1
LANCASTER UNIVERSITY - LANCASTER - MORECAMBE - HEYSHAM
Stg C&NL Superbus
Y
Y Y Y
1A PRESTON - RIBBLETON - GAMULL LANE - PRESTON
Stg M&SL Superbus
Y
Y Y Y
1/2/3/4
BARNOLDSWICK TOWN SERVICES Pilkington Urban
Y
Y N N
2 BLACKPOOL - POULTON BTS Other Interurban
Y Y Y Y Y
2 PRESTON - LONGTON - TARLETON - SOUTHPORT
Stg M&SL Superbus
Y
Y Y
Y Y Y Y
2 BURNLEY - HOSPITAL - NELSON - HIGHERFORD
Transdev Urban
Y
Y
Y Y Y
2 BLACKBURN - BRINSCALL - CHORLEY Transdev Superbus Y
Y
Y Y N
2 ACCRINGTON - DILL HALL - FIRST AVENUE - ACCRINGTON
Pilkington Urban
Y
Y N N

Lancashire and Blackburn with Darwen Joint Bus Service Improvement Plan Page 56 of 90
Borough Operates
Service
Description Operator Category BwDBC
Bnly
Chor
Fylde
Hynd
Lanc
Pend
Pres
RibV
Ros
SRib
WLan
Wyre
XB
MF
SA
SU
2 CLITHEROE - LOW MOOR - CLITHEROE Holmeswood Supported
Y
Y Y N
2A PRESTON - LONGTON - TARLETON - ORMSKIRK
Stg M&SL Superbus
Y
Y Y
Y Y Y
2A BLACKBURN - BRINSCALL - CHORLEY Stg M&SL Supported Y
Y
Y Y Y
2C BLACKPOOL - POULTON - KNOTT END BTS Other Interurban
Y
Y Y Y Y Y
2X LANCASTER - HEYSHAM - MORECAMBE Stg C&NL Superbus
Y
Y Y Y
3 MERESIDE - BLACKPOOL - CLEVELEYS - CLEVELEYS PARK
BTS Urban
Y Y Y Y Y
3 PRESTON - PENWORTHAM - KINGSFOLD - PENWORTHAM - PRESTON
Stg M&SL Urban Superbus
Y
Y
Y Y Y
3 BURNLEY - PIKE HILL Transdev Urban
Y
Y Y Y
3 Blackburn - Sunnybower Blackburn PH Supported Y
Y N N
3 CLITHEROE - SAWLEY CIRCULAR Pilkington Supported
Y
Y Y N
4 MERESIDE - BLACKPOOL - CLEVELEYS BTS Urban
Y Y Y Y Y
4 BURNLEY - PIKE HILL - WORSTHORNE Transdev Urban
Y
Y Y N
4 BLACKBURN - LEYBURN ROAD - BLACKBURN
Transdev Urban Y
Y Y N
4 ACCRINGTON - MERLIN DRIVE- ACCRINGTON
Pilkington Urban
Y
Y N N
4 CLITHEROE - PEEL PARK CIRCULAR Transdev Supported
Y
Y Y N
4/4X LANCASTER UNIVERSITY - LANCASTER - LANCASTER RAILWAY STATION
Stg C&NL Urban
Y
Y Y Y
4B ACCRINGTON - FERN GORE - MERLIN DRIVE- ACCRINGTON
Pilkington Urban
Y
Y N N
5 CARNFORTH - MORECAMBE - HEYSHAM - OVERTON
Stg C&NL Superbus
Y
Y Y Y

Lancashire and Blackburn with Darwen Joint Bus Service Improvement Plan Page 57 of 90
Borough Operates
Service
Description Operator Category BwDBC
Bnly
Chor
Fylde
Hynd
Lanc
Pend
Pres
RibV
Ros
SRib
WLan
Wyre
XB
MF
SA
SU
5 ROSEGROVE - BURNLEY - HARLE SYKE Transdev Urban
Y
Y Y Y
5 CLITHEROE - WHALLEY - RIBCHESTER - LONGRIDGE - CHIPPING
Pilkington Supported
Y
Y Y Y
5 ACCRINGTON - MILNSHAW - CHURCH - ACCRINGTON
Pilkington Urban
Y
Y N N
5 ORMSKIRK - TOWN GREEN CIRCULAR Charlton Supported
Y
Y Y N
5A CLITHEROE - RIBCHESTER - LONGRIDGE - CHIPPING
Pilkington Supported
Y
Y Y N
6 PRESTON - BROOKFIELD - GAMULL - REDSCAR - PRESTON
Preston Bus Urban Superbus
Y
Y Y Y
6 BURNLEY - HOSPITAL - NELSON - MARSDEN PARK - COLNE
Transdev Supported
Y
Y
Y Y N
6 ORMSKIRK - SCOTT ESTATE CIRCULAR Charlton Supported
Y
Y Y N
6/6A LANCASTER - WESTGATE - MORECAMBE Stg C&NL Urban
Y
Y Y Y
6/A/7/A
BLACKBURN - ACCRINGTON - OSWALDTWISTLE - BLACKBURN
Transdev Superbus Y
Y
Y Y Y
6S NELSON - MARSDEN PARK - COLNE Transdev Supported
Y
N N Y
7 ST ANNES - BLACKPOOL - CLEVELEYS BTS Other Interurban
Y
Y Y Y Y Y
7 LANCASTER - VALE - LANCASTER Stg C&NL Urban
Y
Y Y Y
7 TODMORDEN - BACUP - NEWCHURCH - RAWTENSTALL
Transdev Supported
Y
Y Y Y N
8 PRESTON - MOOR NOOK - PRESTON Preston Bus Urban Superbus
Y
Y Y Y
8 BURNLEY - BACUP - BURNLEY Transdev Supported
Y
Y
Y Y N
8 ACCRINGTON - SPRINGHILL - CHURCH - ACCRINGTON
Pilkington Urban
Y
Y N N

Lancashire and Blackburn with Darwen Joint Bus Service Improvement Plan Page 58 of 90
Borough Operates
Service
Description Operator Category BwDBC
Bnly
Chor
Fylde
Hynd
Lanc
Pend
Pres
RibV
Ros
SRib
WLan
Wyre
XB
MF
SA
SU
8 CITY CENTRE - RYELANDS - ST CHADS Kirkby Lonsdale Urban
Y
Y Y N
8A CHORLEY - ADLINGTON - BLACKROD Stg M&SL Other Interurban
Y
Y Y Y N
9 BLACKPOOL - CLEVELEYS BTS Urban Superbus
Y Y Y Y Y
9 PRESTON - MOOR NOOK - PRESTON Stg M&SL Urban
Y
Y Y Y
9 BURNLEY - ACCRINGTON Transdev Superbus
Y
Y
Y N N
9 ACCRINGTON - BARNFIELD - LANESIDE - ACCRINGTON
Pilkington Urban
Y
Y N N
9 CITY CENTRE - PRIMROSE - BOWERHAM - NEWLANDS
Kirkby Lonsdale Urban
Y
Y Y N
9A ACCRINGTON - BARNFIELD - LANESIDE - FIRST AVENUE
Pilkington Urban
Y
Y N N
10 LANCASTER - RIDGE - LANCASTER Stg C&NL Urban / Supported
Y
Y Y Y
10 RAWTENSTALL - EDGESIDE Transdev Supported
Y
Y Y N
10 BLACKBURN - LAMMACK - BLACKBURN Blackburn PH Urban Y
Y N N
11 BLACKPOOL - ST. ANNES - LYTHAM BTS Superbus
Y
Y Y Y Y
11 LANCASTER - MARSH - LANCASTER Stg C&NL Urban / Supported
Y
Y Y Y
11 ACCRINGTON - FERN GORE - ACCRINGTON Pilkington Urban
Y
Y N N
11 HASLINGDEN - HELMSHORE - RAWTENSTALL
Transdev Supported
Y
Y Y N
12 PRESTON - NEW LONGTON - LONGTON Preston Bus Other Interurban
Y
Y
Y Y N
12 RAWTENSTALL - BALLADEN CIRCULAR - RAWTENSTALL
Transdev Supported
Y
Y Y N
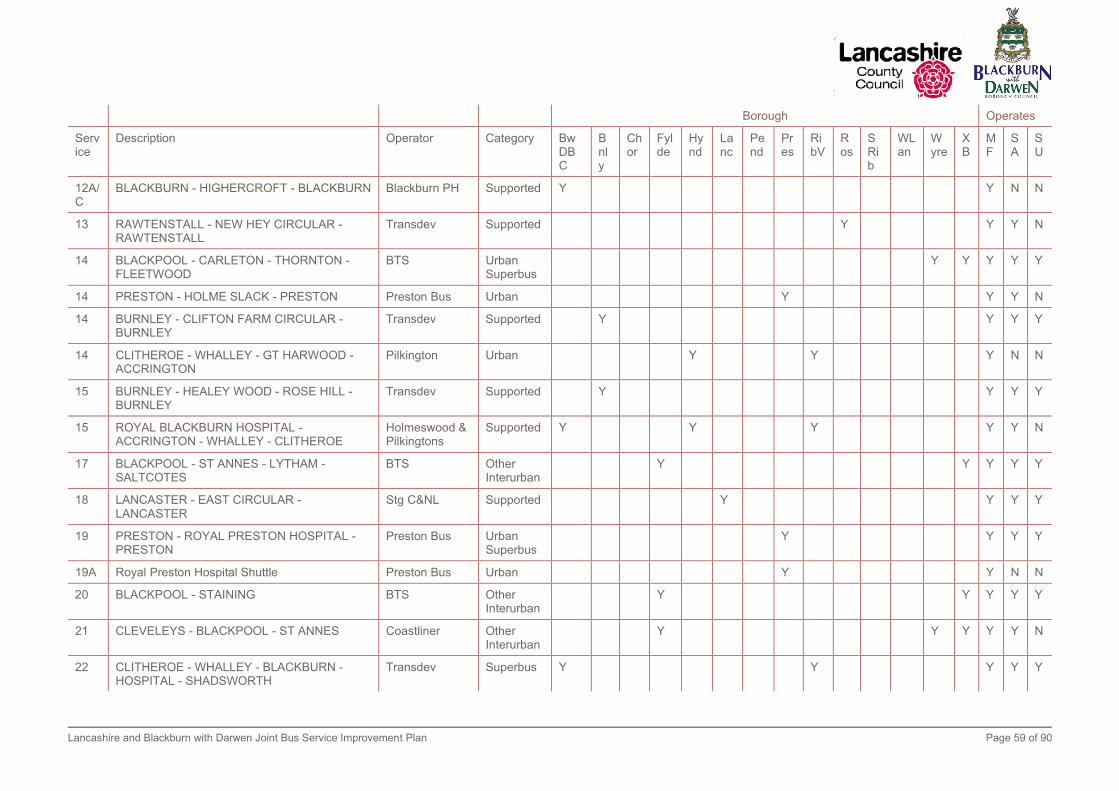
Lancashire and Blackburn with Darwen Joint Bus Service Improvement Plan Page 59 of 90
Borough Operates
Service
Description Operator Category BwDBC
Bnly
Chor
Fylde
Hynd
Lanc
Pend
Pres
RibV
Ros
SRib
WLan
Wyre
XB
MF
SA
SU
12A/C
BLACKBURN - HIGHERCROFT - BLACKBURN Blackburn PH Supported Y
Y N N
13 RAWTENSTALL - NEW HEY CIRCULAR - RAWTENSTALL
Transdev Supported
Y
Y Y N
14 BLACKPOOL - CARLETON - THORNTON - FLEETWOOD
BTS Urban Superbus
Y Y Y Y Y
14 PRESTON - HOLME SLACK - PRESTON Preston Bus Urban
Y
Y Y N
14 BURNLEY - CLIFTON FARM CIRCULAR - BURNLEY
Transdev Supported
Y
Y Y Y
14 CLITHEROE - WHALLEY - GT HARWOOD - ACCRINGTON
Pilkington Urban
Y
Y
Y N N
15 BURNLEY - HEALEY WOOD - ROSE HILL - BURNLEY
Transdev Supported
Y
Y Y Y
15 ROYAL BLACKBURN HOSPITAL - ACCRINGTON - WHALLEY - CLITHEROE
Holmeswood & Pilkingtons
Supported Y
Y
Y
Y Y N
17 BLACKPOOL - ST ANNES - LYTHAM - SALTCOTES
BTS Other Interurban
Y
Y Y Y Y
18 LANCASTER - EAST CIRCULAR - LANCASTER
Stg C&NL Supported
Y
Y Y Y
19 PRESTON - ROYAL PRESTON HOSPITAL - PRESTON
Preston Bus Urban Superbus
Y
Y Y Y
19A Royal Preston Hospital Shuttle Preston Bus Urban
Y
Y N N
20 BLACKPOOL - STAINING BTS Other Interurban
Y
Y Y Y Y
21 CLEVELEYS - BLACKPOOL - ST ANNES Coastliner Other Interurban
Y
Y Y Y Y N
22 CLITHEROE - WHALLEY - BLACKBURN - HOSPITAL - SHADSWORTH
Transdev Superbus Y
Y
Y Y Y

Lancashire and Blackburn with Darwen Joint Bus Service Improvement Plan Page 60 of 90
Borough Operates
Service
Description Operator Category BwDBC
Bnly
Chor
Fylde
Hynd
Lanc
Pend
Pres
RibV
Ros
SRib
WLan
Wyre
XB
MF
SA
SU
23 PRESTON - ROYAL PRESTON HOSPITAL - ASDA - PRESTON
Preston Bus Urban Superbus
Y
Y Y Y
24 POULTON - THORNTON - CLEVELEYS - FLEETWOOD
Coastliner Other Interurban
Y Y Y Y Y
25 BLACKBURN - MELLOR - WHALLEY - CLITHEROE
Pilkington Supported Y
Y
Y Y N
25A BLACKBURN - LAMMACK - MELLOR BROOK Pilkington & Preston Bus
Urban Y
Y
Y Y Y
31 PRESTON - SAVICK - LEA - SAVICK - PRESTON
Preston Bus Urban Superbus
Y
Y Y Y
33 Blackburn - Royal Blackburn Teaching Hospital - Darwen
Moving People Supported Y
Y N N
33 MORECAMBE - BARE CIRCULAR - MORECAMBE
Stg C&NL Supported
Y
Y Y N
35 PRESTON - TANTERTON - PRESTON Preston Bus Urban Superbus
Y
Y Y Y
40/A/41
PRESTON - GARSTANG - LANCASTER - MORECAMBE
Stg C&NL Superbus
Y
Y
Y Y Y Y
42 LANCASTER - GARSTANG - POULTON - BLACKPOOL
Stg C&NL Superbus
Y
Y
Y Y Y Y Y
43 PRESTON - COTTAM - FULWOOD - RPH Preston Bus Supported
Y
Y Y Y
44 PRESTON - COTTAM - PRESTON Preston Bus Supported
Y
Y Y Y
45 PRESTON - BROUGHTON - LONGRIDGE - RIBCHESTER - BLACKBURN
Preston Bus Supported Y
Y Y
Y Y Y
46 PRESTON - BROUGHTON - LONGRIDGE Preston Bus Supported
Y Y
Y Y N
49 LANCASTER - HALTON - CARNFORTH - WARTON
Stg C&NL Other Interurban
Y
Y Y N

Lancashire and Blackburn with Darwen Joint Bus Service Improvement Plan Page 61 of 90
Borough Operates
Service
Description Operator Category BwDBC
Bnly
Chor
Fylde
Hynd
Lanc
Pend
Pres
RibV
Ros
SRib
WLan
Wyre
XB
MF
SA
SU
49 ROYAL PRESTON HOSPITAL - FULWOOD - PRESTON
Preston Bus Supported
Y
Y Y N
51 CARNFORTH - WARTON - SILVERDALE Stg C&NL Supported
Y
Y Y N
55 LANCASTER - CARNFORTH Stg C&NL Superbus
Y
Y Y Y
59 PRESTON - BLACKBURN - ROYAL BLACKBURN HOSPITAL
Stg M&SL Superbus Y
Y Y
Y
Y Y Y
59C RISHTON - ACCRINGTON - BLACKBURN - PRESTON - PRESTON COLLEGE
Stg M&SL Superbus Y
Y Y
Y
Y N N
61 PRESTON - ASHTON - KIRKHAM - WREA GREEN - BLACKPOOL
Stg M&SL Superbus
Y
Y
Y Y Y Y
61C WREA GREEN - KIRKHAM - ASHTON - PRESTON COLLEGE
Stg M&SL Superbus
Y
Y
Y Y N N
64 CLITHEROE - SABDEN - PADIHAM - ROSEGROVE - BURNLEY
Transdev Supported
Y
Y
Y Y Y
65 BURNLEY - PADIHAM - FENCE - NELSON Transdev Supported
Y
Y
Y Y N
66 NELSON - BARROWFORD - FENCE - BARLEY - CHATBURN - CLITHEROE
Transdev Supported
Y
Y
Y Y N
66S CLITHEROE - CHATBURN - BARLEY - FENCE - NELSON
Transdev Supported
Y
Y
N N Y
67 NELSON - BARROWFORD - BLACKO - BARLEY - CHATBURN - CLITHEROE
Transdev Supported
Y
Y
Y Y N
68 BLACKPOOL - ST. ANNES - LYTHAM - PRESTON
Stg M&SL Superbus
Y
Y
Y Y Y Y
68 NELSON - BARROWFORD - COLNE Transdev Supported
Y
Y Y N
68C BLACKPOOL - ST. ANNES - LYTHAM - PRESTON COLLEGE
Stg M&SL Superbus
Y
Y
Y Y N N
69 HOSPITAL - BRIERFIELD - NELSON Transdev Supported
Y
Y
Y Y N

Lancashire and Blackburn with Darwen Joint Bus Service Improvement Plan Page 62 of 90
Borough Operates
Service
Description Operator Category BwDBC
Bnly
Chor
Fylde
Hynd
Lanc
Pend
Pres
RibV
Ros
SRib
WLan
Wyre
XB
MF
SA
SU
74 PRESTON - LEA - GREAT ECCLESTON - POULTON - FLEETWOOD
BTS Supported
Y
Y
Y Y Y Y
75 PRESTON - KIRKHAM - POULTON - CLEVELEYS - FLEETWOOD
BTS Supported
Y
Y
Y Y Y Y
76 ST.ANNES - LYTHAM - KIRKHAM - POULTON - BLACKPOOL
Coastal Coaches
Supported
Y
Y Y Y Y N
78 ST.ANNES - LYTHAM - KIRKHAM - GREAT ECCLESTON
Coastal Coaches
Urban / Supported
Y
Y Y Y N
80 LANCASTER - HORNBY - INGLETON Stg C&NL Other Interurban
Y
Y Y Y N
81/G LANCASTER - HORNBY - KIRKBY LONSDALE - INGLETON
Stg C&NL Other Interurban
Y
Y Y Y N
81A/B
LANCASTER - HORNBY - KIRKBY LONSDALE Kirkby Lonsdale Supported
Y
Y N N Y
88 LARCHES - ROYAL PRESTON HOSPITAL Preston Bus Urban
Y
Y Y N
89 LANCASTER - PILLING - KNOTT END Kirkby Lonsdale Supported
Y
Y Y Y N
100 FARRINGDON PARK - PRESTON - LARCHES Preston Bus Urban Superbus
Y
Y Y Y
100 LANCASTER UNIVERSITY - LANCASTER - BARE - MORECAMBE
Stg C&NL Superbus
Y
Y Y Y
109 PRESTON - LEYLAND - BUCKSHAW - CHORLEY
Stg M&SL Superbus
Y
Y
Y
Y Y Y
111 PRESTON - LEYLAND - MOSS SIDE - WIGAN Stg M&SL Superbus
Y
Y
Y
Y Y Y Y
112 PRESTON - BAMBER BRIDGE - CLAYTON BROOK - LEYLAND - CROSTON
Holmeswood Supported
Y
Y
Y
Y Y N
114 LEYLAND - CLAYTON BROOK - CHORLEY Holmeswood Supported
Y
Y
Y Y N
117 CHORLEY - WELD BANK - CHORLEY Tyrers Supported
Y
Y Y N
118 CHORLEY - LOWER BURGH Tyrers Supported
Y
Y Y N

Lancashire and Blackburn with Darwen Joint Bus Service Improvement Plan Page 63 of 90
Borough Operates
Service
Description Operator Category BwDBC
Bnly
Chor
Fylde
Hynd
Lanc
Pend
Pres
RibV
Ros
SRib
WLan
Wyre
XB
MF
SA
SU
118 CHORLEY - COLLINGWOOD ROAD - CHORLEY
Stg M&SL Supported
Y
Y Y N
119 CHORLEY - ASTLEY VILLAGE - CHORLEY Stg M&SL Supported
Y
Y Y Y
119 PRESTON - PENWORTHAM - LEYLAND - BUCKSHAW VILLAGE - CHORLEY
Tyrers Supported
Y
Y
Y
Y Y N
125 RPH - PRESTON - BAMBER BRIDGE - CHORLEY - HORWICH - BOLTON
Stg M&SL Superbus
Y
Y
Y
Y Y Y Y
125C
CHARNOCK RICHARD - PRESTON - PRESTON COL - MYERSCOUGH COL
Stg M&SL Superbus
Y
Y
Y
Y Y N N
152 PRESTON - BLACKBURN - PADIHAM - BURNLEY
Transdev Superbus Y Y Y
Y
Y
Y
Y Y Y
152 ORMSKIRK - RAINFORD - ST HELENS Huyton Travel Supported
Y
Y Y Y N
153 PRESTON - BAMBER BRIDGE - LEYLAND Transdev Supported
Y
Y
Y Y Y
273 RAWTENSTALL - BOLTON Transdev Other Interurban
Y
Y Y Y N
280 PRESTON - CLITHEROE - BARNOLDSWICK - SKIPTON
Stg M&SL Superbus
Y Y Y
Y
Y Y Y Y
300 SOUTHPORT - HALSALL - LIVERPOOL Arriva Superbus
Y
Y Y Y Y
310 SKELMERSDALE - ORMSKIRK - LIVERPOOL Arriva Superbus
Y
Y Y Y Y
312 SKELMERSDALE - APPLEY BRIDGE - WRIGHTINGTON
Preston Bus Supported
Y
Y Y N
313 SKELMERSDALE - ASHURST - PARBOLD - BURSCOUGH
Preston Bus Supported
Y
Y Y N
315 ORMSKIRK - HASKAYNE - HALSALL - SOUTHPORT
Stg M&SL Supported
Y
Y Y N N
337 ORMSKIRK - BURSCOUGH - CROSTON - ECCLESTON - CHORLEY
Holmeswood Supported
Y
Y
Y Y N
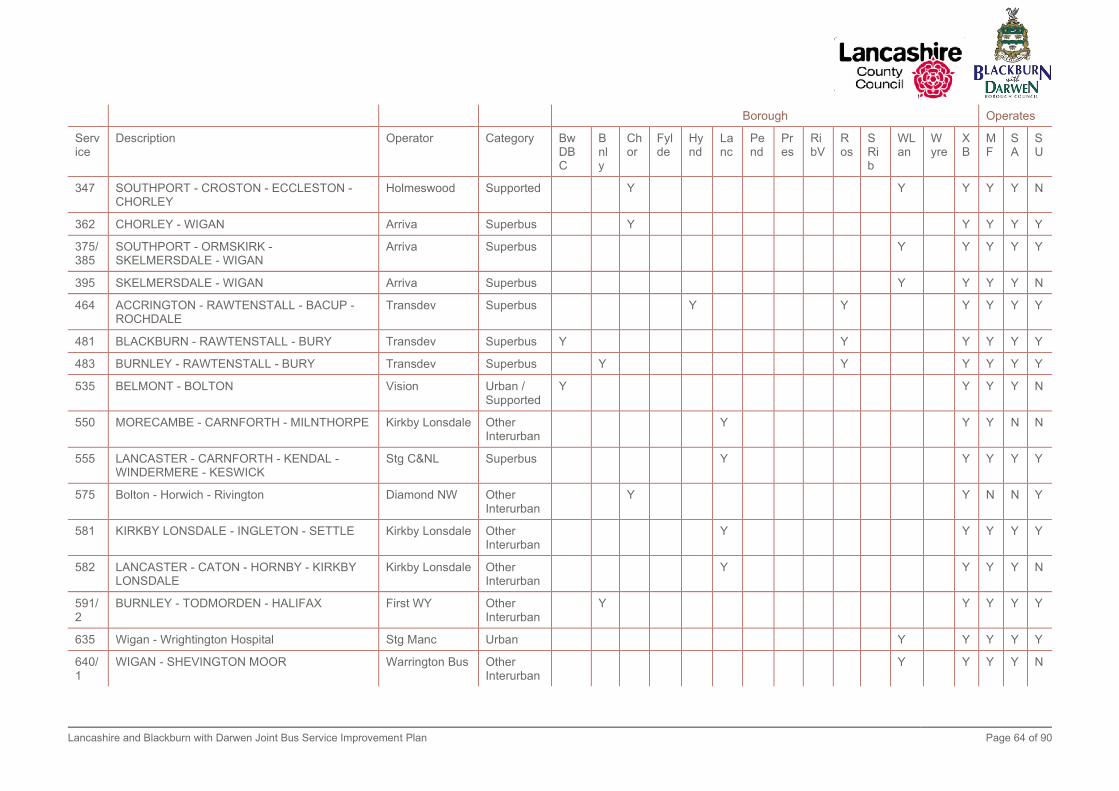
Lancashire and Blackburn with Darwen Joint Bus Service Improvement Plan Page 64 of 90
Borough Operates
Service
Description Operator Category BwDBC
Bnly
Chor
Fylde
Hynd
Lanc
Pend
Pres
RibV
Ros
SRib
WLan
Wyre
XB
MF
SA
SU
347 SOUTHPORT - CROSTON - ECCLESTON - CHORLEY
Holmeswood Supported
Y
Y
Y Y Y N
362 CHORLEY - WIGAN Arriva Superbus
Y
Y Y Y Y
375/385
SOUTHPORT - ORMSKIRK - SKELMERSDALE - WIGAN
Arriva Superbus
Y
Y Y Y Y
395 SKELMERSDALE - WIGAN Arriva Superbus
Y
Y Y Y N
464 ACCRINGTON - RAWTENSTALL - BACUP - ROCHDALE
Transdev Superbus
Y
Y
Y Y Y Y
481 BLACKBURN - RAWTENSTALL - BURY Transdev Superbus Y
Y
Y Y Y Y
483 BURNLEY - RAWTENSTALL - BURY Transdev Superbus
Y
Y
Y Y Y Y
535 BELMONT - BOLTON Vision Urban / Supported
Y
Y Y Y N
550 MORECAMBE - CARNFORTH - MILNTHORPE Kirkby Lonsdale Other Interurban
Y
Y Y N N
555 LANCASTER - CARNFORTH - KENDAL - WINDERMERE - KESWICK
Stg C&NL Superbus
Y
Y Y Y Y
575 Bolton - Horwich - Rivington Diamond NW Other Interurban
Y
Y N N Y
581 KIRKBY LONSDALE - INGLETON - SETTLE Kirkby Lonsdale Other Interurban
Y
Y Y Y Y
582 LANCASTER - CATON - HORNBY - KIRKBY LONSDALE
Kirkby Lonsdale Other Interurban
Y
Y Y Y N
591/2
BURNLEY - TODMORDEN - HALIFAX First WY Other Interurban
Y
Y Y Y Y
635 Wigan - Wrightington Hospital Stg Manc Urban
Y
Y Y Y Y
640/1
WIGAN - SHEVINGTON MOOR Warrington Bus Other Interurban
Y
Y Y Y N
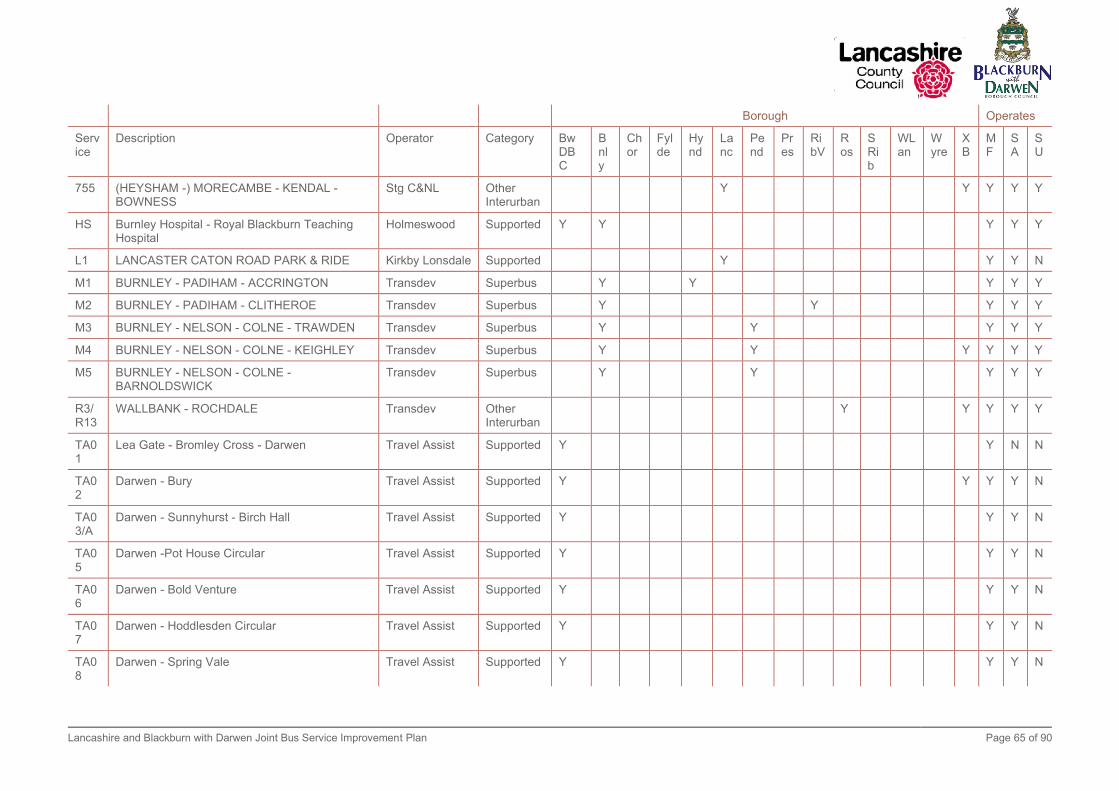
Lancashire and Blackburn with Darwen Joint Bus Service Improvement Plan Page 65 of 90
Borough Operates
Service
Description Operator Category BwDBC
Bnly
Chor
Fylde
Hynd
Lanc
Pend
Pres
RibV
Ros
SRib
WLan
Wyre
XB
MF
SA
SU
755 (HEYSHAM -) MORECAMBE - KENDAL - BOWNESS
Stg C&NL Other Interurban
Y
Y Y Y Y
HS Burnley Hospital - Royal Blackburn Teaching Hospital
Holmeswood Supported Y Y
Y Y Y
L1 LANCASTER CATON ROAD PARK & RIDE Kirkby Lonsdale Supported
Y
Y Y N
M1 BURNLEY - PADIHAM - ACCRINGTON Transdev Superbus
Y
Y
Y Y Y
M2 BURNLEY - PADIHAM - CLITHEROE Transdev Superbus
Y
Y
Y Y Y
M3 BURNLEY - NELSON - COLNE - TRAWDEN Transdev Superbus
Y
Y
Y Y Y
M4 BURNLEY - NELSON - COLNE - KEIGHLEY Transdev Superbus
Y
Y
Y Y Y Y
M5 BURNLEY - NELSON - COLNE - BARNOLDSWICK
Transdev Superbus
Y
Y
Y Y Y
R3/R13
WALLBANK - ROCHDALE Transdev Other Interurban
Y
Y Y Y Y
TA01
Lea Gate - Bromley Cross - Darwen Travel Assist Supported Y
Y N N
TA02
Darwen - Bury Travel Assist Supported Y
Y Y Y N
TA03/A
Darwen - Sunnyhurst - Birch Hall Travel Assist Supported Y
Y Y N
TA05
Darwen -Pot House Circular Travel Assist Supported Y
Y Y N
TA06
Darwen - Bold Venture Travel Assist Supported Y
Y Y N
TA07
Darwen - Hoddlesden Circular Travel Assist Supported Y
Y Y N
TA08
Darwen - Spring Vale Travel Assist Supported Y
Y Y N
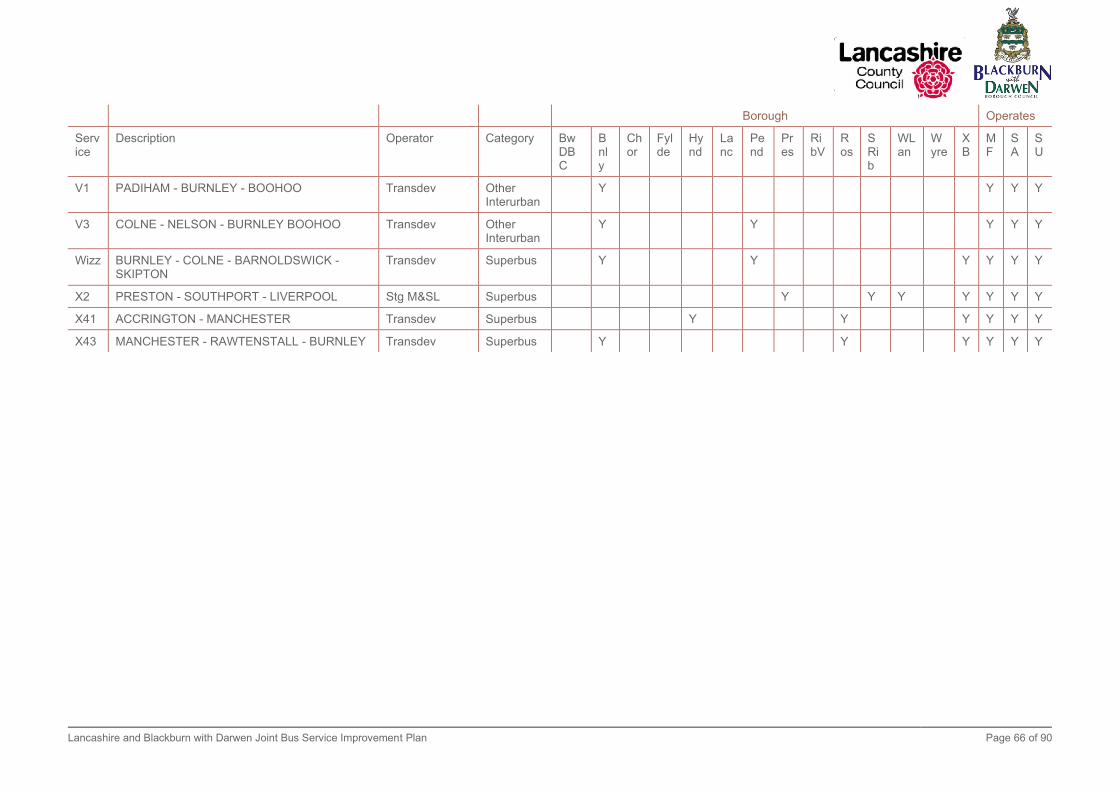
Lancashire and Blackburn with Darwen Joint Bus Service Improvement Plan Page 66 of 90
Borough Operates
Service
Description Operator Category BwDBC
Bnly
Chor
Fylde
Hynd
Lanc
Pend
Pres
RibV
Ros
SRib
WLan
Wyre
XB
MF
SA
SU
V1 PADIHAM - BURNLEY - BOOHOO Transdev Other Interurban
Y
Y Y Y
V3 COLNE - NELSON - BURNLEY BOOHOO Transdev Other Interurban
Y
Y
Y Y Y
Wizz BURNLEY - COLNE - BARNOLDSWICK - SKIPTON
Transdev Superbus
Y
Y
Y Y Y Y
X2 PRESTON - SOUTHPORT - LIVERPOOL Stg M&SL Superbus
Y
Y Y
Y Y Y Y
X41 ACCRINGTON - MANCHESTER Transdev Superbus
Y
Y
Y Y Y Y
X43 MANCHESTER - RAWTENSTALL - BURNLEY Transdev Superbus
Y
Y
Y Y Y Y

Lancashire and Blackburn with Darwen Joint Bus Service Improvement Plan
Appendix B. Proposed Bus Priority Interventions
Table B-1 - Identified Major Schemes (High Cost and High Benefit for buses)
TAS Code
Scheme Districts
M1 Skerton Bridge Sustainable Transport Corridor Lancaster
M2 Grimsargh Bridge Preston
M3 Church Street junction with Ringway and Ribbleton Lane Preston
M4 Queen Street junction with Ringway and New Hall Lane/ Stanley Street Preston
M5 Meadow Street junction with North Road Preston
M6 London Road (Red route) and roundabout junctions at Chorley Road/ Church Brow
Preston, South Ribble
Table B-2 - Countywide schemes for definite inclusion in BSIP
TAS Code Scheme Districts
C1 County Wide – Traffic light priority system as per TCF proposals. Strategy County wide
C2 County Wide Real Time information possibly driven by BODS County wide
Table B-3 - Schemes identified as being a high priority for delivery and for inclusion in BSIP
TAS Code Scheme Districts
H1 Ribbleton Lane bus priority Preston
H2 Bus Lanes on New Hall Lane Preston
H3 Water Lane/ Fylde Road/ Aqueduct street junction - bus lanes Preston
H4 Feasibility studies for old train lines as BRT into Preston Preston
H5 Colne Town Centre Pendle
Table B-4 - Specific schemes identified on Superbus routes for inclusion in BSIP
TAS Code Scheme Districts
SB1 Enhancements to HIF proposals to further improve bus priority in south Lancaster (Bowerham, Ashford Rd etc)
Lancaster
SB2 Lancaster to Morecambe - priority proposals identified in BRT feasibility study Lancaster
SB3 Garstang to Preston Corridor - district levelling up proposal round 2 (Jan to Feb 2022) but connects in with LCC Superbus route
Wyre Preston
SB4 Liverpool Road/ Leyland Road/ Strand road junctions Preston
SB5 Pedders Lane/ Blackpool Road junction - left turn (raised by bus operator) Preston

Lancashire and Blackburn with Darwen Joint Bus Service Improvement Plan
TAS Code Scheme Districts
SB6 Bus Lanes on Blackpool Road between Lane Ends and Pedders Lane (raised by Bus operator)
Preston
SB7 Tulketh Brow between Roebuck Street and Lane Ends (outbound). Parking causing congestion
Preston
SB8 Burnley, Yorkshire Street Burnley
SB9 Nelson, Broadway/Sagar Street (potentially part of Town Funds proposal Pendle
SB10 Rawtenstall Gyratory - part of district levelling up Round 2 (Jan to Feb 2022) Rossendale
SB11 Alterations to Bus Lane opposite Hardman Way, Darwen BwDBC
SB12 Mincing Lane / Darwen Street / Jubilee Street / Mill Lane BwDBC
SB13 Bolton Road / Jack Walker Way South BwDBC
SB14 Bolton Road / Jack Walker Way North BwDBC
SB15 Bolton Road / Aqueduct Road BwDBC
SB16 Towns Moor Gyratory BwDBC
SB17 Sappi Link Road BwDBC
SB18 Town Centre Improvements BwDBC
SB19 St. Paul's / Montague Street BwDBC
SB20 Red Lion Roundabout Burnley Road Bus Lane (priority) BwDBC
SB21 Accrington Road / Audley Range BwDBC
SB22 M65 Junction 6 Park & Ride BwDBC
SB24 Whalley New Road / Whalley Old Road / Brookhouse Lane BwDBC
SB25 Larkhill / Barbara Castle Way BwDBC
SB26 Extend service into Shadsworth Business Park and Loop back via Roman Road
BwDBC
SB27 Haslingden Road / Grimshaw Park BwDBC
SB28 Shadsworth Estate Improvements BwDBC
SB29 Preston New Road / Yew Tree Drive BwDBC
SB30 Oakenhurst Road Bus Gate between Stoneyhurst Rd and Montague St BwDBC
SB31 Lions Drive to School Lane Link Road BwDBC
SB32 Shadsworth Road / Old Bank Lane junction BwDBC
SB33 King Street / Montague Street BwDBC
SB34 Darwen Town Centre Works BwDBC

Lancashire and Blackburn with Darwen Joint Bus Service Improvement Plan
Table B-5 - Specific schemes identified on Support, urban and rural routes for inclusion in BSIP
TAS Code Scheme Districts
UR1 Carnforth, Market St/A6 jnct Lancaster
UR2 Slyne Road to city in am peak Lancaster
UR3 Improvements on Caton Road and at J34 park and ride Lancaster
UR4 Blackbull Lane, Plungington Preston
UR5 Plungington Centre Preston
UR6 Portway on approach to Strand Road queueing back to docks Preston
UR7 Walting Street Road between Fulwood Hall Lane and Garrison Pub Preston
UR8 Oliver's Place/Pittman Way (parking and congestion) Preston
UR9 Stanifield Lane / Lydiate Road junction South Ribble
UR10 Leyland Road at the Sumpter to the Cawsey, no waiting at any time on both sides - part of ST05
South Ribble
UR11 Hare and Hounds junction - remaining bus lane (or red route). Hyndburn
UR12 Lower Audley Street / Bennington Street BwDBC
UR13 Yew Tree Drive / Lammack Road BwDBC
UR14 Audley Range / Queens Park Road BwDBC
Table B-6 - Improvements to Bus interchanges (mainly infrastructure schemes but some bus priority schemes)
TAS Code Scheme Districts
I1 Cleveleys Town centre better information and infrastructure (District have a levelling up regeneration proposal round 2 (Jan to Feb 2022)
Wyre
I2 Clitheroe Interchange (new shelters, TROs,ped crossings) Ribble Valley
I3 Ormskirk Bus Station (Jan 2022) West Lancs
I4 Skelmersdale Interchange (ensure doesn’t conflict with districts proposals for levelling up, round 2 (Jan to feb 2022)
West Lancs
I5 Chorley Bus station - traffic lights and access? Chorley
I6 Accrington bus station, egress priority change Hyndburn
I7 Nelson bus station - make EA compliant Pendle
I7 Nelson bus station -other work Pendle
I8 Preston Bus Station improvements Preston
I9 Chorley Bus station - upgrades Chorley
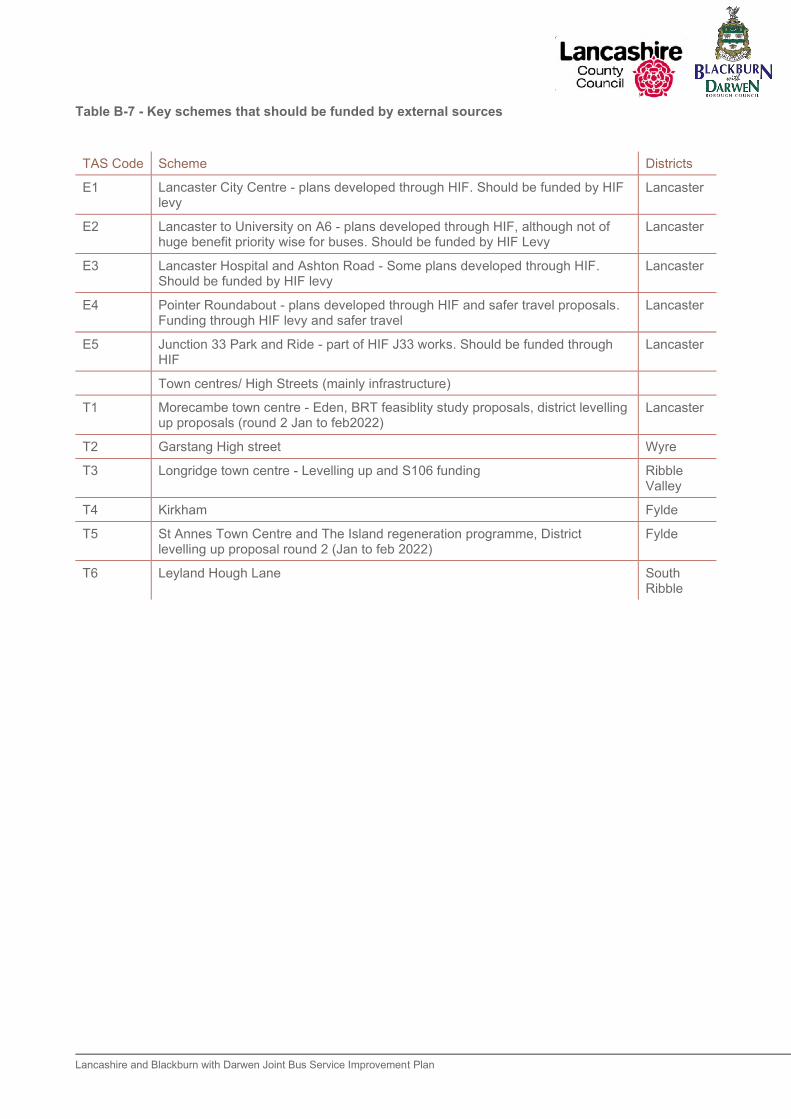
Lancashire and Blackburn with Darwen Joint Bus Service Improvement Plan
Table B-7 - Key schemes that should be funded by external sources
TAS Code Scheme Districts
E1 Lancaster City Centre - plans developed through HIF. Should be funded by HIF levy
Lancaster
E2 Lancaster to University on A6 - plans developed through HIF, although not of huge benefit priority wise for buses. Should be funded by HIF Levy
Lancaster
E3 Lancaster Hospital and Ashton Road - Some plans developed through HIF. Should be funded by HIF levy
Lancaster
E4 Pointer Roundabout - plans developed through HIF and safer travel proposals. Funding through HIF levy and safer travel
Lancaster
E5 Junction 33 Park and Ride - part of HIF J33 works. Should be funded through HIF
Lancaster
Town centres/ High Streets (mainly infrastructure)
T1 Morecambe town centre - Eden, BRT feasiblity study proposals, district levelling up proposals (round 2 Jan to feb2022)
Lancaster
T2 Garstang High street Wyre
T3 Longridge town centre - Levelling up and S106 funding Ribble Valley
T4 Kirkham Fylde
T5 St Annes Town Centre and The Island regeneration programme, District levelling up proposal round 2 (Jan to feb 2022)
Fylde
T6 Leyland Hough Lane South Ribble
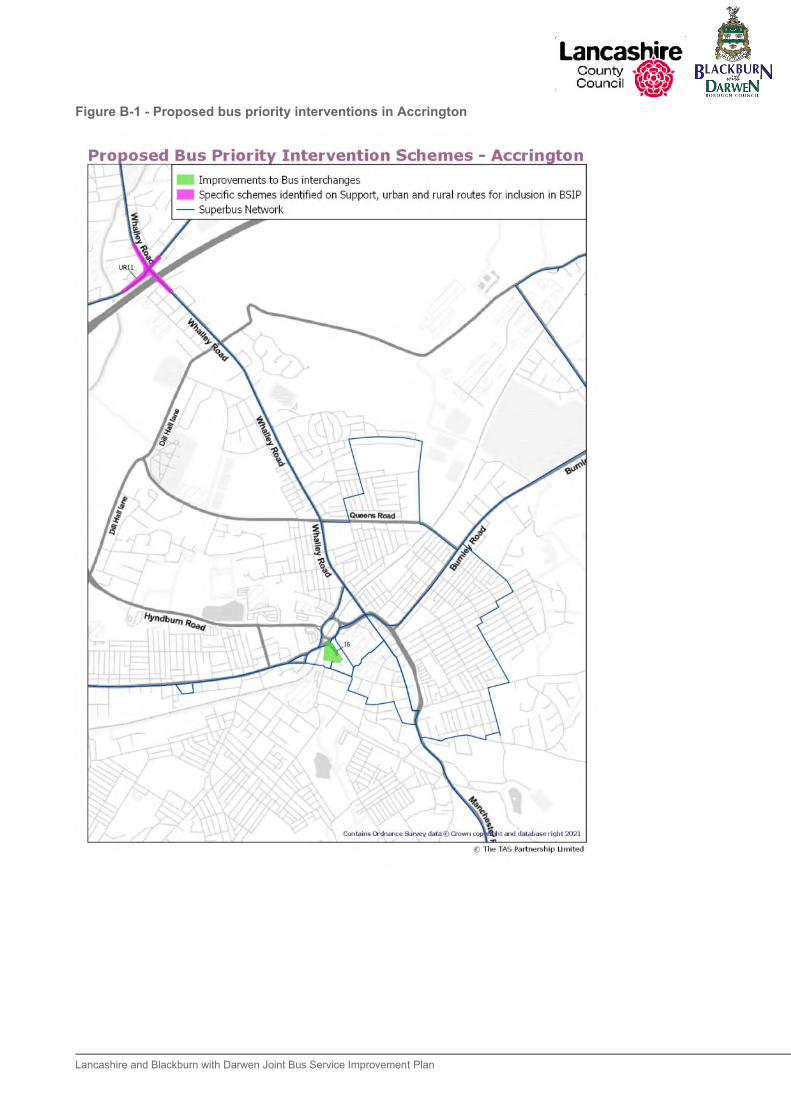
Lancashire and Blackburn with Darwen Joint Bus Service Improvement Plan
Figure B-1 - Proposed bus priority interventions in Accrington

Lancashire and Blackburn with Darwen Joint Bus Service Improvement Plan
Figure B-2 - Proposed bus priority interventions in Blackpool & Fylde

Lancashire and Blackburn with Darwen Joint Bus Service Improvement Plan
Figure B-3 - Proposed bus priority interventions in Burnley

Lancashire and Blackburn with Darwen Joint Bus Service Improvement Plan
Figure B-4 - Proposed bus priority interventions in Darwen
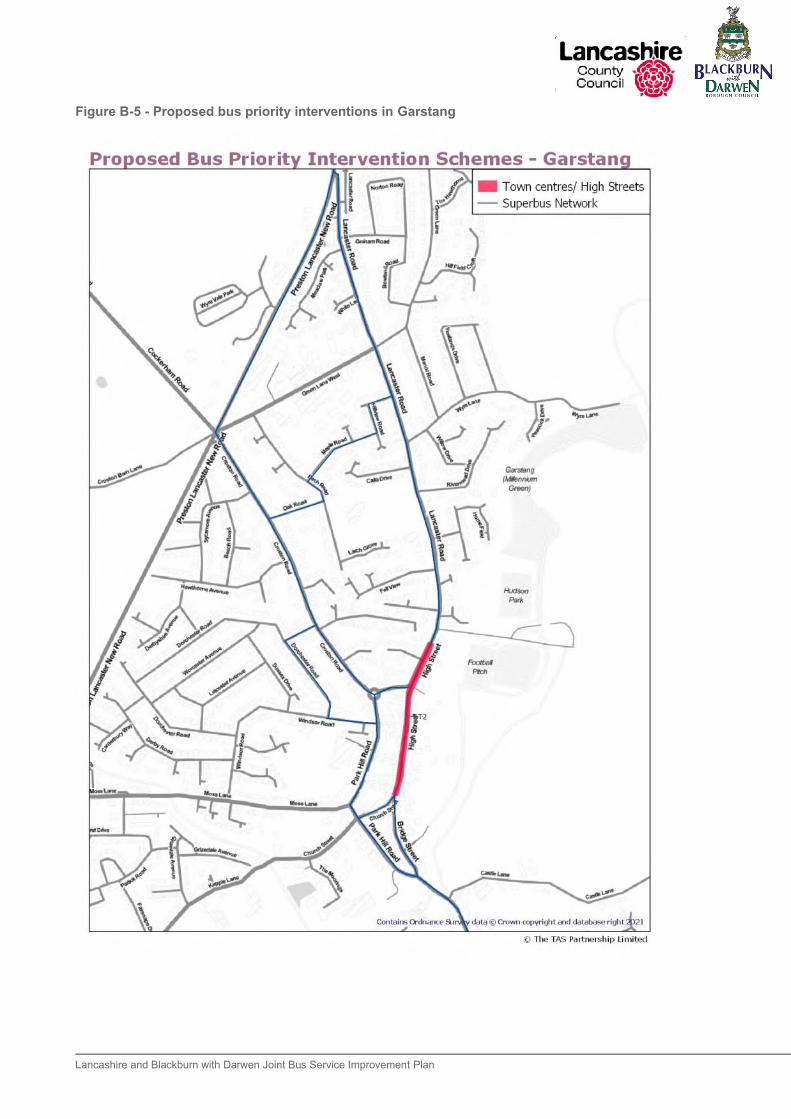
Lancashire and Blackburn with Darwen Joint Bus Service Improvement Plan
Figure B-5 - Proposed bus priority interventions in Garstang
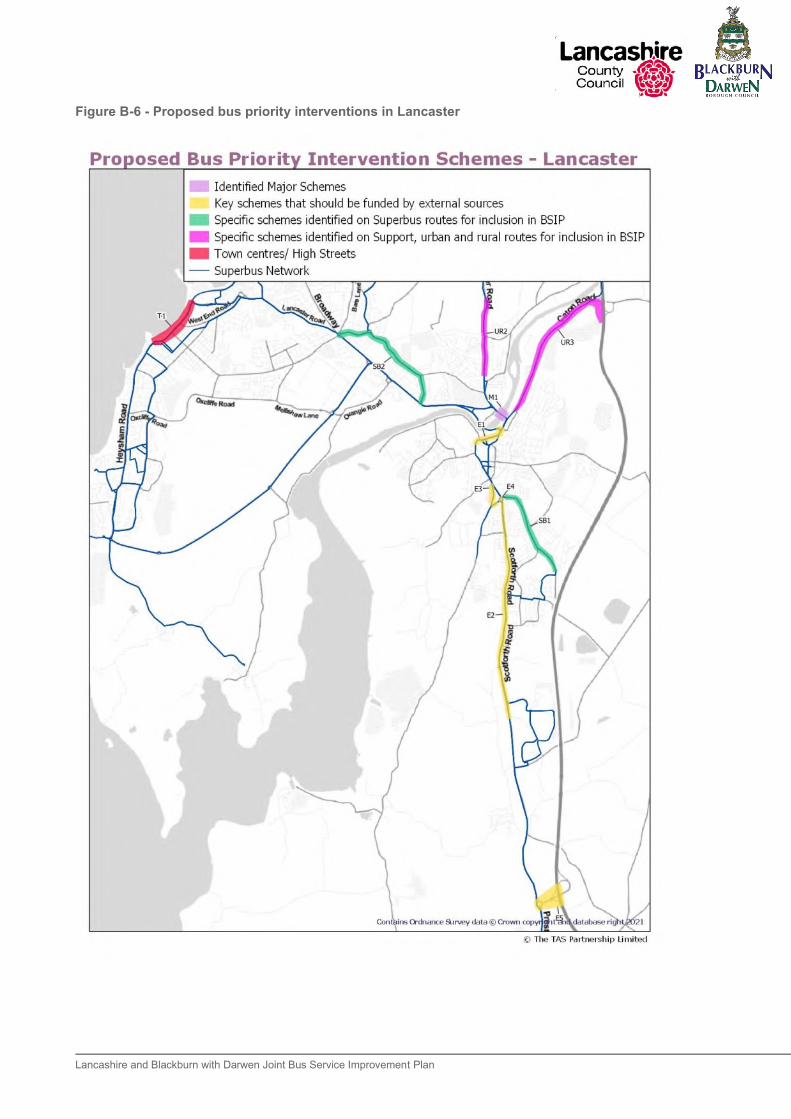
Lancashire and Blackburn with Darwen Joint Bus Service Improvement Plan
Figure B-6 - Proposed bus priority interventions in Lancaster
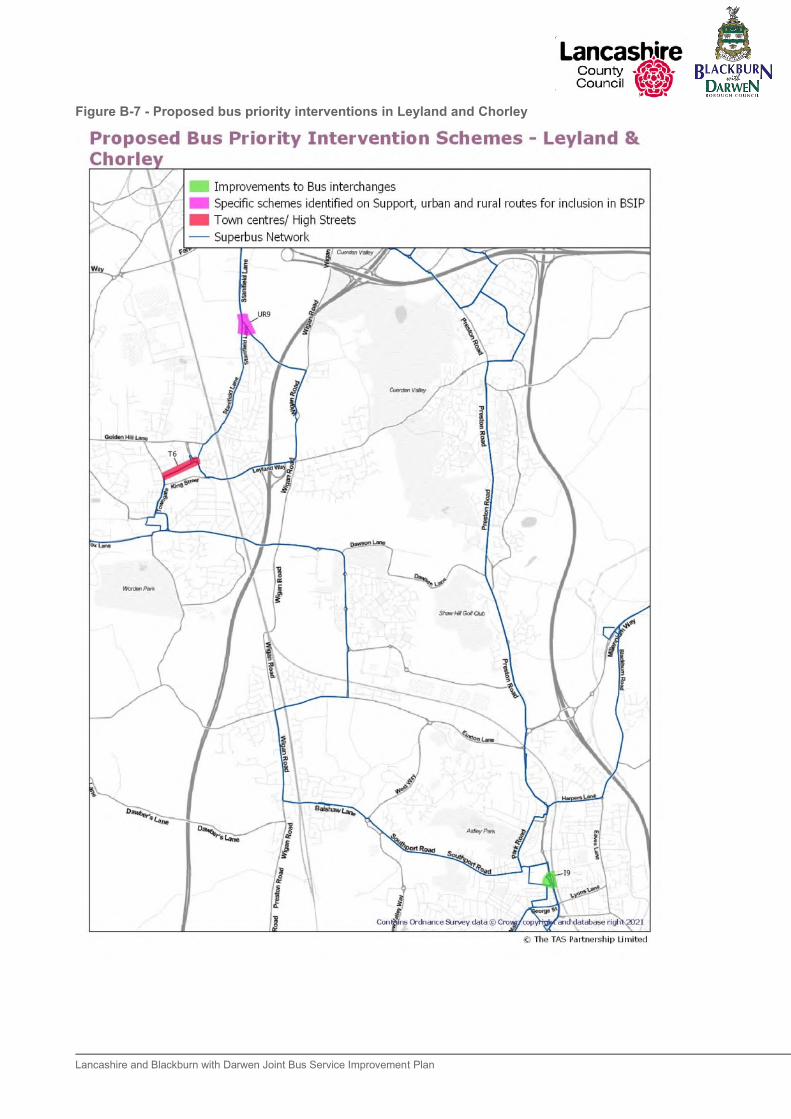
Lancashire and Blackburn with Darwen Joint Bus Service Improvement Plan
Figure B-7 - Proposed bus priority interventions in Leyland and Chorley

Lancashire and Blackburn with Darwen Joint Bus Service Improvement Plan
Figure B-8 - Proposed bus priority interventions in Preston
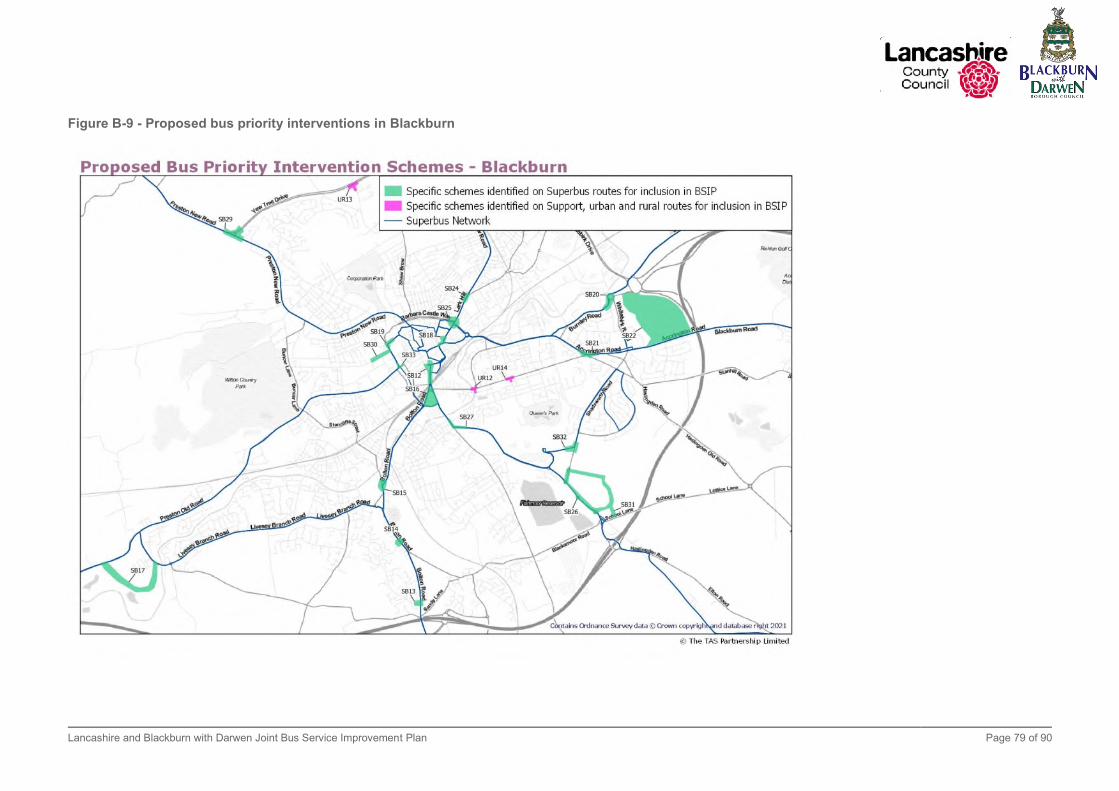
Lancashire and Blackburn with Darwen Joint Bus Service Improvement Plan Page 79 of 90
Figure B-9 - Proposed bus priority interventions in Blackburn
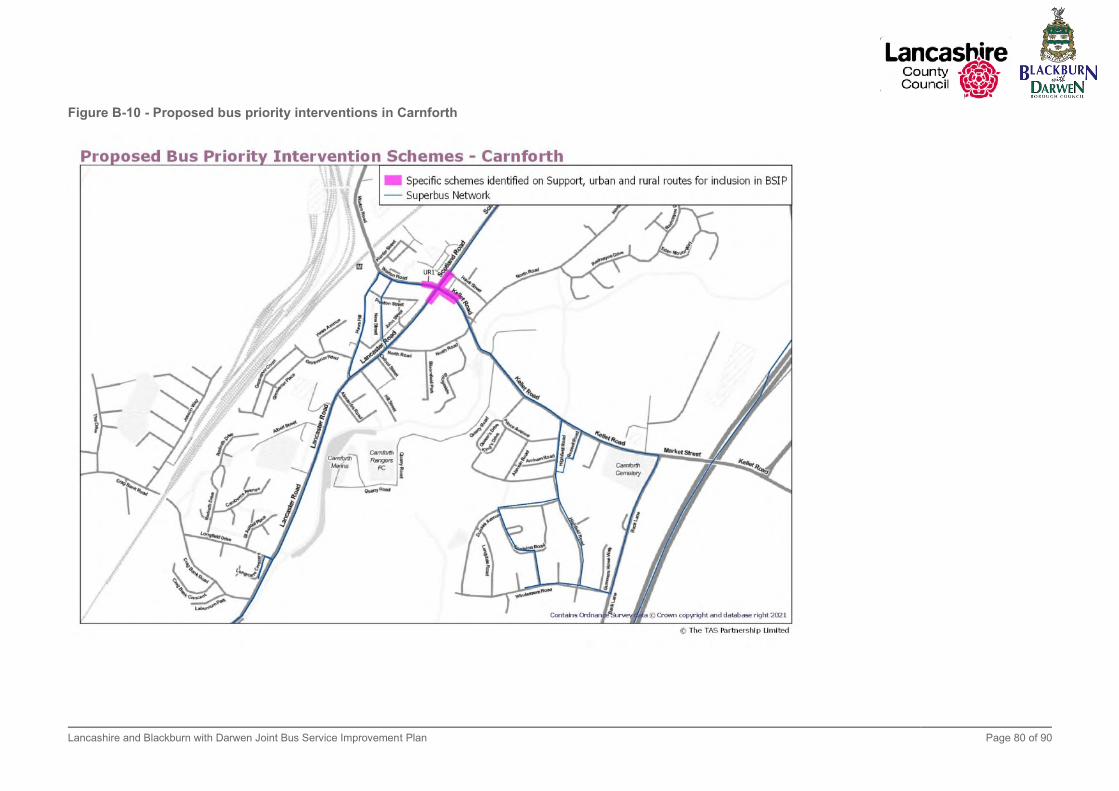
Lancashire and Blackburn with Darwen Joint Bus Service Improvement Plan Page 80 of 90
Figure B-10 - Proposed bus priority interventions in Carnforth
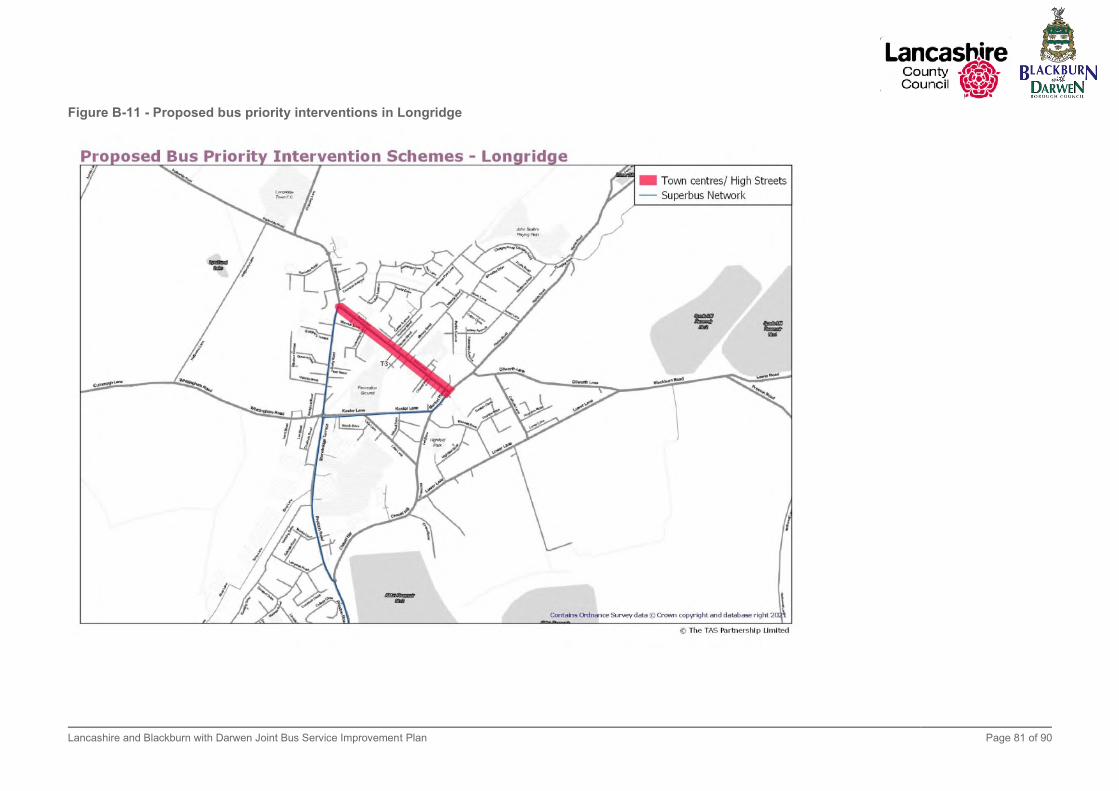
Lancashire and Blackburn with Darwen Joint Bus Service Improvement Plan Page 81 of 90
Figure B-11 - Proposed bus priority interventions in Longridge

Lancashire and Blackburn with Darwen Joint Bus Service Improvement Plan Page 82 of 90
Figure B-12 - Proposed bus priority interventions in Rawtenstall
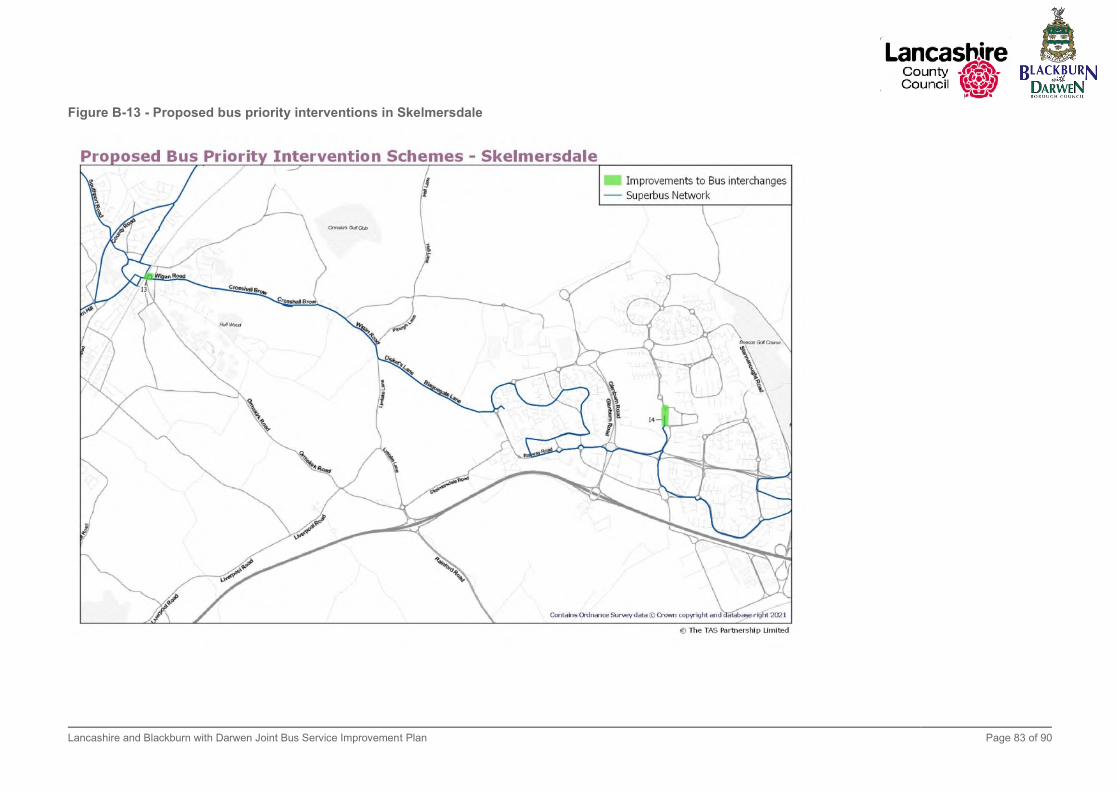
Lancashire and Blackburn with Darwen Joint Bus Service Improvement Plan Page 83 of 90
Figure B-13 - Proposed bus priority interventions in Skelmersdale

Lancashire and Blackburn with Darwen Joint Bus Service Improvement Plan
Appendix C. Letters of Support
Figure C-1 - Letter of support from Coastliner Buses
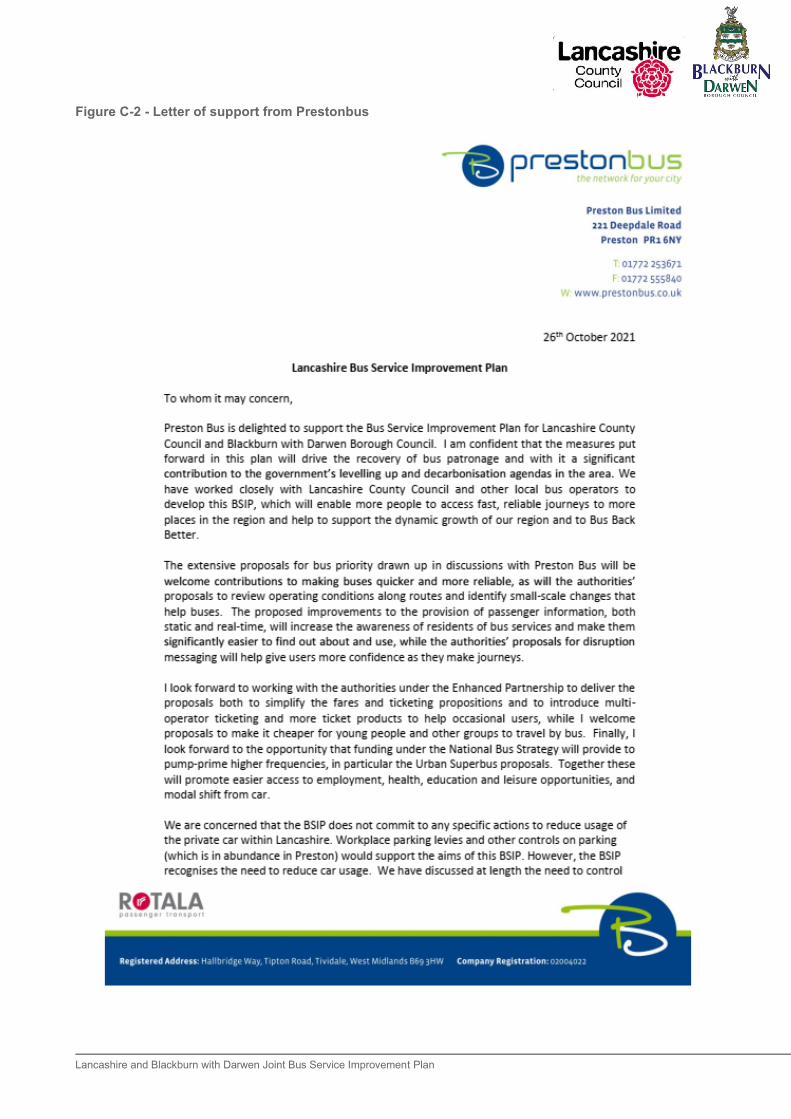
Lancashire and Blackburn with Darwen Joint Bus Service Improvement Plan
Figure C-2 - Letter of support from Prestonbus

Lancashire and Blackburn with Darwen Joint Bus Service Improvement Plan
Lancashire and Blackburn with Darwen Joint Bus Service Improvement Plan
Figure C-3 - Letter of support from Stagecoach
Lancashire and Blackburn with Darwen Joint Bus Service Improvement Plan

Lancashire and Blackburn with Darwen Joint Bus Service Improvement Plan
Figure C-4 - Letter of support from Transdev

Lancashire and Blackburn with Darwen Joint Bus Service Improvement Plan
Appendix D. Lancashire and Blackburn with Darwen BSIP Baseline Evidence Base

1 | 1.5 | 25/10/2021 Atkins | Lancashire with Blackburn With Darwen Baseline Technical Note v1.5 access Page 1 of 134
Technical Note
Project: Lancashire Bus Service Improvement Plan
Subject: Lancashire and Blackburn with Darwen BSIP Baseline Evidence Base
Author: Charlie Watson
Date: 25/10/2021 Project No.: 5208637
Atkins No.: Icepac No.:
Distribution: Representing:
Document history
Revision Purpose description Originated Checked Reviewed Authorised Date
1.0 First draft CW PB CW ND 07/09/21
1.2 Addition of Blackburn with Darwen information and supported bus information.
CW ND
1.3 Addition of bus operator info and document finalisation.
CW ND 20/10/2021
1.4 CW ND 25/10/2021
1.5 Document finalisation. CW ND 26/10/2021
Client signoff
Client Lancashire County Council and Blackburn with Darwen Council
Project Lancashire Bus Service Improvement Plan
Project No. 5208637
Client signature / date

1 | 1.5 | 25/10/2021 Atkins | Lancashire with Blackburn With Darwen Baseline Technical Note v1.5 access Page 2 of 134
1. Background and Demographic Profile Lancashire County Council is a large upper tier authority located in the North West of England, representing 12 districts. The vast nature of the county means that there is significant diversity of both populations and their distributions. To the west of the county there are the large populations in Fleetwood, and Lytham St Annes, and Lancaster to the north west of the authority. To the east, the authority has the large settlements of Burnley, Clitheroe and Accrington alongside Preston, Leyland and Ormskirk to the south west. Lancashire is bordered by several counties, again with diverse geographies. To the south it borders the Combined Authorities representing Greater Manchester and the Liverpool City Region, whereas to the east the county borders North Yorkshire and West Yorkshire and Cumbria to the north. The county has in parts strong highway connectivity, with the M6 providing north-south connectivity, and several local motorways providing for journeys into Manchester, Blackpool and Liverpool. The county also has a number of nodes of access to National Rail services, notably the West Coast Mainline running through Preston and Lancaster, alongside electrified commuter railways to Blackpool, Liverpool and Manchester. Additionally, there are other lines providing less frequent railway services within the county. As at mid-2020 the county’s population stood at 1.1 million people1.
Blackburn with Darwen Council is a small unitary authority bordering Lancashire and Greater Manchester. The authority compromises of two urban areas which are the namesakes of the authority. The area is intrinsically linked to Lancashire, both in terms of its rail and highway network as well as through the travel to work area2. Like Lancashire, Blackburn with Darwen has reasonable highway connectivity, with the M65 running east to west through the borough and the A666 providing a link into Greater Manchester. Regarding railway connectivity, the main railway station within Blackburn provides regular direct services to Blackpool, Manchester and York. As at mid-2020 the local authority’s population was 150,030 people1.
Figure 1-2 outlines the population breakdown within Lancashire at the individual lower tier authorities alongside within Blackburn with Darwen. This is based on the Office for National Statistics (ONS) 2020 mid-year population estimates.
The largest areas within Lancashire are Lancaster and Preston, both of which have a population of around 145,000 people. The least populated lower tier authority is the Ribble Valley with a population around 62,000. When considering the demographic breakdown of the population, it is evident that the population is more youthful within the urban centres such as Preston and Lancaster alongside South Ribble and West Lancashire, with the former likely to reflect those who commute into Preston and Liverpool for work. The highest proportions of those over the age of 60 are found within Wyre and the Ribble Valley, where 35% and 31% of the population are over the age of 60. This contrasts with Preston and Hyndburn where this figure is 20% and 24% respectively.
When considering Blackburn with Darwen, the local authority elicits a similar age profile to Preston, with 20% of the population over the age of 60. The authority also has a high proportion of people under the age of 16 which represent 24% of the population within the authority.
Overall, Figure 1-2 outlines that Lancashire is a diverse county with differing population demographic across the lower tier authorities and the urban/rural spheres. Blackburn with Darwen also has variable demographics, with high proportions of both young and old people. The aforementioned variations in demographics will need to be appreciated when designing the Bus Service Improvement Plan.
1 ONS (2021), Estimates of the population for the UK, England and Wales, Scotland and Northern Ireland 2 ONS (2020), Travel to Work Areas, United Kingdom, 2011
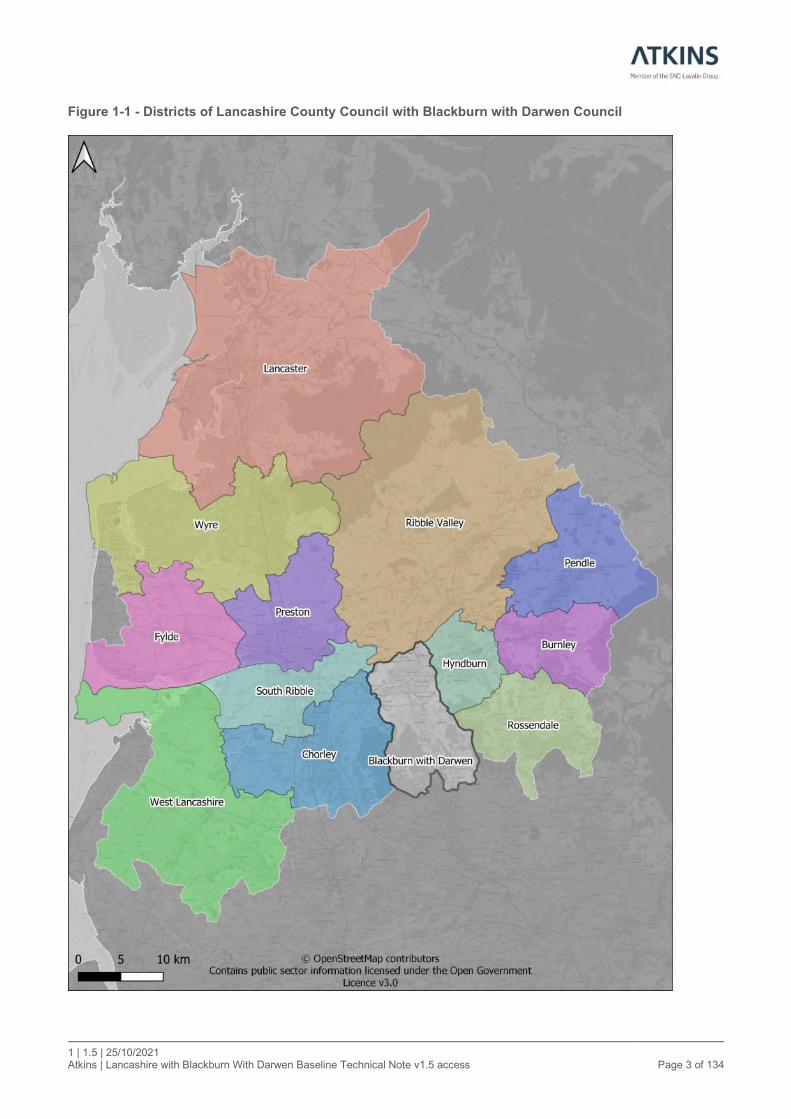
1 | 1.5 | 25/10/2021 Atkins | Lancashire with Blackburn With Darwen Baseline Technical Note v1.5 access Page 3 of 134
Figure 1-1 - Districts of Lancashire County Council with Blackburn with Darwen Council
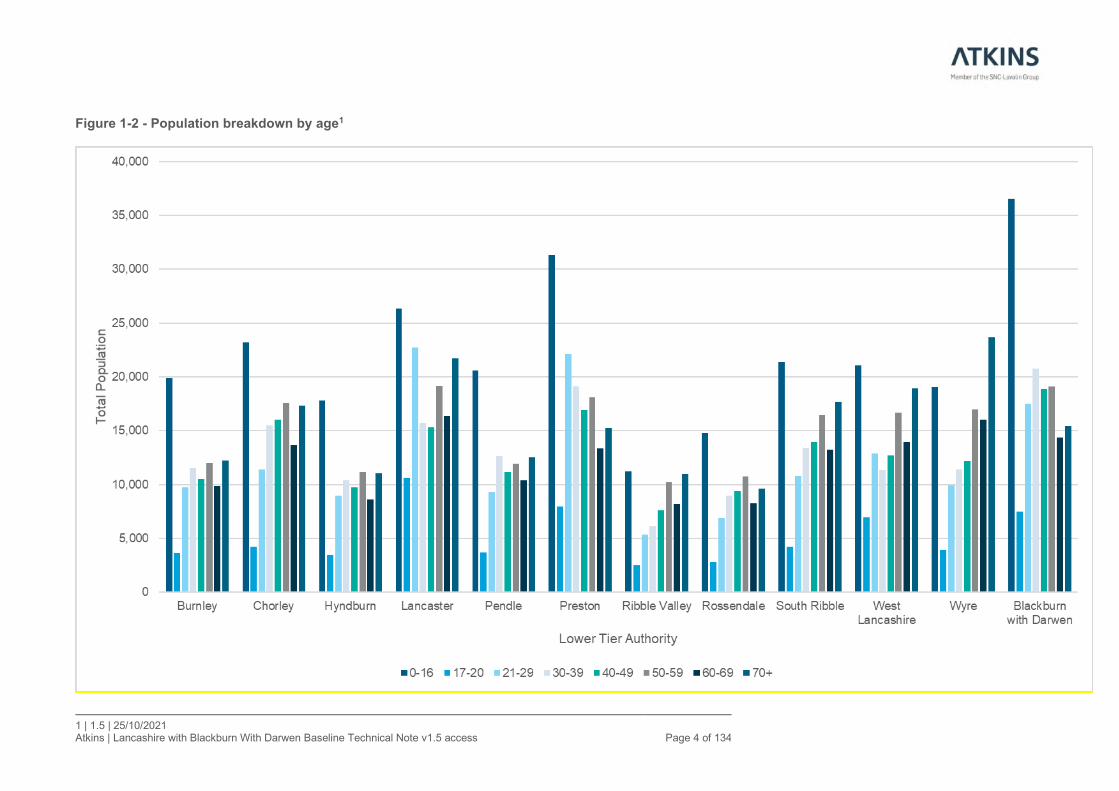
1 | 1.5 | 25/10/2021 Atkins | Lancashire with Blackburn With Darwen Baseline Technical Note v1.5 access Page 4 of 134
Figure 1-2 - Population breakdown by age1

1 | 1.5 | 25/10/2021 Atkins | Lancashire with Blackburn With Darwen Baseline Technical Note v1.5 access Page 5 of 134
2. Spatial demographics
2.1. Economically inactive Economically inactive people are defined as those who are retired, students, those who are unable to work and those unemployed. 2011 Census data has been collected to understand the profile of economic inactivity within Lancashire3. Within Lancashire the average economic inactivity is 32%, which is higher than the average level of 30% for England and Wales. Economic inactivity is however not equally distributed across the county, with higher levels of economic inactivity seen in the built-up areas of the county, particularly in the east within Burnley and Colne, alongside to the coastal west in areas such as Morecombe and Fleetwood. Conversely, higher levels of economic activity are seen in the Chorley and Leyland area, alongside in central parts of the authority to the north of Preston. Overall, economic inactivity within Lancashire appears to be concentrated within the urban areas, especially within the central parts of Burnley, Colne and Accrington, with the greatest levels of activity seen in areas which are suburban to the larger settlements or in proximity to good railway connectivity to these areas.
Within Blackburn with Darwen, the average economic inactivity is 36% which is also higher than the average level of 30% for England and Wales. This is particularly pronounced within central and eastern parts of Blackburn where 47% of households are economically inactive.

1 | 1.5 | 25/10/2021 Atkins | Lancashire with Blackburn With Darwen Baseline Technical Note v1.5 access Page 6 of 134
Figure 2-1 - Percentage economically inactive at the LSOA level3
3 ONS (2013), Economic Activity (QS601EW)
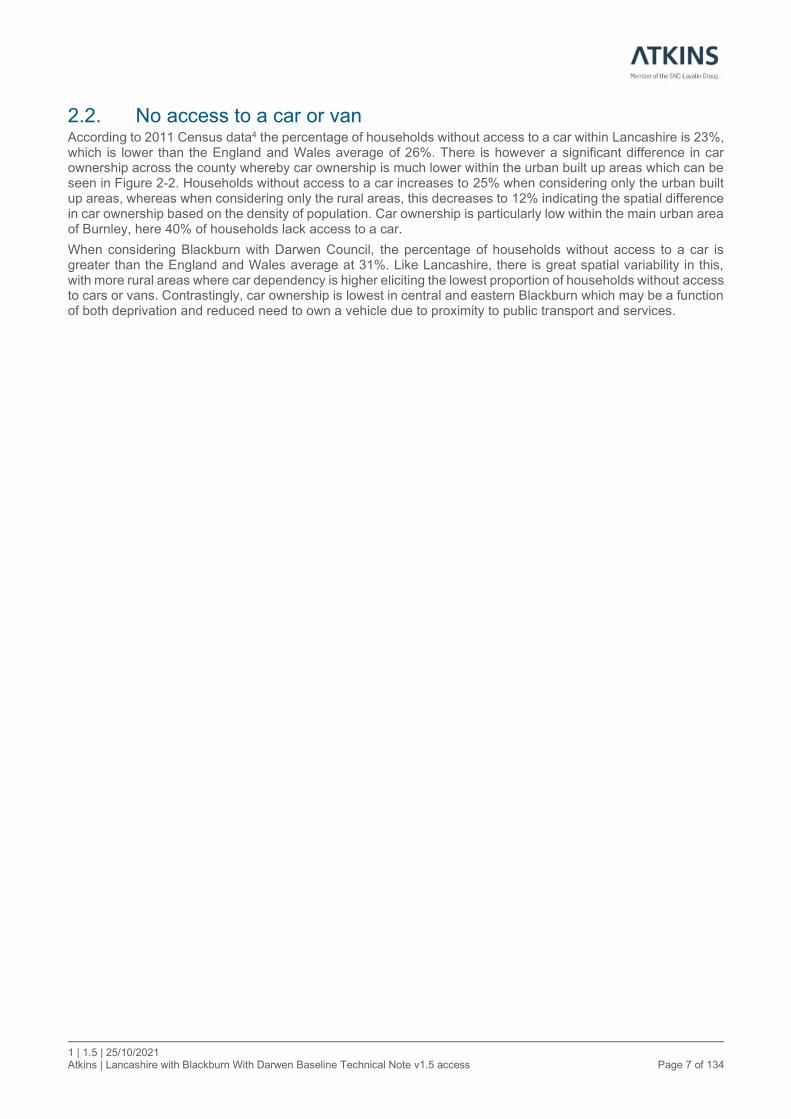
1 | 1.5 | 25/10/2021 Atkins | Lancashire with Blackburn With Darwen Baseline Technical Note v1.5 access Page 7 of 134
2.2. No access to a car or van According to 2011 Census data4 the percentage of households without access to a car within Lancashire is 23%, which is lower than the England and Wales average of 26%. There is however a significant difference in car ownership across the county whereby car ownership is much lower within the urban built up areas which can be seen in Figure 2-2. Households without access to a car increases to 25% when considering only the urban built up areas, whereas when considering only the rural areas, this decreases to 12% indicating the spatial difference in car ownership based on the density of population. Car ownership is particularly low within the main urban area of Burnley, here 40% of households lack access to a car.
When considering Blackburn with Darwen Council, the percentage of households without access to a car is greater than the England and Wales average at 31%. Like Lancashire, there is great spatial variability in this, with more rural areas where car dependency is higher eliciting the lowest proportion of households without access to cars or vans. Contrastingly, car ownership is lowest in central and eastern Blackburn which may be a function of both deprivation and reduced need to own a vehicle due to proximity to public transport and services.

1 | 1.5 | 25/10/2021 Atkins | Lancashire with Blackburn With Darwen Baseline Technical Note v1.5 access Page 8 of 134
Figure 2-2 - Percentage of households without access to a car at the LSOA level4
4 ONS (2013), Car or van availability (QS416EW)

1 | 1.5 | 25/10/2021 Atkins | Lancashire with Blackburn With Darwen Baseline Technical Note v1.5 access Page 9 of 134
2.3. Population density Figure 2-3 outlines the population density of Lower Layer Super Output Areas (LSOAs) based on 2011 Census data5. within Lancashire, the county is sparsely populated with on average 24 people per hectare. This lower than the England and Wales average of 43 people per hectare. This said, when considering only the urban built up areas, the population density of the county increases to 33 people per hectare, again this is lower than the national average.
As Blackburn with Darwen is a smaller unitary authority, the population density is higher than within Lancashire at 47 people per hectare, with this being above the average people per hectare in England and Wales. There are however areas of the lowest classification of population density located between Blackburn and Darwen, alongside to the south of Darwen.

1 | 1.5 | 25/10/2021 Atkins | Lancashire with Blackburn With Darwen Baseline Technical Note v1.5 access Page 10 of 134
Figure 2-3 - Population density at the LSOA level5
5 ONS (2013), Population density (QS102EW)

1 | 1.5 | 25/10/2021 Atkins | Lancashire with Blackburn With Darwen Baseline Technical Note v1.5 access Page 11 of 134
2.4. Index of Multiple Deprivation (IMD) The IMD income deprivation domain6 has been used to investigate deprivation. Table 2-1 outlines the breakdown
of quintiles within Lancashire. It is clear that there is a relatively even distribution of each quintile within the county,
with income quintile 1 and 4 being the two largest groupings, this suggests that there is great diversity in
deprivation across Lancashire. When considering the spatial distribution of income deprivation in Lancashire
(Figure 2-4) it is evident that despite the relatively equal distributions of income quintiles. This is not equal across
space, with all bar 3 LSOAs within income quintile 1 being located within an area deemed as built up urban. This
highlights that there is uneven economic deprivation within the county, whereby those living in urban areas are
more income deprived than the more rural, less deprived parts of the county. The greatest levels of deprivation
are seen within the east of the county in areas such as Colne, Burnley and Accrington with other urban areas
across the county, such as the coastal towns of Fleetwood and Morecambe also having higher levels of
deprivation.
When reviewing the distribution of IMD scores in Blackburn with Darwen (Table 2-2) it is clear that the distribution is skewed towards income quintile 1 and 2, with 70% of LSOAs deemed to fit within these categories. This is driven by high levels of deprivation in Blackburn and north of Darwen. The lowest levels of income deprivation are seen to the south of the authority in more rural areas covering places such as Edgworth and Belmont.
Table 2-1 - IMD income quintile distribution in Lancashire
IMD Income Quintile Number of LSOAs Percentage of LSOAs (%)
1 (most deprived) 175 23
2 148 20
3 127 17
4 170 22
5 (least deprived) 136 18
Table 2-2 - IMD income quintile distribution in Blackburn with Darwen
IMD Income Quintile Number of LSOAs Percentage of LSOAs (%)
1 (most deprived) 50 55
2 14 15
3 8 9
4 11 12
5 (least deprived) 8 9

1 | 1.5 | 25/10/2021 Atkins | Lancashire with Blackburn With Darwen Baseline Technical Note v1.5 access Page 12 of 134
Figure 2-4 - IMD income domain classification at the LSOA level6
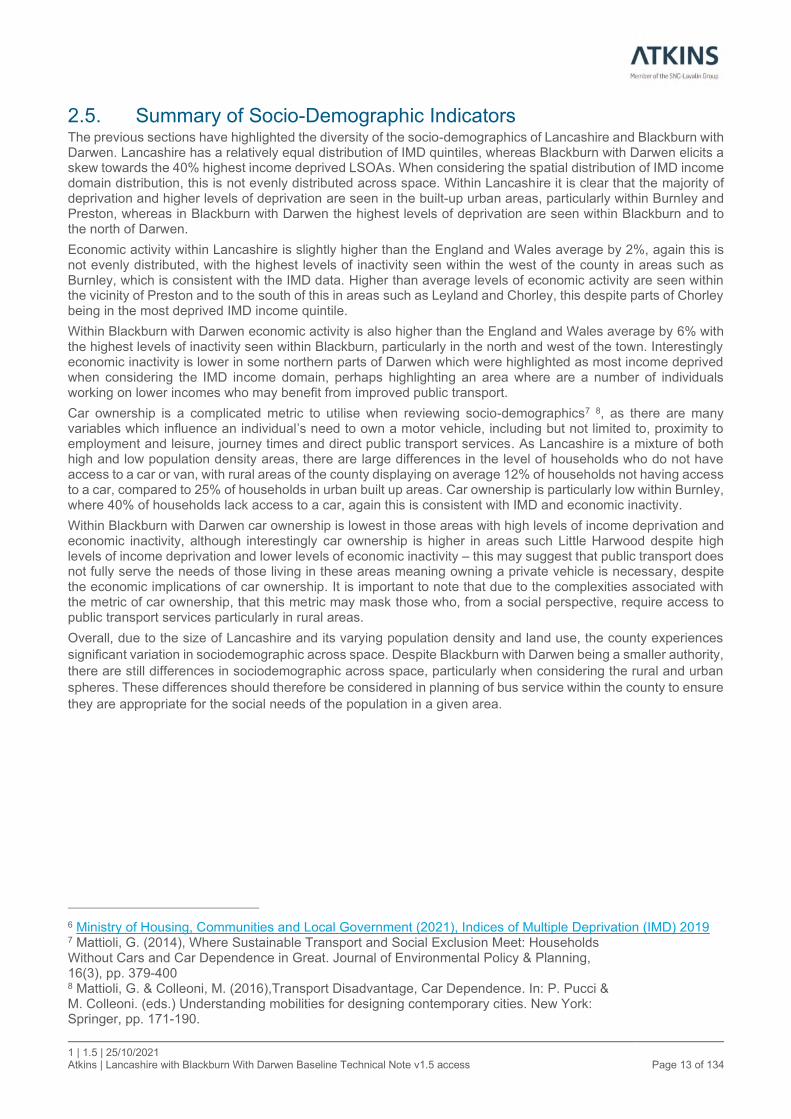
1 | 1.5 | 25/10/2021 Atkins | Lancashire with Blackburn With Darwen Baseline Technical Note v1.5 access Page 13 of 134
2.5. Summary of Socio-Demographic Indicators The previous sections have highlighted the diversity of the socio-demographics of Lancashire and Blackburn with Darwen. Lancashire has a relatively equal distribution of IMD quintiles, whereas Blackburn with Darwen elicits a skew towards the 40% highest income deprived LSOAs. When considering the spatial distribution of IMD income domain distribution, this is not evenly distributed across space. Within Lancashire it is clear that the majority of deprivation and higher levels of deprivation are seen in the built-up urban areas, particularly within Burnley and Preston, whereas in Blackburn with Darwen the highest levels of deprivation are seen within Blackburn and to the north of Darwen.
Economic activity within Lancashire is slightly higher than the England and Wales average by 2%, again this is not evenly distributed, with the highest levels of inactivity seen within the west of the county in areas such as Burnley, which is consistent with the IMD data. Higher than average levels of economic activity are seen within the vicinity of Preston and to the south of this in areas such as Leyland and Chorley, this despite parts of Chorley being in the most deprived IMD income quintile.
Within Blackburn with Darwen economic activity is also higher than the England and Wales average by 6% with the highest levels of inactivity seen within Blackburn, particularly in the north and west of the town. Interestingly economic inactivity is lower in some northern parts of Darwen which were highlighted as most income deprived when considering the IMD income domain, perhaps highlighting an area where are a number of individuals working on lower incomes who may benefit from improved public transport.
Car ownership is a complicated metric to utilise when reviewing socio-demographics7 8, as there are many variables which influence an individual’s need to own a motor vehicle, including but not limited to, proximity to employment and leisure, journey times and direct public transport services. As Lancashire is a mixture of both high and low population density areas, there are large differences in the level of households who do not have access to a car or van, with rural areas of the county displaying on average 12% of households not having access to a car, compared to 25% of households in urban built up areas. Car ownership is particularly low within Burnley, where 40% of households lack access to a car, again this is consistent with IMD and economic inactivity.
Within Blackburn with Darwen car ownership is lowest in those areas with high levels of income deprivation and economic inactivity, although interestingly car ownership is higher in areas such Little Harwood despite high levels of income deprivation and lower levels of economic inactivity – this may suggest that public transport does not fully serve the needs of those living in these areas meaning owning a private vehicle is necessary, despite the economic implications of car ownership. It is important to note that due to the complexities associated with the metric of car ownership, that this metric may mask those who, from a social perspective, require access to public transport services particularly in rural areas.
Overall, due to the size of Lancashire and its varying population density and land use, the county experiences
significant variation in sociodemographic across space. Despite Blackburn with Darwen being a smaller authority,
there are still differences in sociodemographic across space, particularly when considering the rural and urban
spheres. These differences should therefore be considered in planning of bus service within the county to ensure
they are appropriate for the social needs of the population in a given area.
6 Ministry of Housing, Communities and Local Government (2021), Indices of Multiple Deprivation (IMD) 2019 7 Mattioli, G. (2014), Where Sustainable Transport and Social Exclusion Meet: Households Without Cars and Car Dependence in Great. Journal of Environmental Policy & Planning, 16(3), pp. 379-400 8 Mattioli, G. & Colleoni, M. (2016),Transport Disadvantage, Car Dependence. In: P. Pucci & M. Colleoni. (eds.) Understanding mobilities for designing contemporary cities. New York: Springer, pp. 171-190.
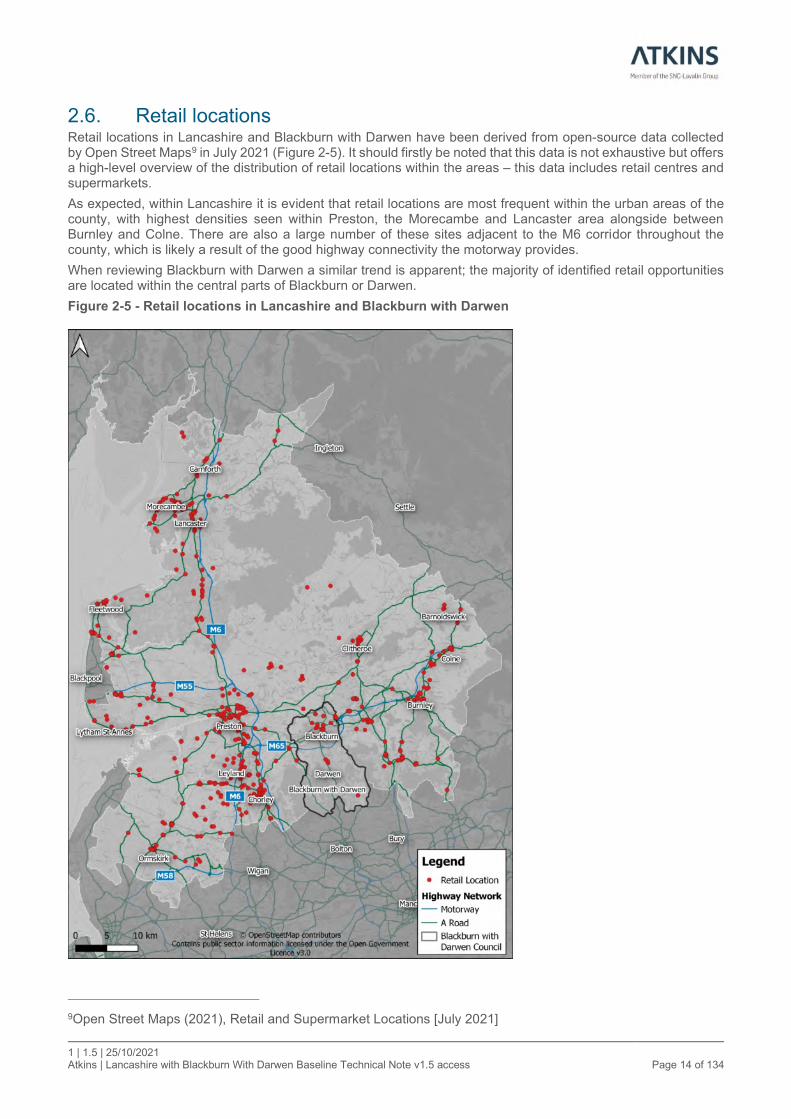
1 | 1.5 | 25/10/2021 Atkins | Lancashire with Blackburn With Darwen Baseline Technical Note v1.5 access Page 14 of 134
2.6. Retail locations Retail locations in Lancashire and Blackburn with Darwen have been derived from open-source data collected by Open Street Maps9 in July 2021 (Figure 2-5). It should firstly be noted that this data is not exhaustive but offers a high-level overview of the distribution of retail locations within the areas – this data includes retail centres and supermarkets.
As expected, within Lancashire it is evident that retail locations are most frequent within the urban areas of the county, with highest densities seen within Preston, the Morecambe and Lancaster area alongside between Burnley and Colne. There are also a large number of these sites adjacent to the M6 corridor throughout the county, which is likely a result of the good highway connectivity the motorway provides.
When reviewing Blackburn with Darwen a similar trend is apparent; the majority of identified retail opportunities are located within the central parts of Blackburn or Darwen.
Figure 2-5 - Retail locations in Lancashire and Blackburn with Darwen
9Open Street Maps (2021), Retail and Supermarket Locations [July 2021]

1 | 1.5 | 25/10/2021 Atkins | Lancashire with Blackburn With Darwen Baseline Technical Note v1.5 access Page 15 of 134
2.7. Mode share Census data for the method of travel to work data has been utilised to understand mode share within
Lancashire (Figure 2-6) and Blackburn with Darwen (Figure 2-7)10.
Within Lancashire it is evident that the majority of trips to work are taken by driving a private car, followed by travelling by foot which account for 67% and 11% of mode share respectively. In the 2011 Census, only 2% of commutes were accounted for by cycling in Lancashire.
When considering public transport, 6% of commuters utilised the bus as their main way of travelling to work, with 2% commuters travelling by train.
Within Blackburn with Darwen, like in Lancashire, the majority of trips to work are taken by driving a private car, followed by travelling by foot which account for 64% and 13% of mode share respectively. In the 2011 Census, only 1% of commutes were accounted for by cycling in Blackburn with Darwen.
When considering public transport, 5% of commuters utilised the bus as their main way of travelling to work, with 2% commuters travelling by train.
Overall, within both authorities, there is a clear dominance of private mobility in terms of the mode of choice for those travelling to work, with public transport and active modes lagging significantly behind private mobility.
Figure 2-6 - Method of travel to work in Lancashire10
10 ONS (2013), Method of travel to work (QS701EW)
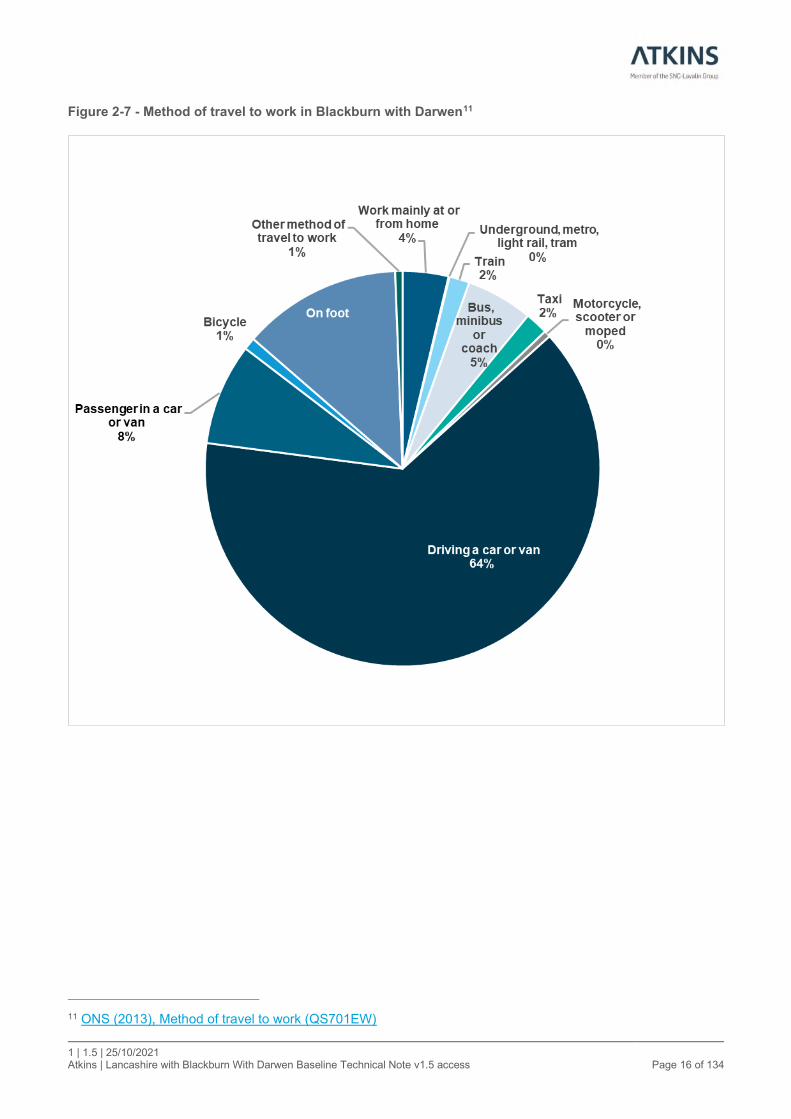
1 | 1.5 | 25/10/2021 Atkins | Lancashire with Blackburn With Darwen Baseline Technical Note v1.5 access Page 16 of 134
Figure 2-7 - Method of travel to work in Blackburn with Darwen11
11 ONS (2013), Method of travel to work (QS701EW)
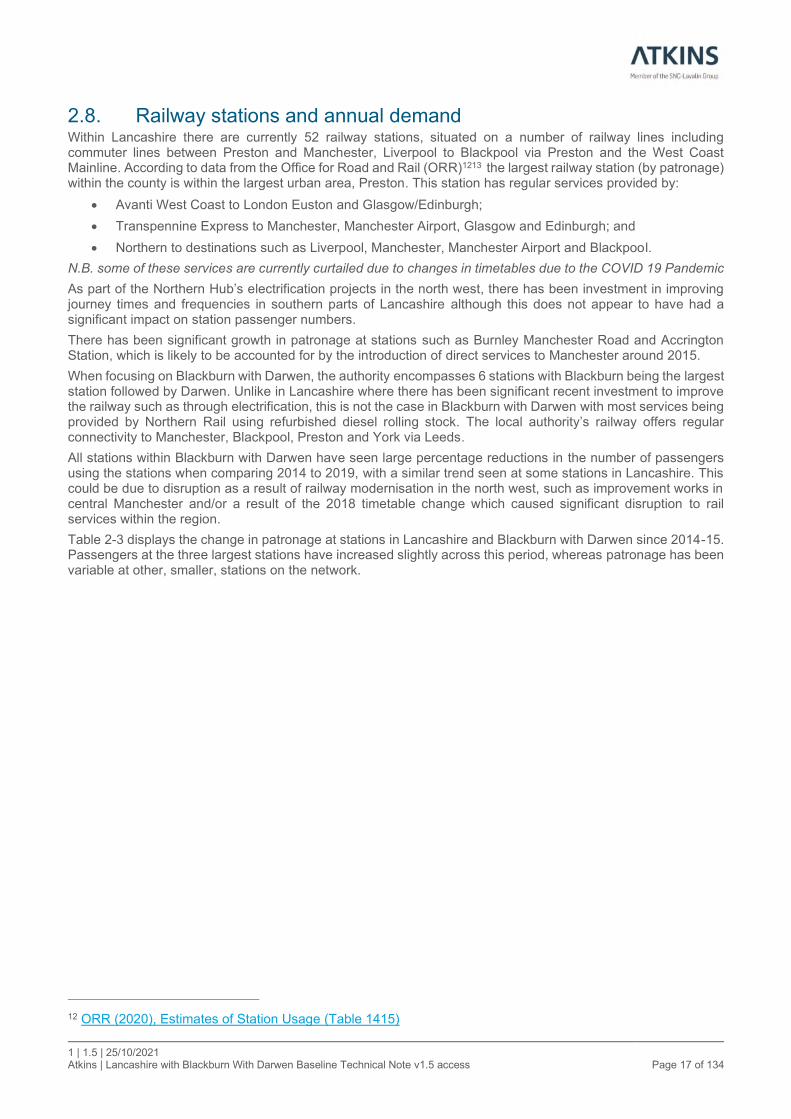
1 | 1.5 | 25/10/2021 Atkins | Lancashire with Blackburn With Darwen Baseline Technical Note v1.5 access Page 17 of 134
2.8. Railway stations and annual demand Within Lancashire there are currently 52 railway stations, situated on a number of railway lines including commuter lines between Preston and Manchester, Liverpool to Blackpool via Preston and the West Coast Mainline. According to data from the Office for Road and Rail (ORR)1213 the largest railway station (by patronage) within the county is within the largest urban area, Preston. This station has regular services provided by:
• Avanti West Coast to London Euston and Glasgow/Edinburgh;
• Transpennine Express to Manchester, Manchester Airport, Glasgow and Edinburgh; and
• Northern to destinations such as Liverpool, Manchester, Manchester Airport and Blackpool.
N.B. some of these services are currently curtailed due to changes in timetables due to the COVID 19 Pandemic
As part of the Northern Hub’s electrification projects in the north west, there has been investment in improving journey times and frequencies in southern parts of Lancashire although this does not appear to have had a significant impact on station passenger numbers.
There has been significant growth in patronage at stations such as Burnley Manchester Road and Accrington Station, which is likely to be accounted for by the introduction of direct services to Manchester around 2015.
When focusing on Blackburn with Darwen, the authority encompasses 6 stations with Blackburn being the largest station followed by Darwen. Unlike in Lancashire where there has been significant recent investment to improve the railway such as through electrification, this is not the case in Blackburn with Darwen with most services being provided by Northern Rail using refurbished diesel rolling stock. The local authority’s railway offers regular connectivity to Manchester, Blackpool, Preston and York via Leeds.
All stations within Blackburn with Darwen have seen large percentage reductions in the number of passengers using the stations when comparing 2014 to 2019, with a similar trend seen at some stations in Lancashire. This could be due to disruption as a result of railway modernisation in the north west, such as improvement works in central Manchester and/or a result of the 2018 timetable change which caused significant disruption to rail services within the region.
Table 2-3 displays the change in patronage at stations in Lancashire and Blackburn with Darwen since 2014-15. Passengers at the three largest stations have increased slightly across this period, whereas patronage has been variable at other, smaller, stations on the network.
12 ORR (2020), Estimates of Station Usage (Table 1415)
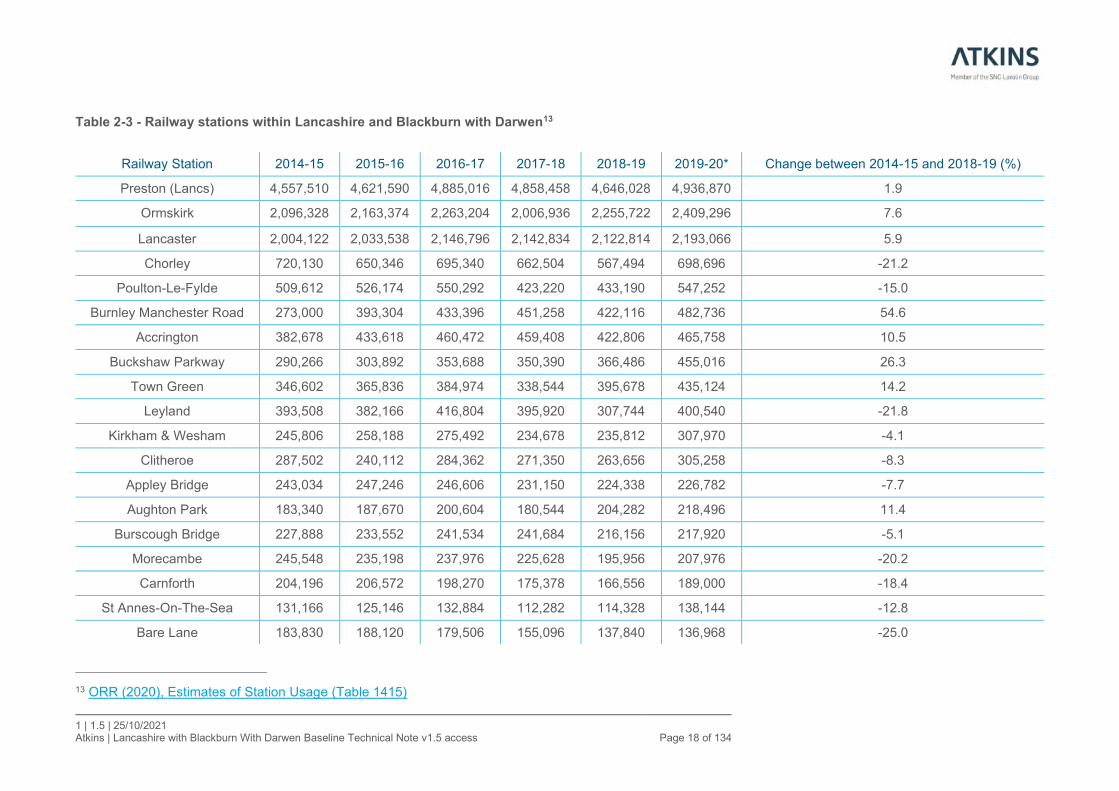
1 | 1.5 | 25/10/2021 Atkins | Lancashire with Blackburn With Darwen Baseline Technical Note v1.5 access Page 18 of 134
Table 2-3 - Railway stations within Lancashire and Blackburn with Darwen13
13 ORR (2020), Estimates of Station Usage (Table 1415)
Railway Station 2014-15 2015-16 2016-17 2017-18 2018-19 2019-20* Change between 2014-15 and 2018-19 (%)
Preston (Lancs) 4,557,510 4,621,590 4,885,016 4,858,458 4,646,028 4,936,870 1.9
Ormskirk 2,096,328 2,163,374 2,263,204 2,006,936 2,255,722 2,409,296 7.6
Lancaster 2,004,122 2,033,538 2,146,796 2,142,834 2,122,814 2,193,066 5.9
Chorley 720,130 650,346 695,340 662,504 567,494 698,696 -21.2
Poulton-Le-Fylde 509,612 526,174 550,292 423,220 433,190 547,252 -15.0
Burnley Manchester Road 273,000 393,304 433,396 451,258 422,116 482,736 54.6
Accrington 382,678 433,618 460,472 459,408 422,806 465,758 10.5
Buckshaw Parkway 290,266 303,892 353,688 350,390 366,486 455,016 26.3
Town Green 346,602 365,836 384,974 338,544 395,678 435,124 14.2
Leyland 393,508 382,166 416,804 395,920 307,744 400,540 -21.8
Kirkham & Wesham 245,806 258,188 275,492 234,678 235,812 307,970 -4.1
Clitheroe 287,502 240,112 284,362 271,350 263,656 305,258 -8.3
Appley Bridge 243,034 247,246 246,606 231,150 224,338 226,782 -7.7
Aughton Park 183,340 187,670 200,604 180,544 204,282 218,496 11.4
Burscough Bridge 227,888 233,552 241,534 241,684 216,156 217,920 -5.1
Morecambe 245,548 235,198 237,976 225,628 195,956 207,976 -20.2
Carnforth 204,196 206,572 198,270 175,378 166,556 189,000 -18.4
St Annes-On-The-Sea 131,166 125,146 132,884 112,282 114,328 138,144 -12.8
Bare Lane 183,830 188,120 179,506 155,096 137,840 136,968 -25.0

1 | 1.5 | 25/10/2021 Atkins | Lancashire with Blackburn With Darwen Baseline Technical Note v1.5 access Page 19 of 134
Adlington (Lancashire) 110,902 115,786 122,514 114,488 102,646 134,180 -7.4
Parbold 117,130 127,754 133,482 140,242 125,578 132,660 7.2
Nelson 131,864 129,762 132,970 123,230 97,446 121,256 -26.1
Ramsgreave & Wilpshire 111,744 96,832 113,542 96,980 94,584 111,452 -15.4
Lytham 87,662 90,896 98,234 81,840 79,852 111,144 -8.9
Burnley Central 145,328 128,614 125,778 120,326 91,204 102,278 -37.2
Bamber Bridge 83,172 86,178 89,676 88,718 68,764 87,266 -17.3
Whalley (Lancashire) 78,184 71,782 83,182 78,720 76,684 86,134 -1.9
Colne 96,830 96,946 95,598 92,132 66,000 81,126 -31.8
Euxton Balshaw Lane 64,792 72,726 77,156 78,918 62,740 77,936 -3.2
Rose Grove 43,176 57,258 71,916 80,874 61,064 73,584 41.4
Silverdale 59,352 54,872 55,892 53,218 47,978 50,722 -19.2
Burscough Junction 39,226 38,396 46,854 43,406 34,936 47,908 -10.9
Croston 45,228 46,322 47,870 48,582 35,598 47,318 -21.3
Langho 46,058 35,734 43,996 37,526 37,850 45,706 -17.8
Rishton 53,850 50,796 52,226 51,014 40,458 45,082 -24.9
Ansdell & Fairhaven 36,794 38,794 40,528 32,482 32,240 42,386 -12.4
Lostock Hall 41,442 41,510 39,788 44,550 31,138 38,602 -24.9
Church & Oswaldtwistle 41,812 40,426 39,486 39,064 28,738 37,920 -31.3
Brierfield 31,548 31,504 33,350 31,350 25,504 37,688 -19.2
Upholland 27,956 26,648 30,974 28,486 31,650 32,250 13.2
Burnley Barracks 25,834 24,572 20,080 22,130 18,028 26,008 -30.2
Huncoat 23,058 22,870 25,008 22,380 18,878 24,918 -18.1
Squires Gate 21,524 19,884 19,972 16,704 18,054 23,964 -16.1
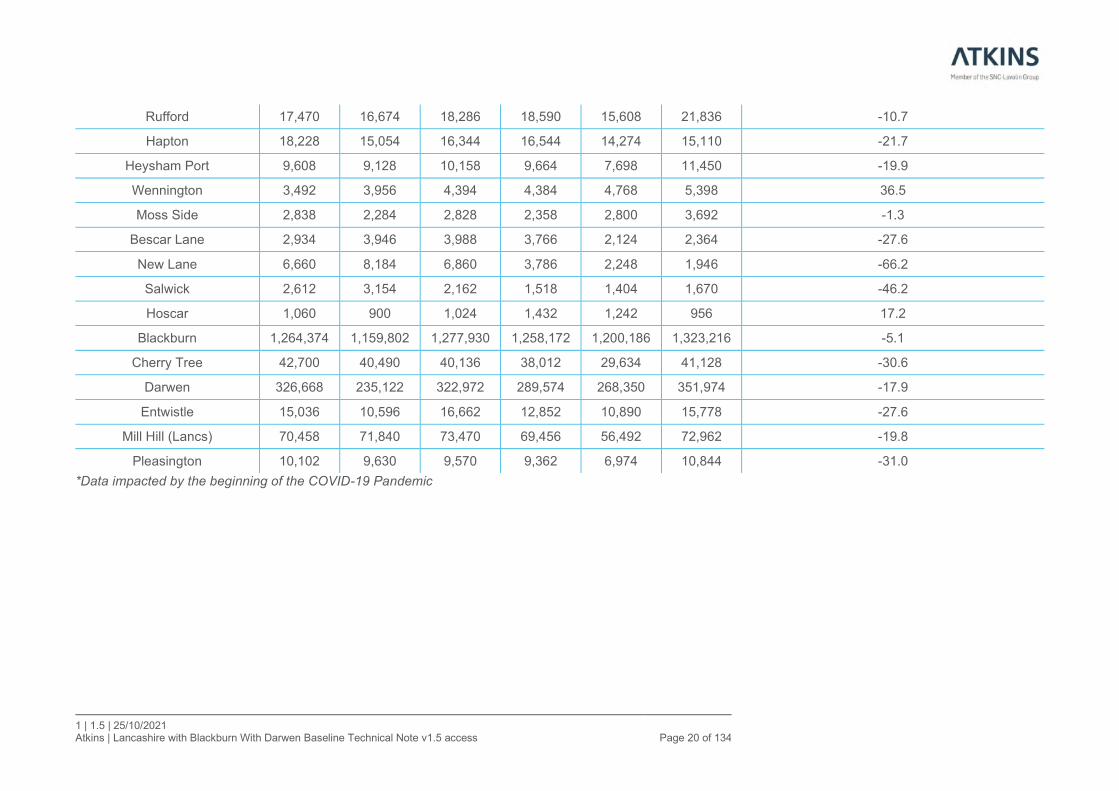
1 | 1.5 | 25/10/2021 Atkins | Lancashire with Blackburn With Darwen Baseline Technical Note v1.5 access Page 20 of 134
*Data impacted by the beginning of the COVID-19 Pandemic
Rufford 17,470 16,674 18,286 18,590 15,608 21,836 -10.7
Hapton 18,228 15,054 16,344 16,544 14,274 15,110 -21.7
Heysham Port 9,608 9,128 10,158 9,664 7,698 11,450 -19.9
Wennington 3,492 3,956 4,394 4,384 4,768 5,398 36.5
Moss Side 2,838 2,284 2,828 2,358 2,800 3,692 -1.3
Bescar Lane 2,934 3,946 3,988 3,766 2,124 2,364 -27.6
New Lane 6,660 8,184 6,860 3,786 2,248 1,946 -66.2
Salwick 2,612 3,154 2,162 1,518 1,404 1,670 -46.2
Hoscar 1,060 900 1,024 1,432 1,242 956 17.2
Blackburn 1,264,374 1,159,802 1,277,930 1,258,172 1,200,186 1,323,216 -5.1
Cherry Tree 42,700 40,490 40,136 38,012 29,634 41,128 -30.6
Darwen 326,668 235,122 322,972 289,574 268,350 351,974 -17.9
Entwistle 15,036 10,596 16,662 12,852 10,890 15,778 -27.6
Mill Hill (Lancs) 70,458 71,840 73,470 69,456 56,492 72,962 -19.8
Pleasington 10,102 9,630 9,570 9,362 6,974 10,844 -31.0
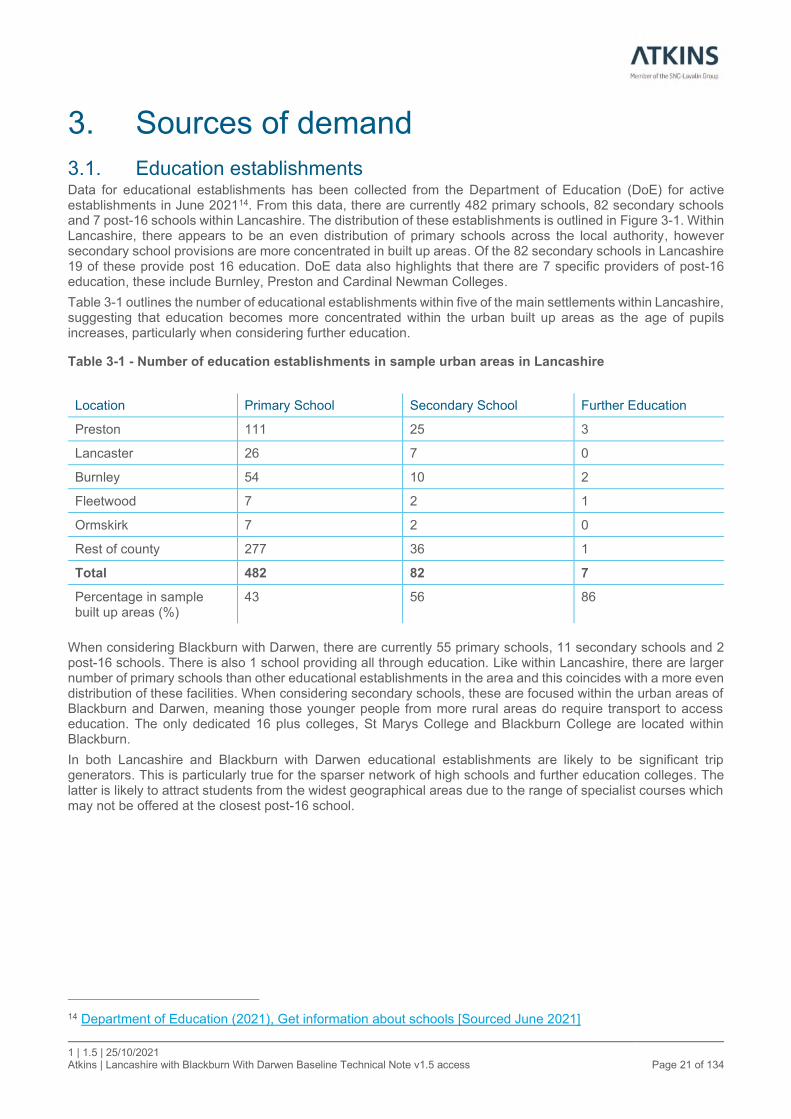
1 | 1.5 | 25/10/2021 Atkins | Lancashire with Blackburn With Darwen Baseline Technical Note v1.5 access Page 21 of 134
3. Sources of demand
3.1. Education establishments Data for educational establishments has been collected from the Department of Education (DoE) for active establishments in June 202114. From this data, there are currently 482 primary schools, 82 secondary schools and 7 post-16 schools within Lancashire. The distribution of these establishments is outlined in Figure 3-1. Within Lancashire, there appears to be an even distribution of primary schools across the local authority, however secondary school provisions are more concentrated in built up areas. Of the 82 secondary schools in Lancashire 19 of these provide post 16 education. DoE data also highlights that there are 7 specific providers of post-16 education, these include Burnley, Preston and Cardinal Newman Colleges.
Table 3-1 outlines the number of educational establishments within five of the main settlements within Lancashire, suggesting that education becomes more concentrated within the urban built up areas as the age of pupils increases, particularly when considering further education.
Table 3-1 - Number of education establishments in sample urban areas in Lancashire
Location Primary School Secondary School Further Education
Preston 111 25 3
Lancaster 26 7 0
Burnley 54 10 2
Fleetwood 7 2 1
Ormskirk 7 2 0
Rest of county 277 36 1
Total 482 82 7
Percentage in sample built up areas (%)
43 56 86
When considering Blackburn with Darwen, there are currently 55 primary schools, 11 secondary schools and 2 post-16 schools. There is also 1 school providing all through education. Like within Lancashire, there are larger number of primary schools than other educational establishments in the area and this coincides with a more even distribution of these facilities. When considering secondary schools, these are focused within the urban areas of Blackburn and Darwen, meaning those younger people from more rural areas do require transport to access education. The only dedicated 16 plus colleges, St Marys College and Blackburn College are located within Blackburn.
In both Lancashire and Blackburn with Darwen educational establishments are likely to be significant trip generators. This is particularly true for the sparser network of high schools and further education colleges. The latter is likely to attract students from the widest geographical areas due to the range of specialist courses which may not be offered at the closest post-16 school.
14 Department of Education (2021), Get information about schools [Sourced June 2021]
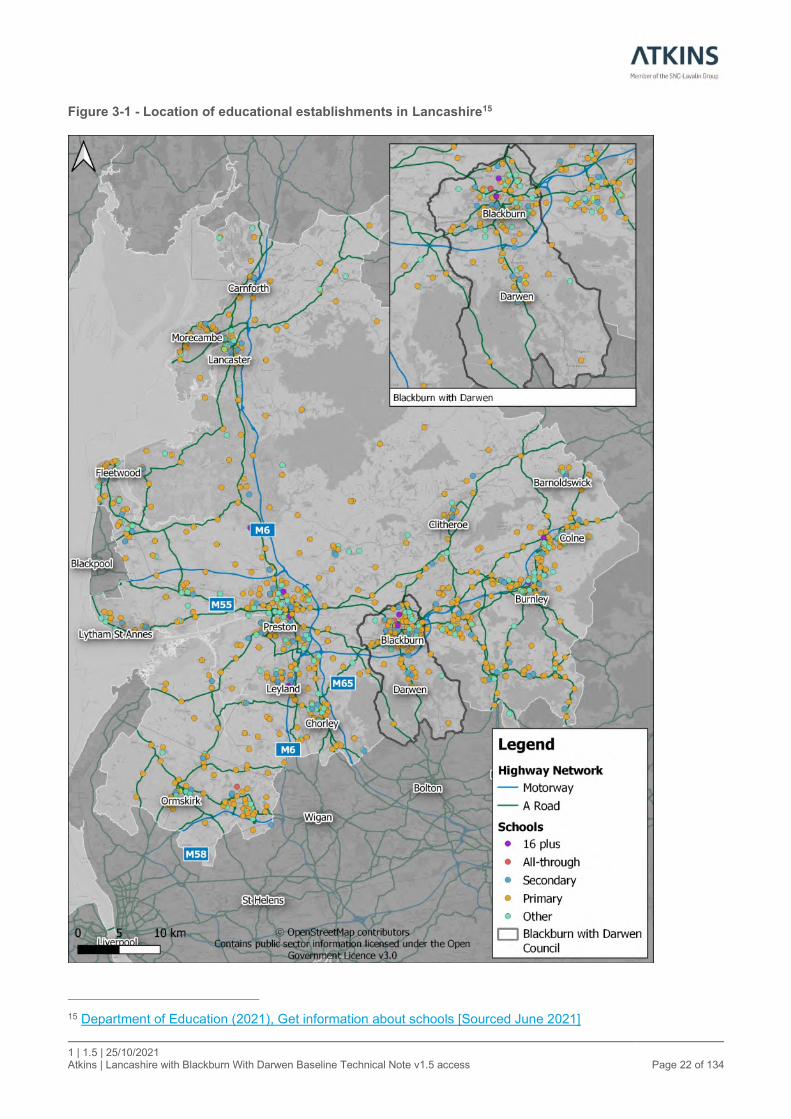
1 | 1.5 | 25/10/2021 Atkins | Lancashire with Blackburn With Darwen Baseline Technical Note v1.5 access Page 22 of 134
Figure 3-1 - Location of educational establishments in Lancashire15
15 Department of Education (2021), Get information about schools [Sourced June 2021]

1 | 1.5 | 25/10/2021 Atkins | Lancashire with Blackburn With Darwen Baseline Technical Note v1.5 access Page 23 of 134
3.1.1. Trip generation by student location To highlight areas where it would be expected a large number of trips for educational purposes would be generated, 2019 mid-year population estimates have been used to display LSOAs with the highest proportion of young people (under 16s)16.
Figure 3-2 outlines that the highest proportion of children in Lancashire are found within Burnley, Accrington, Leyland and to the east of Preston. There are also smaller areas of high proportions of children to the west of Clitheroe and in Haslingden. The lowest proportions of children are seen in areas such as Lytham St Annes, Ormskirk, central Preston and within Lancaster.
Within Blackburn with Darwen, the highest proportions of young people are seen within the north and east of the town, whereas the lowest proportions of children are seen in the more rural LSOAs. Generally speaking, the highest densities of young people are found within the more urban areas of the authority, particularly in the north.
The dispersed patterns of children across both authorities without any significant clustering within rural areas highlights the difficult nature in providing effective public transport across such a wide area.
16 ONS (2020), Lower layer Super Output Area population estimates

1 | 1.5 | 25/10/2021 Atkins | Lancashire with Blackburn With Darwen Baseline Technical Note v1.5 access Page 24 of 134
Figure 3-2 - Proportion of children within LSOAs in Lancashire17
17 ONS (2020), Lower layer Super Output Area population estimates
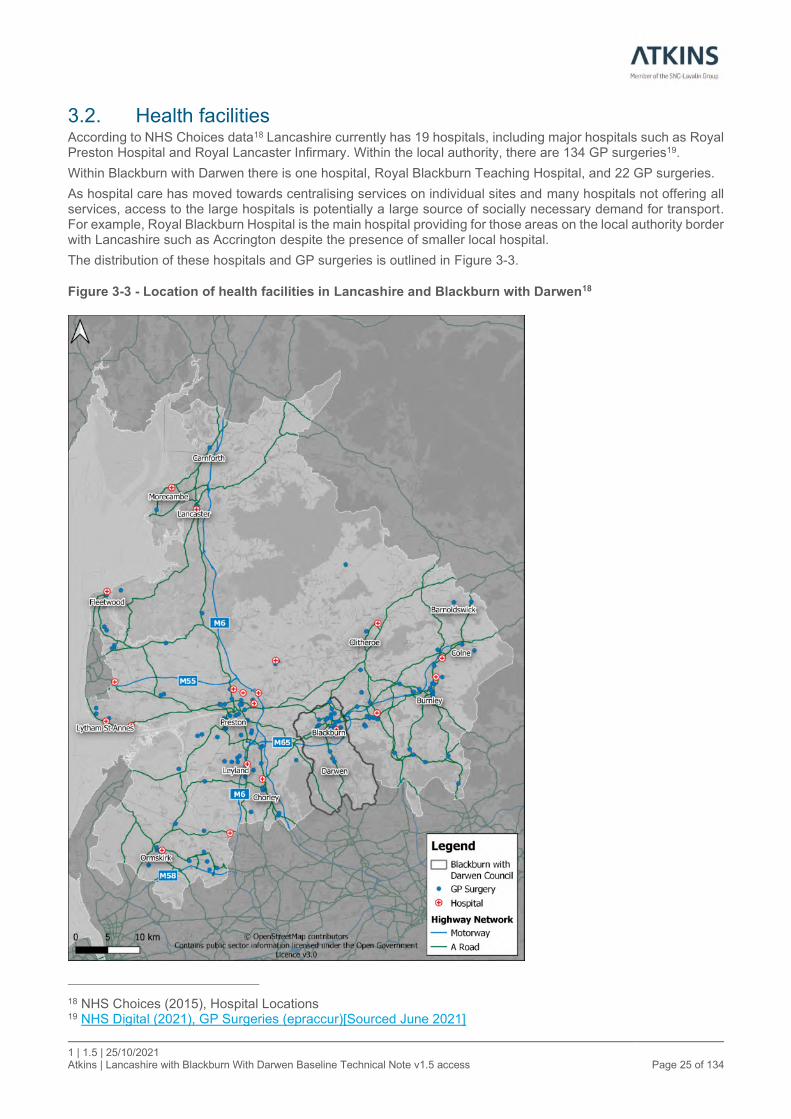
1 | 1.5 | 25/10/2021 Atkins | Lancashire with Blackburn With Darwen Baseline Technical Note v1.5 access Page 25 of 134
3.2. Health facilities According to NHS Choices data18 Lancashire currently has 19 hospitals, including major hospitals such as Royal Preston Hospital and Royal Lancaster Infirmary. Within the local authority, there are 134 GP surgeries19.
Within Blackburn with Darwen there is one hospital, Royal Blackburn Teaching Hospital, and 22 GP surgeries.
As hospital care has moved towards centralising services on individual sites and many hospitals not offering all services, access to the large hospitals is potentially a large source of socially necessary demand for transport. For example, Royal Blackburn Hospital is the main hospital providing for those areas on the local authority border with Lancashire such as Accrington despite the presence of smaller local hospital.
The distribution of these hospitals and GP surgeries is outlined in Figure 3-3.
Figure 3-3 - Location of health facilities in Lancashire and Blackburn with Darwen18
18 NHS Choices (2015), Hospital Locations 19 NHS Digital (2021), GP Surgeries (epraccur)[Sourced June 2021]
1 | 1.5 | 25/10/2021 Atkins | Lancashire with Blackburn With Darwen Baseline Technical Note v1.5 access Page 26 of 134
3.3. Major employment centres As a proxy for major employment centres, job density within LSOAs has been utilised to highlight areas of high concentrations of employment. This has been derived from the Business Register and Employment Survey 20192021 divided by the area of the respective LSOA.
Within Lancashire the employment density is generally low across the county, which is as expected across the rural areas of the county. The highest level of employment density is seen within central Preston and Lancaster, both of which appear to be a result of retail jobs in the centre of the cities alongside the White Cross Business Park in Lancaster.
Across Lancashire, mid-level employment densities are seen in most of the urban cores, again representing the retail opportunities within the given towns. In some areas beyond the centre of the individual towns, mid-level employment densities are also observed, this is often a result of trading estates or business parks as is the case to the south of Preston where Lancashire Business Park is located. These out-of-town employment centres pose a significant opportunity to capture bus patronage.
When considering Blackburn with Darwen the highest employment density is seen within central and eastern Blackburn alongside in central Darwen and the Ewood area, beyond these areas’ employment density is low. Within the centre of Blackburn and Darwen these jobs are likely to reflect retail and leisure opportunities within the town centres. The mid-level employment density seen to the south east of Blackburn is likely a reflection of the location of The Royal Blackburn Hospital as well as Shadsworth Industrial Estate, both of which are likely to be large trip generators. Furthering this, the LSOA in the Ewood area with mid-level employment density appears to reflect the location of Blackburn Rovers football stadium alongside a number of retail sites in proximity to the stadium.
20 ONS (2020), Employees in the UK: 2019
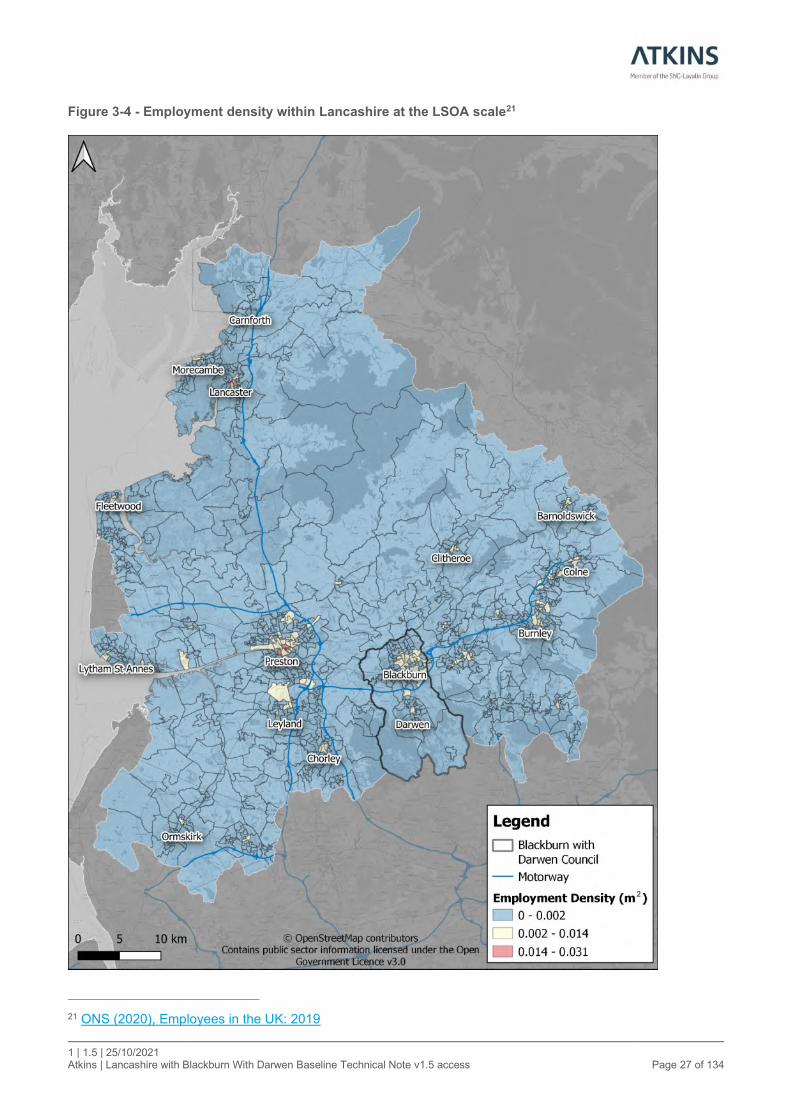
1 | 1.5 | 25/10/2021 Atkins | Lancashire with Blackburn With Darwen Baseline Technical Note v1.5 access Page 27 of 134
Figure 3-4 - Employment density within Lancashire at the LSOA scale21
21 ONS (2020), Employees in the UK: 2019
2

1 | 1.5 | 25/10/2021 Atkins | Lancashire with Blackburn With Darwen Baseline Technical Note v1.5 access Page 28 of 134
3.4. Origin destination for journeys to work Census data has been used to gain an insight into the origins and destinations of workers both arriving in and leaving key settlements for work and MSOA level for all modes of transport and bus and coach only22. For this analysis, Preston, Lancashire, Burnley and Fleetwood have been reviewed.
It must be noted that this data is based on travel behaviours elicited before the COVID-19 Pandemic. It is too early to understand the full impact of the pandemic upon travel behaviours and to which extent the past trends will re-emerge and be reshaped.
22 ONS (2014), Location of usual residence and place of work by method of travel to work (MSOA level) (Table WU03EW)

1 | 1.5 | 25/10/2021 Atkins | Lancashire with Blackburn With Darwen Baseline Technical Note v1.5 access Page 29 of 134
3.4.1. Journeys to work in Preston There are 13,737 workers identified to be working outside of Preston, with the distribution of the LSOAs they travel to highlighted in Figure 3-5. The figure suggests that the MSOAs with the highest concentrations of people traveling from Preston are generally to the north of the city along the M6 corridor, as well as to the west near Lytham St Annes. Of all workers leaving the city, 2,326 travel to MSOAs which border the city. There are also a large number of workers (1,367) travelling to the south of the city into an MSOA which includes a large area of industrial sites.
Figure 3-5 - Workers leaving Preston (all modes)
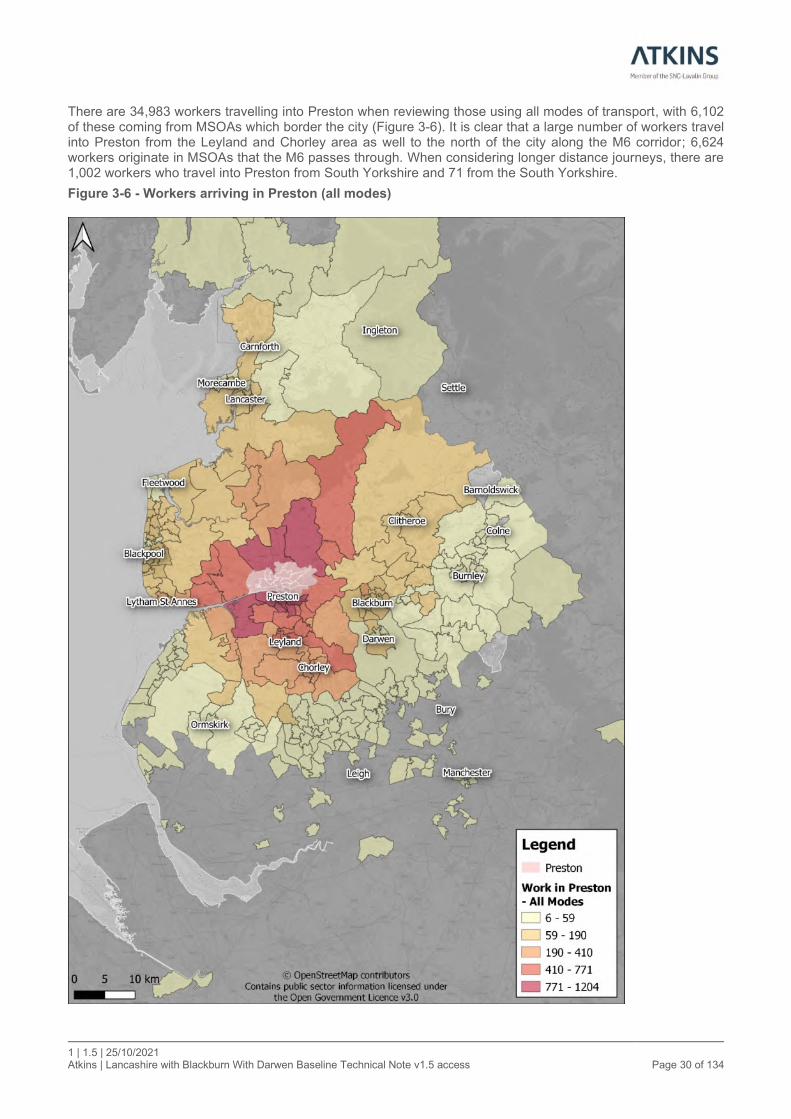
1 | 1.5 | 25/10/2021 Atkins | Lancashire with Blackburn With Darwen Baseline Technical Note v1.5 access Page 30 of 134
There are 34,983 workers travelling into Preston when reviewing those using all modes of transport, with 6,102 of these coming from MSOAs which border the city (Figure 3-6). It is clear that a large number of workers travel into Preston from the Leyland and Chorley area as well to the north of the city along the M6 corridor; 6,624 workers originate in MSOAs that the M6 passes through. When considering longer distance journeys, there are 1,002 workers who travel into Preston from South Yorkshire and 71 from the South Yorkshire.
Figure 3-6 - Workers arriving in Preston (all modes)
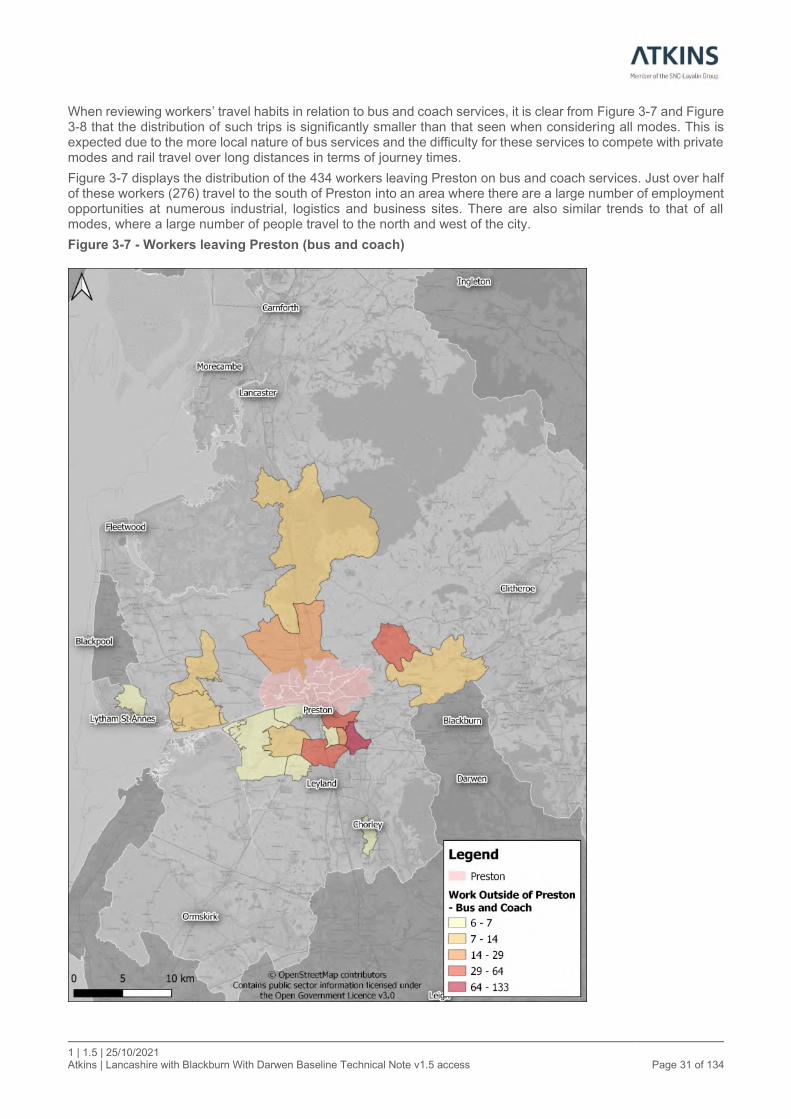
1 | 1.5 | 25/10/2021 Atkins | Lancashire with Blackburn With Darwen Baseline Technical Note v1.5 access Page 31 of 134
When reviewing workers’ travel habits in relation to bus and coach services, it is clear from Figure 3-7 and Figure 3-8 that the distribution of such trips is significantly smaller than that seen when considering all modes. This is expected due to the more local nature of bus services and the difficulty for these services to compete with private modes and rail travel over long distances in terms of journey times.
Figure 3-7 displays the distribution of the 434 workers leaving Preston on bus and coach services. Just over half of these workers (276) travel to the south of Preston into an area where there are a large number of employment opportunities at numerous industrial, logistics and business sites. There are also similar trends to that of all modes, where a large number of people travel to the north and west of the city.
Figure 3-7 - Workers leaving Preston (bus and coach)
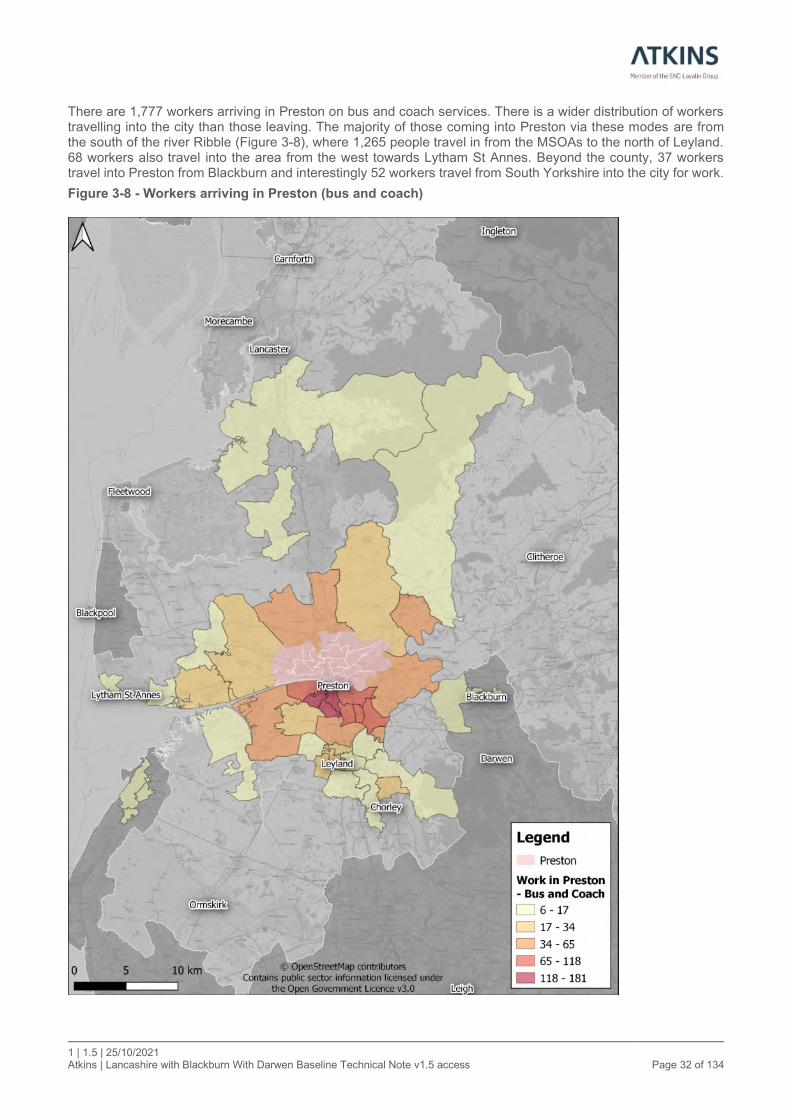
1 | 1.5 | 25/10/2021 Atkins | Lancashire with Blackburn With Darwen Baseline Technical Note v1.5 access Page 32 of 134
There are 1,777 workers arriving in Preston on bus and coach services. There is a wider distribution of workers travelling into the city than those leaving. The majority of those coming into Preston via these modes are from the south of the river Ribble (Figure 3-8), where 1,265 people travel in from the MSOAs to the north of Leyland. 68 workers also travel into the area from the west towards Lytham St Annes. Beyond the county, 37 workers travel into Preston from Blackburn and interestingly 52 workers travel from South Yorkshire into the city for work.
Figure 3-8 - Workers arriving in Preston (bus and coach)

1 | 1.5 | 25/10/2021 Atkins | Lancashire with Blackburn With Darwen Baseline Technical Note v1.5 access Page 33 of 134
3.4.2. Journeys to work in Burnley Figure 3-9 displays those who travel to work outside of Burnley when considering all modes of transport, with 11,203 workers commuting out of the town for work. Most journeys outside of Burnley travel to nearby MSOAs towards Colne and Accrington, however there are also a large number of workers who travel both to Blackburn (1,695), Darwen (129) and Preston (257). There are some longer distance commutes out of the town to Bury (33), Manchester (111), as well as to Sowerby Bridge (6).
Figure 3-9 - Workers leaving Burnley (all modes)

1 | 1.5 | 25/10/2021 Atkins | Lancashire with Blackburn With Darwen Baseline Technical Note v1.5 access Page 34 of 134
When considering those arriving in Burnley using all modes of transport (Figure 3-10), there are 11,365 workers travelling into the town. There is a similar picture in terms of distribution when compared to those out commuting, however there are some notable differences, such as a larger number of people travelling into the town from the adjacent MSOAs beyond Colne. This is expected due to the lower levels of jobs available in these more rural MSOAs. Furthering this, there are more journeys from North Yorkshire and the wider area beyond the city of Preston including areas such as Chorley and Leyland, with 132 workers travelling from south west Lancashire.
Figure 3-10 - Workers arriving in Burnley (all modes)

1 | 1.5 | 25/10/2021 Atkins | Lancashire with Blackburn With Darwen Baseline Technical Note v1.5 access Page 35 of 134
Figure 3-11 displays the distribution of those travelling out of Burnley using bus and coach services to MSOAs outside of the town, with 576 people travelling into the town. Again, there are limited examples of MSOAs where there are significant flows of people travelling out of Burnley, with most commuters travelling to MSOAs towards Colne and Accrington. There is also a large number of people travelling to Blackburn (192), which is likely supported by the strong bus connectivity offered by the number 152 bus.
Figure 3-11 - Workers leaving Burnley (bus and coach)
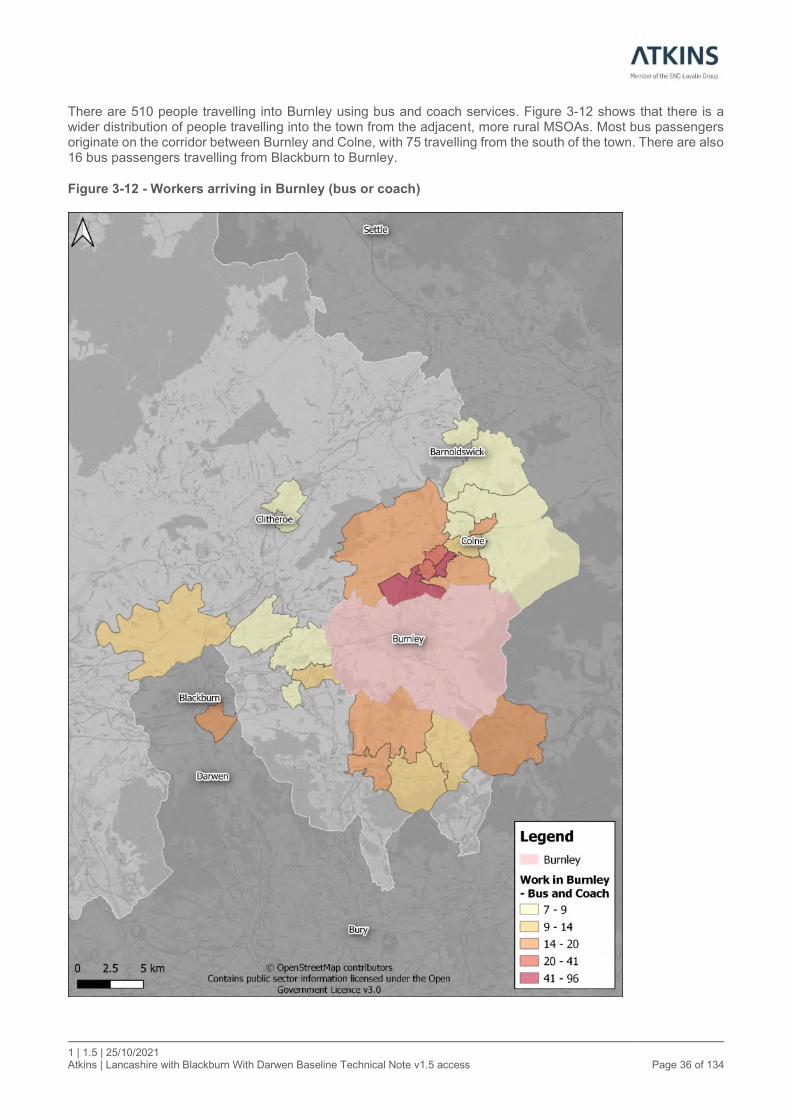
1 | 1.5 | 25/10/2021 Atkins | Lancashire with Blackburn With Darwen Baseline Technical Note v1.5 access Page 36 of 134
There are 510 people travelling into Burnley using bus and coach services. Figure 3-12 shows that there is a wider distribution of people travelling into the town from the adjacent, more rural MSOAs. Most bus passengers originate on the corridor between Burnley and Colne, with 75 travelling from the south of the town. There are also 16 bus passengers travelling from Blackburn to Burnley.
Figure 3-12 - Workers arriving in Burnley (bus or coach)
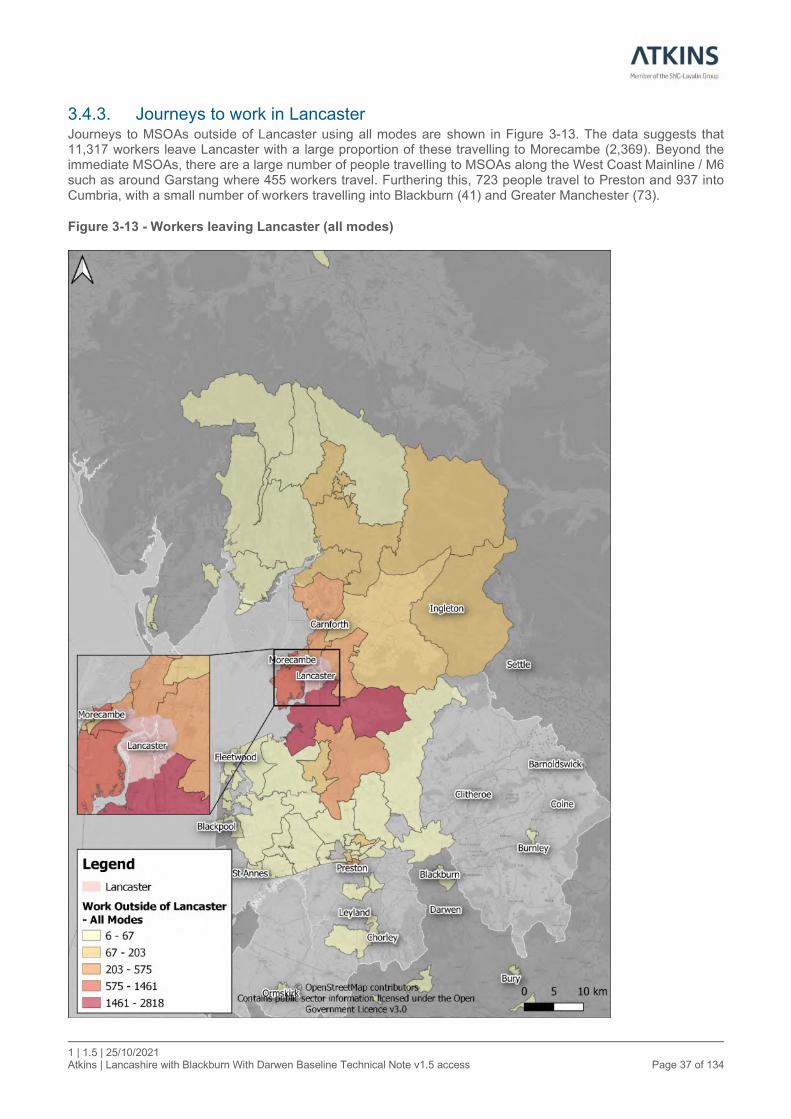
1 | 1.5 | 25/10/2021 Atkins | Lancashire with Blackburn With Darwen Baseline Technical Note v1.5 access Page 37 of 134
3.4.3. Journeys to work in Lancaster Journeys to MSOAs outside of Lancaster using all modes are shown in Figure 3-13. The data suggests that 11,317 workers leave Lancaster with a large proportion of these travelling to Morecambe (2,369). Beyond the immediate MSOAs, there are a large number of people travelling to MSOAs along the West Coast Mainline / M6 such as around Garstang where 455 workers travel. Furthering this, 723 people travel to Preston and 937 into Cumbria, with a small number of workers travelling into Blackburn (41) and Greater Manchester (73).
Figure 3-13 - Workers leaving Lancaster (all modes)
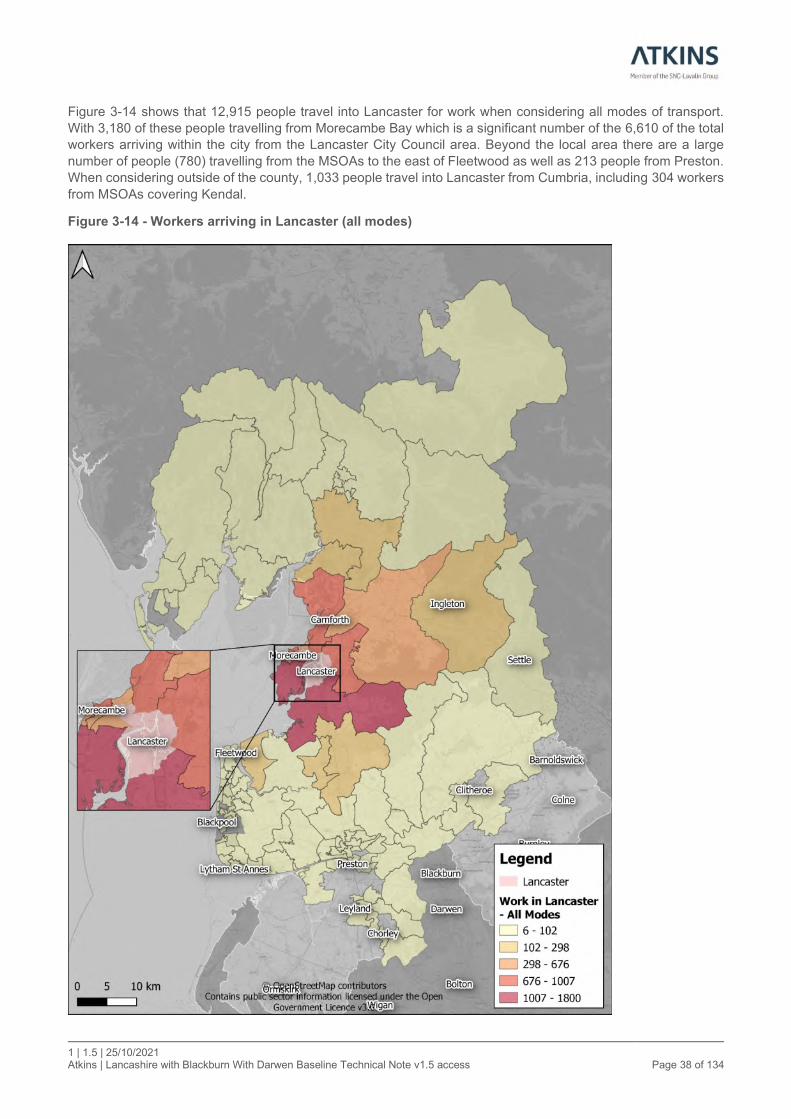
1 | 1.5 | 25/10/2021 Atkins | Lancashire with Blackburn With Darwen Baseline Technical Note v1.5 access Page 38 of 134
Figure 3-14 shows that 12,915 people travel into Lancaster for work when considering all modes of transport.
With 3,180 of these people travelling from Morecambe Bay which is a significant number of the 6,610 of the total
workers arriving within the city from the Lancaster City Council area. Beyond the local area there are a large
number of people (780) travelling from the MSOAs to the east of Fleetwood as well as 213 people from Preston.
When considering outside of the county, 1,033 people travel into Lancaster from Cumbria, including 304 workers
from MSOAs covering Kendal.
Figure 3-14 - Workers arriving in Lancaster (all modes)
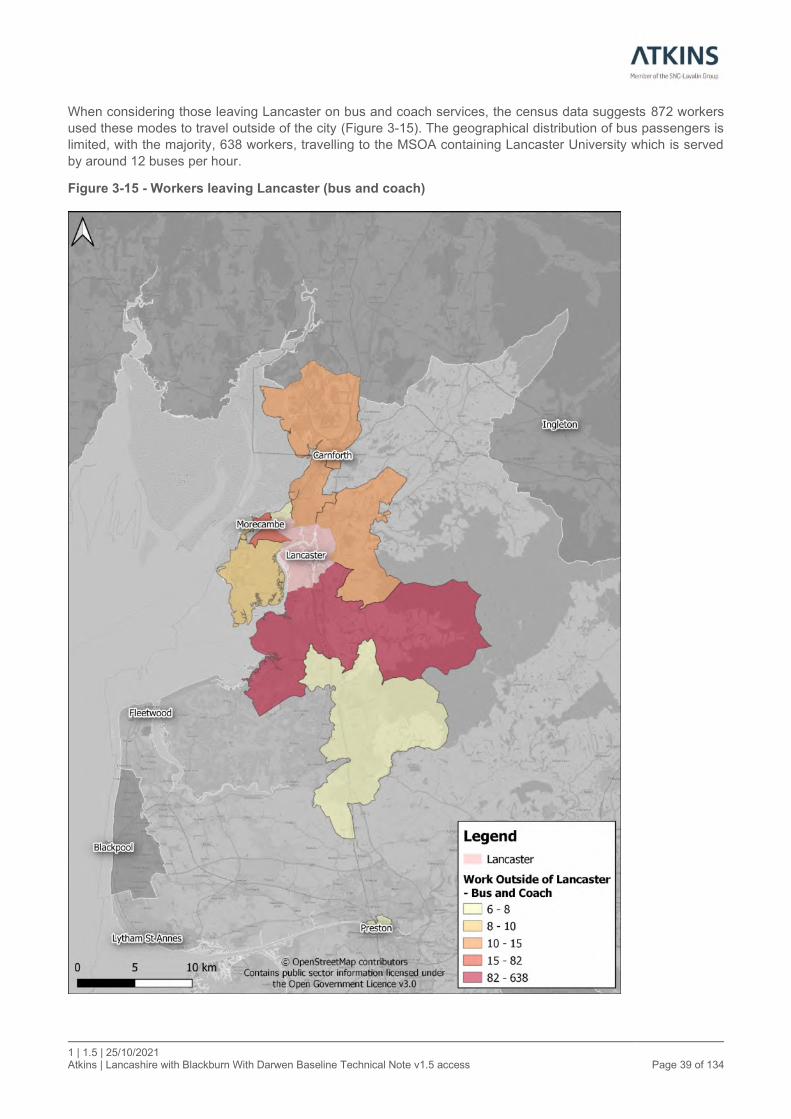
1 | 1.5 | 25/10/2021 Atkins | Lancashire with Blackburn With Darwen Baseline Technical Note v1.5 access Page 39 of 134
When considering those leaving Lancaster on bus and coach services, the census data suggests 872 workers
used these modes to travel outside of the city (Figure 3-15). The geographical distribution of bus passengers is
limited, with the majority, 638 workers, travelling to the MSOA containing Lancaster University which is served
by around 12 buses per hour.
Figure 3-15 - Workers leaving Lancaster (bus and coach)
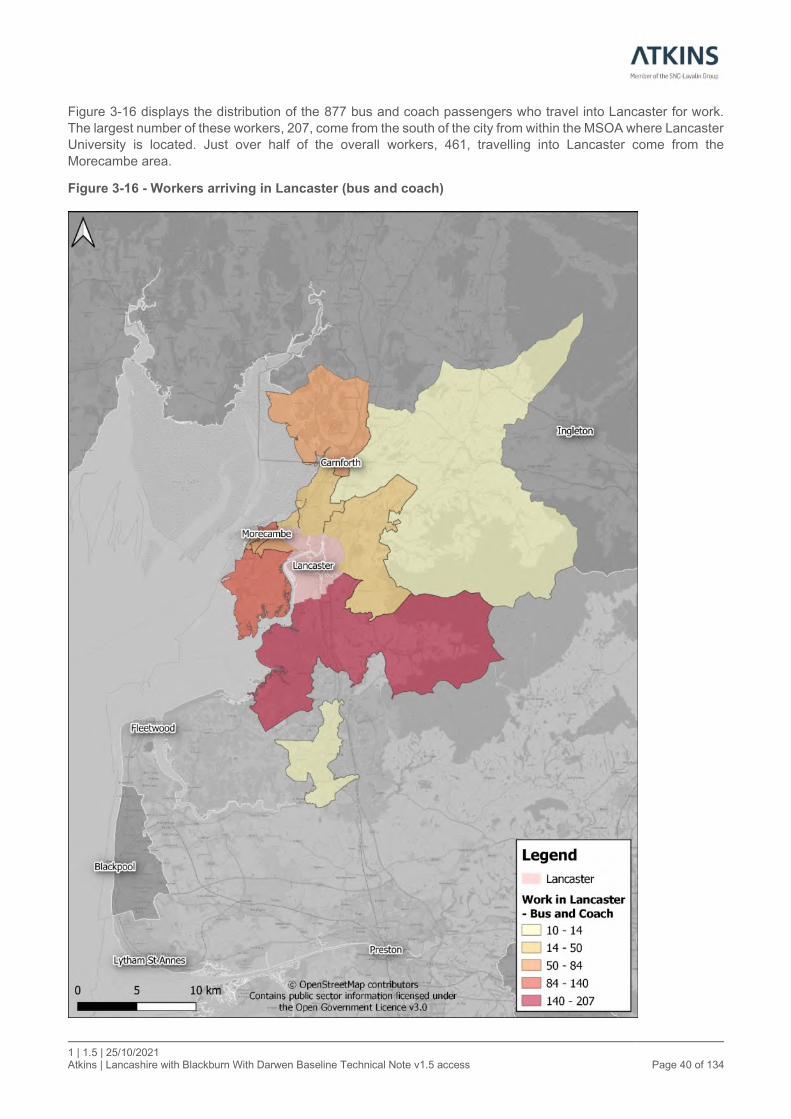
1 | 1.5 | 25/10/2021 Atkins | Lancashire with Blackburn With Darwen Baseline Technical Note v1.5 access Page 40 of 134
Figure 3-16 displays the distribution of the 877 bus and coach passengers who travel into Lancaster for work.
The largest number of these workers, 207, come from the south of the city from within the MSOA where Lancaster
University is located. Just over half of the overall workers, 461, travelling into Lancaster come from the
Morecambe area.
Figure 3-16 - Workers arriving in Lancaster (bus and coach)
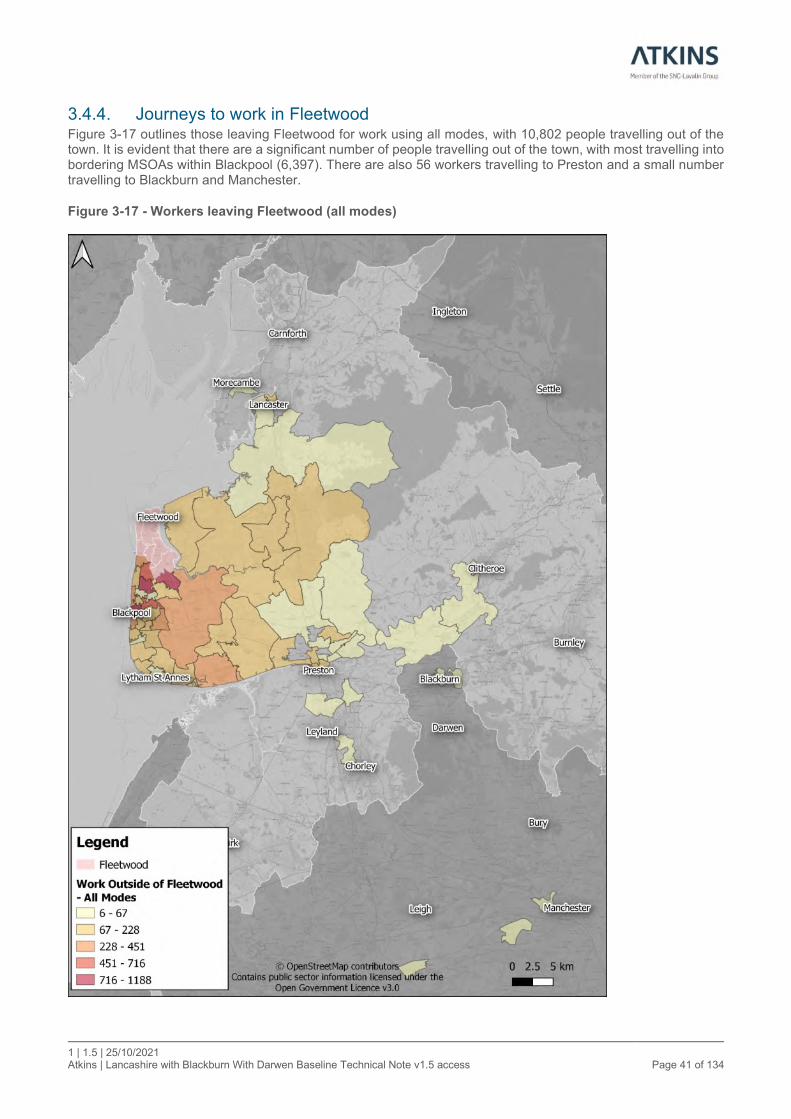
1 | 1.5 | 25/10/2021 Atkins | Lancashire with Blackburn With Darwen Baseline Technical Note v1.5 access Page 41 of 134
3.4.4. Journeys to work in Fleetwood Figure 3-17 outlines those leaving Fleetwood for work using all modes, with 10,802 people travelling out of the town. It is evident that there are a significant number of people travelling out of the town, with most travelling into bordering MSOAs within Blackpool (6,397). There are also 56 workers travelling to Preston and a small number travelling to Blackburn and Manchester.
Figure 3-17 - Workers leaving Fleetwood (all modes)
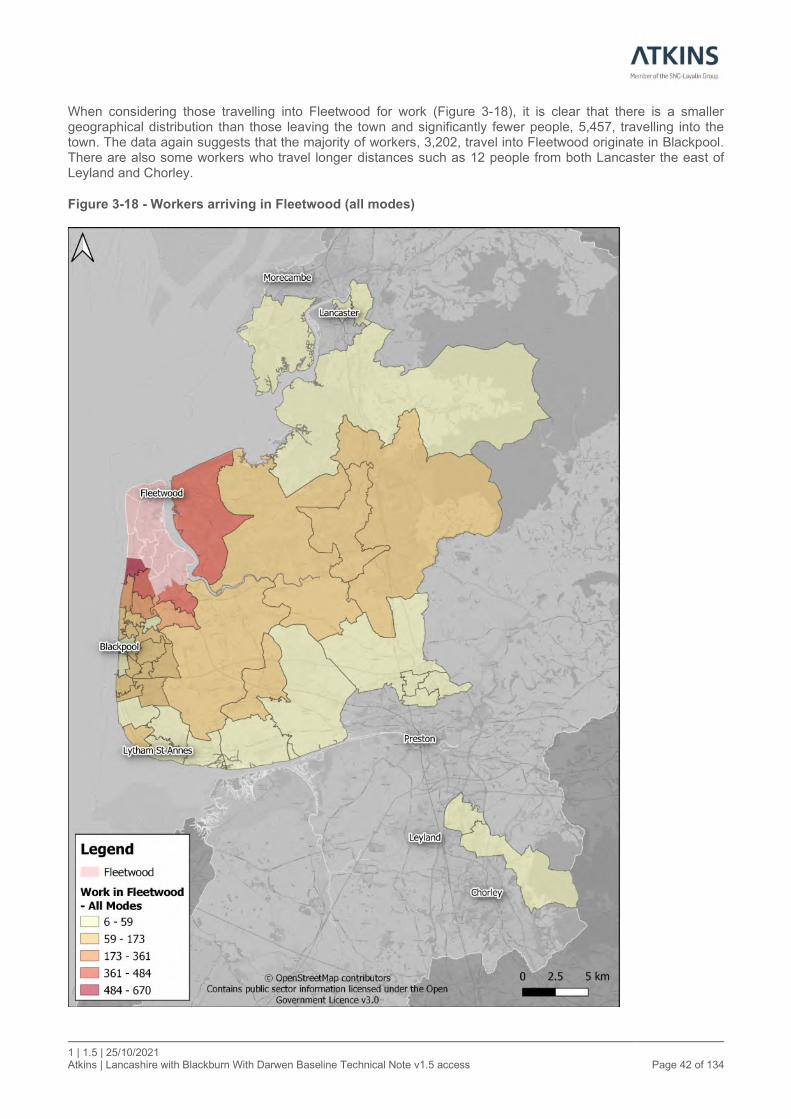
1 | 1.5 | 25/10/2021 Atkins | Lancashire with Blackburn With Darwen Baseline Technical Note v1.5 access Page 42 of 134
When considering those travelling into Fleetwood for work (Figure 3-18), it is clear that there is a smaller geographical distribution than those leaving the town and significantly fewer people, 5,457, travelling into the town. The data again suggests that the majority of workers, 3,202, travel into Fleetwood originate in Blackpool. There are also some workers who travel longer distances such as 12 people from both Lancaster the east of Leyland and Chorley.
Figure 3-18 - Workers arriving in Fleetwood (all modes)

1 | 1.5 | 25/10/2021 Atkins | Lancashire with Blackburn With Darwen Baseline Technical Note v1.5 access Page 43 of 134
The distribution of bus and coach passengers leaving Fleetwood is outlined in Figure 3-19, with 130 workers
travelling into the town. This highlights a limited geographical distribution of bus passengers from the town, with
almost all who leave travelling into Blackpool.
Figure 3-19 - Workers leaving Fleetwood (bus and coach)

1 | 1.5 | 25/10/2021 Atkins | Lancashire with Blackburn With Darwen Baseline Technical Note v1.5 access Page 44 of 134
Figure 3-20 shows those travelling into Fleetwood for work using bus or coaches. According to the census data 481 people travel into the area with this demand originating in MSOAs adjacent to the town and mostly within Blackpool.
Figure 3-20 - Workers arriving in Fleetwood (bus and coach)
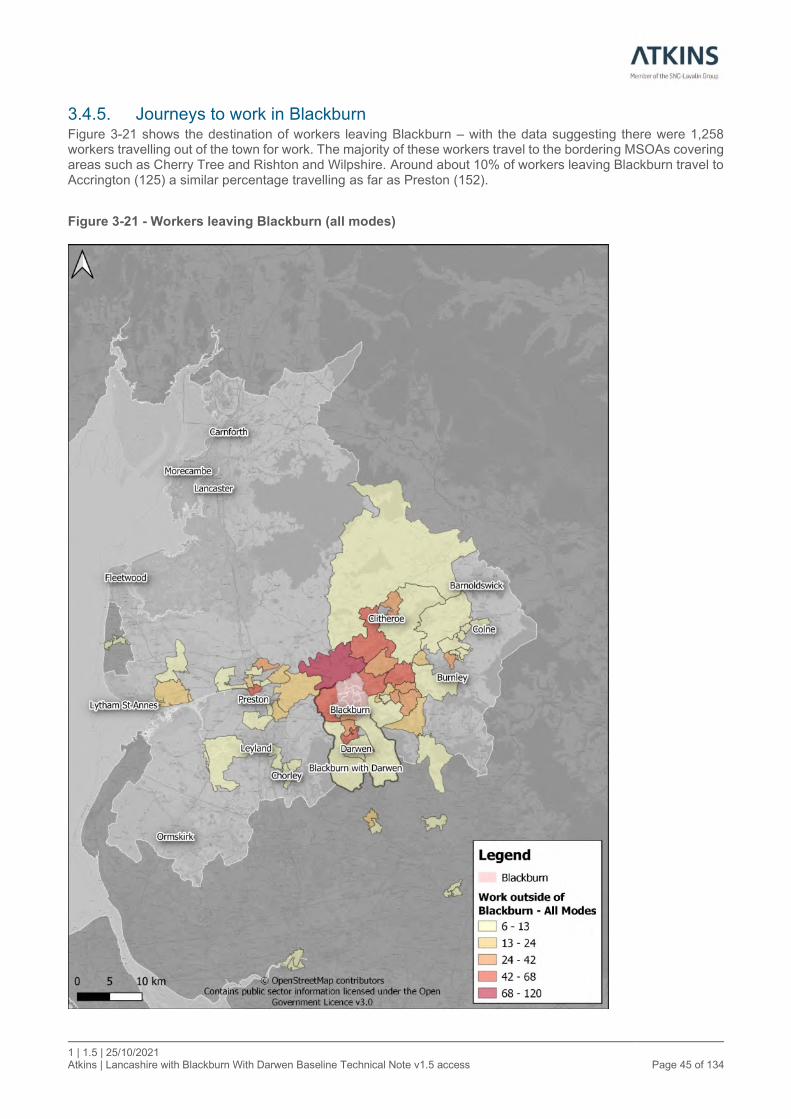
1 | 1.5 | 25/10/2021 Atkins | Lancashire with Blackburn With Darwen Baseline Technical Note v1.5 access Page 45 of 134
3.4.5. Journeys to work in Blackburn Figure 3-21 shows the destination of workers leaving Blackburn – with the data suggesting there were 1,258 workers travelling out of the town for work. The majority of these workers travel to the bordering MSOAs covering areas such as Cherry Tree and Rishton and Wilpshire. Around about 10% of workers leaving Blackburn travel to Accrington (125) a similar percentage travelling as far as Preston (152).
Figure 3-21 - Workers leaving Blackburn (all modes)

1 | 1.5 | 25/10/2021 Atkins | Lancashire with Blackburn With Darwen Baseline Technical Note v1.5 access Page 46 of 134
When considering those travelling outside of Blackburn for work using bus and coach services, a figure is not provided due to the limited number of people travelling - only 17 people travelled out of Blackburn, all of these travelling into central Darwin.
Figure 3-22 shows the distribution of origins for the 4,244 workers travelling into Blackburn using all modes of transport. When comparing with those leaving the town, it is evident that Blackburn has a net influx of workers by 2,986. A large proportion of those travelling to the town originate from the adjacent MSOAs (1,341) however there are also other flows such as 288 workers travelling from Accrington, 378 from Burnley and 117 from Preston.
Figure 3-22 - Workers Arriving in Blackburn (All modes)

1 | 1.5 | 25/10/2021 Atkins | Lancashire with Blackburn With Darwen Baseline Technical Note v1.5 access Page 47 of 134
When considering those workers using bus and coach services to access Blackburn for work (Figure 3-23), it is clear that only a small proportion of the travelling into the area use the bus service and their geographical distribution is limited when compared to Figure 3-22. There are 221 workers travelling into Blackburn using the bus service, with 118 of these coming from Burnley. Of those travelling into Blackburn on the bus 73% travel into the authority area from Lancashire.
Figure 3-23 - Workers Arriving in Blackburn (Bus and coach)

1 | 1.5 | 25/10/2021 Atkins | Lancashire with Blackburn With Darwen Baseline Technical Note v1.5 access Page 48 of 134
3.4.6. Summary of origin destination data This section has outlined the origin destination data at the MSOA level for some of the key settlements within
Lancashire and Blackburn within Blackburn with Darwen. From the previous discussion, it is clear that there are
complicated travel to work behaviour within Lancashire and Blackburn with Darwen, with the authorities generally
divided into more homogenous commuting areas of:
• North – Lancaster;
• South of Preston – Preston and Ormskirk;
• Fylde Coast – Fleetwood, Lytham St Annes and Blackpool; and
• East – Burnley, Accrington, Colne and Blackburn.
A large amount of commuting in and out of the cities and towns occurs within the broad areas that each of the
conurbations sits within, particularly when considering the bus services which tend to be more localised.
Lancaster and Preston, being the larger urban areas within the county tend to attract workers from more distant
areas, but also have significant levels of movement into MSOAs within close proximity to the given areas where
the bus currently has a very low modal share, perhaps highlighting an opportunity for modal shift to bus usage.
Across the five areas studied, the distribution of workers using bus services is limited and does not extend far
beyond each of the given areas. This is contrasted to all modes, which has significantly larger numbers of workers
travelling by private modes over greater distances. This is to be expected as bus and coach services are unlikely
to be competitive in terms of journey times against private modes and the rail network.
3.5. Work shift and end times requirements As part of improving bus services in Lancashire and Blackburn with Darwen, a possibility exists to work
collaboratively with employers to cater the bus services to meet the needs of their workers start and end times.
There is great potential to connect public transport provisions with working times, and to advertise this, as a way
of improving patronage. This is particularly true for shift workers, such as at hospitals or industrial estates where
working times may not match the typical peak periods where bus services are often at their most frequent.
Case Study
Within Blackburn with Darwen recent work on the Royal Blackburn Hospital Travel Plan (2017) highlights the
limited scope of bus services for those travelling to this large employment site. This research showed that 7%
of employees commute by bus, with the majority of workers travelling alone using private modes of transport
(81%). The same survey also states that 61% of people take less than 30 minutes to travel to work.
Analysis carried out using TRACC showed that only 48% of the Blackburn with Darwen population live within a
30-minute bus travel time of the Royal Blackburn Hospital. This low proportion of staff travelling by bus is likely
to be for a combination of reasons such as the frequency and journey time of services, and the lack of
interchange between bus and rail facilities.
This case study exemplifies an example where strengthening connectivity between areas of demand and the
opportunity could potentially encourage modal shift.
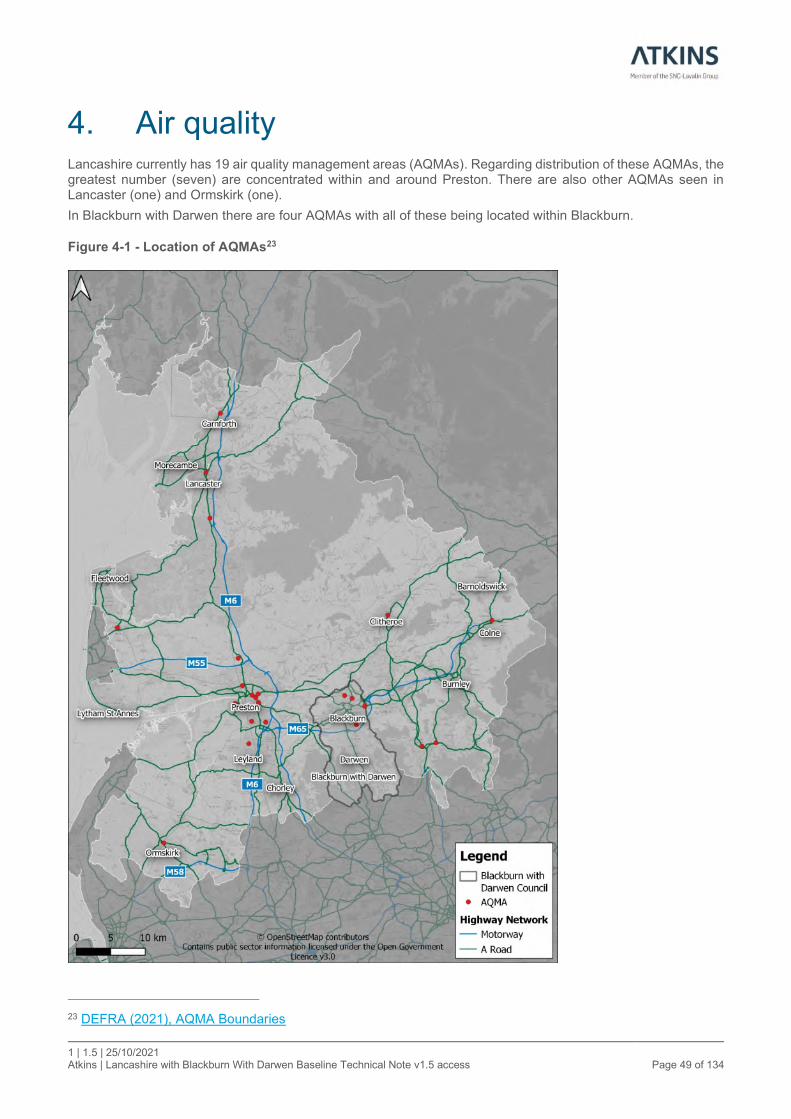
1 | 1.5 | 25/10/2021 Atkins | Lancashire with Blackburn With Darwen Baseline Technical Note v1.5 access Page 49 of 134
4. Air quality Lancashire currently has 19 air quality management areas (AQMAs). Regarding distribution of these AQMAs, the greatest number (seven) are concentrated within and around Preston. There are also other AQMAs seen in Lancaster (one) and Ormskirk (one).
In Blackburn with Darwen there are four AQMAs with all of these being located within Blackburn.
Figure 4-1 - Location of AQMAs23
23 DEFRA (2021), AQMA Boundaries

1 | 1.5 | 25/10/2021 Atkins | Lancashire with Blackburn With Darwen Baseline Technical Note v1.5 access Page 50 of 134
5. Current bus network
5.1. Bus routes and frequencies
5.1.1. January 2020 Network Figure 5-1 outlines the bus network in Lancashire and Blackburn with Darwen during the January 2020 timetable; this is the most recent timetable available which is not impacted by the COVID-19 Pandemic. When considering services with more than 1 bus per hour, Lancashire was served by 101 individual bus services. The bus network within the region is clearly centred around the major settlements of Lancashire, Preston and Burnley alongside numerous services from Blackpool which cross the county boundary. There is a distinct lack of frequent services to the north east of the county within the more sparsely populated areas.
Between the major conurbations within the county there are the following services:
• 152 – Burnley to Preston via Blackburn
• 940/40 – Lancaster to Preston
• 41 – Morecambe to Preston
• 2A – Ormskirk to Preston
As well as internal connectivity, the county also has frequent services other key destinations in the north west:
• X43 – Burnley to Manchester
• 61/68 – Preston to Blackpool
• X2 – Preston to Liverpool
• 300 – Liverpool to Southport via Ormskirk
• 310 - Liverpool to Skelmersdale via Orkskirk
• 555 – Lancaster to Keswick
• 59 – Blackburn to Preston
When considering Blackburn with Darwen there were 12 bus service which ran at least one bus per hour, with all of these radiating out of Blackburn. Of these routes 10 cross the boundary into Lancashire and 1 directly into Greater Manchester. These cross-boundary services indicate the requirement for joint up thinking when considering improvements to the bus service, particularly between Lancashire and Blackburn with Darwen Councils.
Frequent bus routes passing through Blackburn include:
• 1 – Blackburn to Bolton via Darwen
• 481 - Blackburn to Bury
• 152 - Burnley to Preston via Blackburn
• 59 - Blackburn to Preston
• 22 – Blackburn to Clitheroe
• 7 – Blackburn to Accrington

1 | 1.5 | 25/10/2021 Atkins | Lancashire with Blackburn With Darwen Baseline Technical Note v1.5 access Page 51 of 134
Figure 5-1 - January 2020 bus network (over 1bph)
1 | 1.5 | 25/10/2021 Atkins | Lancashire with Blackburn With Darwen Baseline Technical Note v1.5 access Page 52 of 134
Figure 5-2 displays the spatial distribution of bus operators within Lancashire and Blackburn with Darwen24. The analysis only considers operators which have at least one service per hour during the Monday morning peak.
Within Lancashire the analysis finds that there are 21 operators. From Figure 5-2 it appears that differing operators are prevalent depending on the part of the county being considered. In the north of the county into Preston, Stagecoach is the primary operator within the area. Although the services are operated by different sub businesses of Stagecoach, it is likely that from a passenger perspective there is limited difference between the operators. In addition to Stagecoach, Preston also has one other large operator, Preston Bus (Rotala) alongside numerous other operators who provide a limited number of services, such as Arriva North West and Blackpool Transport. To the east of the county within Burnley, the main operator is Burnley Bus Company (Transdev), however there are several services provided by other operators such as First Group and Rosso. To the south west of the county in Ormskirk, the primary operator is Arriva North West, alongside some services from Stagecoach. Table 5-1 summarises the number of operators in the areas in which the bus network is focused upon.
When considering Blackburn with Darwen, there are 4 operators within the authority which operate more than 1 bus per hour in the Monday morning peak period with all of these services, bar bus number 4, crossing the boundary into Lancashire or Greater Manchester. These services include Preston Bus providing services to the north of Blackburn to Longridge or Stagecoach Merseyside and South Lancashire providing service 59 and 24A to Preston and Chorley respectively.
Regarding the individual operator context, Arriva North West operates cross boundary services linking Chorley with Wigan, and Skelmersdale and Ormskirk with Liverpool, Southport and Wigan.
Blackpool Transport is the arm’s length operation of Blackpool Council and provides high frequency links from Blackpool into the neighbouring parts of Fylde and Wyre including Fleetwood, Cleveleys and Lytham St Anne’s. Blackpool Transport also operate the Blackpool Tramway which runs to Fleetwood.
Preston Bus is the former municipal operator now owned by Rotala. It has a core network of high and medium frequency services within the Preston urban area. Preston Bus has also expanded through contracted services including local services in Ormskirk and links into the Ribble Valley from Preston.
Stagecoach Cumbria & North Lancashire (C&NL) is the northern part of the former Ribble Motor Services. Within Lancashire it operates a core network of services in and around Lancaster including high frequency links between Lancaster University, Lancaster, Morecambe and Heysham. It also operates longer distance services from Lancaster to Blackpool and Preston via Wyre District, and from Lancashire into Cumbria and North Yorkshire.
Stagecoach Merseyside & South Lancashire (M&SL) covers the Preston based operations of the former Ribble Motor Services. Core services are interurban routes from Preston to Longridge, Blackburn, Chorley, Leyland, Longton, Ormskirk and Southport. Stagecoach M&SL do operate a number of tendered services around Chorley as well as the Preston – Clitheroe – Skipton route.
Transdev’s operations is a mixture of former municipals in Blackburn, Hyndburn and Rossendale; the eastern part of Ribble Motor Services and former independent Northern Blue. Services are provided by three operating companies with many routes being branded.
• The Blackburn Bus Company is based in Blackburn with a main network of interurban services to Darwen, Bolton, Chorley, Preston, Clitheroe, Accrington and Burnley;
• The Burnley Bus Company’s core network is within Burnley and Pendle with commercial local services and interurban links to Accrington and Clitheroe as well as cross-boundary services into Greater Manchester, North Yorkshire and West Yorkshire. Recent tender wins have seen the takeover of supported services into Ribble Valley under the ‘Ribble County’ brand; and
• Rosso is the former Rossendale Transport operation with a core network of higher frequency commercial services linking Rossendale with Accrington, Blackburn, Burnley and Greater Manchester. Supported services provide local services around Rawtenstall and Haslingden as well as cross boundary links into West Yorkshire.
Smaller Operators
A network of smaller operators provides lower frequency and supported services:
• Blackburn Private Hire, Moving People and Travel Assist operate supported services within the Blackburn with Darwen area;
• Charlton MiniCoaches operators two Ormskirk town services;
• Coastal Coaches operate two supported services linking north and south Fylde District as well as to Blackpool;
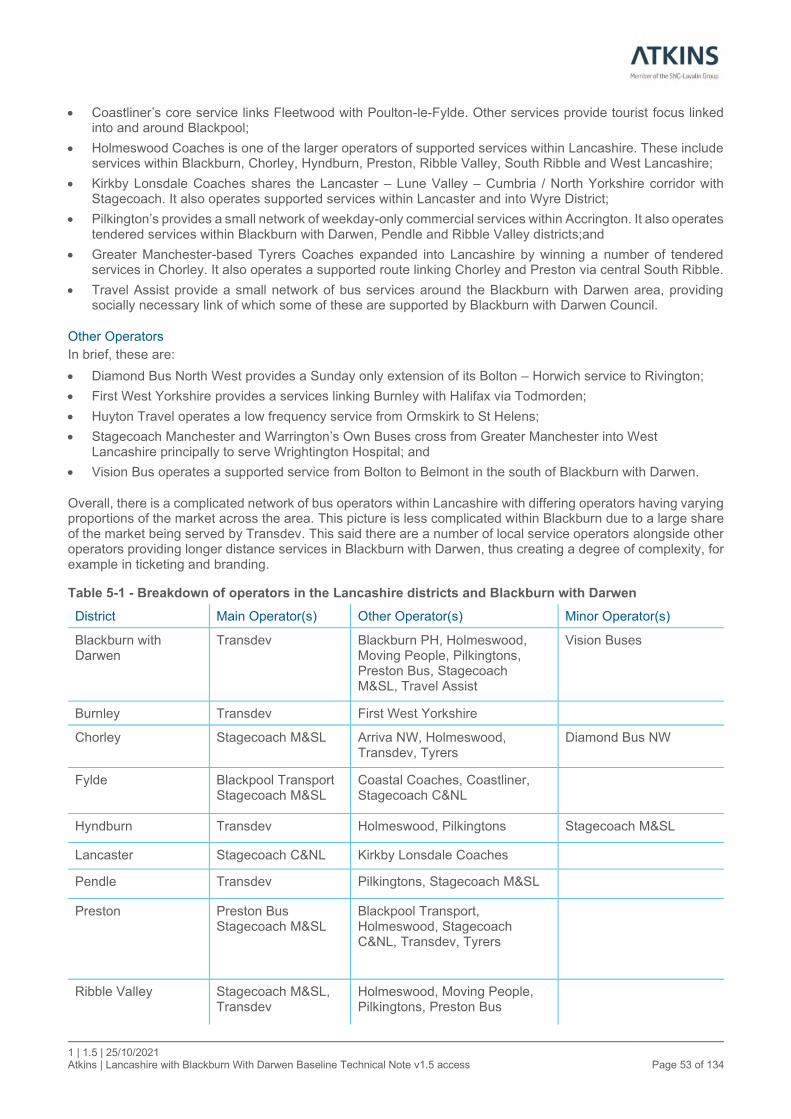
1 | 1.5 | 25/10/2021 Atkins | Lancashire with Blackburn With Darwen Baseline Technical Note v1.5 access Page 53 of 134
• Coastliner’s core service links Fleetwood with Poulton-le-Fylde. Other services provide tourist focus linked into and around Blackpool;
• Holmeswood Coaches is one of the larger operators of supported services within Lancashire. These include services within Blackburn, Chorley, Hyndburn, Preston, Ribble Valley, South Ribble and West Lancashire;
• Kirkby Lonsdale Coaches shares the Lancaster – Lune Valley – Cumbria / North Yorkshire corridor with Stagecoach. It also operates supported services within Lancaster and into Wyre District;
• Pilkington’s provides a small network of weekday-only commercial services within Accrington. It also operates tendered services within Blackburn with Darwen, Pendle and Ribble Valley districts;and
• Greater Manchester-based Tyrers Coaches expanded into Lancashire by winning a number of tendered services in Chorley. It also operates a supported route linking Chorley and Preston via central South Ribble.
• Travel Assist provide a small network of bus services around the Blackburn with Darwen area, providing socially necessary link of which some of these are supported by Blackburn with Darwen Council.
Other Operators
In brief, these are:
• Diamond Bus North West provides a Sunday only extension of its Bolton – Horwich service to Rivington;
• First West Yorkshire provides a services linking Burnley with Halifax via Todmorden;
• Huyton Travel operates a low frequency service from Ormskirk to St Helens;
• Stagecoach Manchester and Warrington’s Own Buses cross from Greater Manchester into West Lancashire principally to serve Wrightington Hospital; and
• Vision Bus operates a supported service from Bolton to Belmont in the south of Blackburn with Darwen.
Overall, there is a complicated network of bus operators within Lancashire with differing operators having varying proportions of the market across the area. This picture is less complicated within Blackburn due to a large share of the market being served by Transdev. This said there are a number of local service operators alongside other operators providing longer distance services in Blackburn with Darwen, thus creating a degree of complexity, for example in ticketing and branding.
Table 5-1 - Breakdown of operators in the Lancashire districts and Blackburn with Darwen
District Main Operator(s) Other Operator(s) Minor Operator(s)
Blackburn with Darwen
Transdev Blackburn PH, Holmeswood, Moving People, Pilkingtons, Preston Bus, Stagecoach M&SL, Travel Assist
Vision Buses
Burnley Transdev First West Yorkshire
Chorley Stagecoach M&SL Arriva NW, Holmeswood, Transdev, Tyrers
Diamond Bus NW
Fylde Blackpool Transport Stagecoach M&SL
Coastal Coaches, Coastliner, Stagecoach C&NL
Hyndburn Transdev Holmeswood, Pilkingtons Stagecoach M&SL
Lancaster Stagecoach C&NL Kirkby Lonsdale Coaches
Pendle Transdev Pilkingtons, Stagecoach M&SL
Preston Preston Bus Stagecoach M&SL
Blackpool Transport, Holmeswood, Stagecoach C&NL, Transdev, Tyrers
Ribble Valley Stagecoach M&SL, Transdev
Holmeswood, Moving People, Pilkingtons, Preston Bus
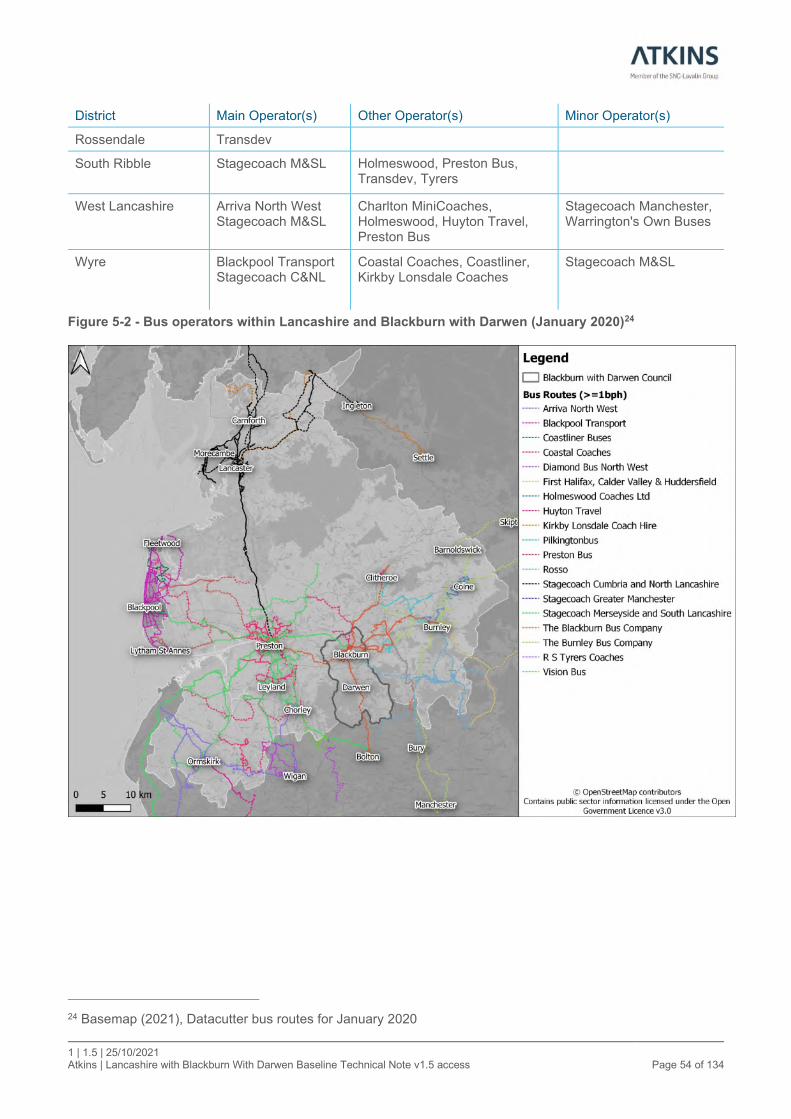
1 | 1.5 | 25/10/2021 Atkins | Lancashire with Blackburn With Darwen Baseline Technical Note v1.5 access Page 54 of 134
District Main Operator(s) Other Operator(s) Minor Operator(s)
Rossendale Transdev
South Ribble Stagecoach M&SL Holmeswood, Preston Bus, Transdev, Tyrers
West Lancashire Arriva North West Stagecoach M&SL
Charlton MiniCoaches, Holmeswood, Huyton Travel, Preston Bus
Stagecoach Manchester, Warrington's Own Buses
Wyre Blackpool Transport Stagecoach C&NL
Coastal Coaches, Coastliner, Kirkby Lonsdale Coaches
Stagecoach M&SL
Figure 5-2 - Bus operators within Lancashire and Blackburn with Darwen (January 2020)24
24 Basemap (2021), Datacutter bus routes for January 2020

1 | 1.5 | 25/10/2021 Atkins | Lancashire with Blackburn With Darwen Baseline Technical Note v1.5 access Page 55 of 134
5.2. Location of bus stops
5.2.1. Lancashire As of May 2021, there are currently 7,806 bus stops in Lancashire25, which, as expected are mainly concentrated within the built-up urban areas and along key bus route corridors. Within the urban areas, accessibility to bus stops is high with few residents outside a 400-metre walking distance.
Lancashire also has several bus stations located across the county, these and their facilities are outlined in Table 5-2.
Table 5-2 - Bus stations within Lancashire
Bus Station Number of Stands
Enclosed RTPI Railway Interchange
Other Facilities
Accrington Bus Station
6 ✓ ✓ Information point.
Burnley Bus Station
18 ✓ ✓ Toilets, café and information point.
Chorley Interchange
15 ✓ ✓
(2021/
2022)
✓ Information point, coffee shop and taxi rank.
Cleveleys bus station
5 ✓ N/A
Clitheroe interchange
6 ✓ N/A
Colne bus station 3 ✓ N/A
Lancaster bus station
20 ✓ ✓ Information point, refreshment kiosk, toilets and taxi rank.
Morecambe bus station
3 ✓ N/A
Nelson interchange
10 ✓ ✓ ✓ Information point and toilets
Ormskirk bus station
7 ✓ N/A
Preston bus station
40 ✓ ✓ Toilets, café, information point
Rawtenstall bus station
4 ✓ N/A
25 DfT (2021), NaPTAN and NPTG download options [Sourced May 2021]

1 | 1.5 | 25/10/2021 Atkins | Lancashire with Blackburn With Darwen Baseline Technical Note v1.5 access Page 56 of 134
5.2.2. Blackburn with Darwen Within Blackburn and Darwen there are currently 980 bus stops. The majority of these are located within the urban areas of Blackburn and Darwen. Throughout the authority almost all settlements appear to be able to access a bus stop within 400m.
All bus stops on the major Pennine Reach corridors, serving services 1, 6 and 7 have been upgraded as part of the Pennine Reach Scheme. This includes:
• Bus shelters upgraded to gold and bronze standards, to the Pennine Reach specification with 114mm polished steel and glazing as standard.
• Bus stops have been upgraded to full Equality Act level access.
As part of this scheme, Blackburn with Darwen Council terminated their advertisement arrangement with Clear Channel as a means of upgrading the life expired bus shelters which were on the route. Blackburn with Darwen Council now manage the advertising on the shelters internally and utilise this income to support public transport activities within the local authority.
Beyond the Pennine Reach routes, other bus stops and bus shelters within Blackburn with Darwen are of varying standards with significant scope to improve provision. However, all bus stops have a standardised method for displaying timetable information using the Blackburn With Darwen Connect branding.
The following real time passenger information facilities are currently provided within Blackburn with Darwen:
• Large departure summary screens and “at-stand” departure screens at Blackburn Bus Station
• Electronic Advertising screens at Blackburn Railway Station Interchange and Blackburn Bus Station
• Journey planning units at Blackburn Bus Station, Blackburn Railway Station Interchange and Darwen Market
• Realtime journey screens at Blackburn Market, Blackburn Railway Station Interchange, Barbara Castle Way Health Centre and One Cathedral Square offices
• Real-time and journey planning units at Royal Blackburn Hospital and Blackburn College
• 27” stretch real-time screens at key bus stops including Darwen Town Centre, Blackburn Railway Station Interchange, Ewood bus interchange and Blackburn Town Hall
Realtime information is also provided via the ‘Transdev Go’ mobile phone app.
5.2.2.1. Blackburn Bus Station
Blackburn has the largest bus station within the local authority which is owned and operated by Blackburn with Darwen Council. This bus station contains 14 bus stands and accommodates 2.5 million passengers a year. The station is served by all of the frequent bus services operating within the area.
As part of the recent Pennine Reach scheme a significant package of upgrades were included for Blackburn Bus Station. This has significantly improved the public transport interchange infrastructure on offer in Blackburn.
The bus station is staffed throughout its operation to provide security and information to passengers using the interchange; this is supported by staff employed by Transdev.
The following facilities for passengers are provided within the Bus Station:
• Counter area at the hub building providing verbal and printed public transport information
• Female, male and disabled WCs
• 1 small retail unit
• 5 large information screens on arrival directing passengers to bus stands
• 6 secure storage units for customer and staff cycle parking
• 14 smaller screens at the stands showing scheduled and real-time departures
• Facility to purchase and top-up NoWSTAR smartcards within the Journey Planning Unit
• Seating areas for passengers to wait for departures
• CCTV and Public Wi-Fi
1 | 1.5 | 25/10/2021 Atkins | Lancashire with Blackburn With Darwen Baseline Technical Note v1.5 access Page 57 of 134
The Bus Station’s running costs and ongoing maintenance are funded by:
• The introduction of departure charges, currently at £0.75 per departure for local buses and £1.75 for National Express coaches
• Leasing parts of the bus station for small retail – 2 retail pods, one in use housing a vending machine company
• Leasing part of the hub building within the bus station to Transdev for bus operations
• Charging for the use of public WCs, currently priced at 20 pence
• Electronic advertising on 5 “totems” on the concourse area
5.2.2.2. Blackburn Rail Station Interchange
There is a small outdoor bus interchange located at Blackburn Rail Station. This interchange consists of 5 bus stands each with a shelter, timetable information, real time bus information and seating. This interchange is served by 15 bus services and provides connectivity to a wide range of destinations across Blackburn with Darwen and into Lancashire.
5.2.2.3. Darwen Bus Station
Darwen Bus Station, also known as Darwen Circus, is situated within Darwen town centre adjacent to Darwen Market and Darwen Town Hall and is the only bus station serving Darwen. Darwen train station is approximately 300m away while Darwen Library Theatre and Darwen Leisure Centre are also within easy walking distance.
The station has 5 bus stands with shelters, seating and bins provided. There are no other facilities provided at Darwen Bus Station. However, there are toilets and a journey planning unit within Darwen Market.
5.2.2.4. Royal Blackburn Hospital
There is a small bus station facility at Blackburn Royal Hospital comprising one large shelter housing two bus stands with seating.
Services 12A, 12C, 15, 22, 33, 59 and 481 call at the stops within Blackburn Royal Hospital offering services to a range of destinations including Blackburn town centre, Darwen, Clitheroe, Preston and Bury.
Figure 5-3 displays the distribution of bus stops and interchanges within Lancashire and Blackburn with Darwen.

1 | 1.5 | 25/10/2021 Atkins | Lancashire with Blackburn With Darwen Baseline Technical Note v1.5 access Page 58 of 134
Figure 5-3 - Bus stops in Lancashire and Blackburn with Darwen25

1 | 1.5 | 25/10/2021 Atkins | Lancashire with Blackburn With Darwen Baseline Technical Note v1.5 access Page 59 of 134
5.3. CONNECT project Blackburn with Darwen Council and Lancashire County Council have worked collaboratively to establish the CONNECT project which aims to encourage behavioural change and promote smart travel choices, alongside to encourage healthier and more sustainable ways of travelling.
Established in 2012 as part of DfT’s Local Sustainable Transport Fund the project has developed and expanded, with Lancashire County Council becoming involved in the scheme through the more recent Access Fund. The project primarily focuses on linking people to employment, skills sites, education establishments and leisure/social sites. Through a variety of dedicated initiatives, the project promotes and enables sustainable travel and aims to address issues of physical inactivity and barriers to sustainable transport. Over the years CONNECT has developed its own website portal promoting and supporting the Blackburn with Darwen Council website by hosting all public transport, active travel and car sharing information, news and activities.
The Connect brand has recently been promoted on social media platforms such as Facebook and Twitter where dedicated accounts have a growing following.
5.4. Bus fares
5.4.1. Lancashire This section outlines the fares charged by the principal operators in Lancashire as of 19 August 2021. The data outlined in Table 5-3 to Table 5-6 outlines the fares for the primary operators within Lancashire and has been collected from public sources, thus they are limited to the data published by each operator.
Table 5-3 – Preston Bus26
Ticket Type mTicket (£) On Bus (£)
Adult - Single - Preston Services N/A 1.60 – 2.00
Adult - EasiDay - Preston Services 4.10 4.10
Adult - EasiWeek - Preston Services 13.50 13.50
Adult - Easi28Day - Preston Services 46.00 46.00
Adult - EasiReturn - Preston Services N/A 3.80
Adult - Day - Lancashire Services 8.00 8.00
Adult - Week - Lancashire Services 15.00 15.00
Family - Family EasiDay - Preston Services
6.00 6.00
Family - Group (2 adults, 3 young persons) - Lancashire Services
15.00 15.00
Family - Duo (2 people) - Lancashire Services
10.00 10.00
Child* - Single - Preston Services 1.50 1.50
Child* - EasiDay - Preston Services 3.10 3.10
Child* - EasiWeek - Preston Services 11.00 11.00
Child* - Easi28Day - Preston Services 36.00 36.00
Child* - U19/12 Week - Lancashire Services
10.00 10.00
Child* - U12 - Lancashire Services 4.00 4.00
Child* - U18 - Lancashire Services 5.40 5.40
*Child fares are valid for those aged 15 and under.
26 Preston Bus (2021), Tickets [Sourced August 2021]

1 | 1.5 | 25/10/2021 Atkins | Lancashire with Blackburn With Darwen Baseline Technical Note v1.5 access Page 60 of 134
Table 5-4 – Stagecoach in Lancashire27
Ticket Type mTicket (£) On Bus (£)
Adult - Merseyside DayRider 4.40 4.40
Adult - Chorley DayRider 4.00 4.00
Adult - Fylde Coast DayRider 4.40 4.40
Adult - Preston Citi DayRider 3.70 3.70
Adult - Central Lancs DayRider 4.90 4.90
Adult - Lancashire DayRider 8.20 8.20
Adult - Bay DayRider 5.00 5.00
Adult - Bay Plus DayRider 7.10 7.10
Adult - North West Explorer 11.50 11.50
Adult - Bus & Boat Windermere Explorer N/A 16.00
Adult - Bus & Boat Ullswater Explorer N/A 17.00
North West 3 Day Explorer N/A 26.00
Bay 7 Day MegaRider 15.90 15.90
Adult - Bay Plus 7 Day MegaRider 17.40 17.40
Adult - Merseyside Plus 7 Day MegaRider 12.00 15.00
Adult - Chorley 7 Day MegaRider 12.00 12.00
Adult - Fylde Coast 7 Day MegaRider 14.50 14.50
Adult - Preston Citi 7 Day MegaRider 12.00 12.00
Adult - Central Lancs 7 Day MegaRider 19.00 19.00
Adult - North West Gold 7 Day MegaRider 29.00 29.00
Adult - Bay 28 Days MegaRider/Monthly Xtra 60.00 60.00
Adult - Bay Plus 28 Days MegaRider/Monthly Xtra 87.00 87.00
Adult - Merseyside Plus 28 Days MegaRider/Monthly Xtra 49.99 N/A
Adult - Chorley 28 Days MegaRider/Monthly Xtra 43.99 N/A
Adult - Fylde Coast 28 Days MegaRider/Monthly Xtra 54.99 N/A
Adult - Preston Citi 28 Days MegaRider/Monthly Xtra 41.99 N/A
Adult - Central Lancs 28 Days MegaRider/Monthly Xtra 71.99 N/A
Adult - North West Gold 28 Days MegaRider/Monthly Xtra 105 N/A
Adult - 7 Day MegaRider (125 (Horwich – Bolton)) 11 11
Adult - 28 Days MegaRider/Monthly Xtra (125 (Horwich – Bolton)) 41.99 41.99
Family - Merseyside Plus DayRider (Family) 10.00 10.00
Family - Preston Citi DayRider (Family) 5.80 5.80
27 Stagecoach (2021), Lancashire Tickets [Sourced August 2021]
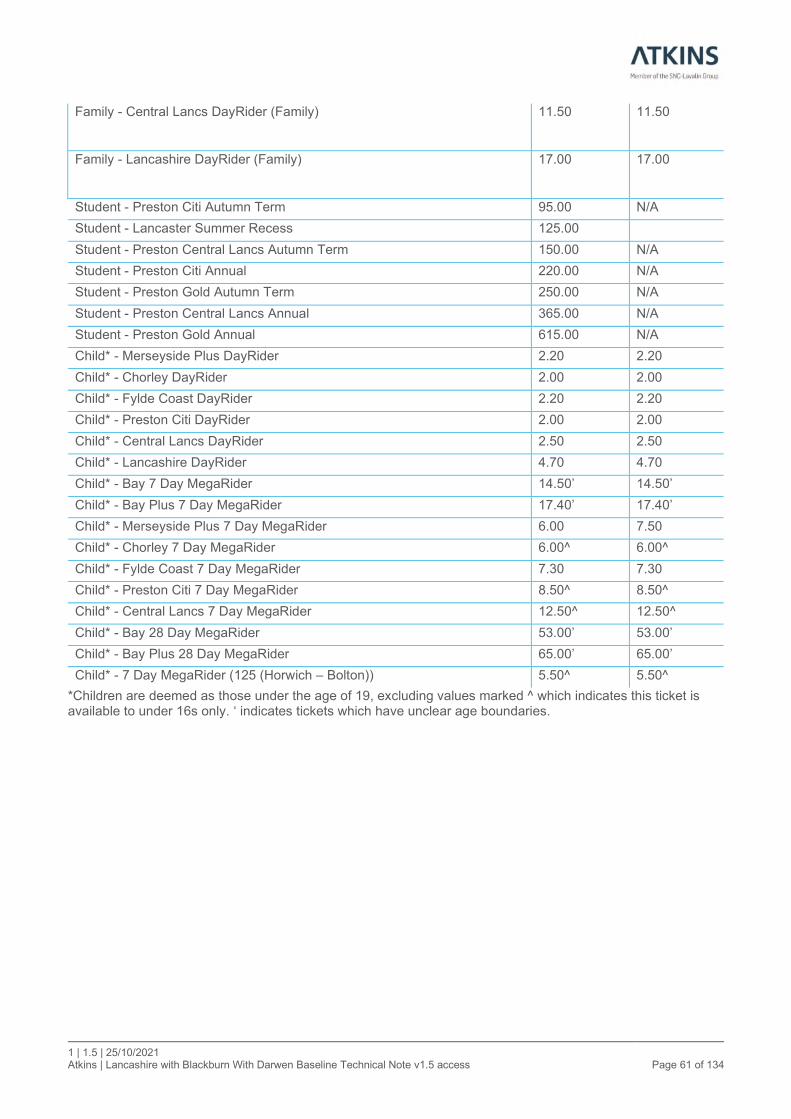
1 | 1.5 | 25/10/2021 Atkins | Lancashire with Blackburn With Darwen Baseline Technical Note v1.5 access Page 61 of 134
Family - Central Lancs DayRider (Family) 11.50 11.50
Family - Lancashire DayRider (Family) 17.00 17.00
Student - Preston Citi Autumn Term 95.00 N/A
Student - Lancaster Summer Recess 125.00
Student - Preston Central Lancs Autumn Term 150.00 N/A
Student - Preston Citi Annual 220.00 N/A
Student - Preston Gold Autumn Term 250.00 N/A
Student - Preston Central Lancs Annual 365.00 N/A
Student - Preston Gold Annual 615.00 N/A
Child* - Merseyside Plus DayRider 2.20 2.20
Child* - Chorley DayRider 2.00 2.00
Child* - Fylde Coast DayRider 2.20 2.20
Child* - Preston Citi DayRider 2.00 2.00
Child* - Central Lancs DayRider 2.50 2.50
Child* - Lancashire DayRider 4.70 4.70
Child* - Bay 7 Day MegaRider 14.50’ 14.50’
Child* - Bay Plus 7 Day MegaRider 17.40’ 17.40’
Child* - Merseyside Plus 7 Day MegaRider 6.00 7.50
Child* - Chorley 7 Day MegaRider 6.00^ 6.00^
Child* - Fylde Coast 7 Day MegaRider 7.30 7.30
Child* - Preston Citi 7 Day MegaRider 8.50^ 8.50^
Child* - Central Lancs 7 Day MegaRider 12.50^ 12.50^
Child* - Bay 28 Day MegaRider 53.00’ 53.00’
Child* - Bay Plus 28 Day MegaRider 65.00’ 65.00’
Child* - 7 Day MegaRider (125 (Horwich – Bolton)) 5.50^ 5.50^
*Children are deemed as those under the age of 19, excluding values marked ^ which indicates this ticket is available to under 16s only. ‘ indicates tickets which have unclear age boundaries.

1 | 1.5 | 25/10/2021 Atkins | Lancashire with Blackburn With Darwen Baseline Technical Note v1.5 access Page 62 of 134
Table 5-5 – Arriva North West Ticket Prices28
Ticket Type mTicket (£) On Bus (£)
Adult - Single Evening 1.00 1.00
Adult - Day 5.50 5.50
Adult - Duo Day 10.50 Not known
Adult - 3 Day Flexi 15.50 Not known
Adult - Weekly 18.00 Not known
Adult - 4 Week 63.00 Not known
Adult - Annual 630.00 Not known
Student - Academic Year 395.00 Not known
Student - Autumn 155.00 N/A
Student - Autumn & Spring 305.00 N/A
Student - Academic Year +1 440.00 N/A
Student - Academic Year + 2 475.00 N/A
Family - Day 12.00 12.00
Child* - Single Evening 1.00 1.00
Child* - Day 3.50 3.50
Child* - Week 12.70 12.70
Child* - 4 Week 42.00 Not known
Child* - Academic Year 230.00 N/A
Child* - Annual 420.00 N/A
Child* - Autumn 85.00 N/A
Child* - Autumn & Spring Term 170.00 N/A
* Child fares are valid for those aged 15 and under.
28 Arriva (2021), Buy Tickets [Sourced August 2021]

1 | 1.5 | 25/10/2021 Atkins | Lancashire with Blackburn With Darwen Baseline Technical Note v1.5 access Page 63 of 134
Table 5-6 – Blackpool Transport Ticket Prices29
Ticket Type mTicket (£) On Bus (£)
Adult - Single (1 zone) 1.90 1.90
Adult - Single (2 zones) 2.40 2.40
Adult - 1 hour 3.00 3.00
Adult - 24 hour 5.20 5.50
Adult - 3 day 11.50 12.50
Adult - 5 x 24 hour 23.50 15.50
Adult - 7 day 14.50 N/A
Adult - 30 day 54.00 N/A
Adult - 1 year 540 N/A
Young Person (16-21) - 24 hour 3.20 3.80
Young Person (16-21) - 5 x 24 hour 14.00 N/A
Young Person (16-21) - 7 day 13.00 14.00
Young Person (16-21) - 30 day 45.50 N/A
Child (5-15) - Single N/A 1.20
Child (5-15) - 24 hour 2.50 2.70
Child (5-15) - 3 day 6.50 7.00
Child (5-15) - 7 day 7.50 8.00
Child (5-15) - 30 day 27.00 N/A
Group - 24 Hour (Family) 11.50 12.00
Group - 24 Hour (Group) 12.50 13.00
Travel Club - 7 Day 13.05 N/A
Travel Club - 30 Day 48.60 N/A
29 Blackpool Transport (2021), Fares and Tickets [Sourced August 2021]
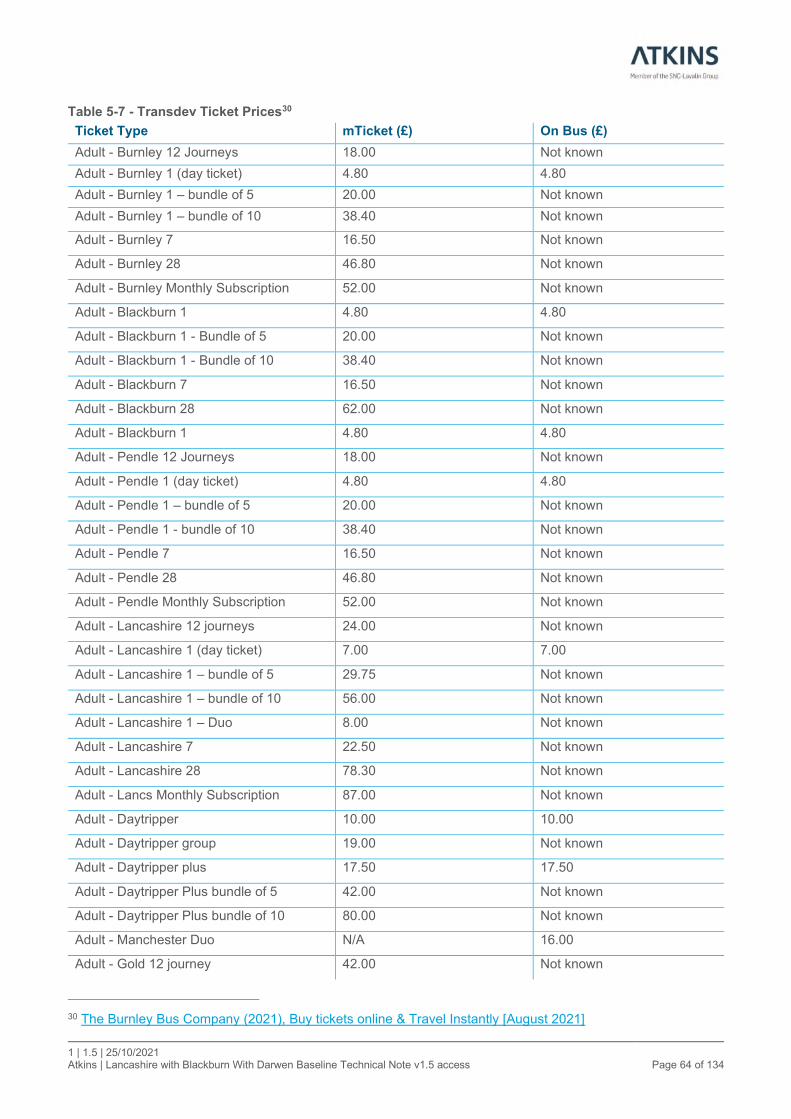
1 | 1.5 | 25/10/2021 Atkins | Lancashire with Blackburn With Darwen Baseline Technical Note v1.5 access Page 64 of 134
Table 5-7 - Transdev Ticket Prices30
Ticket Type mTicket (£) On Bus (£)
Adult - Burnley 12 Journeys 18.00 Not known
Adult - Burnley 1 (day ticket) 4.80 4.80
Adult - Burnley 1 – bundle of 5 20.00 Not known
Adult - Burnley 1 – bundle of 10 38.40 Not known
Adult - Burnley 7 16.50 Not known
Adult - Burnley 28 46.80 Not known
Adult - Burnley Monthly Subscription 52.00 Not known
Adult - Blackburn 1 4.80 4.80
Adult - Blackburn 1 - Bundle of 5 20.00 Not known
Adult - Blackburn 1 - Bundle of 10 38.40 Not known
Adult - Blackburn 7 16.50 Not known
Adult - Blackburn 28 62.00 Not known
Adult - Blackburn 1 4.80 4.80
Adult - Pendle 12 Journeys 18.00 Not known
Adult - Pendle 1 (day ticket) 4.80 4.80
Adult - Pendle 1 – bundle of 5 20.00 Not known
Adult - Pendle 1 - bundle of 10 38.40 Not known
Adult - Pendle 7 16.50 Not known
Adult - Pendle 28 46.80 Not known
Adult - Pendle Monthly Subscription 52.00 Not known
Adult - Lancashire 12 journeys 24.00 Not known
Adult - Lancashire 1 (day ticket) 7.00 7.00
Adult - Lancashire 1 – bundle of 5 29.75 Not known
Adult - Lancashire 1 – bundle of 10 56.00 Not known
Adult - Lancashire 1 – Duo 8.00 Not known
Adult - Lancashire 7 22.50 Not known
Adult - Lancashire 28 78.30 Not known
Adult - Lancs Monthly Subscription 87.00 Not known
Adult - Daytripper 10.00 10.00
Adult - Daytripper group 19.00 Not known
Adult - Daytripper plus 17.50 17.50
Adult - Daytripper Plus bundle of 5 42.00 Not known
Adult - Daytripper Plus bundle of 10 80.00 Not known
Adult - Manchester Duo N/A 16.00
Adult - Gold 12 journey 42.00 Not known
30 The Burnley Bus Company (2021), Buy tickets online & Travel Instantly [August 2021]
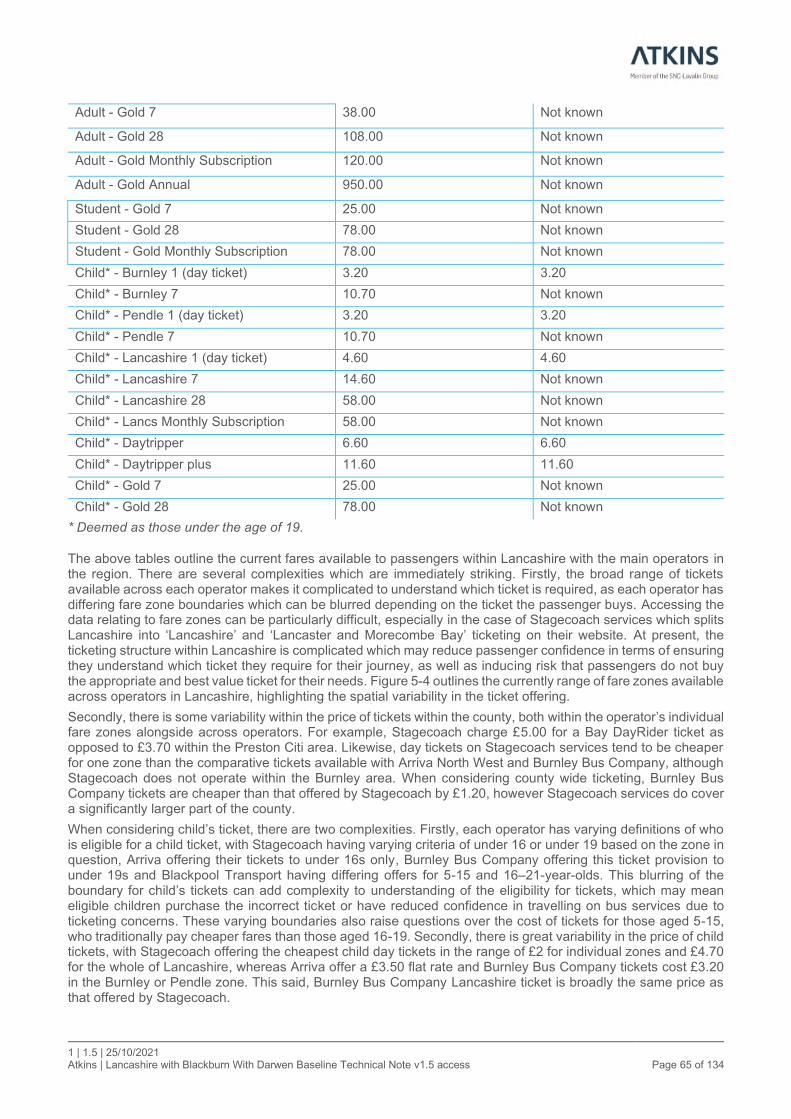
1 | 1.5 | 25/10/2021 Atkins | Lancashire with Blackburn With Darwen Baseline Technical Note v1.5 access Page 65 of 134
Adult - Gold 7 38.00 Not known
Adult - Gold 28 108.00 Not known
Adult - Gold Monthly Subscription 120.00 Not known
Adult - Gold Annual 950.00 Not known
Student - Gold 7 25.00 Not known
Student - Gold 28 78.00 Not known
Student - Gold Monthly Subscription 78.00 Not known
Child* - Burnley 1 (day ticket) 3.20 3.20
Child* - Burnley 7 10.70 Not known
Child* - Pendle 1 (day ticket) 3.20 3.20
Child* - Pendle 7 10.70 Not known
Child* - Lancashire 1 (day ticket) 4.60 4.60
Child* - Lancashire 7 14.60 Not known
Child* - Lancashire 28 58.00 Not known
Child* - Lancs Monthly Subscription 58.00 Not known
Child* - Daytripper 6.60 6.60
Child* - Daytripper plus 11.60 11.60
Child* - Gold 7 25.00 Not known
Child* - Gold 28 78.00 Not known
* Deemed as those under the age of 19.
The above tables outline the current fares available to passengers within Lancashire with the main operators in the region. There are several complexities which are immediately striking. Firstly, the broad range of tickets available across each operator makes it complicated to understand which ticket is required, as each operator has differing fare zone boundaries which can be blurred depending on the ticket the passenger buys. Accessing the data relating to fare zones can be particularly difficult, especially in the case of Stagecoach services which splits Lancashire into ‘Lancashire’ and ‘Lancaster and Morecombe Bay’ ticketing on their website. At present, the ticketing structure within Lancashire is complicated which may reduce passenger confidence in terms of ensuring they understand which ticket they require for their journey, as well as inducing risk that passengers do not buy the appropriate and best value ticket for their needs. Figure 5-4 outlines the currently range of fare zones available across operators in Lancashire, highlighting the spatial variability in the ticket offering.
Secondly, there is some variability within the price of tickets within the county, both within the operator’s individual fare zones alongside across operators. For example, Stagecoach charge £5.00 for a Bay DayRider ticket as opposed to £3.70 within the Preston Citi area. Likewise, day tickets on Stagecoach services tend to be cheaper for one zone than the comparative tickets available with Arriva North West and Burnley Bus Company, although Stagecoach does not operate within the Burnley area. When considering county wide ticketing, Burnley Bus Company tickets are cheaper than that offered by Stagecoach by £1.20, however Stagecoach services do cover a significantly larger part of the county.
When considering child’s ticket, there are two complexities. Firstly, each operator has varying definitions of who is eligible for a child ticket, with Stagecoach having varying criteria of under 16 or under 19 based on the zone in question, Arriva offering their tickets to under 16s only, Burnley Bus Company offering this ticket provision to under 19s and Blackpool Transport having differing offers for 5-15 and 16–21-year-olds. This blurring of the boundary for child’s tickets can add complexity to understanding of the eligibility for tickets, which may mean eligible children purchase the incorrect ticket or have reduced confidence in travelling on bus services due to ticketing concerns. These varying boundaries also raise questions over the cost of tickets for those aged 5-15, who traditionally pay cheaper fares than those aged 16-19. Secondly, there is great variability in the price of child tickets, with Stagecoach offering the cheapest child day tickets in the range of £2 for individual zones and £4.70 for the whole of Lancashire, whereas Arriva offer a £3.50 flat rate and Burnley Bus Company tickets cost £3.20 in the Burnley or Pendle zone. This said, Burnley Bus Company Lancashire ticket is broadly the same price as that offered by Stagecoach.
1 | 1.5 | 25/10/2021 Atkins | Lancashire with Blackburn With Darwen Baseline Technical Note v1.5 access Page 66 of 134
For both adult and children’s ticketing, it is difficult to evaluate the equity of ticket prices across the differing fare zones due to the lack of data relating to the average or maximum distance travelled by the passenger. This technical note has subsequently been unable to calculate the price per kilometres of tickets to highlight equity in ticket pricing. This said, it does appear that there are stark differences in both adult and child ticket prices which should be further considered.
Within Lancashire, Lancashire County Council also provides concessionary travel for the following groups:
• English National Concessionary Travel Scheme for elderly and disabled passengers (statutory minimum scheme); and
• Free scholars’ passes for children entitled to free travel to school
Overall, the current fare structure for all ages within Lancashire could been seen as complicated. Each operator currently offers a range of differing fares, covering differing geographical extents and with differing eligibility criteria, with the latter most pronounced for children. These complexities may be a barrier to accessing bus services within Lancashire as people may not feel confident in understanding the cost of travelling by bus or may find it too expensive when having to complete a journey across multiple operators.

1 | 1.5 | 25/10/2021 Atkins | Lancashire with Blackburn With Darwen Baseline Technical Note v1.5 access Page 67 of 134
Figure 5-4 – Operator Fare Zones in Lancashire and Blackburn with Darwen
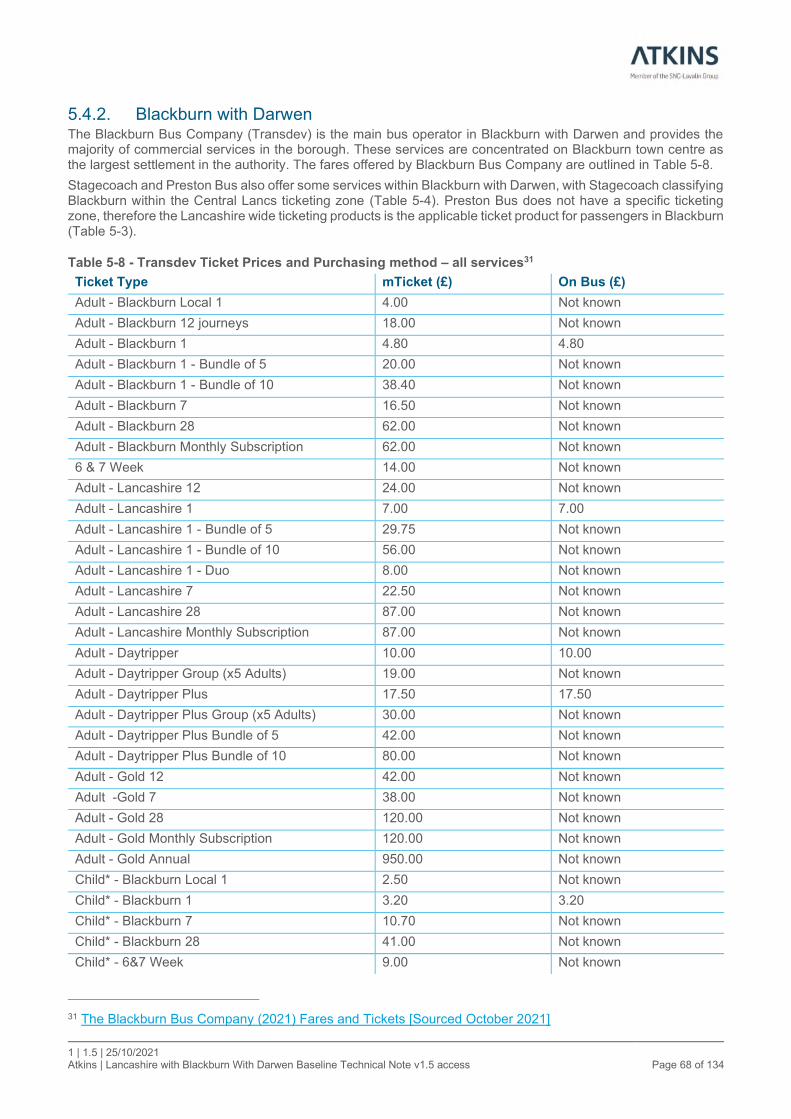
1 | 1.5 | 25/10/2021 Atkins | Lancashire with Blackburn With Darwen Baseline Technical Note v1.5 access Page 68 of 134
5.4.2. Blackburn with Darwen The Blackburn Bus Company (Transdev) is the main bus operator in Blackburn with Darwen and provides the majority of commercial services in the borough. These services are concentrated on Blackburn town centre as the largest settlement in the authority. The fares offered by Blackburn Bus Company are outlined in Table 5-8.
Stagecoach and Preston Bus also offer some services within Blackburn with Darwen, with Stagecoach classifying Blackburn within the Central Lancs ticketing zone (Table 5-4). Preston Bus does not have a specific ticketing zone, therefore the Lancashire wide ticketing products is the applicable ticket product for passengers in Blackburn (Table 5-3).
Table 5-8 - Transdev Ticket Prices and Purchasing method – all services31
Ticket Type mTicket (£) On Bus (£)
Adult - Blackburn Local 1 4.00 Not known
Adult - Blackburn 12 journeys 18.00 Not known
Adult - Blackburn 1 4.80 4.80
Adult - Blackburn 1 - Bundle of 5 20.00 Not known
Adult - Blackburn 1 - Bundle of 10 38.40 Not known
Adult - Blackburn 7 16.50 Not known
Adult - Blackburn 28 62.00 Not known
Adult - Blackburn Monthly Subscription 62.00 Not known
6 & 7 Week 14.00 Not known
Adult - Lancashire 12 24.00 Not known
Adult - Lancashire 1 7.00 7.00
Adult - Lancashire 1 - Bundle of 5 29.75 Not known
Adult - Lancashire 1 - Bundle of 10 56.00 Not known
Adult - Lancashire 1 - Duo 8.00 Not known
Adult - Lancashire 7 22.50 Not known
Adult - Lancashire 28 87.00 Not known
Adult - Lancashire Monthly Subscription 87.00 Not known
Adult - Daytripper 10.00 10.00
Adult - Daytripper Group (x5 Adults) 19.00 Not known
Adult - Daytripper Plus 17.50 17.50
Adult - Daytripper Plus Group (x5 Adults) 30.00 Not known
Adult - Daytripper Plus Bundle of 5 42.00 Not known
Adult - Daytripper Plus Bundle of 10 80.00 Not known
Adult - Gold 12 42.00 Not known
Adult -Gold 7 38.00 Not known
Adult - Gold 28 120.00 Not known
Adult - Gold Monthly Subscription 120.00 Not known
Adult - Gold Annual 950.00 Not known
Child* - Blackburn Local 1 2.50 Not known
Child* - Blackburn 1 3.20 3.20
Child* - Blackburn 7 10.70 Not known
Child* - Blackburn 28 41.00 Not known
Child* - 6&7 Week 9.00 Not known
31 The Blackburn Bus Company (2021) Fares and Tickets [Sourced October 2021]
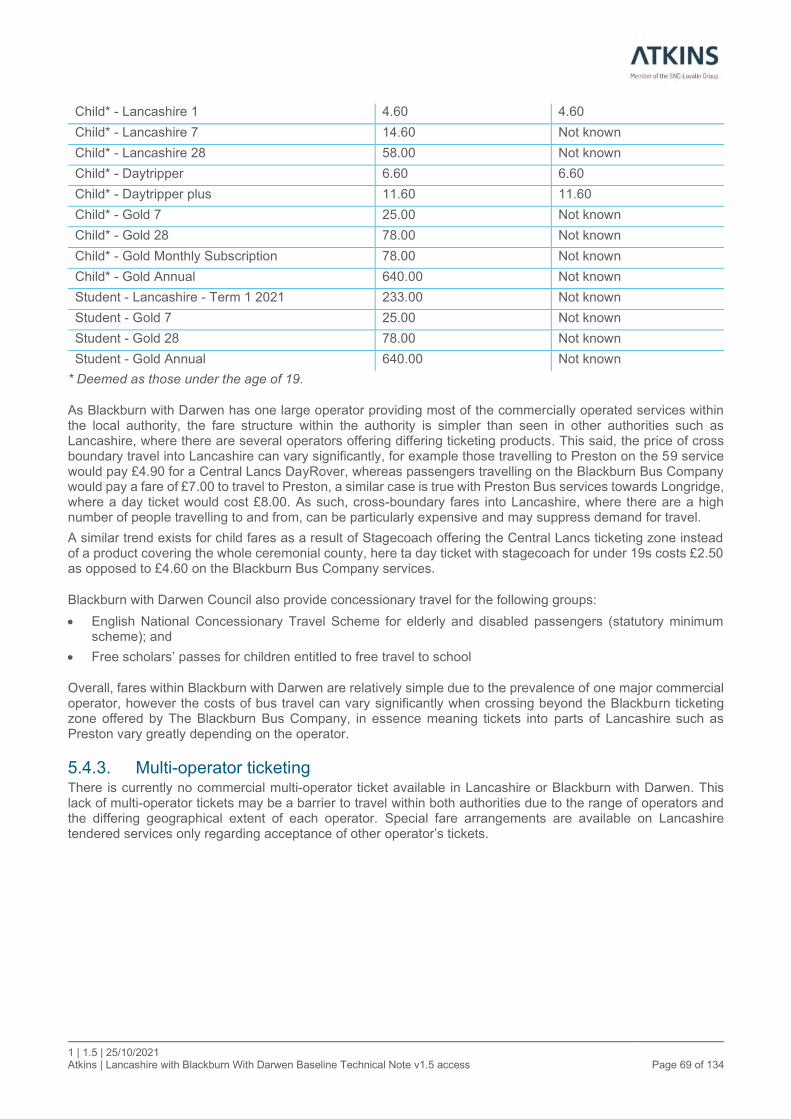
1 | 1.5 | 25/10/2021 Atkins | Lancashire with Blackburn With Darwen Baseline Technical Note v1.5 access Page 69 of 134
Child* - Lancashire 1 4.60 4.60
Child* - Lancashire 7 14.60 Not known
Child* - Lancashire 28 58.00 Not known
Child* - Daytripper 6.60 6.60
Child* - Daytripper plus 11.60 11.60
Child* - Gold 7 25.00 Not known
Child* - Gold 28 78.00 Not known
Child* - Gold Monthly Subscription 78.00 Not known
Child* - Gold Annual 640.00 Not known
Student - Lancashire - Term 1 2021 233.00 Not known
Student - Gold 7 25.00 Not known
Student - Gold 28 78.00 Not known
Student - Gold Annual 640.00 Not known
* Deemed as those under the age of 19.
As Blackburn with Darwen has one large operator providing most of the commercially operated services within the local authority, the fare structure within the authority is simpler than seen in other authorities such as Lancashire, where there are several operators offering differing ticketing products. This said, the price of cross boundary travel into Lancashire can vary significantly, for example those travelling to Preston on the 59 service would pay £4.90 for a Central Lancs DayRover, whereas passengers travelling on the Blackburn Bus Company would pay a fare of £7.00 to travel to Preston, a similar case is true with Preston Bus services towards Longridge, where a day ticket would cost £8.00. As such, cross-boundary fares into Lancashire, where there are a high number of people travelling to and from, can be particularly expensive and may suppress demand for travel.
A similar trend exists for child fares as a result of Stagecoach offering the Central Lancs ticketing zone instead of a product covering the whole ceremonial county, here ta day ticket with stagecoach for under 19s costs £2.50 as opposed to £4.60 on the Blackburn Bus Company services.
Blackburn with Darwen Council also provide concessionary travel for the following groups:
• English National Concessionary Travel Scheme for elderly and disabled passengers (statutory minimum scheme); and
• Free scholars’ passes for children entitled to free travel to school
Overall, fares within Blackburn with Darwen are relatively simple due to the prevalence of one major commercial operator, however the costs of bus travel can vary significantly when crossing beyond the Blackburn ticketing zone offered by The Blackburn Bus Company, in essence meaning tickets into parts of Lancashire such as Preston vary greatly depending on the operator.
5.4.3. Multi-operator ticketing There is currently no commercial multi-operator ticket available in Lancashire or Blackburn with Darwen. This lack of multi-operator tickets may be a barrier to travel within both authorities due to the range of operators and the differing geographical extent of each operator. Special fare arrangements are available on Lancashire tendered services only regarding acceptance of other operator’s tickets.
1 | 1.5 | 25/10/2021 Atkins | Lancashire with Blackburn With Darwen Baseline Technical Note v1.5 access Page 70 of 134
5.5. Public transport journey times Data from the DfT32 has been obtained to develop an insight into journey times via public transport and private modes. Despite the most recent publication being 2020, the base year data for this section is from the transport system in 2017.
5.5.1. Journey times to education
5.5.1.1. Secondary education
Figure 5-5 outlines journey times within Lancashire and Blackburn with Darwen to secondary schools. Within Lancashire there is great variability in times taken to reach secondary schools via public transport, between 4 and 50 minutes, whereas journeys using private vehicles display significantly less variation - between 6 and 23 minutes. When considering the spatial distribution of this variation, it is clear that public transport performs well within the more urban and suburban parts of the county, for example within Preston, Fleetwood, Morecambe, Burnley and Lancaster most LSOAs are able to access a secondary school within 20 minutes, which is still however up to double the equivalent journey by private vehicle, whereby most take a maximum of 10 minutes.
The most pronounced differences in journey times between the modes is apparent when entering more rural areas, for example to the north and west of Clitheroe, public transport journey times can be more than double that of the equivalent car journey. Additionally, there are pockets of longer journey times within the vicinity of Fleetwood and Burnley/Colne, which do not meet the trend of the adjacent LSOAs, perhaps suggesting there is insufficient demand for provision in these areas.
When reviewing Blackburn with Darwen all LSOAs can access a secondary school within 30 minutes on public transport, with most being within 20 minutes. Within the larger settlements a good proportion of LSOAs can also access a secondary school within 10 minutes. When comparing this to private vehicles all LSOAs can access a secondary school within a 15-minute drive, with the LSOAs covering Blackburn and Darwen eliciting a maximum of a 10-minute journey. This means that within Blackburn with Darwen using public transport to travel to school offers a similar journey time to a private vehicle, but this can be up to double the time in some areas.
32 DfT (2020), Journey time statistics: data tables
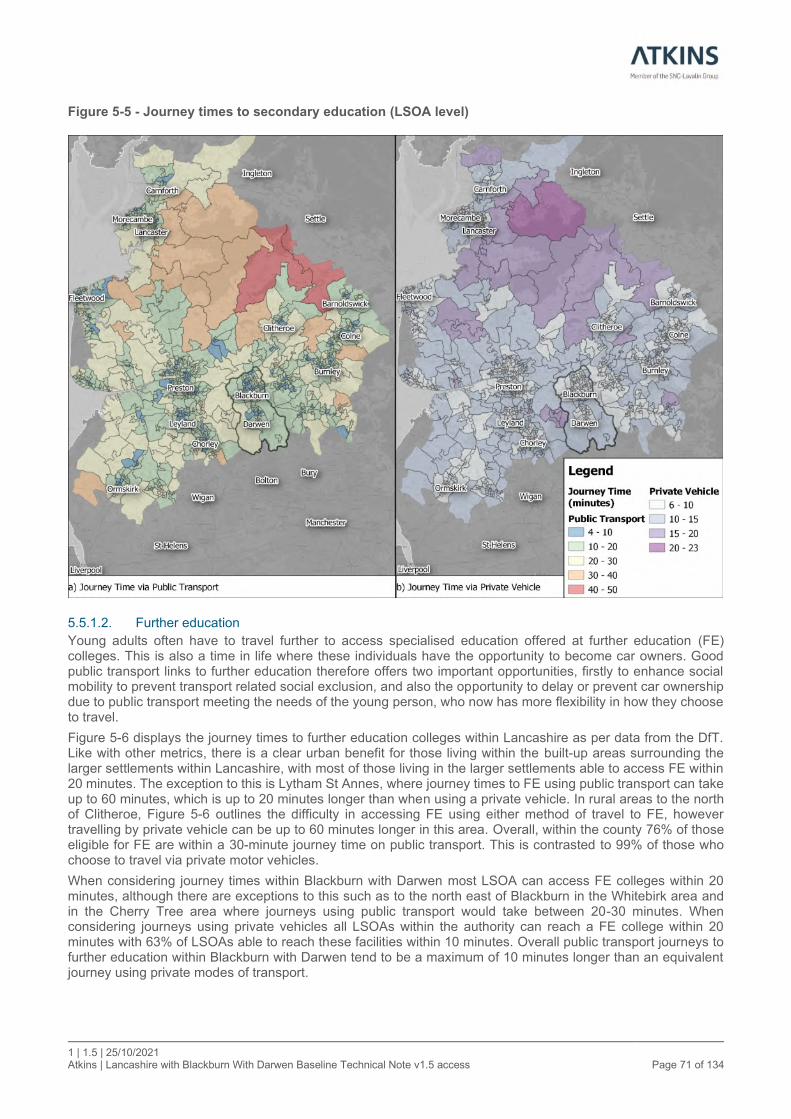
1 | 1.5 | 25/10/2021 Atkins | Lancashire with Blackburn With Darwen Baseline Technical Note v1.5 access Page 71 of 134
Figure 5-5 - Journey times to secondary education (LSOA level)
5.5.1.2. Further education
Young adults often have to travel further to access specialised education offered at further education (FE) colleges. This is also a time in life where these individuals have the opportunity to become car owners. Good public transport links to further education therefore offers two important opportunities, firstly to enhance social mobility to prevent transport related social exclusion, and also the opportunity to delay or prevent car ownership due to public transport meeting the needs of the young person, who now has more flexibility in how they choose to travel.
Figure 5-6 displays the journey times to further education colleges within Lancashire as per data from the DfT. Like with other metrics, there is a clear urban benefit for those living within the built-up areas surrounding the larger settlements within Lancashire, with most of those living in the larger settlements able to access FE within 20 minutes. The exception to this is Lytham St Annes, where journey times to FE using public transport can take up to 60 minutes, which is up to 20 minutes longer than when using a private vehicle. In rural areas to the north of Clitheroe, Figure 5-6 outlines the difficulty in accessing FE using either method of travel to FE, however travelling by private vehicle can be up to 60 minutes longer in this area. Overall, within the county 76% of those eligible for FE are within a 30-minute journey time on public transport. This is contrasted to 99% of those who choose to travel via private motor vehicles.
When considering journey times within Blackburn with Darwen most LSOA can access FE colleges within 20 minutes, although there are exceptions to this such as to the north east of Blackburn in the Whitebirk area and in the Cherry Tree area where journeys using public transport would take between 20-30 minutes. When considering journeys using private vehicles all LSOAs within the authority can reach a FE college within 20 minutes with 63% of LSOAs able to reach these facilities within 10 minutes. Overall public transport journeys to further education within Blackburn with Darwen tend to be a maximum of 10 minutes longer than an equivalent journey using private modes of transport.
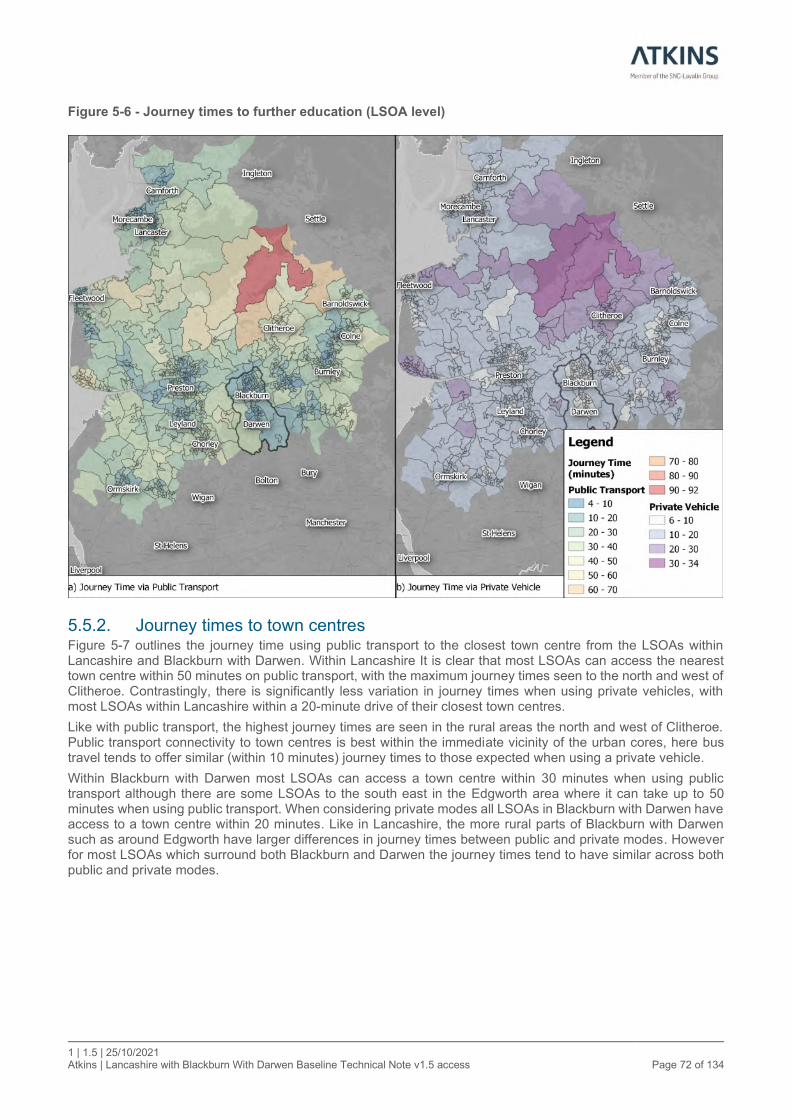
1 | 1.5 | 25/10/2021 Atkins | Lancashire with Blackburn With Darwen Baseline Technical Note v1.5 access Page 72 of 134
Figure 5-6 - Journey times to further education (LSOA level)
5.5.2. Journey times to town centres Figure 5-7 outlines the journey time using public transport to the closest town centre from the LSOAs within Lancashire and Blackburn with Darwen. Within Lancashire It is clear that most LSOAs can access the nearest town centre within 50 minutes on public transport, with the maximum journey times seen to the north and west of Clitheroe. Contrastingly, there is significantly less variation in journey times when using private vehicles, with most LSOAs within Lancashire within a 20-minute drive of their closest town centres.
Like with public transport, the highest journey times are seen in the rural areas the north and west of Clitheroe. Public transport connectivity to town centres is best within the immediate vicinity of the urban cores, here bus travel tends to offer similar (within 10 minutes) journey times to those expected when using a private vehicle.
Within Blackburn with Darwen most LSOAs can access a town centre within 30 minutes when using public transport although there are some LSOAs to the south east in the Edgworth area where it can take up to 50 minutes when using public transport. When considering private modes all LSOAs in Blackburn with Darwen have access to a town centre within 20 minutes. Like in Lancashire, the more rural parts of Blackburn with Darwen such as around Edgworth have larger differences in journey times between public and private modes. However for most LSOAs which surround both Blackburn and Darwen the journey times tend to have similar across both public and private modes.

1 | 1.5 | 25/10/2021 Atkins | Lancashire with Blackburn With Darwen Baseline Technical Note v1.5 access Page 73 of 134
Figure 5-7 - Journey times to town centres (LSOA level)
5.5.3. Journey times to employment centres Figure 5-8 displays journey times to employment centres which employ between 100 and 499 people. The figure outlines that for those in Lancashire who have access to a private vehicle, journey times to such centres are no longer than a maximum of 20 minutes. When considering journeys made by public transport, there is greater variability. To the east of Lancashire in Burnley, Clitheroe and Colne a significant proportion of LSOAs are able to access these employment opportunities within 10 minutes, comparing well to the alternative journey using a private motor vehicle. This is also replicated in Morecambe, Lancaster, Preston and Leyland.
When considering west of Preston, journey times are broadly equitable to journeys made by car, but for the most part take up to 20 minutes. The most pronounced difference in journey times to these employment centres, again is in the north of the county between Lancaster and Clitheroe, here journeys can take up to 29 minutes longer when using public transport, but for the most part take up to 10-15 minutes longer. There are also some LSOAs near Fleetwood, Chorley and Carnforth where journey times via public transport are expected to take 30-40 minutes despite adjacent LSOAs having significantly faster journeys, therefore need and provision should be investigated within these areas.
Regarding Blackburn with Darwen the majority, for those who have access to a private vehicle, the majority of residents can reach an employment site within 10 minutes. However, in more rural LSOAs such as those covering Cherry Tree journey times via private modes are up to 20 minutes. When considering journeys via public transport, there are greater degrees of variability, for example in the urban areas and on the fringes of both Blackburn and Darwen, public transport journey times are broadly comparable to those via private modes. In more rural areas, journeys are slightly longer by around 10 minutes when using public transport.
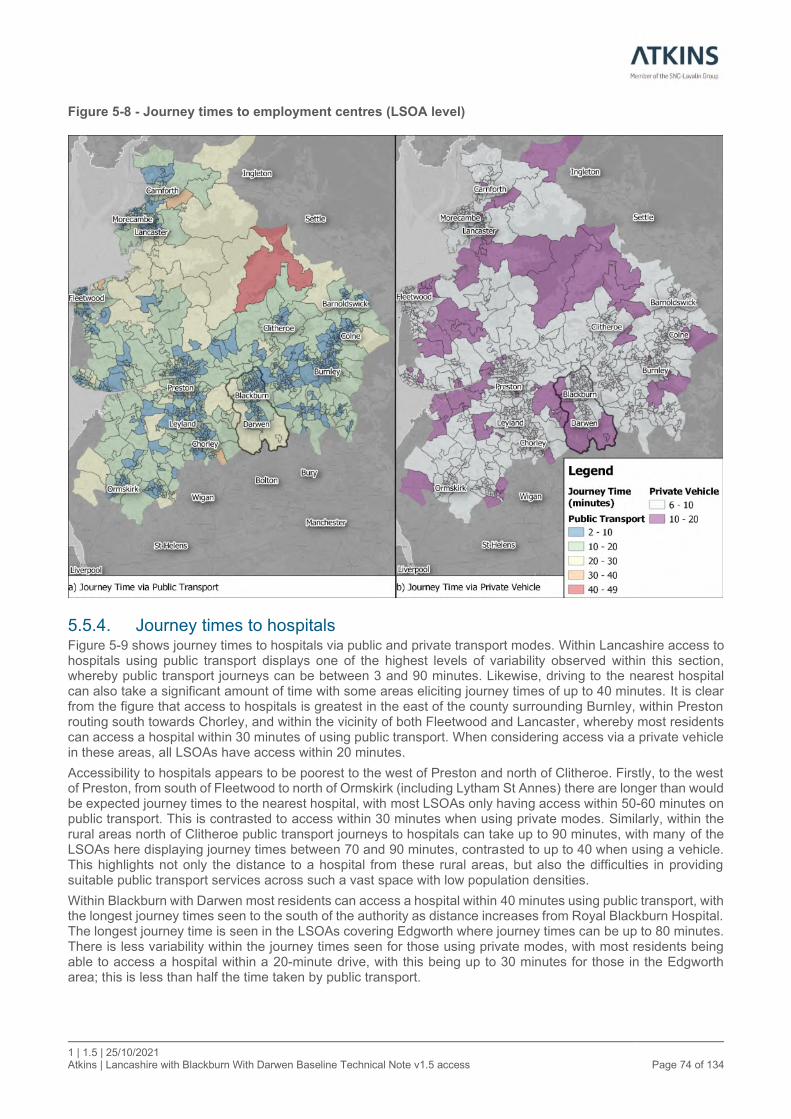
1 | 1.5 | 25/10/2021 Atkins | Lancashire with Blackburn With Darwen Baseline Technical Note v1.5 access Page 74 of 134
Figure 5-8 - Journey times to employment centres (LSOA level)
5.5.4. Journey times to hospitals Figure 5-9 shows journey times to hospitals via public and private transport modes. Within Lancashire access to hospitals using public transport displays one of the highest levels of variability observed within this section, whereby public transport journeys can be between 3 and 90 minutes. Likewise, driving to the nearest hospital can also take a significant amount of time with some areas eliciting journey times of up to 40 minutes. It is clear from the figure that access to hospitals is greatest in the east of the county surrounding Burnley, within Preston routing south towards Chorley, and within the vicinity of both Fleetwood and Lancaster, whereby most residents can access a hospital within 30 minutes of using public transport. When considering access via a private vehicle in these areas, all LSOAs have access within 20 minutes.
Accessibility to hospitals appears to be poorest to the west of Preston and north of Clitheroe. Firstly, to the west of Preston, from south of Fleetwood to north of Ormskirk (including Lytham St Annes) there are longer than would be expected journey times to the nearest hospital, with most LSOAs only having access within 50-60 minutes on public transport. This is contrasted to access within 30 minutes when using private modes. Similarly, within the rural areas north of Clitheroe public transport journeys to hospitals can take up to 90 minutes, with many of the LSOAs here displaying journey times between 70 and 90 minutes, contrasted to up to 40 when using a vehicle. This highlights not only the distance to a hospital from these rural areas, but also the difficulties in providing suitable public transport services across such a vast space with low population densities.
Within Blackburn with Darwen most residents can access a hospital within 40 minutes using public transport, with the longest journey times seen to the south of the authority as distance increases from Royal Blackburn Hospital. The longest journey time is seen in the LSOAs covering Edgworth where journey times can be up to 80 minutes. There is less variability within the journey times seen for those using private modes, with most residents being able to access a hospital within a 20-minute drive, with this being up to 30 minutes for those in the Edgworth area; this is less than half the time taken by public transport.

1 | 1.5 | 25/10/2021 Atkins | Lancashire with Blackburn With Darwen Baseline Technical Note v1.5 access Page 75 of 134
Figure 5-9 - Journey times to hospitals (LSOA level)
5.6. Summary of public transport journey times The journey timed data outlined in Section 5.5 aimed to highlight the spatial breakdown of journey times for the population of individual LSOAs within Lancashire and Blackburn with Darwen based on both private and public transport as the mode option. It is evident that private modes of transport perform better in terms of journey times and consistency of these across both local authorities, which is to be expected. This said, public transport provisions are competitive with private modes, particularly within the urban and suburban areas, where journey times by public transport are often equitable or only slightly longer than the alternative. This is particularly true within Blackburn with Darwen, where the compact nature of the authority means there are not as great distances between facilities as seen in Lancashire.
This section has also outlined the difficulty in providing ample connectivity to opportunities from rural areas such as to the north of Clitheroe, whereby there has been a common theme of large gaps between public and private transport journey times. It is likely that the highly rural nature of the LSOAs in this area mean it is difficult to provide public transport services which serve amenities within a competitive time period of private modes.
Additionally, the data has highlighted large differences in accessibility of hospitals to the west of Preston, in Lytham St Anne and in the south of Blackburn with Darwen. This could therefore be an area where connectivity to the local hospital could be improved. It has also highlighted the importance of strong connectivity to FE colleges and the role this plays not only in social mobility, but also retaining bus patronage.
Overall, for the most part in Lancashire and Blackburn with Darwen the public transport journey time offering can be competitive with private modes, however there are significant opportunities and challenges beyond the urban and suburban areas to improve inclusion and accessibility to key amenities.
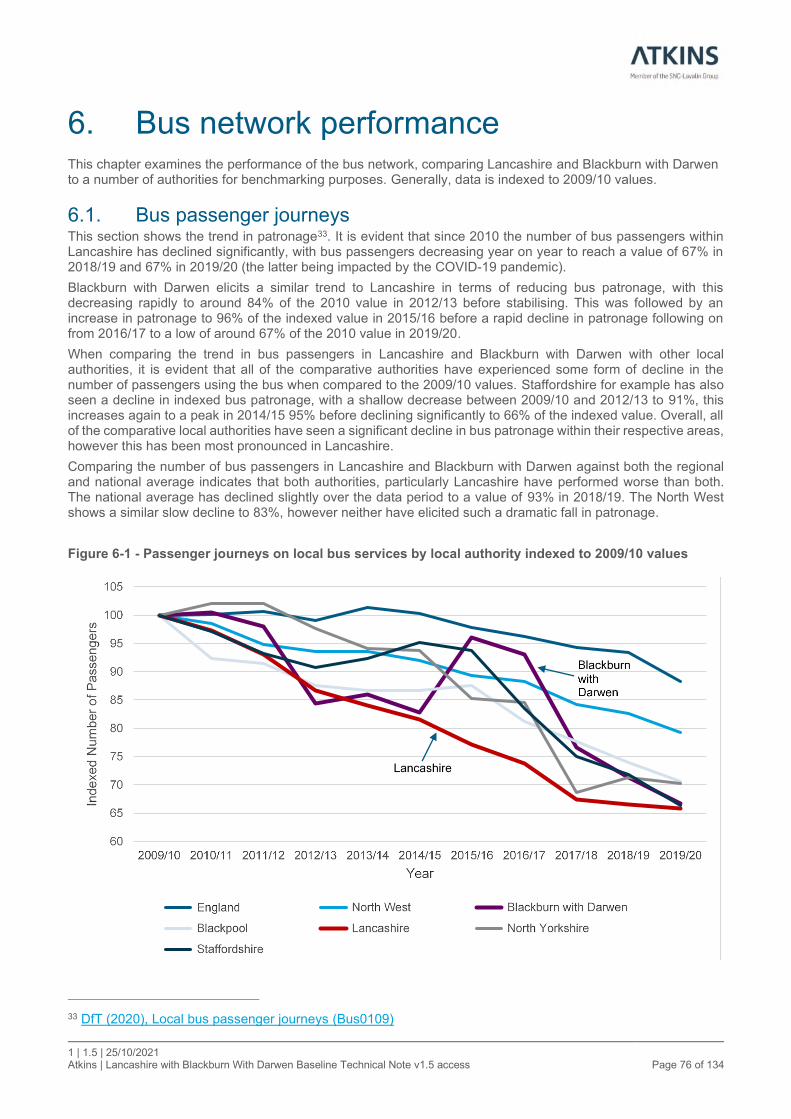
1 | 1.5 | 25/10/2021 Atkins | Lancashire with Blackburn With Darwen Baseline Technical Note v1.5 access Page 76 of 134
6. Bus network performance This chapter examines the performance of the bus network, comparing Lancashire and Blackburn with Darwen to a number of authorities for benchmarking purposes. Generally, data is indexed to 2009/10 values.
6.1. Bus passenger journeys This section shows the trend in patronage33. It is evident that since 2010 the number of bus passengers within Lancashire has declined significantly, with bus passengers decreasing year on year to reach a value of 67% in 2018/19 and 67% in 2019/20 (the latter being impacted by the COVID-19 pandemic).
Blackburn with Darwen elicits a similar trend to Lancashire in terms of reducing bus patronage, with this decreasing rapidly to around 84% of the 2010 value in 2012/13 before stabilising. This was followed by an increase in patronage to 96% of the indexed value in 2015/16 before a rapid decline in patronage following on from 2016/17 to a low of around 67% of the 2010 value in 2019/20.
When comparing the trend in bus passengers in Lancashire and Blackburn with Darwen with other local authorities, it is evident that all of the comparative authorities have experienced some form of decline in the number of passengers using the bus when compared to the 2009/10 values. Staffordshire for example has also seen a decline in indexed bus patronage, with a shallow decrease between 2009/10 and 2012/13 to 91%, this increases again to a peak in 2014/15 95% before declining significantly to 66% of the indexed value. Overall, all of the comparative local authorities have seen a significant decline in bus patronage within their respective areas, however this has been most pronounced in Lancashire.
Comparing the number of bus passengers in Lancashire and Blackburn with Darwen against both the regional and national average indicates that both authorities, particularly Lancashire have performed worse than both. The national average has declined slightly over the data period to a value of 93% in 2018/19. The North West shows a similar slow decline to 83%, however neither have elicited such a dramatic fall in patronage.
Figure 6-1 - Passenger journeys on local bus services by local authority indexed to 2009/10 values
33 DfT (2020), Local bus passenger journeys (Bus0109)
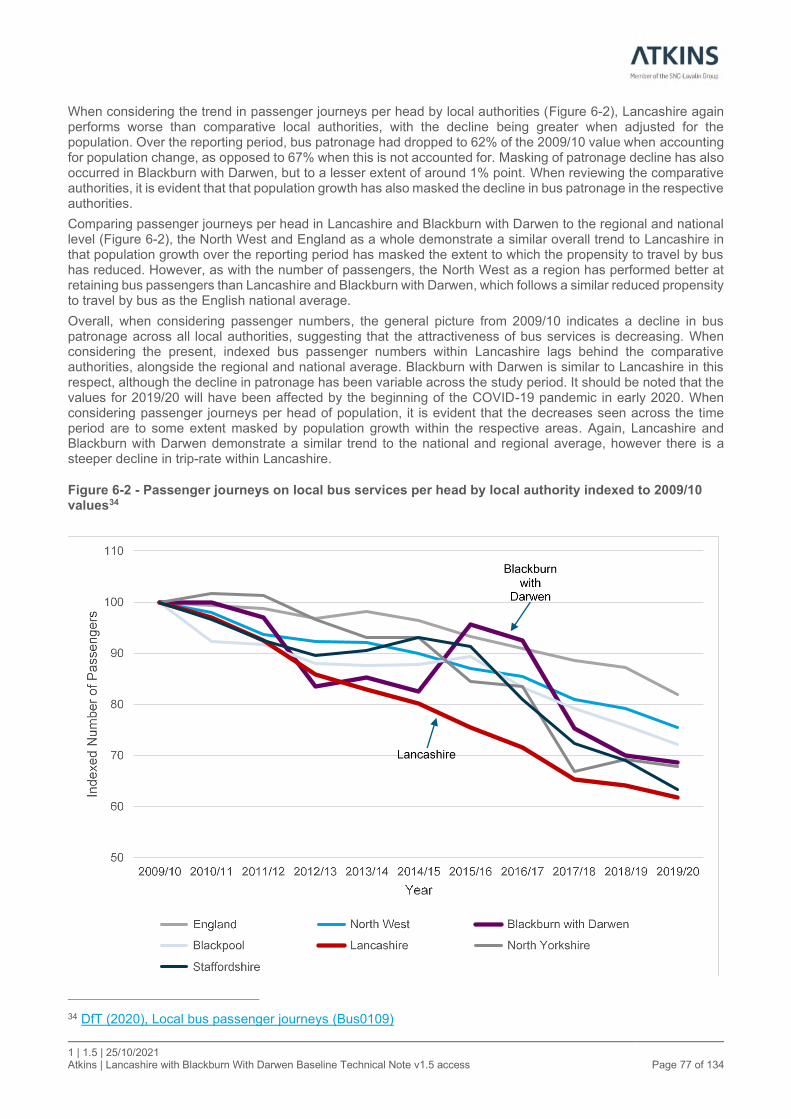
1 | 1.5 | 25/10/2021 Atkins | Lancashire with Blackburn With Darwen Baseline Technical Note v1.5 access Page 77 of 134
When considering the trend in passenger journeys per head by local authorities (Figure 6-2), Lancashire again performs worse than comparative local authorities, with the decline being greater when adjusted for the population. Over the reporting period, bus patronage had dropped to 62% of the 2009/10 value when accounting for population change, as opposed to 67% when this is not accounted for. Masking of patronage decline has also occurred in Blackburn with Darwen, but to a lesser extent of around 1% point. When reviewing the comparative authorities, it is evident that that population growth has also masked the decline in bus patronage in the respective authorities.
Comparing passenger journeys per head in Lancashire and Blackburn with Darwen to the regional and national level (Figure 6-2), the North West and England as a whole demonstrate a similar overall trend to Lancashire in that population growth over the reporting period has masked the extent to which the propensity to travel by bus has reduced. However, as with the number of passengers, the North West as a region has performed better at retaining bus passengers than Lancashire and Blackburn with Darwen, which follows a similar reduced propensity to travel by bus as the English national average.
Overall, when considering passenger numbers, the general picture from 2009/10 indicates a decline in bus patronage across all local authorities, suggesting that the attractiveness of bus services is decreasing. When considering the present, indexed bus passenger numbers within Lancashire lags behind the comparative authorities, alongside the regional and national average. Blackburn with Darwen is similar to Lancashire in this respect, although the decline in patronage has been variable across the study period. It should be noted that the values for 2019/20 will have been affected by the beginning of the COVID-19 pandemic in early 2020. When considering passenger journeys per head of population, it is evident that the decreases seen across the time period are to some extent masked by population growth within the respective areas. Again, Lancashire and Blackburn with Darwen demonstrate a similar trend to the national and regional average, however there is a steeper decline in trip-rate within Lancashire.
Figure 6-2 - Passenger journeys on local bus services per head by local authority indexed to 2009/10 values34
34 DfT (2020), Local bus passenger journeys (Bus0109)
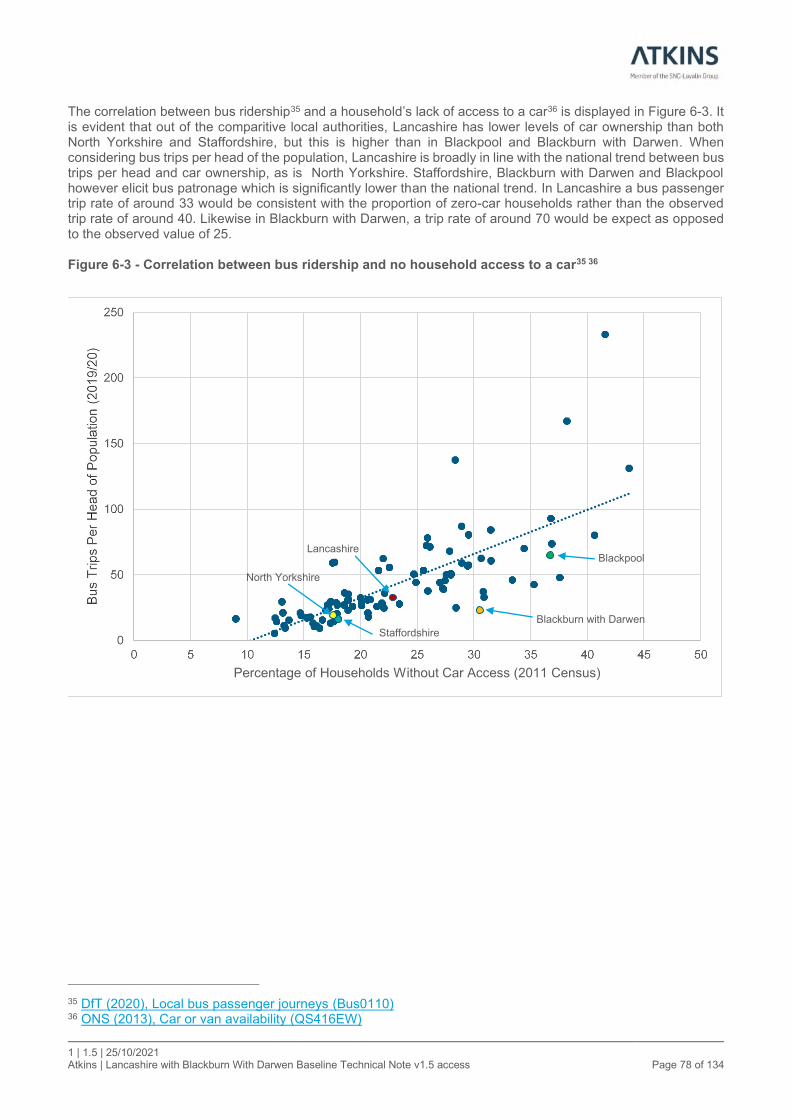
1 | 1.5 | 25/10/2021 Atkins | Lancashire with Blackburn With Darwen Baseline Technical Note v1.5 access Page 78 of 134
The correlation between bus ridership35 and a household’s lack of access to a car36 is displayed in Figure 6-3. It is evident that out of the comparitive local authorities, Lancashire has lower levels of car ownership than both North Yorkshire and Staffordshire, but this is higher than in Blackpool and Blackburn with Darwen. When considering bus trips per head of the population, Lancashire is broadly in line with the national trend between bus trips per head and car ownership, as is North Yorkshire. Staffordshire, Blackburn with Darwen and Blackpool however elicit bus patronage which is significantly lower than the national trend. In Lancashire a bus passenger trip rate of around 33 would be consistent with the proportion of zero-car households rather than the observed trip rate of around 40. Likewise in Blackburn with Darwen, a trip rate of around 70 would be expect as opposed to the observed value of 25. Figure 6-3 - Correlation between bus ridership and no household access to a car35 36
35 DfT (2020), Local bus passenger journeys (Bus0110) 36 ONS (2013), Car or van availability (QS416EW)
Blackburn with Darwen
Blackpool Lancashire
Staffordshire
North Yorkshire
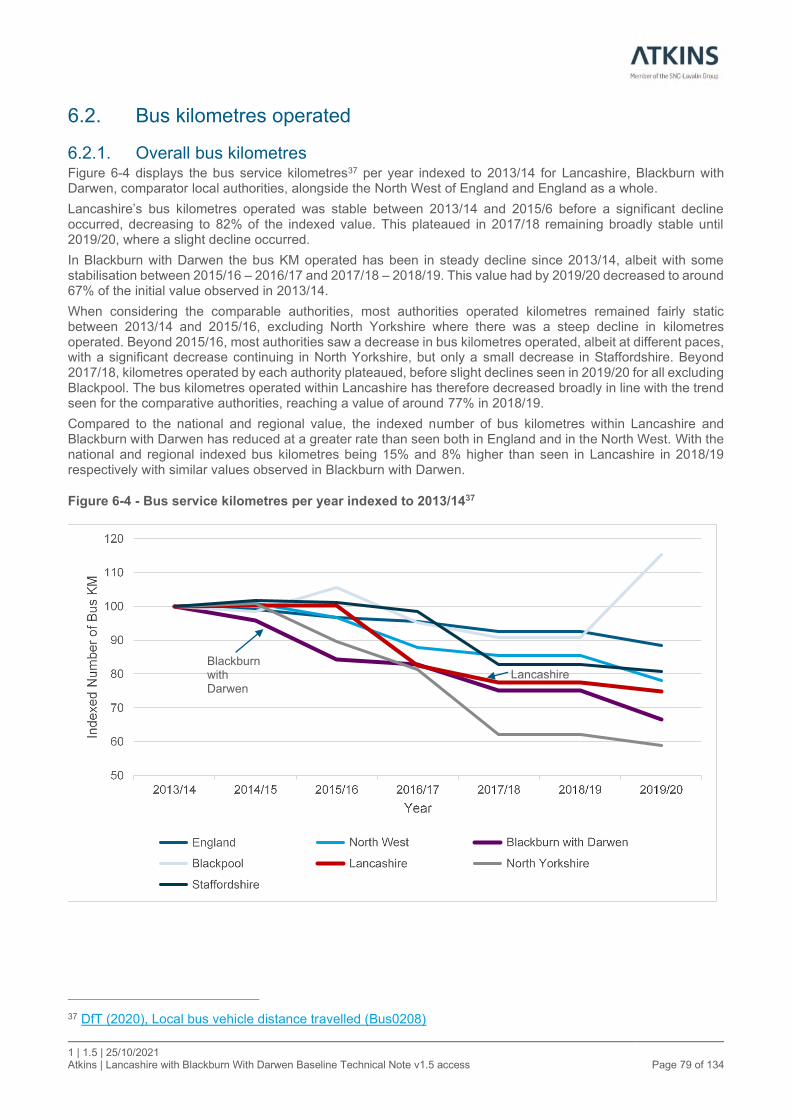
1 | 1.5 | 25/10/2021 Atkins | Lancashire with Blackburn With Darwen Baseline Technical Note v1.5 access Page 79 of 134
6.2. Bus kilometres operated
6.2.1. Overall bus kilometres Figure 6-4 displays the bus service kilometres37 per year indexed to 2013/14 for Lancashire, Blackburn with Darwen, comparator local authorities, alongside the North West of England and England as a whole.
Lancashire’s bus kilometres operated was stable between 2013/14 and 2015/6 before a significant decline occurred, decreasing to 82% of the indexed value. This plateaued in 2017/18 remaining broadly stable until 2019/20, where a slight decline occurred.
In Blackburn with Darwen the bus KM operated has been in steady decline since 2013/14, albeit with some stabilisation between 2015/16 – 2016/17 and 2017/18 – 2018/19. This value had by 2019/20 decreased to around 67% of the initial value observed in 2013/14.
When considering the comparable authorities, most authorities operated kilometres remained fairly static between 2013/14 and 2015/16, excluding North Yorkshire where there was a steep decline in kilometres operated. Beyond 2015/16, most authorities saw a decrease in bus kilometres operated, albeit at different paces, with a significant decrease continuing in North Yorkshire, but only a small decrease in Staffordshire. Beyond 2017/18, kilometres operated by each authority plateaued, before slight declines seen in 2019/20 for all excluding Blackpool. The bus kilometres operated within Lancashire has therefore decreased broadly in line with the trend seen for the comparative authorities, reaching a value of around 77% in 2018/19.
Compared to the national and regional value, the indexed number of bus kilometres within Lancashire and Blackburn with Darwen has reduced at a greater rate than seen both in England and in the North West. With the national and regional indexed bus kilometres being 15% and 8% higher than seen in Lancashire in 2018/19 respectively with similar values observed in Blackburn with Darwen.
Figure 6-4 - Bus service kilometres per year indexed to 2013/1437
37 DfT (2020), Local bus vehicle distance travelled (Bus0208)
Lancashire Blackburn with Darwen

1 | 1.5 | 25/10/2021 Atkins | Lancashire with Blackburn With Darwen Baseline Technical Note v1.5 access Page 80 of 134
6.2.2. Supported Bus Service Kilometres When considering supported kilometres operated in the local authority areas38 (Figure 6-5), the proportion of supported bus kilometres in Lancashire decreased from 2013/14 to 2016/17 before slightly recovering and stabilising beyond 2017/18. This initially a result of an increase in commercially operated kilometres between 2013-15 before a significant decrease in supported kilometres by 2 million kilometres in 2014-16 and then a further decrease of around 4 million km in 2016/17.
This alongside a slight increase in commercially operated services in 2015/16 and a significant decrease in commercial services which masked the percentage reduction of supported services in 2016/17. The increase in the proportion of supported bus kilometres was a result of a slight increase in supported bus kilometres alongside a further reduction of commercially operated kilometres. Beyond this period, the number of commercial and supported kilometres remained broadly the same, explaining the plateau in the proportion of supported bus kilometres.
Regarding Blackburn with Darwen, supported bus kilometres accounted for 15% of overall kilometres in 2013/14 before declining gradually to 10% in 2016/17 as a result of almost halving of the supported bus kilometres alongside a reduction in commercially operated bus kilometres – this masked the true reduction in supported bus kilometres. Supported kilometres increased again to 12% and plateaued until 2018/19 as a result of an increase in the number of supported bus kilometres alongside a reduction of commercial kilometres by around 200,000km. After this point, the data suggests that in 2019/20 there was a large fall in supported kilometres within Blackburn with Darwen to below 100,000km per year, leading to only 1% of bus kilometres being supported by the local authority.
When considering the comparable local authorities, it is evident that across the given time period they have all seen a reduction in the proportion of bus services kilometres supported. Suggesting a broader trend of reducing funding for these services. For the most part, the trend of reducing supported bus kilometres is similar across all of the other local authorities considered, with North Yorkshire having the highest proportion of service kilometres which are supported.
The proportion of supported bus kilometres within Lancashire is broadly consistent with both the national and regional, with Blackburn with Darwen generally slightly below this (assuming 2019/20 is an outlier). When considering the national trend, it is clear that the number of commercially operated vehicle kilometres has remained fairly constant, but the decrease in bus kilometres has been a result of the reduction in supported services. The North West region shows a similar trend however a fall in commercial service kilometres has masked the extent to which supported bus kilometres has reduced (Figure 6-5).
38 DfT (2020), Local bus vehicle distance travelled (Bus0208)

1 | 1.5 | 25/10/2021 Atkins | Lancashire with Blackburn With Darwen Baseline Technical Note v1.5 access Page 81 of 134
Figure 6-5 - Supported bus service kilometres as a proportion of total bus service kilometres
Lancashire
Blackburn with Darwen

1 | 1.5 | 25/10/2021 Atkins | Lancashire with Blackburn With Darwen Baseline Technical Note v1.5 access Page 82 of 134
6.3. Concessionary passenger journeys Figure 6-6 displays the percentage of passenger journeys within each area which were concessionary journeys39. It is evident that the proportion of concessionary journeys within Lancashire is slightly ahead of the national and North West regional average by 13% and 4% respectively, but the proportion of concessionary journeys is lower than the comparator authorities.
When considering Blackburn with Darwen, again the authority is ahead of the local and national averages, however concessionary travel is lower in Lancashire. The proportion of concessionary journeys in Blackburn with Darwen is the 3rd highest of the authorities reviewed.
The percentage of concessionary passengers gives an indication of the extent to which the bus network is used by fare-paying passengers. In the case of Lancashire, around one third of passengers uses an ENCTS bus pass, which implies that around three out of four passengers are paying a fare. This is a significantly higher proportion of fare payers than in North Yorkshire and Blackburn with Darwen.
Figure 6-6 - Concessionary passenger journeys as a percentage of all passenger journeys (2018/19)
39 DfT (2020), Bus Statistics (Bus0823)

1 | 1.5 | 25/10/2021 Atkins | Lancashire with Blackburn With Darwen Baseline Technical Note v1.5 access Page 83 of 134
6.4. Bus service density TRACC accessibility software has been used to calculate the average number of buses per hour calling at bus stops during AM peak for the January 2020 and April 2021 bus timetables as per the data recorded in the National Public Transport Data Repository40.
6.4.1. Pre-COVID (January 2020) Figure 6-7 displays the average number of buses calling at bus stops in Lancashire and Blackburn with Darwen during the January 2020 timetable. Regarding Lancashire, the figure outlines that the county is relatively well connected, with a range of bus corridors having highly frequent services. It is evident that during the morning peak period, Lancashire currently has good levels of connectivity between some of the key urban centres. Within Burnley, Preston and Lancaster there are very frequent buses (11-27) running into the centre of the areas. Within Burnley these high frequencies are seen along the A682 and the A671 both in and out of the town. Within Preston there are high frequencies coming into the city from each cardinal point, with high frequencies seen at bus stops along examples such as the B6243, the A59 and the A6, these buses summate into the highest frequency category within the city centre. Regarding Lancaster, these high frequency services are seen from Torrisholme in the north along the B5321 and from Lancaster University in the south along the A6; before summating into the highest frequency category within the city centre.
Within Blackburn with Darwen the most frequent bus corridors are along the A666 where there are on average 5-11 bus services per hour during the AM peak, additionally there are high frequency services along the A678 and A679 approaching Blackburn from the west, with these A roads summating to achieve 11-27 services in central Blackburn approaching the bus station.
Table 6-1 outlines frequency of buses along bus corridors in Lancashire and Blackburn with Darwen.
Maps representing the local scale of bus stop frequencies are available in Appendix A.
40 Basemap (2021), National Public Transport Data Repository
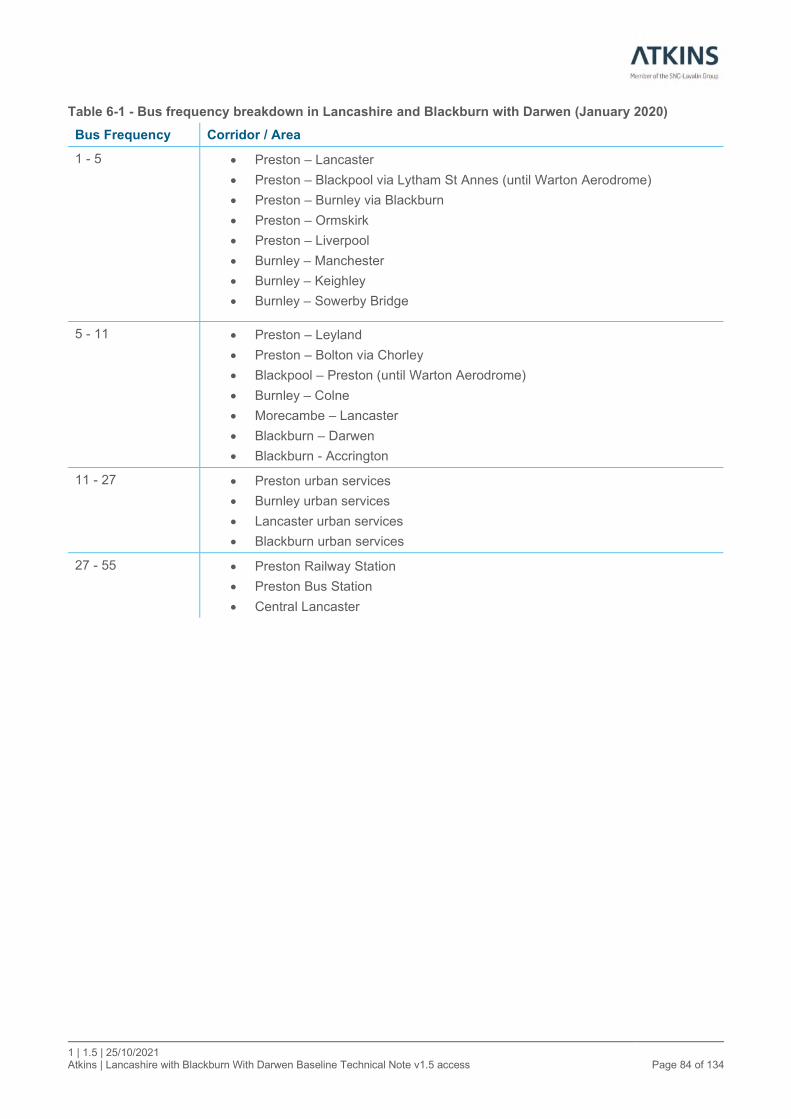
1 | 1.5 | 25/10/2021 Atkins | Lancashire with Blackburn With Darwen Baseline Technical Note v1.5 access Page 84 of 134
Table 6-1 - Bus frequency breakdown in Lancashire and Blackburn with Darwen (January 2020)
Bus Frequency Corridor / Area
1 - 5 • Preston – Lancaster
• Preston – Blackpool via Lytham St Annes (until Warton Aerodrome)
• Preston – Burnley via Blackburn
• Preston – Ormskirk
• Preston – Liverpool
• Burnley – Manchester
• Burnley – Keighley
• Burnley – Sowerby Bridge
5 - 11 • Preston – Leyland
• Preston – Bolton via Chorley
• Blackpool – Preston (until Warton Aerodrome)
• Burnley – Colne
• Morecambe – Lancaster
• Blackburn – Darwen
• Blackburn - Accrington
11 - 27 • Preston urban services
• Burnley urban services
• Lancaster urban services
• Blackburn urban services
27 - 55 • Preston Railway Station
• Preston Bus Station
• Central Lancaster

1 | 1.5 | 25/10/2021 Atkins | Lancashire with Blackburn With Darwen Baseline Technical Note v1.5 access Page 85 of 134
Figure 6-7 - Average bus stop frequency (AM Peak - January 2020)
1 | 1.5 | 25/10/2021 Atkins | Lancashire with Blackburn With Darwen Baseline Technical Note v1.5 access Page 86 of 134
6.4.2. Current bus service density (April 2021) April 2021 represents a period where the provision of bus services continued to be operated at a reduced scale due to the reduction of bus patronage induced by the COVID-19 pandemic. Figure 6-8 outlines the bus frequencies within Lancashire and Blackburn with Darwen during this period of reduced services.
From the figure it is clear that there was some reduction in bus services across Lancashire, for example:
• Within Lancaster the number of bus services within the town centre decreased from 27-55 on average per hour, to between 11-27 on average per hour;
• The frequency of buses running along the corridor between Preston and Bolton also reduced to 1-5 buses per hour, as opposed to 5-11;
• Buses between Liverpool and Ormskirk reduced from 5-11 services per hour to 1-5; and
• Services in and around Burnley also reduced.
When considering Blackburn with Darwen, Figure 6-8 suggests that there were not any drastic service reductions within the district, with most bus stops remaining in the category they were in in January 2020. There is one exception to this, with a reduction in frequency seen on the number 4 bus serving Mill Hill.
The figure does not represent some small adjustments made to the headway of bus services within the local authorities but captures those with the greatest decrease in bus services. This appears to be more pronounced on the higher frequency urban and inter-urban services within Lancashire which have higher capacity and scope for service reductions than less frequent rural services.
Overall, on average the total of bus services operated within Lancashire during an average AM peak hour reduced by 8% between January 2020 and April 2021, whereas the same value reduced by 27% in Blackburn with Darwen. This indicates that there was a slight reduction in services within Lancashire, however within Blackburn with Darwen it appears that between January 2020 and April 2021 many services were reduced to operate less frequently, but not to an extent which impacted overall bus stop frequency significantly.
Maps representing the local scale of bus stop frequencies are available in Appendix A.
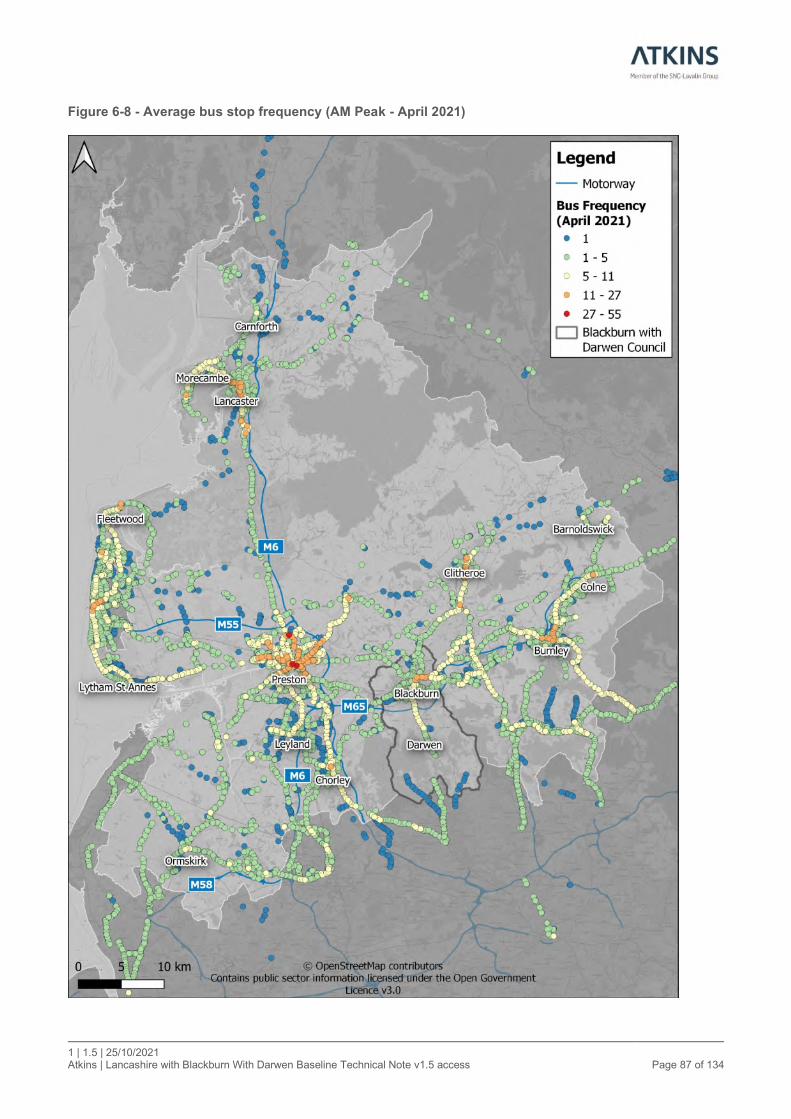
1 | 1.5 | 25/10/2021 Atkins | Lancashire with Blackburn With Darwen Baseline Technical Note v1.5 access Page 87 of 134
Figure 6-8 - Average bus stop frequency (AM Peak - April 2021)

1 | 1.5 | 25/10/2021 Atkins | Lancashire with Blackburn With Darwen Baseline Technical Note v1.5 access Page 88 of 134
6.5. Bus service support
6.5.1. Lancashire Lancashire County Council currently has 39 contracts to provide 68 differing socially necessary bus services41. these contracts cost the council £11.5 million per annum and are estimated to support 2.2 million passenger journeys per year. The net cost – after fare-paying revenue and concessionary travel reimbursement – is expected to be around £7.8m.
In 2020 Lancashire County Council was successful in securing additional funding for its supported network from the DfTs a better deal for bus users, with the council continuing with the planned service improvements despite the impacts of the COVID 19 Pandemic on bus patronage. When this funding ended in 2021, the county council committed funding to retain the enhanced services with further strengthening of the network in May 2021; this means that the majority of smaller settlements within Lancashire have a bus service to their nearest town or city.
Table 6-2 displays the breakdown of the periods in which these bus services are supported with Figure 6-9 outlining the spatial distribution of these supported services.
From this information, it is clear that Lancashire County Council make a significant contribution to the maintenance of socially necessary bus services within the county and is committed to such services. This is particularly evident with the connectivity seen to the primary urban areas of Preston, Lancaster and Burnley.
Table 6-2 - Summary of bus services supported by Lancashire County Council
Period Supported Number of Services Value (£ Million)
Daily 16 4.90
Monday – Friday Daytime 1 0.10
Monday – Saturday Daytime 35 5.90
Monday to Saturday Daytime & Summer Sundays 5 0.50
Monday to Saturday Evenings & Sundays 3 0.10
Saturdays, Sundays and Bank Holidays 1 0.01
Sundays and Bank Holidays 7 0.10
Expenditure on the English National Concessionary Travel Scheme by Lancashire County Council was over £17 million in the 2019/2020 financial year.
41 Lancashire County Council (2021), LCC Tendered Bus Services Contracts (September 2021)
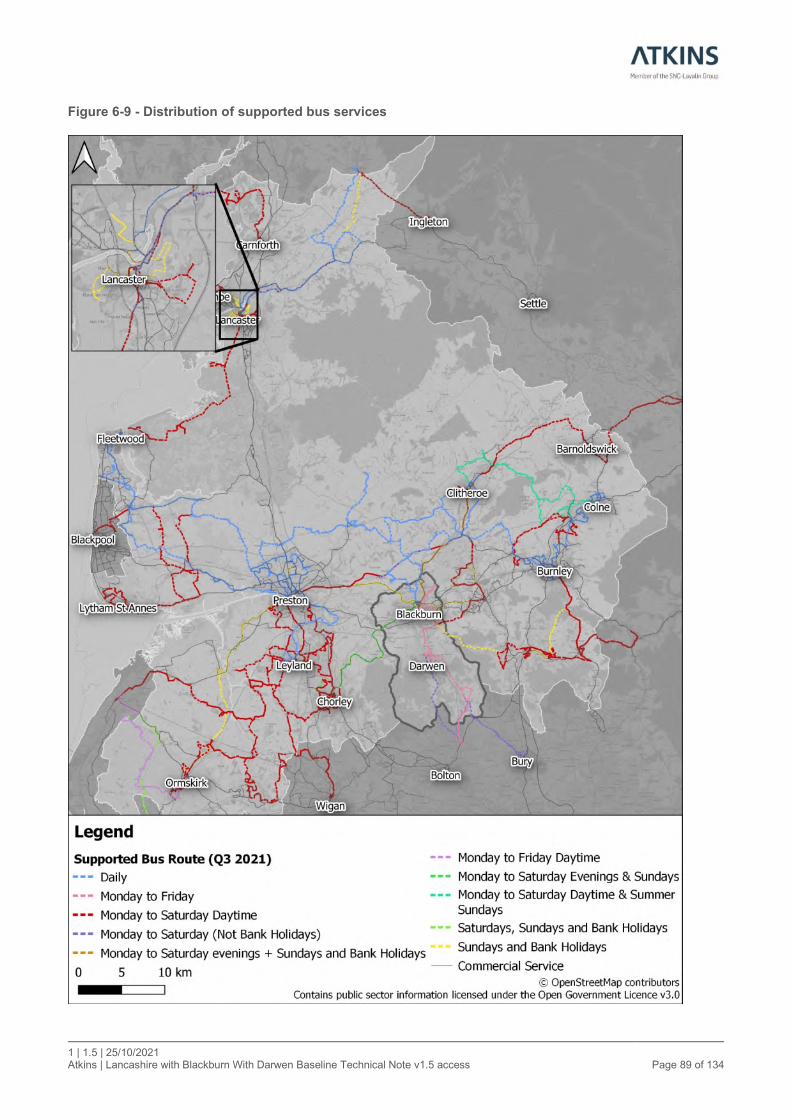
1 | 1.5 | 25/10/2021 Atkins | Lancashire with Blackburn With Darwen Baseline Technical Note v1.5 access Page 89 of 134
Figure 6-9 - Distribution of supported bus services
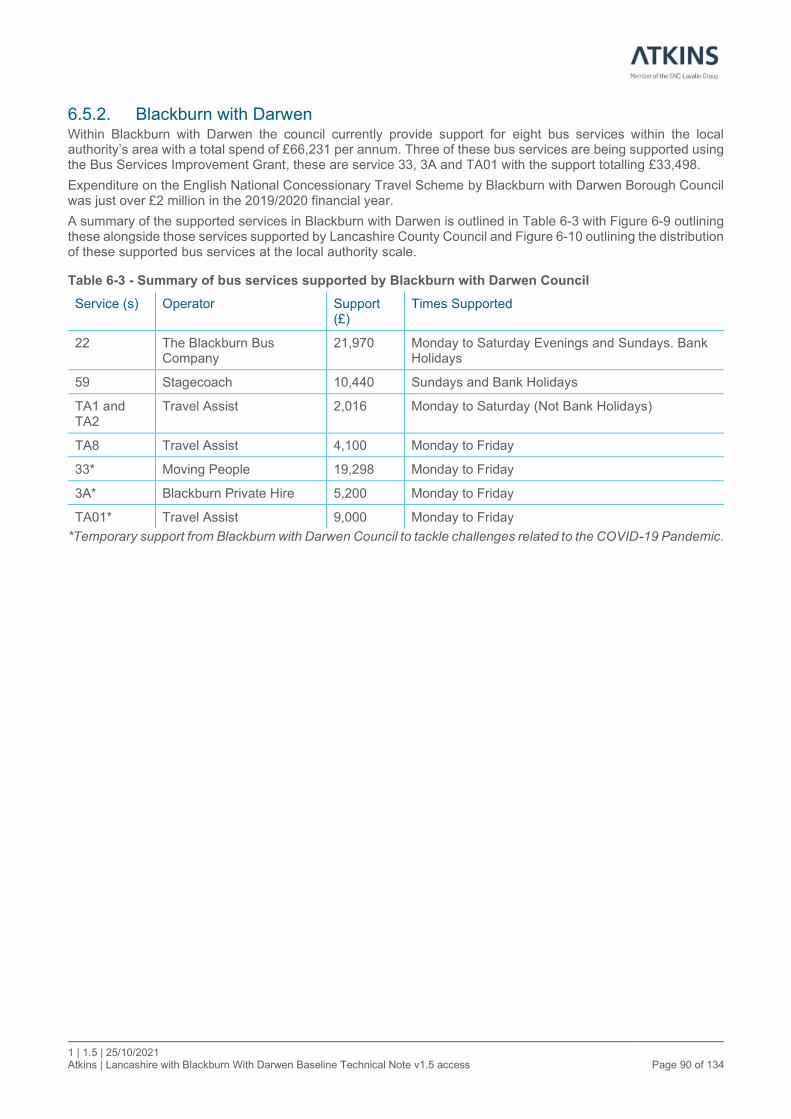
1 | 1.5 | 25/10/2021 Atkins | Lancashire with Blackburn With Darwen Baseline Technical Note v1.5 access Page 90 of 134
6.5.2. Blackburn with Darwen Within Blackburn with Darwen the council currently provide support for eight bus services within the local authority’s area with a total spend of £66,231 per annum. Three of these bus services are being supported using the Bus Services Improvement Grant, these are service 33, 3A and TA01 with the support totalling £33,498.
Expenditure on the English National Concessionary Travel Scheme by Blackburn with Darwen Borough Council was just over £2 million in the 2019/2020 financial year.
A summary of the supported services in Blackburn with Darwen is outlined in Table 6-3 with Figure 6-9 outlining these alongside those services supported by Lancashire County Council and Figure 6-10 outlining the distribution of these supported bus services at the local authority scale.
Table 6-3 - Summary of bus services supported by Blackburn with Darwen Council
Service (s) Operator Support (£)
Times Supported
22 The Blackburn Bus Company
21,970 Monday to Saturday Evenings and Sundays. Bank Holidays
59 Stagecoach 10,440 Sundays and Bank Holidays
TA1 and TA2
Travel Assist 2,016 Monday to Saturday (Not Bank Holidays)
TA8 Travel Assist 4,100 Monday to Friday
33* Moving People 19,298 Monday to Friday
3A* Blackburn Private Hire 5,200 Monday to Friday
TA01* Travel Assist 9,000 Monday to Friday
*Temporary support from Blackburn with Darwen Council to tackle challenges related to the COVID-19 Pandemic.
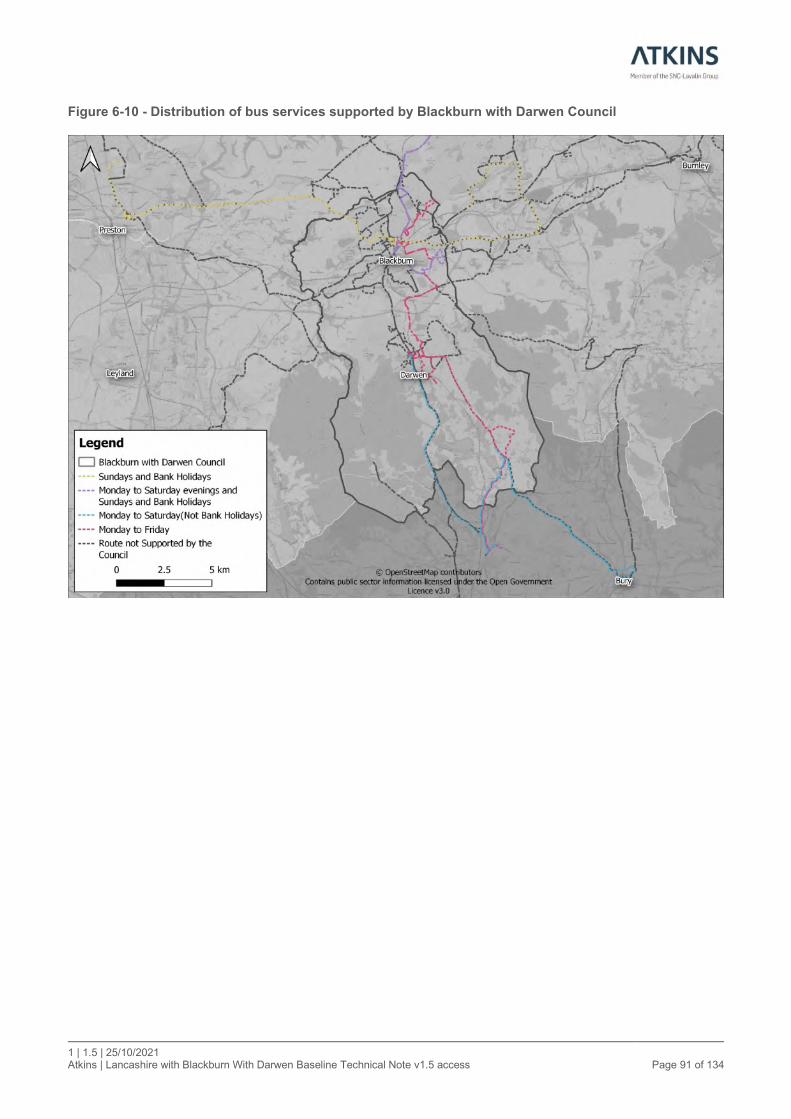
1 | 1.5 | 25/10/2021 Atkins | Lancashire with Blackburn With Darwen Baseline Technical Note v1.5 access Page 91 of 134
Figure 6-10 - Distribution of bus services supported by Blackburn with Darwen Council

1 | 1.5 | 25/10/2021 Atkins | Lancashire with Blackburn With Darwen Baseline Technical Note v1.5 access Page 92 of 134
6.6. Bus priority measures
6.6.1. Lancashire Within Lancashire there are currently 17 bus priority measures in operation across the county, with most of these in operation throughout the day (Figure 6-11).
To avoid misuse of the bus priority infrastructure within Lancashire, a number of bus priority areas and bus lanes are enforced by an ANPR camera system.
The current bus priority measures within Lancashire are summarised in Table 6-4.
Table 6-4 - Bus priority within Lancashire
Road Name Location Type of Bus Priority
Fishergate and Fishergate Hill Preston Bus lane
Tithebarn Street Preston Bus lane (Preston Bus Station)
Ringway Preston Bus right turn only
Broughton Broughton Bus gate
Greyhound Bridge Lancaster Bus lane
Morecambe Road Lancaster Bus lane
Skerton Bridge Lancaster Bus gate
Spring Garden Street Lancaster Bus and access only
Chapel Street and Damside Street Lancaster Bus and access only
Owen Road/Parliament Street Lancaster Bus lane
Whalley Road Accrington Bus lane
Accrington Bus Station Accrington Bus gate and bus lane
A678 Whitebirk approach (partially in Blackburn with Darwen) Whitebirk Bus lane
Whalley Road on approach to Sparth House/Road Accrington Bus lane
Westway (Junction 10) Burnley Bus lane
Church Street Burnley Bus lane
Padiham Road Burnley Bus lane
6.6.2. Blackburn with Darwen There are approximately 3.3km of bus lanes and several junctions incorporating bus priority within Blackburn with Darwen. Many of these were delivered as part of the Pennine Reach scheme and most of the bus priority measures are in operation throughout the day.
To enable the effective operation of bus services within Blackburn with Darwen, a number of bus priority areas and bus lanes are enforced by an ANPR camera system.
Table 6-5 outlines the existing bus lanes within Blackburn with Darwen with Figure 6-11 displaying their location.
Alongside bus lanes, Blackburn with Darwen also features several bus priority measures, particularly along the Pennine Reach routes where the junctions have been upgraded to incorporate intelligent systems linking them together with SCOOT technology. Many of these junctions include bus priority measures with dedicated bus lanes or bus gates, while others are able to identify a bus approaching the junction using GPS and adjust the signal phasing and staging to allow the bus to pass quickly through the junction.
Bus priority measures are provided at the following junctions:
• Higher Eanam / A678 Copy Nook

1 | 1.5 | 25/10/2021 Atkins | Lancashire with Blackburn With Darwen Baseline Technical Note v1.5 access Page 93 of 134
• Carl Fogarty Way / A678 Accrington Road
• Burnley Road / Carl Fogarty Way
• A666 Bolton Road / Branch Road
• A666 Bolton Road / Livesey Branch Road / Kidder Street
• A666 Larkhill / Barbara Castle Way
Other junctions with bus detection capability include:
• A666 Blackburn Road / Hollins Grove Street / Earnsdale Road
• A666 Blackburn Road / Earcroft Way
• A666 Alan Shearer Way / Aqueduct Road / Bolton Road
Table 6-5 - Bus lanes within Blackburn with Darwen
Road Name Extent of Reserved Lane
Direction of Flow
Times of Operation
Class of Vehicle Exempt
Length (m)
Green Street, Darwen
From Arch Street to Police Street
Northbound At any time
Local scheduled service buses
125m
Bolton Road, Blackburn
Between Aqueduct Road and Calico Street
Northbound and Southbound
At any time
Local scheduled service buses, cycles and authorised vehicles
135m
Saint Pauls Street, Blackburn
From University Close to Saint Paul’s Ave
Eastbound and Westbound
At any time
Local scheduled service buses, cycles and authorised vehicles
150m
Bolton Road, Blackburn
From 14m south of Ferguson Street for a distance of 145 metres
Northbound At any time
Local scheduled service buses and cycles
145m
Bolton Road, Darwen
From Wraith Street to 10m north of Hardman Way
Northbound At any time
Local scheduled service buses and cycles
150m
Bolton Road, Blackburn
From 50m north of Tweed Street for 80m
Northbound At any time
Local scheduled service buses and cycles
80m
Bolton Road, Blackburn
From the Red Lion Roundabout for 200m
Eastbound At any time
Local scheduled service buses, hackney carriages, and cycles
200m
Blackburn Road, Darwen
From Hector Road to Moss Fold Road
Northbound Mon-Sat 7:00am-7:00pm
Local scheduled service buses, hackney carriages, and cycles
110m
Lark Hill, Blackburn
From Barbara Castle Way for a distance of 50m
Southbound At any time
Local scheduled service buses, hackney carriages, and cycles
50m

1 | 1.5 | 25/10/2021 Atkins | Lancashire with Blackburn With Darwen Baseline Technical Note v1.5 access Page 94 of 134
Preston Old Road, Blackburn
From 15m north-east of St Francis Road to 20m east of Grant Road
Eastbound Mon-Sat 7:30am-9:00am
Local scheduled service buses, hackney carriages, and cycles
430m
Copy Nook, Blackburn
From Bottomgate to 50m east of Higher Audley Street
Westbound At any time
Local scheduled service buses and cycles
120m
Bottomgate, Blackburn
Entire length Eastbound and Westbound
At any time
Local scheduled service buses and cycles
260m
Furthergate, Blackburn
From Accrington Road to Bottomgate
Westbound At any time
Local scheduled service buses and cycles
210m
Burnley Way, Blackburn
From Gorse Street to Furthergate
Westbound At any time
Local scheduled service buses and cycles
200m
Accrington Road, Blackburn
From 25m west of Crosston Street to Furthergate
Westbound At any time
Local scheduled service buses and cycles
115m
Eanam, Blackburn
From Barbara Castle Way to Copy Nook
Eastbound At any time
Local scheduled service buses and cycles
480m
Jubilee Street, Blackburn
From Bridge Street westbound for 35m
Westbound At any time
Local scheduled service buses, hackney carriages, and cycles
35m
Penny Street, Blackburn
From Salford to Starkie Street
Northbound At any time
Local scheduled service buses, hackney carriages, and cycles
45m
Penny Street, Blackburn
From Starkie Street to 15m south of Brown Street
Northbound and Southbound
At any time
Local scheduled service buses, hackney carriages, and cycles
120m
Railway Road, Blackburn
Adjacent to the railway station forming the interchange
Northbound and Southbound
At any time
Local scheduled service buses, hackney carriages, and cycles
120m
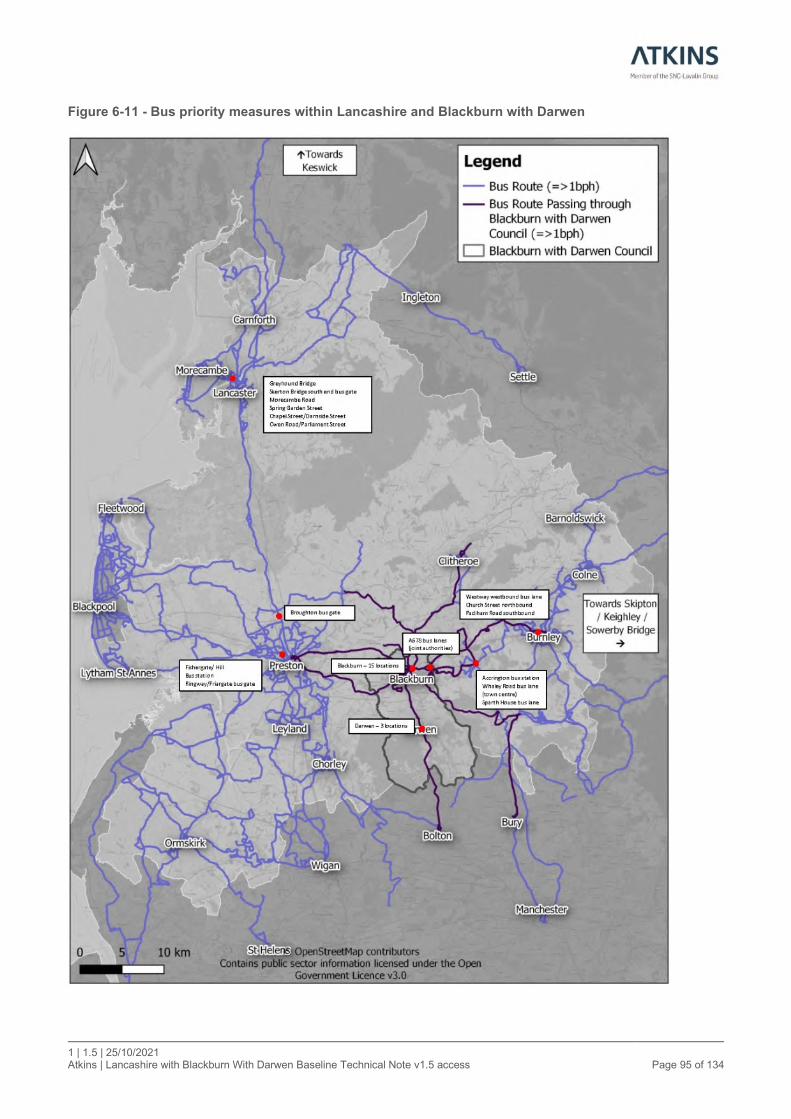
1 | 1.5 | 25/10/2021 Atkins | Lancashire with Blackburn With Darwen Baseline Technical Note v1.5 access Page 95 of 134
Figure 6-11 - Bus priority measures within Lancashire and Blackburn with Darwen
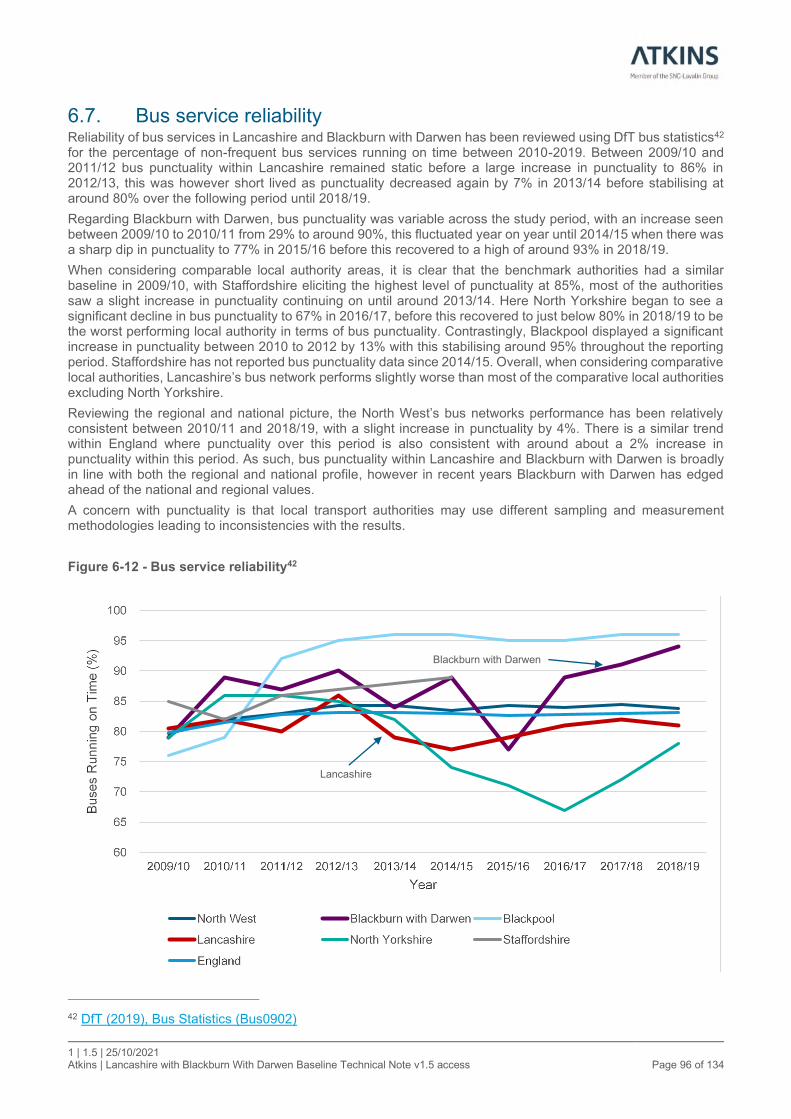
1 | 1.5 | 25/10/2021 Atkins | Lancashire with Blackburn With Darwen Baseline Technical Note v1.5 access Page 96 of 134
6.7. Bus service reliability Reliability of bus services in Lancashire and Blackburn with Darwen has been reviewed using DfT bus statistics42 for the percentage of non-frequent bus services running on time between 2010-2019. Between 2009/10 and 2011/12 bus punctuality within Lancashire remained static before a large increase in punctuality to 86% in 2012/13, this was however short lived as punctuality decreased again by 7% in 2013/14 before stabilising at around 80% over the following period until 2018/19.
Regarding Blackburn with Darwen, bus punctuality was variable across the study period, with an increase seen between 2009/10 to 2010/11 from 29% to around 90%, this fluctuated year on year until 2014/15 when there was a sharp dip in punctuality to 77% in 2015/16 before this recovered to a high of around 93% in 2018/19.
When considering comparable local authority areas, it is clear that the benchmark authorities had a similar baseline in 2009/10, with Staffordshire eliciting the highest level of punctuality at 85%, most of the authorities saw a slight increase in punctuality continuing on until around 2013/14. Here North Yorkshire began to see a significant decline in bus punctuality to 67% in 2016/17, before this recovered to just below 80% in 2018/19 to be the worst performing local authority in terms of bus punctuality. Contrastingly, Blackpool displayed a significant increase in punctuality between 2010 to 2012 by 13% with this stabilising around 95% throughout the reporting period. Staffordshire has not reported bus punctuality data since 2014/15. Overall, when considering comparative local authorities, Lancashire’s bus network performs slightly worse than most of the comparative local authorities excluding North Yorkshire.
Reviewing the regional and national picture, the North West’s bus networks performance has been relatively consistent between 2010/11 and 2018/19, with a slight increase in punctuality by 4%. There is a similar trend within England where punctuality over this period is also consistent with around about a 2% increase in punctuality within this period. As such, bus punctuality within Lancashire and Blackburn with Darwen is broadly in line with both the regional and national profile, however in recent years Blackburn with Darwen has edged ahead of the national and regional values.
A concern with punctuality is that local transport authorities may use different sampling and measurement methodologies leading to inconsistencies with the results.
Figure 6-12 - Bus service reliability42
42 DfT (2019), Bus Statistics (Bus0902)
Lancashire
Blackburn with Darwen

1 | 1.5 | 25/10/2021 Atkins | Lancashire with Blackburn With Darwen Baseline Technical Note v1.5 access Page 97 of 134
6.8. Customer satisfaction
6.8.1. Lancashire To inform the BSIP Lancashire County Council conducted research into the views of residents within the county on the current bus network. The survey was open to anyone and did not require the respondent to be a regular bus user. There were 2,552 responses to the survey with the distribution of respondents outlined in Figure 6-13.
Figure 6-13 - District of origin of survey respondents
The survey found that:
• 63% of respondents currently travel by bus in Lancashire
• 36% of these use the bus 4-7 times per week, with 24% using it 2-3 times a week
• 59% of respondents travelled between 0930 and 1500
Of those who travelled, their trips were for the reasons outline in Figure 6-14.
Figure 6-14 - Purpose of trips in Lancashire
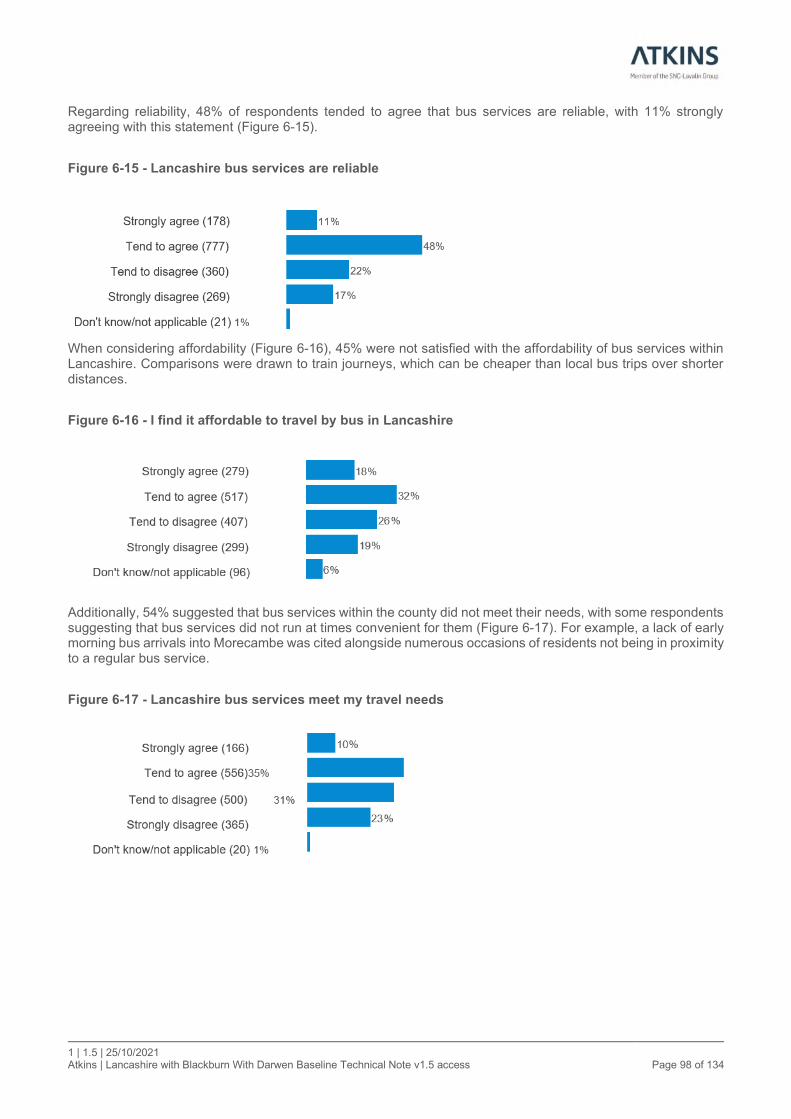
1 | 1.5 | 25/10/2021 Atkins | Lancashire with Blackburn With Darwen Baseline Technical Note v1.5 access Page 98 of 134
Regarding reliability, 48% of respondents tended to agree that bus services are reliable, with 11% strongly agreeing with this statement (Figure 6-15).
Figure 6-15 - Lancashire bus services are reliable
When considering affordability (Figure 6-16), 45% were not satisfied with the affordability of bus services within Lancashire. Comparisons were drawn to train journeys, which can be cheaper than local bus trips over shorter distances.
Figure 6-16 - I find it affordable to travel by bus in Lancashire
Additionally, 54% suggested that bus services within the county did not meet their needs, with some respondents suggesting that bus services did not run at times convenient for them (Figure 6-17). For example, a lack of early morning bus arrivals into Morecambe was cited alongside numerous occasions of residents not being in proximity to a regular bus service.
Figure 6-17 - Lancashire bus services meet my travel needs
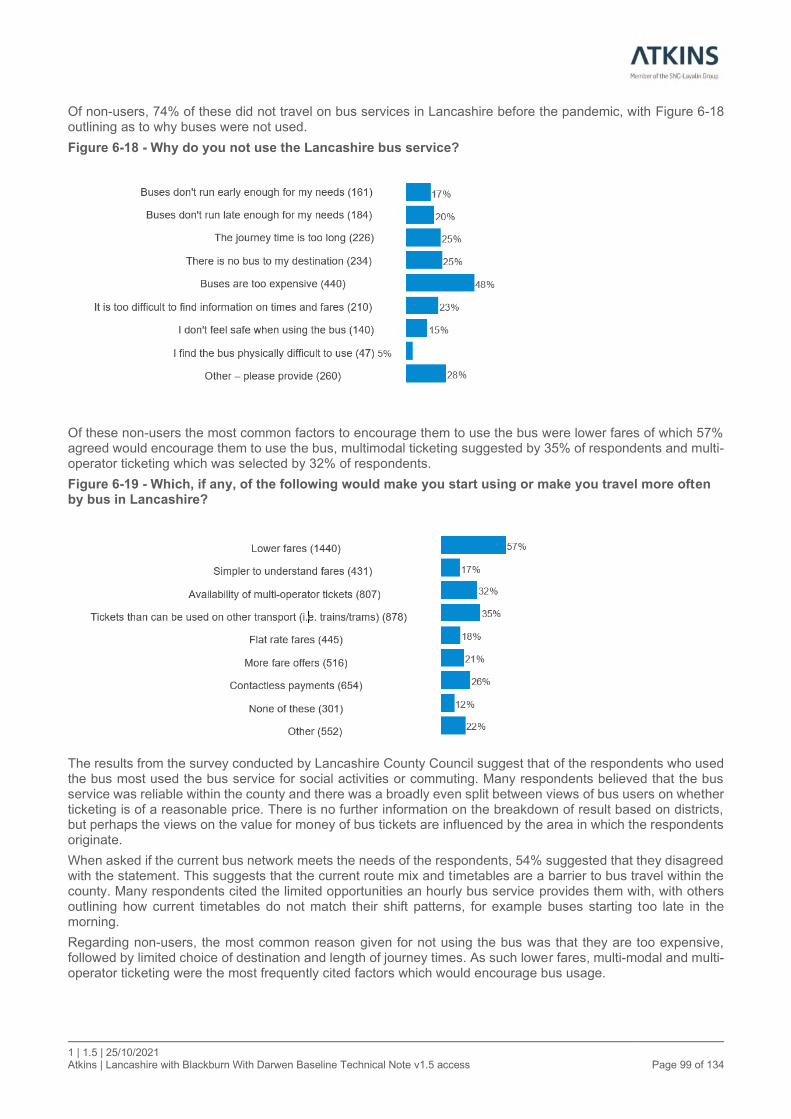
1 | 1.5 | 25/10/2021 Atkins | Lancashire with Blackburn With Darwen Baseline Technical Note v1.5 access Page 99 of 134
Of non-users, 74% of these did not travel on bus services in Lancashire before the pandemic, with Figure 6-18 outlining as to why buses were not used.
Figure 6-18 - Why do you not use the Lancashire bus service?
Of these non-users the most common factors to encourage them to use the bus were lower fares of which 57% agreed would encourage them to use the bus, multimodal ticketing suggested by 35% of respondents and multi-operator ticketing which was selected by 32% of respondents.
Figure 6-19 - Which, if any, of the following would make you start using or make you travel more often by bus in Lancashire?
The results from the survey conducted by Lancashire County Council suggest that of the respondents who used the bus most used the bus service for social activities or commuting. Many respondents believed that the bus service was reliable within the county and there was a broadly even split between views of bus users on whether ticketing is of a reasonable price. There is no further information on the breakdown of result based on districts, but perhaps the views on the value for money of bus tickets are influenced by the area in which the respondents originate.
When asked if the current bus network meets the needs of the respondents, 54% suggested that they disagreed with the statement. This suggests that the current route mix and timetables are a barrier to bus travel within the county. Many respondents cited the limited opportunities an hourly bus service provides them with, with others outlining how current timetables do not match their shift patterns, for example buses starting too late in the morning.
Regarding non-users, the most common reason given for not using the bus was that they are too expensive, followed by limited choice of destination and length of journey times. As such lower fares, multi-modal and multi-operator ticketing were the most frequently cited factors which would encourage bus usage.

1 | 1.5 | 25/10/2021 Atkins | Lancashire with Blackburn With Darwen Baseline Technical Note v1.5 access Page 100 of 134
Overall, the survey results suggest that the current bus offering could be improved with more regular services operating for longer periods during the day, and that patronage could be increased if journey times and ticketing were improved.
6.8.2. Blackburn with Darwen Blackburn with Darwen Council have undertaken engagement with bus users and bus operators to ascertain their satisfaction with the current network and where improvements could be made. This included a small operator customer survey feedback survey alongside a feedback exercise regarding the Pennine Reach scheme.
6.8.2.1. NHT Survey 2020
Blackburn with Darwen Council are part of the National Highways & Transport Network (NHT) who conduct research into customer satisfaction with the transport network within Blackburn with Darwen. The key findings for 2020 are outlined in Table 6-6.
Overall, the NHT survey highlights that satisfaction with local bus services was 56%, which was an increase of 6% on the previous year. The quality of bus services and public transport more generally is between 81-46% depending on the metric considered. Of the survey results people are most satisfied with their personal safety, provision of bus stops, the cleanliness of buses and the number of bus stops. Contrastingly, those surveyed are least satisfied with the bus feres, frequency of buses, punctuality and the state of bus stops.
Table 6-6 - Summary of NHT survey (2020) for Blackburn with Darwen
Factor Satisfaction (%) Above or Below National Average
Provision of bus stops 81 Below
Public transport information 46 Above
Taxi/mini cab services 68 Above
Frequency of bus services 53 Below
Number of bus stops 62 Below
State of bus stops 54 Below
Bus punctuality 54 Below
Bus fares 46 Below
Quality and cleanliness of buses 61 Below
Personal safety at bus stops 60 Below
The amount of information 56 Above
The clarity of information 57 Below
6.8.2.2. Pennine Reach feedback survey
Feedback was sought by Blackburn with Darwen Council to understand passengers views on the impact of the Pennine Reach scheme on their journey. There were 289 respondents with the following key findings:
• 73% of respondents believed their journey became more punctual as a result of the scheme
• 60% of respondents believed their journey became faster as a result of the scheme
• 61% rated the reliability of the bus as very good, with 31% believing this was quite good
• 49% believed the bus shelters were very good, with 35% suggesting they are quite good
• 77% of respondents rated their journey as very good
1 | 1.5 | 25/10/2021 Atkins | Lancashire with Blackburn With Darwen Baseline Technical Note v1.5 access Page 101 of 134
6.8.2.3. Small operator customer survey feedback
This survey was conducted to understand views on the services provided by Blackburn Private Hire, Moving People and Travel Assist. The survey received 46 responses from users of Blackburn Private Hire and Moving People services only. Out of these responses:
• 46% of respondents were reasonably happy with the frequency of the bus service
• 65% were happy with the journey time
• 39% said buses ran at a reasonably convenient time for them
• 85% of users said they had wanted to travel on the bus at a time in which the bus service was not
available to them
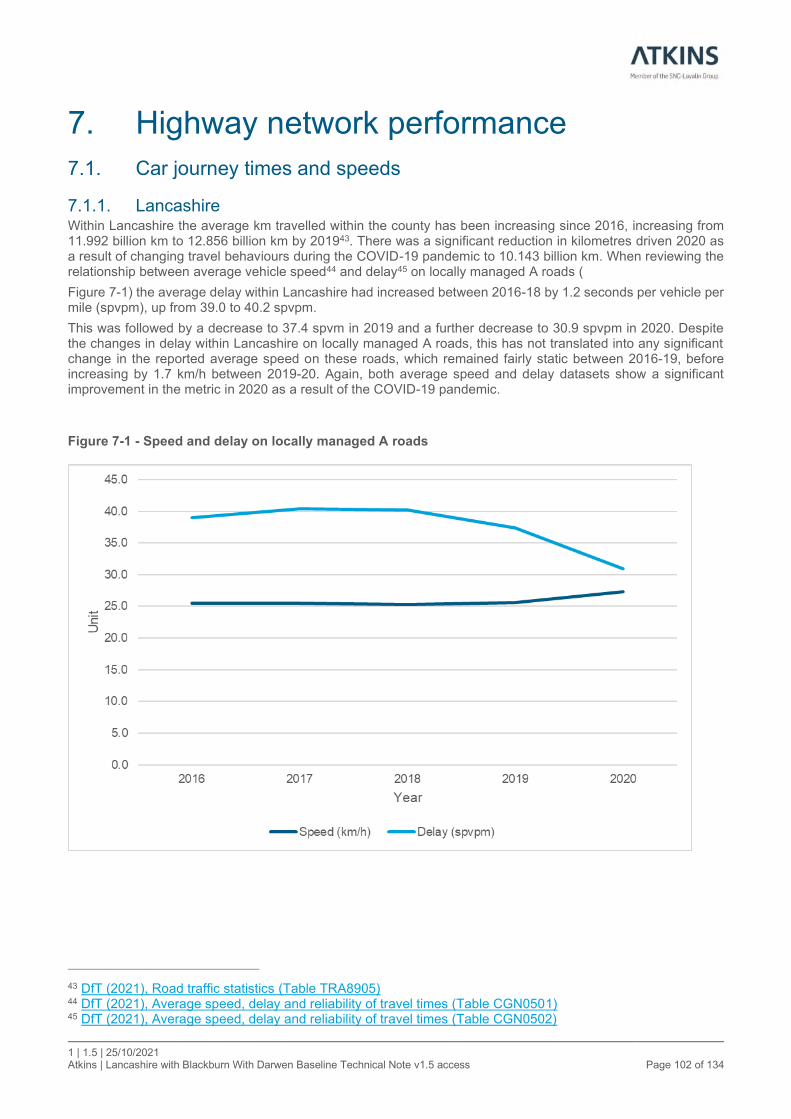
1 | 1.5 | 25/10/2021 Atkins | Lancashire with Blackburn With Darwen Baseline Technical Note v1.5 access Page 102 of 134
7. Highway network performance
7.1. Car journey times and speeds
7.1.1. Lancashire Within Lancashire the average km travelled within the county has been increasing since 2016, increasing from 11.992 billion km to 12.856 billion km by 201943. There was a significant reduction in kilometres driven 2020 as a result of changing travel behaviours during the COVID-19 pandemic to 10.143 billion km. When reviewing the relationship between average vehicle speed44 and delay45 on locally managed A roads (
Figure 7-1) the average delay within Lancashire had increased between 2016-18 by 1.2 seconds per vehicle per mile (spvpm), up from 39.0 to 40.2 spvpm.
This was followed by a decrease to 37.4 spvm in 2019 and a further decrease to 30.9 spvpm in 2020. Despite the changes in delay within Lancashire on locally managed A roads, this has not translated into any significant change in the reported average speed on these roads, which remained fairly static between 2016-19, before increasing by 1.7 km/h between 2019-20. Again, both average speed and delay datasets show a significant improvement in the metric in 2020 as a result of the COVID-19 pandemic.
Figure 7-1 - Speed and delay on locally managed A roads
43 DfT (2021), Road traffic statistics (Table TRA8905) 44 DfT (2021), Average speed, delay and reliability of travel times (Table CGN0501) 45 DfT (2021), Average speed, delay and reliability of travel times (Table CGN0502)
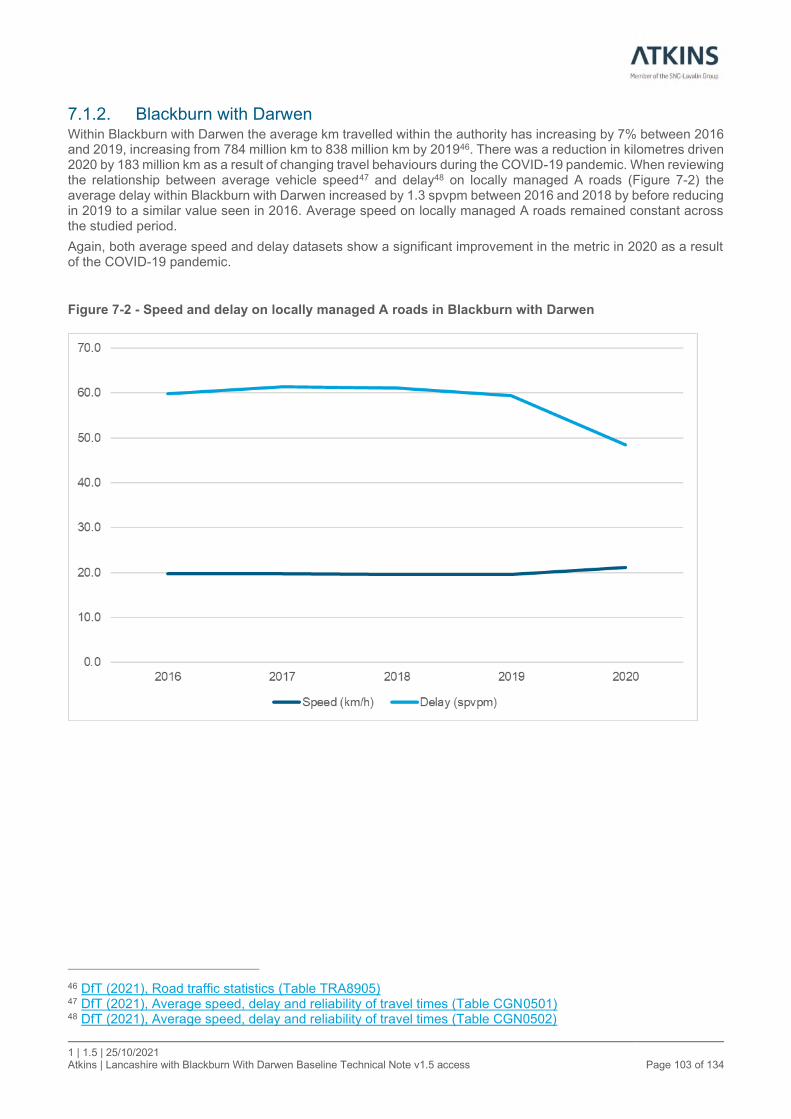
1 | 1.5 | 25/10/2021 Atkins | Lancashire with Blackburn With Darwen Baseline Technical Note v1.5 access Page 103 of 134
7.1.2. Blackburn with Darwen Within Blackburn with Darwen the average km travelled within the authority has increasing by 7% between 2016 and 2019, increasing from 784 million km to 838 million km by 201946. There was a reduction in kilometres driven 2020 by 183 million km as a result of changing travel behaviours during the COVID-19 pandemic. When reviewing the relationship between average vehicle speed47 and delay48 on locally managed A roads (Figure 7-2) the average delay within Blackburn with Darwen increased by 1.3 spvpm between 2016 and 2018 by before reducing in 2019 to a similar value seen in 2016. Average speed on locally managed A roads remained constant across the studied period.
Again, both average speed and delay datasets show a significant improvement in the metric in 2020 as a result of the COVID-19 pandemic.
Figure 7-2 - Speed and delay on locally managed A roads in Blackburn with Darwen
46 DfT (2021), Road traffic statistics (Table TRA8905) 47 DfT (2021), Average speed, delay and reliability of travel times (Table CGN0501) 48 DfT (2021), Average speed, delay and reliability of travel times (Table CGN0502)

1 | 1.5 | 25/10/2021 Atkins | Lancashire with Blackburn With Darwen Baseline Technical Note v1.5 access Page 104 of 134
7.2. Highway congestion Delay on local ‘A’ Road links (spvpm) has been collected from the DfT49 for 2019 and is illustrated in Figure 7-3.
Within Lancashire, this figure outlines that beyond the urban built up areas, delay on local A roads equates to between 9-35 spvpm., the greatest number of links with delay are seen within Preston, particularly when entering the city from the north, where the A5085, the A59, A583 and A6 all have consistent delays at or above 70 spvpm.
When considering Blackburn with Darwen, delays on each link tend to be within the 37-76 spvpm category with some links around Blackburn experiencing delays between 76-136 spvpm. The A679 within Blackburn also can have long delays which the data suggests could be 353 spvpm.
Within both authorities the greatest levels of delay on local A road links are seen within the built-up areas, with the highest link delay in each settlement outlined in table Table 7-1.
Table 7-1 - Highest delays on links in urban areas
Urban Area Road Name Delay (spvpm) Number of Links with Average Delay over 125 spvpm
Preston A59 Ringway 371 12
Burnley A679 Active Way 145 1
Ormskirk A680 Eastgate 421 3
Accrington A570 St Helen’s Road 207 1
Lancaster A6 Kingsway 223 4
Blackburn A679 Audley Range 353 4
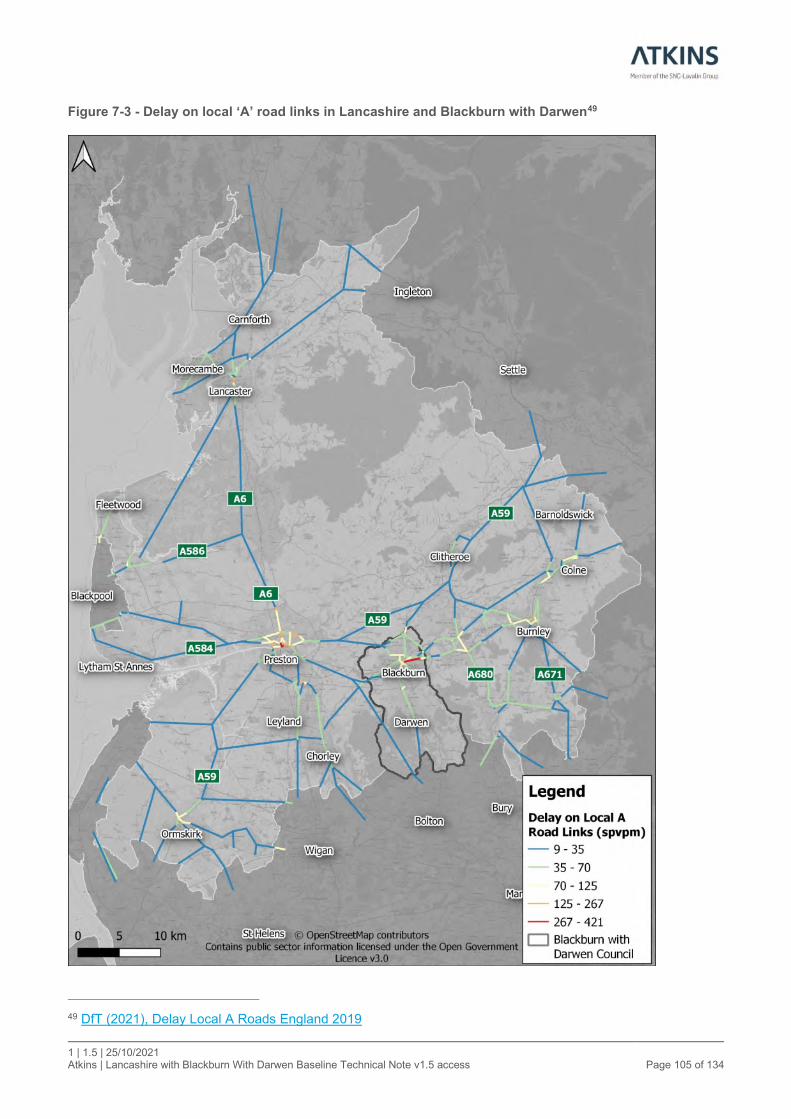
1 | 1.5 | 25/10/2021 Atkins | Lancashire with Blackburn With Darwen Baseline Technical Note v1.5 access Page 105 of 134
Figure 7-3 - Delay on local ‘A’ road links in Lancashire and Blackburn with Darwen49
49 DfT (2021), Delay Local A Roads England 2019
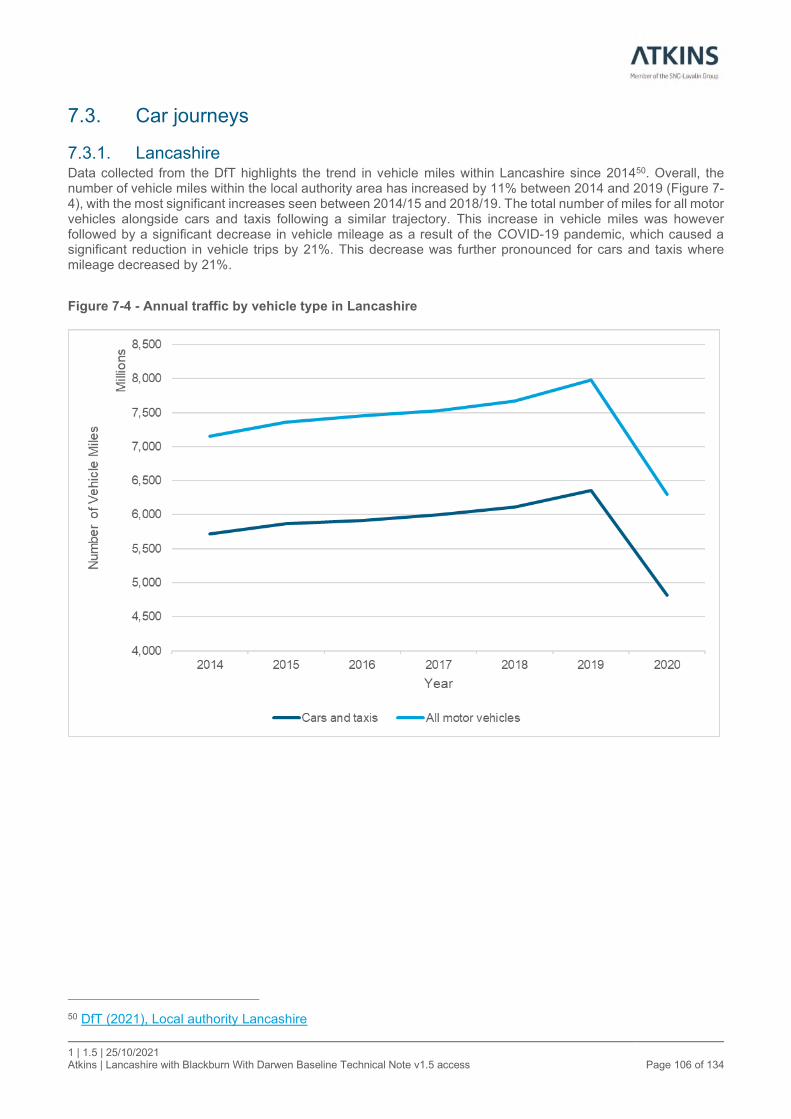
1 | 1.5 | 25/10/2021 Atkins | Lancashire with Blackburn With Darwen Baseline Technical Note v1.5 access Page 106 of 134
7.3. Car journeys
7.3.1. Lancashire Data collected from the DfT highlights the trend in vehicle miles within Lancashire since 201450. Overall, the number of vehicle miles within the local authority area has increased by 11% between 2014 and 2019 (Figure 7-4), with the most significant increases seen between 2014/15 and 2018/19. The total number of miles for all motor vehicles alongside cars and taxis following a similar trajectory. This increase in vehicle miles was however followed by a significant decrease in vehicle mileage as a result of the COVID-19 pandemic, which caused a significant reduction in vehicle trips by 21%. This decrease was further pronounced for cars and taxis where mileage decreased by 21%.
Figure 7-4 - Annual traffic by vehicle type in Lancashire
50 DfT (2021), Local authority Lancashire
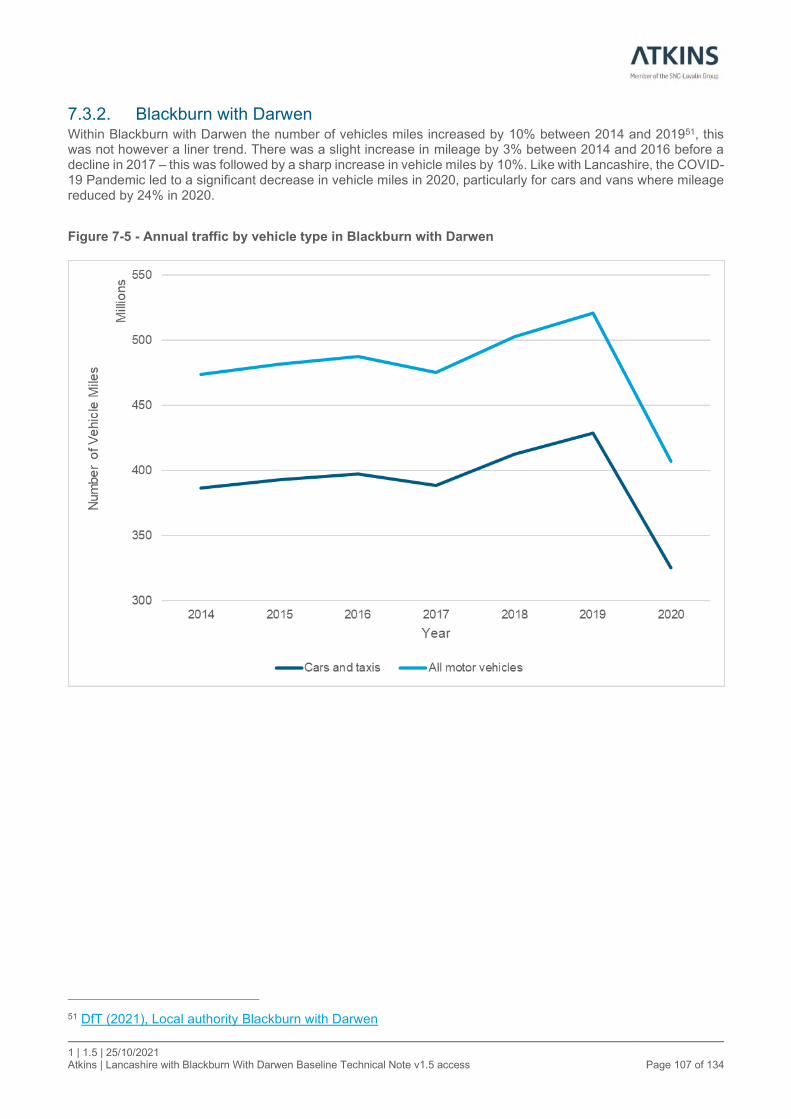
1 | 1.5 | 25/10/2021 Atkins | Lancashire with Blackburn With Darwen Baseline Technical Note v1.5 access Page 107 of 134
7.3.2. Blackburn with Darwen Within Blackburn with Darwen the number of vehicles miles increased by 10% between 2014 and 201951, this was not however a liner trend. There was a slight increase in mileage by 3% between 2014 and 2016 before a decline in 2017 – this was followed by a sharp increase in vehicle miles by 10%. Like with Lancashire, the COVID-19 Pandemic led to a significant decrease in vehicle miles in 2020, particularly for cars and vans where mileage reduced by 24% in 2020.
Figure 7-5 - Annual traffic by vehicle type in Blackburn with Darwen
51 DfT (2021), Local authority Blackburn with Darwen

1 | 1.5 | 25/10/2021 Atkins | Lancashire with Blackburn With Darwen Baseline Technical Note v1.5 access Page 108 of 134
7.4. Transport network investments
7.4.1. Lancashire Lancashire County Council has recently overseen significant investment in a range of differing transport improvement projects from conceptualisation to delivery. The council has worked collaboratively with Blackburn with Darwen Council on schemes such as the opening of Accrington Bus Station as part of the wider Pennine Reach scheme and with other partners and stakeholder such as Network Rail regarding the several railway schemes in which the local authority has sponsored or endorsed.
The authority has also worked closely with bus operators such as Transdev to coordinate improvements on the bus network such as the £200,000 investment at Nelson Bus Station to bring the station up to the standards required within the Equalities Act. This was a coordinated investment alongside the improvement in vehicles offered by Transdev as part of the tendered services agreement.
Lancashire County Council has also been successful in achieving funding from competitive funding streams. Most notably the Transforming Cities funding announced in 2020 which provided £40 million pounds of investment to improve public transport infrastructure in the Preston area. This bid was supported by key partners such as Preston City Council and South Ribble Borough Council, the Lancashire Enterprise Partnership and University of Central Lancashire (UCLan) alongside local bus and rail providers.
A breakdown of some of the key investments made to the public transport network within Lancashire outlined in Table 7-2.
Table 7-2 - Summary of key transport network investments in Lancashire
Investment Completed Description
Penwortham Bypass 2019 New bus station.
Lancaster Bus Station 2001 New bus station.
Burnley Bus Station 2002 New bus station.
Chorley Bus Station 2003 New bus station.
Chorley Bus Station 2021/2022 Installation of electronic departure screens.
Nelson Bus Station 2008 New bus station.
Nelson Bus Station 2021/2022 £200,000 capital contribution to the bus station is compliant with the Equalities Act following the introduction of new vehicles onto tendered routes by Transdev.
Nelson Bus Station 2020 Installation of electronic departure screens at a cost of £100,000.
Preston Bus Station Refurbishment of the Grade II listed stricture
Ormskirk Bus Station Expected 2022
Over £1,000,000 committed by Lancashire County Council to provide a modern bus station within Ormskirk.
Accrington Bus Station 2016 Opening of a new bus station in a coordinated effort with Blackburn with Darwen Council as part of their Pennine Reach scheme.
Upgrading Bus Shelters Ongoing Capital investment from Lancashire County Council totalling £3,000,000 to improve the shelter stock across the county over a 5-year period. This scheme provides a great improvement in the quality of shelter alongside a funded maintenance programme to maintain this new higher standard.
Buckshaw Parkway Station 2011 Contributed funding and support for the opening of Buckshaw Parkway Station.
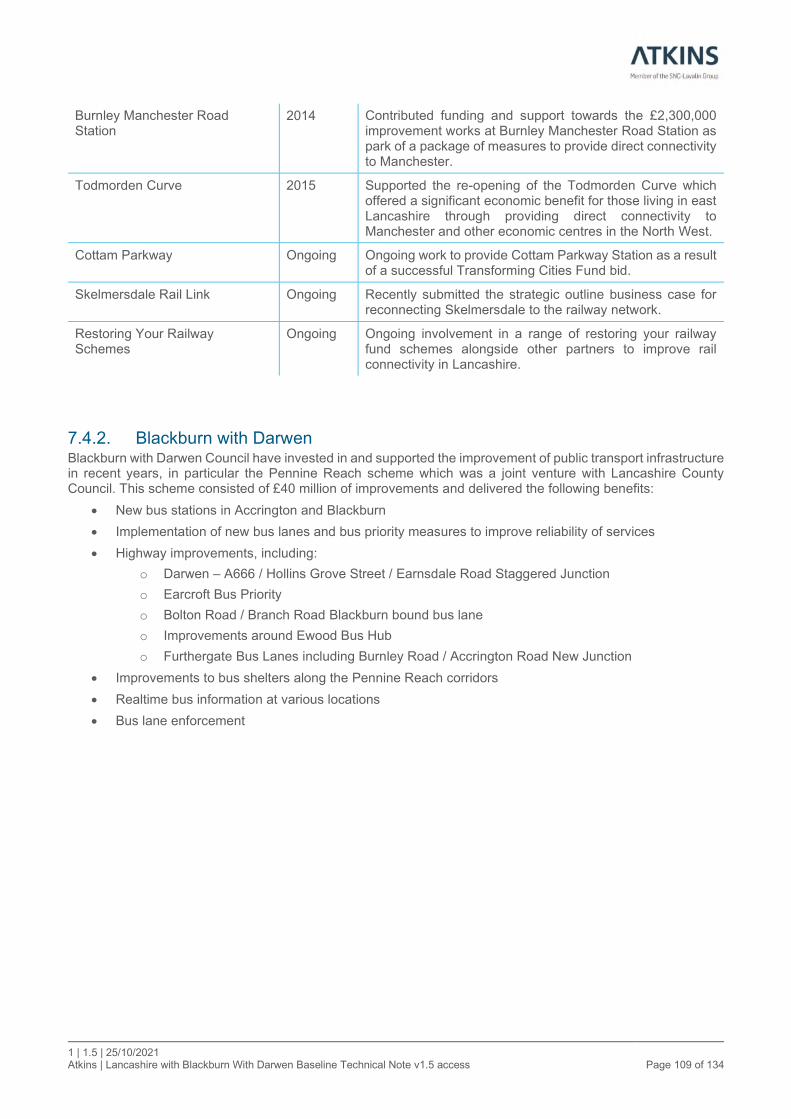
1 | 1.5 | 25/10/2021 Atkins | Lancashire with Blackburn With Darwen Baseline Technical Note v1.5 access Page 109 of 134
Burnley Manchester Road Station
2014 Contributed funding and support towards the £2,300,000 improvement works at Burnley Manchester Road Station as park of a package of measures to provide direct connectivity to Manchester.
Todmorden Curve 2015 Supported the re-opening of the Todmorden Curve which offered a significant economic benefit for those living in east Lancashire through providing direct connectivity to Manchester and other economic centres in the North West.
Cottam Parkway Ongoing Ongoing work to provide Cottam Parkway Station as a result of a successful Transforming Cities Fund bid.
Skelmersdale Rail Link Ongoing Recently submitted the strategic outline business case for reconnecting Skelmersdale to the railway network.
Restoring Your Railway Schemes
Ongoing Ongoing involvement in a range of restoring your railway fund schemes alongside other partners to improve rail connectivity in Lancashire.
7.4.2. Blackburn with Darwen Blackburn with Darwen Council have invested in and supported the improvement of public transport infrastructure in recent years, in particular the Pennine Reach scheme which was a joint venture with Lancashire County Council. This scheme consisted of £40 million of improvements and delivered the following benefits:
• New bus stations in Accrington and Blackburn
• Implementation of new bus lanes and bus priority measures to improve reliability of services
• Highway improvements, including:
o Darwen – A666 / Hollins Grove Street / Earnsdale Road Staggered Junction
o Earcroft Bus Priority
o Bolton Road / Branch Road Blackburn bound bus lane
o Improvements around Ewood Bus Hub
o Furthergate Bus Lanes including Burnley Road / Accrington Road New Junction
• Improvements to bus shelters along the Pennine Reach corridors
• Realtime bus information at various locations
• Bus lane enforcement

1 | 1.5 | 25/10/2021 Atkins | Lancashire with Blackburn With Darwen Baseline Technical Note v1.5 access Page 110 of 134
8. Transport strategy and policy
8.1. Government strategies Table 7-1 and Table 7-2 summarise relevant national and local government strategies.
Table 7-1 – Key National Government Strategies
Key policy documents
Key themes
Transport De-carbonisation Strategy (2021)
Future local transport funding will transition to a state where it is conditional on local areas being able to demonstrate how they will reduce emissions over a portfolio of transport investments through LTPs
Government will provide a toolkit to help authorities deliver measures to reduce greenhouse gas emissions from transport
Re-iterates National Planning Policy Framework presumption on planning for sustainable transport modes in new developments
Commitment to reform Bus Service Operators Grant and re-states aspirations and commitments set out in National Bus Strategy
Recognises the need to contain traffic volumes in towns and cities but the focus appears to be on achieving mode shift through increasing cycling, walking and ride-sharing. Recognises the need to re-allocated roadspace but offers no insight into how mode shift will be achieved from car, particularly to rail or bus
National Bus Strategy (2021)
Investment of £3 billion over the course of the next UK parliament in England
Reverse the cycle of decline in the usage and provision of bus services
Roadspace re-allocation in favour of bus priority
Five Bus Rapid Transit towns
Improved uptake of Zero Emission Buses with 4,000 vehicles delivered
Simpler, multi-operator ticketing with flat and capped fares
Williams-Shapps Rail Review (2021)
Great British Railways to plan, specify and oversee the delivery of rail services
Existing franchising system of passenger rail operations to move a system of managed contracts with the revenue risk borne by Great British Railways
More opportunities for local authorities to work in partnership with Great British Railways to deliver improved rail services
Future of Mobility: Urban Strategy (2019)
Mass transit must remain fundamental to an efficient transport system
Mobility innovation must help to reduce congestion through more efficient use of limited road space, for example through sharing rides, increasing occupancy or consolidating freight
The marketplace for mobility must be open to stimulate innovation and give the best deal to consumers
New mobility services must be designed to operate as part of an integrated transport system combining public, private and multiple modes for transport users
Data from new mobility services must be shared where appropriate to improve choice and the operation of the transport system.
Clean Growth Strategy: Leading the way to a low carbon future (2017)
Increase uptake of zero-emission buses
Reduce the number of shorter journeys made by car
The Ten Point Plan for a Green
Green public transport, cycling and walking – including the National Bus Strategy (see above) and 4,000 Zero Emission Buses
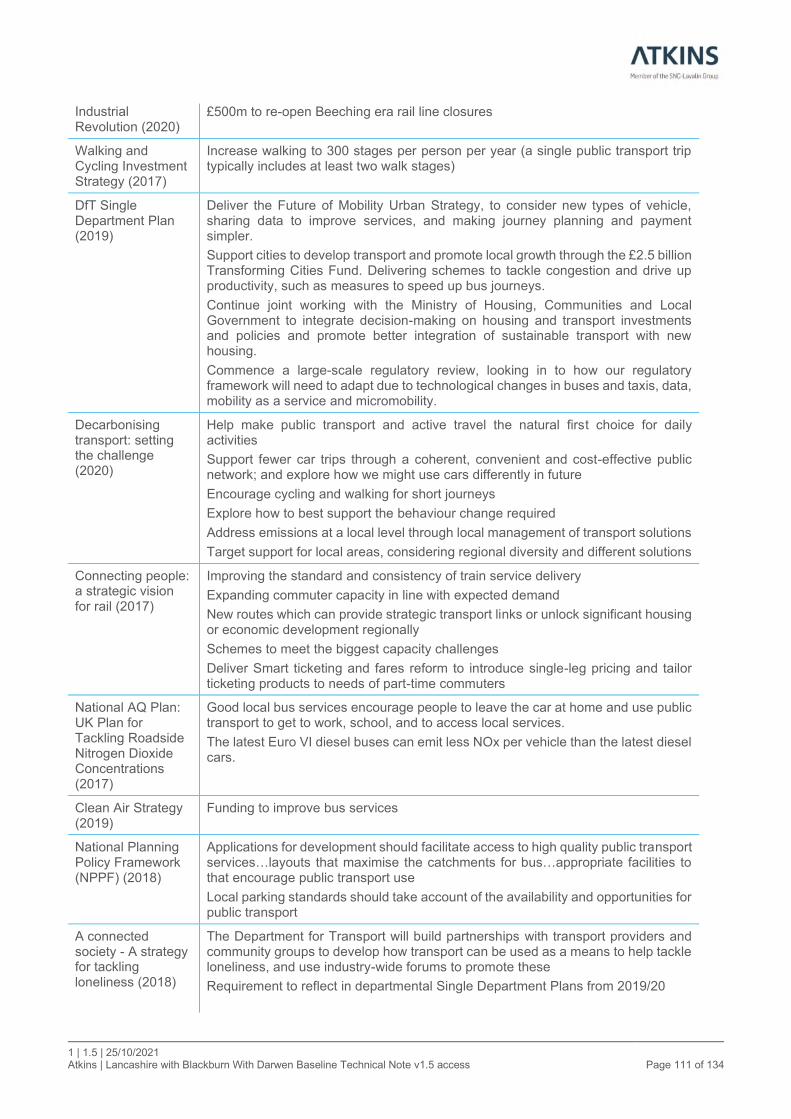
1 | 1.5 | 25/10/2021 Atkins | Lancashire with Blackburn With Darwen Baseline Technical Note v1.5 access Page 111 of 134
Industrial Revolution (2020)
£500m to re-open Beeching era rail line closures
Walking and Cycling Investment Strategy (2017)
Increase walking to 300 stages per person per year (a single public transport trip typically includes at least two walk stages)
DfT Single Department Plan (2019)
Deliver the Future of Mobility Urban Strategy, to consider new types of vehicle, sharing data to improve services, and making journey planning and payment simpler.
Support cities to develop transport and promote local growth through the £2.5 billion Transforming Cities Fund. Delivering schemes to tackle congestion and drive up productivity, such as measures to speed up bus journeys.
Continue joint working with the Ministry of Housing, Communities and Local Government to integrate decision-making on housing and transport investments and policies and promote better integration of sustainable transport with new housing.
Commence a large-scale regulatory review, looking in to how our regulatory framework will need to adapt due to technological changes in buses and taxis, data, mobility as a service and micromobility.
Decarbonising transport: setting the challenge (2020)
Help make public transport and active travel the natural first choice for daily activities
Support fewer car trips through a coherent, convenient and cost-effective public network; and explore how we might use cars differently in future
Encourage cycling and walking for short journeys
Explore how to best support the behaviour change required
Address emissions at a local level through local management of transport solutions
Target support for local areas, considering regional diversity and different solutions
Connecting people: a strategic vision for rail (2017)
Improving the standard and consistency of train service delivery
Expanding commuter capacity in line with expected demand
New routes which can provide strategic transport links or unlock significant housing or economic development regionally
Schemes to meet the biggest capacity challenges
Deliver Smart ticketing and fares reform to introduce single-leg pricing and tailor ticketing products to needs of part-time commuters
National AQ Plan: UK Plan for Tackling Roadside Nitrogen Dioxide Concentrations (2017)
Good local bus services encourage people to leave the car at home and use public transport to get to work, school, and to access local services.
The latest Euro VI diesel buses can emit less NOx per vehicle than the latest diesel cars.
Clean Air Strategy (2019)
Funding to improve bus services
National Planning Policy Framework (NPPF) (2018)
Applications for development should facilitate access to high quality public transport services…layouts that maximise the catchments for bus…appropriate facilities to that encourage public transport use
Local parking standards should take account of the availability and opportunities for public transport
A connected society - A strategy for tackling loneliness (2018)
The Department for Transport will build partnerships with transport providers and community groups to develop how transport can be used as a means to help tackle loneliness, and use industry-wide forums to promote these
Requirement to reflect in departmental Single Department Plans from 2019/20

1 | 1.5 | 25/10/2021 Atkins | Lancashire with Blackburn With Darwen Baseline Technical Note v1.5 access Page 112 of 134
Inclusive Transport Strategy (2018)
Support the establishment of a Rail Ombudsman to investigate unresolved customer complaints.
Identify a framework to ensure bus operators are implementing mandatory bus driver training.
Ensure that disabled travellers are fully aware of their rights and the obligations of transport operators.
Promote the assistance and financial savings available to disabled travellers.
Require a minimum target for the successful completion of booked assistance through the Passenger Assist scheme.
Support regulators to promote information about the rights of disabled travellers.
Release an online tool to assist disabled people in reporting issues they encounter when travelling by bus.
Ensuring that all public transport bodies understand their obligations under the Public Sector Equality Duty in relation to planning and delivering transport.
Legislation to ensure the provision of on-board audible and visible upcoming stop and route information is installed on local bus services across Great Britain.
Increase the availability of data on accessibility.
Ensure transport providers improve the availability of information particularly in relation to accessibility services such as toilets.
Work with Train Operating Companies to help ensure that all disabled passengers are aware of the Passenger Assist service.
Provide improved information about the accessibility of stations, including the development of an accessibility map by the RDG.
Make up to £300 million available for rail accessibility improvements during the period 2019-2024.
Update the Department’s Inclusive Mobility and Tactile Paving guidance.
Announce how to prioritise access to the on-board wheelchair space for wheelchair users and other passengers for whom there is no other suitable accommodation on buses.
Table 8-1 - Key Local Government Strategies
Key policy documents
Key themes
Lancashire LTP 3 The LTP reports challenges across the county to:
• Support economic growth and regeneration by tackling poor connectivity and congestion;
• Providing access to skills and education;
• Addressing fear of crime and antisocial behaviour;
• Addressing poor access to services and social networks for vulnerable and isolated communities;
• Addressing the transport needs of an ageing population;
• Mitigating relatively high costs of public transport for certain groups; and
• Addressing high dependency on the car for personal travel.
Lancashire’s LTP sets out a number of goals and priorities. Those of particular relevance to the Bus Service Improvement Plan include:
• Focus on links between areas of economic opportunity and their workforces, with sustainable transport being a priority for appropriate journeys;
• Work with public transport operators to reduce journey times to strategic employment sites and improve timetables and fares structures, with more joined-up and coherent public transport services;
1 | 1.5 | 25/10/2021 Atkins | Lancashire with Blackburn With Darwen Baseline Technical Note v1.5 access Page 113 of 134
• Develop bus stations and interchanges where these can be a catalyst to town centre regeneration;
• Work to provide affordable public transport to disadvantaged and isolated communities;
• Work with the health sector to make sure that people can connect with the health provision they need, particularly those without access to a car;
• Work with bus and rail operators to invest in new public transport services, where there is a proven economic or regeneration benefit;
• Work with operators to press for clean, well-maintained and well-lit vehicles, stops and interchanges;
• Provide bus fare discount schemes for young people;
• Work with operators to introduce a new Smartcard technology covering multiple forms of transport;
• Improving the range of sustainable transport options available;
• Improve journey time reliability; and
• Engage with planners and developers to ensure that new developments are in sustainable locations.
Blackburn with Darwen LTP 3
This LTP identifies broadly similar challenges to Lancashire’s LTP, with a high reliance on cars for travel despite a high level of accessibility to the public transport network. This is against a background of a high level of social deprivation.
The LTP3 notes that employment in the Manchester City Region is forecast to grow, but that relatively few employees live in Pennine Lancashire. As with the Lancashire LTP3, the Blackburn with Darwen LTP3 sets out of a series of goals, many of which are relevant to bus strategy. Notably, these include:
• Improving public transport connectivity with Preston and Manchester to enable BwDBC residents to benefit from increased employment in these locations;
• Improving connectivity with strategic employment sites at Freckleton Street, Whitebirk and Salmesbury;
• Improving public transport accessibility to rural areas;
• Improved public transport to deliver a reduction in carbon;
• Reduce crime and anti-social behaviour on public transport; and
• Develop ticket incentives and improve passenger transport information.
Emerging Lancashire, Blackburn with Darwen and Blackpool joint LTP 4
The emerging LTP4 identifies the following key challenges facing the transport system in the respective authorities which are consistent with the BSIP:
• Accessibility and inclusion to transport
• Maintaining our transport assets in good condition
• Strengthening our economy
• Quality transport alternatives to the private car
• Making best use of new and emerging technology
With the objectives aiming:
• To reduce the impact of harmful emissions from transport, addressing air quality and climate change concerns
• To improve local public transport, networks and interchanges
• To improve public transport for better inter-urban and rural connectivity
• To deliver sustainable transport systems that are accessible and inclusive for all
• To reduce the need to travel by private car particularly for shorter journeys

1 | 1.5 | 25/10/2021 Atkins | Lancashire with Blackburn With Darwen Baseline Technical Note v1.5 access Page 114 of 134
• To manage our transport assets efficiently and effectively
• To improve the efficiency of our local road networks
8.2. Parking Provision
8.2.1. Lancashire In Lancashire, off-street parking is the responsibility of the district councils.
8.2.2. Blackburn with Darwen Blackburn with Darwen Council charge for the parking of motor vehicles in a number of on street and off-street locations throughout the borough and currently spend £1.05 million per year (2020/21) on parking enforcement within the authority.
The tariff bands for parking vary by location, a summary of parking charges at council operated car parks is outlined in Table 8-2.
Parking permits for a number of the Blackburn town centre car parks are also available for commuter parking. These permits cost £50 per month, £140 per quarter or £500 per annum at the Brown Street, Mill Lane and Penny Street Car Park – this equates to around £2.30 per working day if an annual pass is purchased. Permit prices for the Fielden Street multi-storey car park are £55 per month or £660 per annum which equates to around £3 per working day.
Table 8-2 - Summary of parking charges within Blackburn with Darwen
Duration On street (£) Off street (£)
Up to 30 mins 1.00 N/A
Up to 1 hour 1.40-1.60 1.40
Up to 2 hours 1.70-2.10 1.90-2.10
Up to 3 hours N/A 2.80
Up to 4 hours 2.60 2.90-3.40
Up to 5 hours N/A 4.10
Over 5 hours N/A 4.10-8.40
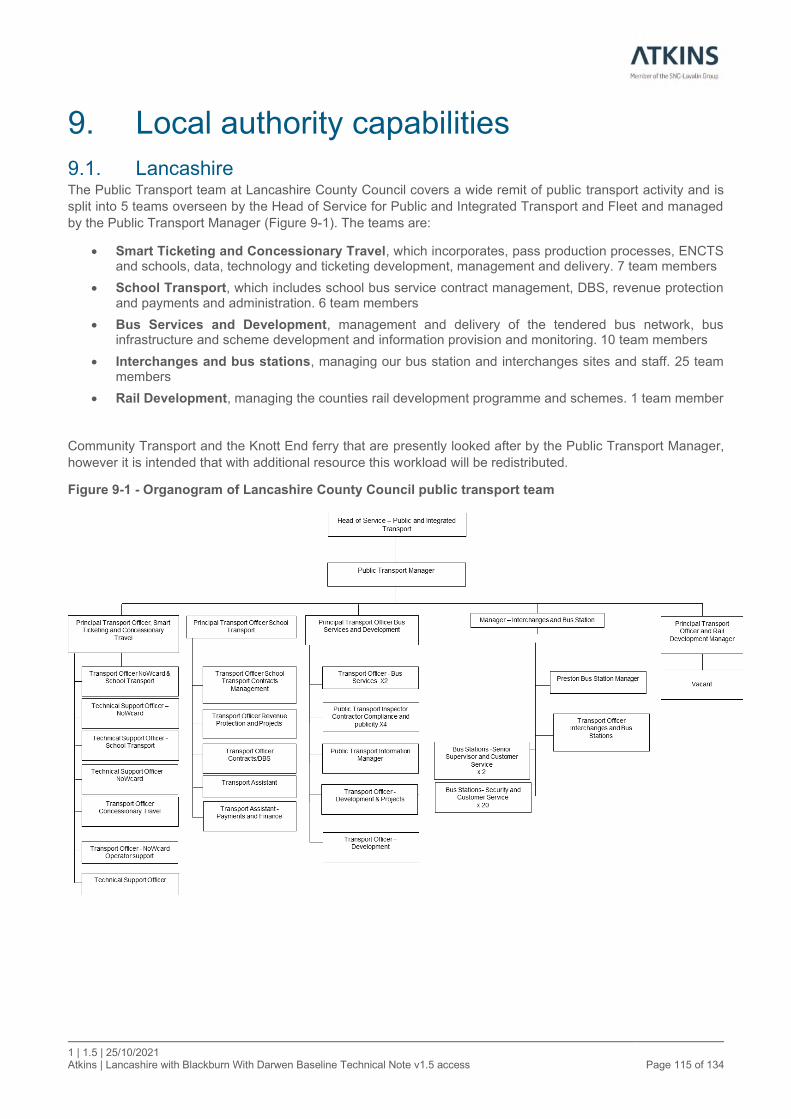
1 | 1.5 | 25/10/2021 Atkins | Lancashire with Blackburn With Darwen Baseline Technical Note v1.5 access Page 115 of 134
9. Local authority capabilities
9.1. Lancashire The Public Transport team at Lancashire County Council covers a wide remit of public transport activity and is
split into 5 teams overseen by the Head of Service for Public and Integrated Transport and Fleet and managed
by the Public Transport Manager (Figure 9-1). The teams are:
• Smart Ticketing and Concessionary Travel, which incorporates, pass production processes, ENCTS and schools, data, technology and ticketing development, management and delivery. 7 team members
• School Transport, which includes school bus service contract management, DBS, revenue protection and payments and administration. 6 team members
• Bus Services and Development, management and delivery of the tendered bus network, bus infrastructure and scheme development and information provision and monitoring. 10 team members
• Interchanges and bus stations, managing our bus station and interchanges sites and staff. 25 team members
• Rail Development, managing the counties rail development programme and schemes. 1 team member
Community Transport and the Knott End ferry that are presently looked after by the Public Transport Manager,
however it is intended that with additional resource this workload will be redistributed.
Figure 9-1 - Organogram of Lancashire County Council public transport team

1 | 1.5 | 25/10/2021 Atkins | Lancashire with Blackburn With Darwen Baseline Technical Note v1.5 access Page 116 of 134
9.2. Blackburn with Darwen As would be expected with a smaller unitary authority, Blackburn with Darwen Council has a smaller team than Lancashire County Council. This consists of:
• Head of Highways, Transport and Networks
• Strategic Transport Lead
• Senior Transport Planner
• Public Transport Officer
• School Transport Team (5 members of staff)
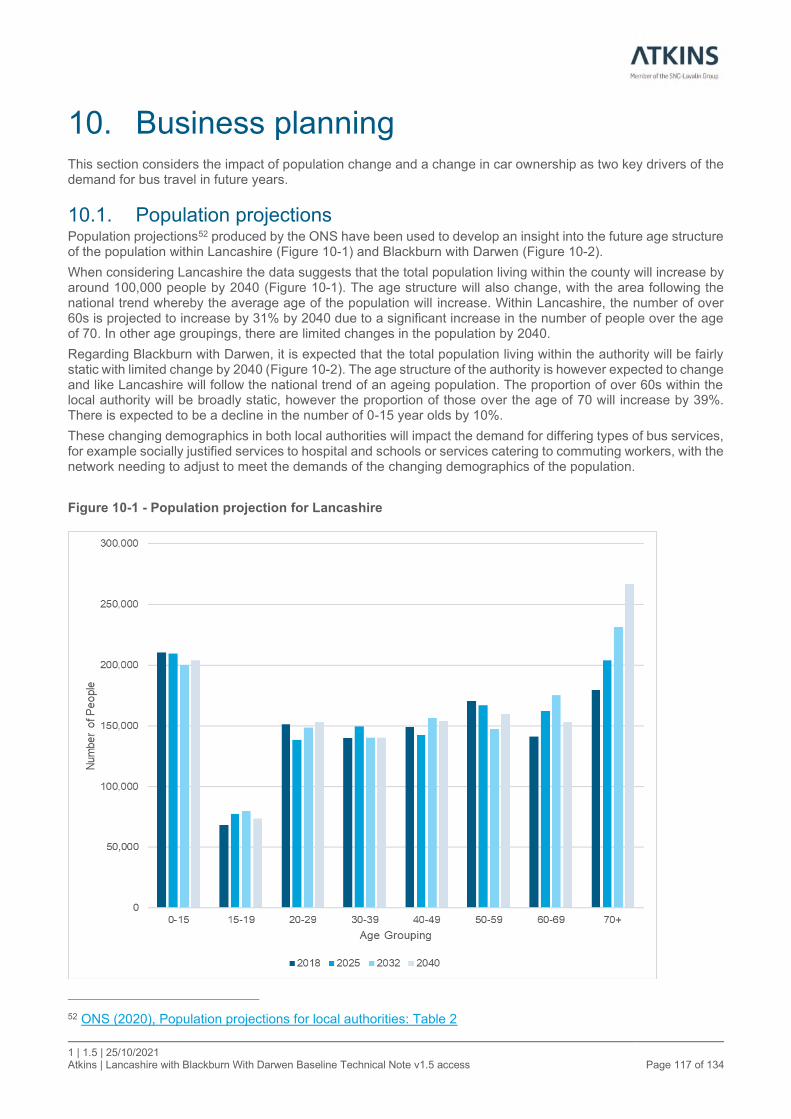
1 | 1.5 | 25/10/2021 Atkins | Lancashire with Blackburn With Darwen Baseline Technical Note v1.5 access Page 117 of 134
10. Business planning This section considers the impact of population change and a change in car ownership as two key drivers of the demand for bus travel in future years.
10.1. Population projections Population projections52 produced by the ONS have been used to develop an insight into the future age structure of the population within Lancashire (Figure 10-1) and Blackburn with Darwen (Figure 10-2).
When considering Lancashire the data suggests that the total population living within the county will increase by around 100,000 people by 2040 (Figure 10-1). The age structure will also change, with the area following the national trend whereby the average age of the population will increase. Within Lancashire, the number of over 60s is projected to increase by 31% by 2040 due to a significant increase in the number of people over the age of 70. In other age groupings, there are limited changes in the population by 2040.
Regarding Blackburn with Darwen, it is expected that the total population living within the authority will be fairly static with limited change by 2040 (Figure 10-2). The age structure of the authority is however expected to change and like Lancashire will follow the national trend of an ageing population. The proportion of over 60s within the local authority will be broadly static, however the proportion of those over the age of 70 will increase by 39%. There is expected to be a decline in the number of 0-15 year olds by 10%.
These changing demographics in both local authorities will impact the demand for differing types of bus services, for example socially justified services to hospital and schools or services catering to commuting workers, with the network needing to adjust to meet the demands of the changing demographics of the population.
Figure 10-1 - Population projection for Lancashire
52 ONS (2020), Population projections for local authorities: Table 2

1 | 1.5 | 25/10/2021 Atkins | Lancashire with Blackburn With Darwen Baseline Technical Note v1.5 access Page 118 of 134
Figure 10-2 - Population projection for Blackburn with Darwen
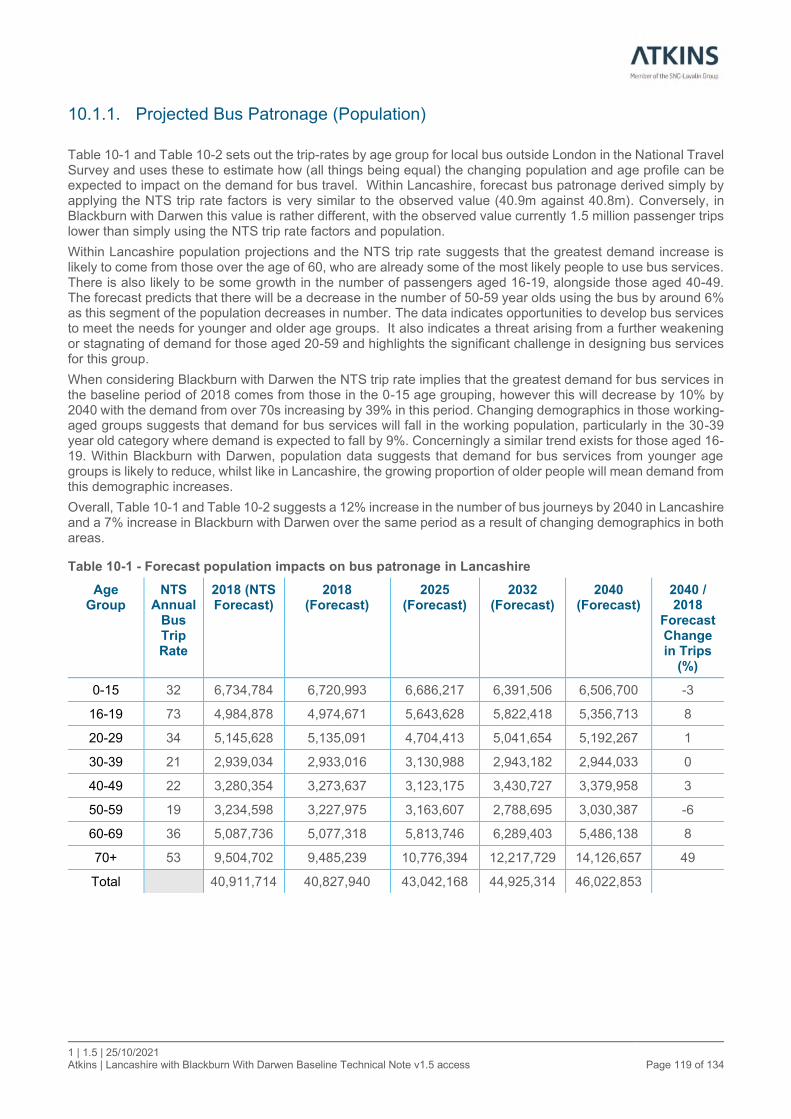
1 | 1.5 | 25/10/2021 Atkins | Lancashire with Blackburn With Darwen Baseline Technical Note v1.5 access Page 119 of 134
10.1.1. Projected Bus Patronage (Population)
Table 10-1 and Table 10-2 sets out the trip-rates by age group for local bus outside London in the National Travel Survey and uses these to estimate how (all things being equal) the changing population and age profile can be expected to impact on the demand for bus travel. Within Lancashire, forecast bus patronage derived simply by applying the NTS trip rate factors is very similar to the observed value (40.9m against 40.8m). Conversely, in Blackburn with Darwen this value is rather different, with the observed value currently 1.5 million passenger trips lower than simply using the NTS trip rate factors and population.
Within Lancashire population projections and the NTS trip rate suggests that the greatest demand increase is likely to come from those over the age of 60, who are already some of the most likely people to use bus services. There is also likely to be some growth in the number of passengers aged 16-19, alongside those aged 40-49. The forecast predicts that there will be a decrease in the number of 50-59 year olds using the bus by around 6% as this segment of the population decreases in number. The data indicates opportunities to develop bus services to meet the needs for younger and older age groups. It also indicates a threat arising from a further weakening or stagnating of demand for those aged 20-59 and highlights the significant challenge in designing bus services for this group.
When considering Blackburn with Darwen the NTS trip rate implies that the greatest demand for bus services in the baseline period of 2018 comes from those in the 0-15 age grouping, however this will decrease by 10% by 2040 with the demand from over 70s increasing by 39% in this period. Changing demographics in those working-aged groups suggests that demand for bus services will fall in the working population, particularly in the 30-39 year old category where demand is expected to fall by 9%. Concerningly a similar trend exists for those aged 16-19. Within Blackburn with Darwen, population data suggests that demand for bus services from younger age groups is likely to reduce, whilst like in Lancashire, the growing proportion of older people will mean demand from this demographic increases.
Overall, Table 10-1 and Table 10-2 suggests a 12% increase in the number of bus journeys by 2040 in Lancashire and a 7% increase in Blackburn with Darwen over the same period as a result of changing demographics in both areas.
Table 10-1 - Forecast population impacts on bus patronage in Lancashire
Age Group
NTS Annual
Bus Trip Rate
2018 (NTS Forecast)
2018 (Forecast)
2025 (Forecast)
2032 (Forecast)
2040 (Forecast)
2040 / 2018
Forecast Change in Trips
(%)
0-15 32 6,734,784 6,720,993 6,686,217 6,391,506 6,506,700 -3
16-19 73 4,984,878 4,974,671 5,643,628 5,822,418 5,356,713 8
20-29 34 5,145,628 5,135,091 4,704,413 5,041,654 5,192,267 1
30-39 21 2,939,034 2,933,016 3,130,988 2,943,182 2,944,033 0
40-49 22 3,280,354 3,273,637 3,123,175 3,430,727 3,379,958 3
50-59 19 3,234,598 3,227,975 3,163,607 2,788,695 3,030,387 -6
60-69 36 5,087,736 5,077,318 5,813,746 6,289,403 5,486,138 8
70+ 53 9,504,702 9,485,239 10,776,394 12,217,729 14,126,657 49
Total 40,911,714 40,827,940 43,042,168 44,925,314 46,022,853
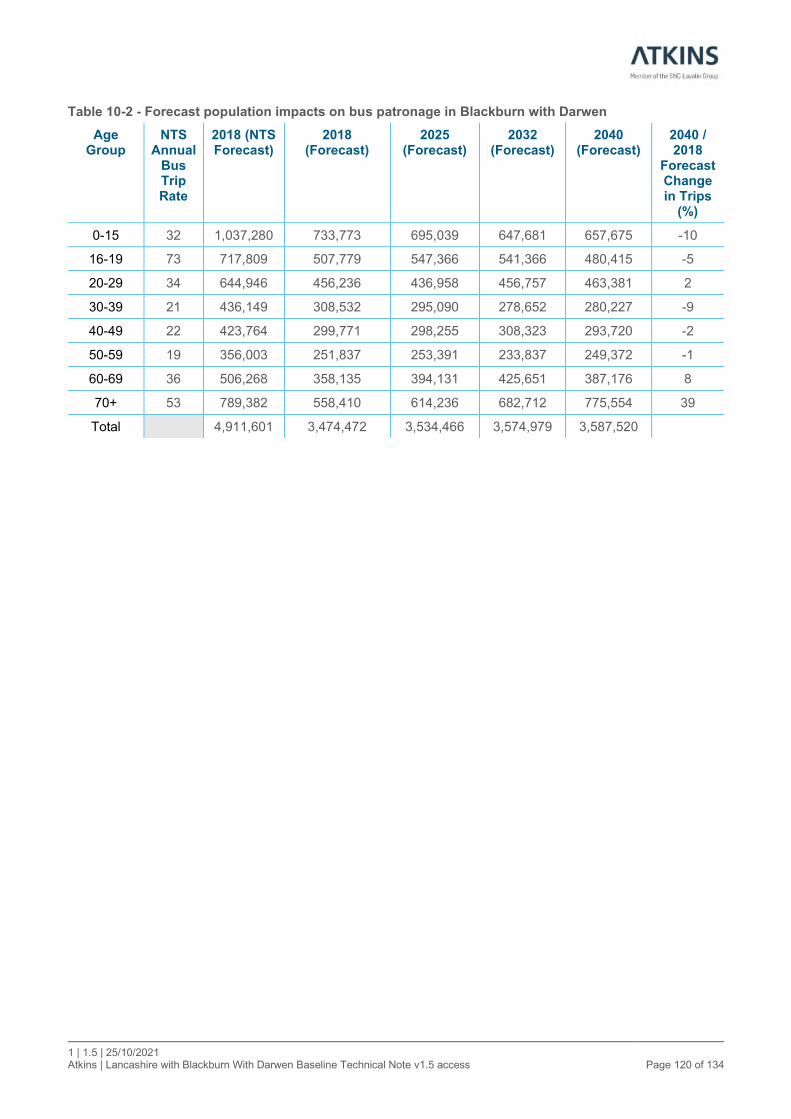
1 | 1.5 | 25/10/2021 Atkins | Lancashire with Blackburn With Darwen Baseline Technical Note v1.5 access Page 120 of 134
Table 10-2 - Forecast population impacts on bus patronage in Blackburn with Darwen
Age Group
NTS Annual
Bus Trip Rate
2018 (NTS Forecast)
2018 (Forecast)
2025 (Forecast)
2032 (Forecast)
2040 (Forecast)
2040 / 2018
Forecast Change in Trips
(%)
0-15 32 1,037,280 733,773 695,039 647,681 657,675 -10
16-19 73 717,809 507,779 547,366 541,366 480,415 -5
20-29 34 644,946 456,236 436,958 456,757 463,381 2
30-39 21 436,149 308,532 295,090 278,652 280,227 -9
40-49 22 423,764 299,771 298,255 308,323 293,720 -2
50-59 19 356,003 251,837 253,391 233,837 249,372 -1
60-69 36 506,268 358,135 394,131 425,651 387,176 8
70+ 53 789,382 558,410 614,236 682,712 775,554 39
Total 4,911,601 3,474,472 3,534,466 3,574,979 3,587,520

1 | 1.5 | 25/10/2021 Atkins | Lancashire with Blackburn With Darwen Baseline Technical Note v1.5 access Page 121 of 134
10.2. Car ownership projections Future car ownership within Lancashire and Blackburn with Darwen has been estimated using the National Car
Ownership Model contained within TEMPro 7.253 with the result displayed in Table 10-3 and Table 10-4
respectively.
Regarding Lancashire this outlines that car ownership is predicted to increase by 13% by 2040, with 84% of
households expected to have access to a car by this point compared to an estimated 79% in 2018. This growth
in the number of households with vehicles is broadly similar to the expected increase in population within
Lancashire.
When considering Blackburn with Darwen, Table 10-4 also highlights that car ownership is expected to increase
in the authority at a similar rate as in Lancashire, with a 14% increase by 2040 leading to 78% of households
having access to a car, up from 72% in 2018.
Table 10-3 - Car ownership projections in Lancashire
Year No car 1 car 2 cars 3+ cars
Households with Car Access (%)
Change over 2018 (%)
2018 110,553 225,586 138,041 45,273 79
2025 105,945 235,428 150,265 49,394 80 4
2032 101,196 242,578 161,956 54,681 82 8
2040 96,402 251,611 179,414 60,195 84 13
Table 10-4 - Car ownership projections in Blackburn with Darwen
Year No car 1 car 2 cars 3+ cars Households with Car Access (%) Change over 2018 (%)
2018 17,198 26,668 12,804 3,764 72
2025 16,708 28,233 14,129 4,207 74 5
2032 15,950 29,380 15,435 4,767 76 8
2040 15,201 30,892 17,431 5,355 78 14
10.2.1. Projected Bus Patronage (Household Car Ownership) With the increase in car ownership that is predicted within Lancashire and Blackburn with Darwen, it is forecast
that there will be an increase in demand for bus services within all car owning groups, however the number of
bus passengers from the no car households is expected to decrease as a result of a falling proportion of homes
without access to a car.
Unlike the age group assessment, the number of trips forecast in Lancashire using NTS in 2018 is much higher than out-turn – around 54.0m trips compared to 40.8m trips – or 33% higher. A similar trend is true in Blackburn with Darwen whereby the forecast trips are 3.7 million higher than the observed value. Both these findings are consistent with the assessment shown at Figure 6-3.
Interestingly, despite the increase in car-owning households, bus patronage is forecast to increase by 6% in both local authorities. This is likely to be an over-estimate, since the NTS data gives a bus passenger trip rate for all car-owning households, whereas in reality it is likely to be lower in multiple car-owning households. However, Table 10-5 and Table 10-6 does illustrate the need to develop bus services that are attractive for people living in car-owning households as well as a need to develop complementary measures designed to reduce the attractiveness of the car.
53 TEMPro (2021), Car ownership projections for Lancashire and Blackburn with Darwen
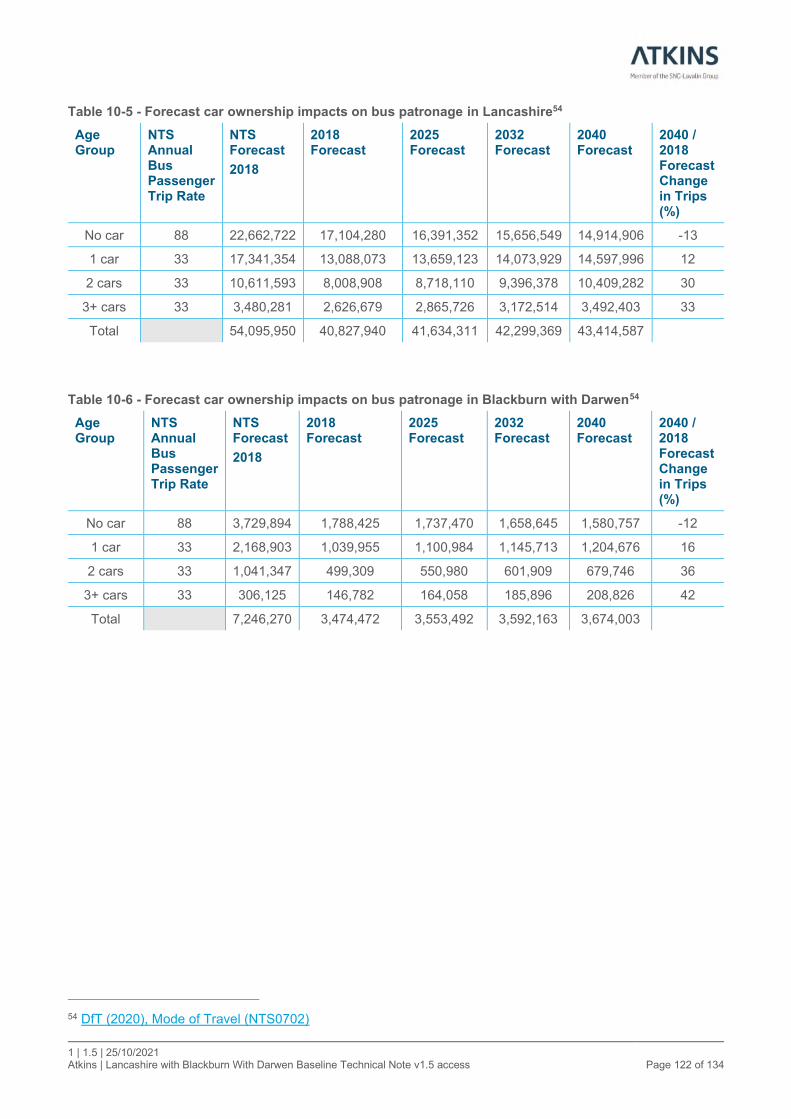
1 | 1.5 | 25/10/2021 Atkins | Lancashire with Blackburn With Darwen Baseline Technical Note v1.5 access Page 122 of 134
Table 10-5 - Forecast car ownership impacts on bus patronage in Lancashire54
Age Group
NTS Annual Bus Passenger Trip Rate
NTS Forecast
2018
2018 Forecast
2025 Forecast
2032 Forecast
2040 Forecast
2040 / 2018 Forecast Change in Trips (%)
No car 88 22,662,722 17,104,280 16,391,352 15,656,549 14,914,906 -13
1 car 33 17,341,354 13,088,073 13,659,123 14,073,929 14,597,996 12
2 cars 33 10,611,593 8,008,908 8,718,110 9,396,378 10,409,282 30
3+ cars 33 3,480,281 2,626,679 2,865,726 3,172,514 3,492,403 33
Total 54,095,950 40,827,940 41,634,311 42,299,369 43,414,587
Table 10-6 - Forecast car ownership impacts on bus patronage in Blackburn with Darwen54
Age Group
NTS Annual Bus Passenger Trip Rate
NTS Forecast
2018
2018 Forecast
2025 Forecast
2032 Forecast
2040 Forecast
2040 / 2018 Forecast Change in Trips (%)
No car 88 3,729,894 1,788,425 1,737,470 1,658,645 1,580,757 -12
1 car 33 2,168,903 1,039,955 1,100,984 1,145,713 1,204,676 16
2 cars 33 1,041,347 499,309 550,980 601,909 679,746 36
3+ cars 33 306,125 146,782 164,058 185,896 208,826 42
Total 7,246,270 3,474,472 3,553,492 3,592,163 3,674,003
54 DfT (2020), Mode of Travel (NTS0702)

1 | 1.5 | 25/10/2021 Atkins | Lancashire with Blackburn With Darwen Baseline Technical Note v1.5 access Page 123 of 134
11. Concluding remarks This technical note has been compiled to develop an understanding of the baseline conditions within Lancashire
and Blackburn with Darwen to inform the joint Bus Service Improvement Plan. The note has aimed to outline the
current social demographic composition of the area and how differing demand points may influence the need for
public transport services, alongside outlining the current bus provision within each local authority.
Analysis of socioeconomic data has highlighted that there is great diversity in socioeconomics across space both
in Lancashire and in Blackburn with Darwen. Both local authorities have a large number of areas with higher
levels of income deprivation, particularly within the urban centres such as Blackburn and Burnley. Additionally,
each authority has economic inactivity higher than the England and Wales average, with Blackburn with Darwen
eliciting a 6% higher rate of inactivity, whereas this is 2% higher in Lancashire. Both areas have a mixture of
higher and lower density populations, this is particularly true for Lancashire which consists of the large urban
areas such as Preston and Lancaster, alongside vast swathes of rural and smaller settlements. As would be
expected, sociodemographic factors such as a car ownership, vary greatly across the differing degrees of
urbanism.
Within both local authorities there are several differing bus operators who utilise varying ticketing products and zones for their operations. This means that there are a range of differing ticketing products on offer to the passenger, adding complexity to the understanding of which ticket is most applicable to a given journey. There is also a lack of consistency within the current fare zone offering, which can also add to this confusion. For example, Stagecoach and Preston Bus have slightly varying zone definitions for the Preston City zone, which may confuse passengers over which ticketing product is most suitable to their needs. There is also variability within the eligibility for a child ticket, with Stagecoach offering this to under 19s in some areas, Arriva offering it to under 16s only and Transdev having a ticketing product for those aged 16-19.
At present Lancashire and Blackburn with Darwen do not have a county-wide multi-operator ticketing option which would help reduce the complexity of the present ticketing offer by standardising both fare zones and age based eligibility criteria as well as removing the barrier of which bus a passenger can board with said ticket.
Within Lancashire bus patronage has, like elsewhere across the country, decline during the previous 10 years, with a reduction in passenger numbers by 21 million (-34%) between 2009/10 and 2018/19. In 2019/20 there was a further decline in patronage as a result of the COVID-19 pandemic. This is alongside a continual decline in bus kilometres operated within the county. When considering Blackburn with Darwen, there is a similar trend, with bus patronage decreasing by 1.4 million (-29%) between 2009/10 and 2019/20. It is difficult to attribute this decrease in patronage to a single causal factor, but this may be due to changing employment and travel habits, reduced knowledge of bus services after cuts in the mid-2010s which have subsequently been restored, and improvements to the railway network, particularly in and around Burnley. When considering bus ridership alongside levels of car ownership, both local authorities elicit a bus trip rate lower than the national trend highlighting a scope to increase bus patronage.
Overall, Lancashire and Blackburn with Darwen have a number of challenges and opportunities facing the bus network going forward. These particularly relate to the current wide ticketing offer and potential for multi-operator ticketing to reduce the complexity of the current offering alongside strategies to address the falling bus patronage and kilometres operated within both local authorities.

1 | 1.5 | 25/10/2021 Atkins | Lancashire with Blackburn With Darwen Baseline Technical Note v1.5 access Page 124 of 134
Appendices

1 | 1.5 | 25/10/2021 Atkins | Lancashire with Blackburn With Darwen Baseline Technical Note v1.5 access Page 125 of 134
Appendix A. Bus Service Density Mapping
A.1. Pre-COVID (January 2020) Figure A-1 - Average bus stop frequency in Preston (AM Peak - January 2020)
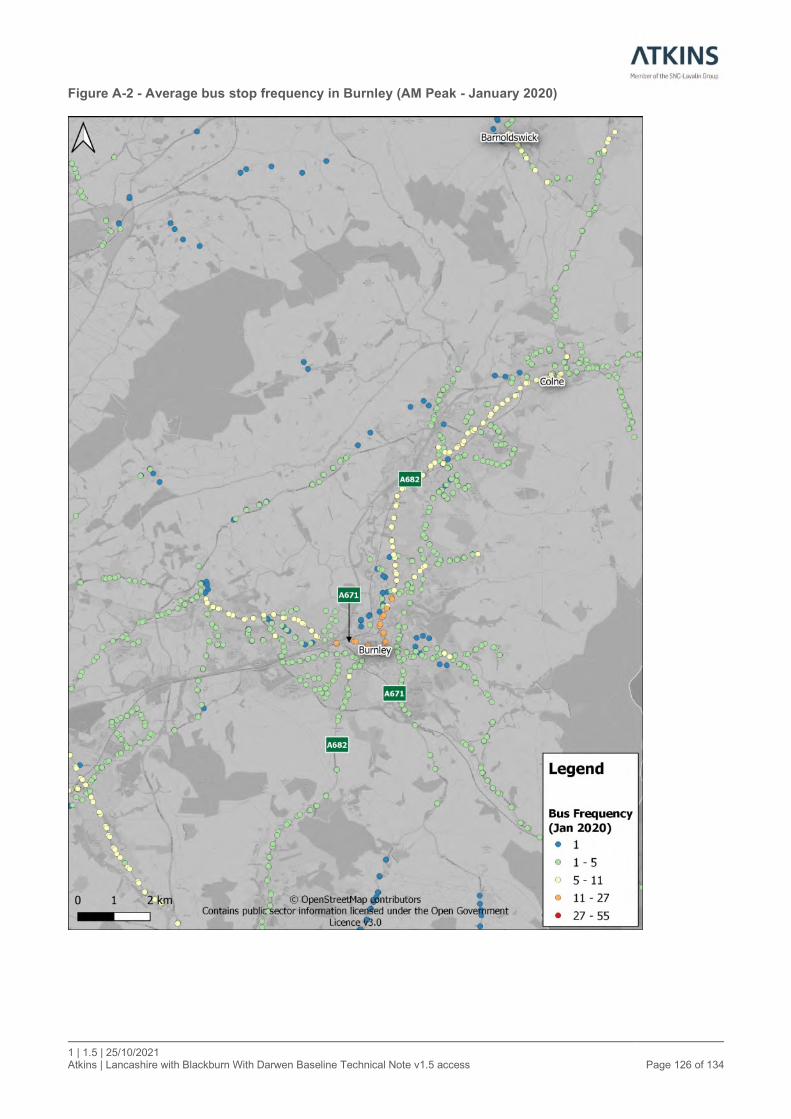
1 | 1.5 | 25/10/2021 Atkins | Lancashire with Blackburn With Darwen Baseline Technical Note v1.5 access Page 126 of 134
Figure A-2 - Average bus stop frequency in Burnley (AM Peak - January 2020)

1 | 1.5 | 25/10/2021 Atkins | Lancashire with Blackburn With Darwen Baseline Technical Note v1.5 access Page 127 of 134
Figure A-3 - Average bus stop frequency In Lancaster (AM Peak - January 2020)
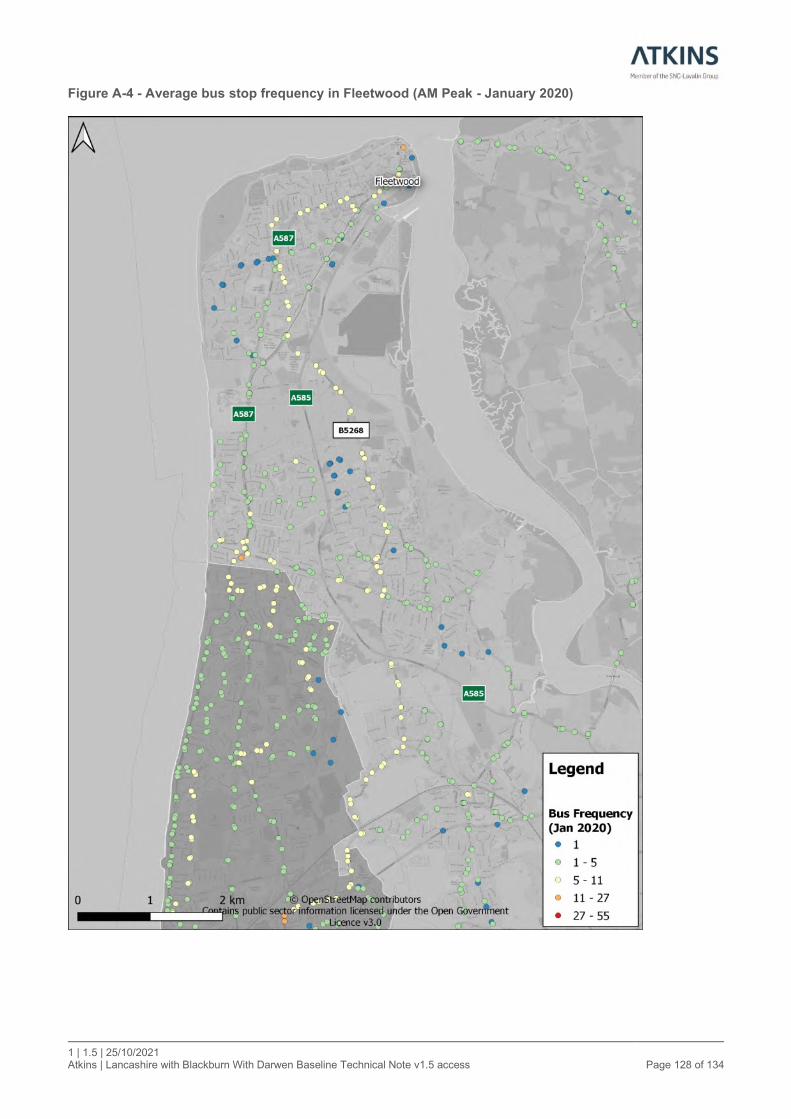
1 | 1.5 | 25/10/2021 Atkins | Lancashire with Blackburn With Darwen Baseline Technical Note v1.5 access Page 128 of 134
Figure A-4 - Average bus stop frequency in Fleetwood (AM Peak - January 2020)
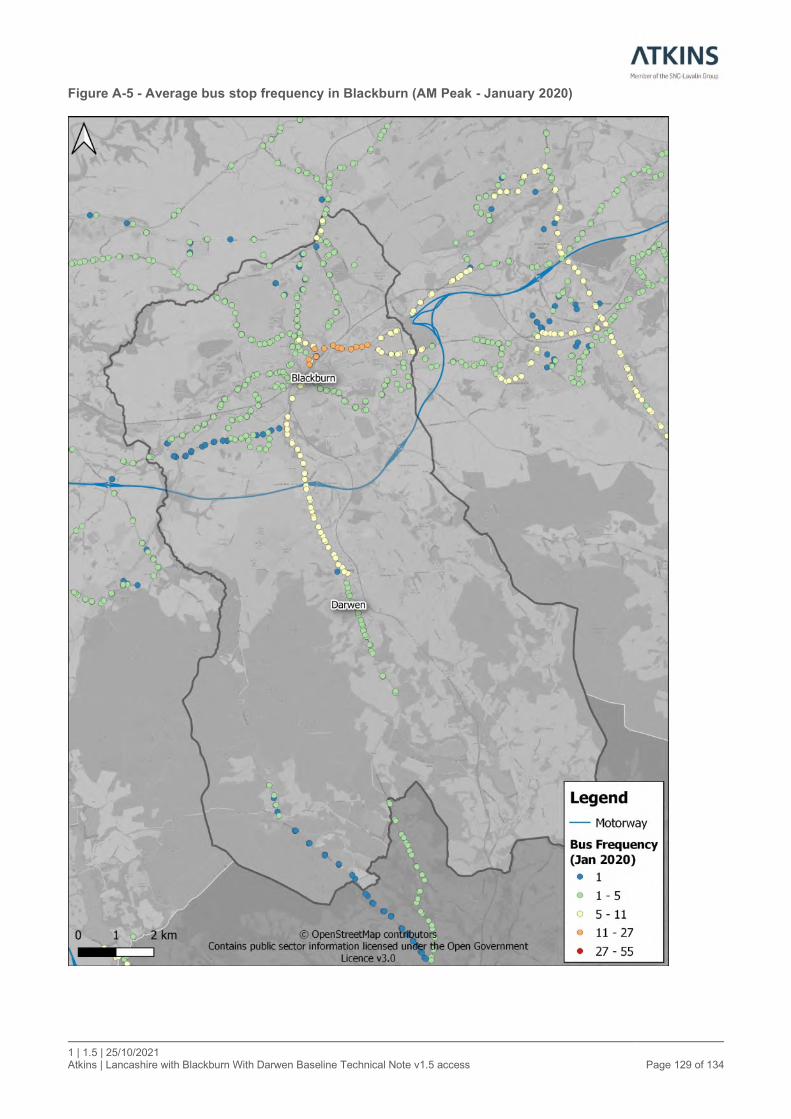
1 | 1.5 | 25/10/2021 Atkins | Lancashire with Blackburn With Darwen Baseline Technical Note v1.5 access Page 129 of 134
Figure A-5 - Average bus stop frequency in Blackburn (AM Peak - January 2020)

1 | 1.5 | 25/10/2021 Atkins | Lancashire with Blackburn With Darwen Baseline Technical Note v1.5 access Page 130 of 134
A.2. Current bus service density (April 2021) Figure A-6 - Average bus stop frequency in Preston (AM Peak - April 2021)
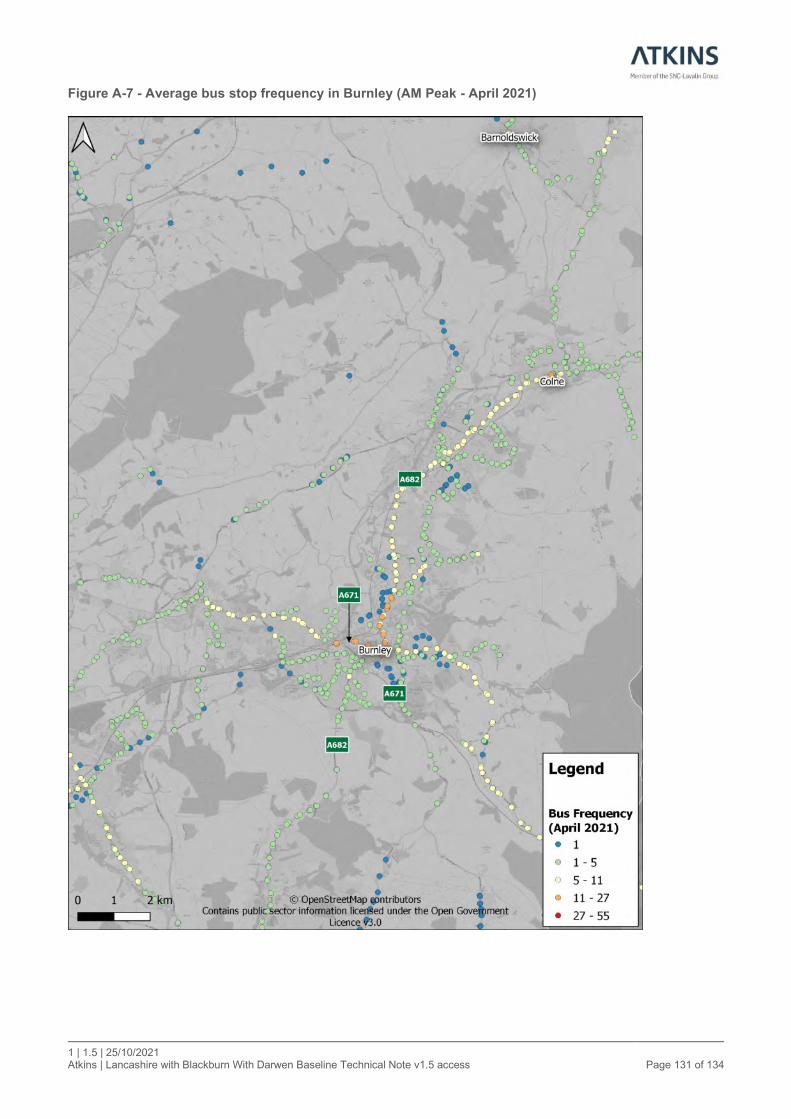
1 | 1.5 | 25/10/2021 Atkins | Lancashire with Blackburn With Darwen Baseline Technical Note v1.5 access Page 131 of 134
Figure A-7 - Average bus stop frequency in Burnley (AM Peak - April 2021)

1 | 1.5 | 25/10/2021 Atkins | Lancashire with Blackburn With Darwen Baseline Technical Note v1.5 access Page 132 of 134
Figure A-8 - Average bus stop frequency in Lancaster (AM Peak - April 2021)

1 | 1.5 | 25/10/2021 Atkins | Lancashire with Blackburn With Darwen Baseline Technical Note v1.5 access Page 133 of 134
Figure A-9 - Average bus stop frequency in Fleetwood (AM Peak - April 2021)
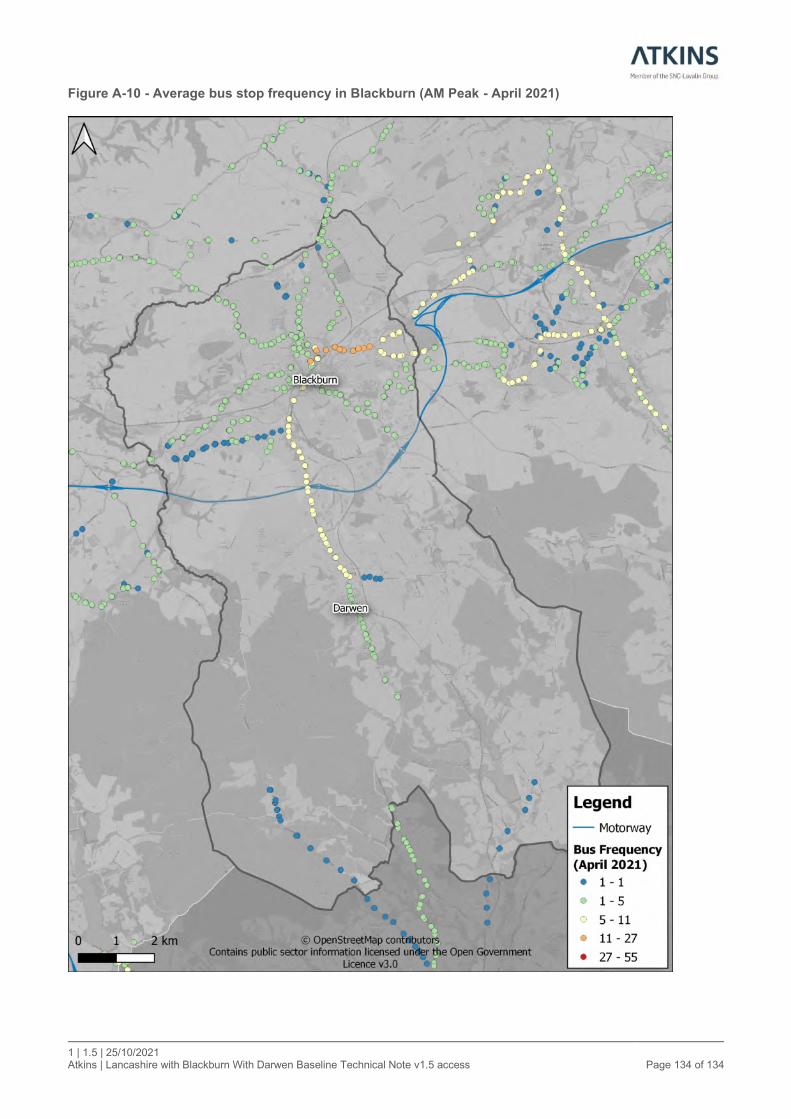
1 | 1.5 | 25/10/2021 Atkins | Lancashire with Blackburn With Darwen Baseline Technical Note v1.5 access Page 134 of 134
Figure A-10 - Average bus stop frequency in Blackburn (AM Peak - April 2021)