Bus Operations for Middle Managers
283
This document contains the following 6 deliverables 1. Delivery Presentation 2. Trainer Manual 3. Participant Manual 4. Pre-Training Questionnaire 5. Post-Training Questionnaire 6. Group Activity Bus Operations for Middle Managers
-
Upload
khangminh22 -
Category
Documents
-
view
0 -
download
0
Transcript of Bus Operations for Middle Managers

This document contains the following 6 deliverables
1. Delivery Presentation
2. Trainer Manual
3. Participant Manual
4. Pre-Training Questionnaire
5. Post-Training Questionnaire
6. Group Activity
Bus Operations for Middle Managers

P resentation title[To edit, c lick View > Slide Master > Slide Master]
©2019 Deloitte Shared Services India LLP 1
Delivery Presentation

EFFICIENT AND SUSTAINABLE CITY BUS SERVICES PROJECT (INDIA)EFFICIENT AND SUSTAINABLE CITY BUS SERVICES PROJECT (INDIA)
BUS OPERATIONS FOR MIDDLE MANAGERS
MINISTRY OF HOUSING AND URBAN AFFAIRS, GOVERNMENT OF INDIA
Consultancy Services for Design and Development of Training Programme for City Transport Professionals
December 2020

2
Preface
The Efficient and Sustainable City Bus Services (ESCBS) project was introduced to improve the efficiency and attractiveness of city
bus transport in India. ESCBS project has three major components which are National Capacity Building (NCB); Regulatory,
Institutional and Fiscal Analysis; and City Demonstration. This engagement falls under the purview of the NCB component of the
ESCBS project. The objective of the engagement is to design and develop training programme for city transport professionals. This
engagement also involves pilot testing, implementation, evaluation, and suitable modification of the training programme.
As a part of this engagement, eight training areas have been identified and prioritized by the Ministry of Housing and Urban Affairs
(MoHUA).
Policy Advocacy for
Senior Managers
Outsourcing for Senior
Managers
Monitoring and
Evaluation for Senior
Managers
Network Planning for
Middle Managers
Operations Planning for
Middle Managers
Outsourcing for Middle
Managers
Bus Operations for
Middle Managers
ITS and MIS for Middle
Managers
1 2 3 4
5 6 7 8
For each training areas, a total of three modules have been prepared:
A. Participant’s Notes: Detailed notes for participant’s reference containing links for more reading and is circulated before training
B. Trainer’s Notes: Detailed notes for the trainer’s reference containing focus points, questions for discussion, etc.
C. Delivery PPT: Brief presentation containing various animation, videos, group activities, etc. and is displayed on the screen

3
This training material on “Bus Operations” covers the technical and commercial aspects of bus operations
and marketing of bus services.
• The schedules of bus and crew cover all relevant aspects of bus operations such as route information,
halts, service frequency, cycle time, turn-around time at the terminal, crew shifts, and other components.
The operations are supervised from a central office and by supervisors on the ground in order to maintain
service standards. The crew's major function is to operate buses and collect revenue from the passengers.
Ascertain the extent to which passenger demand is met and also address the issues viz., significant drop in
particular section along the route. In case of an incident, the procedure described in the operation plan for
incident management needs to be followed.
• In continuation, this module also emphasizes up on adoption of global best practices such as adjusting
running time based on actual data wherein Indian practices are at variance.
• Marketing of bus services helps in creating awareness among the target audience regarding the existence
and benefits of the service. The strategy includes identifying and consulting various stakeholders; branding
the services using name, logo and tagline; and forming a marketing strategy using campaign and various
media options.
About the Module

4
Learning Objectives
1Comprehend the factors affecting the bus & crew scheduling, thereby optimizing bus and fleet
deployment for route operation.
2 Upgrade skill set for managing bus operations using ITS.
3Ascertain the extent to which passenger demand is met. Address the issues viz., significant
drop in particular section along the route.
4Monitor the services for adherence to time, managing dispatch, extending support in case of
emergency, crew behavior, etc., in an efficient way.
5Set/diagnose the process of revenue collection and the controlling mechanism to curb the
pilferages in revenues collected.
6 Design and formulate branding and marketing strategy for outreach.
7 Applying lessons learned from various cities.
8 Ensuring that the brand is maintained.

5
Table of Contents
Introduction A. Terminology in bus operations1
Bus and Crew Scheduling
A. Factors affecting bus scheduling
B. Factors affecting crew scheduling
C. Process for crew scheduling
D. Optimizing utilization of staff and fleet
E. Case study: BEST Mumbai (Impact of IT uses in Route and Duty Scheduling
F. Case study: KSRTC Mysore City
G. Fleet allocation to bus depots
2
Management of
Operations
A. An overview
B. Challenges in AVM implementation
C. Managing dispatch
D. Monitoring route service
E. Ensuring schedule adherence
F. Case study: KSRTC Mysore (MITRA for schedule adherence)
G. Ensuring standard driving compliance
H. Incident Management
I. Legislative provision related to driving and incidents
J. Adjusting schedules dynamically
K. Ensuring service contract compliance
3

6
Table of Contents
Demand and Supply
A. Passenger demand
B. Sources of passenger demand
C. Route wise demand fluctuation
D. Critical parameters for the supply of services
4
Monitoring of Service
A. Parameters to be monitored
B. Monitor timely departure from depot
C. Service contract compliance report
D. Speed limit violation report
E. Stoppage report
F. Monitoring vehicle speed
G. Kilometers report
H. Skipped stops report
I. Monitoring driving behavior
J. Monitoring real-time trip progress
K. Parameters associated with monitoring, along with benefits
5

7
Table of Contents
Revenue Collection
A. Cash / Revenue handling
B. Types of frauds occurring during revenue collection
C. Various types of checks
D. Case study: NEKRTC city bus operation in Gulbarga
E. Link / Interlinkage with ITS and MIS
6
Marketing and BrandingA. Introduction
B. Maintaining a brand7

8
Terminology
Terminologies used in Bus Operations
2. Bus and Crew Scheduling
3. Management of Operations
4. Demand and Supply
5. Monitoring of Services
6. Revenue collection
7. Marketing and Branding
1. Introduction
Terminologies in Bus OperationsABus Schedule: It refers to the programme of operation of a bus for 24 hours
on one or more routes.
Crew Schedule: It refers to pair schedule comprising of driver & conductor.
The duty allotted to the crew for a day is called crew scheduling.

9
2. Bus and Crew Scheduling
3. Management of Operations
4. Demand and Supply
5. Monitoring of Services
6. Revenue collection
1. Introduction
Terminologies in Bus OperationsA Time allocation:
• Completing the Chart
provided – 40 minutes
• Presentation of the
Chart – 15 minutes
each group
Group Activity
7. Marketing and Branding

10
Questions for audience
Q1. What are 03 main factors affecting the scheduling of the bus & crew?
Q2. Explain 02 method followed in respect of crew change?
Q3. In Urban transport, the operator is expected to be provided services
for 18hours, however, as per M T W Act crew duty (with 02 crew per
shift) serves for 16hours. For extra 02 hours, what are the options which
can be adopted?
Bus and Crew Scheduling
2. Bus and Crew Scheduling
3. Management of Operations
4. Demand and Supply
5. Monitoring of Services
6. Revenue collection
1. Introduction
Factors affecting bus schedulingA
Factors affecting crew schedulingB
Process for crew schedulingC
Optimizing utilization of staff and fleetD
Case study: BEST MumbaiE
Case study: KSRTC MysoreF
Fleet allocation to bus depotsG
7. Marketing and Branding

11
Factors affecting bus scheduling
Bus and Crew Scheduling
2. Bus and Crew Scheduling
3. Management of Operations
4. Demand and Supply
5. Monitoring of Services
6. Revenue collection
1. Introduction
Factors affecting bus schedulingA
Factors affecting crew schedulingB
Process for crew schedulingC
Optimizing utilization of staff and fleetD
Case study: BEST MumbaiE
Case study: KSRTC MysoreF
Fleet allocation to bus depotsG
1. Running Time 2. Stand Time / layover time
No. of stops & waiting
time
Distance between stops/
stations
Operating condition
Reporting time for
crew
Cushion for the delay
occurred in the journey
Rest breaks for the crew
7. Marketing and Branding

12
Factors affecting crew scheduling
Bus and Crew Scheduling
The basic factor that effects into the making of a crew schedules as per MotorTransport Workers Act 1961 (MTW Act), is as follows:
2. Bus and Crew Scheduling
3. Management of Operations
4. Demand and Supply
5. Monitoring of Services
6. Revenue collection
1. Introduction
Factors affecting bus schedulingA
Factors affecting crew schedulingB
Process for crew schedulingC
Optimizing utilization of staff and fleetD
Case study: BEST MumbaiE
Case study: KSRTC MysoreF
Fleet allocation to bus depotsG
S.No. Profile Day Week Rest Remark
A Steering duty
Max. 08 hrs
48 hrs 30 min on completion of 5hrs of duty
Duty can be extended upto max. 10 hrs withovertime payment and onapproval of competentauthority
Spreadover duty
Up to 12 hrs
- Only with the approval ofcompetent authority
B Steering duty
06 hrs - No rest At stretch the duty has tobe completed and no dutyafter 6 hrs on same day
C Min. rest • Between 2 successiveduty 09hrs
• 7th day weekly rest aftercompletion of successful6days working
For loss of weekly restpayment of over atdouble the rate of thenormal wages
7. Marketing and Branding

13
Bus and Crew Scheduling
2. Bus and Crew Scheduling
3. Management of Operations
4. Demand and Supply
5. Monitoring of Services
6. Revenue collection
1. Introduction
Factors affecting bus schedulingA
Factors affecting crew schedulingB
Process for crew schedulingC
Optimizing utilization of staff and fleetD
Case study: BEST MumbaiE
Case study: KSRTC MysoreF
Fleet allocation to bus depotsG
Date: 19/09/2019
Type of service:
ordinary
Vehicle no.:
MH 21 1234
Reporting time:
0630hrs
• Complete transparency
without manual intervention
• Fast communication
Process for crew reporting
7. Marketing and Branding
14
Bus and Crew Scheduling
2. Bus and Crew Scheduling
3. Management of Operations
4. Demand and Supply
5. Monitoring of Services
6. Revenue collection
1. Introduction
Factors affecting bus schedulingA
Factors affecting crew schedulingB
Process for crew schedulingC
Optimizing utilization of staff and fleetD
Case study: BEST MumbaiE
Case study: KSRTC MysoreF
Fleet allocation to bus depotsG
Optimizing utilization of staff and fleet
• Vehicle & Crew scheduling for a route using latest technology software
• Since the running times vary by time-of-day hence should be adjusted based
on actual data on running times
• Option of broken duty/split duty concept may be implemented
• There are two kind of methods followed regarding bus & crew change
Tips for improving efficiency
First Method
At the depot
Second Method
En-Route
or at Terminal7. Marketing and Branding

15
Bus and Crew Scheduling
2. Bus and Crew Scheduling
3. Management of Operations
4. Demand and Supply
5. Monitoring of Services
6. Revenue collection
1. Introduction
Factors affecting bus schedulingA
Factors affecting crew schedulingB
Process for crew schedulingC
Optimizing utilization of staff and fleetD
Case study: BEST MumbaiE
Case study: KSRTC MysoreF
Fleet allocation to bus depotsG
Optimizing utilization of staff and fleet
Cost is incurred on account of
fuel consumption toward dead
kms
Is incurred Zero dead kms
En-route/ at terminalAt depot
Due to zero dead kms, no coston account of fuel consumption
Minor technical issues can be easily resolved
Minor Technical issues (requiring more time say > 15-25min) cannot be resolved
Loss of time in taking the bus to the depot from terminal &
vise-a-versa
Nil
Time savings is extended to thepassenger due to which buses areon-road
Saving in the time
Breaks due to changeover at depot.
Service
frequency
Service frequency can be maintained as per schedule.
Not so tedious since the starting & finishing point is at the depot.
Tedious since the crew first has to report at the depot and has to collect accessories and then report at the terminal
Reporting
procedure
Time saving
Benefit to customer
Maint.
issues
Fuel
Consump.
Dead kms
7. Marketing and Branding

16
Case study: BEST Mumbai (Impact of IT on Route and Duty Scheduling)
Bus and Crew Scheduling
2. Bus and Crew Scheduling
3. Management of Operations
4. Demand and Supply
5. Monitoring of Services
6. Revenue collection
1. Introduction
Factors affecting bus schedulingA
Factors affecting crew schedulingB
Process for crew schedulingC
Optimizing utilization of staff and fleetD
Case study: BEST MumbaiE
Case study: KSRTC MysoreF
Fleet allocation to bus depotsG
Parameters considered as inputs:
No. of Buses held
Journey Time per trip
Headway
Departure and
Arrival
Control points at origin & destination
Capacity of bus station / terminalSchedules
7. Marketing and Branding

17
Bus and Crew Scheduling
2. Bus and Crew Scheduling
3. Management of Operations
4. Demand and Supply
5. Monitoring of Services
6. Revenue collection
1. Introduction
Factors affecting bus schedulingA
Factors affecting crew schedulingB
Process for crew schedulingC
Optimizing utilization of staff and fleetD
Case study: BEST MumbaiE
Case study: KSRTC MysoreF
Fleet allocation to bus depotsG
Parameters considered as inputs:
Crew
Combine maximum in one route
Combine with feeder and long
routes
Rest period
Relief point for staff
Optimization through experience
Time taken
Case study: BEST Mumbai (Impact of IT on Route and Duty Scheduling)
7. Marketing and Branding

18
Bus and Crew Scheduling
2. Bus and Crew Scheduling
3. Management of Operations
4. Demand and Supply
5. Monitoring of Services
6. Revenue collection
1. Introduction
Factors affecting bus schedulingA
Factors affecting crew schedulingB
Process for crew schedulingC
Optimizing utilization of staff and fleetD
Case study: BEST MumbaiE
Case study: KSRTC MysoreF
Fleet allocation to bus depotsG
Plan 1 Plan 2
Combination of routes Long route + Long route Feeder + Long Route
Combination of duties &
routes
Duties combined with
routes / buses
Combination of routes
with same depot and type
vehicle
Rest Period 35-40min 50-60min
Spread over More than 10.30hrs Less than 10.30hrs
Saving in duties Up to 4.3% Up to 4.3%
Case study: BEST Mumbai (Impact of IT on Route and Duty Scheduling)
7. Marketing and Branding

19
Bus and Crew Scheduling
Spread Over of Duties ( Wadala & Oshiwara ) – MONDAY TO FRIDAY
Prepared 5-7 hrs 7-9 hrs 9-11 hrs 11-12 hrs Total
Manually22
2.64%
619
74.40%
177
21.27%
14
1.68%
832
100%
Automated88
11.00%
655
81.75 %
53
6.63%
5
0.63%
800
100%
2. Bus and Crew Scheduling
3. Management of Operations
4. Demand and Supply
5. Monitoring of Services
6. Revenue collection
1. Introduction
Factors affecting bus schedulingA
Factors affecting crew schedulingB
Process for crew schedulingC
Optimizing utilization of staff and fleetD
Case study: BEST MumbaiE
Case study: KSRTC MysoreF
Fleet allocation to bus depotsG
Spread Over of Duties (Wadala & Oshiwara) - SATURDAY
Prepared 5-7 hrs 7-9 hrs 9-11 hrs 11-12 hrs Total
Manually 22
2.66%
622
75.30%
169
20.46%
13
1.57%
826
100%
Automated80
10.11%
655
82.81%
51
6.45%
5
0.62%
791
100%
An overview of spread over: Manual vs. Automated
Case study: BEST Mumbai (Impact of IT on Route and Duty Scheduling)
7. Marketing and Branding

20
Bus and Crew Scheduling
Depot Manual (25 Depots)
Mon to Fri Sat Sun Holiday
Wadala 421 419 353 378
Oshiwara 419 415 302 340
2. Bus and Crew Scheduling
3. Management of Operations
4. Demand and Supply
5. Monitoring of Services
6. Revenue collection
1. Introduction
Factors affecting bus schedulingA
Factors affecting crew schedulingB
Process for crew schedulingC
Optimizing utilization of staff and fleetD
Case study: BEST MumbaiE
Case study: KSRTC MysoreF
Fleet allocation to bus depotsG
Duties and Savings
Depot Combined (Manual -23+ Computerized 2 depots)
Mon to Fri Sat Sun Holiday
Wadala 401 397 331 353
Oshiwara 403 397 287 324
Depot Saving by Computerized schedules
Mon to Fri Sat Sun Holiday
Wadala -20 (4.75%) -22 -22 -25
Oshiwara -16 (3.81%) -18 -15 -16
% -36 (4.28%)
Case study: BEST Mumbai (Impact of IT on Route and Duty Scheduling)
7. Marketing and Branding

21
Bus and Crew Scheduling
Manual Computerized Savings
Depots Mon to Fri
Sat Sun Mon to Fri
Sat Sun Mon to Fri
Sat Sun
Wadala 399 398 316 361 359 290 -38 -39 -26
Oshiwara 428 425 314 408 403 290 -20 -22 -24
Colaba 241 216 113 236 209 107 -5 -7 -6
Backbay 309 282 174 295 267 162 -14 -15 -12
Anik 451 449 408 435 432 397 -16 -17 -11
Deonar 356 352 273 338 333 274 -18 -19 1
Ghatkopar 412 394 303 403 384 302 -9 -10 -1
Vikhroli 362 354 215 345 336 224 -17 -18 9
Magthane 376 376 342 353 352 313 -23 -24 -29
Goregaon 397 396 307 384 381 288 -13 -15 -19
Poisar 292 277 226 275 259 212 -17 -18 -14
Goral 431 425 354 430 422 349 -1 -3 -5
Total 4454 4344 3345 4263 4137 3208 -191 -207 -137
-4.3% -4.8% -4.1%
2. Bus and Crew Scheduling
3. Management of Operations
4. Demand and Supply
5. Monitoring of Services
6. Revenue collection
1. Introduction
Factors affecting bus schedulingA
Factors affecting crew schedulingB
Process for crew schedulingC
Optimizing utilization of staff and fleetD
Case study: BEST MumbaiE
Case study: KSRTC MysoreF
Fleet allocation to bus depotsG
Duties and Savings (12 Depots)
Case study: BEST Mumbai (Impact of IT on Route and Duty Scheduling)
7. Marketing and Branding

22
Case study: KSRTC Mysore city
Bus and Crew Scheduling
2. Bus and Crew Scheduling
3. Management of Operations
4. Demand and Supply
5. Monitoring of Services
6. Revenue collection
1. Introduction
Factors affecting bus schedulingA
Factors affecting crew schedulingB
Process for crew schedulingC
Optimizing utilization of staff and fleetD
Case study: BEST MumbaiE
Case study: KSRTC MysoreF
Fleet allocation to bus depotsG
Observation after the ITS implementation
1 During early morning & late night, the running time to complete the trips were less.
2On the other hand, in the peak hours (both morning & evening) the running time was higher than usual.
3 In the afternoon, the trips were adhering the schedule time
Conventional practices: Schedules are planned with fixed criteria.
Suburban route: Speed 24kmph approx.
City route: Speed 20kmphs approx.
7. Marketing and Branding

23
Case study: KSRTC Mysore city
Bus and Crew Scheduling
2. Bus and Crew Scheduling
3. Management of Operations
4. Demand and Supply
5. Monitoring of Services
6. Revenue collection
1. Introduction
Factors affecting bus schedulingA
Factors affecting crew schedulingB
Process for crew schedulingC
Optimizing utilization of staff and fleetD
Case study: BEST MumbaiE
Case study: KSRTC MysoreF
Fleet allocation to bus depotsG
Note: The Mysuru Intelligent Transport System (MITRA) initiative of KSRTC
was supported by World Bank & MoUD
1
2
3
4
Schedule optimization Reduction in buses Preventative maintenance
Staff Reduction Overtime
Overall benefit of IT implementation
Source: Mysore City Transport Division of KSRTC
7. Marketing and Branding

24
Bus and Crew Scheduling
Fleet allocation/deployment to bus depots
2. Bus and Crew Scheduling
3. Management of Operations
4. Demand and Supply
5. Monitoring of Services
6. Revenue collection
1. Introduction
Factors affecting bus schedulingA
Factors affecting crew schedulingB
Process for crew schedulingC
Optimizing utilization of staff and fleetD
Case study: BEST MumbaiE
Case study: KSRTC MysoreF
Fleet allocation to bus depotsG
The criteria to be considered for allocation of routes to a depot are as given below:
1
2
3
The distance between the depot and the origin/
destination point of the route shall be the least.
On common route section, depot operating
maximum no. of buses shall be studied, preference
may be given for such a depot in route allocation.
Also total no. of routes & commuter to carried, available
fleet & workforce and capacity of the depot has to be
taken under consideration while planning for allocation of
routes to a depot.
7. Marketing and Branding

25
2. Bus and Crew Scheduling
3. Management of Operations
4. Demand and Supply
5. Monitoring of Services
6. Revenue collection
7. Marketing and Branding
1. Introduction
An overviewA
Challenges in AVM implementationB
Managing dispatchC
Monitoring route serviceD
Ensuring schedule adherenceE
Case study: KSRTC MysoreF
Ensuring standard driving complianceG
Incident managementH
Legislative provisionsI
Ensuring service contract complianceK
Adjusting schedules dynamicallyJ
Questions for audience
Q1. Are you using ITS application for managing the bus operations?
Management of Operations

26
Management of Operations
An overview
2. Bus and Crew Scheduling
3. Management of Operations
4. Demand and Supply
5. Monitoring of Services
6. Revenue collection
1. Introduction
An overviewA
Challenges in AVM implementationB
Managing dispatchC
Monitoring route serviceD
Ensuring schedule adherenceE
Case study: KSRTC MysoreF
Ensuring standard driving complianceG
Incident managementH
Legislative provisionsI
Ensuring service contract complianceK
Adjusting schedules dynamicallyJ
ITS application enables the operator in efficient management of bus operations.The outline of which is as given below:
Automatic Vehicle Monitoring (AVM)
Dispatch
Route Service Monitoring
Schedule Adherence
Emergency/Incident
management
Driving –Standards
Compliance
Service Contract Compliance
Dynamic rescheduling
The above applications are in line with the World Bank recommendation, which is based on the global best practice.
7. Marketing and Branding
27
Management of Operations
Challenges in AVM implementation
2. Bus and Crew Scheduling
3. Management of Operations
4. Demand and Supply
5. Monitoring of Services
6. Revenue collection
1. Introduction
An overviewA
Challenges in AVM implementationB
Managing dispatchC
Monitoring route serviceD
Ensuring schedule adherenceE
Case study: KSRTC MysoreF
Ensuring standard driving complianceG
Incident managementH
Legislative provisionsI
Ensuring service contract complianceK
Adjusting schedules dynamicallyJ
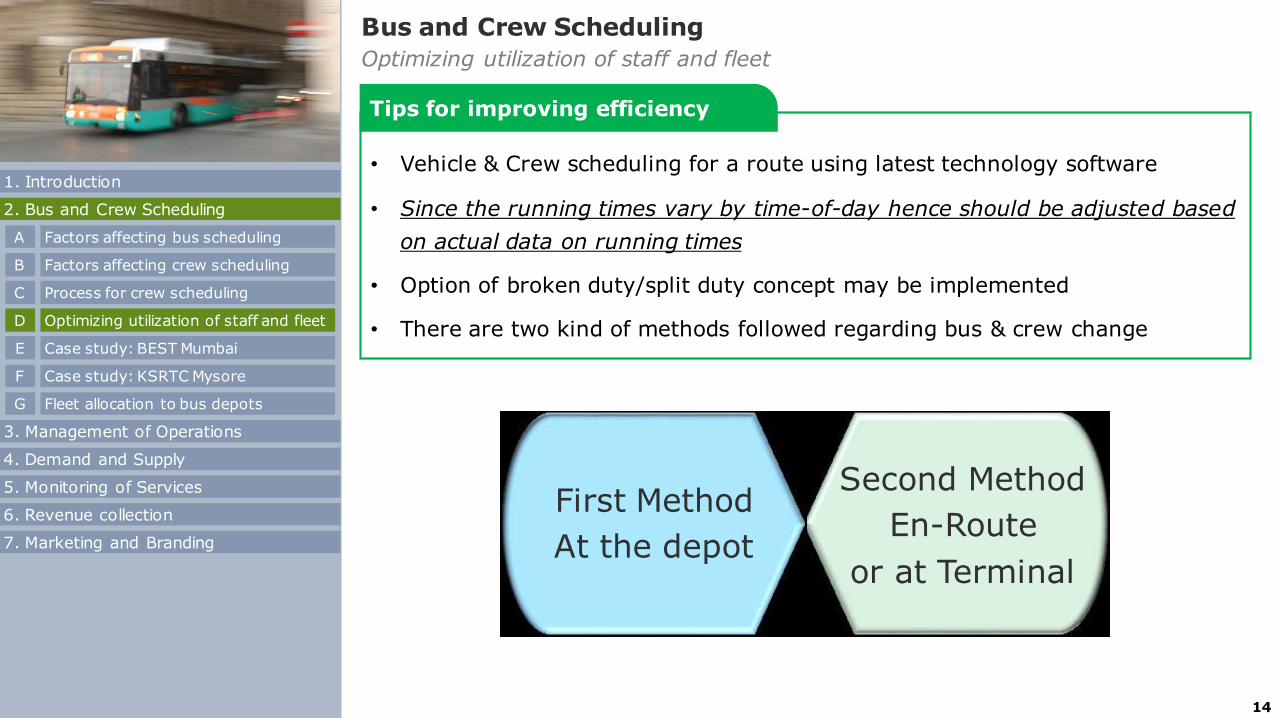
Bus stop - Total area for geo-fencing
in place of only designated area.
Codification of bus stop
PIS – physical trials for
verification of accuracy
ITS and GIS & GPS are procured
separately – trials functionally
synchronize to communicate correct
information of bus location to the
server
Check enroute – tracking
of lat and long,
subsequently update of
information
Educate crew to avoid sabotage
AVM shall be located
within the reach of the
driver
7. Marketing and Branding
28
Management of Operations
Managing dispatch
2. Bus and Crew Scheduling
3. Management of Operations
4. Demand and Supply
5. Monitoring of Services
6. Revenue collection
1. Introduction
An overviewA
Challenges in AVM implementationB
Managing dispatchC
Monitoring route serviceD
Ensuring schedule adherenceE
Case study: KSRTC MysoreF
Ensuring standard driving complianceG
Incident managementH
Legislative provisionsI
Ensuring service contract complianceK
Adjusting schedules dynamicallyJ
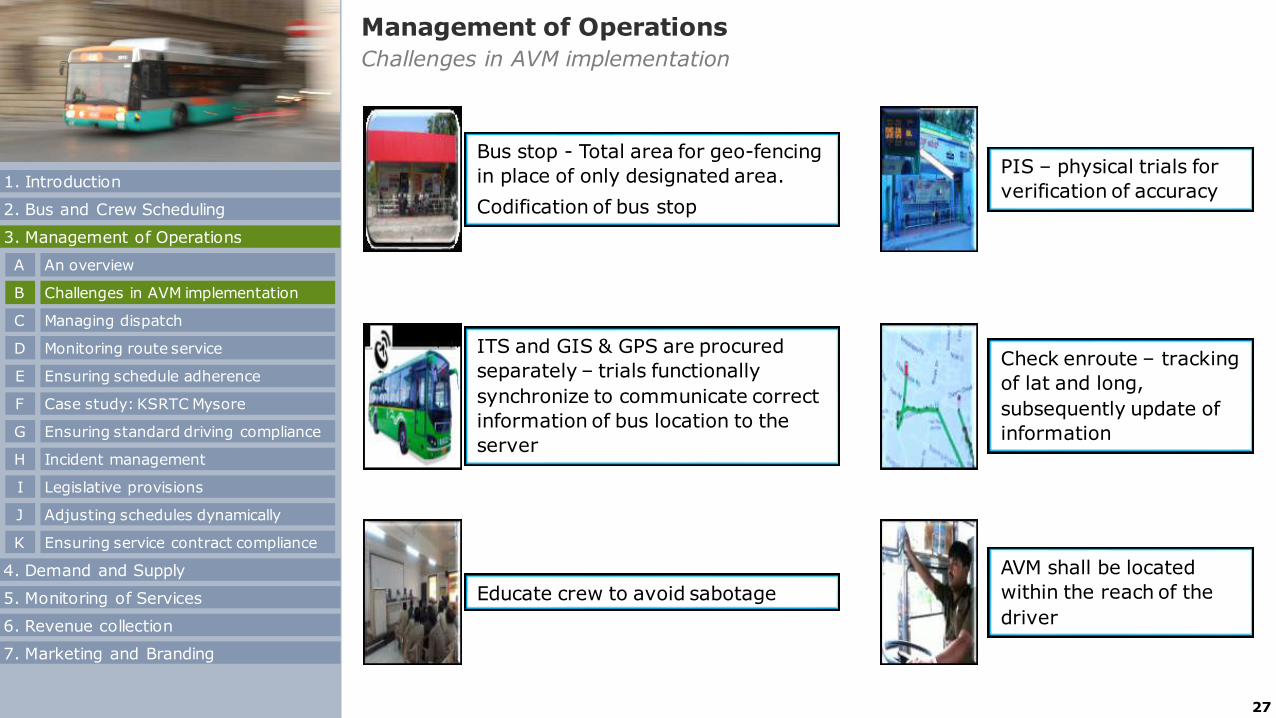
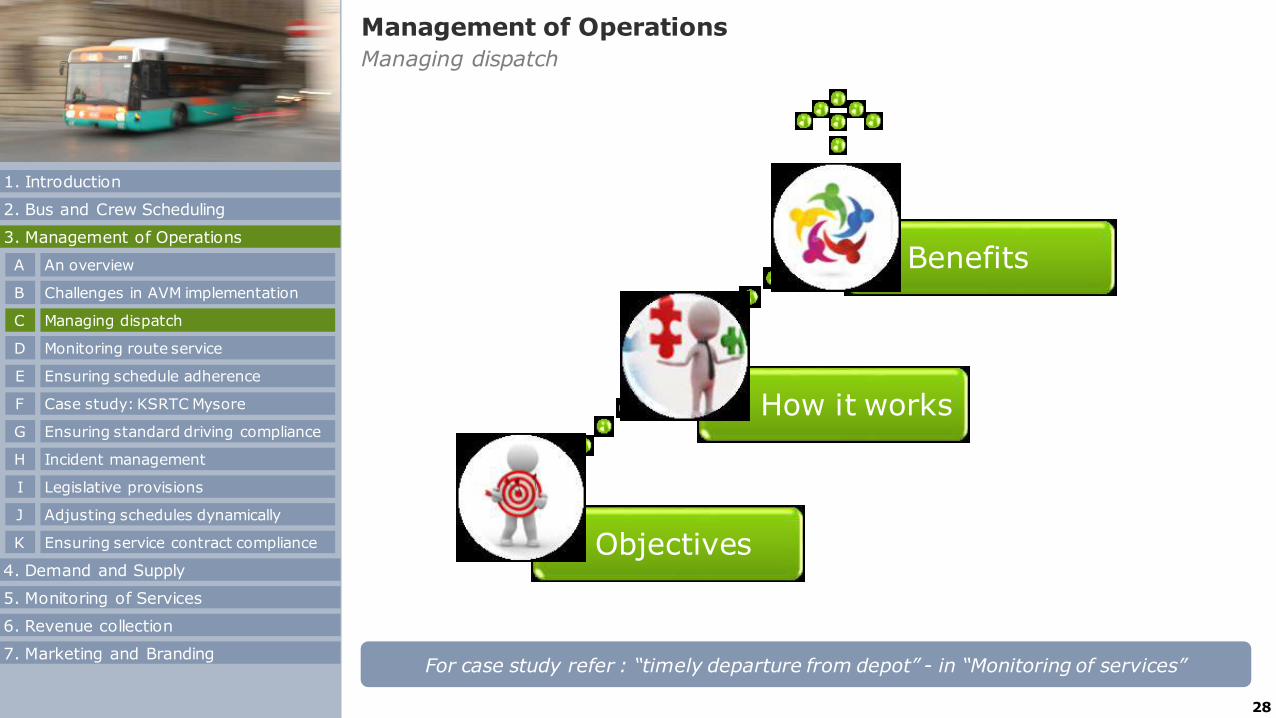
For case study refer : “timely departure from depot” - in “Monitoring of services”
Objectives
How it works
Benefits
7. Marketing and Branding

29
Management of Operations
Managing dispatch
Vehicle tracking on
multiple routes : 05 routes
Source: Mysore City Transport Division of KSRTC
2. Bus and Crew Scheduling
3. Management of Operations
4. Demand and Supply
5. Monitoring of Services
6. Revenue collection
1. Introduction
An overviewA
Challenges in AVM implementationB
Managing dispatchC
Monitoring route serviceD
Ensuring schedule adherenceE
Case study: KSRTC MysoreF
Ensuring standard driving complianceG
Incident managementH
Legislative provisionsI
Ensuring service contract complianceK
Adjusting schedules dynamicallyJ
7. Marketing and Branding

30
Management of Operations
Monitoring route service
2. Bus and Crew Scheduling
3. Management of Operations
4. Demand and Supply
5. Monitoring of Services
6. Revenue collection
1. Introduction
An overviewA
Challenges in AVM implementationB
Managing dispatchC
Monitoring route serviceD
Ensuring schedule adherenceE
Case study: KSRTC MysoreF
Ensuring standard driving complianceG
Incident managementH
Legislative provisionsI
Ensuring service contract complianceK
Adjusting schedules dynamicallyJ
Objectives
How it works
Benefits
7. Marketing and Branding

31
Management of Operations
Monitoring route service
1453 hrs1453 hrs
Source: Mysore City Transport Division of KSRTC
Advance
Vehicle tracking & commitment Vehicle tracking & commitment
Actual
2. Bus and Crew Scheduling
3. Management of Operations
4. Demand and Supply
5. Monitoring of Services
6. Revenue collection
1. Introduction
An overviewA
Challenges in AVM implementationB
Managing dispatchC
Monitoring route serviceD
Ensuring schedule adherenceE
Case study: KSRTC MysoreF
Ensuring standard driving complianceG
Incident managementH
Legislative provisionsI
Ensuring service contract complianceK
Adjusting schedules dynamicallyJ
7. Marketing and Branding

32
Management of Operations
Monitoring route service
2. Bus and Crew Scheduling
3. Management of Operations
4. Demand and Supply
5. Monitoring of Services
6. Revenue collection
1. Introduction
An overviewA
Challenges in AVM implementationB
Managing dispatchC
Monitoring route serviceD
Ensuring schedule adherenceE
Case study: KSRTC MysoreF
Ensuring standard driving complianceG
Incident managementH
Legislative provisionsI
Ensuring service contract complianceK
Adjusting schedules dynamicallyJ
Vehicle tracking : delay/early/on-time
05min
early
Vehicle tracking & commitment
on-
time
Vehicle tracking & commitment
7. Marketing and Branding

33
Management of Operations
Ensuring schedule adherence
2. Bus and Crew Scheduling
3. Management of Operations
4. Demand and Supply
5. Monitoring of Services
6. Revenue collection
1. Introduction
An overviewA
Challenges in AVM implementationB
Managing dispatchC
Monitoring route serviceD
Ensuring schedule adherenceE
Case study: KSRTC MysoreF
Ensuring standard driving complianceG
Incident managementH
Legislative provisionsI
Ensuring service contract complianceK
Adjusting schedules dynamicallyJ
Objectives
How it works
Benefits
7. Marketing and Branding

34
Management of Operations
Case study: KSRTC Mysore (MITRA for schedule adherence)
2. Bus and Crew Scheduling
3. Management of Operations
4. Demand and Supply
5. Monitoring of Services
6. Revenue collection
1. Introduction
An overviewA
Challenges in AVM implementationB
Managing dispatchC
Monitoring route serviceD
Ensuring schedule adherenceE
Case study: KSRTC MysoreF
Ensuring standard driving complianceG
Incident managementH
Legislative provisionsI
Ensuring service contract complianceK
Adjusting schedules dynamicallyJ
No of scheduled trips departed within + 5 min. deviation
No. of scheduled trips departed within -1 to + 5min deviation and the midpoint of the same
Arrival time of vehicle at the midpoint of the trip
Schedule adherence: The “Vehicle Mounting Unit” fitted in the buses was sending the information of its presence. Out of which the information, as highlighted below
was used:
7. Marketing and Branding

35
Management of Operations
Case study: KSRTC Mysore (MITRA for schedule adherence)
2. Bus and Crew Scheduling
3. Management of Operations
4. Demand and Supply
5. Monitoring of Services
6. Revenue collection
1. Introduction
An overviewA
Challenges in AVM implementationB
Managing dispatchC
Monitoring route serviceD
Ensuring schedule adherenceE
Case study: KSRTC MysoreF
Ensuring standard driving complianceG
Incident managementH
Legislative provisionsI
Ensuring service contract complianceK
Adjusting schedules dynamicallyJ
7. Marketing and Branding

36
Management of Operations
Ensuring standard driving compliance
2. Bus and Crew Scheduling
3. Management of Operations
4. Demand and Supply
5. Monitoring of Services
6. Revenue collection
1. Introduction
An overviewA
Challenges in AVM implementationB
Managing dispatchC
Monitoring route serviceD
Ensuring schedule adherenceE
Case study: KSRTC MysoreF
Ensuring standard driving complianceG
Incident managementH
Legislative provisionsI
Ensuring service contract complianceK
Adjusting schedules dynamicallyJ
Objectives
How it works
Benefits
7. Marketing and Branding

37
Management of Operations
Ensuring standard driving compliance
AVG. COUNTS PER BUS PER TRIP
Source: Mysore City Transport Division of KSRTC
2. Bus and Crew Scheduling
3. Management of Operations
4. Demand and Supply
5. Monitoring of Services
6. Revenue collection
1. Introduction
An overviewA
Challenges in AVM implementationB
Managing dispatchC
Monitoring route serviceD
Ensuring schedule adherenceE
Case study: KSRTC MysoreF
Ensuring standard driving complianceG
Incident managementH
Legislative provisionsI
Ensuring service contract complianceK
Adjusting schedules dynamicallyJ
7. Marketing and Branding

38
Management of Operations
Ensuring standard driving compliance
Latitude Longitude Altitude SpeedDirection
AngleNo of Track
satelliteGPS date & Time stamp Remarks
12.323923 76.691193 777 22 352 11 2017-04-24. 11:51:21 Dr. Rajkumar Main road
12.324465 76.691162 780 21 358 11 2017-04-24. 11:51:31 Up Gradient
12.3247 76.69133 780 16 92 12 2017-04-24. 11:51:41 Level road
12.32465 76.692024 777 36 100 12 2017-04-24. 11:51:51 Down Gradient
12.324483 76.693024 773 38 100 10 2017-04-24. 11:52:01 Down Gradient
12.324344 76.693848 769 19 100 12 2017-04-24. 11:52:11 Down Gradient
12.324324 76.69397 768 11 100 12 2017-04-24. 11:52:21 Down Gradient
12.324226 76.694565 766 32 100 12 2017-04-24. 11:52:31 Down Gradient
12.32411 76.695572 763 43 90 11 2017-04-24. 11:52:41 Down Gradient
12.32422 76.696709 758 47 80 12 2017-04-24. 11:52:51 Down Gradient
12.324741 76.697708 752 20 68 12 2017-04-24. 11:53:01 Down Gradient
12.325143 76.698792 752 0 208 11 2017-04-24. 11:53:11 Final position after accident
12.325138 76.698792 753 0 208 11 2017-04-24. 11:53:21 Final position after accident
12.32514 76.698776 753 0 208 11 2017-04-24. 11:53:31 Final position after accident
12.32514 76.698776 753 0 208 11 2017-04-24. 11:53:41 Final position after accident
Positional Lat-Long data used for each accident analysis
Source: Mysore City Transport Division of KSRTC
2. Bus and Crew Scheduling
3. Management of Operations
4. Demand and Supply
5. Monitoring of Services
6. Revenue collection
1. Introduction
An overviewA
Challenges in AVM implementationB
Managing dispatchC
Monitoring route serviceD
Ensuring schedule adherenceE
Case study: KSRTC MysoreF
Ensuring standard driving complianceG
Incident managementH
Legislative provisionsI
Ensuring service contract complianceK
Adjusting schedules dynamicallyJ
7. Marketing and Branding

39
Management of Operations
Incident management
2. Bus and Crew Scheduling
3. Management of Operations
4. Demand and Supply
5. Monitoring of Services
6. Revenue collection
1. Introduction
An overviewA
Challenges in AVM implementationB
Managing dispatchC
Monitoring route serviceD
Ensuring schedule adherenceE
Case study: KSRTC MysoreF
Ensuring standard driving complianceG
Incident managementH
Legislative provisionsI
Ensuring service contract complianceK
Adjusting schedules dynamicallyJ
Objectives How it works Beneficiaries
Individual vehicle or location1
Impacting only the public transport services2
Impacting the urban area and utilities, of which public transport is one37. Marketing and Branding

40
Management of Operations
Legislative provisions related to driving and incidents
2. Bus and Crew Scheduling
3. Management of Operations
4. Demand and Supply
5. Monitoring of Services
6. Revenue collection
1. Introduction
An overviewA
Challenges in AVM implementationB
Managing dispatchC
Monitoring route serviceD
Ensuring schedule adherenceE
Case study: KSRTC MysoreF
Ensuring standard driving complianceG
Incident managementH
Legislative provisionsI
Ensuring service contract complianceK
Adjusting schedules dynamicallyJ
Section 279: Rash driving or riding on a public way.
Section 304A: Causing death by negligence.
Section 338: Causing grievous hurt by act endangering life or
personal safety of others.
Section 337: Causing hurt by act endangering life or personal safety of others.
Section 336: Act endangering life or personal safety of others.
279
340A336
337
338
The Indian Penal Code (IPC): Offences & punishments. Also applicable to Urban Transport.
7. Marketing and Branding

41
Management of Operations
Adjusting schedules dynamically
2. Bus and Crew Scheduling
3. Management of Operations
4. Demand and Supply
5. Monitoring of Services
6. Revenue collection
1. Introduction
An overviewA
Challenges in AVM implementationB
Managing dispatchC
Monitoring route serviceD
Ensuring schedule adherenceE
Case study: KSRTC MysoreF
Ensuring standard driving complianceG
Incident managementH
Legislative provisionsI
Ensuring service contract complianceK
Adjusting schedules dynamicallyJ
Objectives
How it works
Benefits
7. Marketing and Branding

42
Management of Operations
Adjusting schedules dynamically
Source: Mysore City Transport Division of KSRTC
2. Bus and Crew Scheduling
3. Management of Operations
4. Demand and Supply
5. Monitoring of Services
6. Revenue collection
1. Introduction
An overviewA
Challenges in AVM implementationB
Managing dispatchC
Monitoring route serviceD
Ensuring schedule adherenceE
Case study: KSRTC MysoreF
Ensuring standard driving complianceG
Incident managementH
Legislative provisionsI
Ensuring service contract complianceK
Adjusting schedules dynamicallyJ
7. Marketing and Branding

43
Management of Operations
Ensuring service contract compliance
2. Bus and Crew Scheduling
3. Management of Operations
4. Demand and Supply
5. Monitoring of Services
6. Revenue collection
1. Introduction
An overviewA
Challenges in AVM implementationB
Managing dispatchC
Monitoring route serviceD
Ensuring schedule adherenceE
Case study: KSRTC MysoreF
Ensuring standard driving complianceG
Incident managementH
Legislative provisionsI
Ensuring service contract complianceK
Adjusting schedules dynamicallyJ
Objectives
How it works
Benefits
7. Marketing and Branding

44
Demand and Supply Management
Question for audience
2. Bus and Crew Scheduling
3. Management of Operations
4. Demand and Supply
5. Monitoring of Services
6. Revenue collection
7. Marketing and Branding
1. Introduction
Passenger demandA
Sources of passenger demandB
Route wise demand fluctuationC
Critical parameters (supply of service)D
Q1. What is passenger demand?
Q2. Sources of passenger demand?
Q3. What are the critical parameters to be considered in the supply of
services.

45
Demand and Supply Management
Passenger demand
Catered Demand
Un-Catered Demand
Lead Demand
+
+
2. Bus and Crew Scheduling
3. Management of Operations
4. Demand and Supply
5. Monitoring of Services
6. Revenue collection
1. Introduction
Passenger demandA
Sources of passenger demandB
Route wise demand fluctuationC
Critical parameters (supply of service)D
7. Marketing and Branding

46
Demand and Supply Management
Sources of passenger demand
N A C P V
Nigdi
Akurdi
Chinchwad
Pimpri
K KN
Vallabnagar
Nashik Phata
Kasarwadi
D
Dapodi
Khadki
S
Shivajinagar
R
RTO Office
P
Pune Station
Route – Bhosari to Pune MC
Route – Nigdi to Pune MC
Bhosari
CCTI
2. Bus and Crew Scheduling
3. Management of Operations
4. Demand and Supply
5. Monitoring of Services
6. Revenue collection
1. Introduction
Passenger demandA
Sources of passenger demandB
Route wise demand fluctuationC
Critical parameters (supply of service)D
7. Marketing and Branding

47
Demand and Supply Management
Route wise demand fluctuation
0
10
20
30
40
50
60
70
80
Thane
Dadoji K
ond D
ev
Court
Naka
Kalv
a
Shiv
aji H
osp
ital
Vitava
Dam
odar
Vitavkar M
arg
Ganesh
Pada
Mukund C
om
pany
Dig
ha
MSEB
Airoli N
aka
Philip
s Com
pany
Bhara
t Bijle
e
Sie
mens
Co
Rabada P
olice S
tn
Rabada N
aka
Gohavi G
aon
Tala
vli
Naka
Ghansoli N
aka
Sta
ndard
Alc
.
Mahape N
aka
Kopar Khairane
ICI
Khera
ne G
aon
Khera
ne R
eliance
Pavne N
aka
Savita C
hem
icals
Turb
he S
tore
s
Gadge M
ahara
j Chow
k
Turb
he N
aka
Dutta M
andir
Turb
he V
illa
ge
Sanpada R
ly S
tn
Mafc
o
Krishi Upanna B
aja
r
Kanda B
ata
ta B
aja
r
Vashi Rly
Stn
No o
f Passengers
->
Name of the stop ->
Traffic Loading Survey
Starting Time: 19:15 hours; Ending Time: 20:30 hours
Route length : 20.2 kms. approx.2. Bus and Crew Scheduling
3. Management of Operations
4. Demand and Supply
5. Monitoring of Services
6. Revenue collection
1. Introduction
Passenger demandA
Sources of passenger demandB
Route wise demand fluctuationC
Critical parameters (supply of service)D
7. Marketing and Branding

48
Demand and Supply Management
Critical parameters for supply of services
The first focus shall always
be on ensuring assured
passengers are not opting
for other alternatives.
The trend line analysis of
daily, monthly and seasonal
fluctuation could lead to fine
tuning of trips and
schedules.
For planning of route & trips on a
given route, information on bus stop
wise passenger ridership should be
used
If, on a given route between specified
bus stops, more passengers demand
is observed than the services
provided, then an extra bus should be
operated between that section.
However, due considerations are given
to the length of such sections.
The type of bus to be
operated is a function of no.
of passengers travelling/
ridership, expectation of
passengers, income level
attributes, etc.
In supply of services, the following points are to be taken under considerations:
2. Bus and Crew Scheduling
3. Management of Operations
4. Demand and Supply
5. Monitoring of Services
6. Revenue collection
1. Introduction
Passenger demandA
Sources of passenger demandB
Route wise demand fluctuationC
Critical parameters (supply of service)D
7. Marketing and Branding

49
Demand and Supply Management
Critical parameters for supply of services: Case study of PMPML
2. Bus and Crew Scheduling
3. Management of Operations
4. Demand and Supply
5. Monitoring of Services
6. Revenue collection
1. Introduction
Passenger demandA
Sources of passenger demandB
Route wise demand fluctuationC
Critical parameters (supply of service)D
• Corridor – 3 – NashikPhata to Wakad
• Date of commissioning:28 Nov 2015
• Route Length - 8km
• No of stations - 15
• 10 primary surveyswere conducted.
7. Marketing and Branding

50
Monitoring of Service
Parameters to be monitored
2. Bus and Crew Scheduling
3. Management of Operations
4. Demand and Supply
5. Monitoring of Services
6. Revenue collection
7. Marketing and Branding
1. Introduction
Parameters to be monitoredA
Monitor timely departure from depotB
Service contract compliance reportC
Speed limit violation reportD
Stoppage reportE
Monitoring vehicle speedF
Kilometers reportG
Skipped stops reportH
Monitoring driving behaviorI
Monitoring parameters and benefitsK
Monitoring real-time trip progressJ
Early / Late departure
Non-completion of
trips
Deviation in the trips
Cancellation of the trips
Cancelled Kilometers
Vehicle traveled path
Idle time
Speed and Over speed
report
Stoppage report
Skipping of bus stops
VTS Analysis Report
GPS analysis

51
Monitoring of Service
Monitor timely departure from depot
Source: ppt of Dr K N Ingalgi, BMTC
2. Bus and Crew Scheduling
3. Management of Operations
4. Demand and Supply
5. Monitoring of Services
6. Revenue collection
1. Introduction
Parameters to be monitoredA
Monitor timely departure from depotB
Service contract compliance reportC
Speed limit violation reportD
Stoppage reportE
Monitoring vehicle speedF
Kilometers reportG
Skipped stops reportH
Monitoring driving behaviorI
Monitoring parameters and benefitsK
Monitoring real-time trip progressJ
7. Marketing and Branding

52
Monitoring of Service
Service contract compliance report
2. Bus and Crew Scheduling
3. Management of Operations
4. Demand and Supply
5. Monitoring of Services
6. Revenue collection
1. Introduction
Parameters to be monitoredA
Monitor timely departure from depotB
Service contract compliance reportC
Speed limit violation reportD
Stoppage reportE
Monitoring vehicle speedF
Kilometers reportG
Skipped stops reportH
Monitoring driving behaviorI
Monitoring parameters and benefitsK
Monitoring real-time trip progressJ
Trip wise report Summary report
Source: ppt of Dr K N Ingalgi, BMTC
7. Marketing and Branding

53
Monitoring of Service
Speed limit violation report
2. Bus and Crew Scheduling
3. Management of Operations
4. Demand and Supply
5. Monitoring of Services
6. Revenue collection
1. Introduction
Parameters to be monitoredA
Monitor timely departure from depotB
Service contract compliance reportC
Speed limit violation reportD
Stoppage reportE
Monitoring vehicle speedF
Kilometers reportG
Skipped stops reportH
Monitoring driving behaviorI
Monitoring parameters and benefitsK
Monitoring real-time trip progressJ
PMPML Report: Speed Limit Violation
Source: ppt of Dr K N Ingalgi, BMTCSource: PMPML
BMTC Report: Speed Limit Violation
7. Marketing and Branding

54
Monitoring of Service
Stoppage report
2. Bus and Crew Scheduling
3. Management of Operations
4. Demand and Supply
5. Monitoring of Services
6. Revenue collection
1. Introduction
Parameters to be monitoredA
Monitor timely departure from depotB
Service contract compliance reportC
Speed limit violation reportD
Stoppage reportE
Monitoring vehicle speedF
Kilometers reportG
Skipped stops reportH
Monitoring driving behaviorI
Monitoring parameters and benefitsK
Monitoring real-time trip progressJ
Source: ppt of Dr K N Ingalgi, BMTC7. Marketing and Branding

55
Monitoring of Service
Monitoring vehicle speed
2. Bus and Crew Scheduling
3. Management of Operations
4. Demand and Supply
5. Monitoring of Services
6. Revenue collection
1. Introduction
Parameters to be monitoredA
Monitor timely departure from depotB
Service contract compliance reportC
Speed limit violation reportD
Stoppage reportE
Monitoring vehicle speedF
Kilometers reportG
Skipped stops reportH
Monitoring driving behaviorI
Monitoring parameters and benefitsK
Monitoring real-time trip progressJ
Source: ppt of Dr K N Ingalgi, BMTC
7. Marketing and Branding

56
Monitoring of Service
Kilometers report
Source: PMPML
2. Bus and Crew Scheduling
3. Management of Operations
4. Demand and Supply
5. Monitoring of Services
6. Revenue collection
1. Introduction
Parameters to be monitoredA
Monitor timely departure from depotB
Service contract compliance reportC
Speed limit violation reportD
Stoppage reportE
Monitoring vehicle speedF
Kilometers reportG
Skipped stops reportH
Monitoring driving behaviorI
Monitoring parameters and benefitsK
Monitoring real-time trip progressJ
7. Marketing and Branding

57
Monitoring of Service
Skipped stops report
2. Bus and Crew Scheduling
3. Management of Operations
4. Demand and Supply
5. Monitoring of Services
6. Revenue collection
1. Introduction
Parameters to be monitoredA
Monitor timely departure from depotB
Service contract compliance reportC
Speed limit violation reportD
Stoppage reportE
Monitoring vehicle speedF
Kilometers reportG
Skipped stops reportH
Monitoring driving behaviorI
Monitoring parameters and benefitsK
Monitoring real-time trip progressJ
Source: PMPML
7. Marketing and Branding

58
Monitoring of Service
Monitoring driving behavior
2. Bus and Crew Scheduling
3. Management of Operations
4. Demand and Supply
5. Monitoring of Services
6. Revenue collection
1. Introduction
Parameters to be monitoredA
Monitor timely departure from depotB
Service contract compliance reportC
Speed limit violation reportD
Stoppage reportE
Monitoring vehicle speedF
Kilometers reportG
Skipped stops reportH
Monitoring driving behaviorI
Monitoring parameters and benefitsK
Monitoring real-time trip progressJ
7. Marketing and Branding

59
Monitoring of Service
Monitoring real-time trip progress
Source: PMPML
2. Bus and Crew Scheduling
3. Management of Operations
4. Demand and Supply
5. Monitoring of Services
6. Revenue collection
1. Introduction
Parameters to be monitoredA
Monitor timely departure from depotB
Service contract compliance reportC
Speed limit violation reportD
Stoppage reportE
Monitoring vehicle speedF
Kilometers reportG
Skipped stops reportH
Monitoring driving behaviorI
Monitoring parameters and benefitsK
Monitoring real-time trip progressJ
7. Marketing and Branding

60
Monitoring of Service
Monitoring real-time trip progress
Source: PMPML
2. Bus and Crew Scheduling
3. Management of Operations
4. Demand and Supply
5. Monitoring of Services
6. Revenue collection
1. Introduction
Parameters to be monitoredA
Monitor timely departure from depotB
Service contract compliance reportC
Speed limit violation reportD
Stoppage reportE
Monitoring vehicle speedF
Kilometers reportG
Skipped stops reportH
Monitoring driving behaviorI
Monitoring parameters and benefitsK
Monitoring real-time trip progressJ
7. Marketing and Branding

61
Monitoring of Service
Monitoring real-time trip progress – video
2. Bus and Crew Scheduling
3. Management of Operations
4. Demand and Supply
5. Monitoring of Services
6. Revenue collection
1. Introduction
Parameters to be monitoredA
Monitor timely departure from depotB
Service contract compliance reportC
Speed limit violation reportD
Stoppage reportE
Monitoring vehicle speedF
Kilometers reportG
Skipped stops reportH
Monitoring driving behaviorI
Monitoring parameters and benefitsK
Monitoring real-time trip progressJ
Various violations requiring monitoring
7. Marketing and Branding

62
Monitoring of Service
Parameters associated with monitoring along with their benefits
2. Bus and Crew Scheduling
3. Management of Operations
4. Demand and Supply
5. Monitoring of Services
6. Revenue collection
1. Introduction
Parameters to be monitoredA
Monitor timely departure from depotB
Service contract compliance reportC
Speed limit violation reportD
Stoppage reportE
Monitoring vehicle speedF
Kilometers reportG
Skipped stops reportH
Monitoring driving behaviorI
Monitoring parameters and benefitsK
Monitoring real-time trip progressJ
real-time tracking
Rationalization
Arr, Dep &
Deviation
Violation of scheduled timings
Trip curtailment
schedule duty
deviation
Trip cancella
tion
Time: Loss & /idle
Avg. Speed
Skipping of bus stops
Cancellation kms
real-time tracking
Rational-ization
Arr, Dep &Deviation
Violation of scheduled
timings
Trip curtailment
Schedule duty
deviation
Trip cancellation
Additional kms
Time: Loss & /idle
Avg. Speed
Skipping of bus stops
Cancellation kms
7. Marketing and Branding

63
Revenue Collection
Questions for audience
2. Bus and Crew Scheduling
3. Management of Operations
4. Demand and Supply
5. Monitoring of Services
6. Revenue collection
1. Introduction
7. Marketing and Branding
Cash / Revenue handlingA
Types of fraudsB
Types of checksC
Case study: NEKRTC (Gulbarga)D
What are possible fraud in revenue collection & how to curb?
Link / Interlinkage with ITS & MISE
64
Revenue Collection
Cash / Revenue handling
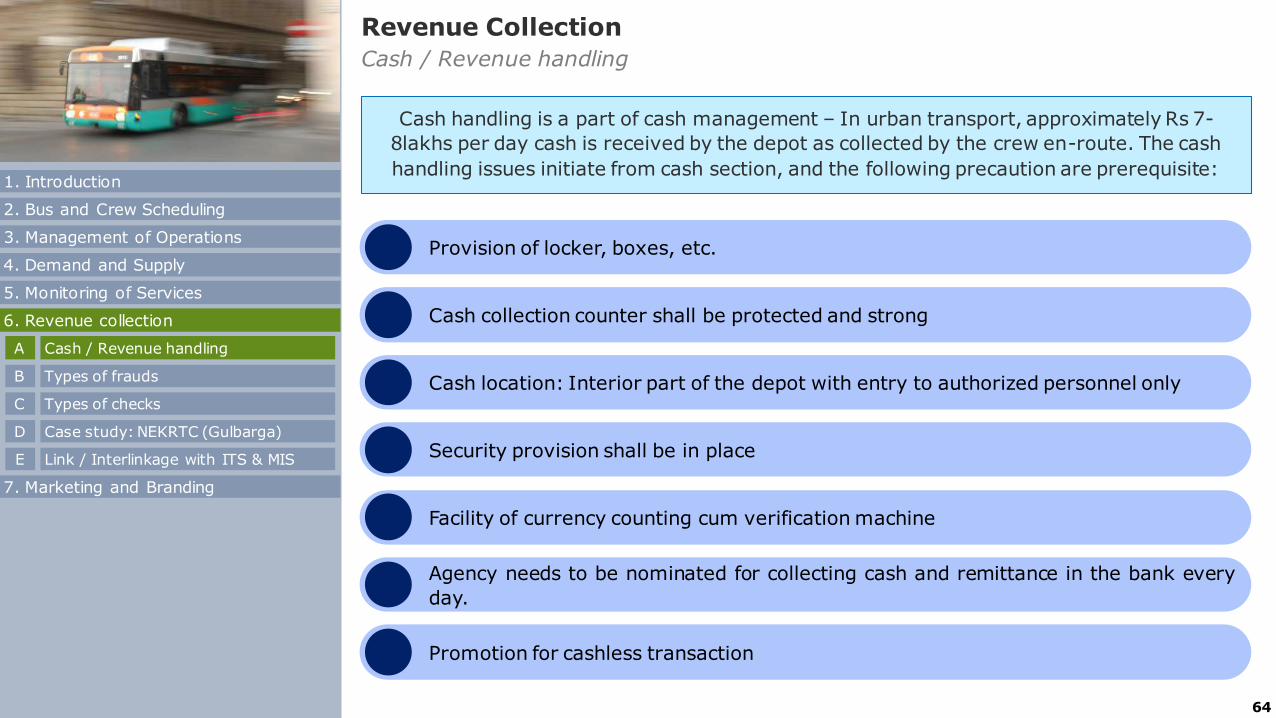
Cash handling is a part of cash management – In urban transport, approximately Rs 7-
8lakhs per day cash is received by the depot as collected by the crew en-route. The cash
handling issues initiate from cash section, and the following precaution are prerequisite:
Provision of locker, boxes, etc.
Cash collection counter shall be protected and strong
Cash location: Interior part of the depot with entry to authorized personnel only
Security provision shall be in place
Facility of currency counting cum verification machine
Agency needs to be nominated for collecting cash and remittance in the bank every
day.
Promotion for cashless transaction
2. Bus and Crew Scheduling
3. Management of Operations
4. Demand and Supply
5. Monitoring of Services
6. Revenue collection
1. Introduction
7. Marketing and Branding
Cash / Revenue handlingA
Types of fraudsB
Types of checksC
Case study: NEKRTC (Gulbarga)D
Link / Interlinkage with ITS & MISE

65
Revenue Collection
Types of frauds occurring during revenue collection
01Collection of lesser fare
03Data
manipulation
04Denomination
tickets
02Parallel ticketing
06Ticketless travel
by passengers 07Over traveling
by passengers
05By foot boarded
passengers
2. Bus and Crew Scheduling
3. Management of Operations
4. Demand and Supply
5. Monitoring of Services
6. Revenue collection
1. Introduction
7. Marketing and Branding
Cash / Revenue handlingA
Types of fraudsB
Types of checksC
Case study: NEKRTC (Gulbarga)D
Link / Interlinkage with ITS & MISE

66
Revenue Collection
Various types of checks
1
Specific Hour Check
3
Combing Operation
5
Schedule time turnout of buses
from depot
7
ETM checking
9
Jackpot Checking
Alighting Checks at heavy
boarding point
2
Avoid Payment of Fare & Over traveling check
4
Smart card checking
6
Ticket Block Checking
8
2. Bus and Crew Scheduling
3. Management of Operations
4. Demand and Supply
5. Monitoring of Services
6. Revenue collection
1. Introduction
7. Marketing and Branding
Cash / Revenue handlingA
Types of fraudsB
Types of checksC
Case study: NEKRTC (Gulbarga)D
Link / Interlinkage with ITS & MISE
67
Revenue Collection
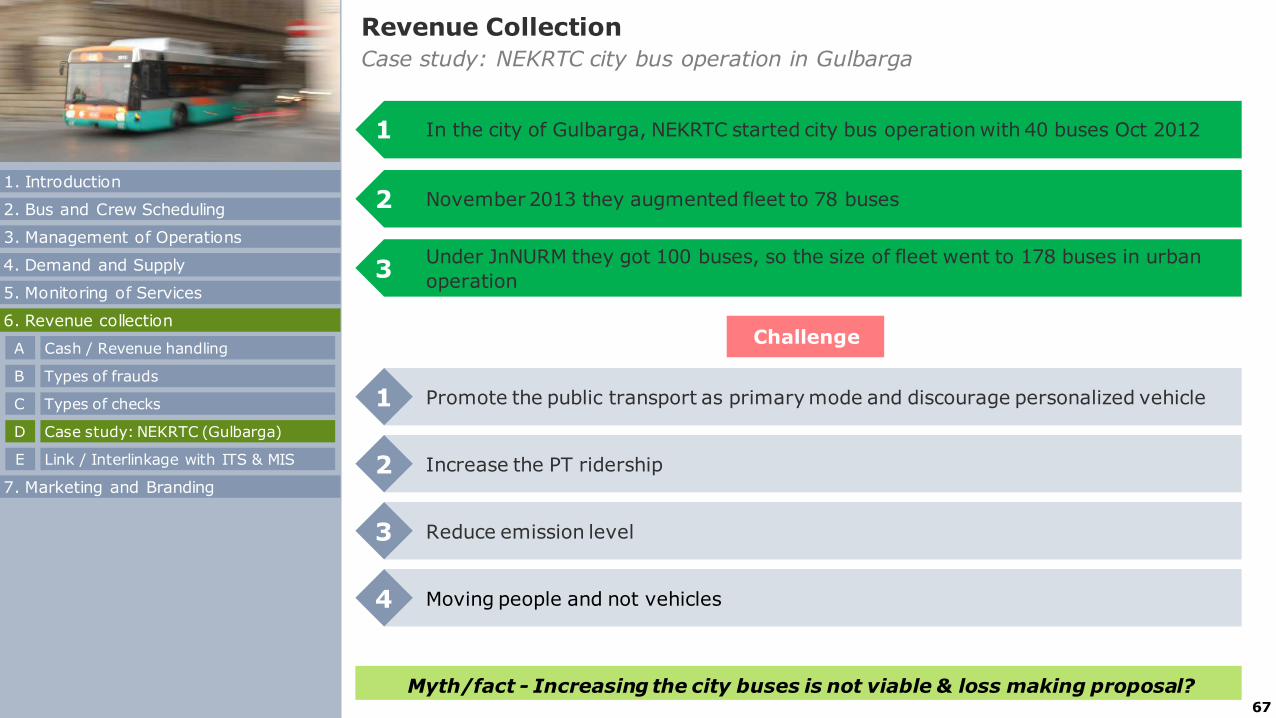
Case study: NEKRTC city bus operation in Gulbarga
Challenge
Myth/fact - Increasing the city buses is not viable & loss making proposal?
In the city of Gulbarga, NEKRTC started city bus operation with 40 buses Oct 20121
Promote the public transport as primary mode and discourage personalized vehicle1
November 2013 they augmented fleet to 78 buses 2
Under JnNURM they got 100 buses, so the size of fleet went to 178 buses in urban
operation 3
Increase the PT ridership2
Reduce emission level3
Moving people and not vehicles4
2. Bus and Crew Scheduling
3. Management of Operations
4. Demand and Supply
5. Monitoring of Services
6. Revenue collection
1. Introduction
7. Marketing and Branding
Cash / Revenue handlingA
Types of fraudsB
Types of checksC
Case study: NEKRTC (Gulbarga)D
Link / Interlinkage with ITS & MISE

68
Plan for sustainable transport approach 1
Wider area coverage 2Reduced waiting for commuters by providing bus service at
higher frequency 3
Keeping the bus stops within the reach of the people4
Use of ITS5
Branding6
Attractive fare7
Revenue Collection
Case study: NEKRTC city bus operation in Gulbarga
2. Bus and Crew Scheduling
3. Management of Operations
4. Demand and Supply
5. Monitoring of Services
6. Revenue collection
1. Introduction
7. Marketing and Branding
Cash / Revenue handlingA
Types of fraudsB
Types of checksC
Case study: NEKRTC (Gulbarga)D
Link / Interlinkage with ITS & MISE
Initiative taken

69
Revenue Collection
Case study: NEKRTC city bus operation in Gulbarga
2. Bus and Crew Scheduling
3. Management of Operations
4. Demand and Supply
5. Monitoring of Services
6. Revenue collection
1. Introduction
7. Marketing and Branding
Cash / Revenue handlingA
Types of fraudsB
Types of checksC
Case study: NEKRTC (Gulbarga)D
Link / Interlinkage with ITS & MISEFare structure
The city bus base fare was reduced to Rs 3.00
and proportionally thereof to see the impact
The above fare was much lower than the base fare of
IPTs (i.e., Rs 5.0)
Year 2014-15
Wider area coverage
Bus stops within the reach
Solar powered light sensitive illumination
Brand name: Nrupatunga

70
Revenue Collection
Case study: NEKRTC city bus operation in Gulbarga
2. Bus and Crew Scheduling
3. Management of Operations
4. Demand and Supply
5. Monitoring of Services
6. Revenue collection
1. Introduction
7. Marketing and Branding
Cash / Revenue handlingA
Types of fraudsB
Types of checksC
Case study: NEKRTC (Gulbarga)D
Link / Interlinkage with ITS & MISE
0
100
200
Before After
126160
VEHICLE UTILIZATION (in kms)
Before, 827
After, 1142
RIDERSHIP PER BUS (in No.)
0
1000
2000
3000
4000
5000
Before After
3195
4523
REVENUE PER BUS (in Rs.) 1. Revenue per bus per km
a) Before – 3195/126 = Rs 25.35
b) After - 4523/160 = Rs 28.26
Revenue per bus per km has increased
by Rs 3.
1. Ridership per bus has increased by 38%
2. With proper network planning, ensuring better
coverage, the vehicle utilization was
increased by 27%

71
Revenue Collection
Case study: NEKRTC city bus operation in Gulbarga
2. Bus and Crew Scheduling
3. Management of Operations
4. Demand and Supply
5. Monitoring of Services
6. Revenue collection
1. Introduction
7. Marketing and Branding
Cash / Revenue handlingA
Types of fraudsB
Types of checksC
Case study: NEKRTC (Gulbarga)D
Link / Interlinkage with ITS & MISE
QUALITY OF SERVICES
Passenger Interview & Feedback
0-2 min16%
2-5 min47%
5-8 min8%
8-12 min14%
More than 12 min15%
0%
10%
20%
30%
40%
50%
60%
70%
80%74%
18%
4% 1… 1% 2%
WAITING TIME

72
Revenue Collection
Link / Interlinkage with ITS & MIS
2. Bus and Crew Scheduling
3. Management of Operations
4. Demand and Supply
5. Monitoring of Services
6. Revenue collection
1. Introduction
7. Marketing and Branding
Cash / Revenue handlingA
Types of fraudsB
Types of checksC
Case study: NEKRTC (Gulbarga)D
Link / Interlinkage with ITS & MISE
In this module, we have emphasized on bus & crew scheduling, management of bus
operation, demand & supply, monitoring of services, revenue collection, and feedback
loop mechanism.
For proper execution of services it is essential to understand these basic principals and
monitor the same with ITS & MIS. In addition, under IT & MIS the focus is on:
1. How to assure the passengers via. PIS, Ticketing Management System.
2. Ensuring availability of fit vehicles on the road with the support of IT in inventory,
3. ITS role in ensuring safety & security of passenger & infrastructure,
4. How to monitor services of the operator.
5. Workforce & fleet management using ITS for improving the efficiency of urban bus
operation.

73
Marketing and Branding
Introduction
2. Bus and Crew Scheduling
3. Management of Operations
4. Demand and Supply
5. Monitoring of Services
6. Revenue collection
1. Introduction
7. Marketing and Branding
IntroductionA
Maintaining a brandB
• To remove the negative stigma
• To stand out from other service competitions
• To increase awareness among common people
Why is Marketing and Branding important?
01
• Work with civil societies and form focus groups.
• Learns the society’s opinions in a direct manner.
• Raise awareness among common people
What are the responsibilities of the authority?
02
• A marketing strategy identifies appropriate mediums of communication to disseminate the message of bus transport services.
What does marketing strategy include?
03 • Analysis done based on the profile of the city and on the target audience.
• Specific analysis of each situation and city is important.
Why does marketing strategies differ?
04

74
Marketing and Branding
Introduction: Approach for marketing and branding bus transport services
2. Bus and Crew Scheduling
3. Management of Operations
4. Demand and Supply
5. Monitoring of Services
6. Revenue collection
1. Introduction
7. Marketing and Branding
IntroductionA
Maintaining a brandB
Stakeholder identification Stakeholder consultation Stakeholder strategy
Stakeholder Analysis
321
Branding Strategy Marketing Strategy
4321
75
Marketing and Branding
Maintaining a brand: Overview
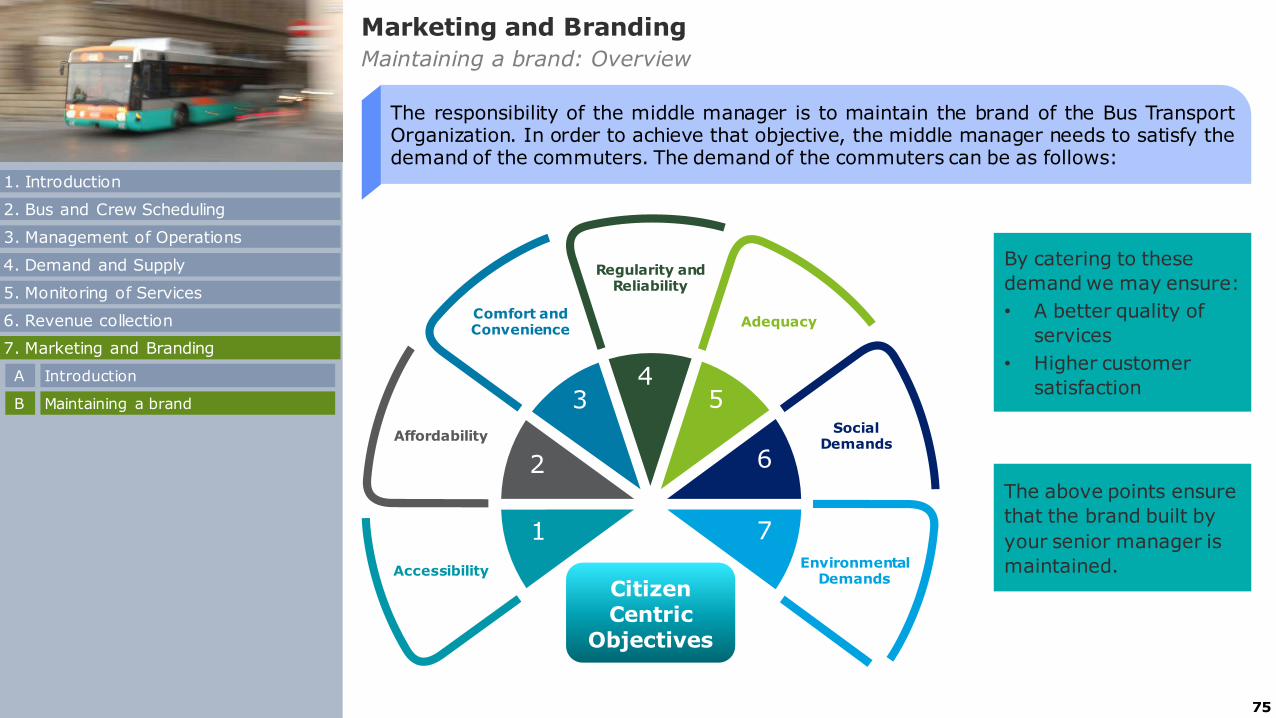
The responsibility of the middle manager is to maintain the brand of the Bus TransportOrganization. In order to achieve that objective, the middle manager needs to satisfy thedemand of the commuters. The demand of the commuters can be as follows:
Citizen Centric
Objectives
Environmental Demands
Social Demands
Adequacy
Regularity and Reliability
Comfort and Convenience
Affordability
Accessibility
7
6
54
3
2
1
By catering to these
demand we may ensure:
• A better quality of
services
• Higher customer
satisfaction
The above points ensure
that the brand built by
your senior manager is
maintained.
2. Bus and Crew Scheduling
3. Management of Operations
4. Demand and Supply
5. Monitoring of Services
6. Revenue collection
1. Introduction
7. Marketing and Branding
IntroductionA
Maintaining a brandB
76
Marketing and Branding
Maintaining a brand: Incorporate stakeholder inputs
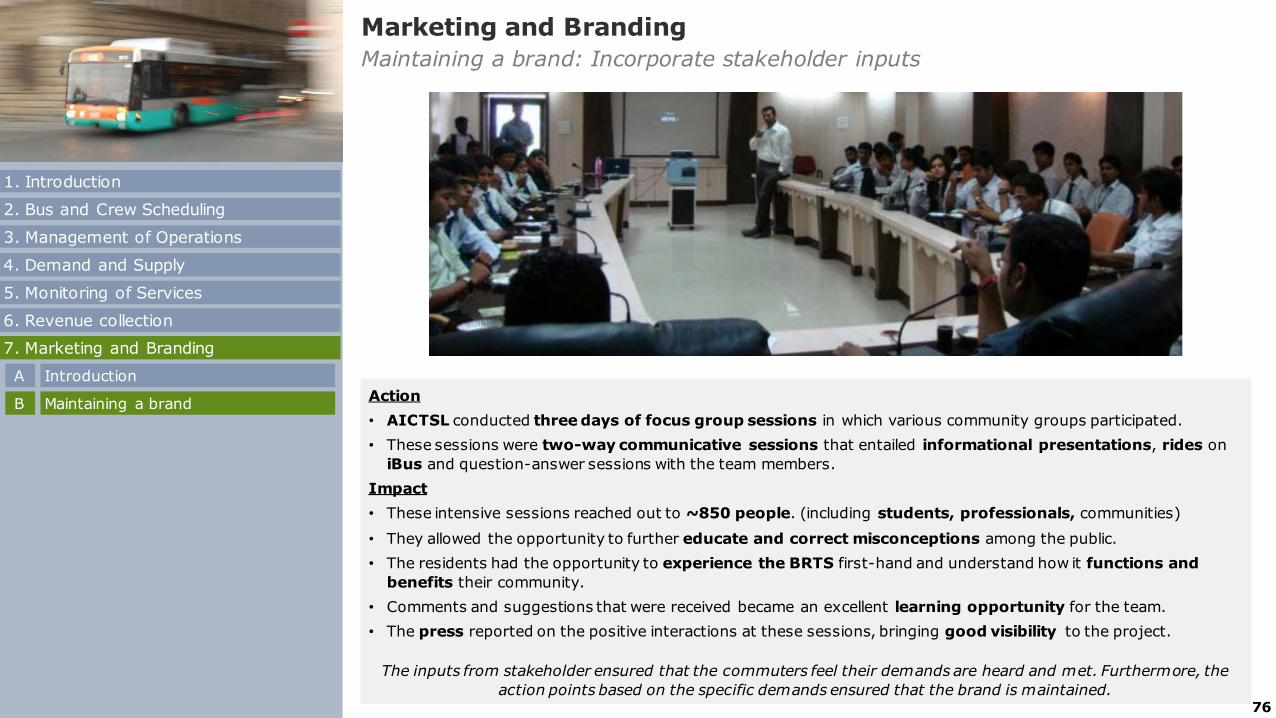
Action
• AICTSL conducted three days of focus group sessions in which various community groups participated.
• These sessions were two-way communicative sessions that entailed informational presentations, rides on
iBus and question-answer sessions with the team members.
Impact
• These intensive sessions reached out to ~850 people. (including students, professionals, communities)
• They allowed the opportunity to further educate and correct misconceptions among the public.
• The residents had the opportunity to experience the BRTS first-hand and understand how it functions and
benefits their community.
• Comments and suggestions that were received became an excellent learning opportunity for the team.
• The press reported on the positive interactions at these sessions, bringing good visibility to the project.
The inputs from stakeholder ensured that the commuters feel their demands are heard and met. Furthermore, the
action points based on the specific demands ensured that the brand is maintained.
2. Bus and Crew Scheduling
3. Management of Operations
4. Demand and Supply
5. Monitoring of Services
6. Revenue collection
1. Introduction
7. Marketing and Branding
IntroductionA
Maintaining a brandB

77
Marketing and Branding
Maintaining a brand: Social media tools
Social media and online marketing are excellent channels for providing updates, connecting with customers, and letting them know the services offered. Social media marketing ensures that the commuters are updated with Authority’s decision.
• It connects the authority directly with consumers by sharingupdates, sales, contests, new services, and more!
• Monitor reviews and comments on different platforms. Respondto questions, compliments, and complaints quickly andprofessionally.
• Unlike web pages that feature static content, social media isupdated frequently.
• Host online contests, offer special discount codes exclusivelyfor social media followers, have customers submit photos, usehashtags, and tag bus services on social media platforms.
• Creative and distinctive content receives the most attentiononline.
• It’s better to do great marketing on 1 or 2 channels than to do it poorly across 5 channels.
• When choosing a platform, consider the platform target customers are on and the objective of the agency
• Each platform has an algorithm that determines who sees posts. Be wary of post frequency, number of likes, and text length to optimize social media impact.
How does it help? What should be considered?
✓ An organization should create multiple channels (Facebook, Twitter, Instagram, etc..) in order to post the updates of the services.
✓ The point of contact for social media marketing should post the same content on all the pages at almost the same time.
Key considerations
Social media marketing channels
2. Bus and Crew Scheduling
3. Management of Operations
4. Demand and Supply
5. Monitoring of Services
6. Revenue collection
1. Introduction
7. Marketing and Branding
IntroductionA
Maintaining a brandB

78
Thank You !
Time for Discussion
79
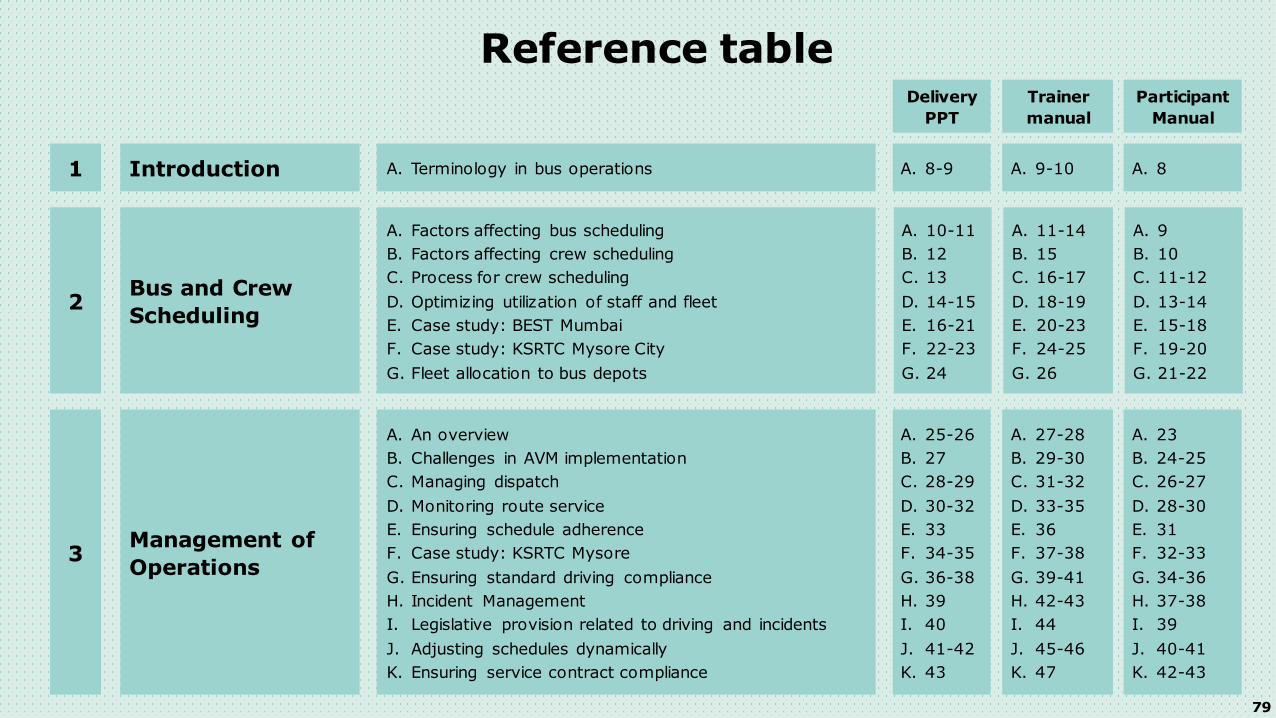
Reference table
A. 8-9 A. 9-10 A. 8
Delivery
PPT
Trainer
manual
Participant
Manual
A. 10-11
B. 12
C. 13
D. 14-15
E. 16-21
F. 22-23
G. 24
A. 11-14
B. 15
C. 16-17
D. 18-19
E. 20-23
F. 24-25
G. 26
A. 9
B. 10
C. 11-12
D. 13-14
E. 15-18
F. 19-20
G. 21-22
A. 25-26
B. 27
C. 28-29
D. 30-32
E. 33
F. 34-35
G. 36-38
H. 39
I. 40
J. 41-42
K. 43
A. 27-28
B. 29-30
C. 31-32
D. 33-35
E. 36
F. 37-38
G. 39-41
H. 42-43
I. 44
J. 45-46
K. 47
A. 23
B. 24-25
C. 26-27
D. 28-30
E. 31
F. 32-33
G. 34-36
H. 37-38
I. 39
J. 40-41
K. 42-43
Introduction A. Terminology in bus operations1
Bus and Crew
Scheduling
A. Factors affecting bus scheduling
B. Factors affecting crew scheduling
C. Process for crew scheduling
D. Optimizing utilization of staff and fleet
E. Case study: BEST Mumbai
F. Case study: KSRTC Mysore City
G. Fleet allocation to bus depots
2
Management of
Operations
A. An overview
B. Challenges in AVM implementation
C. Managing dispatch
D. Monitoring route service
E. Ensuring schedule adherence
F. Case study: KSRTC Mysore
G. Ensuring standard driving compliance
H. Incident Management
I. Legislative provision related to driving and incidents
J. Adjusting schedules dynamically
K. Ensuring service contract compliance
3

80
Reference table
A. 44-45
B. 46
C. 47
D. 48-49
A. 48-49
B. 50
C. 51
D. 52-53
A. 44
B. 45
C. 46
D. 47-48
Delivery
PPT
Trainer
manual
Participant
Manual
A. 50
B. 51
C. 52
D. 53
E. 54
F. 55
G. 56
H. 57
I. 58
J. 59-61
K. 62
A. 54
B. 55
C. 56
D. 57
E. 58
F. 59
G. 60
H. 61
I. 62
J. 63-64
K. 65-67
A. 49
B. 50
C. 51
D. 52
E. 53
F. 54
G. 55
H. 56
I. 57
J. 58-59
K. 60-62
Demand and
Supply
A. Passenger demand
B. Sources of passenger demand
C. Route wise demand fluctuation
D. Critical parameters for supply of services
4
Monitoring of
Service
A. Parameters to be monitored
B. Monitor timely departure from depot
C. Service contract compliance report
D. Speed limit violation report
E. Stoppage report
F. Monitoring vehicle speed
G. Kilometers report
H. Skipped stops report
I. Monitoring driving behavior
J. Monitoring real-time trip progress
K. Parameters associated with monitoring, along with
benefits
5

81
Reference table
A. -
B. -
C. -
D. -
E. 63-64
F. 65
G. 66
H. 67-71
I. 72
A. 68-69
B. 70
C. 71-73
D. 74
E. 75
F. 76-77
G. 78-81
H. 82-86
I. 87
A. 63
B. 64
C. 65-66
D. 67
E. 68
F. 69
G. 70-73
H. 74-78
I. 79-80
Delivery
PPT
Trainer
manual
Participant
Manual
A. 73-74
B. 75-77
A. 88-90
B. 91-93
A. 81-82
B. 83-86
Revenue
Collection
A. An overview
B. Fare fixation and Fare table
C. Case study: Karnataka
D. Case study: DMRC
E. Cash / Revenue handling
F. Types of frauds occurring during revenue collection
G. Various types of checks
H. Case study: NEKRTC city bus operation in Gulbarga
I. Link / Interlinkage with ITS and MIS
6
Marketing and
Branding
A. Introduction
B. Maintaining a brand7

82
Bibliography
1. SSATP ITS Toolkit. https://www.ssatp.org/sites/ssatp/files/publications/Toolkits/ITS%20Toolkit%20content/its-
applications/operations-management.html, Accessed in April 2019
2. Incident Management Plan, Department of Transport and Main Roads, Government of Queensland
3. BRT Planning Guide, ITDP, Viva, UNEP, GTZ, GEF, 2007
4. Robert Pressl, Claus Kollinger, Transport Learning, 2012, “Design and implementation of sustainable mobility campaigns”
5. Presentation of Dr. K N Ingalagi, BMTC, Management of Operations
6. Presentation of Shri Y Srinivasa Rao, Senior Manager, IT, APSRTC
7. Presentation of CMD, PMPML and snap shots received from PMPML
8. Integrated Intelligent Transport System (IITS), presentation by Commissioner, NMMC
9. https://www.fulcrumapp.com/blog/feedback-loops/, Accessed in April 2019
10. https://www.albert.io/blog/positive-negative-feedback-loops-biology/, Accessed in April 2019

P resentation title[To edit, c lick View > Slide Master > Slide Master]
©2019 Deloitte Shared Services India LLP 1
Trainer Manual

1
December 2020December 2020
MINISTRY OF HOUSING AND URBAN AFFAIRS, GOVERNMENT OF INDIA
Consultancy Services for Design and Development of Training Programme for City Transport Professionals
EFFICIENT AND SUSTAINABLE CITY BUS SERVICES PROJECT (INDIA)EFFICIENT AND SUSTAINABLE CITY BUS SERVICES PROJECT (INDIA)
TRAINER’S NOTES – BUS OPERATIONS FOR MIDDLE MANAGERSTRAINER’S NOTES – BUS OPERATIONS FOR MIDDLE MANAGERS

2
PrefaceThe Efficient and Sustainable City Bus Services (ESCBS) project was introduced to improve the efficiency and attractiveness of city
bus transport in India. ESCBS project has three major components which are National Capacity Building (NCB); Regulatory,
Institutional and Fiscal Analysis; and City Demonstration. This engagement falls under the purview of the NCB component of the
ESCBS project. The objective of the engagement is to design and develop training programme for city transport professionals. This
engagement also involves pilot testing, implementation, evaluation, and suitable modification of the training programme.
As a part of this engagement, eight training areas have been identified and prioritized by the Ministry of Housing and Urban Affairs
(MoHUA).
Policy Advocacy for
Senior Managers
Outsourcing for Senior
Managers
Monitoring and
Evaluation for Senior
Managers
Network Planning for
Middle Managers
Operations Planning for
Middle Managers
Outsourcing for Middle
Managers
Bus Operations for
Middle Managers
ITS and MIS for Middle
Managers
1 2 3 4
5 6 7 8
For each training areas, a total of three modules have been prepared:
A. Participant’s Notes: Detailed notes for participant’s reference containing links for more reading and is circulated before training
B. Trainer’s Notes: Detailed notes for the trainer’s reference containing focus points, questions for discussion, etc.
C. Delivery PPT: Brief presentation containing various animation, videos, group activities, etc. and is displayed on the screen

3
About the Module
It is strongly recommended to refer the trainer’s manual before the training session.
This training material on “Bus Operations” covers the technical and commercial aspects of bus operations
and marketing of bus services.
• The schedules of bus and crew cover all relevant aspects of bus operations such as route information,
halts, service frequency, cycle time, turn-around time at the terminal, crew shifts, and other components.
The operations are supervised from a central office and by supervisors on the ground in order to maintain
service standards. The crew's major function is to operate buses and collect revenue from the passengers.
Ascertain the extent to which passenger demand is met and also address the issues viz., significant drop in
particular section along the route. In case of an incident, the procedure described in the operation plan for
incident management needs to be followed.
• In continuation, this module also emphasizes up on adoption of global best practices such as adjusting
running time based on actual data wherein Indian practices are at variance.
• Marketing of bus services helps in creating awareness among the target audience regarding the existence
and benefits of the service. The strategy includes identifying and consulting various stakeholders; branding
the services using name, logo and tagline; and forming a marketing strategy using campaign and various
media options.

4
Learning Objectives
1Comprehend the factors affecting the bus & crew scheduling, thereby optimizing bus and fleet
deployment for route operation.
2 Upgrade skill set for managing bus operations using ITS.
3Ascertain the extent to which passenger demand is met. Address the issues viz., significant
drop in particular section along the route.
4Monitor the services for adherence to time, managing dispatch, extending support in case of
emergency, crew behavior, etc., in an efficient way.
5Set/diagnose the process of revenue collection and the controlling mechanism to curb the
pilferages in revenues collected.
6 Design and formulate branding and marketing strategy for outreach.
7 Applying lessons learned from various cities.
8 Ensuring that the brand is maintained.

5
Note for Trainers
Questionnaire, 20 min
Tea Break, 30 min
Discussion, 30 min
Group Activity, 100 min
Content Dissemination,
180 min
Lunch, 60 min
Session BreakupTotal 7 hours (420 min)
Key points for Trainers
✓ The trainers shall make a genuine effort to the training
session interactive
✓ The trainers shall adhere to the time given for a particular
module. The discussion should be kept at the end of the
session
✓ The trainers are requested to circulate the pre and post-
training questionnaire at the beginning of the training
session
✓ A group activity has been planned for each training
session. The trainers are requested to circulate the same
as per the power point presentation (Delivery
presentation)
✓ It is recommended that the trainer refers to the module-
wise notes. They provide the objective of that module,
along with notes and questions for discussion during the
training session.
Part 1 Part 2Lunch
10:00 AM to 1:00 PM
1:00 PM to 2:00 PM
2:00 PM to 5:00 PM
Tea break 1 Tea break 2
Structure of the training

6
Table of Contents
Introduction A. Terminology in bus operations1
Bus and Crew Scheduling
A. Factors affecting bus scheduling
B. Factors affecting crew scheduling
C. Process for crew scheduling
D. Optimizing utilization of staff and fleet
E. Case study: BEST Mumbai (Impact of IT uses in Route and Duty Scheduling
F. Case study: KSRTC Mysore City
G. Fleet allocation to bus depots
2
Management of
Operations
A. An overview
B. Challenges in AVM implementation
C. Managing dispatch
D. Monitoring route service
E. Ensuring schedule adherence
F. Case study: KSRTC Mysore (MITRA for schedule adherence)
G. Ensuring standard driving compliance
H. Incident Management
I. Legislative provision related to driving and incidents
J. Adjusting schedules dynamically
K. Ensuring service contract compliance
3

7
Table of Contents
Demand and Supply
A. Passenger demand
B. Sources of passenger demand
C. Route wise demand fluctuation
D. Critical parameters for the supply of services
4
Monitoring of Service
A. Parameters to be monitored
B. Monitor timely departure from depot
C. Service contract compliance report
D. Speed limit violation report
E. Stoppage report
F. Monitoring vehicle speed
G. Kilometers report
H. Skipped stops report
I. Monitoring driving behavior
J. Monitoring real-time trip progress
K. Parameters associated with monitoring, along with benefits
5

8
Table of Contents
Revenue Collection
A. An overview
B. Fare fixation and Fare table
C. Case study: Karnataka
D. Case study: DMRC
E. Cash / Revenue handling
F. Types of frauds occurring during revenue collection
G. Various types of checks
H. Case study: NEKRTC city bus operation in Gulbarga
I. Link / Interlinkage with ITS and MIS
6
Marketing and BrandingA. Introduction
B. Maintaining a brand7
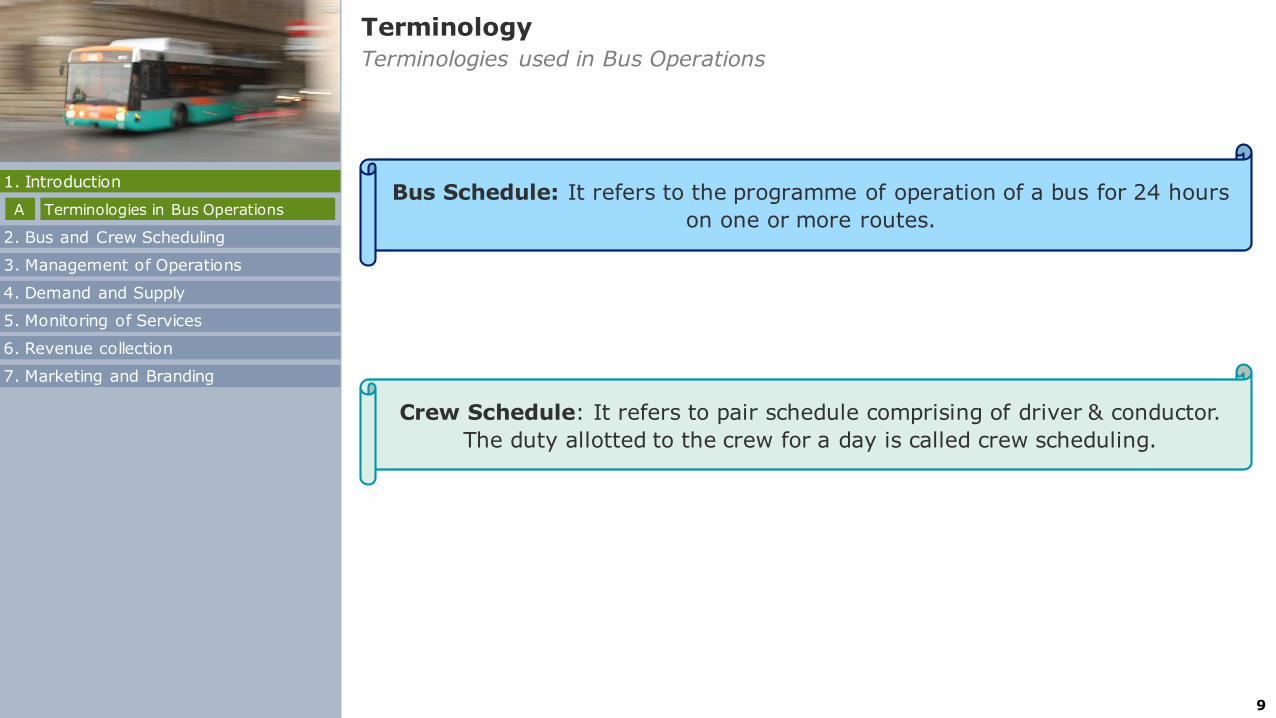
9
Terminology
Terminologies used in Bus Operations
2. Bus and Crew Scheduling
3. Management of Operations
4. Demand and Supply
5. Monitoring of Services
6. Revenue collection
7. Marketing and Branding
1. Introduction
Terminologies in Bus OperationsABus Schedule: It refers to the programme of operation of a bus for 24 hours
on one or more routes.
Crew Schedule: It refers to pair schedule comprising of driver & conductor.
The duty allotted to the crew for a day is called crew scheduling.

10
2. Bus and Crew Scheduling
3. Management of Operations
4. Demand and Supply
5. Monitoring of Services
6. Revenue collection
1. Introduction
Terminologies in Bus OperationsA
Time allocation:
• Completing the Chart
provided – 40 minutes
• Presentation of the
Chart – 15 minutes
each group
Group Activity
Notes for Trainer
Participants are from different cities, and often more than one participants report from the same city, so
following is prerequisite:
• The Participants should divide into groups of 4-6 people each. The trainer should ensure that members
of groups are selected randomly and represent different organizations. Each team to have a team
leader selected by team members.
• Distribute the group activity sheets and help them complete them.
• Encourage brainstorming and thinking outside of the box & innovative solutions.
• On completion, participants to share the challenges they face and their current practices.
7. Marketing and Branding

11
Notes for Trainer
Bus and Crew Scheduling
2. Bus and Crew Scheduling
3. Management of Operations
4. Demand and Supply
5. Monitoring of Services
6. Revenue collection
7. Marketing and Branding
1. Introduction
Factors affecting bus schedulingA
Factors affecting crew schedulingB
Process for crew schedulingC
Optimizing utilization of staff and fleetD
Case study: BEST MumbaiE
Case study: KSRTC MysoreF
Fleet allocation to bus depotsG
General Information on the Session
Approximately 30 min
Module Objective
• Module covers the technical and commercial aspects of bus operations and marketing of
bus services.
Module Notes
This part covers factors affecting bus & crew scheduling, optimum utilization of staff & fleet
with case study and crew reporting procedure.
Questions for Discussion
Q1. What are 03 main factors affecting the scheduling of the bus & crew?
Q2. Explain 02 method followed in respect of crew change?
Q3. In Urban transport, the operator is expected to be provided services for 18hours,
however, as per M T W Act crew duty (with 02 crew per shift) serves for 16hours. For extra 02
hours, what are the options which can be adopted?

12
Factors affecting bus scheduling
Bus and Crew Scheduling
2. Bus and Crew Scheduling
3. Management of Operations
4. Demand and Supply
5. Monitoring of Services
6. Revenue collection
1. Introduction
Factors affecting bus schedulingA
Factors affecting crew schedulingB
Process for crew schedulingC
Optimizing utilization of staff and fleetD
Case study: BEST MumbaiE
Case study: KSRTC MysoreF
Fleet allocation to bus depotsG
1. Running Time 2. Stand Time / layover time
No. of stops & waiting
time
Distance between stops/
stations
Operating condition
Reporting time for
crew
Cushion for the delay
occurred in the journey
Rest breaks for the crew
7. Marketing and Branding

13
Factors affecting bus scheduling
Bus and Crew Scheduling
2. Bus and Crew Scheduling
3. Management of Operations
4. Demand and Supply
5. Monitoring of Services
6. Revenue collection
1. Introduction
Factors affecting bus schedulingA
Factors affecting crew schedulingB
Process for crew schedulingC
Optimizing utilization of staff and fleetD
Case study: BEST MumbaiE
Case study: KSRTC MysoreF
Fleet allocation to bus depotsG
Notes for Trainer
• Running time is effected by no. of bus stop/stations, distance between them and the operating conditions
• Therefore, stand time should be arrived after taking into consideration the punctuality of the operation,
passenger convenience, and rest time for the crew. For longer routes the stand time is more, and the stand
time is less for shorter routes.
• It is highly essential note that the running times vary by time-of-day and should be adjusted based on
actual data on running times
In bus scheduling, there are three main factors:
• Passenger demand & frequency proposed
• Running time
• Stand time
From Operations Planning, we got insights into route wise passenger demand and frequency requirements.
Next focus is on understanding running time & stand time.
7. Marketing and Branding
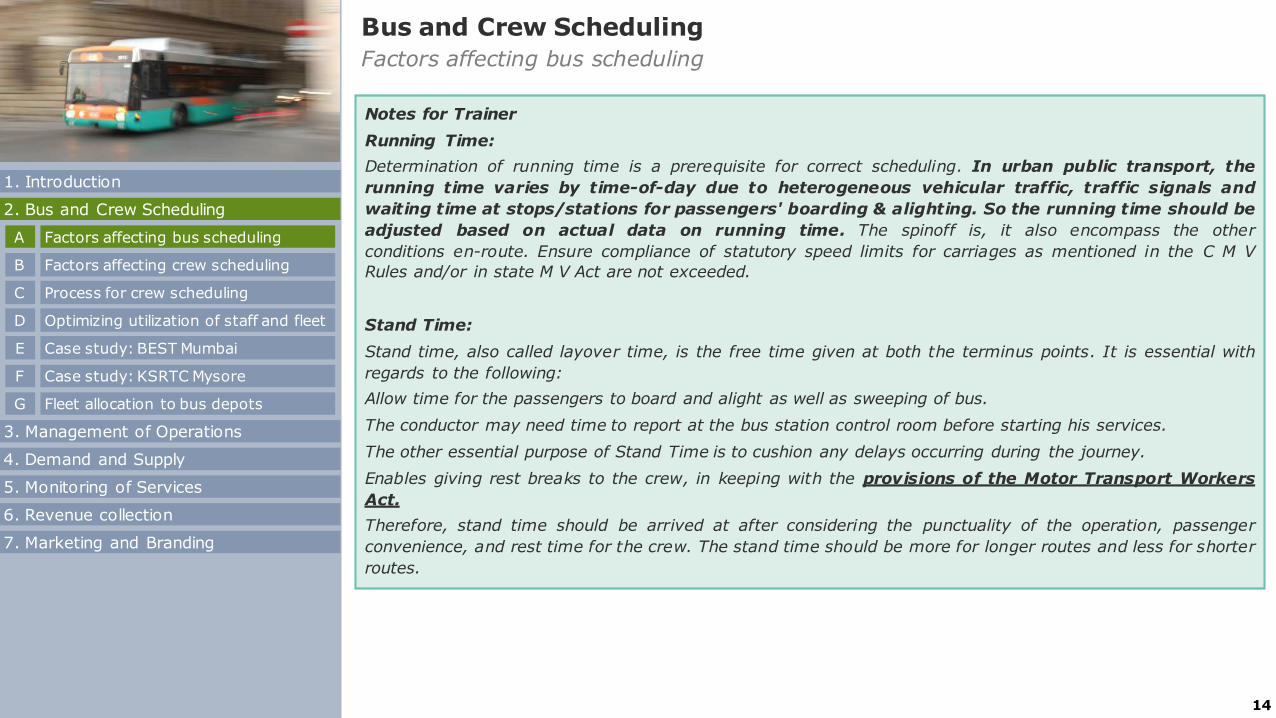
14
Factors affecting bus scheduling
Bus and Crew Scheduling
2. Bus and Crew Scheduling
3. Management of Operations
4. Demand and Supply
5. Monitoring of Services
6. Revenue collection
1. Introduction
Factors affecting bus schedulingA
Factors affecting crew schedulingB
Process for crew schedulingC
Optimizing utilization of staff and fleetD
Case study: BEST MumbaiE
Case study: KSRTC MysoreF
Fleet allocation to bus depotsG
7. Marketing and Branding
Notes for Trainer
Running Time:
Determination of running time is a prerequisite for correct scheduling. In urban public transport, the
running time varies by time-of-day due to heterogeneous vehicular traffic, traffic signals and
waiting time at stops/stations for passengers' boarding & alighting. So the running time should be
adjusted based on actual data on running time. The spinoff is, it also encompass the other
conditions en-route. Ensure compliance of statutory speed limits for carriages as mentioned in the C M V
Rules and/or in state M V Act are not exceeded.
Stand Time:
Stand time, also called layover time, is the free time given at both the terminus points. It is essential with
regards to the following:
Allow time for the passengers to board and alight as well as sweeping of bus.
The conductor may need time to report at the bus station control room before starting his services.
The other essential purpose of Stand Time is to cushion any delays occurring during the journey.
Enables giving rest breaks to the crew, in keeping with the provisions of the Motor Transport Workers
Act.
Therefore, stand time should be arrived at after considering the punctuality of the operation, passenger
convenience, and rest time for the crew. The stand time should be more for longer routes and less for shorter
routes.

15
Factors affecting crew scheduling
Bus and Crew Scheduling
2. Bus and Crew Scheduling
3. Management of Operations
4. Demand and Supply
5. Monitoring of Services
6. Revenue collection
1. Introduction
Factors affecting bus schedulingA
Factors affecting crew schedulingB
Process for crew schedulingC
Optimizing utilization of staff and fleetD
Case study: BEST MumbaiE
Case study: KSRTC MysoreF
Fleet allocation to bus depotsG
Notes for Trainer: Bus and Crew Scheduling (Factors affecting crew scheduling)
• Explain the above and highlight that Lack of proper crew scheduling increases the operational cost
• A crew schedule is considered efficient and economic only when the over-time allowance to be paid is
minimum, and the analysis is carried out, ensuring the least number of conductors and drivers are
required to perform a bus schedule.
• Long layover periods will increase the cost of operation since both the vehicles and crews are idle.
Therefore, the hours of duty should be as near as possible to 8 hours per day, and duties far below or
above 8 hours per day should be the least in number.
Basic factors that affects development of a crew schedules as per Motor Transport Workers Act 1961 (MTWAct), are as follows:
✓ Maximum 8 hours steering duty on a day and 48 hours in a week.
✓ The 8 hours steering duty can be extended up to 10 hours in a day with the approval of competent
authority.
✓ After completion of 5 hours duty, a 30 minutes rest should be provided.
✓ At a stretch 6 hours duty (without providing a 30 minutes rest) can also be obtained. However, the crew
cannot be given duty after 6 hours for the same day.
✓ Maximum 12 hours spread over in a day. However, in case of natural calamities, breakdowns, accidents
and acts of god this provision is not applicable.
✓ Minimum 9 hours rest between two successive duties.
✓ Split duty - Subject to the other provisions contained in the Act, the hours of work of a motor transport
worker shall not be split into more than two spells on any day.
✓ After working successfully for 6 days, 7th day shall be weekly off.
✓ For loss of weekly rest payment of over at double the rate of the normal wages.
7. Marketing and Branding

16
Process for crew reporting
Bus and Crew Scheduling
• The crew duty allocation is done with the help of IT. The crew gets the information well in
advance on their mobile phones and crew duty kiosk.
• All crews members are supposed to follow the standard operating procedure of reporting on
duty.
1. Everyday, the crew is first expected to first report to the traffic supervisor at the dispatch
section.
2. The driver then has to collect the bus from the parking vehicle pool while the conductor
collects the ETM, denomination tickets and other accessories.
3. After completing all formalities, both of them can depart from the depot
4. In case any one from crew has not reported, it is the responsibility of the traffic supervisor
to call and confirm his availability for duty.
• In case of non-availability of the driver, the traffic supervisor has to arrange another
driver from the daily wages staff pool. Rarely it may also happen that a driver is not
available in the pool. In such circumstances, the traffic supervisor is required to
depute such driver who has completed his allotted duty (with overtime).
• In case of non-availability of the conductor, the traffic supervisor has to arrange
another conductor from the daily wages staff pool. In case a conductor is not available
in the pool, the traffic supervisor is required depute such conductor who has
completed his allotted duty (with overtime).
• The role of a driver–cum–conductor, in the absence of either driver or conductor,
becomes vital, since he may be given duty at the dispatcher's wish.
2. Bus and Crew Scheduling
3. Management of Operations
4. Demand and Supply
5. Monitoring of Services
6. Revenue collection
1. Introduction
Factors affecting bus schedulingA
Factors affecting crew schedulingB
Process for crew schedulingC
Optimizing utilization of staff and fleetD
Case study: BEST MumbaiE
Case study: KSRTC MysoreF
Fleet allocation to bus depotsG
7. Marketing and Branding

17
Process for crew reporting
Bus and Crew Scheduling
5. In normal circumstances, IT plays a significant role in crew management. However, in a
case of abnormal circumstances, it is the dispatch section's responsibility to make the crew
available and ensure that the operation does not get hampered.
6. The dispatch section has to ensure that the entire crew has completed their duties and
reported back.
7. The dispatch section has to validate the next day’s crew duty allocation
8. After completion of duty, the driver will hand over the vehicle to vehicle pool in charge in
the same working condition. In case any defects are experienced or observed by the driver,
the same shall have to be reported to the vehicle pool in charge.
9. After the completion of duty, the conductor will hand over the ETM / tray to cash & issue
section in charge in the same working condition along with cash & way bill. If any deviation
/ fault are experienced or observed by the conductor, the same shall have to be reported to
the Cash & Issue Section.
2. Bus and Crew Scheduling
3. Management of Operations
4. Demand and Supply
5. Monitoring of Services
6. Revenue collection
1. Introduction
Factors affecting bus schedulingA
Factors affecting crew schedulingB
Process for crew schedulingC
Optimizing utilization of staff and fleetD
Case study: BEST MumbaiE
Case study: KSRTC MysoreF
Fleet allocation to bus depotsG
7. Marketing and Branding

18
Optimizing utilization of staff and fleet
Bus and Crew Scheduling
Tips for improving the efficiency of staff and fleet utilization
• Planning the route schedule using latest technology software
• Since the running times varies by time-of-day, it should be adjusted based on actual data on
running times
• Option of broken duty concept may be implemented
• There are two methods that can be followed for bus & crew change
• First method (at the depot)– After completing all scheduled trips, the crew, along with the
bus, reports to the depot, and crew change takes place at the depot. Depending on
maintenance requirement, bus replacement may also take place.
• Second method (en-route/at the terminal) – After completing all scheduled trips, the crew
changes occur at the bus station/destination; the bus is kept on rolling without getting back
to the depot. After completion of the last trip of the day, the vehicle & the respective crew has
to report to the depot.
• Challenges in route scheduling–
1. In urban areas, the public transport operator is expected to be provided services from 05:00 till
23:00 (total 18 hours).
2. In Urban transport, the operator is expected to be provided services for 18hours, however,
as per M T W Act crew duty (with 02 crew per shift) serves for 16hours. For extra 02 hours,the following are standard options:
A. Providing additional crew per shift. This would lead to extra expenditure (or)
B. Giving overtime (OT) is to be given to the last crew on a rotation basis. This would also lead
to extra expenditure (or)
C. In case passenger demand is known, then it is possible to plan the vehicle & crew schedule
without any extra expenditure.
2. Bus and Crew Scheduling
3. Management of Operations
4. Demand and Supply
5. Monitoring of Services
6. Revenue collection
1. Introduction
Factors affecting bus schedulingA
Factors affecting crew schedulingB
Process for crew schedulingC
Optimizing utilization of staff and fleetD
Case study: BEST MumbaiE
Case study: KSRTC MysoreF
Fleet allocation to bus depotsG
7. Marketing and Branding

19
Optimizing utilization of staff and fleet
Bus and Crew Scheduling
2. Bus and Crew Scheduling
3. Management of Operations
4. Demand and Supply
5. Monitoring of Services
6. Revenue collection
1. Introduction
Factors affecting bus schedulingA
Factors affecting crew schedulingB
Process for crew schedulingC
Optimizing utilization of staff and fleetD
Case study: BEST MumbaiE
Case study: KSRTC MysoreF
Fleet allocation to bus depotsG
7. Marketing and Branding
Cost is incurred on account of
fuel consumption toward dead
kms
Is incurred Zero dead kms
Due to zero dead kms, no costis incurred on account of fuelconsumption
Minor technical issues can be easily resolved
Minor Technical issues (requiring more time say > 15-25min) cannot be resolved
Loss of time in taking the bus to the depot from terminal &
vise-a-versa
Nil
Time savings is extended to thepassenger due to which buses areon-road
Time saving
Frequent breaks due to changeover at depot.
Service
frequency
Service frequency can be maintained as per schedule.
Not so tedious since the starting & finishing point is at the depot.
Tedious since the crew first has to report at the depot and has to collect accessories and then report at the terminal
Reporting
procedure
Time saving
Benefit to customer
Maint.
issues
Fuel
Consump
Dead kms
En-route/ at terminalAt depot
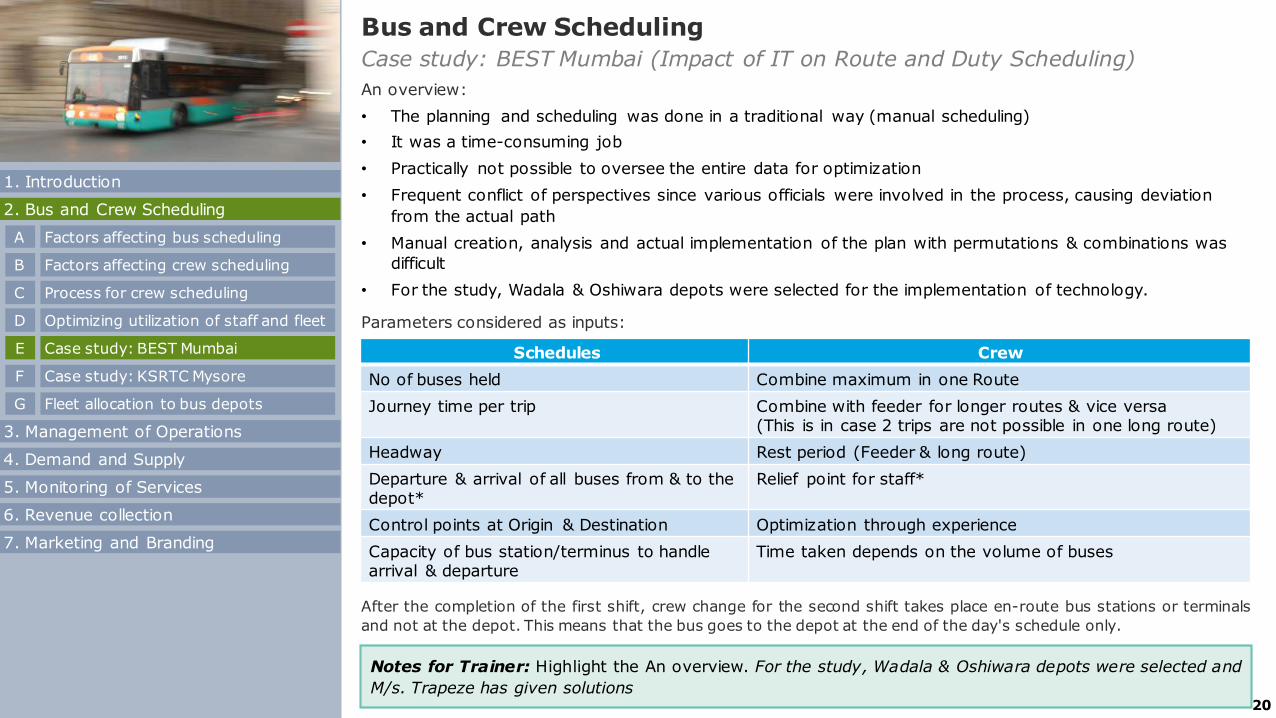
20
Case study: BEST Mumbai (Impact of IT on Route and Duty Scheduling)
Bus and Crew Scheduling
2. Bus and Crew Scheduling
3. Management of Operations
4. Demand and Supply
5. Monitoring of Services
6. Revenue collection
1. Introduction
Factors affecting bus schedulingA
Factors affecting crew schedulingB
Process for crew schedulingC
Optimizing utilization of staff and fleetD
Case study: BEST MumbaiE
Case study: KSRTC MysoreF
Fleet allocation to bus depotsG
Notes for Trainer: Highlight the An overview. For the study, Wadala & Oshiwara depots were selected and
M/s. Trapeze has given solutions
An overview:
• The planning and scheduling was done in a traditional way (manual scheduling)
• It was a time-consuming job
• Practically not possible to oversee the entire data for optimization
• Frequent conflict of perspectives since various officials were involved in the process, causing deviation
from the actual path
• Manual creation, analysis and actual implementation of the plan with permutations & combinations was
difficult
• For the study, Wadala & Oshiwara depots were selected for the implementation of technology.
Parameters considered as inputs:
Schedules Crew
No of buses held Combine maximum in one Route
Journey time per trip Combine with feeder for longer routes & vice versa (This is in case 2 trips are not possible in one long route)
Headway Rest period (Feeder & long route)
Departure & arrival of all buses from & to the depot*
Relief point for staff*
Control points at Origin & Destination Optimization through experience
Capacity of bus station/terminus to handle arrival & departure
Time taken depends on the volume of buses
After the completion of the first shift, crew change for the second shift takes place en-route bus stations or terminals
and not at the depot. This means that the bus goes to the depot at the end of the day's schedule only.
7. Marketing and Branding

21
Bus and Crew Scheduling
Plan 1 Plan 2
Combination of routes Long route + Long route Feeder + Long Route
Combination of duties
& routes
Duties combined with routes/buses of
different depot at common relief point
Combination of routes with same depot
& same type vehicle (i.e., AC with AC)
Rest Period 35-40min 50-60min
Spread over More than 10.30hrs Less than 10.30hrs
Saving in duties Up to 4.3% Up to 4.3%
Plan 1, due to the combination of the long routes, the BEST got the freedom to change duties at a common
relief point for various routes of different depots.
The duty saving is to the extent of 4.3% in similar line in plan 2 having a combination of feeder & long route
of the same depot; the duty savings is up to 4.3% even with 12 depots.
2. Bus and Crew Scheduling
3. Management of Operations
4. Demand and Supply
5. Monitoring of Services
6. Revenue collection
1. Introduction
Factors affecting bus schedulingA
Factors affecting crew schedulingB
Process for crew schedulingC
Optimizing utilization of staff and fleetD
Case study: BEST MumbaiE
Case study: KSRTC MysoreF
Fleet allocation to bus depotsG
Case study: BEST Mumbai (Impact of IT on Route and Duty Scheduling)
7. Marketing and Branding

22
Bus and Crew Scheduling
Depot Manual
(25Depots)
Combined (Manual -23+
Computerized 2 depots)
Saving by Computerized
schedules
Mon to Fri
Sat Sun Holiday Mon to Fri
Sat Sun Holiday Mon to Fri
Sat Sun Holiday
Wadala 421 419 353 378 401 397 331 353 -204.75%
-22 -22 -25
Oshiwara 419 415 302 340 403 397 287 324 -16 3.81%
-18 -15 -16
% 840 -364.28%
Duti
es &
Savin
gs
Benefits in duty savings due to automation
Spread Over of Duties ( Wadala & Oshiwara ) – MONDAY TO FRIDAY
Prepared 5-7 hrs 7-9 hrs 9-11 hrs 11-12 hrs Total
Manually 22
2.64%
619
74.40%
177
21.27%
14
1.68%
832
100%
Automated 88
11.00%
655
81.75 %
53
6.63%
5
0.63%
800
100%
Spread Over of Duties (Wadala & Oshiwara) - SATURDAY
Prepared 5-7 hrs 7-9 hrs 9-11 hrs 11-12 hrs Total
Manually 22
2.66%
622
75.30%
169
20.46%
13
1.57%
826
100%
Automated 80
10.11%
655
82.81%
51
6.45%
5
0.62%
791
100%
Overv
iew
of
spre
ad o
ver:
M
anual
vs. A
uto
mate
d
2. Bus and Crew Scheduling
3. Management of Operations
4. Demand and Supply
5. Monitoring of Services
6. Revenue collection
1. Introduction
Factors affecting bus schedulingA
Factors affecting crew schedulingB
Process for crew schedulingC
Optimizing utilization of staff and fleetD
Case study: BEST MumbaiE
Case study: KSRTC MysoreF
Fleet allocation to bus depotsG
Case study: BEST Mumbai (Impact of IT on Route and Duty Scheduling)
7. Marketing and Branding
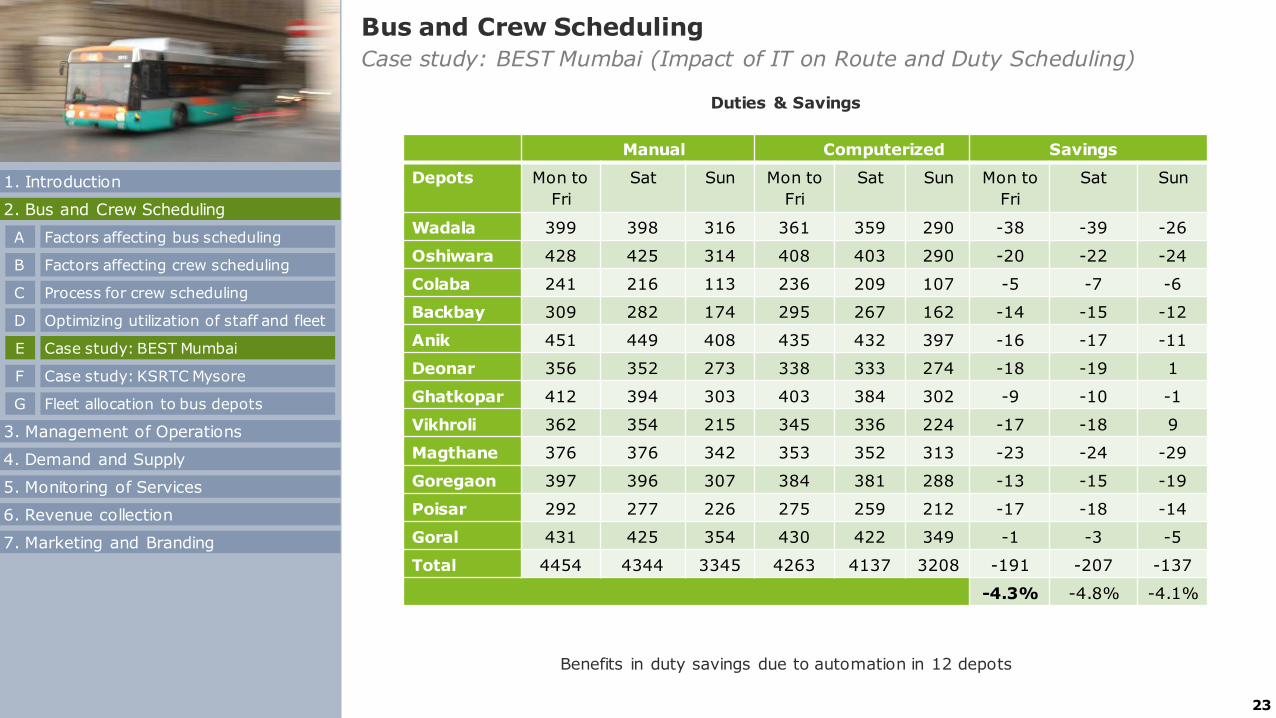
23
Bus and Crew Scheduling
Duties & Savings
Manual Computerized Savings
Depots Mon to
Fri
Sat Sun Mon to
Fri
Sat Sun Mon to
Fri
Sat Sun
Wadala 399 398 316 361 359 290 -38 -39 -26
Oshiwara 428 425 314 408 403 290 -20 -22 -24
Colaba 241 216 113 236 209 107 -5 -7 -6
Backbay 309 282 174 295 267 162 -14 -15 -12
Anik 451 449 408 435 432 397 -16 -17 -11
Deonar 356 352 273 338 333 274 -18 -19 1
Ghatkopar 412 394 303 403 384 302 -9 -10 -1
Vikhroli 362 354 215 345 336 224 -17 -18 9
Magthane 376 376 342 353 352 313 -23 -24 -29
Goregaon 397 396 307 384 381 288 -13 -15 -19
Poisar 292 277 226 275 259 212 -17 -18 -14
Goral 431 425 354 430 422 349 -1 -3 -5
Total 4454 4344 3345 4263 4137 3208 -191 -207 -137
-4.3% -4.8% -4.1%
Benefits in duty savings due to automation in 12 depots
2. Bus and Crew Scheduling
3. Management of Operations
4. Demand and Supply
5. Monitoring of Services
6. Revenue collection
1. Introduction
Factors affecting bus schedulingA
Factors affecting crew schedulingB
Process for crew schedulingC
Optimizing utilization of staff and fleetD
Case study: BEST MumbaiE
Case study: KSRTC MysoreF
Fleet allocation to bus depotsG
Case study: BEST Mumbai (Impact of IT on Route and Duty Scheduling)
7. Marketing and Branding

24
Case study: KSRTC Mysore city
Bus and Crew Scheduling
2. Bus and Crew Scheduling
3. Management of Operations
4. Demand and Supply
5. Monitoring of Services
6. Revenue collection
1. Introduction
Factors affecting bus schedulingA
Factors affecting crew schedulingB
Process for crew schedulingC
Optimizing utilization of staff and fleetD
Case study: BEST MumbaiE
Case study: KSRTC MysoreF
Fleet allocation to bus depotsG
In most of the urban transport, schedules are planned based on certain fixed criteria i.e., time taken to traverse 1kms distance.
• Suburban route will take 2.5min to travel 1km distance (approx. speed 24 kmph.)
• City route will take 3min to travel 1kms distance (approx. speed 20 kmph.)
Slab Time
Morning Slack From first trip of first schedule till 0800hrs
Morning Peak 0800 – 1100hrs
Normal 1100 – 1600hrs
Evening Peak 1600 – 2000hrs
Evening Slack 2000 - till the last trip of the last schedule
Since the implementation of ITS project, the outcome of the vehicle monitoring system are as follows:
1. During early morning & late night, the running time to complete the trips have reduced were less.
2. On the other hand, during peak hours (both morning & evening) running time has been higher than usual.
3. In the afternoon, the trips have been adhering to the schedule time.
So the management has revised the schedules as given below:
7. Marketing and Branding

25
Case study: KSRTC Mysore city
Bus and Crew Scheduling
Sl. Parameters Savings in 2015-16 Amount(Rs. Lakhs)
1 Schedule optimization
Reduction of 2314 kms daily; 844610 kms annually (@ Rs 18.95 variable CPKM in 2014-15)
160.05
2 Reduction in Buses
Same effective kms performed using 8 less nos. of buses (Procurement cost @ Rs 33 lakhs/bus)
264.00
3 PreventiveMaintenance
Savings on lubricants & filters(@ avg. cost of 20 ps/km & 5 ps/km)
2.19
4 StaffReduction
Reduction of Staff in Central Bus Station 35.00
5 Over Time Reduction in Over Time 124.00
Total 585.24
Source: Mysore City Transport Division of KSRTC
Note: The Mysuru Intelligent Transport System (MITRA)initiative of KSRTC was supported by World Bank & MoUD
Overall benefit of IT implementation
2. Bus and Crew Scheduling
3. Management of Operations
4. Demand and Supply
5. Monitoring of Services
6. Revenue collection
1. Introduction
Factors affecting bus schedulingA
Factors affecting crew schedulingB
Process for crew schedulingC
Optimizing utilization of staff and fleetD
Case study: BEST MumbaiE
Case study: KSRTC MysoreF
Fleet allocation to bus depotsG
7. Marketing and Branding

26
Bus and Crew Scheduling
Fleet allocation/deployment to bus depots
In operation planning, we learned about the routes, frequency/trips required in-line with passenger
ridership, and study of existing and required public transport infrastructure for smooth bus operation.
Bus infrastructure includes the depot, terminal/stations, and stops.
Focus will now be laid on allocation of routes to particular depots. The criteria to be considered while
allocating the routes to the depot are as given below:
• The distance between the depot and the origin of the route shall be the least. In case of depot
availability at the destination point, the possibility of allocating an onward route to one depot and
return route to another depot may be explored so that the total dead kms are the least.
• On the common route section, depots operating maximum number of buses shall be studied.
Preference may be given for such a depot in route allocation.
• Total number of routes to be plied on and commuters to be carried, available fleet & workforce
and capacity of the depot have to be taken under consideration while planning for allocation of
routes.
The information on alignments of routes, trips with ridership patterns is covered in “operation
planning,” and optimum utilization of staff & fleet is covered under bus & crew scheduling of “bus
operations.”
In the last phase of operation planning, we have covered the validation of the operation plan via
reality check.
2. Bus and Crew Scheduling
3. Management of Operations
4. Demand and Supply
5. Monitoring of Services
6. Revenue collection
1. Introduction
Factors affecting bus schedulingA
Factors affecting crew schedulingB
Process for crew schedulingC
Optimizing utilization of staff and fleetD
Case study: BEST MumbaiE
Case study: KSRTC MysoreF
Fleet allocation to bus depotsG
Notes for Trainer: Bus and Crew Scheduling (Fleet allocation)
• Terms such as dead kilometers should be explained first
• In case of availability of depot at the destination point, the possibility of allocating an onward route to
one depot and return route to another depot may be explored so that the total dead kms is the least.
7. Marketing and Branding

27
Management of Operations
Notes for Trainer
2. Bus and Crew Scheduling
3. Management of Operations
4. Demand and Supply
5. Monitoring of Services
6. Revenue collection
7. Marketing and Branding
1. Introduction
An overviewA
Challenges in AVM implementationB
Managing dispatchC
Monitoring route serviceD
Ensuring schedule adherenceE
Case study: KSRTC MysoreF
Ensuring standard driving complianceG
Incident managementH
Legislative provisionsI
Ensuring service contract complianceK
Adjusting schedules dynamicallyJ
General Information on the Session
Approximately 30 min
Module Objective
• Module covers the technical and commercial aspects of bus operations and marketing ofbus services.
Module Notes
This unit emphasizes on how to manage the bus operation effectively.
Questions
Are you using ITS application for managing the bus operations?This question is intentionally included, since this module aim at getting change/upgradation inthe traditional practice of bus operation by extensive use of ITS. The facts shared wouldenable the trainer to have beforehand information on topics to be emphasized whiledelivering.
For navigation the discussion, the topics are service route service monitoring (scheduleadherence, incident management and driving standards compliance), contract compliance,dynamic rescheduling.

28
Management of Operations
An overview
Automatic Vehicle Monitoring (AVM)
Dispatch
Route Service Monitoring
Schedule Adherence
Emergency/Incident
management
Driving –Standards
Compliance
Service Contract Compliance
Dynamic rescheduling
The above applications are in line with the World Bank recommendation, which are based onthe global best practice. However, to get the expected outcome, some challenges need to beaddressed in the bus operation stage with the aim to synchronize the technology with groundrealties/conditions
2. Bus and Crew Scheduling
3. Management of Operations
4. Demand and Supply
5. Monitoring of Services
6. Revenue collection
1. Introduction
An overviewA
Challenges in AVM implementationB
Managing dispatchC
Monitoring route serviceD
Ensuring schedule adherenceE
Case study: KSRTC MysoreF
Ensuring standard driving complianceG
Incident managementH
Legislative provisionsI
Ensuring service contract complianceK
Adjusting schedules dynamicallyJ
Notes for Trainer: Management of Operations (An overview)
In Urban transport, traditionally managing the entire operation (i.e., without the use of ITS) has often lead
to criticism especially on the fasciae like no efficient control on dispatch of vehicle, route service
monitoring, schedule adherence, lack of real-time information to the passengers, coordination with other
supporting sections/departments including for handling an emergency.
ITS application enables the operator in efficient management of bus operations.The outline of which is as given below:
7. Marketing and Branding

29
Management of Operations
Challenges in AVM implementation
1. In Urban transport, during peak hours, it is often impossible for the bus to halt at the
designated area at the bus stop/bay. It is, therefore to take the total area for geo-fencing
in place of only designated area. Else, even after stopping the bus, it would be treated as
“skipped bus stop.”
2. For a result, orientated AVM implementation, it is essential to synchronize the functional
requirements of PIS, AVM for a given geo-fenced area. For the same, physical trail needs
to be carried out, and information captured needs to be verified for its accuracy.
3. Changes in the route schedules needs to be tracked properly for latitudinal and
longitudinal and should be updated accordingly. In case of incidence, a reason beyond
control, decision to "override" the PIS shall be in place with provision to restore once the
bus follows the regular path. Ensure action taken shall be as per standard protocol and
does not create a panic situation
4. If buses are to be procured with ITS and the GPS & GPRS are to be procured from
different sources, it is essential to ensure that the ITS equipment is functionally
synchronized to communicate correct information of bus location to the server in a
predefined format. At the same time, the ITS equipment shall also be able to accept the
transmitted information from the server.
5. In urban transport, bus stops are often closely located, and it becomes challenging to
track bus arrival at a given bus stop. Therefore, a prerequisite is to codify the bus stop
and display the number at the bus stop while making sure that same coding pattern is
used for the web portal also.
2. Bus and Crew Scheduling
3. Management of Operations
4. Demand and Supply
5. Monitoring of Services
6. Revenue collection
1. Introduction
An overviewA
Challenges in AVM implementationB
Managing dispatchC
Monitoring route serviceD
Ensuring schedule adherenceE
Case study: KSRTC MysoreF
Ensuring standard driving complianceG
Incident managementH
Legislative provisionsI
Ensuring service contract complianceK
Adjusting schedules dynamicallyJ
7. Marketing and Branding

30
Management of Operations
Challenges in AVM implementation
6. Ensure algorithm are fine-tuned to provide correct “Expected Time of Arrival” truly verified
with real-time situation
7. Educating the crew – Often the crew with the knowledge that their performance is
monitored, sabotage the AVM by disconnecting the power without knowing that with the
power backup, the AVM continues to send the information. In this backdrop, the crew,
needs to be educated about the benefits of the system to ensure their acceptance and
prevent sabotage
8. The AVM shall be placed within the driver’s reach to enable him to use the hotkeys
provided for various types of emergencies (may be fixed on the right side of the driver,
above the driver's door). The AVM shall get uninterrupted power supply irrespective of the
movement of the bus.
9. Fitment of GPS/GPRS antenna should not be easily accessible by the crew to avoid
sabotage (maybe fixed on top of the bus, above the windshield, in the middle)
2. Bus and Crew Scheduling
3. Management of Operations
4. Demand and Supply
5. Monitoring of Services
6. Revenue collection
1. Introduction
An overviewA
Challenges in AVM implementationB
Managing dispatchC
Monitoring route serviceD
Ensuring schedule adherenceE
Case study: KSRTC MysoreF
Ensuring standard driving complianceG
Incident managementH
Legislative provisionsI
Ensuring service contract complianceK
Adjusting schedules dynamicallyJ
7. Marketing and Branding

31
Management of Operations
Managing dispatch
2. Bus and Crew Scheduling
3. Management of Operations
4. Demand and Supply
5. Monitoring of Services
6. Revenue collection
1. Introduction
An overviewA
Challenges in AVM implementationB
Managing dispatchC
Monitoring route serviceD
Ensuring schedule adherenceE
Case study: KSRTC MysoreF
Ensuring standard driving complianceG
Incident managementH
Legislative provisionsI
Ensuring service contract complianceK
Adjusting schedules dynamicallyJ
Objective
• Ensure the departure of the bus, according to the operational and headway plan at the scheduled time
• Maintain the headway intervals by managing the departures as close as possible, in case of late arrival of incoming
vehicles and/or other disruptions
• Manage departures by providing best possible services with limited resources
• Liaise for support services with depot for replacement vehicles and/or drivers, in case of break down
Whom it will benefit
Operator:
• It provides real-time information on schedules, dispatching sequence, and vehicle availability to the dispatcher.
• Provides status information and alerts about actual and missing departures.
• Dispatcher can intervene as and when required to ensure the planned service is performed, and respond to
disruptions (if any).
• Voice and data communication with drivers, vehicles and support staff helps to facilitate on-time departure.
• Uses the information to fine-tune the planned service, and to monitor driver performance.
Authority:
• The information aid’s the Transport Authority to monitor the daily performance. In real-time, they can direct the
operators to carry out corrective measures, or the Authority can intervene directly (in case of major disruption).
• The data generated in Bus Operation can be used extensively for post-event analysis.
Other modules: The information generated is one of the crucial inputs for other modules.
How it works
AVM Unit is mounted in each bus which enables the operator to visualize vehicle positioning at any given time, both in
terms of the actual location and relative to their scheduled location.
For case study refer : “timely departure from depot” - in “Monitoring of services”
7. Marketing and Branding

32
Management of Operations
Managing dispatch
Vehicle tracking on
multiple routes : 05 routes
Source: Mysore City Transport Division of KSRTC
2. Bus and Crew Scheduling
3. Management of Operations
4. Demand and Supply
5. Monitoring of Services
6. Revenue collection
1. Introduction
An overviewA
Challenges in AVM implementationB
Managing dispatchC
Monitoring route serviceD
Ensuring schedule adherenceE
Case study: KSRTC MysoreF
Ensuring standard driving complianceG
Incident managementH
Legislative provisionsI
Ensuring service contract complianceK
Adjusting schedules dynamicallyJ
7. Marketing and Branding

33
Management of Operations
Monitoring route service
2. Bus and Crew Scheduling
3. Management of Operations
4. Demand and Supply
5. Monitoring of Services
6. Revenue collection
1. Introduction
An overviewA
Challenges in AVM implementationB
Managing dispatchC
Monitoring route serviceD
Ensuring schedule adherenceE
Case study: KSRTC MysoreF
Ensuring standard driving complianceG
Incident managementH
Legislative provisionsI
Ensuring service contract complianceK
Adjusting schedules dynamicallyJ
Objective
It provides real-time information about the operational status of the route ie., identify how the route is
performing as against the planned performance.
Whom it will benefit
Passengers: Route service information viz, real-time passenger information, traveler alert services, and
journey planners can be included in passengers advice.
Dispatcher: To grab the attention of dispatcher about crucial information, the visual tools are used for
highlighting the critical information:
• Representation of the intervals between vehicles
• Colour-coding of variances to indicate early/late running, bunching, excessive intervals
• Flashing symbols for variances that need close attention
• Audio alerts
The information also channelizes the support staff of bus operation.
How it works
• VMU fitted in each bus tracks the location throughout the trip. Such information from all the buses is fed
into the module and along with other necessary information such as acquired real-time and pre-planned
information from external sources about events, disruptions, etc.
• For a given route, the data is compiled & processed basically for comparison of real-time information on
route (such as vehicle location, speed, delays etc.,) as against the planned service (timetable, headways,
running times). The focus is to measure the deviation of actual performance against the planned.
• It supports the dispatch module.
7. Marketing and Branding

34
Management of Operations
Monitoring route service
1453 hrs1453 hrs
Source: Mysore City Transport Division of KSRTC
Advance
Vehicle tracking & commitment Vehicle tracking & commitment
Actual
2. Bus and Crew Scheduling
3. Management of Operations
4. Demand and Supply
5. Monitoring of Services
6. Revenue collection
1. Introduction
An overviewA
Challenges in AVM implementationB
Managing dispatchC
Monitoring route serviceD
Ensuring schedule adherenceE
Case study: KSRTC MysoreF
Ensuring standard driving complianceG
Incident managementH
Legislative provisionsI
Ensuring service contract complianceK
Adjusting schedules dynamicallyJ
7. Marketing and Branding

35
Management of Operations
Monitoring route service
On-
time
05min
early
Source: Mysore City Transport Division of KSRTC
Vehicle tracking : delay/ early/ on-time
2. Bus and Crew Scheduling
3. Management of Operations
4. Demand and Supply
5. Monitoring of Services
6. Revenue collection
1. Introduction
An overviewA
Challenges in AVM implementationB
Managing dispatchC
Monitoring route serviceD
Ensuring schedule adherenceE
Case study: KSRTC MysoreF
Ensuring standard driving complianceG
Incident managementH
Legislative provisionsI
Ensuring service contract complianceK
Adjusting schedules dynamicallyJ
7. Marketing and Branding

36
Management of Operations
Ensuring schedule adherence
2. Bus and Crew Scheduling
3. Management of Operations
4. Demand and Supply
5. Monitoring of Services
6. Revenue collection
1. Introduction
An overviewA
Challenges in AVM implementationB
Managing dispatchC
Monitoring route serviceD
Ensuring schedule adherenceE
Case study: KSRTC MysoreF
Ensuring standard driving complianceG
Incident managementH
Legislative provisionsI
Ensuring service contract complianceK
Adjusting schedules dynamicallyJ
Objective
Aid the dispatcher to keep the service operating according to the schedule/planned headway and get
vehicles to depart on time or according to headway specifications.
Whom it will benefit
Dispatcher:
• The application predicts & highlights the delays & excessive intervals in advance, viz.,
• any vehicles that will arrive at the terminal point too late to commence their next trip on-time.
• any vehicles that are likely to be in delay for a scheduled crew change or meal break, and causing
cascading delays in services. This gives the dispatcher the opportunity to prioritize such vehicles for
intervention, so that the change-over or meal-break happens on-time
• so that the dispatcher gets the time to plan mitigating actions
• Some of the lead interventions which dispatcher uses to improve schedule adherence are:
• Use of traffic priority system, which can grant priority to vehicles on-schedule or in delay.
• If continuous delay is occurring, then the planning function needs to intervene to identify where the
schedule needs to be adjusted to optimize schedule adherence
• This application plays a crucial role in reducing the risk of bunching
How it works
• The key to the success of urban transport is to ensure all trips depart/arrive on time.
• The application gets information from dispatch & route service applications on the current location,
current delay status, known sectional running times, and actual information such as disruptions, if any
inputs and checks whether the schedule is adhering to the plan or demands intervention of dispatcher.
7. Marketing and Branding

37
Management of Operations
Case study: KSRTC Mysore (MITRA for schedule adherence)
Schedule adherence:
The “Vehicle Mounting Unit” fitted in the buses, send the information of its presence. Out of
which the information, as highlighted below, is of interest:
No of scheduled trips departed within + 5 min. deviation
No. of scheduled trips departed within -1 to + 5min deviation and the midpoint of the same
Arrival time of vehicle at the midpoint of the trip
2. Bus and Crew Scheduling
3. Management of Operations
4. Demand and Supply
5. Monitoring of Services
6. Revenue collection
1. Introduction
An overviewA
Challenges in AVM implementationB
Managing dispatchC
Monitoring route serviceD
Ensuring schedule adherenceE
Case study: KSRTC MysoreF
Ensuring standard driving complianceG
Incident managementH
Legislative provisionsI
Ensuring service contract complianceK
Adjusting schedules dynamicallyJ
7. Marketing and Branding
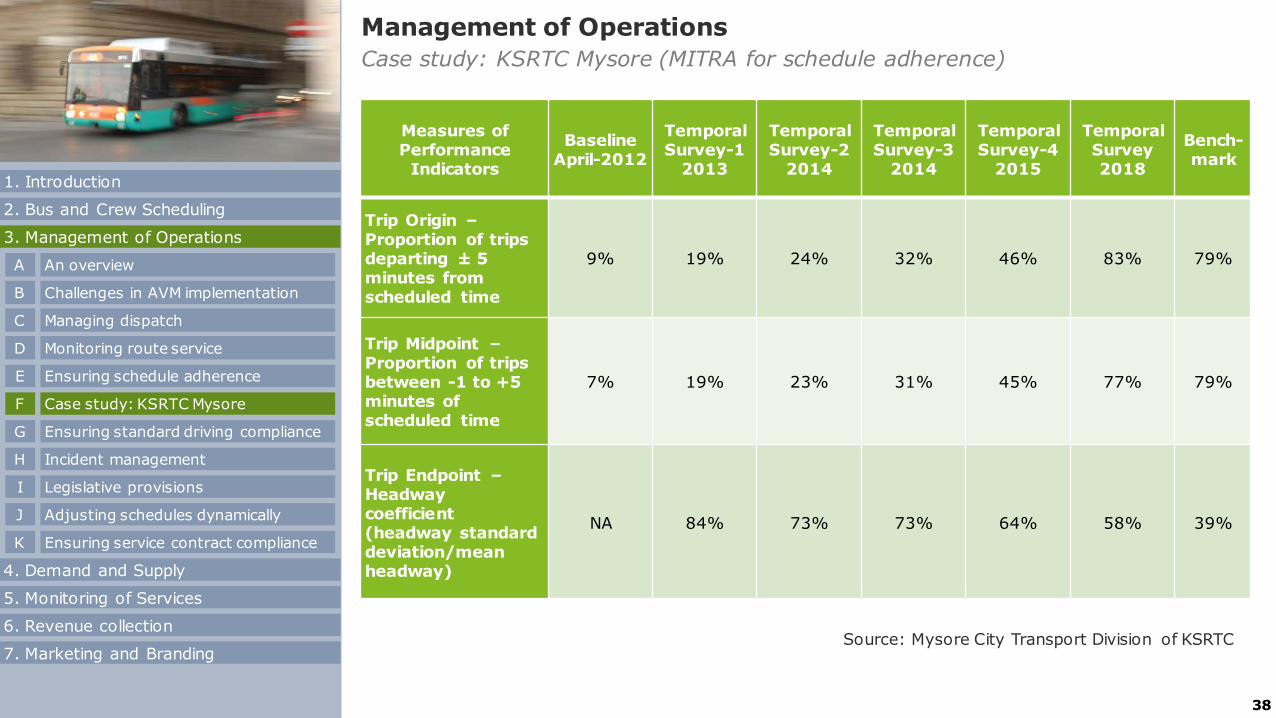
38
Management of Operations
Case study: KSRTC Mysore (MITRA for schedule adherence)
Measures of Performance
Indicators
BaselineApril-2012
Temporal Survey-1
2013
Temporal Survey-2
2014
Temporal Survey-3
2014
Temporal Survey-4
2015
Temporal Survey2018
Bench-mark
Trip Origin –Proportion of trips departing ± 5 minutes from scheduled time
9% 19% 24% 32% 46% 83% 79%
Trip Midpoint –Proportion of trips between -1 to +5 minutes of scheduled time
7% 19% 23% 31% 45% 77% 79%
Trip Endpoint –Headway coefficient (headway standard deviation/mean headway)
NA 84% 73% 73% 64% 58% 39%
Source: Mysore City Transport Division of KSRTC
2. Bus and Crew Scheduling
3. Management of Operations
4. Demand and Supply
5. Monitoring of Services
6. Revenue collection
1. Introduction
An overviewA
Challenges in AVM implementationB
Managing dispatchC
Monitoring route serviceD
Ensuring schedule adherenceE
Case study: KSRTC MysoreF
Ensuring standard driving complianceG
Incident managementH
Legislative provisionsI
Ensuring service contract complianceK
Adjusting schedules dynamicallyJ
7. Marketing and Branding

39
Management of Operations
Ensuring standard driving compliance
2. Bus and Crew Scheduling
3. Management of Operations
4. Demand and Supply
5. Monitoring of Services
6. Revenue collection
1. Introduction
An overviewA
Challenges in AVM implementationB
Managing dispatchC
Monitoring route serviceD
Ensuring schedule adherenceE
Case study: KSRTC MysoreF
Ensuring standard driving complianceG
Incident managementH
Legislative provisionsI
Ensuring service contract complianceK
Adjusting schedules dynamicallyJ
Objective
Driving a public transport bus in urban areas having heterogeneous traffic using the same road space is not
an easy task. The style of driving further aggravates the task and human factor, i.e., thoughts that are
going through the mind & its implications increase the chance of incidence. So the objective of ensuring
drivers to follow driving standards has gained significance. It may be through controlling mechanisms fitted
in vehicles like speed limiting device and/or on-road checks. It is essential to note that the traditional
checking procedure on-road is complimentary to ITS application.
Whom it will benefit
• Safety of passengers at large and rolling stock safety, which is the property of the operator.
• Authority : image building of urban transport as an organize transport having incident-free track record &
compliance with driving standard
How it works
The application gets information from the dispatch & other related applications as inputs. The application
processes the recorded information and carries out investigation, regime for monitoring, detection of poor
practice or violations, and subsequent enforcement – i.e., ‘detect and deter’. Some of the sets of compliance
checks that can be included consist of:
• Detection of excessive speed;
• Detection of sharp acceleration or deceleration;
• Detection of excessive pitch and roll, sharp turns; and
• Detection of poor driving practice
7. Marketing and Branding

40
Management of Operations
Ensuring standard driving compliance
S.NO MIS REPORT ATTRIBUTEMAR15
MAR16
MAR17
MAR18
MAR19
1NO OF BUS STOPS
SKIPPED5 4 4 3 4
2 NO OF SPEED VIOLATIONS 6 4 4 3 3
3NO OF SUDDENACCELERATION 15 11 11 8 8
4 NO OF HARSH BRAKES 7 3 2 2 2
Source: Mysore City Transport Division of KSRTC
2. Bus and Crew Scheduling
3. Management of Operations
4. Demand and Supply
5. Monitoring of Services
6. Revenue collection
1. Introduction
An overviewA
Challenges in AVM implementationB
Managing dispatchC
Monitoring route serviceD
Ensuring schedule adherenceE
Case study: KSRTC MysoreF
Ensuring standard driving complianceG
Incident managementH
Legislative provisionsI
Ensuring service contract complianceK
Adjusting schedules dynamicallyJ
AVG. COUNTS PER BUS PER TRIP
7. Marketing and Branding

41
Management of Operations
Ensuring standard driving compliance
Latitude Longitude Altitude SpeedDirection
AngleNo of Track
satelliteGPS date & Time stamp Remarks
12.323923 76.691193 777 22 352 11 2017-04-24. 11:51:21 Dr. Rajkumar Main road
12.324465 76.691162 780 21 358 11 2017-04-24. 11:51:31 Up Gradient
12.3247 76.69133 780 16 92 12 2017-04-24. 11:51:41 Level road
12.32465 76.692024 777 36 100 12 2017-04-24. 11:51:51 Down Gradient
12.324483 76.693024 773 38 100 10 2017-04-24. 11:52:01 Down Gradient
12.324344 76.693848 769 19 100 12 2017-04-24. 11:52:11 Down Gradient
12.324324 76.69397 768 11 100 12 2017-04-24. 11:52:21 Down Gradient
12.324226 76.694565 766 32 100 12 2017-04-24. 11:52:31 Down Gradient
12.32411 76.695572 763 43 90 11 2017-04-24. 11:52:41 Down Gradient
12.32422 76.696709 758 47 80 12 2017-04-24. 11:52:51 Down Gradient
12.324741 76.697708 752 20 68 12 2017-04-24. 11:53:01 Down Gradient
12.325143 76.698792 752 0 208 11 2017-04-24. 11:53:11 Final position after accident
12.325138 76.698792 753 0 208 11 2017-04-24. 11:53:21 Final position after accident
12.32514 76.698776 753 0 208 11 2017-04-24. 11:53:31 Final position after accident
12.32514 76.698776 753 0 208 11 2017-04-24. 11:53:41 Final position after accident
From this data, it is evident that the driver has not observed the traffic while crossing the ring
road
Positional Lat-Long data used for each accident analysis
Source: Mysore City Transport Division of KSRTC
2. Bus and Crew Scheduling
3. Management of Operations
4. Demand and Supply
5. Monitoring of Services
6. Revenue collection
1. Introduction
An overviewA
Challenges in AVM implementationB
Managing dispatchC
Monitoring route serviceD
Ensuring schedule adherenceE
Case study: KSRTC MysoreF
Ensuring standard driving complianceG
Incident managementH
Legislative provisionsI
Ensuring service contract complianceK
Adjusting schedules dynamicallyJ
7. Marketing and Branding

42
Management of Operations
Objective
Emergency preparedness for potential disruptive or damaging incidences. Incidents may include accident,
fire, an assault or threat for a driver, commuter, medical emergency, etc.
How it works
It is prerequisite to know the types of incidences, clustered in 3 levels followed how it works/way to handle
the incidence:
• Alarm/alert initiated by the driver/conductor/bystander overrides the standard communication protocols
and gets priority alert to the dispatcher
• Dispatcher tries to understand & categories the incidence and follows the protocol action as stipulated:
Incident management
Level Categories Incidence Way to handle the incidence
1 Individual vehicle or location
1. Breakdown of vehicle,requiring technical assistanceor replacement;
2. Illness or other non-criminalincident including minorinjuries requiring medicalsupport;
1. Send the towing vehicle & team ofmechanics and other vehicle of the sameclass as a replacement.
2. As per the requirement of the situation,inform the emergency trauma center,police department and other allieddepartments.
As per the case, traffic signal adjustment inthe vicinity of the disruption areas is highlyessential.
2. Bus and Crew Scheduling
3. Management of Operations
4. Demand and Supply
5. Monitoring of Services
6. Revenue collection
1. Introduction
An overviewA
Challenges in AVM implementationB
Managing dispatchC
Monitoring route serviceD
Ensuring schedule adherenceE
Case study: KSRTC MysoreF
Ensuring standard driving complianceG
Incident managementH
Legislative provisionsI
Ensuring service contract complianceK
Adjusting schedules dynamicallyJ
Instructor – explain the objectives, how it works & level and also beneficiary
7. Marketing and Branding

43
Management of Operations
Incident management
2. Bus and Crew Scheduling
3. Management of Operations
4. Demand and Supply
5. Monitoring of Services
6. Revenue collection
1. Introduction
An overviewA
Challenges in AVM implementationB
Managing dispatchC
Monitoring route serviceD
Ensuring schedule adherenceE
Case study: KSRTC MysoreF
Ensuring standard driving complianceG
Incident managementH
Legislative provisionsI
Ensuring service contract complianceK
Adjusting schedules dynamicallyJ
Level Categories Incidence Way to handle the incidence
2 Impacting only the public transport services
1. Restriction on entry ofHeavy Motor Vehicles
2. Diversion/Restriction due toroad construction/repairs /events
3. Unplanned diversion by thedriver &/crew
4. Incidence involving loss ofproperty, fire and orcommuters sustaining
major injury/fatality
For known disruptions (e.g. planned road work, events),temporary route diversions, temporary schedules andadjusted sectional running times can be pre-programmedinto the dispatch module and activated for the workperiod
It is essential to escalate such incidence to the dedicatedteam/workstation, which takes over the management ofspecific categories of emergency/incident. This ensuresthat appropriately-trained personnel handle the incident.
At the same time, it allows the dispatchers to remainfocused on the normal operations.
3 Impacting the urban area and utilities, of
which public transport is one
1. Assault, aggressive orsecurity incident, requiringpolice/security response
2. Weather-related events and
restrictions3. Diversion/Restriction due to
major road construction/repairs/events
Such incidence needs to be escalated to the dedicatedteam/workstation as referred above, allowing thedispatchers to remain focused on normal operations.
For occasional disruptions due major road construction/fairs, festival leading to unavailability of streets,alternative plans can be stored within the dispatch andactivated whenever a trigger event occurs
Note: It is equally essential to train the staff including crew in incident procedures, maintaining good
incident records and call log, reviewing the response after an incident, and identifying whose responsibility
it is to take specific actions if an incident happens
Whom it will benefit
1. Commuter: safety at large
2. Operator: safety of crew & rolling stock
3. Authority & Operator: image building of urban transport as an organized public transport with
excellence in the management of an incident
7. Marketing and Branding
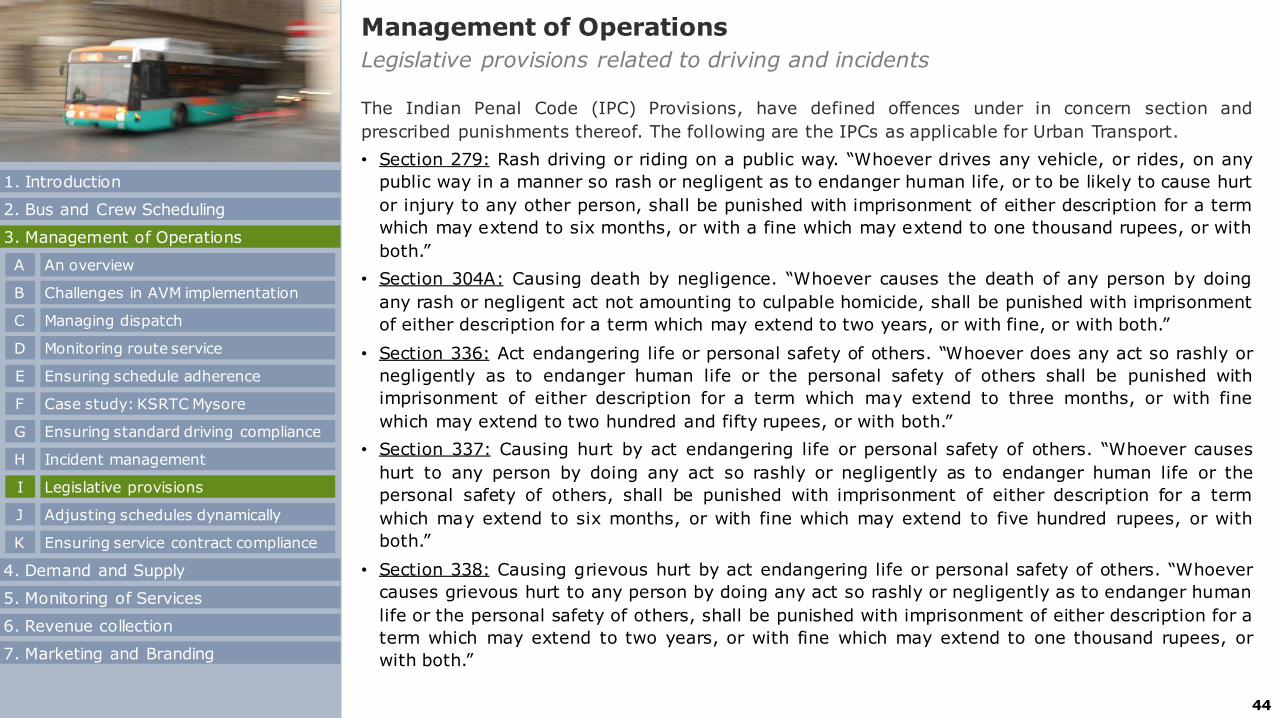
44
Management of Operations
Legislative provisions related to driving and incidents
The Indian Penal Code (IPC) Provisions, have defined offences under in concern section and
prescribed punishments thereof. The following are the IPCs as applicable for Urban Transport.
• Section 279: Rash driving or riding on a public way. “Whoever drives any vehicle, or rides, on any
public way in a manner so rash or negligent as to endanger human life, or to be likely to cause hurt
or injury to any other person, shall be punished with imprisonment of either description for a term
which may extend to six months, or with a fine which may extend to one thousand rupees, or with
both.”
• Section 304A: Causing death by negligence. “Whoever causes the death of any person by doing
any rash or negligent act not amounting to culpable homicide, shall be punished with imprisonment
of either description for a term which may extend to two years, or with fine, or with both.”
• Section 336: Act endangering life or personal safety of others. “Whoever does any act so rashly or
negligently as to endanger human life or the personal safety of others shall be punished with
imprisonment of either description for a term which may extend to three months, or with fine
which may extend to two hundred and fifty rupees, or with both.”
• Section 337: Causing hurt by act endangering life or personal safety of others. “Whoever causes
hurt to any person by doing any act so rashly or negligently as to endanger human life or the
personal safety of others, shall be punished with imprisonment of either description for a term
which may extend to six months, or with fine which may extend to five hundred rupees, or with
both.”
• Section 338: Causing grievous hurt by act endangering life or personal safety of others. “Whoever
causes grievous hurt to any person by doing any act so rashly or negligently as to endanger human
life or the personal safety of others, shall be punished with imprisonment of either description for a
term which may extend to two years, or with fine which may extend to one thousand rupees, or
with both.”
2. Bus and Crew Scheduling
3. Management of Operations
4. Demand and Supply
5. Monitoring of Services
6. Revenue collection
1. Introduction
An overviewA
Challenges in AVM implementationB
Managing dispatchC
Monitoring route serviceD
Ensuring schedule adherenceE
Case study: KSRTC MysoreF
Ensuring standard driving complianceG
Incident managementH
Legislative provisionsI
Ensuring service contract complianceK
Adjusting schedules dynamicallyJ
7. Marketing and Branding

45
Management of Operations
Adjusting schedules dynamically
Objective
To allows the schedule to be adjusted in real-time or semi-real time in response to prevailing circumstances
Whom it will benefit
Passengers: Passengers get real-time updates due to dynamic rescheduling through various
communication channels, including traveler alert services.
Dispatcher:
• The revised schedule is not only transmitted to the commuters but also in-vehicle devices; thereby, the
crew get the latest information on the trip to be performed.
• Even the times of arrival of the bus at en-routes bus stops also gets adjusted
• This application not only revises the schedule but also focuses on eliminating miscommunication, which
may often arise in manual communication
How it works
The application gets information from dispatch & other applications as inputs. The schedule gets adjusted in
real-time, and as such the dynamic rescheduling can operate at various levels of complexity, including the
following situations:
• Smoothing the schedule or headway pattern when a vehicle is missing
• Recalculating the schedule or headway pattern when one or more additional vehicles are operated on a
route (e.g. in response to unusually high demand)
• Recalculating the schedule and intermediate times when a route diversion takes place
• Recalculating the schedule based on the actual overall or sectional running times
• Creating an alternative schedule in case of severe disruption
2. Bus and Crew Scheduling
3. Management of Operations
4. Demand and Supply
5. Monitoring of Services
6. Revenue collection
1. Introduction
An overviewA
Challenges in AVM implementationB
Managing dispatchC
Monitoring route serviceD
Ensuring schedule adherenceE
Case study: KSRTC MysoreF
Ensuring standard driving complianceG
Incident managementH
Legislative provisionsI
Ensuring service contract complianceK
Adjusting schedules dynamicallyJ
7. Marketing and Branding

46
Management of Operations
Adjusting schedules dynamically
Source: Mysore City Transport Division of KSRTC
2. Bus and Crew Scheduling
3. Management of Operations
4. Demand and Supply
5. Monitoring of Services
6. Revenue collection
1. Introduction
An overviewA
Challenges in AVM implementationB
Managing dispatchC
Monitoring route serviceD
Ensuring schedule adherenceE
Case study: KSRTC MysoreF
Ensuring standard driving complianceG
Incident managementH
Legislative provisionsI
Ensuring service contract complianceK
Adjusting schedules dynamicallyJ
7. Marketing and Branding

47
Management of Operations
Ensuring service contract compliance
Objective
The application focuses on measuring the degree of compliance with the conditions of the service contract
Whom it will benefit
Transport Operator: When the service contract requires self-reporting by the Operator (this is usually
supplemented with checks by the Transport Authority)
Authority: When the authority prefers to have full visibility of service operations and performance
How it works
The application gets information from the dispatch module & other related modules as input and
performance is measured for parameters like
• Whether all scheduled trips are operated in full;
• Whether trips are part-operated;
• Deviations from specified route alignments;
• Breakdowns, Speeding, etc.
• Vehicle committed vs. provided (A/C against non AC (or) availability of ITS or fares equipment on the
vehicle)
• Compliance for supply of fit vehicle and driver with license, insurance, safety, and other regulatory criteria
2. Bus and Crew Scheduling
3. Management of Operations
4. Demand and Supply
5. Monitoring of Services
6. Revenue collection
1. Introduction
An overviewA
Challenges in AVM implementationB
Managing dispatchC
Monitoring route serviceD
Ensuring schedule adherenceE
Case study: KSRTC MysoreF
Ensuring standard driving complianceG
Incident managementH
Legislative provisionsI
Ensuring service contract complianceK
Adjusting schedules dynamicallyJ
7. Marketing and Branding

48
Demand and Supply Management
Notes for Trainer
General Information on the Session
Approximately 20 min
Module Objective
• Module covers the technical and commercial aspects of bus operations and marketing ofbus services.
Module Notes
The unit focuses on total demand & its sources and route wise demand fluctuation.
Questions for Discussion
Q1. What is passenger demand?
Q2. Sources of passenger demand?
Q3. What are the critical parameters to be considered in the supply of services.
2. Bus and Crew Scheduling
3. Management of Operations
4. Demand and Supply
5. Monitoring of Services
6. Revenue collection
7. Marketing and Branding
1. Introduction
Passenger demandA
Sources of passenger demandB
Route wise demand fluctuationC
Critical parameters (supply of service)D

49
Demand and Supply Management
Passenger demand
Catered demand + Un-Catered demand + Lead
Catered demand – no. of passengers who boarded the bus /
availed the public transport services.
Un-catered demand – no. of passengers who have not boarded
any public transport bus, instead they preferred to go by IPT/
other mode after waiting at the bus stop.
Lead – Individuals willing to shift to public transport from other
modes such as IPTs, personalized vehicles, etc.
Notes for Trainer: Demand and Supply (Passenger demand)
• The catered demand includes those commuters who have availed public transport facilities.
• Un-catered demand includes those individuals who come to the bus stop and due to non -availability of
bus they opt for other modes of transport (IPT/share a ride etc.);
• Lead includes - those individuals who commute daily by personalized vehicle or IPT and if their
commuting needs are addressed by the public transport they would shift to public transport.
2. Bus and Crew Scheduling
3. Management of Operations
4. Demand and Supply
5. Monitoring of Services
6. Revenue collection
1. Introduction
Passenger demandA
Sources of passenger demandB
Route wise demand fluctuationC
Critical parameters (supply of service)D
7. Marketing and Branding

50
Demand and Supply Management
Sources of passenger demand
N A C P V
Nigdi
Akurdi
Chinchwad
Pimpri
K KN
Vallabnagar
Nashik Phata
Kasarwadi
D
Dapodi
Khadki
S
Shivajinagar
R
RTO Office
P
Pune Station
Route – Bhosari to Pune MC
Route – Nigdi to Pune MC
Bhosari
CCTI
Notes for Trainer: Demand and Supply (Sources of passenger demand)
Bus stops, which are common boarding points for multiple routes – real-time information on route-wise
services, for awaiting passengers, is also essential.
2. Bus and Crew Scheduling
3. Management of Operations
4. Demand and Supply
5. Monitoring of Services
6. Revenue collection
1. Introduction
Passenger demandA
Sources of passenger demandB
Route wise demand fluctuationC
Critical parameters (supply of service)D Total demand
Source
Catered demand
Route wise and trip wise data on no. of passengers availed Public Transport (PT) services
Un-catered demand
Primary survey –Passenger volume count survey is a prerequisite at all en-route bus stops/stations followed bysegregation of received data with the help of no. of passengers availing & not availing PT
Lead Shift to Public transport – primary survey on(1)Classified traffic volume count(2)Origin-Destination survey with additional data on expectation from PT service provider, if
provided would shift to public transport from other modes
7. Marketing and Branding
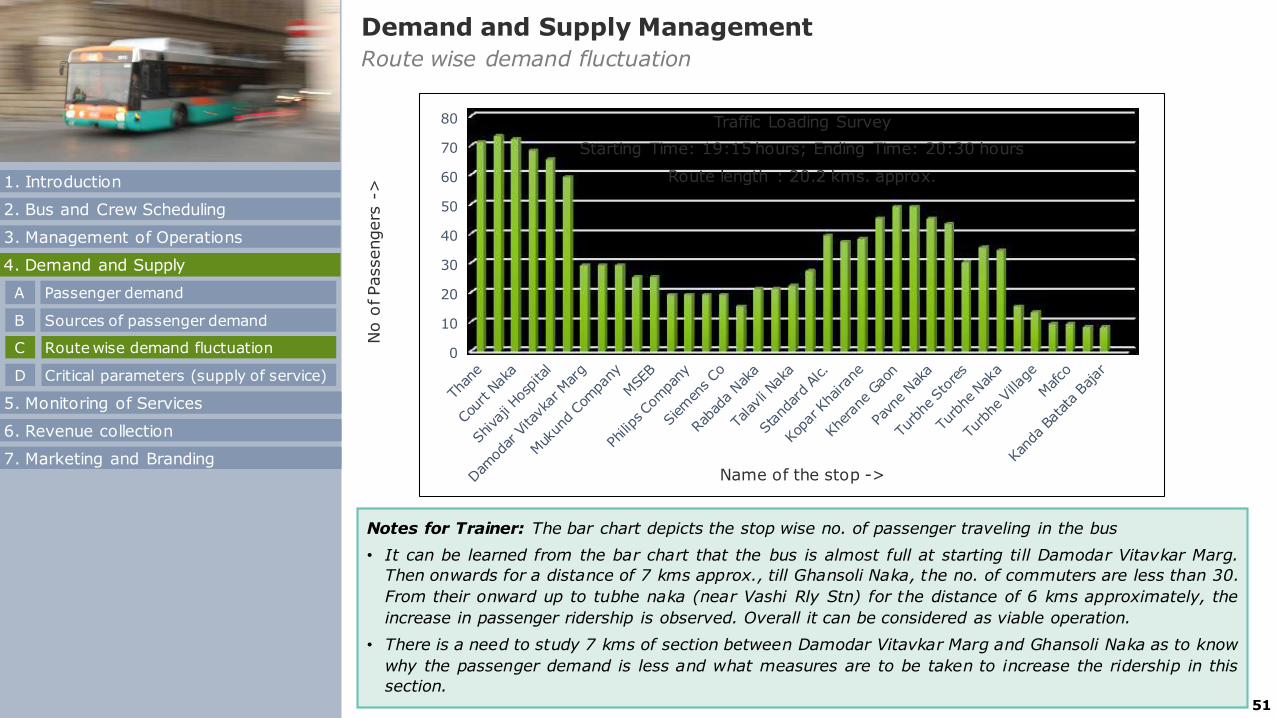
51
Demand and Supply Management
Route wise demand fluctuation
0
10
20
30
40
50
60
70
80
No o
f Passengers
->
Name of the stop ->
Traffic Loading Survey
Starting Time: 19:15 hours; Ending Time: 20:30 hours
Route length : 20.2 kms. approx.
Notes for Trainer: The bar chart depicts the stop wise no. of passenger traveling in the bus
• It can be learned from the bar chart that the bus is almost full at starting till Damodar Vitavkar Marg.
Then onwards for a distance of 7 kms approx., till Ghansoli Naka, the no. of commuters are less than 30.
From their onward up to tubhe naka (near Vashi Rly Stn) for the distance of 6 kms approximately, the
increase in passenger ridership is observed. Overall it can be considered as viable operation.
• There is a need to study 7 kms of section between Damodar Vitavkar Marg and Ghansoli Naka as to know
why the passenger demand is less and what measures are to be taken to increase the ridership in this
section.
2. Bus and Crew Scheduling
3. Management of Operations
4. Demand and Supply
5. Monitoring of Services
6. Revenue collection
1. Introduction
Passenger demandA
Sources of passenger demandB
Route wise demand fluctuationC
Critical parameters (supply of service)D
7. Marketing and Branding

52
Demand and Supply Management
Critical parameters for the supply of services
In the supply of services, the following points are
to be taken under considerations:
The first focus shall always be onensuring assured passengers are notopting for other alternatives.
For planning of route & trips on a givenroute, information on bus stop wisepassenger ridership should be used
The trend line analysis of daily,monthly and seasonal fluctuation couldlead to fine-tuning of trips andschedules.
If, on a given route between specified busstops, more passengers demand isobserved than the services provided, thenan extra bus should be operated betweenthat section. However, due considerationsare given to the length of such sections.
The type of bus to be operated is afunction of no. of passengerstraveling/ridership, expectation ofpassengers, income level attributes, etc..
Notes for Trainer: Along with above explain also stress on the following:
It is essential to match service frequencies to passenger demand to avoid overcrowding, delays, and
convoy formation. This may mean changing headways every 15 to 60 minutes during peak travel times
2. Bus and Crew Scheduling
3. Management of Operations
4. Demand and Supply
5. Monitoring of Services
6. Revenue collection
1. Introduction
Passenger demandA
Sources of passenger demandB
Route wise demand fluctuationC
Critical parameters (supply of service)D
7. Marketing and Branding

53
Demand and Supply Management
Critical parameters for the supply of services – Cases study of PCMC
2. Bus and Crew Scheduling
3. Management of Operations
4. Demand and Supply
5. Monitoring of Services
6. Revenue collection
1. Introduction
Passenger demandA
Sources of passenger demandB
Route wise demand fluctuationC
Critical parameters (supply of service)D
• Corridor – 3 – NashikPhata to Wakad
• Date of commissioning:28 Nov 2015
• Route Length - 8km
• No of stations - 15
• 10 primary surveyswere conducted.
7. Marketing and Branding
Notes for Trainer:
Reference to M&E annual report, 2015, the commuters have expressed dissatisfaction over the existing
non A/C services and thereby generated a demand for A/C buses. Which PMPML could not provide.

54
Monitoring of Service
Parameters to be monitored
2. Bus and Crew Scheduling
3. Management of Operations
4. Demand and Supply
5. Monitoring of Services
6. Revenue collection
7. Marketing and Branding
1. Introduction
Parameters to be monitoredA
Monitor timely departure from depotB
Monitoring is an ongoing internal process, where system conditions are examined through
collected data. Monitoring aids in analyzing the operational efficiency and performance, and
the detection and reporting of possible errors. An efficient monitoring framework leads to
improved performance.
Some of the parameters considered in the monitoring of urban transport services are as
follows:
1. Early/Late departures and arrival of buses from depots and at bus stations
2. Non-completion of scheduled trips by the buses
3. Deviation in trips by the buses
4. Cancellation of the trips in the scheduled program
5. Calculation of cancelled Kilometers
6. Vehicle traveled path with distance report
7. Identification of the Idle time of the buses
8. Average speed report
9. Over speed distance report
10. Speed limit violation report
11. Stoppage report
12. Skipping of bus stops
13. 1 Weekly/15 Days Consolidated VTS Analysis Report - Depot wise/vehicle wise
14. Monthly Consolidated VTS Analysis Report - Depot wise/Vehicle wise
15. Working/non-working status report of GPS units every month
Service contract compliance reportC
Speed limit violation reportD
Stoppage reportE
Monitoring vehicle speedF
Kilometers reportG
Skipped stops reportH
Monitoring driving behaviorI
Monitoring parameters and benefitsK
Monitoring real-time trip progressJ

55
Monitoring of Service
Monitor timely departure from depot
Source: ppt of Dr K N Ingalgi, BMTC
2. Bus and Crew Scheduling
3. Management of Operations
4. Demand and Supply
5. Monitoring of Services
6. Revenue collection
1. Introduction
Parameters to be monitoredA
Monitor timely departure from depotB
Service contract compliance reportC
Speed limit violation reportD
Stoppage reportE
Monitoring vehicle speedF
Kilometers reportG
Skipped stops reportH
Monitoring driving behaviorI
Monitoring parameters and benefitsK
Monitoring real-time trip progressJNotes for Trainer: Monitoring of Service (Monitor timely departure from the depot)
• In Urban Transport, the priority is given to punctual departure from the depot.
• The table (left above) depicts the delay in some of the scheduled departure from the depot.
• The adjacent table (right) is a summary table that depicts the cause for delay.7. Marketing and Branding

56
Monitoring of Service
Service contract compliance report
2. Bus and Crew Scheduling
3. Management of Operations
4. Demand and Supply
5. Monitoring of Services
6. Revenue collection
1. Introduction
Parameters to be monitoredA
Monitor timely departure from depotB
Service contract compliance reportC
Speed limit violation reportD
Stoppage reportE
Monitoring vehicle speedF
Kilometers reportG
Skipped stops reportH
Monitoring driving behaviorI
Monitoring parameters and benefitsK
Monitoring real-time trip progressJ
Trip wise report Summary report
Source: ppt of Dr K N Ingalgi, BMTC
Notes for Trainer: Monitoring of Service (Service contract compliance report)
• The above table illustrates the service performed by the vehicle in a day.
• By this report, one can ensure the compliance of no. of trips performed against the allotted route and
deviation from route; punctuality; skipping of stops; total kms operated against scheduled kms.
7. Marketing and Branding

57
Monitoring of Service
Speed limit violation report
PMPML Report: Speed Limit Violation
Source: ppt of Dr K N Ingalgi, BMTCSource: PMPML
BMTC Report: Speed Limit Violation
2. Bus and Crew Scheduling
3. Management of Operations
4. Demand and Supply
5. Monitoring of Services
6. Revenue collection
1. Introduction
Parameters to be monitoredA
Monitor timely departure from depotB
Service contract compliance reportC
Speed limit violation reportD
Stoppage reportE
Monitoring vehicle speedF
Kilometers reportG
Skipped stops reportH
Monitoring driving behaviorI
Monitoring parameters and benefitsK
Monitoring real-time trip progressJ
Notes for Trainer: Monitoring of Service (Speed limit violation report)
Above information shows, frequency of speed limit violation in a given trip by a specific bus.
7. Marketing and Branding

58
Monitoring of Service
Stoppage report
Source: ppt of Dr K N Ingalgi, BMTC
2. Bus and Crew Scheduling
3. Management of Operations
4. Demand and Supply
5. Monitoring of Services
6. Revenue collection
1. Introduction
Parameters to be monitoredA
Monitor timely departure from depotB
Service contract compliance reportC
Speed limit violation reportD
Stoppage reportE
Monitoring vehicle speedF
Kilometers reportG
Skipped stops reportH
Monitoring driving behaviorI
Monitoring parameters and benefitsK
Monitoring real-time trip progressJ
Notes for Trainer: Monitoring of Service (Stoppage report)
• The above report outlines the no. of stops taken by the bus in a trip and duration of halt.
• In case the time exceeds the stoppage time prescribed at a given bus stop; a report may be initiated for
inquiry.
7. Marketing and Branding

59
Monitoring of Service
Monitoring vehicle speed
Source: ppt of Dr K N Ingalgi, BMTC
2. Bus and Crew Scheduling
3. Management of Operations
4. Demand and Supply
5. Monitoring of Services
6. Revenue collection
1. Introduction
Parameters to be monitoredA
Monitor timely departure from depotB
Service contract compliance reportC
Speed limit violation reportD
Stoppage reportE
Monitoring vehicle speedF
Kilometers reportG
Skipped stops reportH
Monitoring driving behaviorI
Monitoring parameters and benefitsK
Monitoring real-time trip progressJ
Notes for Trainer: Monitoring of Service (Monitor vehicle speed)
As a part of safety initiatives, speed limit monitoring is done.
7. Marketing and Branding

60
Monitoring of Service
Kilometers report
Source: PMPML
2. Bus and Crew Scheduling
3. Management of Operations
4. Demand and Supply
5. Monitoring of Services
6. Revenue collection
1. Introduction
Parameters to be monitoredA
Monitor timely departure from depotB
Service contract compliance reportC
Speed limit violation reportD
Stoppage reportE
Monitoring vehicle speedF
Kilometers reportG
Skipped stops reportH
Monitoring driving behaviorI
Monitoring parameters and benefitsK
Monitoring real-time trip progressJ
Notes for Trainer: Monitoring of Service (Kilometers report)
• The kilometers report, provides information on how many kilometers the vehicle has performed against
the number of planned kilometers.
• The report comprises of vehicle no., type of route – BRT/Non BRT, and the distance covered on BRT
section/route and non BRT section/routes separately.
7. Marketing and Branding
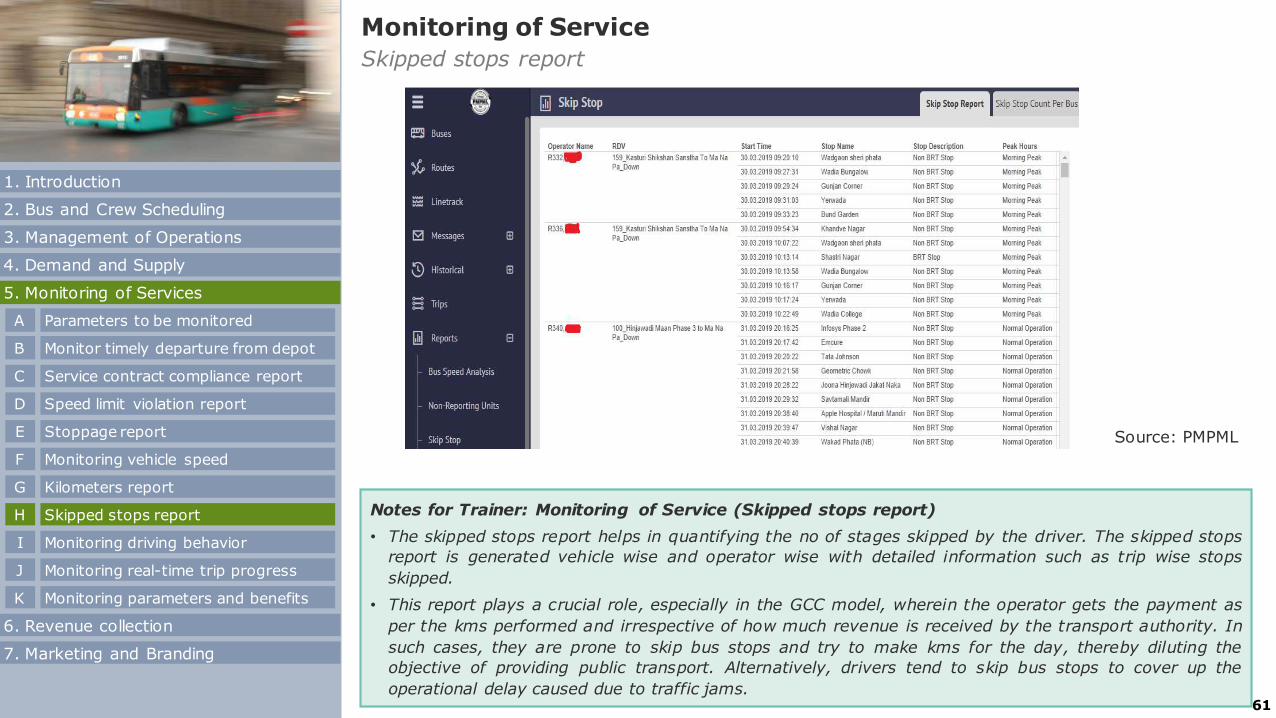
61
Monitoring of Service
Skipped stops report
Source: PMPML
2. Bus and Crew Scheduling
3. Management of Operations
4. Demand and Supply
5. Monitoring of Services
6. Revenue collection
1. Introduction
Parameters to be monitoredA
Monitor timely departure from depotB
Service contract compliance reportC
Speed limit violation reportD
Stoppage reportE
Monitoring vehicle speedF
Kilometers reportG
Skipped stops reportH
Monitoring driving behaviorI
Monitoring parameters and benefitsK
Monitoring real-time trip progressJ
Notes for Trainer: Monitoring of Service (Skipped stops report)
• The skipped stops report helps in quantifying the no of stages skipped by the driver. The skipped stops
report is generated vehicle wise and operator wise with detailed information such as trip wise stops
skipped.
• This report plays a crucial role, especially in the GCC model, wherein the operator gets the payment as
per the kms performed and irrespective of how much revenue is received by the transport authority. In
such cases, they are prone to skip bus stops and try to make kms for the day, thereby diluting the
objective of providing public transport. Alternatively, drivers tend to skip bus stops to cover up the
operational delay caused due to traffic jams.
7. Marketing and Branding

62
Monitoring of Service
Monitoring driving behavior
2. Bus and Crew Scheduling
3. Management of Operations
4. Demand and Supply
5. Monitoring of Services
6. Revenue collection
1. Introduction
Parameters to be monitoredA
Monitor timely departure from depotB
Service contract compliance reportC
Speed limit violation reportD
Stoppage reportE
Monitoring vehicle speedF
Kilometers reportG
Skipped stops reportH
Monitoring driving behaviorI
Monitoring parameters and benefitsK
Monitoring real-time trip progressJ
7. Marketing and Branding
Notes for Trainer: Monitoring of Service (Monitoring driving behavior)
• ITS monitors the driving behavior, detects poor practice and/or violations, and subsequent enforcement
– i.e. ‘detect and deter’. The advantage is it
1. Provide universal detection of specific poor practice or violation of driving standards – as shown above
the ITS detects errors such as harsh braking, harsh acceleration, sharp cornering, etc (location wise & or
type wise). Besides enforcement, this information aid in planning measures for curb such behavior.
2. Capture data in a cost-effective way in comparison to traditional practices, wherein workforce is
deployed.
3. Generate reliable records for use in investigation and disciplinary processes
4. Generate records which can be utilized in court, both for enforcement processes and as protection
against spurious/fraudulent claims

63
Monitoring of Service
Monitoring real-time trip progress
Source: PMPML
2. Bus and Crew Scheduling
3. Management of Operations
4. Demand and Supply
5. Monitoring of Services
6. Revenue collection
1. Introduction
Parameters to be monitoredA
Monitor timely departure from depotB
Service contract compliance reportC
Speed limit violation reportD
Stoppage reportE
Monitoring vehicle speedF
Kilometers reportG
Skipped stops reportH
Monitoring driving behaviorI
Monitoring parameters and benefitsK
Monitoring real-time trip progressJ
Notes for Trainer: Monitoring of Service (Monitoring real-time trip progress)
The diagram apprises about the current status of service, based on speed and other parameters. Based on
this report, the expected time of arrival & departure at stops can be seen, and en-routes can be monitored.
7. Marketing and Branding

64
Monitoring of Service
Monitoring real-time trip progress
Source: PMPML
2. Bus and Crew Scheduling
3. Management of Operations
4. Demand and Supply
5. Monitoring of Services
6. Revenue collection
1. Introduction
Parameters to be monitoredA
Monitor timely departure from depotB
Service contract compliance reportC
Speed limit violation reportD
Stoppage reportE
Monitoring vehicle speedF
Kilometers reportG
Skipped stops reportH
Monitoring driving behaviorI
Monitoring parameters and benefitsK
Monitoring real-time trip progressJ
Notes for Trainer: Monitoring of Service (Monitoring real-time trip progress)
The diagram apprises about the current status of service, based on speed and other parameters. Based on
this report, the expected time of arrival & departure at stops can be seen and en-routes can be monitored.
7. Marketing and Branding

65
Monitoring of Service
Parameters associated with monitoring along with their benefits
2. Bus and Crew Scheduling
3. Management of Operations
4. Demand and Supply
5. Monitoring of Services
6. Revenue collection
1. Introduction
Parameters to be monitoredA
Monitor timely departure from depotB
Service contract compliance reportC
Speed limit violation reportD
Stoppage reportE
Monitoring vehicle speedF
Kilometers reportG
Skipped stops reportH
Monitoring driving behaviorI
Monitoring parameters and benefitsK
Monitoring real-time trip progressJ
S. No Parameters Benefits Derived
1 Identification of vehicle location at any time of day:
Real-time tracking of the vehicle. (computation of
avg. speed and over speeding of bus
Helpful in detecting fake hit & run accident
cases. Quick detection of stolen/missing
vehicles
2 Rationalization of schedule timing and route length.
(Preparation of scientific form-IV based on VTS
report)
Rationalisation of schedules
3 Early and Late arrival and departure of vehicles
from depots and bus stations; non-completion and
cancellation of trips (kms); deviation of trips; idle
time; missing bus stops; over speeding
Actions may be taken against such crew
members
4 Operation of services in violation of scheduled
timings
Improved operational punctuality leading to
enhanced revenue realization
5 Avoidable trip curtailment Constant monitoring of vehicle movement
helps in the detection of missing trips. This
results in improved ridership
6 Unauthorized deviations from scheduled duty Monitoring curbs, unauthorized deviations
resorted by the crew. It also improves the
reliability of the service, which translates into
committed ridership and helps in achieving
higher revenue.
7 Cancellation of trips on flimsy grounds Reduction in cancellation of trips improves
ridership and helps in achieving higher
revenue.
7. Marketing and Branding

66
Monitoring of Service
Parameters associated with monitoring along with their benefits
2. Bus and Crew Scheduling
3. Management of Operations
4. Demand and Supply
5. Monitoring of Services
6. Revenue collection
1. Introduction
Parameters to be monitoredA
Monitor timely departure from depotB
Service contract compliance reportC
Speed limit violation reportD
Stoppage reportE
Monitoring vehicle speedF
Kilometers reportG
Skipped stops reportH
Monitoring driving behaviorI
Monitoring parameters and benefitsK
Monitoring real-time trip progressJ
S. No Parameters Benefits Derived
8 Additional kilometres operated Accurate computing of additional kilometres
if any operated.
9 Calculation of cancelled kilometres for bonafide and
non-bonafide reasons.
It provides the data for accurate computation
of cancelled kilometres. It is especially
beneficial in case the vehicles are operated
under PPP scheme for the preparation of
bills.
10 Accounting of loss of time in non-performance of
trips.
The data can act as the base for initiation
action against the crew for non-performing
trips.
11 Identification of idle time of the vehicle. Ensures proper utilization of vehicles for
operation through revision of time table.
12 Computation of average speed of the vehicle. The data can be the basis for drafting
accurate time tables. This depends on the
speeds achieved during different timings of a
day on different stretches of the route.
13 Non-stoppage of the buses at bus stops/skipping of
bus-stops.
Curbs the tendency of the crew to skip the
bus stops. This improves ridership, increases
the revenue, and brings down public
complaints.
14 Real-time tracking of the desired vehicle Aids in responding to emergencies like riots,
curfews, and strikes.7. Marketing and Branding

67
Monitoring of Service
Parameters associated with monitoring along with their benefits
2. Bus and Crew Scheduling
3. Management of Operations
4. Demand and Supply
5. Monitoring of Services
6. Revenue collection
1. Introduction
Parameters to be monitoredA
Monitor timely departure from depotB
Service contract compliance reportC
Speed limit violation reportD
Stoppage reportE
Monitoring vehicle speedF
Kilometers reportG
Skipped stops reportH
Monitoring driving behaviorI
Monitoring parameters and benefitsK
Monitoring real-time trip progressJ
Notes for Trainer: Monitoring of Service (Parameters associated with monitoring)
However, an inclination is also required to see the issues of monitoring from a practical perspective. It is
recommended to prefer result-based monitoring rather than conventional monitoring
For example, speed limit violation, every time a driver does a violation, an offence is recorded (in some
cases, provision is in place of send alert to the driver about the speed violation). The following are the
monitoring practices.
In conventional monitoring - Often penalty/action on driver, as per SOP is initiated.
In result-based monitoring - Such drivers are assigned driver instructors who travel with him and observe
the fault/s in his driving. This fault is rectified through classroom & practical training. The driving is again
monitored for positive changes (if any).
The simple question is – in city operation, are the drivers expected to drive the bus by looking
simultaneously at the dashboard meter/screen for speed and roadway & traffic conditions ahead.
Further, sending penalty information/alerts may cause distraction.
Such violation cases need to be handled separately by segregating habitual & non-habitual drivers, before
knowing the prevailing roadway & traffic situation.
7. Marketing and Branding

68
Revenue Collection
Notes for Trainer
2. Bus and Crew Scheduling
3. Management of Operations
4. Demand and Supply
5. Monitoring of Services
6. Revenue collection
7. Marketing and Branding
1. Introduction
An overviewA
Fare fixation and Fare tableB
Case study: KarnatakaC
Case study: DMRCD
Cash / Revenue handlingE
Types of fraudsF
Types of checksG
General Information on the Session
Approximately 30 min
Module Objective
• Module covers the technical and commercial aspects of bus operations and marketing ofbus services.
Module Notes
Sources of revenue, fare revision mechanism and checks to be done to minimize thepilferages are covered in the unit
Questions for Discussion
What are possible fraud in revenue collection & how to curb?

69
Revenue Collection
An overview
Revenue is classified into the following two categories:
Note: In the “operations module” the focus is on the type of fare structure &
insight into each. In the “bus operation module,” information on how to collect
the revenue and minimize the pilferages is covered. In “IT & MIS” module,
information on ticketing management system is covered in detail, mainly
concentrating on cashless transactions.
A. Traffic Revenue
Revenue realized from the
transportation of passengers &
associated incidental revenue
constitutes the traffic revenue. The
sources of traffic revenue includes:
B. Non-Traffic Revenue
Revenue from other sources not
directly related to transportation of
passengers, constitute the non-
traffic revenue. The sources
includes:
• Sale of passenger tickets, monthly
pass, advance booking, etc.
• Charges for luggage/parcel
• Reservation charges
• Casual contract service charges
• Advertisement revenue
• Rent from canteens, refreshment
rooms, stalls, parking, property
• Scale of scrap materials
• Interest on investment
2. Bus and Crew Scheduling
3. Management of Operations
4. Demand and Supply
5. Monitoring of Services
6. Revenue collection
7. Marketing and Branding
1. Introduction
An overviewA
Fare fixation and Fare tableB
Case study: KarnatakaC
Case study: DMRCD
Cash / Revenue handlingE
Types of fraudsF
Types of checksG
Case study: NEKRTC (Gulbarga)H
Link / Interlinkage with ITS & MISI

70
Revenue Collection
Fare fixation and Fare table
Fare Table for Illustration purpose
The State Government fixes the fares as per Section 67 of the
Motor Vehicles Act, 1988 having regard to:
1. Advantages offered to the public, trade and industry
through the development of motor transport
2. Coordinating road and rail transport
3. Preventing the deterioration of the road system, and
4. Preventing uneconomic competition among holders of
permits
Factors that affect fare fixation are as under:
Instructor: In public transport, an average of 50% of the revenue is spent on personnel and 25-30% on
account of diesel. Hence, diesel and personnel are the major cost factors. However, often fare revisions are
made without taking these cost factors into consideration & the fare adopted by other competitive modes.
Instructor: Explain – 1) above points2) Between the given set of Origin & Destination, if the route changes its direction, leading to an increasein the distance; then, the fare between the two sets of O-D will be different for both the routes.
Cost of Diesel
Personnel Cost
Capacity of bus and load
factor
Cost of other alternate
mode
2. Bus and Crew Scheduling
3. Management of Operations
4. Demand and Supply
5. Monitoring of Services
6. Revenue collection
7. Marketing and Branding
1. Introduction
An overviewA
Fare fixation and Fare tableB
Case study: KarnatakaC
Case study: DMRCD
Cash / Revenue handlingE
Types of fraudsF
Types of checksG
Case study: NEKRTC (Gulbarga)H
Link / Interlinkage with ITS & MISI

71
Revenue Collection
Case study: Karnataka
Increase in Diesel price from Rs. 35.91 paise per liter to Rs. 39.27 paise per liter.
Diesel Price adjustment fare F(DPA)=(F-D)+(RPD/BPD) XD
• F= CPKM/SCxLF=2091.5/(55x0.64)=59.41 fare per passenger km.
• D= CPKM(HSD)/SCxLF=845.3/(55x0.64)=24.01 paise per passenger km.
• Carrying Capacity=55
• Load Factor=64%
• CPKM=2091.5 paise per km (Data Based on figures of June 2006)
• Diesel Cost=845.3 paise per km
• BPD=Rs. 35.91 per liter
• RPD=Rs. 39.27 per liter
• F(DPA)-(59.41-24.01)+(3927.0/3591.0)x24.01=35.40+(1.09x24.01)
=35.40+26.17=61.57 paise/km
• F(DPA)=61.57 paise/passenger km
• Increase in Fares= F(DPA)-F=61.57-59.41=2.16 paise.
• Increase in Fare=2.16 paise per passenger km.
2. Bus and Crew Scheduling
3. Management of Operations
4. Demand and Supply
5. Monitoring of Services
6. Revenue collection
7. Marketing and Branding
1. Introduction
An overviewA
Fare fixation and Fare tableB
Case study: KarnatakaC
Case study: DMRCD
Cash / Revenue handlingE
Types of fraudsF
Types of checksG
Case study: NEKRTC (Gulbarga)H
Link / Interlinkage with ITS & MISI

72
Revenue Collection
Case study: Karnataka
Increase in Dearness Allowance Rate: F(R)=F+(CPKM(L)/CPKM)X P/100 X F
City Services (Present Fare per Passenger kms weighed average)=54.58
Revised:
= 54.58 + (702.9/2091.5) x (18.19/100)
= 54.58 + (0.34 x 0.18 x 54.58)
= 54.58+3.34
= 57.92
After adding fuel burden: 57.92 + 2.16 = 60.08
Increase in existing fare = 60.08-54.58=5.50 paise per km=10.07%
P is Compounded as follows:Burden due to release of DA instalments & DA merger with basic @ 320.00 lakhs/month.
Staff Cost for the month of June = 1758.96 lakhs
Increase in DA = 320.00 lakhs & merger of 71% DA with Basic (tentative)
P = 320.00 X 100 = 18.19%1758.96
CPKM (L) = 1758.96 = 702.9 PS/KM250.26
CPKM = 5671.71 = 2091.5 ps/per km271.18
2. Bus and Crew Scheduling
3. Management of Operations
4. Demand and Supply
5. Monitoring of Services
6. Revenue collection
7. Marketing and Branding
1. Introduction
An overviewA
Fare fixation and Fare tableB
Case study: KarnatakaC
Case study: DMRCD
Cash / Revenue handlingE
Types of fraudsF
Types of checksG
Case study: NEKRTC (Gulbarga)H
Link / Interlinkage with ITS & MISI

73
Revenue Collection
Case study: Karnataka
Notes for Trainer: Revenue Collection (Case study of Karnataka)
• F= is Total Cost per Passenger km at the time of previous fare revision
• D= is Diesel Cost per passenger km at the time of previous fare revision
• RPD= is revised price of Diesel and
• BPD= is Basic Price of Diesel when the last fare revision was permitted.
Where
• F (R) is Revised Fare paise per passenger km
• F is the Present Fare in paise per passenger km
• CPKM(L) is staff cost in paise per km at the time of previous fare revision
• CPKM is Total cost in paise per km at the time of previous fare revision
• P is % increase in Staff Cost due to increase in DA rates over the staff cost at the time of previous fare
revision.
2. Bus and Crew Scheduling
3. Management of Operations
4. Demand and Supply
5. Monitoring of Services
6. Revenue collection
7. Marketing and Branding
1. Introduction
An overviewA
Fare fixation and Fare tableB
Case study: KarnatakaC
Case study: DMRCD
Cash / Revenue handlingE
Types of fraudsF
Types of checksG
Case study: NEKRTC (Gulbarga)H
Link / Interlinkage with ITS & MISI

74
Revenue Collection
Case study: DMRC
Distance kms Fare Rs Distance kms Fare Rs
Old fareRevised fare 1st
October, 2017
0 2 8 0 2 10
2 4 102 5 20
4 6 12
6 9 155 12 30
9 12 16
12 15 18
12 21 4015 18 19
18 21 21
21 24 22
21 32 5024 27 23
27 31 25
31 35 27 >32 60
35 39 28
39 44 29
>44 30
Notes for Trainer: Revenue Collection (Case study of DMRC)
• Due to the fare revision, the passenger ridership has declined, and passengers started using other public
transport modes. This case study should show that people are sensitive to fare.
• Since there are other competing modes of transport, so for commuting, the customer chose the best
available option.
• Therefore, while fare fixation, competing modes of transport must also be taken into consideration.
• The declination would be mainly in the first part a few of the slab; for example, passengers traveling a
distance of 2-4 will have to pay Rs 10 more in comparison 4-6 in which the passenger will have to pay Rs
8 extra.
2. Bus and Crew Scheduling
3. Management of Operations
4. Demand and Supply
5. Monitoring of Services
6. Revenue collection
7. Marketing and Branding
1. Introduction
An overviewA
Fare fixation and Fare tableB
Case study: KarnatakaC
Case study: DMRCD
Cash / Revenue handlingE
Types of fraudsF
Types of checksG
Case study: NEKRTC (Gulbarga)H
Link / Interlinkage with ITS & MISI

75
Revenue Collection
Cash / Revenue handling
Cash handling is a part of cash management – In urban transport, approximately INR Rs 7-8
lakhs per day cash is received by the depot from collections by the crew en-route. Cash
handling issues are initiated from the cash section and precautionary pre-requisite are as
follows:
• Provision of locker, boxes, etc.
• Cash collection counter should be sturdy and protected
• The location for keeping collected cash shall be in an interior part of the depot with
entry allowed to authorized personnel only
• Security provision shall be in place
• Facility of currency counting cum verification machine
• Agency needs to be nominated for collection of cash & remittance in the bank every
day
• Promotion for cashless transaction
2. Bus and Crew Scheduling
3. Management of Operations
4. Demand and Supply
5. Monitoring of Services
6. Revenue collection
7. Marketing and Branding
1. Introduction
An overviewA
Fare fixation and Fare tableB
Case study: KarnatakaC
Case study: DMRCD
Cash / Revenue handlingE
Types of fraudsF
Types of checksG
Case study: NEKRTC (Gulbarga)H
Link / Interlinkage with ITS & MISI

76
Revenue Collection
Types of frauds occurring during revenue collection
2. Bus and Crew Scheduling
3. Management of Operations
4. Demand and Supply
5. Monitoring of Services
6. Revenue collection
7. Marketing and Branding
1. Introduction
An overviewA
Fare fixation and Fare tableB
Case study: KarnatakaC
Case study: DMRCD
Cash / Revenue handlingE
Types of fraudsF
Types of checksG
Case study: NEKRTC (Gulbarga)H
Link / Interlinkage with ITS & MISI
AB
C
1
2
3
4
5
6
7
8
Collection of lesser fare and
(a) no issue of tickets
(b) issue of ticket corresponding to other fare stages
Parallel ticketing
Data manipulation
Not following the sequence in the issue of denomination tickets
By foot boarded passengers
Ticketless travel by passengers
Goods (perishable and non-perishable)
Over traveling by passengers

77
Revenue Collection
Types of frauds occurring during revenue collection
Notes for Trainer: Revenue Collection (Types of frauds occurring during revenue collection)
1. Collection of lesser fare - This kind of fraud happens mostly on the residential route, wherein the
conductor collects the money, but either does not issue the tickets or issue the ticket after completing
few stages.
For example, the passenger has boarded at point A for which the legal fare up to a point C say Rs 15/-,
the conductor has collected Rs 13/- from the commuter at point A itself and not issued any tickets till
the bus reached point B (which falls on collector street / sub-arterial road). After the bus departs from
point B, the conductor issues the ticket corresponding to legal fare from point B to point C say Rs 8/-.
This kind of fraud also occurs on late night trips.
2. Purchase of ETMs by conductors similar to the one issued by the PT operator followed by design,
development & printing of rolls. Due to which conductor can issue parallel tickets some through his own
ETM and other through official ETM issued by PT operator.
3. Since the data is in electronic form, the data is prone to manipulation – possible only with the help of in-
house staff at ETM collection center, software developer & hackers. – say Rs 5000/- is the actual
collection of revenue on a given route of a schedule. The data can be edited and shown as say Rs 3500/-
as the actual collection.
4. In a block, each denomination ticket has a serial no. issued in sequence. Since the value of each
denomination ticket in the block is the same, the conductor issue ticket in between or those at last; so
that the revenue collected will be with him the sale of denomination tickets reaches the serial no. Often
such conductors are found using this money in illicit activities like local gambling etc.
5. Often, the foot boarded passengers, on inquiry by the conductor for a ticket tend to say I have a pass.
When insisted on, the commuter alights from the moving bus.
6. It occurs mostly when the bus is full; some passengers tend to travel ticketless.
7. Some passengers pay less and get legal fare up to one / two stages earlier of alighting stage
2. Bus and Crew Scheduling
3. Management of Operations
4. Demand and Supply
5. Monitoring of Services
6. Revenue collection
7. Marketing and Branding
1. Introduction
An overviewA
Fare fixation and Fare tableB
Case study: KarnatakaC
Case study: DMRCD
Cash / Revenue handlingE
Types of fraudsF
Types of checksG
Case study: NEKRTC (Gulbarga)H
Link / Interlinkage with ITS & MISI

78
Revenue Collection
Various types of checks
1 3 75 9
Specific Hour Check
Alighting Checks at heavy
boarding point
Combing Operation
Avoid Payment of Fare & Over travelling check
schedule time turnout of buses
from depot
Smart card checking
ETM checking
Ticket Block Checking
Jackpot Checking
2 4 6 8
2. Bus and Crew Scheduling
3. Management of Operations
4. Demand and Supply
5. Monitoring of Services
6. Revenue collection
7. Marketing and Branding
1. Introduction
An overviewA
Fare fixation and Fare tableB
Case study: KarnatakaC
Case study: DMRCD
Cash / Revenue handlingE
Types of fraudsF
Types of checksG
Case study: NEKRTC (Gulbarga)H
Link / Interlinkage with ITS & MISI

79
Revenue Collection
Various types of checks
1. Specific Hour Check
The errant conductors have the habit of collecting less money without issuing the ticket. Even the
drivers, in the early morning and late-night services, in order to sign off early, skip bus stops or
drive rashly without courtesy to other road users and awaiting passengers.
To curb such activities, it is essential to conducts specific hour checks, say at night twice a month
between 18:00 to 21:00 or 20:00 to 23:00. Under this, the squad conducts checks at junctions or
the bus stop. The report prepared is then sent to the higher authority for positive change.
2. Alighting Checks at dense boarding point
The check is performed to know whether the alighting passengers have a valid ticket/pass. The
frequency of such checks needs to be increased during fairs/festivals. Besides, such checks may
also be performed at bus stands wherein passengers alighting from all buses are to be checked.
3. Combing Operation
This operation is done for a given area where checking squads are deployed on all access points
through which the bus enters the area. All the buses entering and leaving the point will be
checked.
4. Avoid Payment of Fare & Over traveling check
This type of check is done to control errant passengers who:
1) pay less, (i.e., up to one/two stages earlier of the alighting stage) and over travel
2) are habituated of traveling free of cost
2. Bus and Crew Scheduling
3. Management of Operations
4. Demand and Supply
5. Monitoring of Services
6. Revenue collection
7. Marketing and Branding
1. Introduction
An overviewA
Fare fixation and Fare tableB
Case study: KarnatakaC
Case study: DMRCD
Cash / Revenue handlingE
Types of fraudsF
Types of checksG
Case study: NEKRTC (Gulbarga)H
Link / Interlinkage with ITS & MISI
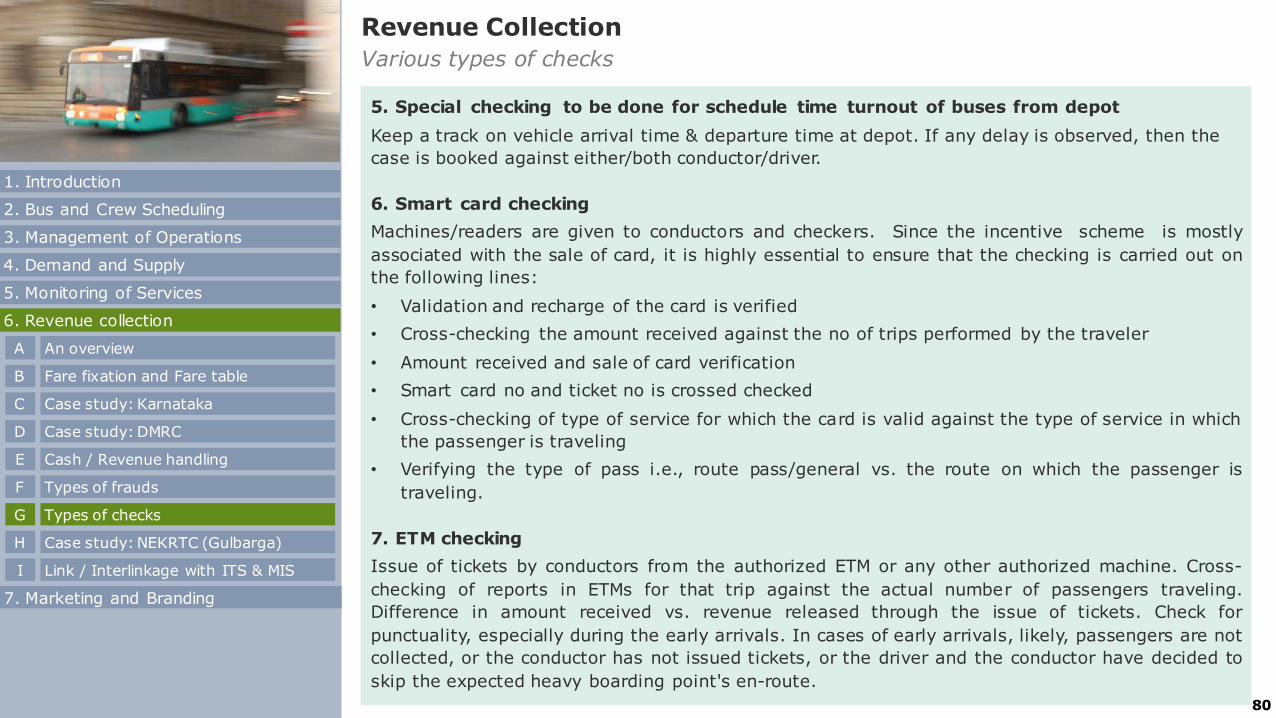
80
Revenue Collection
Various types of checks
5. Special checking to be done for schedule time turnout of buses from depot
Keep a track on vehicle arrival time & departure time at depot. If any delay is observed, then the
case is booked against either/both conductor/driver.
6. Smart card checking
Machines/readers are given to conductors and checkers. Since the incentive scheme is mostly
associated with the sale of card, it is highly essential to ensure that the checking is carried out on
the following lines:
• Validation and recharge of the card is verified
• Cross-checking the amount received against the no of trips performed by the traveler
• Amount received and sale of card verification
• Smart card no and ticket no is crossed checked
• Cross-checking of type of service for which the card is valid against the type of service in which
the passenger is traveling
• Verifying the type of pass i.e., route pass/general vs. the route on which the passenger is
traveling.
7. ETM checking
Issue of tickets by conductors from the authorized ETM or any other authorized machine. Cross-
checking of reports in ETMs for that trip against the actual number of passengers traveling.
Difference in amount received vs. revenue released through the issue of tickets. Check for
punctuality, especially during the early arrivals. In cases of early arrivals, likely, passengers are not
collected, or the conductor has not issued tickets, or the driver and the conductor have decided to
skip the expected heavy boarding point's en-route.
2. Bus and Crew Scheduling
3. Management of Operations
4. Demand and Supply
5. Monitoring of Services
6. Revenue collection
7. Marketing and Branding
1. Introduction
An overviewA
Fare fixation and Fare tableB
Case study: KarnatakaC
Case study: DMRCD
Cash / Revenue handlingE
Types of fraudsF
Types of checksG
Case study: NEKRTC (Gulbarga)H
Link / Interlinkage with ITS & MISI

81
Revenue Collection
Various types of checks
8. Ticket Block Checking
At the depot, the blocks of various denomination tickets (with a serial number on each
denomination ticket) are given to the conductors to issue denomination tickets to the passengersfurther. However, some conductors have the habit of issuing the tickets in between and not in serial
order. The difference in ticket cash collected between the ticket which was serially issued last andwhich will be issued next, is the amount that they keep for personal use.
So the check is done to know whether the conductor has issued the tickets in serial order or not.
The above check is mostly done on-board, and also, some transport organizations carry out this
kind of check for suspected conductors at the depot while cash remittance.
Further, once in a month, 100% tray checking for all conductors is also done.
9. Jackpot Checking
Some transport operators send squads to a particular spot irrespective of route. In contrast, otheroperators send an adequate number of squads to all stages on a given route.
It is the squads' responsibility to check all the buses passing through the stage throughout the day
irrespective of the number of times it passes.
Since the complete route is to be checked; it involves massive workforce requirements, and for thispurpose, clerical and technical staff is taken from the depot or nearby units.
2. Bus and Crew Scheduling
3. Management of Operations
4. Demand and Supply
5. Monitoring of Services
6. Revenue collection
7. Marketing and Branding
1. Introduction
An overviewA
Fare fixation and Fare tableB
Case study: KarnatakaC
Case study: DMRCD
Cash / Revenue handlingE
Types of fraudsF
Types of checksG
Case study: NEKRTC (Gulbarga)H
Link / Interlinkage with ITS & MISI

82
Revenue Collection
Case study: NEKRTC city bus operation in Gulbarga
• In the city of Gulbarga, NEKRTC started city bus operation with 40 buses in October 2012
• By November 2013 they augmented the fleet to 78 buses
• Under JnNURM they got 100 buses totaling a fleet size of 178 buses in city bus
operations.
Challenge
• Promote public transport as primary mode and discourage personalized vehicle
• Increase PT ridership
• Reduce emission level
• To move people rather than vehicles
2. Bus and Crew Scheduling
3. Management of Operations
4. Demand and Supply
5. Monitoring of Services
6. Revenue collection
7. Marketing and Branding
1. Introduction
An overviewA
Fare fixation and Fare tableB
Case study: KarnatakaC
Case study: DMRCD
Cash / Revenue handlingE
Types of fraudsF
Types of checksG
Case study: NEKRTC (Gulbarga)H
Link / Interlinkage with ITS & MISI
Increasing city buses is not viable & loss making proposal?

83
Revenue Collection
Case study: NEKRTC city bus operation in Gulbarga
Plan for sustainable transport approach 1
Wider area coverage 2Reduced waiting for commuters by providing bus service at
higher frequency 3
Keeping the bus stops within the reach of the people4
Use of ITS5
Branding6
Attractive fare7
2. Bus and Crew Scheduling
3. Management of Operations
4. Demand and Supply
5. Monitoring of Services
6. Revenue collection
7. Marketing and Branding
1. Introduction
An overviewA
Fare fixation and Fare tableB
Case study: KarnatakaC
Case study: DMRCD
Cash / Revenue handlingE
Types of fraudsF
Types of checksG
Case study: NEKRTC (Gulbarga)H
Link / Interlinkage with ITS & MISI
Initiative taken

84
Revenue Collection
Case study: NEKRTC city bus operation in Gulbarga
2. Bus and Crew Scheduling
3. Management of Operations
4. Demand and Supply
5. Monitoring of Services
6. Revenue collection
7. Marketing and Branding
1. Introduction
An overviewA
Fare fixation and Fare tableB
Case study: KarnatakaC
Case study: DMRCD
Cash / Revenue handlingE
Types of fraudsF
Types of checksG
Case study: NEKRTC (Gulbarga)H
Link / Interlinkage with ITS & MISI
Fare structure
The city bus base fare was reduced to Rs 3.00 & proportionally thereof to see the impact. The above fare was much lower than the base fare of IPTs (i.e., Rs 5.0)
Year 2014-15
Wider area coverage
Bus stops within the reach
Solar powered light sensitive illumination
Brand name: Nrupatunga
Notes for Trainer:
1. A sustainable transport plan was prepared focusing a wider area
in place of few routes. Multimodal integration in third phase.
2. The route genetics were studied.
3. As per the plan new bus stops were created with solar powered
light and sensitive illumination.
4. Fare structure were reduced on trial basis initially

85
Revenue Collection
Case study: NEKRTC city bus operation in Gulbarga
0
100
200
Before After
126160
VEHICLE UTILIZATION (in kms)
Before, 827
After, 1142
RIDERSHIP PER BUS (in No.)
0
1000
2000
3000
4000
5000
Before After
3195
4523
REVENUE PER BUS (in Rs.) Trainer to elaborate the result.
1. Revenue per bus per km
a) Before – 3195/126 = Rs 25.35
b) After - 4523/160 = Rs 28.26
Revenue per bus per km has increased
by Rs 3.
1. Ridership per bus has increased by 38%
2. With proper network planning, ensuring better
coverage, the vehicle utilization was
increased by 27%
2. Bus and Crew Scheduling
3. Management of Operations
4. Demand and Supply
5. Monitoring of Services
6. Revenue collection
7. Marketing and Branding
1. Introduction
An overviewA
Fare fixation and Fare tableB
Case study: KarnatakaC
Case study: DMRCD
Cash / Revenue handlingE
Types of fraudsF
Types of checksG
Case study: NEKRTC (Gulbarga)H
Link / Interlinkage with ITS & MISI

86
QUALITY OF SERVICES
Passenger Interview & Feedback
Revenue Collection
Case study: NEKRTC city bus operation in Gulbarga
0-2 min16%
2-5 min47%
5-8 min8%
8-12 min14%
More than 12 min15%
0%
10%
20%
30%
40%
50%
60%
70%
80%74%
18%
4% 1… 1% 2%
1. 63% (47+16) commuter stated that the waiting times at bus stop was not more than 5min.
2. 74% commuters have rated the services as ‘very good’ and 18% as good.
Can we say now that
1. Increasing city buses is a viable & not a loss making proposal always
2. The objectives are achieved i.e., increase in ridership, reduction in waiting time, improved
quality of services.
2. Bus and Crew Scheduling
3. Management of Operations
4. Demand and Supply
5. Monitoring of Services
6. Revenue collection
7. Marketing and Branding
1. Introduction
An overviewA
Fare fixation and Fare tableB
Case study: KarnatakaC
Case study: DMRCD
Cash / Revenue handlingE
Types of fraudsF
Types of checksG
Case study: NEKRTC (Gulbarga)H
Link / Interlinkage with ITS & MISI
WAITING TIME

87
• In this module, we have emphasized on bus & crew scheduling, management of bus
operation, demand & supply, monitoring of services, revenue collection, and feedback loop
mechanism.
• For proper execution of services it is essential to understand these basic principals and
monitor the same with ITS & MIS. In addition, under IT & MIS the focus is on:
1. How to assure the passengers via. PIS, Ticketing Management System.
2. Ensuring availability of fit vehicles on the road with the support of IT in inventory,
3. ITS role in ensuring safety & security of passenger & infrastructure,
4. How to monitor services of the operator.
5. Workforce & fleet management using ITS for improving the efficiency of urban bus
operation.
Link / Interlinkage with ITS & MIS
Revenue Collection
2. Bus and Crew Scheduling
3. Management of Operations
4. Demand and Supply
5. Monitoring of Services
6. Revenue collection
7. Marketing and Branding
1. Introduction
An overviewA
Fare fixation and Fare tableB
Case study: KarnatakaC
Case study: DMRCD
Cash / Revenue handlingE
Types of fraudsF
Types of checksG
Case study: NEKRTC (Gulbarga)H
Link / Interlinkage with ITS & MISI

88
Marketing and Branding
Notes for Trainer
General Information on the Session
Approximately 30 min
Module Objective
• Module covers the technical and commercial aspects of bus operations and marketing ofbus services.
Module Notes
This module focuses on formulating a branding strategy and formulating a marketing strategy.
Questions for Discussion
• Why is marketing and branding important?
• What are the responsibilities of the authority in marketing and branding?
• What does marketing strategy include?
• Why does marketing strategies differ?
2. Bus and Crew Scheduling
3. Management of Operations
4. Demand and Supply
5. Monitoring of Services
6. Revenue collection
1. Introduction
7. Marketing and Branding
IntroductionA
Maintaining a brandB

89
Marketing and Branding
Introduction
• The negative stigma of existing bus transport is a
formidable barrier to overcome in selling these services. For this purpose, marketing of public
transport is necessary.
• Marketing and Branding the service would make it stand out from other service competitions. These
strategies are impactful in changing the way people perceive the services.
• It increases awareness among the common people
and updates them on new and upcoming schemes and services.
• The analysis is done based on the profile of the
city and on the target audience.
• The specific analysis of each situation and the designing of activities and messages that are
appropriate for each city’s target audience is important.
• The authority should work with civil societies
and form focus groups.
• Communication between the authorities and civil societies is essential as the authority
learns the society’s opinions in a direct manner.
• The authority should be conscious to raise
awareness among the common people with respect to their attitude & actions (regarding
city transport).
• A marketing strategy identifies appropriate
mediums of communication to disseminate the
message of bus transport services.
Why is Marketing and Branding important?
What does marketing strategy include?
What are the responsibilities of the authority?
Why do marketing strategies differ?
01 02
03 04
2. Bus and Crew Scheduling
3. Management of Operations
4. Demand and Supply
5. Monitoring of Services
6. Revenue collection
1. Introduction
7. Marketing and Branding
IntroductionA
Maintaining a brandB

90
Marketing and Branding
Introduction: Approach for marketing and branding bus transport services
Stakeholder identification Stakeholder consultation Stakeholder strategy
Stakeholder Analysis
This is a technique by which an organization aiming to develop marketing & branding strategy identifies groups & organizations which are directly or indirectly related to its services. It consists of:
321
Branding Strategy
Branding the system with an identifiable name,logo, and slogan can make your service standout among other competitions. It has thepotential to generate new customers, getrecognition and increase business value.
Marketing Strategy
4321
Marketing is useful for educating the customerabout the service. It is useful for sustaining thepresence of a service. Marketing even acts as asource of revenue. It may act as a basis fordecision making.
2. Bus and Crew Scheduling
3. Management of Operations
4. Demand and Supply
5. Monitoring of Services
6. Revenue collection
1. Introduction
7. Marketing and Branding
IntroductionA
Maintaining a brandB

91
Marketing and Branding
Maintaining a brand: Overview
The responsibility of the middle manager is to maintain the brand of the Bus TransportOrganization. In order to achieve that objective, the middle manager needs to satisfy thedemand of the commuters. The demand of the commuters can be as follows:
Citizen Centric
Objectives
Environmental Demands
Social Demands
Adequacy
Regularity and Reliability
Comfort and Convenience
Affordability
Accessibility
7
6
54
3
2
1
By catering to these
demand we may ensure:
• A better quality of
services
• Higher customer
satisfaction
The above points ensure
that the brand built by
your senior manager is
maintained.
2. Bus and Crew Scheduling
3. Management of Operations
4. Demand and Supply
5. Monitoring of Services
6. Revenue collection
1. Introduction
7. Marketing and Branding
IntroductionA
Maintaining a brandB

92
Marketing and Branding
Maintaining a brand: Incorporate stakeholder inputs
Action
• AICTSL conducted three days of focus group sessions in which various community groups participated.
• These sessions were two-way communicative sessions that entailed informational presentations, rides on
iBus and question-answer sessions with the team members.
Impact
• These intensive sessions reached out to ~850 people. (including students, professionals, communities)
• They allowed the opportunity to further educate and correct misconceptions among the public.
• The residents had the opportunity to experience the BRTS first-hand and understand how it functions and
benefits their community.
• Comments and suggestions that were received became an excellent learning opportunity for the team.
• The press reported on the positive interactions at these sessions, bringing good visibility to the project.
The inputs from stakeholder ensured that the commuters feel their demands are heard and met. Furthermore, the
action points based on the specific demands ensured that the brand is maintained.
2. Bus and Crew Scheduling
3. Management of Operations
4. Demand and Supply
5. Monitoring of Services
6. Revenue collection
1. Introduction
7. Marketing and Branding
IntroductionA
Maintaining a brandB

93
Marketing and Branding
Maintaining a brand: Social media tools
Social media and online marketing are excellent channels for providing updates, connecting with customers, and letting them know the services offered. Social media marketing ensures that the commuters are updated with Authority’s decision.
• It connects the authority directly with consumers by sharingupdates, sales, contests, new services, and more!
• Monitor reviews and comments on different platforms. Respondto questions, compliments, and complaints quickly andprofessionally.
• Unlike web pages that feature static content, social media isupdated frequently.
• Host online contests, offer special discount codes exclusivelyfor social media followers, have customers submit photos, usehashtags, and tag bus services on social media platforms.
• Creative and distinctive content receives the most attentiononline.
• It’s better to do great marketing on 1 or 2 channels than to do it poorly across 5 channels.
• When choosing a platform, consider the platform target customers are on and the objective of the agency
• Each platform has an algorithm that determines who sees posts. Be wary of post frequency, number of likes, and text length to optimize social media impact.
How does it help? What should be considered?
✓ An organization should create multiple channels (Facebook, Twitter, Instagram, etc..) in order to post the updates of the services.
✓ The point of contact for social media marketing should post the same content on all the pages at almost the same time.
Key considerations
Social media marketing channels
2. Bus and Crew Scheduling
3. Management of Operations
4. Demand and Supply
5. Monitoring of Services
6. Revenue collection
1. Introduction
7. Marketing and Branding
IntroductionA
Maintaining a brandB

94
Thank You !
Time for Discussion

95
Reference table
A. 8-9 A. 9-10 A. 8
Delivery
PPT
Trainer
manual
Participant
Manual
A. 10-11
B. 12
C. 13
D. 14-15
E. 16-21
F. 22-23
G. 24
A. 11-14
B. 15
C. 16-17
D. 18-19
E. 20-23
F. 24-25
G. 26
A. 9
B. 10
C. 11-12
D. 13-14
E. 15-18
F. 19-20
G. 21-22
A. 25-26
B. 27
C. 28-29
D. 30-32
E. 33
F. 34-35
G. 36-38
H. 39
I. 40
J. 41-42
K. 43
A. 27-28
B. 29-30
C. 31-32
D. 33-35
E. 36
F. 37-38
G. 39-41
H. 42-43
I. 44
J. 45-46
K. 47
A. 23
B. 24-25
C. 26-27
D. 28-30
E. 31
F. 32-33
G. 34-36
H. 37-38
I. 39
J. 40-41
K. 42-43
Introduction A. Terminology in bus operations1
Bus and Crew
Scheduling
A. Factors affecting bus scheduling
B. Factors affecting crew scheduling
C. Process for crew scheduling
D. Optimizing utilization of staff and fleet
E. Case study: BEST Mumbai
F. Case study: KSRTC Mysore City
G. Fleet allocation to bus depots
2
Management of
Operations
A. An overview
B. Challenges in AVM implementation
C. Managing dispatch
D. Monitoring route service
E. Ensuring schedule adherence
F. Case study: KSRTC Mysore
G. Ensuring standard driving compliance
H. Incident Management
I. Legislative provision related to driving and incidents
J. Adjusting schedules dynamically
K. Ensuring service contract compliance
3

96
Reference table
A. 44-45
B. 46
C. 47
D. 48-49
A. 48-49
B. 50
C. 51
D. 52-53
A. 44
B. 45
C. 46
D. 47-48
Delivery
PPT
Trainer
manual
Participant
Manual
A. 50
B. 51
C. 52
D. 53
E. 54
F. 55
G. 56
H. 57
I. 58
J. 59-61
K. 62
A. 54
B. 55
C. 56
D. 57
E. 58
F. 59
G. 60
H. 61
I. 62
J. 63-64
K. 65-67
A. 49
B. 50
C. 51
D. 52
E. 53
F. 54
G. 55
H. 56
I. 57
J. 58-59
K. 60-62
Demand and
Supply
A. Passenger demand
B. Sources of passenger demand
C. Route wise demand fluctuation
D. Critical parameters for supply of services
4
Monitoring of
Service
A. Parameters to be monitored
B. Monitor timely departure from depot
C. Service contract compliance report
D. Speed limit violation report
E. Stoppage report
F. Monitoring vehicle speed
G. Kilometers report
H. Skipped stops report
I. Monitoring driving behavior
J. Monitoring real-time trip progress
K. Parameters associated with monitoring, along with
benefits
5

97
Reference table
A. -
B. -
C. -
D. -
E. 63-64
F. 65
G. 66
H. 67-71
I. 72
A. 68-69
B. 70
C. 71-73
D. 74
E. 75
F. 76-77
G. 78-81
H. 82-86
I. 87
A. 63
B. 64
C. 65-66
D. 67
E. 68
F. 69
G. 70-73
H. 74-78
I. 79-80
Delivery
PPT
Trainer
manual
Participant
Manual
A. 73-74
B. 75-77
A. 88-90
B. 91-93
A. 81-82
B. 83-86
Revenue
Collection
A. An overview
B. Fare fixation and Fare table
C. Case study: Karnataka
D. Case study: DMRC
E. Cash / Revenue handling
F. Types of frauds occurring during revenue collection
G. Various types of checks
H. Case study: NEKRTC city bus operation in Gulbarga
I. Link / Interlinkage with ITS and MIS
6
Marketing and
Branding
A. Introduction
B. Maintaining a brand7

98
Bibliography
1. SSATP ITS Toolkit. https://www.ssatp.org/sites/ssatp/files/publications/Toolkits/ITS%20Toolkit%20content/its-
applications/operations-management.html, Accessed in April 2019
2. Incident Management Plan, Department of Transport and Main Roads, Government of Queensland
3. BRT Planning Guide, ITDP, Viva, UNEP, GTZ, GEF, 2007
4. Robert Pressl, Claus Kollinger, Transport Learning, 2012, “Design and implementation of sustainable mobility campaigns”
5. Presentation of Dr. K N Ingalagi, BMTC, Management of Operations
6. Presentation of Shri Y Srinivasa Rao, Senior Manager, IT, APSRTC
7. Presentation of CMD, PMPML and snap shots received from PMPML
8. Integrated Intelligent Transport System (IITS), presentation by Commissioner, NMMC
9. https://www.fulcrumapp.com/blog/feedback-loops/, Accessed in April 2019
10. https://www.albert.io/blog/positive-negative-feedback-loops-biology/, Accessed in April 2019

P resentation title[To edit, c lick View > Slide Master > Slide Master]
©2019 Deloitte Shared Services India LLP 1
Participant Manual

1
December 2020December 2020
MINISTRY OF HOUSING AND URBAN AFFAIRS, GOVERNMENT OF INDIA
Consultancy Services for Design and Development of Training Programme for City Transport Professionals
EFFICIENT AND SUSTAINABLE CITY BUS SERVICES PROJECT (INDIA)EFFICIENT AND SUSTAINABLE CITY BUS SERVICES PROJECT (INDIA)
PARTICIPANT’S NOTES – BUS OPERATIONS FOR MIDDLE MANAGERSPARTICIPANT’S NOTES – BUS OPERATIONS FOR MIDDLE MANAGERS

2
PrefaceThe Efficient and Sustainable City Bus Services (ESCBS) project was introduced to improve the efficiency and attractiveness of city
bus transport in India. ESCBS project has three major components which are National Capacity Building (NCB); Regulatory,
Institutional and Fiscal Analysis; and City Demonstration. This engagement falls under the purview of the NCB component of the
ESCBS project. The objective of the engagement is to design and develop training programme for city transport professionals. This
engagement also involves pilot testing, implementation, evaluation, and suitable modification of the training programme.
As a part of this engagement, eight training areas have been identified and prioritized by the Ministry of Housing and Urban Affairs
(MoHUA).
Policy Advocacy for
Senior Managers
Outsourcing for Senior
Managers
Monitoring and
Evaluation for Senior
Managers
Network Planning for
Middle Managers
Operations Planning for
Middle Managers
Outsourcing for Middle
Managers
Bus Operations for
Middle Managers
ITS and MIS for Middle
Managers
1 2 3 4
5 6 7 8
For each training areas, a total of three modules have been prepared:
A. Participant’s Notes: Detailed notes for participant’s reference containing links for more reading and is circulated before training
B. Trainer’s Notes: Detailed notes for the trainer’s reference containing focus points, questions for discussion, etc.
C. Delivery PPT: Brief presentation containing various animation, videos, group activities, etc. and is displayed on the screen

3
About the Module
It is strongly recommended to refer the participant’s manual prior to the training session.
This training material on “Bus Operations” covers the technical and commercial aspects of bus operations
and marketing of bus services.
• The schedules of bus and crew cover all relevant aspects of bus operations such as route information,
halts, service frequency, cycle time, turn-around time at the terminal, crew shifts, and other components.
The operations are supervised from a central office and by supervisors on the ground in order to maintain
service standards. The crew's major function is to operate buses and collect revenue from the passengers.
Ascertain the extent to which passenger demand is met and also address the issues viz., significant drop in
particular section along the route. In case of an incident, the procedure described in the operation plan for
incident management needs to be followed.
• In continuation, this module also emphasizes up on adoption of global best practices such as adjusting
running time based on actual data wherein Indian practices are at variance.
• Marketing of bus services helps in creating awareness among the target audience regarding the existence
and benefits of the service. The strategy includes identifying and consulting various stakeholders; branding
the services using name, logo and tagline; and forming a marketing strategy using campaign and various
media options.
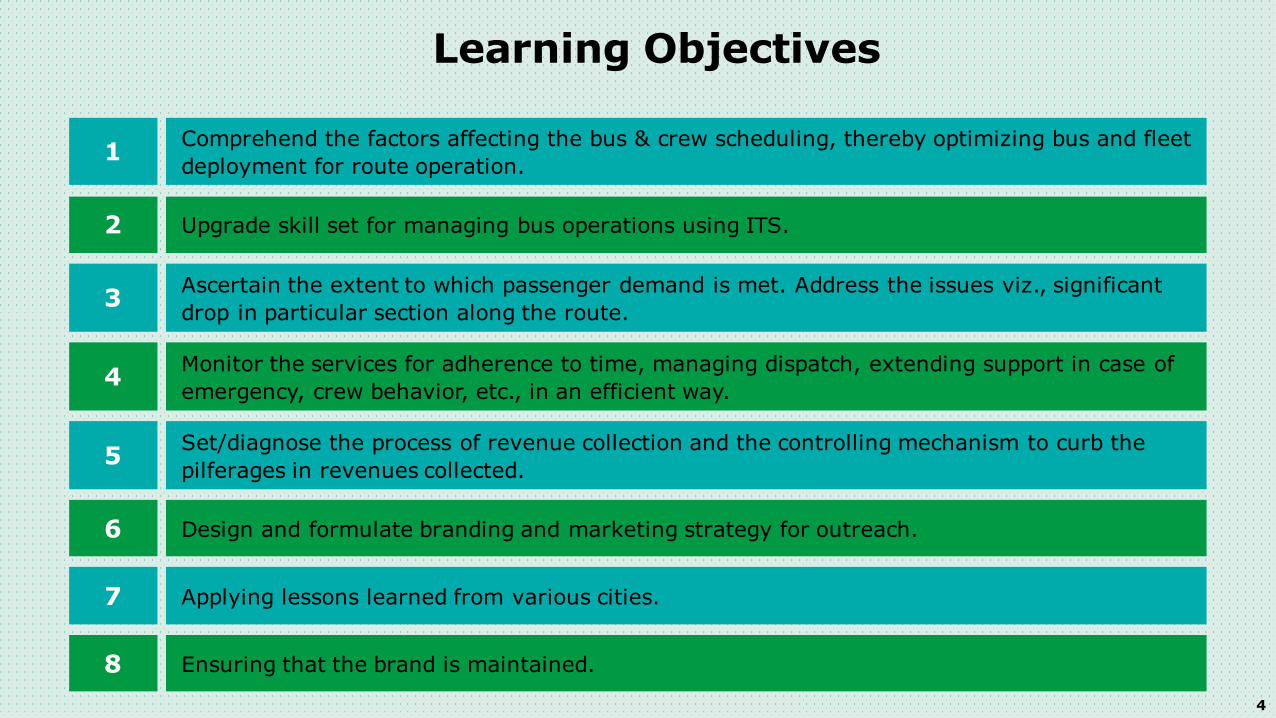
4
Learning Objectives
1Comprehend the factors affecting the bus & crew scheduling, thereby optimizing bus and fleet
deployment for route operation.
2 Upgrade skill set for managing bus operations using ITS.
3Ascertain the extent to which passenger demand is met. Address the issues viz., significant
drop in particular section along the route.
4Monitor the services for adherence to time, managing dispatch, extending support in case of
emergency, crew behavior, etc., in an efficient way.
5Set/diagnose the process of revenue collection and the controlling mechanism to curb the
pilferages in revenues collected.
6 Design and formulate branding and marketing strategy for outreach.
7 Applying lessons learned from various cities.
8 Ensuring that the brand is maintained.

5
Table of Contents
Introduction A. Terminology in bus operations1
Bus and Crew Scheduling
A. Factors affecting bus scheduling
B. Factors affecting crew scheduling
C. Process for crew scheduling
D. Optimizing utilization of staff and fleet
E. Case study: BEST Mumbai (Impact of IT uses in Route and Duty Scheduling
F. Case study: KSRTC Mysore City
G. Fleet allocation to bus depots
2
Management of
Operations
A. An overview
B. Challenges in AVM implementation
C. Managing dispatch
D. Monitoring route service
E. Ensuring schedule adherence
F. Case study: KSRTC Mysore (MITRA for schedule adherence)
G. Ensuring standard driving compliance
H. Incident Management
I. Legislative provision related to driving and incidents
J. Adjusting schedules dynamically
K. Ensuring service contract compliance
3

6
Table of Contents
Demand and Supply
A. Passenger demand
B. Sources of passenger demand
C. Route wise demand fluctuation
D. Critical parameters for supply of services
4
Monitoring of Service
A. Parameters to be monitored
B. Monitor timely departure from depot
C. Service contract compliance report
D. Speed limit violation report
E. Stoppage report
F. Monitoring vehicle speed
G. Kilometers report
H. Skipped stops report
I. Monitoring driving behavior
J. Monitoring real-time trip progress
K. Parameters associated with monitoring, along with benefits
5

7
Table of Contents
Revenue Collection
A. An overview
B. Fare fixation and Fare table
C. Case study: Karnataka
D. Case study: DMRC
E. Cash / Revenue handling
F. Types of frauds occurring during revenue collection
G. Various types of checks
H. Case study: NEKRTC city bus operation in Gulbarga
I. Link / Interlinkage with ITS and MIS
6
Marketing and BrandingA. Introduction
B. Maintaining a brand7

8
Terminology
Terminologies used in Bus Operations
2. Bus and Crew Scheduling
3. Management of Operations
4. Demand and Supply
5. Monitoring of Services
6. Revenue collection
7. Marketing and Branding
1. Introduction
Terminologies in Bus OperationsABus Schedule: It refers to the programme of operation of a bus for 24 hours
on one or more routes.
Crew Schedule: It refers to pair schedule comprising of driver & conductor.
The duty allotted to the crew for a day is called crew scheduling.

9
Factors affecting bus scheduling
Bus and Crew Scheduling
2. Bus and Crew Scheduling
3. Management of Operations
4. Demand and Supply
5. Monitoring of Services
6. Revenue collection
7. Marketing and Branding
1. Introduction
Factors affecting bus schedulingA
Factors affecting crew schedulingB
Process for crew schedulingC
Optimizing utilization of staff and fleetD
Case study: BEST MumbaiE
Case study: KSRTC MysoreF
Fleet allocation to bus depotsG
In bus scheduling, there are three main factors:
1. Passenger demand & frequency proposed
2. Running time
3. Stand time
From Operations Planning, we got insights into route wise passenger demand and frequency requirements.
Now, we will lay focus on understanding running time & stand time.
Running Time: Determination of running time is a prerequisite for correct scheduling. In urban publictransport, the running time varies by time-of-day due to heterogeneous vehicular traffic, trafficsignals and waiting time at stops/stations for passengers' boarding & alighting. So the runningtime should be adjusted based on actual data on running time. The spinoff is, it also encompass theother conditions en-route.
Ensure compliance of statutory speed limits for carriages as mentioned in the C M V Rules and/or in state M V Act are not exceeded.
Stand Time: Stand time, also called layover time, is the free time given at both the terminus points. It is
essential with regards to the following:
• Allow time for the passengers to board and alight as well as sweeping of bus.
• The conductor may need time to report at the bus station control room before starting his services.
• The other essential purpose of Stand Time is to cushion any delays occurring during the journey.
• Enables giving rest breaks to the crew, in keeping with the provisions of the Motor Transport Workers
Act.
Therefore, stand time should be arrived at after considering the punctuality of the operation, passenger
convenience, and rest time for the crew. The stand time should be more for longer routes and less for shorter
routes.

10
Factors affecting crew scheduling
Bus and Crew Scheduling
Basic factors that affects development of a crew schedules as per Motor Transport WorkersAct 1961 (MTW Act), are as follows:
✓ Maximum 8 hours steering duty on a day and 48 hours in a week.
✓ The 8 hours steering duty can be extended up to 10 hours in a day with the approval of
competent authority.
✓ After completion of 5 hours duty, a 30 minutes rest should be provided.
✓ At a stretch 6 hours duty (without providing a 30 minutes rest) can also be obtained.
However, the crew cannot be given duty after 6 hours for the same day.
✓ Maximum 12 hours spread over in a day. However, in case of natural calamities,
breakdowns, accidents and acts of god this provision is not applicable.
✓ Minimum 9 hours rest between two successive duties.
✓ Split duty - Subject to the other provisions contained in the Act, the hours of work of a
motor transport worker shall not be split into more than two spells on any day.
✓ After working successfully for 6 days, 7th day shall be weekly off.
✓ For loss of weekly rest payment of over at double the rate of the normal wages.
2. Bus and Crew Scheduling
3. Management of Operations
4. Demand and Supply
5. Monitoring of Services
6. Revenue collection
1. Introduction
Factors affecting bus schedulingA
Factors affecting crew schedulingB
Process for crew schedulingC
Optimizing utilization of staff and fleetD
Case study: BEST MumbaiE
Case study: KSRTC MysoreF
Fleet allocation to bus depotsG
7. Marketing and Branding

11
Process for crew reporting
Bus and Crew Scheduling
• The crew duty allocation is done with the help of IT. The crew gets the information well in
advance on their mobile phones and crew duty kiosk.
• All crews members are supposed to follow the standard operating procedure of reporting on
duty.
1. Everyday, the crew is first expected to first report to the traffic supervisor at the dispatch
section.
2. The driver then has to collect the bus from the parking vehicle pool while the conductor
collects the ETM, denomination tickets and other accessories.
3. After completing all formalities, both of them can depart from the depot
4. In case any one from crew has not reported, it is the responsibility of the traffic supervisor
to call and confirm his availability for duty.
• In case of non-availability of the driver, the traffic supervisor has to arrange another
driver from the daily wages staff pool. Rarely it may also happen that a driver is not
available in the pool. In such circumstances, the traffic supervisor is required to
depute such driver who has completed his allotted duty (with overtime).
• In case of non-availability of the conductor, the traffic supervisor has to arrange
another conductor from the daily wages staff pool. In case a conductor is not
available in the pool, the traffic supervisor is required depute such conductor who
has completed his allotted duty (with overtime).
• The role of a driver–cum–conductor, in the absence of either driver or conductor,
becomes vital, since he may be given duty at the dispatcher's wish.
2. Bus and Crew Scheduling
3. Management of Operations
4. Demand and Supply
5. Monitoring of Services
6. Revenue collection
1. Introduction
Factors affecting bus schedulingA
Factors affecting crew schedulingB
Process for crew schedulingC
Optimizing utilization of staff and fleetD
Case study: BEST MumbaiE
Case study: KSRTC MysoreF
Fleet allocation to bus depotsG
7. Marketing and Branding

12
Process for crew reporting
Bus and Crew Scheduling
5. In normal circumstances, IT plays a significant role in crew management. However, in a
case of abnormal circumstances, it is the dispatch section's responsibility to make the
crew available and ensure that the operation does not get hampered.
6. The dispatch section has to ensure that the entire crew has completed their duties and
reported back.
7. The dispatch section has to validate the next day’s crew duty allocation
8. After completion of duty, the driver will hand over the vehicle to vehicle pool in charge in
the same working condition. In case any defects are experienced or observed by the
driver, the same shall have to be reported to the vehicle pool in charge.
9. After the completion of duty, the conductor will hand over the ETM / tray to cash & issue
section in charge in the same working condition along with cash & way bill. If any
deviation / fault are experienced or observed by the conductor, the same shall have to
be reported to the Cash & Issue Section.
2. Bus and Crew Scheduling
3. Management of Operations
4. Demand and Supply
5. Monitoring of Services
6. Revenue collection
1. Introduction
Factors affecting bus schedulingA
Factors affecting crew schedulingB
Process for crew schedulingC
Optimizing utilization of staff and fleetD
Case study: BEST MumbaiE
Case study: KSRTC MysoreF
Fleet allocation to bus depotsG
7. Marketing and Branding

13
Optimizing utilization of staff and fleet
Bus and Crew Scheduling
2. Bus and Crew Scheduling
3. Management of Operations
4. Demand and Supply
5. Monitoring of Services
6. Revenue collection
1. Introduction
Factors affecting bus schedulingA
Factors affecting crew schedulingB
Process for crew schedulingC
Optimizing utilization of staff and fleetD
Case study: BEST MumbaiE
Case study: KSRTC MysoreF
Fleet allocation to bus depotsG
Tips for improving the efficiency of staff and fleet utilization
• Planning the route schedule using latest technology software
• Since the running times varies by time-of-day, it should be adjusted based on actual data on
running times
• Option of broken duty concept may be implemented
• There are two methods that can be followed for bus & crew change
• First method (at the depot)– After completing all scheduled trips, the crew, along with the
bus, reports to the depot, and crew change takes place at the depot. Depending on
maintenance requirement, bus replacement may also take place.
• Second method (en-route/at the terminal) – After completing all scheduled trips, the crew
changes occur at the bus station/destination; the bus is kept on rolling without getting back
to the depot. After completion of the last trip of the day, the vehicle & the respective crew
has to report to the depot.
• Challenges in route scheduling–
1. In urban areas, the public transport operator is expected to be provided services from 05:00 till
23:00 (total 18 hours).
2. However, as per the Motor Transport Workers Act, 08 hours of duty is to be given to the crew, so a
set of 02 crew are available for a total of 16 hours. For the extra 2 hours, the following are
standard options:
A. Providing additional crew per shift. This would lead to extra expenditure (or)
B. Giving overtime (OT) is to be given to the last crew on a rotation basis. This would also lead
to extra expenditure (or)
C. In case passenger demand is known, then it is possible to plan the vehicle & crew schedule
without any extra expenditure.
7. Marketing and Branding

14
Optimizing utilization of staff and fleet
Bus and Crew Scheduling
2. Bus and Crew Scheduling
3. Management of Operations
4. Demand and Supply
5. Monitoring of Services
6. Revenue collection
1. Introduction
Factors affecting bus schedulingA
Factors affecting crew schedulingB
Process for crew schedulingC
Optimizing utilization of staff and fleetD
Case study: BEST MumbaiE
Case study: KSRTC MysoreF
Fleet allocation to bus depotsG
Cost is incurred on account of
fuel consumption toward dead
kms
Is incurred Zero dead kms
Due to zero dead kms, no costis incurred on account of fuelconsumption
Minor technical issues can be easily resolved
Minor Technical issues (requiring more time say > 15-25min) cannot be resolved
Loss of time in taking the bus to the depot from terminal &
vise-a-versa
Nil
Time savings is extended to thepassenger due to which buses areon-road
Time saving
Frequent breaks due to changeover at depot.
Service
frequency
Service frequency can be maintained as per schedule.
Not so tedious since the starting & finishing point is at the depot.
Tedious since the crew first has to report at the depot and has to collect accessories and then report at the terminal
Reporting
procedure
Time saving
Benefit to customer
Maint.
issues
Fuel
Consump
Dead kms
En-route/ at terminalAt depot
7. Marketing and Branding

15
Bus and Crew Scheduling
An overview:
• The planning and scheduling was done in a traditional way (manual scheduling)
• It was a time-consuming job
• Practically not possible to oversee the entire data for optimization
• Frequent conflict of perspectives since various officials were involved in the process, causing
deviation from the actual path
• Manual creation, analysis and actual implementation of the plan with permutations & combinations
was difficult
• For the study, Wadala & Oshiwara depots were selected for the implementation of technology.
Parameters considered as inputs:
Schedules Crew
No of buses held Combine maximum in one Route
Journey time per trip Combine with feeder for longer routes & vice versa (This is in case 2 trips are not possible in one long route)
Headway Rest period (Feeder & long route)
Departure & arrival of all buses from & to the depot*
Relief point for staff*
Control points at Origin & Destination Optimization through experience
Capacity of bus station/terminus to handle to arrival & departure
Time taken depends on the volume of buses
After the completion of the first shift, crew change for the second shift takes place en-route bus stations or
terminals and not at the depot. This means that the bus goes to the depot at the end of the day's schedule
only.
2. Bus and Crew Scheduling
3. Management of Operations
4. Demand and Supply
5. Monitoring of Services
6. Revenue collection
1. Introduction
Factors affecting bus schedulingA
Factors affecting crew schedulingB
Process for crew schedulingC
Optimizing utilization of staff and fleetD
Case study: BEST MumbaiE
Case study: KSRTC MysoreF
Fleet allocation to bus depotsG
Case study: BEST Mumbai (Impact of IT on Route and Duty Scheduling)
7. Marketing and Branding

16
Bus and Crew Scheduling
2. Bus and Crew Scheduling
3. Management of Operations
4. Demand and Supply
5. Monitoring of Services
6. Revenue collection
1. Introduction
Factors affecting bus schedulingA
Factors affecting crew schedulingB
Process for crew schedulingC
Optimizing utilization of staff and fleetD
Case study: BEST MumbaiE
Case study: KSRTC MysoreF
Fleet allocation to bus depotsG
Case study: BEST Mumbai (Impact of IT on Route and Duty Scheduling)
Plan 1 Plan 2
Combination of routes Long route + Long route Feeder + Long Route
Combination of duties
& routes
Duties combined with routes/buses of
different depot at common relief point
Combination of routes with same depot
& same type vehicle (i.e., AC with AC)
Rest Period 35-40min 50-60min
Spread over More than 10.30hrs Less than 10.30hrs
Saving in duties Up to 4.3% Up to 4.3%
Plan 1, due to the combination of the long routes, the BEST got the freedom to change duties at a common
relief point for various routes of different depots.
The duty saving is to the extent of 4.3% in similar line in plan 2 having a combination of feeder & long route
of the same depot; the duty savings is up to 4.3% even with 12 depots.
7. Marketing and Branding

17
Bus and Crew Scheduling
Depot Manual
(25Depots)
Combined (Manual -23+
Computerized 2 depots)
Saving by Computerized
schedules
Mon to Fri
Sat Sun Holiday Mon to Fri
Sat Sun Holiday Mon to Fri
Sat Sun Holiday
Wadala 421 419 353 378 401 397 331 353 -204.75%
-22 -22 -25
Oshiwara 419 415 302 340 403 397 287 324 -16 3.81%
-18 -15 -16
% 840 -364.28%
Duti
es &
Savin
gs
Benefits in duty savings due to automation
Spread Over of Duties ( Wadala & Oshiwara ) – MONDAY TO FRIDAY
Prepared 5-7 hrs 7-9 hrs 9-11 hrs 11-12 hrs Total
Manually 22
2.64%
619
74.40%
177
21.27%
14
1.68%
832
100%
Automated 88
11.00%
655
81.75 %
53
6.63%
5
0.63%
800
100%
Spread Over of Duties (Wadala & Oshiwara) - SATURDAY
Prepared 5-7 hrs 7-9 hrs 9-11 hrs 11-12 hrs Total
Manually 22
2.66%
622
75.30%
169
20.46%
13
1.57%
826
100%
Automated 80
10.11%
655
82.81%
51
6.45%
5
0.62%
791
100%
Overv
iew
of
spre
ad o
ver:
M
anual
vs. A
uto
mate
d
2. Bus and Crew Scheduling
3. Management of Operations
4. Demand and Supply
5. Monitoring of Services
6. Revenue collection
1. Introduction
Factors affecting bus schedulingA
Factors affecting crew schedulingB
Process for crew schedulingC
Optimizing utilization of staff and fleetD
Case study: BEST MumbaiE
Case study: KSRTC MysoreF
Fleet allocation to bus depotsG
Case study: BEST Mumbai (Impact of IT on Route and Duty Scheduling)
7. Marketing and Branding

18
Bus and Crew Scheduling
Duties & Savings
Manual Computerized Savings
Depots Mon to
Fri
Sat Sun Mon to
Fri
Sat Sun Mon to
Fri
Sat Sun
Wadala 399 398 316 361 359 290 -38 -39 -26
Oshiwara 428 425 314 408 403 290 -20 -22 -24
Colaba 241 216 113 236 209 107 -5 -7 -6
Backbay 309 282 174 295 267 162 -14 -15 -12
Anik 451 449 408 435 432 397 -16 -17 -11
Deonar 356 352 273 338 333 274 -18 -19 1
Ghatkopar 412 394 303 403 384 302 -9 -10 -1
Vikhroli 362 354 215 345 336 224 -17 -18 9
Magthane 376 376 342 353 352 313 -23 -24 -29
Goregaon 397 396 307 384 381 288 -13 -15 -19
Poisar 292 277 226 275 259 212 -17 -18 -14
Goral 431 425 354 430 422 349 -1 -3 -5
Total 4454 4344 3345 4263 4137 3208 -191 -207 -137
-4.3% -4.8% -4.1%
Benefits in duty savings due to automation in 12 depots
2. Bus and Crew Scheduling
3. Management of Operations
4. Demand and Supply
5. Monitoring of Services
6. Revenue collection
1. Introduction
Factors affecting bus schedulingA
Factors affecting crew schedulingB
Process for crew schedulingC
Optimizing utilization of staff and fleetD
Case study: BEST MumbaiE
Case study: KSRTC MysoreF
Fleet allocation to bus depotsG
Case study: BEST Mumbai (Impact of IT on Route and Duty Scheduling)
7. Marketing and Branding

19
Case study: KSRTC Mysore city
Bus and Crew Scheduling
In most of the urban transport, schedules are planned based on certain fixed criteria i.e., time taken to traverse 1kms distance.
• Suburban route will take 2.5min to travel 1km distance (approx. speed 24 kmph.)
• City route will take 3min to travel 1kms distance (approx. speed 20 kmph.)
Slab Time
Morning Slack From first trip of first schedule till 0800hrs
Morning Peak 0800 – 1100hrs
Normal 1100 – 1600hrs
Evening Peak 1600 – 2000hrs
Evening Slack 2000 - till the last trip of the last schedule
Since the implementation of ITS project, the outcome of the vehicle monitoring system are as follows:
1. During early morning & late night, the running time to complete the trips have reduced were less.
2. On the other hand, during peak hours (both morning & evening) running time has been higher than usual.
3. In the afternoon, the trips have been adhering to the schedule time.
So the management has revised the schedules as given below:
2. Bus and Crew Scheduling
3. Management of Operations
4. Demand and Supply
5. Monitoring of Services
6. Revenue collection
1. Introduction
Factors affecting bus schedulingA
Factors affecting crew schedulingB
Process for crew schedulingC
Optimizing utilization of staff and fleetD
Case study: BEST MumbaiE
Case study: KSRTC MysoreF
Fleet allocation to bus depotsG
7. Marketing and Branding

20
Case study: KSRTC Mysore city
Bus and Crew Scheduling
Sl. Parameters Savings in 2015-16 Amount(Rs. Lakhs)
1 Schedule optimization
Reduction of 2314 kms daily; 844610 kms annually (@ Rs 18.95 variable CPKM in 2014-15)
160.05
2 Reduction in Buses
Same effective kms performed using 8 less nos. of buses (Procurement cost @ Rs 33 lakhs/bus)
264.00
3 PreventiveMaintenance
Savings on lubricants & filters(@ avg. cost of 20 ps/km & 5 ps/km)
2.19
4 StaffReduction
Reduction of Staff in Central Bus Station 35.00
5 Over Time Reduction in Over Time 124.00
Total 585.24
Source: Mysore City Transport Division of KSRTC
Note: The Mysuru Intelligent Transport System (MITRA)initiative of KSRTC was supported by World Bank & MoUD
Overall benefit of IT implementation
2. Bus and Crew Scheduling
3. Management of Operations
4. Demand and Supply
5. Monitoring of Services
6. Revenue collection
1. Introduction
Factors affecting bus schedulingA
Factors affecting crew schedulingB
Process for crew schedulingC
Optimizing utilization of staff and fleetD
Case study: BEST MumbaiE
Case study: KSRTC MysoreF
Fleet allocation to bus depotsG
7. Marketing and Branding

21
Bus and Crew Scheduling
Fleet allocation/deployment to bus depots
In operation planning, we learned about the routes, frequency/trips required in-line with
passenger ridership, and study of existing and required public transport infrastructure for
smooth bus operation. Bus infrastructure includes the depot, terminal/stations, and stops.
Focus will now be laid on allocation of routes to particular depots. The criteria to be considered
while allocating the routes to the depot are as given below:
• The distance between the depot and the origin of the route shall be the least. In case of
depot availability at the destination point, the possibility of allocating an onward route to
one depot and return route to another depot may be explored so that the total dead kms
are the least.
• On the common route section, depots operating maximum number of buses shall be
studied. Preference may be given for such a depot in route allocation.
• Total number of routes to be plied on and commuters to be carried, available fleet &
workforce and capacity of the depot have to be taken under consideration while planning
for allocation of routes.
The information on alignments of routes, trips with ridership patterns is covered in “operation
planning,” and optimum utilization of staff & fleet is covered under bus & crew scheduling of
“bus operations.”
In the last phase of operation planning, we have covered the validation of the operation plan
via reality check.
2. Bus and Crew Scheduling
3. Management of Operations
4. Demand and Supply
5. Monitoring of Services
6. Revenue collection
1. Introduction
Factors affecting bus schedulingA
Factors affecting crew schedulingB
Process for crew schedulingC
Optimizing utilization of staff and fleetD
Case study: BEST MumbaiE
Case study: KSRTC MysoreF
Fleet allocation to bus depotsG
7. Marketing and Branding

22
Bus and Crew Scheduling
Points to Ponder
In this unit, focus is on
• Factors that affect the scheduling buses
• Aspects that affect the crew scheduling,
• How to optimize the staff & fleet with case study of BEST and KSRTC, Mysore2. Bus and Crew Scheduling
3. Management of Operations
4. Demand and Supply
5. Monitoring of Services
6. Revenue collection
1. Introduction
Factors affecting bus schedulingA
Factors affecting crew schedulingB
Process for crew schedulingC
Optimizing utilization of staff and fleetD
Case study: BEST MumbaiE
Case study: KSRTC MysoreF
Fleet allocation to bus depotsG
7. Marketing and Branding

23
Management of Operations
An overview
Automatic Vehicle Monitoring (AVM)
Dispatch
Route Service Monitoring
Schedule Adherence
Emergency/Incident
management
Driving –Standards
Compliance
Service Contract Compliance
Dynamic rescheduling
The above applications are in line with the World Bank recommendation, which are based onthe global best practice. However, to get the expected outcome, some challenges need to beaddressed in the bus operation stage with the aim to synchronize the technology with groundrealties/conditions
2. Bus and Crew Scheduling
3. Management of Operations
4. Demand and Supply
5. Monitoring of Services
6. Revenue collection
7. Marketing and Branding
1. Introduction
An overviewA
Challenges in AVM implementationB
Managing dispatchC
Monitoring route serviceD
Ensuring schedule adherenceE
Case study: KSRTC MysoreF
Ensuring standard driving complianceG
Incident managementH
Legislative provisionsI
Ensuring service contract complianceK
Adjusting schedules dynamicallyJ
ITS application enables the operator in efficient management of bus operations.The outline of which is as given below:
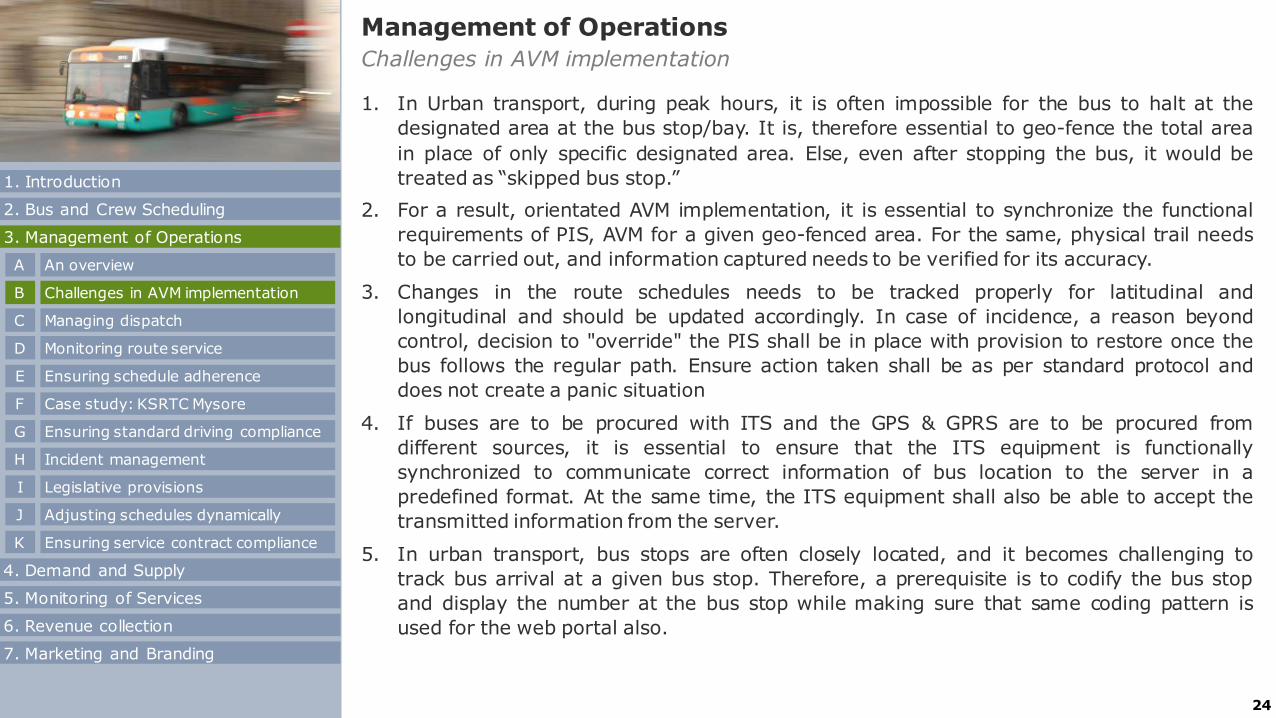
24
Management of Operations
Challenges in AVM implementation
1. In Urban transport, during peak hours, it is often impossible for the bus to halt at the
designated area at the bus stop/bay. It is, therefore essential to geo-fence the total area
in place of only specific designated area. Else, even after stopping the bus, it would be
treated as “skipped bus stop.”
2. For a result, orientated AVM implementation, it is essential to synchronize the functional
requirements of PIS, AVM for a given geo-fenced area. For the same, physical trail needs
to be carried out, and information captured needs to be verified for its accuracy.
3. Changes in the route schedules needs to be tracked properly for latitudinal and
longitudinal and should be updated accordingly. In case of incidence, a reason beyond
control, decision to "override" the PIS shall be in place with provision to restore once the
bus follows the regular path. Ensure action taken shall be as per standard protocol and
does not create a panic situation
4. If buses are to be procured with ITS and the GPS & GPRS are to be procured from
different sources, it is essential to ensure that the ITS equipment is functionally
synchronized to communicate correct information of bus location to the server in a
predefined format. At the same time, the ITS equipment shall also be able to accept the
transmitted information from the server.
5. In urban transport, bus stops are often closely located, and it becomes challenging to
track bus arrival at a given bus stop. Therefore, a prerequisite is to codify the bus stop
and display the number at the bus stop while making sure that same coding pattern is
used for the web portal also.
2. Bus and Crew Scheduling
3. Management of Operations
4. Demand and Supply
5. Monitoring of Services
6. Revenue collection
1. Introduction
An overviewA
Challenges in AVM implementationB
Managing dispatchC
Monitoring route serviceD
Ensuring schedule adherenceE
Case study: KSRTC MysoreF
Ensuring standard driving complianceG
Incident managementH
Legislative provisionsI
Ensuring service contract complianceK
Adjusting schedules dynamicallyJ
7. Marketing and Branding

25
Management of Operations
Challenges in AVM implementation
6. Ensure algorithm are fine-tuned to provide correct “Expected Time of Arrival” truly verified
with real-time situation
7. Educating the crew – Often the crew with the knowledge that their performance is
monitored, sabotage the AVM by disconnecting the power without knowing that with the
power backup, the AVM continues to send the information. In this backdrop, the crew,
needs to be educated about the benefits of the system to ensure their acceptance and
prevent sabotage
8. The AVM shall be placed within the driver’s reach to enable him to use the hotkeys
provided for various types of emergencies (may be fixed on the right side of the driver,
above the driver's door). The AVM shall get uninterrupted power supply irrespective of the
movement of the bus.
9. Fitment of GPS/GPRS antenna should not be easily accessible by the crew to avoid
sabotage (maybe fixed on top of the bus, above the windshield, in the middle)
2. Bus and Crew Scheduling
3. Management of Operations
4. Demand and Supply
5. Monitoring of Services
6. Revenue collection
1. Introduction
An overviewA
Challenges in AVM implementationB
Managing dispatchC
Monitoring route serviceD
Ensuring schedule adherenceE
Case study: KSRTC MysoreF
Ensuring standard driving complianceG
Incident managementH
Legislative provisionsI
Ensuring service contract complianceK
Adjusting schedules dynamicallyJ
7. Marketing and Branding

26
Management of Operations
Managing dispatch
Objective
• Ensure the departure of the bus, according to the operational and headway plan at the scheduled time
• Maintain the headway intervals by managing the departures as close as possible, in case of late arrival of incoming
vehicles and/or other disruptions
• Manage departures by providing best possible services with limited resources
• Liaise for support services with depot for replacement vehicles and/or drivers, in case of break down
Whom it will benefit
Operator:
• It provides real-time information on schedules, dispatching sequence, and vehicle availability to the dispatcher.
• Provides status information and alerts about actual and missing departures.
• Dispatcher can intervene as and when required to ensure the planned service is performed, and respond to
disruptions (if any).
• Voice and data communication with drivers, vehicles and support staff helps to facilitate on-time departure.
• Uses the information to fine-tune the planned service, and to monitor driver performance.
Authority:
• The information aid’s the Transport Authority to monitor the daily performance. In real-time, they can direct the
operators to carry out corrective measures, or the Authority can intervene directly (in case of major disruption).
• The data generated in Bus Operation can be used extensively for post-event analysis.
Other modules: The information generated is one of the crucial inputs for other modules.
How it works
AVM Unit is mounted in each bus which enables the operator to visualize vehicle positioning at any given time, both in
terms of the actual location and relative to their scheduled location.
For case study refer : “timely departure from depot” - in “Monitoring of services”
2. Bus and Crew Scheduling
3. Management of Operations
4. Demand and Supply
5. Monitoring of Services
6. Revenue collection
1. Introduction
An overviewA
Challenges in AVM implementationB
Managing dispatchC
Monitoring route serviceD
Ensuring schedule adherenceE
Case study: KSRTC MysoreF
Ensuring standard driving complianceG
Incident managementH
Legislative provisionsI
Ensuring service contract complianceK
Adjusting schedules dynamicallyJ
7. Marketing and Branding
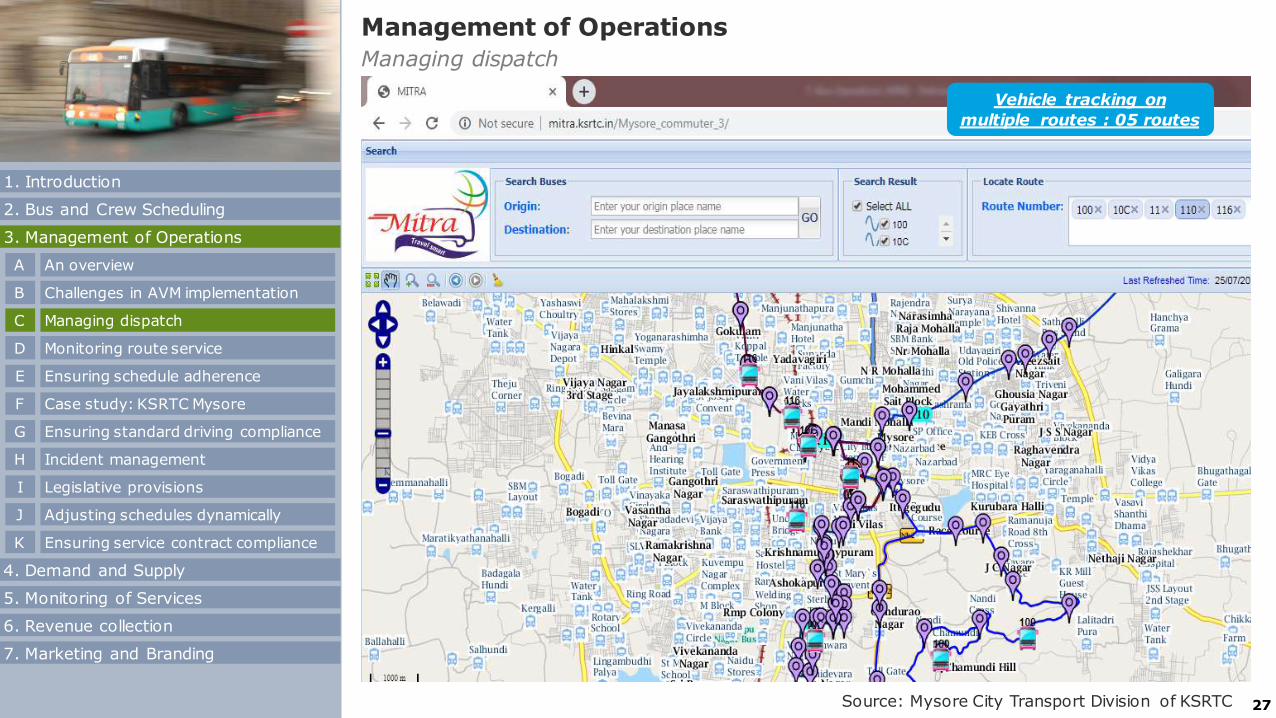
27
Management of Operations
Managing dispatch
Vehicle tracking on
multiple routes : 05 routes
Source: Mysore City Transport Division of KSRTC
2. Bus and Crew Scheduling
3. Management of Operations
4. Demand and Supply
5. Monitoring of Services
6. Revenue collection
1. Introduction
An overviewA
Challenges in AVM implementationB
Managing dispatchC
Monitoring route serviceD
Ensuring schedule adherenceE
Case study: KSRTC MysoreF
Ensuring standard driving complianceG
Incident managementH
Legislative provisionsI
Ensuring service contract complianceK
Adjusting schedules dynamicallyJ
7. Marketing and Branding

28
Management of Operations
Monitoring route service
Objective
It provides real-time information about the operational status of the route ie., identify how the route is
performing as against the planned performance.
Whom it will benefit
Passengers: Route service information viz, real-time passenger information, traveler alert services, and
journey planners can be included in passengers advice.
Dispatcher: To grab the attention of dispatcher about crucial information, the visual tools are used for
highlighting the critical information:
• Representation of the intervals between vehicles
• Colour-coding of variances to indicate early/late running, bunching, excessive intervals
• Flashing symbols for variances that need close attention
• Audio alerts
The information also channelizes the support staff of bus operation.
How it works
• VMU fitted in each bus tracks the location throughout the trip. Such information from all the buses is fed
into the module and along with other necessary information such as acquired real-time and pre-planned
information from external sources about events, disruptions, etc.
• For a given route, the data is compiled & processed basically for comparison of real-time information on
route (such as vehicle location, speed, delays etc.,) as against the planned service (timetable, headways,
running times). The focus is to measure the deviation of actual performance against the planned.
• It supports the dispatch module.
2. Bus and Crew Scheduling
3. Management of Operations
4. Demand and Supply
5. Monitoring of Services
6. Revenue collection
1. Introduction
An overviewA
Challenges in AVM implementationB
Managing dispatchC
Monitoring route serviceD
Ensuring schedule adherenceE
Case study: KSRTC MysoreF
Ensuring standard driving complianceG
Incident managementH
Legislative provisionsI
Ensuring service contract complianceK
Adjusting schedules dynamicallyJ
7. Marketing and Branding

29
Management of Operations
Monitoring route service
1453 hrs1453 hrs
Source: Mysore City Transport Division of KSRTC
Advance
Vehicle tracking & commitment Vehicle tracking & commitment
Actual
2. Bus and Crew Scheduling
3. Management of Operations
4. Demand and Supply
5. Monitoring of Services
6. Revenue collection
1. Introduction
An overviewA
Challenges in AVM implementationB
Managing dispatchC
Monitoring route serviceD
Ensuring schedule adherenceE
Case study: KSRTC MysoreF
Ensuring standard driving complianceG
Incident managementH
Legislative provisionsI
Ensuring service contract complianceK
Adjusting schedules dynamicallyJ
7. Marketing and Branding

30
Management of Operations
Monitoring route service
on-
time
05min
early
Source: Mysore City Transport Division of KSRTC
Vehicle tracking: delay/ early/ on-time
2. Bus and Crew Scheduling
3. Management of Operations
4. Demand and Supply
5. Monitoring of Services
6. Revenue collection
1. Introduction
An overviewA
Challenges in AVM implementationB
Managing dispatchC
Monitoring route serviceD
Ensuring schedule adherenceE
Case study: KSRTC MysoreF
Ensuring standard driving complianceG
Incident managementH
Legislative provisionsI
Ensuring service contract complianceK
Adjusting schedules dynamicallyJ
7. Marketing and Branding

31
Management of Operations
Ensuring schedule adherence
Objective
Aid the dispatcher to keep the service operating according to the schedule/planned headway and get
vehicles to depart on time or according to headway specifications.
Whom it will benefit
Dispatcher:
• The application predicts & highlights the delays & excessive intervals in advance, viz.,
• any vehicles that will arrive at the terminal point too late to commence their next trip on-time.
• any vehicles that are likely to be in delay for a scheduled crew change or meal break, and causing
cascading delays in services. This gives the dispatcher the opportunity to prioritize such vehicles for
intervention, so that the change-over or meal-break happens on-time
• so that the dispatcher gets the time to plan mitigating actions
• Some of the lead interventions which dispatcher uses to improve schedule adherence are:
• Use of traffic priority system, which can grant priority to vehicles on-schedule or in delay.
• If continuous delay is occurring, then the planning function needs to intervene to identify where the
schedule needs to be adjusted to optimize schedule adherence
• This application plays a crucial role in reducing the risk of bunching
How it works
• The key to the success of urban transport is to ensure all trips depart/arrive on time.
• The application gets information from dispatch & route service applications on the current location,
current delay status, known sectional running times, and actual information such as disruptions, if any
inputs and checks whether the schedule is adhering to the plan or demands intervention of dispatcher.
2. Bus and Crew Scheduling
3. Management of Operations
4. Demand and Supply
5. Monitoring of Services
6. Revenue collection
1. Introduction
An overviewA
Challenges in AVM implementationB
Managing dispatchC
Monitoring route serviceD
Ensuring schedule adherenceE
Case study: KSRTC MysoreF
Ensuring standard driving complianceG
Incident managementH
Legislative provisionsI
Ensuring service contract complianceK
Adjusting schedules dynamicallyJ
7. Marketing and Branding

32
Management of Operations
Case study: KSRTC Mysore (MITRA for schedule adherence)
Schedule adherence:
The “Vehicle Mounting Unit” fitted in the buses, send the information of its presence. Out of
which the information, as highlighted below, is of interest:
No of scheduled trips departed within + 5 min. deviation
No. of scheduled trips departed within -1 to + 5min deviation and the midpoint of the same
Arrival time of vehicle at the midpoint of the trip
2. Bus and Crew Scheduling
3. Management of Operations
4. Demand and Supply
5. Monitoring of Services
6. Revenue collection
1. Introduction
An overviewA
Challenges in AVM implementationB
Managing dispatchC
Monitoring route serviceD
Ensuring schedule adherenceE
Case study: KSRTC MysoreF
Ensuring standard driving complianceG
Incident managementH
Legislative provisionsI
Ensuring service contract complianceK
Adjusting schedules dynamicallyJ
7. Marketing and Branding

33
Management of Operations
Case study: KSRTC Mysore (MITRA for schedule adherence)
Measures of Performance
Indicators
BaselineApril-2012
Temporal Survey-1
2013
Temporal Survey-2
2014
Temporal Survey-3
2014
Temporal Survey-4
2015
Temporal Survey2018
Bench-mark
Trip Origin –Proportion of trips departing ± 5 minutes from scheduled time
9% 19% 24% 32% 46% 83% 79%
Trip Midpoint –Proportion of trips between -1 to +5 minutes of scheduled time
7% 19% 23% 31% 45% 77% 79%
Trip Endpoint –Headway coefficient (headway standard deviation/mean headway)
NA 84% 73% 73% 64% 58% 39%
Source: Mysore City Transport Division of KSRTC
2. Bus and Crew Scheduling
3. Management of Operations
4. Demand and Supply
5. Monitoring of Services
6. Revenue collection
1. Introduction
An overviewA
Challenges in AVM implementationB
Managing dispatchC
Monitoring route serviceD
Ensuring schedule adherenceE
Case study: KSRTC MysoreF
Ensuring standard driving complianceG
Incident managementH
Legislative provisionsI
Ensuring service contract complianceK
Adjusting schedules dynamicallyJ
7. Marketing and Branding

34
Management of Operations
Ensuring standard driving compliance
Objective
Driving a public transport bus in urban areas having heterogeneous traffic using the same road space is not
an easy task. The style of driving further aggravates the task and human factor, i.e., thoughts that are
going through the mind & its implications increase the chance of incidence. So the objective of ensuring
drivers to follow driving standards has gained significance. It may be through controlling mechanisms fitted
in vehicles like speed limiting device and/or on-road checks. It is essential to note that the traditional
checking procedure on-road is complimentary to ITS application.
Whom it will benefit
• Safety of passengers at large and rolling stock safety, which is the property of the operator.
• Authority : image building of urban transport as an organize transport having incident-free track record &
compliance with driving standard
How it works
The application gets information from the dispatch & other related applications as inputs. The application
processes the recorded information and carries out investigation, regime for monitoring, detection of poor
practice or violations, and subsequent enforcement – i.e., ‘detect and deter’. Some of the sets of compliance
checks that can be included consist of:
• Detection of excessive speed;
• Detection of sharp acceleration or deceleration;
• Detection of excessive pitch and roll, sharp turns; and
• Detection of poor driving practice
2. Bus and Crew Scheduling
3. Management of Operations
4. Demand and Supply
5. Monitoring of Services
6. Revenue collection
1. Introduction
An overviewA
Challenges in AVM implementationB
Managing dispatchC
Monitoring route serviceD
Ensuring schedule adherenceE
Case study: KSRTC MysoreF
Ensuring standard driving complianceG
Incident managementH
Legislative provisionsI
Ensuring service contract complianceK
Adjusting schedules dynamicallyJ
7. Marketing and Branding

35
Management of Operations
Ensuring standard driving compliance
S.NO MIS REPORT ATTRIBUTEMAR15
MAR16
MAR17
MAR18
MAR19
1NO OF BUS STOPS
SKIPPED5 4 4 3 4
2 NO OF SPEED VIOLATIONS 6 4 4 3 3
3NO OF SUDDENACCELERATION 15 11 11 8 8
4 NO OF HARSH BRAKES 7 3 2 2 2
Source: Mysore City Transport Division of KSRTC
2. Bus and Crew Scheduling
3. Management of Operations
4. Demand and Supply
5. Monitoring of Services
6. Revenue collection
1. Introduction
An overviewA
Challenges in AVM implementationB
Managing dispatchC
Monitoring route serviceD
Ensuring schedule adherenceE
Case study: KSRTC MysoreF
Ensuring standard driving complianceG
Incident managementH
Legislative provisionsI
Ensuring service contract complianceK
Adjusting schedules dynamicallyJ
AVG. COUNTS PER BUS PER TRIP
7. Marketing and Branding

36
Management of Operations
Ensuring standard driving compliance
Latitude Longitude Altitude SpeedDirection
AngleNo of Track
satelliteGPS date & Time stamp Remarks
12.323923 76.691193 777 22 352 11 2017-04-24. 11:51:21 Dr. Rajkumar Main road
12.324465 76.691162 780 21 358 11 2017-04-24. 11:51:31 Up Gradient
12.3247 76.69133 780 16 92 12 2017-04-24. 11:51:41 Level road
12.32465 76.692024 777 36 100 12 2017-04-24. 11:51:51 Down Gradient
12.324483 76.693024 773 38 100 10 2017-04-24. 11:52:01 Down Gradient
12.324344 76.693848 769 19 100 12 2017-04-24. 11:52:11 Down Gradient
12.324324 76.69397 768 11 100 12 2017-04-24. 11:52:21 Down Gradient
12.324226 76.694565 766 32 100 12 2017-04-24. 11:52:31 Down Gradient
12.32411 76.695572 763 43 90 11 2017-04-24. 11:52:41 Down Gradient
12.32422 76.696709 758 47 80 12 2017-04-24. 11:52:51 Down Gradient
12.324741 76.697708 752 20 68 12 2017-04-24. 11:53:01 Down Gradient
12.325143 76.698792 752 0 208 11 2017-04-24. 11:53:11 Final position after accident
12.325138 76.698792 753 0 208 11 2017-04-24. 11:53:21 Final position after accident
12.32514 76.698776 753 0 208 11 2017-04-24. 11:53:31 Final position after accident
12.32514 76.698776 753 0 208 11 2017-04-24. 11:53:41 Final position after accident
From this data, it is evident that the driver has not observed the traffic while crossing the ring
road
Positional Lat-Long data used for each accident analysis
Source: Mysore City Transport Division of KSRTC
2. Bus and Crew Scheduling
3. Management of Operations
4. Demand and Supply
5. Monitoring of Services
6. Revenue collection
1. Introduction
An overviewA
Challenges in AVM implementationB
Managing dispatchC
Monitoring route serviceD
Ensuring schedule adherenceE
Case study: KSRTC MysoreF
Ensuring standard driving complianceG
Incident managementH
Legislative provisionsI
Ensuring service contract complianceK
Adjusting schedules dynamicallyJ
7. Marketing and Branding

37
Management of Operations
Objective
Emergency preparedness for potential disruptive or damaging incidences. Incidents may include accident,
fire, an assault or threat for a driver, commuter, medical emergency, etc.
How it works
It is prerequisite to know the types of incidences, clustered in 3 levels followed by how it works and way to
handle the incidence:
• Alarm/alert initiated by the driver/conductor/bystander overrides the standard communication protocols
and gets priority alert to the dispatcher
• Dispatcher tries to understand & categorizes the incidence and follows the protocol action as stipulated:
Incident management
Level Categories Incidence Way to handle the incidence
1 Individual vehicle or location
1. Breakdown of vehicle, requiringtechnical assistance orreplacement;
2. Illness or other non-criminalincident including minor injuriesrequiring medical support;
1. Send the towing vehicle & team ofmechanics and other vehicle of the sameclass as a replacement.
2. As per the requirement of the situation,inform the emergency trauma center, policedepartment and other allied departments.
As per the case, traffic signal adjustment inthe vicinity of the disruption areas is highlyessential.
2. Bus and Crew Scheduling
3. Management of Operations
4. Demand and Supply
5. Monitoring of Services
6. Revenue collection
1. Introduction
An overviewA
Challenges in AVM implementationB
Managing dispatchC
Monitoring route serviceD
Ensuring schedule adherenceE
Case study: KSRTC MysoreF
Ensuring standard driving complianceG
Incident managementH
Legislative provisionsI
Ensuring service contract complianceK
Adjusting schedules dynamicallyJ
7. Marketing and Branding

38
Management of Operations
Incident management
Level Categories Incidence Way to handle the incidence
2 Impacting only the
public transport services
1. Restriction on entry ofHeavy Motor Vehicles
2. Diversion/Restriction dueto roadconstruction/repairs /events
3. Unplanned diversion by thedriver &/crew
4. Incidence involving loss ofproperty, fire and orcommuters sustainingmajor injury/fatality
For known disruptions (e.g. planned road work, events),temporary route diversions, temporary schedules and adjusted
sectional running times can be pre-programmed intothe dispatch module and activated for the work period
It is essential to escalate such incidence to the dedicatedteam/workstation, which takes over the management ofspecific categories of emergency/incident. This ensures thatappropriately-trained personnel handle the incident. At thesame time, it allows the dispatchers to remain focused on thenormal operations.
3 Impacting the urban area and utilities, of which public transport is one
1. Assault, aggressive orsecurity incident, requiringpolice/security response
2. Weather-related eventsand restrictions
3. Diversion/Restriction dueto major roadconstruction/repairs/events
Such incidence needs to be escalated to the dedicatedteam/workstation as referred above, allowing the dispatchersto remain focused on normal operations.
For occasional disruptions due major road construction/ fairs,festival leading to unavailability of streets, alternative planscan be stored within the dispatch and activated whenever atrigger event occurs
Whom it will benefit1. Commuter: safety at large2. Operator: safety of crew & rolling stock3. Authority & Operator: image building of urban transport as an organized public transport with
excellence in the management of an incident
2. Bus and Crew Scheduling
3. Management of Operations
4. Demand and Supply
5. Monitoring of Services
6. Revenue collection
1. Introduction
An overviewA
Challenges in AVM implementationB
Managing dispatchC
Monitoring route serviceD
Ensuring schedule adherenceE
Case study: KSRTC MysoreF
Ensuring standard driving complianceG
Incident managementH
Legislative provisionsI
Ensuring service contract complianceK
Adjusting schedules dynamicallyJ
7. Marketing and Branding

39
Management of Operations
Legislative provisions related to driving and incidents
The Indian Penal Code (IPC) Provisions, have defined offences under in concern section and
prescribed punishments thereof. The following are the IPCs as applicable for Urban Transport.
• Section 279: Rash driving or riding on a public way. “Whoever drives any vehicle, or rides, on any
public way in a manner so rash or negligent as to endanger human life, or to be likely to cause hurt
or injury to any other person, shall be punished with imprisonment of either description for a term
which may extend to six months, or with a fine which may extend to one thousand rupees, or with
both.”
• Section 304A: Causing death by negligence. “Whoever causes the death of any person by doing
any rash or negligent act not amounting to culpable homicide, shall be punished with imprisonment
of either description for a term which may extend to two years, or with fine, or with both.”
• Section 336: Act endangering life or personal safety of others. “Whoever does any act so rashly or
negligently as to endanger human life or the personal safety of others shall be punished with
imprisonment of either description for a term which may extend to three months, or with fine
which may extend to two hundred and fifty rupees, or with both.”
• Section 337: Causing hurt by act endangering life or personal safety of others. “Whoever causes
hurt to any person by doing any act so rashly or negligently as to endanger human life or the
personal safety of others, shall be punished with imprisonment of either description for a term
which may extend to six months, or with fine which may extend to five hundred rupees, or with
both.”
• Section 338: Causing grievous hurt by act endangering life or personal safety of others. “Whoever
causes grievous hurt to any person by doing any act so rashly or negligently as to endanger human
life or the personal safety of others, shall be punished with imprisonment of either description for a
term which may extend to two years, or with fine which may extend to one thousand rupees, or
with both.”
2. Bus and Crew Scheduling
3. Management of Operations
4. Demand and Supply
5. Monitoring of Services
6. Revenue collection
1. Introduction
An overviewA
Challenges in AVM implementationB
Managing dispatchC
Monitoring route serviceD
Ensuring schedule adherenceE
Case study: KSRTC MysoreF
Ensuring standard driving complianceG
Incident managementH
Legislative provisionsI
Ensuring service contract complianceK
Adjusting schedules dynamicallyJ
7. Marketing and Branding

40
Management of Operations
Adjusting schedules dynamically
Objective
To allows the schedule to be adjusted in real-time or semi-real time in response to prevailing circumstances
Whom it will benefit
Passengers: Passengers get real-time updates due to dynamic rescheduling through various
communication channels, including traveler alert services.
Dispatcher:
• The revised schedule is not only transmitted to the commuters but also in-vehicle devices; thereby, giving
the crew latest information on the trip to be performed.
• The times of arrival of the bus at en-routes bus stops also gets adjusted
• This application not only revises the schedule but also focuses on eliminating miscommunication, which
may often arise in manual communication
How it works
The application gets information from dispatch & other applications as inputs. The schedule gets adjusted in
real-time, and as such the dynamic rescheduling can operate at various levels of complexity, including the
following situations:
• Smoothing the schedule or headway pattern when a vehicle is missing.
• Recalculating the schedule or headway pattern when one or more additional vehicles are operated on a
route (e.g. in response to unusually high demand).
• Recalculating the schedule and intermediate times when a route diversion takes place.
• Recalculating the schedule based on the actual overall or sectional running times.
• Creating an alternative schedule in case of severe disruption.
2. Bus and Crew Scheduling
3. Management of Operations
4. Demand and Supply
5. Monitoring of Services
6. Revenue collection
1. Introduction
An overviewA
Challenges in AVM implementationB
Managing dispatchC
Monitoring route serviceD
Ensuring schedule adherenceE
Case study: KSRTC MysoreF
Ensuring standard driving complianceG
Incident managementH
Legislative provisionsI
Ensuring service contract complianceK
Adjusting schedules dynamicallyJ
7. Marketing and Branding

41
Management of Operations
Adjusting schedules dynamically
Source: Mysore City Transport Division of KSRTC
2. Bus and Crew Scheduling
3. Management of Operations
4. Demand and Supply
5. Monitoring of Services
6. Revenue collection
1. Introduction
An overviewA
Challenges in AVM implementationB
Managing dispatchC
Monitoring route serviceD
Ensuring schedule adherenceE
Case study: KSRTC MysoreF
Ensuring standard driving complianceG
Incident managementH
Legislative provisionsI
Ensuring service contract complianceK
Adjusting schedules dynamicallyJ
7. Marketing and Branding

42
Management of Operations
Ensuring service contract compliance
Objective
The application focuses on measuring the degree of compliance with the conditions of the service contract
Whom it will benefit
Transport Operator: When the service contract requires self-reporting by the Operator (this is usually
supplemented with checks by the Transport Authority)
Authority: When the authority prefers to have full visibility of service operations and performance
How it works
The application gets information from the dispatch module & other related modules as input and
performance is measured for parameters like
• Whether all scheduled trips are operated in full;
• Whether trips are part-operated;
• Deviations from specified route alignments;
• Breakdowns, Speeding, etc.
• Vehicle committed vs. provided (A/C against non AC (or) availability of ITS or fares equipment on the
vehicle)
• Compliance for supply of fit vehicle and driver with license, insurance, safety, and other regulatory criteria
2. Bus and Crew Scheduling
3. Management of Operations
4. Demand and Supply
5. Monitoring of Services
6. Revenue collection
1. Introduction
An overviewA
Challenges in AVM implementationB
Managing dispatchC
Monitoring route serviceD
Ensuring schedule adherenceE
Case study: KSRTC MysoreF
Ensuring standard driving complianceG
Incident managementH
Legislative provisionsI
Ensuring service contract complianceK
Adjusting schedules dynamicallyJ
7. Marketing and Branding

43
Management of Operations
Points to Ponder
2. Bus and Crew Scheduling
3. Management of Operations
4. Demand and Supply
5. Monitoring of Services
6. Revenue collection
1. Introduction
An overviewA
Challenges in AVM implementationB
Managing dispatchC
Monitoring route serviceD
Ensuring schedule adherenceE
Case study: KSRTC MysoreF
Ensuring standard driving complianceG
Incident managementH
Legislative provisionsI
Ensuring service contract complianceK
Adjusting schedules dynamicallyJ
In this unit, the emphasis is on
• Effective management of operations, expounded with the help of relevant case studies.
• Defined levels of incidences and ways to handle them.
7. Marketing and Branding

44
Demand and Supply Management
Passenger demand
Catered demand + Un-Catered demand + Lead
Catered demand – no. of passengers who boarded the bus /
availed the public transport services
Un-catered demand – no. of passengers who have not boarded
any public transport bus, instead they preferred to go by IPT/
other mode after waiting at the bus stop
Lead – Individuals willing to shift to public transport from other
modes such as IPTs, personalized vehicles, etc.
2. Bus and Crew Scheduling
3. Management of Operations
4. Demand and Supply
5. Monitoring of Services
6. Revenue collection
7. Marketing and Branding
1. Introduction
Passenger demandA
Sources of passenger demandB
Route wise demand fluctuationC
Critical parameters (supply of service)D
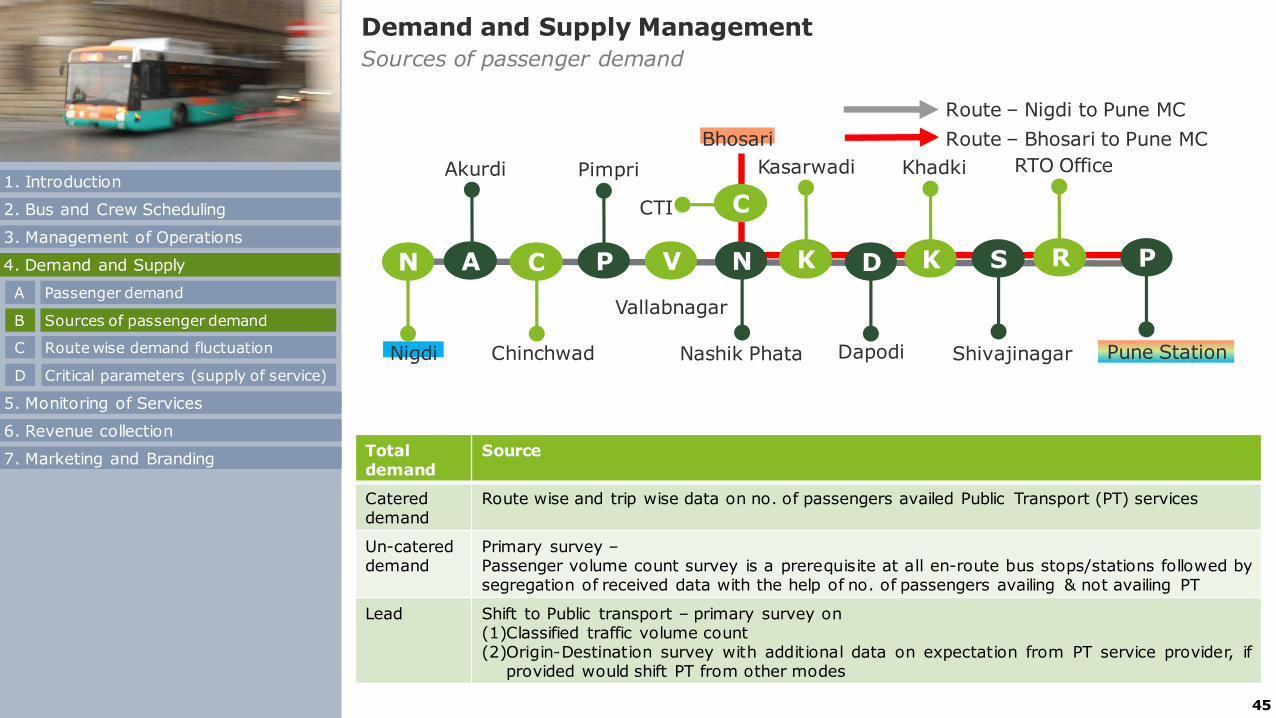
45
Demand and Supply Management
Sources of passenger demand
Total demand
Source
Catered demand
Route wise and trip wise data on no. of passengers availed Public Transport (PT) services
Un-catered demand
Primary survey –Passenger volume count survey is a prerequisite at all en-route bus stops/stations followed bysegregation of received data with the help of no. of passengers availing & not availing PT
Lead Shift to Public transport – primary survey on(1)Classified traffic volume count(2)Origin-Destination survey with additional data on expectation from PT service provider, if
provided would shift PT from other modes
N A C P V
Nigdi
Akurdi
Chinchwad
Pimpri
K KN
Vallabnagar
Nashik Phata
Kasarwadi
D
Dapodi
Khadki
S
Shivajinagar
R
RTO Office
P
Pune Station
Route – Bhosari to Pune MC
Route – Nigdi to Pune MC
Bhosari
CCTI2. Bus and Crew Scheduling
3. Management of Operations
4. Demand and Supply
5. Monitoring of Services
6. Revenue collection
1. Introduction
Passenger demandA
Sources of passenger demandB
Route wise demand fluctuationC
Critical parameters (supply of service)D
7. Marketing and Branding

46
Demand and Supply Management
Route wise demand fluctuation
0
10
20
30
40
50
60
70
80
Thane
Dadoji K
ond D
ev
Court
Naka
Kalv
a
Shiv
aji H
osp
ital
Vitava
Dam
odar
Vitavkar M
arg
Ganesh
Pada
Mukund C
om
pany
Dig
ha
MSEB
Airoli N
aka
Philip
s Com
pany
Bhara
t Bijle
e
Sie
mens
Co
Rabada P
olice S
tn
Rabada N
aka
Gohavi G
aon
Tala
vli
Naka
Ghansoli N
aka
Sta
ndard
Alc
.
Mahape N
aka
Kopar Khairane
ICI
Khera
ne G
aon
Khera
ne R
eliance
Pavne N
aka
Savita C
hem
icals
Turb
he S
tore
s
Gadge M
ahara
j Chow
k
Turb
he N
aka
Dutta M
andir
Turb
he V
illa
ge
Sanpada R
ly S
tn
Mafc
o
Krishi Upanna B
aja
r
Kanda B
ata
ta B
aja
r
Vashi Rly
Stn
No o
f Passengers
->
Name of the stop ->
Traffic Loading Survey
Starting Time: 19:15 hours; Ending Time: 20:30 hours
Route length : 20.2 kms. approx.
2. Bus and Crew Scheduling
3. Management of Operations
4. Demand and Supply
5. Monitoring of Services
6. Revenue collection
1. Introduction
Passenger demandA
Sources of passenger demandB
Route wise demand fluctuationC
Critical parameters (supply of service)D
7. Marketing and Branding

47
Demand and Supply Management
Critical parameters for supply of services
In supply of services, the following points are to be taken under considerations:
The first focus shall always be onensuring assured passengers are notopting for other alternatives.
For planning of route & trips on a givenroute, information on bus stop wisepassenger ridership should be used
The trend line analysis of daily,monthly and seasonal fluctuation couldlead to fine-tuning of trips andschedules.
If, on a given route between specified busstops, more passengers demand isobserved than the services provided, thenan extra bus should be operated betweenthat section. However, due considerationsare given to the length of such sections.
The type of bus to be operated is afunction of no. of passengerstraveling/ridership, expectation ofpassengers, income level attributes, etc.
2. Bus and Crew Scheduling
3. Management of Operations
4. Demand and Supply
5. Monitoring of Services
6. Revenue collection
1. Introduction
Passenger demandA
Sources of passenger demandB
Route wise demand fluctuationC
Critical parameters (supply of service)D
7. Marketing and Branding

48
Demand and Supply Management
Points to Ponder
The unit covers the following aspects
• understanding of passenger demand.
• Sources of passenger demand.
• Route wise demand fluctuation explained with the help of relevant case studies.
• Critical aspects to kept in mind viz., changing headways every 15 to 60 minutes during
peak travel times.
2. Bus and Crew Scheduling
3. Management of Operations
4. Demand and Supply
5. Monitoring of Services
6. Revenue collection
1. Introduction
Passenger demandA
Sources of passenger demandB
Route wise demand fluctuationC
Critical parameters (supply of service)D
7. Marketing and Branding

49
Monitoring of Service
Parameters to be monitored
2. Bus and Crew Scheduling
3. Management of Operations
4. Demand and Supply
5. Monitoring of Services
6. Revenue collection
7. Marketing and Branding
1. Introduction
Parameters to be monitoredA
Monitor timely departure from depotB
Monitoring is an ongoing internal process, where system conditions are examined through
collected data. Monitoring aids in analyzing the operational efficiency and performance, and
the detection and reporting of possible errors. An efficient monitoring framework leads to
improved performance.
Some of the parameters considered in the monitoring of urban transport services are as
follows:
1. Early/Late departures and arrival of buses from depots and at bus stations
2. Non-completion of scheduled trips by the buses
3. Deviation in trips by the buses
4. Cancellation of the trips in the scheduled program
5. Calculation of canceled Kilometers
6. Vehicle traveled path with distance report
7. Identification of the Idle time of the buses
8. Average speed report
9. Over speed distance report
10. Speed limit violation report
11. Stoppage report
12. Skipping of bus stops
13. 1 Weekly/15 Days Consolidated VTS Analysis Report - Depot wise/vehicle wise
14. Monthly Consolidated VTS Analysis Report - Depot wise/Vehicle wise
15. Working/non-working status report of GPS units every month
Service contract compliance reportC
Speed limit violation reportD
Stoppage reportE
Monitoring vehicle speedF
Kilometers reportG
Skipped stops reportH
Monitoring driving behaviorI
Monitoring parameters and benefitsK
Monitoring real-time trip progressJ

50
Monitoring of Service
Monitor timely departure from depot
Source: ppt of Dr K N Ingalgi, BMTC
In Urban Transport, the priority is given to punctual departure from the depot.
The table (left above) depicts the delay in some of the scheduled departure from the
depot.
The adjacent table (right) is a summary table that depicts the cause for delay.
2. Bus and Crew Scheduling
3. Management of Operations
4. Demand and Supply
5. Monitoring of Services
6. Revenue collection
1. Introduction
Parameters to be monitoredA
Monitor timely departure from depotB
Service contract compliance reportC
Speed limit violation reportD
Stoppage reportE
Monitoring vehicle speedF
Kilometers reportG
Skipped stops reportH
Monitoring driving behaviorI
Monitoring parameters and benefitsK
Monitoring real-time trip progressJ
7. Marketing and Branding

51
Monitoring of Service
Service contract compliance report
The above table illustrates the service performed by the vehicle in a day.
By this report, one can ensure the compliance in no. of trips performed against the allotted
route and deviation from route; punctuality; skipping of stops; total kms operated against
scheduled kms.
2. Bus and Crew Scheduling
3. Management of Operations
4. Demand and Supply
5. Monitoring of Services
6. Revenue collection
1. Introduction
Parameters to be monitoredA
Monitor timely departure from depotB
Service contract compliance reportC
Speed limit violation reportD
Stoppage reportE
Monitoring vehicle speedF
Kilometers reportG
Skipped stops reportH
Monitoring driving behaviorI
Monitoring parameters and benefitsK
Monitoring real-time trip progressJ
Trip wise report Summary report
Source: ppt of Dr K N Ingalgi, BMTC
7. Marketing and Branding

52
Monitoring of Service
Speed limit violation report
PMPML Report: Speed Limit Violation
Source: ppt of Dr K N Ingalgi, BMTCSource: PMPML
BMTC Report: Speed Limit Violation
Above information shows, frequency of speed limit violation in a given trip by a specific
bus.
2. Bus and Crew Scheduling
3. Management of Operations
4. Demand and Supply
5. Monitoring of Services
6. Revenue collection
1. Introduction
Parameters to be monitoredA
Monitor timely departure from depotB
Service contract compliance reportC
Speed limit violation reportD
Stoppage reportE
Monitoring vehicle speedF
Kilometers reportG
Skipped stops reportH
Monitoring driving behaviorI
Monitoring parameters and benefitsK
Monitoring real-time trip progressJ
7. Marketing and Branding

53
Monitoring of Service
Stoppage report
Source: ppt of Dr K N Ingalgi, BMTC
• The above report outlines the no. of stops taken by the bus in a trip and duration of halt.
• In case the time exceeds the stoppage time prescribed at a given bus stop; a report may
be initiated for inquiry.
2. Bus and Crew Scheduling
3. Management of Operations
4. Demand and Supply
5. Monitoring of Services
6. Revenue collection
1. Introduction
Parameters to be monitoredA
Monitor timely departure from depotB
Service contract compliance reportC
Speed limit violation reportD
Stoppage reportE
Monitoring vehicle speedF
Kilometers reportG
Skipped stops reportH
Monitoring driving behaviorI
Monitoring parameters and benefitsK
Monitoring real-time trip progressJ
7. Marketing and Branding

54
Monitoring of Service
Monitoring vehicle speed
Source: ppt of Dr K N Ingalgi, BMTC
As a part of safety initiatives, speed limit monitoring is done
2. Bus and Crew Scheduling
3. Management of Operations
4. Demand and Supply
5. Monitoring of Services
6. Revenue collection
1. Introduction
Parameters to be monitoredA
Monitor timely departure from depotB
Service contract compliance reportC
Speed limit violation reportD
Stoppage reportE
Monitoring vehicle speedF
Kilometers reportG
Skipped stops reportH
Monitoring driving behaviorI
Monitoring parameters and benefitsK
Monitoring real-time trip progressJ
7. Marketing and Branding

55
Monitoring of Service
Kilometers report
• The kilometers report, provides information on how many kilometers the vehicle has
performed against the number of planned kilometers.
• The report comprises of vehicle no., type of route – BRT/Non BRT, and the distance
covered on BRT section/route and non BRT section/routes separately.
Source: PMPML
2. Bus and Crew Scheduling
3. Management of Operations
4. Demand and Supply
5. Monitoring of Services
6. Revenue collection
1. Introduction
Parameters to be monitoredA
Monitor timely departure from depotB
Service contract compliance reportC
Speed limit violation reportD
Stoppage reportE
Monitoring vehicle speedF
Kilometers reportG
Skipped stops reportH
Monitoring driving behaviorI
Monitoring parameters and benefitsK
Monitoring real-time trip progressJ
7. Marketing and Branding

56
Monitoring of Service
Skipped stops report
The skipped stops report helps in quantifying the no of stages skipped by the driver. The
skipped stops report is generated vehicle wise and operator wise with detailed information
such as trip wise stops skipped.
This report plays a crucial role, especially in the GCC model, wherein the operator gets the
payment as per the kms performed and irrespective of how much revenue is received by the
transport authority. In such cases, they are prone to skip bus stops and try to make kms for
the day, thereby diluting the objective of providing public transport. Alternatively, drivers
tend to skip bus stops to cover up the operational delay caused due to traffic jams.
Source: PMPML
2. Bus and Crew Scheduling
3. Management of Operations
4. Demand and Supply
5. Monitoring of Services
6. Revenue collection
1. Introduction
Parameters to be monitoredA
Monitor timely departure from depotB
Service contract compliance reportC
Speed limit violation reportD
Stoppage reportE
Monitoring vehicle speedF
Kilometers reportG
Skipped stops reportH
Monitoring driving behaviorI
Monitoring parameters and benefitsK
Monitoring real-time trip progressJ
7. Marketing and Branding

57
Monitoring of Service
Monitoring driving behavior
2. Bus and Crew Scheduling
3. Management of Operations
4. Demand and Supply
5. Monitoring of Services
6. Revenue collection
1. Introduction
Parameters to be monitoredA
Monitor timely departure from depotB
Service contract compliance reportC
Speed limit violation reportD
Stoppage reportE
Monitoring vehicle speedF
Kilometers reportG
Skipped stops reportH
Monitoring driving behaviorI
Monitoring parameters and benefitsK
Monitoring real-time trip progressJ
Notes for Trainer: Monitoring of Service (Monitoring driving behavior)
ITS monitors the driving behavior, detects poor practice and/or violations, and subsequent enforcement – i.e.‘detect and deter’. The advantage is it1. provide universal detection of specific poor practice or violation of driving standards –
as shown above the ITS detects errors such as harsh braking, harsh acceleration, sharpcornering, etc (location wise & or type wise). Besides enforcement, this information aid inplanning measures for curb such behavior.
2. capture data in a cost-effective way in comparison to traditional practices, wherein workforce is deployed.3. generate reliable records for use in investigation and disciplinary processes4. generate records which can be utilized in court, both for enforcement processes and as protection against
spurious/fraudulent claims
7. Marketing and Branding

58
Monitoring of Service
Monitoring real-time trip progress
Source: PMPML
The diagram apprises about the current status of service, based on speed and other
parameters. Based on this report, the expected time of arrival & departure at stops can be
seen, and en-routes can be monitored.
2. Bus and Crew Scheduling
3. Management of Operations
4. Demand and Supply
5. Monitoring of Services
6. Revenue collection
1. Introduction
Parameters to be monitoredA
Monitor timely departure from depotB
Service contract compliance reportC
Speed limit violation reportD
Stoppage reportE
Monitoring vehicle speedF
Kilometers reportG
Skipped stops reportH
Monitoring driving behaviorI
Monitoring parameters and benefitsK
Monitoring real-time trip progressJ
7. Marketing and Branding
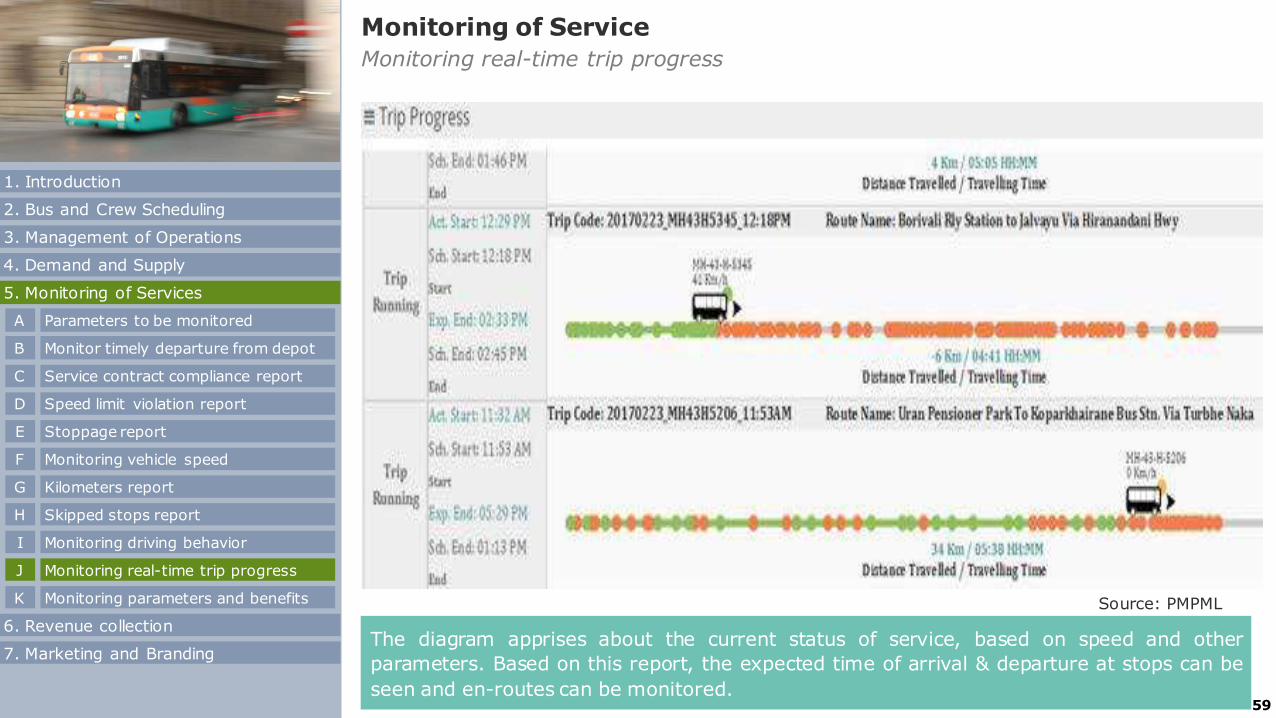
59
Monitoring of Service
Monitoring real-time trip progress
Source: PMPML
The diagram apprises about the current status of service, based on speed and other
parameters. Based on this report, the expected time of arrival & departure at stops can be
seen and en-routes can be monitored.
2. Bus and Crew Scheduling
3. Management of Operations
4. Demand and Supply
5. Monitoring of Services
6. Revenue collection
1. Introduction
Parameters to be monitoredA
Monitor timely departure from depotB
Service contract compliance reportC
Speed limit violation reportD
Stoppage reportE
Monitoring vehicle speedF
Kilometers reportG
Skipped stops reportH
Monitoring driving behaviorI
Monitoring parameters and benefitsK
Monitoring real-time trip progressJ
7. Marketing and Branding

60
Monitoring of Service
Parameters associated with monitoring along with their benefits
S. No Parameters Benefits Derived
1 Identification of vehicle location at any time of day:
Real-time tracking of the vehicle. (computation of
avg. speed and over speeding of bus
Helpful in detecting fake hit & run accident
cases. Quick detection of stolen/missing
vehicles
2 Rationalization of schedule timing and route length.
(Preparation of scientific form-IV based on VTS
report)
Rationalisation of schedules
3 Early and Late arrival and departure of vehicles
from depots and bus stations; non-completion and
cancellation of trips (kms); deviation of trips; idle
time; missing bus stops; over speeding
Actions may be taken against such crew
members
4 Operation of services in violation of scheduled
timings
Improved operational punctuality leading to
enhanced revenue realization
5 Avoidable trip curtailment Constant monitoring of vehicle movement
helps in the detection of missing trips. This
results in improved ridership
6 Unauthorized deviations from scheduled duty Monitoring curbs, unauthorized deviations
resorted by the crew. It also improves the
reliability of the service, which translates into
committed ridership and helps in achieving
higher revenue.
7 Cancellation of trips on flimsy grounds Reduction in cancellation of trips improves
ridership and helps in achieving higher
revenue.
2. Bus and Crew Scheduling
3. Management of Operations
4. Demand and Supply
5. Monitoring of Services
6. Revenue collection
1. Introduction
Parameters to be monitoredA
Monitor timely departure from depotB
Service contract compliance reportC
Speed limit violation reportD
Stoppage reportE
Monitoring vehicle speedF
Kilometers reportG
Skipped stops reportH
Monitoring driving behaviorI
Monitoring parameters and benefitsK
Monitoring real-time trip progressJ
7. Marketing and Branding

61
Monitoring of Service
Parameters associated with monitoring along with their benefits
S. No Parameters Benefits Derived
8 Additional kilometres operated Accurate computing of additional kilometres
if any operated.
9 Calculation of cancelled kilometres for bonafide and
non-bonafide reasons.
It provides the data for accurate computation
of cancelled kilometres. It is especially
beneficial in case the vehicles are operated
under PPP scheme for the preparation of
bills.
10 Accounting of loss of time in non-performance of
trips.
The data can act as the base for initiation
action against the crew for non-performing
trips.
11 Identification of idle time of the vehicle. Ensures proper utilization of vehicles for
operation through revision of time table.
12 Computation of average speed of the vehicle. The data can be the basis for drafting
accurate time tables. This depends on the
speeds achieved during different timings of a
day on different stretches of the route.
13 Non-stoppage of the buses at bus stops/skipping of
bus-stops.
Curbs the tendency of the crew to skip the
bus stops. This improves ridership, increases
the revenue, and brings down public
complaints.
14 Real-time tracking of the desired vehicle Aids in responding to emergencies like riots,
curfews, and strikes.
2. Bus and Crew Scheduling
3. Management of Operations
4. Demand and Supply
5. Monitoring of Services
6. Revenue collection
1. Introduction
Parameters to be monitoredA
Monitor timely departure from depotB
Service contract compliance reportC
Speed limit violation reportD
Stoppage reportE
Monitoring vehicle speedF
Kilometers reportG
Skipped stops reportH
Monitoring driving behaviorI
Monitoring parameters and benefitsK
Monitoring real-time trip progressJ
7. Marketing and Branding

62
Monitoring of Service
Points to Ponder
2. Bus and Crew Scheduling
3. Management of Operations
4. Demand and Supply
5. Monitoring of Services
6. Revenue collection
1. Introduction
Parameters to be monitoredA
Monitor timely departure from depotB
Service contract compliance reportC
Speed limit violation reportD
Stoppage reportE
Monitoring vehicle speedF
Kilometers reportG
Skipped stops reportH
Monitoring driving behaviorI
Monitoring parameters and benefitsK
Monitoring real-time trip progressJ
An efficient monitoring framework leads to improved performance, With this backdrop, this
unit addresses the following:
• What parameters could be monitored and
• What benefit is derived thereof?
• However an inclination is also required to see the issues of monitoring from practicality
perspective. It is recommended to prefer result-based monitoring rather than conventional
monitoring
7. Marketing and Branding

63
Revenue Collection
An overview
Revenue is classified into the following two categories:
Note: In the “operations module” the focus is on the type of fare structure &
insight into each. In the “bus operation module,” information on how to collect
the revenue and minimize the pilferages is covered. In “IT & MIS” module,
information on ticketing management system is covered in detail, mainly
concentrating on cashless transactions.
A. Traffic Revenue
Revenue realized from the
transportation of passengers &
associated incidental revenue
constitutes the traffic revenue. The
sources of traffic revenue includes:
B. Non-Traffic Revenue
Revenue from other sources not
directly related to transportation of
passengers, constitute the non-
traffic revenue. The sources
includes:
• Sale of passenger tickets, monthly
pass, advance booking, etc.
• Charges for luggage/parcel
• Reservation charges
• Casual contract service charges
• Advertisement revenue
• Rent from canteens, refreshment
rooms, stalls, parking, property
• Scale of scrap materials
• Interest on investment
2. Bus and Crew Scheduling
3. Management of Operations
4. Demand and Supply
5. Monitoring of Services
6. Revenue collection
7. Marketing and Branding
1. Introduction
An overviewA
Fare fixation and Fare tableB
Case study: KarnatakaC
Case study: DMRCD
Cash / Revenue handlingE
Types of fraudsF
Types of checksG
Case study: NEKRTC (Gulbarga)H
Link / Interlinkage with ITS & MISI

64
Revenue Collection
Fare fixation and Fare table
Fare Table for Illustration purpose
The State Government fixes the fares as per Section 67 of the
Motor Vehicles Act, 1988 having regard to:
1. Advantages offered to the public, trade and industry
through the development of motor transport
2. Coordinating road and rail transport
3. Preventing the deterioration of the road system, and
4. Preventing uneconomic competition among holders of
permits
Factors that affect fare fixation are as under:
Cost of Diesel
Personnel Cost
Capacity of bus and load
factor
Cost of other alternate
mode
2. Bus and Crew Scheduling
3. Management of Operations
4. Demand and Supply
5. Monitoring of Services
6. Revenue collection
7. Marketing and Branding
1. Introduction
An overviewA
Fare fixation and Fare tableB
Case study: KarnatakaC
Case study: DMRCD
Cash / Revenue handlingE
Types of fraudsF
Types of checksG
Case study: NEKRTC (Gulbarga)H
Link / Interlinkage with ITS & MISI

65
Revenue Collection
Case study: Karnataka
Increase in Diesel price from Rs. 35.91 paise per liter to Rs. 39.27 paise per liter.
Diesel Price adjustment fare F(DPA)=(F-D)+(RPD/BPD) XD
• F= CPKM/SCxLF=2091.5/(55x0.64)=59.41 fare per passenger km.
• D= CPKM(HSD)/SCxLF=845.3/(55x0.64)=24.01 paise per passenger km.
• Carrying Capacity=55
• Load Factor=64%
• CPKM=2091.5 paise per km (Data Based on figures of June 2006)
• Diesel Cost=845.3 paise per km
• BPD=Rs. 35.91 per liter
• RPD=Rs. 39.27 per liter
• F(DPA)-(59.41-24.01)+(3927.0/3591.0)x24.01=35.40+(1.09x24.01)
=35.40+26.17=61.57 paise/km
• F(DPA)=61.57 paise/passenger km
• Increase in Fares= F(DPA)-F=61.57-59.41=2.16 paise.
• Increase in Fare=2.16 paise per passenger km.
2. Bus and Crew Scheduling
3. Management of Operations
4. Demand and Supply
5. Monitoring of Services
6. Revenue collection
7. Marketing and Branding
1. Introduction
An overviewA
Fare fixation and Fare tableB
Case study: KarnatakaC
Case study: DMRCD
Cash / Revenue handlingE
Types of fraudsF
Types of checksG
Case study: NEKRTC (Gulbarga)H
Link / Interlinkage with ITS & MISI

66
Revenue Collection
Case study: Karnataka
Increase in Dearness Allowance Rate: F(R)=F+(CPKM(L)/CPKM)X P/100 X F
City Services (Present Fare per Passenger kms weighed average)=54.58
Revised:
= 54.58 + (702.9/2091.5) x (18.19/100)
= 54.58 + (0.34 x 0.18 x 54.58)
= 54.58+3.34
= 57.92
After adding fuel burden: 57.92 + 2.16 = 60.08
Increase in existing fare = 60.08-54.58=5.50 paise per km=10.07%
P is Compounded as follows:Burden due to release of DA instalments & DA merger with basic @ 320.00 lakhs/month.
Staff Cost for the month of June = 1758.96 lakhs
Increase in DA = 320.00 lakhs & merger of 71% DA with Basic (tentative)
P = 320.00 X 100 = 18.19%1758.96
CPKM (L) = 1758.96 = 702.9 PS/KM250.26
CPKM = 5671.71 = 2091.5 ps/per km271.18
2. Bus and Crew Scheduling
3. Management of Operations
4. Demand and Supply
5. Monitoring of Services
6. Revenue collection
7. Marketing and Branding
1. Introduction
An overviewA
Fare fixation and Fare tableB
Case study: KarnatakaC
Case study: DMRCD
Cash / Revenue handlingE
Types of fraudsF
Types of checksG
Case study: NEKRTC (Gulbarga)H
Link / Interlinkage with ITS & MISI

67
Revenue Collection
Case study: DMRC
Distance kms Fare Rs Distance kms Fare Rs
Old fare Revised fare 1st October, 2017
0 2 8 0 2 10
2 4 102 5 20
4 6 12
6 9 155 12 30
9 12 16
12 15 18
12 21 4015 18 19
18 21 21
21 24 22
21 32 5024 27 23
27 31 25
31 35 27 >32 60
35 39 28
39 44 29
>44 30
2. Bus and Crew Scheduling
3. Management of Operations
4. Demand and Supply
5. Monitoring of Services
6. Revenue collection
7. Marketing and Branding
1. Introduction
An overviewA
Fare fixation and Fare tableB
Case study: KarnatakaC
Case study: DMRCD
Cash / Revenue handlingE
Types of fraudsF
Types of checksG
Case study: NEKRTC (Gulbarga)H
Link / Interlinkage with ITS & MISI

68
Revenue Collection
Cash / Revenue handling
Cash handling is a part of cash management – In urban transport, approximately INR Rs 7-8
lakhs per day cash is received by the depot from collections by the crew en-route. Cash
handling issues are initiated from the cash section and precautionary pre-requisite are as
follows:
• Provision of locker, boxes, etc.
• Cash collection counter should be sturdy and protected
• The location for keeping collected cash shall be in an interior part of the depot with
entry allowed to authorized personnel only
• Security provision shall be in place
• Facility of currency counting cum verification machine
• Agency needs to be nominated for collection of cash & remittance in the bank every
day
• Promotion for cashless transaction
2. Bus and Crew Scheduling
3. Management of Operations
4. Demand and Supply
5. Monitoring of Services
6. Revenue collection
7. Marketing and Branding
1. Introduction
An overviewA
Fare fixation and Fare tableB
Case study: KarnatakaC
Case study: DMRCD
Cash / Revenue handlingE
Types of fraudsF
Types of checksG
Case study: NEKRTC (Gulbarga)H
Link / Interlinkage with ITS & MISI

69
Revenue Collection
Types of frauds occurring during revenue collection
AB
C
1
2
3
4
5
6
7
8
Collection of lesser fare and
(a) no issue of tickets
(b) issue of ticket corresponding to other fare stages
Parallel ticketing
Data manipulation
Not following the sequence in the issue of denomination tickets
By foot boarded passengers
Ticketless travel by passengers
Goods (perishable and non-perishable)
Over traveling by passengers
2. Bus and Crew Scheduling
3. Management of Operations
4. Demand and Supply
5. Monitoring of Services
6. Revenue collection
7. Marketing and Branding
1. Introduction
An overviewA
Fare fixation and Fare tableB
Case study: KarnatakaC
Case study: DMRCD
Cash / Revenue handlingE
Types of fraudsF
Types of checksG
Case study: NEKRTC (Gulbarga)H
Link / Interlinkage with ITS & MISI

70
Revenue Collection
Various types of checks
1 3 75 9
Specific Hour Check
Alighting Checks at heavy
boarding point
Combing Operation
Avoid Payment of Fare & Over travelling check
schedule time turnout of buses
from depot
Smart card checking
ETM checking
Ticket Block Checking
Jackpot Checking
2 4 6 8
2. Bus and Crew Scheduling
3. Management of Operations
4. Demand and Supply
5. Monitoring of Services
6. Revenue collection
7. Marketing and Branding
1. Introduction
An overviewA
Fare fixation and Fare tableB
Case study: KarnatakaC
Case study: DMRCD
Cash / Revenue handlingE
Types of fraudsF
Types of checksG
Case study: NEKRTC (Gulbarga)H
Link / Interlinkage with ITS & MISI

71
Revenue Collection
Various types of checks
1. Specific Hour Check
The errant conductors have the habit of collecting less money without issuing the ticket. Even the
drivers, in the early morning and late-night services, in order to sign off early, skip bus stops or drive
rashly without courtesy to other road users and awaiting passengers.
To curb such activities, it is essential to conducts specific hour checks, say at night twice a month
between 18:00 to 21:00 or 20:00 to 23:00. Under this, the squad conducts checks at junctions or
the bus stop. The report prepared is then sent to the higher authority for positive change.
2. Alighting Checks at dense boarding point
The check is performed to know whether the alighting passengers have a valid ticket/pass. The
frequency of such checks needs to be increased during fairs/festivals. Besides, such checks may also
be performed at bus stands wherein passengers alighting from all buses are to be checked.
3. Combing Operation
This operation is done for a given area where checking squads are deployed on all access points
through which the bus enters the area. All the buses entering and leaving the point will be checked.
4. Avoid Payment of Fare & Over traveling check
This type of check is done to control errant passengers who:
1) pay less, (i.e., up to one/two stages earlier of the alighting stage) and over travel
2) are habituated of traveling free of cost
2. Bus and Crew Scheduling
3. Management of Operations
4. Demand and Supply
5. Monitoring of Services
6. Revenue collection
7. Marketing and Branding
1. Introduction
An overviewA
Fare fixation and Fare tableB
Case study: KarnatakaC
Case study: DMRCD
Cash / Revenue handlingE
Types of fraudsF
Types of checksG
Case study: NEKRTC (Gulbarga)H
Link / Interlinkage with ITS & MISI

72
Revenue Collection
Various types of checks
5. Special checking to be done for schedule time turnout of buses from depot
Keep a track on vehicle arrival time & departure time at depot. If any delay is observed, then the
case is booked against either/both conductor/driver.
6. Smart card checking
Machines/readers are given to conductors and checkers. Since the incentive scheme is mostly
associated with the sale of card, it is highly essential to ensure that the checking is carried out on thefollowing lines:
• Validation and recharge of the card is verified
• Cross-checking the amount received against the no of trips performed by the traveler
• Amount received and sale of card verification
• Smart card no and ticket no is crossed checked
• Cross-checking of type of service for which the card is valid against the type of service in which
the passenger is traveling
• Verifying the type of pass i.e., route pass/general vs. the route on which the passenger istraveling.
7. ETM checking
Issue of tickets by conductors from the authorized ETM or any other authorized machine.
Cross-checking of reports in ETMs for that trip against the actual number of passengers traveling.
Difference in amount received vs. revenue released through the issue of tickets.
Check for punctuality, especially during the early arrivals. In cases of early arrivals, likely, passengers
are not collected, or the conductor has not issued tickets, or the driver and the conductor havedecided to skip the expected heavy boarding point's en-route.
2. Bus and Crew Scheduling
3. Management of Operations
4. Demand and Supply
5. Monitoring of Services
6. Revenue collection
7. Marketing and Branding
1. Introduction
An overviewA
Fare fixation and Fare tableB
Case study: KarnatakaC
Case study: DMRCD
Cash / Revenue handlingE
Types of fraudsF
Types of checksG
Case study: NEKRTC (Gulbarga)H
Link / Interlinkage with ITS & MISI

73
Revenue Collection
Various types of checks
8. Ticket Block Checking
At the depot, the blocks of various denomination tickets (with a serial number on each denomination
ticket) are given to the conductors to issue denomination tickets to the passengers further. However,some conductors have the habit of issuing the tickets in between and not in serial order. The
difference in ticket cash collected between the ticket which was serially issued last and which will beissued next, is the amount that they keep for personal use.
So the check is done to know whether the conductor has issued the tickets in serial order or not.
The above check is mostly done on-board, and also, some transport organizations carry out this kind
of check for suspected conductors at the depot while cash remittance.
Further, once in a month, 100% tray checking for all conductors is also done.
9. Jackpot Checking
Some transport operators send squads to a particular spot irrespective of route. In contrast, otheroperators send an adequate number of squads to all stages on a given route.
It is the squads' responsibility to check all the buses passing through the stage throughout the day
irrespective of the number of times it passes.
Since the complete route is to be checked; it involves massive workforce requirements, and for thispurpose, clerical and technical staff is taken from the depot or nearby units.
2. Bus and Crew Scheduling
3. Management of Operations
4. Demand and Supply
5. Monitoring of Services
6. Revenue collection
7. Marketing and Branding
1. Introduction
An overviewA
Fare fixation and Fare tableB
Case study: KarnatakaC
Case study: DMRCD
Cash / Revenue handlingE
Types of fraudsF
Types of checksG
Case study: NEKRTC (Gulbarga)H
Link / Interlinkage with ITS & MISI

74
Revenue Collection
Case study: NEKRTC city bus operation in Gulbarga
• In the city of Gulbarga, NEKRTC started city bus operation with 40 buses in October 2012
• By November 2013 they augmented the fleet to 78 buses
• Under JnNURM they got 100 buses totaling a fleet size of 178 buses in city bus operations.
Challenge
• Promote public transport as primary mode and discourage personalized vehicle
• Increase PT ridership
• Reduce emission level
• To move people rather than vehicles
Increasing city buses is not viable & loss making proposal?
2. Bus and Crew Scheduling
3. Management of Operations
4. Demand and Supply
5. Monitoring of Services
6. Revenue collection
7. Marketing and Branding
1. Introduction
An overviewA
Fare fixation and Fare tableB
Case study: KarnatakaC
Case study: DMRCD
Cash / Revenue handlingE
Types of fraudsF
Types of checksG
Case study: NEKRTC (Gulbarga)H
Link / Interlinkage with ITS & MISI

75
Revenue Collection
Case study: NEKRTC city bus operation in Gulbarga
Plan for sustainable transport approach 1
Wider area coverage 2Reduced waiting for commuters by providing bus service at
higher frequency 3
Keeping the bus stops within the reach of the people4
Use of ITS5
Branding6
Attractive fare7
Initiative taken
2. Bus and Crew Scheduling
3. Management of Operations
4. Demand and Supply
5. Monitoring of Services
6. Revenue collection
7. Marketing and Branding
1. Introduction
An overviewA
Fare fixation and Fare tableB
Case study: KarnatakaC
Case study: DMRCD
Cash / Revenue handlingE
Types of fraudsF
Types of checksG
Case study: NEKRTC (Gulbarga)H
Link / Interlinkage with ITS & MISI

76
Fare structure
The city bus base fare was reduced to Rs 3.00
and proportionally thereof to see the impact
The above fare was much lower than the base fare of
IPTs (i.e., Rs 5.0)
Year 2014-15
Wider area coverage
Bus stops within the reach
Solar powered light sensitive illumination
Brand name: Nrupatunga
Revenue Collection
Case study: NEKRTC city bus operation in Gulbarga
2. Bus and Crew Scheduling
3. Management of Operations
4. Demand and Supply
5. Monitoring of Services
6. Revenue collection
7. Marketing and Branding
1. Introduction
An overviewA
Fare fixation and Fare tableB
Case study: KarnatakaC
Case study: DMRCD
Cash / Revenue handlingE
Types of fraudsF
Types of checksG
Case study: NEKRTC (Gulbarga)H
Link / Interlinkage with ITS & MISI

77
Revenue Collection
Case study: NEKRTC city bus operation in Gulbarga
0
100
200
Before After
126160
VEHICLE UTILIZATION (in kms)
Before, 827
After, 1142
RIDERSHIP PER BUS (in No.)
0
1000
2000
3000
4000
5000
Before After
3195
4523
REVENUE PER BUS (in Rs.) 1. Revenue per bus per km
a) Before – 3195/126 = Rs 25.35
b) After - 4523/160 = Rs 28.26
Revenue per bus per km has increased
by Rs 3.
1. Ridership per bus has increased by 38%
2. With proper network planning, ensuring better
coverage, the vehicle utilization was
increased by 27%
2. Bus and Crew Scheduling
3. Management of Operations
4. Demand and Supply
5. Monitoring of Services
6. Revenue collection
7. Marketing and Branding
1. Introduction
An overviewA
Fare fixation and Fare tableB
Case study: KarnatakaC
Case study: DMRCD
Cash / Revenue handlingE
Types of fraudsF
Types of checksG
Case study: NEKRTC (Gulbarga)H
Link / Interlinkage with ITS & MISI

78
Revenue Collection
Case study: NEKRTC city bus operation in Gulbarga
2. Bus and Crew Scheduling
3. Management of Operations
4. Demand and Supply
5. Monitoring of Services
6. Revenue collection
7. Marketing and Branding
1. Introduction
An overviewA
Fare fixation and Fare tableB
Case study: KarnatakaC
Case study: DMRCD
Cash / Revenue handlingE
Types of fraudsF
Types of checksG
Case study: NEKRTC (Gulbarga)H
Link / Interlinkage with ITS & MISI
QUALITY OF SERVICES
Passenger Interview & Feedback
0-2 min16%
2-5 min47%
5-8 min8%
8-12 min14%
More than 12 min15%
0%
10%
20%
30%
40%
50%
60%
70%
80%74%
18%
4% 1… 1% 2%
1. 63% (47+16) commuter stated that the waiting times at bus stop was not more than 5min.
2. 74% commuters have rated the services as ‘very good’ and 18% as good.
Can we say now that
1. Increasing city buses is a viable & not a loss making proposal always
2. The objectives are achieved i.e., increase in ridership, reduction in waiting time, improved
quality of services.
WAITING TIME
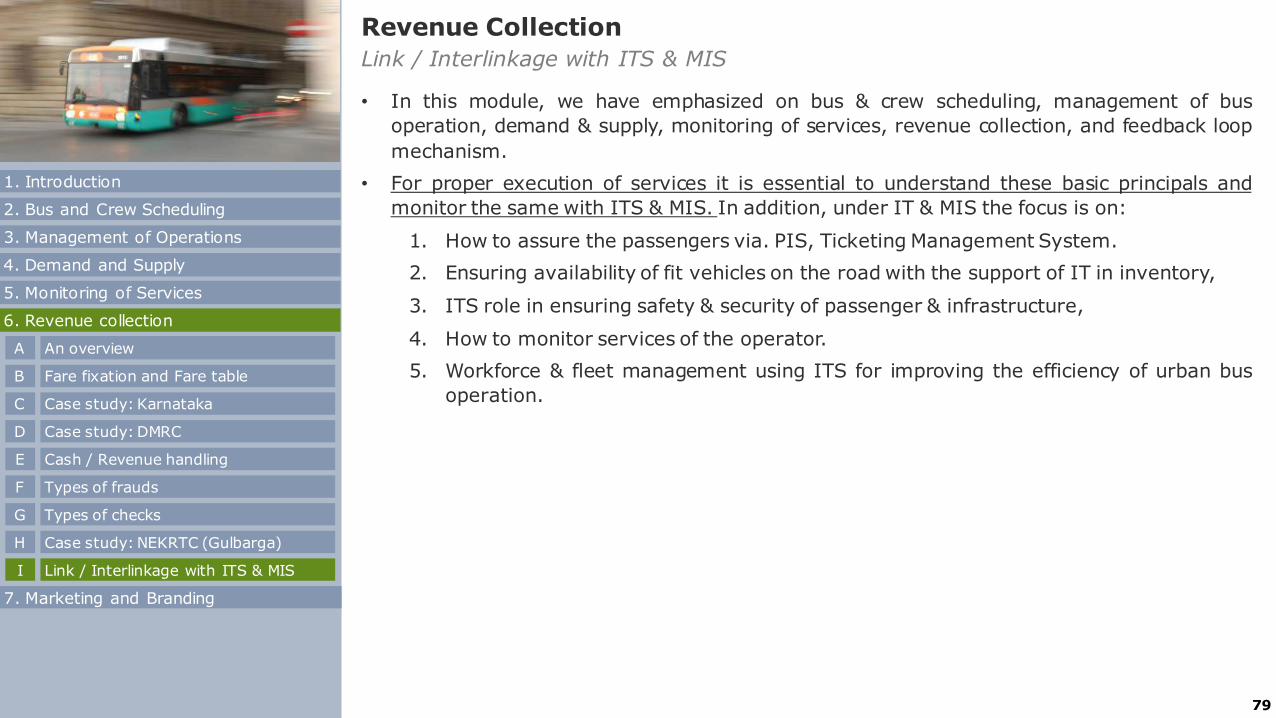
79
Link / Interlinkage with ITS & MIS
• In this module, we have emphasized on bus & crew scheduling, management of bus
operation, demand & supply, monitoring of services, revenue collection, and feedback loop
mechanism.
• For proper execution of services it is essential to understand these basic principals and
monitor the same with ITS & MIS. In addition, under IT & MIS the focus is on:
1. How to assure the passengers via. PIS, Ticketing Management System.
2. Ensuring availability of fit vehicles on the road with the support of IT in inventory,
3. ITS role in ensuring safety & security of passenger & infrastructure,
4. How to monitor services of the operator.
5. Workforce & fleet management using ITS for improving the efficiency of urban bus
operation.
Revenue Collection
2. Bus and Crew Scheduling
3. Management of Operations
4. Demand and Supply
5. Monitoring of Services
6. Revenue collection
7. Marketing and Branding
1. Introduction
An overviewA
Fare fixation and Fare tableB
Case study: KarnatakaC
Case study: DMRCD
Cash / Revenue handlingE
Types of fraudsF
Types of checksG
Case study: NEKRTC (Gulbarga)H
Link / Interlinkage with ITS & MISI
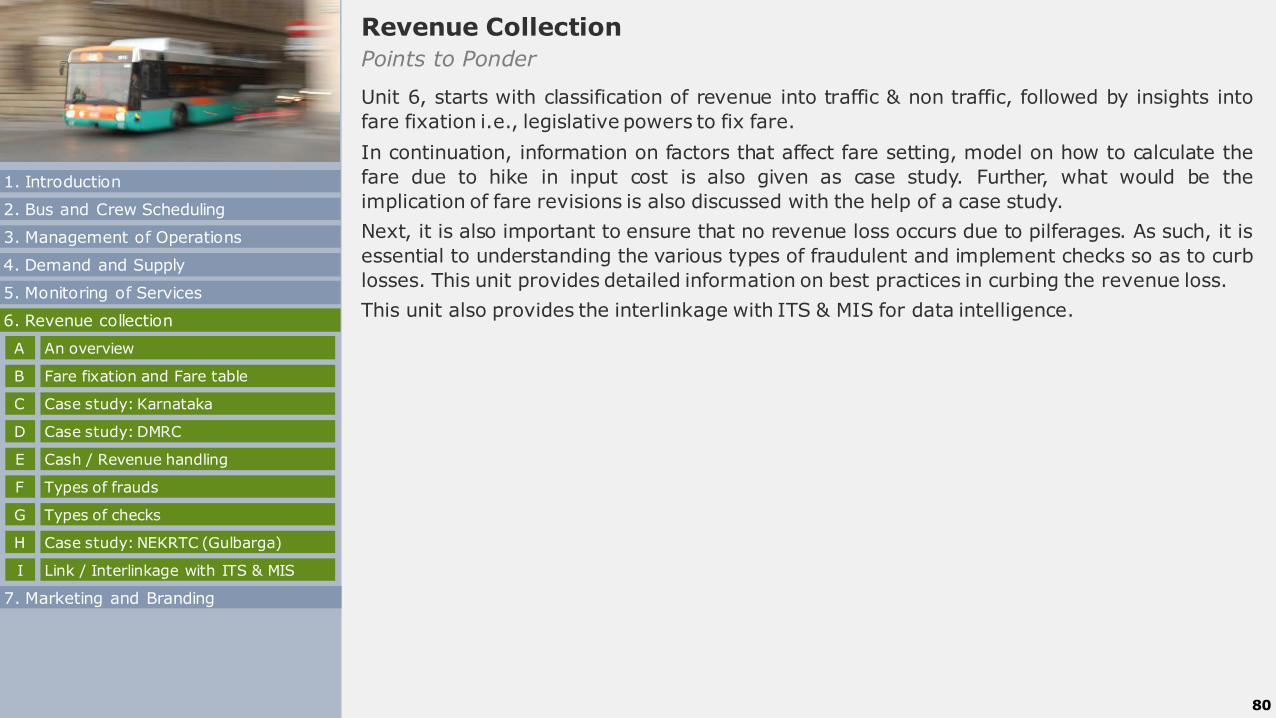
80
Revenue Collection
Points to Ponder
Unit 6, starts with classification of revenue into traffic & non traffic, followed by insights into
fare fixation i.e., legislative powers to fix fare.
In continuation, information on factors that affect fare setting, model on how to calculate the
fare due to hike in input cost is also given as case study. Further, what would be the
implication of fare revisions is also discussed with the help of a case study.
Next, it is also important to ensure that no revenue loss occurs due to pilferages. As such, it is
essential to understanding the various types of fraudulent and implement checks so as to curb
losses. This unit provides detailed information on best practices in curbing the revenue loss.
This unit also provides the interlinkage with ITS & MIS for data intelligence.
2. Bus and Crew Scheduling
3. Management of Operations
4. Demand and Supply
5. Monitoring of Services
6. Revenue collection
7. Marketing and Branding
1. Introduction
An overviewA
Fare fixation and Fare tableB
Case study: KarnatakaC
Case study: DMRCD
Cash / Revenue handlingE
Types of fraudsF
Types of checksG
Case study: NEKRTC (Gulbarga)H
Link / Interlinkage with ITS & MISI
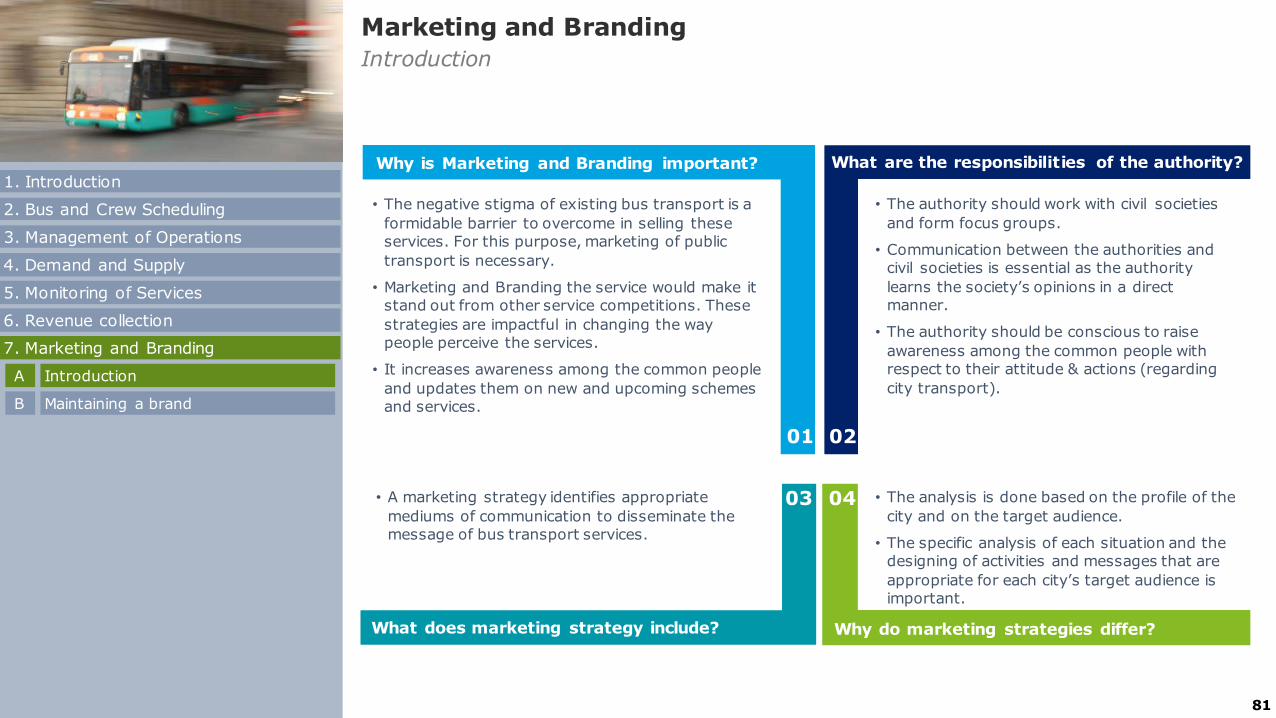
81
Marketing and Branding
Introduction
• The negative stigma of existing bus transport is a
formidable barrier to overcome in selling these services. For this purpose, marketing of public
transport is necessary.
• Marketing and Branding the service would make it stand out from other service competitions. These
strategies are impactful in changing the way people perceive the services.
• It increases awareness among the common people
and updates them on new and upcoming schemes and services.
• The analysis is done based on the profile of the
city and on the target audience.
• The specific analysis of each situation and the designing of activities and messages that are
appropriate for each city’s target audience is important.
• The authority should work with civil societies
and form focus groups.
• Communication between the authorities and civil societies is essential as the authority
learns the society’s opinions in a direct manner.
• The authority should be conscious to raise
awareness among the common people with respect to their attitude & actions (regarding
city transport).
• A marketing strategy identifies appropriate
mediums of communication to disseminate the
message of bus transport services.
Why is Marketing and Branding important?
What does marketing strategy include?
What are the responsibilities of the authority?
Why do marketing strategies differ?
01 02
03 04
2. Bus and Crew Scheduling
3. Management of Operations
4. Demand and Supply
5. Monitoring of Services
6. Revenue collection
1. Introduction
7. Marketing and Branding
IntroductionA
Maintaining a brandB

82
Marketing and Branding
Introduction: Approach for marketing and branding bus transport services
Stakeholder identification Stakeholder consultation Stakeholder strategy
Stakeholder Analysis
This is a technique by which an organization aiming to develop marketing & branding strategy identifies groups & organizations which are directly or indirectly related to its services. It consists of:
321
Branding Strategy
Branding the system with an identifiable name,logo, and slogan can make your service standout among other competitions. It has thepotential to generate new customers, getrecognition and increase business value.
Marketing Strategy
4321
Marketing is useful for educating the customerabout the service. It is useful for sustaining thepresence of a service. Marketing even acts as asource of revenue. It may act as a basis fordecision making.
2. Bus and Crew Scheduling
3. Management of Operations
4. Demand and Supply
5. Monitoring of Services
6. Revenue collection
1. Introduction
7. Marketing and Branding
IntroductionA
Maintaining a brandB

83
Marketing and Branding
Maintaining a brand: Overview
The responsibility of the middle manager is to maintain the brand of the Bus TransportOrganization. In order to achieve that objective, the middle manager needs to satisfy thedemand of the commuters. The demand of the commuters can be as follows:
Citizen Centric
Objectives
Environmental Demands
Social Demands
Adequacy
Regularity and Reliability
Comfort and Convenience
Affordability
Accessibility
7
6
54
3
2
1
By catering to these
demand we may ensure:
• A better quality of
services
• Higher customer
satisfaction
The above points ensure
that the brand built by
your senior manager is
maintained.
2. Bus and Crew Scheduling
3. Management of Operations
4. Demand and Supply
5. Monitoring of Services
6. Revenue collection
1. Introduction
7. Marketing and Branding
IntroductionA
Maintaining a brandB

84
Marketing and Branding
Maintaining a brand: Incorporate stakeholder inputs
Action
• AICTSL conducted three days of focus group sessions in which various community groups participated.
• These sessions were two-way communicative sessions that entailed informational presentations, rides on
iBus and question-answer sessions with the team members.
Impact
• These intensive sessions reached out to ~850 people. (including students, professionals, communities)
• They allowed the opportunity to further educate and correct misconceptions among the public.
• The residents had the opportunity to experience the BRTS first-hand and understand how it functions and
benefits their community.
• Comments and suggestions that were received became an excellent learning opportunity for the team.
• The press reported on the positive interactions at these sessions, bringing good visibility to the project.
The inputs from stakeholder ensured that the commuters feel their demands are heard and met. Furthermore, the
action points based on the specific demands ensured that the brand is maintained.
2. Bus and Crew Scheduling
3. Management of Operations
4. Demand and Supply
5. Monitoring of Services
6. Revenue collection
1. Introduction
7. Marketing and Branding
IntroductionA
Maintaining a brandB

85
Marketing and Branding
Maintaining a brand: Social media tools
Social media and online marketing are excellent channels for providing updates, connecting with customers, and letting them know the services offered. Social media marketing ensures that the commuters are updated with Authority’s decision.
• It connects the authority directly with consumers by sharingupdates, sales, contests, new services, and more!
• Monitor reviews and comments on different platforms. Respondto questions, compliments, and complaints quickly andprofessionally.
• Unlike web pages that feature static content, social media isupdated frequently.
• Host online contests, offer special discount codes exclusivelyfor social media followers, have customers submit photos, usehashtags, and tag bus services on social media platforms.
• Creative and distinctive content receives the most attentiononline.
• It’s better to do great marketing on 1 or 2 channels than to do it poorly across 5 channels.
• When choosing a platform, consider the platform target customers are on and the objective of the agency
• Each platform has an algorithm that determines who sees posts. Be wary of post frequency, number of likes, and text length to optimize social media impact.
How does it help? What should be considered?
✓ An organization should create multiple channels (Facebook, Twitter, Instagram, etc..) in order to post the updates of the services.
✓ The point of contact for social media marketing should post the same content on all the pages at almost the same time.
Key considerations
Social media marketing channels
2. Bus and Crew Scheduling
3. Management of Operations
4. Demand and Supply
5. Monitoring of Services
6. Revenue collection
1. Introduction
7. Marketing and Branding
IntroductionA
Maintaining a brandB

86
Revenue Collection
Points to Ponder
Unit 7 provides an overview on Marketing and Branding of bus operations
The middle manager of a bus transport organization is responsible for maintaining the brand.
In order to maintain the brand it is essential to satisfy the demand of the customers and
provide good quality service to the commuters.
2. Bus and Crew Scheduling
3. Management of Operations
4. Demand and Supply
5. Monitoring of Services
6. Revenue collection
1. Introduction
7. Marketing and Branding
IntroductionA
Maintaining a brandB

87
Thank You !
Time for Discussion

88
Reference table
A. 8-9 A. 8
Delivery PPTParticipant
Manual
A. 10-11
B. 12
C. 13
D. 14-15
E. 16-21
F. 22-23
G. 24
A. 9
B. 10
C. 11-12
D. 13-14
E. 15-18
F. 19-20
G. 21-22
A. 25-26
B. 27
C. 28-29
D. 30-32
E. 33
F. 34-35
G. 36-38
H. 39
I. 40
J. 41-42
K. 43
A. 23
B. 24-25
C. 26-27
D. 28-30
E. 31
F. 32-33
G. 34-36
H. 37-38
I. 39
J. 40-41
K. 42-43
Introduction A. Terminology in bus operations1
Bus and Crew
Scheduling
A. Factors affecting bus scheduling
B. Factors affecting crew scheduling
C. Process for crew scheduling
D. Optimizing utilization of staff and fleet
E. Case study: BEST Mumbai
F. Case study: KSRTC Mysore City
G. Fleet allocation to bus depots
2
Management of
Operations
A. An overview
B. Challenges in AVM implementation
C. Managing dispatch
D. Monitoring route service
E. Ensuring schedule adherence
F. Case study: KSRTC Mysore
G. Ensuring standard driving compliance
H. Incident Management
I. Legislative provision related to driving and incidents
J. Adjusting schedules dynamically
K. Ensuring service contract compliance
3

89
Reference table
A. 44-45
B. 46
C. 47
D. 48-49
A. 44
B. 45
C. 46
D. 47-48
Delivery PPTParticipant
Manual
A. 50
B. 51
C. 52
D. 53
E. 54
F. 55
G. 56
H. 57
I. 58
J. 59-61
K. 62
A. 49
B. 50
C. 51
D. 52
E. 53
F. 54
G. 55
H. 56
I. 57
J. 58-59
K. 60-62
Demand and
Supply
A. Passenger demand
B. Sources of passenger demand
C. Route wise demand fluctuation
D. Critical parameters for supply of services
4
Monitoring of
Service
A. Parameters to be monitored
B. Monitor timely departure from depot
C. Service contract compliance report
D. Speed limit violation report
E. Stoppage report
F. Monitoring vehicle speed
G. Kilometers report
H. Skipped stops report
I. Monitoring driving behavior
J. Monitoring real-time trip progress
K. Parameters associated with monitoring, along with
benefits
5

90
Reference table
A. -
B. -
C. -
D. -
E. 63-64
F. 65
G. 66
H. 67-71
I. 72
A. 63
B. 64
C. 65-66
D. 67
E. 68
F. 69
G. 70-73
H. 74-78
I. 79-80
Delivery PPTParticipant
Manual
A. 73-74
B. 75-77
A. 81-82
B. 83-86
Revenue
Collection
A. An overview
B. Fare fixation and Fare table
C. Case study: Karnataka
D. Case study: DMRC
E. Cash / Revenue handling
F. Types of frauds occurring during revenue collection
G. Various types of checks
H. Case study: NEKRTC city bus operation in Gulbarga
I. Link / Interlinkage with ITS and MIS
6
Marketing and
Branding
A. Introduction
B. Maintaining a brand7

91
Bibliography
1. SSATP ITS Toolkit. https://www.ssatp.org/sites/ssatp/files/publications/Toolkits/ITS%20Toolkit%20content/its-
applications/operations-management.html, Accessed in April 2019
2. Incident Management Plan, Department of Transport and Main Roads, Government of Queensland
3. BRT Planning Guide, ITDP, Viva, UNEP, GTZ, GEF, 2007
4. Robert Pressl, Claus Kollinger, Transport Learning, 2012, “Design and implementation of sustainable mobility campaigns”
5. Presentation of Dr. K N Ingalagi, BMTC, Management of Operations
6. Presentation of Shri Y Srinivasa Rao, Senior Manager, IT, APSRTC
7. Presentation of CMD, PMPML and snap shots received from PMPML
8. Integrated Intelligent Transport System (IITS), presentation by Commissioner, NMMC
9. https://www.fulcrumapp.com/blog/feedback-loops/, Accessed in April 2019
10. https://www.albert.io/blog/positive-negative-feedback-loops-biology/, Accessed in April 2019

P resentation title[To edit, c lick View > Slide Master > Slide Master]
©2019 Deloitte Shared Services India LLP 1
Pre-Training Questionnaire
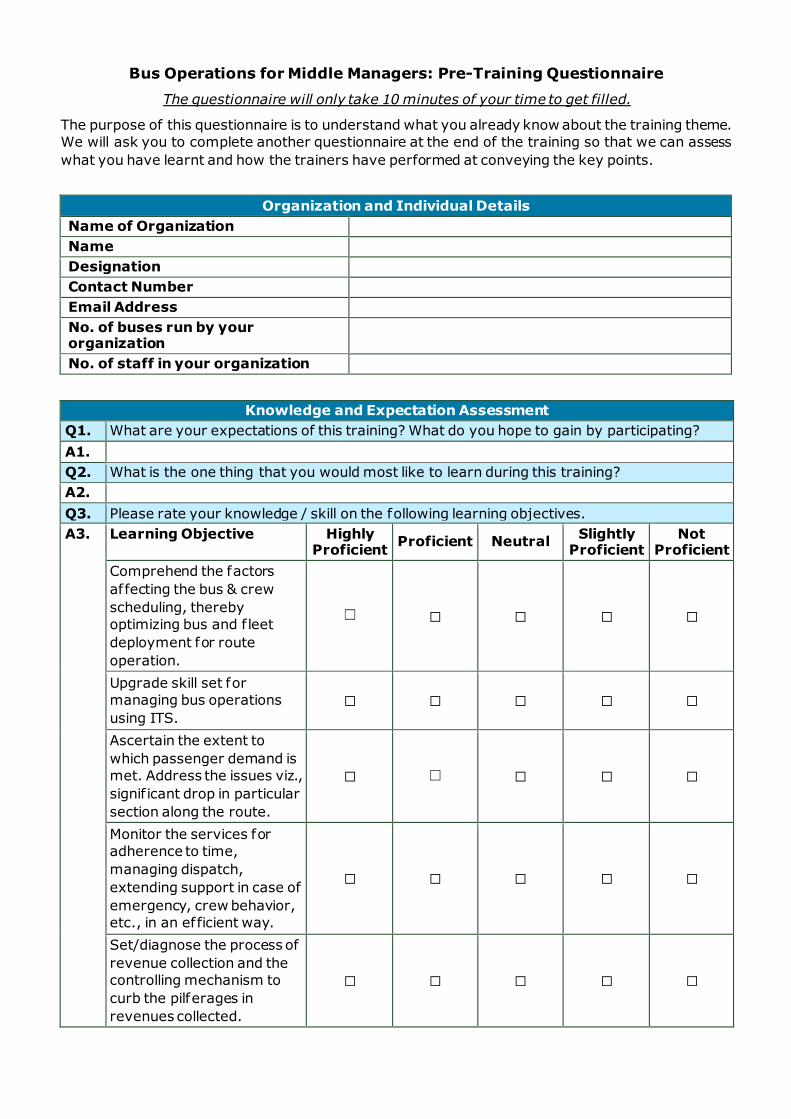
Bus Operations for Middle Managers: Pre-Training Questionnaire
The questionnaire will only take 10 minutes of your time to get filled.
The purpose of this questionnaire is to understand what you already know about the training theme.
We will ask you to complete another questionnaire at the end of the training so that we can assess
what you have learnt and how the trainers have performed at conveying the key points.
Organization and Individual Details
Name of Organization
Name
Designation
Contact Number
Email Address
No. of buses run by your organization
No. of staff in your organization
Knowledge and Expectation Assessment
Q1. What are your expectations of this training? What do you hope to gain by participating?
A1.
Q2. What is the one thing that you would most like to learn during this training?
A2.
Q3. Please rate your knowledge / skill on the following learning objectives.
A3. Learning Objective Highly Proficient
Proficient Neutral Slightly
Proficient Not
Proficient
Comprehend the factors
affecting the bus & crew
scheduling, thereby
optimizing bus and f leet
deployment for route
operation.
☐ ☐ ☐ ☐ ☐
Upgrade skill set for
managing bus operations
using ITS.
☐ ☐ ☐ ☐ ☐
Ascertain the extent to
which passenger demand is
met. Address the issues viz.,
signif icant drop in particular
section along the route.
☐ ☐ ☐ ☐ ☐
Monitor the services for
adherence to time,
managing dispatch,
extending support in case of
emergency, crew behavior,
etc., in an efficient way.
☐ ☐ ☐ ☐ ☐
Set/diagnose the process of
revenue collection and the
controlling mechanism to
curb the pilferages in
revenues collected.
☐ ☐ ☐ ☐ ☐

Knowledge and Expectation Assessment
Design and formulate
branding and marketing
strategy for outreach.
☐ ☐ ☐ ☐ ☐
Applying lessons learned
from various cities. ☐ ☐ ☐ ☐ ☐
Ensuring that the brand is
maintained. ☐ ☐ ☐ ☐ ☐
Q4. Kindly provide any additional comments for this training.
A4.

P resentation title[To edit, c lick View > Slide Master > Slide Master]
©2019 Deloitte Shared Services India LLP 1
Post-Training Questionnaire

Bus Operations for Middle Managers: Post-Training Questionnaire
The questionnaire will only take 10 minutes of your time to get filled.
The purpose of this questionnaire is to assess the capacity building, assess the trainer, training
material and the training programme. Kindly f ill this questionnaire with respect to your experience
from the training session.
Organization and Individual Details
Name of Organization
Name
Designation
Contact Number
Email Address
No. of buses run by your organization
No. of staff in your organization
Assessment of the Training Session
Q1. Please rate your knowledge / skill on the following learning objectives.
A1. Learning Objective Highly Proficient
Proficient Neutral Slightly
Proficient Not
Proficient
Comprehend the factors
affecting the bus & crew
scheduling, thereby optimizing
bus and f leet deployment for
route operation.
☐ ☐ ☐ ☐ ☐
Upgrade skill set for managing
bus operations using ITS. ☐ ☐ ☐ ☐ ☐
Ascertain the extent to which
passenger demand is met.
Address the issues viz.,
signif icant drop in particular
section along the route.
☐ ☐ ☐ ☐ ☐
Monitor the services for
adherence to time, managing
dispatch, extending support in
case of emergency, crew
behavior, etc., in an efficient
way.
☐ ☐ ☐ ☐ ☐
Set/diagnose the process of
revenue collection and the
controlling mechanism to curb
the pilferages in revenues
collected.
☐ ☐ ☐ ☐ ☐
Design and formulate branding
and marketing strategy for
outreach.
☐ ☐ ☐ ☐ ☐
Applying lessons learned from
various cities. ☐ ☐ ☐ ☐ ☐
Ensuring that the brand is
maintained. ☐ ☐ ☐ ☐ ☐

Assessment of the Training Session
Q2. Please rate the training material on the following parameters.
A2. Parameter Very High High Neutral Low Very Low
Extent of coverage ☐ ☐ ☐ ☐ ☐
Relevance of contents ☐ ☐ ☐ ☐ ☐
Practical applicability of case studies ☐ ☐ ☐ ☐ ☐
Easy to understand ☐ ☐ ☐ ☐ ☐
Usefulness of reference material ☐ ☐ ☐ ☐ ☐
Q3. Was the trainer able to achieve the stated learning objectives of the session?
A3. ☐ Yes ☐ No Reasons ________________________________________
Q4. Please rate the trainer on the following parameters.
A4. Parameter Very High High Neutral Low Very Low
Knowledge of the subject ☐ ☐ ☐ ☐ ☐
Communication skills ☐ ☐ ☐ ☐ ☐
Organized and structured approach
☐ ☐ ☐ ☐ ☐
Interactive and engaging ☐ ☐ ☐ ☐ ☐
Q5. Do you think your knowledge / skill / ability on the subject has improved after attending the training session?
A5. ☐ Very High ☐ High ☐ Neutral ☐ Low
☐ Very Low Reasons ________________________________________
Q6. What are your top 3 takeaways from the training you attended today?
A6. 1.
2.
3.
Q7. Please rate the training session on the timing and duration of each module.
A7. ☐ Very Effective ☐ Effective ☐ Neutral ☐ Slightly Effective
☐ Deficient Reasons ________________________________________
Q8. What is your preference of location for this training session?
A8.
Q9. What should be the duration of this training session?
A9. ☐ 0.5 days ☐ 1 days ☐ 1.5 days ☐ 2 or more days
Q10. What should be the frequency of this training session at your level?
A10. ☐ Quarterly ☐ Semi-annually ☐ Annually ☐ Every 2 years
Q11. Kindly provide any areas in which the training requires improvement / Other additional comments
A11.

P resentation title[To edit, c lick View > Slide Master > Slide Master]
©2019 Deloitte Shared Services India LLP 1
Group Activity

Bus Operations for Middle Managers – Group ActivityBus Operations for Middle Managers – Group Activity
Part A – Ice Breaker Question
Part B – Group Exercise
Part C – Case Study
From your perspective, which city is managing the bus operations effectively and Why to do you feel so?
Substantiate with observation / learnings.
In bus operation, what are the challenges that are often encountered? What are some of the possible solution to those
challenges?
Substantiate with observation / experience.
Challenges
Problem Statement: The Scandas city administration, has decided to implement outreach programme for
increasing the ridership, make the people aware of public transport operation. Since your group are the key members
of the administration, so you carry out brainstorming discussions and suggest activities /ways that can be opted as a
part of outreach programme. Try to think creatively and give implementable suggestion. You may refer to the
participant’s notes for details if required.
Solutions
You are required to form a group of 3-5 participants in order to complete this activity. Time required for completion is 40 minutes. Furthermore, 15 minutes would be given to each group to present their outcome.