Loss of D 3 receptors in the zitter mutant rat is not reversed by l-dopa treatment
On the cover:
Long‐term consequences of undernutrition on metabolism.
On pp. 312–319 of this issue, Hardikar et al. use a rat model of undernutrition over 50
generations (a 12‐year‐long experiment), which closely mimics human populations in
developing countries, to study how environmental impacts can be transmitted across
generations. Undernourished rats are more susceptible to obesity and diabetes, and these
metabolic abnormalities, associated with epigenetic changes, are not reversed following
unrestricted access to normal chow in two subsequent generations. The cover image depicts
the concept of intergenerational inheritance and its association with histone modifications
at key metabolic genes.
Short Article
Multigenerational Undernu
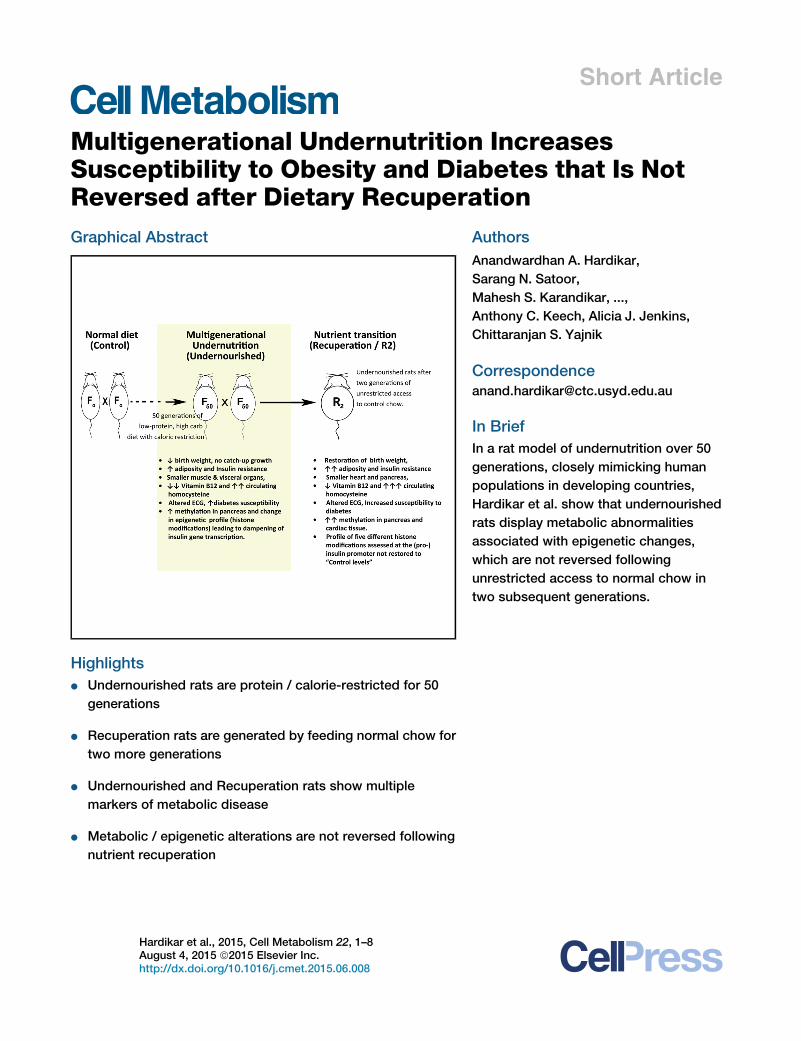
trition IncreasesSusceptibility to Obesity and Diabetes that Is NotReversed after Dietary RecuperationGraphical Abstract
Highlights
d Undernourished rats are protein / calorie-restricted for 50
generations
d Recuperation rats are generated by feeding normal chow for
two more generations
d Undernourished and Recuperation rats show multiple
markers of metabolic disease
d Metabolic / epigenetic alterations are not reversed following
nutrient recuperation
Hardikar et al., 2015, Cell Metabolism 22, 1–8August 4, 2015 ª2015 Elsevier Inc.http://dx.doi.org/10.1016/j.cmet.2015.06.008
Authors
Anandwardhan A. Hardikar,
Sarang N. Satoor,
Mahesh S. Karandikar, ...,
Anthony C. Keech, Alicia J. Jenkins,
Chittaranjan S. Yajnik
In Brief
In a rat model of undernutrition over 50
generations, closely mimicking human
populations in developing countries,
Hardikar et al. show that undernourished
rats display metabolic abnormalities
associated with epigenetic changes,
which are not reversed following
unrestricted access to normal chow in
two subsequent generations.
Please cite this article in press as: Hardikar et al., Multigenerational Undernutrition Increases Susceptibility to Obesity and Diabetes that Is NotReversed after Dietary Recuperation, Cell Metabolism (2015), http://dx.doi.org/10.1016/j.cmet.2015.06.008
Cell Metabolism
Short Article
Multigenerational Undernutrition IncreasesSusceptibility to Obesity and Diabetes that IsNot Reversed after Dietary RecuperationAnandwardhan A. Hardikar,1,11,* Sarang N. Satoor,1,2,11 Mahesh S. Karandikar,3,4,11 Mugdha V. Joglekar,1,11
Amrutesh S. Puranik,2,12 Wilson Wong,1 Sandeep Kumar,2 Amita Limaye,2,5 Dattatray S. Bhat,6 Andrzej S. Januszewski,1
Malati R. Umrani,2 Amaresh K. Ranjan,7 Kishori Apte,8 Pranav Yajnik,9 Ramesh R. Bhonde,2,10 Sanjeev Galande,5
Anthony C. Keech,1 Alicia J. Jenkins,1 and Chittaranjan S. Yajnik61NHMRC Clinical Trials Centre, University of Sydney, Sydney, NSW 2050, Australia2National Center for Cell Science, Ganeshkhind Road, Pune 411007, India3Department of Physiology, DY Patil Medical College, DPU, Pimpri, Pune 411018, India4Department of Physiology, BJ Medical College, Pune 411011, India5Indian Institute of Science Education and Research (IISER), Dr Homi Bhabha Road, Pashan, Pune 411008, India6Diabetes Unit, KEM Hospital, Rasta Peth, Pune 411011, India7Cardiovascular Institute, Mount Sinai School of Medicine, New York, NY 10029, USA8National Toxicology Center, 36/1/1 MN199, Vadgaon Khurd, Singhgad Road, Pune 411041, India9Department of Biostatistics, University of Michigan, Ann Arbor, Michigan 48109, USA10Manipal Institute of Regenerative Medicine, Manipal University, Bangalore, India11Co-first author12Present address: Robert & Arlene Kogod Center on Aging, Mayo Clinic, Rochester, MN 55905, USA*Correspondence: [email protected]
http://dx.doi.org/10.1016/j.cmet.2015.06.008
SUMMARY
People in developing countries have faced multigen-erational undernutrition and are currently undergoingmajor lifestyle changes, contributing to an epidemicof metabolic diseases, though the underlying mech-anisms remain unclear. Using a Wistar rat model ofundernutrition over 50 generations, we show thatUndernourished rats exhibit low birth-weight, highvisceral adiposity (DXA/MRI), and insulin resistance(hyperinsulinemic-euglycemic clamps), comparedto age-/gender-matched control rats. Undernour-ished rats also have higher circulating insulin, homo-cysteine, endotoxin and leptin levels, lower adipo-nectin, vitamin B12 and folate levels, and an 8-foldincreased susceptibility to Streptozotocin-induceddiabetes compared to control rats. Importantly,these metabolic abnormalities are not reversed aftertwo generations of unrestricted access to commer-cial chow (nutrient recuperation). Altered epigeneticsignatures in insulin-2 gene promoter region ofUndernourished rats are not reversed by nutrientrecuperation, and may contribute to the persistentdetrimental metabolic profiles in similar multigenera-tional undernourished human populations.
INTRODUCTION
The burden of type 2 diabetes mellitus (T2D) is increasing world-
wide, particularly in developing countries, where >70% of the
global burden of T2D is predicted to exist by 2030 (Echouffo-
Tcheugui and Dagogo-Jack, 2012). Although reasons for the
increasing rates of T2D in developing countries are not fully eluci-
dated, important factors include lifestyle changes involving rural-
to-urban migration (‘‘urbanization’’), intra-uterine undernutrition,
and fetal programming.
During the past two decades, increasing evidence arising from
multiple clinical studies conducted by the research teams of
Yajnik and Barker support an important role of early life undernu-
trition, and specifically disturbances of one-carbon metabolism,
in the heightened susceptibility of (Asian) Indians to T2D at a
younger age, and in the absence of generalized obesity (Yajnik
et al., 1995, 2003, 2014; Yajnik and Deshmukh, 2012). These
studies have highlighted body composition and nutritional-meta-
bolic peculiarities of multigenerationally undernourished Indians:
a thin-fat (low lean mass, high fat mass) phenotype compared to
Europeans, with predominant visceral deposition of fat. This
body composition is strongly associated with insulin resistance
and related metabolic-endocrine abnormalities. Importantly,
this ‘‘thin-fat’’ phenotype was present at birth and, therefore,
programmed during intrauterine life, possibly through epigenetic
mechanisms over multiple generations. Maternal intergenera-
tional undernutrition, evident in stunting, low BMI, and a distur-
bance of dietary methyl donors (low protein and vitamin B12
and high folate status, related to vegetarian diets) appear
contributory to the increased risk of diabetes and CVD in Indians
(Yajnik, 2004; Yajnik and Deshmukh, 2012; Yajnik et al., 2003,
2008).
It is now well appreciated that the intra-uterine environment
can induce heritable alterations that may be retained over gener-
ations (Aiken and Ozanne, 2014; Goodspeed et al., 2015; Ng
et al., 2010). In non-human primates, a maternal high-fat diet
supplemented with calorically dense treats leading to obesity
Cell Metabolism 22, 1–8, August 4, 2015 ª2015 Elsevier Inc. 1
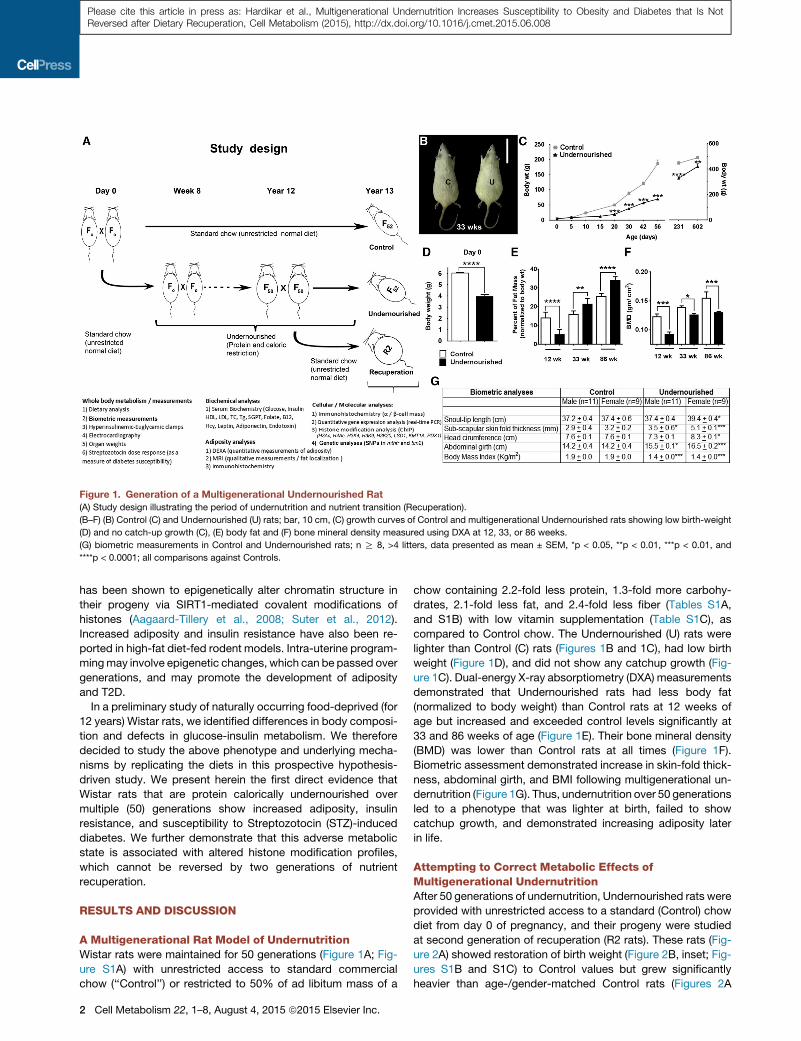
Figure 1. Generation of a Multigenerational Undernourished Rat
(A) Study design illustrating the period of undernutrition and nutrient transition (Recuperation).
(B–F) (B) Control (C) and Undernourished (U) rats; bar, 10 cm, (C) growth curves of Control and multigenerational Undernourished rats showing low birth-weight
(D) and no catch-up growth (C), (E) body fat and (F) bone mineral density measured using DXA at 12, 33, or 86 weeks.
(G) biometric measurements in Control and Undernourished rats; n R 8, >4 litters, data presented as mean ± SEM, *p < 0.05, **p < 0.01, ***p < 0.01, and
****p < 0.0001; all comparisons against Controls.
Please cite this article in press as: Hardikar et al., Multigenerational Undernutrition Increases Susceptibility to Obesity and Diabetes that Is NotReversed after Dietary Recuperation, Cell Metabolism (2015), http://dx.doi.org/10.1016/j.cmet.2015.06.008
has been shown to epigenetically alter chromatin structure in
their progeny via SIRT1-mediated covalent modifications of
histones (Aagaard-Tillery et al., 2008; Suter et al., 2012).
Increased adiposity and insulin resistance have also been re-
ported in high-fat diet-fed rodent models. Intra-uterine program-
mingmay involve epigenetic changes, which can be passed over
generations, and may promote the development of adiposity
and T2D.
In a preliminary study of naturally occurring food-deprived (for
12 years) Wistar rats, we identified differences in body composi-
tion and defects in glucose-insulin metabolism. We therefore
decided to study the above phenotype and underlying mecha-
nisms by replicating the diets in this prospective hypothesis-
driven study. We present herein the first direct evidence that
Wistar rats that are protein calorically undernourished over
multiple (50) generations show increased adiposity, insulin
resistance, and susceptibility to Streptozotocin (STZ)-induced
diabetes. We further demonstrate that this adverse metabolic
state is associated with altered histone modification profiles,
which cannot be reversed by two generations of nutrient
recuperation.
RESULTS AND DISCUSSION
A Multigenerational Rat Model of UndernutritionWistar rats were maintained for 50 generations (Figure 1A; Fig-
ure S1A) with unrestricted access to standard commercial
chow (‘‘Control’’) or restricted to 50% of ad libitum mass of a
2 Cell Metabolism 22, 1–8, August 4, 2015 ª2015 Elsevier Inc.
chow containing 2.2-fold less protein, 1.3-fold more carbohy-
drates, 2.1-fold less fat, and 2.4-fold less fiber (Tables S1A,
and S1B) with low vitamin supplementation (Table S1C), as
compared to Control chow. The Undernourished (U) rats were
lighter than Control (C) rats (Figures 1B and 1C), had low birth
weight (Figure 1D), and did not show any catchup growth (Fig-
ure 1C). Dual-energy X-ray absorptiometry (DXA) measurements
demonstrated that Undernourished rats had less body fat
(normalized to body weight) than Control rats at 12 weeks of
age but increased and exceeded control levels significantly at
33 and 86 weeks of age (Figure 1E). Their bone mineral density
(BMD) was lower than Control rats at all times (Figure 1F).
Biometric assessment demonstrated increase in skin-fold thick-
ness, abdominal girth, and BMI following multigenerational un-
dernutrition (Figure 1G). Thus, undernutrition over 50 generations
led to a phenotype that was lighter at birth, failed to show
catchup growth, and demonstrated increasing adiposity later
in life.
Attempting to Correct Metabolic Effects ofMultigenerational UndernutritionAfter 50 generations of undernutrition, Undernourished rats were
provided with unrestricted access to a standard (Control) chow
diet from day 0 of pregnancy, and their progeny were studied
at second generation of recuperation (R2 rats). These rats (Fig-
ure 2A) showed restoration of birth weight (Figure 2B, inset; Fig-
ures S1B and S1C) to Control values but grew significantly
heavier than age-/gender-matched Control rats (Figures 2A
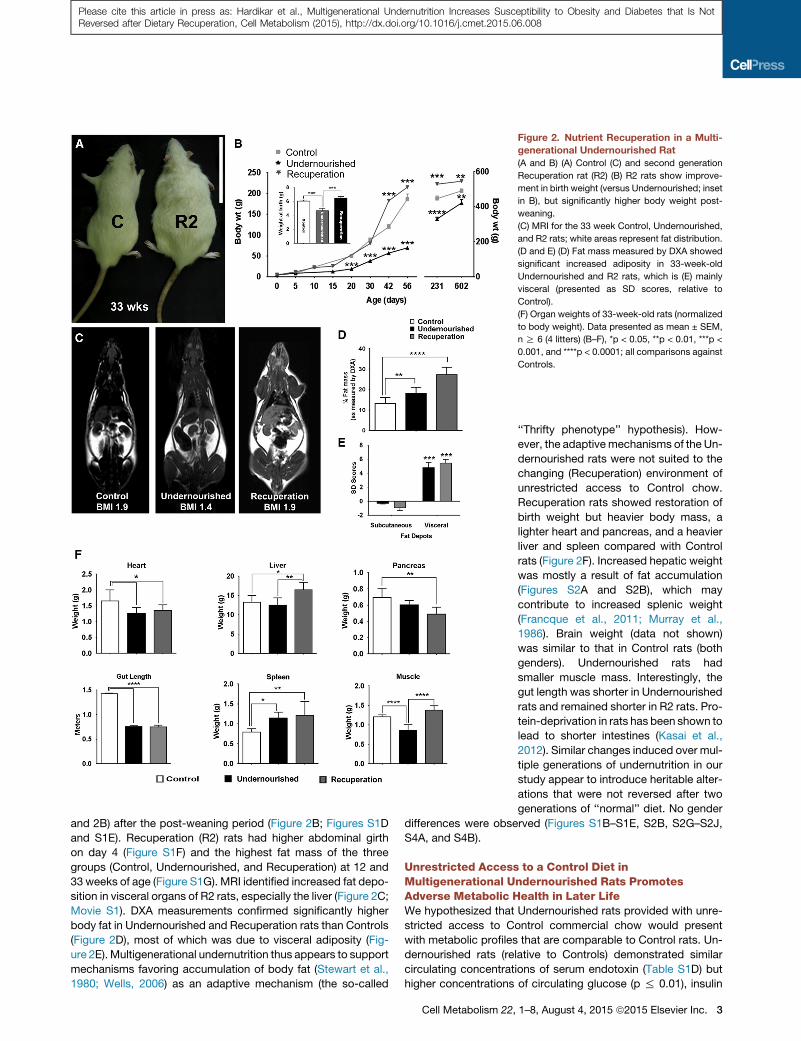
Figure 2. Nutrient Recuperation in a Multi-
generational Undernourished Rat
(A and B) (A) Control (C) and second generation
Recuperation rat (R2) (B) R2 rats show improve-
ment in birth weight (versus Undernourished; inset
in B), but significantly higher body weight post-
weaning.
(C) MRI for the 33 week Control, Undernourished,
and R2 rats; white areas represent fat distribution.
(D and E) (D) Fat mass measured by DXA showed
significant increased adiposity in 33-week-old
Undernourished and R2 rats, which is (E) mainly
visceral (presented as SD scores, relative to
Control).
(F) Organ weights of 33-week-old rats (normalized
to body weight). Data presented as mean ± SEM,
n R 6 (4 litters) (B–F), *p < 0.05, **p < 0.01, ***p <
0.001, and ****p < 0.0001; all comparisons against
Controls.
Please cite this article in press as: Hardikar et al., Multigenerational Undernutrition Increases Susceptibility to Obesity and Diabetes that Is NotReversed after Dietary Recuperation, Cell Metabolism (2015), http://dx.doi.org/10.1016/j.cmet.2015.06.008
and 2B) after the post-weaning period (Figure 2B; Figures S1D
and S1E). Recuperation (R2) rats had higher abdominal girth
on day 4 (Figure S1F) and the highest fat mass of the three
groups (Control, Undernourished, and Recuperation) at 12 and
33 weeks of age (Figure S1G). MRI identified increased fat depo-
sition in visceral organs of R2 rats, especially the liver (Figure 2C;
Movie S1). DXA measurements confirmed significantly higher
body fat in Undernourished and Recuperation rats than Controls
(Figure 2D), most of which was due to visceral adiposity (Fig-
ure 2E). Multigenerational undernutrition thus appears to support
mechanisms favoring accumulation of body fat (Stewart et al.,
1980; Wells, 2006) as an adaptive mechanism (the so-called
Cell Metabolism 22,
‘‘Thrifty phenotype’’ hypothesis). How-
ever, the adaptivemechanisms of the Un-
dernourished rats were not suited to the
changing (Recuperation) environment of
unrestricted access to Control chow.
Recuperation rats showed restoration of
birth weight but heavier body mass, a
lighter heart and pancreas, and a heavier
liver and spleen compared with Control
rats (Figure 2F). Increased hepatic weight
was mostly a result of fat accumulation
(Figures S2A and S2B), which may
contribute to increased splenic weight
(Francque et al., 2011; Murray et al.,
1986). Brain weight (data not shown)
was similar to that in Control rats (both
genders). Undernourished rats had
smaller muscle mass. Interestingly, the
gut length was shorter in Undernourished
rats and remained shorter in R2 rats. Pro-
tein-deprivation in rats has been shown to
lead to shorter intestines (Kasai et al.,
2012). Similar changes induced over mul-
tiple generations of undernutrition in our
study appear to introduce heritable alter-
ations that were not reversed after two
generations of ‘‘normal’’ diet. No gender
differences were observed (Figures S1B–S1E, S2B, S2G–S2J,
S4A, and S4B).
Unrestricted Access to a Control Diet inMultigenerational Undernourished Rats PromotesAdverse Metabolic Health in Later LifeWe hypothesized that Undernourished rats provided with unre-
stricted access to Control commercial chow would present
with metabolic profiles that are comparable to Control rats. Un-
dernourished rats (relative to Controls) demonstrated similar
circulating concentrations of serum endotoxin (Table S1D) but
higher concentrations of circulating glucose (p % 0.01), insulin
1–8, August 4, 2015 ª2015 Elsevier Inc. 3

Figure 3. Insulin Sensitivity and Susceptibility to STZ-Induced Diabetes
(A–D) (A) Glucose tolerance test, (B) insulin tolerance test, (C) glucose was clamped during hyperinsulinemic-euglycemic clamp, and (D) glucose infusion rate
(GIR) was measured during the clamp.
(E–G) Survival curves for Streptozotocin (STZ) dose response in (E) Control, (F) Undernourished, and (G) R2 rats.
(H) Circulating insulin after STZ injection (200 mg/kg). Data presented as mean ± SD, n R 6 (4–12 litters). (A, B, and E–H) 14- to 20-week-old rats; (C and D)
33-week-old rats; *p < 0.05, **p < 0.01, ***p < 0.001, and ****p < 0.0001; all comparisons against Controls.
Please cite this article in press as: Hardikar et al., Multigenerational Undernutrition Increases Susceptibility to Obesity and Diabetes that Is NotReversed after Dietary Recuperation, Cell Metabolism (2015), http://dx.doi.org/10.1016/j.cmet.2015.06.008
(p % 0.001), leptin (p % 0.05), serum glutamic pyruvic transam-
inase (SGPT; p% 0.001), total homocysteine (tHcy; p% 0.0001)
triglycerides (TG; p % 0.0001), and reduced concentrations of
high-density lipoprotein-(HDL) cholesterol, folate, and vitamin
B12 (p % 0.0001; all). In comparison with Control rats, Recuper-
ation rats demonstrated elevated circulating insulin, glucose
(p % 0.0001; both), leptin (p % 0.001), endotoxin (p % 0.0001),
TG (p < 0.0001), total cholesterol (p% 0.0001), VLDL-cholesterol
(p % 0.0001), LDL-cholesterol (p % 0.001), SGPT (p % 0.01),
and tHcy (p % 0.0001), but similar levels of HDL-cholesterol
(Table S1D).
Higher levels of SGPT in Undernourished and R2 rats
compared to Control rats was consistent with liver damage
due to fat deposition. We also observed that low levels of circu-
lating vitamin B12 and folate in Undernourished rats were partially
corrected in R2 rats. Macro-nutrient sufficiency thus seems to
offer a considerable correction for vitamin B12 and folate defi-
ciency as seen in the R2 rats, yet their levels remained signifi-
cantly lower than Controls. Serum total homocysteine was
elevated in Undernourished rats (versus Control) and did not
reverse in R2 rats. Recuperation rats were visibly obese (Fig-
ure 2A) and showed sedentary habits as compared to Control
rats (Movies S2 and S3), despite having similar total energy
intake (Table S1B). Higher circulating leptin and lower adiponec-
tin (Table S1D) levels in Undernourished and R2 rats reflected
increased adiposity in these rats (Figures 1E and 2D; Figures
S1F and S1G). Serum endotoxin concentrations were signifi-
cantly higher in the R2 rats (Table S1D), as seen in human studies
of obese, IGT, and T2D subjects (Harte et al., 2012). Similar to
4 Cell Metabolism 22, 1–8, August 4, 2015 ª2015 Elsevier Inc.
findings inmouse studies (Smith et al., 1966), elevations in serum
endotoxin levels, along with hepatic fat (discussed above), may
contribute to heavier spleens (Figure 2F) in Undernourished
and R2 rats.
Fasting hyperinsulinemia was a prominent feature of Under-
nourished and R2 rats although islet insulin content was
�3-fold lower in Undernourished, but not R2, rats (Table S1D).
We observed significant increases in numbers of insulin-contain-
ing cells in Undernourished and R2 rats with relatively fewer
glucagon-containing cells (Figures S2C–S2E), though no signifi-
cant increases in beta cell mass (Figure S2F) were observed.
Altered Metabolic Health following MultigenerationalUndernutrition Is Not Restored through MacronutrientSupplementationFollowing assessment of impaired glucose tolerance (Figures 3A
and 3B; Figures S2G and S2H), hyperinsulinemic-euglycemic
clamp studies were performed on Control, Undernourished,
and R2 rats (Figures 3C and 3D; Figures S2I–S2J) to confirm in-
sulin resistance. Significantly lower glucose infusion rates
supported maintenance of clamped glucose concentrations
in the Undernourished and R2 rats, confirming that the insulin
resistance observed in the Undernourished rats was not
restored following two generations of Control diet restoration.
To understand whether undernutrition over generations altered
the susceptibility to diabetes, we carried out a streptozo-
tocin (STZ) dose response (see Experimental Procedures,
Figure S3A). STZ, a pancreatic beta cell toxin, is routinely used
to induce diabetes in Wistar rats. Undernourished rats died

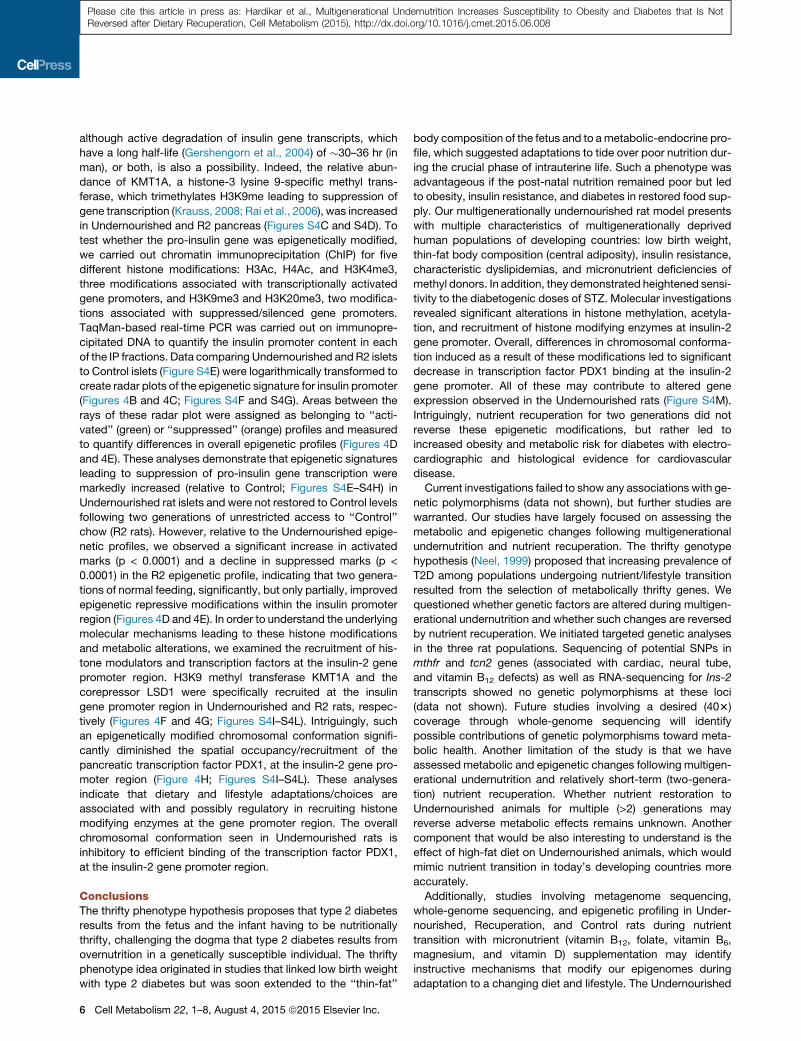
Figure 4. Epigenetic Modifications following Multigeneration Undernutrition and Nutrient Transition
(A) Pancreatic Insulin-2 gene transcript abundance.
(B and C) Epigenetic signatures of histone modifications (relative to control, see Experimental Procedures). Areas between the rays of the radar plot were
assigned as belonging to ‘‘activated’’ or ‘‘suppressed’’ parts of the epigenetic signature based on the antibodies used for IP. The Shoelace formula was then used
to measure the areas of these fragments of the signature. Results were compared using t test and plotted mean ± SD.
(D and E) Areas for ‘‘active’’ and ‘‘suppressed’’ modifications before and after nutrient transition.
(F–H) Recruitment of histone modifying enzymes (F and G) and the transcription factor PDX1 (H) at rat insulin 2 promoter region.
Please cite this article in press as: Hardikar et al., Multigenerational Undernutrition Increases Susceptibility to Obesity and Diabetes that Is NotReversed after Dietary Recuperation, Cell Metabolism (2015), http://dx.doi.org/10.1016/j.cmet.2015.06.008
following exposure to a dose of STZ (200 mg/kg b.w.) that
rendered R90% Control rats (Figure 3E) diabetic (fasting blood
glucose > 11 mmol/l by day 8 post-STZ). An 8-fold lower dose
(25 mg/kg b.w.) offered 100% survival in Undernourished
(Figure 3F) as well as R2 rats (Figure 3G) but all developing dia-
betes with fasting blood glucose > 11 mmol/l by day 8 from STZ
injection; none of the Control animals became diabetic at this
(low) dose. We observed that Undernourished and R2 rats
injected with this high dose (200 mg/kg b.w.) of STZ died with
hypoglycemic convulsions in 12–14 hr (Figures 3F and 3G).
Serial circulating insulin measurements following STZ injection
(200 mg/kg b.w.) in Undernourished and R2 rats (Figure 3H)
demonstrated that the increased mortality at 200 mg/kg
dose was indeed associated with a significant increase in circu-
lating insulin within 3–6 hr after STZ injection, which resulted
in hypoglycemic convulsions and death. As Undernourished
and R2 rats showed 100% survival with fasting plasma
glucose > 11 mmol/l by day 8, at a dose that is eight times lower
than the diabetogenic dose in Control rats (200 mg/kg b.w), Un-
dernourished and R2 rats had eight times more susceptibility to
STZ-induced diabetes.
Undernourished rats also showed other markers of metabolic
disorder. Elevated levels of circulating tHcy (Table S1D) is related
to higher risk of coronary disease, stroke, and peripheral
vascular disease and atherosclerosis in man (Zhou and Austin,
2009). Electrocardiograms (Figures S3B–S3F) revealed inverted
P and T waves in R2 rats, with elevated Q and ST-segments,
consistent with myocardial infarction and associated with higher
early mortality and morbidity (Anderson et al., 2007), in man. A
lower circulating concentration of folate (Table S1D) may itself
be an atherogenic factor (Imamura et al., 2010) that could pro-
mote hyperhomocysteinemia seen in these Undernourished
and R2 rats. Cardiac histology revealed multiple morphological
abnormalities in R2 rats (Figure S3G) and higher cardiac tissue
levels of the DNAmethyl transferase dnmt3a1 in Undernourished
and R2 rats (Figure S3H), which may be associated with epige-
netic silencing in cardiac tissue as well (Kotini et al., 2011).
Undernourished and R2 rat pancreas contained significantly
fewer (pro-)insulin 2 gene transcripts (Figure 4A; Figures S4A
and S4B), indicating that multigenerational undernutrition
affected insulin gene transcription with no recovery. This may
be a result of epigenetic repression of insulin gene transcription,
Cell Metabolism 22, 1–8, August 4, 2015 ª2015 Elsevier Inc. 5
Please cite this article in press as: Hardikar et al., Multigenerational Undernutrition Increases Susceptibility to Obesity and Diabetes that Is NotReversed after Dietary Recuperation, Cell Metabolism (2015), http://dx.doi.org/10.1016/j.cmet.2015.06.008
although active degradation of insulin gene transcripts, which
have a long half-life (Gershengorn et al., 2004) of �30–36 hr (in
man), or both, is also a possibility. Indeed, the relative abun-
dance of KMT1A, a histone-3 lysine 9-specific methyl trans-
ferase, which trimethylates H3K9me leading to suppression of
gene transcription (Krauss, 2008; Rai et al., 2006), was increased
in Undernourished and R2 pancreas (Figures S4C and S4D). To
test whether the pro-insulin gene was epigenetically modified,
we carried out chromatin immunoprecipitation (ChIP) for five
different histone modifications: H3Ac, H4Ac, and H3K4me3,
three modifications associated with transcriptionally activated
gene promoters, and H3K9me3 and H3K20me3, two modifica-
tions associated with suppressed/silenced gene promoters.
TaqMan-based real-time PCR was carried out on immunopre-
cipitated DNA to quantify the insulin promoter content in each
of the IP fractions. Data comparing Undernourished andR2 islets
to Control islets (Figure S4E) were logarithmically transformed to
create radar plots of the epigenetic signature for insulin promoter
(Figures 4B and 4C; Figures S4F and S4G). Areas between the
rays of these radar plot were assigned as belonging to ‘‘acti-
vated’’ (green) or ‘‘suppressed’’ (orange) profiles and measured
to quantify differences in overall epigenetic profiles (Figures 4D
and 4E). These analyses demonstrate that epigenetic signatures
leading to suppression of pro-insulin gene transcription were
markedly increased (relative to Control; Figures S4E–S4H) in
Undernourished rat islets and were not restored to Control levels
following two generations of unrestricted access to ‘‘Control’’
chow (R2 rats). However, relative to the Undernourished epige-
netic profiles, we observed a significant increase in activated
marks (p < 0.0001) and a decline in suppressed marks (p <
0.0001) in the R2 epigenetic profile, indicating that two genera-
tions of normal feeding, significantly, but only partially, improved
epigenetic repressive modifications within the insulin promoter
region (Figures 4D and 4E). In order to understand the underlying
molecular mechanisms leading to these histone modifications
and metabolic alterations, we examined the recruitment of his-
tone modulators and transcription factors at the insulin-2 gene
promoter region. H3K9 methyl transferase KMT1A and the
corepressor LSD1 were specifically recruited at the insulin
gene promoter region in Undernourished and R2 rats, respec-
tively (Figures 4F and 4G; Figures S4I–S4L). Intriguingly, such
an epigenetically modified chromosomal conformation signifi-
cantly diminished the spatial occupancy/recruitment of the
pancreatic transcription factor PDX1, at the insulin-2 gene pro-
moter region (Figure 4H; Figures S4I–S4L). These analyses
indicate that dietary and lifestyle adaptations/choices are
associated with and possibly regulatory in recruiting histone
modifying enzymes at the gene promoter region. The overall
chromosomal conformation seen in Undernourished rats is
inhibitory to efficient binding of the transcription factor PDX1,
at the insulin-2 gene promoter region.
ConclusionsThe thrifty phenotype hypothesis proposes that type 2 diabetes
results from the fetus and the infant having to be nutritionally
thrifty, challenging the dogma that type 2 diabetes results from
overnutrition in a genetically susceptible individual. The thrifty
phenotype idea originated in studies that linked low birth weight
with type 2 diabetes but was soon extended to the ‘‘thin-fat’’
6 Cell Metabolism 22, 1–8, August 4, 2015 ª2015 Elsevier Inc.
body composition of the fetus and to ametabolic-endocrine pro-
file, which suggested adaptations to tide over poor nutrition dur-
ing the crucial phase of intrauterine life. Such a phenotype was
advantageous if the post-natal nutrition remained poor but led
to obesity, insulin resistance, and diabetes in restored food sup-
ply. Our multigenerationally undernourished rat model presents
with multiple characteristics of multigenerationally deprived
human populations of developing countries: low birth weight,
thin-fat body composition (central adiposity), insulin resistance,
characteristic dyslipidemias, and micronutrient deficiencies of
methyl donors. In addition, they demonstrated heightened sensi-
tivity to the diabetogenic doses of STZ. Molecular investigations
revealed significant alterations in histone methylation, acetyla-
tion, and recruitment of histone modifying enzymes at insulin-2
gene promoter. Overall, differences in chromosomal conforma-
tion induced as a result of these modifications led to significant
decrease in transcription factor PDX1 binding at the insulin-2
gene promoter. All of these may contribute to altered gene
expression observed in the Undernourished rats (Figure S4M).
Intriguingly, nutrient recuperation for two generations did not
reverse these epigenetic modifications, but rather led to
increased obesity and metabolic risk for diabetes with electro-
cardiographic and histological evidence for cardiovascular
disease.
Current investigations failed to show any associations with ge-
netic polymorphisms (data not shown), but further studies are
warranted. Our studies have largely focused on assessing the
metabolic and epigenetic changes following multigenerational
undernutrition and nutrient recuperation. The thrifty genotype
hypothesis (Neel, 1999) proposed that increasing prevalence of
T2D among populations undergoing nutrient/lifestyle transition
resulted from the selection of metabolically thrifty genes. We
questioned whether genetic factors are altered during multigen-
erational undernutrition and whether such changes are reversed
by nutrient recuperation. We initiated targeted genetic analyses
in the three rat populations. Sequencing of potential SNPs in
mthfr and tcn2 genes (associated with cardiac, neural tube,
and vitamin B12 defects) as well as RNA-sequencing for Ins-2
transcripts showed no genetic polymorphisms at these loci
(data not shown). Future studies involving a desired (403)
coverage through whole-genome sequencing will identify
possible contributions of genetic polymorphisms toward meta-
bolic health. Another limitation of the study is that we have
assessed metabolic and epigenetic changes following multigen-
erational undernutrition and relatively short-term (two-genera-
tion) nutrient recuperation. Whether nutrient restoration to
Undernourished animals for multiple (>2) generations may
reverse adverse metabolic effects remains unknown. Another
component that would be also interesting to understand is the
effect of high-fat diet on Undernourished animals, which would
mimic nutrient transition in today’s developing countries more
accurately.
Additionally, studies involving metagenome sequencing,
whole-genome sequencing, and epigenetic profiling in Under-
nourished, Recuperation, and Control rats during nutrient
transition with micronutrient (vitamin B12, folate, vitamin B6,
magnesium, and vitamin D) supplementation may identify
instructive mechanisms that modify our epigenomes during
adaptation to a changing diet and lifestyle. The Undernourished
Please cite this article in press as: Hardikar et al., Multigenerational Undernutrition Increases Susceptibility to Obesity and Diabetes that Is NotReversed after Dietary Recuperation, Cell Metabolism (2015), http://dx.doi.org/10.1016/j.cmet.2015.06.008
rat model offers unique advantages as a model of a multigenera-
tionally undernourished population then exposed to rapid nutri-
tional and epidemiologic transition, causing a ‘‘double burden’’
of disease. Our model may contribute to the development of a
strategy to reduce the mismatch between early- and late-life
nutrition and, therefore, facilitate development of newer strate-
gies for diabetes prevention.
EXPERIMENTAL PROCEDURES
Animals
Undernourished rats were derived from a colony of Wistar rats (Control) by
feeding a protein caloric-deficient diet (Tables S1A–S1C), as outlined in the
study design (Figure 1A). Animals were housed under 12 hr day/night cycle;
Control and Recuperation rats were allowed free access to standard commer-
cial chow and water at all times. National and Institutional guidelines for the
use and care of laboratory animals were followed. All procedures detailed in
this study were approved by the NCCS/NTC Ethics and Animal Welfare
Committees. At least 20 litters were used at each generation for propagation
of this outbred colony (Figure S1A). Data represent analyses on >6 animals
from 4 to 12 different litters.
Biochemical Estimations
Glucose and insulin estimations were carried as detailed in Supplemental
Experimental Procedures.
Circulating biomarkers were measured on a Spectrum II Auto analyzer
(Abbott Laboratories) as detailed in Supplemental Experimental Procedures.
Dual-energy X-ray absorptiometry (DXA) was carried out on age-matched
males at 12, 33, or 86 weeks using Orthometrics p-DEXA scanner. Total/
visceral/s.c. fat mass were measured and adiposity were calculated as
amount of fat normalized to body weight at the time of measurement.
MRI was performed on age-matched rats using a Siemens 1.5 Tesla
machine with 3 mm sections.
Hyperinsulinemic-euglycemic clamp studies were carried out based on the
guidelines and procedures detailed by Ayala et al. (2006).
Streptozotocin (STZ), a pancreatic b-cell toxin, was reconstituted in chilled
citrate buffer (pH = 4.5) prior to i.p. injection and post-STZ survival was
measured as detailed in Supplemental Experimental Procedures.
Immunostaining and confocal microscopy was carried out using methods
detailed in Supplemental Experimental Procedures and published earlier
(Joglekar et al., 2009).
ChIP and western blotting for epigenetic modulators was carried out as
detailed in Supplemental Experimental Procedures.
Quantitative real-time PCR was carried out using SybrG or TaqMan assays
as detailed in Supplemental Experimental Procedures. Data are presented as
‘‘Fold over detectable’’ as explained elsewhere (Hardikar et al., 2014).
Statistical Analysis
Differences between groups were calculated by using one-way or two-way
ANOVA and appropriate post hoc tests as described in Supplemental Exper-
imental Procedures. SPPS, GraphPad Prism, and Jandel Scientific softwares
were used to assess/plot data. A sample size of six rats in each group is suf-
ficient to identify a difference of 27% (SD 15% of mean), with 80% power at
2p = 0.05 between any two groups, or to identify a difference of 45% (SD
25%of mean) as statistically significant, with 80%power at 2p = 0.05 between
any two groups. Results are expressed asmean ± SEM or SD. SD scores were
used to compare organ weights of Undernourished animals in comparison to
the Controls. SD score = S [(xi – Xc)/SDc], wherein xi is individual value in the
experimental (Undernourished or Recuperation) group, Xc is the mean value
for the Control group, and SDc is the SD of the Control group. Difference be-
tween groups was tested by one-way ANOVA and Fisher’s LSD test or
Student’s t test, as appropriate. Serial changes in plasma glucose and insulin
concentrations were tested by paired t test or one-way ANOVA as appropriate.
Computations were performed using Graphpad Prism software. Radar plots of
the data representing ChIP studies were created by logarithmically transform-
ing fold over detectable data, using shoelace formula.
SUPPLEMENTAL INFORMATION
Supplemental Information includes Supplemental Experimental Procedures,
four figures, one table, and three movies and can be found with this article
online at http://dx.doi.org/10.1016/j.cmet.2015.06.008.
AUTHOR CONTRIBUTIONS
A.A.H. designed, planned, carried cellular and molecular assays, data ana-
lyses, and wrote/revised the paper; S.N.S. performed animal work and
biochemical assays, M.S.K. performed animal physiology studies; M.V.J. per-
formed all epigenetic studies, immunostaining, and morphometry; W.W. and
A.L. performed epigenetic studies; A.S.P. and S.K. performed clamps, DXA,
and EKGs; D.S.B. performed biochemistry; A.J. performed statistics; M.R.U.
conducted animal studies; A.K.R. and P.Y. performed molecular studies;
R.R.B., K.A., S.G., A.C.K., A.J.J., and C.S.Y. provided infrastructure support,
data analysis, and statistics. All authors read and contributed to modifica-
tions/revisions in final draft.
ACKNOWLEDGMENTS
Authors acknowledge infrastructure support through the NHMRC-CTC, JDRF
Australia, Rebecca L. Cooper Foundation, and fromDr. Patwardhan (HPLC ac-
cess), Dr. Ramanmurthy (animal maintenance), Dr. Sitaswad (EKG), Dr. Wani
(small animal DXA), Dr. Banerjee (SGPT analysis), Dr. Rahalkar and Mr. Ghale
(MRI), and Dr. K Sawaimul and Prof. Harsh Kumar (histology). Funding: A.A.H.
acknowledges Australian Research Council (ARC; grant # FT110100254) and
Department of Biotechnology, Government of India. M.V.J. is supported by
JDRF, USA, W.W. through JDRF Australia, A.S.P. through Lady Tata Memorial
fellowship, and S.N.S. through an NHMRC project grant (GNT1023060) to
A.A.H.
Received: December 12, 2014
Revised: March 10, 2015
Accepted: June 9, 2015
Published: July 9, 2015
REFERENCES
Aagaard-Tillery, K.M., Grove, K., Bishop, J., Ke, X., Fu, Q., McKnight, R., and
Lane, R.H. (2008). Developmental origins of disease and determinants of chro-
matin structure: maternal diet modifies the primate fetal epigenome. J. Mol.
Endocrinol. 41, 91–102.
Aiken, C.E., and Ozanne, S.E. (2014). Transgenerational developmental pro-
gramming. Hum. Reprod. Update 20, 63–75.
Anderson, J.L., Adams, C.D., Antman, E.M., Bridges, C.R., Califf, R.M., Casey,
D.E., Jr., Chavey, W.E., 2nd, Fesmire, F.M., Hochman, J.S., Levin, T.N., et al.;
American College of Cardiology; American Heart Association Task Force
on Practice Guidelines (Writing Committee to Revise the 2002 Guidelines for
the Management of Patients With Unstable Angina/Non-ST-Elevation
Myocardial Infarction); American College of Emergency Physicians;
Society for Cardiovascular Angiography and Interventions; Society of
Thoracic Surgeons; American Association of Cardiovascular and Pulmonary
Rehabilitation; Society for Academic Emergency Medicine (2007). ACC/AHA
2007 guidelines for the management of patients with unstable angina/non-
ST-Elevation myocardial infarction: a report of the American College of
Cardiology/American Heart Association Task Force on Practice Guidelines
(Writing Committee to Revise the 2002 Guidelines for the Management of
PatientsWith Unstable Angina/Non-ST-ElevationMyocardial Infarction) devel-
oped in collaboration with the American College of Emergency Physicians, the
Society for Cardiovascular Angiography and Interventions, and the Society of
Thoracic Surgeons endorsed by the American Association of Cardiovascular
and Pulmonary Rehabilitation and the Society for Academic Emergency
Medicine. J. Am. Coll. Cardiol. 50, e1–e157.
Ayala, J.E., Bracy, D.P., McGuinness, O.P., and Wasserman, D.H. (2006).
Considerations in the design of hyperinsulinemic-euglycemic clamps in the
conscious mouse. Diabetes 55, 390–397.
Cell Metabolism 22, 1–8, August 4, 2015 ª2015 Elsevier Inc. 7
Please cite this article in press as: Hardikar et al., Multigenerational Undernutrition Increases Susceptibility to Obesity and Diabetes that Is NotReversed after Dietary Recuperation, Cell Metabolism (2015), http://dx.doi.org/10.1016/j.cmet.2015.06.008
Echouffo-Tcheugui, J.B., and Dagogo-Jack, S. (2012). Preventing diabetes
mellitus in developing countries. Nat. Rev. Endocrinol. 8, 557–562.
Francque, S., Verrijken, A., Mertens, I., Hubens, G., VanMarck, E., Pelckmans,
P., Michielsen, P., and Van Gaal, L. (2011). Visceral adiposity and insulin resis-
tance are independent predictors of the presence of non-cirrhotic NAFLD-
related portal hypertension. Int J Obes (Lond) 35, 270–278.
Gershengorn, M.C., Hardikar, A.A., Wei, C., Geras-Raaka, E., Marcus-
Samuels, B., and Raaka, B.M. (2004). Epithelial-to-mesenchymal transition
generates proliferative human islet precursor cells. Science 306, 2261–2264.
Goodspeed, D., Seferovic, M.D., Holland, W., Mcknight, R.A., Summers, S.A.,
Branch, D.W., Lane, R.H., and Aagaard, K.M. (2015). Essential nutrient supple-
mentation prevents heritable metabolic disease in multigenerational intrauter-
ine growth-restricted rats. FASEB J. 29, 807–819.
Hardikar, A.A., Farr, R.J., and Joglekar, M.V. (2014). Circulating microRNAs:
understanding the limits for quantitative measurement by real-time PCR.
J. Am. Heart. Assoc. 3, e000792.
Harte, A.L., Varma, M.C., Tripathi, G., McGee, K.C., Al-Daghri, N.M., Al-Attas,
O.S., Sabico, S., O’Hare, J.P., Ceriello, A., Saravanan, P., et al. (2012). High fat
intake leads to acute postprandial exposure to circulating endotoxin in type 2
diabetic subjects. Diabetes Care 35, 375–382.
Imamura, A., Murakami, R., Takahashi, R., Cheng, X.W., Numaguchi, Y.,
Murohara, T., andOkumura, K. (2010). Low folate levelsmay be an atherogenic
factor regardless of homocysteine levels in young healthy nonsmokers.
Metabolism 59, 728–733.
Joglekar,M.V., Joglekar, V.M., Joglekar, S.V., andHardikar, A.A. (2009). Human
fetal pancreatic insulin-producing cells proliferate in vitro. J. Endocrinol. 201,
27–36.
Kasai, A., Gama, P., and Alvares, E.P. (2012). Protein restriction inhibits gastric
cell proliferation during rat postnatal growth in parallel to ghrelin changes.
Nutrition 28, 707–712.
Kotini, A.G., Mpakali, A., and Agalioti, T. (2011). Dnmt3a1 upregulates tran-
scription of distinct genes and targets chromosomal gene clusters for epige-
netic silencing in mouse embryonic stem cells. Mol. Cell. Biol. 31, 1577–1592.
Krauss, V. (2008). Glimpses of evolution: heterochromatic histone H3K9meth-
yltransferases left its marks behind. Genetica 133, 93–106.
Murray, M., Zaluzny, L., and Farrell, G.C. (1986). Drug metabolism in cirrhosis.
Selective changes in cytochrome P-450 isozymes in the choline-deficient rat
model. Biochem. Pharmacol. 35, 1817–1824.
Neel, J.V. (1999). The ‘‘thrifty genotype’’ in 1998. Nutr. Rev. 57, S2–S9.
Ng, S.F., Lin, R.C., Laybutt, D.R., Barres, R., Owens, J.A., and Morris, M.J.
(2010). Chronic high-fat diet in fathers programs b-cell dysfunction in female
rat offspring. Nature 467, 963–966.
8 Cell Metabolism 22, 1–8, August 4, 2015 ª2015 Elsevier Inc.
Rai, K., Nadauld, L.D., Chidester, S., Manos, E.J., James, S.R., Karpf, A.R.,
Cairns, B.R., and Jones, D.A. (2006). Zebra fish Dnmt1 and Suv39h1 regulate
organ-specific terminal differentiation during development. Mol. Cell. Biol. 26,
7077–7085.
Smith, W.W., Brecher, G., Budd, R.A., and Fred, S. (1966). Effects of bacterial
endotoxin on the occurrence of spleen colonies in irradiatedmice. Radiat. Res.
27, 369–374.
Stewart, R.J., Sheppard, H., Preece, R., and Waterlow, J.C. (1980). The effect
of rehabilitation at different stages of development of rats marginally malnour-
ished for ten to twelve generations. Br. J. Nutr. 43, 403–412.
Suter, M.A., Chen, A., Burdine, M.S., Choudhury, M., Harris, R.A., Lane, R.H.,
Friedman, J.E., Grove, K.L., Tackett, A.J., and Aagaard, K.M. (2012). A
maternal high-fat diet modulates fetal SIRT1 histone and protein deacetylase
activity in nonhuman primates. FASEB J. 26, 5106–5114.
Wells, J.C. (2006). The evolution of human fatness and susceptibility to
obesity: an ethological approach. Biol. Rev. Camb. Philos. Soc. 81, 183–205.
Yajnik, C.S. (2004). Early life origins of insulin resistance and type 2 diabetes in
India and other Asian countries. J. Nutr. 134, 205–210.
Yajnik, C.S., and Deshmukh, U.S. (2012). Fetal programming: maternal nutri-
tion and role of one-carbon metabolism. Rev. Endocr. Metab. Disord. 13,
121–127.
Yajnik, C.S., Fall, C.H., Vaidya, U., Pandit, A.N., Bavdekar, A., Bhat, D.S.,
Osmond, C., Hales, C.N., and Barker, D.J. (1995). Fetal growth and glucose
and insulin metabolism in four-year-old Indian children. Diabet. Med. 12,
330–336.
Yajnik, C.S., Fall, C.H., Coyaji, K.J., Hirve, S.S., Rao, S., Barker, D.J., Joglekar,
C., and Kellingray, S. (2003). Neonatal anthropometry: the thin-fat Indian baby.
The Pune Maternal Nutrition Study. Int. J. Obes. Relat. Metab. Disord. 27,
173–180.
Yajnik, C.S., Deshpande, S.S., Jackson, A.A., Refsum, H., Rao, S., Fisher, D.J.,
Bhat, D.S., Naik, S.S., Coyaji, K.J., Joglekar, C.V., et al. (2008). Vitamin B12
and folate concentrations during pregnancy and insulin resistance in the
offspring: the Pune Maternal Nutrition Study. Diabetologia 51, 29–38.
Yajnik, C.S., Chandak, G.R., Joglekar, C., Katre, P., Bhat, D.S., Singh, S.N.,
Janipalli, C.S., Refsum, H., Krishnaveni, G., Veena, S., et al. (2014). Maternal
homocysteine in pregnancy and offspring birthweight: epidemiological associ-
ations and Mendelian randomization analysis. Int. J. Epidemiol. 43, 1487–
1497.
Zhou, J., and Austin, R.C. (2009). Contributions of hyperhomocysteinemia to
atherosclerosis: Causal relationship and potential mechanisms. Biofactors
35, 120–129.
Cell Metabolism
Supplemental Information
Multigenerational Undernutrition Increases
Susceptibility to Obesity and Diabetes that Is
Not Reversed after Dietary Recuperation
Anandwardhan A. Hardikar, Sarang N. Satoor, Mahesh S. Karandikar, Mugdha V.
Joglekar, Amrutesh S. Puranik, Wilson Wong, Sandeep Kumar, Amita Limaye, Dattatray
S. Bhat, Andrzej Januszewski, Malati R. Umrani, Amaresh K. Ranjan, Kishori Apte,
Pranav Yajnik, Ramesh R. Bhonde, Sanjeev Galande, Anthony C. Keech, Alicia J.
Jenkins, and Chittaranjan S. Yajnik
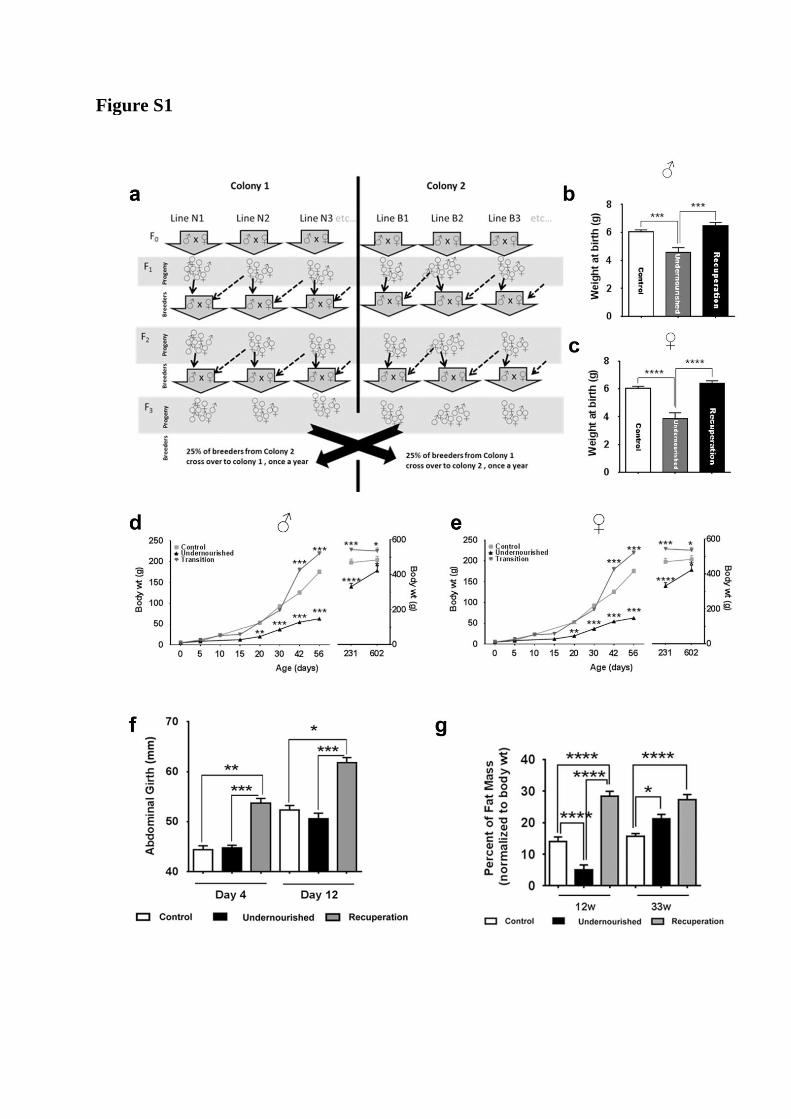
Figure S1

Figure S1, related to Figure 1:
a) In order to avoid any genetic drift in this outbred line, two colonies (Colony 1 and Colony
2) were established at the participating institutions which are geographically separated and
managed by different primary animal care takers. Within each of these colonies the
following breeding strategy was planned –
i) Ten to 12 different lines were maintained at a time (N1, N2,N3 etc. & B1, B2 B3
etc…)
ii) males from one line (within a colony) are used as breeders with females from a
different line (within the same colony but a different line).
iii) males are replaced at every other generation.
iv) twenty-five percent of the breeding stock was replaced every year with a breeding
stock from the other geographically distinct colony (as shown after F3 above) to
maintain the variability achieved through outbreeding. At least 20 different litters
were used to propagate the colony in each generation.
b, c) At birth, Undernourished rats were lighter as compared to the Control rats. No
differences were seen between males (b) and females (c) within a group or between birth
weights of Control and Recuperation rats. Recuperation rats were significantly heavier than
Undernourished rats (both sexes). These data are separate from the animals presented in
Figure 1d and 2b (inset) and were obtained by measuring the weights of every rat in the litter
and then allocating data to males / females after six days, when identification of their gender
was evident. Data presented as mean+SEM, N=6 rats / group (from four litters), ***p<0.001
and **** p<0.0001; multiple comparisons between groups.
d, e) Growth profiles for the three rat groups broken down based on gender. Data represents
body weights from 3-6 rats at each time point, Males and females were not separated/
identified until after six days from birth (4-6 litters). Therefore data for 0 and 5 days
represent pooled sets of males and females as their gender was not identified by then. Body
weights for 231 and 602 days are plotted on the right Y-axis. Data presented as mean+SEM,
*: p<0.05, **:p<0.01, ***p<0.001 and **** p<0.0001; all comparisons against Controls.
f) Since fat mass estimations could not be carried out prior to 12 weeks of age in the Control
rats (limitation of the DXA system used), abdominal girth was measured in day 4 and day 12
litters. Data represent comparison between at least three litters. Recuperation rats showed
larger abdominal girth on post-natal day 4, which remained larger on day 12.
g) Adiposity was measured using DXA as described in methods and normalized to body
weight for comparing the percent fat mass. Undernourished rats showed lower fat mass at 12
weeks, which increased by over 4-fold in next 21 weeks. Recuperation rats showed higher
fat mass at both these time points (12 and 33 weeks). For panels f and g; N=3 to 8, data
presented as mean + SEM. *p<0.05, **p<0.01, ***p<0.001 and ****p<0.0001. Gender
differences are difficult to identify until day 6 of age and data from panel (f) refers to ~1:1
males:females from 4 litters. As discussed earlier, DXA measurements were carried out on
males (3-6 litters were analysed). One-way ANOVA, Fisher’s LSD comparisons test were
used to compare differences between groups.

Figure S2

Figure S2, related to Figure 2:
a, b) MRI imaging (Supplemental movie 1 and Figure 2c) indicated that Recuperation rats
showed signs of fat deposition in the liver. This was confirmed by comparing liver sections
from Undernourished and Recuperation rats to age and gender matched Control rats (a).
H&E staining shows nuclei in blue and cytoplasm in pink for the 33 week old rats (N=6, 3
males, three litters). The white deposit in the cytoplasm represents fat. Bar represents 25
µm. (b) Binary imaging was carried to measure the integrated density of lipid areas and
plotted as Z-scores with reference to those in the Control rat liver. Data presented as mean +
SEM.
c-e) Immunohistochemistry analysis of insulin- and glucagon-producing cells in 33-week old
rats. (c) No major differences in the islet architecture (localization of Glucagon- Vs Insulin-
producing cells within the islet) were observed between Control, Undernourished and
Recuperation islets. Bar represents 25µm. Undernourished and Recuperation islets had more
Insulin-producing cells (d) and fewer Glucagon-producing cells (e). Data presented as mean
+ SEM. *p<0.05, **p<0.01 and ***p<0.001 from measurements made using at least 15
different pancreas sections each and from 3 to 6 pancreas – each from a different litter,
spaced at 150µm.
f) To assess if changes in beta cell number (Figure S2c,d) led to an increase in beta cell mass,
we measured the mass of insulin-producing beta cells in 12-week old rats (N=6-10; 3-5
males, four litters). No differences were seen across groups, nor were any gender differences
seen between groups. Further studies assessing serial measurements of beta cell mass during
the life course of these rats and after nutrient transition will help understand if nutrient
changes alter beta cell fraction, beta cell mass or beta cell number (Chintinne et al., 2012)
during their life.
g, h) Plasma glucose concentrations were measured in overnight fasted Control,
Undernourished and Recuperation rats during a glucose tolerance test (g) (intraperitoneal
glucose at 2g/Kg body weight). Circulating glucose concentrations were measured in
overnight fasted Control, Undernourished and Recuperation rats after intra-peritoneal insulin
(0.15U/Kg) injection (h). N=8, four males in each group and representing four different
litters from 20 week old rats. For panels f, g and h, data are presented as mean+SEM, *:
p<0.05, **:p<0.01, ***p<0.001 and **** p<0.0001; all comparisons against Controls using
two-way ANOVA.

i, j) Insulin resistance observed during glucose and insulin tolerance tests was confirmed by
carrying out hyperinsulinemic euglycemic clamps (Figure 3c,d). Data from at least 3 or 4
males (i) and an equal number of females (j) for each of the three groups (Control,
Undernourished and Recuperation) were assessed - no significant gender differences were
seen in terms of insulin resistance observed in the Undernourished and Recuperation rats.
Data presented as mean+SEM, 33-week old rats and a total of four litters. * p<0.05, **
p<0.01 ***p<0.001 and **** p<0.0001; both experimental groups compared to Controls.
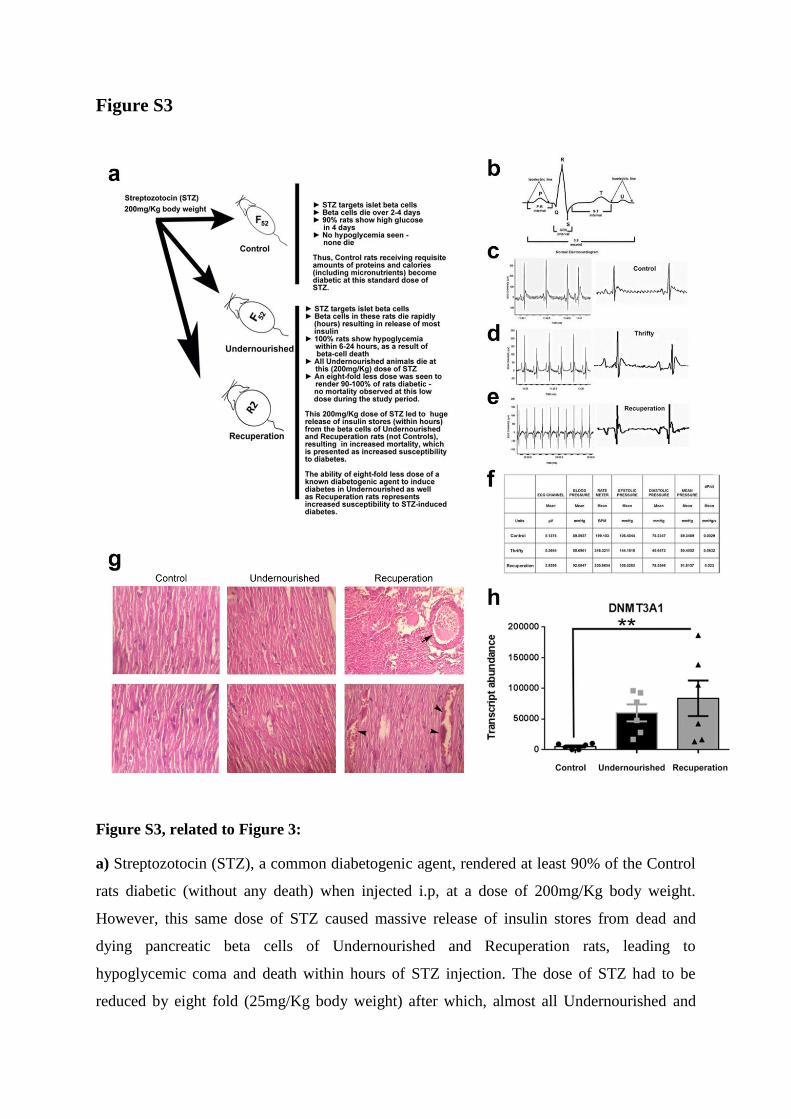
Figure S3
Figure S3, related to Figure 3:
a) Streptozotocin (STZ), a common diabetogenic agent, rendered at least 90% of the Control
rats diabetic (without any death) when injected i.p, at a dose of 200mg/Kg body weight.
However, this same dose of STZ caused massive release of insulin stores from dead and
dying pancreatic beta cells of Undernourished and Recuperation rats, leading to
hypoglycemic coma and death within hours of STZ injection. The dose of STZ had to be
reduced by eight fold (25mg/Kg body weight) after which, almost all Undernourished and
over 90% Recuperation rats become diabetic. The potential of this lower dose of STZ
causing beta cell death and diabetes was measured in terms of survival (Figure 3e-g) after
STZ injection and represents increased susceptibility to STZ-induced diabetes.
b-f) Cartoon showing an example of a normal EKG (b), (c) EKG of Control rats showing
normal EKG pattern, (d) Undernourished rat EKG showed raised ‘P’ and ‘T’ waves with
irregular ‘R’ and ‘S’ wave pattern, (e) Electrocardiogram of Recuperation rats showed
inverted ‘P’ and ‘T’ waves with elevated Q and ST-segments, as normally seen with
myocardial infarction and associated with higher early mortality and morbidity, and (f) EKG
table summarizing several cardiac parameters in Control, Undernourished and Recuperation
rats. Data are presented as mean values of N=3 to 5 rats for each group, three males and from
four litters at 33 weeks of age.
g) Hearts from four to eight Control, Undernourished and Recuperation rats (50% males, four
litters) at 14-16 weeks of age were isolated, fixed in paraformaldehyde, sectioned and stained
with Haematoxylin and Eosin. No histological abnormalities were seen in any of the Control
or Undernourished hearts at this age, but vascular congestion (arrowheads) and atrial
thrombus (arrow) were seen in Recuperation rat hearts. Bar=10µm.
h) The levels of DNA methyltransferase gene (dnmt3a1) transcript was assessed using
TaqMan-real time PCR and found to be significantly increased in cardiac tissue of
Recuperation rats. N=6, three males, four litters, 33-week old, data presented as mean +
SEM. **p<0.01, One-way ANOVA, Fisher’s LSD comparisons test was used to compare
differences between groups.
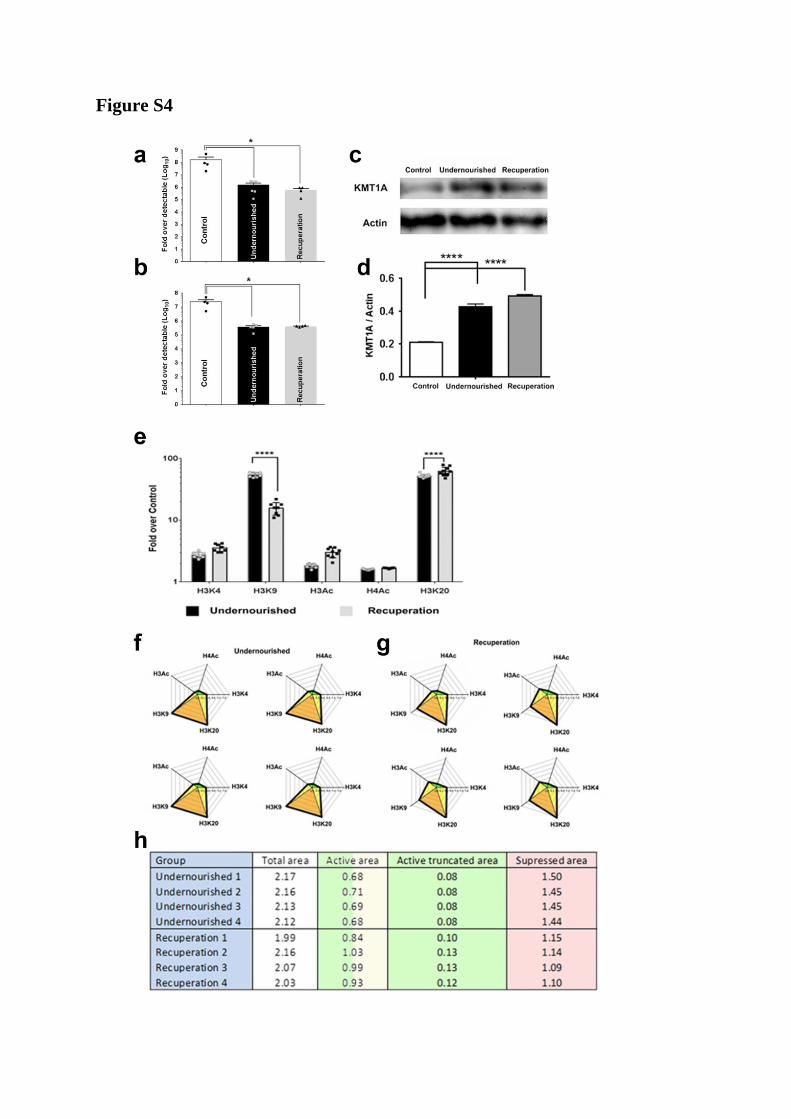
Figure S4
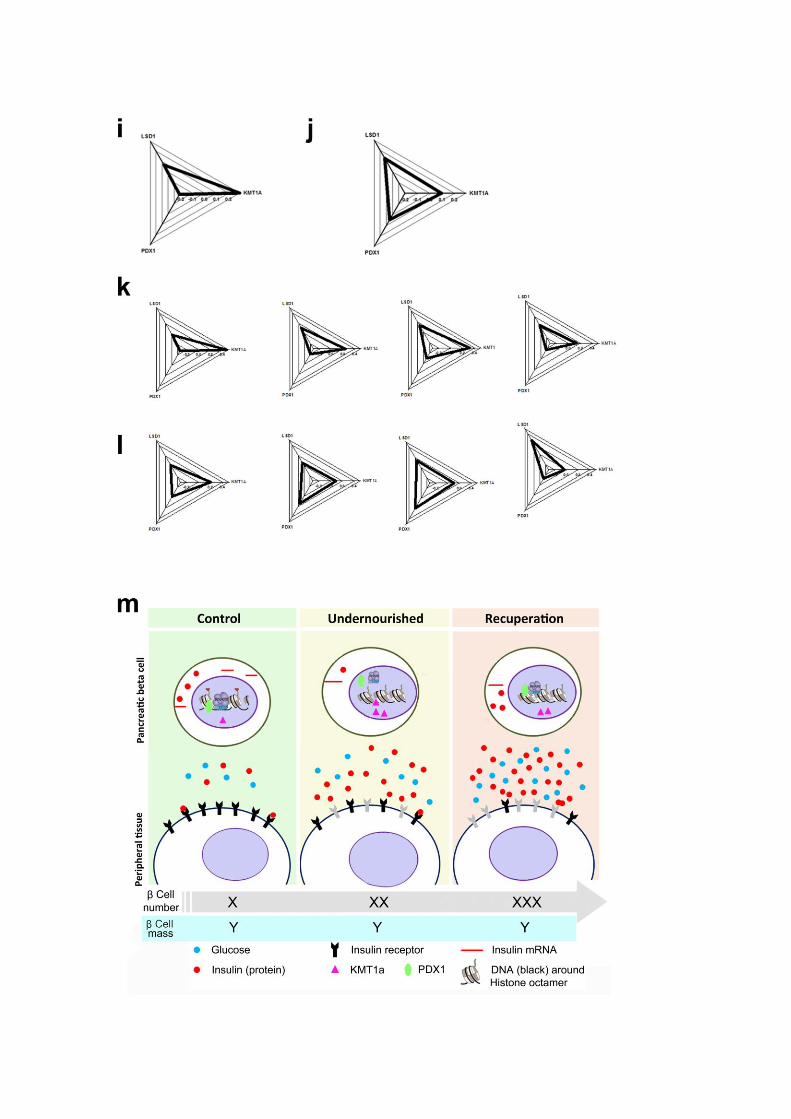

Figure S4, related to Figure 4:
a, b) Transcript abundance of ins-2 gene was assessed using TaqMan-based real-time PCR
in pancreas from Control, Undernourished and Recuperation rats. Insulin gene transcripts
were ~100-fold lower in abundance in Undernourished rats with no change following
Recuperation. These differences were seen in both males (a) and females (b) across the
groups; no differences observed between males and females within each of the three groups.
Each of the points in the overlay scatter plot represents a different pancreas sample from a
different rat. Data represents rats from four different litters at 33 weeks of age. Data
presented as mean + SEM, *: p<0.05.
c, d) The expression of histone methyl transferase (KMT1A) was assessed in the pancreas of
33-week-old Control, Undernourished and Recuperation rats. A representative western blot
showing abundance of KMT1A in the pancreas of Control (lane 1; left), Undernourished
(lane 2) and Recuperation (lane 3) rats (c) is shown. Actin was probed as a housekeeping
control. Quantitation of blots from six different rats (three males, total of four litters)
indicates that the Undernourished and Recuperation rats had increased abundance of KMT1A
in the pancreas as compared to those in the Control rats (d). Data presented as mean + SEM.
****p<0.0001, one-way ANOVA, Fisher’s LSD comparisons test was used to compare
differences between groups.
e-h) Chromatin immunoprecipitation (ChIP) for five different histone modifications was
carried out on islet cells isolated from Control, Undernourished and Recuperation rat
pancreas and data are presented as fold relative to those in the Control rat pancreatic islets
(e). Data are presented as mean + SEM (N=8 to 9, 33 week old, four males, and from four
litters ****p<0.0001). Data from ChIP studies (shown in panel e, above) were
logarithmically transformed and values were used to create radar plots of epigenetic
signatures/profiles. Panels (f) and (g) present individual log transformed data from four of the
eight rats used in panel e (above). Data from individual samples are plotted so as to
demonstrate the low variability (within a group and across the four litters) seen in the
signature/profile (as opposed to individual histone modification shown in panel “e” above) of
these five different histone modifications in each of the four rat pancreatic islets. Areas
between the rays of the radar plot were assigned as belonging to “activated” (green color) or
“supressed” (orange color) parts of the signature based on the effect of specific histone
modification. The Shoelace formula was then used to measure the areas belonging to
“activated” or “suppressed” signature. Results were compared using t-test. h) table
representing the actual areas for signatures of “active” (labelled as Active truncated area) and
“suppressed” (labelled as Supressed area) gene promoters in each of the four Undernourished
and Recuperation rats shown in panel f and g. The area tabulated as ‘Active area’ is the sum
of the green and yellow areas (from radar plots) and represents the sum of areas for the
activated modifications (from H3Ac to H3K4 through H4Ac) as well as the areas between
activated and suppressed regions (yellow region between H3Ac to H3K9 and between H3K4
to H3K20).
i-l) Pancreas from 33-week old rats (n=6, three males, four litters) were taken for islet
isolation. Islet cells were cross-linked and processed for Chromatin immunoprecipitation
using protocol described herein. Two of the samples (one of each gender) had to be pooled at
the post-clearing stage due to low amounts of immunoprecipitated DNA.
Immunoprecipitation was carried out for the epigenetic modulators LSD1 and KMT1a as well
as the pancreatic homeobox gene 1 protein PDX1. Following immunoprecipitation and DNA
isolation, real-time PCR was carried out using primers targeting the ins-2 gene promoter
region so as to find out recruitment of these epigenetic modulators and the transcription factor
PDX1 at the insulin gene promoter region. Panels (i) and (j) present radar plots for
Undernourished and Recuperation rats respectively (presented as mean of all values). Panels
(k) and (l) present the radar plots for four of the Undernourished and Recuperation individual
rat(s) respectively.
m) We demonstrate that Wistar rats that are fed a diet that not only provides lower amounts
of protein but also fewer calories and most importantly, inadequate micronutrients, impacts
epigenetic mechanisms resulting in significant metabolic defects.
At a cellular level, Undernourished and Recuperation rats showed higher levels of H3K9
methylation in the pancreas as well as increased recruitment of KMT1a at insulin gene
promoter in Undernourished rats. KMT1a and LSD1 confer repressive epigenetic
conformation that possibly limits the transcription efficiency (as represented in this cartoon
by the binding of RNAPII and PDX1 to ins-2 gene promoter region) leading to significantly
lower levels of pro-insulin mRNA in the cells.
Any improvement in activated / repressed epigenetic marks at insulin gene promoter region
seen in Recuperation rats may be responsible for increase in islet insulin content (possibly
through efficient translation or other mechanisms currently unknown). Undernourished and
Recuperation rats show insulin resistance (Figure 3A-D) as represented by a non-functional
(grey colour) insulin receptor on peripheral cells, resulting in higher circulating glucose and
therefore higher insulin concentrations.
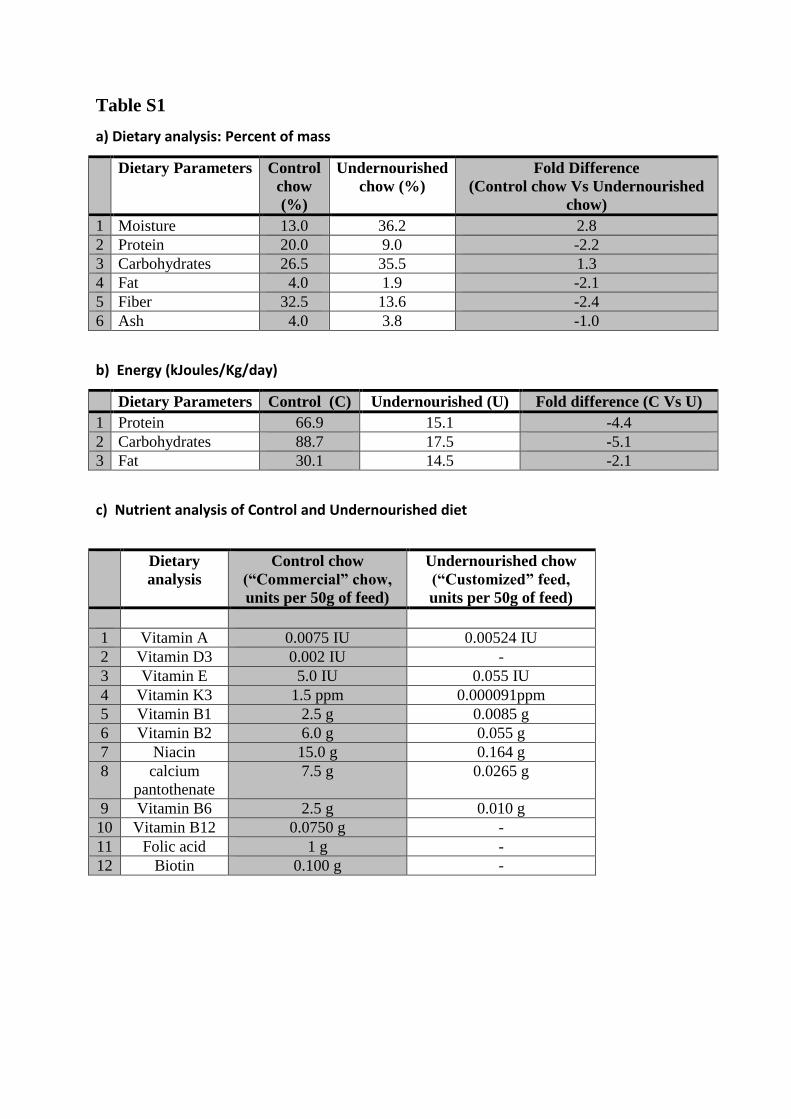
Table S1
a) Dietary analysis: Percent of mass
Dietary Parameters Control
chow
(%)
Undernourished
chow (%)
Fold Difference
(Control chow Vs Undernourished
chow)
1 Moisture 13.0 36.2 2.8
2 Protein 20.0 9.0 -2.2
3 Carbohydrates 26.5 35.5 1.3
4 Fat 4.0 1.9 -2.1
5 Fiber 32.5 13.6 -2.4
6 Ash 4.0 3.8 -1.0
b) Energy (kJoules/Kg/day)
Dietary Parameters Control (C) Undernourished (U) Fold difference (C Vs U)
1 Protein 66.9 15.1 -4.4
2 Carbohydrates 88.7 17.5 -5.1
3 Fat 30.1 14.5 -2.1
c) Nutrient analysis of Control and Undernourished diet
Dietary
analysis
Control chow
(“Commercial” chow,
units per 50g of feed)
Undernourished chow
(“Customized” feed,
units per 50g of feed)
1 Vitamin A 0.0075 IU 0.00524 IU
2 Vitamin D3 0.002 IU -
3 Vitamin E 5.0 IU 0.055 IU
4 Vitamin K3 1.5 ppm 0.000091ppm
5 Vitamin B1 2.5 g 0.0085 g
6 Vitamin B2 6.0 g 0.055 g
7 Niacin 15.0 g 0.164 g
8 calcium
pantothenate
7.5 g 0.0265 g
9 Vitamin B6 2.5 g 0.010 g
10 Vitamin B12 0.0750 g -
11 Folic acid 1 g -
12 Biotin 0.100 g -
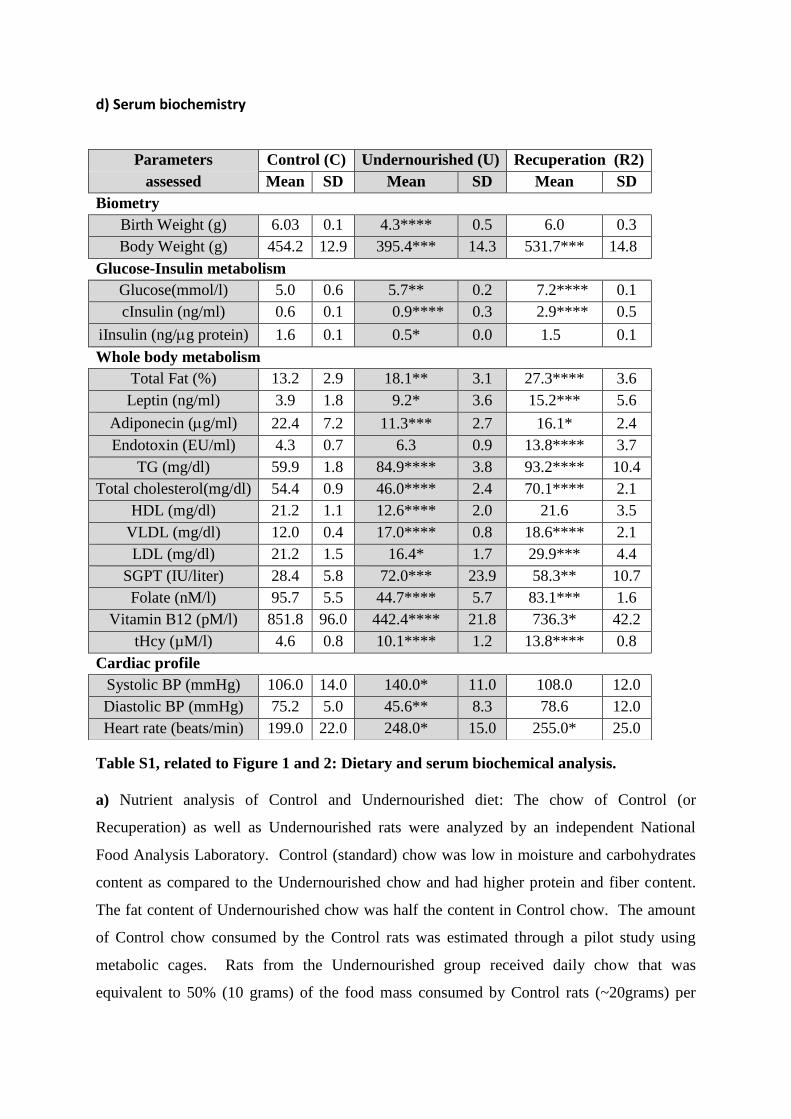
d) Serum biochemistry
Table S1, related to Figure 1 and 2: Dietary and serum biochemical analysis.
a) Nutrient analysis of Control and Undernourished diet: The chow of Control (or
Recuperation) as well as Undernourished rats were analyzed by an independent National
Food Analysis Laboratory. Control (standard) chow was low in moisture and carbohydrates
content as compared to the Undernourished chow and had higher protein and fiber content.
The fat content of Undernourished chow was half the content in Control chow. The amount
of Control chow consumed by the Control rats was estimated through a pilot study using
metabolic cages. Rats from the Undernourished group received daily chow that was
equivalent to 50% (10 grams) of the food mass consumed by Control rats (~20grams) per
Parameters Control (C) Undernourished (U) Recuperation (R2)
assessed Mean SD Mean SD Mean SD
Biometry
Birth Weight (g) 6.03 0.1 4.3**** 0.5 6.0 0.3
Body Weight (g) 454.2 12.9 395.4*** 14.3 531.7*** 14.8
Glucose-Insulin metabolism
Glucose(mmol/l) 5.0 0.6 5.7** 0.2 7.2**** 0.1
cInsulin (ng/ml) 0.6 0.1 0.9**** 0.3 2.9**** 0.5
iInsulin (ng/g protein) 1.6 0.1 0.5* 0.0 1.5 0.1
Whole body metabolism
Total Fat (%) 13.2 2.9 18.1** 3.1 27.3**** 3.6
Leptin (ng/ml) 3.9 1.8 9.2* 3.6 15.2*** 5.6
Adiponecin (g/ml) 22.4 7.2 11.3*** 2.7 16.1* 2.4
Endotoxin (EU/ml) 4.3 0.7 6.3 0.9 13.8**** 3.7
TG (mg/dl) 59.9 1.8 84.9**** 3.8 93.2**** 10.4
Total cholesterol(mg/dl) 54.4 0.9 46.0**** 2.4 70.1**** 2.1
HDL (mg/dl) 21.2 1.1 12.6**** 2.0 21.6 3.5
VLDL (mg/dl) 12.0 0.4 17.0**** 0.8 18.6**** 2.1
LDL (mg/dl) 21.2 1.5 16.4* 1.7 29.9*** 4.4
SGPT (IU/liter) 28.4 5.8 72.0*** 23.9 58.3** 10.7
Folate (nM/l) 95.7 5.5 44.7**** 5.7 83.1*** 1.6
Vitamin B12 (pM/l) 851.8 96.0 442.4**** 21.8 736.3* 42.2
tHcy (µM/l) 4.6 0.8 10.1**** 1.2 13.8**** 0.8
Cardiac profile
Systolic BP (mmHg) 106.0 14.0 140.0* 11.0 108.0 12.0
Diastolic BP (mmHg) 75.2 5.0 45.6** 8.3 78.6 12.0
Heart rate (beats/min) 199.0 22.0 248.0* 15.0 255.0* 25.0

day. b) Since carbohydrates, proteins and fats together constitute 100% of dietary energy, the
net % reduction in total calories was 2.1-times less and the protein was 4.4-times less than
those in the control diet. The source and complexity of carbohydrate (starch) was the same in
both the diets. c) Dietary analysis was carried out by assessment of actual food constituents of
the Undernourished rat chow by an independent analytical laboratory (VRK Nutritional
Solutions, Pune, India). The values for micronutrients in the control diet were significantly
higher in the Control rat chow and were obtained directly from the commercial feed (chow)
provider. d) Serum biochemistry of Control, Undernourished and Recuperation (R2) rats at
33 weeks of age. Age and gender matched Control rats were compared with Undernourished
and Recuperation (R2) rats for biometric, biochemical and metabolic profiles. “c” in the table
refers to “circulating” insulin, while “i” in the table refers to “islet” insulin. Data are
presented as mean + SD. *p<0.05, **p<0.01, ***p<0.001 and ****p<0.0001, n ≥ 6 (>4
litters) in each group; all comparisons against Controls.

Supplemental movie legends
Supplemental Online Movie 1, related to Figure 2: Localization of fat depots in the
Recuperation rats
Recuperation rats (normal Wistar rats undernourished for 50 generations and then examined
after two generations of unrestricted access to Control chow) showed significant increase in
adiposity (Figure 2C-E, Figure S1f,g). This movie demonstrates the localized deposition of
adipose tissue using MRI while the rat is scanned from dorsal to ventral side. All adipose
tissue appears white in color on MRI – note the fatty deposition in liver, which is confirmed
by immunostaining in Figure S2a,b.
Supplemental Online Movie 2, related to Figure 1: Control rats
Control chow fed Wistar rats visualized during mid-day. Control rats were typically active
and showed the usual exploratory behavior in the day. Note they also appeared leaner than
the Recuperation rats (Supplemental online movie 3).
Supplemental Online Movie 3, related to Figure 2: Recuperation rats
Recuperation rats (normal Wistar rats undernourished for 50 generations and then examined
after two generations of unrestricted access to Control chow) appeared obese as compared to
the Control rats (Supplemental movie 2) and did not show any significant activity during
mid-day. The image capture and playback settings for this movie are identical to that of the
Control animals (Supplemental online movie 2).
Supplemental experimental procedures
Animals: Normal Wistar rats were fed a standard commercial chow diet for up to 52
generations (Control rats) or provided 50% restricted (by mass) low protein and high
carbohydrate specialty chow (Undernourished rats; see Table S1a-c). In order to assess the
metabolic effects of nutrient transition, undernourished rats after 50 generations of protein-
caloric undernutrition were transferred on to the normal (Control) chow diet and given food
and water ad libitum from day 0 of pregnancy (Day of mating is calculated as Day 0 of
pregnancy. When a vaginal plug is confirmed in the breeding female, this is noted as Day 0.5
of pregnancy). For reasons unknown to us as yet, we found that the first generation of
Recuperation rats (R1) showed significantly smaller litter size (data not shown) and we had to
use these low numbers of R1 rats to set up the breeding pairs for the second generation of
Recuperation rats (R2). Therefore all studies were carried out on the second generation of
these Recuperation rats (R2 rats; Figure 2) and are presented throughout this manuscript. In
order to avoid any genetic drift in this outbred line, two colonies (Colony 1 and Colony 2)
were established at the participating institutions which are geographically separated and
managed by different primary animal care takers (Figure S1a).
The breeding strategy is illustrated in Figure S1a and was planned such that
i) Ten to 12 different lines were maintained at a time (N1, N2,N3 etc & B1, B2 B3
etc…)
ii) males from one line (within a colony) are used as breeders with females from a
different line (within the same colony).
iii) males are replaced at every other generation.
iv) twenty-five percent of the breeding stock was replaced every year with a breeding
stock from the other geographically distinct colony (see Figure S1a) to maintain the
variability achieved through outbreeding.
Although these strategies can maintain variability, we recognize that commercial vendors
would maintain over 200 such lines, which was not possible for us in an academic setting. It
can therefore be argued that a potential genetic drift may be introduced through the breeding
process wherein certain alleles may be selected and be the underlying cause of the metabolic
defects observed in our Undernourished and Recuperation rat colonies. Although preliminary
analysis targeting MTHFR and TCN2 gene loci does not indicate any differences in gene
sequence, one of the limitations of the present study is that whole genomic sequencing of rats
from the three groups (Control, Undernourished and Recuperation), is not available.
Although such data can be obtained at lower (~4X) coverage of the genome, these will not be
conclusive due to the resolution offered at that coverage. A desired (40X) coverage in whole
genome sequencing, will form part of a future study that is planned for the coming year.
Control rats are housed under standard conditions and allowed free access to standard rat
chow and water at all times. The mass of daily feed consumed by the Control rats was
measured in a pilot study using metabolic cages and 50% restriction of calories was
introduced in the Undernourished rats so as to mimic the protein-caloric undernutrition often
seen in countries from the developing world. Recuperation rats were maintained on the
Control chow and under the exact same conditions as for the Control rats. Animals are
housed under 12 hour day / night cycle. Institutional guidelines for the use and care of
laboratory animals are followed at all times. The procedures detailed in this study were
approved by the NCCS/NTC Ethics and Animal Welfare Committees and access provided as
per the ICMR/ Government of India guidelines on the use of laboratory animals.
Dietary intake and body composition:
All measurements for food intake were carried out using metabolic cages (Harvard
Apparatus, Holliston, MA). The chow of Control (and Recuperation) as well as
Undernourished animals was analyzed by an independent National Food Analysis Laboratory
and presented after normalization to the mean weight of chow consumed by Control or
Undernourished rats (Table S1a-c). Dietary micronutrient analysis was carried out by
assessment of actual food constituents of the Undernourished chow by an independent
analytical laboratory (VRK Nutritional Solutions, Pune, India). The micronutrient values for
Control chow were obtained directly from the provider (Table S1c). The dietary intake for
Undernourished rats was decided at the onset of the study. No significant change was
observed in the dietary intake of Control rats over the 52 generations.
Biometric measurements:
Animals (n=6 to 8) were sedated with isoflurane and weighed on an electronic balance
(BL6205, Shimadzu Corp., Japan; least count (LC) 0.01 g). Length was measured from tip of
the snout to tip of the tail in a ‘relaxed’ posture with a non-stretchable tape (John Bull,
London, UK). Since the length is dependent on skeletal development, (including the
development of caudal vertebrae), we measured total length as that from snout to tip of the
tail. Measurement of tail length along with snout to rump length has been described earlier
(Hughes and Tanner, 1970). Head circumference was measured at a standardized point just
behind the ear base. Skin-fold thickness was measured on the back (caudal to the ribcage)
with Harpenden calipers (John Bull, London, UK). Abdominal girth (an index of ‘central
adiposity’) was measured above the hind limbs (Figure 1G, S1f). Three observers carried out
all measurements presented in this study (c.v <3 %).
Biochemical estimations:
The individual biochemical estimations were performed using at least 6 samples from each
group (Table S1d).
Glucose and insulin estimations: Plasma glucose was estimated by a glucose oxidase method
using Analox GM7 analyser (Analox Instruments, London, UK) and calibration standards
from Sigma, Dorset, UK or by using a blood glucose meter (Accu-Chek, Roche Diagnostics,
India), during clamp studies. Serum insulin concentrations were measured by using an
ELISA kit (Linco Research Inc, USA).
Circulating biomarkers: Total cholesterol, HDL-cholesterol and triglycerides were measured
in fasting animals from each group on a Spectrum II Auto analyzer (Abbott Laboratories,
Texas, USA) using standard kits (Sigma-Aldrich, Diagnostic Division, Dorset, UK).
Homocystein was measured using HPLC as described earlier (Puranik et al., 2011). Leptin
and Adiponectin were measured using ELISA kits from Abcam.
Lifespan of Undernourished rats:
We observed that Undernourished animals had a life span of 22 to 30 months. Control rats
had a life span of 32-38 months.
Dual-energy X-ray absorptiometry (DXA):
DXA scans were carried out on age and sex matched animals of 12, 33 or 86 weeks (n=6 to 8
males) using Orthometrics p-DEXA scanner. Total/visceral/s.c. fat mass measured and
adiposity is calculated as amount of fat normalized to body weight at the time of
measurement.
Magnetic resonance imaging (MRI):
MRI was performed on age matched rats using a Siemens 1.5 Tesla machine with 3mm
sections.
Organ weights:
At least six to eight males at 33 weeks age from each group were anaesthetized and dissected
to remove brain, heart, liver, pancreas, spleen and muscle. All organs were immediately
weighed on a balance Shimadzu Corp., Japan; after blotting off excess water from their
surface. Biceps and triceps muscles of the left forelimb were removed and weighed.
Blood sampling:
Fasting blood samples were obtained by retro-orbital puncture under isoflurane anesthesia in
EDTA containing vacutainers. Samples were centrifuged at 4000 rpm for 15 min and plasma
was stored at -80°C until assayed. Similarly an aliquot was collected in nuclease free sterile
tubes and the samples were centrifuged at 4000 rpm for 15 min and serum samples were
stored at -80°C until assayed.
Tolerance tests:
Glucose and insulin tolerance tests were carried out in fasted rats. All animals were bled at
the start of the tests. For glucose tolerance test, glucose was intra-peritoneally injected at a
dose of 2g/Kg body weight and blood glucose concentrations measured at 30-, 60- or 90-
minutes after the glucose load. For insulin tolerance test, rats were intra-peritoneally injected
with 0.15U/Kg body weight soluble insulin (Human Actrapid, Novo Nordisk, India) and
serial glucose concentrations measured.
Hyperinsulinemic-euglycemic clamp studies:
All clamps were carried out based on the guidelines and procedures detailed by Ayala J et al
(Ayala et al., 2006). Briefly, all animals were fasted for 12 hours during the dark cycle and
catheterized after being anesthetized on isoflurane. The left common carotid artery and the
right jugular vein were catheterized for sampling using a catheter with an outer diameter of
2.5 mm. The free catheter end from carotid artery was used to collect 100µl blood per
10min. The free catheter end from the jugular vein was used to infuse insulin and glucose.
The insulin clamp began at 0 min with a primed-continuous infusion of human insulin

300mU/kg bolus followed by 4mU/kg/min. Normoglycemia (90–110mg/dl) is maintained
during clamps by measuring blood glucose every 10min starting at t- 0min and infusing 10%
dextrose as and when necessary. Blood samples were taken every 10min from t-0min to
120min and processed to determine insulin sensitivity (Figure 3C,D).
Cardiovascular measurements:
The EKG and blood pressure data was acquired using Powerlab® and LabChart® softwares
from ADI instruments. A transducer was inserted in the carotid artery of the rat for recording
the systolic and diastolic blood pressure. Data obtained under isoflurane anesthesia were
analyzed using the LabChart® software (Figure S3b-f).
Streptozotocin (STZ) survival curve:
STZ, a pancreatic β-cell toxin, was reconstituted in chilled citrate buffer (pH = 4.5) just prior
to the i.p injection. A 200 mg/Kg b.w. or lower doses of STZ were injected in fed animals
(N>10each). It was observed that following injection of 200mg/Kg STZ, Undernourished
(but not Control) rats showed hypoglycemic convulsions and died within hours of injection.
Therefore lower doses (180 mg/Kg, 125 mg/Kg, 100 mg/Kg, 60 mg/Kg and 25 mg/Kg) are
used. Post-STZ survival was measured as number of rats that survived the dose on
completion of day 4 since STZ injection. The high dose (200mg/Kg) of STZ rendered at
least 90% Control rats diabetic, none died. However, this dose had to be reduced by eight-
times in Undernourished or Recuperation rats to achieve the same effect (>90% rats diabetic
and none dead post-injection). The eight-fold decrease in STZ-dose is therefore presented as
increased susceptibility (Figure S3a) to STZ-induced diabetes (Figure 3E-G). Glucose was
tested by Glukotest strips (Boehringer Mannheim India Ltd., Thane, India). All of the
Undernourished / Recuperation rats became diabetic at the doses tested.
Immunostaining and confocal microscopy:
Anti-insulin antibody (Linco Research Inc, MO) and anti-glucagon (Sigma, St. Louis, MO)
antibodies were used at 1:100 and 1:500 dilutions respectivelly. Alexa-Fluor 488, Alexa-
Fluor 546 and Alexa-Fluor 633 F(ab’)2 secondary antibodies (Molecular Probes, OR) were
used at 1:200 dilution. Hoechst 33342 was used to visualize nuclei. Briefly, tissues were
fixed in 4% freshly prepared paraformaldehyde and then processed to obtain paraffin

sections. Following removal of paraffin and hydration of sections, tissue sections were
permeabilized with chilled 50% methanol, blocked with 4% normal donkey serum and then
incubated with mixture of primary antisera. Primary antibodies were incubated overnight at
4°C, washed with PBS and then incubated with the secondary antibodies at 37°C for 1 hour.
All slides were washed extensively in PBS and mounted in Vectashield mountant. Confocal
images were captured with Zeiss LSM Meta laser scanning microscope using a 63X/1.3 oil
objective with optical slices ~0.8 µm. Magnification, laser and detector gains were set below
saturation and were identical for scanning of all samples. Results presented are
representative fields confirmed from at least three different age/gender matched rat pancreas
in each group (Figure S2c).
Real-time PCR:
Tissue samples were snap frozen upon removal and stored at -80°C until further processing.
All samples were thawed on ice and homogenized using conventional battery operated
handheld homogenizer (Sigma, St. Louis, MO). Tissue lysates were solubilized in 1 ml of
Tri reagent (Sigma, St. Louis, MO) and re-suspended to ensure that all tissue lysates are
solubilized. Total RNA isolated using manufacturer’s instructions was quantified on ND-
1000 spectrophotometer (NanoDrop Technologies, Wilmington, DE) and reverse transcribed
to obtain cDNA using ‘High Capacity cDNA Reverse Transcription Kit’ (Applied
Biosystems, Foster City, CA). Ten nanograms equivalent of cDNA was taken for gene
transcript analysis using validated Assay-on-demand TaqMan PCR probe-primers (Life
Technologies, Carlsbad, CA). Fold-changes were calculated after normalization for 18S
rRNA using 2-∆∆ Ct method as described earlier (Joglekar et al., 2010). Gene transcript
analysis was carried out using 7500 FAST or ViiA-7 PCR systems (Life Technologies,
Carlsbad, CA).
Primers used for real-time PCR were:
Gene name Symbol F/ R Sequence or Catalogue number
1 Insulin-1 ins1 - Life Tech Inventoried | Rn02121433_g1
2 Insulin-2 ins2 - Life Tech Inventoried | Rn01774648_g1
3 DNA methyl transferase A1 dnmt3a1 - Life Tech Inventoried | Rn01027162_g1
Chromatin Immunoprecipitaion (ChIP):
Pancreatic tissues from Control, Undernourished or Recuperation rats were taken for islet
isolation using a standardized procedure in the laboratory, involving collagenase digestion of
the pancreas to liberate the islets from the pancreatic tissue. Islet cell clusters obtained were
used for Chromatin Immunoprecipitation (ChIP) using a slight modification of existing
protocols. Briefly, tissue was trypsinized for 2-3 minutes in a water bath at 37°C, washed to
remove trypsin and then cross-linked using 1% formaldehyde (Sigma, St. Louis, MO). Cells
were then sonicated to generate 300bp to 500bp DNA fragments. Quality and quantity of
chromatin was assessed and immunoprecipitation using antibodies for specific histone
modifications (Millipore, Billerica, MA) was carried out. Precipitation cocktail included
protein A/G plus beads (Pierce, Pittsburgh, PA), sonicated salmon sperm DNA (Amersham
Biosciences Pittsburgh, PA) and BSA (Sigma, St. Louis, MO). Rabbit IgG (Upstate,
Millipore, Billerica, MA) was used as an isotype control. Chromatin was eluted using 2%
SDS, 0.1 M NaHCO3 and 10 mM DTT. Cross-links were reversed by incubating the eluted
chromatin in 4M NaCl for >4-hours at 65°C. This was followed by proteinase-K digestion.
DNA was then extracted using phenol- chloroform- isoamyl alcohol followed by two washes
of 70% ethanol and finally dissolved in nuclease-free water. Real-time PCR was carried out
to measure the relative amount of insulin promoter in each of the immunoprecipitated
fractions using the primers 5′-GCTGTGAACTGGTTCATCAG-3′ (forward) and 5′-
CTGCAGAAAGTGCTCATTGG-3’ (reverse). PCR results are presented relative to Control
levels in Figure S4e or log transformed and presented as radar plots for the epigenetic
signatures in Figure 4B,C and S4f,g, i-l.
Histology:
Pancreas from 12-week old Control (C; N=6), Undernourished (U; N=6) and Recuperation
(R2; N=10) rats were isolated, weighed after blotting excess water and fixed in
paraformaldehyde. Tissues were processed to prepare paraffin blocks, sectioned at every
25µm for 5µm and alternate sections stained with Hematoxylin and Eosin. Every third of the
unstained slides (spaced 150µm apart) was taken for immunostaining using a Guinea pig anti-
Insulin antibody (DAKO) and an Alexa 488 secondary antibody using protocols described
earlier (Joglekar et al., 2009a; Joglekar et al., 2009b). Sections were mounted using
Vectashield mountant containing Hoechst 33342 and visualized on a FLoid fluorescence
system (Life Technologies). Area of insulin-positive cells was measured on the entire section
(final magnification 460X) using blue fluorescence illumination while area of the entire
pancreatic tissue was imaged using standard phase (white light). These area measurements
were used to calculate beta-cell fraction in the pancreas (the ratio of insulin-positive area to
the total area of the pancreatic section). Absolute beta-cell mass per pancreas was calculated
as the product of mean beta-cell fraction and the corresponding pancreatic weight (mg)
(Garofano et al., 1998).
Western blotting:
To assess the abundance of histone methyl transferase (KMT1A) in the pancreas of 33-week-
old Control, Undernourished and Recuperation rats, pancreatic lysates were prepared in RIPA
buffer and isolated protein fractions were measured on Nanodrop. A 10% resolving gel was
used for SDS polyacrylamide gel electrophoresis using 20 ug of total protein per lane.
Electrophoresed proteins were transferred on to membrane according to the instructions
provided by the manufacturer (BioRad) and transfer was confirmed using standard Ponceau S
procedure. The blot was then rinsed and non-specific epitopes were blocked using standard
blocking buffer for 1-hour, washed three times in wash buffer (10 minutes each) and
incubated in KMT1a antibody diluted 1:100 in blocking buffer for 1 hour at room
temperature. Blots were developed using HRP conjugated secondary antibody in blocking
buffer, incubated for 1-hour at room temperature and then washed in generous volumes of
wash buffer. Detection reagent (Luminol) was used as per manufacturer’s protocol and
densitometric analysis was performed using the Bio-Rad imaging system.
Statistical analysis:
Differences between groups were calculated by using one-way or two-way ANOVA and
appropriate post hoc tests. SPPS, GraphPad Prism and Jandel Scientific softwares were used
to assess/plot data. A sample size of six rats in each group is sufficient to identify a
difference of 27% (SD 15% of mean), with 80% power at 2p=0.05 between any two groups,
or to identify a difference of 45% (SD 25% of mean) as statistically significant, with 80%
power at 2p=0.05 between any two groups. Results are expressed as mean + SEM or SD. SD
(Standard Deviation) scores were used to compare organ weights of Undernourished animals
in comparison to the Controls. SD score =∑ [(xi –Xc)/SDc]; wherein xi is individual value in
the experimental (Undernourished or Recuperation) group, Xc is the mean value for the
Control group and SDc is the standard deviation of the Control group. Difference between

groups was tested by one-way ANOVA and Fisher’s LSD test or Student’s t-test, as
appropriate. Serial changes in plasma glucose and insulin concentrations were tested by
paired t-test or one-way ANOVA as appropriate. Computations were performed using
Graphpad® Prism software. Radar plots of the data representing ChIP studies were created
by logarithmically transforming fold over detectable data, using shoelace formula.
Supplemental references
Ayala, J.E., Bracy, D.P., McGuinness, O.P., and Wasserman, D.H. (2006). Considerations in the design of hyperinsulinemic-euglycemic clamps in the conscious mouse. Diabetes 55, 390-397. Chintinne, M., Stange, G., Denys, B., Ling, Z., In 't Veld, P., and Pipeleers, D. (2012). Beta cell count instead of beta cell mass to assess and localize growth in beta cell population following pancreatic duct ligation in mice. PloS one 7, e43959. Garofano, A., Czernichow, P., and Breant, B. (1998). Beta-cell mass and proliferation following late fetal and early postnatal malnutrition in the rat. Diabetologia 41, 1114-1120. Hughes, P.C., and Tanner, J.M. (1970). A longitudinal study of the growth of the black-hooded rat: methods of measurement and rates of growth for skull, limbs, pelvis, nose-rump and tail lengths. J Anat 106, 349-370. Joglekar, M.V., Joglekar, V.M., Joglekar, S.V., and Hardikar, A.A. (2009a). Human fetal pancreatic insulin-producing cells proliferate in vitro. The Journal of endocrinology 201, 27-36. Joglekar, M.V., Patil, D., Joglekar, V.M., Rao, G.V., Reddy, D.N., Mitnala, S., Shouche, Y., and Hardikar, A.A. (2009b). The miR-30 family microRNAs confer epithelial phenotype to human pancreatic cells. Islets 1, 137-147. Joglekar, M.V., Wei, C., and Hardikar, A.A. (2010). Quantitative estimation of multiple miRNAs and mRNAs from a single cell. Cold Spring Harb Protoc 2010, pdb prot5478. Puranik, A.S., Halade, G., Kumar, S., Mogre, R., Apte, K., Vaidya, A.D., and Patwardhan, B. (2011). Cassia auriculata: Aspects of Safety Pharmacology and Drug Interaction. Evidence-based complementary and alternative medicine : eCAM 2011, 915240.
Copyright © 2022 FDOKUMEN