Polyparasite Helminth Infections and Their Association to Anaemia and Undernutrition in Northern...
10
Polyparasite Helminth Infections and Their Association to Anaemia and Undernutrition in Northern Rwanda Denise Mupfasoni 1 , Blaise Karibushi 1 , Artemis Koukounari 2 *, Eugene Ruberanziza 1 , Teddy Kaberuka 1 , Michael H. Kramer 3 , Odette Mukabayire 4 , Michee Kabera 1 , Vianney Nizeyimana 3 , Marie-Alice Deville 2 , Josh Ruxin 1,5 , Joanne P. Webster 2 , Alan Fenwick 2 1 Access Project, Kigali, Rwanda, 2 Schistosomiasis Control Initiative, Department of Infectious Disease Epidemiology, Imperial College London, London, United Kingdom, 3 TRAC Plus - Center for Treatment and Research on AIDS, Malaria, Tuberculosis and Other Epidemics, Kigali, Rwanda, 4 National Reference Laboratory, Kigali, Rwanda, 5 The Earth Institute, Columbia University, New York, New York, United States of America Abstract Background: Intestinal schistosomiasis and soil-transmitted helminth (STH) infections constitute major public health problems in many parts of sub-Saharan Africa. In this study we examined the functional significance of such polyparasite infections in anemia and undernutrition in Rwandan individuals. Methods: Three polyparasite infection profiles were defined, in addition to a reference profile that consisted of either no infections or low-intensity infection with only one of the focal parasite species. Logistic regression models were applied to data of 1,605 individuals from 6 schools in 2 districts of the Northern Province before chemotherapeutic treatment in order to correctly identify individuals who were at higher odds of being anaemic and/or undernourished. Findings: Stunted relative to nonstunted, and males compared to females, were found to be at higher odds of being anaemic independently of polyparasite infection profile. The odds of being wasted were 2-fold greater for children with concurrent infection of at least 2 parasites at M+ intensity compared to those children with the reference profile. Males compared to females and anaemic compared to nonanaemic children were significantly more likely to be stunted. None of the three polyparasite infection profiles were found to have significant effects on stunting. Conclusion: The present data suggest that the levels of polyparasitism, and infection intensities in the Rwandan individuals examined here may be lower as compared to other recent similar epidemiological studies in different regions across sub- Saharan Africa. Neither the odds of anaemia nor the odds of stunting were found to be significantly different in the three- polyparasite infection profiles. However, the odds of wasting were higher in those children with at least two parasites at M+ intensity compared to those children with the reference profile. Nevertheless, despite the low morbidity levels indicated in the population under study here, we recommend sustainable efforts for the deworming of affected populations to be continued in order to support the economic development of the country. Citation: Mupfasoni D, Karibushi B, Koukounari A, Ruberanziza E, Kaberuka T, et al. (2009) Polyparasite Helminth Infections and Their Association to Anaemia and Undernutrition in Northern Rwanda. PLoS Negl Trop Dis 3(9): e517. doi:10.1371/journal.pntd.0000517 Editor: Charles H. King, Case Western Reserve University School of Medicine, United States of America Received April 20, 2009; Accepted August 20, 2009; Published September 15, 2009 Copyright: ß 2009 Mupfasoni et al. This is an open-access article distributed under the terms of the Creative Commons Attribution License, which permits unrestricted use, distribution, and reproduction in any medium, provided the original author and source are credited. Funding: The Rwanda NTD control programme was funded by the international philanthropic organization Geneva Global with Schistosomiasis Control Initiative (SCI) as the technical oversight lead organization. The programme was implemented by the Rwanda Ministry of Health (MoH) in collaboration with the Access project, a Columbia University project with the partnership of the Global Network for Neglected Tropical Diseases (GNNTD) and technical assistance as required by SCI. The funders had no role in study design, data collection and analysis, decision to publish or preparation of the manuscript. Competing Interests: The authors have declared that no competing interests exist. * E-mail: [email protected] Introduction Individuals living primarily in rural areas of low-income countries commonly harbor multiple parasitic infections, including infection with multiple helminth species [1,2,3,4,5,6,7]. In particular, intestinal schistosomiasis and polyparasitic soil-trans- mitted helminths (STHs) infections constitute major public health problems in sub-Saharan Africa [5,7,8]. Despite the considerable attention in epidemiological literature to the profile of the aforementioned infections, there are very few human studies that have examined the morbidity implications of polyparasitism [9,10,11]. Investigating the implications of polyparasitism mor- bidity is particularly relevant for healthcare providers in many developing countries where they must decide screening and treatment strategies in resource-limited settings [10]. The United Nations’ fifth report on world nutrition emphasized that malnutrition is the largest contributor to ill-health in the world and that diet-related risk factors for chronic disease are responsible for a large share of the burden of disease in low mortality developing countries [12]. Furthermore, this same report underscored that the effect of such malnutrition is exacerbated by the 4 to 5 billion individuals in the developing world who simultaneously suffer from iron deficiency and its related form of anemia, whilst it also highlighted the high prevalence of anemia throughout the developing world. The link between hookworm infection and anaemia is well known, and the mechanism of effect through intestinal blood loss www.plosntds.org 1 September 2009 | Volume 3 | Issue 9 | e517
Transcript of Polyparasite Helminth Infections and Their Association to Anaemia and Undernutrition in Northern...
Polyparasite Helminth Infections and Their Associationto Anaemia and Undernutrition in Northern RwandaDenise Mupfasoni1, Blaise Karibushi1, Artemis Koukounari2*, Eugene Ruberanziza1, Teddy Kaberuka1,
Michael H. Kramer3, Odette Mukabayire4, Michee Kabera1, Vianney Nizeyimana3, Marie-Alice Deville2,
Josh Ruxin1,5, Joanne P. Webster2, Alan Fenwick2
1 Access Project, Kigali, Rwanda, 2 Schistosomiasis Control Initiative, Department of Infectious Disease Epidemiology, Imperial College London, London, United Kingdom,
3 TRAC Plus - Center for Treatment and Research on AIDS, Malaria, Tuberculosis and Other Epidemics, Kigali, Rwanda, 4 National Reference Laboratory, Kigali, Rwanda,
5 The Earth Institute, Columbia University, New York, New York, United States of America
Abstract
Background: Intestinal schistosomiasis and soil-transmitted helminth (STH) infections constitute major public healthproblems in many parts of sub-Saharan Africa. In this study we examined the functional significance of such polyparasiteinfections in anemia and undernutrition in Rwandan individuals.
Methods: Three polyparasite infection profiles were defined, in addition to a reference profile that consisted of either noinfections or low-intensity infection with only one of the focal parasite species. Logistic regression models were applied todata of 1,605 individuals from 6 schools in 2 districts of the Northern Province before chemotherapeutic treatment in orderto correctly identify individuals who were at higher odds of being anaemic and/or undernourished.
Findings: Stunted relative to nonstunted, and males compared to females, were found to be at higher odds of beinganaemic independently of polyparasite infection profile. The odds of being wasted were 2-fold greater for children withconcurrent infection of at least 2 parasites at M+ intensity compared to those children with the reference profile. Malescompared to females and anaemic compared to nonanaemic children were significantly more likely to be stunted. None ofthe three polyparasite infection profiles were found to have significant effects on stunting.
Conclusion: The present data suggest that the levels of polyparasitism, and infection intensities in the Rwandan individualsexamined here may be lower as compared to other recent similar epidemiological studies in different regions across sub-Saharan Africa. Neither the odds of anaemia nor the odds of stunting were found to be significantly different in the three-polyparasite infection profiles. However, the odds of wasting were higher in those children with at least two parasites at M+intensity compared to those children with the reference profile. Nevertheless, despite the low morbidity levels indicated inthe population under study here, we recommend sustainable efforts for the deworming of affected populations to becontinued in order to support the economic development of the country.
Citation: Mupfasoni D, Karibushi B, Koukounari A, Ruberanziza E, Kaberuka T, et al. (2009) Polyparasite Helminth Infections and Their Association to Anaemia andUndernutrition in Northern Rwanda. PLoS Negl Trop Dis 3(9): e517. doi:10.1371/journal.pntd.0000517
Editor: Charles H. King, Case Western Reserve University School of Medicine, United States of America
Received April 20, 2009; Accepted August 20, 2009; Published September 15, 2009
Copyright: � 2009 Mupfasoni et al. This is an open-access article distributed under the terms of the Creative Commons Attribution License, which permitsunrestricted use, distribution, and reproduction in any medium, provided the original author and source are credited.
Funding: The Rwanda NTD control programme was funded by the international philanthropic organization Geneva Global with Schistosomiasis Control Initiative(SCI) as the technical oversight lead organization. The programme was implemented by the Rwanda Ministry of Health (MoH) in collaboration with the Accessproject, a Columbia University project with the partnership of the Global Network for Neglected Tropical Diseases (GNNTD) and technical assistance as required bySCI. The funders had no role in study design, data collection and analysis, decision to publish or preparation of the manuscript.
Competing Interests: The authors have declared that no competing interests exist.
* E-mail: [email protected]
Introduction
Individuals living primarily in rural areas of low-income
countries commonly harbor multiple parasitic infections, including
infection with multiple helminth species [1,2,3,4,5,6,7]. In
particular, intestinal schistosomiasis and polyparasitic soil-trans-
mitted helminths (STHs) infections constitute major public health
problems in sub-Saharan Africa [5,7,8]. Despite the considerable
attention in epidemiological literature to the profile of the
aforementioned infections, there are very few human studies that
have examined the morbidity implications of polyparasitism
[9,10,11]. Investigating the implications of polyparasitism mor-
bidity is particularly relevant for healthcare providers in many
developing countries where they must decide screening and
treatment strategies in resource-limited settings [10].
The United Nations’ fifth report on world nutrition emphasized
that malnutrition is the largest contributor to ill-health in the world
and that diet-related risk factors for chronic disease are responsible for
a large share of the burden of disease in low mortality developing
countries [12]. Furthermore, this same report underscored that the
effect of such malnutrition is exacerbated by the 4 to 5 billion
individuals in the developing world who simultaneously suffer from
iron deficiency and its related form of anemia, whilst it also highlighted
the high prevalence of anemia throughout the developing world.
The link between hookworm infection and anaemia is well
known, and the mechanism of effect through intestinal blood loss
www.plosntds.org 1 September 2009 | Volume 3 | Issue 9 | e517

has been described [13,14,15,16,17,18]. Recent large scale studies
have suggested links between heavy intensities of Schistosoma
mansoni infections (the intestinal type of schistosomiasis mainly
found in sub-Saharan Africa) with anaemia and lowered
haemoglobin counts [19,20,21]. The mechanisms underlying S.
mansoni associated anaemia are likely multifactorial (e.g., iron
deficiency due to extra-corporeal loss, splenic sequestration,
autoimmune haemolysis and anaemia of inflammation) and have
also been documented [22,23]. Moderate or high intensities of
Trichuris trichiura are also associated with higher risks of anaemia in
the presence of other STHs [24], while the impact of Ascaris
lumbricoides on anaemia is less clear [10].
Different types of helminth infection may affect nutritional
status in different ways (e.g., nutrient absorption, and degree of
mucosal damage) [25]. Previous studies indicated various
mechanisms through which hookworm, S. mansoni, T. trichiura
and A. lumbricoides infections might alter nutritional status
[11,22,26,27]. Several studies have found positive associations
between malnutrition and the aforementioned intestinal parasites,
but they have always limited their focus to single helminth species
rather than looking at combinations of helminth species present
[28,29,30,31]. In addition, Ezeamama and colleagues [9] have
emphasized the lack, and at the same time the need for,
epidemiological studies that examine the effect of polyparasite
infections at various intensities in a range of morbidities.
In the present study, we have used uniquely detailed data from
the Rwandan national Neglected Tropical Disease (NTD) control
programme in order to refine and understand the functional
significance of polyparasite infections in anaemia and undernutri-
tion in mainly school aged children from two districts in Northern
Rwanda. The objectives of this study were to examine the
distribution and the intensities of such polyparasite infections as
well as to elucidate whether if individuals concurrently infected
with multiple helminth species have measurably increased odds of
being anaemic and/or undernourished.
Methods
Ethics statementEthical approval for Monitoring & Evaluation (M & E) surveys
was obtained from the Rwandan National Ethical Committee and
Columbia University’s International Review Board. The aim of
the survey was explained to the participants, their parents,
guardians and teachers before data collection. Moreover, only
children who had completed their assent form and presented a
consent form signed by their parents were entered in these surveys.
Control programme, study sites, population, sampling,and design
Rwanda is a landlocked country in the Great Lakes region of
east-central Africa, bordered by Uganda, Burundi, the Democratic
Republic of the Congo and Tanzania. It is one of the smallest
countries of Africa (26, 338 km2), but is home to approximately
10.1 million people thus supporting the densest population in
continental Africa, with most of the population engaged in
subsistence agriculture. A verdant country of fertile and hilly
terrain with altitudes varying from 950 m to 4519 m, the small
republic bears the title ‘‘Land of a Thousand Hills’’.
The Rwanda MoH through the Centre for Treatment and
Research on AIDS, Malaria, Tuberculosis and Other Epidemics
(TRAC Plus) - a centre for infectious disease control - was charged
with planning and implementing data collection with the
assistance from the National Reference Laboratory and the Access
project.
For the M & E survey, schools in both districts were randomly
selected from three sample frames to allow the programme to be
evaluated in 2 low-, 2 medium- and 2 high-schistosomiasis
prevalence schools. More precisely these sample frames were
defined as follows:
N one school located less than 1 km away from each of the Lakes
Ruhondo and Burera- this was aimed to represent a high
schistosomiasis prevalence school in each of the 2 districts
N one school located between 2 km and 3 km away from each of
the Lakes Ruhondo and Burera- this was aimed to represent a
medium schistosomiasis prevalence school in each of the 2
districts
N one school located between 4 km and 5 km away from each of
the Lakes Ruhondo and Burera- this was aimed to represent a
low schistosomiasis prevalence school in each of the 2 districts
It should be noted that the aforementioned lakes are located in
different districts and they were selected on the basis that distance
to the lakeshore has been proven useful to screen schools in the
greater region [32]. The required sample sizes for children were
calculated based on schistosomiasis prevalence/intensity data from
schools in various African countries with similar age ranges
assuming expected reductions in S. mansoni intensities over two
annual treatments through EpiSchisto software (http://www.
schoolsandhealth.org/epidynamics.htm); more technical details
have been described elsewhere [33] and hence they are not
repeated here. In addition, 120 adults were randomly selected in
two villages from the two aforementioned districts, which were
located less than 1 km away from each of the lakes. This adult sub-
group was included with the aim of monitoring the future impact
of Mass Drug Administration (MDA) on S. mansoni-related hepatic
fibrosis, where highest morbidity/symptomology tends to be
displayed in this older age group. However, for the purposes of
the current analyses, we decided to include data from individuals
of up to 20 years old, thereby inclusive of the end of the growing
period for late maturers.
These data were collected during February to April in 2008,
based on results of mapping surveys in 2007 (data not presented
here) with the aim to determine pre-treatment levels of the
infection status and some clinical indicators.
Author Summary
The helminth infections—schistosomiasis, hookworm, as-cariasis and trichuriasis—are the main neglected tropicaldiseases (NTDs) to thrive in sub-Saharan Africa. Here weassess the distribution and the intensities of suchpolyparasite infections in two districts of the NorthernProvince in Rwanda and determine whether these areassociated with anaemia, lowered haemoglobin levels andrecent and/or chronic undernutrition. Rwanda is a smalllandlocked country in Central Africa where no research orcontrol efforts on NTDs has been conducted since beforethe genocide in 1994. The current study aimed toelucidate, for the first time post-genocide, the burden ofNTDs on the health of the Rwandan people and potentialassociated morbidity. Despite the fact that we observedlow morbidity levels and intensities of polyparasitehelminth infections, we recommend sustainable effortsfor the deworming of the Rwandan people to becontinued in order to offer a worm-free physical andcognitive development to the children of Rwanda andhence support the economic development of the country.
NTDs in Northern Rwanda
www.plosntds.org 2 September 2009 | Volume 3 | Issue 9 | e517

Infection intensityThe parasite burden was determined by duplicate examination
from different microscopists of one stool specimen, at the same
time, from each study participant for the presence of S. mansoni, T.
trichiura, A. lumbricoides and hookworm (Ancylostoma duodenale) by the
Kato-Katz method. This was due to logistical and financial
reasons and can be justified within the scale of a large-scale control
programme, although we are fully aware that replicate stool
samples over several days are ideally required to accurately
estimate intensity of schistosomiasis and STH. The mean number
of eggs per gram (EPG) of stool for each parasite was used to
define infections of low and moderate/high (M+) intensity in
accordance with WHO-established intensity cutoff values for S.
mansoni, T. trichiura, hookworm and A. lumbricoides infections.
Primary determinant: parasite infection profilesParasite infection profiles were based on infection status of the
study participants; these parasite infection profiles were created
using a similar technique developed in a study conducted in rice-
farming villages in Leyte, The Philippines [9].
Given possible concurrent infection by up to four parasites at
one of three potential intensity levels (none, low, or M+) for each
species, there were 34 = 81 possible unique categories of
polyparasite infections. A total of 47 of the 81 categories were
found in the current Rwandese study population. The sub profiles
were finally condensed into the following 4 infection profiles
corresponding to putatively different risk levels for anaemia and
undernutrition:
1. Reference profile (n = 189): no infection or infection with 1
parasite species at low intensity;
2. Polyparasite infection profile I (n = 582): concurrent infection
with 2, 3, or 4 parasite species at low intensity;
3. Polyparasite infection profile II (n = 543): infection with 1
parasite species at M+ intensity and all other parasite species
present at low intensity or absent;
4. Polyparasite infection profile III (n = 291): concurrent infection
with at least 2 parasite species at M+ intensity and all other
parasite species present at low intensity or absent. More
precisely, in this polyparasite infection profile 6 children had
concurrent infection with 3 or 4 parasites at M+ intensity.
Morbidity indicatorsHeights were measured with height poles which had a fixed
head board and can thus be considered comparable to that of the
NHANES stadiometer (http://www.cdc.gov/nchs/products/
elec_prods/subject/video.htm). More precisely, the stature meter
was placed to the floor and for each individual the tape was pulled
up until zero reached the red line. The upper part of the pole was
then firmly and accurately attached to the wall and fixed with
screws. Finally the meter was pulled down onto the head of
individual to get the measurement. Weights were measured with
electronic balances. Children were asked to remove their shoes
and all heavy clothes if they wore any and this was done in the
morning by the survey team. All persons performing these
measurements were fully trained and experienced in the use of
these protocols, and the same staffs were used throughout to
ensure standardization.
Finger prick blood samples were also obtained from each
individual, sufficient for accurate Hb measurement using a
Hemocue photometer [34]. Indices of the anthropometric status
of the studied children were based on the 2000 growth reference
curves designed by the Centre for Disease Control (CDC) as this
population more closely resembles those in countries like Rwanda
since it includes both human milk and formula-fed infants; these
were computed using the Nutstat program within Epi Info V 3.4.
The fact that the 2000 CDC growth charts consist of sex specific
charts for infants, birth to age 36 months (length-for-age, weight-
for-length, weight-for-age, and head circumference-for-age) and
older children, 2 to 20 years (stature-for-age, weight-for-age and
Body Mass Index (BMI)-for-age) led us also to the decision of
excluding data of individuals more than 20 years old. Low Body
Mass Index is considered an indicator of acute under-nutrition
(thinness or wasting) and is generally associated with failure to gain
weight or a loss of weight [35]. The Z-score cut-off point
recommended by WHO, CDC, and others to classify low
anthropometric levels is 2 Standard Deviation (SD) units below
the reference median for this specific index. A cut-off of -2 BMI
Z-scores was calculated to classify underweight individuals. The
z-scores of height-for-age that were less than 2 SD below the
reference median served to define stunted individuals.
Statistical methodsIn order to examine the adjusted odds ratios (ORs) of anaemia,
wasting and stunting, we tested a range of different approaches of
statistical modeling to correctly identify individuals who have had
higher morbidity as assessed from the outcomes aforementioned.
Because the modeling of the between school variation through
random effects logistic regressions did not prove appropriate for
the statistical analysis of our data, we also employed the
Generalized Estimating Equations (GEE) approach whenever this
was analytically possible. If the GEE algorithm did not converge,
we used conventional logistic regression models. The GEE method
does not explicitly model between-cluster variation; instead it
focuses on and it estimates its counterpart, the within-cluster
similarity of the residuals; it then uses this estimated correlation to
reestimate the regression parameters and to calculate standard
errors which are reasonably accurate and hence lead to the
generation of confidence intervals with the correct coverage rates
[36]. Data management and statistical analyses were performed
using SAS V9 (SAS Institute Inc., Cary, NC, USA).
For all the odds ratios studied, we fitted the random effects
logistic regression models by using PROC NLMIXED while we
employed the GEE method by using PROC GENMOD.
Particularly for the odds of anaemia, we have included as
explanatory variable the parasite infection profiles I-III (as defined
in the previous section); we also consider the nutritional status as
defined by stunting as an effect modifier. We therefore display
estimates with and without considering the effect of stunting; we
also included the interaction term of stunting with the parasite
infection profiles if the change in deviances between relevant
nested models was significant at the 5% significance level.
Similarly, when we modeled the odds of wasting and stunting
respectively, we have included as explanatory variable the parasite
infection profiles I-III while we consider anaemia status as an
effect modifier. Potential confounders of the relationships between
anaemia stunting, wasting and helminth infection were decided to
be included in light of known confounders of these associations
based on published literature [11,20,21,37,38,39] and these were
the categories of age, sex, and the district where study participants
were living in.
Mean Hb concentration of different groups of individuals
recruited in the current study were also initially examined through
a random effects at the school level multivariate linear regression
model by using PROC MIXED. Likelihood ratio tests indicated
that these random effects were not significant and thus it was
NTDs in Northern Rwanda
www.plosntds.org 3 September 2009 | Volume 3 | Issue 9 | e517

finally decided to omit them. However, because of the non-
independence found in our data we finally decided to employ the
GEE method by using PROC GENMOD. We tested as
explanatory variables the categories of age, sex, district and
parasite infection profiles I-III. We also tested the two-way
interaction terms of parasite infection profiles I-III with district
and stunting and retained them in the model if the change in
deviances between the relevant nested models was significant at
the 5% significance level.
Covariates in all aforementioned multivariable models with
p,0.05 were considered significantly associated with outcomes.
Results
A total of 1605 children and adolescents were recruited, for a
participation rate of 88%, and provided complete parasitologic and
anthropometric data. They were aged 5 to 20 years old, with a
median age of 10 years and 47.7% of the recruited individuals were
male. The observed prevalences of wasting, stunting and anaemia
were respectively estimated as following: 8.1% (95% CI: 6.8 to 9.4),
38.5% (36.1 to 40.9) and 4.9% (95% CI: 3.9 to 6.1). The mean
observed Hb concentration was estimated to be 13.8 g/dL (95%
CI: 13.7 to 13.8).
Table 1 contains the characteristics of the study population by
subprofile classification infection category. The most prevalent co-
infections were those of low intensity of A. lumbricoides and T.
trichiura (21.2%).
The adjusted ORs of anaemia from the GEE multivariate
logistic regression models are presented in Table 2. Deviance tests
indicated ‘Model 3’ as the most appropriate one; this model shows
that individuals who are stunted are almost 1.5 times more likely
than non-stunted to be anaemic (OR: 1.6, P = 0.041). Children of
11–13 years old were significantly less likely than children of 5–7
years old to be anaemic (OR = 0.572, P = 0.026). In addition,
males are almost twice more likely to be anaemic compared to
females (OR: 1.9, P = 0.024). Neither the interaction terms of
stunting or district with the parasite infection profiles nor any
other examined variable here were found to be significant factors
for the odds of being anaemic.
GEE did not converge for the modeling of the odds of being
wasted and this is most likely to be explicable by the fact that there
was not sufficient information in order to estimate the binomial
probability structure by taking into account the intra-subject
correlation. Consequently, we used Maximum Likelihood (ML)
and the results of such multivariate logistic regression models for
the odds of being wasted are presented in Table 3. Deviance tests
as well as Akaike’s information criterion (AIC) indicated ‘Model
2’as the best one among the tested models. This model shows that
only children of 11–13 years old were significantly more likely than
the younger children (age group: 5–7 years old) to be wasted
(OR = 1.8, P = 0.033). Furthermore, study participants from
Burera district were significantly more likely to be wasted when
compared with study participants from Musanze district
(OR = 3.3, P,0.001). It is noteworthy that children with
concurrent infection of at least 2 parasite species at M+ intensity
- that is, those with polyparasite infection profiles III - were almost
twice marginally significantly more likely to be wasted than
children with the reference polyparasite infection profile
(OR = 2.2, P = 0.054). Neither the interaction terms of anaemia
status or district with the parasite infection profiles nor any other
examined variable here, were found to be significant factors for the
odds of being wasted.
Table 4 contains the results from the GEE multivariate logistic
regression models for the odds of being stunted. Deviance tests
indicated ‘Model 3’ as the most appropriate one; this model shows
those children of 11–17 years old to have significant positive ORs
if compared with the youngest age group examined here (i.e. 5–7
years old), (more specifically, 11–13 years old: OR = 2.4,
P = 0.001; 14–17 years old: OR = 1.4, P = 0.044). However,
adolescents of 18–20 years old were significantly less likely than
the youngest age group to be stunted (OR = 0.4, P = 0.003). Male
individuals were significantly more likely than females to be
stunted (OR = 1.9, P,0.001). Study participants from Burera
district were significantly less likely to be stunted than the study
participants from Musanze district (OR = 0.4, P,0.001). Anaemic
study participants were significantly more likely than non anaemic
to be stunted (OR = 1.7, P = 0.020). Neither the interaction terms
of anaemia status or district with the parasite infection profiles nor
any other examined variable here were found to be significant
factors for the odds of being stunted.
Finally, Table 5 contains the results from the GEE linear
regression model for the mean Hb concentration and the mean
differences in different groups of the study population here.
Deviance tests indicated ‘Model 3’ as the most appropriate one;
this model shows that on average Hb concentration in the study
population was 13.109 g/dL (95% CI: 12.904–13.314). All
different categories of age yielded significant associations with
increased Hb levels compared to the youngest age group examined
here (i.e., 5–7 years old). Study participants who were stunted
when compared to non-stunted had significantly lower Hb counts
by 0.270 g/dL, respectively (P,0.001).
Discussion
Concurrent multiple parasite infections were found to be the
norm in our study population, as has been reported in studies
published elsewhere [1,2,5,6,9,10]. However, in the current study
population, none of the concurrent polyparasite infections were
found to be significantly associated with higher odds of anaemia,
wasting, stunting nor mean lowered Hb concentration. Neverthe-
less, results did indicate that those study participants with
concurrent infection with at least 2 parasites at M+ intensity were
marginally significantly more likely to be wasted (P = 0.054)
relative to those with no infection or infection with 1 parasite
species at low intensity, thereby validating the impact of higher
intensity infections on health [40].
Potential reasons for the general lack of association of the
concurrent polyparasite infections with anaemia in the current
Rwandan population might be that anaemia itself appears to be
relatively uncommon in this area. One reason for the latter may
relate also to the fact that malaria incidence in the two districts
studied here is lower that the rest of the country, as well as to the
decrease of malaria prevalence in Rwanda in general as an
unpublished WHO Draft of Mid Term Evaluation Report of the
Rwandan Malaria Strategic Plan 2005–2010, reveals. In addition,
as Table 1 indicates, the majority of the study participants (i.e.
21.2%) had low intensities of A. lumbricoides and T. trichiura while
very few of them had M+ intensities of hookworm and S. mansoni
infections. Such a distribution is likely to have limited the power of
this study – potentially making it difficult to achieve statistical
significance where one existed for co-infections of M+ intensities.
M+ intensities of the latter two helminth infections have been
recently shown to be significant factors for anaemia in other
similar epidemiological studies [20,21], and such combined
findings highlight how different factors contribute to anaemia in
different parasite transmission and eco-epidemiological settings.
Indeed we would recommend further similar studies in the eastern
part of Rwanda where there is a higher prevalence of hookworm
NTDs in Northern Rwanda
www.plosntds.org 4 September 2009 | Volume 3 | Issue 9 | e517
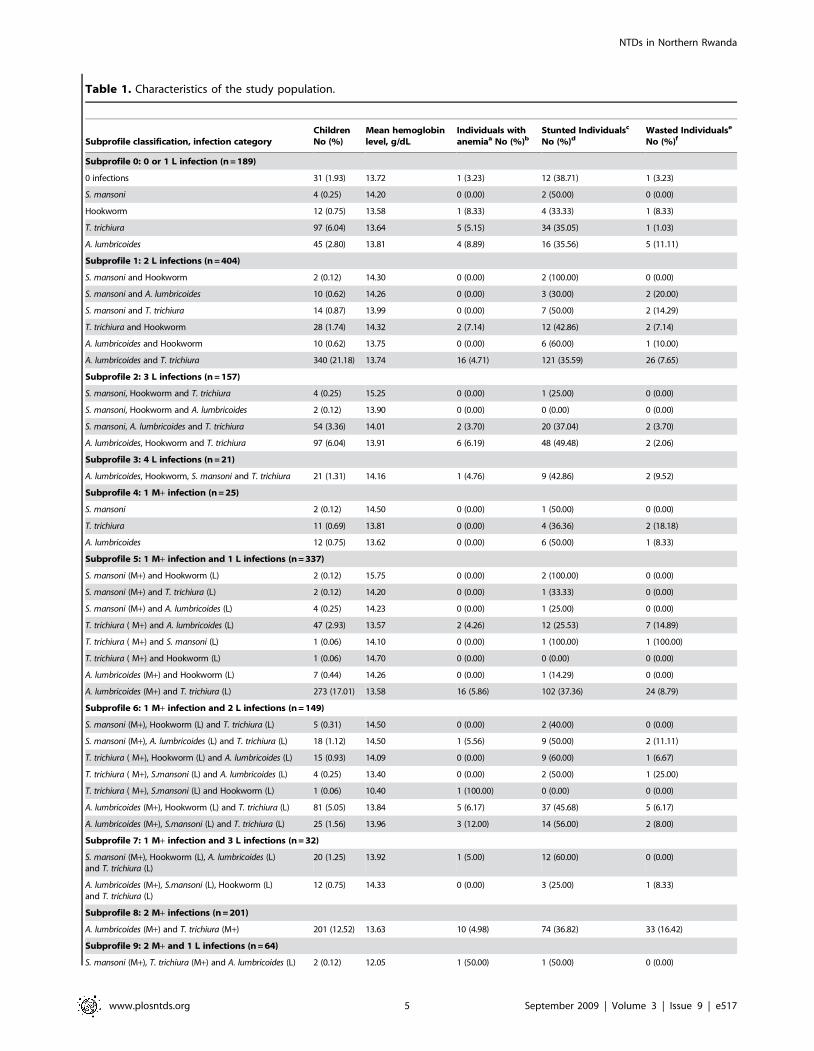
Table 1. Characteristics of the study population.
Subprofile classification, infection categoryChildrenNo (%)
Mean hemoglobinlevel, g/dL
Individuals withanemiaa No (%)b
Stunted Individualsc
No (%)dWasted Individualse
No (%)f
Subprofile 0: 0 or 1 L infection (n = 189)
0 infections 31 (1.93) 13.72 1 (3.23) 12 (38.71) 1 (3.23)
S. mansoni 4 (0.25) 14.20 0 (0.00) 2 (50.00) 0 (0.00)
Hookworm 12 (0.75) 13.58 1 (8.33) 4 (33.33) 1 (8.33)
T. trichiura 97 (6.04) 13.64 5 (5.15) 34 (35.05) 1 (1.03)
A. lumbricoides 45 (2.80) 13.81 4 (8.89) 16 (35.56) 5 (11.11)
Subprofile 1: 2 L infections (n = 404)
S. mansoni and Hookworm 2 (0.12) 14.30 0 (0.00) 2 (100.00) 0 (0.00)
S. mansoni and A. lumbricoides 10 (0.62) 14.26 0 (0.00) 3 (30.00) 2 (20.00)
S. mansoni and T. trichiura 14 (0.87) 13.99 0 (0.00) 7 (50.00) 2 (14.29)
T. trichiura and Hookworm 28 (1.74) 14.32 2 (7.14) 12 (42.86) 2 (7.14)
A. lumbricoides and Hookworm 10 (0.62) 13.75 0 (0.00) 6 (60.00) 1 (10.00)
A. lumbricoides and T. trichiura 340 (21.18) 13.74 16 (4.71) 121 (35.59) 26 (7.65)
Subprofile 2: 3 L infections (n = 157)
S. mansoni, Hookworm and T. trichiura 4 (0.25) 15.25 0 (0.00) 1 (25.00) 0 (0.00)
S. mansoni, Hookworm and A. lumbricoides 2 (0.12) 13.90 0 (0.00) 0 (0.00) 0 (0.00)
S. mansoni, A. lumbricoides and T. trichiura 54 (3.36) 14.01 2 (3.70) 20 (37.04) 2 (3.70)
A. lumbricoides, Hookworm and T. trichiura 97 (6.04) 13.91 6 (6.19) 48 (49.48) 2 (2.06)
Subprofile 3: 4 L infections (n = 21)
A. lumbricoides, Hookworm, S. mansoni and T. trichiura 21 (1.31) 14.16 1 (4.76) 9 (42.86) 2 (9.52)
Subprofile 4: 1 M+ infection (n = 25)
S. mansoni 2 (0.12) 14.50 0 (0.00) 1 (50.00) 0 (0.00)
T. trichiura 11 (0.69) 13.81 0 (0.00) 4 (36.36) 2 (18.18)
A. lumbricoides 12 (0.75) 13.62 0 (0.00) 6 (50.00) 1 (8.33)
Subprofile 5: 1 M+ infection and 1 L infections (n = 337)
S. mansoni (M+) and Hookworm (L) 2 (0.12) 15.75 0 (0.00) 2 (100.00) 0 (0.00)
S. mansoni (M+) and T. trichiura (L) 2 (0.12) 14.20 0 (0.00) 1 (33.33) 0 (0.00)
S. mansoni (M+) and A. lumbricoides (L) 4 (0.25) 14.23 0 (0.00) 1 (25.00) 0 (0.00)
T. trichiura ( M+) and A. lumbricoides (L) 47 (2.93) 13.57 2 (4.26) 12 (25.53) 7 (14.89)
T. trichiura ( M+) and S. mansoni (L) 1 (0.06) 14.10 0 (0.00) 1 (100.00) 1 (100.00)
T. trichiura ( M+) and Hookworm (L) 1 (0.06) 14.70 0 (0.00) 0 (0.00) 0 (0.00)
A. lumbricoides (M+) and Hookworm (L) 7 (0.44) 14.26 0 (0.00) 1 (14.29) 0 (0.00)
A. lumbricoides (M+) and T. trichiura (L) 273 (17.01) 13.58 16 (5.86) 102 (37.36) 24 (8.79)
Subprofile 6: 1 M+ infection and 2 L infections (n = 149)
S. mansoni (M+), Hookworm (L) and T. trichiura (L) 5 (0.31) 14.50 0 (0.00) 2 (40.00) 0 (0.00)
S. mansoni (M+), A. lumbricoides (L) and T. trichiura (L) 18 (1.12) 14.50 1 (5.56) 9 (50.00) 2 (11.11)
T. trichiura ( M+), Hookworm (L) and A. lumbricoides (L) 15 (0.93) 14.09 0 (0.00) 9 (60.00) 1 (6.67)
T. trichiura ( M+), S.mansoni (L) and A. lumbricoides (L) 4 (0.25) 13.40 0 (0.00) 2 (50.00) 1 (25.00)
T. trichiura ( M+), S.mansoni (L) and Hookworm (L) 1 (0.06) 10.40 1 (100.00) 0 (0.00) 0 (0.00)
A. lumbricoides (M+), Hookworm (L) and T. trichiura (L) 81 (5.05) 13.84 5 (6.17) 37 (45.68) 5 (6.17)
A. lumbricoides (M+), S.mansoni (L) and T. trichiura (L) 25 (1.56) 13.96 3 (12.00) 14 (56.00) 2 (8.00)
Subprofile 7: 1 M+ infection and 3 L infections (n = 32)
S. mansoni (M+), Hookworm (L), A. lumbricoides (L)and T. trichiura (L)
20 (1.25) 13.92 1 (5.00) 12 (60.00) 0 (0.00)
A. lumbricoides (M+), S.mansoni (L), Hookworm (L)and T. trichiura (L)
12 (0.75) 14.33 0 (0.00) 3 (25.00) 1 (8.33)
Subprofile 8: 2 M+ infections (n = 201)
A. lumbricoides (M+) and T. trichiura (M+) 201 (12.52) 13.63 10 (4.98) 74 (36.82) 33 (16.42)
Subprofile 9: 2 M+ and 1 L infections (n = 64)
S. mansoni (M+), T. trichiura (M+) and A. lumbricoides (L) 2 (0.12) 12.05 1 (50.00) 1 (50.00) 0 (0.00)
NTDs in Northern Rwanda
www.plosntds.org 5 September 2009 | Volume 3 | Issue 9 | e517

as shown by the STH mapping survey conducted last year by the
NTD control programme (unpublished data) and malaria together
with other country and epidemiological settings, to further
elucidate the potential association of polyparasitism to human
morbidity.
The present study also indicated children of 11–13 years old to
be significantly less likely than children of 5–7 years old to be
anaemic. This finding might be explained by the fact that the
youngest children have recently experienced the high iron demand
of early childhood. We also found males compared to females to
be significantly more likely to be anaemic. A previous study has
discussed that among younger children, boys are more anaemic
than girls but the reasons for this remain still unknown [41]. We
have also attempted to examine if the differences between the
sexes in the odds of being anaemic varied by age, but when the
statistical interactions of age and sex were included in the relevant
model, the algorithm did not converge. Stunted children
compared to non stunted were also demonstrated to be more
likely to be anaemic. This result is supported by the observation
that iron deficiency which leads to anaemia also contributes to
poor growth while it has been demonstrated that supplementation
of iron to anemic children has a positive effect on linear growth
[42]. The effect of the polyparasite infection profile on anaemia
was not found to vary according to stunting.
We also assessed the association between the polyparasite
infection profiles and acute under-nutrition. Children with
concurrent infection with at least two parasites at M+ intensity
relative to those with no infection or infection were found to be
marginally significantly more likely to be wasted (P = 0.054). This
finding might be explained by decreased appetite experienced in
those individuals who harbored two or more parasites at M+intensity. However, significant differences in the odds of wasting
observed within the two districts studied here still remain unclear
as we do not think that the latter would differ in dietary patterns or
socio-economic status.
Regarding chronic undernutrition and concurrent polyparasite
infections, the present cross-sectional study did not find any
significant association with the exception of age and anaemia
status being revealed as a significant factor for stunting. Older
individuals, with the exception of the age group of 18–20 years old,
were found to be more likely to be stunted than the younger age
group studied here (i.e. 5–7 years old). This could imply prior
malnutrition in these individuals as has previously been reported in
Zanzibar and Burkina Faso [43,44]. Furthermore, the findings of
decreased odds of stunting in the older age of 18–20 years old
suggest compensatory growth in height for this age group and this
is consistent with results from longitudinal Senegalese data [45].
Anaemic compared to non-anaemic individuals were also found to
be significantly more likely to be stunted and the causal pathways
for such results have been discussed in the previous paragraph.
However, the effect of the polyparasite infection profile on stunting
was not found to vary according to anaemia status. Finally, it
should be noted that stunting - an indicator of chronic
undernutrition - was the most prevalent form of undernutrition
observed in this study. This has been also found by the Rwanda
demographic health survey 2005 where the Northern province
had the highest prevalence of severe chronic malnutrition [46].
Nevertheless, for the same reasons as mentioned above, any
explanation for the significant differences in the odds of stunting
observed within the two districts studied here still remain unclear.
Our investigation has some limitations. As mentioned above,
due in part to the overdispersed nature of helminth infections eggs
in stool and daily variation in excretion, the ideal protocol is to use
replicate faecal samples over several (ideally a minimum of three)
consecutive days [47]. Unfortunately due to the logistical and
financial constraints inherent within the scale of such a large-scale
Subprofile classification, infection categoryChildrenNo (%)
Mean hemoglobinlevel, g/dL
Individuals withanemiaa No (%)b
Stunted Individualsc
No (%)dWasted Individualse
No (%)f
S. mansoni (M+), A. lumbricoides (M+) and T. trichiura (L) 17 (1.06) 14.29 1 (5.26) 5 (29.41) 0 (0.00)
A. lumbricoides (M+), T. trichiura (M+) and S. mansoni (L) 15 (0.93) 13.42 0 (0.00) 7 (46.67) 2 (13.33)
A. lumbricoides (M+), T. trichiura (M+) and Hookworm (L) 29 (1.81) 13.27 1 (3.45) 8 (27.59) 1 (3.45)
A. lumbricoides (M+), S. mansoni (M+) and T. trichiura (L) 1 (0.06) 14.60 0 (0.00) 0 (0.00)
Subprofile 10: 2 M+ and 2 L infections (n = 20)
S. mansoni (M+), T. trichiura (M+), Hookworm (L) and A.lumbricoides (L)
2 (0.12) 14.65 0 (0.00) 1 (50.00) 0 (0.00)
S. mansoni (M+), A. lumbricoides (M+), T. trichiura (L)and Hookworm (L)
7 (0.44) 14.49 0 (0.00) 0 (0.00) 0 (0.00)
A. lumbricoides (M+), T. trichiura (M+), Hookworm (L)and S. mansoni (L)
11 (0.69) 14.35 0 (0.00) 6 (54.55) 0 (0.00)
Subprofile 11: 3 M+ infections or 3 M+ and 1 L infections (n = 6)
S. mansoni (M+), A. lumbricoides (M+), T. trichiura (M+) 2 (0.12) 11.80 1 (50.00) 1 (50.00) 0 (0.00)
S. mansoni (M+), A. lumbricoides (M+), T. trichiura (M+)and Hookworm (L)
4 (0.25) 12.85 0 (0.00) 0 (0.00) 0 (0.00)
aAnaemia was defined for all tables displayed (according to WHO guidelines), as Hb less than 11.5 g/dL for children from 5 to 11 years old and for children between 12and 14 years old as Hb less than 12.0 g/dL. For individuals aged more than 14 years old, anaemia was defined as Hb less 12.0 g/dL for females and Hb less than 13.0 g/dL for males.
bPercentages in this column denote percentages of anaemic within each specific subprofile classification/infection category.cStunting was defined as height for age z-score (HAZ) less than -2.dPercentages in this column denote percentages of stunted within each specific subprofile classification/infection category.eWasting was defined as body mass index z-score (BMIZ) less than -2.fPercentages in this column denote percentages of wasted within each specific subprofile classification/infection category.doi:10.1371/journal.pntd.0000517.t001
Table 1. Cont.
NTDs in Northern Rwanda
www.plosntds.org 6 September 2009 | Volume 3 | Issue 9 | e517
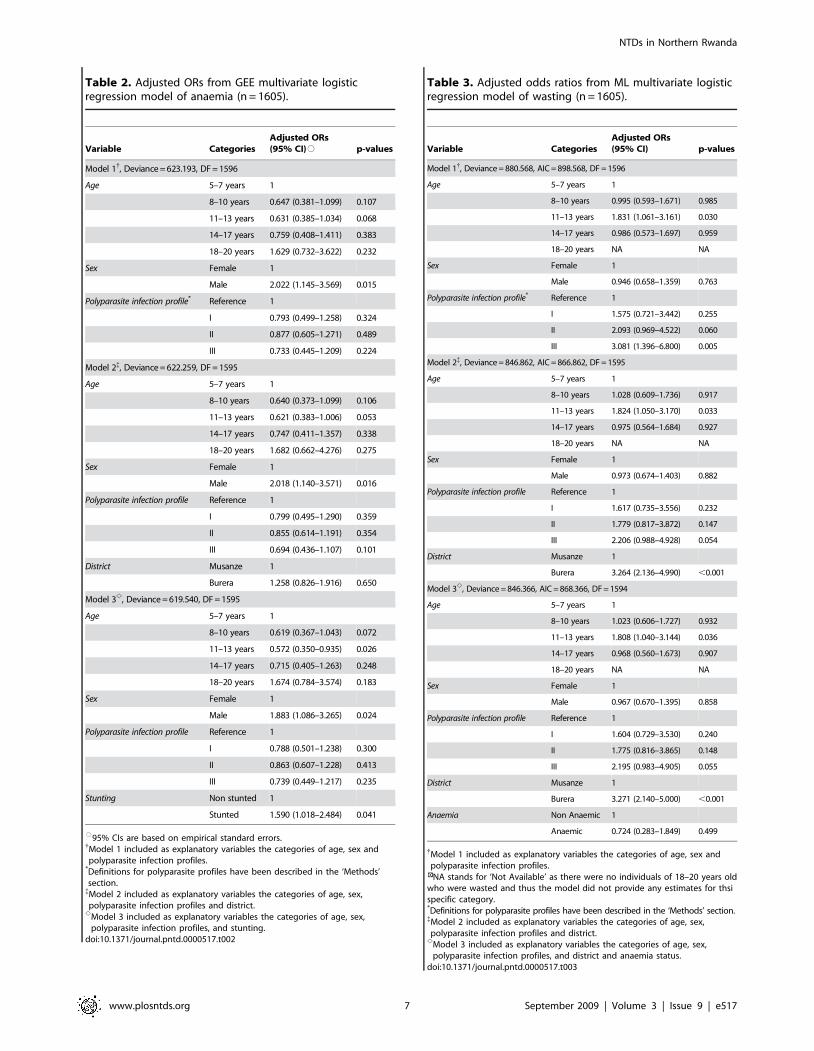
Table 2. Adjusted ORs from GEE multivariate logisticregression model of anaemia (n = 1605).
Variable CategoriesAdjusted ORs(95% CI)# p-values
Model 1{, Deviance = 623.193, DF = 1596
Age 5–7 years 1
8–10 years 0.647 (0.381–1.099) 0.107
11–13 years 0.631 (0.385–1.034) 0.068
14–17 years 0.759 (0.408–1.411) 0.383
18–20 years 1.629 (0.732–3.622) 0.232
Sex Female 1
Male 2.022 (1.145–3.569) 0.015
Polyparasite infection profile* Reference 1
I 0.793 (0.499–1.258) 0.324
II 0.877 (0.605–1.271) 0.489
III 0.733 (0.445–1.209) 0.224
Model 2{, Deviance = 622.259, DF = 1595
Age 5–7 years 1
8–10 years 0.640 (0.373–1.099) 0.106
11–13 years 0.621 (0.383–1.006) 0.053
14–17 years 0.747 (0.411–1.357) 0.338
18–20 years 1.682 (0.662–4.276) 0.275
Sex Female 1
Male 2.018 (1.140–3.571) 0.016
Polyparasite infection profile Reference 1
I 0.799 (0.495–1.290) 0.359
II 0.855 (0.614–1.191) 0.354
III 0.694 (0.436–1.107) 0.101
District Musanze 1
Burera 1.258 (0.826–1.916) 0.650
Model 3e, Deviance = 619.540, DF = 1595
Age 5–7 years 1
8–10 years 0.619 (0.367–1.043) 0.072
11–13 years 0.572 (0.350–0.935) 0.026
14–17 years 0.715 (0.405–1.263) 0.248
18–20 years 1.674 (0.784–3.574) 0.183
Sex Female 1
Male 1.883 (1.086–3.265) 0.024
Polyparasite infection profile Reference 1
I 0.788 (0.501–1.238) 0.300
II 0.863 (0.607–1.228) 0.413
III 0.739 (0.449–1.217) 0.235
Stunting Non stunted 1
Stunted 1.590 (1.018–2.484) 0.041
#95% CIs are based on empirical standard errors.{Model 1 included as explanatory variables the categories of age, sex andpolyparasite infection profiles.
*Definitions for polyparasite profiles have been described in the ‘Methods’section.{Model 2 included as explanatory variables the categories of age, sex,polyparasite infection profiles and district.
eModel 3 included as explanatory variables the categories of age, sex,polyparasite infection profiles, and stunting.
doi:10.1371/journal.pntd.0000517.t002
Table 3. Adjusted odds ratios from ML multivariate logisticregression model of wasting (n = 1605).
Variable CategoriesAdjusted ORs(95% CI) p-values
Model 1{, Deviance = 880.568, AIC = 898.568, DF = 1596
Age 5–7 years 1
8–10 years 0.995 (0.593–1.671) 0.985
11–13 years 1.831 (1.061–3.161) 0.030
14–17 years 0.986 (0.573–1.697) 0.959
18–20 years NA NA
Sex Female 1
Male 0.946 (0.658–1.359) 0.763
Polyparasite infection profile* Reference 1
I 1.575 (0.721–3.442) 0.255
II 2.093 (0.969–4.522) 0.060
III 3.081 (1.396–6.800) 0.005
Model 2{, Deviance = 846.862, AIC = 866.862, DF = 1595
Age 5–7 years 1
8–10 years 1.028 (0.609–1.736) 0.917
11–13 years 1.824 (1.050–3.170) 0.033
14–17 years 0.975 (0.564–1.684) 0.927
18–20 years NA NA
Sex Female 1
Male 0.973 (0.674–1.403) 0.882
Polyparasite infection profile Reference 1
I 1.617 (0.735–3.556) 0.232
II 1.779 (0.817–3.872) 0.147
III 2.206 (0.988–4.928) 0.054
District Musanze 1
Burera 3.264 (2.136–4.990) ,0.001
Model 3e, Deviance = 846.366, AIC = 868.366, DF = 1594
Age 5–7 years 1
8–10 years 1.023 (0.606–1.727) 0.932
11–13 years 1.808 (1.040–3.144) 0.036
14–17 years 0.968 (0.560–1.673) 0.907
18–20 years NA NA
Sex Female 1
Male 0.967 (0.670–1.395) 0.858
Polyparasite infection profile Reference 1
I 1.604 (0.729–3.530) 0.240
II 1.775 (0.816–3.865) 0.148
III 2.195 (0.983–4.905) 0.055
District Musanze 1
Burera 3.271 (2.140–5.000) ,0.001
Anaemia Non Anaemic 1
Anaemic 0.724 (0.283–1.849) 0.499
{Model 1 included as explanatory variables the categories of age, sex andpolyparasite infection profiles.
&N. NA stands for ‘Not Available’ as there were no individuals of 18–20 years oldwho were wasted and thus the model did not provide any estimates for thsispecific category.*Definitions for polyparasite profiles have been described in the ‘Methods’ section.{Model 2 included as explanatory variables the categories of age, sex,polyparasite infection profiles and district.
eModel 3 included as explanatory variables the categories of age, sex,polyparasite infection profiles, and district and anaemia status.
doi:10.1371/journal.pntd.0000517.t003
NTDs in Northern Rwanda
www.plosntds.org 7 September 2009 | Volume 3 | Issue 9 | e517

Table 4. Adjusted odds ratios from GEE multivariate logisticregression model of stunting (n = 1605).
Variable CategoriesAdjusted ORs(95% CI)# p-values
Model 1{, Deviance = 2073.436, DF = 1596
Age 5–7 years 1
8–10 years 1.390 (0.937–2.062) 0.102
11–13 years 2.237 (1.370–3.654) 0.001
14–17 years 1.337 (0.953–1.875) 0.092
18–20 years 0.360 (0.143–0.909) 0.031
Sex Female 1
Male 1.904 (1.648–2.200) ,0.001
Polyparasite infection profile* Reference 1
I 1.030 (0.742–1.431) 0.858
II 1.249 (0.849–1.837) 0.259
III 1.136 (0.642–2.010) 0.662
Model 2{, Deviance = 2016.559, DF = 1595
Age 5–7 years 1
8–10 years 1.450 (0.963–2.182) 0.075
11–13 years 2.354 (1.414–3.919) 0.001
14–17 years 1.403 (0.998–1.972) 0.051
18–20 years 0.405 (0.214–0.769) 0.006
Sex Female 1
Male 1.973 (1.700–2.289) ,0.001
Polyparasite infection profile Reference 1
I 1.043 (0.747–1.456) 0.806
II 1.280 (0.872–1.880) 0.208
III 1.189 (0.660–2.142) 0.565
District Musanze 1
Burera 0.427 (0.309–0.588) ,0.001
Model 3e, Deviance = 2012.140, DF = 1594
Age 5–7 years 1
8–10 years 1.465 (0.973–2.206) 0.068
11–13 years 2.384 (1.428–3.981) 0.001
14–17 years 1.412 (1.009–1.977) 0.044
18–20 years 0.397 (0.214–0.735) 0.003
Sex Female 1
Male 1.942 (1.692–2.228) ,0.001
Polyparasite infection profile Reference 1
I 1.049 (0.755–1.458) 0.775
II 1.286 (0.884–1.871) 0.189
III 1.201 (0.672–2.146) 0.536
District Musanze 1
Burera 0.424 (0.307–0.585) ,0.001
Anaemia Non Anaemic 1
Anaemic 1.671 (1.086–2.572) 0.020
#95% CIs are based on empirical standard errors.{Model 1 included as explanatory variables the categories of age, sex andpolyparasite infection profiles.
*Definitions for polyparasite profiles have been described in the ‘Methods’ section.{Model 2 included as explanatory variables the categories of age, sex,polyparasite infection profiles and district.
eModel 3 included as explanatory variables the categories of age, sex, polyparasiteinfection profiles, and district and anaemia status.
doi:10.1371/journal.pntd.0000517.t004
Table 5. Estimated differences in mean Hb concentration atbaseline for the effects of selected explanatory variables froma GEE linear regression model (n = 1605).
Variable CategoriesAdjusted meandifferences (95% CI) #
p-values
Model 1{, Deviance = 2385.795, DF = 1596
Age Intercept (5–7 years,female, referencepolyparasite profile)
13.052 (12.859–13.246) ,0.001
8–10 years 0.473 (0.391–0.556) ,0.001
11–13 years 0.845 (0.679–1.012) ,0.001
14–17 years 1.342 (1.113–1.571) ,0.001
18–20 years 1.628 (1.137–2.120) ,0.001
Sex Male 20.100 (20.227–0.027) 0.124
Polyparasiteinfection profile*
I 0.093 (20.131–0.317) 0.418
II 0.079 (20.167–0.325) 0.530
III 0.052 (20.145–0.248) 0.605
Model 2{, Deviance = 2381.176, DF = 1595
Age Intercept (5–7 years,female, referencepolyparasite profile,Musanze)
13.098 (12.877–13.319) ,0.001
8–10 years 0.471 (0.392–0.550) ,0.001
11–13 years 0.845 (0.681–1.010) ,0.001
14–17 years 1.342 (1.115–1.568) ,0.001
18–20 years 1.631 (1.154–2.109) ,0.001
Sex Male 20.099 (20.229–0.031) 0.135
Polyparasiteinfection profile
I 0.090 (20.135–0.315) 0.434
II 0.081 (20.169–0.330) 0.527
III 0.057 (20.154–0.268) 0.597
District Burera 20.091 (20.352–0.171) 0.497
Model 3e, Deviance = 2361.793, DF = 1595
Age Intercept (5–7 years,female, referencepolyparasite profile,non stunted)
13.109 (12.904–13.314) ,0.001
8–10 years 0.494 (0.426–0.561) ,0.001
11–13 years 0.896 (0.755–1.037) ,0.001
14–17 years 1.360 (1.142–1.577) ,0.001
18–20 years 1.583 (1.081–2.085) ,0.001
Sex Male 20.060 (20.181–0.061) 0.330
Polyparasiteinfection profile
I 0.096 (20.139–0.330) 0.424
II 0.092 (20.155–0.340) 0.464
III 0.060 (20.155–0.274) 0.587
Stunting Stunted 20.270 (20.336–20.205) ,0.001
#95 % CIs are based on empirical standard errors.{Model 1 included as explanatory variables the categories of age, sex andpolyparasite infection profiles.
*Definitions for polyparasite profiles have been described in the ‘Methods’section.{Model 2 included as explanatory variables the categories of age, sex,polyparasite infection profiles and district.
eModel 3 included as explanatory variables the categories of age, sex,polyparasite infection profiles, and stunting.
doi:10.1371/journal.pntd.0000517.t005
NTDs in Northern Rwanda
www.plosntds.org 8 September 2009 | Volume 3 | Issue 9 | e517

control programme, such ideals cannot realistically be met and
hence duplicate Kato Katz thick smears were taken from a single
day’s stool per individual instead. We are aware that such an
assessment method is likely to have introduced some misclassifi-
cation in the measurement of the intensities of helminth infections
and consequently in the allocation of study participants to the
polyparasite infection profiles. In addition, although we do
recognize that anthropometric measurements should be taken
according to the standardized protocols used by NHANES to
develop the growth charts, some modification to these gold
standard measures are necessarily within the field conditions of
Mass Drug Administration. Nevertheless, we are confident that
every possible precaution was employed by the Rwanda field team
in order to obtain accurate and high quality reproducible data.
Furthermore, we believe that is it high unlikely that the examined
associations of this study were biased by unmeasured confounding
factors such as socio-economic status of the study participants
despite the fact that helminth infections are known to be intimately
linked with poverty [48,49,50,51]. The reason for this is that
surveyed participants most likely would belong to the poorest
populations of the country with no significant variations in their
socio-economic status and thus with no effect in the examined
outcomes here. Therefore overall, despite the aforementioned
potential limitations, this study represents one of the few
quantitative, comprehensively analyzed studies on the epidemiol-
ogy of helminth infections, anaemia and undernutrition in
Rwanda covering a broad age range with an extension particularly
in the adolescents’ years.
In conclusion the results of this study suggest that low-intensity
polyparasite infections are more prevalent in Northern Rwanda,
relative to high intensity polyparasitism, at least in terms of the
major species of parasites under focus in the current study, and
such co-infections appear not to have, alone, a great impact on
anaemia and undernutrition. Consequently based on the current
findings we would support the argument that sufficient chemo-
therapy programmes to prevent high infection intensities build up
in these people even without achieving parasite eradications,
should be promoted. Finally, as currently there is a move towards
drugs for integrated NTDs, we would urge for similar analytical
studies in order to fully evaluate risks and benefits of such
initiatives in helminth endemic regions.
Supporting Information
Alternative Language Abstract S1 Translation of the abstract
into French by MAD.
Found at: doi:10.1371/journal.pntd.0000517.s001 (0.03 MB
DOC)
Acknowledgments
We extend sincere thanks to the schoolchildren, teachers, districts officials
and the population around Lakes Burera and Ruhondo in Burera and
Musanze districts respectively for their participation and assistance in
conducting the field-work. We also thank the field and technical staff
especially the laboratory technicians from district hospitals for their
collaboration and hard work.
Author Contributions
Conceived and designed the experiments: DM BK AK ER TK MHK OM
MK VN. Performed the experiments: DM BK ER TK MHK OM MK
VN. Analyzed the data: AK. Contributed reagents/materials/analysis
tools: AF. Wrote the paper: DM AK. Critical review of and contribution to
intellectual content of paper: DM BK ER TK MHK OM MK VN MAD
JPW AF. Participated in data collection: DM BK ER TK MHK OM MK
VN MAD AF. Drafted the first version of this paper: AK. Obtained the
funding and was the principal investigator: JR.
References
1. Ashford RW, Craig PS, Oppenheimer SJ (1993) Polyparasitism on the Kenya
coast. 2. Spatial heterogeneity in parasite distributions. Ann Trop Med Parasitol
87: 283–293.
2. Chunge RN, Karumba N, Ouma JH, Thiongo FW, Sturrock RF, et al. (1995)
Polyparasitism in two rural communities with endemic Schistosoma mansoni
infection in Machakos District, Kenya. J Trop Med Hyg 98: 440–444.
3. de Cassia Ribeiro Silva R, Barreto ML, Assis AM, de Santana ML, Parraga IM,
et al. (2007) The relative influence of polyparasitism, environment, and host
factors on schistosome infection. Am J Trop Med Hyg 77: 672–675.
4. Drake LJ, Bundy DA (2001) Multiple helminth infections in children: impact
and control. Parasitology 122 Suppl: S73–81.
5. Keiser J, N’Goran EK, Traore M, Lohourignon KL, Singer BH, et al. (2002)
Polyparasitism with Schistosoma mansoni, geohelminths, and intestinal protozoa
in rural Cote d’Ivoire. J Parasitol 88: 461–466.
6. Tchuem Tchuente LA, Behnke JM, Gilbert FS, Southgate VR, Vercruysse J
(2003) Polyparasitism with Schistosoma haematobium and soil-transmitted helminth
infections among school children in Loum, Cameroon. Trop Med Int Health 8:
975–986.
7. Thiong’o FW, Luoba A, Ouma JH (2001) Intestinal helminths and
schistosomiasis among school children in a rural district in Kenya. East Afr
Med J 78: 279–282.
8. Rietveld E, Vetter JC, Stilma JS (1987) Concurrent parasitic infections among
patients with onchocerciasis and controls in Sierra Leone, West Africa. Doc
Ophthalmol 67: 25–32.
9. Ezeamama AE, Friedman JF, Olveda RM, Acosta LP, Kurtis JD, et al. (2005)
Functional significance of low-intensity polyparasite helminth infections in
anemia. J Infect Dis 192: 2160–2170.
10. Ezeamama AE, McGarvey ST, Acosta LP, Zierler S, Manalo DL, et al. (2008)
The Synergistic Effect of Concomitant Schistosomiasis, Hookworm, and Trichuris
Infections on Children’s Anemia Burden. PLoS Negl Trop Dis 2: e245.
11. Jardim-Botelho A, Brooker S, Geiger SM, Fleming F, Souza Lopes AC, et al.
(2008) Age patterns in undernutrition and helminth infection in a rural area of
Brazil: associations with ascariasis and hookworm. Trop Med Int Health 13:
458–467.
12. UN SCN (United Nations System Sub-Committee on Nutrition) (2004) 5th
Report on the World Nutrition Situation: Nutrition for Improved Development
Outcomes. New York.
13. Brooker S, Peshu N, Warn PA, Mosobo M, Guyatt HL, et al. (1999) The
epidemiology of hookworm infection and its contribution to anaemia among
pre-school children on the Kenyan coast. Trans R Soc Trop Med Hyg 93:
240–246.
14. Changhua L, Xiaorong Z, Dongchuan Q, Shuhua X, Hotez PJ, et al. (1999)
Epidemiology of human hookworm infections among adult villagers in Hejiang
and Santai Counties, Sichuan Province, China. Acta Trop 73: 243–249.
15. Crompton DW, Whitehead RR (1993) Hookworm infections and human iron
metabolism. Parasitology 107 Suppl: S137–145.
16. Olsen A, Magnussen P, Ouma JH, Andreassen J, Friis H (1998) The
contribution of hookworm and other parasitic infections to haemoglobin and
iron status among children and adults in western Kenya. Trans R Soc Trop Med
Hyg 92: 643–649.
17. Stoltzfus RJ, Albonico M, Chwaya HM, Savioli L, Tielsch J, et al. (1996)
Hemoquant determination of hookworm-related blood loss and its role in iron
deficiency in African children. Am J Trop Med Hyg 55: 399–404.
18. Stoltzfus RJ, Chwaya HM, Tielsch JM, Schulze KJ, Albonico M, et al. (1997)
Epidemiology of iron deficiency anemia in Zanzibari schoolchildren: the
importance of hookworms. Am J Clin Nutr 65: 153–159.
19. Kabatereine NB, Brooker S, Koukounari A, Kazibwe F, Tukahebwa EM, et al.
(2007) Impact of a national helminth control programme on infection and
morbidity in Ugandan schoolchildren. Bull World Health Organ 85: 91–99.
20. Koukounari A, Estambale BB, Njagi JK, Cundill B, Ajanga A, et al. (2008)
Relationships between anaemia and parasitic infections in Kenyan schoolchil-
dren: a Bayesian hierarchical modelling approach. Int J Parasitol 38:
1663–1671.
21. Koukounari A, Fenwick A, Whawell S, Kabatereine NB, Kazibwe F, et al.
(2006) Morbidity indicators of Schistosoma mansoni: relationship between infection
and anemia in Ugandan schoolchildren before and after praziquantel and
albendazole chemotherapy. Am J Trop Med Hyg 75: 278–286.
22. Friedman JF, Kanzaria HK, McGarvey ST (2005) Human schistosomiasis and
anemia: the relationship and potential mechanisms. Trends Parasitol 21: 386–392.
23. Tolentino K, Friedman JF (2007) An update on anemia in less developed
countries. Am J Trop Med Hyg 77: 44–51.
24. Robertson LJ, Crompton DW, Sanjur D, Nesheim MC (1992) Haemoglobin
concentrations and concomitant infections of hookworm and Trichuris trichiura in
Panamanian primary schoolchildren. Trans R Soc Trop Med Hyg 86: 654–656.
NTDs in Northern Rwanda
www.plosntds.org 9 September 2009 | Volume 3 | Issue 9 | e517

25. Stephenson LS, Latham MC, Ottesen EA (2000) Malnutrition and parasitic
helminth infections. Parasitology 121 Suppl: S23–38.
26. Stephenson L (1993) The impact of schistosomiasis on human nutrition.
Parasitology 107 Suppl: S107–123.
27. Stoltzfus RJ, Dreyfuss ML, Chwaya HM, Albonico M (1997) Hookworm control
as a strategy to prevent iron deficiency. Nutr Rev 55: 223–232.
28. Assis AM, Prado MS, Barreto ML, Reis MG, Conceicao Pinheiro SM, et al.
(2004) Childhood stunting in Northeast Brazil: the role of Schistosoma mansoni
infection and inadequate dietary intake. Eur J Clin Nutr 58: 1022–1029.
29. Corbett EL, Butterworth AE, Fulford AJ, Ouma JH, Sturrock RF (1992)
Nutritional status of children with schistosomiasis mansoni in two different areas
of Machakos District, Kenya. Trans R Soc Trop Med Hyg 86: 266–273.
30. Ferreira HS, Coutinho EM (1999) Should nutrition be considered as a
supplementary measure in schistosomiasis control? Ann Trop Med Parasitol 93:
437–447.
31. Friis H, Mwaniki D, Omondi B, Muniu E, Magnussen P, et al. (1997) Serum
retinol concentrations and Schistosoma mansoni, intestinal helminths, and malarial
parasitemia: a cross-sectional study in Kenyan preschool and primary school
children. Am J Clin Nutr 66: 665–671.
32. Brooker S, Miguel EA, Waswa P, Namunyu R, Moulin S, et al. (2001) The
potential of rapid screening methods for Schistosoma mansoni in western Kenya.
Ann Trop Med Parasitol 95: 343–351.
33. Koukounari A, Sacko M, Keita AD, Gabrielli AF, Landoure A, et al. (2006)
Assessment of ultrasound morbidity indicators of schistosomiasis in the context
of large-scale programs illustrated with experiences from Malian children.
Am J Trop Med Hyg 75: 1042–1052.
34. Parker DR, Bargiota A, Cowan FJ, Corrall RJ (1997) Suspected hypoglycaemia
in out patient practice: accuracy of dried blood spot analysis. Clin Endocrinol
(Oxf) 47: 679–683.
35. Gorstein J, Sullivan K, Yip R, de Onis M, Trowbridge F, et al. (1994) Issues in
the assessment of nutritional status using anthropometry. Bull World Health
Organ 72: 273–283.
36. Hanley JA, Negassa A, Edwardes MD, Forrester JE (2003) Statistical analysis of
correlated data using generalized estimating equations: an orientation.
Am J Epidemiol 157: 364–375.
37. Beasley NM, Tomkins AM, Hall A, Kihamia CM, Lorri W, et al. (1999) The
impact of population level deworming on the haemoglobin levels of
schoolchildren in Tanga, Tanzania. Trop Med Int Health 4: 744–750.
38. Ferreira MR, Souza W, Perez EP, Lapa T, Carvalho AB, et al. (1998) Intestinal
helminthiasis and anaemia in youngsters from Matriz da Luz, district of SaoLourenco da Mata, state of Pernambuco, Brazil. Mem Inst Oswaldo Cruz 93:
289–293.
39. Gilgen DD, Mascie-Taylor CG, Rosetta LL (2001) Intestinal helminthinfections, anaemia and labour productivity of female tea pluckers in
Bangladesh. Trop Med Int Health 6: 449–457.40. Beaver PC (1975) Biology of soil-transmitted helminths: the massive infection.
Health Lab Sci 12: 116–125.
41. Lwambo NJ, Brooker S, Siza JE, Bundy DA, Guyatt H (2000) Age patterns instunting and anaemia in African schoolchildren: a cross-sectional study in
Tanzania. Eur J Clin Nutr 54: 36–40.42. Bhandari N, Bahl R, Taneja S (2001) Effect of micronutrient supplementation
on linear growth of children. Br J Nutr 85 Suppl 2: S131–137.43. Koukounari A, Gabrielli AF, Toure S, Bosque-Oliva E, Zhang Y, et al. (2007)
Schistosoma haematobium infection and morbidity before and after large-scale
administration of praziquantel in Burkina Faso. J Infect Dis 196: 659–669.44. Stoltzfus RJ, Albonico M, Tielsch JM, Chwaya HM, Savioli L (1997) Linear
growth retardation in Zanzibari school children. J Nutr 127: 1099–1105.45. Simondon KB, Simondon F, Simon I, Diallo A, Benefice E, et al. (1998)
Preschool stunting, age at menarche and adolescent height: a longitudinal study
in rural Senegal. Eur J Clin Nutr 52: 412–418.46. Institut National de la Statistique du Rwanda (INSR) and ORC Macro (2006)
Rwanda Demographic andHealth Survey 2005,.47. Webster JP, Koukounari A, Lamberton PHL, Stothard JR, Fenwick A (2009)
Evaluation and application of potential schistosome-associated morbiditymarkers within large-scale mass chemotherapy programmes. Parasitology:
(Article in press).
48. de Silva NR, Brooker S, Hotez PJ, Montresor A, Engels D, et al. (2003) Soil-transmitted helminth infections: updating the global picture. Trends Parasitol
19: 547–551.49. Fenwick A, Molyneux D, Nantulya V (2005) Achieving the Millennium
Development Goals. Lancet 365: 1029–1030.
50. Holland CV, Taren DL, Crompton DW, Nesheim MC, Sanjur D, et al. (1988)Intestinal helminthiases in relation to the socioeconomic environment of
Panamanian children. Soc Sci Med 26: 209–213.51. Raso G, Vounatsou P, Gosoniu L, Tanner M, N’Goran EK, et al. (2006) Risk
factors and spatial patterns of hookworm infection among schoolchildren in arural area of western Cote d’Ivoire. Int J Parasitol 36: 201–210.
NTDs in Northern Rwanda
www.plosntds.org 10 September 2009 | Volume 3 | Issue 9 | e517