Multidisciplinary Design Optimization of Amphibious Aircraft of Unconventional Aerodynamic...
10
Multidisciplinary Design Optimization of Amphibious Aircraft of Unconventional Aerodynamic Configurations Plamen Roglev, MSc. P. O. Box 26, 4001 Plovdiv, BULGARIA [email protected] Abstract: Modern commuter seaplanes have performance that is significantly lower than that of landplanes and that is the reason why they find a limited use. In this work a conceptual design investigation into the application of non-traditional aerodynamic configurations such as canard, tandem and box-wings in regard to improving the flight performance of flying boats is carried out. Also an optimization of the hull shape is shown to provide aerodynamic, hydrodynamic and structural advantages. Seaplanes with optimized design and made from composites can be an effective and practical means of transport and can provide a much wider field for seaplane operations. Keywords: commuter seaplanes, flying boats, amphibious aircraft, optimization 1. Introduction Seaplanes reached the peak of their development both for civil and military operations in the years right after the end of the Second world war. In the 1950’s their use quickly declined, because they lost the competition with landplanes. Nowadays the main use of seaplanes is in the private sector or for niche applications such as fire-fighting or tourist flights. There are a few small companies offering regular passenger service usually to little islands. The main drawbacks of seaplanes in comparison to landplanes are: -Seaplanes have high empty weight fractions. Their structure is heavier, because they have to carry extra weight for what amounts to a boat hull that has to be seaworthy. -The hull with its specific shape creates higher drag than the fuselage of a landplane. - Higher trim drag because of the need of placing the propellers far from the water surface. - The operation and maintenance of seaplanes are more difficult and expensive, partly due to problems with corrosion. - Seaplane service is more sensitive to adverse weather conditions than that from planes taking off and landing on land. It must be pointed out that all of these drawbacks are more expressed for floatplanes than for flying boats. Despite that, floatplanes converted from commuter type aircraft are the prevailing type currently operated for passenger transport [1]. Also it has to be noted that the newest aircraft is already 30 years old. All are made from aluminium alloys and suffer from problems with corrosion. Turboprop Single 0 500 1000 1500 2000 0 200 400 600 800 1000 Range, nm Payload, kg Caravan Caravan Amphibian Turboprop Twin 0 500 1000 1500 2000 0 200 400 600 800 1000 Range, nm Payload, kg Twin Otter Twin Otter Amphibian Seastar Fig. 1: Payload-Range Diagrams for Commuter Aircraft These floatplanes are not competitive to state- of-the-art aircraft - neither in performance nor in cost effectiveness. This can be seen by the payload-range diagrams on Fig. 1. The floatplane variants lose about 20% of their
Transcript of Multidisciplinary Design Optimization of Amphibious Aircraft of Unconventional Aerodynamic...
Multidisciplinary Design Optimization of Amphibious Aircraft of
Unconventional Aerodynamic Configurations Plamen Roglev, MSc.
P. O. Box 26, 4001 Plovdiv, BULGARIA
Abstract: Modern commuter seaplanes have performance that is significantly lower than that
of landplanes and that is the reason why they find a limited use. In this work a conceptual design
investigation into the application of non-traditional aerodynamic configurations such as canard,
tandem and box-wings in regard to improving the flight performance of flying boats is carried out.
Also an optimization of the hull shape is shown to provide aerodynamic, hydrodynamic and structural
advantages. Seaplanes with optimized design and made from composites can be an effective and
practical means of transport and can provide a much wider field for seaplane operations.
Keywords: commuter seaplanes, flying boats, amphibious aircraft, optimization
1. Introduction
Seaplanes reached the peak of their
development both for civil and military
operations in the years right after the end of the
Second world war. In the 1950’s their use
quickly declined, because they lost the
competition with landplanes. Nowadays the
main use of seaplanes is in the private sector or
for niche applications such as fire-fighting or
tourist flights. There are a few small
companies offering regular passenger service
usually to little islands.
The main drawbacks of seaplanes in
comparison to landplanes are:
-Seaplanes have high empty weight fractions.
Their structure is heavier, because they have to
carry extra weight for what amounts to a boat
hull that has to be seaworthy.
-The hull with its specific shape creates higher
drag than the fuselage of a landplane.
- Higher trim drag because of the need of
placing the propellers far from the water
surface.
- The operation and maintenance of seaplanes
are more difficult and expensive, partly due to
problems with corrosion.
- Seaplane service is more sensitive to adverse
weather conditions than that from planes
taking off and landing on land.
It must be pointed out that all of these
drawbacks are more expressed for floatplanes
than for flying boats. Despite that, floatplanes
converted from commuter type aircraft are the
prevailing type currently operated for
passenger transport [1]. Also it has to be
noted that the newest aircraft is already 30
years old. All are made from aluminium
alloys and suffer from problems with
corrosion.
Turboprop Single
0
500
1000
1500
2000
0 200 400 600 800 1000
Range, nm
Payload,
kg Caravan
Caravan
Amphibian
Turboprop Twin
0
500
1000
1500
2000
0 200 400 600 800 1000
Range, nm
Payload,
kg Twin Otter
Twin Otter
Amphibian
Seastar
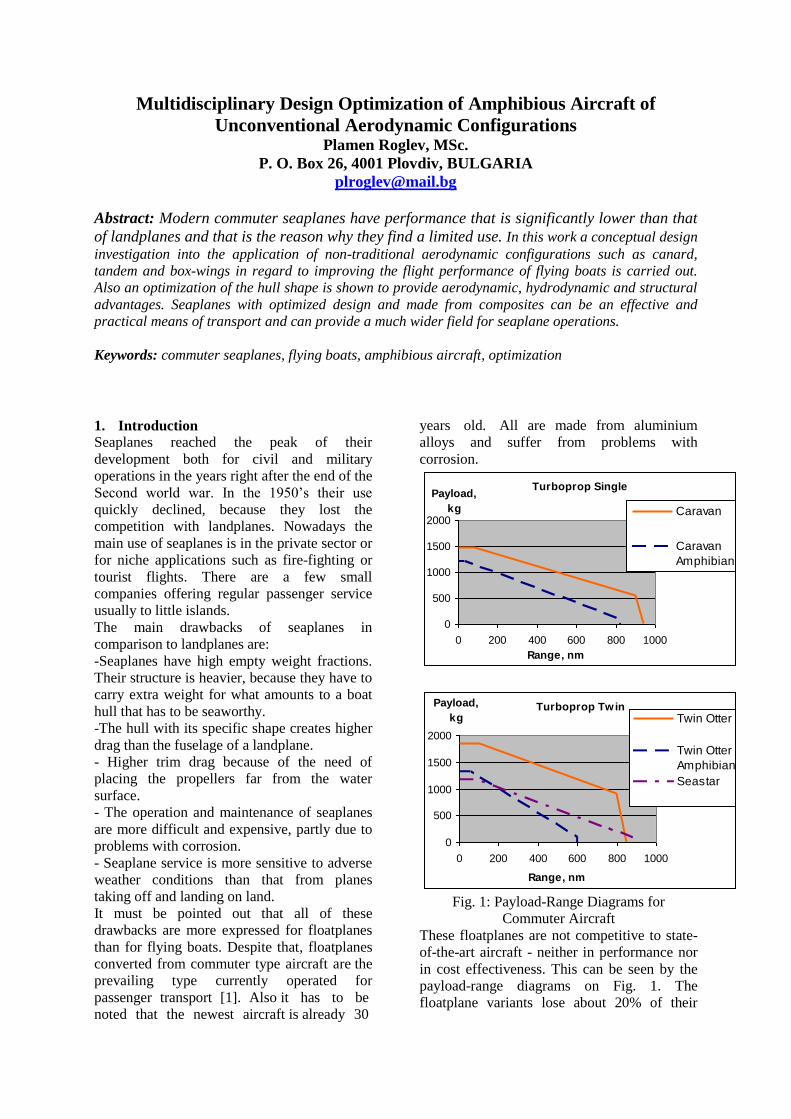
Fig. 1: Payload-Range Diagrams for
Commuter Aircraft
These floatplanes are not competitive to state-
of-the-art aircraft - neither in performance nor
in cost effectiveness. This can be seen by the
payload-range diagrams on Fig. 1. The
floatplane variants lose about 20% of their

payload and range. Their cruising speed is also
about 15% lower but this is not as big a
problem, since they are employed mostly over
distances of up to 100 nm and the influence
upon the block speed is insignificant.
The operation of float planes is limited in
rough waters. They can usually operate up to a
sea state 2. This brings restrictions for
operations in open waters and in strong wind
conditions.
With all those shortcomings of contemporary
commuter seaplanes, it is not difficult to see
why they have such a small market share. And
that is why major aircraft manufactures are not
interested in developing new seaplanes.
Despite all the above stated we should say that
current seaplanes do have competitive
advantages over fast planing boats for
transporting people over medium distances.
Modern passengers demand faster service and
today there are high-speed ferries that travel at
more than 40 knots. As might be seen on Fig.2,
if they were airplanes, they would travel much
faster on the power that they utilise. And they
would be less limited by the sea state.
0
0,05
0,1
0,15
0,2
0,25
0 100 200 300 400 500
Cruise velocity, km/h
Po
we
r to
we
igh
t ra
tio
, k
W/k
g
Seaplanes
Landplanes
Planing Boats-Calm sea
Planing Boats - Stormy
Fig. 2: Power to weight ratio versus cruise
velocity for planing boats and seaplanes.
As pointed in [2] scheduled flights of
floatplanes between islands and off-shore
regions are highly competitive with ferries and
boat transfers. There are companies
successfully offering this service due to a
relatively low ticket price and a high time
saving in comparison to boat transfers.
The results of a survey published in [2] reveal
that operators believe that the growth
of a future seaplane transport system is being
restricted by the availability of suitable
aircraft.
In order the expenses of a new seaplane design
to be justified, it should be able to offer
substantially improved performance, close to
that of landplanes.
Nowadays there are available enabling
technologies that make that possible.
The spreading use of composites in
commercial aircraft is able to facilitate the
design and certification of composite
seaplanes. Advanced composites might
provide important advantages for amphibious
aircraft reducing the problems with corrosion
and providing lighter and better shaped
structures. There are many new designs of
LSA flying boats, some with very good
characteristics that compare favourable to LSA
landplanes, as can be seen on fig. 3.
However only the advantages brought by the
composites alone are not enough for a
commercially successful seaplane. A remake
of an old flying boat with modern materials
will deliver some improvement in performance
and reduction of operating costs, but there are
other important areas such as seaworthiness
and safety that have to be addressed. A major
factor that can support the revival of flying
boats is the progress that builders of high
performance boats have made in planing hull
design. At first the development of seaplanes
aided the design of high speed boats. But as the
research in the field of seaplanes came to a
complete stop after the Second World War,
boat builders lead the way in improvement of
planing hulls. Much can be learned from the
marine application of composites as well. The
experience gained in planing boats design and
construction should be applied to seaplanes in
order to be achieved better and safer
performance in waves.
0,4
0,45
0,5
0,55
0,6
0,65
0,7
0 500 1000 1500 2000
Range, km
EW
/MT
OW
LSA seaplanes
LSA landplanes
Fig.3: Empty weight fractions of LSA aircraft
The design of amphibious aircraft demands
reconciling contradicting requirements for
aerodynamic and structural performance with
seaworthiness. Seaplanes have lower flying
qualities compared to landplanes due to the
need to provide the necessary flotation, planing
qualities, longitudinal and lateral stability and
control, in order to be able to take off and land
on water safely. Simultaneous optimization of
aerodynamic, hydrodynamic and structural
properties of flying boats should be applied if
further improvements in their flying qualities
are to be achieved, as their design is a highly
multidisciplinary activity by nature.
Traditional design of seaplanes is mostly based
on previous example. Despite the extensive
research in the field before and after WW2, the
scope of the studied models was not large.
Theoretical methods have been rather limited
in use. Modern design methodologies allow
broadening the design space. The use of
metamodels ( models of models), also known
as response surfaces or surrogate models,
allows overcoming the difficulties associated
with the direct application of high-fidelity
finite-element methods for the exploration of
the design space and optimization such as
numerical noise and high computational cost,
and allow the inclusion of results obtained
from physical experiments and empirical
relations.
In this work a conceptual design investigation
into the application of non-traditional
aerodynamic configurations such as canard,
tandem and box-wings in regard to improving
the flight performance of flying boats is carried
out. Also an optimization of the hull shape is
shown to provide aerodynamic, hydrodynamic
and structural advantages.
2. Design requirements for a new
commuter seaplane
The existing aircraft types do not satisfy the
future requirements of seaplane operators. But
as the seaplane business has a small market
share and the development of a new aircraft
design is costly, it must be considered that only
a version with improved performance, close to
that of current commuter landplanes, and
aimed at serving a broader market has the
chance to find an investor to develop such a
new generation of seaplanes.
The sizing of a perspective commuter seaplane
is largely dependent on regulations. It should
comply with CS (FAR) -23. For economic
reasons the number of passengers must be the
maximum alloable-19. The gross take-off
weight should be limited to 5670 kg.
For improved safety and ability to operate in
rough waters we should address the following
factors:
-hull design
-take-off and landing speed
Usually the take-off and landing distances are
not limiting factors for seaplane design. But as
the loads inflicted by waves are directly
proportional to the speed on the water, it is
possible to state that in order to improve
operational availability we need not short but
slow take-off and landing seaplanes.
In a FUSETRA study [3] there is a good
presentation of the properties that should be
improved in a new seaplanes design, as viewed
by the operators. Added to the above
mentioned are better passenger comfort, easier
operation and maintenance
3. Hull optimization
The excessive hull drag and weight are the
main factors that bring the worse performance
of seaplanes compared to landplanes. The
flying boat hull is naturally heavy and
voluminous because of having to be
seaworthy. Seaplane hull design is a complex
matter with many aspects to address. More on
it can be found in [4]. But for the conceptual
design stage there are a few important
parameters that have to be determined. The
most important parameter is the beam at the
step which determines the beam load
coefficient:
3bC
(1)
Δ – displacement (weight)
b - beam
ρ – specific weight of water
Hydrodynamic lift coefficient:
2
2
2b
VChl
(2)
The Displacement Froude Number determines
speed regimes on water:
3
g
VF (3)
V- speed
The transition from displacement regime to
planing takes place at the so—called hump
speed when FΔ= 2.
For the longitudinal dynamic stability on water
of great importance is the ratio of the length of
forebody (hull in front of the step) to the beam.
The overall length to beam ratio influences air
drag, structural weight and performance in
waves. The same can be said for the deadrise
angle. More on the influence of the hull
parameters can be found in [5].
Speed Regimes of Hull
0 1 2 3 4 5
Displacement Froude Number
Res
ista
nce
Planing Boats ResistanceSeaplanes Water ResistanceSeaplane DragTotal Seaplane ResistanceThrust
Fig. 4: Comparison of planing boat and
seaplane water resistance
The only way substantial reduction of parasite
drag and weight to be achieved while
providing safe and stable performance on
water is multidisciplinary optimization of the
hull shape of the flying boat. But seaplane
design has primarily to rely on model scale
tests and experience from former projects.
Theoretical methods are rather limited in use
because of the complexity of the flow: A hull
is with a complex geometrical shape and it
passes through different speed regimes with
different types of flow.
Since it is hard for any analytical method to
provide complete flow field calculations with
reliable accuracy, the most effective way to
proceed will be to further develop semi-
empirical methods that allow useful
predictions and integrate them in a MDO
methodology. Of great use here can be the
progress that has been made in the field of
naval architecture which can be put to use in
seaplane design. But there are differences in
behavior of seaplanes to planing boats that
should be taken in consideration (Fig. 3).
We have developed a MDO methodology
employing metamodels (also known as
response surfaces or surrogate models) for the
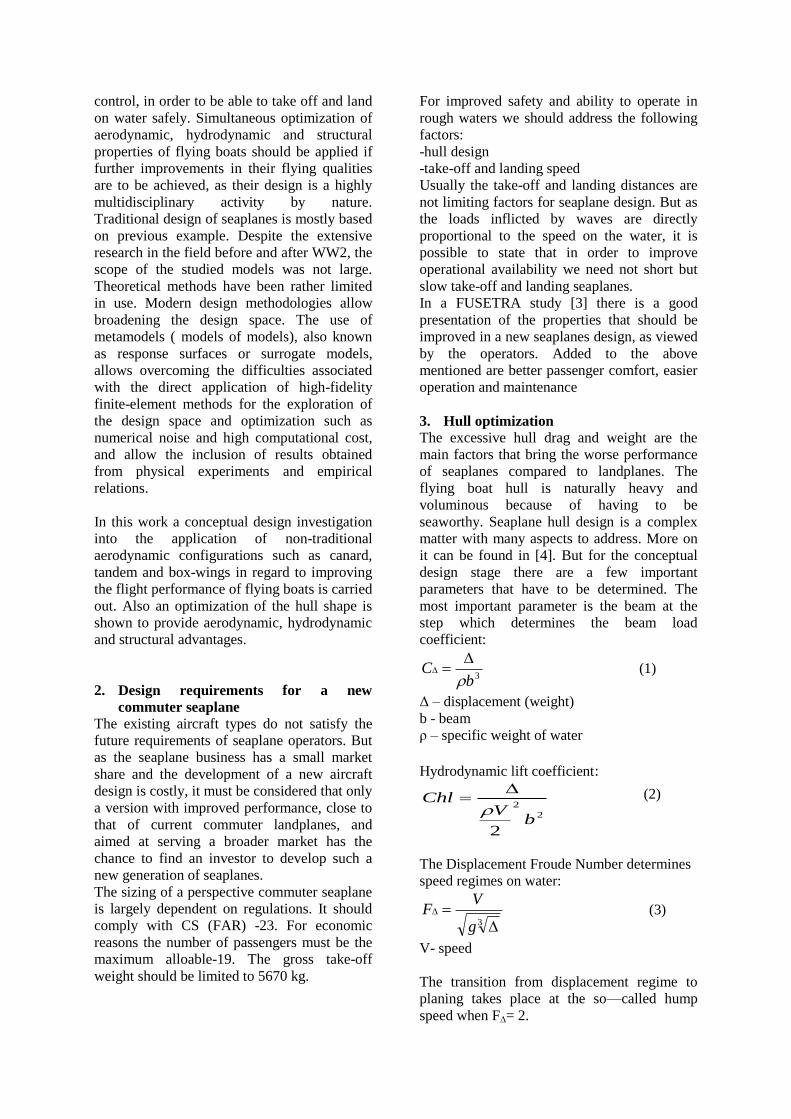
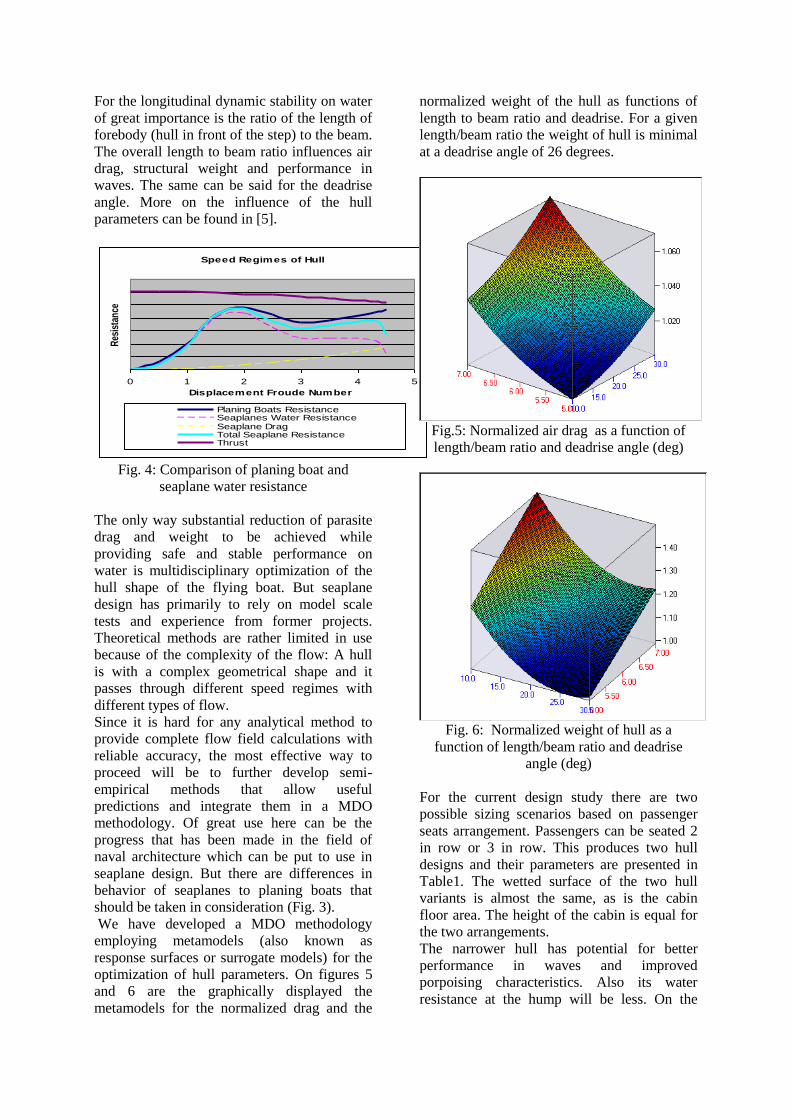
optimization of hull parameters. On figures 5
and 6 are the graphically displayed the
metamodels for the normalized drag and the
normalized weight of the hull as functions of
length to beam ratio and deadrise. For a given
length/beam ratio the weight of hull is minimal
at a deadrise angle of 26 degrees.
Fig.5: Normalized air drag as a function of
length/beam ratio and deadrise angle (deg)
Fig. 6: Normalized weight of hull as a
function of length/beam ratio and deadrise
angle (deg)
For the current design study there are two
possible sizing scenarios based on passenger
seats arrangement. Passengers can be seated 2
in row or 3 in row. This produces two hull
designs and their parameters are presented in
Table1. The wetted surface of the two hull
variants is almost the same, as is the cabin
floor area. The height of the cabin is equal for
the two arrangements.
The narrower hull has potential for better
performance in waves and improved
porpoising characteristics. Also its water
resistance at the hump will be less. On the
aerodynamics side its air drag will be lower.
But its structural weight is higher. How this
affects the overall performance of the seaplane
can be seen on figures 7 and 8.
Table 1. Hull parameters Parameter Unit 2-in-row 3-in-row
Beam m 1.5 1.8
Deadrise Deg. 26 26
Beam Loading 1.68 0,97
Length/Beam ratio 11.0 8,9
Forebody
length/Beam ratio
4.4 3.6
CDh related to wing
area .10-4
9.1 9.8
Hull weight/MTOW 0,26 0.24
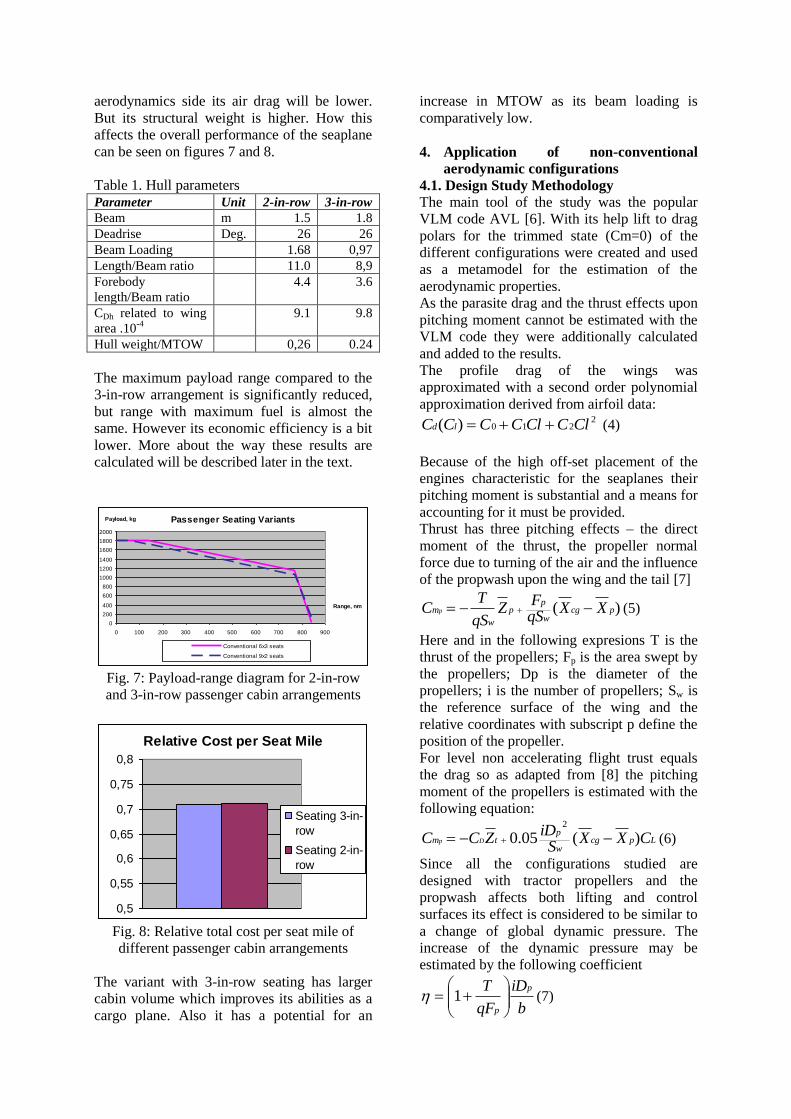
The maximum payload range compared to the
3-in-row arrangement is significantly reduced,
but range with maximum fuel is almost the
same. However its economic efficiency is a bit
lower. More about the way these results are
calculated will be described later in the text.
Passenger Seating Variants
0
200
400
600
800
1000
1200
1400
1600
1800
2000
0 100 200 300 400 500 600 700 800 900
Range, nm
Payload, kg
Conventional 6x3 seats
Conventional 9x2 seats
Fig. 7: Payload-range diagram for 2-in-row
and 3-in-row passenger cabin arrangements
Relative Cost per Seat Mile
0,5
0,55
0,6
0,65
0,7
0,75
0,8
Seating 3-in-
row
Seating 2-in-
row
Fig. 8: Relative total cost per seat mile of
different passenger cabin arrangements
The variant with 3-in-row seating has larger
cabin volume which improves its abilities as a
cargo plane. Also it has a potential for an
increase in MTOW as its beam loading is
comparatively low.
4. Application of non-conventional
aerodynamic configurations
4.1. Design Study Methodology The main tool of the study was the popular
VLM code AVL [6]. With its help lift to drag
polars for the trimmed state (Cm=0) of the
different configurations were created and used
as a metamodel for the estimation of the
aerodynamic properties.
As the parasite drag and the thrust effects upon
pitching moment cannot be estimated with the
VLM code they were additionally calculated
and added to the results.
The profile drag of the wings was
approximated with a second order polynomial
approximation derived from airfoil data: 2
210)( ClCClCCCC ld (4)
Because of the high off-set placement of the
engines characteristic for the seaplanes their
pitching moment is substantial and a means for
accounting for it must be provided.
Thrust has three pitching effects – the direct
moment of the thrust, the propeller normal
force due to turning of the air and the influence
of the propwash upon the wing and the tail [7]
)( pcgw
pp
w
m XXqSF
ZqS
TC p (5)
Here and in the following expresions T is the
thrust of the propellers; Fp is the area swept by
the propellers; Dp is the diameter of the
propellers; i is the number of propellers; Sw is
the reference surface of the wing and the
relative coordinates with subscript p define the
position of the propeller.
For level non accelerating flight trust equals
the drag so as adapted from [8] the pitching
moment of the propellers is estimated with the
following equation:
Lpcgw
ptm CXX
SiD
ZCC Dp )(05.02
(6)
Since all the configurations studied are
designed with tractor propellers and the
propwash affects both lifting and control
surfaces its effect is considered to be similar to
a change of global dynamic pressure. The
increase of the dynamic pressure may be
estimated by the following coefficient
b
iD
qF
T p
p
1 (7)
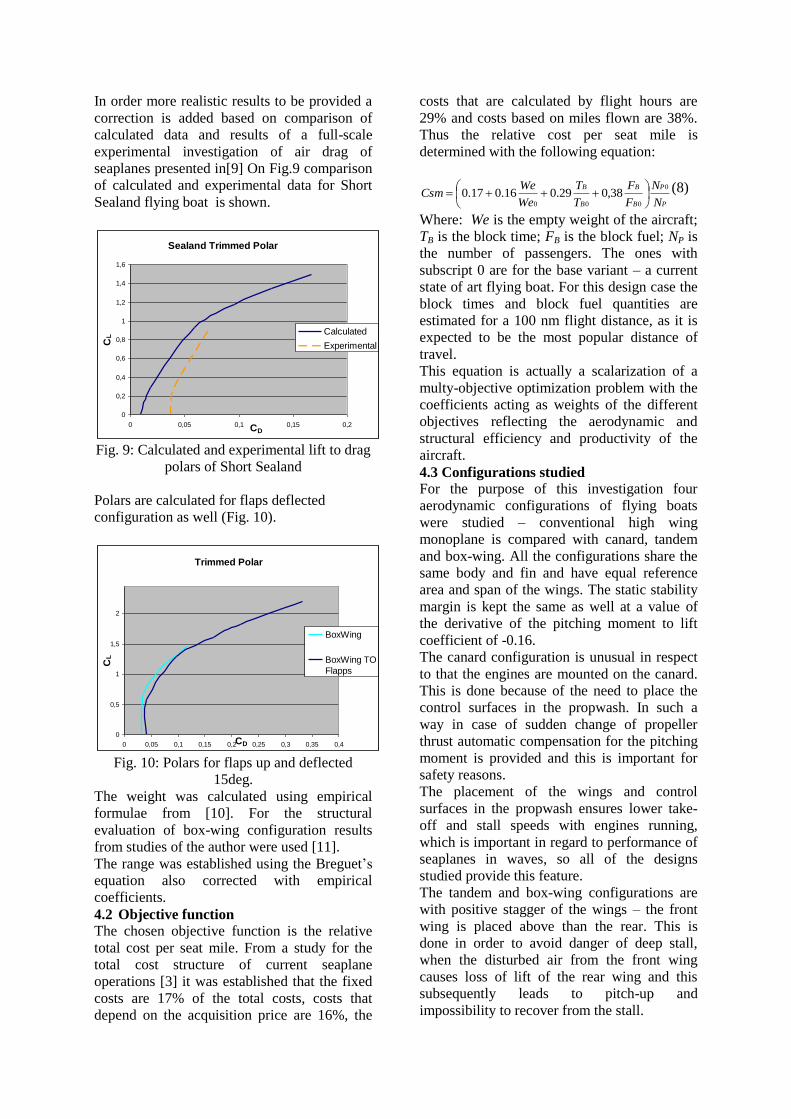
In order more realistic results to be provided a
correction is added based on comparison of
calculated data and results of a full-scale
experimental investigation of air drag of
seaplanes presented in[9] On Fig.9 comparison
of calculated and experimental data for Short
Sealand flying boat is shown.
Sealand Trimmed Polar
0
0,2
0,4
0,6
0,8
1
1,2
1,4
1,6
0 0,05 0,1 0,15 0,2CD
CL
Calculated
Experimental
Fig. 9: Calculated and experimental lift to drag
polars of Short Sealand
Polars are calculated for flaps deflected
configuration as well (Fig. 10).
Trimmed Polar
0
0,5
1
1,5
2
0 0,05 0,1 0,15 0,2 0,25 0,3 0,35 0,4CD
CL
BoxWing
BoxWing TO
Flapps
Fig. 10: Polars for flaps up and deflected
15deg.
The weight was calculated using empirical
formulae from [10]. For the structural
evaluation of box-wing configuration results
from studies of the author were used [11].
The range was established using the Breguet’s
equation also corrected with empirical
coefficients.
4.2 Objective function
The chosen objective function is the relative
total cost per seat mile. From a study for the
total cost structure of current seaplane
operations [3] it was established that the fixed
costs are 17% of the total costs, costs that
depend on the acquisition price are 16%, the
costs that are calculated by flight hours are
29% and costs based on miles flown are 38%.
Thus the relative cost per seat mile is
determined with the following equation:
P
P
B
B
B
B
N
N
F
F
T
T
We
WeCsm
0
000
38,029.016.017.0
(8)
Where: We is the empty weight of the aircraft;
TB is the block time; FB is the block fuel; NP is
the number of passengers. The ones with
subscript 0 are for the base variant – a current
state of art flying boat. For this design case the
block times and block fuel quantities are
estimated for a 100 nm flight distance, as it is
expected to be the most popular distance of
travel.
This equation is actually a scalarization of a
multy-objective optimization problem with the
coefficients acting as weights of the different
objectives reflecting the aerodynamic and
structural efficiency and productivity of the
aircraft.
4.3 Configurations studied
For the purpose of this investigation four
aerodynamic configurations of flying boats
were studied – conventional high wing
monoplane is compared with canard, tandem
and box-wing. All the configurations share the
same body and fin and have equal reference
area and span of the wings. The static stability
margin is kept the same as well at a value of
the derivative of the pitching moment to lift
coefficient of -0.16.
The canard configuration is unusual in respect
to that the engines are mounted on the canard.
This is done because of the need to place the
control surfaces in the propwash. In such a
way in case of sudden change of propeller
thrust automatic compensation for the pitching
moment is provided and this is important for
safety reasons.
The placement of the wings and control
surfaces in the propwash ensures lower take-
off and stall speeds with engines running,
which is important in regard to performance of
seaplanes in waves, so all of the designs
studied provide this feature.
The tandem and box-wing configurations are
with positive stagger of the wings – the front
wing is placed above than the rear. This is
done in order to avoid danger of deep stall,
when the disturbed air from the front wing
causes loss of lift of the rear wing and this
subsequently leads to pitch-up and
impossibility to recover from the stall.
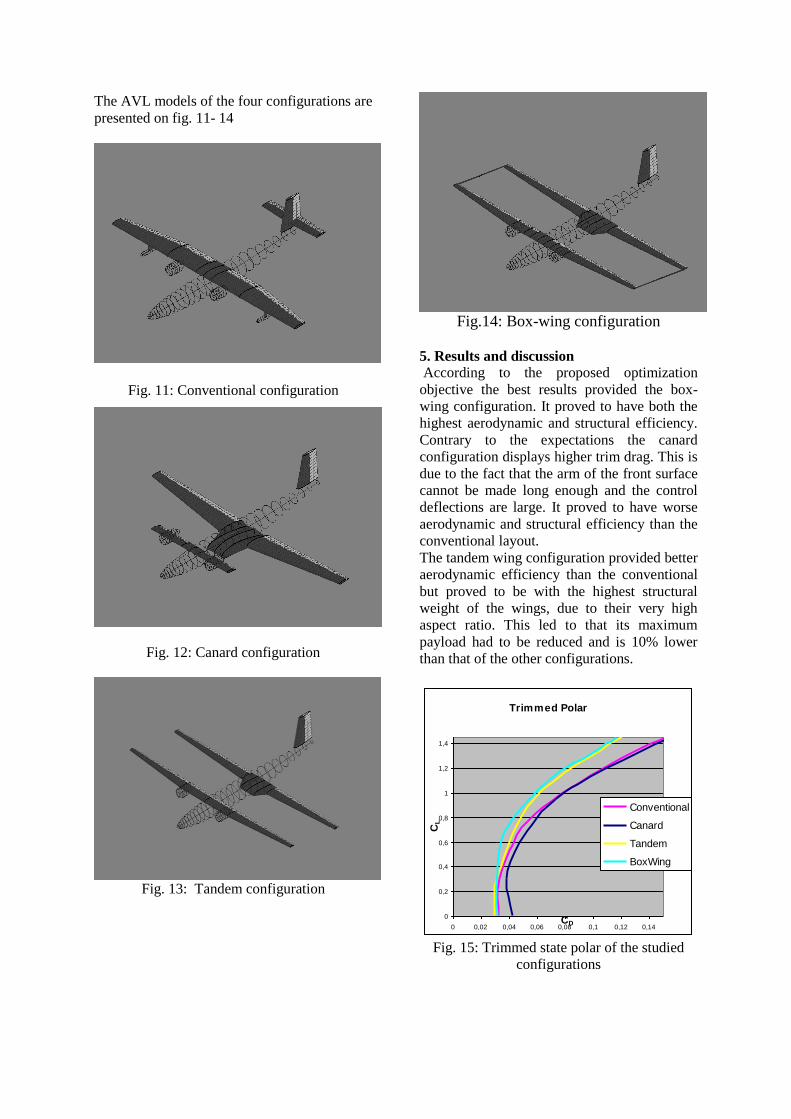
The AVL models of the four configurations are
presented on fig. 11- 14
Fig. 11: Conventional configuration
Fig. 12: Canard configuration
Fig. 13: Tandem configuration
Fig.14: Box-wing configuration
5. Results and discussion
According to the proposed optimization
objective the best results provided the box-
wing configuration. It proved to have both the
highest aerodynamic and structural efficiency.
Contrary to the expectations the canard
configuration displays higher trim drag. This is
due to the fact that the arm of the front surface
cannot be made long enough and the control
deflections are large. It proved to have worse
aerodynamic and structural efficiency than the
conventional layout.
The tandem wing configuration provided better
aerodynamic efficiency than the conventional
but proved to be with the highest structural
weight of the wings, due to their very high
aspect ratio. This led to that its maximum
payload had to be reduced and is 10% lower
than that of the other configurations.
Trimmed Polar
0
0,2
0,4
0,6
0,8
1
1,2
1,4
0 0,02 0,04 0,06 0,08 0,1 0,12 0,14CD
CL
Conventional
Canard
Tandem
BoxWing
Fig. 15: Trimmed state polar of the studied
configurations

Lifting Surfaces Weight
Fraction
0
0,05
0,1
0,15
0,2
1
Conventional
Canard
Tandem
BoxWng
Fig. 16: Lifting surfaces weight as a fraction of
the MTOW of the studied configurations
Seaplane Variants
0
500
1000
1500
2000
0 200 400 600 800 1000 1200
Range, nm
Payload, kg
Conventional Canard Tandem
Box-Wing Seastar
Fig. 17: Payload-Range diagram of the studied
configurations
The results of the study are presented on
figures15-18. It must be pointed out that all
configurations deliver much better payload-
range performance than the baseline design.
Their total cost of operation per seat mile is
significantly lower – in the range of 70-80% of
the benchmark. The performance of the studied
seaplane designs is competitive with modern
commuter landplanes.
Relative Cost per Seat Mile
0
0,2
0,4
0,6
0,8
1
Conventional
Canard
Tandem
BoxWng
Fig. 18: Cost per seat mile of the designs
studied
As the box-wing configuration provided the
overall best results a further investigation was
carried out to study the sensitivity of the
objective function to variations in its geometric
parameters. For the aerodynamic efficiency
(effect upon the Oswald span efficiency factor)
of the type most important is the gap to span
ratio (Fig19). Gap (or height) is the vertical
distance between the front and rear wings. The
increase of gap/span ratio reduces the induced
drag but increases the parasite drag and
structural weight which limits the increase in
lift to drag ratio (Fig. 20).
Oswald Span Efficiency Factor
0,5
0,7
0,9
1,1
1,3
1,5
-0,4 -0,2 0 0,2 0,4
Gap/span ratio
Fig. 19: Influence of gap/span ratio of box-
wing configurations on the span efficiency
factor (with no dihedral or anhedral of the
wings)
Lift/Drag Ratio of Wing System
20
22
24
26
28
30
-0,4 -0,2 0 0,2 0,4
Gap/Span ratio
Fig.20: Influence of gap/span ratio of box-
wing configurations on the aerodynamic
efficiency (with no dihedral or anhedral of the
wings)
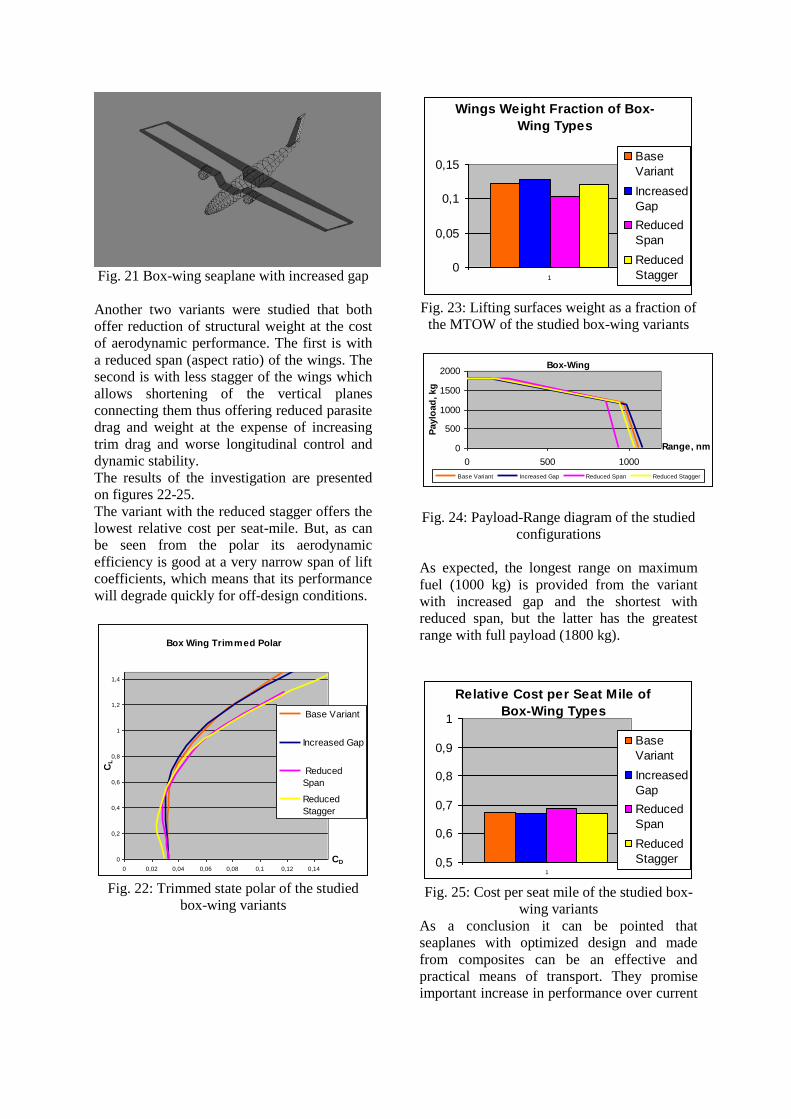
Fig. 21 Box-wing seaplane with increased gap
Another two variants were studied that both
offer reduction of structural weight at the cost
of aerodynamic performance. The first is with
a reduced span (aspect ratio) of the wings. The
second is with less stagger of the wings which
allows shortening of the vertical planes
connecting them thus offering reduced parasite
drag and weight at the expense of increasing
trim drag and worse longitudinal control and
dynamic stability.
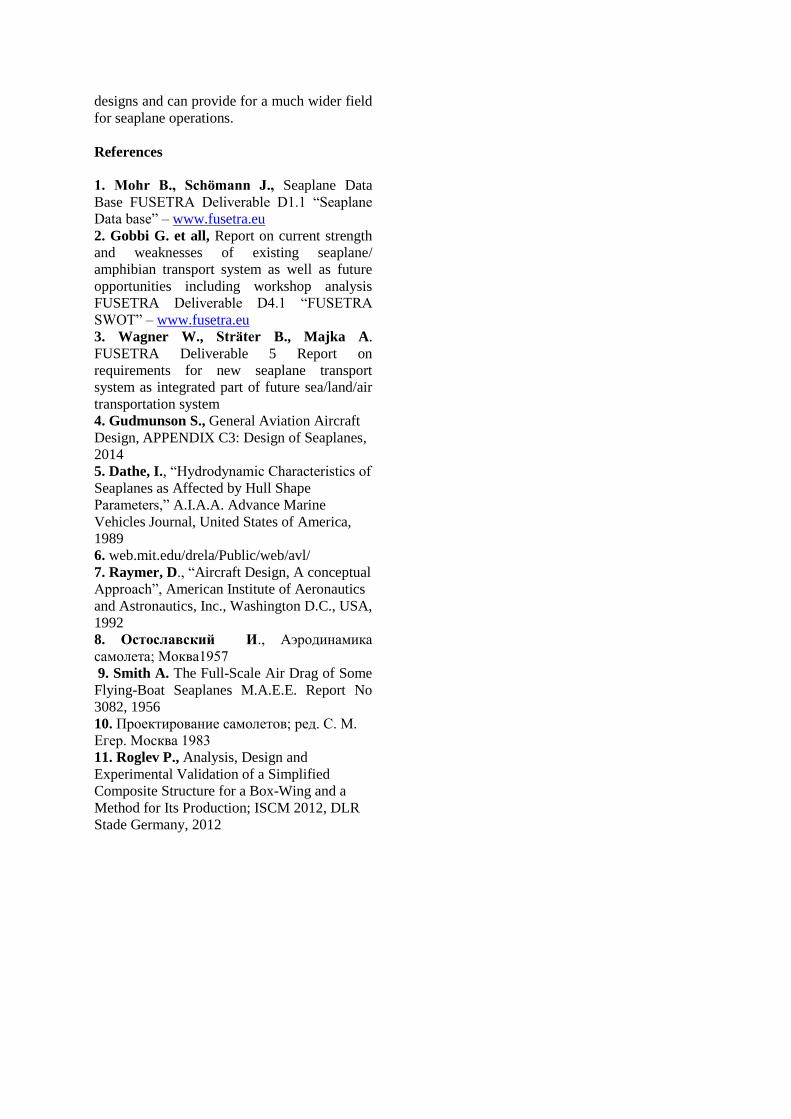
The results of the investigation are presented
on figures 22-25.
The variant with the reduced stagger offers the
lowest relative cost per seat-mile. But, as can
be seen from the polar its aerodynamic
efficiency is good at a very narrow span of lift
coefficients, which means that its performance
will degrade quickly for off-design conditions.
Box Wing Trimmed Polar
0
0,2
0,4
0,6
0,8
1
1,2
1,4
0 0,02 0,04 0,06 0,08 0,1 0,12 0,14
CD
CL
Base Variant
Increased Gap
Reduced
Span
Reduced
Stagger
Fig. 22: Trimmed state polar of the studied
box-wing variants
Wings Weight Fraction of Box-
Wing Types
0
0,05
0,1
0,15
1
Base
Variant
Increased
Gap
Reduced
Span
Reduced
Stagger
Fig. 23: Lifting surfaces weight as a fraction of
the MTOW of the studied box-wing variants
Box-Wing
0
500
1000
1500
2000
0 500 1000
Range, nm
Paylo
ad
, kg
Base Variant Increased Gap Reduced Span Reduced Stagger
Fig. 24: Payload-Range diagram of the studied
configurations
As expected, the longest range on maximum
fuel (1000 kg) is provided from the variant
with increased gap and the shortest with
reduced span, but the latter has the greatest
range with full payload (1800 kg).
Relative Cost per Seat Mile of
Box-Wing Types
0,5
0,6
0,7
0,8
0,9
1
1
Base
Variant
Increased
Gap
Reduced
Span
Reduced
Stagger
Fig. 25: Cost per seat mile of the studied box-
wing variants
As a conclusion it can be pointed that
seaplanes with optimized design and made
from composites can be an effective and
practical means of transport. They promise
important increase in performance over current
designs and can provide for a much wider field
for seaplane operations.
References
1. Mohr B., Schömann J., Seaplane Data
Base FUSETRA Deliverable D1.1 “Seaplane
Data base” – www.fusetra.eu
2. Gobbi G. et all, Report on current strength
and weaknesses of existing seaplane/
amphibian transport system as well as future
opportunities including workshop analysis
FUSETRA Deliverable D4.1 “FUSETRA
SWOT” – www.fusetra.eu
3. Wagner W., Sträter B., Majka A.
FUSETRA Deliverable 5 Report on
requirements for new seaplane transport
system as integrated part of future sea/land/air
transportation system
4. Gudmunson S., General Aviation Aircraft
Design, APPENDIX C3: Design of Seaplanes,
2014
5. Dathe, I., “Hydrodynamic Characteristics of
Seaplanes as Affected by Hull Shape
Parameters,” A.I.A.A. Advance Marine
Vehicles Journal, United States of America,
1989
6. web.mit.edu/drela/Public/web/avl/
7. Raymer, D., “Aircraft Design, A conceptual
Approach”, American Institute of Aeronautics
and Astronautics, Inc., Washington D.C., USA,
1992
8. Остославский И., Аэродинамика
самолета; Моква1957
9. Smith A. The Full-Scale Air Drag of Some
Flying-Boat Seaplanes M.A.E.E. Report No
3082, 1956
10. Проектирование самолетов; ред. С. М.
Егер. Москва 1983
11. Roglev P., Analysis, Design and
Experimental Validation of a Simplified
Composite Structure for a Box-Wing and a
Method for Its Production; ISCM 2012, DLR
Stade Germany, 2012