International Developments in the Field of Unconventional ...
arX
iv:1
107.
0114
v1 [
cond
-mat
.mtr
l-sc
i] 1
Jul
201
1
Origin of the unconventional magnetoresistance in Sr2FeMoO6
Sugata Ray,1,2,⋆ Srimanta Middey,2 Somnath Jana,2 A. Banerjee,3
P. Sanyal,4 Rajeev Rawat,3 Luca Gregoratti,5 and D. D. Sarma6
1Department of Materials Science, Indian Association for
the Cultivation of Science, Jadavpur, Kolkata 700 032, India
2Centre for Advanced Materials, Indian Association for the
Cultivation of Science, Jadavpur, Kolkata 700 032, India
3UGC-DAE CSR, University Campus,
Khandawa Road, Indore 451 027, India
4S. N. Bose National Centre for Basic Sciences,
Sector-III, Block - JD, Kolkata 700 098, India
5Sincrotrone Trieste, Area Science Park, 34012 BasoVizza-Trieste, Italy
6Solid State and Structural Chemistry Unit,
Indian Institute of Science, Bangalore 560 012, India
Abstract
The unusual magnetoresistance (MR) behavior in Sr2FeMoO6, recently termed as spin-valve type
MR (SVMR), presents several anomalies that are little understood so far. The difficulty in probing
the origin of this phenomenon, arising from the magnetic property of only a small volume fraction
of the ferromagnetic bulk, is circumvented in the present study by the use of ac susceptibility
measurements that are sensitive to the slope rather than the magnitude of the magnetization. The
present study unravels a spin-glass (SG) like surface layer around each soft ferromagnetic (FM)
grain of Sr2FeMoO6. It is also observed that there is a very strong exchange coupling between the
two, generating ‘exchange bias’ effect, which consequently creates the ‘valve’, responsible for the
unusual MR effects.
1

PACS number(s): 75.47.-m, 73.40.Gk, 72.80.Ga
I. INTRODUCTION
Understanding the spin-dependent tunneling of conduction electrons between two ferro-
magnetic metallic electrodes through an insulating barrier has been a key issue with spe-
cific applications in the field of spintronics2. Such tunneling process gets modified by the
application of external magnetic fields (H), giving rise to the well known tunneling mag-
netoresistance (TMR) effect. Other than fabricated multilayers, significant TMR effect has
also been observed in polycrystalline ferro-/ferrimagnetic (FM/FiM) materials in which the
insulating grain boundaries act as tunnel barriers. The theoretical model of TMR predicts3
that the peak of the resistivity (will be called Hc[MR] from here on) in a resistance (R)
vs. H measurement is expected to appear exactly at the zero net magnetization point i.e.
the magnetic coercivity (Hc[M ]). This prediction was duly confirmed by experiments on all
major TMR materials, such as Ca-doped LaMnO34, CrO2
5, Fe3O46, or Co-Cu alloy7 in all
possible material forms e.g. annealed or cold-pressed polycrystals or polycrystalline films.
However, drastic exceptions have recently been observed8–10 in a family of double perovskite
TMR materials11–14, especially in their cold pressed form9,10, where Hc[MR] has been found
to be several times larger than Hc[M ]. This highly anomalous observation was rationalized,
for the representative case of Sr2FeMoO6 (SFMO), on the basis of a hypothesis that the in-
sulating barriers between the soft ferromagnetic, metallic grains are composed of relatively
hard magnetic material and the phenomenon was termed as SVMR9. Surprisingly, there has
been no attempt to test the above mentioned hypothesis so far, in spite of its obvious im-
portance to validate a new class of MR materials, possessing an unusual switching behavior.
This is presumably driven by the extreme difficulty, if not the impossibility, to separately
identify the magnetic signal of the boundary material by any standard measurement, in the
background of the overwhelmingly large contribution from the bulk.
In order to probe the true nature of these barriers and the origin of this newly discovered
SVMR phenomenon, we carried out careful ac susceptibility measurement on a highly or-
dered polycrystalline sample of Sr2FeMoO6, followed by specifically designed magnetization
and magnetoresistance measurements. These experiments could separate the barrier layer
signal from the bulk FM signal due to their significantly different frequency responses to
2

the applied ac magnetic field. Most importantly, it was observed that the origin of SVMR
is distinctly different from earlier speculation9. For example, our results conclusively prove
a spin-glass (SG) behavior at the grain surfaces instead of the previously anticipated hard
ferromagnetism. Most importantly, the present study reveals that SVMR arises due to the
pinned ferromagnetic spins at the FM/SG interface as a result of exchange coupling be-
tween the ferromagnetic core and spin-glass like surface of a grain. The decisive proof for
this model came from the observation of disappearing SVMR signal above the SG transition.
II. EXPERIMENTAL
The synthesis of ordered cold-pressed pellets of Sr2FeMoO6 have been discussed previ-
ously9,11,12. The excellent degree of phase purity and B-site Fe/Mo ordering (∼90%) were
confirmed in a Bruker AXS: D8 Advance x-ray diffractometer, while the magnetic and mag-
netotransport measurements were carried out in a Cryogenics PPMS as well as in a Quantum
Design SQUID. A part of the MR measurements were also performed in the longitudinal
geometry using a homemade resistivity setup equipped with a superconducting magnet from
Oxford Instruments. Linear and non-linear ac-susceptibility was measured using a home-
made setup15. The XPS microscopy experiments were carried out with the SPEM at the
spectroscopy for chemical analysis (ESCA) microscopy beamline at the Elettra synchrotron
facility in Trieste. In SPEM the incident photon beam is focused onto the sample to a spot
of diameter, D, smaller than 0.15 µm using zone plate optics. The imaging mode in SPEM
maps the lateral distribution of elements by collecting photoelectrons with a selected energy
while scanning the specimen with respect to the focused beam.16,17.
III. RESULTS AND DISCUSSION
In Fig. 1(a), one scanning electron microscopy (SEM) image from a typical cold pressed
SFMO pellet is shown, which exhibits the sample morphology, grain sizes (3-5 µm) and
the average grain size dispersion (±30%). The grain sizes confirm that our sample is far
away from the single domain regime of a ferromagnet. The linear ac susceptibility (χ′
1) as
a function of temperature with different frequencies, at an applied ac field of 2.33 Oe, are
shown in panel (b). The experimental curves have been stacked arbitrarily along the y-axis
3

to achieve better visual clarity. Clearly, a broad peak is observed around 190 K, which shifts
towards lower temperatures with decreasing frequency (shown by the arrow). The imaginary
part of the linear susceptibility (χ′′
1) vs. T (see inset to Fig. 1(b)) reveals the frequency
dispersion of the signal more distinctly, albeit at a lower temperature of around 160 K. It is
rather a common feature that the peak in χ′′
1 appears at a lower temperature than the same
in the χ′
1, and has been observed in many well-known systems18–20, but the temperature
difference here (≈ 30 K) seems to be unusually large. However, even such behavior has
been observed earlier21, especially in systems with coexisting ferromagnetic and spin-glass
features, appearing from the grains and the disordered grain boundaries, respectively22. It
is to be noted that the ferromagnetic Tc of Sr2FeMoO6 lies well above 400 K and therefore,
this low temperature transition can only be associated with a coexisting metastability in the
sample, arising from a very different magnetic origin. Now, a frequency dependence in χ1 is
often considered sufficient to assign a spin-glass phase in many systems but it is also known
for many decades that many long-range ordered systems or superparamagnets exhibit similar
bulk susceptibility behavior, although they might arise from completely different physical
origins23,24. Therefore, mere observation of frequency dependence in χ1 is not conclusive
enough for determining the exact magnetic ground state, especially for systems which are
not exactly tailor made canonical spin-glasses. It is here that the measurement and analysis
of higher order susceptibility become crucial as the higher order susceptibilities can provide
the much needed information to differentiate among the variety of magnetic orders hidden in
the system, e.g. non-linear susceptibility was introduced as a direct probe for the divergence
of Edwards-Anderson order parameter, signifying the onset of a spin-glass transition25. In
a pioneering work, this issue has been taken up for Au96Fe4, known to be a spin-glass,
and Co97Co3, which is a conventional superparamagnet26, while many such examples can
consequently be drawn27,28.
In general, the nonlinearity of magnetization in the presence of a magnetic field is given
by29 the series expansion,
m = m0 + χ1h+ χ2h2 + χ3h
3 + ... (1)
wherem0 is the spontaneous magnetization, h is the applied alternating field, and χ1 (linear),
χ2, χ3 are first-, second-, and third order susceptibilities. It is well known that only for a
true spin-glass system, the real part of the third order susceptibility (χ′
3) increases below
4

the glass transition temperature (Tg) as the amplitude of the measuring ac field tends to
zero 25,26,30. In the inset to Fig. 1(c), the |χ′
3| vs. field curves at different temperatures are
shown. It is evident that |χ′
3| exhibits glassy dynamics already at 183 K, consistent with the
peak observed in χ′
1(T ) curves, while the same at 250 K displays behavior corresponding
to the expected Sr2FeMoO6 FM state. This fact becomes even more evident from the log-
log plot of the |χ′
3| vs. T data (main panel of Fig. 1(c)), where linearity is observed
for the data taken at T = 183 K, indicating clear divergence in non-linear susceptibility -
an unique characteristics of a spin-glass. Therefore, these critical experiments conclusively
establish the presence of a minor spin-glass component in our sample at T ≤ 183 K, and
consequently, it can be concluded that the broad peak in the |χ′
1| vs. T data indicates
the onset of a true spin-glass transition. However, as the observed ac signal is composed of
a magnetic metastability as well as a predominant long range FM signal, it is a nontrivial
task to accurately determine the Tg of the SG phase, and moreover the broadness of the
transition indicates a wide distribution of exchange interactions in the system, negating the
possibility of any uniquely defined spin-glass ordering temperature for the minority phase.
It is important to note here that SVMR effect arises due to the magnetic interference of
the insulating tunnel barrier to the TMR process. Obviously, in case of these cold pressed
samples only the magnetically active grain surfaces could be identified as this spurious tunnel
barrier. However, still to establish the insulating nature of the grain surface, we have carried
out photoemission microscopy experiments on our sample. At first, an image of a particular
sample region was created using the imaging spectromicroscopy, and then several energy
distribution curves were collected from different selected areas of this surface, illuminated
by the focused beam (µ-spot spectroscopy)16,17. In Fig. 2(a), two representative wide range
spectra below the Fermi energy, collected from the deep inside and the surface region of the
grains, are shown. The large shift in the spectrum from the boundary region towards higher
binding energy, arising due to possible ‘charging effect’, immediately confirms the significant
insulating nature of the surface phase. Thereafter, we attempted to establish the magnetic
identity of this insulating surface component since that it needed to correctly understand
SVMR. Although it might be anticipated that the observed SG signal is associated with
this unknown surface phase31–33, such an assumption requires experimental confirmation.
Notably, if this hypothesis is indeed valid, every grain should possess a FM/SG interface,
and as a result unusual effects like ‘exchange bias’ might be observed32,33, provided the SG
5

layer has large anisotropy 34. However, no clear exchange bias effect was observed in our
samples by standard field-cooled (FC) and zero-field-cooled (ZFC) M(H) measurements,
probably because the grains are of µm sizes (Fig. 1) and the small contribution from
the pinned ferromagnetic spins to the total magnetization, if any, is buried under the the
large undistorted core signal35,36. However, as the intergrain tunneling process critically
depends on the alignment of spins near the surface of the grains (tunnel barrier), it could be
expected that the effect of exchange pinning might be observed in theMR(H) measurements.
Accordingly, we investigated the FC and ZFC MR(H) in search of possible exchange bias
effects. In Fig. 2(b), we show an expanded view of the FC and ZFC MR(H) curves
at 5 K. Distinct shifts (indicated by brown, red and blue arrows) of the FC MR peaks
(Hc[MR]) with respect to the symmetric ZFC loop along the field axis are found, while
the shifts changed signs depending on the direction of the applied fields during cooling.
Here, a clear analogy can be drawn with the asymmetric shift of the FC M(H) hysteresis
loops, which is the key point of all exchange bias systems37. Such shifts in the field sweep
measurements are known to arise due to the pinned ferromagnetic spins at the interface,
originated as a consequence of strong exchange coupling between the soft ferromagnetic and
hard antiferromagnetic/ferrimagnetic or spin-glass layers37. Therefore, it is possible to draw
two important conclusions here. Firstly the spurious SG signal must be associated with
the surface phase i.e. the tunnel barrier, giving rise to definite FM/SG exchange coupling
across the core/surface interfaces in each grain, pinning the ferromagnetic spins near the
interface, and producing the asymmetric shifts in the MR(H) curves. Recently, we have
shown that nanosized Sr2FeMoO6 particles, with largely enhanced surface volume, indeed
exhibit clear exchange bias effect in the M(H) measurements38, which further supports this
conclusion. Secondly, as the field at which the MR peaks is susceptible to cooling history
and exchange biasing, it could be understood that the TMR response is critically following
the field response of the pinned ferromagnetic spins, and contrary to earlier proposal9 it has
to be these spins which must be acting as the ‘valve’, giving rise to the SVMR response. It is
obvious that these pinned FM spins at the interface are hard to rotate and can effectively act
as scattering centers for the softer core spins that are trying to tunnel through the insulating
barrier. To confirm the reliability of the observed exchange bias, we show the ZFC M(H)
data from our sample n Fig. 2(c), which comes out of irreversibility at a field of only 0.1
Tesla, while the ZFC MR(H) measurements were carried out within a field range of -0.5 to
6

+0.5 Tesla (Fig. 2(d)). This observation testifies that the observed loop shift is not arising
due to the so called minor loop effect39. Another experimental aspect that is worth noting
here is the observed significant asymmetries between the highest resistivity values in the
positive and negative field quadrants in any particular FC MR(H) measurement, which are
also related to exchange biasing (Fig. 2b).
It is to be noted that exchange bias is known to disappear if the maximum applied field
(Hmax) in a field sweeping measurement becomes too high40, that is if the applied field
becomes large enough to orient even the hard ferrimagnetic or SG layers. Therefore, HE is
expected to fall with increasing Hmax, which is exactly what is observed in this case, shown
in Fig. 3(a). In Fig. 3(b), we show the dependence of HE on the cooling field. This behavior
is reminiscent of all exchange bias systems, FM-SG bilayer being one of them33,41.
In order to check all the hypothesis made so far, we also attempted to carry out extensive
numerical simulations, where the model considered is a modification of that used in our
earlier works9. A schematic representation of the present model and the magnitude of
different interactions are shown in the left panel of Fig. 4. Here, there is a magnetic
interfacial coupling between the hard SG layer ‘h’ and the surface of the soft FM grains. This
coupling gives rise to a ‘pinned’ layer ‘p’ at the surface of the soft FM grains, crucial for the
exchange bias effect. The hard SG layer has both ferro (JFM(p−h)) and antiferro (JFM(p−
h)) couplings with the pinned layer. There is also a weaker, ferro coupling between the soft
layer and the pinned layer (JFM(s−p)), arising essentially from the remnant ferromagnetism
at the grain surface. There are also randomly oriented anisotropy axes within the spin glass
layer, designed to make it hard, without giving any preferential axis direction. Since this
pinned layer is at the core/surface interface of the grain, it controls the switching of the
tunneling, and the exchange bias effect is reflected in the MR(H) curves. We have changed
the method of calculating the Landauer conductance to Non-Equilibrium Green’s Function
(NEGF) method instead of the Transfer Matrix method used in the earlier work9 as this is
more stable and allows larger sizes. The response of this system in absence of a bias field
is identical to that of our previous model, however, in presence of a bias cooling field, the
response is very different. The results of the simulation is presented in the right panel of Fig.
4. Evidently, the experimental observations of the shifts along the field axis as well as the
MR axis in the MR(H) curves are captured very well in these simulations. It is to be noted
that we considered the hard layer as electronically transparent, i.e., the spins in this layer
7

do not affect the transport, otherwise the observed MR would have traced out a minor loop,
which it does not. In ref. 30, a model similar to ours had been proposed, where the defective
surface with random anisotropy is similar to the hard SG layer proposed here. Since we have
actually done a full-fledged simulation of this model on a finite size system involving Monte
Carlo and NEGF, additionally we have been able to probe the pinned layer, the exchange
bias effect as well as the hysteresis, all of which are non-equilibrium phenomena.
However, the decisive point for the whole understanding is the assumed direct connec-
tion between the appearance of the SG layer at the surface, generating the valve through
exchange coupling, and the consequent arrival of SVMR. Therefore, the acid test for such
an understanding would be to study the temperature dependence of SVMR, which should
disappear above Tg of the glassy skin layer as a result of extinguished pinning effect at the
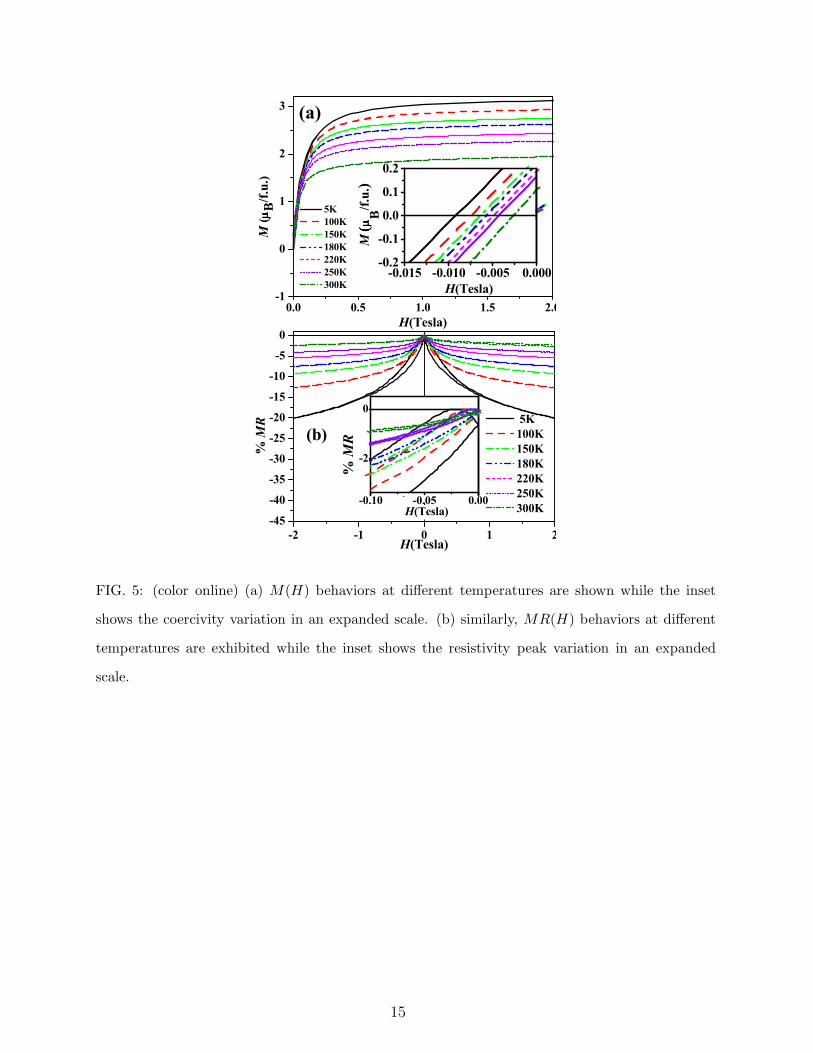
interface. In Fig. 5(a), we show M vs. H behavior of our sample at few different tem-
peratures. Following the expected line, the saturation moment as well as the coercivity
(see inset) is found to decrease regularly with increasing temperature. Similarly, in Fig.
5(b), MR(H) behaviors at same temperatures and their resistivity peaks (inset) are shown.
Next, we have extracted the temperature variation of SVMR from these experiments and
the results are summarized in Fig. 6.
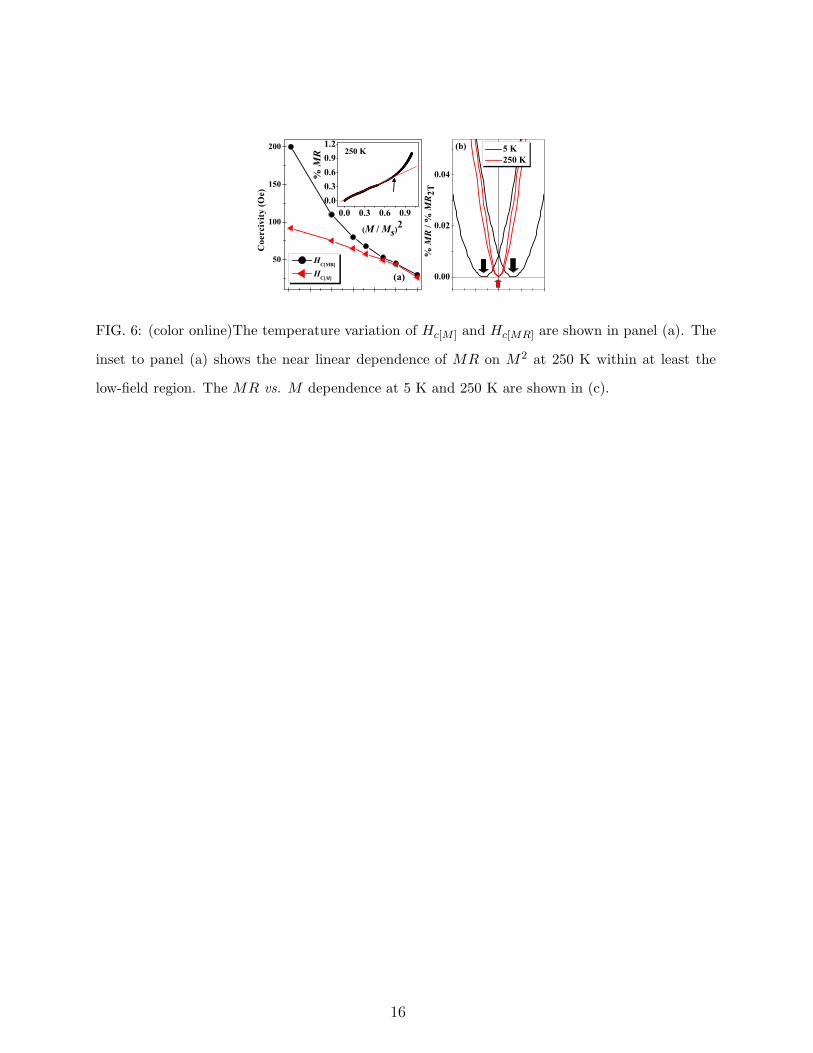
In Fig. 6(a), variations of Hc[M ] and Hc[MR] as a function of temperature is shown.
Expectedly, the separation between the two quantities, i.e. the SVMR effect, is most severe
at the lowest temperature. But most interestingly, the distinction between the two is found
to diminish gradually with increasing temperature and disappear around 200 K, i.e. at the
estimated Tg of the SG-like skin (see Fig. 1). We have also observed that the exchange bias
in MR(H) completely vanishes above the glass transition temperature, confirming the close
connection between the setting up of the spin-glass order at the grain surface, the exchange
bias, and the SVMR. In the inset to Fig. 6(a), %MR is plotted against (M/Ms)2 at 250 K
(i.e. above the Tg), which follows the predicted straight line like behavior at the low field
region, where the intergrain TMR is known to be most pronounced. The deviation from the
linear behavior at higher fields might appear due to intragrain tunneling mechanism, often
discussed for Sr2FeMoO642. Fig. 6(b) shows the development of MR as a function of the
bulk M , from which the absence of SVMR above Tg is understood more clearly as the MR
is found to touch the zero value (Hc[MR]) exactly at the zero magnetization point (Hc[M ])
point at 250 K. This behavior is consistent with any other conventional TMR material4–7.
8

However, at 5 K the tunneling needed much higher field to kickoff, giving rise to SVMR.
IV. CONCLUSIONS
In summary, our detailed experiments clearly establish the presence of a spin-glass like
phase at the surface of each grain, which is spontaneously formed during the mechanical
creation of the small grain powders of Sr2FeMoO6. However, this SG layer immediately
exchange couples with the core ferromagnetic spins through the interface and produces the
‘valve’ that stops the tunneling of conduction electrons between two adjacent grains even
though the core of each grain is largely aligned in the same direction as the applied magnetic
field. This phenomena gives rise to the unprecedent effect of the SVMR, observed in double
perovskites in general8–10. Understandably, this effect can persist only till the SG phase
exist and immediately gets perished as soon as the experimental temperature goes above
the Tg.
Acknowledgments
SR and DDS thank the DST and BRNS, India for financial support. SM and SJ thank
CSIR, India for fellowship. PS thanks Dr. A. Agarwal for useful discussions.
⋆
2 Wolf S. A. et al., Science, 294 (2001), 1488.
3 Perkin S., Yang H., Yang S.-H. and Hayashi M., Handbook of Magnetism and Advanced Magnetic
Materials, edited by H. Kronmuller and S. Perkin (Wiley 2007).
4 Li X. W., Gupta A., Xiao G. and Gong G. Q., Appl. Phys. Lett., 71 (1997), 1124.
5 Coey J. M. D., Berkowitz A. E., Balcells Ll., Putris, F. F. and Barry A., Phys. Rev. Lett., 80
(1998), 3815.
6 Coey J. M. D., Berkowitz A. E., Balcells Ll., Putris F. F. and Parker F. T., Appl. Phys. Lett.,
72 (1998), 734.
7 Xiao J. Q., Jiang J. S. and Chien C. L., Phys. Rev. Lett., 68 (1992), 3749.
9

8 De Teresa J. M., Serrate D., Blasco J., Ibarra M. R. and Morellon L., Phys. Rev. B, 69 (2004),
144401.
9 Sarma D. D., Ray S., Tanaka K., Kobayashi M., Fujimori A., Sanyal P., Krishnamurthy H. R.
and Dasgupta C., Phys. Rev. Lett., 98 (2007), 157205.
10 Jana S., Middey S. and Ray S., J. Phys.: Condens. Matter, 22 (2010), 346004.
11 Kobayashi K.-I., Kimura T., Sawada H., Terakura K. and Tokura Y., Nature, 395 (1998), 677.
12 Sarma D. D., Sampathkumaran E. V., Ray S., Nagarajan R., Majumdar S., Kumar A., Nalini
G. and Row T. N. Guru, Solid State Commun., 114 (2000), 465.
13 Sarma D. D., Mahadevan P., Saha-Dasgupta T., Ray S. and Kumar A., Phys. Rev. Lett., 85
(2000), 2549; Meneghini C., Ray S., Liscio F., Bardelli F., Mobilio S. and Sarma D. D., Phys.
Rev. Lett., 103 (2009), 046403.
14 Serrate D., De Teresa J. M. and Ibarra M. R., J. Phys.: Condens. Matter, 19 (2007), 023201.
15 Bajpai A. and Banerjee A., Rev. Sci. Instrum., 68 (1997), 4075.
16 Kiskinova M., Marsi K K., Di Fabrizio E. and Gentili M., Surface Review Letters, 6 (1999), 265.
17 Gunther S., Kaulich B., Gregoratti L. and Kiskinova M., Progress in surface science, 70 (2002),
187.
18 Viswanathan M. and Anil Kumar P. S., Phys. Rev. B, 80 (2009), 012410.
19 Dho J., Kim W. S. and Hur N. H., Phys. Rev. Lett., 89 (2002), 027202.
20 Sarkar T., Pralong V., Caignaert V. and Raveau B., Chem. Mater., 22 (2010), 2885.
21 Wang Y. T., Bai H. Y., Pan M. X., Zhao D. Q. and Wang W. H., Phys. Rev. B, 74 (2006),
064422.
22 Bonetti E., Del Bianco L., Fiorani D., Rinaldi D., Caciuffo R. and Hernando A., Phys. Rev.
Lett., 83 (1999), 2829.
23 R. A. Hein, T. L. Francavilla and S. Perkin, Magnetic Susceptibility of Superconductor and
Other Spin Systems, (Plenum) 2007.
24 Banerjee A., Bajpai A. and Nair S., Frontiers in Magnetic Materials, edited by A. V. Narlikar
(Springer) 2005.
25 Binder K. and Young A. P., Rev. Mod. Phys., 58 (1986), 801.
26 Bitoh T., Ohba K., Takamatsu M., Shirane T. and Chikazawa S., J. Phys. Soc. Japan, 62
(1993), 2583.
27 Bajpai A. and Banerjee A., Phys. Rev. B, 55 (1997), 12439.
10

28 Sinha G. and Majumdar A. K., J. Magn. Magn. Mater., 185 (1998), 18.
29 Sato T. and Miyako Y., J. Phys. Soc. Japan, 51 (1982), 1394.
30 Katsura S., Prog. Theor. Phys., 55 (1976), 10049.
31 Serrate D., De Teresa J. M., Algarabel P. A., Ibarra M. R. and Galibert J., Phys. Rev. B , 71
(2005), 104409.
32 Martınez B., Obradors X., Balcells Ll., Rouanet A. and Monty C., Phys. Rev. Lett., 80 (1998),
181.
33 Wang H., Zhu T., Zhao K., Wang W. N., Wang C. S., Wang Y. J. and Zhan W. S., Phys. Rev.
B, 70 (2004), 092409.
34 Ali M. et al., Nature Materials, 6 (2007), 70.
35 Muroi M., McCormick P. G. and Street R., Rev. Adv. Mater. Sci., 5 (2003), 76.
36 Kodama R. H., Makhlouf S. A. and Berkowitz A. E., Phys. Rev. Lett., 79 (1997), 1393.
37 Nogues J., Sort J., Langlais V., Skumryev V., Surinach S., Munoz J. S. and Baro M. D., Phys.
Rep., 422 (2005), 65.
38 Middey S., Jana S. and Ray S., J. Appl. Phys., 108 (2010), 043918.
39 Geshev J., J. Magn. Magn. Mater., 320 (2008), 600.
40 Tang Y. K., Sun Y. and Cheng Z. H., Phys. Rev. B, 73 (2006), 174419 .
41 Del Bianco L., Fiorani D., Testa A. M., Bonetti E., and Signorini L., Phys. Rev. B, 70 (2004),
052401.
42 Garcia-Hernandez M., Martinez J. L., Martinez-Lope M. J., Casais M. T. and Alonso J. A.,
Phys. Rev. Lett., 86 (2001), 2443.
11

FIG. 1: (color online) (a) shows a SEM image of the cold pressed sample. (b) Real and imaginary
(inset) parts of linear ac susceptibility vs. T . (c) the log-log plot of |χ′
3| vs. H, while the linear
data are shown in the inset.
12

-0.05 0.00 0.05-2.0
-1.6
-1.2
-0.8
-0.4
0.0
% MR
Fig. 2
5 K
(b)
ZFC
FC with 0.3 Tesla
FC with -0.3Tesla
% MR
H (Tesla)
-0.5 0.0 0.5
-10
-5
0
H (Tesla)
M (µµ µµ
B/f
.u.)
(d)
H (Tesla)-0.1 0.0 0.1
-2
-1
0
1
2
(c)
60 50 40 30 20 10 0
grain boundary
inside grain
Inte
nsi
ty (
arb
. u
nit
s)
Binding Energy (eV)
(a)
FIG. 2: (color online) (a) Two representative wide range, near valence band spectra from the
sample. (b) Expanded MR(H) data, while the full field range data is shown in panel (d). Panel
(c) shows M(H) of the same sample. All the measurements have been carried out at 5 K.
0.0 0.5 1.0 1.5
0
25
50
5 K
(a)
Fig. 3
HE
(Oe)
Cooling field (Tesla)
Fixed Hmax : 2 Tesla
0.5 1.0 1.5 2.00
20
40
60
80
(b)
5 K
HE
(Oe)
Hmax (Tesla)
Fixed cooling field : 0.3 Tesla
FIG. 3: (color online) The variations of the exchange field (HE) as a function of maximum measur-
ing field in the field sweeping measurements and as a function of cooling field are shown in panels
(a) and (b), respectively.
13

-0.2 -0.1 0.0 0.1 0.2
-20
-10
0Parameters: JFM (s-p) << JFM (p-h)
≤≤≤≤ JAFM (p-h) ≈≈≈≈ Hmax << HCF
JFM (s-p)
JFM (p-h)
JAFM (p-h)
J=0
Shown configuration: T << Tg, Tc;
H = 0; HCF = +(ve)
-HCF
+HCF
%MR
H
FIG. 4: (color online) A schematic of the model is shown on the left half, while the simulated MR
data is shown on the right half in an expanded scale. In the schematic, Light pink: Soft Layer
(s); Purple : Pinned layer (p); White: Hard layer (h); Vertical/canted arrows symbolize the spins,
while horizontal double headed arrows show the coupling between the different layers: JFM (s− p)
is the ferromagnetic coupling between ‘s’ and ‘p’ layers. Some spins of rough interface between
the ‘p’ and the ‘h’ layers have ferro coupling JFM (p − h), while others have antiferro coupling
JAFM (p− h). Hmax is the maximum value of the sweeping field, while HCF is the bias field.
14
-2 -1 0 1 2
-45
-40
-35
-30
-25
-20
-15
-10
-5
0
-0.10 -0.05 0.00
-2
0
0.0 0.5 1.0 1.5 2.0-1
0
1
2
3
H(Tesla)
(b)
M (µµ µµ
B/f
.u.)
5K
100K
150K
180K
220K
250K
300K
Fig. 5
(a)
5K
100K
150K
180K
220K
250K
300K
% MR
H(Tesla)
% MR
H(Tesla)
-0.015 -0.010 -0.005 0.000-0.2
-0.1
0.0
0.1
0.2
H(Tesla)
M (( ((µµ µµ
B/f
.u.)
FIG. 5: (color online) (a) M(H) behaviors at different temperatures are shown while the inset
shows the coercivity variation in an expanded scale. (b) similarly, MR(H) behaviors at different
temperatures are exhibited while the inset shows the resistivity peak variation in an expanded
scale.
15
0.0 0.3 0.6 0.90.00.30.60.91.2
0 50 100 150 200 250 300
50
100
150
200
(a)
HC[MR]
HC[M]
Coe
rciv
ity (O
e)
T (K)-0.4 -0.2 0.0 0.2 0.4
0.00
0.02
0.04
(b)
Fig. 6
M / M2T
5 K 250 K
% MR
/ %
MR
2T
250 K
% MR
(M / Ms)2
FIG. 6: (color online)The temperature variation of Hc[M ] and Hc[MR] are shown in panel (a). The
inset to panel (a) shows the near linear dependence of MR on M2 at 250 K within at least the
low-field region. The MR vs. M dependence at 5 K and 250 K are shown in (c).
16

100 150 200 250 300
(b)Hac = 2.33 Oe
1131.1 Hz
731.1 Hz
331.1 Hz
131.1 Hz
31.1 Hz
χχ χχ1
' (arb
. u
nit
s)
T (K)
0.5 1.0 1.5 2.0 2.5
-8
-7
-6
-5
| χχ χχ3
'| O
e-2
em
u/m
ol)
(c)
Fig. 1
Frequency: 131.1 Hz
83 K
183 K
250 K
ln (| χχ χχ
3'|
)
ln (Hac
)
2 4 6 8 10
0.001
0.002
0.003
0.004
Hac
(Oe)
100 200 300
χχ χχ1''
(a
rb u
nit
s)
T (K)
2 µm
(a)
Fig. 1
Copyright © 2022 FDOKUMEN