Magnetoresistance behavior of ferromagnetic shape memory alloy Ni1.75Mn1.25Ga
19
arXiv:0802.1801v2 [cond-mat.mtrl-sci] 30 May 2008 Magnetoresistance behavior of a ferromagnetic shape memory alloy: Ni 1.75 Mn 1.25 Ga S. Banik 1 , R. Rawat 1 , P. K. Mukhopadhyay 2 , B. L. Ahuja 3 , Aparna Chakrabarti 4 , P. L. Paulose 5 , S. Singh 1 , A. K. Singh 6 , D. Pandey 6 , and S. R. Barman 1∗ 1 UGC-DAE Consortium for Scientific Research, Khandwa Road, Indore, 452017, India 2 LCMP, S. N. Bose National Centre for Basic Sciences, Kolkata, 700098, India 3 Department of Physics, M. L. Sukhadia University, Udaipur 313001, India 4 Raja Ramanna Centre for Advanced Technology, Indore, 452013, India 5 Tata Institute of Fundamental Research, Homi Bhabha Road, Mumbai, 400005, India. and 6 School of Materials Science and Technology, Banaras Hindu University, Varanasi, 221005, India. Abstract A negative-positive-negative switching behavior of magnetoresistance (MR) with temperature is observed in a ferromagnetic shape memory alloy Ni 1.75 Mn 1.25 Ga. In the austenitic phase between 300 and 120 K, MR is negative due to s-d scattering. Curiously, below 120 K MR is positive, while at still lower temperatures in the martensitic phase, MR is negative again. The positive MR cannot be explained by Lorentz contribution and is related to a magnetic transition. Evidence for this is obtained from ab initio density functional theory, a decrease in magnetization and resistivity upturn at 120 K. Theory shows that a ferrimagnetic state with anti-ferromagnetic alignment between the local magnetic moments of the Mn atoms is the energetically favoured ground state. In the martensitic phase, there are two competing factors that govern the MR behavior: a dominant negative trend up to the saturation field due to the decrease of electron scattering at twin and domain boundaries; and a weaker positive trend due to the ferrimagnetic nature of the magnetic state. MR exhibits a hysteresis between heating and cooling that is related to the first order nature of the martensitic phase transition. PACS numbers: 73.43.Qt, 81.30.Kf, 75.47.-m, 71.15.Nc 1
-
Upload
independent -
Category
Documents
-
view
1 -
download
0
Transcript of Magnetoresistance behavior of ferromagnetic shape memory alloy Ni1.75Mn1.25Ga

arX
iv:0
802.
1801
v2 [
cond
-mat
.mtr
l-sc
i] 3
0 M
ay 2
008
Magnetoresistance behavior of a ferromagnetic shape memory
alloy: Ni1.75Mn1.25Ga
S. Banik1, R. Rawat1, P. K. Mukhopadhyay2, B. L. Ahuja3, Aparna Chakrabarti4,
P. L. Paulose5, S. Singh1, A. K. Singh6, D. Pandey6, and S. R. Barman1∗
1UGC-DAE Consortium for Scientific Research,
Khandwa Road, Indore, 452017, India
2LCMP, S. N. Bose National Centre for Basic Sciences, Kolkata, 700098, India
3Department of Physics, M. L. Sukhadia University, Udaipur 313001, India
4Raja Ramanna Centre for Advanced Technology, Indore, 452013, India
5Tata Institute of Fundamental Research,
Homi Bhabha Road, Mumbai, 400005, India. and
6School of Materials Science and Technology,
Banaras Hindu University, Varanasi, 221005, India.
Abstract
A negative−positive−negative switching behavior of magnetoresistance (MR) with temperature
is observed in a ferromagnetic shape memory alloy Ni1.75Mn1.25Ga. In the austenitic phase between
300 and 120 K, MR is negative due to s−d scattering. Curiously, below 120 K MR is positive, while
at still lower temperatures in the martensitic phase, MR is negative again. The positive MR cannot
be explained by Lorentz contribution and is related to a magnetic transition. Evidence for this is
obtained from ab initio density functional theory, a decrease in magnetization and resistivity upturn
at 120 K. Theory shows that a ferrimagnetic state with anti-ferromagnetic alignment between
the local magnetic moments of the Mn atoms is the energetically favoured ground state. In the
martensitic phase, there are two competing factors that govern the MR behavior: a dominant
negative trend up to the saturation field due to the decrease of electron scattering at twin and
domain boundaries; and a weaker positive trend due to the ferrimagnetic nature of the magnetic
state. MR exhibits a hysteresis between heating and cooling that is related to the first order nature
of the martensitic phase transition.
PACS numbers: 73.43.Qt, 81.30.Kf, 75.47.-m, 71.15.Nc
1

I. INTRODUCTION
Recent years have witnessed extensive research on magnetoresistance (MR) to understand
its basic physics in metallic multilayers, transition metal oxides, etc.1 Ferromagnetic shape
memory alloys (SMA) are of current interest because of their potential technological applica-
tions and the rich physics they exhibit.2,3,4,5,6,7,8,9,10,11,12 Large magnetic field induced strain
(MFIS) of 10% with actuation that is faster than conventional SMA’s has been obtained in
Ni-Mn-Ga.13,14 MFIS is achieved by twin boundary rearrangement in the martensitic phase
and the main driving force for twin boundary motion in the presence of a magnetic field is
the large magnetocrystalline anisotropy (MCA).13,14,15,16,17,18,19
Negative MR has been observed earlier in SMA’s like Cu-Mn-Al and was associated with
the possible presence of Mn-rich clusters in the Cu2AlMn structure.20 Recently, we have
reported a negative MR of about 7.3% at 8 T at room temperature in Ni2+xMn1−xGa.21
It was explained by s − d scattering model for a ferromagnet, while the differences in the
MR behavior in the martensitic phase compared to the austenitic phase was related to twin
variant rearrangement with magnetic field.21 MR ranging between -1 to -4.5% has been
reported for thin films of Ni-Mn-Ga.22,23 Recently, a large negative MR of 60-70% has been
reported for Ni-Mn-In, which has been explained by the shift of the martensitic transition
temperature with magnetic field.24,25
Ni2−yMn1+yGa with y=0.25 i.e. Ni1.75Mn1.25Ga is one of the unique compositions in
the Ni-Mn-Ga family that has low martensitic transition temperature (Ms) of about 76K.26
This enables the study of the ferroelastic transition much below the Curie temperature
(TC=380 K). Here, part of the Mn atoms (y=0.25), referred to as MnI, occupy the Ni site
while the remaining Mn (y=1.0) atoms at the Mn site are referred to MnII. The MnI atoms,
which are 20% of the total Mn atoms, are excess with respect to the stoichiometric Ni2MnGa
composition. These excess MnI type atoms are expected to have interesting influence on
the resistivity, MR, and magnetization, since in related systems like Ni2Mn1.25Ga0.75 and
Mn2NiGa their moments are reported to be anti-parallel to the MnII atoms.10,27 Here, we
report an intriguing switching behavior of MR with temperature that is related to the oc-
currence of martensitic transition at low temperature in the ferrimagnetic state. To the best
of our knowledge, such MR behavior reported here has not been observed in any magnetic
material till date. This basically arises from the interplay of magnetism and shape mem-
2
ory effect. Our studies indicate possibility of new practical applications for ferromagnetic
SMA as magnetic sensor for data storage and encryption, whose response can be toggled by
changing the temperature. It is envisaged that the multifunctional combination of properties
(magnetic sensing, magnetocaloric, actuation and shape memory effects) of the ferromag-
netic SMA’s will be important for their future application.
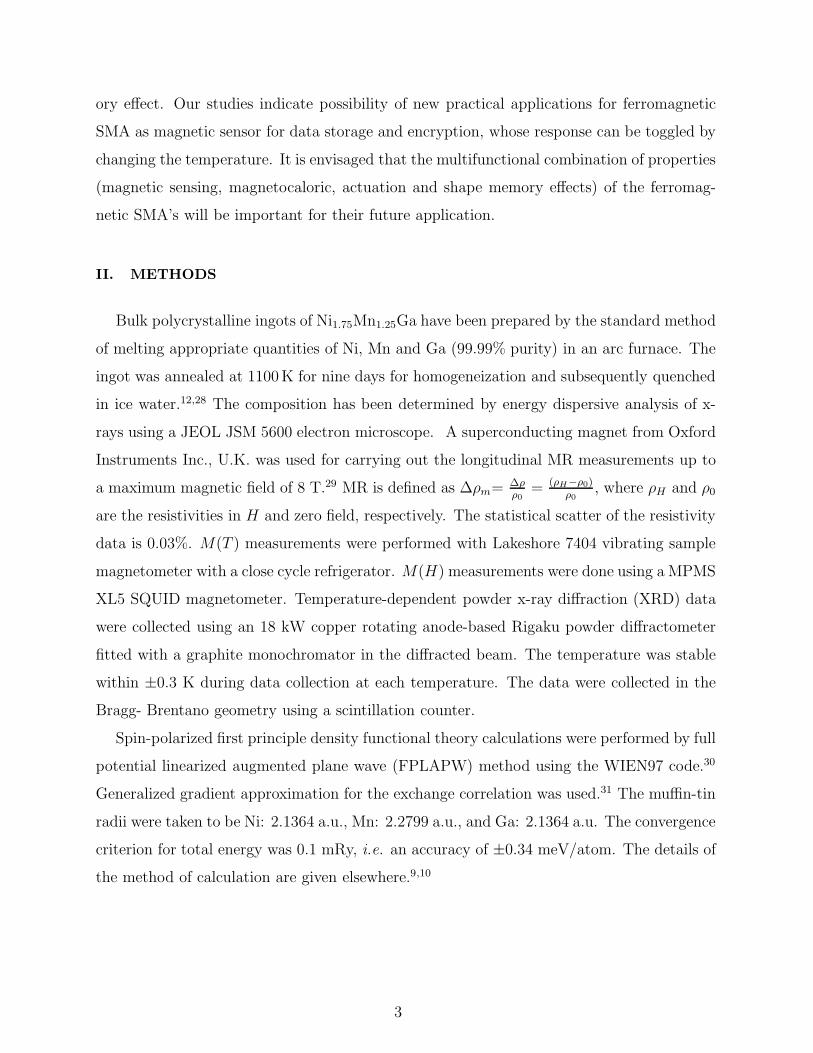
II. METHODS
Bulk polycrystalline ingots of Ni1.75Mn1.25Ga have been prepared by the standard method
of melting appropriate quantities of Ni, Mn and Ga (99.99% purity) in an arc furnace. The
ingot was annealed at 1100K for nine days for homogeneization and subsequently quenched
in ice water.12,28 The composition has been determined by energy dispersive analysis of x-
rays using a JEOL JSM 5600 electron microscope. A superconducting magnet from Oxford
Instruments Inc., U.K. was used for carrying out the longitudinal MR measurements up to
a maximum magnetic field of 8 T.29 MR is defined as ∆ρm= ∆ρρ0
= (ρH−ρ0)ρ0
, where ρH and ρ0
are the resistivities in H and zero field, respectively. The statistical scatter of the resistivity
data is 0.03%. M(T ) measurements were performed with Lakeshore 7404 vibrating sample
magnetometer with a close cycle refrigerator. M(H) measurements were done using a MPMS
XL5 SQUID magnetometer. Temperature-dependent powder x-ray diffraction (XRD) data
were collected using an 18 kW copper rotating anode-based Rigaku powder diffractometer
fitted with a graphite monochromator in the diffracted beam. The temperature was stable
within ±0.3 K during data collection at each temperature. The data were collected in the
Bragg- Brentano geometry using a scintillation counter.
Spin-polarized first principle density functional theory calculations were performed by full
potential linearized augmented plane wave (FPLAPW) method using the WIEN97 code.30
Generalized gradient approximation for the exchange correlation was used.31 The muffin-tin
radii were taken to be Ni: 2.1364 a.u., Mn: 2.2799 a.u., and Ga: 2.1364 a.u. The convergence
criterion for total energy was 0.1 mRy, i.e. an accuracy of ±0.34 meV/atom. The details of
the method of calculation are given elsewhere.9,10
3

III. RESULTS AND DISCUSSION
Fig. 1 shows the isothermal magnetoresistance (∆ρm) of Ni1.75Mn1.25Ga as a function of
magnetic field at different temperatures. It can been seen from the figure that at 300 K,
the magnitude of ∆ρm(H) increases with H to -1.35% at 8T (Fig. 1a). In order to ascer-
tain the H dependence, we have fitted ∆ρm(H) by a second order polynomial of the form
α H+β H2(solid lines in Fig. 1). We find the second order term (β) to be very small, the ratio
β/α being 0.02, which shows that the variation is essentially linear. Similar linear variation
is obtained up to 150K, although the magnitude of ∆ρm decreases to -0.3%. Linear variation
of negative MR with field has been observed for Ni2MnGa.21 Also Kataoka has calculated
∆ρm(H) for ferromagnets with different electron concentrations using the s − d scattering
model, where the scattering of s conduction electrons by localized d spins is suppressed by
the magnetic field resulting in a decrease in ρ.32 Magnitude of ∆ρm is shown to increase
almost linearly with H for ferromagnetic materials.32 Since Ni1.75Mn1.25Ga has large Mn 3d
local moment with high electron concentration (valence electron to atom ratio, e/a=7.31),
negative MR in the 150-300 K range is well described by the s− d scattering model. As the
temperature is lowered, ∆ρm(H) decreases due to reduction in the spin disorder scattering.
MR in Fig. 1b shows an interesting behavior: ∆ρm(H) is positive at 100 K. However,
at 50 K it is negative, but with a different H dependence compared to the s − d scattering
regime (Fig. 1a). In other ferromagnetic Heusler alloys like Ni2MnSn and Pd2MnSn, positive
MR has been observed and attributed to the Lorentz contribution.33 In such cases, ∆ρm is
positive at lowest temperatures and decreases as temperature increases. For example, MR
is positive for Pd2MnSn at 1.8K and is negative above 60K.33 In contrast, the MR variation
in Ni1.75Mn1.25Ga is opposite. Lorentz contribution gives rise to a positive MR when the
condition ωCτ >> 1 is satisfied, where ωC and τ are cyclotron frequency and conduction
electron relaxation time, respectively. This condition is valid for extremely pure metallic
single crystals at very low temperatures (where τ is large and ρ≤10−8 Ωcm) or at large H
(where ωC is large). But for Ni1.75Mn1.25Ga, the residual resistivity is large, implying small
τ so that even at 8T the above condition is not satisfied. By the same argument, we expect
a more positive contribution at 5K compared to 50K, since the resistivity is lower at 5K
(Fig. 2a). On the other hand, the observed data show opposite trend. Hence, the positive
MR in Ni1.75Mn1.25Ga cannot be ascribed to Lorentz force and other mechanisms need to
4

be explored to understand this finding.
Fig. 2a shows resistivity (ρ(T )) at zero and 5 T magnetic field between 5 and 180K for
two cycles. Above 120K, where the sample is in the austenitic phase ρ(T ) has a positive
temperature coefficient of resistance, and the data for the different cycles overlap. Between
88 and 37K, the hysteresis in ρ(T ) becomes highly pronounced and this is a signature
of the martensitic transition. The martensitic transition is also clearly shown by the ac-
susceptibility data in Ref.26 and the low field magnetization data shown in Fig. 4a (discussed
latter). The onset of the martensitic transition is depicted by the change in slope in ρ at
Ms (= 76K, in agreement with Ref.26). The other transition temperatures like martensite
finish Mf=37K, austenitic start As=47K, and austenitic finish Af=88K, shown in Fig. 2a,
concur with the M(T ) data to be discussed later (Fig. 4a). ρ shows a step centered around
65K. This possibly arises due to strain effect on the nucleation and growth of the martensitic
phase at such low temperatures, and similar effect has been observed in Ni2FeGa.26
In order to establish beyond any doubt that the hysteresis in ρ(T ) is related to the
martensitic transition, we show the powder XRD pattern at different temperatures in Fig. 3.
To record the XRD patterns, Ni1.75Mn1.25Ga ingot was crushed to powder and annealed at
773 K for 10 hrs to remove the residual stress. The L21cubic austenitic phase is observed up
to 100 K. There is no signature of any phase transition, related to the formation of a possible
premartensitic phase around 120 K, which could have been responsible for the upturn in
ρ(T ). The lattice constant at 100 K turns out to be aaus=5.83A. At 80 K, new peaks
appear. These peaks correspond to the martensitic phase and coexist with the austenite
peaks. By 40 K, the XRD pattern shows that the martensitic transition is complete as there
is no austenite phase, in agreement with the ρ(T ) data. The XRD patterns have been indexed
by Le Bail fitting procedure;34 and we find that the martensitic phase is monoclinic in the
P2/m space group. The refined lattice constants are a=4.22, b=5.50 and c=29.18 A, and
β=91.13. Since c≈ 7×a, a seven layer modulation may be expected, and such modulated
structures with monoclinic or orthorhombic symmetry have been reported for Ni-Mn-Ga.35
Magnetic field induced strain has been observed in Ni-Mn-Ga for structures that exhibit
modulation.13,14 The unit cell volume of the martensitic phase is within 2% of that of the
equivalent austenitic cell given by 7×a3aus/2. This shows that the unit cell volume changes
little between the two phases, as expected for a shape memory alloy.36
After establishing the existence of the structural martensitic transition from XRD, we
5

discuss the details of the resistivity behavior. ρ(T ) at 5T shows a difference in the first and
second FH (field heating) cycles, the first cycle ρ(T ) being higher. In the first FH cycle,
the sample is subjected to a magnetic field of 5T at 5 K after ZFC (zero field cooling).
Subsequently, FC data were taken and then the second cycle of FH was measured. Thus,
while in FH first cycle, the magnetic field of 5 T was switched on at 5K, where as in the
FH second cycle the field is on from RT. The possible reason for the difference in resistivity
between the two FH cycles is discussed later on. In Fig. 2b, we show the MR calculated
from the difference between the ZFC and FC (cooling MR data) and ZFH and FH second
cycle (heating MR data). But, if the FH first cycle is considered, MR is lower by about
0.4% at 5 K, which argees with the value in Fig. 1. This is because the MR in Fig. 1, ∆ρm
is measured in a different way: at 300 K, H is varied from 0 to 8 to 0 to -8 to 0 Tesla. Then,
the specimen was cooled down to the next measurement temperature of 235 K and the field
was varied in a similar way. For the next measurement, the sample was heated up to 300 K
and cooled under zero field condition to the temperature of measurement. Thus, for the
martensitic phase, this MR data (Fig. 1) can be related to ∆ρm calculated from ZFH and
FH first cycle ρ data (Fig. 2a).
Fig. 2b clearly shows the switching effect in MR as a function of temperature. A com-
parison of Fig. 2a and b shows a significant correlation between the hysteresis in MR and
ρ(T ). For the cooling cycle, MR is negative from 300 to 135 K, and exhibits a negative to
positive switching at 135 K. This negative MR region is explained by s − d scattering, as
discussed above. MR is positive between 135 to 76 K (=Ms); and this is also manifested in
MR(H) data at 100 K in Fig. 1b. As discussed earlier, the positive MR cannot be assigned
to Lorentz force contribution. MR exhibits a positive to negative switching at Ms in the
cooling cycle. MR becomes negative at Ms with a shallow minimum at 73 K, shows a hump
at 64 K, and then plunges to large negative values below 64 K, and finally increases slightly
to reach a temperature independent value of about -3% below 37 K (=Mf ). The shape of
the MR(T) curve in Fig. 2b during heating is very similar to that during cooling, but is
shifted in temperature in the martensitic transition region due to hysteresis. Thus, hystere-
sis in MR is clearly observed, which indicates the possibility of studying phase co-existence
and first order phase transition in FSMA’s using MR.
Magnetization measurements have been performed to understand the magnetoresistance
behavior. A sharp decrease of magnetization at the martensitic transition (Fig. 4a) in small
6
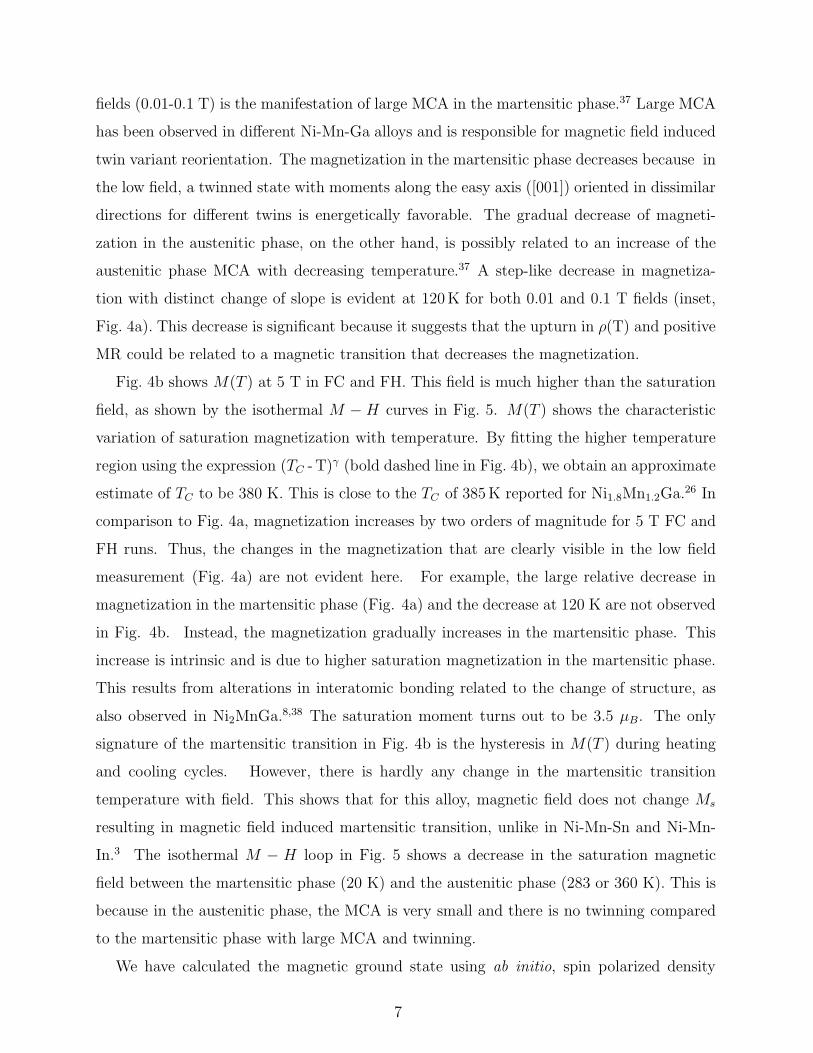
fields (0.01-0.1 T) is the manifestation of large MCA in the martensitic phase.37 Large MCA
has been observed in different Ni-Mn-Ga alloys and is responsible for magnetic field induced
twin variant reorientation. The magnetization in the martensitic phase decreases because in
the low field, a twinned state with moments along the easy axis ([001]) oriented in dissimilar
directions for different twins is energetically favorable. The gradual decrease of magneti-
zation in the austenitic phase, on the other hand, is possibly related to an increase of the
austenitic phase MCA with decreasing temperature.37 A step-like decrease in magnetiza-
tion with distinct change of slope is evident at 120K for both 0.01 and 0.1 T fields (inset,
Fig. 4a). This decrease is significant because it suggests that the upturn in ρ(T) and positive
MR could be related to a magnetic transition that decreases the magnetization.
Fig. 4b shows M(T ) at 5 T in FC and FH. This field is much higher than the saturation
field, as shown by the isothermal M − H curves in Fig. 5. M(T ) shows the characteristic
variation of saturation magnetization with temperature. By fitting the higher temperature
region using the expression (TC - T)γ (bold dashed line in Fig. 4b), we obtain an approximate
estimate of TC to be 380 K. This is close to the TC of 385K reported for Ni1.8Mn1.2Ga.26 In
comparison to Fig. 4a, magnetization increases by two orders of magnitude for 5 T FC and
FH runs. Thus, the changes in the magnetization that are clearly visible in the low field
measurement (Fig. 4a) are not evident here. For example, the large relative decrease in
magnetization in the martensitic phase (Fig. 4a) and the decrease at 120 K are not observed
in Fig. 4b. Instead, the magnetization gradually increases in the martensitic phase. This
increase is intrinsic and is due to higher saturation magnetization in the martensitic phase.
This results from alterations in interatomic bonding related to the change of structure, as
also observed in Ni2MnGa.8,38 The saturation moment turns out to be 3.5 µB. The only
signature of the martensitic transition in Fig. 4b is the hysteresis in M(T ) during heating
and cooling cycles. However, there is hardly any change in the martensitic transition
temperature with field. This shows that for this alloy, magnetic field does not change Ms
resulting in magnetic field induced martensitic transition, unlike in Ni-Mn-Sn and Ni-Mn-
In.3 The isothermal M − H loop in Fig. 5 shows a decrease in the saturation magnetic
field between the martensitic phase (20 K) and the austenitic phase (283 or 360 K). This is
because in the austenitic phase, the MCA is very small and there is no twinning compared
to the martensitic phase with large MCA and twinning.
We have calculated the magnetic ground state using ab initio, spin polarized density
7

functional theory employing FPLAPW method to understand the origin of positive MR
behavior. Good agreement between experiment and theory has been obtained earlier for
the magnetic moments, lattice constants, total energies and the density of states for both
the phases.8,9,10,12,28 In particular, the total energies have been used to explain the phase
diagram and magnetic states of Ni2MnGa, Ni2.25Mn1.75Ga and Mn2NiGa.9,10
Here, we calculate the total energies of the different magnetic states of non-stoichiometric
Ni1.75Mn1.25Ga for the L21structure (see Fig. 1 in Ref.8) with lattice constant of 5.843A de-
termined from XRD at room temperature. The structure consists of 4 interpenetrating f.c.c.
sub-lattices occupied by two Ni atoms, one Mn (MnII) and one Ga atom. To emulate the
non-stoichiometric composition, a 16 atom L21super-cell is considered, where one of the eight
Ni atoms is replaced by one excess MnI type atom.9 Thus, there are seven Ni, five Mn (one
MnI and four MnII i.e. out of total Mn atoms only 20% are MnI) and four Ga atoms in the
super cell with the chemical formula Ni7Mn5Ga4, which is equivalent to Ni1.75Mn1.25Ga. The
total energy that consists of the total kinetic, potential, and exchange correlation energies of
a periodic solid with frozen nuclei has been calculated for two magnetic configurations with
MnI spin moment parallel and anti-parallel to MnII. We find that the total energy is signifi-
cantly lower by 16 meV/atom, when MnI is anti-parallel to MnII, compared to their parallel
orientation. Anti-parallel alignment of Mn spins is energetically favored because of the direct
MnI-MnII nearest neighbor (at 2.53 A distance) interaction, as has been shown for other
Mn excess systems like Mn2NiGa, Ni2Mn1.25Ga0.75 and Ni-Mn-Sn.3,10,27 The exchange pair
interaction as a function of Mn - Mn separation was calculated by a Heisenberg-like model
and an antiferromagnetic coupling at short interatomic distances was found.39 Enkovaara
et al. reported antiferromagnetic Mn configuration in Ni2Mn1.25Ga0.75 from magnetization
and first principle calculations.27 Here for Ni1.75Mn1.25Ga, the Ni magnetic moment (0.3µB)
is parallel to MnII. The MnI and MnII moments for the anti-parallel (parallel) orientation
are unequal: -2.74 (1.9) and 3.23 (3.16) µB, respectively. Thus, the magnetic moment
of MnI is smaller than MnII. Smaller magnetic moment for MnI has also been obtained for
Mn2NiGa, and this has been assigned to stronger hybridization between the majority-spin
Ni and MnII 3d states in comparison to hybridization between Ni and MnI 3d minority-spin
states.10
The difference in total energy between the paramagnetic and ferromagnetic phases of
Ni2MnGa was equated to kB TC .40 Following a similar approach, the total energy difference
8

between the ferro- and ferrimagnetic states (16 meV/atom) corresponds to 186K. As dis-
cussed earlier, M(T ) shows a decrease in magnetization at 120K which is indicative of a
magnetic transition. Since from theory, we find that the MnI atoms have magnetic moment
different from and anti-parallel to the MnII atom, we term the state below 120 K to be ferri-
magnetic. Here, anti-parallel alignment of unequal local Mn moments would exist for those
MnII atoms that have MnI as a nearest neighbor. The estimate of a transition temperature
of 186 K from theory can be considered to be in fair agreement with the experiment (120K),
considering that theory considers an ideal situation while the actual conditions may be more
complicated. For example, the MnI atoms would replace the Ni atoms at random positions,
and absence of any superlattice peak in the XRD pattern (Fig. 3) indeed indicates that. This
disorder effect in not considered in theory. Moreover, anti-site defects, possibility of canted
alignment are not considered by theory. So, in reality, the lattice sites where anti-parallel
alignment between MnI and MnII moments occurs would be random and the moment of
MnI could be less than what is calculated. In fact, this is indicated by the underestimation
of the total moment by theory (3.1 µB) compared to the experimental value of 3.5 µB
(Fig. 4b).
To explain the positive MR shown in Figs. 1 and 2, we note that the application of
magnetic field to a state with partial antiferromagnetic alignment of moments (MnI and
MnII in this case) would induce spin fluctuations, thus increasing the spin disorder and hence
resistivity that would result in positive MR.41,42 In Eu0.83Fe4Sb12, large positive MR has been
assigned to a ferrimagnetic or canted magnetic phase.41 We also find that for Ni1.75Mn1.25Ga
positive MR increases linearly with field. In many antiferromagnetic intermetallic alloys
positive MR has been observed to increase linearly with H.43 For Eu0.83Fe4Sb12, at low
temperatures a H2/3 variation was observed. Linear positive MR has been recently reported
for Fe, Co and Ni thin films up to 60 T and has been explained by quantum electron-electron
interaction theory.44 To the best of our knowledge, no theoretical prediction exists about
MR behavior for a ferrimagnet with disordered antiferromagnetic alignment of a fraction of
the local moments. To understand the linear MR variation in Ni1.75Mn1.25Ga, measurements
with higher fields would constitute an interesting study.
In the martensitic phase, MR is negative and its magnitude increases up to the saturation
field (5 and 50 K data in Fig. 1b). But the behavior is clearly different from the austenitic
phase: the slope of MR(H) does not change with temperature between 0 to 2 T (see the
9
5 and 50 K plots in Fig. 1b). In contrast, the slope changes between 300, 235 and 150 K
data in the austenitic phase where s - d scattering dominates. This indicates that the origin
of negative MR is different in the martensitic phase. Unlike in Ni2MnGa,21 here the TC
(= 380 K) is much higher than Ms (= 76 K) and so the effect of s − d scattering in the
martensitic phase is not visible.
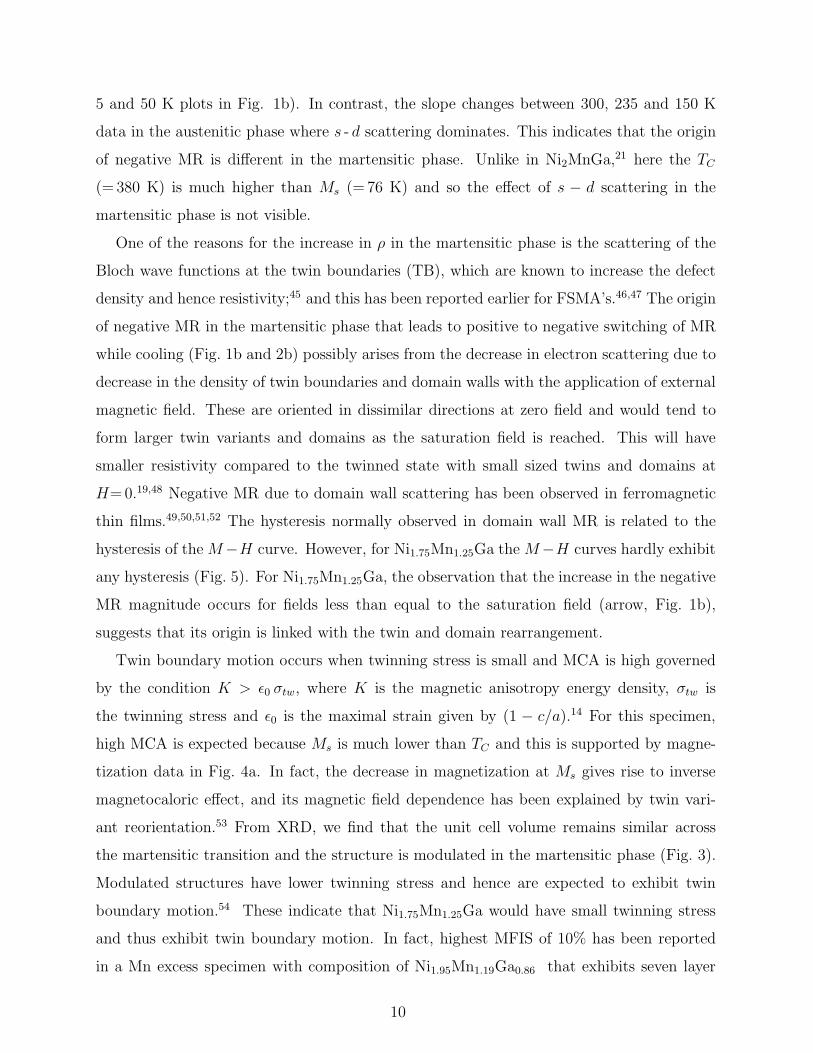
One of the reasons for the increase in ρ in the martensitic phase is the scattering of the
Bloch wave functions at the twin boundaries (TB), which are known to increase the defect
density and hence resistivity;45 and this has been reported earlier for FSMA’s.46,47 The origin
of negative MR in the martensitic phase that leads to positive to negative switching of MR
while cooling (Fig. 1b and 2b) possibly arises from the decrease in electron scattering due to
decrease in the density of twin boundaries and domain walls with the application of external
magnetic field. These are oriented in dissimilar directions at zero field and would tend to
form larger twin variants and domains as the saturation field is reached. This will have
smaller resistivity compared to the twinned state with small sized twins and domains at
H=0.19,48 Negative MR due to domain wall scattering has been observed in ferromagnetic
thin films.49,50,51,52 The hysteresis normally observed in domain wall MR is related to the
hysteresis of the M−H curve. However, for Ni1.75Mn1.25Ga the M−H curves hardly exhibit
any hysteresis (Fig. 5). For Ni1.75Mn1.25Ga, the observation that the increase in the negative
MR magnitude occurs for fields less than equal to the saturation field (arrow, Fig. 1b),
suggests that its origin is linked with the twin and domain rearrangement.
Twin boundary motion occurs when twinning stress is small and MCA is high governed
by the condition K > ǫ0 σtw, where K is the magnetic anisotropy energy density, σtw is
the twinning stress and ǫ0 is the maximal strain given by (1 − c/a).14 For this specimen,
high MCA is expected because Ms is much lower than TC and this is supported by magne-
tization data in Fig. 4a. In fact, the decrease in magnetization at Ms gives rise to inverse
magnetocaloric effect, and its magnetic field dependence has been explained by twin vari-
ant reorientation.53 From XRD, we find that the unit cell volume remains similar across
the martensitic transition and the structure is modulated in the martensitic phase (Fig. 3).
Modulated structures have lower twinning stress and hence are expected to exhibit twin
boundary motion.54 These indicate that Ni1.75Mn1.25Ga would have small twinning stress
and thus exhibit twin boundary motion. In fact, highest MFIS of 10% has been reported
in a Mn excess specimen with composition of Ni1.95Mn1.19Ga0.86 that exhibits seven layer
10

modulated structure and a low twinning stress of 2 MPa.14 MFIS has been reported to occur
in polycrystals that are textured and with large grain size, in trained samples, and also in
fine grained systems.6,16,18,55,56,57 In our case, the specimen has been annealed for more than
a week at 1100 K, and that leads to the growth of large grains (200-500 µm). On the other
hand, in the absence of field, the width of the twins is only a few microns.19,48,58 Thus, within
a grain the twins are ubiquitous and twin boundary rearrangement can occur due to external
magnetic field. Coarse grained Ni-Mn-Ga is known to show larger MFIS, while annealing of
Ni-Mn-Ga ribbons is reported to increase the MFIS by an order of magnitude.59 Sozinov
et al. obtained single variant state for polycrystalline Ni-Mn-Ga at 1 T.18 For polycrystals,
since the grains are oriented randomly, which lead to internal geometric constraints, for
example, the motion of the twin boundaries would be suppressed by the grain boundaries,
the macroscopic strain is small. However, at the microscopic level within a grain the twin
boundary motion is expected to occur in Ni1.75Mn1.25Ga and this is what is important in
the present context to explain the negative MR behavior in the martensitic phase. The
characteristic shape of the MR curve in the martensitic phase in polycrystalline Ni-Mn-Ga
has been explained by twin variant rearrangement with magnetic field.21
The difference in resistivity between the first and second FH cycles (Fig. 2) can be related
to the extent of twin boundary rearrangement. Lower values of ρ(T ) in second FH cycle,
which is recorded after cooling in presence of magnetic field across the martensitic transition
from 300 K, indicate that the field would more effectively reorient the twins as soon as these
are formed below Ms. On the other hand, for FH first cycle where ρ is higher the magnetic
field is switched on at 5 K. Thus, although MCA increases with decreasing temperature,37
twinning stress may also increase limiting the extent of twin variant rearrangement forming
larger twins. The variation of negative MR with temperature in the martensitic phase shown
in Fig. 2b is significant because the heating and cooling data are very similar. This may
be related to the microscopic details of the domain and twin variant reorientation with
temperature and further studies are required to explain this.
Another interesting observation in the MR of the martensitic phase is as follows: above
the saturation field although MR is negative, a positive component is evident from its gradual
increase with field (see Fig. 1b). For example, at 50K MR increases from -0.2% at 1T to
-0.1% at 8T. A weakly increasing MR is also observed for the 5K data, but its slope is
less compared to 50K. This shows that at lower temperatures where thermal fluctuations
11
decrease, higher field would be required to induce spin disorder in the ferrimagnetic state
for causing similar increase in MR. This, in turn, supports the argument that below 120K
the magnetic state is ferrimagnetic in nature. Thus, there are two competing effects that
govern MR in the martensitic phase with increasing field: a dominant negative trend due to
the formation of larger size twin variants and domains and a weaker positive trend due to
the ferrimagnetic nature of the magnetic state. While the first effect is present only up to
the saturation field, the second effect becomes visible only above the saturation field.
IV. CONCLUSION
The switching of MR from negative to positive and back to negative values with decreasing
temperature is observed in a Mn excess ferromagnetic shape memory alloy Ni1.75Mn1.25Ga.
Positive MR below 120K in the austenitic phase is related to a ferrimagnetic state where
the excess Mn atoms (MnI) at Ni site are antiferromagnetically oriented with the Mn atoms
at Mn site (MnII). The existence of the ferrimagnetic state is shown by density functional
theory, and experimental evidence is obtained from a decrease in magnetization and resis-
tivity upturn at 120 K. In the martensitic phase, negative MR arises due to decrease in
electron scattering related to reduction in the density of twin boundaries and domain walls
with the application of external magnetic field. This effect is visible up to the saturation
magnetic field. Above this, a weaker positive trend due to the ferrimagnetic nature of the
magnetic state is visible. On the other hand, negative MR above 120K in the ferromagnetic
austenitic phase is explained by the s − d scattering model. The hysteresis in MR(T) is a
manifestation of the first order nature of the martensitic phase transition.
V. ACKNOWLEDGMENT
We are grateful to S. N. Kaul, A. K. Majumdar, E. V. Sampathkumaran, N. Lakshmi,
A. Banerjee, R. Ranjan and K. Maiti for useful discussions and support. P. Nordblad is
thanked for his valuable support during the visit of PKM to his laboratory. P. Chaddah,
K. Horn, A. K. Raychaudhuri, V. C. Sahni, B. K. Sharma, A. Gupta and S. M. Oak are
thanked for constant encouragement. Research grants from Ramanna Research Grant, Max
Planck partner group project, Department of Science and Technology, India, and SIDA,
12

Sweden are acknowledged.
1 M. N. Baibich, J. M. Broto, A. Fert, F. Nguyen Van Dau, F. Petroff, P.Eitenne, G. Greuzet,
A. Friederich, and J. Chazelas, Phys. Rev. Lett. 61, 2472 (1988); S. Jin, T. H. Tiefel, M.
McCormack, R. A. Fastnacht, R. Ramesh, and L. H. Chen, Science 264, 413 (1994).
2 R. Kainuma, Y. Imano, W. Ito, Y. Sutou, H. Morito, S. Okamoto, O. Kitakami, K. Oikawa, A.
Fujita, T. Kanomata and K. Ishida, Nature 439, 957 (2006).
3 T. Krenke, E. Duman, M. Acet, E. F. Wassermann, X. Moya, L. Manosa and A. Planes, Nature
Mat. 4, 450 (2005).
4 I. Takeuchi, O. O. Famodu, J. C. Read, M. A. Aronova, K. -S. Chang, C. Craciunescu, S. E.
Lofland, M. Wuttig, F.C Wellstood, L. Knauss and A. Orozco, Nature Materials 2, 180 (2003).
5 A. Planes, E. Obrado, A. Gonzalez-Comas, and L. Manosa, Phys. Rev. Lett. 79, 3926 (1997).
6 Y. Boonyongmaneerat, M. Chmielus, D. C. Dunand, and P. Mullner, Phys. Rev. Lett. 99,
247201 (2007).
7 V. A. Chernenko, V. A. L′vov, P. Mullner, G. Kostorz and T. Takagi, Phys. Rev. B 69, 134410
(2004).
8 S. R. Barman, S. Banik, and A. Chakrabarti, Phys. Rev. B 72, 184410 (2005).
9 A. Chakrabarti, C. Biswas, S. Banik, R. S. Dhaka, A. K. Shukla, and S. R. Barman, Phys.
Rev. B 72, 073103 (2005).
10 S. R. Barman, S. Banik, A. K. Shukla, C. Kamal, and A. Chakrabarti, Europhys. Lett. 80,
57002 (2007); S. R. Barman and A. Chakrabarti, Phys. Rev. B 77, 176401 (2008).
11 B. L. Ahuja, B. K. Sharma, S. Mathur, N. L. Heda, M. Itou, A. Andrejczuk, Y. Sakurai, Aparna
Chakrabarti, S. Banik, A. M. Awasthi, and S. R. Barman, Phys. Rev. B 75, 134403(2007).
12 S. Banik, A. Chakrabarti, U. Kumar, P. K. Mukhopadhyay, A. M. Awasthi, R. Ranjan, J.
Schneider, B. L. Ahuja, and S. R. Barman, Phys. Rev. B 74, 085110 (2006).
13
13 S. J. Murray, M. Marioni, S. M. Allen, R. C. O’Handley and T. A. Lograsso, Appl. Phys. Lett.
77, 886 (2000).
14 A. Sozinov, A. A. Likhachev, N. Lanska and K. Ullakko, Appl. Phys. Lett. 80, 1746 (2002).
15 F. Albertini, L. Morellon, P. A. Algarabel, M. R. Ibarra, L. Pareti, Z. Arnold and G. Calestani,
J. Appl. Phys. 89, 5614 (2001).
16 K. Ullakko, Y. Ezer, A. Sozinov, G. Kimmel, P. Yakovenko, Y. K. Lindroos, Scripta Materialia
44, 475 (2001)
17 M. R. Sullivan and H. D. Chopra, Phys. Rev. B 70, 094427 (2004).
18 A. Sozinov, A. A. Likhachev, N. Lanska, O. Soderberg, K. Ullakko, V.K. Lindroos, Mat. Sci.
Eng. A 378 399 (2004).
19 Q. Pan and R. D. James, J. Appl. Phys. 87, 4702 (2000).
20 J. Marcos, A. Planes, L. Manosa, A. Labarta, B. J. Hattink, Phys. Rev. B 66, 054428 (2002).
21 C. Biswas, R. Rawat, and S. R. Barman, Appl. Phys. Lett. 86, 202508 (2005).
22 M. S. Lund, J. W. Dong, J. Lu, X. Y. Dong, C. J. Palmstrom, and C. Leighton, Appl. Phys.
Lett. 80, 4798 (2002).
23 V. O. Golub, A. Ya. Vovk, L. Malkinski, C. J. O’Connor, Z. Wang and J. Tang, J. Appl. Phys.
96, 3865 (2004)
24 S. Y. Yu, Z. H. Liu, G. D. Liu, J. L. Chen, Z. X. Cao, G. H. Wu, B. Zhang and X. X. Zhang,
Appl. Phys. Lett. 89 89, 162503 (2006).
25 V. K. Sharma, M. K. Chattopadhyay, K. H. B. Shaeb, Anil Chouhan, and S. B. Roy, Appl.
Phys. Lett. 89, 222509 2006.
26 G. D. Liu, J. L. Chen, Z. H. Liu, X. F. Dai, G. H. Wua, B. Zhang and X. X. Zhang, Appl.
Phys. Lett. 87, 262504 (2005); Appl. Phys. Lett. 82, 424 (2003).
27 J. Enkovaara, O. Heczko, A. Ayuela, and R. M. Nieminen, Phys. Rev. B 67, 212405 (2003).
28 S. Banik, R. Ranjan, A. Chakrabarti, S. Bhardwaj, N. P. Lalla, A. M. Awasthi, V. Sathe, D. M.
Phase, P. K. Mukhopadhyay, D. Pandey, and S. R. Barman, Phys. Rev. B 75, 104107 (2007).
29 R. Rawat and I. Das, J. Phys. Condens. Matter 13, L1 (2001); A. Venimadhav, M. S. Hedge,
R. Rawat, I. Das, P. L. Paulose, and E. V. Sampathkumaran, Phys. Rev. B 63, 214404 (2001).
30 P. Blaha, K. Schwartz, J. Luitz, WIEN97, A Full Potential Linearized Augmented Plane Wave
Package for Calculating Crystal Properties (Karlheinz Schwarz, Tech. Universitat, Austria),
ISBN 3-95010310-4.
14
31 J. P. Perdew and K. Burke, Phys. Rev. Lett. 77, 3865 (1996).
32 M. Kataoka, Phys. Rev. B 63, 134435 (2001).
33 C. M. Hurd, I. Shiozaki and S. P. McAlister, Phys. Rev. B. 26, 701 (1982).
34 A. Le Bail et al., Mat. Res. Bull. 23, 447 (1988).
35 P. J. Brown, J. Crangle, T. Kanomata, M. Matsumoto, K-U. Neumann, B. Ouladdiaf and K.
R. A. Ziebeck, J. Phys.: Condens. Matter 14, 10159 (2002); J. Pons, R. Santamarta, V. A.
Chernenko, E. Cesari, J. Appl. Phys. 97, 083516 (2005); R. Ranjan, S. Banik, U. Kumar,
P.K. Mukhopadhyay, S.R. Barman, D. Pandey, Phys. Rev. B 74, 224443 (2006); L. Righi, F.
Albertini, G. Calestani, L. Rareti, A. Paoluzi, C. Ritter, P. A. Algarabel, L. Morellon, and M.
R. Ibarra, J. Solid State Chem. 179, 3525 (2006)
36 K. Bhattacharya, Microstructure of Martensite. Why it Forms and How it Gives Rise to the
Shape-Memory Effect (Oxford University Press, Oxford, 2003).
37 F. Albertini, L. Pareti, and A. Paoluzi, L. Morellon, P. A. Algarabel, M. R. Ibarra, and L.
Righi, Appl. Phys. Lett., 81, 4032 (2002).
38 P. J. Webster, K. R. A. Ziebeck, S. L. Town, M. S. Peak, Philos. Mag. 49, 295 (1984).
39 D. Hobbs, J. Hafner, D. Spisak, Phys. Rev. B 68 014407 (2003).
40 O.I. Velikokhatnyi and I. I. Nuamov, Phys. Solid State 41, 617(1999).
41 E. Bauer, St. Berger, A. Galatanu, M. Galli, H. Michor, G. Hilscher, Ch. Paul, B. Ni, M. M.
Abd-Elmeguid, V. H. Tran, A. Grytsiv, and P. Rogl, Phys. Rev. B. 63,224414 (2001).
42 S. von Molner, R. J. Gambino, and J. M. D. Ceoy, J. Appl. Phys 52, 2193 (1981); A. Fert and
R. Asomoza, J. Appl. Phys. 50, 1886 (1979).
43 E. V. Sampathkumaran and I. Das, Phys. Rev. B. 51, 8631(1995); C. Majumdar, A. K. Nigam,
R. Nagarajan, C. Godart, L. C. Gupta, B. D. Padalia, G. Chandra and R. Vijayaraghavan,
Appl. Phys. Lett. 68, 3647 (1996); A. K. Nigam, S. B. Roy and P. Chaddah, Phys. Rev. B. 60,
3002 (1999); S. Radha, S. B. Roy and A. K. Nigam, J. Appl. Phys 80, 6803 (2000).
44 A. Gerber, I. Kishon, I. Ya. Korenblit, O. Riss, A. Segal, M. Karpovski, B. Raquet, Phys. Rev.
Lett. 99, 027201 (2007).
45 M. Shatzkes, P. Chaudhari, A. A. Levi, A. F. Mayadas, Phys. Rev. B 7, 5058 (1973).
46 X. Jin, D. Bono, C. Henry, J. Feuchtwanger, S. M. Allen, and R. C. OHandley, Philos. Mag.
83, 3193 (2003).
47 K. S. Sokhey, M. Manekar, M. K. Chattopadhyay, R. Kaul, S. B. Roy, and P. Chaddah, J. Phys.
15

D 36, 1366 (2003).
48 C. Biswas, S. Banik, A. K. Shukla, R. S. Dhaka, V. Ganesan and S. R. Barman, Surf. Sci. 600,
3749(2006).
49 J. F. Gregg, W. Allen, K. Ounadjela, M. Viret, M. Hehn, S. M. Thompson, and J. M. D. Coey,
Phys. Rev. Lett. 77, 1580 (1996).
50 D. Ravelosona, A. Cebollada, and F. Briones, C. Diaz-Paniagua, M. A. Hidalgo, and F. Batallan,
Phys. Rev. B 59, 4322 (1999).
51 W. Gil, D. Gorlitz, M. Horisberger, and J. Kotzler, Phys. Rev. B 72, 134401 (2005).
52 K. M. Seemann, V. Baltz, M. MacKenzie, J. N. Chapman, B. J. Hickey, and C. H. Marrows,
Phys. Rev. B 76, 174435 (2007).
53 J. Marcos, A. Planes, and L. Manosa, F. Casanova, X. Batlle, and A. Labarta, B. Martinez,
Phys. Rev. B 66, 224413 (2002).
54 A. A. Likhachev, A. Sozinov, and K. Ullakko, Mater. Sci. Eng. A 378, 513 (2004).
55 S. Jeong, K. Inoue, S. Inoue, K. Koterazawa, M. Taya and K. Inoue, Mat. and Eng. A 359, 253
(2003).
56 M. Pasquale, C. Sasso, S. Besseghini, F. Passaretti, E. Villa, and A. Sciacca, IEEE Trans. Mag.
36, 3263 (2000).
57 U. Gaitzsch, M. Potschke, S. Roth, B. Rellinghaus and L. Schultz, Scripta Mater. 57, 493
(2007).
58 H. D. Chopra and C. Ji, Phys. Rev. B 61, R14 913 (2000)
59 O. Soderberg, Y. Ge, N. Glavatska, O. Heczko, K. Ullakko, and V. K. Lindroos J. Phys IV
(France) 11, 287 (2001); S. Guo, Y. Zhang, B. Quan, J. Li, and X. Wang, Mat. Sci. Forum,
475-479, 2009 (2005).
16
Figure Captions:
Fig. 1: Isothermal magnetoresistance (MR, ∆ρm) of Ni1.75Mn1.25Ga, as a function of mag-
netic field at different temperatures (a) 300 to 150 K (b) 100 to 5 K. MR has been measured
in the cooling cycle. The arrow indicates the saturation magnetic field at 20 K. Solid lines
are fit to the data.
Fig. 2: (Color online) (a) Resistivity (ρ) as a function of temperature at zero and 5T
field for Ni1.75Mn1.25Ga between 5 to 180K for two cooling and heating cycles. The data
has been recorded in the following sequence: zero-field heating (ZFH); zero-field cooling
(ZFC); the sample is then subjected to a magnetic field of 5T and field-cooled heating (FH,
first cycle) is done up to RT; field-cooled cooling (FC) and once again FH (second cycle)
was measured. As, Af , Ms, and Mf are the austenitic and martensitic start and finish
temperatures, respectively. (b) Magnetoresistance during cooling and heating calculated
from the difference of ρ(T ) at zero and 5T after interpolating to same temperature intervals.
The difference has been taken between ZFC and FC in the cooling cycle and ZFH and FH
second cycle while heating.
Fig. 3: X-ray diffraction pattern of Ni1.75Mn1.25Ga as a function of temperature while cooling.
The calculated profiles obtained by Le Bail fitting (solid line through the experimental data
points) are shown for 150 and 40 K data. A and M indicate the peaks related to the
austenitic and martensitic phases, respectively.
Fig. 4: (a) Temperature dependence of magnetization in (a) a small applied field of 0.01 T
Fig. 5: Isothermal M − H loops at different temperatures.
17

-4
-2
0
2
4
M (
µ B /
f.u.)
-1.0 0.0 1.0
µ0H (tesla)
20K 100K 283K 360K
layout50, Graph63_1, R-MR.pxp
40 42 44 46 66 68 112 114
A (220
)
150K
(x 5)A (6
20)
120K
(x 4)
100K
inte
nsity
(arb
. un
it)
(x 12)
M
A
MM
M
80K
(/ 2)A
M
M
M
M M M
(-1
2 7)
(1 1
11)
(0 0
14)
(-2
0 1)
(-1
0 12
)
40K
(x 3)
M
(-2
0 16
)
2θ (degree)

-1.2
-0.8
-0.4
0.0
∆ρm
(%)
T(K) 300 235 150
(a)
-0.4
-0.3
-0.2
-0.1
0.0
0.1
0.2
0.3
∆ρm
(%)
-8 -4 0 4 8µ0H (tesla)
(b)
100 50 5
Layout 19: Graph 43_1, 45_1
110
105
100
ρ (µ
Ω−c
m)
(a) ZFC ZFH
FH 1st cycle
FC
FH 2nd
cycle
Mf
Ms
As
Af
-4
-3
-2
-1
0
1
∆ρm
(%)
1601208040temperature (K)
(b)
Ms Af
Mf As
Layout47:Graph70_1,73_2, R-MR.pxp
75x10-3
70
65
60
55
M (
µ Β /
f.u.)
30025020015010050temperature (K)
(a)
As
Af 0.1 T
0.68
0.66
14012010080
0.07
0.068
0.1 T
0.01 T
3.50
3.40
3.30
3.20
M (
µ Β /
f.u.)
1601208040temperature (K)
(b) 5 T
Layout48: Graph 48_5,75_1,48_4, R-MR.pxp