Crossflow membrane filtration of interacting nanoparticle suspensions

Molecular Dynamics Simulations of Evaporation-Induced Nanoparticle Assembly
Shengfeng Cheng1 and Gary S. Grest1
1Sandia National Laboratories, Albuquerque, NM 87185, USA∗
(Dated: December 11, 2013)
While evaporating solvent is a widely used technique to assemble nano-sized objects into desiredsuperstructures, there has been limited work on how the assembled structures are affected by thephysical aspects of the process. We present large scale molecular dynamics simulations of theevaporation-induced assembly of nanoparticles suspended in a liquid that evaporates in a controlledfashion. The quality of the nanoparticle crystal formed just below the liquid/vapor interface is foundto be better at relatively slower evaporation rates, as less defects and grain boundaries appear. Thistrend is understood as the result of the competition between the accumulation and diffusion times ofnanoparticles at the liquid/vapor interface. When the former is smaller, nanoparticles are depositedso fast at the interface that they do not have sufficient time to arrange through diffusion, whichleads to the prevalence of defects and grain boundaries. Our results have important implications inunderstanding assembly of nanoparticles and colloids in non-equilibrium liquid environments.
I. INTRODUCTION
Large, defect-free crystalline arrays of nanoparticles(NPs) are critical for many technologically importantultra thin film materials including filters, sensors, opti-cal devices, and magnetic storage media.1,2 One commonmethod for dispersing nanoparticles is to suspend themin solution, spread the suspension on a surface, and thenevaporate the solvent.1,3–5 This technique has been usedto assemble NPs into desired structures such as nanoclus-ters, rings, wires, stripes, films, and superlattices.2,6–18
The factors that influence the assembled structure in-clude the evaporation kinetics of the solvent, the flowproperties and concentration of NPs in the solution, theNP-NP interactions, the interactions between NPs andthe liquid/vapor interface, and the wetting/dewetting be-havior of the suspension on the solid surface.15 One ubiq-uitous example is the ”coffee-ring” stain left behind aftera particle-laden drop has evaporated. A simple and beau-tiful physical picture of this class of phenomena was firstclarified by Deegan et al.19 When the drop dries, a flowof liquid from the interior of the drop to its edge emergesto replenish the liquid that has evaporated from the re-gion around the pinned contact line. This flow convectsparticles to the drop’s edge, where they form ring-like de-positions. The model was tested recently by Chen et al.on the molecular scale with molecular dynamics (MD)simulations.20
Recently, Marin et al. demonstrated an order-to-disorder transition of the particle organization in coffee-ring stains.21,22 In the early stage of evaporation, thedeposition speed of particles at the contact line is lowand they have time to arrange into an ordered super-lattice by Brownian diffusion. However, at the end ofevaporation, because of the increase of the flux velocitytoward the contact line, particles are deposited at a highspeed and jammed into a quenched disordered phase asthe result of “rush-hour” traffic. The experiment clearlyshowed the importance of deposition/accumulation anddiffusive time scales on controlling the particle orderingduring solvent evaporation.
Bigioni et al. showed earlier that particle accumulationand diffusion times determine the assembly behavior andgrowth kinetics of monolayers of gold NPs with diame-ters ∼ 6 nm at a liquid/vapor interface.6,10,23 They foundthat in order to induce NP assembly at the interface, theevaporation rate of the solvent has to be rapid and anattractive interaction between the NPs and interface isrequired. The latter was induced by the excess of do-decanethiol in a toluene solution where gold NPs weresuspended. After the assembly is initiated, the growthkinetics of each crystalline domain can be exponential,sub-exponential, or linear in time, depending on the ra-tio of a diffusive length scale to the domain size. Bytuning the concentration of dodecanethiol, Bigioni et al.were able to make long-range ordered arrays of gold NPsover macroscopic areas.10
The work of of Bigioni et al. showed that evaporationgenerally needs to be fast so that the accumulation of NPsat the interface passes certain critical density, leading tothe nucleation and growth of 2-dimensional (2D) crystals.However, if evaporation is too fast, the crystalline qual-ity may diminish because NPs do not have sufficient timeto arrange via diffusion, but instead quenched disorderedstructures will emerge, similar to the “rush-hour” effectobserved in the coffee-ring stains. This trend was actu-ally observed earlier in an experiment of Im and Parkusing larger polystyrene colloids with diameters ∼ 230nm,24 where the evaporation rate was tuned by varyingthe temperature. They found that there exists an opti-mum evaporation temperature that yields particle arraysof the highest quality at the water/air interface. Whenthe evaporation temperature is higher than the optimumone, the accumulation rate of colloids at the interface istoo large, leading to defects in the array. It is thus in-teresting to determine if the effect of evaporation rateon particle assembly persists to smaller NPs in the fast-evaporation regime, which nicely fits the accessible lengthand time scales of MD simulations. This was the moti-vation of our work reported here. To anticipate the finalresults, we will show that there exits an optimum rate,determined by the diffusive times of NPs along the in-
arX
iv:1
301.
1720
v1 [
cond
-mat
.sof
t] 8
Jan
201
3

2
terface, at which the 2D crystal of NPs formed near theinterface has the highest quality even without the “an-nealing” step.The remainder of this paper is organized as follows.
The simulation methods are briefly introduced in Sec. II.Then Sec. III is devoted to results and discussion. Con-clusions are included in Sec. IV.
II. SIMULATION METHODS
We modeled the liquid solvent and its vapor withatoms interacting through a standard Lennard-Jones
(LJ) potential, ULJ(r) = 4ǫ[
(σ/r)12 − (σ/r)
6]
, where
r is the distance between two atoms, ǫ the unit of en-ergy, and σ the diameter of atoms. The potential wastruncated and shifted to 0 at rc = 3.0σ. The mass ofeach LJ atom is m and a time unit τ can be defined asτ =
√
mσ2/ǫ. The NPs of diameter d = 20σ were as-sumed to consist of a uniform distribution of atoms inter-acting with a LJ potential. For spherical particles, theirmutual interaction can be determined analytically by in-tegrating over all the interacting LJ atom pairs betweenthe two particles.25 The resulting potential depends ond, the inter-NP distance, and a Hamaker constant Ann
that characterizes the interaction strength. We used astandard value Ann = 39.48ǫ and a cut-off 20.427σ. Thisled to a purely repulsive NP-NP interaction, which physi-cally corresponds to adding a short surfactant coating onNPs to avoid flocculation.26,27 The interaction betweenLJ atoms and NPs was determined similarly by integrat-ing the interaction between a single LJ atom and thosewithin a NP. We set the corresponding Hamaker constantAns = 100ǫ, which with a cut-off of 14σ resulted in NPsthat were fully solvated and dispersed in the LJ solvent.28
The simulation cell was a rectangular box of dimen-sions Lx × Ly × Lz. The liquid/vapor interface was par-allel to the x-y plane, in which periodic boundary con-ditions were employed. In the z direction, the LJ atomsand NPs were confined by two flat walls at z = 0 andz = Lz, respectively. The depth of the liquid was atleast 150σ and the vapor was at least 70σ thick beforeevaporation. The resulting liquid and vapor densities are0.64m/σ3 and 0.056m/σ3, respectively. Note that LJmonomers have a vapor density higher than most realfluids (Fig. 1(a)). This implies that the vaporization rateof LJ liquids is quite large and they can evaporate veryfast.29 To provide a rough mapping of the evaporationrates (number fluxes of solvent atoms) in our simula-tions to experimental values, we take σ ∼ 0.3 nm andτ ∼ 2 ps, the slowest evaporation rate we can simulatewith MD is at the order of 10−4τ−1σ−2, correspondingto ∼ 5× 1026 sec−1m−2. This is about an order of mag-nitude higher than the maximum rate at which waterevaporates, which is not surprising since water has anunusually high boiling temperature and surface tensioncompared with the LJ liquids studied here.All simulations were performed using LAMMPS.30,31
The equations of motion were integrated using a velocity-
Verlet algorithm with a time step δt = 0.005τ . Duringthe equilibration, the temperature T was held at 1.0ǫ/kBby a Langevin thermostat weakly coupled to all LJ atomswith a damping constant Γ = 0.1τ−1. Once the liq-uid/vapor interface was equilibrated, the Langevin ther-mostat was removed except for those liquid atoms within15σ of the lower wall at z = 0. We confirmed that theevaporation occurring at the interface was not affectedby the thermostat.29
III. RESULTS AND DISCUSSION
A. Effect of Evaporation Rate
Most of our simulations started with 668 NPs dispersedin a liquid that contained about 7.1 million LJ atoms,32
as shown in Fig. 1(a). The volume fraction of NPs was0.205, which was based on the diameter of bare NPs.If we took into account the effect of a layer of solventof thickness ∼ 1σ that was effectively attached to NPs,27
the effective volume fraction of NPs would be even higher,roughly by a factor of 1.16. We have studied systemsof which the liquid/vapor interface has various aspectratios. Since the NPs were spherical and with a short-range isotropic interaction, their ordering at the inter-face was expected to be hexagonal. Thus to reduce thefinite size effects, we focused on a system with a cross-section that was commensurate with hexagonal packing,i.e., Lx =
√3Ly/2 = 271σ (Figs. 1 and 2). Lx and Ly
were chosen so that the lattice spacing in a perfectly or-dered hexagonal array would be the same as that foundafter some of the solvent was evaporated in a system thathad a square cross-section with Lx = Ly = 304σ. How-ever, this latter system has a larger interfacial area thanthe previous one. To reduce the potential influence ofareal size, we studied another system of which Ly wasincreased to 352σ while Lx was kept at 271σ, so that notonly the interfacial area was close to that of the squareinterface, but also the aspect ratio of the interface fa-vored a hexagonal packing with a lattice spacing foundin the previous two systems. Our results indicated thatthe size and aspect ratio of the interface had negligibleeffects on the particle packing. Below we mainly discussthe results for the first system and include the results ofother two systems in Supplementary Material.33
The side view of the NP distribution in the equilibriumsolution is shown in Fig. 1(e), where the dashed line in-dicates the location of the liquid/vapor interface. NPsare almost uniformly distributed in the solvent. Notethat during all our simulations, including the evapora-tion runs described below, all NPs were fully solvated inthe liquid solvent. NPs within d = 20σ of the interfacewere grouped together and referred as the top layer. Atequilibrium their areal coverage is about 45%, which isbelow the critical coverage 70% at the 2D hexatic phasetransition.34 As shown in Fig. 1(i), the layer is clearlydisordered.To quantitatively characterize the in-plane packing ge-
ometry, we have defined an order parameter ψ6 for each

3
1.0
0.8
0.6
0.4
0.2
(a) (b) (c) (d)
(e) (f) (g) (h)
(i) (j) (k) (l)
FIG. 1: Snapshots of a NP solution with Lx =√3Ly/2 = 271σ: (a) the equilibrated solution before the evaporation of
solvent (containing ∼ 7.1 million LJ atoms); (b) after 52% (∼ 3.7 million atoms) of the solvent had evaporated at a fixedrate 2.35 × 10⁻⁴τ−1σ−2 for 1.85 × 10⁵τ ; (c) after 52% (∼ 3.7 million atoms) of the solvent had evaporated into a vacuum for2.9× 104τ ; (d) the same system as in (c), but the system had re-equilibrated for 3.4× 10⁴τ after the evaporation was stopped.For clarity in (a)-(d) only about a quarter of the system in the x-y plane is shown. (e)-(h): Side views of the NP distributionfor systems in (a)-(d), respectively; the dashed lines indicate the location of the liquid/vapor interface. (i)-(l): Top views ofNPs in the top layer for systems in (a)-(d), respectively; colors are based on an order parameter (ψ6) for each NP as definedin Sec. III(A).
NP. A Voronoi construction was performed and thoseNPs with 6 neighbors were identified since in a close2D packing each particle was expected to have 6 nearestneighbors forming a hexagon. The angle θi correspond-ing to the i-th side of the hexagon was found and ψ6 wascomputed as ψ6 =
∑6
i=1 |θi − π/6|. We found that ψ6
was typically in the range of 0 to 4π/3. So we normalizedψ6 by 4π/3 and the normalized ψ6 was thus in the rangeof 0 to 1. ψ6 = 0 indicates a perfect hexagonal packing,while ψ6 → 1 indicates situations far from a hexagonallattice. The Voronoi construction also showed that allother NPs had either 5 or 7 neighbors and they wereassigned ψ6 = 1 to indicate that their packing configura-tion was not hexagonal. In Fig. 1(i)-(l), NPs are coloredaccording to their values of ψ6 (NPs with ψ6 ≤ 0.2 arecolored red and with ψ6 = 1 are colored blue). As shownin Fig. 1(i), in an equilibrated solution NPs near the in-terface are randomly distributed without any ordering,which is also clear from the Voronoi construction shownin Fig. 2(a).
Evaporation of the solvent was modeled by introduc-ing a deletion zone from (Lz − 20σ) to Lz. All or acertain number of vapor atoms in the deletion zone wereremoved every 0.5τ . The former mimicked evaporationinto a vacuum which proceeded at the maximum rate,while the latter simulated evaporation at a fixed ratejE , namely the rate of removal of solvent atoms out ofthe simulation box. Results in Figs. 1(b), (f), and (j)are for a system of which the solvent had evaporated atjE = 2.35 × 10⁻⁴τ−1σ−2 since t = 0. During evapora-tion, the liquid film where NPs were dispersed shrunk,and NPs started to accumulate below the liquid/vaporinterface that impinged from above. In this case the va-por density was only slightly reduced compared with itsequilibrium value (Fig. 1(b)) throughout the whole sim-ulation and the interface always remained close to equi-librium. As a result, the rate jE was roughly the sameas the actual outward flux of solvent atoms near the liq-uid/vapor interface or in the vapor. The side view of theNP distribution in Fig. 1(f) shows that NPs formed layers

4
(a) (b) (c) (d)
FIG. 2: (a)-(d): Voronoi constructions of NPs in the top layer in Figs. 1(i), (j), (k), and (i), respectively. Colors are based onψ6.
where their concentration had peaks. At t = 1.85×10⁵τ ,52% of the solvent (∼ 3.7 million atoms) had evaporated,and the volume fraction of NPs increased to 0.35. Atleast 3 layers of NPs were formed as shown in Fig. 1(f),with 171 NPs in the top layer. Figure 1(j) shows thein-layer structure of these NPs, from which a hexagonalpacking is clearly visible. This is also evident from thecorresponding Voronoi construction (Fig. 2(b)).
Note that the number of layers induced by evaporationdepends on the volume fraction of NPs and the interfacialarea. In many experiments, NP solutions are quite diluteand only one layer of NPs forms, but more layers werealso experimentally observed,6 as in our simulations. Thestructures in the NP layers below the top one were essen-tially similar but with a diminishing crystalline qualityas the distance from the interface increased. Two con-secutive layers were roughly in-registry as in fcc or hcpcrystals, but we had too few layers to distinguish the twocrystal structures. For clarity, we focus on the in-planestructure in the top NP layer below.
The results in Figs. 1(c), (g), and (k) are for a sys-tem with the same starting state, but with the solventevaporating into a vacuum since t = 0. Here the va-por was quickly depleted (Fig. 1(c)) and the evaporationat the liquid/vapor interface proceeded at the maximumrate, which decreased with time and eventually reached aplateau value around 1.2× 10⁻³τ−1σ−2 (see Fig.3). Theactual flux of solvent atoms at the interface was lowerthan jE for the first 1000τ during which the vapor de-pletion occurred, and then the two were almost identi-cal. It only took 2.9 × 10⁴τ to evaporate roughly thesame amount (52%) of solvent as in the previous casewith a fixed rate. The layering of NPs was obvious fromthe side view (Fig. 1(g)). However, each layer was com-posed of several 2D grains separated by grain boundaries,where the packing deviated significantly from a hexago-nal lattice as indicated by colors based on the values of ψ6
(Fig. 1(k)) and the corresponding Voronoi construction(Fig. 2(c)) for NPs in the top layer.
Comparing Figs. 1(j) and (k) (or Figs. 2(b) and (c))
shows that the slower evaporation led to a NP packingwith a better crystalline order. The same trend was alsofound for the other two systems evaporating at variousrates (see Figs. S1(a) and (b), and Figs. S2(a) and (b)in Supplementary Material).33 This effect of evaporationrate jE on the assembly quality can be understood onthe basis of two time scales: one describes how fast NPsaccumulate at the interface, and another is determinedby the diffusivity of NPs along the interface. In thesteady state, the liquid/vapor interface recedes almostuniformly, with a receding velocity v that is related tojE through jE = ρv, where ρ = 0.64σ−3 is the liquiddensity. Using a model discussed by Bigioni et. al.,10 atime scale ta = (φvd2)−1 can be defined to describe thespeed of NP accumulation at the interface, where φ is theNP concentration in the solution. After NPs reach thetop layer, they primarily diffuse along the interface. Wedenote the diffusive time scale as td, which can be esti-mated as td = d2/4D with D as the diffusion coefficient.For d = 20σ and D ∼ 3× 10⁻³σ2/τ ,28 the diffusive timeis td ∼ 3.3× 10⁴τ .
NPs accumulate faster than they diffuse in the limitta ≪ td, where the growth of 2D crystals is induced pri-marily by NP addition. As it is unlikely that crystallinegrains in different spatial regions have orientations thatmatch, this leads to the occurrence of grain boundarieswhen grains meet. However, in the opposite limit ta & td,NPs are added to the top layer slowly and small crystalregions can act as seeds which then grow larger throughNP diffusion. In this case defects and grain boundariesare less likely to appear. The NP layer also has moretime to relax into a uniform hexagonal lattice even if im-perfections in the packing occur. For the system shownin Figs. 1(k) and 2(c), the solvent evaporated fast andthe interface velocity v was about 2 × 10⁻³σ/τ , whichleads to ta ≃ 1.3 ∼ 2.3 × 10⁴τ . The value of ta has arange since the NP concentration φ increased as the sol-vent evaporated. For Figs. 1(j) and 2(b) where jE wasfixed at 2.35× 10⁻⁴τ−1σ−2, v was about 3.7× 10⁻⁴σ/τ ,which gives ta ≃ 7 ∼ 12 × 104τ . As expected, ta < td

5
in the fast evaporation (into a vacuum), while ta > td inthe slow evaporation (at a small fixed rate).Since ta and jE are related through ta = (φd2jE/ρ)
−1,by equating ta to td one can estimate a critical ratejC = ρ/(φd2td). When jE < jC , an almost defect-free hexagonal NP array is expected; while for jE > jC ,grain boundaries and point defects will appear in the2D crystal induced by evaporation. For our simulations,jC ≃ 9×10⁻⁴τ−1σ−2. When the solvent evaporated intoa vacuum, the evaporation rate was always larger thanjC , leading to NP layers with defects and grain bound-aries. However, when jE was reduced and fixed at avalue below jC , the assembly quality in NP layers wasgreatly improved. Furthermore, from experiments it isalready known that if the evaporation is too slow, thenthe density of NPs at the interface never reaches the crit-ical nucleation density since NPs have abundant time todiffuse back into the bulk of the solution, and assemblyis not initiated in the first place.6,10 Combined with thisobservation, our simulations indicate that there exits anoptimum evaporation rate jopt at which the NP arraysformed near the liquid/vapor interface are of the highestquality. Though it is very difficult to precisely calcu-late jopt from simulations, our results indicate that joptshould be about an oder of magnitude smaller than jCsince only a few defects and grain boundaries were ob-served at jE ≃ jC/5 (Fig. 2(b) and Fig. S1(a) in Supple-mentary Material),33 while more were seen at jE ≃ jC(Fig. S2(a) in Supplementary Material).33 Therefore, areasonable estimate is jopt ∼ jC/10 = ρ/(10φd2td).
B. Effect of Annealing
Since the volume fraction of NPs was only 0.35 inFig. 1(c) and still below the critical fraction of hard-sphere crystallization (∼ 0.545),35 we expected that thelayering structure in Fig. 1(g) would be destroyed whenthe evaporation was stopped and the system was allowedto relax. However, this was not the case on MD timescales, and the layering became even more dramatic af-ter the evaporation ceased at t = 2.9 × 10⁴τ and thesystem had re-requilibrated, as shown in Fig. 1(d) and(h) at t = 6.3 × 10⁴τ . The robustness of layering waspartly due to the fact that some solvent evaporated tofill the vapor-depleted region above the liquid and to re-establish the liquid/vapor equilibrium. This increasedthe volume fraction of NPs in the solution to 0.38. Fur-thermore, melting requires the diffusion of NPs in the di-rection perpendicular to the layers, which was hinderedby the ordered structure in each layer and the commen-surability between layers. Our results thus indicate thatthe system was dominated by non-equilibrium dynamicswith long relaxation and equilibration times, much largerthan those achievable with MD simulations.The organization of NPs in the top layer was greatly
improved after relaxation. The grain boundaries inthis layer completely disappeared after approximately3.4 × 104τ and NPs formed an almost perfect hexag-onal lattice, as shown in Fig. 1(l) and Fig. 2(d) (also
see Figs. S1(c) and S2(c) in Supplementary Material).33
This finding is consistent with an experimental observa-tion that alternative evaporation and relaxation produce2D crystals of NPs with less defects.36 It reveals the im-portance of relaxation that allows imperfections in theNP packing to heal via structural re-arrangement, whichonly gradually proceeds through the diffusion of NPs.The improvement of the crystalline quality was also ob-served for the other layers below the top one after anneal-ing, though over the time scale of simulations they werestill not completely ordered. For NPs with diameters atthe nanometer scale and without mutual attractions asstudied here, their diffusion is relatively fast and thusthe time scale of structural re-arrangement is accessiblewith MD. However, it can be imagined that for largerNPs or colloidal particles in the micrometer range andwith attractive inter-particle interactions, diffusion be-comes much slower and it will take much longer time toremove defects and grain boundaries. This is one of thereasons that they are frequently observed in assemblyexperiments.6,10
C. Effect on Evaporation Rate of Assembled
Nanoparticle Layers
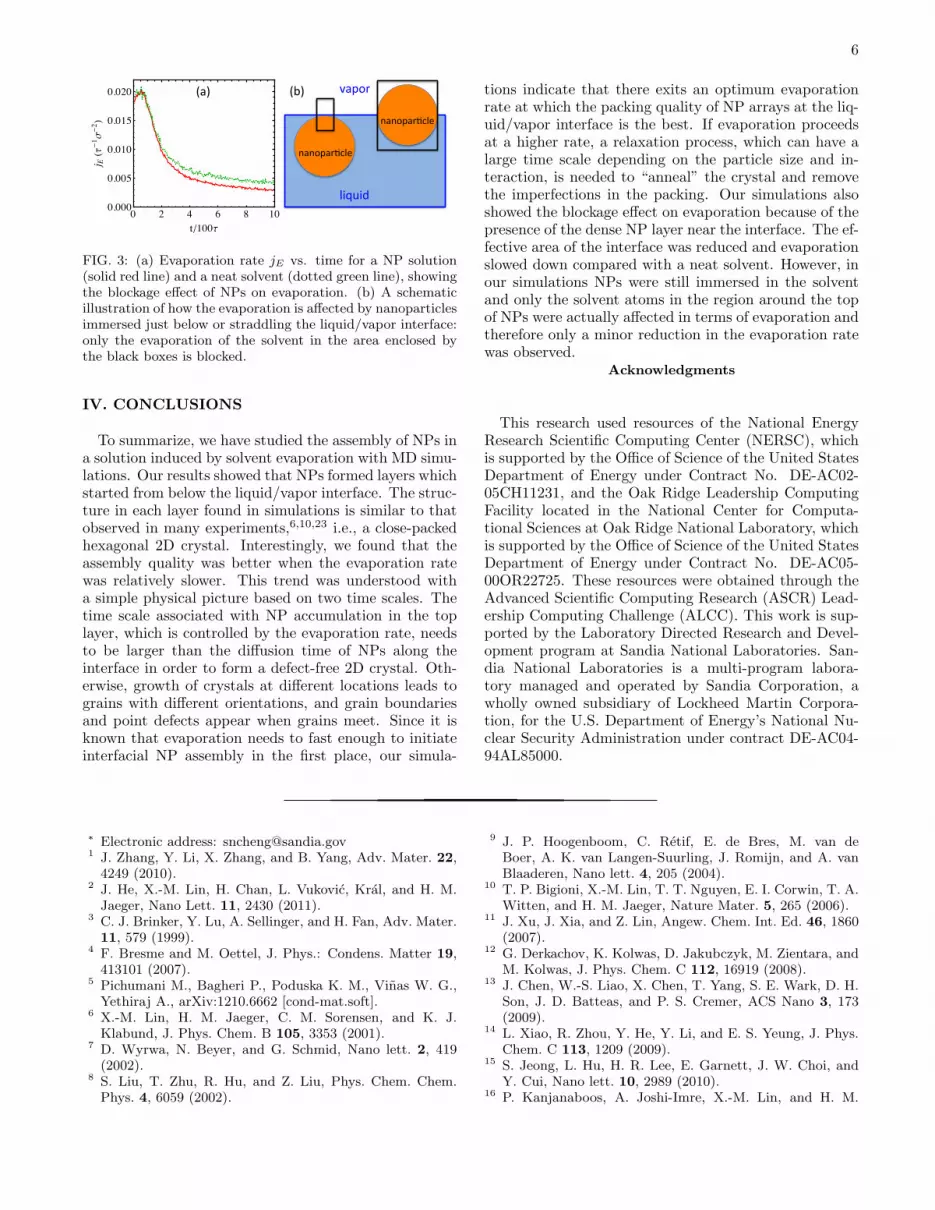
When NPs crystallize below the liquid/vapor interface,they slow down the evaporation, since liquid atoms needto circumvent NPs to reach the interface and then evap-orate. This blockage effect on evaporation is shown inFig. 3(a), where the rate jE is plotted against time for aneat solvent and the NP solution that both evaporatedinto a vacuum. At earlier times, NPs were dilute nearthe interface and liquid atoms essentially did not feeltheir presence. Therefore jE was roughly the same forthe two systems. At later times, since NPs started toform a dense layer below the interface, jE for the NPsolution became smaller than that for the pure solvent.The factor of reduction was 25% when jE reached theplateau values in the two systems at t & 800τ . How-ever, the reduction in jE is not as dramatic as what anaive estimate of the areal reduction of the liquid/vaporinterface would indicate. The reason is that NPs still sitbelow the interface in our simulations and their top sidesonly barely touched the liquid/vapor transition zone. Asillustrated in Fig. 3(b), only liquid atoms attached to thesurface around the north pole of NPs were affected interms of evaporation. At several σ away from this region(outside the box enclosing the north pole of the immersedNP in Fig. 3(b)), the distance from the interface to NPsurface quickly increases beyond a few diameters of LJatoms, and the evaporation of the liquid there was notinfluenced by the presence of NPs. However, if the NPlayer straddled the liquid/vapor interface (see the strad-dling NP in Fig. 3(b)), we would expect jE to decreaseby an order of magnitude compared with the case of aneat solvent. In this case, the interfacial area is indeedreduced by NPs. The evaporation cannot occur in thearea covered by NPs and will slow down significantly.
6
0 2 4 6 8 100.000
0.005
0.010
0.015
0.020
t�100Τ
j E�Τ�1Σ�2�
vapor
liquid
nanopar-cle
nanopar-cle
(a) (b)
FIG. 3: (a) Evaporation rate jE vs. time for a NP solution(solid red line) and a neat solvent (dotted green line), showingthe blockage effect of NPs on evaporation. (b) A schematicillustration of how the evaporation is affected by nanoparticlesimmersed just below or straddling the liquid/vapor interface:only the evaporation of the solvent in the area enclosed bythe black boxes is blocked.
IV. CONCLUSIONS
To summarize, we have studied the assembly of NPs ina solution induced by solvent evaporation with MD simu-lations. Our results showed that NPs formed layers whichstarted from below the liquid/vapor interface. The struc-ture in each layer found in simulations is similar to thatobserved in many experiments,6,10,23 i.e., a close-packedhexagonal 2D crystal. Interestingly, we found that theassembly quality was better when the evaporation ratewas relatively slower. This trend was understood witha simple physical picture based on two time scales. Thetime scale associated with NP accumulation in the toplayer, which is controlled by the evaporation rate, needsto be larger than the diffusion time of NPs along theinterface in order to form a defect-free 2D crystal. Oth-erwise, growth of crystals at different locations leads tograins with different orientations, and grain boundariesand point defects appear when grains meet. Since it isknown that evaporation needs to fast enough to initiateinterfacial NP assembly in the first place, our simula-
tions indicate that there exits an optimum evaporationrate at which the packing quality of NP arrays at the liq-uid/vapor interface is the best. If evaporation proceedsat a higher rate, a relaxation process, which can have alarge time scale depending on the particle size and in-teraction, is needed to “anneal” the crystal and removethe imperfections in the packing. Our simulations alsoshowed the blockage effect on evaporation because of thepresence of the dense NP layer near the interface. The ef-fective area of the interface was reduced and evaporationslowed down compared with a neat solvent. However, inour simulations NPs were still immersed in the solventand only the solvent atoms in the region around the topof NPs were actually affected in terms of evaporation andtherefore only a minor reduction in the evaporation ratewas observed.
Acknowledgments
This research used resources of the National EnergyResearch Scientific Computing Center (NERSC), whichis supported by the Office of Science of the United StatesDepartment of Energy under Contract No. DE-AC02-05CH11231, and the Oak Ridge Leadership ComputingFacility located in the National Center for Computa-tional Sciences at Oak Ridge National Laboratory, whichis supported by the Office of Science of the United StatesDepartment of Energy under Contract No. DE-AC05-00OR22725. These resources were obtained through theAdvanced Scientific Computing Research (ASCR) Lead-ership Computing Challenge (ALCC). This work is sup-ported by the Laboratory Directed Research and Devel-opment program at Sandia National Laboratories. San-dia National Laboratories is a multi-program labora-tory managed and operated by Sandia Corporation, awholly owned subsidiary of Lockheed Martin Corpora-tion, for the U.S. Department of Energy’s National Nu-clear Security Administration under contract DE-AC04-94AL85000.
∗ Electronic address: [email protected] J. Zhang, Y. Li, X. Zhang, and B. Yang, Adv. Mater. 22,4249 (2010).
2 J. He, X.-M. Lin, H. Chan, L. Vukovic, Kral, and H. M.Jaeger, Nano Lett. 11, 2430 (2011).
3 C. J. Brinker, Y. Lu, A. Sellinger, and H. Fan, Adv. Mater.11, 579 (1999).
4 F. Bresme and M. Oettel, J. Phys.: Condens. Matter 19,413101 (2007).
5 Pichumani M., Bagheri P., Poduska K. M., Vinas W. G.,Yethiraj A., arXiv:1210.6662 [cond-mat.soft].
6 X.-M. Lin, H. M. Jaeger, C. M. Sorensen, and K. J.Klabund, J. Phys. Chem. B 105, 3353 (2001).
7 D. Wyrwa, N. Beyer, and G. Schmid, Nano lett. 2, 419(2002).
8 S. Liu, T. Zhu, R. Hu, and Z. Liu, Phys. Chem. Chem.Phys. 4, 6059 (2002).
9 J. P. Hoogenboom, C. Retif, E. de Bres, M. van deBoer, A. K. van Langen-Suurling, J. Romijn, and A. vanBlaaderen, Nano lett. 4, 205 (2004).
10 T. P. Bigioni, X.-M. Lin, T. T. Nguyen, E. I. Corwin, T. A.Witten, and H. M. Jaeger, Nature Mater. 5, 265 (2006).
11 J. Xu, J. Xia, and Z. Lin, Angew. Chem. Int. Ed. 46, 1860(2007).
12 G. Derkachov, K. Kolwas, D. Jakubczyk, M. Zientara, andM. Kolwas, J. Phys. Chem. C 112, 16919 (2008).
13 J. Chen, W.-S. Liao, X. Chen, T. Yang, S. E. Wark, D. H.Son, J. D. Batteas, and P. S. Cremer, ACS Nano 3, 173(2009).
14 L. Xiao, R. Zhou, Y. He, Y. Li, and E. S. Yeung, J. Phys.Chem. C 113, 1209 (2009).
15 S. Jeong, L. Hu, H. R. Lee, E. Garnett, J. W. Choi, andY. Cui, Nano lett. 10, 2989 (2010).
16 P. Kanjanaboos, A. Joshi-Imre, X.-M. Lin, and H. M.

7
Jaeger, Nano Lett. 11, 2567 (2011).17 A. Dong, X. Ye, J. Chen, and C. B. Murray, Nano lett. 11,
1804 (2011).18 J. A. Fan, K. Bao, L. Sun, J. Bao, V. N. Manoharan,
P. Nordlander, and F. Capasso, Nano lett. 12, 5318 (2012).19 R. D. Deegan, O. Bakajin, T. F. Dupont, G. Huber, S. R.
Nagel, and T. A. Witten, Nature 389, 827 (1997).20 Chen W., Koplik J., Kretzschmar I., arXiv:1203.1910
[cond-mat.soft].21 Alvaro G. Marın, H. Gelderblom, D. Lohse, and J. H.
Snoeiger, Phys. Rev. Lett. 107, 085502 (2011).22 Alvaro G. Marın, H. Gelderblom, D. Lohse, and J. H.
Snoeiger, Phys. Fluids 23, 091111 (2011).23 S. Narayanan, J. Wang, and X.-M. Lin, Phys. Rev. Lett.
93, 135503 (2004).24 S. H. Im and O. O. Park, Langmuir 18, 9642 (2002).25 R. Everaers and M. R. Ejtehadi, Phys. Rev. E 67, 041710
(2003).26 P. J. in’t Veld, M. K. Petersen, and G. S. Grest, Phys. Rev.
E 79, 021401 (2009).27 G. S. Grest, Q. Wang, P. J. in’t Veld, and D. J. Keffer, J.
Chem. Phys. 134, 144902 (2011).28 S. Cheng and G. S. Grest, J. Chem. Phys. 136, 214702
(2012).29 S. Cheng, J. B. Lechman, S. J. Plimpton, and G. S. Grest,
J. Chem. Phys. 134, 224704 (2011).30 S. J. Plimpton, J. Comp. Phys. 117, 1 (1995).31 http://lammps.sandia.gov/.32 We also simulated a larger system starting with 720 NPs
dispersed in a solvent containing about 17 million LJ atoms
at a volume fraction 0.1. Results are qualitatively similarto those reported here, which indicates that our results arerobust and insensitive to both the starting volume fractionof NPs and the finite size of the liquid/vapor interface.
33 See Supplementary Material Document No.XXXXX forVoronoi constructions of the other two systems with Lx =Ly = 304σ, and Lx = 271σ and Ly = 352σ, respec-tively. For information on Supplementary Material, seehttp://www.aip.org/pubservs/epaps.html.
34 K. Binder, S. Sengupta, and P. Nielaba, J. Phys.: Condens.Matter 14, 2323 (2002).
35 W. G. Hoover and F. H. Ree, J. Chem. Phys. 49, 3609(1968).
36 W. J. Ray, private communication.
Supplementary Material
In this Supplementary Material, we include Voronoiconstructions of NPs in the top layer for the other 2systems that we have studied. They underwent variousevaporation schemes, as is detailed in the captions of eachfigure. Figure S1 is for a system with a square cross sec-tion (Lx = Ly = 304σ). Figure S2 is for another systemthat had a similar area, but the sizes of the liquid/vaporinterface were adjusted to accommodate an integer num-ber of NPs in both x and y directions (Lx = 271σ andLy = 352σ), respectively.

8
(a) (b) (c)
FIG. S1: Voronoi constructions of NPs in the top layer for the system with Lx = Ly = 304σ: (a) after 45% (∼ 3.2 millionatoms) of the solvent had evaporated at a fixed rate 2.17× 10⁻⁴τ−1σ−2 for 1.645× 10⁵τ ; (b) after 45% (∼ 3.2 million atoms)of the solvent had evaporated into a vacuum for t = 1.9× 10⁴τ ; (c) the same system as in (b) but relaxed for 3.4× 10⁴τ afterthe evaporation was stopped.
(a) (b) (c)
FIG. S2: Voronoi constructions of NPs in the top layer for the system with Lx = 271σ and Ly = 352σ: (a) after 42% (∼ 3million atoms) of the solvent had evaporated at a fixed rate 1.05× 10⁻³τ−1σ−2 for 3× 10⁴τ ; (b) after 42% (∼ 3 million atoms)of the solvent had evaporated into a vacuum for 1.6× 10⁴τ ; (c) the same system as in (b) but relaxed for 2.8× 10⁴τ after theevaporation was stopped.
Copyright © 2022 FDOKUMEN