
Stable High Beta Plasmas Confined by a Dipole Magnetic Field
32 Surfaceand CoatingsTechnology,59 (1993) 32—40
Modelling of dischargesandnon-thermalplasmas—applicationstoplasmaprocessing
J. P. Boeuf, L. C. Pitchford,A. Fiala andPh. BelenguerCentredePhysiqueAtomiquedeToulouse,CNRSUnite deRechercheAssociée277, UniversitéPaul Sabatier,118 RoutedeNarbonne,F-31062ToulouseCedex(France)
Abstract
We presentanoverviewof modelsof low pressure,non-thermalgasdischargesascommonly usedin plasmaprocessing.Significantprogresshasbeenmadein the pastdecadetowards thegoal of a self-consistentmodelof the electricalpropertiesof discharges,whetherd.c., r.f. or microwavedischarges.Thesemodelsare basedon solutionsof thechargedparticletransportequationscoupledwith Poisson’sequationfor the electric field, and provide the spaceand time distribution of chargedparticledensities, currentdensitiesandelectricfield or potential.Someof themostsophisticatedmodelsalsoprovidetheelectronandion velocity distributionfunctionsin thedischargeatanypoint in spaceortime. It is now possibleto describereasonablyaccuratelythephysicalpropertiesofa discharge(includingtheplasma,the electroderegionsandthewalls) for two-dimensionalcylindrical geometries,evenfor complexelectrodeconfigurationsinvolving e.g.ahollow cathodeoranode.A surveyof theavailablemodelsis presentedhereandwe illustratethecurrentstateoftheart by resultsfrom one-andtwo-dimensionalmodelsofd.c., r.f. andtransientdischarges.
1. Introduction In thepresentpaperemphasisis placedmoreon generalpropertiesof low pressure,non-equilibrium discharges
In a non-thermalplasmathe centralrole is playedby than on specific processingconditionsand no attemptthe electronswhich transform the electric power into will be made to describe the plasma chemistry of a“chemical power”. The energy gainedby the electrons particulartype of processingreactor.from theelectric field is releasedin theform of excitation, A completemodel of a plasmareactormust includedissociation,ionization or heatingof the gas molecules threedifferent(but coupled)submodels[1]: (1) an electri-or by radiation. cal model of the dischargeand plasma; (2) a model
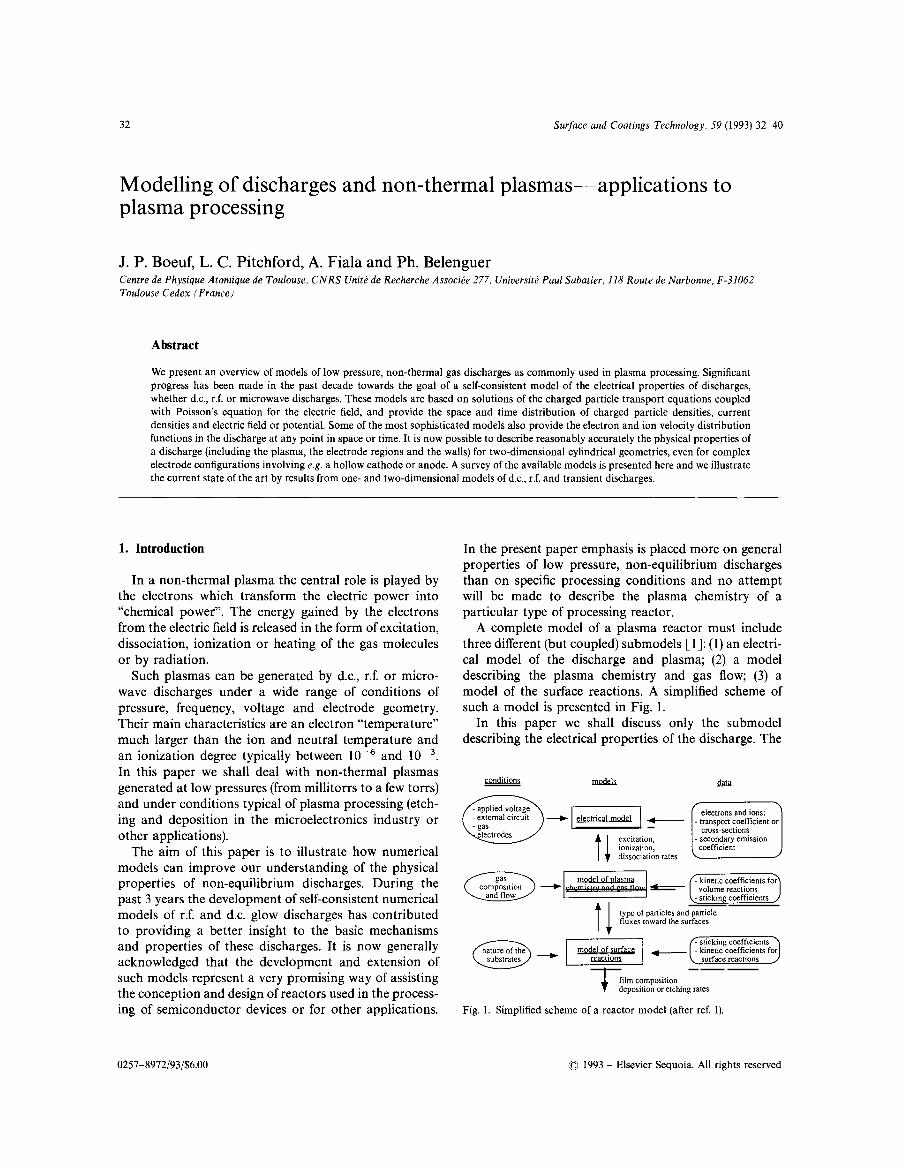
Suchplasmascan be generatedby d.c., r.f. or micro- describing the plasma chemistry and gas flow; (3) awave dischargesunder a wide range of conditions of model of the surfacereactions.A simplified schemeofpressure,frequency, voltage and electrode geometry. sucha model is presentedin Fig. 1.Theirmaincharacteristicsare anelectron“temperature” In this paper we shall discuss only the submodelmuch larger than the ion and neutraltemperatureand describingthe electricalpropertiesof the discharge.Thean ionization degreetypically between106 and lOs.In this paperwe shall deal with non-thermalplasmas
conditions ttiQdSiageneratedat low pressures(from millitorrs to a few torrs)andunderconditionstypical of plasmaprocessing(etch- /‘ie~olt~\ (~trons andions
ing and depositionin the microelectronicsindustry or ( externalcircuit ) —Ø~ electricalm~J ~ - transportcoefficiei~tor
otherapplications). . . gtect~~e~~_/ + excitation,
The aim of this paper is to illustrate how numerical I + ~ rates coefficient
modelscan improve our understandingof the physical ___________
propertiesof non-equilibrium discharges.During the ~ chernistrvan~egsflpw~4~ eticcoefficientsfo~)
past3 yearsthe developmentof self-consistentnumerical andflow A I t~stickingcoefficientsJ
modelsof r.f. and d.c. glow dischargeshascontributed T I typeof particlesandparticlefluxestowardthesurfaces
to providing a better insight to the basic mechanisms ____________
and propertiesof thesedischarges.It is now generally ~ modelof surface ______
acknowledgedthat the developmentand extensionof \..sisbstrates~rates t~5~iiQfl5 ~ surfacereactions
suchmodelsrepresenta very promisingway of assisting film composition
theconceptionanddesignof reactorsusedin theprocess- depositionoretchingrates
ing of semiconductordevicesor for other applications. Fig. 1. Simplified schemeof a reactormodel (after ref. 1).
0257—8972/93/$6.00 © 1993 — ElsevierSequoia.All rights reserved
J. P. Boeufet a!. / Dischargeand non-thermalplasmamodelling 33
principles of this model are outlined in Section 2. suchdischargesare still beyondthe practicalcapabilitiesSection 3 presentssome examplesof fluid, hybrid and of mostcomputers.particle modelsof low pressured.c., transientand r.f. Particlemodelsare appropriatefor conditionswheredischarges. the particle mean free paths are not negligible with
respectto the characteristicdimensionsof the problem.Forhigherpressuresituationstheyare notpracticalandthe fluid or hybrid approachbecomesmoreefficient.
2. Principles of the models For pressuresin therangeof hundredsof millitorrs afluid description of the chargedparticle transport is
Physical models of non-equilibrium dischargesare generally appropriate. In a fluid model the chargedbasedon solutions of electronand ion transportequa- particles are characterizedby their mean properties:tions coupled with Poisson’sequation for the electric density, mean velocity and meanenergy. The chargedfield. A numberof papersdescribingsuch modelscan particle transportequationsused in a fluid model arebe found in ref. 2. The most complete and accurate momentsof the Boltzmannequation,generallycontinu-descriptionof chargedparticletransportis basedon the ity, momentum transfer and energy equations.SinceBoltzmannequation,which providesthe time variation such a systemof momentsdoesnot form a closedset,of particle velocity distribution functions.The simplest onehasto makefurther assumptionsaboutthe particleway to solve the Boltzmannequationas a space-and velocity distribution functions to estimate the termstime-dependentproblem is to describethe ensembleof which dependon higher order moments(e.g. the heatchargedparticles by a representativesample and to flux or the ionization frequency). Fluid models havefollow the trajectoriesof eachindividual particle subject beenusedextensivelyduring the past5 yearsto describeto accelerationby the (self-consistent)fields andunder- r.f. andd.c. glow discharges[2, 10—22].going collisions with the neutralbackground.A model The assumptionswhich are made as to the electronusing this representationis termeda “particle model”. distribution functions in a fluid model will naturallyIn a particlemodel thenumericaltechniqueusedfor the limit the domain of validity of the model. In somecharged particle transport is generally based on situationsand for particular regionsof the discharge,the “particle-in-cell” (PlC) method described in the evenfor high pressureconditions,it canbe verydifficultbooksby Birdsall and Langdon[3] and Hockney and to make reasonableassumptionson the distributionEastwood[4]. This method has been usedextensively function andto obtain acorrectestimateof the ioniza-in the context of hot plasmas to solve the Vlasov tion frequency.This is often the case in the cathodeequation.In the caseof weakly ionized gasesthe PlC regionof a discharge,wherefast electronsacceleratedinmethodmustbe combinedwith a descriptionof electron the sheath provide most of the ionization. For such(or ion) collisions with neutralatoms.This is generally situationsit is possibleto combinea particle approachdoneby usinga Monte Carlo (MC) techniquein which to describethe highenergypart of theelectrondistribu-parameterssuch as the time of collision, the natureof tion with a fluid representationof the low energythe collision and angular scatteringare consideredas electronsforming the bulk of the distribution. Theserandomvariableswhoseprobabilitydensitiesare related models are generally termed “hybrid models”. Someto electron (ion)—neutral cross-sections(see e.g. ref. 5). examplesof hybrid modelscanbe found in refs. 23—25.Particle models based on particle-in-cell and MonteCarlo methodswill be termedPIC—MC modelsin thefollowing. The basic data used in these models are 3. Examplesof fluid, hybrid and particle modelselectron— andion—moleculecross-sections.Someexam-ples of such models applied to r.f. dischargescan be 3.1. Fluidmodelsfound in refs. 6—10. Thefollowing caseconcernsa two-dimensionalmodel
Note that although PIC—MC simulationsare in prin- of an r.f. dischargein silaneunderthe following condi-ciple moreaccuratethan fluid modelssince they do not tions: frequency13.56MHz, pressure0.1 Torr (gastern-imply any assumptionson the distribution functions, perature300 K), gapspacing3.6 cm (alongthe dischargethey are verytime consumingandsubjectto “numerical axis), reactorradius 6 cm. Thegeometryof thedischargeheating”if thenumberof particlessimulatedor the grid chamberis displayedin Fig. 2. Calculationshavebeenspacingis notcarefullychosen.Typically, thetrajectories made for various values of the radius r of the smallin phasespaceof 1 Ø4_1 o~electronsand ions must be electrode:(a) r =3 cm; (b) r =6cm; (c) symmetricalcon-followed in a one-dimensional(1D) model of an r.f. figuration. An r.f. voltage (amplitude V~=100 V) isdischargeand morethan a few tens of CPU hours on applied to the poweredelectrodethrough a capacitor.the fastestworkstationsmay be necessaryto reachthe Under these conditions it can be shown [10] thatsteadystate.Two-dimensional(2D) PIC—MC modelsof secondaryemission under ion bombardmentof the

34 J. P. Boeufet al. / Dischargeand non-thermalplasmamodelling
3.6cm cannotreach the electrodeduring the anodicpart of acycle for this electrode)so that their concentrationiscontrolled by other loss processessuch as ion—ion
Groundedelectrode recombination. The negative-ion-to-electronconcen-Poweredelectrode
tration ratio can therefore be large even in a weaklyVrLJ L~i Dischargeaxis electronegativegassuch as silane.
I T 1 T Another consequenceof the asymmetry of the31cm 6cm electrodeconfigurationis thefact that the voltageacross
the electrodeis not purely r.f. buthasa d.c. component_L (seee.g. ref. 26). This appearsin the spatial distribution— -~ of the electricfield displayedin Fig. 3 (the averagesheath
voltage correspondingto the small electrodeis larger(b) (C) than the averagesheathvoltage of the largerelectrode)
and also in Fig. 4, which shows the time variationsof
200 200(a) (b)
Fig. 2. Electrodegeometriesusedin the2D fluid model of a silaner.f. Vrf tOO Vrf
discharge.Cases(a), (b) and (c) correspondto different electrodearea ,.— ~‘
ratios (the electrodeconfiguration is symmetricalin case(c)). For all ~ c 0 i I
~ are:silane,0.1 Torr, 13.56MHz, r.f. voltage ~ ~ . vi
electrodesdoesnot play anyrole andthat the discharge 20C -200
is sustainedmainly by the sheathoscillations[16, 19]. 0 0.25 0~S 1175 1 0 0.25 ~5 0.75 1
Figure 3 showsthe spatialdistributionof theelectrons, (c)
positive and negativeions and electric field on the ISO
dischargeaxis at four different timesof an r.f. cycle for 0 _____________
case(a). The chargedparticle profile is not symmetricalowing to the asymmetryof the electrodeconfiguration.Note that the ion density in the plasmais much higher ~~oo0025 05 075
than the electron density. This is due to the fact thatnegativeions are trapped in an r.f. discharge(their Fig. 4. Time variations of the r.f. voltageand dischargevoltage for
mobility being much smallerthan that of electrons,they theconditionsof Fig. 2.
2 0.5 2 0.5
0.t-OT 1..I E
4 0
~ 0r~ne,05~0 Position(cm) 3.6 0 Position(cm) 3.6
2 —________ 0.5 2 __________________________________-0.5o0 I_2
ft \E \E
0 ~ 5 0 05Position(cm) Position (cm)
Fig. 3. Spatialdistributions of electron,positive and negative ion densitiesand electric field on thedischargeaxis at four different times of ther.f. cyclein thegeometryof Fig. 2, case(a).
J. P. Boeufet a!. / Dischargeandnon-thermalplasmamodelling 35
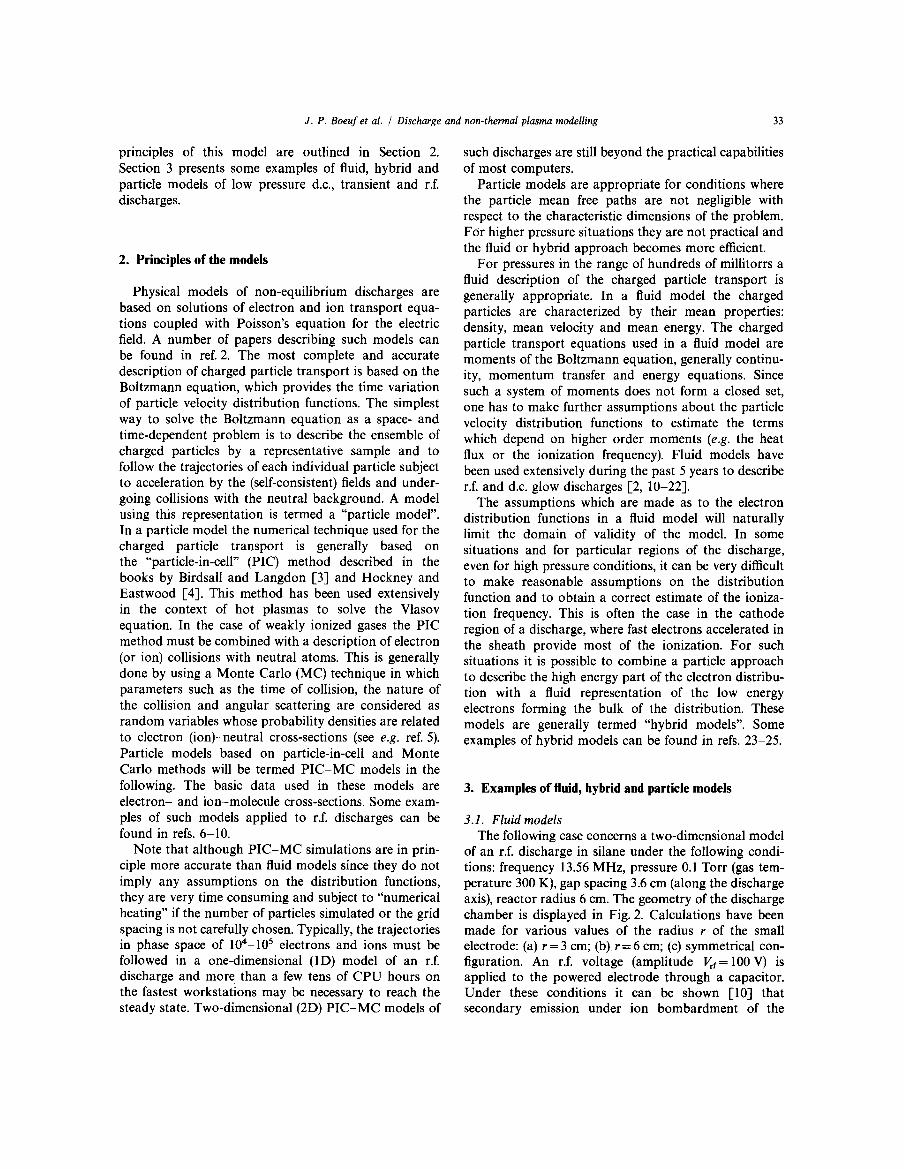
the dischargevoltage for the threedifferent electrode 3.2. Hybridfluid—particlemodelsconfigurations(asexpected,no d.c. bias appearsfor the In the 2D fluid model of an r.f. dischargedescribedsymmetricalconfigurationof electrodes).Figure 5 dis- above some assumptionswere made concerning theplays the spatial distribution of the potential at four ionization rateandthereforethe electronvelocity distri-different times of an r.f. cycle for case(a) and shows bution function. The ionization coefficient at a givenclearly the asymmetricsheathconfiguration. location in spaceandtime wassupposedto dependonly
The (2D) spaceand time variations of the electron on E/n (E is the electricfield, n the gas density) at thatdensityoverone cycle are shownin Fig. 6. The shapeof location. This assumptionis not valid whensecondarythe electrondensity in the sheathregion is typical of electronsemitted by the cathodeunder ion bombard-electronegativegases. During the anodic part of the ment and acceleratedin the sheathare the dominantcycle for oneelectrode,the electrondensityin the sheath discharge-sustainingmechanism,as in a d.c. glow dis-regionin front of this electrodemustbecomelargerthan charge[10, 16]. In thatcasea bettersolution would bethe electrondensityin the plasmain order to neutralize to usea hybrid model in which ionization phenomenathe positive ion spacecharge (the ion density in the in the sheathcan berepresentedmuch moreaccurately.sheathis larger than theelectrondensityin the plasma). In this approach[23—25]a fluid model is used toThe neutralizationof the ion spacechargeat that time describethe low energyplasmaelectronsand the ions,of the cycle is necessaryto decreasethe potentialbarrier while a particlemethodis usedto representthe transportin front of the electrodeandto allow a flow of electrons propertiesof the high energyelectronswhich are createdto the temporary anode. This specific feature of the by ion bombardmenton the cathode,acceleratedin theelectrondensity in electronegativegaseshas also been sheathandreleasetheir energy in the negativeglow. Inobservedin one-dimensionalmodels[15, 16, 18] andin this waythe ionization rateis calculatedveryaccurately,experiments[15, 27], where the increasein the electron since no assumptionhas to be madeabout the tail ofdensity in front of the electrodeduring the anodicpart the distributionfunction.of the cycle for that electrodeis accompaniedby an This hybrid method has been used in the exampleincreasein the light emission (which is not seen in below to model a two-dimensionald.c. discharge inelectropositivegases). 1 Torr of argonin the rod—rodgeometryof Fig. 7. The
A discussionof the comparisonbetweenthe model secondary emission coefficient of the cathode wasresults(for ID fluid and PIC—MC models)and experi- assumedto be 0.07. The walls of the chamber arementsis presentedin ref. 10. assumedto be perfect dielectrics. An external circuit
t=OT 0 t=T/4
0)
~6~~20}00 __
0 X(cm) 3.6 0 X(cm) 3.6
~ 6L0 X(cm) 3.6 0 X(cm) 3.6
Fig. 5. Contoursof constantpotentialat four different timesof anr.f. cycle (conditionsof Fig. 2, case(a)).

36 J. P. Boeufet al. / Dischargeand non-thermalplasmamodelling
Fig. 6. Spatial variationsof theelectrondensityin the dischargeat six different times of anr.f. cycle (conditionsof Fig. 2, case(a)).
1 ~ (a) (b)dielectric ____________________ __________________________
__________ Ic~de~~~e _______
0 X(cm) 2 0 X(cm) 2
Fig. 8. Contours of (a) constantpotential and (b) constantelectron—1 density (unit: 1.2 x loin cm
3) for a 1 Torr dischargein argon in the0 2 geometry of Fig. 7 for current (0.58 isA) and voltage (142.4V) corre-
X (cm) . spondingto a normal glow discharge.The potential incrementfrom
Fig. 7. Electrode geometry usedin the 2D hybrid model of a d.c. oneequipotentialcontourto thenext is 15 V (from thecathode)exceptdischargein argon. for thecontour whosevalueis indicatedin (a).
consistingof a generatorin serieswith a resistoris used thereare two field reversalson the dischargeaxis.Notein the calculationsin orderto obtainthecurrent—voltage the relativemaximumin the electrondensityin theformcharacteristicsof the discharge.The spatialvariationsof of a ring in front of the cathode(Fig. 8(b)). When thethe potential and electrondensity in the dischargeare current is increased(by decreasingthe resistor in theshown in Figs. 8(a) and 8(b) respectively for a case external circuit), the sheathlength decreasesand thecorrespondingto a normal glow discharge(minimum electron density in the plasma increasesas shown incurrent in the current vs. voltage characteristiccurve). Fig.9, wherethe spatial variationsof the potentialandThe sheathregion in front of the cathode and the electrondensityare displayed.Figure 9 correspondstonegativeglow plasmaappearclearly in Fig. 8(a). The a slightly abnormalglow dischargeas shown by theshapeof the 137.2V equipotentialcontour shows that current vs. voltagecharacteristiccurve of Fig. 10.

J. P. Boeufet al. / Dischargeand non-thermalplasmamodelling 37
(a) (b) 250 I 1111111 I I I
E~ ~h~e anode I I
-1.5 _________________________ 15 to-4 ioo
U X(cm) 2 0 X(cm) 2 —a jo_aCURRENT (A)
Ftg. 9. Contours of (a) constantpotenttal and (b) constantelectrondensity (unit: 9.4 x 1010cm3) for a 1 Torr dischargein argon in the Fig. 10. Voltage vs. currentcharacteristiccurvefor a 1 Torr dischargegeometry of Fig. 7 for current (3.7 IsA) and voltage (163.3V) corre- in argon in the geometry of Fig. 7. (1) and (2) correspondto thespondingto a slightly abnormalregime.The potentialincrementfrom regimesof Figs. 8 and 9 respectively.oneequipotentialcontourto thenextis 15 V (from thecathode)exceptfor thecontourwhosevalueis indicated in (a). (pseudosparkdischarge [28]). More details on these
calculationscanbe foundin ref. 23. In a hollow cathodeThis hybrid model canalso be used to describemore geometry,electronsemittedby the cathodeare confined
complicatedgeometriessuch as the one corresponding in thecathodecavity andcanoscillatebetweenpartsofto Fig. 11. This figure shows the temporalevolution of the cathodesheathfacing each other. This “pendulumthe spatial distribution of the potential in a transient effect” is responsiblefor the higher ionization ratesandhollow cathodedischargeusedfor switchingapplications efficiency of thesedischarges.It is thereforeextremely
Position(cm) Position(cm)0 1 1.5 0 1 1.5
1 (a) 1 (b)
0 6ns~. 1~~~flSI
cathode - cathode [ \\\\\\anode anode
-1 - . -1 .1.
cqthode0_~i qtiocje c’othode ~tu)J n~ ns
Fig. 11. Time evolution of the contoursof constantpotential in a transientpseudosparkdischarge(helium, 0.5Torr, anodevoltage2 kV). Thedots correspondto thepositionsof the ionization eventsfrom the particlemodel of high energyelectrons.See ref. 23 for furtherdetails.

38 J. P. Boeufet al. / Dischargeand non-thermalplasmamodelling
(a) unit~=1.3 1016crn~s~ (a) unit=5.010 15 cm3s4
o ~O 0 0 - __________________ .~.:
0.5 ~0.5 - ‘ , ~ 0.5
1 .-. 1 ~ I0 Position(cm) 3 0 Position(cm)
(b)5.1015
2.l0l5’~
Fig. 12. (a) Ionizationrateas a functionof spaceand time duringone 0 1 2 3r.f. cycle for a dischargein helium (3 Torr, gaplength 3 cm, 9.2 MHz, Positton(cm)appliedvoltage amplitude 300 V, secondaryelectron emissioncoeffi-cient y = 0.2) from a PIC—MC simulation. The lines correspondto Fig. 13. (a) Ionizationrateasa functionof spaceand time duringonecontoursof constantelectric field (V cm 1) for thesameconditions. r.f. cyclefor thesameconditionsasin Fig. 12, but without secondary(b) Time-averagedionization rate for thesameconditionsas(a). electron emission (y =0), from a PIC—MC simulatton. The lines
correspondto contoursof constantelectricfield (V cm— 1) for thesameconditions.(b) Time-averagedionization rate for the sameconditions
important to describethis ionization mechanismaccu- as(a).
rately in a model of hollow cathodedischarges.Thehybrid modelis perfectlysuitedto such situations,since applied voltage amplitude I’~= 300 V (the left electrodeno approximationis madeaboutthe velocity distribution is groundedand the voltage on the right electrodeisof the electronsresponsiblefor ionization in the cavity. V(t) = J’~cos(cot)).Although the gaspressure(3 Torr) in
thesecalculationsis within the validity domain of the3.3. Particle models fluid models,the use of PIC—MC simulationsfor these
Sincethe validity of the fluid model canbe question- casesis interestingbecause(1) it provides the “exact”ableat low pressure,we havedevelopedmoreaccurate shapeof the electrondistribution function (EDF) andmodelsbasedon a particle description of the charged (2) it allows direct comparisonswith the fluid models.particle transport. Thesemodels use a combinationof In Fig. 12(a) the ionization rateis shownasa functionthe “particle-in-cell” and “Monte Carlo” (PIC—MC) of time and space for case (a). Contoursof constantmethodsas describedabove, electric field as a function of spaceand time, showing
We shall illustrate thesemodelswith a lD simulation the sheathexpansionand contractionduring one r.f.of an r.f. dischargein helium (more details about the cycle, are also displayed in this figure. Note that themodelsand resultscan be found in ref. 29). Two cases shapeof the ionization ratein front of eachelectrodeishave been consideredin order to study the effect of relatively symmetricalwith respectto sheathexpansionsecondaryelectronemissionin an r.f. discharge:in case or contraction.On the otherhand,the regionsof high(a) a secondaryelectronemissioncoefficient y = 0.2 is ionization extendfar beyondtheplasmasheathbound-assumed,while y is takenas zero in case(b). All other ary as indicatedapproximatelyby the contourscorre-dischargeparametersare the samein cases(a) and (b), sponding to the lowest field values. Under thesei.e. pressure3 Torr, gaplength 3 cm,frequency9.2MHz, conditions the plasmais very similar to the negative

J. P. Boeufef a!. / Dischargeandnon-thermalplasmamodelling 39
(a) (b) glow of a d.c. discharge.The glow canbe consideredas
a plasma sustainedby an external sourceof electrons(electronsacceleratedin the sheaths).The time-averaged
Id2
10a .~ ionization rate is shown in Fig. 12(b) as a function of
0 ~ — ‘~!~WI distancebetween the two electrodes Little ionization~h~l I ~ 2 occursin the dischargecentrewherethe electronmean
F ~ energy is very smallI — 10 It is well known that the emissionof electronsfrom
— .~ the electrodeand the subsequentaccelerationof these0.5 . — . II? \ 3 electronsthrough a high field sheathare not necessary
— for r.f. dischargeoperation.This is due in part to the_____ >~ t? fact that the rapid variation in the electncfield limits
the loss of electronson the electrodesand in part toI ~ io° anothermechanismof electron heatingwhich appears
200 100 0 100 200 for driving frequenciesof theorder of 1 MHz andhigher.Energy(eV) 10 For thesehigh frequenciesthe sheathexpansioncan
Backward Forward 0 100 200 provideenergyto the plasmaelectrons.This hasbeenEnergy(cv) called the “~ regime”, “wave riding” or “ohmic sheath
heating”.The ionization sourceterm for case(b), whereFig. 14. (a) Electron energydistribution function integratedbetween . . .
the abscissa0.12 and 0.15 cm from the left electrodeas a function of the secondaryemissioncoefficient is zero, is shown inenergy and time during one r.f. cycle for the conditionsof Fig. 12; Fig. 13. The behaviourof the ionization rate is quitepartsof the distribution correspondingto electronswhosevelocity is different from the case above where the dischargeisdirectedforwards (towardstheplasmacentre)or backwards(towards sustainedby the ionization producedfrom the cathode-the electrode)are representedseparately.(b) Electron distribution emitted electrons.We note that in contrast with thefunction of (a) displayedat the four different times tndtcatedby the . .
numbers(the contributions of forward and backward electronsare previouscase,ionization occursonly during the sheathadded).Theunitsarethe samefor all curves, expansion,showingthat electronsin the vicinity of the
plasmasheathboundaryareheatedby the sheathexpan-sions. Excellent agreementhas beenobtained betweenresultsof various modelsandexperiments(seee.g. refs.16, 19 and30).
The PIC—MC modelalso providesthe spaceandtime
(a) (b) variationsof the chargedparticle velocity distributionfunction. It is very instructive to look at thesedistribu-
-6 -4 -2 5 tion functions in cases(a) and (b). Figure 14(a) shows~ 10 10 ~ to4 the EDF in the “y regime” as a function of time and
r ~ . energyin the forward and backwarddirectionsfor the
I
— ~ 2 same conditions as in Fig 12 and centred about a~ position 0.13cm from the left electrode.Theseresultst~ io~ are the integral over a small distance from 0.12 to
— .~ 0.15 cm from the left electrode.It is clearfrom this figure0.5 r~ io° that the tail of the EDFis strongly modulatedwith the
— ~ applied voltage.The tail of the EDF at any particular10 timeextendsup to the maximumenergyavailablein the
electricfield configurationat that point andtime.
— 10 To quantify the behaviourdescribedabove,the same200 tOO 0 100 200 ~ \ electron energy distribution function is displayed in
Energy(eV) ~° Fig. 14(b)asa function of energyat four different timesBackward Forward 0 100 200 during ther.f. cycle (the forwardandbackwardcontribu-
Energy(eV) tions are addedin Fig. 14(b) andamaxwelliandistribu-
Fig. 15. (a) Electron energydistribution function integratedaround tion would appear as a straight line in thisthe abscissa0.25cm from the left electrodeas a function of energy representation).and time during one r.f. cycle for the conditions of Fig. 13; forward For comparisonthe EDFs correspondingto case(b)and backwardelectronsarerepresentedseparately.(b) Electrondistri-bution function of (a) displayedat the four different times indicated (no secondaryelectronsemitted from the cathode)areby thenumbers(the contributionsof forward and backwardelectrons shownin Fig. 15 at a point which is abouttwo-thirds ofare added).The unitsare thesamefor all curves, the distancefrom the electrodeto the maximum sheath

40 J. P. Boeufet a!. / Dischargeand non-thermalplasmamodelling
thickness(0.25cm). The scalesare the sameas in Fig. 14 4 R. W. Hockneyand J. W. Eastwood,ComputerSimulation Using
and even at first glance the EDFs are remarkably Particles, McGraw-Hill, New York, 1981.5 J. P. Boeufand E. Marode,J. Phys.D: App!. Phys.15 (1982)2169.different from the case where secondaryelectronsare 6 R. W. Boswell andI. J. Morey, App!. Phys.Left., 52 (1988) 21.
present.The maximumelectronenergyis muchless than 7 M. Surrendraand D. B. Graves,IEEE Trans. Plasma Sci., PS-19in the ‘y regime,becausein the c~regime the wave-riding (1991) 144.
electrons which are pushedby the sheathexpansion 8 C. K. Birdsall, IEEE Trans. PlasmaSci., PS-19(1991) 65.
never“see” thewholecathodesheathvoltage,incontrast 9 A. Date,K. Kitamori and T. Tagashira,in M. Capitelli andJ. N.Bardsley (eds.), NATO ASI Series, Vol. 220b, Non-equilibrium
with the cathode-emittedelectrons in the ‘y regime. At Processesin Partially Ionized Gases,Plenum, New York, 1990,
the beginning of the sheathcontraction(at t/T= 0 the p433sheathcontractionbegins at the position of the EDFs 10 J. P. Boeufand Ph. Belenguer,J. App!. Phys.,71 (1992)4751.
in the figure) thereare essentiallyno electronspresent 11 D. B. Gravesand K. F. Jensen,IEEE Trans. Plasma Sci., PS-14
in thesheathregion. As the sheathlength decreases,the (1986) 78.12 D. B. Graves,J. App!. Phys.,62 (1987) 88.
plasmadiffuses towardsthe electrode,bringing with it 13 J. P. Boeuf, Phys.Rev.A, 36 (1987)2782.low energy electronswhose energy reflects the field in 14 M. S. Barnes, T. J. Cotler and M. E. Elta, J. AppI. Phys., 61
the plasma.Themodulationin the plasmafield accounts (1987) 81.
for the modulation of the EDF during the first half- 15 E. Gogolides,J. P. Nicolai andH. H. Sawin,J. Vac. Sci. Technol.cycle shownin the figure. During the secondhalf-cycle A, 7 (1989) 1001.
16 J. P. Boeufand Ph. Belenguer,in M. Capitelli and J. N. Bardsleythe sheathbegins to grow in the sampleregionandthe (eds.), NATO ASI Series,Vol. 220b, Non-equilibrium Processesin
electronsare carriedback into the plasmaby the front Partially IonizedGases,Plenum,New York, 1990, p. 155.
of the advancingsheathfield, gaining a small energy 17 T. Makabe, F. Tochikuboand M. Nishimura,Phys. Rev. A, 42
which is neverthelesssufficientto maintainthedischarge. (1990) 3674.
Thus no highenergytail appearsin the EDF, butrather 18 M. Meyyapanand T. R. Govindan,IEEE Trans. PlasmaSci., PS-19 (1991) 122.
the bodyof the distributionswells asthe sheathexpands. 19 Ph. BelenguerandJ. P. Boeuf, Phys.Rev.A, 41 (1990)4447.
This is seenmoreclearly in Fig. 15(b). 20 A. P. Paranjpe,J. P. McVittie and S. A. Self, Phys. Rev. A, 41(1990)6949.
21 F. Tochikubo,A. Suzuki, S. Kakuta,Y. Terazonoand T. Makabe,4. Conclusions J. App!. Phys.,68 (1990) 5532.
22 W. J. Goedheerand P. M. Meijer, IEEE Trans. Plasma Sci., PS-19 (i991) 245.
The examplesof one-andtwo-dimensionalmodelsof 23 L. C. Pitchford and J. P. Boeuf, in L. G. Christophorouandd.c., r.f. and transientdischargespresentedin this paper I. Sauers(eds.),GaseousDielectrics VI, Plenum,New York, 1990,
show that capabilitiesin dischargemodellinghavecon- p. 109.J. P. Boeufand L. C. Pitchford, IEEE Trans. PlasmaSci., PS-19
siderablyincreasedin recentyearsandthat we are very (1991)286.close to being able to apply these models to practical 24 A. Fiala, L. C. Pitchford, J. P. Boeufand I. Pérés,in L. Tsendin
situationsof plasmaprocessing. (ed),Proc. 11th ESCAMPIG,EuropeanPhysical Society, Geneva,1992, p. 322.
25 I. Pérés,N. Ouadoudi,L. C. Pitchford and J. P. Boeuf, J. App!.References Phys.,72 (1992)4533.
26 B. Chapman,G!ow DischargeProcesses,Wiley, New York, 1980.27 D. L. FlammandV. M. Donnelly, J. App!. Phys.,59 (1986) 1052.
I L. E. Kline and M. J. Kushner,Crit. Rev.Solid StateMater. Sci., 28 M. A. GundersenandG. Schaefer(eds.),NATOASISeries,Vol. 219,16 (1) (1989) 1. Physicsand App!icationsof Pseudosparks,Plenum,New York, 1990.
2 M. J. Kushnerand D. B. Graves(eds.),Special issueon modeling 29 L. C. Pitchford, Ph. BelenguerandJ. P. Boeuf, in C. M. Fereiracollisional low temperatureplasmas,IEEE Trans. PlasmaSci.,PS- and M. Moisan (eds.),NATOARWSeries,MicrowaveDischarges:
19(2) (1991). Fundamentalsand Applications,Plenum,New York, 1993.3 C. K. Birdsall and A. B. Langdon,Plasma Physicsvia Computer 30 C. Bbhm and J. Perrin, Le Vide, leo CouchesMinces, Suppl., 256
Simulation, McGraw-Hill, New York, 1985. (1991) 286.
Copyright © 2022 FDOKUMEN