effects of coal-mine discharges on the quality of the ...
101
EFFECTS OF COAL-MINE DISCHARGES ON THE QUALITY OF THE STONYCREEK RIVER AND ITS TRIBUTARIES, SOMERSET AND CAMBRIA COUNTIES, PENNSYLVANIA by Donald R. Williams, James I. Sams III, and Mary E. Mulkerrin U.S. GEOLOGICAL SURVEY Water-Resources Investigations Report 96-4133 prepared in cooperation with the SOMERSET CONSERVATION DISTRICT Lemoyne, Pennsylvania 1996
-
Upload
khangminh22 -
Category
Documents
-
view
1 -
download
0
Transcript of effects of coal-mine discharges on the quality of the ...

EFFECTS OF COAL-MINE DISCHARGES ON THE QUALITYOF THE STONYCREEK RIVER AND ITS TRIBUTARIES,
SOMERSET AND CAMBRIA COUNTIES, PENNSYLVANIA
by Donald R. Williams, James I. Sams III, and Mary E. Mulkerrin
U.S. GEOLOGICAL SURVEY Water-Resources Investigations Report 96-4133
prepared in cooperation with the
SOMERSET CONSERVATION DISTRICT
Lemoyne, Pennsylvania 1996
U.S. DEPARTMENT OF THE INTERIOR
BRUCE BABBITT, Secretary
U.S. GEOLOGICAL SURVEY
Gordon P. Eaton, Director
For additional information write to:
District ChiefU.S. Geological Survey840 Market StreetLemoyne, Pennsylvania 17043-1586
Copies of this report may be purchased from:
U.S. Geological Survey Branch of Information Services Box 25286 Denver, Colorado 80225-0286

CONTENTS
Page
Abstract.................................................................................... 1
Introduction................................................................................ 2
Purpose and scope..................................................................... 2Description of study area ............................................................... 3Methods of study...................................................................... 7Previous investigations................................................................. 8Acknowledgments..................................................................... 9
Coal-mine discharges....................................................................... 10
Locations............................................................................ 10Water quality and contaminant discharges............................................... 12Remediation-prioritization index ....................................................... 18Remediation by passive-treatment systems .............................................. 31
Surface-water-quality sampling sites.......................................................... 33
Locations............................................................................ 33Water quality and contaminant discharges............................................... 36
Effects of coal-mine discharge on the quality of Stonycreek River and its tributaries ................. 41
Summary ................................................................................. 48
References cited............................................................................ 50
Appendix 1. Geographic information system (GIS) datasets ................................... 542. Location coordinates and station numbers for sampled mine discharges in the
Stonycreek River Basin.................................................... 563. Field data and laboratory analyses of mine discharges ............................ 624. Prioritization index (PI) for all mine discharges................................... 785. Field data and laboratory analyses for surface-water sites.......................... 88
ILLUSTRATIONS
Page
Figure 1. Map showing the location of the Stonycreek River Basin............................ 4
2. A generalized stratigraphic column of the geologic formations in the StonycreekRiver Basin............................................................... 5
3. Geologic map of the Stonycreek River Basin ...................................... 6
4. Map showing locations of coal-mine-discharge sites in the Stonycreek River Basin .... 11
5. Graph showing coal-mine discharges that exceeded federal effluent limits for pH and concentrations of total iron and total manganese, and arbitrary indicator limits for sulfate and net acidity concentrations............................... 13
6-11. Maps showing:6. Location of the coal-mine-discharge sites in the Shade Creek Basin ............ 25
7. Location of the coal-mine-discharge sites in the Paint Creek Basin ............. 26
8. Location of the coal-mine-discharge sites in the Wells Creek Basin............. 27
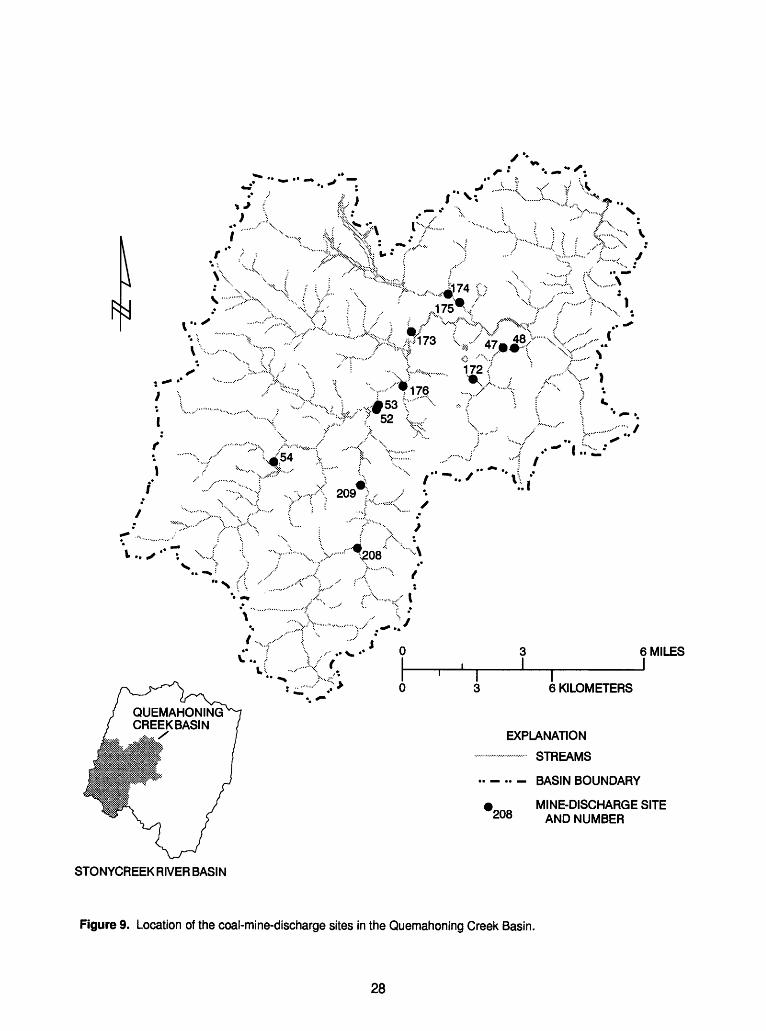
9. Location of the coal-mine-discharge sites in the Quernahoning Creek Basin..... 28
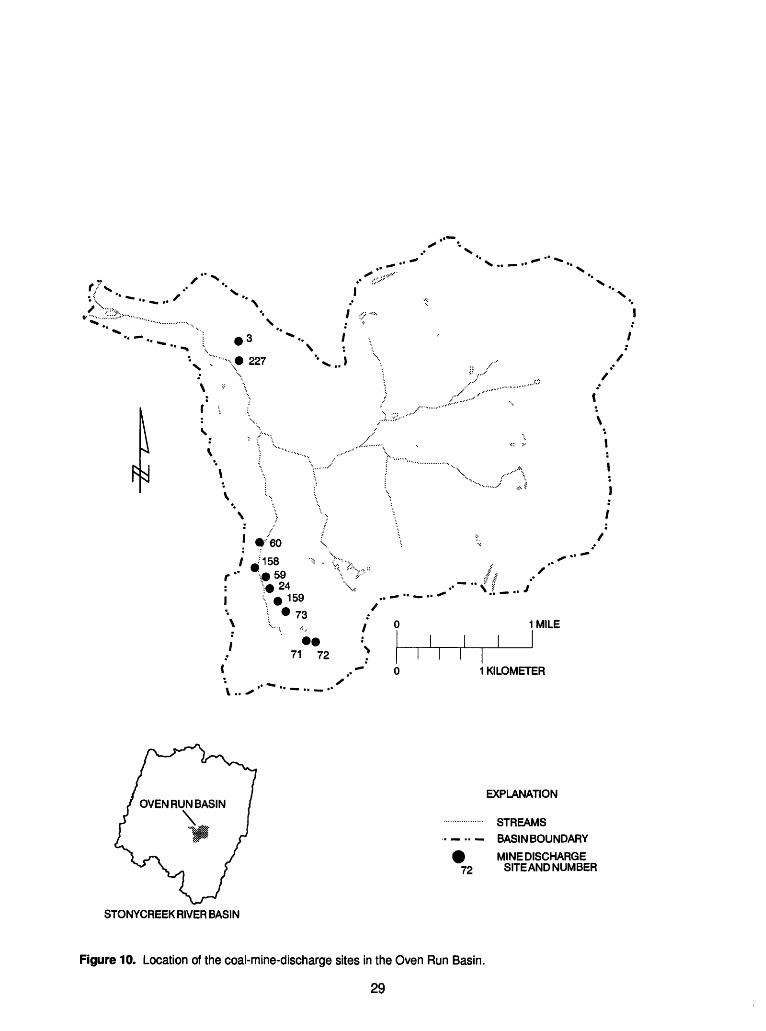
10. Location of the coal-mine-discharge sites in the Oven Run Basin .............. 29
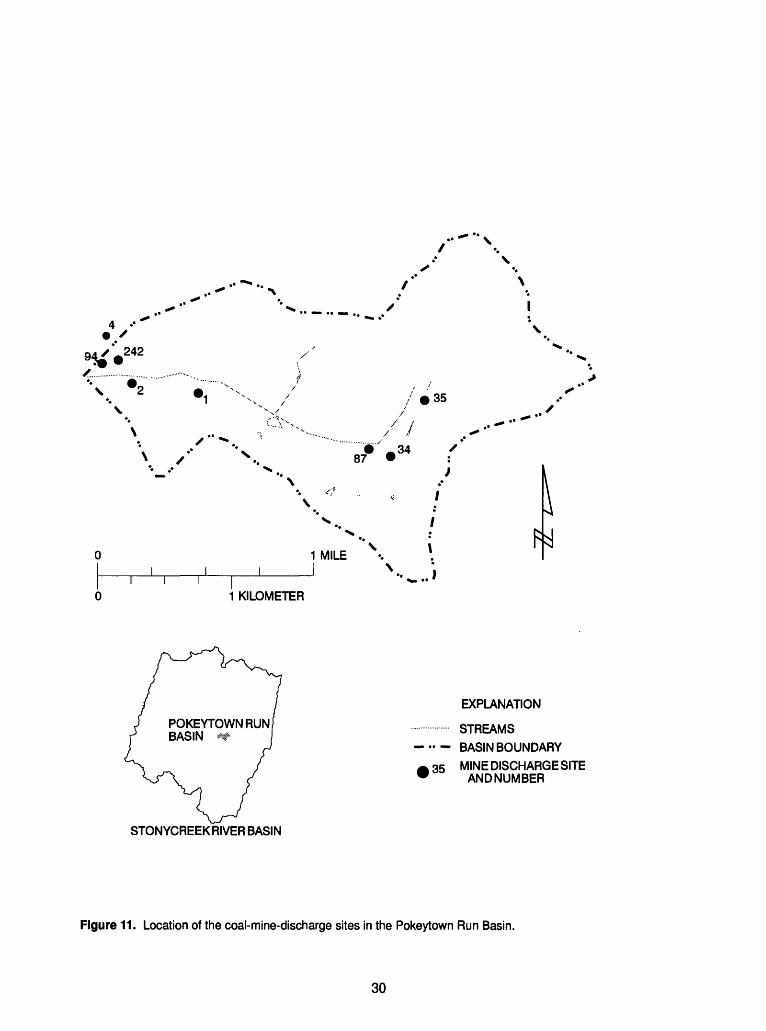
11. Location of the coal-mine-discharge sites in the Pokeytown Run Basin ......... 30
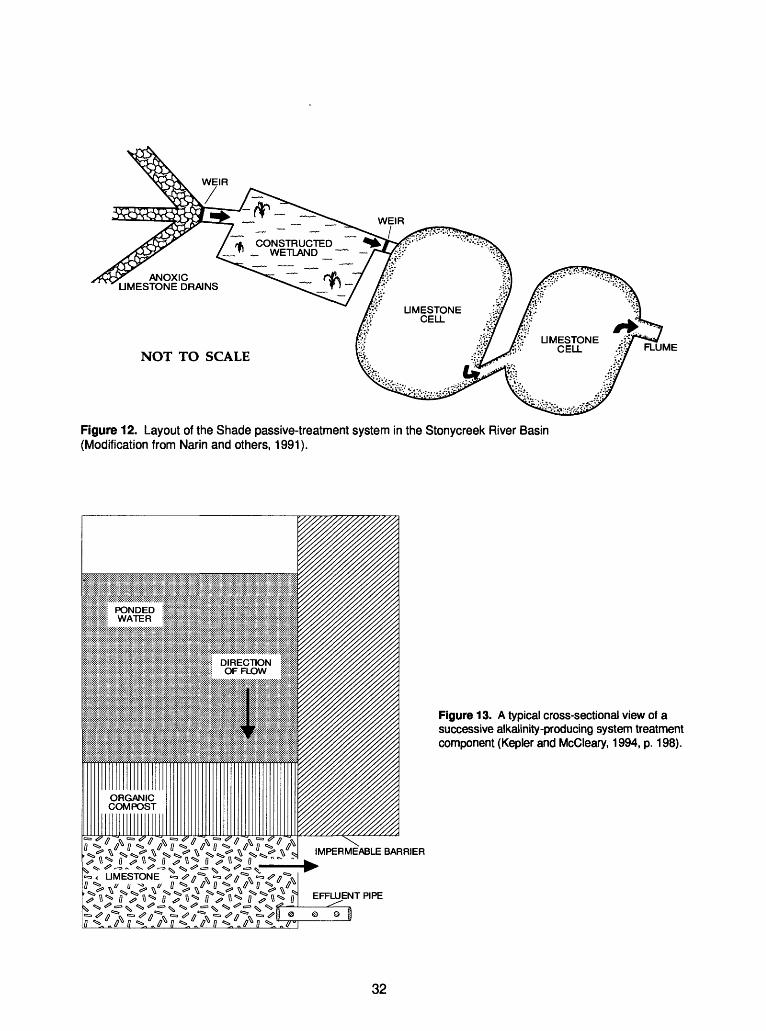
12. Diagram showing the layout of the Shade passive-treatment system in theStonycreek River Basin.................................................... 32
13. Diagram showing a typical cross-sectional view of a successive alkalinity-producingsystem treatment component .............................................. 32
14. Map showing surface-water-quality sampling sites in the Stonycreek River Basin..... 35
Figures 15-21. Graphs showing:15. Specific conductance, pH, and concentrations and discharges of dissolved solids
measured in the mainstem and in tributary streams in the Stonycreek River Basin on July 27 and 28,1993...................................... 37
16. Concentrations and discharges of alkalinity and acidity measured in the mainstem and in tributary streams in the Stonycreek River Basin on July 27 and 28,1993 ................................................... 38
17. Concentrations and discharges of total iron and total manganese measured in the mainstem and in tributary streams in the Stonycreek River Basin on July 27 and 28,1993 ................................................... 39
18. Concentrations and discharges of total sulfate measured in the mainstem andin tributary streams in the Stonycreek River Basin on July 27 and 28,1993.... 40
19. Measured total sulfate discharges in tributary streams and measured and cal culated total sulfate discharges in the mainstem of the Stonycreek River on July 27 and 28,1993 ................................................ 42
20. The effects of mine discharges 17 and 22 on Wells Creek on September 9,1993 .. 45
21. The effects of Oven Run and Pokeytown Run on the Stonycreek River onSeptember 8,1993..................................................... 47
IV
TABLES
Page
Table 1. Federal effluent limitations for coal-mine drainage................................ 10
2. Water-quality and quantity changes that occurred downstream of mine-dischargesites 17 and 22 on May 12,1994............................................. 14
3. Mine discharges that met federal effluent standards for pH and concentrations oftotal iron and total manganese ............................................. 15
4. Flows, concentrations of total iron and acidity, and iron and acidity discharges anddischarge rank for mine discharge sites in the Stonycreek River Basin ........... 17
5. Unsorted total-iron data and sorted, ranked, and scored total-iron data used for thePrioritization Index (PI) calculations ........................................ 19
6. Prioritization index (PI) for coal-mine discharges in the Shade Creek Basin........... 21
7. Prioritization index (PI) for coal-mine discharges in the Paint Creek Basin ........... 22
8. Prioritization index (PI) for coal-mine discharges in the Wells Creek Basin ........... 23
9. Prioritization index (PI) for coal-mine discharges in the Quemahoning Creek Basin ... 23
10. Prioritization index (PI) for coal-mine discharges in the Oven Run Basin............. 24
11. Prioritization index (PI) for coal-mine discharges in the Pokeytown Run Basin ....... 24
12. Surface-water-quality sampling sites in the Stonycreek River Basin ................. 34
13. Water-quality data for five coal-mine discharges and the receiving streams .......... 43
14. Water-quality data collected on September 8,1993, for Oven Run, Pokeytown Run, and the Stonycreek River above and below where each of the runs flows into the river................................................................. 44
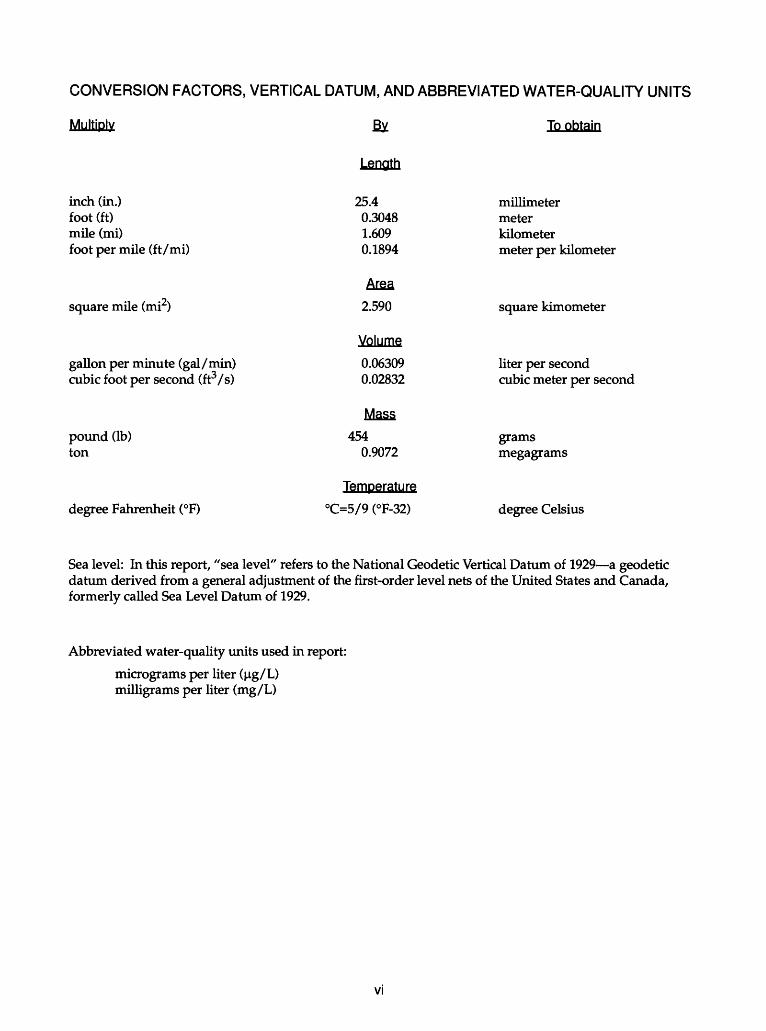
CONVERSION FACTORS, VERTICAL DATUM, AND ABBREVIATED WATER-QUALITY UNITS
Multiply By To obtain
Length
inch (in.) 25.4 millimeterfoot (ft) 0.3048 metermile (mi) 1.609 kilometerfoot per mile (ft/mi) 0.1894 meter per kilometer
Area
square mile (mi2) 2.590 square kimometer
Volume
gallon per minute (gal/min) 0.06309 liter per second cubic foot per second (ft3/s) 0.02832 cubic meter per second
Mass
pound (Ib) 454 grams ton 0.9072 megagrams
Temperature
degree Fahrenheit (°F) °C=5/9 (°F-32) degree Celsius
Sea level: In this report, "sea level" refers to the National Geodetic Vertical Datum of 1929 a geodetic datum derived from a general adjustment of the first-order level nets of the United States and Canada, formerly called Sea Level Datum of 1929.
Abbreviated water-quality units used in report:
micrograms per liter (ug/L) milligrams per liter (mg/L)
VI
EFFECTS OF COAL-MINE DISCHARGES ON THE QUALITYOF THE STONYCREEK RIVER AND ITS TRIBUTARIES,
SOMERSET AND CAMBRIA COUNTIES, PENNSYLVANIA
By Donald R. Williams, James I. Sams III, and Mary E. Mulkerrin
ABSTRACT
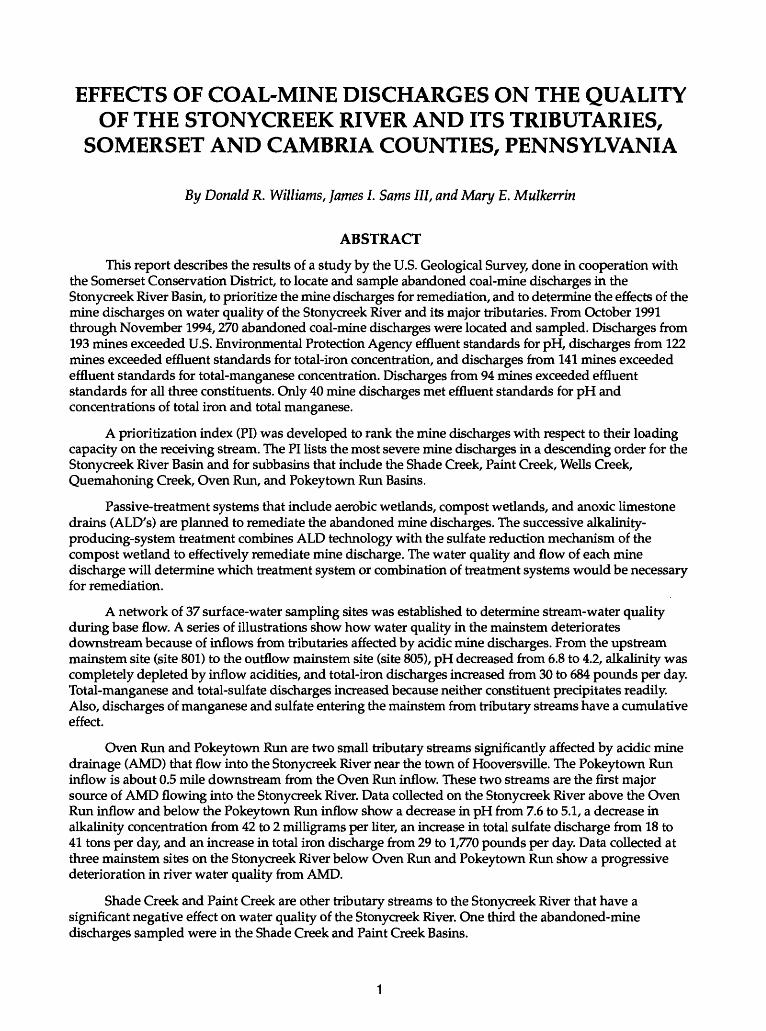
This report describes the results of a study by the U.S. Geological Survey, done in cooperation with the Somerset Conservation District, to locate and sample abandoned coal-mine discharges in the Stonycreek River Basin, to prioritize the mine discharges for remediation, and to determine the effects of the mine discharges on water quality of the Stonycreek River and its major tributaries. From October 1991 through November 1994,270 abandoned coal-mine discharges were located and sampled. Discharges from 193 mines exceeded U.S. Environmental Protection Agency effluent standards for pH, discharges from 122 mines exceeded effluent standards for total-iron concentration, and discharges from 141 mines exceeded effluent standards for total-manganese concentration. Discharges from 94 mines exceeded effluent standards for all three constituents. Only 40 mine discharges met effluent standards for pH and concentrations of total iron and total manganese.
A prioritization index (PI) was developed to rank the mine discharges with respect to their loading capacity on the receiving stream. The PI lists the most severe mine discharges in a descending order for the Stonycreek River Basin and for subbasins that include the Shade Creek, Paint Creek, Wells Creek, Quemahoning Creek, Oven Run, and Pokeytown Run Basins.
Passive-treatment systems that include aerobic wetlands, compost wetlands, and anoxic limestone drains (ALD's) are planned to remediate the abandoned mine discharges. The successive alkalinity- producing-system treatment combines ALD technology with the sulfate reduction mechanism of the compost wetland to effectively remediate mine discharge. The water quality and flow of each mine discharge will determine which treatment system or combination of treatment systems would be necessary for remediation.
A network of 37 surface-water sampling sites was established to determine stream-water quality during base flow. A series of illustrations show how water quality in the mainstem deteriorates downstream because of inflows from tributaries affected by acidic mine discharges. From the upstream mainstem site (site 801) to the outflow mainstem site (site 805), pH decreased from 6.8 to 4.2, alkalinity was completely depleted by inflow acidities, and total-iron discharges increased from 30 to 684 pounds per day. Total-manganese and total-sulfate discharges increased because neither constituent precipitates readily. Also, discharges of manganese and sulfate entering the mainstem from tributary streams have a cumulative effect.
Oven Run and Pokeytown Run are two small tributary streams significantly affected by acidic mine drainage (AMD) that flow into the Stonycreek River near the town of Hooversville. The Pokeytown Run inflow is about 0.5 mile downstream from the Oven Run inflow. These two streams are the first major source of AMD flowing into the Stonycreek River. Data collected on the Stonycreek River above the Oven Run inflow and below the Pokeytown Run inflow show a decrease in pH from 7.6 to 5.1, a decrease in alkalinity concentration from 42 to 2 milligrams per liter, an increase in total sulfate discharge from 18 to 41 tons per day, and an increase in total iron discharge from 29 to 1,770 pounds per day. Data collected at three mainstem sites on the Stonycreek River below Oven Run and Pokeytown Run show a progressive deterioration in river water quality from AMD.
Shade Creek and Paint Creek are other tributary streams to the Stonycreek River that have a significant negative effect on water quality of the Stonycreek River. One third the abandoned-mine discharges sampled were in the Shade Creek and Paint Creek Basins.
INTRODUCTION
Coal is Pennsylvania's most important mineral resource. In 1993, coal production in Pennsylvania was more than 63 million tons and Somerset and Cambria Counties ranked second (5.6 million tons) and fifth (4.6 million tons), respectively in the state for total coal produced (Pennsylvania Coal Association, 1994). Much of the Stonycreek River Basin, which is primarily in Somerset County and part in Cambria County, is underlain by low-volatile bituminous coal deposits that are an important economic mineral resource. With the onset of the Industrial Revolution in the late 1800's, extensive commercial mining of these coal resources began with almost no concern for the protection of the land surface and water resources. Consequently, the water quality in the Stonycreek River and its tributaries has been severely degraded for many decades by acid mine drainage (AMD) from abandoned coal mines and coal-refuse piles. The AMD problem has been recognized as one of the most serious and persistent water-quality problems not only in Pennsylvania, but in all of Appalachia, extending from New York to Alabama (Biesecker and George, 1966). Thousands of stream and river miles in Appalachia are currently affected by the input of mine drainage from sites mined and abandoned before strict effluent regulations were implemented (Kleinmann and others, 1988).
Part of the Stonycreek River Basin received an AMD evaluation in the early 1970's in the Operation Scarlift studies (Carson Engineers, 1974). The evaluation indicated the cleanup cost (based on conventional treatment technologies) in that part of the basin would amount to several hundred million dollars, and annual operating costs also would be in the millions of dollars. However, new passive-treatment technologies pioneered by the U.S. Bureau of Mines in the late 1970's and first applied by the mining industry in the 1980's, offer effective, low-cost, low-maintenance remediation.
The Stonycreek-Conemaugh River Improvement Project (SCRIP) association is a coalition of grass roots groups and local resource agencies seeking to restore water quality in the Upper Conemaugh River Basin. This will be accomplished by the combined efforts of government, industry, and the private sectors and by use of new passive-treatment technologies. SCRIP was formed at the request of U.S Congressman John P. Murtha. Its goal is to develop and implement solutions to the AMD problem in the Conemaugh River Basin. SCRIP was instrumental in initiating the cooperative study of the Stonycreek River Basin between the U. S. Geological Survey (USGS) and the Somerset Conservation District.
Purpose and Scope
This report presents the results of a coal-mine-drainage study in the Stonycreek River Basin in Somerset and Cambria Counties, Pa., from 1992 to 1995. The report describes the locations and instantaneous contaminant loads of 270 mine discharges sampled during low flow throughout the basin and shows the effect that the discharges had on the water quality of the Stonycreek River and its major tributary streams. The report also describes the method used to prioritize the mine discharges for remediation and gives methods for remediation by use of passive-treatment systems. Base-flow samples were collected at 5 mainstem sites and 32 tributary sites in September 1992, July 1993, and May 1994. All 37 sites were sampled each year. To show the specific effect of mine discharges on the receiving streams, five mine discharges were sampled at their point of discharge into the receiving streams, and the receiving streams were sampled above and below these discharges. Also, two streams significantly affected by AMD, Oven Run and Pokeytown Run, were sampled at their point of discharge into the Stonycreek River, and the Stonycreek River was sampled above and below these tributary-stream inflows.
Description of Study Area
The Stony creek River Basin is almost entirely in northern Somerset County in southwestern Pennsylvania with only a small part of the basin in Cambria County (fig. 1). Stonycreek River drains an area of 468 mi2 . Stonycreek River Basin is in the Allegheny Mountain Section of the Appalachian Plateaus Physiographic Province (Berg and others, 1989). The eastern basin boundary is the Allegheny Front, which is a crest forming the western edge of the Appalachian Mountains of the Ridge and Valley Physiographic Province. The western border of the Stonycreek River Basin is Laurel Ridge. The headwaters of the Stonycreek River rise near the town of Berlin in central Somerset County and flow generally north to Johnstown in Cambria County where it joins the Little Conemaugh River to form the Conemaugh River. The Stonycreek River has a length of 43.4 mi and an average slope of 38 ft/mi (U.S. Army Corps of Engineers, 1994). Elevations in the basin range from more than 2,900 ft above sea level on both the Allegheny Front and the Laurel Ridge to about 1,150 ft above sea level in the city of Johnstown. Relief throughout the basin is moderate to high. A wide, low flood plain exists at the headwaters of the Stonycreek River. As the river meanders northward, it enters an area of steep flanking hills with relief of 400 to 500 ft near the town of Hooversville; relief increases to a maximum of about 600 ft in Johnstown.
The Stonycreek River Basin contains a large resource of low-volatile bituminous coal. About 14 coal beds of mineable thickness are in the basin. However, the Lower and Upper Kittanning and the Upper Freeport coals have been the most extensively mined. The earliest mining activity in the basin was during the middle to late 1800's and was limited almost entirely to the Pittsburgh Coal bed in the southeastern most part of the basin and the Lower Kittanning Coal bed in the central and northern part of the basin. In the early 1900's, extensive mining of the Upper Kittanning Coal bed began. Surface-mining activities began between 1940 and 1950 and continue to be a major industry throughout the basin.
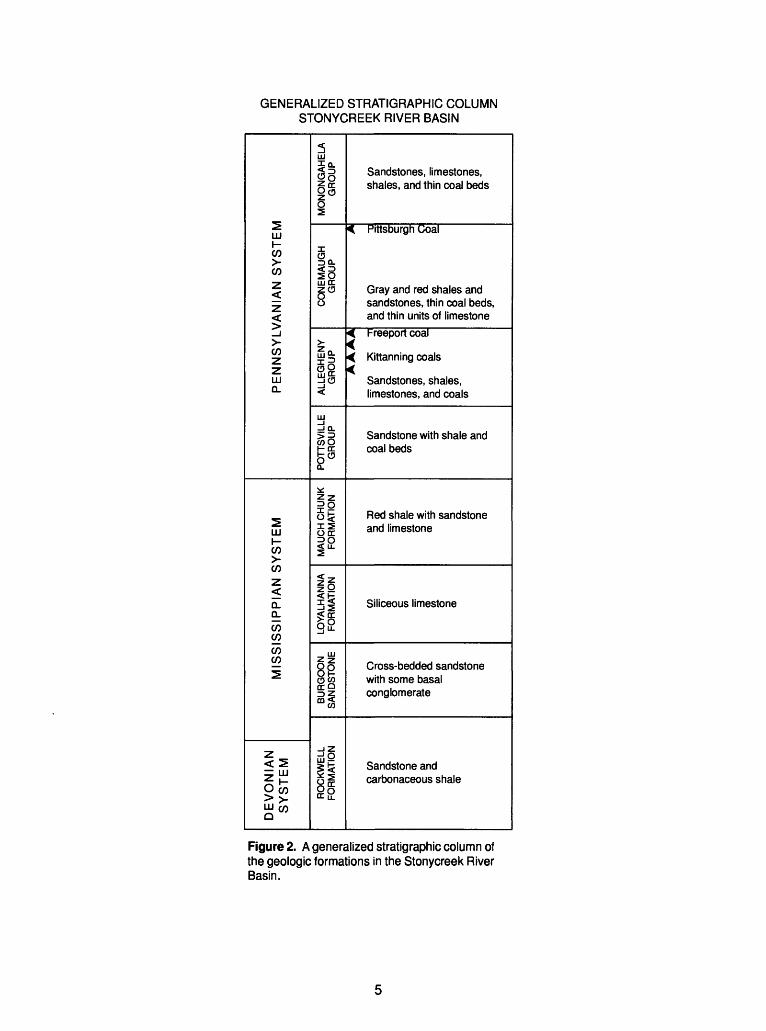
Rock in the Stonycreek River Basin is sedimentary in origin, and the rock types are primarily sandstone, siltstone, and shale with thin beds of limestone and coal. Folding along the Allegheny Front on the east and Laurel Hill on the west exposes a considerable part of the geologic column, from the Mississippian-Devonian age Rockwell Formation to the Pennsylvania age Monongahela Group. A generalized stratigraphic column showing the units present in the basin is shown in figure 2.
The rocks are divided into eight stratigraphic units: the Rockwell Formation of the Mississippian- Devonian System; the Burgoon sandstone, Loyalhanna Formation, and Mauch Chunk Formation of the Mississippian System; and the Pottsville Group, Allegheny Group, Conemaugh Group, and Monongahela Group of the Pennsylvanian System. The distribution of stratigraphic units in the basin is shown in figure 3. The Rockwell Formation consists of sandstone, shale, and some red beds. The Burgoon sandstone consists of buff-nonmarine sandstone and conglomerate. The Loyalhanna Formation is a highly cross- bedded siliceous limestone. The Mauch Chunk Formation consists of red shale with subordinate sandstone and limestone. The Pottsville Group is composed of the Homewood, Mercer, and Connoquenessing Formations and consists predominantly of sandstone, conglomerate, and thin beds of shale.
The Allegheny and Conemaugh Groups are the two most areally extensive stratigraphic units in the basin. The Allegheny Group is composed of the Freeport, Kittanning, and Clarion Formations. The group consists of sandstone, shale, and discontinuous limestone and coal beds. The Conemaugh Group is composed of the Casselman and Glenshaw Formations and consists primarily of sandstone and shale and lesser amounts of limestone and coal. The Allegheny Group is the major coal-bearing unit in the Stonycreek River Basin, containing the thick Freeport and Kittanning coal beds. In the basin, the Monongahela Group is composed only of the Pittsburgh Formation, which consists of sandstone, limestone, shale, and coal. The Monongahela Group is confined to the hilltops just north of Berlin. This Group contains three workable coal beds the Pittsburgh coal, the Blue Lick coal (local name), and the Redstone coal. However, in the Stonycreek River Basin, this Group is sparsely represented.

/.' - -..- *79° 07' 30"//'
FERNDALE.*^- ** " 'A
_.... i
JOHNSTOWN / '
78° 45'
40° 15' > --*. V* WINDBER f PAINT
JV
QUEMAHONINGj \ "\ < ' RESERVOIR : > { \/ >,
^- ......^r ^i*OOVERSVILLE\ Z*" *1 ;|: a N) U; ' ' ; OITY .x :;
/BOSWELL ffj ^ ^: - S? BOSWELL ^
I/03 i
,/ !
'»
SOMERSET 4"°°-
\ BERLIN ^ «
EXPLANATION
MAJOR TOWNS
STREAMS
------- DRAINAGE DIVIDE
------ COUNTY BOUNDARY
02468 10 MILES I HT ,',',' '
02468 10 KILOMETERS
Figure 1. Location of the Stonycreek River Basin.
GENERALIZED STRATIGRAPHIC COLUMN STONYCREEK RIVER BASIN
PENNSYLVANIAN SYSTEM
SSIPPIAN SYSTEM
CO CO
2
DEVONIAN SYSTEM
MONONGAHELA
GROUP
CONEMAUGH GROUP
ALLEGHENY GROUP
POTTSVILLE GROUP
MAUCH CHUNK FORMATION
LOYALHANNA FORMATION
BURGOON SANDSTONE
ROCKWELL FORMATION
Sandstones, limestones, shales, and thin coal beds
4 Pittsburgh Coal
Gray and red shales and sandstones, thin coal beds, and thin units of limestone
< Freeport coal
< Kittanning coals<
Sandstones, shales,limestones, and coals
Sandstone with shale and coal beds
Red shale with sandstone and limestone
Siliceous limestone
Cross-bedded sandstone with some basal conglomerate
Sandstone and carbonaceous shale
Figure 2. A generalized stratigraphic column of the geologic formations in the Stonycreek River Basin.

79° 07' 30"
40° 15'
PENNSYLVANIANEXPLANATION
MISSISSIPPI
MONONGAHELAGROUP
CONEMAUGHGROUP
ALLEGHENY GROUP
POTTSVILLE GROUP
MAUCH CHUNK FORMATION AND LOYALHANNA LIMESTONE
BURGOON SANDSTONE
ROCKWELL FORMATION
Figure 3. Geologic map of the Stonycreek River Basin (Geology compiled by Berg and others, 1980)
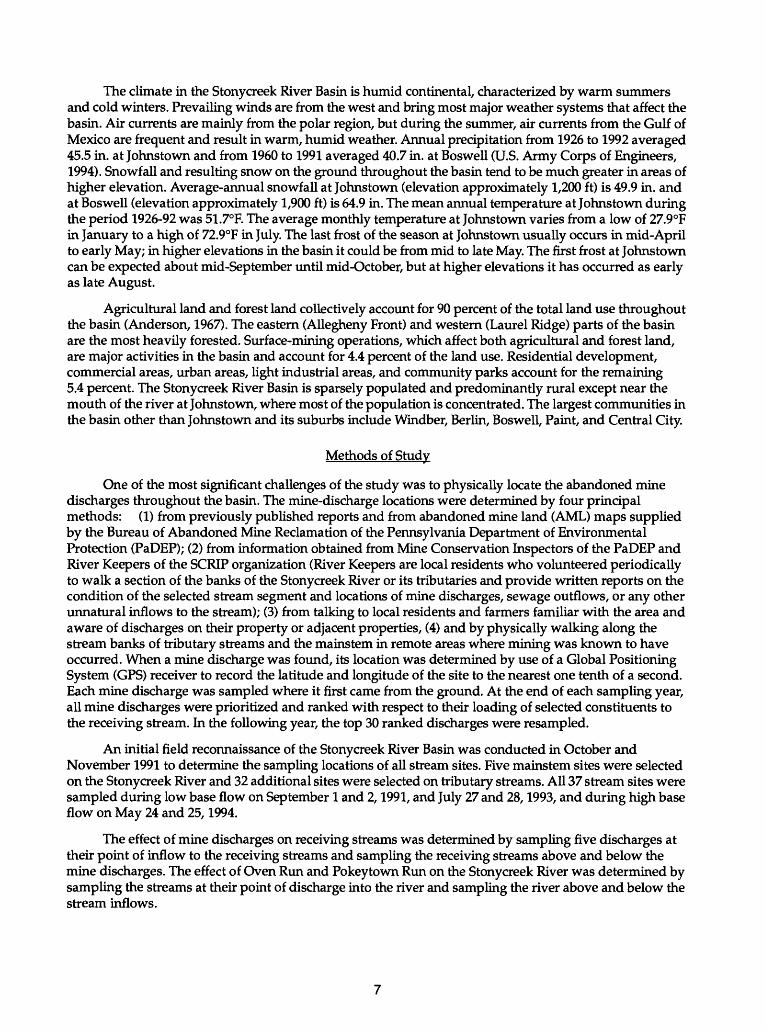
The climate in the Stonycreek River Basin is humid continental, characterized by warm summers and cold winters. Prevailing winds are from the west and bring most major weather systems that affect the basin. Air currents are mainly from the polar region, but during the summer, air currents from the Gulf of Mexico are frequent and result in warm, humid weather. Annual precipitation from 1926 to 1992 averaged 45.5 in. at Johnstown and from 1960 to 1991 averaged 40.7 in. at Boswell (U.S. Army Corps of Engineers, 1994). Snowfall and resulting snow on the ground throughout the basin tend to be much greater in areas of higher elevation. Average-annual snowfall at Johnstown (elevation approximately 1,200 ft) is 49.9 in. and at Boswell (elevation approximately 1,900 ft) is 64.9 in. The mean annual temperature at Johnstown during the period 1926-92 was 51.7°F. The average monthly temperature at Johnstown varies from a low of 27.9°F in January to a high of 72.9°F in July. The last frost of the season at Johnstown usually occurs in mid-April to early May; in higher elevations in the basin it could be from mid to late May. The first frost at Johnstown can be expected about mid-September until mid-October, but at higher elevations it has occurred as early as late August.
Agricultural land and forest land collectively account for 90 percent of the total land use throughout the basin (Anderson, 1967). The eastern (Allegheny Front) and western (Laurel Ridge) parts of the basin are the most heavily forested. Surface-mining operations, which affect both agricultural and forest land, are major activities in the basin and account for 4.4 percent of the land use. Residential development, commercial areas, urban areas, light industrial areas, and community parks account for the remaining 5.4 percent. The Stonycreek River Basin is sparsely populated and predominantly rural except near the mouth of the river at Johnstown, where most of the population is concentrated. The largest communities in the basin other than Johnstown and its suburbs include Windber, Berlin, Boswell, Paint, and Central City.
Methods of Study
One of the most significant challenges of the study was to physically locate the abandoned mine discharges throughout the basin. The mine-discharge locations were determined by four principal methods: (1) from previously published reports and from abandoned mine land (AML) maps supplied by the Bureau of Abandoned Mine Reclamation of the Pennsylvania Department of Environmental Protection (PaDEP); (2) from information obtained from Mine Conservation Inspectors of the PaDEP and River Keepers of the SCRIP organization (River Keepers are local residents who volunteered periodically to walk a section of the banks of the Stonycreek River or its tributaries and provide written reports on the condition of the selected stream segment and locations of mine discharges, sewage outflows, or any other unnatural inflows to the stream); (3) from talking to local residents and farmers familiar with the area and aware of discharges on their property or adjacent properties, (4) and by physically walking along the stream banks of tributary streams and the mainstem in remote areas where mining was known to have occurred. When a mine discharge was found, its location was determined by use of a Global Positioning System (GPS) receiver to record the latitude and longitude of the site to the nearest one tenth of a second. Each mine discharge was sampled where it first came from the ground. At the end of each sampling year, all mine discharges were prioritized and ranked with respect to their loading of selected constituents to the receiving stream. In the following year, the top 30 ranked discharges were resampled.
An initial field reconnaissance of the Stonycreek River Basin was conducted in October and November 1991 to determine the sampling locations of all stream sites. Five mainstem sites were selected on the Stonycreek River and 32 additional sites were selected on tributary streams. All 37 stream sites were sampled during low base flow on September 1 and 2,1991, and July 27 and 28,1993, and during high base flow on May 24 and 25,1994.
The effect of mine discharges on receiving streams was determined by sampling five discharges at their point of inflow to the receiving streams and sampling the receiving streams above and below the mine discharges. The effect of Oven Run and Pokeytown Run on the Stonycreek River was determined by sampling the streams at their point of discharge into the river and sampling the river above and below the stream inflows.

In 1983-86, the USGS collected data on five headwater streams in the Laurel Hill area, three of which were in the Stonycreek River Basin, to determine the effect of acid precipitation on stream water quality (Barker and Witt III, 1990). Sulfate was the dominant precursor for acid formation in precipitation and streamflow. Nitrate was more abundant in snowfalls and contributed to streamflow acidification only during snowmelt.
Water-resources data, climatological data, and quality-assurance data were collected by the USGS in the North Fork Bens Creek Basin, a small subbasin in the Stonycreek River Basin, from 1983 through 1988 (Witt III, 1991).
In 1993, the U.S. Army Corps of Engineers, Pittsburgh District, completed a reconnaissance survey on the lower 4-mi section of the flood-reduction channel on the Stonycreek River (U.S. Army Corps of Engineers, 1993). The survey was conducted to examine the water quality, the channel sediments that might be removed or disturbed, and aquatic-life resources that might be affected by proposed rehabilitation in that section of the flood channel.
A Conemaugh River Basin Reconnaissance Study was published in 1994 by the U.S. Army Corps of Engineers, Pittsburgh District. This study considered a broad array of basin problems, one of which was water-quality degradation with respect to AMD. The study also recommended solutions for identified problem conditions.
The PaDEP publishes a water-quality assessment for Pennsylvania waters on a biennial basis in response to Section 305(b) of the Federal Clean Water Act. The PaDEP 1994 Water-Quality Assessment report for subbasin 18, which includes the Conemaugh River Basin, indicates that the single biggest source of water degradation in the subbasin is coal mining and is responsible for more than 81 percent of the degradation (Pennsylvania Department of Environmental Resources, 1994b).
Acknowledgments
The authors gratefully acknowledge the many individuals residing in the Stonycreek River Basin who took an earnest interest in this project and provided information and assistance in finding many abandoned-mine discharges. A special thanks goes to the Mine Conservation Inspectors of the PaDEP and to the River Keepers of SCRIP who provided information on the location of many mine discharges and assisted field personnel in physically locating the discharges. The authors also acknowledge the interest and cooperation of the many individual landowners, companies, and municipalities throughout the Stonycreek River Basin who provided access to private and public property for the field data collection, and commonly, provided personal escorts for locating secluded mine discharges.
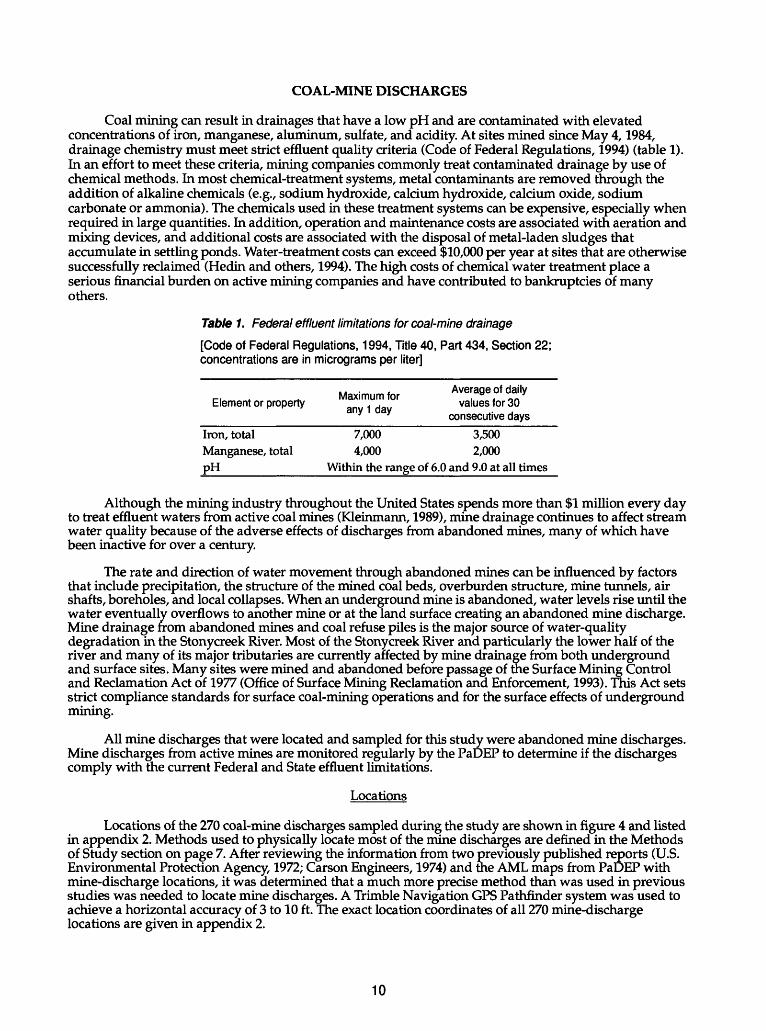
COAL-MINE DISCHARGES
Coal mining can result in drainages that have a low pH and are contaminated with elevated concentrations of iron, manganese, aluminum, sulfate, and acidity. At sites mined since May 4,1984, drainage chemistry must meet strict effluent quality criteria (Code of Federal Regulations, 1994) (table 1). In an effort to meet these criteria, mining companies commonly treat contaminated drainage by use of chemical methods. In most chemical-treatment systems, metal contaminants are removed through the addition of alkaline chemicals (e.g., sodium hydroxide, calcium hydroxide, calcium oxide, sodium carbonate or ammonia). The chemicals used in these treatment systems can be expensive, especially when required in large quantities. In addition, operation and maintenance costs are associated with aeration and mixing devices, and additional costs are associated with the disposal of metal-laden sludges that accumulate in settling ponds. Water-treatment costs can exceed $10,000 per year at sites that are otherwise successfully reclaimed (Hedin and others, 1994). The high costs of chemical water treatment place a serious financial burden on active mining companies and have contributed to bankruptcies of many others.
Table 1. Federal effluent limitations for coal-mine drainage
[Code of Federal Regulations, 1994, Title 40, Part 434, Section 22; concentrations are in micrograms per liter]
Element or property
Iron, total Manganese, total pH
Maximum for any 1 day
Average of daily values for 30
consecutive days
7,000 3,500 4,000 2,000
Within the range of 6.0 and 9.0 at all times
Although the mining industry throughout the United States spends more than $1 million every day to treat effluent waters from active coal mines (Kleinmann, 1989), mine drainage continues to affect stream water quality because of the adverse effects of discharges from abandoned mines, many of which have been inactive for over a century.
The rate and direction of water movement through abandoned mines can be influenced by factors that include precipitation, the structure of the mined coal beds, overburden structure, mine tunnels, air shafts, boreholes, and local collapses. When an underground mine is abandoned, water levels rise until the water eventually overflows to another mine or at the land surface creating an abandoned mine discharge. Mine drainage from abandoned mines and coal refuse piles is the major source of water-quality degradation in the Stonycreek River. Most of the Stonycreek River and particularly the lower half of the river and many of its major tributaries are currently affected by mine drainage from both underground and surface sites. Many sites were mined and abandoned before passage of the Surface Mining Control and Reclamation Act of 1977 (Office of Surface Mining Reclamation and Enforcement, 1993). This Act sets strict compliance standards for surface coal-mining operations and for the surface effects of underground mining.
All mine discharges that were located and sampled for this study were abandoned mine discharges. Mine discharges from active mines are monitored regularly by the PaDEP to determine if the discharges comply with the current Federal and State effluent limitations.
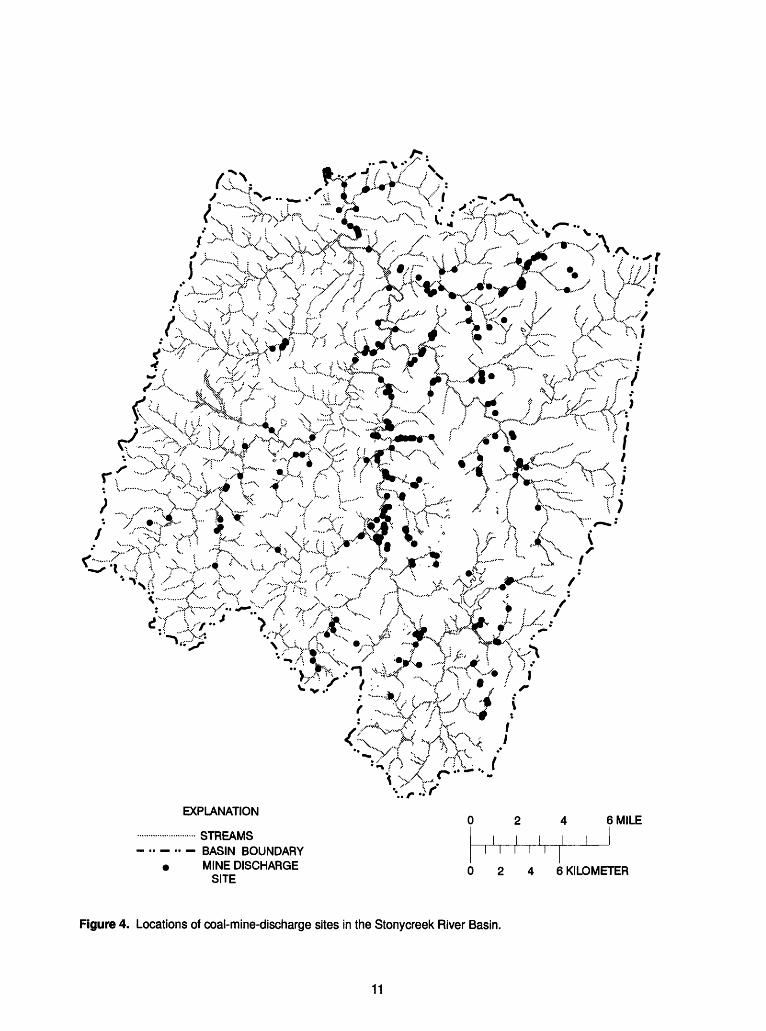
Locations
Locations of the 270 coal-mine discharges sampled during the study are shown in figure 4 and listed in appendix 2. Methods used to physically locate most of the mine discharges are defined in the Methods of Study section on page 7. After reviewing the information from two previously published reports (U.S. Environmental Protection Agency, 1972; Carson Engineers, 1974) and the AML maps from PaDEP with mine-discharge locations, it was determined that a much more precise method than was used in previous studies was needed to locate mine discharges. A Trimble Navigation GPS Pathfinder system was used to achieve a horizontal accuracy of 3 to 10 ft. The exact location coordinates of all 270 mine-discharge locations are given in appendix 2.
10
"" "x"-' \.,\ I. ^ "^A I , '"vS. s ..
' ' ^- *\Yr- -A.h;\ £V r*-- 4 N ., \} x /- ;<\, ~"^s > c^ ->-<' ; VY. / /^^»>\. vH/-f - ^k*v4 D V> -"i \^' v--^,^"-v \ /' ^^^<.>' x\ \\ ,
c^^J^K^r?V " - '^ f' ^V'-x } } . ">T"~' ^'>V % ^ -v.4^,..
EXPLANATION6 MILE
STREAMS- BASIN BOUNDARY
MINE DISCHARGE SITE
1 I I I I
2 4 6 KILOMETER
Figure 4. Locations of coal-mine-discharge sites in the Stonycreek River Basin.
11

Water Quality and Contaminant Discharges
Surface and underground coal mining exposes many earth materials to weathering. The physical- chemical breakdown of some materials is accelerated by this weathering process. Pyrite, or iron sulfide (FeS2), is commonly present in coal and the adjacent rock strata and is the compound most associated with AMD. Water is also a principal component of the AMD problem, functioning as a reactant in pyrite oxidation, as a reaction medium, and as a transport medium for oxidation products. Pyrite oxidation is described by the following reaction in which pyrite, oxygen, and water form sulfuric acid and ferrous sulfate:
2FeS2 + 7O2 + 2H2O = 4H+ + 2Fe2+ + 450^ . (1)
Oxidation of ferrous iron (Fe2+) produces ferric ions (Fe3+) according to the following reaction:
2Fe2+ + 1/2 O2 + 2H+ = 2Fe3+ + H2O. (2)
When the ferric ions react with water, an insoluble ferric hydroxide [Fe(OH)3], also called "yellow boy," and more acid are produced:
Fe3+ + 3H2O = Fe(OH)3 + 3H+ . (3)
The above reactions produce elevated concentrations of the precipitate insoluble ferric hydroxide [Fe(OH)3], dissolved sulfate (SO2̂ ), and acid (H+). Secondary reactions of the acidic water dissolve many other constituents associated with coal deposits, including manganese, aluminum, zinc, and trace metals such as arsenic, cadmium, and mercury (Tolar, 1982).
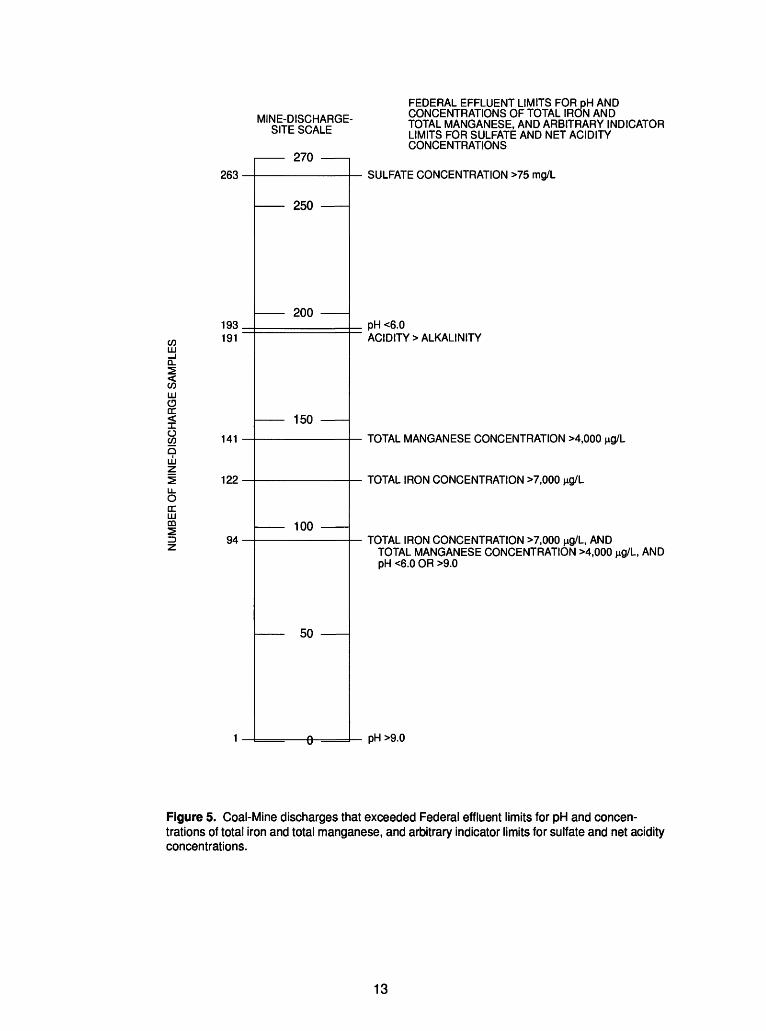
High acidities of many mine discharges also can be attributed to the action of the bacterium Thiobacillusferrooxidans on the pyrite associated with the coal. At near-neutral pH, the oxidation rates of pyrite by air and by T. ferrooxidans are comparable. This stage is typical of freshly exposed coal or refuse, and despite the high concentration of pyrite, the oxidation rate either by oxygen or T. ferrooxidans is low. When a mine discharge is sufficiently alkaline, the acidic water may persist for only a short time before neutralization occurs. However, when the neutralization capacity of the discharge is exceeded, acid begins to accumulate and the pH decreases. As the pH decreases, the rate of iron oxidation by oxygen also decreases, but T. ferrooxidans catalyze the pyrite oxidation and accelerate acid production, which serves to further lower pH. As the pH near the pyrite falls to less than 3, the increased solubility of iron and the decreased rate of ferric hydroxide precipitation significantly increase the overall rate of acid production. Most sampled mine discharges throughout the Stonycreek River Basin that had a pH less than 3 also had very high acidities in addition to high concentrations of iron, manganese, aluminum, and sulfate. The field and laboratory analyses of all samples collected at the 270 mine discharge sites are listed in appendix 3. The number of sampled mine discharges that exceeded effluent limits for pH, total iron, and total manganese concentrations (Code of Federal Regulations, 1994) (table 1) and arbitrary limits for sulfate (U.S. Department of the Interior, 1968) and acidity are shown in figure 5. A pH less than 6.0 was measured in 193 mine discharges, and a pH greater than 9.0 was measured in 1 discharge. Concentrations of total iron greater than 7,000 ug/L were measured in 122 mine discharges, and 141 mine discharges contained concentrations of total manganese greater than 4,000 ug/L. Effluent limits for pH and for concentrations of total iron and total manganese were all exceeded in 94 mine discharges. Effluent standards for 1 or 2 of those constituents were exceeded in 140 mine discharges. Sulfate is an excellent indicator of mine drainage because neutralization processes generally do not change the sulfate concentration and the sulfate ion remains in solution. The U.S. Department of Interior (1968) reported that 75 mg/L of sulfate is an indicator of AMD in streams. Sulfate concentrations exceeded 75 mg/L in 263 mine discharges.
12
MINE-DISCHARGE- SITE SCALE
263
COLJJ
LJJ O DC <
IoLJJ
oDC LJJ DO
193191
141
122
94
ocni-vjv
200
1*501 OU
100
enww
fl
FEDERAL EFFLUENT LIMITS FOR pH AND CONCENTRATIONS OF TOTAL IRON AND TOTAL MANGANESE, AND ARBITRARY INDICATOR LIMITS FOR SULFATE AND NET ACIDITY CONCENTRATIONS
SULFATE CONCENTRATION >75 mg/L
pH <6.0ACIDITY > ALKALINITY
TOTAL MANGANESE CONCENTRATION >4,000 iig/L
TOTAL IRON CONCENTRATION >7,000 iig/L
TOTAL IRON CONCENTRATION >7,000 iig/L, AND TOTAL MANGANESE CONCENTRATION >4,000 iig/L, AND pH <6.0 OR >9.0
pH >9.0
Figure 5. Coal-Mine discharges that exceeded Federal effluent limits for pH and concen trations of total iron and total manganese, and arbitrary indicator limits for sulfate and net acidity concentrations.
13
Acidity concentrations show the severity of a mine discharge. A discharge that is appreciably acidic will be highly aggressive that is, it will dissolve many minerals in coal mines. The acidity of coal-mine drainage generally arises from free hydrogen ions (H+) and mineral acidity from dissolved iron, manganese, and aluminum, which can undergo hydrolysis reactions that produce H+. When a mine discharge contains both mineral acidity and alkalinity, the discharge is net acidic if acidity is greater than alkalinity or net alkaline if alkalinity is greater than acidity. Of the mine discharges sampled, 191 were classified as net acidic and the remaining 79 were classified as net alkaline.
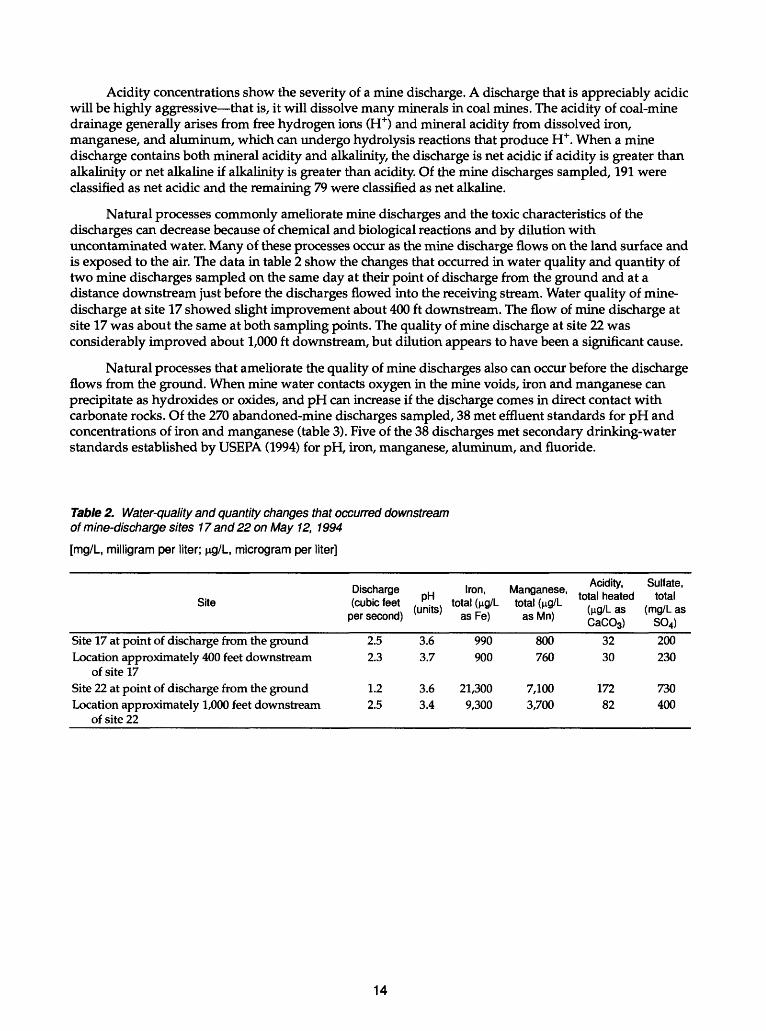
Natural processes commonly ameliorate mine discharges and the toxic characteristics of the discharges can decrease because of chemical and biological reactions and by dilution with uncontaminated water. Many of these processes occur as the mine discharge flows on the land surface and is exposed to the air. The data in table 2 show the changes that occurred in water quality and quantity of two mine discharges sampled on the same day at their point of discharge from the ground and at a distance downstream just before the discharges flowed into the receiving stream. Water quality of mine- discharge at site 17 showed slight improvement about 400 ft downstream. The flow of mine discharge at site 17 was about the same at both sampling points. The quality of mine discharge at site 22 was considerably improved about 1,000 ft downstream, but dilution appears to have been a significant cause.
Natural processes that ameliorate the quality of mine discharges also can occur before the discharge flows from the ground. When mine water contacts oxygen in the mine voids, iron and manganese can precipitate as hydroxides or oxides, and pH can increase if the discharge comes in direct contact with carbonate rocks. Of the 270 abandoned-mine discharges sampled, 38 met effluent standards for pH and concentrations of iron and manganese (table 3). Five of the 38 discharges met secondary drinking-water standards established by USEPA (1994) for pH, iron, manganese, aluminum, and fluoride.
Table 2. Water-quality and quantity changes that occurred downstream of mine-discharge sites 17 and 22 on May 12, 1994
[mg/L, milligram per liter; j*g/L, microgram per liter]
Site
Site 17 at point of discharge from the ground Location approximately 400 feet downstream
of site 17 Site 22 at point of discharge from the ground Location approximately 1,000 feet downstream
of site 22
Discharge (cubic feet
per second)
2.5 2.3
1.2 2.5
PH (units)
3.6 3.7
3.6 3.4
Iron, total (no/L
as Fe)
990 900
21,300 9,300
Manganese, total (ng/L
asMn)
800 760
7,100 3,700
Acidity, total heated
(ng/L as CaCO3)
32 30
172 82
Sulfate, total
(mg/L as S04)200 230
730 400
14

Table 3. Mine discharges that met Federal effluent standards forpH and concentrations of total iron and total manganese
[U.S. Environmental Protection Agency, 1994; u.g/L, microgram per liter; mg/L, milligrams per liter, <, less than]
Site number
506164666886889196
121123135136145146151152153171193
!195 !196
197199202211224229230243244245
J246 !247
257259268
1270
pH (units)
7.16.76.46.86.76.66.56.86.36.06.46.66.66.26.76.56.56.36.66.9 7.1 6.87.27.16.16.66.46.26.16.36.36.0 6.4 6.66.96.36.3 6.6
Manganese, total (ng/L)
3302,0002,90050013061010
120610760170
1,2001,800
701,6003,000
40230950
1,400 100 30
1,900230150
1,200830
2,2004,0002,000220210 20
490570180700 110
Iron, total (HQ/L)
24150
1,700260
1,4005006088
46094050140170280120260100320510130 10 107917086
1,6003,900380
2,0004317
120 240 84033190680 10
Aluminum, Fluoride total (ng/L) (mg/L)
<130 <0.2 <130 <.2
<130 <.2 150 <.2
197 .2
1 Discharges that met U.S. Environmental Protection Agency secondary drinking water standards for aluminum and fluoride.
15
The flow rate of a mine discharge is one of the most important factors when determining contaminant discharges. This is illustrated in table 4. The first set of data on the top left side of the table represents the top 10 percent (27 discharges) of the 270 mine discharges with respect to the largest total iron concentrations. The sites are sorted from highest concentration to lowest concentration of total iron. The "DISCHARGE RANK" column represents the rank of the corresponding discharge for each site from highest measured instantaneous discharge to lowest measured instantaneous discharge of all 270 mine discharges. For example, mine discharge at site 20 contained the highest measured total-iron concentration (4,750,000 ug/L) of all 270 mine discharges, but the iron discharge of 39.9 Ib/d ranked 26th of all 270 mine discharges. Mine discharge at site 122 contained the fourth highest measured iron concentration (690,000 ug/L), but its discharge of only 1.66 Ib/d ranked that mine discharge 107th of the 270 mine discharges.
On the top right side of table 4, the data are sorted with respect to total-iron discharges, with the highest measured discharge at the top of the data group in the column marked "Discharge, Ib/d" and the lowest measured discharge at the bottom. In this data group, mine discharge at site 16 contained the largest total iron discharge (1,700 Ib/d), but the concentration ranked only 41 of the 270 discharges. The reason for the highest measured total iron discharge was because of the very large flow (2,250 gal/min) in addition to a large concentration (63,000 ug/L). Mine discharges at sites 149 and 242 ranked very high in both iron discharge rank and iron concentration rank because both mine discharges contained high total- iron concentrations and high flows.
The bottom half of table 4 shows discharge ranks and concentration ranks for acidities that were sorted on the basis of acidity concentrations and acidity discharges. Site 242 ranked second of all 270 sites in acidity discharge rank and acidity concentration rank. The iron and acidity columns labeled "Discharge, Ib/d" on the right side of table 4 gives the 27 mine discharges that are contributing most of the contaminant discharges of total iron and total acidity to the receiving streams.
The next section in this report integrates discharges of total iron, total manganese, dissolved aluminum, acidity, and sulfate to prioritize all sampled mine discharges for remediation.
16
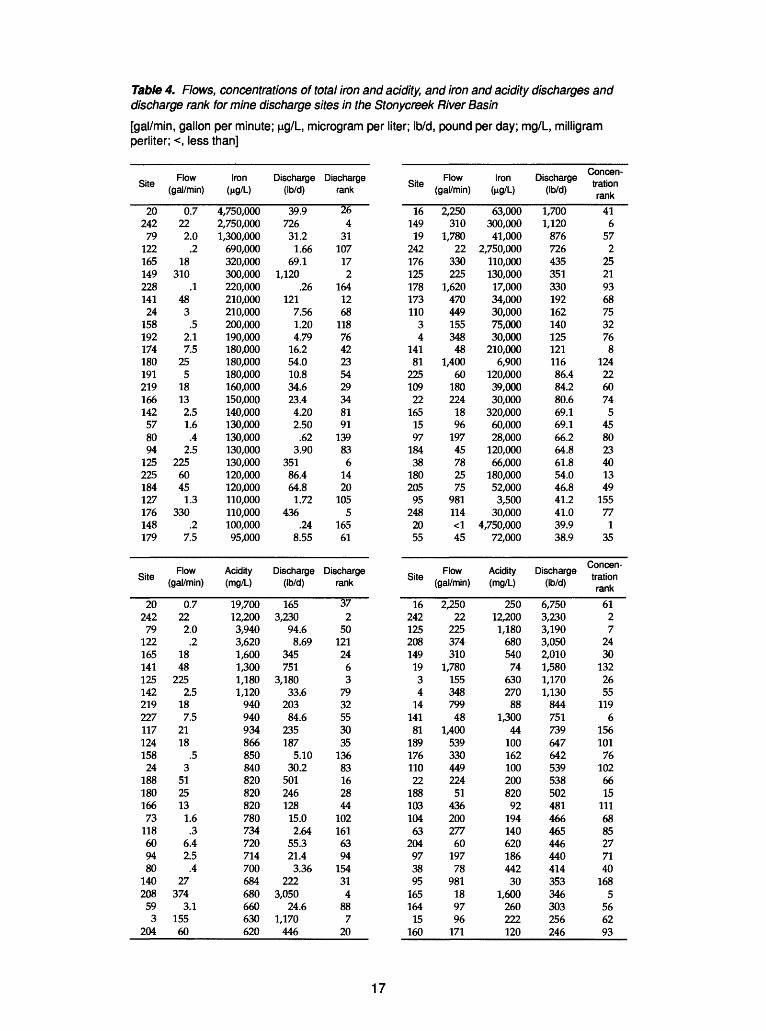
Table 4. Flows, concentrations of total iron and acidity, and iron and acidity discharges and discharge rank for mine discharge sites in the Stonycreek River Basin
[gal/min, gallon per minute; ng/L, microgram per liter; Ib/d, pound per day; mg/L, milligram perliter; <, less than]
Site
202427912216514922814124158192174180191219166142578094125225184127176148179
Site
202427912216514112514221922711712415824
18818016673118609480140208593
204
Flow(gal/min)
0.7222.0.2
18310
.1483.5
2.17.5
25518132.51.6.4
2.522560451.3
330.2
7.5
Flow(gal/min)
0.7222.0.2
1848
2252.5
187.5
2118
.53
5125131.6.3
6.42.5.4
27374
3.115560
Iron(H9/L)
4,750,0002,750,0001,300,000690,000320,000300,000220,000210,000210,000200,000190,000180,000180,000180,000160,000150,000140,000130,000130,000130,000130,000120,000120,000110,000110,000100,00095,000
Acidity(mg/L)
19,70012,2003,9403,6201,60013001,1801,120940940934866850840820820820780734720714700684680660630620
Discharge(Ib/d)
39.972631.21.66
69.11,120
.26121
7.561.204.79
16.254.010.834.623.44.202.50.62
3.9035186.464.81.72
436.24
8.55
Discharge(Ib/d)
1653,230
94.68.69
345751
3,18033.6
20384.6
235187
5.1030.2
50124612815.02.64
55.321.43.36
2223,050
24.61,170446
Dischargerank
264
31107172
1641268118764223542934819113983614201055
16561
Dischargerank
372
501212463
7932553035136831628441021616394154314887
20
Site
1614919
24217612517817311034
141812251092216515971843818020595
2482055
Site
16242125208149193414
141811891761102218810310463
20497389516516415
160
Flow (gal/min)
2,250310
1,78022
330225
1,62047044915534848
1,40060180224189619745782575
981114<145
Flow (gal/min)
2,25022
225374310
1,78015534879948
1,40053933044922451
4362002776019778
981189796171
Iron (WJ/L)
63,000300,00041,000
2,750,000110,000130,00017,00034,00030,00075,00030,000
210,0006,900
120,00039,00030,000
320,00060,00028,000
120,00066,000
180,00052,0003,500
30,0004,750,000
72,000
Acidity (mg/L)
25012,2001,18068054074
63027088
1,300441001621002008209219414062018644230
1,600260222120
Discharge (Ib/d)
1,7001,12087672643535133019216214012512111686.484.280.669.169.166.264.861.854.046.841.241.039.938.9
Discharge (Ib/d)
6,7503,2303,1903,0502,0101,5801,1701,130844751739647642539538502481466465446440414353346303256246
Concen tration rank
416
572
252193687532768
1242260745
458023401349155771
35
Concen tration rank
6127
243013226551196
15610176102661511168852771401685
566293
17
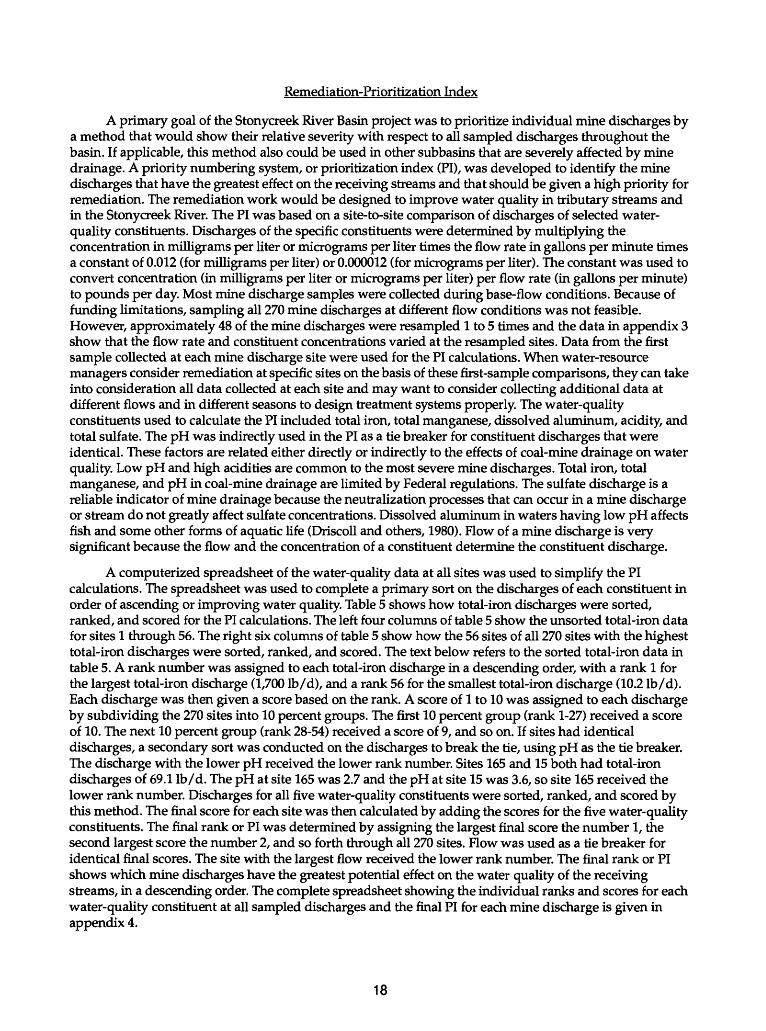
Remediation-Prioritization Index
A primary goal of the Stonycreek River Basin project was to prioritize individual mine discharges by a method that would show their relative severity with respect to all sampled discharges throughout the basin. If applicable, this method also could be used in other subbasins that are severely affected by mine drainage. A priority numbering system, or prioritization index (PI), was developed to identify the mine discharges that have the greatest effect on the receiving streams and that should be given a high priority for remediation. The remediation work would be designed to improve water quality in tributary streams and in the Stonycreek River. The PI was based on a site-to-site comparison of discharges of selected water- quality constituents. Discharges of the specific constituents were determined by multiplying the concentration in milligrams per liter or micrograms per liter times the flow rate in gallons per minute times a constant of 0.012 (for milligrams per liter) or 0.000012 (for micrograms per liter). The constant was used to convert concentration (in milligrams per liter or micrograms per liter) per flow rate (in gallons per minute) to pounds per day. Most mine discharge samples were collected during base-flow conditions. Because of funding limitations, sampling all 270 mine discharges at different flow conditions was not feasible. However, approximately 48 of the mine discharges were resampled 1 to 5 times and the data in appendix 3 show that the flow rate and constituent concentrations varied at the resampled sites. Data from the first sample collected at each mine discharge site were used for the PI calculations. When water-resource managers consider remediation at specific sites on the basis of these first-sample comparisons, they can take into consideration all data collected at each site and may want to consider collecting additional data at different flows and in different seasons to design treatment systems properly. The water-quality constituents used to calculate the PI included total iron, total manganese, dissolved aluminum, acidity, and total sulfate. The pH was indirectly used in the PI as a tie breaker for constituent discharges that were identical. These factors are related either directly or indirectly to the effects of coal-mine drainage on water quality. Low pH and high acidities are common to the most severe mine discharges. Total iron, total manganese, and pH in coal-mine drainage are limited by Federal regulations. The sulfate discharge is a reliable indicator of mine drainage because the neutralization processes that can occur in a mine discharge or stream do not greatly affect sulfate concentrations. Dissolved aluminum in waters having low pH affects fish and some other forms of aquatic life (Driscoll and others, 1980). Flow of a mine discharge is very significant because the flow and the concentration of a constituent determine the constituent discharge.
A computerized spreadsheet of the water-quality data at all sites was used to simplify the PI calculations. The spreadsheet was used to complete a primary sort on the discharges of each constituent in order of ascending or improving water quality. Table 5 shows how total-iron discharges were sorted, ranked, and scored for the PI calculations. The left four columns of table 5 show the unsorted total-iron data for sites 1 through 56. The right six columns of table 5 show how the 56 sites of all 270 sites with the highest total-iron discharges were sorted, ranked, and scored. The text below refers to the sorted total-iron data in table 5. A rank number was assigned to each total-iron discharge in a descending order, with a rank 1 for the largest total-iron discharge (1,700 Ib/d), and a rank 56 for the smallest total-iron discharge (10.2 Ib/d). Each discharge was then given a score based on the rank. A score of 1 to 10 was assigned to each discharge by subdividing the 270 sites into 10 percent groups. The first 10 percent group (rank 1-27) received a score of 10. The next 10 percent group (rank 28-54) received a score of 9, and so on. If sites had identical discharges, a secondary sort was conducted on the discharges to break the tie, using pH as the tie breaker. The discharge with the lower pH received the lower rank number. Sites 165 and 15 both had total-iron discharges of 69.1 Ib/d. The pH at site 165 was 2.7 and the pH at site 15 was 3.6, so site 165 received the lower rank number. Discharges for all five water-quality constituents were sorted, ranked, and scored by this method. The final score for each site was then calculated by adding the scores for the five water-quality constituents. The final rank or PI was determined by assigning the largest final score the number 1, the second largest score the number 2, and so forth through all 270 sites. Flow was used as a tie breaker for identical final scores. The site with the largest flow received the lower rank number. The final rank or PI shows which mine discharges have the greatest potential effect on the water quality of the receiving streams, in a descending order. The complete spreadsheet showing the individual ranks and scores for each water-quality constituent at all sampled discharges and the final PI for each mine discharge is given in appendix 4.
18
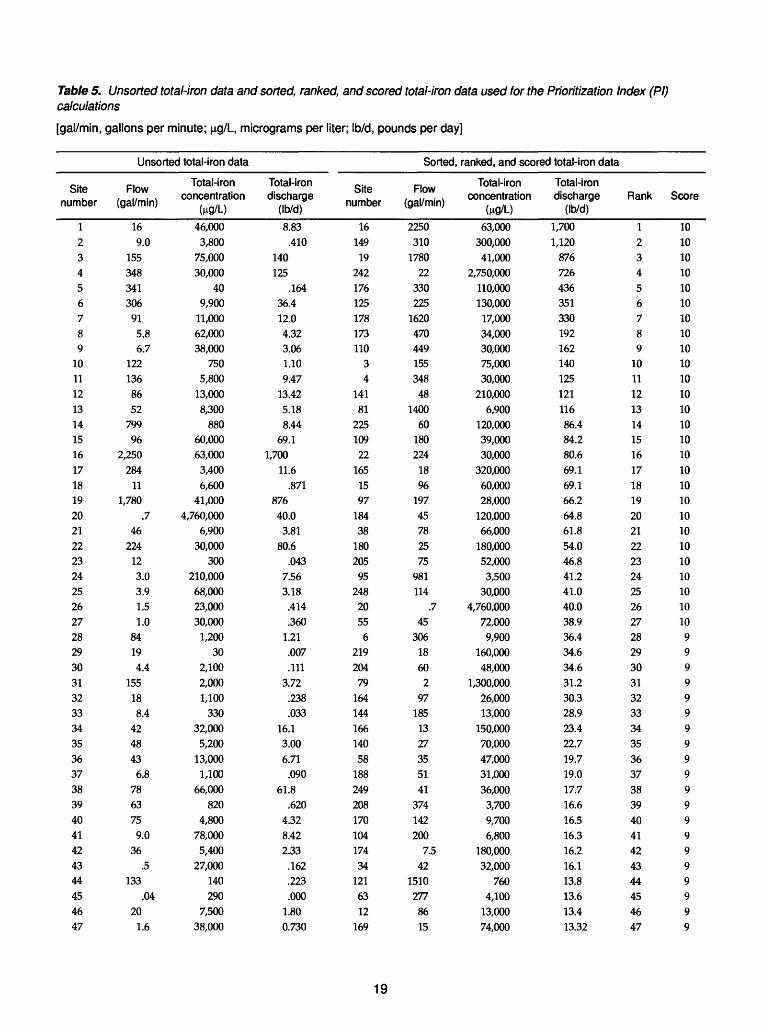
Table 5. Unsorted total-iron data and sorted, ranked, and scored total-iron data used for the Prioritization Index (PI) calculations
[gal/min, gallons per minute; ng/L, micrograms per liter; Ib/d, pounds per day]
Unsorted total-iron data
Site number
123456789
1011121314151617181920212223242526272829303132333435363738394041424344454647
Flow (gal/min)
169.0
155348341306
915.86.7
1221368652
79996
2,250284
111,780
.746
224123.03.91.51.0
84194.4
155188.4
424843
6.87863759.0
36.5
133.04
201.6
Total-iron concentration
(ng/L)46,000
3,80075,00030,000
409,900
11,00062,00038,000
7505,800
13,0008,300
88060,00063,000
3,4006,600
41,0004,760,000
6,90030,000
300210,00068,00023,00030,000
1,20030
2,1002,0001,100
33032,000
5,20013,000
1,10066,000
8204,800
78,0005,400
27,000140290
7,50038,000
Total-iron discharge
(Ib/d)8.83
.410140125
.16436.412.04.323.061.109.47
13.425.188.44
69.11,700
11.6.871
87640.0
3.8180.6
.0437.563.18
.414
.3601.21.007.111
3.72.238.033
16.13.006.71
.09061.8
.6204.328.422.33
.162
.223
.0001.800.730
Site number
16149
19242176125178173110
34
14181
22510922
1651597
18438
180205
95248
2055
6219204
7916414416614058
18824920817010417434
1216312
169
Sorted,
Flow (gal/min)
2250310
178022
330225
162047044915534848
140060
180224
1896
19745782575
981114
.745
3061860
297
1851327355141
374142200
7.542
1510277
8615
, ranked, and scored total-iron data
Total-iron concentration
(HQ/L)63,000
300,00041,000
2,750,000110,000130,000
17,00034,00030,00075,00030,000
210,0006,900
120,00039,00030,000
320,00060,00028,000
120,00066,000
180,00052,0003,500
30,0004,760,000
72,0009,900
160,00048,000
1,300,00026,00013,000
150,00070,00047,00031,00036,000
3,7009,7006,800
180,00032,000
7604,100
13,00074,000
Total-iron discharge
(Ib/d)1,7001,120
87672643635133019216214012512111686.484.280.669.169.166.264.861.854.046.841.241.040.038.936.434.634.631.230.328.923.422.719.719.017.716.616.516.316.216.113.813.613.413.32
Rank
123456789
1011121314151617181920212223242526272829303132333435363738394041424344454647
Score
101010101010101010101010101010101010101010101010101010
99999999999999999999
19
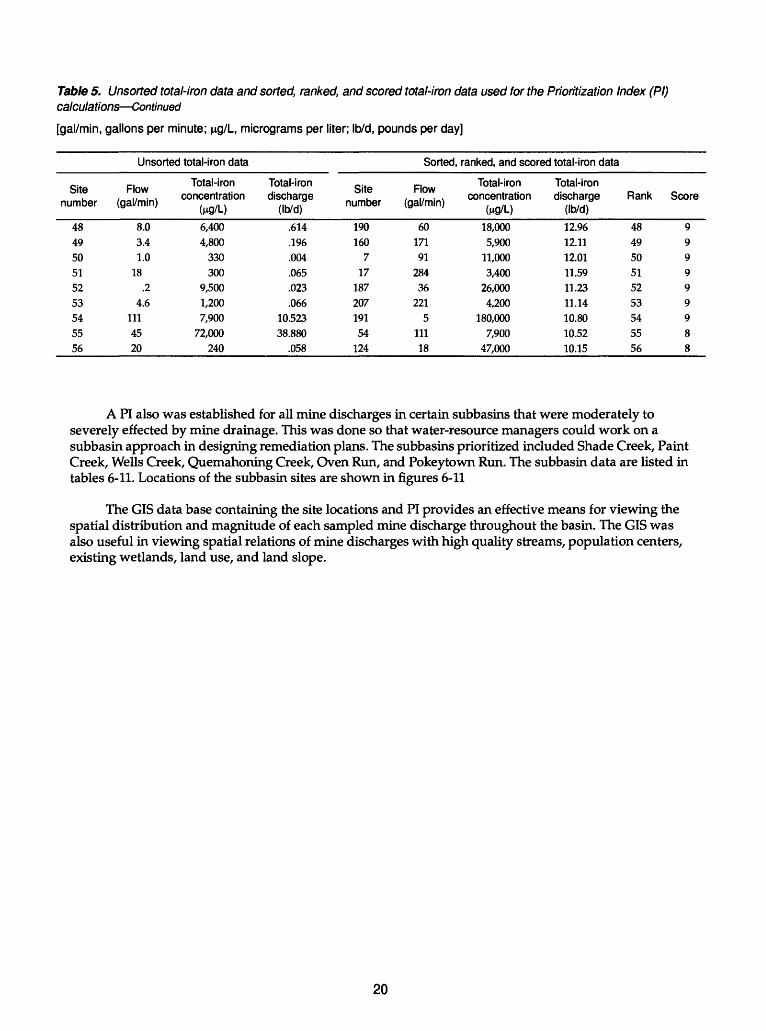
Table 5. Unsorted total-iron data and sorted, ranked, and scored total-iron data used for the Prioritization Index (PI) calculations Continued
[gal/min, gallons per minute; ng/L, micrograms per liter; Ib/d, pounds per day]
Unsorted total-iron data
Site number
484950515253545556
Flow (gal/min)
8.03.41.0
18.2
4.61114520
Total-iron concentration
(ng/L)6,4004,800
330300
9,5001,2007,900
72,000240
Total-iron discharge
(Ib/d)
.614
.196
.004
.065
.023
.06610.52338.880
.058
Site number
190160
717
18720719154
124
Sorted,
Flow (gal/min)
6017191
28436
2215
11118
, ranked, and scored total-iron data
Total-iron concentration
(ng/L)18,0005,900
11,0003,400
26,0004,200
180,0007,900
47,000
Total-iron discharge
(Ib/d)
12.9612.1112.0111.5911.2311.1410.8010.5210.15
Rank
484950515253545556
Score
999999988
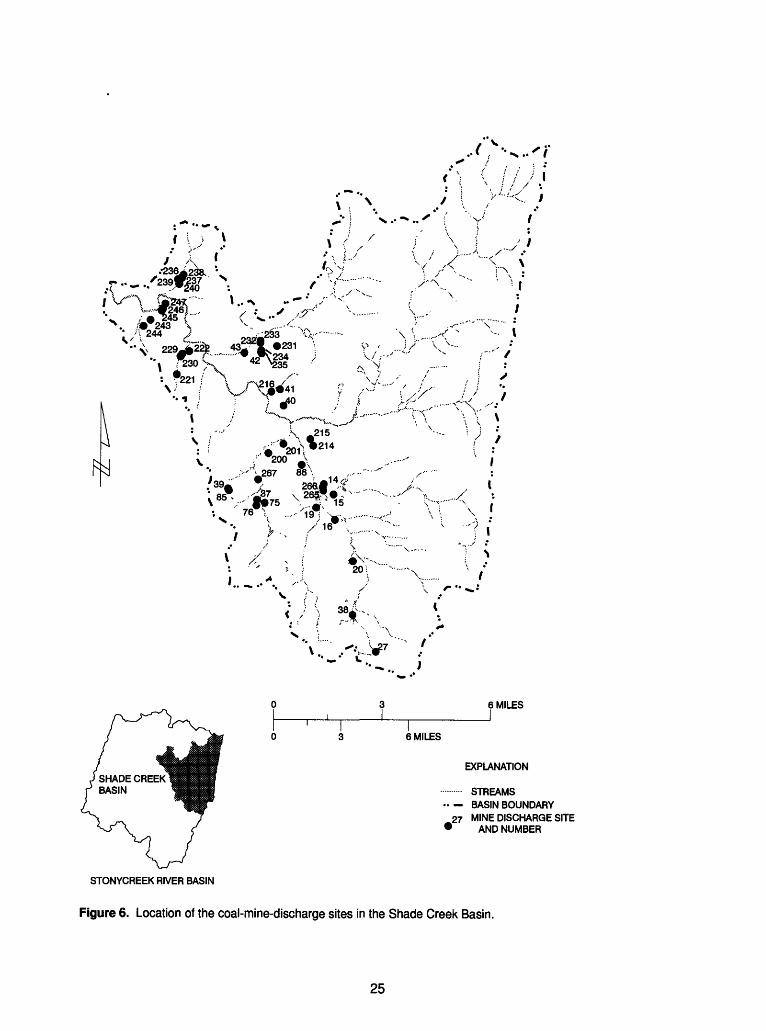
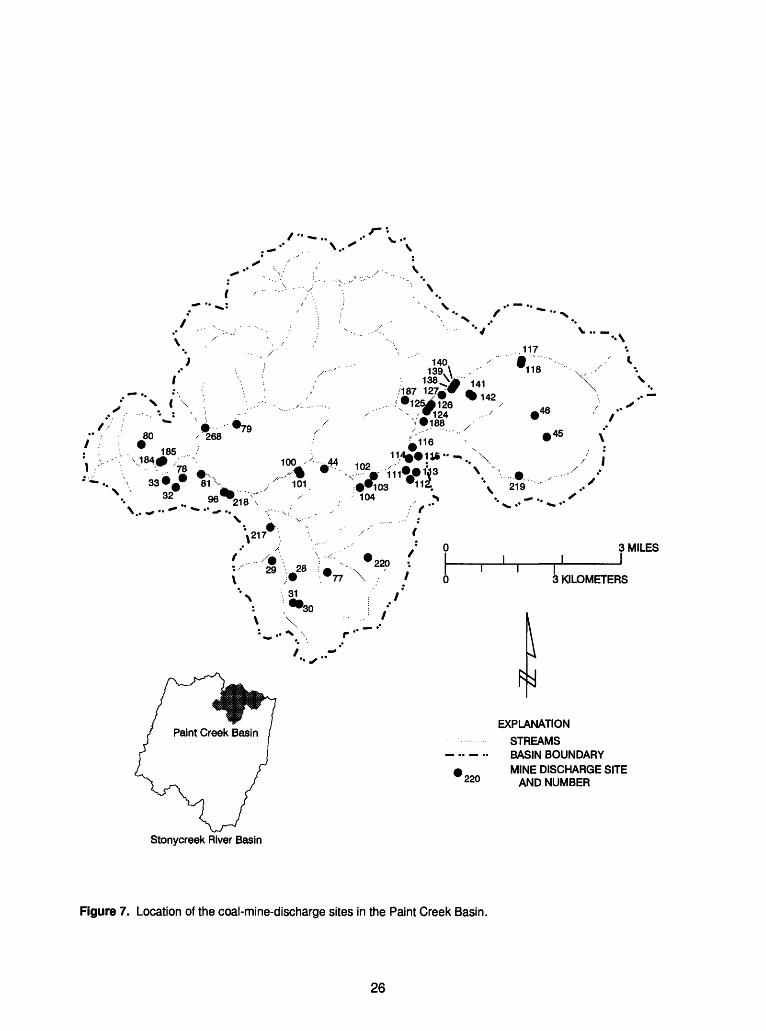
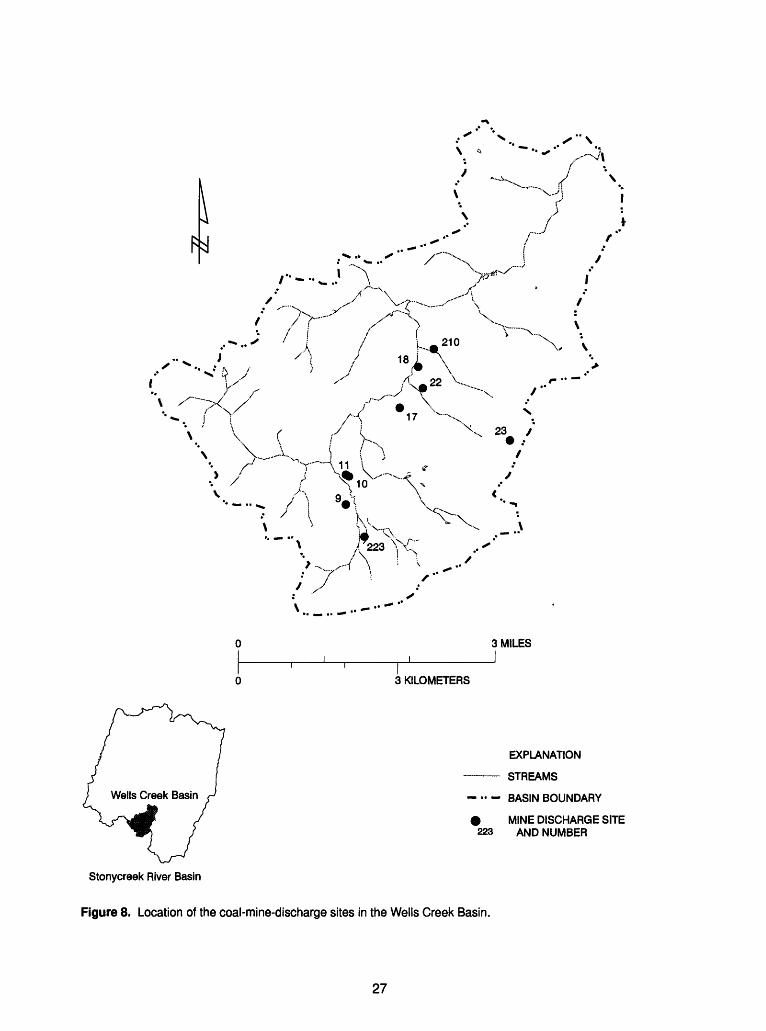
A PI also was established for all mine discharges in certain subbasins that were moderately to severely effected by mine drainage. This was done so that water-resource managers could work on a subbasin approach in designing remediation plans. The subbasins prioritized included Shade Creek, Paint Creek, Wells Creek, Quemahoning Creek, Oven Run, and Pokeytown Run. The subbasin data are listed in tables 6-11. Locations of the subbasin sites are shown in figures 6-11
The GIS data base containing the site locations and PI provides an effective means for viewing the spatial distribution and magnitude of each sampled mine discharge throughout the basin. The GIS was also useful in viewing spatial relations of mine discharges with high quality streams, population centers, existing wetlands, land use, and land slope.
20

Table 6. Prioritization index (PI) for coal-mine discharges in the Shade Creek Basin
[gal/min, gallon per minute; Ib/d, pound per day; <, less than]
Site number
1619151438424076
221231
2075
234236
41215214232247235216
392333727
22923023843
245200265
86243
85246201237244266267239222240
PH (units)
3.35.1
3.63.63.03.13.13.43.23.42.43.33.55.45.53.03.12.76.63.75.56.22.73.63.06.26.15.33.56.04.66.36.66.34.66.44.23.66.36.86.66.05.65.8
Iron, total (Ib/d
as Fe)1,700
87669.18.44
61.82.334.327.142.09
.9239.9
1.983.22
.028.42
.35
.131.08
.39
.066.27
.62
.49
.09
.36
.63
.35
.01
.16
.03
.021.04.07.19.06
<.01<.01
.12
.01
.06
.07
.05<.01
.01
Acidity, total heated
(Ib/d as CaCO3)6,750158025684441486.4
14852.947.562.2
16528.813.825.913.09.468.356.58<.015.699.65<.014.032.945.04<.01<.014.03
.83<.012.16
.46<.01<.01
.33<.01
.50
.20<.01<.01<.01
.02<.01
.03
Sulfate, total
(Ib/d as S04)
29,70010,300
1,1307,000
796562378239612478227176104421
52.953.463.429.6
6756.7
39.415920.421.210.697.925.1
1192.16
67.712.66.91
15.112.38.40
32.32.111.736.344.61
.02
.114.18
.98
Aluminum, dissolved
(Ib/d asAI)486
25.618.493.038.4
6.0512.64.123.313.281.341.22
.10
.39
.01
.38
.85
.02
.10
.18
.01
.08
.05
.19
.50
.04
.01
.04
.05
.02
.05<.01
.01
.01<.01<.01
.01<.01<.01<.01<.01<.01<.01<.01
Manganese, total (Ib/d
asMn
23285.419.664.2
6.0811.24.861.341.735.76
.501.221.14
.39
.44
.58
.29
.36
.68
.71
.33
.46
.28
.25
.14
.11
.17
.01
.06
.02
.05
.08
.05<.01
.08
.01
.01<.01<.0l<.01
.01<.01<.01<.01
Discharge, instantaneous
(gal/min)
22501780
96799
783675356048
.730
7.945
97.3
121.3
677.96.7
6316.81
247.2
14.5
127.51.297.92.53.91.6
.24.8
.8
.4
.11.2
.2
Final score
50505049494544444343424038343434333231313130292828272322222121211717171414131110101099
PI
123456789
1011121314151617181920212223242526272829303132333435363738394041424344
21
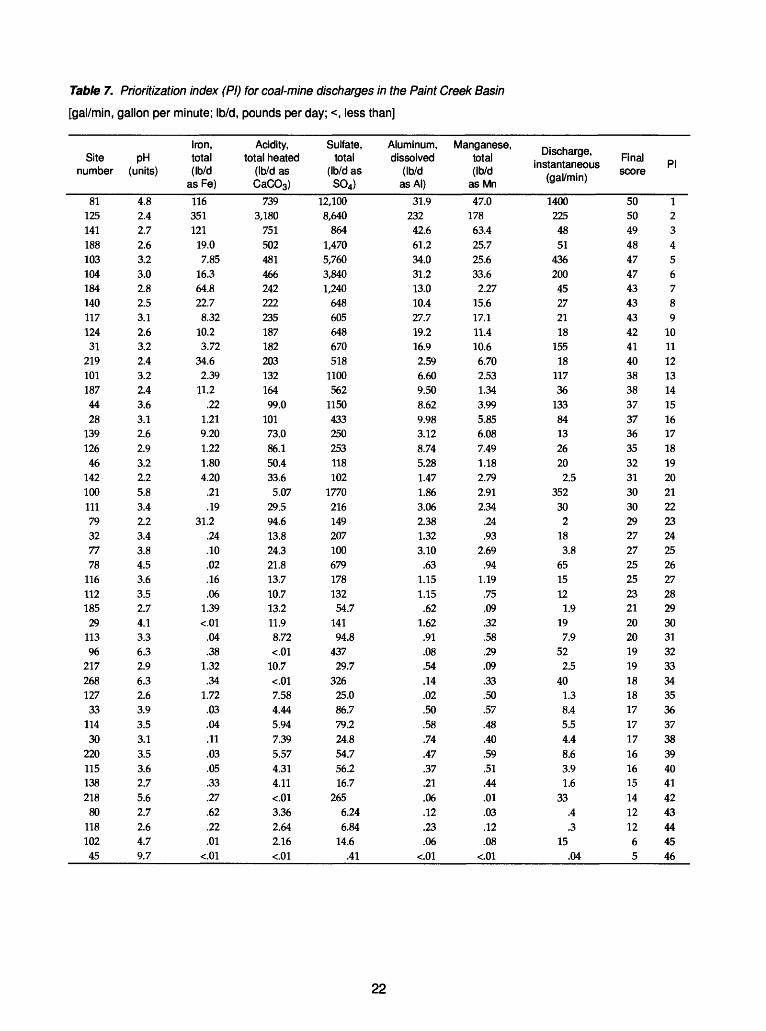
Table 7. Prioritization index (PI) for coal-mine discharges in the Paint Creek Basin
[gal/min, gallon per minute; Ib/d, pounds per day; <, less than]
Site number
8112514118810310418414011712431
2191011874428
13912646
14210011179327778
11611218529
11396
21726812733
11430
220115138218
8011810245
PH (units)
4.82.42.72.63.23.02.82.53.12.63.22.43.22.43.63.12.62.93.22.25.83.42.23.43.84.53.63.52.74.13.36.32.96.32.63.93.53.13.53.62.75.62.72.64.79.7
Iron, total (Ib/d
asFe)116351121
19.07.85
16.364.822.7
8.3210.23.72
34.62.39
11.2.22
1.219.201.221.804.20
.21
.1931.2
.24
.10
.02
.16
.061.39<.01
.04
.381.32
.341.72.03.04.11.03.05.33.27.62.22.01
<.01
Acidity, total heated
(Ib/d as CaC03)
7393,180
75150248146624222223518718220313216499.0
10173.086.150.433.65.07
29.594.613.824.321.813.710.713.211.98.72<.01
10.7<.017.584.445.947.395.574.314.11<.013.362.642.16<.01
Sulfate, total
(Ib/d as S04)
12,1008,640
8641,4705,7603,8401,240
648605648670518
1100562
1150433250253118102
177021614920710067917813254.7
14194.8
43729.7
32625.086.779.224.854.756.216.7
2656.246.84
14.6.41
Aluminum, dissolved
(Ib/d asAI)
31.9232
42.661.234.031.213.010.427.719.216.92.596.609.508.629.983.128.745.281.471.863.062.381.323.10
.631.151.15
.621.62
.91
.08
.54
.14
.02
.50
.58
.74
.47
.37
.21
.06
.12
.23
.06<.01
Manganese, total (Ib/d
asMn47.0
17863.425.725.633.62.27
15.617.111.410.66.702.531.343.995.856.087.491.182.792.912.34
.24
.932.69
.941.19
.75
.09
.32
.58
.29
.09
.33
.50
.57
.48
.40
.59
.51
.44
.01
.03
.12
.08<.01
Discharge, instantaneous
(gal/min)
14002254851
43620045272118
15518
11736
13384132620
2.5352
302
183.8
651512
1.9197.9
522.5
401.38.45.54.48.63.91.6
33.4.3
15.04
Rnal score
5050494847474343434241403838373736353231303029272725252321202019191818171717161615141212
65
PI
123456789
10111213141516171819202122232425262728293031323334353637383940414243444546
22

Table 8. Prioritization index (PI) for coal-mine discharges in the Wells Creek Basin
[gal/min, gallon per minute; Ib/d, pounds per day; <, less than]
Site number
2217101121023223
9
18
Table 9.
[gal/min,
Site number
208
176
172
173
259
174
175
209
48
258
54
53
171
47
183
92
182
52
256
257
PH (units)
3.03.33.54.4
5.8
3.4
5.6
6.1
6.4
Iron, total (Ib/d
as Fe)
80.611.61.109.47
9.43
.04
.75
3.06
.87
Acidity, total heated
(Ib/d as CaCO3)
53819835.132.6
<.01
14.4
1.74
<.01
<.01
Sulfate, total
(Ib/d as S04)
2,020
1,260
571
588
524
51.8
78.0
30.6
31.7
Aluminum, dissolved
(Ib/d asAI)
25.5
17.0
2.78
1.31
.35
1.58
.06
.01
.01
Manganese, total (Ib/d
asMn
20.26.48
1332.61
5.35
1.30
.90
.21
.11
Discharge, instantaneous
(gal/min)
224284122
136
97
12
25
6.7
11
Final score
49443835
29
24
21
17
13
PI
1
2
3
4
5
6
7
8
9
Prioritization index (PI) for coal-mine discharges in the Quemahoning Creek Basin
gallon per minute; Ib/d,
PH (units)
6.2
5.9
2.8
6.2
6.3
5.0
3.2
3.5
4.5
3.8
6.7
3.6
6.6
3.2
4.2
5.8
5.2
3.8
5.8
6.9
Iron, total (Ib/d
as Fe)
16.6
436
2.38
192
1.87
16.2
2.22
6.68
.61
1.51
10.5
.07
.79
.73
.05
.02
.18
.02
<.01
<.01
pounds per day; <, less than]
Acidity, total heated
(Ib/d as CaCO3)
3,050
642
93.6
<.01
<.01
30.6
7.20
<.01
4.80
6.42
<.01
3.97
<.01
3.69
1.44
.24
.20
.12
.05
<.01
Sulfate, total
(Ib/d as S04)
5,830
1,780
342
4,570
4,580
83.7
28.8
230
53.8
38.4
129
28.2
124
14.8
7.56
22.4
1.44
1.32
.30
4.09
Aluminum, dissolved
(Ib/d asAI)
539
.40
8.64
1.13
1.35
.07
.32
.15
.27
.21
.19
.43
.11
.17
.14
<.01
<.01
<.01
<.01
<.01
Manganese, total (Ib/d
asMn
58.3
24.2
5.04
24.8
1.98
1.17
.66
.92
.87
.33
.84
.04
.42
.27
.10
.02
.03
<.01
<.01
<.01
Discharge, instantaneous
(gal/min)
374
330
30
470
867
7.5
5
64
8
3.3
111
4.6
69
1.6
3
1.7
1
.2
.8
1.1
Final score
49
46
43
41
35
35
33
31
31
30
28
25
23
23
20
16
15
11
8
7
PI
1
2
3
4
5
6
7
8
9
10
11
12
13
14
15
16
17
18
19
20
23
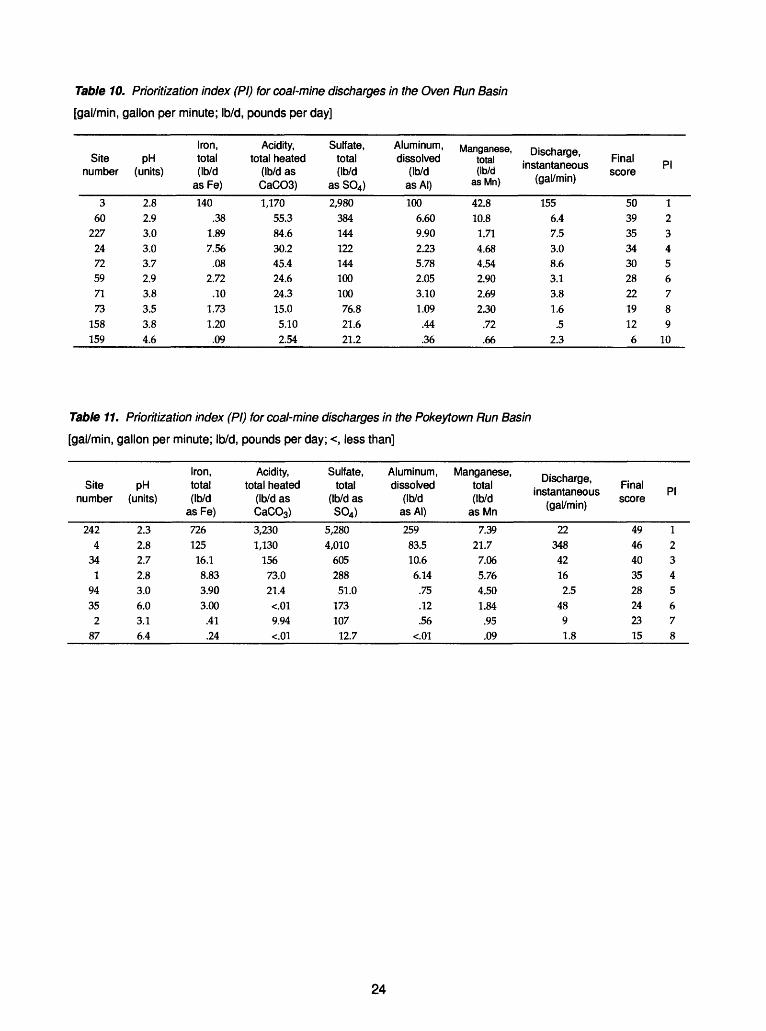
Table 10. Prioritization index (PI) for coal-mine discharges in the Oven Run Basin
[gal/min, gallon per minute; Ib/d, pounds per day]
Site number
360
22724
72
59
71
73
158
159
pH (units)
2.8
2.9
3.0
3.0
3.7
2.9
3.8
3.5
3.8
4.6
Iron, total (Ib/d
asFe)
140.38
1.897.56
.08
2.72
.10
1.73
1.20
.09
Acidity, total heated
(Ib/d as CaC03)
1,17055.384.630.2
45.4
24.6
24.3
15.0
5.10
2.54
Sulfate, total (Ib/d
as S04)
2,980384144122
144
100
100
76.8
21.6
21.2
Aluminum, dissolved
(Ib/d asAI)
1006.609.902.23
5.78
2.05
3.10
1.09
.44
.36
Manganese, total (Ib/d
as Mn)
42.8
10.8
1.71
4.68
4.54
2.90
2.69
2.30
.72
.66
Discharge, instantaneous
(gal/min)
1556.47.5
3.0
8.6
3.1
3.8
1.6
.5
2.3
Final score
503935343028221912
6
PI
1
2
3
4
5
6
7
8
9
10
Table 11. Prioritization index (PI) for coal-mine discharges in the Pokeytown Run Basin
[gal/min, gallon per minute; Ib/d, pounds per day; <, less than]
Site number
2424
34
1
94
35
2
87
pH (units)
2.3
2.8
2.7
2.8
3.0
6.0
3.1
6.4
Iron, total (Ib/d
asFe)
726125
16.1
8.83
3.90
3.00
.41
.24
Acidity, total heated
(Ib/d as CaC03)
3,2301,130
15673.021.4
<.01
9.94
<.01
Sulfate, total
(Ib/d as S04)
5,280
4,010
605
288
51.0
173
107
12.7
Aluminum, dissolved
(Ib/d asAI)
25983.510.66.14
.75
.12
.56
<.01
Manganese, total (Ib/d
asMn
7.39
21.7
7.06
5.76
4.50
1.84
.95
.09
Discharge, instantaneous
(gal/min)
22348
42
16
2.5
48
9
1.8
Final score
4946
40
35
28
24
23
15
PI
1
2
3
4
5
6
7
8
24
. 236^2k ''.
N
&
; ' J...^x~
V ,/"""<" <'
.s :\
SMILES
SMILES
EXPLANATION
STREAMS BASIN BOUNDARY 27 MINE DISCHARGE SITE
> AND NUMBER
STONYCREEK RIVER BASIN
Figure 6. Location of the coal-mine-discharge sites in the Shade Creek Basin.
25
/ *...
" %
V .. _
SMILES
EXPLANATION
STREAMS - BASIN BOUNDARY
MINE DISCHARGE SITE 220 AND NUMBER
Stonycreek River Basin
Figure 7. Location of the coal-mine-discharge sites in the Paint Creek Basin.
26
\ *'
-* . X
/I L - 210
/ 18 \
I /*
V
v
17 x-
sv% V'-\^ \10 V
« L \
SMILES
3 KILOMETERS
EXPLANATION
STREAMS
- - BASIN BOUNDARY
MINE DISCHARGE SITE 223 AND NUMBER
Stonycreek River Basin
Figure 8. Location of the coal-mine-discharge sites in the Wells Creek Basin.
27
N
1 ??, » " y -x\ U^JH l><:- " "-' % ">t ?&, ^ : / .., ?
i» . '" . I'*..; Vtt * .^* .,*' *
f I "T^vft" ' } s "" :\ : ' ./-^f-vix }"* \\ \ : ' 1--^%.. ,,. / . ' -- v,. S. , . : -^^ y4-TA " :..^\.. H !\A- \ /'-^N.^ 74 y
I s ,-^'x -- , : / , \ ; 17=^ / * "' Xs X^ 1 / f=;< ,J1
\ ** r .. ' f ....'^.. \ / .' > '; {' ../ VX'^ Xi>V f
"\. / >'"' :. \f i A .*' / ?\ /
V " ;-.....----..x \ '"i : ..... ^ / ':xt^ ^ ^.. % /"
^ . -.../"" v, , \ .. J53 V"' x- * /\.,X-----"x....,.-\^ ; - ^ ^ :'-: v^;;/ V ^ CO } ^
/ ..X---.---X x.-x,w../ ,»y x \ ' "" ) ""'^^ x ' 1454 >i .... K ^":: </'""-J
' ^ ^-,\X V ,. >-A 209^ / x * * s \ ' 'x\ f : - ( i"-x.-«<; /
. :-»:.... .. '' ' V .-i 1. . ""'"';: ,. * ;>-..- )---f' v^ ' : f \x /
» / ' .. * ''\
^ ^x..., . /- s ;rV^l x J "/""0 <:..} jyv^" °
QUEMAHONING^ CREEKBASIN /
^ $*vK ^^ /
:. Y -f ^
VI. )N fe\- :/ ""NJ:--1^-^/-^ /'
\ f ^ ' \ - ''~'* ^/^-. >--<7- / J *" ' -'"
3 6 MILES 1 1
1 6 KILOMETERS
EXPLANATION
STREAMS
_.. _ BASIN BOUNDARY
MINE-DISCHARGE SITE 208 AND NUMBER
STONYCREEK RIVER BASIN
Figure 9. Location of the coal-mine-discharge sites in the Quemahoning Creek Basin.
28
! *eo
f" *«59: 24| C 0 159
\ TS
71 72
\.. ^
1MILE
1 KILOMETER
EXPLANATION
STREAMS
- - BASIN BOUNDARY
MINE DISCHARGE 72 SITE AND NUMBER
STONYCREEK RIVER BASIN
Figure 10. Location of the coal-mine-discharge sites in the Oven Run Basin.
29
\ 2 % \ *.
\
A 35
8734
I I
/
1 MILE \ \J N -...'»
1 KILOMETER
POKEYTOWN RUN BASIN
STONYCREEKRIVER BASIN
EXPLANATION
STREAMS
- - BASIN BOUNDARY
A 35 MINE DISCHARGE SITE 9 ANDNUMBER
Figure 11. Location of the coal-mine-discharge sites in the Pokeytown Run Basin.
30

Remediation by Passive-Treatment Systems
Within the last decade, passive-treatment systems have developed from an experimental concept to full-scale field implementation at hundreds of sites (Hedin and others, 1994). Passive technologies take advantage of natural chemical and biological processes that improve the quality of contaminated water. Passive-treatment systems use contaminant removal processes that are slower than conventional treatment systems. Passive-treatment systems must retain contaminated mine water long enough to decrease contaminant concentrations to acceptable levels. The retention time for a particular mine discharge is limited by available land area, and therefore, the sizing of passive-treatment systems is a crucial design aspect. Baseline water quality and flow must be known to design AMD-treatment systems properly.
Three principal types of passive technologies are currently in use for the treatment of coal-mine drainage: aerobic wetland systems, wetlands that contain an organic substrate (compost wetlands), and ALD's. In aerobic wetland systems, oxidation reactions occur and metals precipitate primarily as oxides and hydroxides. Most aerobic wetlands contain cattails (Typha latifblia) growing in clay or spoil substrate. Plantless systems also have been constructed and function similarly to those containing plants if the influent water is alkaline. However, it is recommended that plants be included because they may help filter particulates, prevent flow channelization, and benefit wildlife. The water depth in a typical aerobic system is approximately 6 to 18 in.
Compost wetlands are similar to aerobic wetlands in form but also contain a thick layer of organic substrate. This substrate promotes chemical and microbial processes that generate alkalinity and neutralize acidic components of mine drainage. Typical substrates used in compost wetlands include spent mushroom compost, Sphagnum peat, hay bales, and manure.
ALD's are commonly used to treat AMD before it flows into a constructed wetland. The ALD raises the pH of the water to circumneutral levels (pH 6 to 7) and introduces bicarbonate alkalinity that neutralizes the acidity. When water exits the ALD, the circumneutral pH level promotes metal precipitation (Hedin and Narin, 1993). The limestone and mine water in an ALD are kept anoxic by sealing the drain to atmospheric oxygen to avoid armoring of the limestone with ferric hydroxide.
Each of the three passive technologies is most appropriate for a particular type of mine-water problem, but commonly, they are most effectively used in combination with each other. Examples are shown in figures 12 and 13. A passive-treatment system in which three ALD's, a constructed wetland, and two limestone cells are used in series to treat mine drainage from reclaimed surface mine spoils that were approximately 10 years old is shown in figure 12. This passive-treatment system is at an experimental site of the U.S. Bureau of Mines in the Shade Creek Basin, a subbasin of the Stonycreek River Basin. Kepler and McCleary (1994) have conducted research on a system called a successive alkalinity-producing system (SAPS) that combines ALD technology with the sulfate reduction mechanism of the compost wetland. A typical cross-sectional view of a SAPS treatment component is shown in figure 13. This system can be used to treat mine drainage that is extremely acidic (acidity concentration greater than 300 mg/L as CaCOa) and has high concentrations of ferric iron (concentrations greater than 1.0 mg/L). A series of SAPS is commonly utilized until the AMD either meets effluent criteria or the quality of the AMD improves to the degree proportional to the area available for treatment. Passive treatment technology is still evolving and developing as researchers continue to work on perfecting these treatment systems. Although the effluent from these treatment systems at abandoned mine sites may not meet compliance standards, passive treatment may provide the only practical means of improving the quality of the mine discharge. Hedin and Narin (1992) provide an extensive listing of passive-treatment literature for water-resource managers who may be involved in the passive treatment of contaminated mine discharges.
31
ANOXIC UMESTONE DRAINS
NOT TO SCALE
Figure 12. Layout of the Shade passive-treatment system in the Stonycreek River Basin (Modification from Narin and others, 1991).
FLUME
Figure 13. A typical cross-sectional view of a successive alkalinity-producing system treatment component (Kepler and McCleary, 1994, p. 198).
MPERMEABLE BARR.ER
32
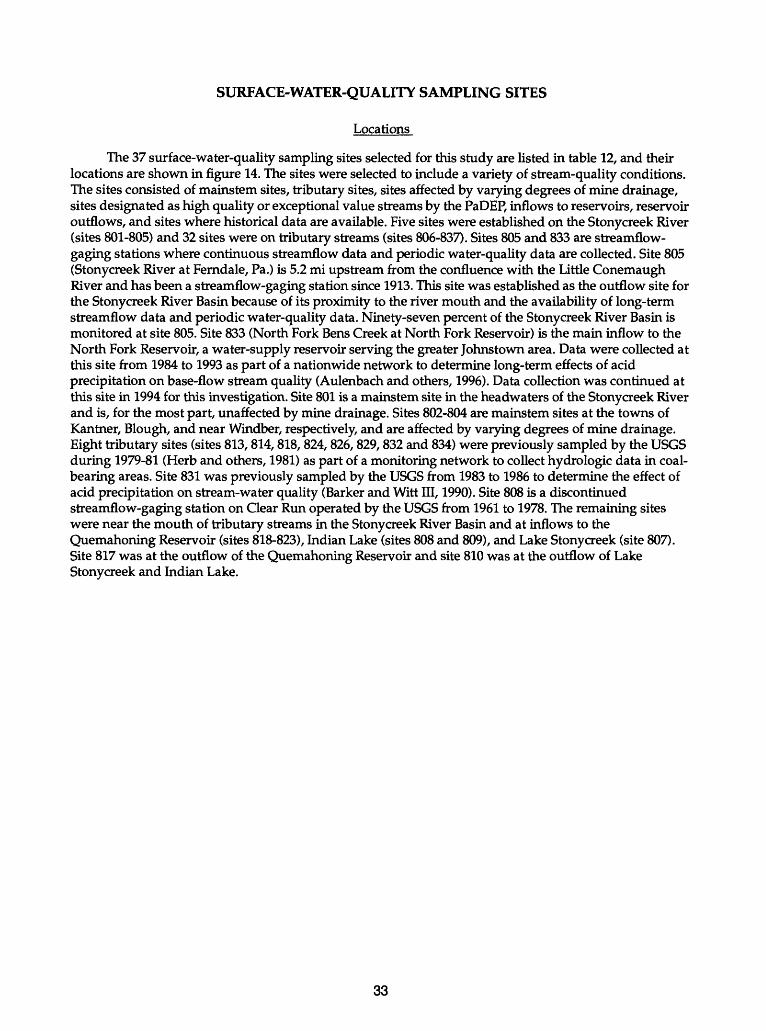
SURFACE-WATER-QUALITY SAMPLING SITES
Locations
The 37 surface-water-quality sampling sites selected for this study are listed in table 12, and their locations are shown in figure 14. The sites were selected to include a variety of stream-quality conditions. The sites consisted of mainstem sites, tributary sites, sites affected by varying degrees of mine drainage, sites designated as high quality or exceptional value streams by the PaDEP, inflows to reservoirs, reservoir outflows, and sites where historical data are available. Five sites were established on the Stonycreek River (sites 801-805) and 32 sites were on tributary streams (sites 806-837). Sites 805 and 833 are streamflow- gaging stations where continuous streamflow data and periodic water-quality data are collected. Site 805 (Stonycreek River at Ferndale, Pa.) is 5.2 mi upstream from the confluence with the Little Conemaugh River and has been a streamflow-gaging station since 1913. This site was established as the outflow site for the Stonycreek River Basin because of its proximity to the river mouth and the availability of long-term streamflow data and periodic water-quality data. Ninety-seven percent of the Stonycreek River Basin is monitored at site 805. Site 833 (North Fork Bens Creek at North Fork Reservoir) is the main inflow to the North Fork Reservoir, a water-supply reservoir serving the greater Johnstown area. Data were collected at this site from 1984 to 1993 as part of a nationwide network to determine long-term effects of acid precipitation on base-flow stream quality (Aulenbach and others, 1996). Data collection was continued at this site in 1994 for this investigation. Site 801 is a mainstem site in the headwaters of the Stonycreek River and is, for the most part, unaffected by mine drainage. Sites 802-804 are mainstem sites at the towns of Kantner, Blough, and near Windber, respectively, and are affected by varying degrees of mine drainage. Eight tributary sites (sites 813,814,818, 824, 826,829,832 and 834) were previously sampled by the USGS during 1979-81 (Herb and others, 1981) as part of a monitoring network to collect hydrologic data in coal- bearing areas. Site 831 was previously sampled by the USGS from 1983 to 1986 to determine the effect of acid precipitation on stream-water quality (Barker and Witt III, 1990). Site 808 is a discontinued streamflow-gaging station on Clear Run operated by the USGS from 1961 to 1978. The remaining sites were near the mouth of tributary streams in the Stonycreek River Basin and at inflows to the Quemahoning Reservoir (sites 818-823), Indian Lake (sites 808 and 809), and Lake Stonycreek (site 807). Site 817 was at the outflow of the Quemahoning Reservoir and site 810 was at the outflow of Lake Stonycreek and Indian Lake.
33
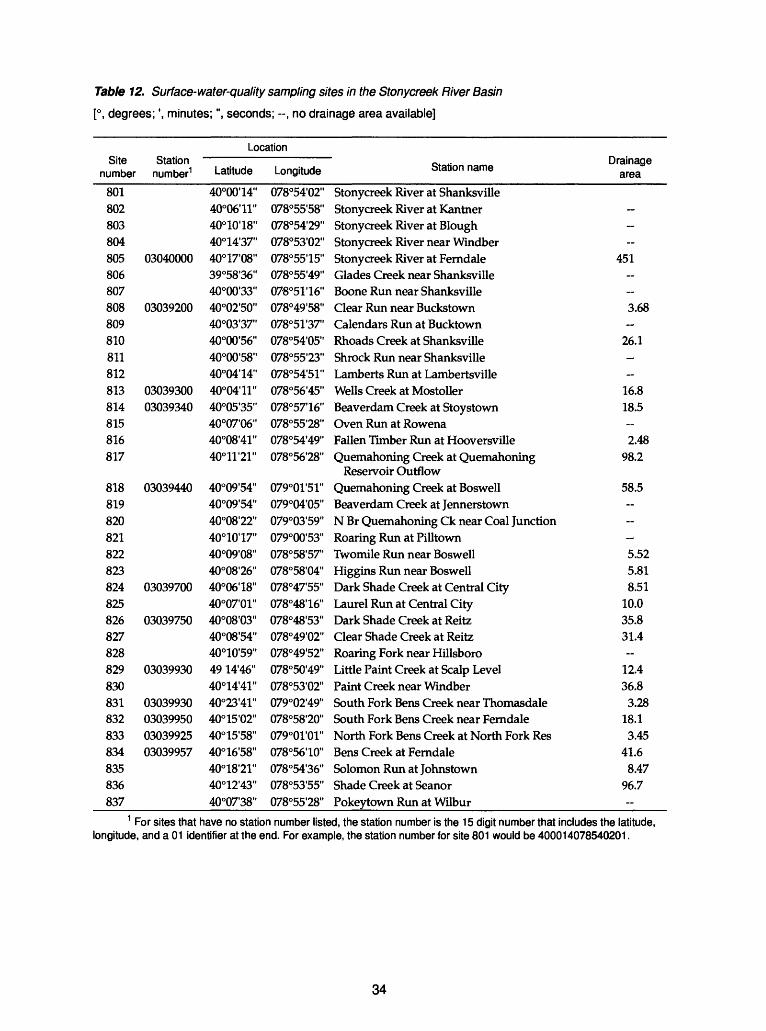
Table 12. Surface-water-quality sampling sites in the Stonycreek River Basin
[°, degrees;', minutes;", seconds; -, no drainage area available]
Site number
801802803804805806807808809810811812813814815816817
818819820821822823824825826827828829830831832833834835836837
Station number1
03040000
03039200
0303930003039340
03039440
03039700
03039750
03039930
03039930030399500303992503039957
Location
Latitude40000'14"40006'11"40°10'18"40°14'37"40°171 08"39°58'36"40°00'33"40°02'50"40°03'37"40°00'56"40°00 1 58"40°04'14"40°04'11"40°05'35"40°07'06"40°08'41"40°11'21"
40°09'54"40°09'54"40°08'22"40°10'17"40°09'08"40°08'26"40°06'18"40°07'01"40°08'03"40°08'541140°10'59"
49 14'46"40°14'41"40°23'4r'40°15'02"40°15'58"400 16'58"40°18'21"40°12'43"40°07'38"
Longitude078°54'02"078°55'58"078°54'29"078°53'02"
078°5515"078°55'49"
07«°5116"078°49'58"078°51'37'078°54105"078°55'23"078°54'51"078°56'45"078°57'16"078°55'28"078°54'49"078°56'28"
079°0r51"079°04'05"079003'59"079°00'53"078058'57"078°58'04"078°47'55"078°48'16"078048'53"078°49'02"078°49'52"078°50'49"078°53'02"079°02'49"078°58'20"079001'0r'078°56'10"078°54'36"078°53'55"078°55'28"
Station name
Stonycreek River at ShanksvilleStonycreek River at KantnerStonycreek River at BloughStonycreek River near WindberStonycreek River at FerndaleGlades Creek near ShanksvilleBoone Run near ShanksvilleClear Run near BuckstownCalendars Run at BucktownRhoads Creek at ShanksvilleShrock Run near ShanksvilleLamberts Run at LambertsvilleWells Creek at MostollerBeaverdam Creek at StoystownOven Run at RowenaFallen Timber Run at HooversvilleQuemahoning Creek at Quemahoning
Reservoir OutflowQuemahoning Creek at BoswellBeaverdam Creek at JennerstownN Br Quemahoning Ck near Coal JunctionRoaring Run at PilltownTwomile Run near BoswellHiggins Run near BoswellDark Shade Creek at Central CityLaurel Run at Central CityDark Shade Creek at ReitzClear Shade Creek at ReitzRoaring Fork near HillsboroLittle Paint Creek at Scalp LevelPaint Creek near WindberSouth Fork Bens Creek near ThomasdaleSouth Fork Bens Creek near FerndaleNorth Fork Bens Creek at North Fork ResBens Creek at FerndaleSolomon Run at JohnstownShade Creek at SeanorPokeytown Run at Wilbur
Drainage area
---
451~
3.68
26.1--
16.818.5-
2.4898.2
58.5---
5.525.818.51
10.035.831.4-
12.436.8
3.2818.13.45
41.68.47
96.7-
1 For sites that have no station number listed, the station number is the 15 digit number that includes the latitude, longitude, and a 01 identifier at the end. For example, the station number for site 801 would be 400014078540201.
34
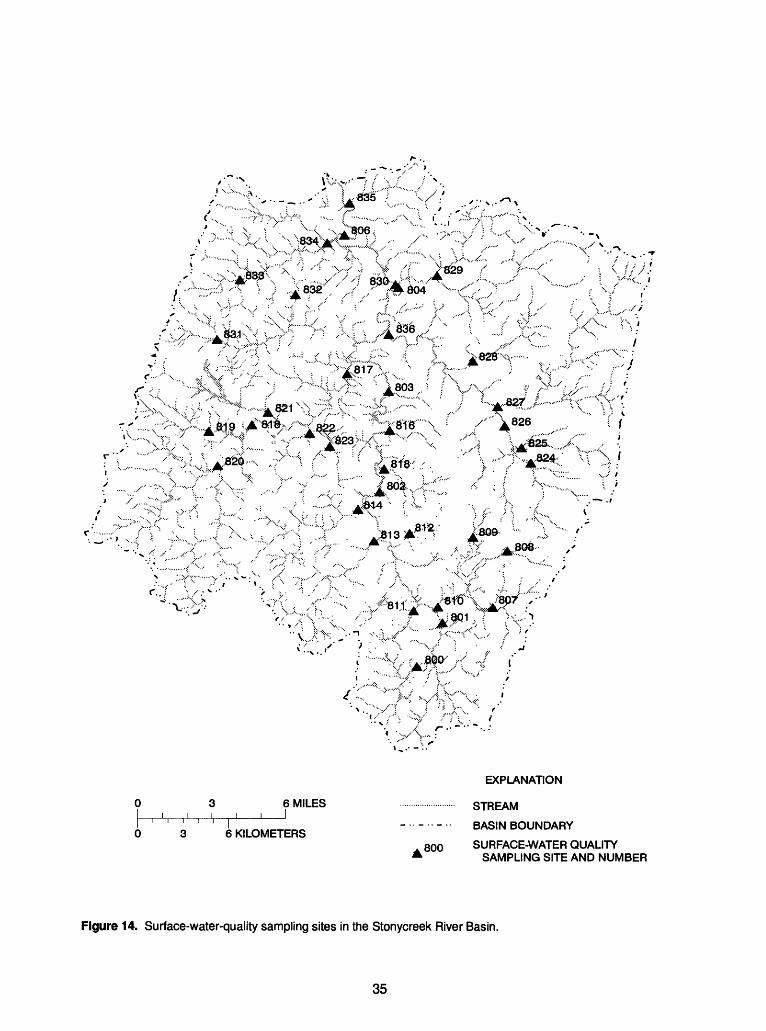
r ;
I'ao&
3 6 MILESj__i__i__i__i__I
i i i i r
3 6 KILOMETERS800
EXPLANATION
STREAM
BASIN BOUNDARY
SURFACE-WATER QUALITY SAMPLING SITE AND NUMBER
Figure 14. Surface-water-quality sampling sites in the Stonycreek River Basin.
35
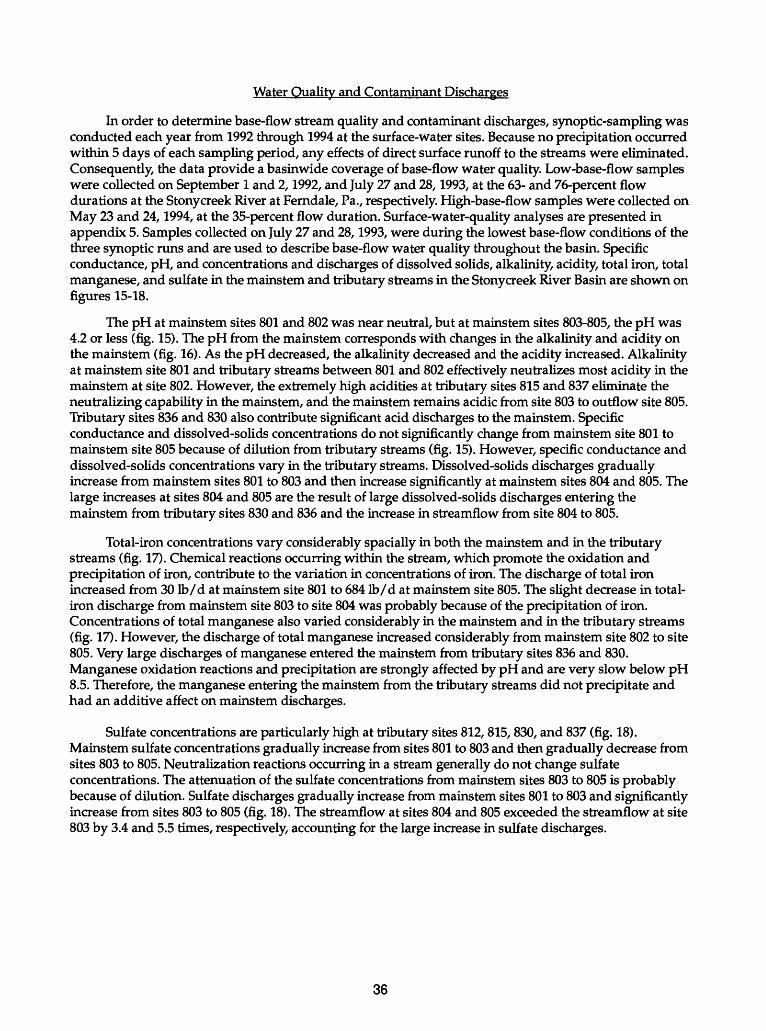
Water Quality and Contaminant Discharges
In order to determine base-flow stream quality and contaminant discharges, synoptic-sampling was conducted each year from 1992 through 1994 at the surface-water sites. Because no precipitation occurred within 5 days of each sampling period, any effects of direct surface runoff to the streams were eliminated. Consequently, the data provide a basinwide coverage of base-flow water quality. Low-base-flow samples were collected on September 1 and 2,1992, and July 27 and 28,1993, at the 63- and 76-percent flow durations at the Stonycreek River at Ferndale, Pa., respectively. High-base-flow samples were collected on May 23 and 24,1994, at the 35-percent flow duration. Surface-water-quality analyses are presented in appendix 5. Samples collected on July 27 and 28,1993, were during the lowest base-flow conditions of the three synoptic runs and are used to describe base-flow water quality throughout the basin. Specific conductance, pH, and concentrations and discharges of dissolved solids, alkalinity, acidity, total iron, total manganese, and sulfate in the mainstem and tributary streams in the Stonycreek River Basin are shown on figures 15-18.
The pH at mainstem sites 801 and 802 was near neutral, but at mainstem sites 803-805, the pH was 4.2 or less (fig. 15). The pH from the mainstem corresponds with changes in the alkalinity and acidity on the mainstem (fig. 16). As the pH decreased, the alkalinity decreased and the acidity increased. Alkalinity at mainstem site 801 and tributary streams between 801 and 802 effectively neutralizes most acidity in the mainstem at site 802. However, the extremely high acidities at tributary sites 815 and 837 eliminate the neutralizing capability in the mainstem, and the mainstem remains acidic from site 803 to outflow site 805. Tributary sites 836 and 830 also contribute significant acid discharges to the mainstem. Specific conductance and dissolved-solids concentrations do not significantly change from mainstem site 801 to mainstem site 805 because of dilution from tributary streams (fig. 15). However, specific conductance and dissolved-solids concentrations vary in the tributary streams. Dissolved-solids discharges gradually increase from mainstem sites 801 to 803 and then increase significantly at mainstem sites 804 and 805. The large increases at sites 804 and 805 are the result of large dissolved-solids discharges entering the mainstem from tributary sites 830 and 836 and the increase in streamflow from site 804 to 805.
Total-iron concentrations vary considerably spacially in both the mainstem and in the tributary streams (fig. 17). Chemical reactions occurring within the stream, which promote the oxidation and precipitation of iron, contribute to the variation in concentrations of iron. The discharge of total iron increased from 30 Ib/d at mainstem site 801 to 684 Ib/d at mainstem site 805. The slight decrease in total- iron discharge from mainstem site 803 to site 804 was probably because of the precipitation of iron. Concentrations of total manganese also varied considerably in the mainstem and in the tributary streams (fig. 17). However, the discharge of total manganese increased considerably from mainstem site 802 to site 805. Very large discharges of manganese entered the mainstem from tributary sites 836 and 830. Manganese oxidation reactions and precipitation are strongly affected by pH and are very slow below pH 8.5. Therefore, the manganese entering the mainstem from the tributary streams did not precipitate and had an additive affect on mainstem discharges.
Sulfate concentrations are particularly high at tributary sites 812, 815, 830, and 837 (fig. 18). Mainstem sulfate concentrations gradually increase from sites 801 to 803 and then gradually decrease from sites 803 to 805. Neutralization reactions occurring in a stream generally do not change sulfate concentrations. The attenuation of the sulfate concentrations from mainstem sites 803 to 805 is probably because of dilution. Sulfate discharges gradually increase from mainstem sites 801 to 803 and significantly increase from sites 803 to 805 (fig. 18). The streamflow at sites 804 and 805 exceeded the streamflow at site 803 by 3.4 and 5.5 times, respectively, accounting for the large increase in sulfate discharges.
36
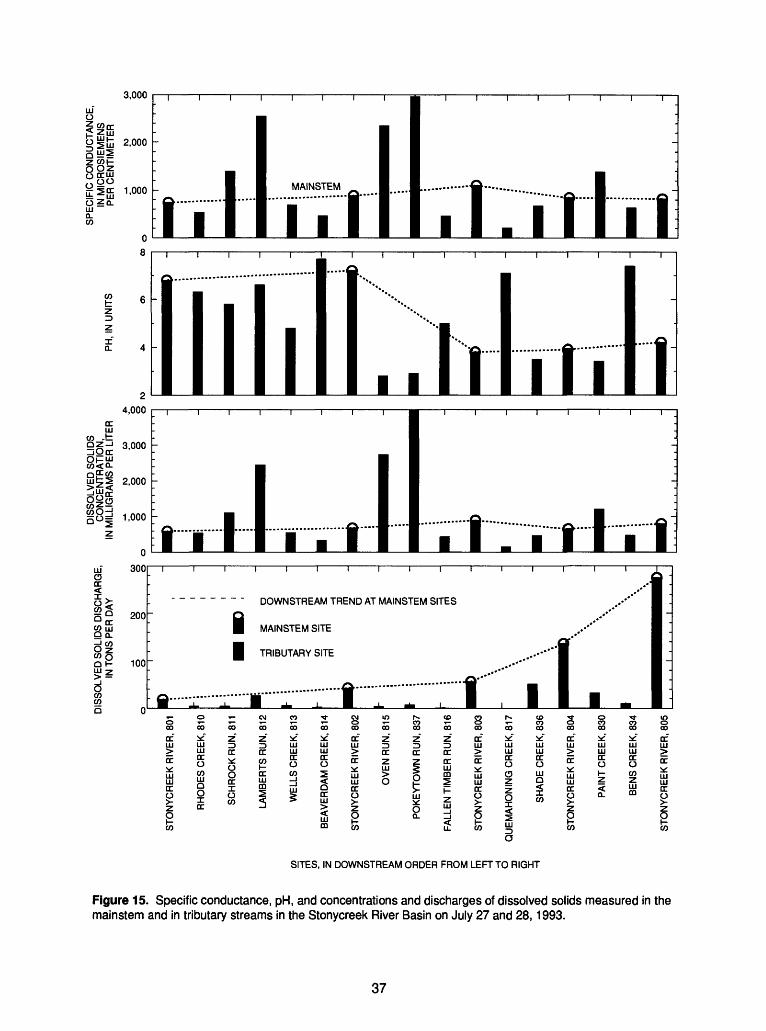
3,000
2,000 -
1,000 -O ZUJo-CO
11 1 1
1 1 1
MAINSTEM
III , 1 .Trim
co -t Z-J
2
4,000
3,000
2,000
§8j 1.000
C0<0-
COQQH
0
300
200
100
riHrvt tiiilil\ i i r i i
DOWNSTREAM TREND AT MAINSTEM SITES
MAINSTEM SITE
TRIBUTARY SITE
I I 1£ 8 oo oo
SITES, IN DOWNSTREAM ORDER FROM LEFT TO RIGHT
Figure 15. Specific conductance, pH, and concentrations and discharges of dissolved solids measured in the mainstem and in tributary streams in the Stonycreek River Basin on July 27 and 28,1993.
37
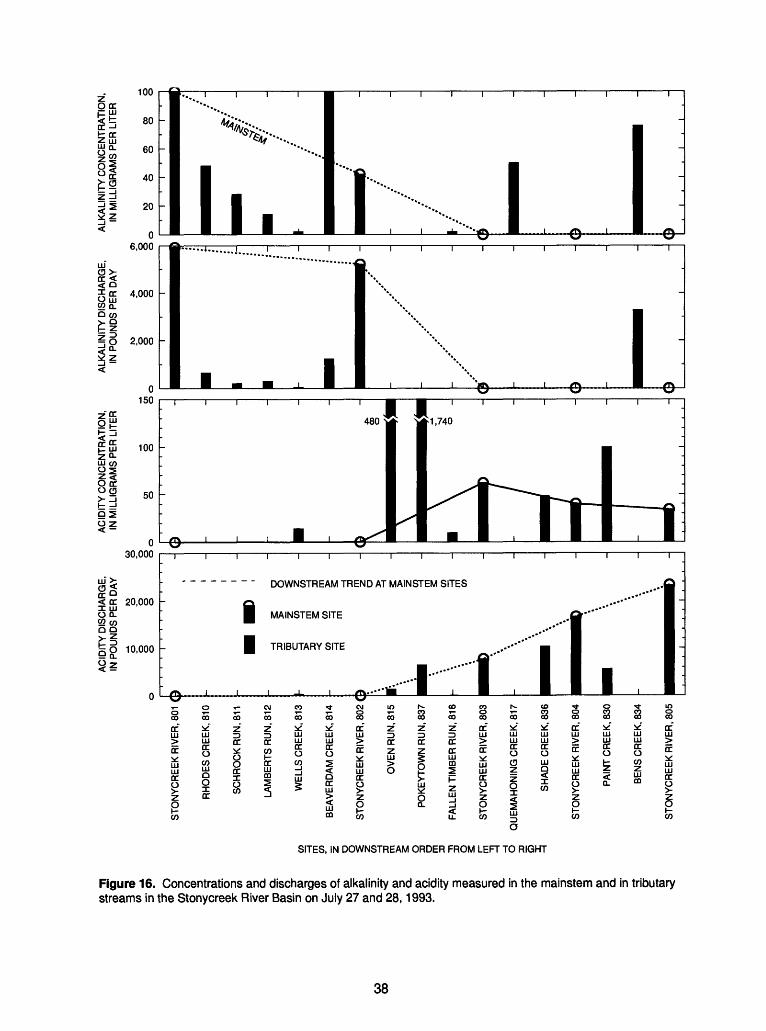
AC
IDIT
Y D
ISC
HA
RG
E,
IN P
OU
ND
S P
ER
DA
YA
CID
ITY
CO
NC
EN
TR
AT
ION
, IN
MIL
LIG
RA
MS
PE
R L
ITE
RA
LKA
LIN
ITY
DIS
CH
AR
GE
, IN
PO
UN
DS
PE
R D
AY
ALK
ALI
NIT
Y C
ON
CE
NT
RA
TIO
N,
IN M
ILLI
GR
AM
S P
ER
LIT
ER
CD 9?3"
CO CD 3
o> 0. I 5>
CO
ST
ON
YC
RE
EK
RIV
ER
, 80
1 (
)
RH
OD
ES
CR
EE
K,
810
SC
HR
OC
KR
UN
.811
LAM
BE
RT
S R
UN
, 81
2
WE
LLS
CR
EE
K,
813
BE
AV
ER
DA
M C
RE
EK
, 81
4
ST
ON
YC
RE
EK
RIV
ER
, 80
2 ( )
OV
EN
RU
N,
815
PO
KE
YT
OW
N R
UN
, 83
7
FA
LLE
N T
IMB
ER
RU
N,
816
ST
ON
YC
RE
EK
RIV
ER
, 80
3
QU
EM
AH
ON
ING
CR
EE
K,
817
SH
AD
E C
RE
EK
, 83
6
ST
ON
YC
RE
EK
RIV
ER
, 80
4
PA
INT
CR
EE
K,
830
BE
NS
CR
EE
K,
834
ST
ON
YC
RE
EK
RIV
ER
, 80
5

cc.UJ
Z K-
10,000
g< 1,000
§1
UJ <CD O CC CC
Q Zn
1001,000
800
600
400
200
8UJ o co o
1,000
100
10800
600
400
200
21,000 i 400,000
I II ,11,470^
T flz- 100,000 t r Ope
10,000
rin i r
DOWNSTREAM TREND AT MAINSTEM SITES
MAINSTEM SITE
TRIBUTARY SITE
«ccUJ>YCREEK Rl
zPCO
CO\£UJUJ
IHODES CR
LL.
CO
Z13CC
SCHROCK
CO
z13CCCO
ccUJm
CO\£UJUJ
WELLS CR
CO\£UJUJ
'ERDAM CR
^>UJm
8cc>YCREEK Rl
zP-CO
00
z13ccUJ
0
8z13cc
KEYTOWN
f\
0-
00
Z13CC
iN TIMBER
3_iu^
§cc>
YCREEK Rl
zP-CO
CO\£UJUJ
HONING CR
3*
5UJ >
3\£UJLU
SHADE CR
§ccUJ>YCREEK Rl
OCO
3\,£
UJUJ
PAINT CR
3\£UJUJ
BENS CR
8ccUJ>YCREEK Rl
zeCO
SITES, IN DOWNSTREAM ORDER FROM LEFT TO RIGHT
Figure 17. Concentrations and discharges of total iron and total manganese measured in the mainstem and in tributary streams in the Stonycreek River Basin on July 27 and 28,1993.
39
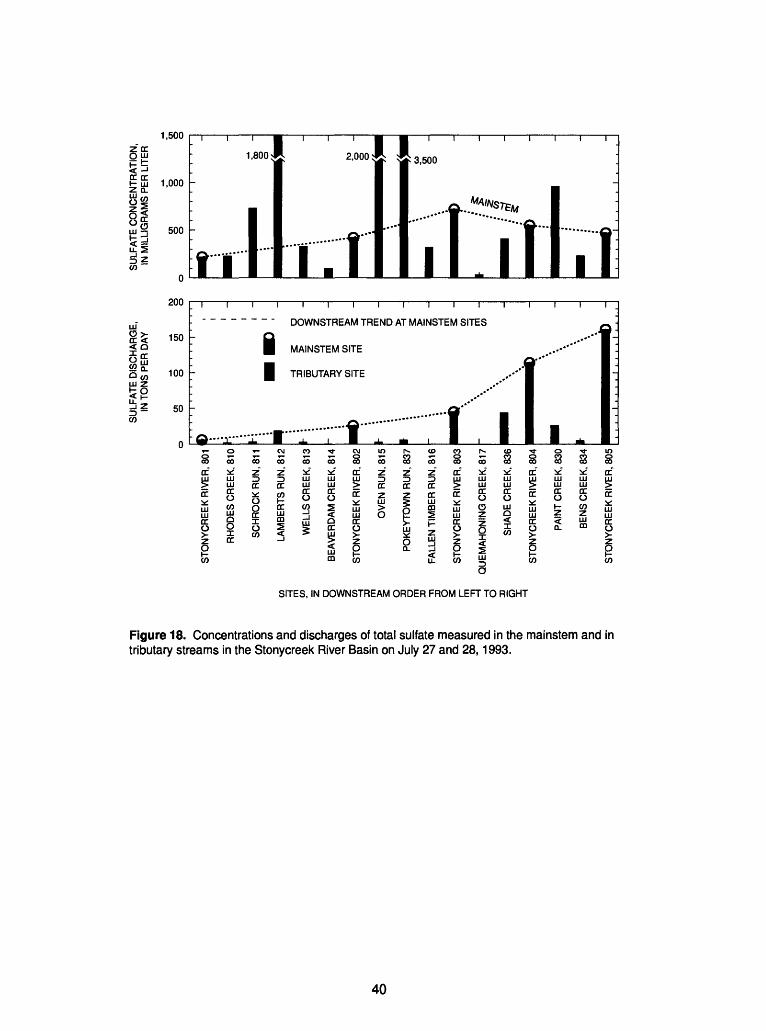
Z CC O LUpt
££3*w o $1 31CO
1,500
1,000
gO
200
1,800;
11
150 -
100 -
50 -
n i
2,000 >l3,500
1 I^'A/sre/^ I
:TT,Ti
Q..
oCO
TONYCREEK RIVER
i i
O i-
00 00
RHODES CREEK SCHROCK RUN
i i
~ ' DOWN
| MAINS
| TRIBU
~r~rCM CO
00 00
LAMBERTS RUN WELLS CREEK
i i i i i
STREAM TREND AT MAINS
TEM SITE
TARY SITE
.......f--------! _L
* CM m,- O i- 00 00 00
EAVERDAM CREEK TONYCREEK RIVER OVEN RUN
szCC
LU
,CO
00
<VLLEN TIMBER RUN
TEME
Is00
TONYCREEK RIVER
i
5ITES
i
00
IMAHONING CREEK
1
1S
SHADE CREEK
To00
TONYCREEK RIVER
1
IoS3
PAINT CREEK
i i
0 .J !
S O 00
BENS CREEK TONYCREEK RIVER
SITES, IN DOWNSTREAM ORDER FROM LEFT TO RIGHT
Figure 18. Concentrations and discharges of total sulfate measured in the mainstem and in tributary streams in the Stonycreek River Basin on July 27 and 28,1993.
40
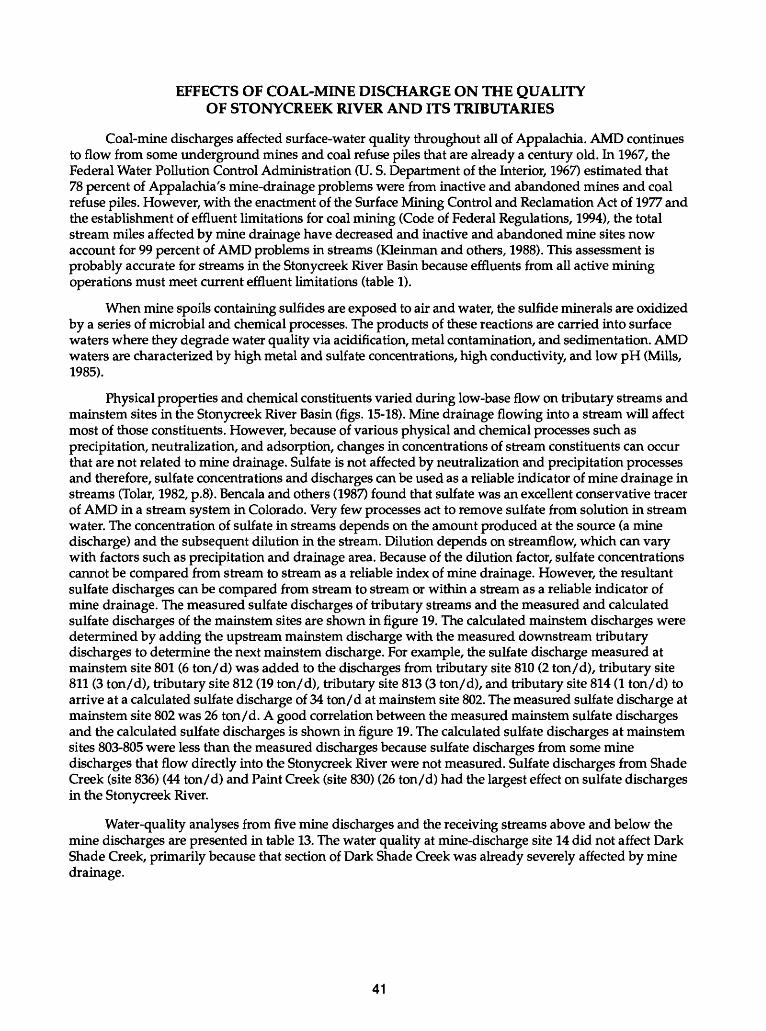
EFFECTS OF COAL-MINE DISCHARGE ON THE QUALITY OF STONYCREEK RIVER AND ITS TRIBUTARIES
Coal-mine discharges affected surface-water quality throughout all of Appalachia. AMD continues to flow from some underground mines and coal refuse piles that are already a century old. In 1967, the Federal Water Pollution Control Administration (U. S. Department of the Interior, 1967) estimated that 78 percent of Appalachia's mine-drainage problems were from inactive and abandoned mines and coal refuse piles. However, with the enactment of the Surface Mining Control and Reclamation Act of 1977 and the establishment of effluent limitations for coal mining (Code of Federal Regulations, 1994), the total stream miles affected by mine drainage have decreased and inactive and abandoned mine sites now account for 99 percent of AMD problems in streams (Kleinman and others, 1988). This assessment is probably accurate for streams in the Stonycreek River Basin because effluents from all active mining operations must meet current effluent limitations (table 1).
When mine spoils containing sulfides are exposed to air and water, the sulfide minerals are oxidized by a series of microbial and chemical processes. The products of these reactions are carried into surface waters where they degrade water quality via acidification, metal contamination, and sedimentation. AMD waters are characterized by high metal and sulfate concentrations, high conductivity, and low pH (Mills, 1985).
Physical properties and chemical constituents varied during low-base flow on tributary streams and mainstem sites in the Stonycreek River Basin (figs. 15-18). Mine drainage flowing into a stream will affect most of those constituents. However, because of various physical and chemical processes such as precipitation, neutralization, and adsorption, changes in concentrations of stream constituents can occur that are not related to mine drainage. Sulfate is not affected by neutralization and precipitation processes and therefore, sulfate concentrations and discharges can be used as a reliable indicator of mine drainage in streams (Tolar, 1982, p.8). Bencala and others (1987) found that sulfate was an excellent conservative tracer of AMD in a stream system in Colorado. Very few processes act to remove sulfate from solution in stream water. The concentration of sulfate in streams depends on the amount produced at the source (a mine discharge) and the subsequent dilution in the stream. Dilution depends on streamflow, which can vary with factors such as precipitation and drainage area. Because of the dilution factor, sulfate concentrations cannot be compared from stream to stream as a reliable index of mine drainage. However, the resultant sulfate discharges can be compared from stream to stream or within a stream as a reliable indicator of mine drainage. The measured sulfate discharges of tributary streams and the measured and calculated sulfate discharges of the mainstem sites are shown in figure 19. The calculated mainstem discharges were determined by adding the upstream mainstem discharge with the measured downstream tributary discharges to determine the next mainstem discharge. For example, the sulfate discharge measured at mainstem site 801 (6 ton/d) was added to the discharges from tributary site 810 (2 ton/d), tributary site 811 (3 ton/d), tributary site 812 (19 ton/d), tributary site 813 (3 ton/d), and tributary site 814 (1 ton/d) to arrive at a calculated sulfate discharge of 34 ton/d at mainstem site 802. The measured sulfate discharge at mainstem site 802 was 26 ton/d. A good correlation between the measured mainstem sulfate discharges and the calculated sulfate discharges is shown in figure 19. The calculated sulfate discharges at mainstem sites 803-805 were less than the measured discharges because sulfate discharges from some mine discharges that flow directly into the Stonycreek River were not measured. Sulfate discharges from Shade Creek (site 836) (44 ton/d) and Paint Creek (site 830) (26 ton/d) had the largest effect on sulfate discharges in the Stonycreek River.
Water-quality analyses from five mine discharges and the receiving streams above and below the mine discharges are presented in table 13. The water quality at mine-discharge site 14 did not affect Dark Shade Creek, primarily because that section of Dark Shade Creek was already severely affected by mine drainage.
41
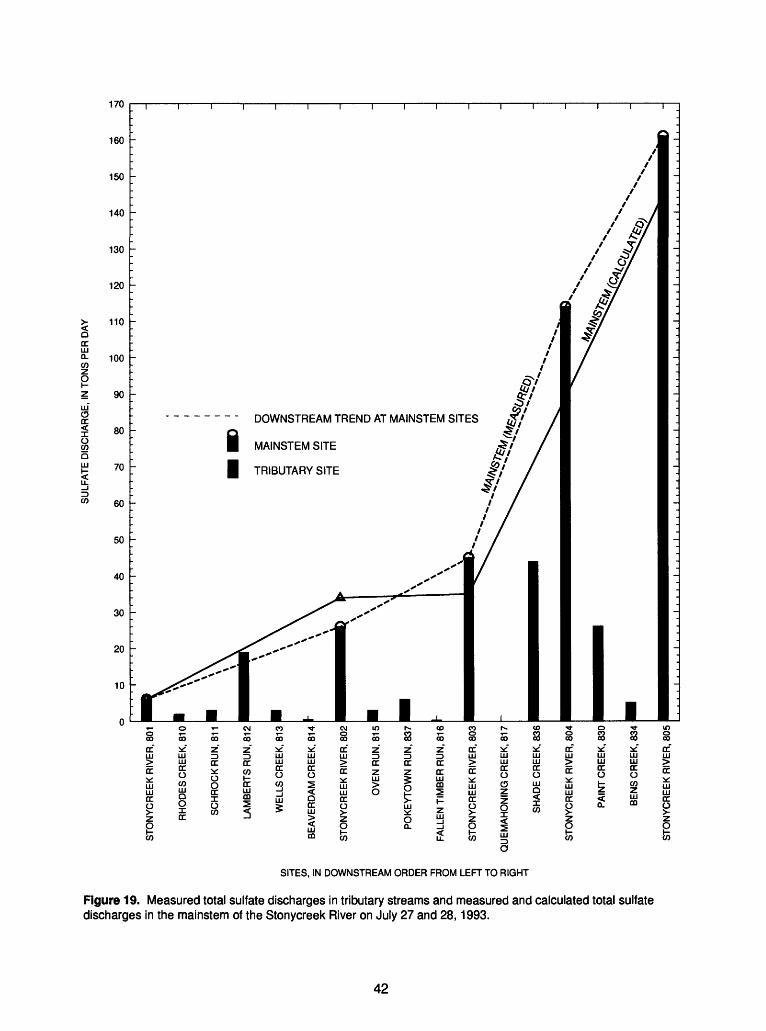
170
160
150
140
130
120
110
100
90
80
70
60
50
40
30
20
10
DOWNSTREAM TREND AT MAINSTEM SITES
MAINSTEM SITE
TRIBUTARY SITE
SITES, IN DOWNSTREAM ORDER FROM LEFT TO RIGHT
Figure 19. Measured total sulfate discharges in tributary streams and measured and calculated total sulfate discharges in the mainstem of the Stonycreek River on July 27 and 28,1993.
42
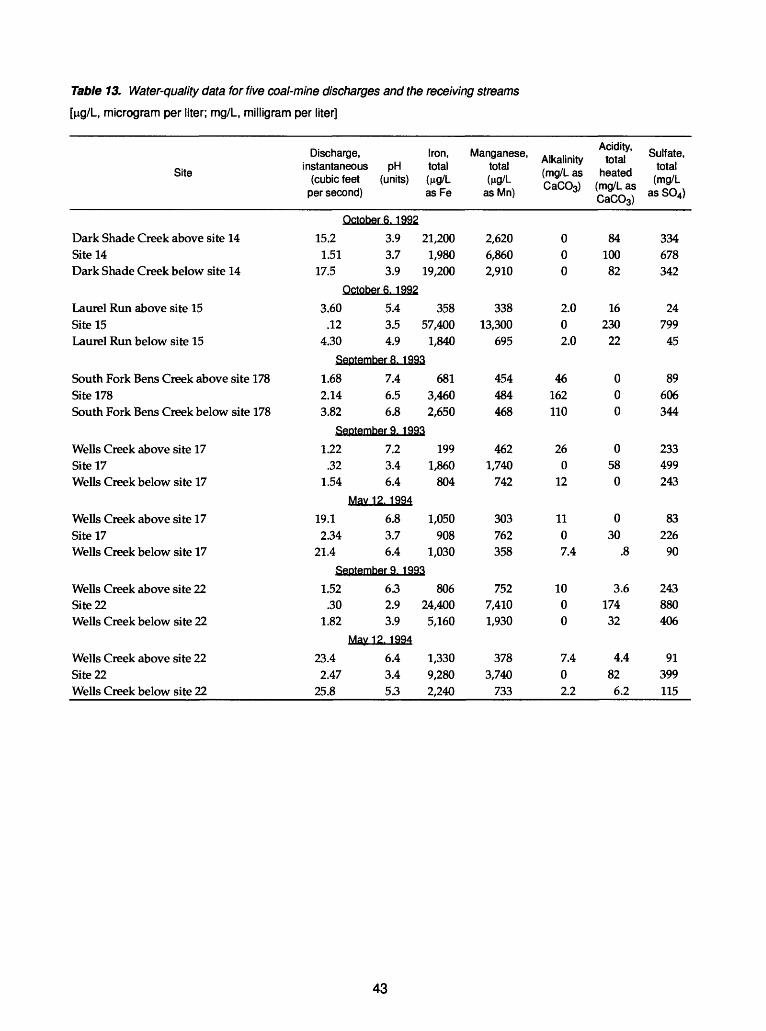
Table 13. Water-quality data for five coal-mine discharges and the receiving streams
[ug/L, microgram per liter; mg/L, milligram per liter]
Site
Discharge, instantaneous
(cubic feet per second)
PH (units)
Iron, totalfog/l as Fe
Manganese, total(MQ/L
asMn)
Alkalinity (mg/L as CaCO3)
Acidity, total
heated (mg/L as CaCO3)
Sulfate, total
(mg/L as SO4)
Octobers. 1992
Dark Shade Creek above site 14Site 14Dark Shade Creek below site 14
15.21.51
17.5
3.93.73.9
21,2001,980
19,200
2,6206,8602,910
000
8410082
334678342
Octobers. 1992
Laurel Run above site 15Site 15Laurel Run below site 15
3.60.12
4.30
5.43.54.9
35857,400
1,840
33813,300
695
2.002.0
16230
22
24799
45Septembers. 1993
South Fork Bens Creek above site 178Site 178South Fork Bens Creek below site 178
1.682.143.82
7.46.56.8
6813,4602,650
454484468
46162110
000
89606344
September 9. 1993
Wells Creek above site 17Site 17Wells Creek below site 17
1.22.32
1.54
7.23.46.4
1991,860
804
4621,740
742
260
12
058
0
233499243
Mav 12. 1994
Wells Creek above site 17Site 17Wells Creek below site 17
19.12.34
21.4
6.83.76.4
1,050908
1,030
303762358
1107.4
030
.8
83226
90September 9. 1993
Wells Creek above site 22Site 22Wells Creek below site 22
1.52.30
1.82
6.32.93.9
80624,4005,160
7527,4101,930
1000
3.617432
243880406
Mav 12. 1994
Wells Creek above site 22Site 22Wells Creek below site 22
23.42.47
25.8
6.43.45.3
1,3309,2802,240
3783,740
733
7.402.2
4.482
6.2
91399115
43
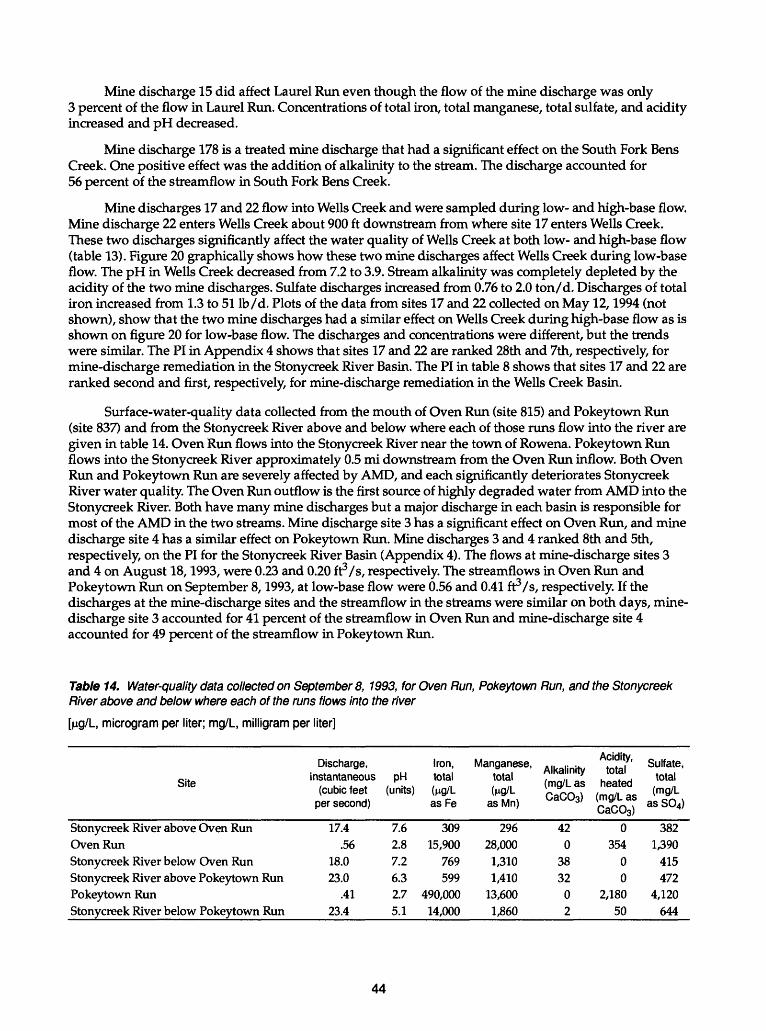
Mine discharge 15 did affect Laurel Run even though the flow of the mine discharge was only 3 percent of the flow in Laurel Run. Concentrations of total iron, total manganese, total sulfate, and acidity increased and pH decreased.
Mine discharge 178 is a treated mine discharge that had a significant effect on the South Fork Bens Creek. One positive effect was the addition of alkalinity to the stream. The discharge accounted for 56 percent of the streamflow in South Fork Bens Creek.
Mine discharges 17 and 22 flow into Wells Creek and were sampled during low- and high-base flow. Mine discharge 22 enters Wells Creek about 900 ft downstream from where site 17 enters Wells Creek. These two discharges significantly affect the water quality of Wells Creek at both low- and high-base flow (table 13). Figure 20 graphically shows how these two mine discharges affect Wells Creek during low-base flow. The pH in Wells Creek decreased from 7.2 to 3.9. Stream alkalinity was completely depleted by the acidity of the two mine discharges. Sulfate discharges increased from 0.76 to 2.0 ton/d. Discharges of total iron increased from 1.3 to 51 Ib/d. Plots of the data from sites 17 and 22 collected on May 12,1994 (not shown), show that the two mine discharges had a similar effect on Wells Creek during high-base flow as is shown on figure 20 for low-base flow. The discharges and concentrations were different, but the trends were similar. The PI in Appendix 4 shows that sites 17 and 22 are ranked 28th and 7th, respectively, for mine-discharge remediation in the Stonycreek River Basin. The PI in table 8 shows that sites 17 and 22 are ranked second and first, respectively, for mine-discharge remediation in the Wells Creek Basin.
Surface-water-quality data collected from the mouth of Oven Run (site 815) and Pokeytown Run (site 837) and from the Stonycreek River above and below where each of those runs flow into the river are given in table 14. Oven Run flows into the Stonycreek River near the town of Rowena. Pokeytown Run flows into the Stonycreek River approximately 0.5 mi downstream from the Oven Run inflow. Both Oven Run and Pokeytown Run are severely affected by AMD, and each significantly deteriorates Stonycreek River water quality. The Oven Run outflow is the first source of highly degraded water from AMD into the Stonycreek River. Both have many mine discharges but a major discharge in each basin is responsible for most of the AMD in the two streams. Mine discharge site 3 has a significant effect on Oven Run, and mine discharge site 4 has a similar effect on Pokeytown Run. Mine discharges 3 and 4 ranked 8th and 5th, respectively, on the PI for the Stonycreek River Basin (Appendix 4). The flows at mine-discharge sites 3 and 4 on August 18,1993, were 0.23 and 0.20 ft3/s, respectively. The streamflows in Oven Run and Pokeytown Run on September 8,1993, at low-base flow were 0.56 and 0.41 ft3/s, respectively. If the discharges at the mine-discharge sites and the streamflow in the streams were similar on both days, mine- discharge site 3 accounted for 41 percent of the streamflow in Oven Run and mine-discharge site 4 accounted for 49 percent of the streamflow in Pokeytown Run.
Table 14. Water-quality data collected on Septembers, 1993, for Oven Run, Pokeytown Run, and the Stonycreek River above and below where each of the runs flows into the river
[|Kj/L, microgram per liter; mg/L, milligram per liter]
Site
Stonycreek River above Oven RunOven RunStonycreek River below Oven RunStonycreek River above Pokeytown RunPokeytown RunStonycreek River below Pokeytown Run
Discharge,instantaneous
(cubic feet per second)
17.4.56
18.023.0
.4123.4
pH (units)
7.62.87.26.32.75.1
Iron,total(nO/l- as Fe
30915,900
769599
490,00014,000
Manganese,total(nO/l-
as Mn)
29628,000
1,3101,410
13,6001,860
Allolinitv
(mg/L as CaC03)
420
3832
02
Acidity, total
heated (mg/L as CaC03)
0354
00
2,18050
Sulfate,total
(mg/L as S04)
3821390
415472
4,120644
44
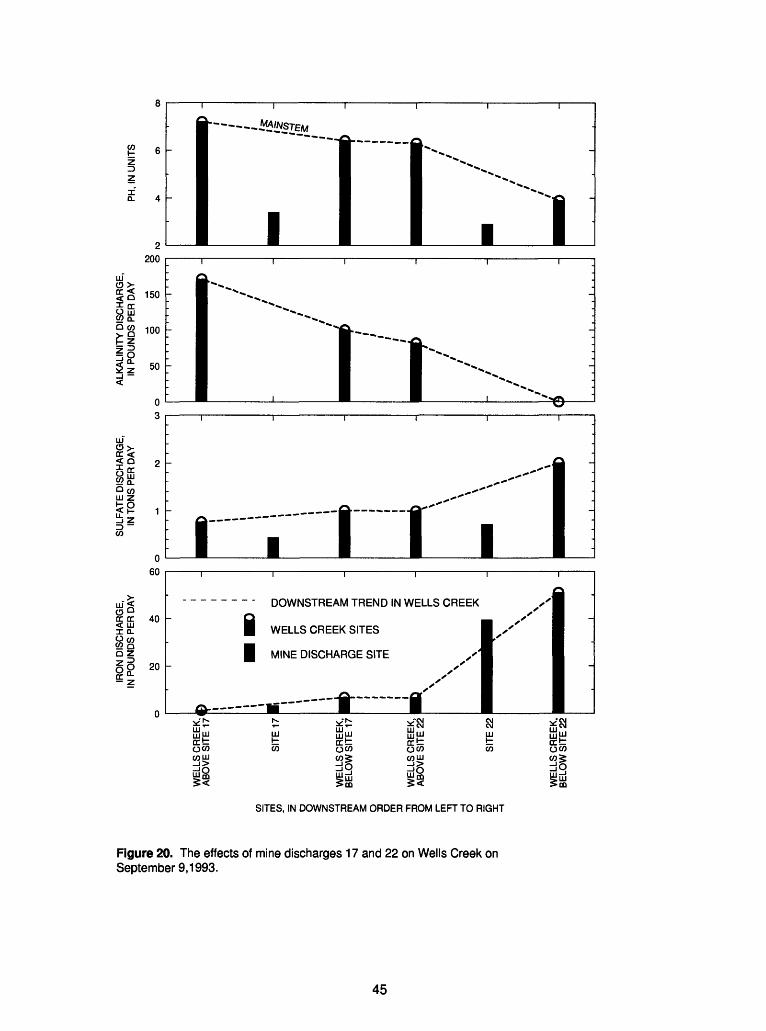
ul O >
Q CO
2200
150
100
50
oc<<Q
QCOUJ Z
uJ< 0° cc cc < LJJI Q- O cocogQZ
12
60
40
20
II
- - DOWNSTREAM TREND IN WELLS CREEK
WELLS CREEK SITES
MINE DISCHARGE SITE
UJUJoct oco oct
oco oct oco cou
SITES, IN DOWNSTREAM ORDER FROM LEFT TO RIGHT
Figure 20. The effects of mine discharges 17 and 22 on Wells Creek on September 9,1993.
45
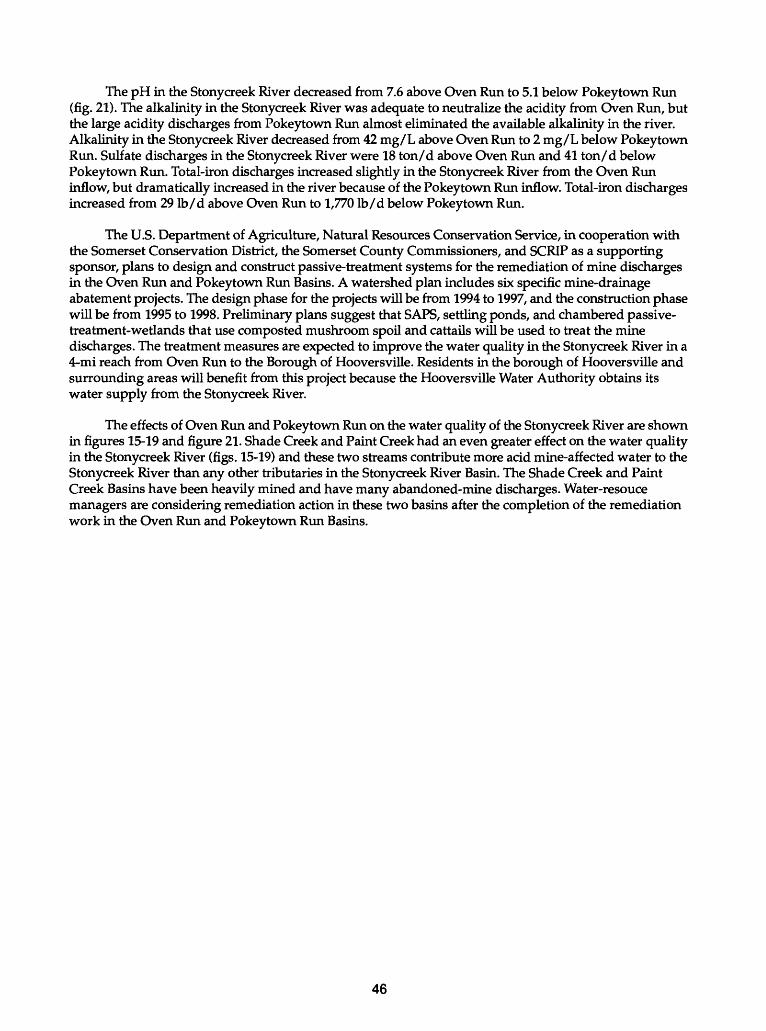
The pH in the Stonycreek River decreased from 7.6 above Oven Run to 5.1 below Pokeytown Run (fig. 21). The alkalinity in the Stonycreek River was adequate to neutralize the acidity from Oven Run, but the large acidity discharges from Pokeytown Run almost eliminated the available alkalinity in the river. Alkalinity in the Stonycreek River decreased from 42 mg/L above Oven Run to 2 mg/L below Pokeytown Run. Sulfate discharges in the Stonycreek River were 18 ton/d above Oven Run and 41 ton/d below Pokeytown Run. Total-iron discharges increased slightly in the Stonycreek River from the Oven Run inflow, but dramatically increased in the river because of the Pokeytown Run inflow. Total-iron discharges increased from 29 Ib/d above Oven Run to 1,770 Ib/d below Pokeytown Run.
The U.S. Department of Agriculture, Natural Resources Conservation Service, in cooperation with the Somerset Conservation District, the Somerset County Commissioners, and SCRIP as a supporting sponsor, plans to design and construct passive-treatment systems for the remediation of mine discharges in the Oven Run and Pokeytown Run Basins. A watershed plan includes six specific mine-drainage abatement projects. The design phase for the projects will be from 1994 to 1997, and the construction phase will be from 1995 to 1998. Preliminary plans suggest that SAPS, settling ponds, and chambered passive- treatment-wetlands that use composted mushroom spoil and cattails will be used to treat the mine discharges. The treatment measures are expected to improve the water quality in the Stonycreek River in a 4-mi reach from Oven Run to the Borough of Hooversville. Residents in the borough of Hooversville and surrounding areas will benefit from this project because the Hooversville Water Authority obtains its water supply from the Stonycreek River.
The effects of Oven Run and Pokeytown Run on the water quality of the Stonycreek River are shown in figures 15-19 and figure 21. Shade Creek and Paint Creek had an even greater effect on the water quality in the Stonycreek River (figs. 15-19) and these two streams contribute more acid mine-affected water to the Stonycreek River than any other tributaries in the Stonycreek River Basin. The Shade Creek and Paint Creek Basins have been heavily mined and have many abandoned-mine discharges. Water-resouce managers are considering remediation action in these two basins after the completion of the remediation work in the Oven Run and Pokeytown Run Basins.
46
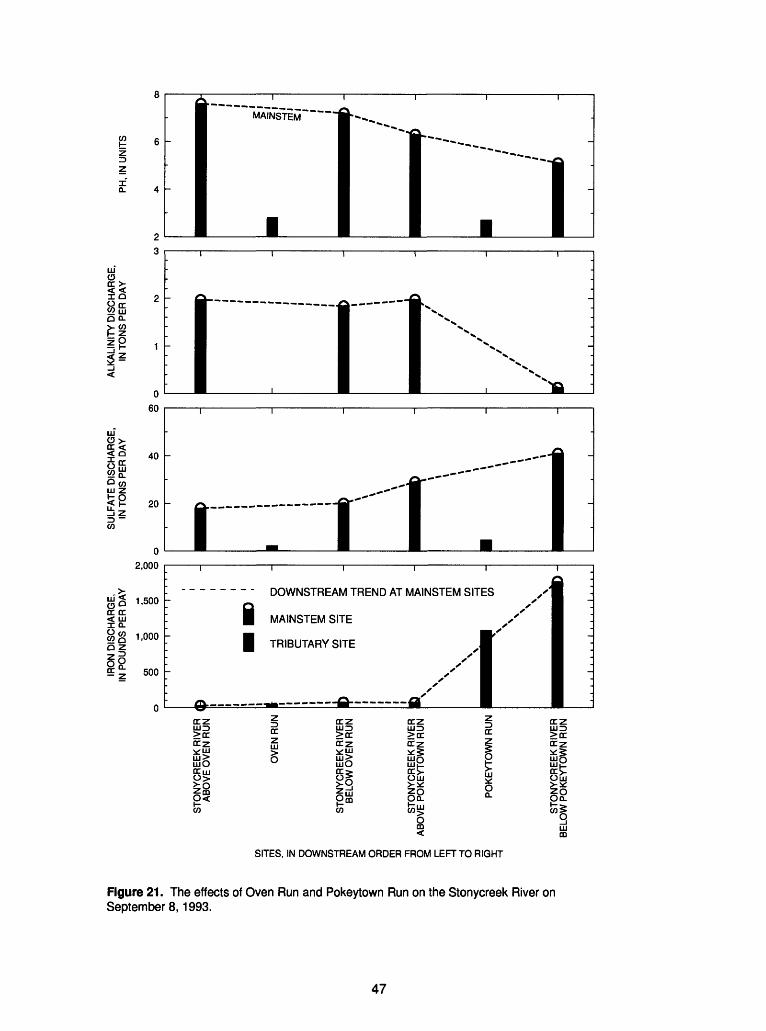
MAINSTEM"
HIOtr >
QQ-
tr << Q
01 2
0
60
40
20
0
2,000
tr tr< HIx o-
1-500
1,000Q z
If 500
i if- - DOWNSTREAM TREND AT MAINSTEM SITES
| MAINSTEM SITE
TRIBUTARY SITE
SITES, IN DOWNSTREAM ORDER FROM LEFT TO RIGHT
Figure 21. The effects of Oven Run and Pokeytown Run on the Stonycreek River on Septembers, 1993.
47
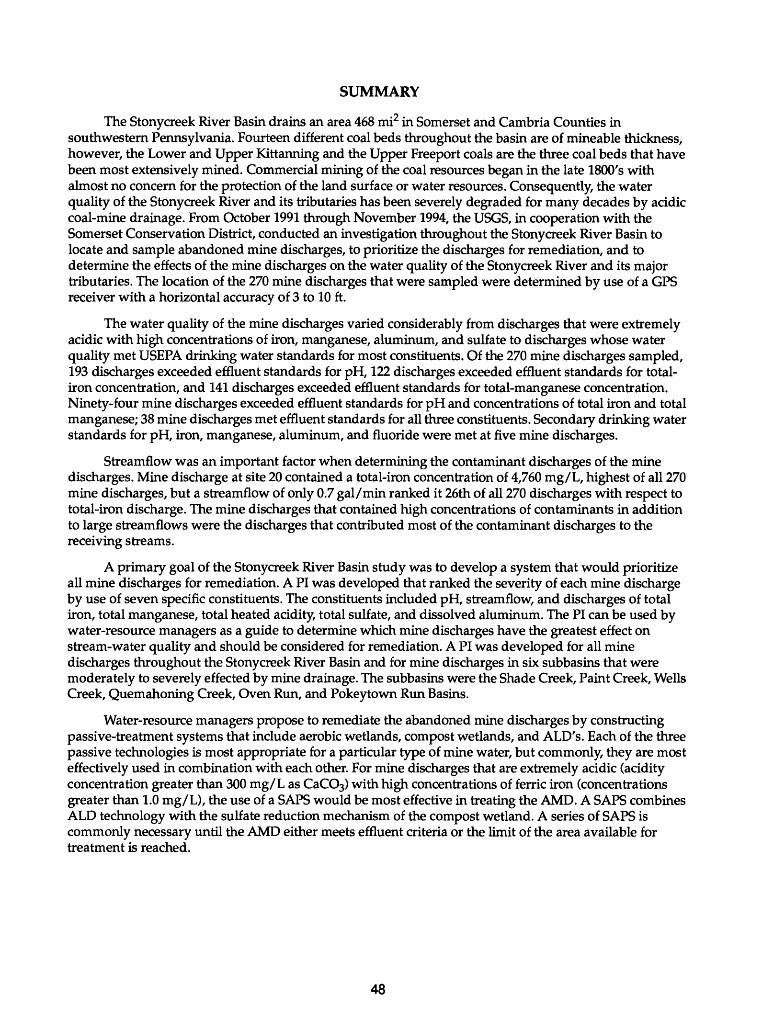
SUMMARY
The Stonycreek River Basin drains an area 468 mi2 in Somerset and Cambria Counties in southwestern Pennsylvania. Fourteen different coal beds throughout the basin are of mineable thickness, however, the Lower and Upper Kittanning and the Upper Freeport coals are the three coal beds that have been most extensively mined. Commercial mining of the coal resources began in the late 1800's with almost no concern for the protection of the land surface or water resources. Consequently, the water quality of the Stonycreek River and its tributaries has been severely degraded for many decades by acidic coal-mine drainage. From October 1991 through November 1994, the USGS, in cooperation with the Somerset Conservation District, conducted an investigation throughout the Stonycreek River Basin to locate and sample abandoned mine discharges, to prioritize the discharges for remediation, and to determine the effects of the mine discharges on the water quality of the Stonycreek River and its major tributaries. The location of the 270 mine discharges that were sampled were determined by use of a GPS receiver with a horizontal accuracy of 3 to 10 ft.
The water quality of the mine discharges varied considerably from discharges that were extremely acidic with high concentrations of iron, manganese, aluminum, and sulfate to discharges whose water quality met USEPA drinking water standards for most constituents. Of the 270 mine discharges sampled, 193 discharges exceeded effluent standards for pH, 122 discharges exceeded effluent standards for total- iron concentration, and 141 discharges exceeded effluent standards for total-manganese concentration. Ninety-four mine discharges exceeded effluent standards for pH and concentrations of total iron and total manganese; 38 mine discharges met effluent standards for all three constituents. Secondary drinking water standards for pH, iron, manganese, aluminum, and fluoride were met at five mine discharges.
Streamflow was an important factor when determining the contaminant discharges of the mine discharges. Mine discharge at site 20 contained a total-iron concentration of 4,760 mg/L, highest of all 270 mine discharges, but a streamflow of only 0.7 gal/min ranked it 26th of all 270 discharges with respect to total-iron discharge. The mine discharges that contained high concentrations of contaminants in addition to large streamflows were the discharges that contributed most of the contaminant discharges to the receiving streams.
A primary goal of the Stonycreek River Basin study was to develop a system that would prioritize all mine discharges for remediation. A PI was developed that ranked the severity of each mine discharge by use of seven specific constituents. The constituents included pH, streamflow, and discharges of total iron, total manganese, total heated acidity, total sulfate, and dissolved aluminum. The PI can be used by water-resource managers as a guide to determine which mine discharges have the greatest effect on stream-water quality and should be considered for remediation. A PI was developed for all mine discharges throughout the Stonycreek River Basin and for mine discharges in six subbasins that were moderately to severely effected by mine drainage. The subbasins were the Shade Creek, Paint Creek, Wells Creek, Quemahoning Creek, Oven Run, and Pokeytown Run Basins.
Water-resource managers propose to remediate the abandoned mine discharges by constructing passive-treatment systems that include aerobic wetlands, compost wetlands, and ALD's. Each of the three passive technologies is most appropriate for a particular type of mine water, but commonly, they are most effectively used in combination with each other. For mine discharges that are extremely acidic (acidity concentration greater than 300 mg/L as CaCO3) with high concentrations of ferric iron (concentrations greater than 1.0 mg/L), the use of a SAPS would be most effective in treating the AMD. A SAPS combines ALD technology with the sulfate reduction mechanism of the compost wetland. A series of SAPS is commonly necessary until the AMD either meets effluent criteria or the limit of the area available for treatment is reached.
48

A network of 37 surface-water sampling sites was established to identify stream water quality during base flow. Water samples collected on July 27 and 28,1993, are used to describe base-flow quality throughout the basin. From mainstem site 801 to mainstem site 805, water-quality degradation occurred that is attributed to the inflows of acidic mine discharges from affected tributaries in addition to inflows of mine discharges directly into the river. Shade Creek, Paint Creek, Oven Run, and Pokeytown Run are tributaries that significantly affect river water quality. From mainstem site 801 to 805, pH decreased from 6.8 to 4.2, alkalinity was completely depleted, and discharges of total iron increased from 30 to 684 Ib/d. Very large discharges of manganese entered the mainstem from Shade Creek and Paint Creek. Manganese oxidation reactions and precipitation are strongly affected by pH and are very slow below pH 8.5. The manganese entering the mainstem from the tributary streams did not precipitate and had an additive affect on mainstem discharges. The attenuation of sulfate concentrations from mainstem sites 803 to 805 is because of dilution, but the significant increase in sulfate discharges from sites 803 to 805 is the result of increased streamflow. A good correlation existed between the measured mainstem sulfate discharges and the calculated mainstem sulfate discharges. The sulfate discharges were calculated by adding the sulfate discharges of the previous upstream mainstem site to the sulfate discharges of all sampled tributary streams entering the river between the two mainstem sites.
Mine discharges 17 and 22 had a major effect on the water quality of Wells Creek. Mine discharge 22 enters Wells Creek about 900 ft downstream from where mine discharge 17 enters Wells Creek. Data collected in Wells Creek above mine discharge 17 inflow and below mine discharge 22 inflow on September 9,1993, show that pH decreased from 7.2 to 3.9, stream alkalinity was completely depleted by the two mine discharge acidities, sulfate discharges increased from 0.76 to 2.0 ton/d, and total-iron discharges increased from 1.3 to 51 Ib/d. The PI for mine discharges 17 and 22 rank them 28th and 7th, respectively, for mine-discharge remediation in the Stonycreek River Basin. Oven Run and Pokeytown Run had a similar effect on the water quality of the Stonycreek River. Both streams are significantly affected by AMD and are the first major sources of AMD flowing into the Stonycreek River. The Pokeytown Run inflow is about 0.5 mi downstream from the Oven Run inflow. Both basins contain many mine discharges, but one major discharge in each basin is responsible for much of the AMD in each stream. Mine discharge at site 3 has a large effect on Oven Run, and mine discharge at site 4 has a similar effect on Pokeytown Run. Mine discharges at sites 3 and 4 ranked 8th and 4th, respectively, on the PI for the Stonycreek River Basin. Data collected in the Stonycreek River above Oven Run and below Pokeytown Run during low-base flow on September 8,1993, show a decrease in pH from 7.6 to 5.1, a decrease in alkalinity from 42 to 2 mg/L, an increase in sulfate discharges from 18 to 41 ton/d, and an increase in total-iron discharges from 29 to 1,770 Ib/d. The U.S. Department of Agriculture, Natural Resources Conservation Service, in cooperation with the Somerset Conservation District, the Somerset County Commissioners, and SCRIP as a supporting sponsor, plans to design and construct passive-treatment systems for the remediation of mine discharges in the Oven Run and Pokeytown Run Basins. The design phase for the projects will occur during 1994-97, and the construction phase will occur during 1995-98.
49
REFERENCES CITED
Anderson, J.R., 1967, Major land uses in the United States, in U.S. Geological Survey, 1970, National atlas of the United States of America: Washington, D.C., U.S. Geological Survey, p. 158-159.
Aulenbach, B.T., Hooper, R.P., and Bricker, O.P., 1996, Trends in the chemistry of precipitation and surface water in a national network of small watersheds: Hydrological processes.
Barker, J.L., and Witt III, E.G., 1990, Effects of acidic precipitation on the water quality of streams in the Laurel Hill area, Somerset County, Pennsylvania, 1983-86: U.S. Geological Survey Water-Resources Investigations Report 89-4113, 72 p.
Bencala, K.E., McKnight, D.M., and Zellweger, G.W, 1987, Evaluation of natural tracers in an acidic and metal rich stream: Water Resources Research, v. 23, no. 5, p. 827-836.
Berg, T.M., Barnes, J.H., Sevon, W.D., Skema, V.W, Wilshusen, J.P., and Yannacci, D.S., 1989, Physiographic provinces of Pennsylvania: Pennsylvania Geological Survey, 4th ser., Map 13,1 p.
Berg, T.M., Edmunds, W.E., Geyer, A.R., and others, comps., 1980, Geologic map of Pennsylvania: Pennsylvania Geological Survey, 4th ser., Map 1, scale 1:250,000,3 sheets.
Biesecker, J.E., and George, J.R., 1966, Stream quality in Appalachia as related to coal-mine drainage, 1965: U.S. Geological Survey Circular 526,27 p., 1 pi.
Carson Engineers, 1974, Operation Scarlift, Stony Creek Mine Drainage Pollution Abatement Project, SL-179.
Code of Federal Regulations, 1994, Title 40, Part 434, Section 22.
Driscoll, C.T., Baker, J.P., Bisogni, J.J., Jr., and Schofield, C.L., 1980, Effect of aluminum speciation on fish in dilute acidified water: Nature, v. 284, p. 161-164.
Fishman, M.J., and Friedman, L.C., eds., 1989, Methods for determination of inorganic substances in water and fluvial sediments: U.S. Geological Survey Techniques of Water Resources Investigations, book 5, chap. Al, 545 p.
Hedin, R.S., and Narin, R.W., 1992, Designing and sizing passive mine drainage treatment systems, in Proceedings, Thirteenth annual West Virginia surface mine drainage task force symposium: Morgantown, W Va., 11 p.
___1993, Contaminant removal capabilities of wetlands constructed to treat coal mine drainage, in G.A. Moshiri, ed., Constructed wetlands for water quality improvement: Boca Raton, Fla., Lewis Publishers, p. 187-195.
Hedin, R.S., Narin, R.W., and Kleinmann, R.L.P., 1994, Passive treatment of coal mine drainage: U.S. Bureau of Mines Information Circular 9389,35 p.
Herb, W.J., Shaw, L.C., and Brown, D.E., 1981, Hydrology of area 3, eastern coal province, Pennsylvania: U.S. Geological Survey Water-Resources Investigations Report 81-537,88 p.
Kepler, D.A., and McCleary, B.C., 1994, Successive alkalinity-producing systems (SAPS) for the treatment of acid mine drainage: International Land Reclamation and Mine Drainage Conference and Third International Conference on the Abatement of Acidic Drainage [Proceedings], v. 1, Mine Drainage, p. 195-204.
50
REFERENCES CITECUcontinued
Kleinmann, R.L.R, 1989, Acid Mine Drainage: Engineering Mining Journal, v. 190, p. 16I-16N.
Kleinmann, R.L.P., Jones, J.R., and Erickson, RM., 1988, An assessment of the coal mine drainage problem: 10th Annual Conference of the Association of Abandoned Mine Land Programs, Pennsylvania Bureau of Abandoned Mine Lands Reclamation {Proceedings}, p. 1-9.
Mills, A.L., 1985, Soil Reclamation Processes, in Klein, D., Tate, R.L., eds.: New York, Marcel Dekker, Inc., p. 35-81.
Nairn, R.W., Hedin, R.S., and Watzlaf, G.R., 1991, A preliminary review of the use of anoxic limestone drains in the passive treatment of acid mine drainage, in 12th Annual West Virginia Surface Mine Drainage Task Force Symposium: West Virginia University [Proceedings], 15 p.
Office of Surface Mining Reclamation and Enforcement, 1993, Surface mining control and reclamation act of 1977: Public law 95-87,239 p.
Pennsylvania Coal Association, Pennsylvania Coal Data 1994, table 16.
Pennsylvania Department of Environmental Resources, 1994a, Methods manual: [Harrisburg, Pa.], Bureau of Laboratories, v. 1, [n.p.].
___1994b, Commonwealth of Pennsylvania 1994 water quality assessment: Harrisburg, Pa., 186 p.
Rantz, S.E., and others, 1982, Measurement and computation of streamflow, vol. 1 and 2: U.S. Geological Survey Water-Supply Paper 2175,631 p.
Toler, L.G., 1982, Some chemical characteristics of mine drainage in Illinois: U.S. Geological Survey Water-Supply Paper 1078,47 p.
U.S. Army Corps of Engineers, 1993, Johnstown, Pennsylvania local flood protection project,reconnaissance report on water and sediment quality and aquatic life resources pertinent to rehabilitation of the flood reduction channel: Pittsburgh District, 67 p.
___1994, Conemaugh River Basin Pennsylvania, Reconnaissance Study: Pittsburgh District, 67 p.
U.S. Department of the Interior, 1967, Stream pollution by coal mine drainage in Appalachia: Federal Water Pollution Control Administration, prepared in 1967 and revised in 1969, 261 p.
___1968, Stream pollution by coal mine drainage upper Ohio River Basin: Federal Water Pollution Control Administration, p. 110.
U.S. Environmental Protection Agency 1971, Water supply and water quality control study, Conemaugh River Basin, Pennsylvania: Wheeling Field Office.
___1972, Cooperative mine drainage survey, Kiskiminetas River Basin: Wheeling Field Office, p. 251-313.
___1994, Drinking water regulations and health advisories: Washington, D.C., Office of Water, 11 p.
U.S. Geological Survey 1976-81, Water resources data for Pennsylvania, v. 3, Ohio River and St. Lawrence River Basins: U.S. Geological Survey Water-Data Reports PA 76-3 to PA 81-3 (published annually).
51

REFERENCES CITED^Continued
Ward, J.R., and Harr, C.A., eds., 1990, Methods for collection and processing of surface-water and bed- material samples for physical and chemical analyses: U.S. Geological Survey Open-File Report 90-140,71 p.
Witt III, B.C., 1991, Water-resources data for North Fork Bens Creek, Somerset County, Pennsylvania, August 1983 through September 1988: U.S. Geological Survey Open-File Report 89-584,61 p.
52

APPENDIXES
53
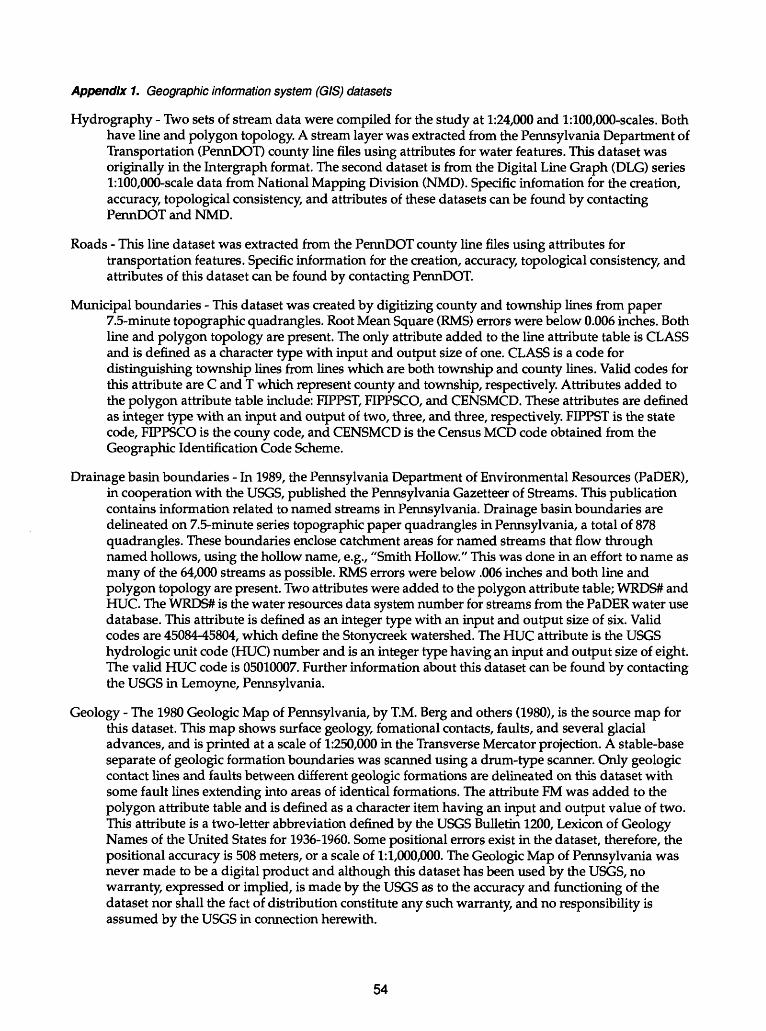
Appendix 1. Geographic information system (GIS) datasets
Hydrography - Two sets of stream data were compiled for the study at 1:24,000 and l:100,000-scales. Both have line and polygon topology. A stream layer was extracted from the Pennsylvania Department of Transportation (PennDOT) county line files using attributes for water features. This dataset was originally in the Intergraph format. The second dataset is from the Digital Line Graph (DLG) series l:100,000-scale data from National Mapping Division (NMD). Specific infomation for the creation, accuracy, topological consistency, and attributes of these datasets can be found by contacting PennDOT and NMD.
Roads - This line dataset was extracted from the PennDOT county line files using attributes fortransportation features. Specific information for the creation, accuracy, topological consistency, and attributes of this dataset can be found by contacting PennDOT.
Municipal boundaries - This dataset was created by digitizing county and township lines from paper7.5-minute topographic quadrangles. Root Mean Square (RMS) errors were below 0.006 inches. Both line and polygon topology are present. The only attribute added to the line attribute table is CLASS and is defined as a character type with input and output size of one. CLASS is a code for distinguishing township lines from lines which are both township and county lines. Valid codes for this attribute are C and T which represent county and township, respectively. Attributes added to the polygon attribute table include: FIPPST, FIPPSCO, and CENSMCD. These attributes are defined as integer type with an input and output of two, three, and three, respectively. FIPPST is the state code, FIPPSCO is the couny code, and CENSMCD is the Census MCD code obtained from the Geographic Identification Code Scheme.
Drainage basin boundaries - In 1989, the Pennsylvania Department of Environmental Resources (PaDER), in cooperation with the USGS, published the Pennsylvania Gazetteer of Streams. This publication contains information related to named streams in Pennsylvania. Drainage basin boundaries are delineated on 7.5-minute series topographic paper quadrangles in Pennsylvania, a total of 878 quadrangles. These boundaries enclose catchment areas for named streams that flow through named hollows, using the hollow name, e.g., "Smith Hollow." This was done in an effort to name as many of the 64,000 streams as possible. RMS errors were below .006 inches and both line and polygon topology are present. Two attributes were added to the polygon attribute table; WRDS# and HUC. The WRDS# is the water resources data system number for streams from the PaDER water use database. This attribute is defined as an integer type with an input and output size of six. Valid codes are 45084-45804, which define the Stonycreek watershed. The HUC attribute is the USGS hydrologic unit code (HUC) number and is an integer type having an input and output size of eight. The valid HUC code is 05010007. Further information about this dataset can be found by contacting the USGS in Lemoyne, Pennsylvania.
Geology - The 1980 Geologic Map of Pennsylvania, by T.M. Berg and others (1980), is the source map for this dataset. This map shows surface geology, fomational contacts, faults, and several glacial advances, and is printed at a scale of 1:250,000 in the Transverse Mercator projection. A stable-base separate of geologic formation boundaries was scanned using a drum-type scanner. Only geologic contact lines and faults between different geologic formations are delineated on this dataset with some fault lines extending into areas of identical formations. The attribute FM was added to the polygon attribute table and is defined as a character item having an input and output value of two. This attribute is a two-letter abbreviation defined by the USGS Bulletin 1200, Lexicon of Geology Names of the United States for 1936-1960. Some positional errors exist in the dataset, therefore, the positional accuracy is 508 meters, or a scale of 1:1,000,000. The Geologic Map of Pennsylvania was never made to be a digital product and although this dataset has been used by the USGS, no warranty, expressed or implied, is made by the USGS as to the accuracy and functioning of the dataset nor shall the fact of distribution constitute any such warranty, and no responsibility is assumed by the USGS in connection herewith.
54
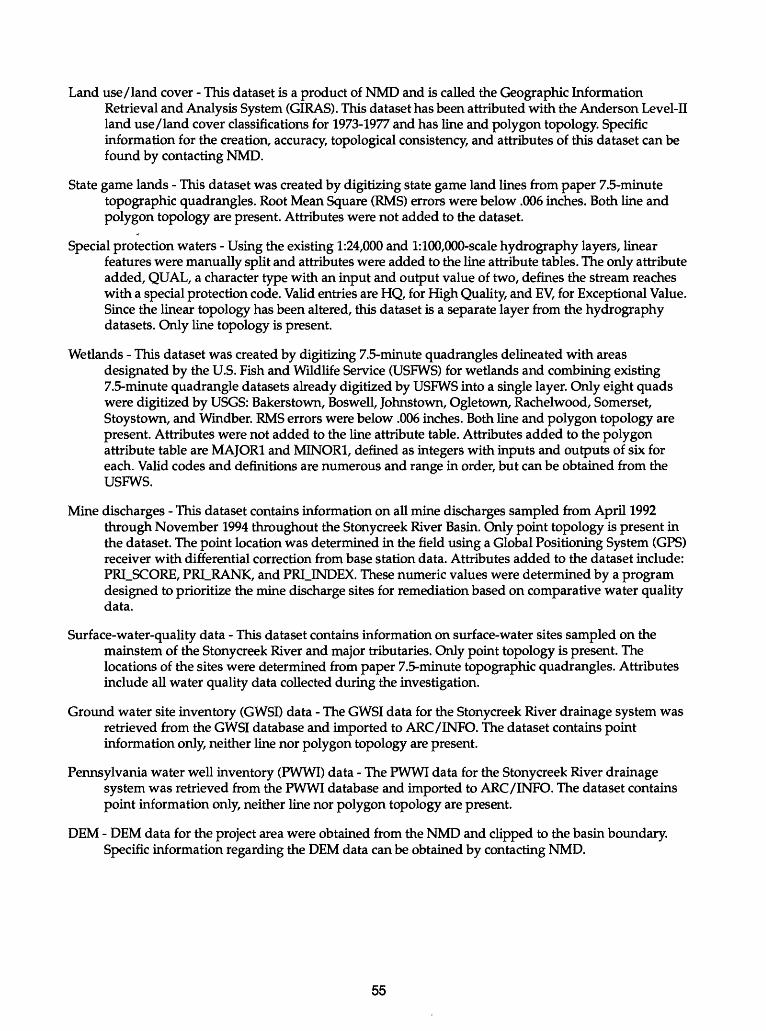
Land use/land cover - This dataset is a product of NMD and is called the Geographic InformationRetrieval and Analysis System (GIRAS). This dataset has been attributed with the Anderson Level-II land use/land cover classifications for 1973-1977 and has line and polygon topology. Specific information for the creation, accuracy, topological consistency, and attributes of this dataset can be found by contacting NMD.
State game lands - This dataset was created by digitizing state game land lines from paper 7.5-minute topographic quadrangles. Root Mean Square (RMS) errors were below .006 inches. Both line and polygon topology are present. Attributes were not added to the dataset.
Special protection waters - Using the existing 1:24,000 and l:100,000-scale hydrography layers, linearfeatures were manually split and attributes were added to the line attribute tables. The only attribute added, QUAL, a character type with an input and output value of two, defines the stream reaches with a special protection code. Valid entries are HQ, for High Quality, and EV, for Exceptional Value. Since the linear topology has been altered, this dataset is a separate layer from the hydrography datasets. Only line topology is present.
Wetlands - This dataset was created by digitizing 7.5-minute quadrangles delineated with areasdesignated by the U.S. Fish and Wildlife Service (USFWS) for wetlands and combining existing 7.5-minute quadrangle datasets already digitized by USFWS into a single layer. Only eight quads were digitized by USGS: Bakerstown, Boswell, Johnstown, Ogletown, Rachelwood, Somerset, Stoystown, and Windber. RMS errors were below .006 inches. Both line and polygon topology are present. Attributes were not added to the line attribute table. Attributes added to the polygon attribute table are MAJOR1 and MINOR1, defined as integers with inputs and outputs of six for each. Valid codes and definitions are numerous and range in order, but can be obtained from the USFWS.
Mine discharges - This dataset contains information on all mine discharges sampled from April 1992through November 1994 throughout the Stonycreek River Basin. Only point topology is present in the dataset. The point location was determined in the field using a Global Positioning System (GPS) receiver with differential correction from base station data. Attributes added to the dataset include: PRI_SCORE, PRI_RANK, and PRIJNDEX. These numeric values were determined by a program designed to prioritize the mine discharge sites for remediation based on comparative water quality data.
Surface-water-quality data - This dataset contains information on surface-water sites sampled on the mainstem of the Stonycreek River and major tributaries. Only point topology is present. The locations of the sites were determined from paper 7.5-minute topographic quadrangles. Attributes include all water quality data collected during the investigation.
Ground water site inventory (GWSI) data - The GWSI data for the Stonycreek River drainage system was retrieved from the GWSI database and imported to ARC/INFO. The dataset contains point information only, neither line nor polygon topology are present.
Pennsylvania water well inventory (PWWI) data - The PWWI data for the Stonycreek River drainage system was retrieved from the PWWI database and imported to ARC/INFO. The dataset contains point information only, neither line nor polygon topology are present.
DEM - DEM data for the project area were obtained from the NMD and clipped to the basin boundary. Specific information regarding the DEM data can be obtained by contacting NMD.
55
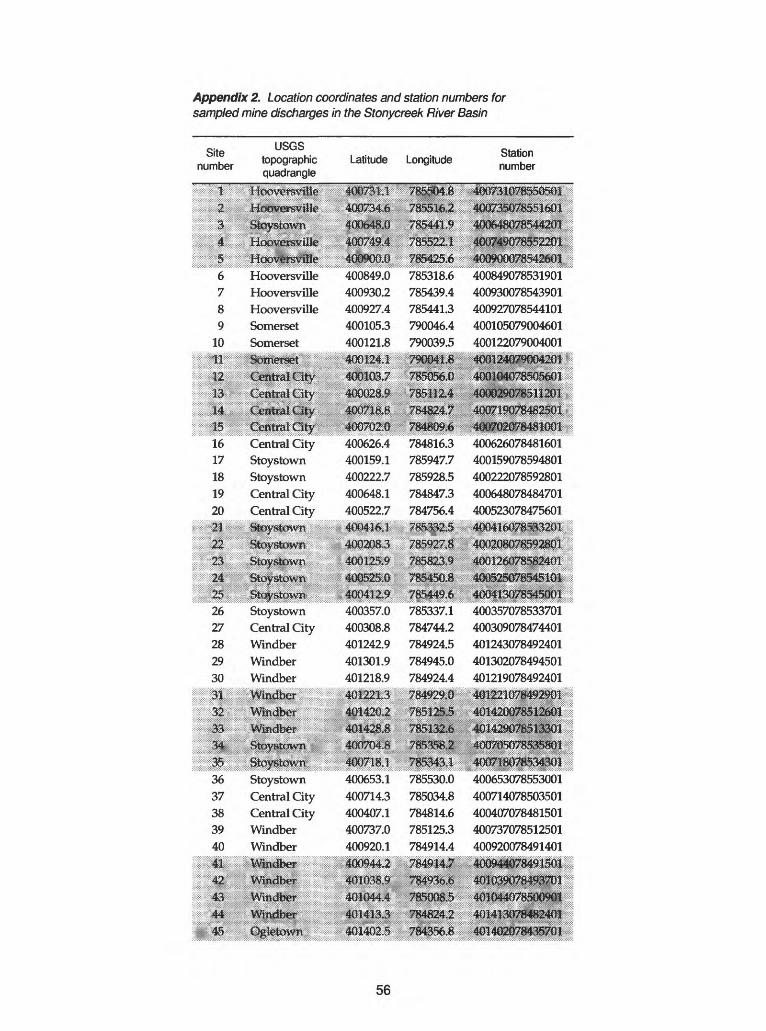
Appendix 2. Location coordinates and station numbers for sampled mine discharges in the Stonycreek River Basin
Site number
usestopographic quadrangle
Latitude LongitudeStation number
21
I m&
6789
10
12m,m
1617
181920V
23
2627282930
HooversvilleHooversvilleHooversvilleSomersetSomerset
Central City Stoystown Stoystown Central City Central City
Stoystowrt
Stoystown Central City Windber Windber Windber
II Witdbefm
3637383940Ir
m
45
430M8J 40064807^*1201
4GG9ome400849.0
400930.2
400927.4400105.3
400121.8
785318.6
785439.4785441.3790046.4790039.5
40Q9QQ828S42603 400849078531901 400930078543901 400927078544101 400105079004601 400122079004001
4QOTO7 78S95&0 400104078505601
mm® mmm400626.4400159.1400222.7400648.1400522.7
784816.3785947.7785928.5784847.3784756.4
400626078481601400159078594801400222078592801400648078484701400523078475601
48Q2Q&3
46(112567814^101
400357.0400308.8401242.9401301.9401218.9
785337.1784744.2784924.5784945.0784924.4
400357078533701400309078474401401243078492401401302078494501401219078492401
Stoystown Central City Central City Windber Windber
JPPpi 400653.1400714.3400407.1400737.0400920.1
785530.0785034.8784814.6785125.3784914.4
400653078553001400714078503501400407078481501400737078512501400920078491401
':4iiiiiiii|pii
56
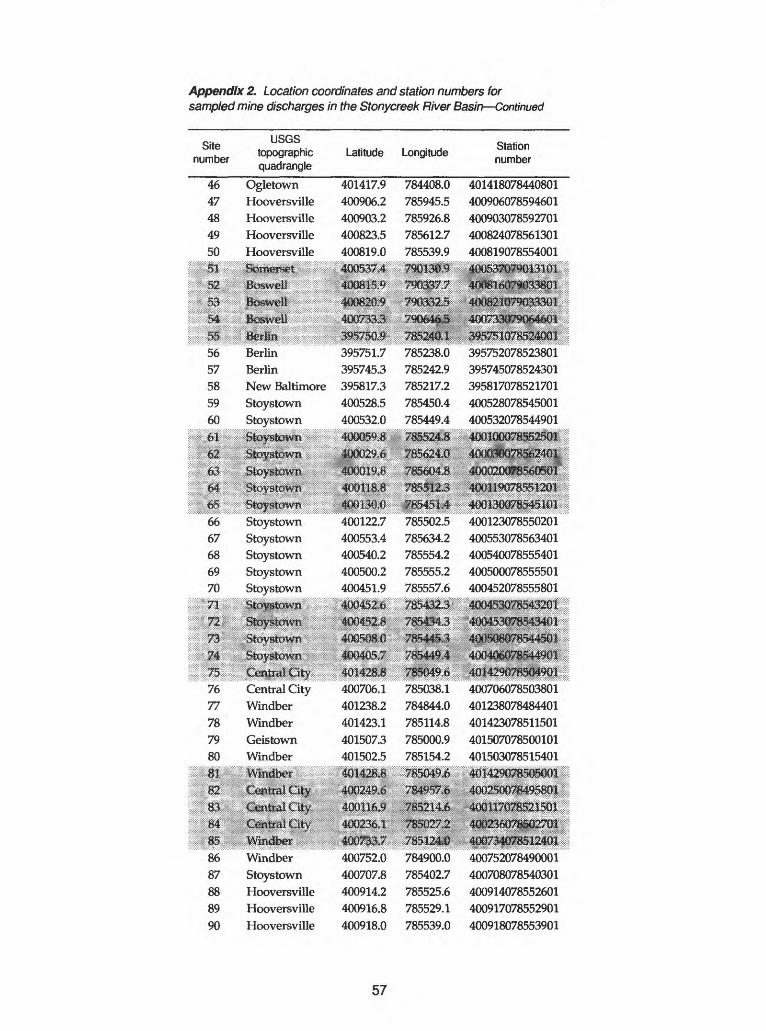
Appendix 2. Location coordinates and station numbers for sampled mine discharges in the Stonycreek River Basin Continued
Site number
USGS topographic quadrangle
Latitude LongitudeStation number
4647484950
5657585960w
lip-7677787980
m
8687888990
OgletownHooversvilleHooversvilleHooversvilleHooversville
BosweU BbsvveH
BerlinBerlinNew BaltimoreStoystownStoystown
6667686970
StoystownStoystownStoystownStoystownStoystown
Central CityWindberWindberGeistownWindber
WindberStoystownHooversvilleHooversvilleHooversville
401417.9400906.2400903.2400823.5400819.0
395751.7395745.3395817.3400528.5400532.0
400029,0maim
400122.7400553.4400540.2400500.2400451.9
400405,7401428.8400706.1401238.2401423.1401507.3401502.5
400236*1
400752.0400707.8400914.2400916.8400918.0
784408.0 401418078440801785945.5 400906078594601785926.8 400903078592701785612.7 400824078561301785539.9 400819078554001
785236.0 785242.9 785217.2 785450.4 785449.4 785124$:
395752078523801395745078524301395817078521701400528078545001400532078544901
785502.5785634.2785554.2785555.2785557.6
400123078550201400553078563401400540078555401400500078555501400452078555801
785038.1784844.0785114.8785000.9785154.2
400706078503801401238078484401401423078511501401507078500101401503078515401
78S2M 78582^2
784900.0785402.7785525.6785529.1785539.0
4007M07S512401 400752078490001 400708078540301 400914078552601 400917078552901 400918078553901
57

Appendix 2. Location coordinates and station numbers for sampled mine discharges in the Stonycreek River Basin Continued
Site number
USGS topographic quadrangle
Latitude Longitude Station number
'
96979899
100Ey0£!
m
106107108109110
\ i"i:::::: I IcJ
116117118119120
126127128129130
HiDoversville Hiooyersville
Windber Hooversville Central City Central City Windber
Pitdber
Central CityJohnstownJohnstownJohnstownGeistown
Windber
WindberBeaverdaleBeaverdaleHooversvilleHooversville
WM&erWindberWindberStoystownStoystownJohnstown
ISli^P I 4QOM9L3: WSW&j? me@88& ?8PPJ7
28S52&?
401408.2401335.8400248.1400245.8401417.6
785022.9785422.3785005.5785007.9784849.8
401408078502301 401336078542201 400248078500501 400246078500801 401418078485001 401415078485001 4014fl067«4736&l
400323.0 785202.8401847.6401846.2401844.0401848.2
785344.3
785348.2785257.4
785224.5
400323078520301401848078534401401846078534801401844078525701401848078522401
mmmrn^Mi40*463 J401401,9 784o43jO401409.2 784648;! 401409078464801
401414.7401516.5401517.6400857.4400859.7
784641.5784414.6784413.6785403.2785414.178S»4
401415078464101 401516078441501 401518078441401 400857078540301 400900078541401 40U85507S534001
401451.4401500.0400521.0400519.6401527.7
784612.5784552.0785613.2785614.1785248.5
401451078461201401500078455201400521078561301400520078561401401528078524801
785622,4
^85759,5
58
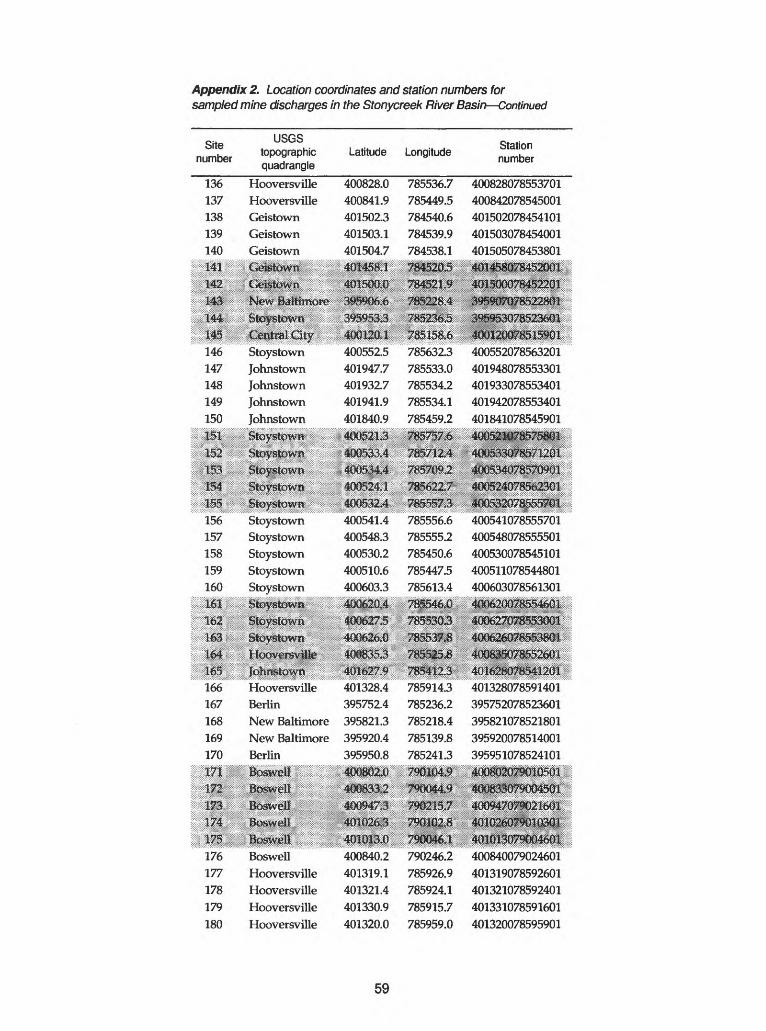
Appendix 2. Location coordinates and station numbers for sampled mine discharges in the Stonycreek River Basin Continued
Site number
USGS topographic quadrangle
Latitude Longitude Station number
136137138139140Ml"
HooversvilleHooversvilleGeistownGeistownGeistownciitetoMn,
1341IM:
146147148149150
Stoystown Johnstown Johnstown Johnstown Johnstown
iPif.156157158159160
SioyStownStoystownStoystownStoystownStoystownStoystown
P, M
y3.W*t~&:W ::¥**¥Jifc¥:::;
166 Hooversville167168169170
mm
176177178179180
400828.0400841.9401502.3401503.1401504.7
BerlinNew Baltimore New Baltimore Berlin
Soswell
BoswellHooversvilleHooversvilleHooversvilleHooversville
«2$l 400552.5 401947.7 401932.7 401941.9 401840.9
400541.4 400548.3 400530.2 400510.6 400603.3 M62&4 fQ0617J
401328.4395752.4395821.3395920.4395950.8
4018M 400840.2 401319.1 401321.4 401330.9 401320.0
785536.7785449.5784540.6784539.9784538.1
1PM1F
400828078553701400842078545001401502078454101401503078454001401505078453801
4S3 5808784522*]!
785632.3785533.0785534.2785534.1785459.2
400552078563201401948078553301401933078553401401942078553401401841078545901
785556.6785555.2785450.6785447.5785613.4
400541078555701400548078555501400530078545101400511078544801400603078561301
490626^8553801
785914.3785236.2785218.4785139.8785241.3
401328078591401395752078523601395821078521801395920078514001395951078524101mmimmm
790246.2785926.9785924.1785915.7785959.0
400840079024601401319078592601401321078592401401331078591601401320078595901
59
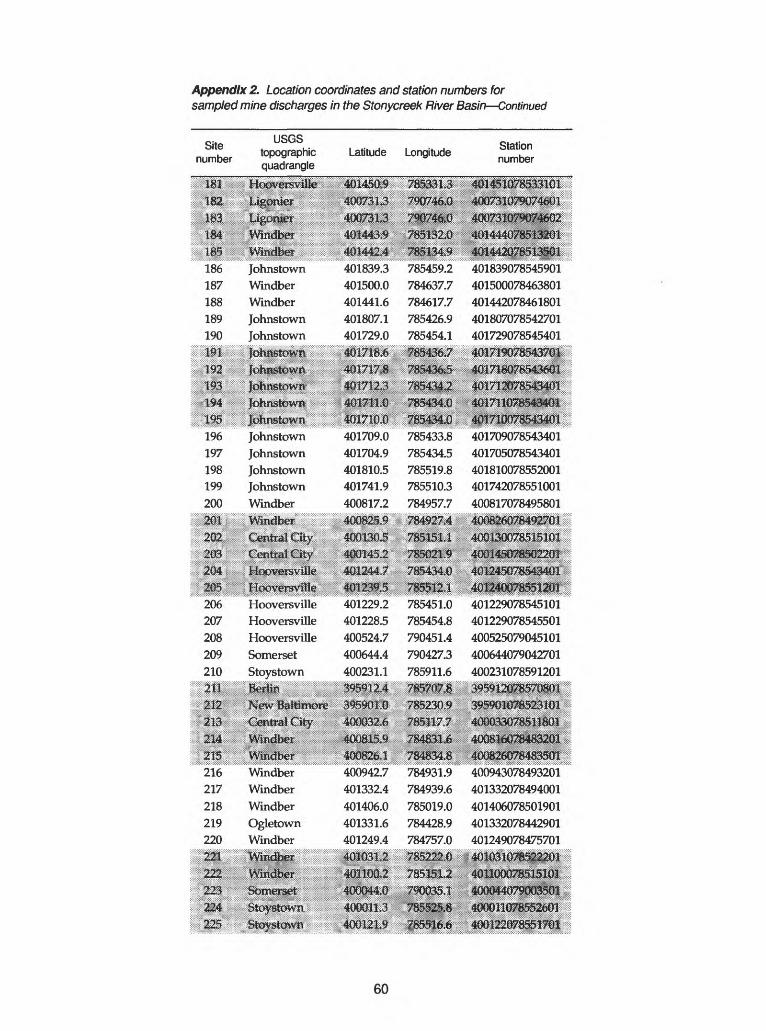
Appendix 2. Location coordinates and station numbers for sampled mine discharges in the Stonycreek River Basin Continued
uses _ .Slte topographic Latitude Longitude Stat!°n
quadrangle number
itPtlf182 Ligonierm.
186 Johnstown 401839.3 785459.2 401839078545901187 Windber 401500.0 784637.7 401500078463801188 Windber 401441.6 784617.7 401442078461801189 Johnstown 401807.1 785426.9 401807078542701190 Johnstown 401729.0 785454.1 401729078545401
IIBI! fyte&xmrft IQlFPi- ?!$43&i
196 Johnstown 401709.0 785433.8 401709078543401197 Johnstown 401704.9 785434.5 401705078543401198 Johnstown 401810.5 785519.8 401810078552001199 Johnstown 401741.9 785510.3 401742078551001200 Windber 400817.2 784957.7 400817078495801
CenttdtCMrKjveap t|9p#?p!<
206 Hooversville 401229.2 785451.0 401229078545101207 Hooversville 401228.5 785454.8 401229078545501208 Hooversville 400524.7 790451.4 400525079045101209 Somerset 400644.4 790427.3 400644079042701210 Stoystown 400231.1 785911.6 400231078591201
fas? d£| in $|pit$i3$T|||i I 78523M smg&iraw-i
4600m6
216 Windber 406942.7 784931.9 400943078493201217 Windber 401332.4 784939.6 401332078494001218 Windber 401406.0 785019.0 401406078501901219 Ogletown 401331.6 784428.9 401332078442901220 Windber 401249.4 784757.0 401249078475701
iS*S*7Tf> WinrfJSoT &C¥l 1 fifl ^> :::::::::-.-Jilili VVUltiUtfT ^iUllWUi^:
|l|g| Somerset 4GQCM«^ ?9somi mm$®Mmm$HIB i!6p&&**i 4l!6011il tSiSmiS 40QOHS785526D3
60
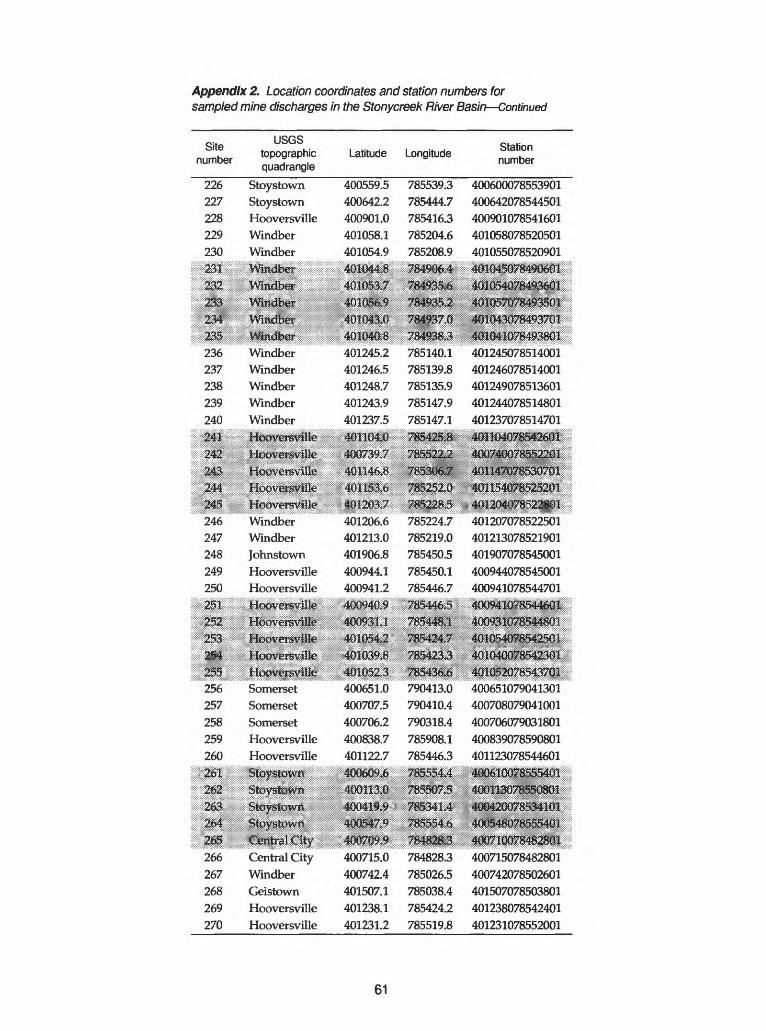
Appendix 2. Location coordinates and station numbers for sampled mine discharges in the Stonycreek River Basin Continued
Site number
USGS topographic quadrangle
Latitude Longitude Station number
226227228229230
m246247248249250
256257258259260wlies-im
266267268269270
StoystownStoystownHooversvilleWindberWindber
23*?33&2362372382392405HF"
lM
WindberSVMdberteste-WindberWindberWindberWindberWindber
:::> Jt4iBd**ieiip?
Huovetsw
WindberWindberJohnstownHooversvilleHooversville
SomersetSomersetSomersetHooversvilleHooversville
sirair&y Central City Windber Geistown Hooversville Hooversville
400559.5 785539.3400642.2 785444.7400901.0 785416.3401058.1 785204.6401054.9 785208.9
401206.6401213.0401906.8400944.1400941.2
S810S42
4810M
400651.0400707.5400706.2400838.7401122.7
400715.0400742.4
401507.1401238.1401231.2
400600078553901400642078544501400901078541601401058078520501401055078520901
401245.2 785140.1401246.5 785139.8401248.7 785135.9401243.9 785147.9401237.5 785147.1
401245078514001401246078514001401249078513601401244078514801401237078514701
W97&3 mmmmmm
785224.7785219.0785450.5785450.1785446.7
401207078522501401213078521901401907078545001400944078545001400941078544701
wwm78S424J 7854233 78S43&6 790413.0 790410.4 790318.4 785908.1 785446.3
wimmmmm400651079041301400708079041001400706079031801400839078590801401123078544601
784828.3785026.5785038.4785424.2785519.8
400715078482801400742078502601401507078503801401238078542401401231078552001
61

Appendix 3. Field data and laboratory analyses of mine discharges
[ft3/s, cubic foot per second; gal/min, gallon per minute; °C, degrees Celsius; nS/cm, microsiemen per centimeter at 25 degrees Celsius; mg/L, milligram per liter; <, less than; --, no data available]
Site number
Localidentifier
(Topographicquadrangle)
Date Time
Discharge, instan
taneous (ft3/*)
Flow rate, Temper- Specific pH, water
instan taneous (gal/min)
ature, water <°Q
conduc-field
Alkalinity, Residue at Carbon, water 105 °C, inorganic,
(mg/L as dissolved total CaCO3) (mg/L) (mg/L
asC)
Illf^lPi^pWll
II 2
m^m^m^ mm u
4 Hooversville
5 HooversvilleSSHij?;': ?S" '6
im m mm II:
S2: 40Wm Central r%:
1.1&*
08-18-93 171005-03-94 1040
17 Stoystown 06-25-92 084009-09-93 092008-31-93 0840
f^^^^^f^^^^^!^^^ 1Q&3&M
3.48.3
.63
.33
.34
ilU£250;1,5103,750
284
146151
W®
11.010.59.5
10.59.5
16-06-92 is,ms
1,780 3.11,760 2.9
728 3.3
780 3.4
774 3.3
3J
M.
m900
0
0
0
0
0
4614m if
2, 180
m
1,8501,630
544606596
404
04-21-94 1100ille 06-17-92 1330
08-18-93 134005-09-94 1520
ille 06-17-92 1430
1.1.78.20.95.76
501348
90429341
10.511.512.011.59.5
2,2201,7501,8001,310
708
2.72.83.32.74.5
00004
2,3601,5401,7401,140
602
16<1.0
7.013
1.0
M;
L -.--.. .-. ... «y^Jks&,4&tf -M - :*5L,x,:,.,,,a@ii5:.: 4>$2$ -- 2# x. -,. p l£m I?
89
1011
pn
05-09-94
Hooversville 06-17-92SomersetSomersetSomerset
06-18-9206-18-9206-18-92
^lliilill^itMr?*^
13301700073008150845
mm
.69
.01
.02
.27
.30M
3125.86.7
122136'Pfc
10.016.510.510.010.5TS&
8662,290
836805710
2.?§0
2.92.86.13.54.4&i
00
6202
130-
7982,640
688628628
urn
19<1.0
2.81.01.1
m
f *a*»*#| *fi$6;:;:¥:iJS:|J:;:g:jg:5;|:j:;:S|:¥!;:;J:;|J:¥Ji:g:|SgS:;:;;^^^ J:140
10-07-92 061508-18-93 153005-03-94 1215
15 Central City 06-24-92 174510-06-92 0945
1545
f:J:
ll:1.51.35.1
.21
.12
i t
*i^!
678584
2,300965656; 56
TS^iiPH
9!)10.510.010.59.5
Tipsfc#
Mgepeo1,1801,170
8801,4101,380
T- fYfcfft-
3,63,73.53.63.53.63.5
$ 1-
00000
y&960958
1,190792
1,2901,120
.*-.££l/i
%!st75.2
41291015&ll
27
23
2.5
11
12
62
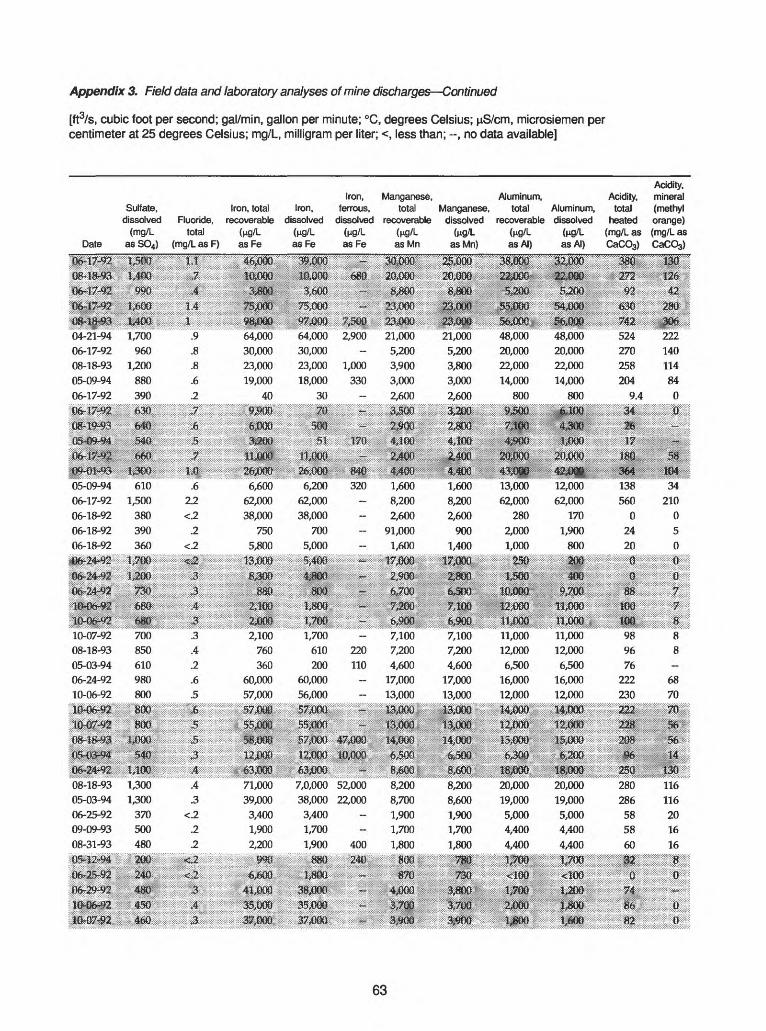
Appendix 3. Field data and laboratory analyses of mine discharges Continued
[ft3/s, cubic foot per second; gal/min, gallon per minute; °C, degrees Celsius; nS/cm, microsiemen per centimeter at 25 degrees Celsius; mg/L, milligram per liter; <, less than; --, no data available]
Date
Iron, Manganese,Sulfate, Iron, total Iron, ferrous, total Manganese,
dissolved Fluoride, recoverable dissolved dissolved recoverable dissolved(mg/L total (ng/L (ng/L (ng/L (ng/L (ng/L
asSO4) (mg/Las F) asFe as Fe as Fe asMn asMn)
Aluminum, Acidity,total Aluminum, total
recoverable dissolved heated(ng/L (Mg/L (mg/L asas Al) as Al) CaCO3)
Acidity, mineral (methyl orange) (mg/L as CaCO3)
04-21-94 06-17-92 08-18-93
05-09-94
06-17-92
mom m. mmt 22^000&S&3
I/HP1,700
9601,200
880
390
.9
.8
.8
.6
.2
ir
64,00030,000
23,000
19,000
40'mm
64,00030,000
23,000
18,000
30...,......^..
500
2,900 21,000
5,2001,000 3,900
330 3,000
2,600
21,0005,200
3,800
3,000
2,600
5&OPJ 48,000
20,000 22,000
14,000
800
48,00020,000
22,000
14,000
800
524270
258
204
9.4
126
3M222140
114
84
0-"IF
iifemm
10-07-92 08-18-93
05-03-94
06-24-92 10-06-92
08-18-9305-03-94
06-25-92 09-09-93 08-31-93lilpi'
;|ii|i2iPlii?
640J
20,
m§700850
610980
800
m& m.
a*:*:: Xmxi ftfKfff: *t jfWVJt^mmmg&ip10®
3 2,100 .4 760
.2 360
.6 60,000
.5 57,000
£
PP1,700
610
20060,000
56,000
J&00Q
220
110
7,1007,200
4,60017,000
13,000
I3ias0
fm &po7,1007,200
4,60017,000
13,000
mm
JM300sips11,00012,000
6,50016,000
12,000
(IP® 11,00012,000
6,50016,000
12,000
14,000ipoa
$M® 13001,300
370500480" r 'Wm
.4
.3
.2
.2::::^i::w>::::::::: ::>.^^i:ix"
J ,3
OTP6100071,000
39,0003,4001,900
2,200
moeo
7,0,000 52,000
38,000 22,0003,4001,700
1,900 400
8,2008,700
1,9001,700
1,800
4,000
8-600 8,200 8,600 1,900 1,700
1,800
3,800
&30ai&QOO20,00019,000
5,0004,400
4,400
18,00020,00019,000
5,0004,400
4,400
ysas L2SOmmi
IWm9896
76222
230
222
3P
JSQ280286585860
7$ 86
is-%fc®$&&05-09-94 06-17-92
06-18-92
06-18-92 06-18-92
BS
lj3QU610
1,500 380 390 360
t£ffi
m.6
2.2
.2
*3
:-FML 'HflO *5iC':nifW\ " 6"> WVv **O> v wv '
6,600 6,200 62,000 62,000 38,000 38,000
750 700 5,800 5,000
iliiiiiii^Ds
, 84$ 4:M30320 1,600
8,200
2,600
91,000
1,600
- irpa
M6G1,600 8,200
2,600
900
1,400
I5$p 2,800
43^00013,000 62,000
280 2,000 1,000
25®
:4&$qfc::.
12,000
62,000 170
1,900
800
aea
363, 138 560
0 24 20a
::IM
34 210
0
5
0
il
88
6870
5614
130116116201616
63
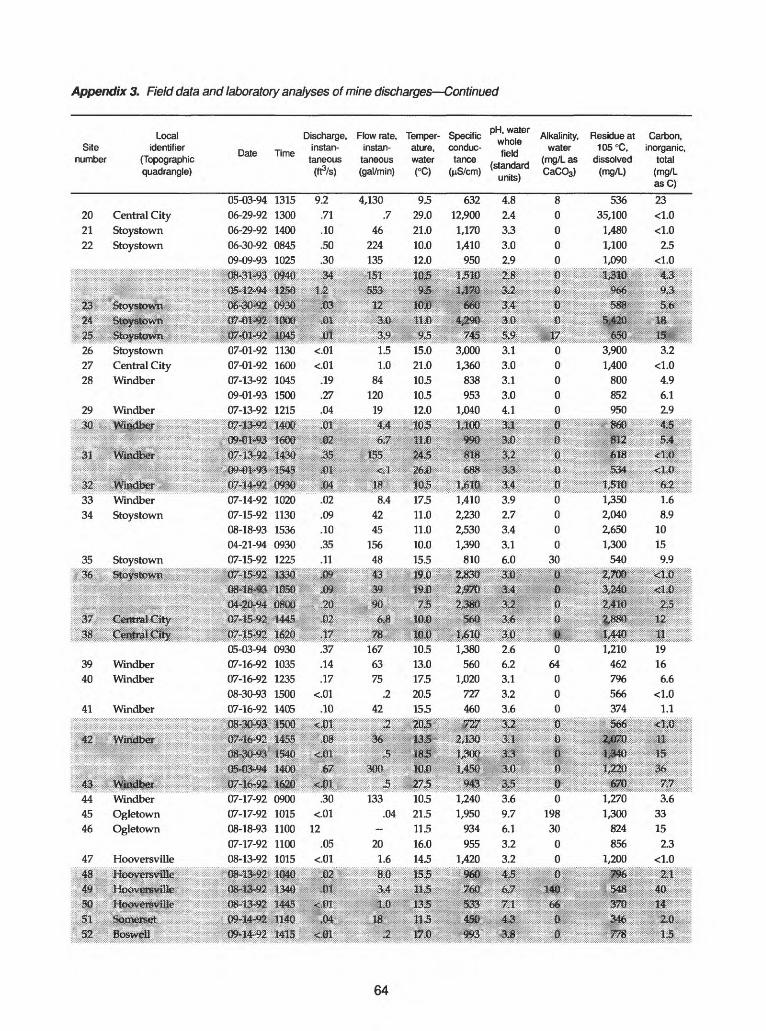
Appendix 3. Field data and laboratory analyses of mine discharges Continued
Sitenumber
202122
Localidentifier
(Topographicquadrangle)
Central CityStoystownStoystown
D
05-03-9406-29-9206-29-9206-30-9209-09-93
Time
13151300140008451025
ww
|:23;: - - - - - '";!" *
Sfcjvstdwtt
&> MZ^.:m$>& ;01o
Discharge,instan
taneous(ffrs)
9.2.71.10.50.30
.34I'vl
m
Flow rate,instan
taneous(gal/min)
4,130.7
46224135
55312
Temperature,water(°C)
9.529.021.010.012.0
mm$
Specificconductance
(nS/cm) '
63212,9001,1701,410
950
IWi*iS8>:
660
'h 1
fiplrillt?IU
f standardunits
4.82.43.33.02.9
£2;£4
Alkalinity,water
(mg/L asCaCO3)
80000
W08
Residue at105°C,
dissolved(mg/L)
53635,100
1,4801,1001,090
366;588
Carbon,inorganic,
total(mg/LasC)
23<1.0<1.0
2.5<1.0
43.9*3; i&«
26 Stoystown27 Central City28 Windber
29 Windber
07-01-92 113007-01-92 160007-13-92 104509-01-93 150007-13-92 1215
: ; :3T33 Windber34 Stoystown
35 Stoystown
07-14-92 102007-15-92 113008-18-93 153604-21-94 093007-15-92 1225
mmm mm
J44S,18.
39 Windber40 Windber
41 Windber
: 42 Windber
05-03-94 093007-16-92 103507-16-92 123508-30-93 150007-16-92 1405
145S
44 Windber45 Ogletown46 Ogletown
47 Hooversville
51
gss&gsg
.19
.27
.04m mm
.02
.09
.10
.35
.11
m2Q
W.37 .14 .17
.10
* JS
|pgiPJ||i^g|s;;y!;!^|.,:,.3007-17-92 0900
07-17-92 1015 <.0108-18-93 1100 1207-17-92 1100 .0508-13-92 1015 <.01
m m
1.51.0
84120
194,4&7
15.021.010.510.512.0DiM
3,0001,360
838953
1,040U6Q
999
3.13.03.13.04.1mMl
IS8.4
4245
15648
$B&17.511.011.010.015.5
ysii1,4102,2302,5301,390
810
i*3.92.73.43.16.0
1676375
42.2
J
133.04
201.6m
10.5 13.0 17.5 20.5 15.5 MS
J&fi
yep1,380
5601,020
727460
4138
M
2.6 6.23.13.2 3.6
10.5 21.5 11.5 16.0 14.5 PSm.
$&1,240 '3.6 1,950 9.7
934955
1,420960
6.1 3.2 3.2
531 XI450 4J993 3iB
0 0 0 0 0
0 0 fe
do000
30
H
P
0
64000
E)
P
""o"
19830
00
PW
(S
i
3,9001,400
800852950m®
III
1,3502,0402,6501,300
540
1,210462796566374 S6T
1,300824856
1,200
371
3.2
4.9 6.1 2.9
1.68.9
10159.9
19166.6
1.1
if36:
,, '
3315
2.3
21
H?
64

Appendix 3. Field data and laboratory analyses of mine discharges Continued
Date
05-03-94
06-29-92
06-29-92
06-30-92
09-09-93
;i;p8J3H93;piila: ;6fe-i30?W:
l||||p
07-01-92
07-01-92
07-13-92
09-01-93
07-13-92
Sulfate,dissolved
(mg/LasSO4)
370
27,000
630
750
880:^iBm360
3400
ii?.2,200
880
430
690
620
Fluoride,total
(mg/L as F)
0.2
4.2
<.2
.4
.4i:
#|;
&&*&£i.i
.4
.3
.3
.2
Iron, totalrecoverable
(ng/LasFe
16,000
4,760,000
6,900
30,000
24,000
Mil!nnr
380!;2 KMKJ$|0g>:
23,000
30,000
1,200
1,700
30
Iron,dissolved
(ng/Las Fe
14,000
4,360,000
7,600
30,000
23,000
111 ̂ SjilGP12%OD0
2W
J;^Bp$Pi>23,000
30,000
1,200
1,700
30
Iron,ferrous,
dissolved(ng/LasFe
220-
-
-
-
66Q
610^
^.~-
-
-
170-
Manganese,total
recoverable(ng/LasMn
2,700
60,000
7,100
7,500
7,400
wm2M:o--/\fvp(:' f-AKKJ
mfaim4i?i):
56,000
12,000
5,800
5,700
1,400
Manganese,dissolved
(ng/LasMn)
2,700
60,000
7,700
7,500
7,200
;8,7QQ
5p!0:
ijj3?Q&
*Hiij4jm
56,000
12,000
5,700
5,700
1,400
Aluminum,total
recoverable(ng/LasAI)
1,400
160,000
1,100
9,600
9,500
ujmmm*I2ip0&*sj|»
<&m55,000
42,000
10,000
12,000
7,100
Aluminum,dissolved
(nQ/LasAI)
910
160,000
1,200
9,500
9,200
11JPB
11,0198
rpQl
B^ljips*\m
55,000
42,000
9,900
12,000
7,100
Acidity,total
heated(mg/L asCaCOg)
52
19,688
62
200
174
23®
S2EJOSH40
JJP
490
420
100
114
52
Acidity,mineral(methylorange)(mg/L asCaCO3)
-
8.170
38
130
94
126
80m :|B$
100
120
32
28
0
&mm
07-17-9207-17-9208-18-9307-17-9208-13-92
m
05-03-94 84007-16-92 21007-16-92 42008-30-93 45007-16-92 200
85$
720860480490770spPS200206«
_ MK:|g|
pop mm
mm
34,000820
4,8003,4003,000
~ 0,500:34,000 25,000 4,400
390 - 6104,800 - 5,4003,200 400 13,0001,200 - 3,200
fiOfi
4,400600
5,40013,0003,200
31,000 <100
14,000 8,600 6,400
31,000 <100
14,000 8,300 4,500mm
140290
57,0007,500
38,000
-13JG
338308
m230
u*$
J48
Ip-wd07-14-9207-15-9208-18-9304-21-9407-15-92
J^MT
9&0860
1,2001^00
900300" iw:-r-
- 3
.3
.8
.9
.5
.2
?>l^330
32,00045,00012,0005,200;«;r'-- ^Jp::-
9W290
32,00044,00011,0004,800 pili-
--
2,8001,100
-*
4JKK?:5,700
14,00016,0006^003,200
42,000:
4.2QP5,700
14,00016,0006,5003,200
4;p0on
SJQ®5,000
21,00028,00010,000
1,600
ip^ii^
4100!5,000
21,00028,00010,000
200:-:.:-:-:.:.:-:-:-:o:-:»-,:|jj;Sjrt- -. . .-. . . . . .
£yS\J(t
M44
310404
--
0- ma
si.0
15020452
084:,
232
384 0
16410262
12G
1120
44289
"22
2fe>000;140<10
41,0007,300
37,000pso
m ; Q$@&?2^005,5004,7004,900
14,000- rtp-:
...9i$DD;s::sTsoo
1,5004,6004,900
14,000WO
;,.:;«K;s^j80l&*5,4004,200<130
22,0009,2003,200
m: :^$jj(j&mm5,400
730<130
22,0008,900ilif
xm$Mjysm:m$........ _.................
056
210 4192 6
II
mm i/200
65
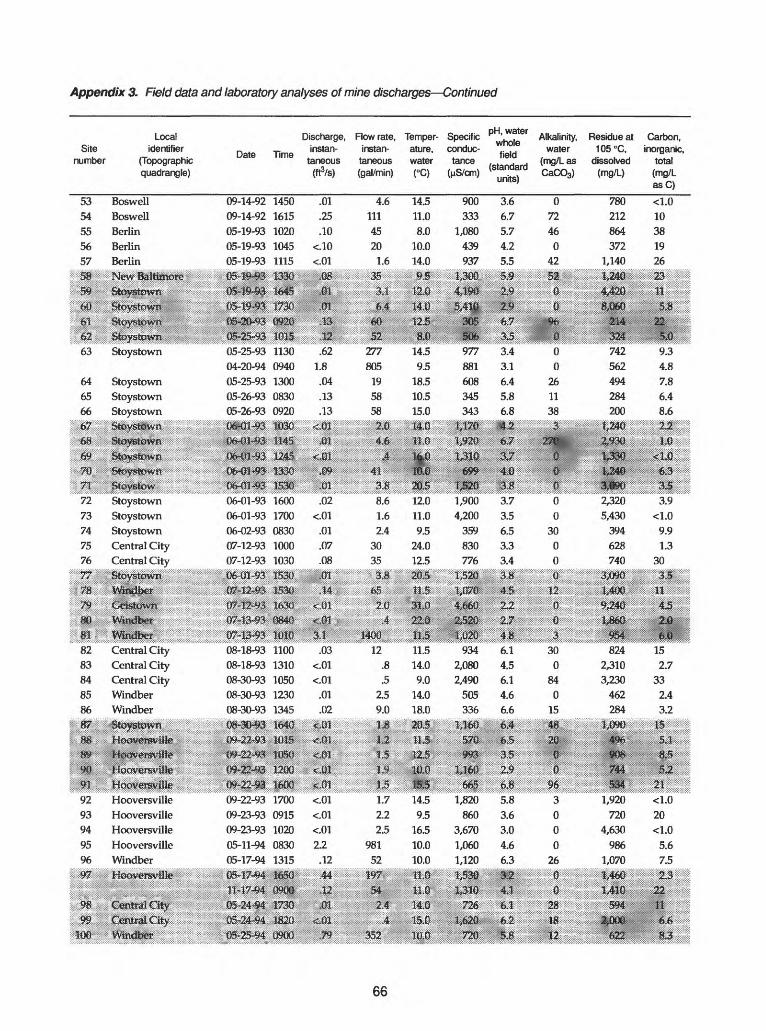
Appendix 3. Field data and laboratory analyses of mine discharges Continued
Local Site identifier
number (Topographic quadrangle)
5354555657
isa
isUrntea
63
646566
BoswellBoswellBerlinBerlinBerlin
Mfe^ BalttHtotfiStovstowrv
^y^evwiSfcjystown:;Stoystown
StoystownStoystownStoystown
Date
09-14-9209-14-9205-19-9305-19-9305-19-93
mm$$mmm
pg-2(*.Q3m^m05-25-9304-20-9405-25-9305-26-9305-26-93
Time
14501615102010451115
Ti33ft164S
Q92&1!QM11300940130008300920
Discharge, Flow rate, instan- instan
taneous taneous (frVs) (gal/min)
.01
.25
.10<.10<.01
.DP
t,33J&.62
1.8.04.13.13
4.61114520
1.6
M
fi*
es32
277805
195858
Temper ature, water (°C)
14.511.08.0
10.014.095
MOoisM
14.59.5
18.510.515.0
:» W&|,_
iS;.. ! '
Z?:%Q
1^1;72
73
74
75
76
llP^
f|' $8
Stoystown$&y#f&»$
S^5^0S!^B
Sfoysfow
StoystownStoystownStoystownCentral CityCentral City
,.S&ystdSwnWitidkef
&&&&&OMS .$$
OMJ1 *9-?:
8&&M®06-01-9306-01-9306-02-9307-12-9307-12-93
GfcftlsSStffiMM
IMSm&
3i33&:3i3&16001700083010001030 isp:368ti
,ua
<J33rP£:
J9L
.02<.01
.01
.07
.08S* m?-"*"-"
*l&
*&
&41
3J:|8.61.62.4
3035
srpg;;;fig
i&a
10,02@iS:12.011.09.5
24.012.5
:T'SiK|:::r
^|J:
Specific conduc tance
(nS/cm)
900333
1,080439937
L38Q
sS3D?506977881608345343
IP*
|y2pysiQj
165^'EJ211,9004,200
359830776
";;s3|p|01jd5?0:
pH, water whole field
(standard units)
3.66.75.74.25.5-*S
1*J
&7m3.43.16.45.86.8
Alkalinity, water
(mg/L as CaC03)
07246
042
52
f
% «
00
261138
Residue at 105°C,
dissolved (mg/L)
780212864372
1,140L240
IS21432i742562494284200
Carbon, inorganic,
total (mg/L asC)
<1.010381926
2^111
m ' " "
$&9.34.87.86.48.6
,.&& >|; :^g|p;;5pisss;^2||;s
^
4,0m3.73.56.53.33.4
"""'33|""';;:;:;s
4J<
^9:"0:
£00
3000;';r';.pr "'
si
) u'ili'i1fi ?iNTyT
L2403piE2,3205,430
394628740
:3jP& :
1*$
*«-sLS
;6>3333.9
<1.09.91.3
303;5s;
11
Hi82 83 84 85 86
. S'Smdbiet: ............................Central City Central City Central City Windber Windber
as
9293949596
P*8 08-18-93 1100 08-18-93 1310 08-30-93 1050 08-30-93 1230 08-30-93 1345
Wffi
<m£3
.03
2320: 2.7
.01
.02fe$
12.8.5
2.59.0
11.514.09.0
14.018.0
9342,0802,490505336
6.14.56.14.66.6
300
840
15
1290 irJ3
Hooversville Hooversville Hooversville Hooversville Windber
09-22-93 170009-23-93 091509-23-93 102005-11-94 083005-17-94 1315
mmm
mm
2.2 .12J4- m m
1.7 2.2 2.5
981 52
J9f
im
14.5 1,8209.5 860
16.5 3,67010.0 1,06010.0 1,120
m
sj
5.8 3.6 3.0 4.6 6.3il4:1
6.1
3 0 0 0
26 I
8242,3103,230
462284
XlvIv.vSSTOv:
1,920720
4,630986
1,070
594
152.7
332.43.2
is
13
20
5.6 7.5
66
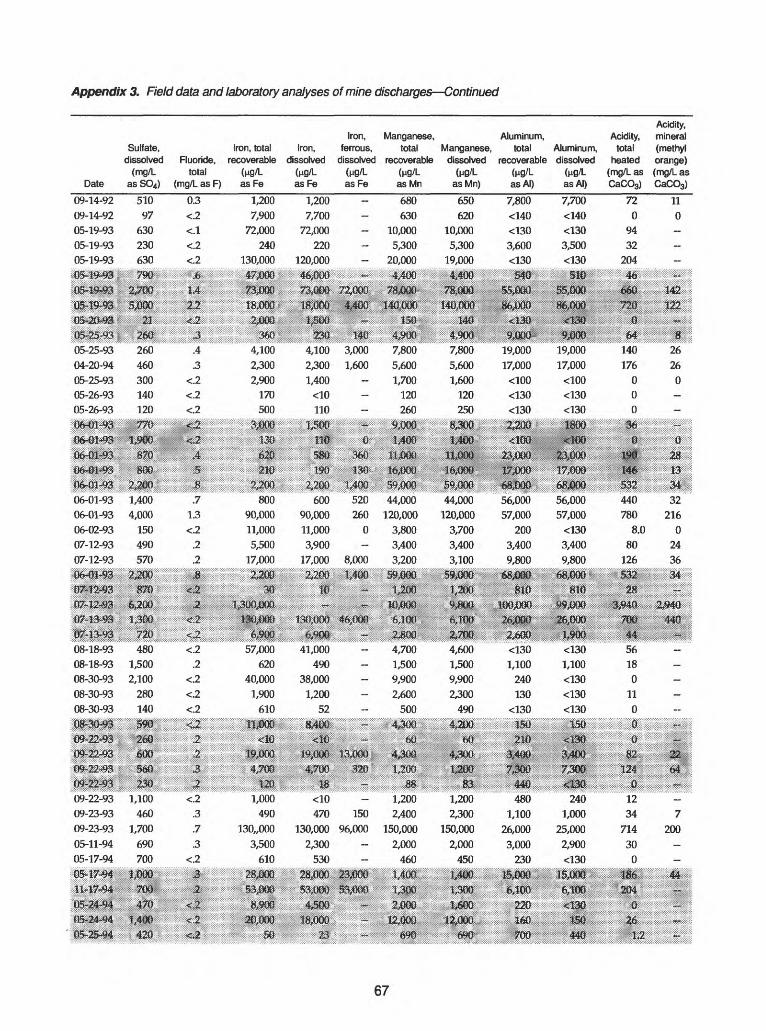
Appendix 3. Field data and laboratory analyses of mine discharges Continued
Date
09-14-92
09-14-92
05-19-93
05-19-93
05-19-93
iiysMpi
Sulfate,dissolved
(mg/Las SO4)
510
97
630
230
630
79®
Fluoride,total
(mg/L as F)
0.3
<.2
<.l
<.2
<.2
&
Iron, totalrecoverable
(PO/LasFe
1,200
7,900
72,000
240
130,000
il$fc
Iron,dissolved
fcg/LasFe
1,200
7,700
72,000
220
120,000
S&IP
Iron,ferrous,
dissolved(^g/LasFe
-
-
-
-
-
~
Manganese,total
recoverablefug/las Mn
680
630
10,000
5,300
20,000
M09
Manganese,dissolved
fag/LasMn)
650
620
10,000
5,300
19,000
fe4QQ
Aluminum,total
recoverable<w/LasAI)
7,800
<140
<130
3,600
<130
®*0
Aluminum,dissolved
fag/las Al)
7,700
<140
<130
3,500
<130
Sifi
Acidity,total
heated(mg/L asCaCO3)
72
0
94
32
204
46
Acidity,mineral(methylorange)(mg/L asCaCO3)
11
0-
-
-
~
Iplpaliiip:05-25-93
04-20-94
05-25-93 05-26-93 05-26-93
08-18-93 08-18-93 08-30-93 08-30-93 08-30-93
21
9260460300140120
m
6,200
in.480
1,5002,100
280140wa
600
J3| 09-22-93 1,100 09-23-93 460 09-23-93 1,700 05-11-94 690 05-17-94 700
U30D
mm
1.4 1,2
^:.
.4
.3
06-01-9306-01-9306-02-9307-12-9307-12-93
1,4004,000150490570
.71.3<.2.2.2
.2
m4,1002,3002,900
170500
80090,00011,0005,500
17,000
m
Plili
57,000620
40,0001,900
610
1,000490
130,,0003,500
610
733300 22,000 ISaJDD 4480;
55,000
4,100 3,000 7,8002,300 1,600 5,6001,400 - 1,700
<10 - 120110 - 260
!40,n(X) hh,000
^9007,8005,6001,600
120250
iiliir1,400
19,00017,000
<100<130<130
19,000 17,000
<100 <130 <130 1800
wornliDJD 1,400
600 520 44,00090,000 260 120,00011,000 0 3,8003,900 - 3,400
17,000 8,000 3,200
44,000120,000
3,7003,4003,100
56,00057,000
2003,4009,800
*te# mm68.00056,00057,000
<1303,4009,800
m
I -JH;UEto
ijm
26,000
41,000490
38,0001,200
52
4,7001,5009,9002,600
500
17004,6001,5009,9002,300
490%2oa
Hf)
<1301,100
240130
<130
2-P
<130 1,100 <130 <130 <130
13W
140176
000
0
440780
8.080
126
M32
2160
2436
lip
44Q
56180
110
m
<10470 150
130,000 96,000 2,300
530
1,2002,400
150,0002,000
460
wm
1,2002,300
150,0002,000
450
4801,100
26,0003,000
230
2401,000
25,0002,900<130
poo; 2286,100£136:
1234
71430
0186204
7
200
44
memm L2
67

Appendix 3. Field data and laboratory analyses of mine discharges Continued
Site number
101102103
104si
iflS;
J%IP
109110
111112
P3:
fl!4:
||||:Ifc1117
118119120121122g»' :-^
Local identifier
(Topographic quadrangle)
WindberWindberWindber
Windber
Stoystown:C5erttraJ<^rmmvm
JohnstownGeistown
WindberWindberWINfoerWindber6V$P$befWinclberBeayetdkleBeaverdaleHooversvilleHooversvilleHooversvilleHooversvilleJKiiSi^ei'!^^
Date
05-25-9405-25-9405-25-9411-17-9405-25-94t>l7**J4
lOS^fe&i;86<$&*|
06-14-9406-14-9411-21-9406-20-9406-22-94
3M-94:fle^2^4fyij&mwm+mMr^M4:
06-27-9406-27-9406-27-9406-28-9406-28-94
:'-''"''''':.::®6^N*i
Discharge,Time tinstan-
taneous(ftVs)
100012301310104514001110Uft401305
IQBi 11201300125010501115meIM*
H»*13QPmo11301550164508100840
10930? '""
.26
.03
.97
.07
.4485mjii
m,.40
1.0.88.07.03
Flow rate, instan
taneous (gal/min)
11715
43633
200mM
-Sj
180449396
3012
Temper- Specific ' Alkalinity, Residue at Carbon, ature, conduc- .. . .e water 105°C, inorganic, water tance . ' . (mg/L as dissolved total (°C) (jiS/cm) . . CaCOs) (mg/L) (mg/L
units) asC)
10.513.010.510.011.0ma.1:21
^
15.513.012.512.010.0
1310186
13503,1102,4002p0-
£B&tH
1,2301,2201,420
9921,430
3.24.73.22.73.03J:
Wn7m5.94.53.03.43.5
000000d^4
440000
1,180270
1,2503,7802,270Mm.
2p!W528 542
1,20013101,2601,0001,530
3.51.53.32.43.62JJ?Pbj
12 2.34.6
112.13.1
;02;i M:; £&& 1-jpD &&iuisi
J@;05
<.01.01.02
3.4<.01M
MW
15;£l
.34.07.5
1,510.2
s&ff
Piimw®M&19.015.520.012.018.0J&0 v
y?!QIJ^Q3.41Q2i4^02,380
177810718
5,010ip;rs0iw«
%5a*Mr
:-SJ
2.65.03.26.02.9
§:6&x
«i9QQ030
180
3.^10289S1,490$MQ3,150
140474662
10,880
<^M3$Mm&m1.45.91.09.42.7^ ,,,., :,.
[W
1*42Illl-:
Windber
WindberWindberStoystownStoystownJohnstown
m126127128129130
Ip4-
136 Hooversville137 Hooversville138 Geistown139 Geistown140 Geistown
M
mm
07-06-94 110007-06-94 115007-06-94 162007-06-94 170007-07-94 0840
ww
.06
.06
.04
.56
1026
1.32817
250°m43
17.5 1,43022.5 234012.5 1,52014.5 2,06012.0 1,170JTyj : ' :ggi|
m
2.9 2.63.63.7 3.9
07-14-94 075007-14-94 084007-21-94 101007-21-94 110007-21-94 1130
Geistown
.02
.40
.03
.06
m m
7.5180
1.61327
m
10.0 288 6.69.5 360 5.3
18.0 1,280 2.716.5 2,520 2.616.5 3,090 2.5
m3^20
86 6 0 0 0 P-
i 0
mmIPP137023701,6902,5501,150
234352
13602,6003,270
msM
1.2 8.0 7.5 1.2
5.6 5.5 5.3 4.6 5.6
22,0* He
68
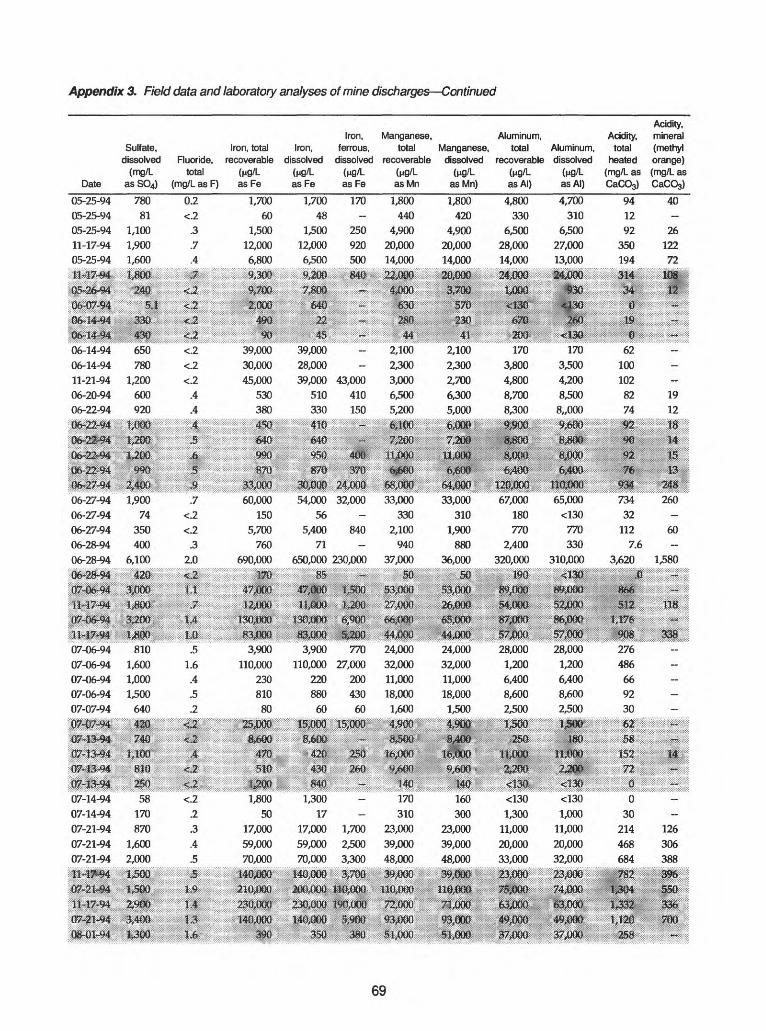
Appendix 3. Field data and laboratory analyses of mine discharges Continued
Date
05-25-94
05-25-94
05-25-94
11-17-94
05-25-94
liiiklirOlia|plii#4m^m06-14-94
06-14-94
11-21-94
06-20-94
06-22-94
.^U% $$fM$&
06-27-94
06-27-94
06-27-94
06-28-94
06-28-94
Sulfate, dissolved
(mg/L as SO4)
780
81
1,100
1,900
1,600y*P
248;
336
430
650
780
1,200
600
920
%2D&;S90:
1,900
74
350
400
6,100
Iron, total Fluoride, recoverable
total (ng/L (mg/L as F) as Fe
0.2
<.2
.3
.7
.4J
«£2
ll-si<.2
<.2
<.2
.4
.4
: «
3.
.7
<2
<.2
.3
2.0
1,700
60
1,500
12,000
6,800
fittlilpf*
490*%
39,000
30,000
45,000
530
380
4%
640
S!
j%0po60,000
150
5,700
760
690,000
Iron, dissolved
asFe
1,700
48
1,500
12,000
6,500
Illl^iofi^ £800
MS
4i-39,000
28,000
39,000
510
330
640
mJfojaOQ
54,000
56
5,400
71
650,000
Iron, ferrous,
dissolved(H9/L asFe
170-
250
920
500
PSP
~
~:
-
-
43,000
410
150
Aim
24i$00:32,000
-
840-
230,000
;;:G]^28M. .^^^^W3^^^^^^^^" ' ~8i " 3s
Manganese, total
recoverable
asMn
1,800
440
4,900
20,00014,000
i&(3t$:4,000
m
44
2,100
2,300
3,000
6,500
5,200
S£68;000
33,000
330
2,100
940
37,000
5MHM
Aluminum, Acidity, Manganese, total Aluminum, total
dissolved recoverable dissolved heated (ng/L (n9/L (n9/L (mg/L as
asMn) asAI) asAI) CaCO3)
1,800
420
4,900
20,000
14,000
283300
|P
ft:2,100
2,300
2,700
6,300
5,000
12Tra$W
:§>60Q
MjBOP
33,000
310
1,900
880
36,000
m&m
4,800
330
6,500
28,000
14,000
mmipa
200
170
3,800
4,800
8,700
8,300
MB
w&lm67,000
180
770
2,400
320,000. . . . . . .-.-. . . . . . . .;*j/jrt>v
'tiii fifiri-'O-T^t-JiAJ
4,700
310
6,500
27,000
13,000
23P0®5
JS*rm.
170
3,500
4,200
8,500
8,,000:^0Q
6,400110,000 65,000
<130
770
330
310,000
tfetito
94
12
92
350
194
Wt
0
isP
62
100
102
82
74
m m92
934:
734
32
112
7.6
3,620
*/
Acidity, mineral (methyl orange) (mg/L as CaCOs)
40-
26
122
72
108
12
»
-
-
-
19
12
m148
260--
60--
1,580
T
Mil^:
07-14-94 07-14-94 07-21-94 07-21-94 07-21-94
07-06-94 81007-06-94 1,60007-06-94 1,00007-06-94 1,50007-07-94 640
5RB)
1100
&1 .5
1.6 .4 .5 .2
3,900 3,900 770 24,000110,000 110,000 27,000 32,000
230 220 200 11,000810 880 430 18,000
80 60 60 1,600
24,00032,00011,00018,000
1,500
28,0001,2006,400
8,600
2,500
28,0001,2006,400
8,600
2,500ipa
WM
,.,..M,58
170870
1,6002,000
1,800 50
17,000
59,000
70,000
&0,Q0G
1,30017
17,000 1,70059,000 2,50070,000 3,300
140,000
170310
23,00039,000
48,000
160300
23,00039,000
48,000
<130I,300
II,000 20,000 33,000
<130I,000
II,000 20,000 32,000
imp72$90;MBS
mm*
276486
66
9230
W:
030
214468
684
m.
m
J80
126306388m-55i
336
m
69

Appendix 3. Field data and laboratory analyses of mine discharges Continued
Local Site identifier
number (Topographic quadrangle)
144145
146147
148I49:
*||Sff;l|Sil
StoystownCentral City
StoystownJohnstown
JohnstownJohnstown
JoJ>nsKM*nStoystown
Date
08-01-9408-01-94
08-01-9408-10-94
08-10-94
d&$&,$4IIHZli-94;mmmfi?T2.M2
Discharge,T. instan- Time .
taneous(ffrs)
11501415
10500920
1010
JI3&1:QOP124?1L4S
.41
.01
<.01<.01
<.01;&9
m-d&
My|2- y& m
153154155156
rpri;'i§8(;Jss; 1601
161
162
163164
Stoystown
Stoystown
Stoystown
Stoystown
' ;ig5y^tif3wJK^iii^|;
Sfa$YStOWR
StoystownStoystown
Stoystown
Stoystown
StoystownHooversville
07-21-92
07-21-92
07-21-92
07-22-92
08-17-93
W-ZZ&'Sii*MM&0^*22^1W-&v$05-09-94
07-22-9207-23-92
07-23-9207-23-92
1320
143516001130
1135
i&iyist&IS!§*&
mm1635
1620
0945
1025
1130
<.01
.06
.04
.08
.10
m^J3S;
,8*
m
.60
.04
.01
<.01
.22
Flow rate, Temper- Specific instan- ature, conduc-
taneous water tance (gal/min) (°C) (nS/cm)
1854.9
1.1.5
.2
10S84
LeIMass
.3
2820
36
45
mJS
IfIF!!no272
20
5.0
2.097
11.013.0
25.021.0
21.5|gi:j)
11;$
2<p
NPIBp9.5
17.0
14.012.5
14.0
ilvSlil&§tub10.5
15.5
16.0
16.0
11.0
1,5902,600
1,0301350
1,480
&4:80
mm&m'W
W9700
1,640
2,200
2,2002,220
pH, water
field (standard
units)
6.06.26.76.86.3If£7mf&
&&
6.33.53.23.53.8
Alkalinity, Residue at Carbon, water 105°C, inorganic,
(mg/L as dissolved total CaCO3) (mg/L) (mg/L
asC)
100140
3888
70
4B
66412l*$§&:26
0
0
00
1,8503,410
9561,300
1,770
2,840O10p60
MPw676
1,170
2,390
2,210
2,4202P0P-:
4>616y?w1,836ysis13701,3802,1701,9901,680
Sift
fcfrJil
M2.9
3.2
3.1
3.02.8
u
SP0fl0
0
0
0
0
E^tiOu
U?9L460i^TS1,1801,1602,1701,8601,500
9.412
6.74.6
3.0
3.F3i;lli|
**;
3612
1.2
1.1
31
14?P
2<S^y ̂«s
10
<1.0
<1.0
2.7
2.9
lannstoivit
166 Hooversville
167 Berlin
168 New Baltimore Qua
£5
07-24-92 0940
09-01-93 1000
05-09-94 1100 08-03-92 1025 08-03-92 -
ggiQ^ag^ iffQwm&- mm
P Berlin J3^| BipsweiJ:
.03
.01
.17
.03
.01 Mm
.If
134.0775.02.3
12.016.010.512.012.5
2,2702,5201,960665
1,180
2.72.62.53.56.0
0
0
00
38
m31
173 Boswell174 Boswell
175 Boswell
176 Boswell
09-02-93 0830 <.01 <.l 18.6 1,460 2.9 0
08-05-92 111508-05-92 1155
08-05-92 1315
08-05-92 1530
09^02^93 0928Mi-.t&"54 t)$2t!i
1.0.02
.01
.73
M
Mi
470
7.5
5.0330
39!
1$
10.513.0
15.5
11.0
t£0
n&
1,4601450
1,060
890967
3UJO»
6.25.0
3.2
5.9SJ:
&z
10012
034
mm
7m:|,620
mm 2JOO
:-:->i^^^:-:- x-^SFWSL--;*
mtwM
5^80 2,420
2,660
1,710 574
1,070
fern
288
1,070
1,1801,200
708
760
1.6
5.9
4.818If :
16
1,4
8.123135.7
15
m
70
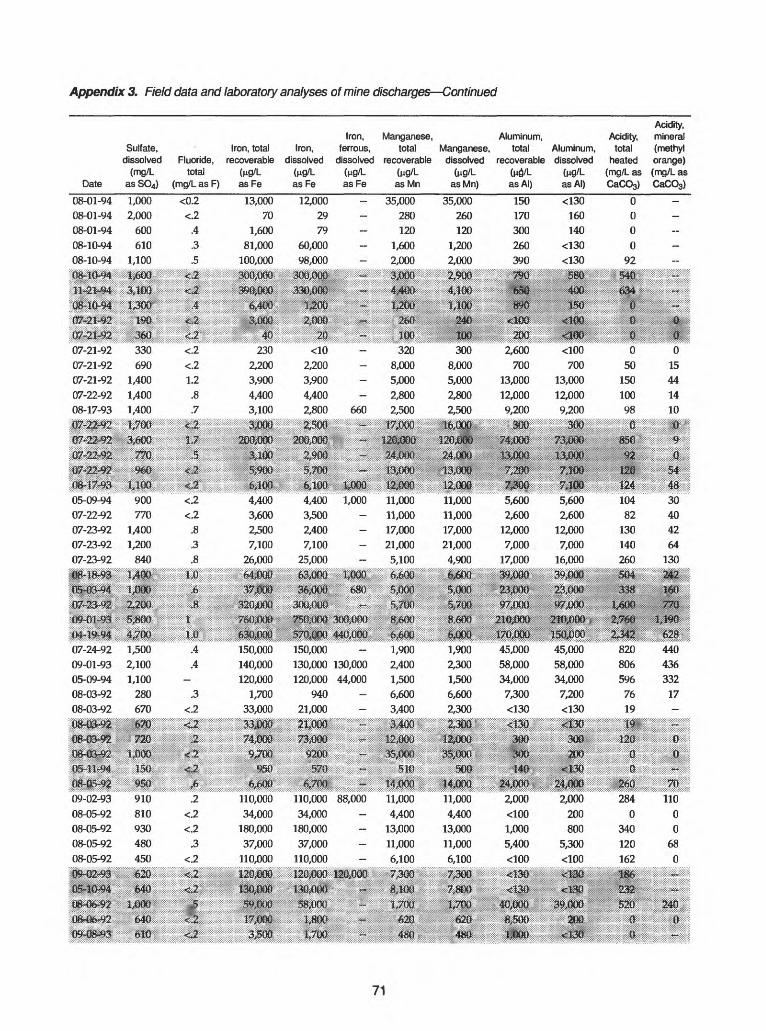
Appendix 3. Field data and laboratory analyses of mine discharges Continued
Date
08-01-94
08-01-94
08-01-94
08-10-94
08-10-94
OliMt^Mt
INPH
ltth$ii
Sulfate,dissolved
(mg/Las SO4)
1,0002,000
600610
1,100jygjpjQ;
J3I&ism
Fluoride,total
(mg/L as F)
<0.2
<.2
.4
.3
.5.&£
*J
A
Iron, totalrecoverable
(ng/LasFe
13,000
70
1,600
81,000
100,000
:300fji000>
39&00f«p&:
Iron,Iron, ferrous,
dissolved dissolved(ng/L (ng/Las Fe as Fe
12,0002979
60,00098,000
~t
TMl!B
%Z0D *
Manganese,total
recoverable(ng/LasMn
35,000
280
120
1,600
2,000
mm4,4001p3ii
Manganese,dissolved
(ng/LasMn)
35,000
260
120
1,200
2,000
2il90D:
1P&
t>IP
Aluminum,total
recoverable(no/las Al)
150
170
300
260
390
?9$
(Mw$
Aluminum,dissolved
(ng/LasAI)
<130160140
<130<130
580<m*$&
Acidity,total
heated(mg/L asCaC03)
0000
92540b34
¥
Acidity, mineral(methylorange)(mg/L asCaCO3)
-----±*
r-_.
,
*
09-02-93 08-05-92 08-05-92 08-05-92 08-05-92
07-24-92 1,50009-01-93 2,10005-09-94 1,10008-03-92 28008-03-92 670
910810930
480
450
640
648
07-21-9207-21-9207-21-9207-22-9208-17-93
J^2j2&f21|SM22r92IN
05-09-9407-22-9207-23-9207-23-9207-23-92
330690
1,4001,4001,400mmmm
776
jy$900770
1,4001,200
840
""""<.2
<.21.2
.8
.7
2302,2003,9004,4003,100
<102,2003,9004,4002,800 660
*i
o;5
<l<.2<.2
.8
.3
.8
2CJ0i00&!P0&
l^4,4003,6002,5007,100
26,000
2S00iQ0 ^M
S urn4,400 1,0003,5002,4007,100
25,000
3208,0005,0002,8002,500wm
WMMU#t&
t2»11,00011,00017,00021,0005,100
JZ
150,000140,000120,000
1,70033,000
i®^150,000130,000 130,000120,000 44,000
940
21,000
1,9002,4001,5006,6003,400
950
.3
110,00034,000
180,00037,000
110,000m00s
110,00034,000
180,00037,000
110,000
88,000 11,0004,400
13,00011,0006,100
120,000: 120,000: 7^380
im* m480
3008,0005,0002,8002,500
11,00011,00017,00021,0004,900
1,9002,3001,5006,6002,300lios
11,0004,400
13,00011,0006,100
1,700
4BO
%m2,600
70013,00012,0009,200
<100700
13,00012,0009,200
mm
5,6002,600
12,0007,000
17,000
5,6002,600
12,0007,000
16,000
45,00058,00034,000
7,300<130
45,00058,00034,000
7,200<130
2,000 <100 1,000 5,400 <100
200
050
15010098
015441410
8
12012410482
130140260
820806596
7619
t20
30404264
130
440436332
17
2,000200800
5,300<100<!&<T3G
3&00Q
2840
340120162
186232S21
11000
680 *~
240Itm>
71
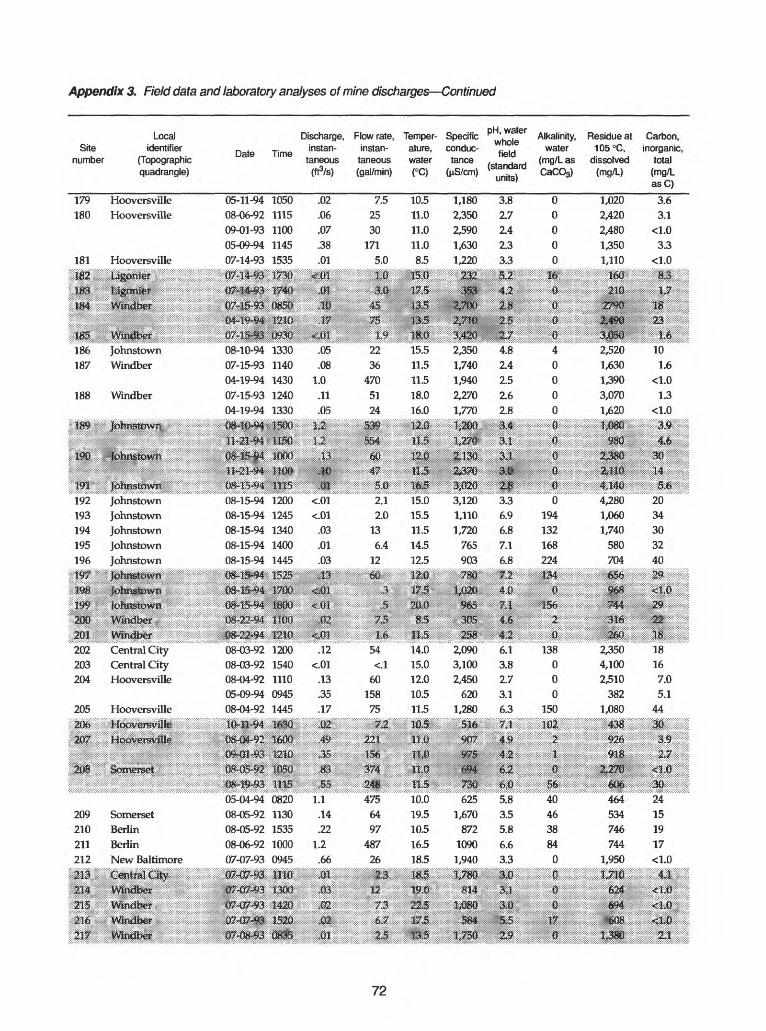
Appendix 3. Field data and laboratory analyses of mine discharges Continued
Site number
179
180
181
|p2083
tN
Localidentifier
(Topographic quadrangle)
Hooversville
Hooversville
Hooversville
jLlgomer
] :learti£JiVaibr
Date
05-11-94
08-06-92
09-01-93
05-09-94
07-14-93
tW M
®7-%$jjf$
wj&rn.
Time
1050
1115
1100
1145
1535
&%
wm085G
Discharge,instan
taneous (frVs)
.02
.06
.07
.38
.01«m
.01
,30
Flow rate,instan
taneous (gal/min)
7.5
25
30
171
5.0
1,0;
3Mm
Temperature, water (°C)
10.5
11.0
11.0
11.0
8.5
I5.p
imm
Specificconduc tance
(nS/cm)
1,180
2,350
2,590
1,630
1,220
2323BS
1P>
pH, waterwholefield
(standard units)
3.8
2.7
2.4
2.3
3.3
M4$
is
Alkalinity,water
0
0
0
0
0
mf
Residue at105°C,
dissolved (mg/L)
1,020
2,420
2,480
1,350
1,110
PJfeiiS
aS
Carbon,inorganic,
total (mg/L asC)
3.6
3.1
<1.0
3.3
<1.0
l||;ji j?: !m
209210211212
IIPlib
m
186 Johnstown187 Windber
188 Windber
IIP :;! J||i|!bS1K ^;Jl
&*''?£.. j&f^i-iz-- Ji3 m$3$$il$Mii$
08-10^94 133007-15-93 114004-19-94 143007-15-93 124004-19-94 1330
II|fOs^9g
Johnstown Johnstown Johnstown Johnstown Johnstown
s|p TfiftndberJ|pt WiShJiber202 Central City203 Central City204 Hooversville
205 Hooversville
StHnerset
SomersetBerlinBerlinNew Baltimore
Windber tVindb^r
.05
.081.0
.11
.053iJE1,1
2236
4705124
53$5pi
15.511.511.518.016.01i2ii&&
2,3501,7401,9402,2701,770ipo:y^
4.82.42.52.62.83$&i
40000
©
2,5201,6301,3903,0701,620
m
101.6
<1.01.3
<1.01$£
4J6$4 W
wwti&MM
08-03-92 120008-03-92 154008-04-92 111005-09-94 094508-04-92 1445
lose
0820 08-05-92 1130 08-05-92 1535 08-06-92 1000 07-07-93 0945
14201520
.12
.13
.35
.17
M
m81
Yi.14 .22
1.2 .66 M
M,
54
6015875
:/«
m
14.0 2,09015.0 3,10012.0 2,45010.5 62011.5 1,280
j^p «EJ?rip s»zp
. ^ »w_ .
mmm
475649748726
m m
m
10.0 19.5 1,670 10.5 872 16.5 1090 18.5 1,940
HP 1,780 814mm
6.1 3.8 2.7 3.1 6.3
m
5.8 3.5 5.8 6.6 3.3
m
138000
150
H
i
404638840
8:00
2,3504,1002,510382
1,080
mmSI8;
m14
tfM-NS 31\§08-15-94 120008-15-94 124508-15-94 134008-15-94 140008-15-94 1445
m<.01<.01
.03
.01
.03
ifr2.12.0
136.4
12
16.515.015.511.514.512.5
SMQ3,1201,1101,720
765903
m3.36.96.87.16.8
(]0
194132168224
lift).4,2801,0601,740
580704
1*2034303240
m
18167.05.144
m m m
534746744
1,950
24151917
72
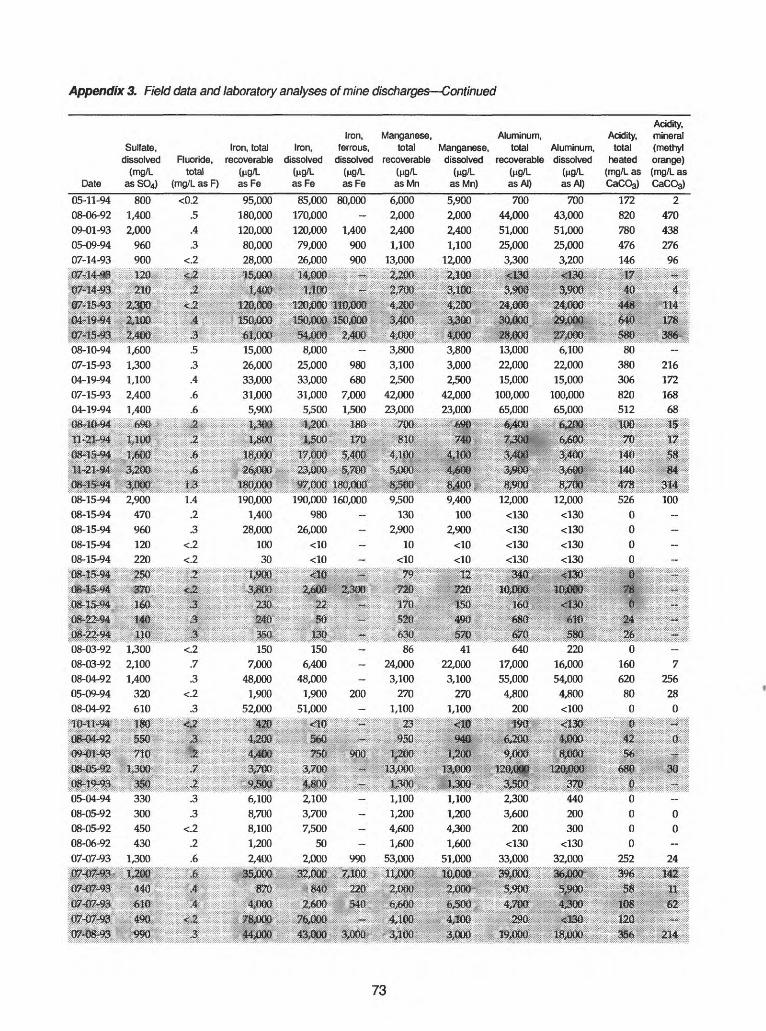
Appendix 3. Field data and laboratory analyses of mine discharges Continued
Date05-11-9408-06-9209-01-9305-09-9407-14-93
H^'&ilpISN&sii|(|Z_fFjJ9i
Sulfate,dissolved
(mg/Las SO4)
8001,4002,000
960900*P
2li2,300
Fluoride,total
(mg/L as F)
<0.2.5.4.3
<.2<>2
J
&3
Iron, totalrecoverable
(ng/LasFe
95,000180,000120,00080,00028,000
?i,efi|w>
i2o;00t
Iron,dissolved
fog/las Fe
85,000170,000120,00079,00026,000
lllfllPI
&SPBQ
Iron,ferrous,
dissolvedfug/las Fe
80,000-
1,400900900
~.<~.
IIMS
Manganese,total
recoverable(Mg/LasMn
6,0002,0002,4001,100
13,000
lil*4-z%g®£280
Manganese,dissolved
(ng/LasMn)
5,9002,0002,4001,100
12,000
mm&JBQODD
Aluminum,total
recoverablefog/las Al)
70044,00051,00025,0003,300*>P0
&3B02&£08
Aluminum,dissolved
(MQ/LasAI)
70043,00051,00025,0003,200<i3B3»
2%006
Acidity,total
heated(mg/L asCaCO3)
172820780476146
w40
MS
Acidity,mineral(methylorange)(mg/L asCaCO3)
247043827696«
41*4
08-10-94 07-15-93 04-19-94 07-15-93 04-19-94
08-15-94 08-15-94 08-15-94 08-15-94 08-15-94
08-03-92 08-03-92 08-04-92 05-09-94 08-04-92
05-04-94 08-05-92 08-05-92 08-06-92 07-07-93
1,6001,3001,1002,4001,400
&ji-
2,900470960120220
; *!!§'
i&j
M.1,3002,1001,400
320610
550
330300450430
1,300wm
440
.5
.3
.4
.6
.6ill 1'
.6
1.4 .2 .3
mm
j
<.2 .7 .3
J
15,00026,00033,00031,0005,900
8,00025,00033,00031,0005,500
-
980680
7,0001,500
?SJ5;:S;ia^:J?iSKiSS-:1H«|i|Sri: 1 JIA :»S:?:¥S-jB$^.::>:>:>S:;::&:: :.lf4\j\f -1 BU
3,8003,1002,500
42,00023,000
m
3,8003,0002,500
42,00023,000
13,00022,00015,000
100,00065,000
6,10022,00015,000
100,00065,000
80380306820512
2161721686811
IP 6-600mms
190,0001,400
28,00010030
l^OjOE* 190,000 160,000
980 26,000
8J8Q9,500
1302,900
10
9,400100
2,900
1507,000
48,0001,900
52,0004W
1,2064408
:2JDS 2^300 720m r, m
150 - 866,400 - 24,000
48,000 - 3,1001,900 200 270
51,000 - 1,100
4pj
4122,000
3,100270
1,100
MO
p&iy#$3MMJ
12,000<130<130<130<130
psffiwm1100
12,000<130<130<130<130
|4ut"«J
45B:526
0000
mm
314100-- ~
.^^^^mm^^^m^mrn^f^m^ff^^
64017,00055,0004,800
200»
22016,00054,0004,800<100mm
6
3*
016062080
0
II
7256
280
- w$m.3
.3
.2
.6
.4&
6,1008,7008,1001,2002,400
2,1663,7007,500
502,000
£JD&&*&
~---
990O00
226:
1,1001,2004,6001,600
53,0001JMJ8D:2,8tM
1,1001,2004,3001,600
51,000t0,8Q02,006
2,3003,600
200<130
33,0003%@Q8§ni
440200300
<13032,000mms
1^1)
'"""""6"""""
000
252m&IP
0
0
24
IPm
4J08 296:
4JQS 168;
Wl:
73
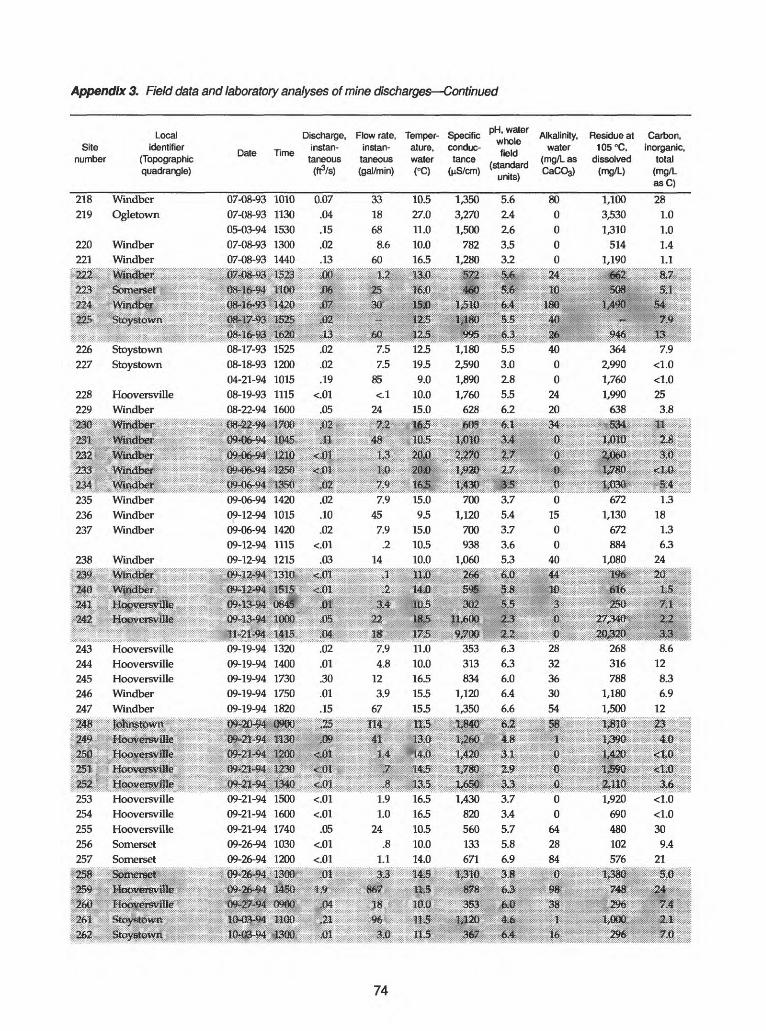
Appendix 3. Field data and laboratory analyses of mine discharges Continued
Local Site identifier
number (Topographic quadrangle)
218219
220221
\$&\*£&;!ltlx8l1226227
228229
p*0
ffcf|32liasHP*
235236237
238I.J3I
WindberOgletown
WindberWindberWi^berSomerset
:fic|)ier;56&vrgtowft
StoystownStoystown
HooversvilleWindber\%dfeerVyiiSdfeefWtndberWindberW&yfeerWindberWindberWindber
Windber'-'-' : :^i|a|^^T WKKWX-^HK -
07-08-9307-08-9305-03-9407-08-9307-08-93
*ErM*yI^HP-N«PtP?38&KM®SSHMJ08-17-9308-18-9304-21-9408-19-9308-22-94
f#H22HN09^36^d&iforM
tju^ig^I*Mfe«4
09-06-9409-12-9409-06-9409-12-9409-12-94
IpSKSgl 5
Time
101011301530130014401523itgP1438mmi M15251200101511151600P$*
HBH&yy*1256
lit14201015142011151215
sHJia '"
Discharge, Flow rate, instan- instan
taneous taneous (frVs) (gal/min)
0.07.04.15.02.13;p06
.67mm
.02
.02
.19<.01
.05&Mi
<ms&Oi;
,01.02.10.02
<.01.03
iiiils
331868
8.660
UZ5
:30*
&D7.57.5
85<.l
24I$M
48titS'
TUl^? -0:
7.945
7.9.2
14iiiilP^lslf
Temper- Specific ature, conduc- water tance (°C) (nS/cm)
10.527.011.010.016.5
3 III16DmuipIP12.519.59.0
10.015.0m&i;Qi§jp21,016.515.09.5
15.010.510.0
r:1ii:iiii::s:;;
1,3503,2701,500
7821,280llir460
im&yt^j*s
1,1802^901,8901,760
628605
l£&^?ffi;«at*1.430;
7001,120
700938
1,060?::2ife"
whole field
5.62.42.63.53.2&&Mi6.4SIS;efel5.53.02.85.56.2 &1
MPZW-
liS3.75.43.73.65.3mwr-^
Alkalinity, Residue at water 105°C,
(mg/L as dissolved CaCO3) (mg/L)
800000
24to
180mP40
00
2420mMm0P0
1500
40r-""M"'
1,1003,5301,310
5141,190
662503
1,490~
M364
2,9901,7601,990
638sm
IMtiism*1,7®Pyj3@.
6721,130
672884
1,080:.>:.x.x.x,.x.:-:.x-x.||||x,.>x.
Carbon, inorganic,
total (mg/L asC)
281.01.01.41.1
tep»
117.9
<1.0<1.025
3.8
%& '"""
m^33$
m1.3
181.36.3
24:':'xHa;x":':':':'w':'!
243244245246247
Hoover«!$Ue HoeversveOte
HooversvilleHooversvilleHooversvilleWindberWindber
I {oosersvilie 1 looversviHe
111,253254255256257
HooversvilleHooversvilleHooversvilleSomersetSomerset
MboversviHe
M MM
tm&m
09-19-94 132009-19-94 140009-19-94 173009-19-94 175009-19-94 1820
m
.02
.01
.30
.01
.15
M7.94.8
123.9
67114
Bi.11.010.016.515.515.5ms-
.ilfe353313834
1,1201,350tJNS:
%£-6.36.36.06.46.6&2
12832363054
mm 413:4 Eflifli
14;J W8&
09-21-94 150009-21-94 160009-21-94 174009-26-94 103009-26-94 1200
<.01 <.01
.05 <.01 <.01m
m, 11 ipom
268316788
1,1801,500l$il
mm
128.36.9
12
M1.91.0
24.8
1.1£3
{#£>
IS
JS;5i16.516.510.510.014.0i||.iistie
J^Q; ......1,430
820560133671
IIP-gSH
353
iM3.73.45.75.86.918k&bM
............. ,..-®L , .........00
642884&
3$
38
.....1^31®:,,1,920
690480102576
!ii89i:748
m
-^lis<1.0<1.030
9.421
m24
?M
74
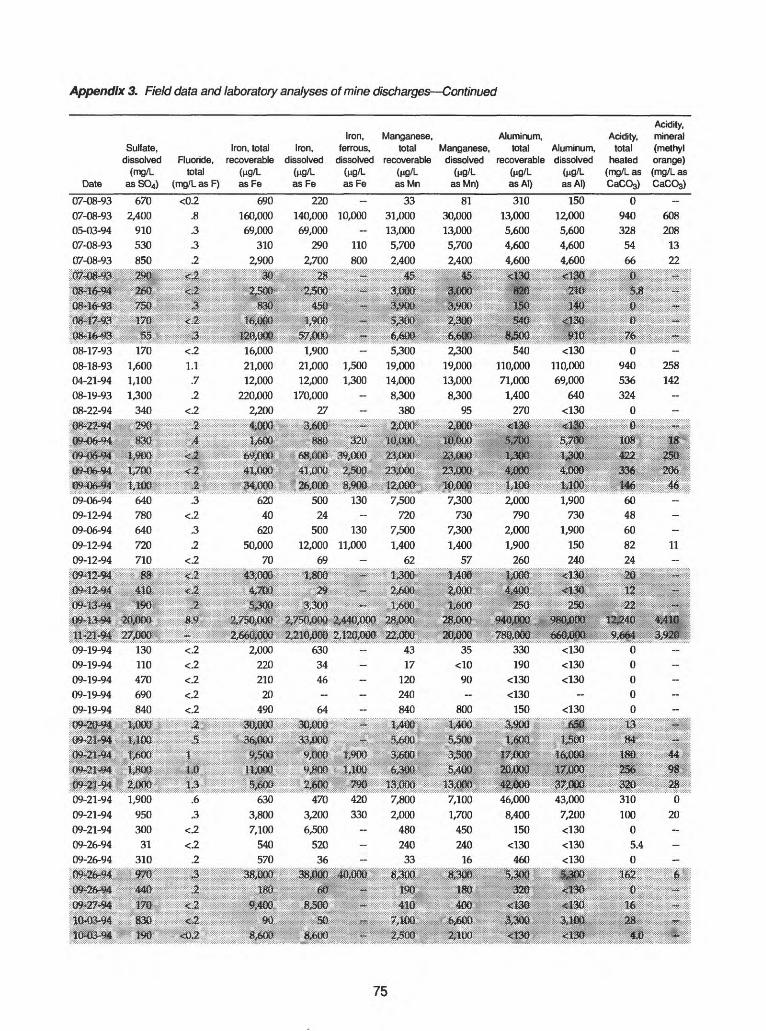
Appendix 3. Field data and laboratory analyses of mine discharges Continued
Date
07-08-93
07-08-93
05-03-94
07-08-93
07-08-93
w&$&?j&^IMM1|fH<&93^Mms*JJM&$&08-17-93
08-18-93
04-21-94
08-19-93
08-22-94
Sulfate, dissolved
(mg/L as SO4)
670
2,400
910
530
850
260
7M
120
II170
1,600
1,100
1,300
340
Fluoride, total
(mg/L as F)
<0.2
.8
.3
.3
.2
.3-
.<y1*
<.2
1.1
.7
.2
««£
Iron, total recoverable
asFe
690
160,000
69,000
310
2,900
BM:
%,&P
lH&P
16,000
21,000
12,000
220,000
2,200
mm^ii:
Iron, dissolved
as Fe
220
140,000
69,000
290
2,700
2J0fr«PJ
pp1 ^i?yil?:
1,900
21,000
12,000
170,000
Iron, ferrous,
dissolved
asFe
-
10,000-
110
800
*-
:+**
-
1,500
1,300-
Manganese, total
recoverable
asMn
33
31,000
13,000
5,700
2,400
4i
3£JQU:
lilN*6,601,1
5^00
19,000
14,000
8,300
27 - 380
Manganese, dissolved
asMn)
81
30,000
13,000
5,700
2,400
M
'!?$&isefr6,600
2,300
19,000
13,000
8,300
95
Aluminum, total
recoverable
asAI)
310
13,000
5,600
4,600
4,600
w&l*e:
&58Q;
540
110,000
71,000
1,400
270
Aluminum, dissolved
asAI)
150
12,000
5,600
4,600
4,600
3&&<W®mv
<130
110,000
69,000
640
<130
<am
Acidity, total
heated (mg/L as CaCO3)
0
940
328
54
66
¥Pm0
940
536
324
0
Acidity, mineral (methyl orange) (mg/L as CaCO3)
-
608
208
13
22
~~~-
**>
-
258
142-
H*:W;SS*!g;;si
3K30&SliD®;1,900
7301,900
150240
3361466048608224
296:
M---
11-
75

Appendix 3. Field data and laboratory analyses of mine discharges Continued
Sitenumber
263
264
265
266
267
DP].$£&
Localidentifier
(Topographic quadrangle)
Stoystown
Stoystown
Central City
Central City
Windber
%&*&*&lipo^ej-svlle
Date
10-03-94
10-03-94
10-11-94
10-11-94
10-11-94
&>-$-&!
fIFW-94;
Time
1630
1710
0930
1010
1110
m&1/45
Discharge,instan
taneous (frVs)
0.01
<.01
<.01
<.01
<.01
mM
Flow rate,instan
taneous (gal/min)
4.8
1.6
1.2
.8
.4
m4.8
Temperature,water
15.5
13.5
9.5
8.0
10.5
1*.?&L-8
Specificconductance
(nS/cm)
1,290
2,570
1,270
2,160
210
1>2SPmm
pH, water
field(standard
units)
6.5
6.4
6.3
6.8
6.6
&3It?
Alkalinity,water
(mg/L as CaC03)
54
340
84
168
90
640
Residue at105°C,
dissolved (mg/L)
1,340
3,090-
1,650
148
PSBi;$M
Carbon,inorganic.
total (mg/L asC)
14
97
9.2
44
26
^111
^yilllmm
76
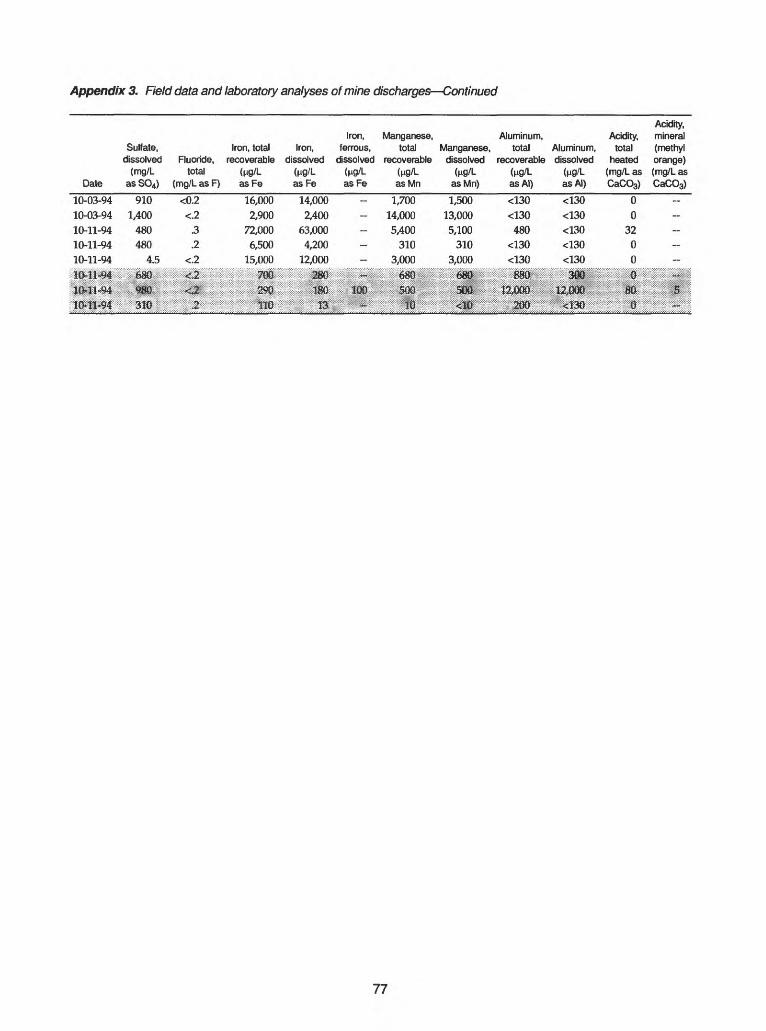
Appendix 3. Field data and laboratory analyses of mine discharges Continued
Date
10-03-94
10-03-94
10-11-94
10-11-94
10-11-94
mmm
mmm
Sulfate,dissolved
(mg/Las SO4)
910
1,400
480
480
4.5
680*»ia
. . 318..
Fluoride,total
(mg/L as F)
<0.2
<.2
.3
.2
<.2
*M£<£'
M
Iron, totalrecoverable
(M9/LasFe
16,000
2,900
72,000
6,500
15,000
m290
................IK*,.
Iron,dissolved
(M9/Las Fe
14,000
2,400
63,000
4,200
12,000
m188;
13
Iron,ferrous,
dissolved(M9/LasFe
-
-
-
-
-
»
100
,,.,.,,,.:*::.,.,
Manganese,total
recoverable(M9/LasMn
1,700
14,000
5,400
310
3,000
680
m::,:::,:;,,,JPs:::::;:::::::::
Manganese,dissolved
(M9/LasMn)
1,500
13,000
5,100
310
3,000
J68Q
500
::::..K<i&Q..«
Aluminum,total
recoverable(ng/LasAI)
<130
<130
480<130
<130
888
12,000
m^m&s^
Aluminum,dissolved
(ng/LasAI)
<130
<130
<130<130
<130
3M
12,000
.^Sllfe;::.:.,
Acidity,total
heated(mg/L asCaC03)
0
0
32
0
0
8rf&
,...,.,,-,::«is
Acidity,mineral(methylorange)(mg/L asCaCO3)
-
-
-
-
-*-
i :
,,,i.:::,,s«S>,,.:
77
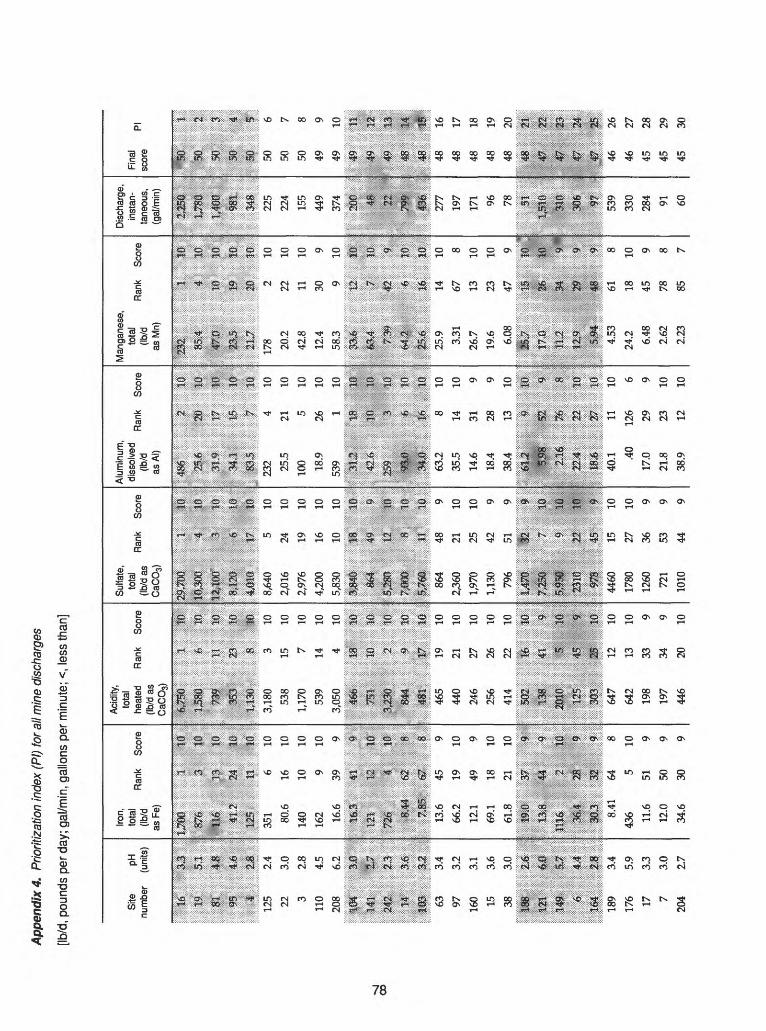
App
endi
x 4.
Prio
ritiz
atio
n in
dex
(PI)
for a
ll m
ine
disc
harg
es
[Ib/d
, pou
nds
per d
ay; g
al/m
in, g
allo
ns p
er m
inut
e; <
, les
s th
an]
Site
pH
nu
mbe
r (u
nits)
"
: ; :*
£
>&
:*
-:
.*U
w
rt*
If
S3:
'
81
48
i
m
&&
iii
;:,4:
M;
:
125
2.4
22
3.0
3 2.
8
110
4.5
208
6.2
mm
. V
-
242:
2J
:
M
M:
Itfl
ife
i>>!
T...:
ft
wJr
®1
.*&
$&.$
63
3.4
97
3.2
160
3.1
15
3.6
38
3.0
123
&0
349
5gr
5 :'4*
4
189
3.4
176
5.9
17
3.3
7 3.
0
204
2.7
Iron,
55!
Rank
Sc
ore
(ib/d
asFe
)
:325S
3
10
US
13
16
:4'iL
;? 24
lu
351
6 10
80.6
16
10
140
10
10
162
9 10
16.6
39
9
12*
li
16
72«
4 IS
8,*4
m
iJ:;:,
;,;;JJ
5:,.
..J&
Jptf
c;13
.6
45
9
66.2
19
10
12.1
49
9
69.1
18
10
61.8
21
10
1 im
m
9ra
ft T
m ':
; 3&
4 28
9
;:
8.41
64
8
436
5 10
11.6
51
9
12.0
50
9
34.6
30
9
Acid
ity,
tota
l he
ated
Ra
nk
Scor
e (Ib
/d a
s C
aCO
3)
rs *
*!
?39
p
m
I^V
&i
515
S'H
:
^ffc
* j&
y!
-^-i
j ;
1 l^
fr
v -
M
KM
ftASS
fi:
:i
* r "
i&S:
:&
ii*f^
:
3,18
0 3
10
538
15
10
1,17
0 7
10
539
14
10
3,05
0 4
10is!
-"'"
is H
b- ;
:3J3
0 2
IS:
|
: 84
4 9
10
I 4
8r:
;S:to,
1?
16
465
19
10
440
21
10
246
27
10
256
26
10
414
22
10
f
|ft
i: 13
B:
m
*
\ m
m
s m
\ 13
S 4S
^*&-
647
12
10
642
13
10
198
33
9
197
34
9
446
20
10
Sulfa
te,
.....
Rank
Sc
ore
CaC
03)
1 1'
ilj:, I
P)
3 ifl
8,64
0 5
10
2,01
6 24
10
2,97
6 19
10
4,20
0 16
10
5,83
0 10
10
A&
m
9 \
S.28
9 n
P
j1/m
:8
10
!
IPO;
:;v»i
;a% -
^
^l1
I86
4 48
9
2,36
0 21
10
1,97
0 25
10
1,13
0 42
9
796
51
9i;p
i?'':':'w
'"^l*
;;': sH
^250
7
m
\m
m
s 10:
!
L ...
~.^
^44
60
15
10
1780
27
10
1260
36
9
721
53
9
1010
44
9
Alu
min
um,
diss
olve
d n
. _
(Ib/d
Ra
nk
Scor
e
asA
I)
3|iif
i |U
J.U
:
i TJ
9
:̂3?
]:0;
232
4 10
25.5
21
10
100
5 10
18.9
26
10
539
1 10
U "
S T
;P
i; P
mt)
K
i
^Illll
%&
a|||||;
63.2
8
10
35.5
14
10
14.6
31
9
18.4
28
9
38.4
13
10
^ :£
iH!P
::: if i
iiPI
''SJS
: S9
: 1
j
Mfe
2fe
i: PJ:
<
^1
P
1
|
40.1
11
10
.40
126
6
17.0
29
9
21.8
23
10
38.9
12
10
Man
gane
se,
(Ib/d
Ra
nk
^cor
e
asM
n)
rill
" t
"10:
I1
MM
4
m
I\
45
^ 10
ID
: !
i f?
«S
1$
10;
!
i m~
r .20
10:
i17
8 2
10
20.2
22
10
42.8
11
10
12.4
30
9
58.3
9
10
&&S
? IP
i f J
» :4l
4:
^fe?
§i
Jf|^
::||^
li
If ,,
;25
.9
14
10
3.31
67
8
26.7
13
10
19.6
23
10
6.08
47
9
&&
&
li
i
JM
P
»
:J^L
^
4.53
61
8
24.2
18
10
6.48
45
9
2.62
78
8
2.23
85
7
Dis
char
ge,
inst
an
tane
ous,
(g
al/m
in)
1JPO
;
L400 981
225
224
155
449
374
\ ^n
1 22
- ;
799;
j\m
-^f:
\f^.
277
197
171 96 78
i ^i
J1;fi
: !
:: ^
!|
306
;
539
330
284 91 60
Fina
l sc
ore
: ,.«
:;ii
*S:
50.
||
i 50
, II
i <P
i!|
?:M
1
1
50
6
50
7
50
8
49
9
49
10
:; .A
Q
^fj
f^
~7Tf
\ -*
*;::v
49
l||
48
s||
|;;u m
d||;
48
16
48
17
48
18
48
19
48
2048
:!:':':
:::||j
W
SI
w
z||
m
fl|
46
26
46
27
45
28
45
29
45
30
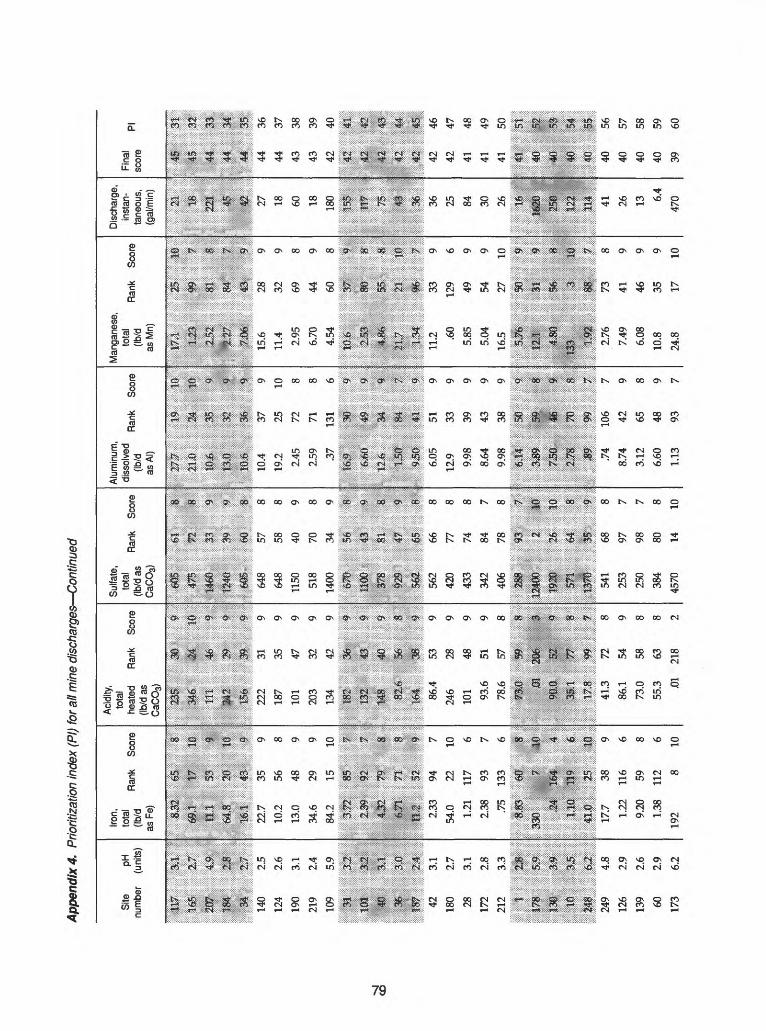
App
endi
x 4.
Prio
ritiz
atio
n in
dex
(PI)
for a
ll m
ine
disc
harg
es C
ontin
ued
Site
pH
nu
mbe
r (u
nits)
' ' :T.;
J?
avi:
:
107
$#
iis*
2j
; I
&&
9 !7
: :
.... t
£75T
v
*i|>
'?v
./
140
2.5
124
2.6
190
3.1
219
2.4
109
5.9
&
MW
l 36
2;m
m
iS&
' .i
pii
lfi
1 Q
lT.
^'-J
l*i
Qr/'
: .
4-<3
42
3.1
180
2.7
28
3.1
172
2.8
212
3.3
i ;%
r ;:
Pt
Mm
M
,
i &$
^P"
&£
249
4.8
126
2.9
139
2.6
60
2.9
173
6.2
Iron,
/!L^i
Ran
k Sc
ore
(\o/Q
asFe
)
: o
il3
*:
Qt$
: ' '
''!&
''''.x
::;W
'!':'''i
691
15*
Ifl
BLl
S?
:964
.8
21
ID
$64,
,,J
3;
1.. ;:
22.7
35
9
10.2
56
8
13.0
48
9
34.6
29
9
84.2
15
10
mz
m.1.
39
8!?'
;7
&32
7®
8
i fei
STi
71
8
$3$
53
|2.
33
94
7
54.0
22
10
1.21
11
7 6
2.38
93
7
.75
133
6
3&B3
-$
*^^A
: -^
T
ill
^
B&
4-
4;
i,w
m
e:-^
$ .-25
10
17.7
38
9
1.22
11
6 6
9.20
59
8
1.38
11
2 6
192
8 10
Acid
ity,
tota
l he
ated
Ra
nk
Scor
e (Ib
/d a
s C
aCO
3)
: 34
6',:
M
m
\
m
-p
i J
j 2*2
m
i
i^
-m.
., M
. .,,
*... 1
222
31
9
187
35
9
101
47
9
203
32
9
134
42
9
1 1 t3
2 43
*
i -<
J:£g
4
0
itji
:
82:4
m
&.
m.
.m
*.86
.4
53
9
246
28
9
101
48
9
93.6
51
9
78.6
57
8
= ?W
*«
$ f
m 20
6 >
«0iQ
RT
^
3&1
^
a17J
B m
f
41.3
72
8
86.1
54
9
73.0
58
8
55.3
63
8
.01
218
2
Sulfa
te,
...°
a Ra
nk
Scor
e
CaC
O3)
4:5*5:
72
S
|
t4fe
fj 33
|
I
J^M
m
». i
: .. e^
s;.
. *$
.. ., ,J
.. .i
648
57
8
648
58
8
1150
40
9
518
70
8
1400
34
9
^JP
'SS
S-
i !
1380
;: 43
. &
5M
m
Si :
S29::
i45
T 9:
: 56
Z:,
. ;^
5 i
^56
2 66
8
420
77
8
433
74
8
342
84
7
406
78
8
i $$
!||f i
s
r:
:-l*
,TW
W
:j£
JtH
; |
mm
26
1C
:
55N
;64
Si
.HH
;3§
^
541
68
8
253
97
7
250
98
7
384
80
8
4570
14
10
Alu
min
um,
'Th/
fT
Rank
^°
°re
asA
I)
: V
? §f
ir
^ '
:¥:¥?
:¥: jj
fti
|P»
2ft;
P
pJi
S|
: :«
i&$
^' :?
,, Ji
S
. ,31
,., .;:
;,, JU
10.4
37
9
19.2
25
10
2.45
72
8
2.59
71
8
.37
131
6
mm
&
$ \
s,ki
$&
« I
O:f
t ^
9
: ^J§
:S
4 ?
j
:- aJ
di
,;41
a !
6.05
51
9
12.9
33
9
9.98
39
9
8.64
43
9
9.98
38
9
M*"
s|
: %
I*i
flQ
: ;C
Q
ifi;
: w
^Os?
-:
-IS!
" O
: ;
7JD
:: ;4
S i
2>*8
:. :3^
) 8:
i
M
99
5*
.74
106
7
8.74
42
9
3.12
65
8
6.60
48
9
1.13
93
7
Man
gane
se,
.? f
. R
ank
Scor
e
asM
n)
P'S "
j *
:' 6,
iEW
O
tt
t?'
i .^>
¥ d
rL
*$30
&
.:,-4
3:,.....
^ :9
;
15.6
28
9
11.4
32
9
2.95
69
8
6.70
44
9
4.54
60
8
::^pP
^
.||*
"'I
ff :||
,J,:i53
^ :;i|&
: S
: 4K
B:
||
£
: .I
JtJ
23
||:;
j!J|
| :;i
^,
:|
11.2
33
9
.60
129
6
5.85
49
9
5.04
54
9
16.5
27
10
P&
::$
0:
**
^J
M
*4
,M
:§fe:
s
133
:4
::$
;
1,9
J:;
Hi
J
!
2.76
73
8
7.49
41
9
6.08
46
9
10.8
35
9
24.8
17
10
Dis
char
ge,
inst
an
tane
ous,
(g
al/m
in)
[ |
j
! 22
3 I
\ m
I
,:,.>
P.:
ft,j
27 18 60 18 180
F P!
i
ft7
:
^
i »*
!
L M-
'.. i
36 25 84 30 26i
$r i!
'1
Mo
1 m
i ^1
:i II
I 41 26 13 6.4
470
Fina
l sc
ore
r::lP
*ii(
|j:
e i
ii:y
'i 4
3
i?*?
?5
.Ad
^Sj;?
-:
«*
k^sir
'.:-/:
:44 d
M
...,:
.d|l
44
36
44
37
43
38
43
39
42
40
W
4|f
42
-^il
42
i||
*<
*
»;!
? :
^
^ ^i
:^:-'
::::
42,
,J5lt
42
46
42
47
41
48
41
49
41
50
P$
l||
^
ll
4(1
'tjjjj
j.
*$
|||
m
ill
40
56
40
57
40
58
40
59
39
60
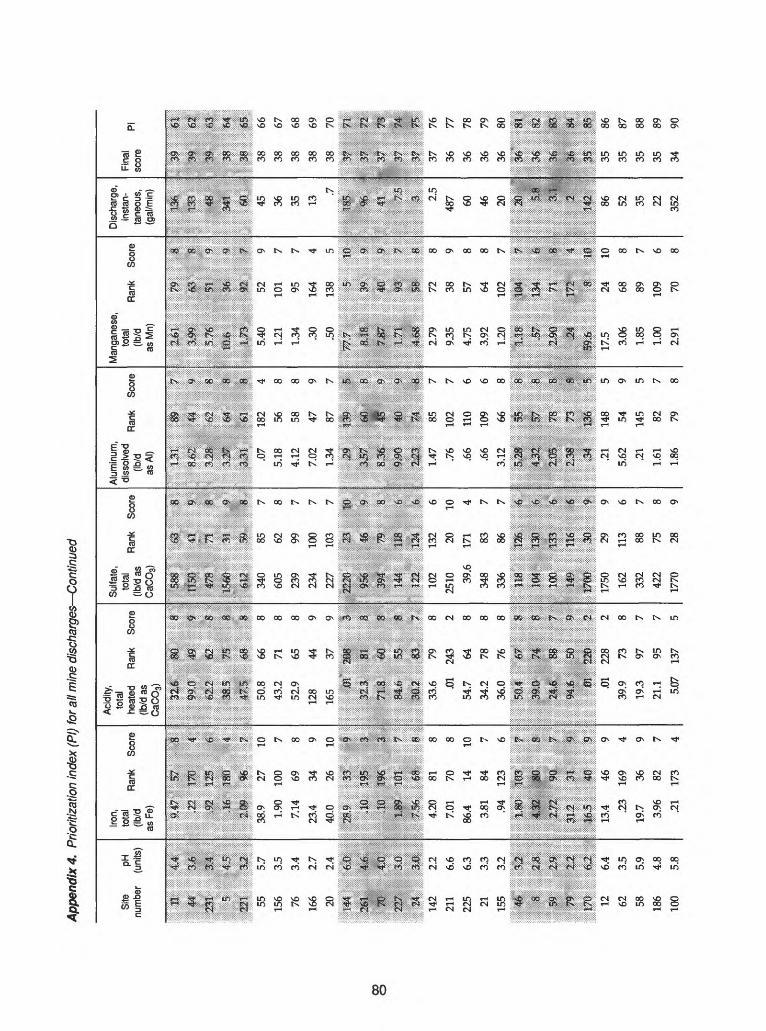
App
endi
x 4.
Prio
ritiz
atio
n in
dex
(PI)
for a
ll m
ine
disc
harg
es C
ontin
ued
Site
pH
nu
mbe
r (u
nits
)
|!!p;:;ii
g& "'
"44
- 3
&
2pl
&*
22*
M
55
5.7
156
3.5
76
3.4
166
2.7
20
2.4
-fc®
m
M?
WZ
3
®
m $w
142
2.2
211
6.6
225
6.3
21
3.3
155
3.2
%
'Wi
i&3r
ts
&
;il
12
6.4
62
3.5
58
5.9
186
4.8
100
5.8
Iron,
!°
. R
ank
Scor
e (ib
/das
Fe)
' lll
: 1l-III:f :
s:
,22
VM
4
£|
&&
,6
,M
ISO
4
38.9
27
10
1.90
10
0 7
7.14
69
8
23.4
34
9
40.0
26
10
; iSs
iiS?"
5y
9.
,10
»
3
IS
196
3
L89
101
7'
WC
-£i
£G
O
; &
36
-w
- 8
,
4.20
81
8
7.01
70
8
86.4
14
10
3.81
84
7
.94
123
6
im
i03
2!
4il2
;S
b I
J3
$
W
.f
>: &
&»
&
:*?
'*
y
13.4
46
9
.23
169
4
19.7
36
9
3.96
82
7
.21
173
4
Acid
ity,
tota
l he
ated
R
ank
Scor
e (Ib
/d a
s C
aC03
)
3&
£
;8$.
>*:::*
*i
M;
m
=#
e!2
i 62
8;
S* 1
*50
.8
66
8
43.2
71
8
52.9
65
8
128
44
9
165
37
9
1 $l
i;>:
\ 7m
m
&
: 8
*t»
O::
35
5
;*X
-:
3BEP
83
.. ,
,,,,.;
7
33.6
79
8
.01
243
2
54.7
64
8
34.2
78
8
36.0
76
8
?®
i4
$
7'
J?:.
SSfiil
J1 74
; 8
?%i!&
88
7
94;;f
i i5Q
^
0]
2*Q
2
.01
228
2
39.9
73
8
19.3
97
7
21.1
95
7
5.07
13
7 5
Sulfa
te,
tota
l (Ib
/d a
s R
ank
Scor
e
CaC
03)
1 |p S
H*:
:x;i;:|i-:
:?::;::-
|
: ^I
S9i;
&
9;
: ^
3T
! |
:^
1 Jl
340
85
7
605
62
8
239
99
7
234
100
7
227
103
7
s»
: m
m
'*95
6 16
9;
; S?
4 29
8:
i 14
4 1J
8 &
; !|Z
; J2
4 |
102
132
6
2510
20
10
39.6
17
1 4
348
83
7
336
86
7;
i i-a
. ft
K
J»:
iliO
1
*0
:A}
ISI
J3
0
6:
; m
m
*
! 14
9 H
b
$;
i I7
D0
30
9
1750
29
9
162
113
6
332
88
7
422
75
8
1770
28
9
Alum
inum
,di
ssol
ved
0 .
0 ...
.. R
ank
Scor
e (ib
/das
AI)
iiii|;
;:8$:
':?$;
i;;;Pp
;:
S,e3
; M
«
: ?P
^
*
3^i
i-
8.0
7 18
2 4
5.18
56
8
4.12
58
8
7.02
47
9
1.34
87
7
aS1*
^1
1!
S
M
&
i&s
® m
&
' i-M
. '7®
,,;! ,
1.47
85
7
.76
102
7
.66
110
6
.66
109
6
3.12
66
8
158::
is
i
iji
iS7
P:
2i0S;
. ;7
8 *
2>3r
o;:
;3^
':p:
.21
148
5
5.62
54
9
.21
145
5
1.61
82
7
1.86
79
8
Man
gane
se,
/n./j
R
ank
Scor
e (Ib
/das
Mn)
1 $M
w
"®
$$*
I ,M
H:
<^:
^
^:5i
j»
Sii
4:
: itp
?§:
"?L
1; M
-. -
S&
:^ .
5.40
52
9
1.21
10
1 7
1.34
95
7
.30
164
4
.50
138
5
<9*^* ^
"
SJ?^
"Ip:
^
tJI
=«
| -3
;:; 4
^;
:S8:;-
,. ,J
U2.
79
72
8
9.35
38
9
4.75
57
8
3.92
64
8
1.20
10
2 7
* t&
H
p
S !|
J5T
134
^ i|
2i90
i :71
j|
j
S9^
. f
H j
17.5
24
10
3.06
68
8
1.85
89
7
1.00
10
9 6
2.91
70
8
Dis
char
ge,
inst
an
tane
ous,
(g
al/m
in)
:': m
>
\
\ !$
*'
1
! "9
- i
i ^
|
45 36 35 13
.7
;. --v
ta !
; *l
!
! ^
\
\ .,!
;..
' 2.
5
487 60 46 20 m- :o SJ
142 86 52 35 22 352
Fina
l -
scor
e
'x:|f':':
' ' ';l||
SI
M
*i|S
...m
J
38
66
38
67
38
68
38
69
38
70
**
11
:sp
|||
IP
^ij
.Jl
,,;;li!
37
76
36
77
36
78
36
79
36
80
36
sSJj
j
3fc
,8|j
36;
,8||
"im
*»(«
; ijtf
m
|33
: "3
:'j:i
35
86
35
87
35
88
35
89
34
90
00 o
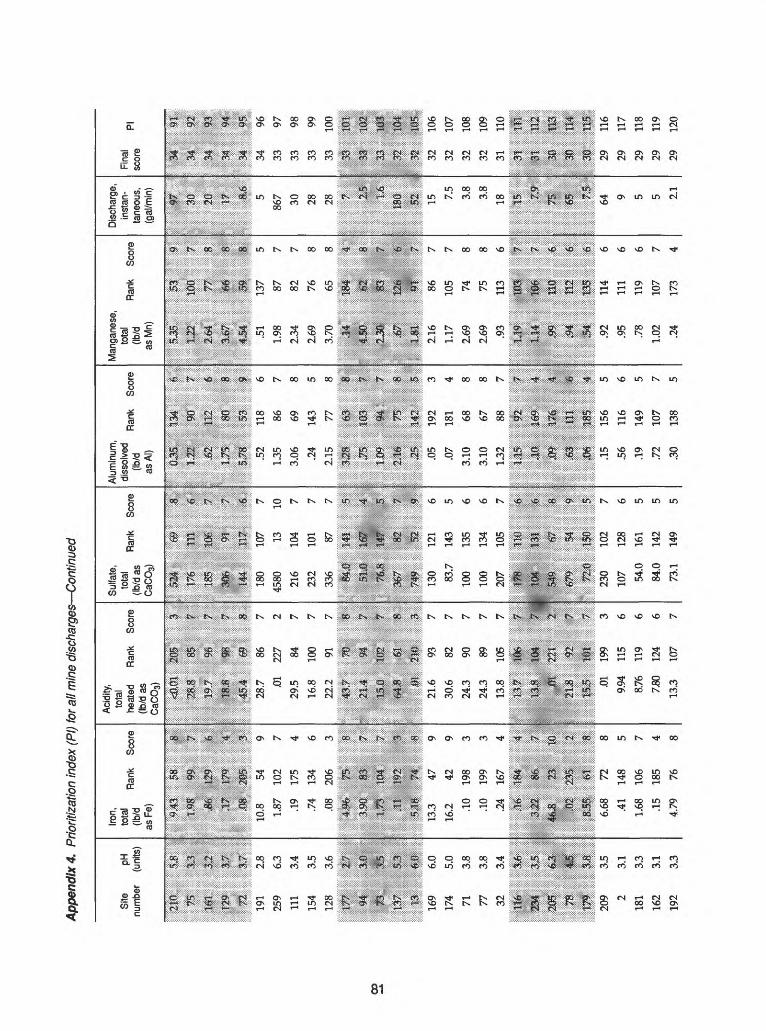
App
endi
x 4.
Prio
ritiz
atio
n in
dex
(PI)
for a
ll m
ine
disc
harg
es C
ontin
ued
Site
pH
nu
mbe
r (u
nits)
m.
33
:
m - j
191
2.8
259
6.3
111
3.4
154
3.5
128
3.6
n 1$
I'fk1^
fe^
-1*.
' 13
55
5;3;
ii3
: J
J:
:
169
6.0
174
5.0
71
3.8
77
3.8
32
3.4
J
J2
BS
feji
p i&
l$£
lit
209
3.5
2 3.
1
181
3.3
162
3.1
192
3.3
Iron,
/Hw
Ra
nk
Scor
e (ib
/das
Fe)
i 11
F- s
r $
: J!
? |i7
« 4
'
? ,0
8 m
.3;
10.8
54
9
1.87
10
2 7
.19
175
4
.74
134
6
.08
206
3
&
f'
.11
li$2:
J;<$
M®
3*
*13
.3
47
9
16.2
42
9
.10
198
3
.10
199
3
.24
167
4
pfc
184
.4
«
23;
ifii
;0|:
IH
| ,
M
y
A:
6.68
72
8
.41
148
5
1.68
10
6 7
.15
185
4
4.79
76
8
Acid
ity,
tota
l he
ated
Ra
nk
Scor
e (Ib
/d a
s C
aC03
)
x&
M
iZll
'*
***&
:;
f.g
-:o
D
Q'
^*
IBiO
M
B
j| :
'4M
. 69,,.
;;::
;;::
:, ,
« .
. i
28.7
86
7
.01
227
2
29.5
84
7
16.8
10
0 7
22.2
91
7
4if!,f
jj!$l
||||t
mo
m
f
M
'ft*
1
i
1 w
2.:m
. .......
921
.6
93
7
30.6
82
7
24.3
90
7
24.3
89
7
13.8
10
5 7
! li
*<1
f|
&
&$*
|: i
I li
t :^?
f i
i w
$N
f \.01
19
9 3
9.94
11
5 6
8.76
11
9 6
7.80
12
4 6
13.3
10
7 7
Sulfa
te,
.. °
a Ra
nk
Scor
e
CaC
03)
ITS:
133
i
..ni
;$ir
. iJ
180
107
7
4580
13
10
216
104
7
232
101
7
336
87
7
5 "
4
$&
m 7
130
121
6
83.7
14
3 5
100
135
6
100
134
6
207
105
7
IP
m
i^*
;fi
7 8
*P*
i
?
^3
ill
123
0 10
2 7
107
128
6
54.0
16
1 5
84.0
14
2 5
73.1
14
9 5
Alu
min
um,
asA
I)
1 T
S
fin
B:
i»/O
O
U
Q:
ii8;::
53
., ....
.i...
.52
118
6
1.35
86
7
3.06
69
8
.24
143
5
2.15
77
8
: '-
1 O
S
'Efit
: 'O
1 :|
3+
*?
05:
>«}:
;
t>9»
m
r
/jt*
. :1
:-Jf1
T(:
:R:;
+£>
3:
*3i¥
*;
:«?:
:
.05
192
3
.07
181
4
3.10
68
8
3.10
67
8
1.32
88
7
iff
4
fl«
J76;
4
J3i
m
fr
?0&:
18&
4
.15
156
5
.56
116
6
.19
149
5
.72
107
7
.30
138
5
Man
gane
se,
n>^4
Ra
nk
Scor
e (Ib
/das
Mn)
i:*: K
'"
'':|i
:;:;li:
|i|H
£22-
10
0 ?
i
It^T
66
8
1
%M
iSS,
,,,,,.8
: i
.51
137
5
1.98
87
7
2.34
82
7
2.69
76
8
3.70
65
8
; W
,6
2 i
;
1 *
J
^^
^ |
i j.
^|
9pf:;:i
:;i;:|i;i
fi j";
' :
. -;-:
:?' : .
: .. .
-. ; . .
. .;'.-
:":;>:
:>:"'
:':':W
x;-v
;i-
;
2.16
86
7
1.17
10
5 7
2.69
74
8
2.69
75
8
.93
113
6
I S
I m
7
j &
P 11
0 *
j jN
l lii
*
'S
di
1^*
5
:A'
: H
-TS
l*:^-
!*^
'";
.92
114
6
.95
111
6
.78
119
6
1.02
10
7 7
.24
173
4
Disc
harg
e,
inst
an
tane
ous,
(g
al/m
in)
........
. _
;; ^
3D P IS!,
,
- ..
%fa
j.
5
867 30 28 28 2,5
: ;
180
;...
5.2
.115 7.
5
3.8
3.8
18 m
[
w
\m
!;
?& !
64 9 5 5 2.1
Fina
l sc
ore
'. "'"
i:;;l|
: «i
'.ij'*
:?!
; a*
- "S
iS:
34
.^
I ;-'
.' ;::.
:i:|
LJ»
i;34
96
33
97
33
98
33
9933
10
0
ft 3
J2 £4
j:
- ®
.JlS
32
106
32
107
32
108
32
109
31
110
1 m
ip
I :
w
JD
l|||
, JO
Il
if?
' m
:if
g:29
11
6
29
117
29
118
29
119
29
120
00

App
endi
x 4.
Prio
ritiz
atio
n in
dex
(PI)
for a
ll m
ine
disc
harg
es C
ontin
ued
Site
pH
nu
mbe
r (u
nits)
P^H
i^ '
$::i
\:.(
J3ft
Si
fli
i
:1e
lf
;
151
6.5
35
6.0
23
3.4
112
3.5
215
3.0
flip
M
i#:
* £
&£
:ji ^
'
xttv
iQS
J '£
. *'
'
||p
**
1
54
6.7
29
4.1
214
3.1
41
5.5
48
4.5
:i$S#
!jt:f$
»..*
p||a
&»*
223:
&
ft
. i&
fl $&
,
235
3.7
216
5.5
217
2.9
247
6.6
268
6.3
Iron,
!?f.
R
ank
Scor
e (ib
/das
Fe)
am
m
b
in^
M
ist
> I'i
j(K
S»
<?
«fe
11*
*
.. ijy
jl SS
k-
4.54
77
8
3.00
89
7
.04
226
2
.06
219
2
.35
152
5ili
lili
to§ ^
i'if
,1*
izfe
i|
10.5
55
8
.01
254
1
.13
188
4
8.42
63
8
.61
141
5
M
227
%
tJQ
; IS
*
&fi&
10
7 3!
J&
132
*,
#&
P2i
3L
.06
215
3
6.27
73
8
1.32
11
4 6
.39
149
5
.34
156
5
Acid
ity,
tota
l he
ated
Ra
nk
Scor
e (Ib
/d a
s &8F
P
S
s i
2$y
^
^
^
lf§
fr i
H'r
tfc
T1*
i'i
C.
;o
4Ja
.1 44
a
;
.01
238
2
.01
207
3
14.4
10
3 7
10.7
11
3 6
9.46
11
7 6
*Jg
i
&i
life
^: i
.01
251
1
11.9
11
0 6
8.35
12
2 6
13.0
10
9 6
4.80
13
9 5
; !
SJS
136
&
B»
W
I ^
'?S
:?!9
l^
d
Jfv;
i1
xJiC
J/.
J.JK
E
-**
5.69
13
3 6
9.65
11
6 6
10.7
11
2 6
.01
244
1
.01
226
2
Sulfa
te,
(Ib/cT
as
Rank
Sc
°re
CaC
03)
'" W
ip
::wi:i:ll
:;:iii
:: ';
411:
S%
: i
HI
lit
:!> :
287
94
7
173
112
6
51.8
16
6 4
132
120
6
53.4
16
3 4
pi
if*
4BR
jj, ..J
15
-!o
*t
i
Ejj.
?j
T^Q
^J
: .-.'
:''::-:
" ' :
: : .' '
. ;:-.
;'::"
; : '.'
'.' .: . '
'
129
122
6
141
119
6
63.4
15
4 5
52.9
16
4 4
53.8
16
2 5
14>f
i ZT
iS 3
s&a
H|
sS
|l
M:;
S60
.7
155
5
39.4
17
2 4
29.7
18
4 4
675
55
8
326
89
7
Alu
min
um,
diss
olve
d _
.
(lb/d
R
ank
Scor
e
asA
I)
1 ;|p
s-:-:-^l-
:-^:-:-
:;|
:
.3?
ESF
* *
j ?4
: tP
l, T
i ,0
2 .21
1: ,1
.15
157
5
.12
164
4
1.58
83
7
1.15
91
7
.38
129
6
i; ;t
jy
yg
7
.19
151
5
1.62
81
8
.85
100
7
.01
213
3
.27
141
5"m 4
4
IP
ft
7!i
iia.
T
: j^s
pi
i.1
8 15
2 5
.01
225
2
.54
117
6
.10
168
4
.14
158
5
Man
gane
se,
/!iw
Ra
nk
Scor
e (ib
/das
Mn)
: T'
itiJ
' ''^
^illS
j^Pw
s*'.
; j£
1§I:
^
1
j 1,
2T
98
7: !
1 m
ti&
s:
.39
152
5
1.84
90
7
1.30
97
7
.75
120
6
.58
132
6
89
188
£
: J
1^
I
.84
118
6
.32
162
5
.29
165
4
.44
146
5
.87
116
6
! $
If
%.vip
j ""i
rtrt
i1:
:*-f
;*
jt^'v
5
1
i .j«
l|l,,,
,v, *
.71
123
6
.33
159
5
.09
196
3
.68
125
6
.33
161
5
Dis
char
ge,
inst
an
tane
ous,
(g
al/m
in)
It";
41:
20
Mil
;. «
J
126 48 12 12 7.
3rr
S¥ftW
: ;-
: -JS
SSg:
3j
:.3':
i:
IP
i:
28°'
1
11
1 19 12 9 8
i hs
j
I ^^
! ^ !
7.9
6.7
2.5
67 40
Fina
l sc
ore
i 29
' 1
21
:
* *
"T1*
!
M
,12;||
28
I2lj
:w;il
,s
27
126
27
127
27
128
27
129
27
130
;26
lilj
26
136
26
137
26
138
26
139
26
140
gijii
li!25
14
6
25
147
25
148
24
149
24
150
00 ro
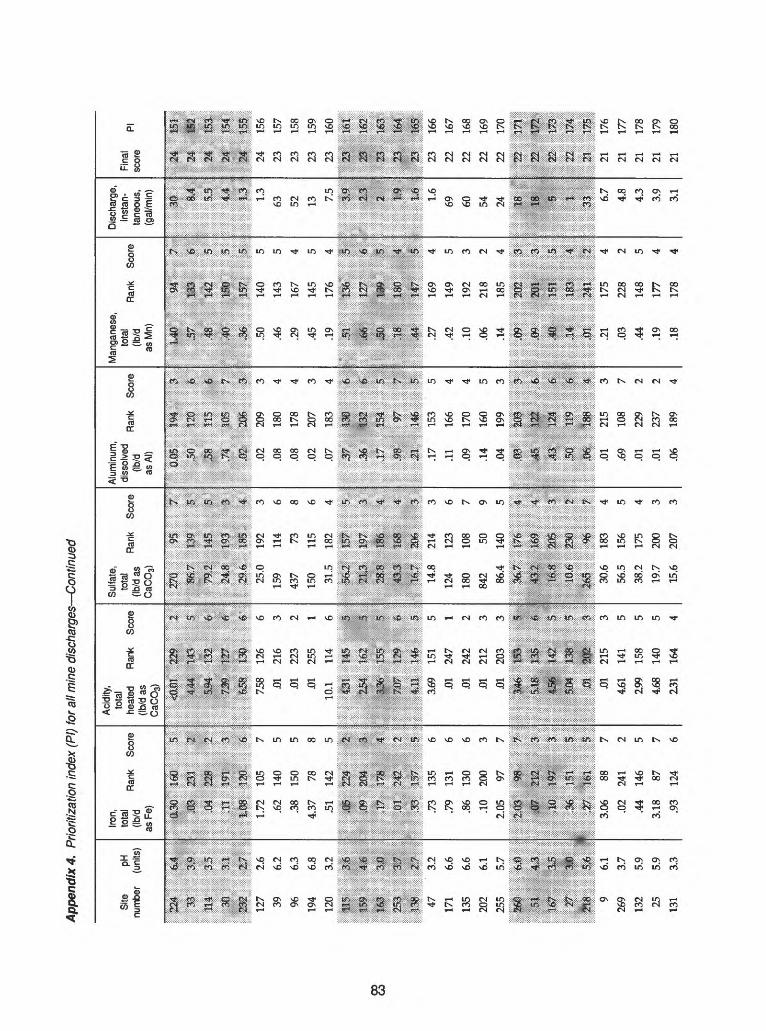
App
endi
x 4.
Prio
ritiz
atio
n in
dex
(PI)
for a
ll m
ine
disc
harg
es C
ontin
ued
Site
pH
nu
mbe
r (u
nits)
*«m
mm.
mIU
3£>
m m
.232
m12
7 2.
6
39
6.2
96
6.3
194
6.8
120
3.2
M
'*$
9 4s
6 w®
m
:M.
:'PH3
g: Z
3
47
3.2
171
6.6
135
6.6
202
6.1
255
5.7
11$
$$n
4$X
&
:A3
w :y
,|$-:
4$
'9
6.1
269
3.7
132
5.9
25
5.9
131
3.3
Iron,
/!L^i
Rank
Sc
ore
(Ib/d
asF
e)
i -O
il'
lir^
::::tt:*
|
; ;03
23
:3 2
;04
228
2
M
Wl
3
..IM
.,,.»
&.,
1.72
10
5 7
.62
140
5
.38
150
5
4.37
78
8
.51
142
5;Il
lp|g
§ 22
4: ...
2
:,;F
2H4
1
P
r?S
H
m
24
?:
1
.,33
1W!
?.7
3 13
5 6
.79
131
6
.86
130
6
.10
200
3
2.05
97
7
j IP
'9
8 £
Ffi
wn
'ft .ji}
/ £M
_T
m
*M
$M
, 1*
1 £
!*r*
,.*,
g.
:Ji4
^
jn-t
5?
3.06
88
7
.02
241
2
.44
146
5
3.18
87
7
.93
124
6
Acid
ity,
tota
l he
ated
R
ank
Scor
e (Ib
/d a
s C
aCO
s)<f
fii:
:$I
" ""-:
::':t
4,41
14
? |
E.'jQ
j^4.
I'lT
'J
v Z
f*Z
3t
ks-W
|i :*
7
£39
J27
6:
.658
U
B
,:&
758
126
6
.01
216
3
.01
223
2
.01
255
1
10.1
11
4 6
133
!§*
E£
2 !
336-
IW
>
PF
t;^
: :*
&H
K%
.,5
3.69
15
1 5
.01
247
1
.01
242
2
.01
212
3
.01
203
3
»
I4®
*?
:I$!
dP
1*is
: N
ip*
1^
1
jl) $$
fe 3
.01
215
3
4.61
14
1 5
199
158
5
4.68
14
0 5
231
164
4
Sulfa
te,
,. °
a Ra
nk
Scor
e
CaC
03)
[ "i
^)':
:95
¥'}
\ M
J7
139
I. ;
i m
2
145
5: i
! J4
J 19
3 3
;
i ..,: J1
!,,.
..18
1 ,J
!
25.0
19
2 3
159
114
6
437
73
8
150
115
6
31.5
18
2 4
I mm
m
;f i
21,1
19
7 3:
;:
n-O
"'-Q
l;
Qi_
jl
'1 '
: .£
(ff'
f*
l^vO
^;
;
: 43
.3
L68
£ i
i. 16
,7
:306
$
14.8
21
4 3
124
123
6
180
108
7
842
50
9
86.4
14
0 5
i W
$$
V
;4i
i:
!$
^ ^
^*H
:3
|t^
^
1
$,!
Us
l; i
j^
«e
r !
30.6
18
3 4
56.5
15
6 5
38.2
17
5 4
19.7
20
0 3
15.6
20
7 3
Alu
min
um,
diss
olve
d _
, _
.....
Rank
Sc
ore
(Ib/d
asA
I)
"' "':'d
idS:"""
'"":l9
^ "i
"
,5Q
OS
6,sa
m
&:
J».
185
7M
. ?$
&,..
..:-i,
..0
2 20
9 3
.08
180
4
.08
178
4
.02
207
3
.07
183
4
[1
37
J3
lf!!
ii,3
6 13
2 6
^ JT
13
4 S«
!:
J?:
W;
r i
L Jl
II
I ?:
i.1
7 15
3 5
.11
166
4
.09
170
4
.14
160
5
.04
199
3
®$
tm
?:JI
M
6;
&I'
J3«
&:
H:
11?
i !
$1
pa
.1;.0
1 21
5 3
.69
108
7
.01
229
2
.01
237
2
.06
189
4
Man
gane
se,
°f.
Rank
Sc
ore
(Ib/d
asM
n)f"
"1||
'"^'Ili
ip''''''
''-1!!
!!!
;r *£)/
L
<53
: 6
::
j i^ta
i*2
i s
^j
M
15Q;
;?
1
I, M
......
W
-- ,
1
j.5
0 14
0 5
.46
143
5
.29
167
4
.45
145
5
.19
176
4
: : 136IP
;1 J
M
127'
<j
[
JO;
139:
I \
M
180:
4 i
$L
, .
.11!
'- l.
j.2
7 16
9 4
.42
149
5
.10
192
3
.06
218
2
.14
185
4
a»>
202
3 ;
Ji
ZQ1
3 \
* M
J'^
l S
;,1
* 18
3 4
|
*$<
2^3
2 i
.21
175
4
.03
228
2
.44
148
5
.19
177
4
.18
178
4
Dis
char
ge,
inst
an
tane
ous,
(g
al/m
in)
1 3!
=
i ;&
4 !
| m
\4.4
:L
;.
.,,
,.:|1
1.3
63 52 13 7.5
pill
m [
I .m
1 ;2
j m
i i,fe
i1.
6
69 60 54 24 18 18 :5 I
,33. 6.
7
4.8
4.3
3.9
3.1
Fina
l p|
sc
ore
: :2
4;?
" 1S
||
m
^1
: 2|
I5||
; 24
, l§
3i ,.
i!(L i
sll24
15
6
23
157
23
158
23
159
23
160
: 23
16
||
1 M
16
li2w
J. IL
o'^; i".:
*t>
*
*it
:il^
:i::
*J:
-iD
V^:
23
leij
23
166
22
167
22
168
22
169
22
170
W
17
||
22;
J7§^
2S
13J|
22;
17||
21
I||i
21
176
21
177
21
178
21
179
21
180
00
CO

App
endi
x 4.
Prio
ritiz
atio
n in
dex
(PI)
for a
ll m
ine
disc
harg
es
Con
tinue
d
Site
pH
nu
mbe
r (u
nits)
:"!i!"
y" H
f"*
Iso-
MF»
* M
I"?
V*5
i .:.
>>/
,5U
>
;gJS
3$
.
53
3.6
134
4.1
57
5.5
233
2.7
252
3.3
m
&%
\m
m
\
66
&$
:
$$
si
\18
. S4
: .!
226
5.5
80
2.7
65
5.8
157
6.7
168
6.0
Ss
&J|
i
:3i88
:'' i/l
® '
**
£$
isa
bs
« i:
;yL
l*0
:£,:!
: :
!?««
&£
i26
3 6.
5
67
4.2
90
2.9
251
2.9
270
6.6
Iron,
tota
l (Ib
/d
Rank
Sc
ore
asFe
) ' '^
M"'M
'"'v^ir
""m
ess
A
M
13?
5
m
201
3
^
J$
k
§,
.07
210
3
.02
234
2
2.50
91
7
.49
144
5
.05
221
2
m
*m
4LIT
*m
*
,7?:
l!?
3: 1
M.
W
:S
,8?:
121
;!& :1.
44
109
6
.62
139
5
.12
190
3
.13
187
4
.91
127
6
$* ^
&
,07
: ^1
^:
S
^
W
*1,
1T ^
f:
J&
i^i
:!.9
2 12
6 6
.07
208
3
.11
193
3
.09
202
3
.11
194
3
Acid
ity,
tota
l he
ated
R
ank
Scor
e (Ib
/d a
s C
aCO
3)""
"""
:'|H
'"
lH -
X:: :f
'i
3m
15
7 S
|i
JS
233'
£
j
294
159
5 5
2:45:;
: 16
3-
1 ij
3.97
14
9 5
3.46
15
2 5
3.92
15
0 5
4.03
14
7 5
3.07
15
6 5
i W
&
161
j
j m
268
i
Ism
, 25
9 I
!i
ii it*
i !,^
-Z
35
Z )
.01
200
3
336
154
5
.01
204
3
.01
249
1
52
180
4
i w
m * i
i m
m
i. i
! p
: *S
$ j;
1
i ^
NI i i
$r
531
| ;
.01
239
2
^6
177
4
253
160
5
Z15
167
4
.01
245
1
Sulfa
te,
(ras R
ank sc°re
CaC
03)
j II
?-
W
:31
2Ss9
18
9 4
j g8
ii
152i
5
j m
r 19.8
; ,3
i. m&
2d*
i ;3
28.2
18
8 4
38.9
17
3 4
12.1
22
5 2
20.4
19
9 3
19.2
20
1 3
| rf
:' 2
3f
':':2K
OfV
T
HQ
£
IjuU
; XU
TSr1
-p
?a^
;W:
iW
&
13
6:
:5
3l,
r ;iJi
80:..
415
.3
210
3
624
241
2
97.4
13
7 5
73.4
14
8 5
18.5
20
2 3
m*
&
331
®
90;:
1
$M
^
:- *
3iJ6
25
3 [
I&I
;W
152
.4
165
4
18.5
20
3 3
12.8
21
9 2
15.1
21
1 3
298
92
7
Alu
min
um,
/iu/j
Ran
k Sc
ore
(Ib/d
asA
I)
:: -Q
i$2;
il
S
;:;:::;
:;:i:;
:i:$.
.a?
fss
^1
i&&
^
5
?
,::
,19^
m.
m-I
M.
.J84
.,.,
.,., 4
.,,
.43
125
6
.11
167
4
.01
245
1
.05
195
3
.36
133
6
J $$
m
&
..i
309
m
4
''- ft
®
1:7
&
4':
j S«
; 20
0 :3
\ m
%x
b a
...0
1 21
9 2
.12
162
5
.09
174
4
.01
217
2
.01
242
2
i; %
rw
*
t1
|jgi
^§!^
: .4
i JP
JP
I:
4
! iH
ll
^:
4
: J@
1 m
' -2
.01
231
2
.04
197
3
.17
155
5
.14
159
5
.12
163
4
Man
gane
se,
/ik/j
Rank
Sc
ore
(Ib/d
asM
n)
i «
;!:-
-:
! m
JI
2
I i
: "*
iiQ
l:)5i
l: (C
i IX
.TX
*;i:̂:
*; -^
'
i ;2
S PE
i I:
i
:. :a9
.. .
,.16:6
. M
I.0
4 22
3 2
.46
144
5
.38
156
5
.28
168
4
.12
186
4
yJ2
1:87"
'4:
I iss
:2i
r %
\\
M
m
cJl
189:
4;
! :.):ji
i im
^
.48
141
5
.03
227
2
.08
203
3
.73
121
6
.09
195
3
I m
im
?
! J3
22
5 Z:
! ii
^
?
r3??
. tf
tj;
J:
i 13
i8
.i fr
.10
193
3
.22
174
4
.03
230
2
.05
220
2
.01
246
1
Dis
char
ge,
insta
n
tane
ous,
(g
al/m
in)
«* i
t 4i li' 6.8
,,;::.
.;¥;;;
v.::x
fe::: 4.6
4 1.6
1 .8 Jt
60 W:
24 H: 7.
5 .4
58 3.6
2.3
3^ !
m
1m
j
§1 od
4.8
2 1.9 .7
80
Fina
l p|
sc
ore
i - il
ii
||!
21
I8|!
! ^
18||
! 2&
1
8l|
: J0
i ....
.... li
SlI
20
186
20
187
20
188
20
189
20
190
i!%
isiii
! IS
Ii
9||
i i^
ii|i
: K
tafj
jo
lio
ili!
? *"
3:t:
:::
19
196
19
197
18
198
18
199
18
200
1 w
\ jij!
30
^ 1
I W
30||
! O
2Q
|I
i m,
201;:
17
206
17
207
17
208
17
209
16
210

App
endi
x 4.
Prio
ritiz
atio
n in
dex
(PI)
for a
ll m
ine
disc
harg
es C
ontin
ued
Site
pH
nu
mbe
r (u
nits)
jffi
S
'Vlv
.^
:-4j
dtjy
'^
V'f
i ''
241
5.5
262
6.4
74
6.5
43
3.5
102
4.7
jjZgfc
jfL
£.
on
tjjf
t
2M
4.6
m
.4368
6.
7
85
4.6
93
3.6
87
6.4
92
5.8
IIP
&raj
.)*
--s t
tIJJ
4>
iQ
13|
&«s
264
6.4
182
M .
i69
3.
7
99
6.2
228
5.5
243
6.3
246
6.4
Iron,
J2J
Rank
Sc
ore
asFe
)
i IP
W
, *
LJi
I!..
- 1
.22
171
4
.31
159
5
.32
158
5
.16
181
4
.01
248
1
w m
$
M
mt
1.0
1 25
3 1
.06
217
2
.01
244
1
.24
168
4
.02
240
2
MS
'" i
Ji
MJ
i,1®
18
2 |:
.iOo
-JM
a 2:
,1:8
12
!? i.
.01
262
1
.10
201
3
.26
162
5
.19
176
4
.01
266
1
Acid
ity,
tota
l he
ated
Ra
nk
Scor
e (Ib
/d a
s C
aCO
3) 11
1m
so
* 3
.90
176
4
.14
193
3
23
187
4
53
178
4
116
166
4
r 4 £
si:
l&
fa&
^i
.. .
,:$.
. $$;
. ;:£
,..,
.01
253
1
33
184
4
.90
175
4
.01
230
2
24
186
4
i m
m$
3 "
m&
rifi
: J[
:I
r*.3
r.
.4
.a
24i
2J3
28fe
2
-:-.
-, ,.,,J&
*
®K
,.
4.
.91
174
4
.12
194
3
39
183
4
.01
224
2
.01
234
2
Sulfa
te,
.....
Rank
Sc
ore
CaC
O3)
r¥FT
;1
:S
* -I-
-.-:
4'.
775
234
2
654
238
2
432
245
1
116
257
1
14.6
21
6 3
' m
m
1=
i $*
£l
i 1
Lxll
l,
Ii2|;.
...
..!;,,
105
129
6
8.40
232
2
12.1
22
4 2
12.7
22
0 2
22.4
19
4 3
i m
2&
* i
i K
Jj»
: Ti
-.*1*
: S
: JU
B
Z4
i!
:iS
522:
543:
i.3
$£
t^
|:
Mt
2i61:
|
418
246
1
672
239
2
156
260
1
12.3
22
3 2
32.3
17
9 4
Alu
min
um,
asA
I)
: jj
:94
^
j
j'9^'
V|t:
'
:
ja
.250
i.
\ 2,,
» ., ,
Lj.0
1 22
6 2
.01
238
2
.01
241
2
.05
196
3
.06
190
3
|*
^""W
^
I $1'
&*
?:
i
L $&
^I
za,
,2'
i.0
1 23
4 2
.01
239
2
.03
204
3
.01
243
2
.01
236
2
| m
m
l
\ £ji
vi l^
c^
3;
: :fV
:t ?:
J(:5
!^'
I ;0t
:?*
« J
M
<$$
1.1
1 16
5 4
.01
263
1
.01
262
1
.01
218
2
.01
233
2
Man
gane
se,
/!Lw
Rank
Sc
ore
(ib/d
asM
n)
,iq
194
3
,98
206
3m
23
4 2
.07
210
3
.09
199
3
.11
190
3
.06
214
3
.08
204
3
m$
;1Pi
$1
pt
3...
..,^:
.... .
. ....
.JZ3&
:,..
-2
.
.08
208
3
.08
205
3
.06
211
3
.09
197
3
.02
232
2
; A
W
* 1
$$
i^
^jff
ix.
2P!/
2 i
ss^
l$*:
<l.
*ft|
Hi
| i
.05
221
2
.06
216
3
.01
245
1
.01
251
1
.01
243
2
Dis
char
ge,
inst
an
tane
ous,
(g
al/m
in)
'"'. \
vaJ
3.4
3 2.4 .5
15r'"
^"i m i
m. ,
4.6
2.5
2.2
1.8
1.7 J A M y* i .4 .4 .1 7.9
3.9
Fina
l sc
ore
&:&
is aa
fjfIS
2l|||
15
216
15
217
15
218
15
219
14
220
P
22^1
;
13
2i||i
, 1:3,
. 3&
K13
22
6
13
227
13
228
13
229
13
230
4
2$|
&
rfl
^1:
BJ|
Til
j|:
g3||
12
236
12
237
12
238
11
239
11
240
00
Ol
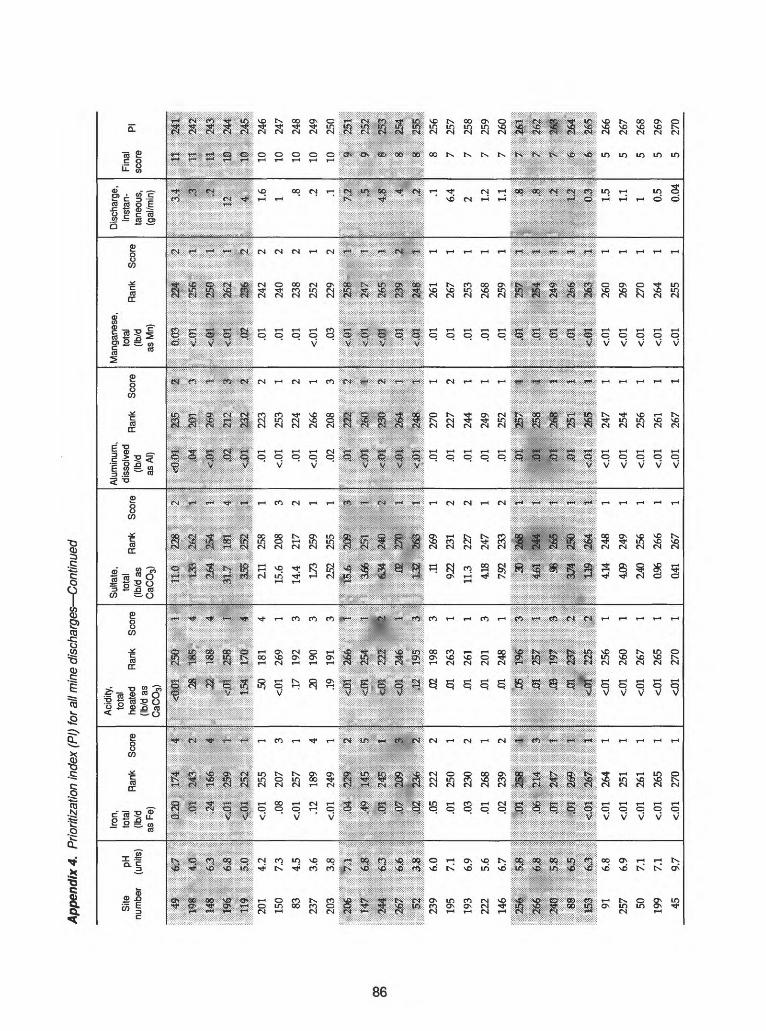
App
endi
x 4.
Prio
ritiz
atio
n in
dex
(PI)
for a
ll m
ine
disc
harg
es C
ontin
ued
Site
pH
nu
mbe
r (u
nits)
VX::'"i
l' """!::
li|i|P
^
198
M
148
6.3
JM
m
:;
«m,
.-...IL
,I20
1 4.
2
150
7.3
83
4.5
237
3.6
203
3.8
;206
3£
|
1:4?
&
8
244
$J
j
267
&JS
iC
^
St-'
ti1
> J?
:4,;
&$
.,w
;
239
6.0
195
7.1
193
6.9
222
5.6
146
6.7
25&
m
\
216
&S
|
$W,
M
I
88
6J5
|
351
&3
!91
6.
8
257
6.9
50
7.1
199
7.1
45
9.7
Iron,
°f.
Rank
Sc
ore
(ib/d
asFe
)
* ii|
ISi
::X*xf
i:
\ m
24
3.
2
: :3
1 16
6 4
i %
M
3M
1:
: ,.:^
i|
;|51
.. .I
J<.
01
255
1
.08
207
3
<.01
25
7 1
.12
189
4
<.01
24
9 1
,04
129
,48
UPS
5; |
m
245
I
M
209
i
m
236
2:.0
5 22
2 2
.01
250
1
.03
230
2
.01
268
1
.02
239
2
JI
238
1
,06;
jm
1,0
3 3H
S"
i
J3
269
1
&H
26
? I
<.01
26
4 1
<.01
25
1 1
<.01
26
1 1
<.01
26
5 1
<.01
27
0 1
Acid
ity,
tota
l he
ated
Ra
nk
Scor
e (Ib
/d a
s C
aCO
3) '$&$
'2iii
" HI
M w
i
2£
: *8
g: i
«$
p
*.
t
.JU
S*
! .$
$...
,,#
.,:,
50
181
4
<.01
26
9 1
.17
192
3
20
190
3
.19
191
3':" I
lllp
ji 3
^W
*3
;|$
>*ill
&
^d
tK£
JU!1
£
£H
E
«;Q
1.
222:
2
«D1
246
i
...,,,
,,,,..
,,12
195:
.. J
..02
19
8 3
.01
263
1
.01
261
1
.01
201
3
.01
248
1
m
m
3 \
Jd$
257'
1i :|
&
T97:
3 |
;<8J
m
2 |
^JQI
22
5'
2 i!
<.01
25
6 1
<.01
26
0 1
<.01
26
7 1
<.01
26
5 1
<.01
27
0 1
Sulfa
te,
. Ra
nk
Scor
e
CaC
03)
i Iti
:|§
: ?
[
': L
^j3
-ift
2
J
Jifc
.y'li
..
iW
-jl-
4
rrm
L
7*
ilL
1
: -<
i.![i^
t ^.^
r.
4
m^
M !
,: ,,...
., ,.!|
S5
,J52
\ ,,.,.
...-,, ,
!,,,,
Zll
25
8 1
15.6
20
8 3
14.4
21
7 2
1.73
259
1
252
255
1:^^
::::::
:::::i
?S:;;
it
:TW
1Q
^££$
\: tt
^'X
'tsM
?:'
-iiP
#
a:;'-'-
'-'
:., ,M
i: 2S
&
|
i "S
S f
.11
269
1
922
231
2
11.3
22
7 2
418
247
1
7.92
233
2
3D
268:
|
M!
244
t
SB
265
i
£74
253:
I
. w
m
- i
414
248
1
409
249
1
2.40
256
1
0.96
266
1
0.41
267
1
Alu
min
um,
' (Ib
/d6
Rank
^°
°re
asA
I)j '
^
N^i
^sm
%m
t
i&Z:.
|l"
3:
:,;:x,:
.::^
l^ ,
:'.., x
Mi
.. .^
Jl.
.01
223
2
<.01
25
3 1
.01
224
2
<.01
26
6 1
.02
208
3
P
" P
J
^2?
|:'
I
^*0t;
|p«
i
1
' 2
S
]
.01
270
1
.01
227
2
.01
244
1
.01
249
1
.01
252
1
m '
";asp
3
-!
M
258
iI
M
268
Hj
IJij
j;
"fgft,
j
i xm
as
s j
...<.
01
247
1
<.01
25
4 1
<.01
25
6 1
<.01
26
1 1
<.01
26
7 1
Man
gane
se,
.....
Rank
Sc
ore
(ib/d
as M
n)
;: :|P
:
* <*
m %5
& i
^i
i: ma
i
^P
i 2
^:
f
> .,,
::i:::
::i^;
:::;S
:|:::
;, ^^^J?^
.01
242
2
.01
240
2
.01
238
2
<.01
25
2 1
.03
229
2
' "*
88
25^::
1:
ii
<^l
l9?
T: 1:
1 s
:|.0
1 26
1 1
.01
267
1
.01
253
1
.01
268
1
.01
259
1
m *sz
* <
;
Us N^
i
i*S
$1
,- :1
63
..
1;
1
<.01
26
0 1
<.01
26
9 1
<.01
27
0 1
<.01
26
4 1
<.01
25
5 1
Disc
harg
e,
inst
an
tane
ous,
(gal
/min
)
f Ii
:V:X:,
3
I -2
12
,,.,,.
.....,
... J:.
,,
1.6
1 .8 .2 .1
i; **
*$ IZ
lli
,1.:
4£ .1 6.4
2 1.2
1.1
i|i
i J :
&i:
J
1.5
1.1
1 0.5
0.04
Fina
l sc
ore
:X""1!
Il
li:
11
2^||
m
2*ll
*$
i^||
:::,,:
:J|:;.
Ill
10
246
10
247
10
248
10
249
10
250
ili^r
* ?: ^||
8:
25i|
8 25
6
7 25
7
7 25
8
7 25
9
7 26
0
i i
:^ll
:^ rtl
:|. >
;||||
5 26
6
5 26
7
5 26
8
5 26
9
5 27
0

87
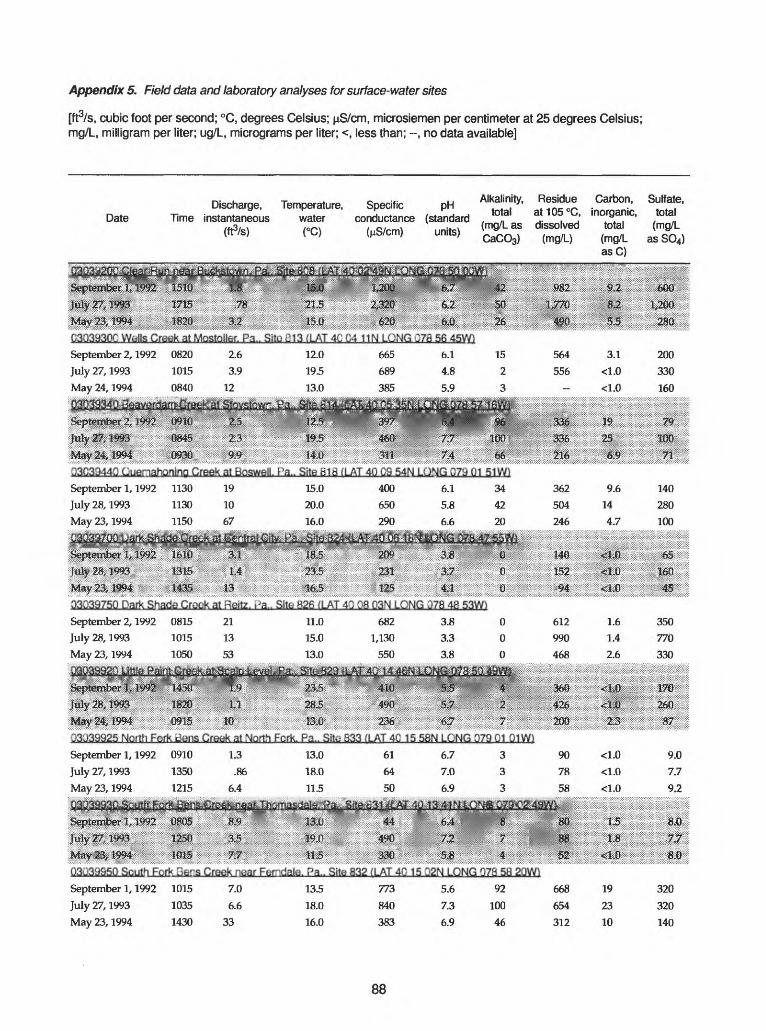
Appendix 5. Field data and laboratory analyses for surface-water sites
[ft3/s, cubic foot per second; °C, degrees Celsius; uS/cm, microsiemen per centimeter at 25 degrees Celsius; mg/L, milligram per liter; ug/L, micrograms per liter; <, less than; --, no data available]
DateDischarge, Temperature, Specific pH
Time instantaneous water conductance (standard(ftVs) (°C) (j^S/cm) units)
, (mg7Las dissolved (mg/L)
. Carbon ' S"lffafm°tr9ta"ic' /ota'
total (mg/L
asC)
m
C30393QC Wfalls Greek at Mostoller. Pa.. Site i!13 ( LAT 4C C4 11N
September 2,1992 0820 2.6 12.0 665
July 27,1993 1015 3.9 19.5 689
May 24,1994 0840 12 13.0 385.,,...,,.,,,,.....,..,.........,.......... ...........,..............^__
m178 56 45W1
$M& K "x --:^t " ':':';s" X;:":! '1-8^ " :;:2D9 ::;!":';^' :': :';;3:;8
L4 M& 231
.|| :,, ft 3fe,|«:- ^ 03039750 Dark Shade Crook at Heilz. >>a.. Site 826 (LAT 40 08 03N LONG 078 48 53W)
September 2,1992 0815 21 11.0 682 3.8 0July 28,1993 1015 13 15.0 1,130 3.3 0May 23,1994 1050 53 13.0 550 3.8 0
612 1.6
990 1.4
468 2.6
03J39925 Noitfi Fcrk AT 4C 15 58N LONG 073 C1 01VV
September 1,1992 0910 1.3July 27,1993 1350 .86
May 23,1994 1215 6.4
13.0
18.0
11.5
61
64
50
6.7
7.0
6.9
90
78
58
80
<1.0 <1.0
<1.0
03039950 South Fork Sens Creek near Femdale. Pa.. Site 832 /LAT 40 15 Q2N LONG 078 58 2QW1
September 1,1992 1015 7.0 13.5 773 5.6 92 668
July 27,1993 1035 6.6 18.0 840 7.3 100 654
May 23,1994 1430 33 16.0 383 6.9 46 312
19
2310
350
770
330
m
9.0
7.7
9.2
m
rnJix
320
320140
88
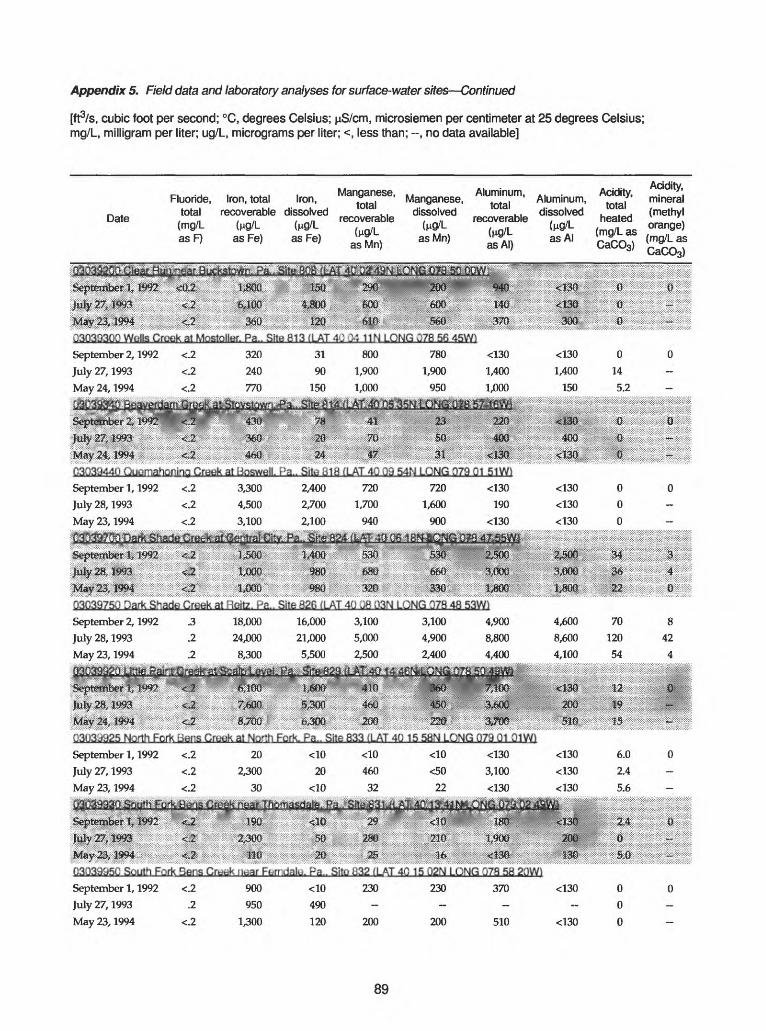
Appendix 5. Field data and laboratory analyses for surface-water sites Continued
[ft3/s, cubic foot per second; °C, degrees Celsius; uS/cm, microsiemen per centimeter at 25 degrees Celsius; mg/L, milligram per liter; ug/L, micrograms per liter; <, less than; --, no data available]
_ . Date
,-, . . . . . . .Fluonde, Iron, total Iron,total recoverable dissolved
<molL ML (M9/LasF) asFe) as Fe)
Manganese, a . ..Manganese,
dissolved
Aluminum, .
.. Aluminum,dissolved
. .... Acidity, Acidity,
. ,mineral
sCaC03)
pj ........ 120 SP*
Q303930C Wolls Crook at Mostoller. Pa.. Site 813 (LAT 4<J 04 11N LONG 078 56 45\M
September 2,1992 <.2 320 31 800 780 <130
July 27,1993 <.2 240 90 1,900 1,900 1,400
May 24,1994 <.2 770 150 1,000 950 1,000
aggjgj^j^
<130
1,400
150
C3j3d.W
September 1, 1992
July 28, 1993
May 23, 1994
< 2 ^rS?*1: i^r-y'
i'lv Gfdt;k at iioswel
<.2 3,300
<.2 4,500
<.2 3,100
|0 8$ 50
24 W 3$
ra.. Situ bid I LAT 4J jj 54.N LCNG 379 '1 51 Wi
2,400 720 720
2,700 1,700 1,600
2,100 940 900
400
<130
190
<130
<130
<130
<130
0
14
5.2
&
0
0
0
581
yn,03039750 Dark Shade Creek at Hertz. Pa.. Site 826 (LAT 40 08 03N LONG 078 48 53W)
September 2,1992 .3 18,000 16,000 3,100 3,100 4,900
July 28,1993 .2 24,000 21,000 5,000 4,900 8,800
May 23,1994 .2 8,300 5,500 2,500 2,400 4,400
^^^^^^^^^^^^^^^^SB^il^^S^S^.v . :: :¥:-x?S.:-!*-:w:7:-:-Xx' ' 1--^ T
3&&
'5*300
G3U3j^25 North Fcrk Liai:s Crtsuk at N^r
September 1,1992 <.2 20
July 27,1993 <.2 2,300
May 23,1994 <.2 30
Fcrk. rs... Sits 833 (LAT 40 15 5B.\ LL'NG L'7'd 'J1 LJ1WI
<10 <10 <10 <130 <130
20 460 <50 3,100 <130
<10 32 22 <130 <130
Ig^ls^^i^^ijtg^
6.0
2.4
5.6
50 ^0
^. ^ ^^i;::^:,,:;:;*^^
Q3Q3995C South Fork Bens Cmak naar Farndale^ Pa.. Site 832 (LAT 40 15 Q2N LONG 078 58 2flWl
September 1,1992 <.2 900 <10 230 230 370 <130
July 27,1993 .2 950 490 -
May 23,1994 <.2 1,300 120 200 200 510 <130
89

Appendix 5. Field data and laboratory analyses for surface-water sites Continued
DateDischarge,
Time instantaneous (frVs)
Temperature, water (°C)
Specific conductance
(nS/cm)
pH (standard
units)
Alkalinity, total
(mg/L as CaCO3)
Residue at105°C, dissolved
(mg/L)
Carbon, inorganic,
total (mg/L asC)
$*!&§s8$®s^ilpieS&et i, TWw mm w£ ** isl
2 %m «M s
u
N
Sulfate, total (mg/L
as SO4)
190-
rj4Co'UL: Stjnvcr^-k MJv^-r at Fi-rrvJaL-. Pa.. Situ L'j5 (LAT -',L- 17 'jSM LONG .7b 55 15W1
September 1,1992
July 27,1993
May 23,1994
40301407854Q2Q1 StonvcrBek River at Shanksvilb. Pa.. Site BC1 (LAT 40 00 14N LONG 078 54 02W)
September 1, 1992
July 27, 1993
May 24, 1994
0850
1245
1225
11
11
21
16.0
23.5
18.0
557
740
446
6.8
6.8
6.4
58
100
50
532
596
360
1019
11
190
220
140
mm^mmmmmm^mmmmm^^^m1489 JS,P
I-heads Creek at ShanksvUlu. fa.. Site bl. (LAT 4j Ju 56 N LONGi54 U5W)
September 1,1992
July 27,1993
May 24,1994
1030
1110
1045
14
2.5
23
18.5
22.5
16.5
610
535
412
6.8
6.3
6.6
24
48
15
134
540
538
352
5.1
6.4
3.4
m
280
230
170
4CQ337Q785137Q1 Calendars Run at Buckstown. Pa.. Site 809 (LAT 4C 03 37N LONG 078 51 37W1
September 1,1992 1300 .11 13.0 224 7.1 30 180
July 28,1993 1440 <.01 18.5 250 6.1 20 190
May 23,1994 1715 .87 15.5 160 7.1 10 144
3.6
5.3
2.1
30
19
40
imt
400611C7h555HC1 Stonvcrebk River at Kantnsr. i a.. Site bu2 (LAT 4^ J6 11N LONG J78 55 58Wi
September 2, 1992 1000 35 13.5 650 6.0 42
July 27, 1993 1140 23 23.5 884 7.2 42
May 23, 1994 1620 91 20.0 567 7.6 22
564
678
470
8.3
9.1
4.5
3710 73 ? MB
i'fci
260
420
260
wfifi;.-t\- .-.-:-:-.-.-.-.-.- -.-.-.-.-. .-.-.-.-.-.-.-.-.-. £Jttt:'-- '. f.-.-.-.-.-.-.-.-.-.-.-.--,-.-.-;1S£:-Ji.-.- v.w.-.w.'.v.-.-.v.-.'. tt-.-.-.-.v -. --. - -" ^i?Si-- " .-.-i-.^'.^.-'jAi;-.-.-.-.-;'.-.-.-.---:-.---.-. '.^(ff>.-. .-- ,
LOiM^gp^ipiigHj??::;:;:^;!^
90

Appendix 5. Field data and laboratory analyses for surface-water sites Continued
Fluoride,
« «£asF)
Iron, total recoverable
asFe)
Iron, dissolved
asFe)
Manganese, total
recoverable (H9/L
asMn)
Manganese, dissolved
asMn)
Aluminum, total
recoverable (H9/L asAI)
Aluminum, dissolved
(MO/L asAI
Acidity, total
heated
CaCO3)
Acidity, mineral (methyl orange) (mg/L as CaCO3)
^^^tiSilS&Siri^^ " "
^pteoPerl, W& <3O
lpiii» <3 £*>.*
5 2 IS "2&
0
03Q4QOQQ Slanvcreek iivcr at F^rncfaL. Pa.. Site fciJS (LAT 4u 17 OtiM LCNG :7S 55 15Wi September 1,1992 <.2 1,200 630 1,300 1,200 990
July 27,1993 <.2 1,000 340 2,600 2,500 4,700 May 23,1994 <.2 1,700 630 1,400 1,400 1,800
640 154,400 341,100 16
a
40UG l4C7b54C2(J1 Stonvcroak reiver at Shanks vite. Pa.. Situ ti(J1 ^LAT 40 QC UN LUNG C78 54 G2W1
September 1,1992 <.2 1,000 83 450 210 820 130 0 0
July 27,1993 <.2 500 40 500 440 330 <100 0
May 24,1994 <.2 390 220 820 780 <130 <130 0
72P 290.
_^»-:^:: IDiCifV TfOlli1 ^'i*-" : 7f?f\f- '*-''£&?'
-hoads Creek at Shanksvife. Pa.. Situ
340:
L20D
tLAT 4i .. 56N LONG 078 54 05Wi
430:
8.6
m
September 1,1992
July 27,1993 May 24,1994
;;4^Q58078Sg23^l1^n:
400337078513701 C
September 1, 1992
July 28, 1993May 23, 1994
ialendars Run at LJuckstDwn. Pa.. Site 809 (LAT 40 03 37N LONG 078 51 37W)
<.2<.2
.2
160
40310
45
10100
170
60820
160<50
730
<130
<100
600
<130<100
180
00
0
0--
Slcnvcreek Ftiver at Kantnbf. i'a,. Sitd h'^2 (LAT 40 CG UN LONG C7h 55 5GW)
September 2, 1992
July 27, 1993
May 23, 1994
<.2
<.2
<.2
160
240
180
61
20
<10
75
170
450
65
100
400
240
240
370
mm 2,K)Q poo ^009
440
I
0
0
0
Ny
150
200
290
91
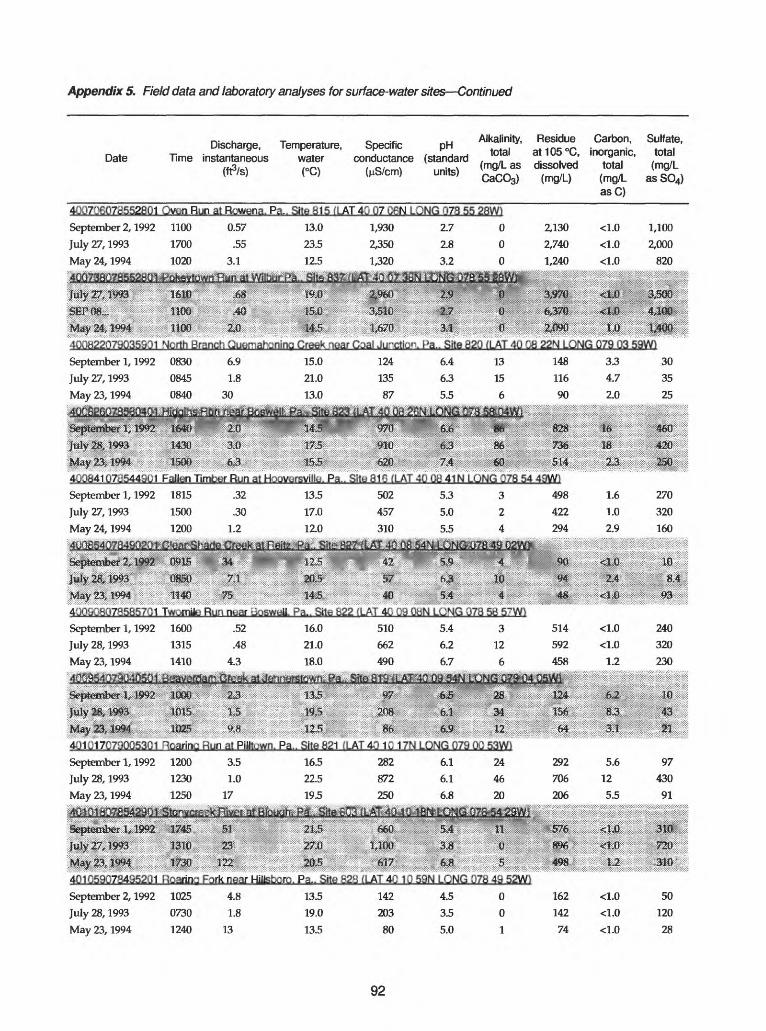
Appendix 5. Field data and laboratory analyses for surface-water sites Continued
Date TimeDischarge,
instantaneousTemperature,
water(°C)
Specificconductance
(nS/cm)
pH(standard
units)
Alkalinity,total
(mg/L as CaCO3)
Residueat105°C,dissolved
(mg/L)
Carbon, Sulfate, inorganic, total
total (mg/L (mg/L as SO4) asC)
40Q7Q6Q7a552fiQl Qvon Run at Rowena. Pa.. Site 815 (LAT 40 07 C N LONG 073 55 28W)
September 2, 1992 1100 0.57 13.0 1,930 2.7 0
July 27, 1993 1700 .55 23.5 2,350 2.8 0
May 24, 1994 1020 3.1 12.5 1,320 3.2 0:'frp$^
'"'~ "'" 1610 ^ --- --- -"££--- pp 2$ i
,40 m& 3M& m &
2,130
2,740
1,240
<1.0
<1.0
<1.0
1,100
2,000
820sis
11G0 m - -^~- vM£, , pm ^sfc .... .Sl H ... ..$P& . >y«>;S^*.< 400822079035931 North Branch Quemahonin Creek near Caal Junction. Pa.. SKe 820 (LAT 40 08 22N LONG 079 03 59W1
September 1, 1992
July 27, 1993
May 23, 1994
0830
0845
0840
6.9
1.8
30
15.0
21.0
13.0
124
135
87
6.4
6.3
5.5
13
15
6
148
116
90
' " "M
3J0
WO86
d544aul Fallen Timter Run at H-juvarsvillL-. Pa.. Sito 81G (LAT 40 ud 41N LONG 078 54 49W1
September 1, 1992 July 27, 1993 May 24, 1994^085407849020*:lefHember &, 1992
1815 1500 1200
mm mm
.32
.30 1.2
ii&S&i&i:34
13.5 17.0 12.0
i&ssffifcss&^TssiBS
2501
502 457 310
timmmm4257
5.3 5.05.5
3 2 4
^J^^S078:*S: Q2WOis
w4
498
422
294
3.3
4.7
2.0
2,1
1.6
1.0
2.9
30
35
25
4On9QHQ7p585701 Tw.Tmik Run nuar L^swull. Pa.. Site -22 (LAT 4C j9 Q^N L'JNG :J7J 5d 5"Wl
September 1,1992
July 28,1993
May 23,1994
1600
1315
1410
.52
.48
4.3
401C17C79QQ53C1 Rcarine Hun at PilHcwn. Pa.. Site 821 (LAT 43 1C 17N LONG G79 00 53W)
September 1, 1992 1200 3.5 16.5 282 6.1 24
July 28, 1993 1230 1.0 22.5 872 6.1 46
May 23, 1994 1250 17 19.5 250 6.8 20
64
292
706
206
1.2
m
5.6
12
5.5
270
320
160
10
240
320
230
m
97
430
91
^ycre^^ilpMaQp^^
401C59G734952'J1 iicarin;
September 2,1992 1025
July 28,1993 0730
May 23,1994 1240
122:
Fork near HiUsbcrc. Pa.. Site
1.2.AT 4>: 1 w1 59N LONG 07d 4i> 52Wi
4.8
1.8
13
13.5
19.0
13.5
142
203
80
4.5
3.5
5.0
162
142
74
50
120
28
92
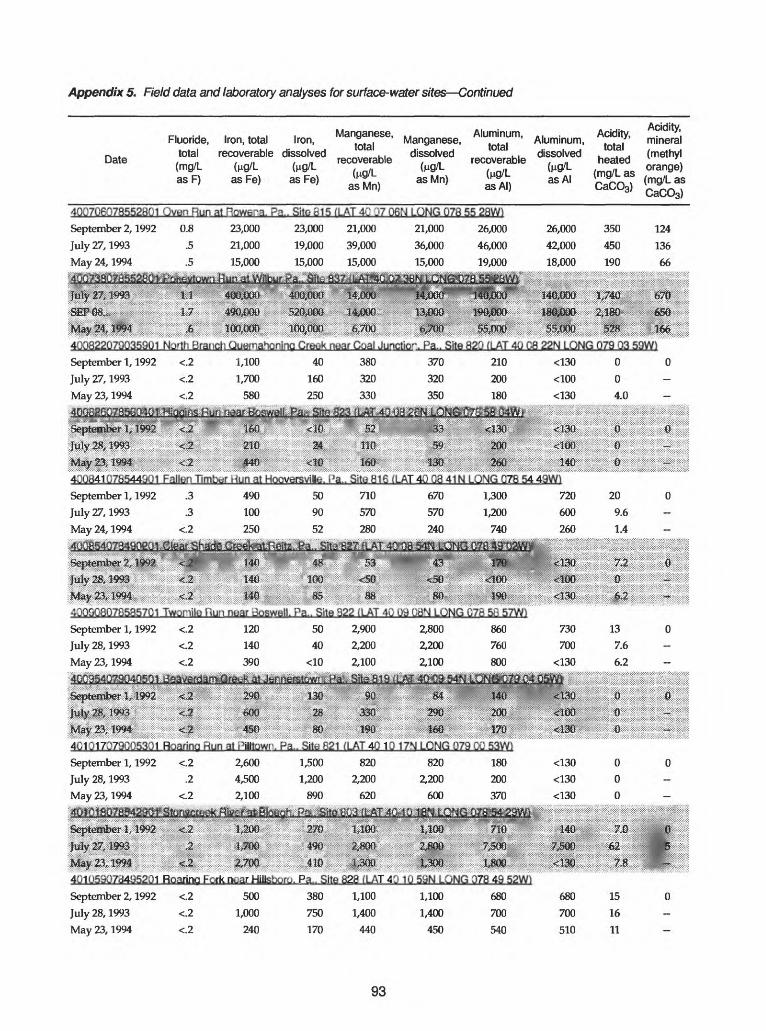
Appendix 5. Field data and laboratory analyses for surface-water sites Continued
Date
400706078552801
Fluoride,total
(mg/LasF)
Iron, totalrecoverable
(nO/l-as Fe)
Iron,dissolved
asFe)
Manganese, total
recoverable
asMn)
Manflanese,dissolved
fog/las Mn)
Aluminum, A .
recTrable di^
£% -*total
heated
CaCO3)
Acidity, mineral(methyl orange)
CaCO3)
Oven Run at Rowena. Pa.. Site 815 (LAT 40 07 06N LONG 078 55 28W)
September 2,1992 0.8 23,000 23,000 21,000 21,000 26,000
July 27,1993 .5 21,000 19,000 39,000 36,000 46,000
May 24,1994 .5 15,000 15,000 15,000 15,000 19,000
Ipl^ffi^^^JSiiV''23£ I^JiS i: 1 '(BiRJStK'- J^D^di^? J^i£i0jD: I4JMW? M&iJCfif
l^ij^ytSM.................. _.v-&;.........s,%ffi$®4Q0822Q79Q359Q1 North Branch Quemahonlna Creek near Coal Junction. Pa!. Site 820 (LAT 4 j
26,000 350 124
42,000 450 136
18,000 190 66
I4&88® USQ 6256
2,180 650
22N LONG 079September 1, 1992
July 27, 1993
May 23, 1994
1,100
1,700
580
40
160
250
380
320
330
370
320
350
210
200
180
S2 m m
im218; 24? 88 m 2p**0; <tp see im. 2&a w&
Fallun Timbtir t^n at HooversvJUe. i ja.. Sito 816 (LAT 40 03 41N LONG C78 5449WJ
September 1, 1992
July 27, 1993
May 24, 1994
.3
.3
<-2
490
100
250
50
90
52
710
570
280
670
570
240
1,300
1,200
740
720
600
260
<130 0
<100 0
<130 4.0
B
0
20
9.6
1.4
0
@featSM:W^^<J 1411 4:£; 53 * 43
1993
Twjr-iiliJ nu'i nu'ar ^oswoll. ra.. Site i>22 iLAT 40 09 Q8N LONG C7r 5- 57V/1
September 1, 1992 <.2
July 28, 1993 <.2
May 23, 1994 <.2
120
140
390
50
40
<10
2,900
2,200
2,100
2,800
2,200
2,100
860
760
800
730
700
<130
13
7.6
6.2
grdaj^;Q^^'a.t:^aWnfeMS^':>:^-:a'?i!;
3m: 200
4C1317079C0530I Roaring Run at PJUtowr. Pa.. Site 521 (LAT 40 10 17N LONG Q79 CO 53W1
September 1,1992
July 28,1993
May 23,1994
.2
2,600
4,500
2,100
1,500
1,200
890
820
2,200
620
820
2,200
600
180
200
370
<130
<130
<130
tixW^faMs^^tglSfaMmi^^-2 ii!^J9^ 27£) ^; JOX)^ 1100: ^IG 140 7S
4Clu5a::-7a495201 Roarino Fcfk n^ Pa.. Site 828 (b\T4L- 1u 5jN LONG 078 4a 52Wi
September 2,1992
July 28,1993
May 23,1994
500
1,000
240
380
750
170
1,100
1,400
440
1,100
1,400
450
680
700
540
680
700
510
15
16
11
93
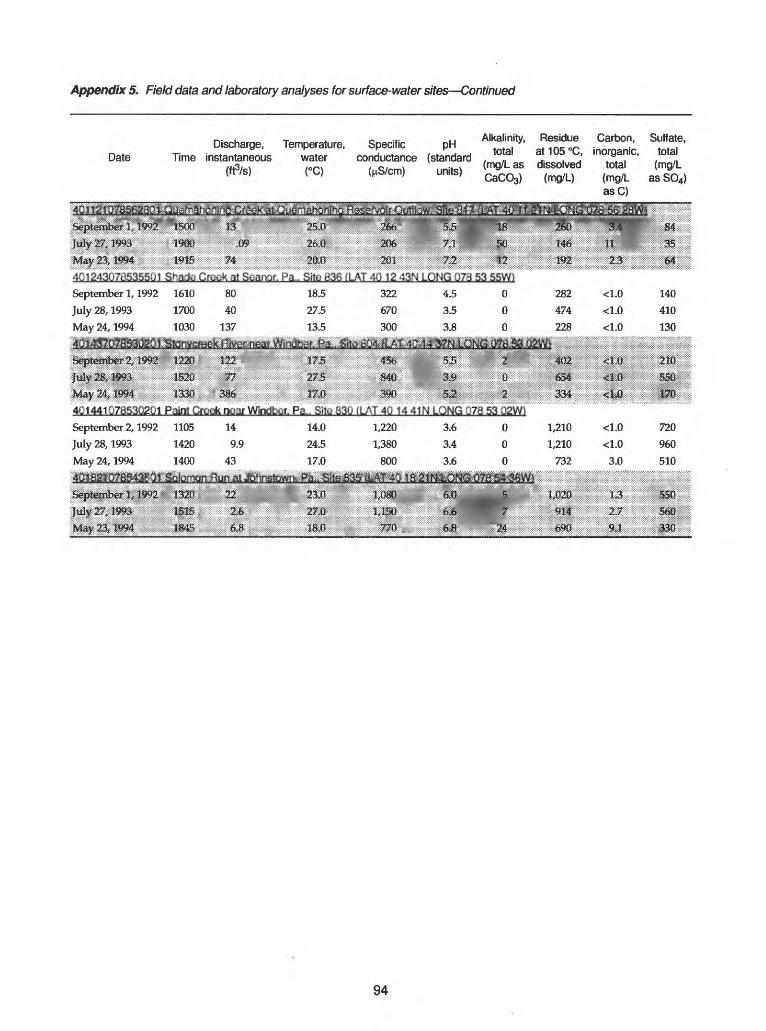
Appendix 5. Field data and laboratory analyses for surface-water sites Continued
Discharge, Date Time instantaneous
^B-jtZI tJ785S23"3^''yP^i''^5it^ !?Irl5*S'?e$j?8ti'
Temperature, water
p^S^MI
Specific conductance
PH (standard
units)
Alkalinity, total
(mg/L as CaCO3)
dissolved (mg/L)
Carbon, inorganic,
total (mg/L asC)
total (mg/L
as SO4)
m^mm^immi^mmm^m^^^^mm^m^'""'^25;D m S$ m 268 3,4: S4
IP |y^ J?P ^1 5® Wfe H 35
m M & m4C124307c;5355Ul S^aJ^ Cru-uk at Sua:ijr. Pa.. Situ t^3g iLAT 40 12 -',3N LONG 'J7J 53 55Wi
September 1, 1992 1610 80 18.5 322 4.5 0 282 <1.0 140
July 28, 1993 1700 40 27.5 670 3.5 0 474 <1.0 410
May 24, 1994 1030 137 13.5 300 3.8 0 228 <1.0 130
1704C1441 0785302U1 Paint Crook noar Windbor. Pa.. Sito &3Q (LAT 40 14 41N LONG 078 53 Q2W)
September 2, 1992 1105 14 14.0 1,220 3.6 0 1,210 <1.0 720
July 28, 1993 1420 9.9 24.5 1,380 3.4 0 1,210 <1.0 960
May 24, 1994 1400 43 17.0 800 3.6 0 732 3.0 510
^^i
1994 184? 6,8; |J& Wn ^ 24 jy
94
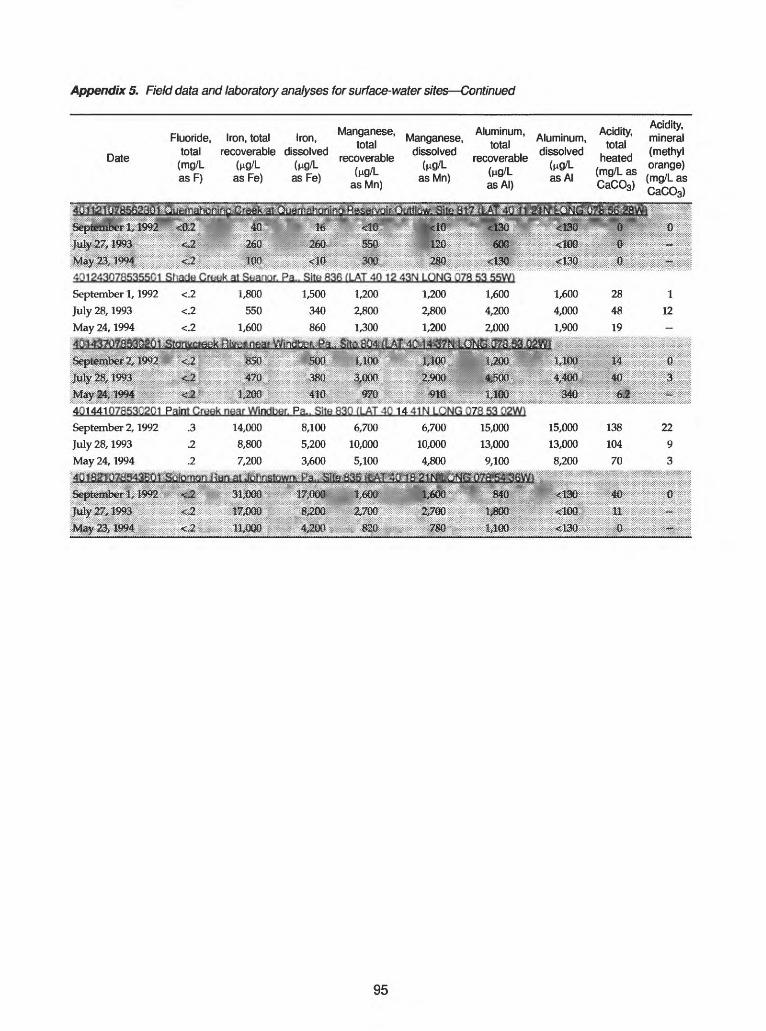
Appendix 5. Field data and laboratory analyses for surface-water sites Continued
Fluoride,
Date total Uate (mg/LasF)
Iron, total recoverable
asFe)
Iron, dissolved
asFe)
Manganese, total
recoverable
asMn)
Manganese, dissolved
asMn)
Aluminum, total
recoverable (ng/LasAI)
Aluminum, dissolved
as Al
Acidity, total
heated (mg/L as CaCO3)
Acidity, mineral (methyl orange) (mg/L as CaCO3)
4P^tSif£l§£^^ 2ii^i^$S^^iii£<^ ...............
;!$!%< 27v 1993 *i,2 260 ZiSQ ^S0: I2& 4500 g$00 Si
40124307^535501 Sl.adc GroLk at SL-a-ur. Pa.. Situ 83G fLA.T -ID 12 -;3N LONG J73 53 55Wi
September 1, 1992
July 28, 1993
May 24, 1994
<.2
<.2
<.2
1*1994
401441Q7553C2C1 Paint Creek near Windber. Pa.. Site 83Q (LAT 4C14 41N LCNG 078 53 Q2W)
September 2, 1992
July 28, 1993
May 24, 1994
14,000
8,800
7,200
8,100
5,200
3,600
6,700
10,000
5,100
6,700
10,000
4,800
15,000
13,000
9,100
15,000
13,000
8,200
138
104
70
22
9
3
mm& mm *ntm
95