
Safety Issues Referred to Induced Sheath Voltages in High ...
Upload
independentCategory
view
0download
0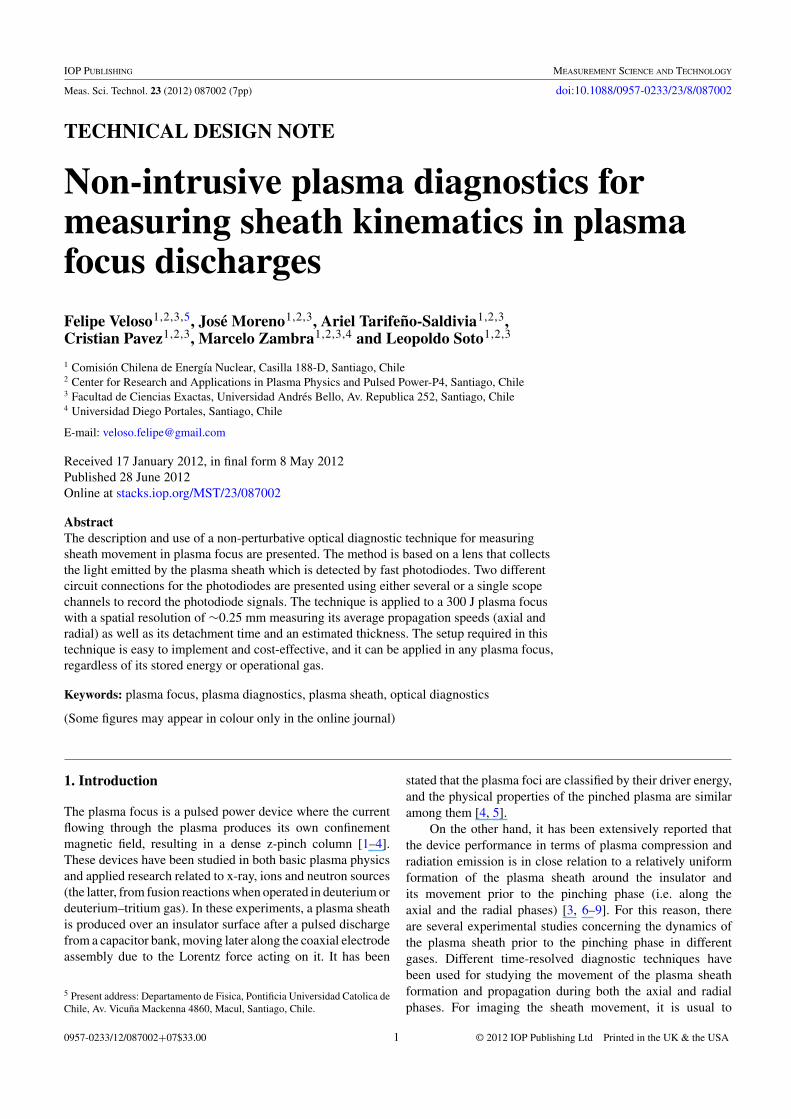
IOP PUBLISHING MEASUREMENT SCIENCE AND TECHNOLOGY
Meas. Sci. Technol. 23 (2012) 087002 (7pp) doi:10.1088/0957-0233/23/8/087002
TECHNICAL DESIGN NOTE
Non-intrusive plasma diagnostics formeasuring sheath kinematics in plasmafocus dischargesFelipe Veloso1,2,3,5, Jose Moreno1,2,3, Ariel Tarifeno-Saldivia1,2,3,Cristian Pavez1,2,3, Marcelo Zambra1,2,3,4 and Leopoldo Soto1,2,3
1 Comision Chilena de Energıa Nuclear, Casilla 188-D, Santiago, Chile2 Center for Research and Applications in Plasma Physics and Pulsed Power-P4, Santiago, Chile3 Facultad de Ciencias Exactas, Universidad Andres Bello, Av. Republica 252, Santiago, Chile4 Universidad Diego Portales, Santiago, Chile
E-mail: [email protected]
Received 17 January 2012, in final form 8 May 2012Published 28 June 2012Online at stacks.iop.org/MST/23/087002
AbstractThe description and use of a non-perturbative optical diagnostic technique for measuringsheath movement in plasma focus are presented. The method is based on a lens that collectsthe light emitted by the plasma sheath which is detected by fast photodiodes. Two differentcircuit connections for the photodiodes are presented using either several or a single scopechannels to record the photodiode signals. The technique is applied to a 300 J plasma focuswith a spatial resolution of !0.25 mm measuring its average propagation speeds (axial andradial) as well as its detachment time and an estimated thickness. The setup required in thistechnique is easy to implement and cost-effective, and it can be applied in any plasma focus,regardless of its stored energy or operational gas.
Keywords: plasma focus, plasma diagnostics, plasma sheath, optical diagnostics
(Some figures may appear in colour only in the online journal)
1. Introduction
The plasma focus is a pulsed power device where the currentflowing through the plasma produces its own confinementmagnetic field, resulting in a dense z-pinch column [1–4].These devices have been studied in both basic plasma physicsand applied research related to x-ray, ions and neutron sources(the latter, from fusion reactions when operated in deuterium ordeuterium–tritium gas). In these experiments, a plasma sheathis produced over an insulator surface after a pulsed dischargefrom a capacitor bank, moving later along the coaxial electrodeassembly due to the Lorentz force acting on it. It has been
5 Present address: Departamento de Fisica, Pontificia Universidad Catolica deChile, Av. Vicuna Mackenna 4860, Macul, Santiago, Chile.
stated that the plasma foci are classified by their driver energy,and the physical properties of the pinched plasma are similaramong them [4, 5].
On the other hand, it has been extensively reported thatthe device performance in terms of plasma compression andradiation emission is in close relation to a relatively uniformformation of the plasma sheath around the insulator andits movement prior to the pinching phase (i.e. along theaxial and the radial phases) [3, 6–9]. For this reason, thereare several experimental studies concerning the dynamics ofthe plasma sheath prior to the pinching phase in differentgases. Different time-resolved diagnostic techniques havebeen used for studying the movement of the plasma sheathformation and propagation during both the axial and radialphases. For imaging the sheath movement, it is usual to
0957-0233/12/087002+07$33.00 1 © 2012 IOP Publishing Ltd Printed in the UK & the USA
Meas. Sci. Technol. 23 (2012) 087002 Technical Design Note
Figure 1. Schematic diagram of the imaging system and photograph of the load, where the optical fibers image can be seen next to thecopper anode. The lens and the optical fibers are located outside the vacuum chamber.
use ICCD (intensified charged coupled devices) [3, 9–12]or streak [12, 13] cameras which capture an image of aportion of the visible light coming from the plasma sheath orlaser probing diagnostics (either schlieren or interferometry)[3, 14, 15], capturing the light refractivity due to the plasmaof a synchronized pulsed laser. On the one hand, these casesusually use different shots under similar conditions in order toprovide plasma dynamics, having the difficulty of shot-to-shotvariation among discharges. Besides, the costs of the camerasand/or lasers are not always affordable for small labs. Onthe other hand, these imaging diagnostics have the advantageof being non-perturbative for the plasma sheath. In the caseof studying the plasma dynamics on a single shot, the usualdiagnostics are magnetic probes [16–20]. These probes detectthe induced voltage on a coil located in the plasma pathwaydue to the time- and space-varying current carrying region.These probes are located at different axial/radial positions,having the disadvantage of producing perturbations on theplasma sheath. These perturbations must be considered whenanalyzing their results. Some efforts have been devoted toeither correcting their signals using an appropriate model[19] or using very small probe sizes when compared tothe plasma sheath dimensions [20]. These methods areparticularly difficult to use on very small plasma focusdevices (usually portable and sub-kJ of stored energy) wherethe physical dimensions of the load and the plasma sheathare in the millimeter range (or even lower) [10, 14, 21–26]. Additionally, some optical diagnostic methods havebeen used for determining some sheath properties basedon single shot measurements. A photodiode system hasbeen used for determining sheath particle density profilesfor a pure hydrogen plasma [27] under certain symmetry
conditions. Also, a photomultiplier system has been used fordetermining the sheath axial velocity and thickness estimationlocating optical fibers inside the discharge chamber [28]. Thispaper describes the application of a non-intrusive diagnosticmethod useful to measure sheath kinematics in plasmafocus discharges, regardless of their physical dimensions oroperating gas. The method is based on the detection of thevisible light emission of the plasma using a simple and cost-convenient circuit. The application of the technique and someconsiderations on its use for different cases are presented.
2. Experimental setup
The experiments were performed in the PF-400J device [22],which is a fast and very low-energy plasma focus (quarterperiod !310–330 ns; stored energy !210–400 J). The loadsection consists of a central 6 mm radius electrode (live anode)surrounded by eight equally spaced rods which—together withthe baseplate—constitute the grounded cathode. The anodedimensions are 28 mm in length and 6 mm in radius, whereasthe cathode bar structures have internal radius of 13 mm. Theanode is partially covered by a 21.6 mm alumina insulatorleaving an effective anode length of 6.4 mm. This plasma focuscannot be classified as either a Mather-type [1] or a Filippov-type [2] device due to its anode dimensions (radius/effectivelength). This device is more accurately classified as a hybrid-type plasma focus. Deuterium has been used as working gas.The electrical diagnostics of the discharge are the load voltageand the current derivative, measured with a resistive dividerand a Rogowski coil, respectively. The vacuum chamber hastwo radial BK7 windows which allow the collection of thelight emitted by the plasma (but for this diagnostic, only one
2
Meas. Sci. Technol. 23 (2012) 087002 Technical Design Note
window is needed). The optical system consists of a convergentlens located outside the vacuum chamber in the radial directionof the plasma load (i.e. side-on), whose object plane lies in themiddle of the anode. A screen is located in the image planeof the lens, where the optical fibers are positioned. In ourexperiments, the focal length is 175 mm, the lens to screendistance is 850 mm and the load to lens distance is 220 mm,having a depth of field of 0.7 mm. This configuration providesan optical magnification M!3.9 and this can be easily adjustedby simply moving the lens and adjusting the image and objectdistances properly. In addition, a 25 mm diameter aperture hasbeen located at 165 mm from the load in order to diminishthe stray light emitted elsewhere inside the vacuum chamber.A schematic diagram is shown in figure 1. The optical fibers arestandard polymer (polyethylene) fiber optic cables, with 1 mmcore diameter. Given the optical magnification of the system,these fibers have a spatial resolution of !0.25 mm in the objectplane (i.e. at the plasma load). This resolution should be lowerthan the thickness of the plasma sheath to be measured. Ifit is not the case, then the optical magnification should beadjusted properly. The fibers are coupled to negatively biasedphotodiodes (SFH250V) operating as light-driven currentsources, having a temporal resolution of 10 ns (both rise andfall times, according to manufacturer specifications). If shortertemporal resolution is needed, faster photodiodes should beused. The photodiodes are not cross calibrated; hence, theirsignal amplitudes do not provide further information.
The screen (image plane of the lens) has been made ofwood, where several holes have been drilled for positioningthe optical fibers in the desired configuration. This screenis mounted in a three-axis positioner for fine positioningadjustment. The corresponding position of the optical fibers inthe object plane (i.e. at the load) is obtained from photographsof the load, using the anode dimensions as scale indicator. Theuncertainties of each fiber position depend on the photographresolution, which is usually lower than 0.1 mm. The five-fiber system uncertainties will not affect the average axialspeed and estimated thickness measurements since they willbe shifted as a whole. However, it can affect the average radialspeed and detachment time estimations which are includedin the calculations. An example of this kind of photographis included in figure 1. The fibers are arranged in the imageplane in such a way so as to measure the light emission from theplasma sheath during its movement close to the anode duringthe axial phase (as shown in figure 1). This positioning avoidsmisinterpretation from light emitted in the same line of sight,since no plasma lies on it before the passage of the sheath.However, in the radial phase, the fibers could not be arrangedto view the anode top in the side-on direction, since the radialimplosion of the plasma sheath has cylindrical symmetry, andit could lead to misinterpretations of the real position of thelight emission. To overcome this situation, an optical fiber hasbeen located for monitoring the anode corner, where the axialphase ends and the radial begins. This fiber will indicate thebeginning time for the radial phase. If major detail is requiredfor measuring the time-varying radial position of the sheath,the optical system and fiber arrangement should be put in theend-on direction. However, the plasma focus discharges have
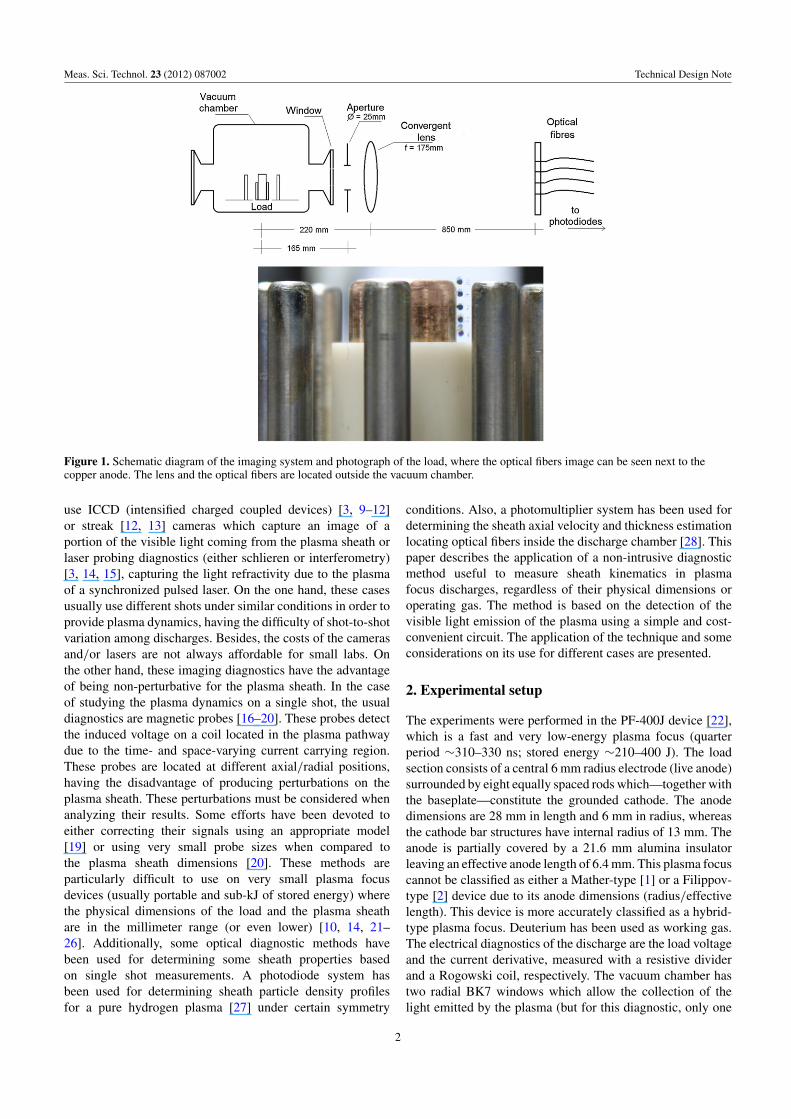
Figure 2. Electrical signals in a 9 mbar D2, !310 J shot using onescope channel per optical fiber, as shown in the electrical diagram.Fiber position is indicated on each signal.
been stated as the plasma sheath implodes on axis up to a finalradius of 0.1–0.2a (where a is the anode radius) at the time ofthe dip in the current derivative trace [4, 5, 28, 29]. Using thisinformation and the measured time from the fiber located in theanode corner, a radial transit time can be obtained. Figure 1shows a schematic of the experimental setup and an actualpicture of the electrode load, where the image of the opticalfibers can be seen next to the anode border.
3. Diagnostic description and results
Two different sets of experiments were performed formeasuring the movement of the plasma sheath in the plasmafocus. The first set was performed using the load parameters in9 mbar D2, and charging voltage of 27 kV(!310 J). These loadparameters have been stated as the most reliable operation ofour device, where larger neutron yields have been obtained(!106 n/shot) [22]. In this case, the sheath movement ismonitored using five optical fibers coupled to five independentphotodiodes. Each photodiode is connected to a scope channel,as shown in figure 2. For the operational condition used inthis set of experiments, the photodiode signals show single ordouble Gaussian-like curves, depending on the position that
3
Meas. Sci. Technol. 23 (2012) 087002 Technical Design Note
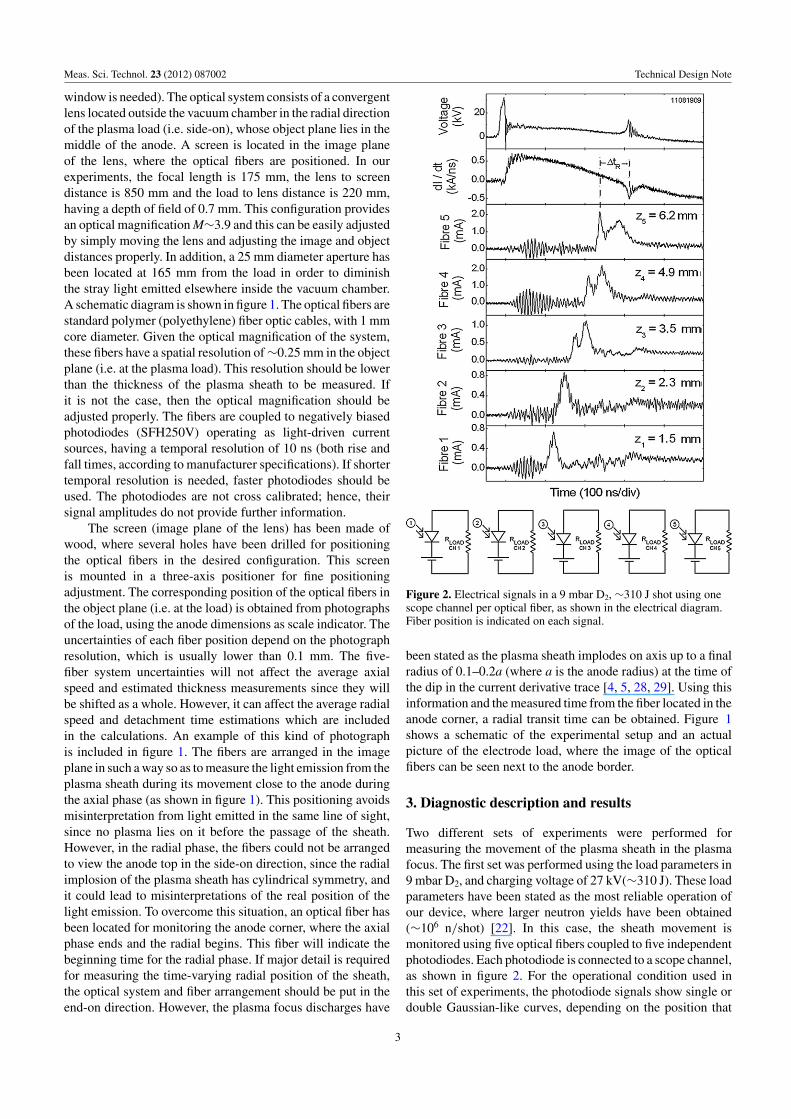
Figure 3. Electrical signals in a 15 mbar D2, !190 J shot using asingle scope channel for four optical fibers, as shown in theelectrical diagram.
monitors each optical fiber, as shown in figure 2. The singleGaussian-like curves are present in the optical fibers whichmonitor the plasma close to the insulator. The double Gaussian-like curves are more frequent in the fibers that monitor thesecond half of the axial phase. When measuring a singleGaussian-like curve, the photodiodes detect the movement ofa compact sheath. In the case of double Gaussian-like curves,there are three possible explanations: the sheath has separatedinto two consecutive light-emitting zones, or there is a secondbreakdown toward the outer electrode instead of the insulatorsurface, or the sheath has become a complex multi-filamentarystructure making the optical fiber detect more than one filamentin the same line of sight. Using this diagnostic technique, itis not possible to discriminate which explanation is correct.However, several filamentary structures have been measuredin larger devices using time-resolved visible images [3] andin the PF-400J itself using both visible and interferometricmeasurements of the radial phase [30]. These observationsprovide support to the last explanation, but widening ofthe sheath and/or a second breakdown could not be fullydiscarded. It is worthwhile to mention that similar doubledstructures have been measured with magnetic probes in a 1.1 kJplasma focus using nitrogen gas [19] which can be attributedto any of these explanations, and the analysis of its natureis beyond the scope of this paper. In any case, the kinematic
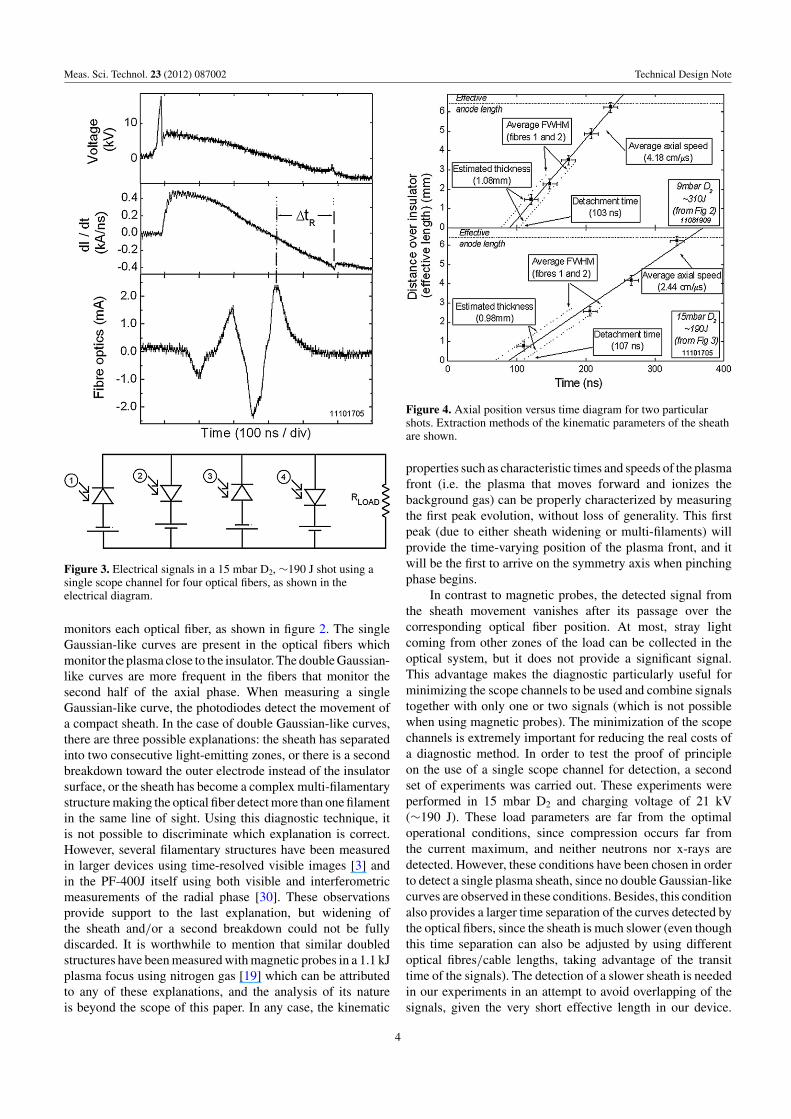
Figure 4. Axial position versus time diagram for two particularshots. Extraction methods of the kinematic parameters of the sheathare shown.
properties such as characteristic times and speeds of the plasmafront (i.e. the plasma that moves forward and ionizes thebackground gas) can be properly characterized by measuringthe first peak evolution, without loss of generality. This firstpeak (due to either sheath widening or multi-filaments) willprovide the time-varying position of the plasma front, and itwill be the first to arrive on the symmetry axis when pinchingphase begins.
In contrast to magnetic probes, the detected signal fromthe sheath movement vanishes after its passage over thecorresponding optical fiber position. At most, stray lightcoming from other zones of the load can be collected in theoptical system, but it does not provide a significant signal.This advantage makes the diagnostic particularly useful forminimizing the scope channels to be used and combine signalstogether with only one or two signals (which is not possiblewhen using magnetic probes). The minimization of the scopechannels is extremely important for reducing the real costs ofa diagnostic method. In order to test the proof of principleon the use of a single scope channel for detection, a secondset of experiments was carried out. These experiments wereperformed in 15 mbar D2 and charging voltage of 21 kV(!190 J). These load parameters are far from the optimaloperational conditions, since compression occurs far fromthe current maximum, and neither neutrons nor x-rays aredetected. However, these conditions have been chosen in orderto detect a single plasma sheath, since no double Gaussian-likecurves are observed in these conditions. Besides, this conditionalso provides a larger time separation of the curves detected bythe optical fibers, since the sheath is much slower (even thoughthis time separation can also be adjusted by using differentoptical fibres/cable lengths, taking advantage of the transittime of the signals). The detection of a slower sheath is neededin our experiments in an attempt to avoid overlapping of thesignals, given the very short effective length in our device.
4
Meas. Sci. Technol. 23 (2012) 087002 Technical Design Note
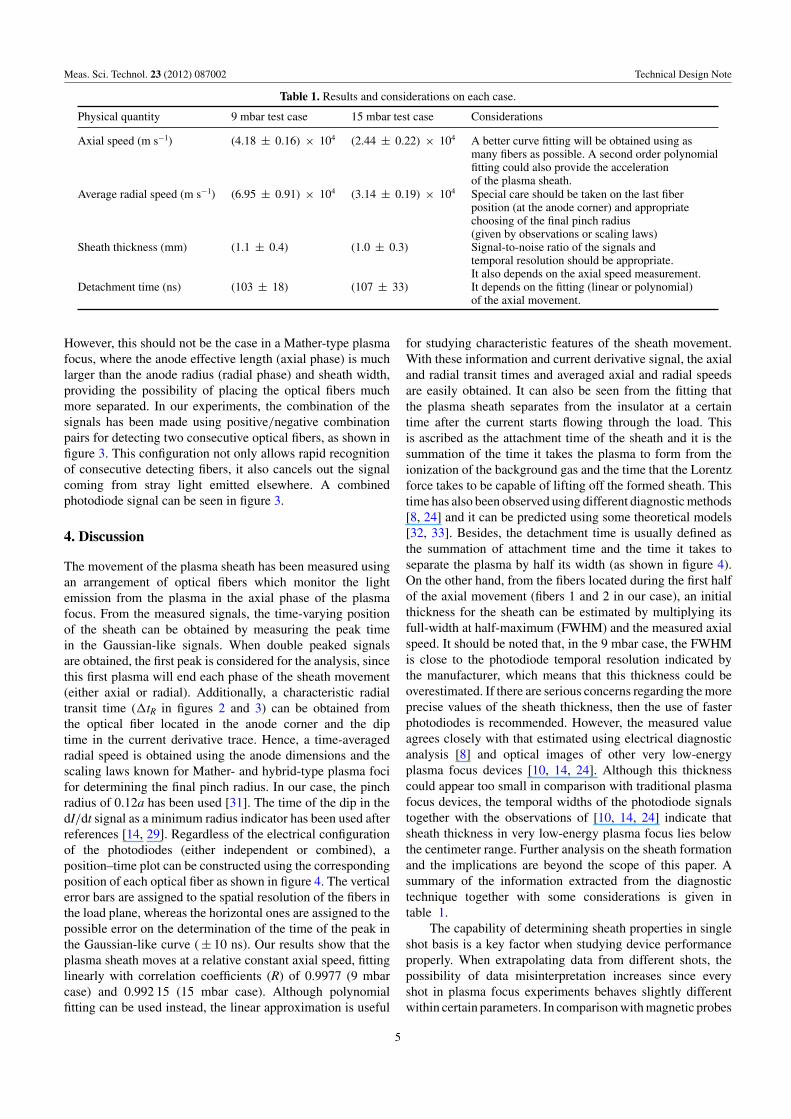
Table 1. Results and considerations on each case.
Physical quantity 9 mbar test case 15 mbar test case Considerations
Axial speed (m s"1) (4.18 ± 0.16) # 104 (2.44 ± 0.22) # 104 A better curve fitting will be obtained using asmany fibers as possible. A second order polynomialfitting could also provide the accelerationof the plasma sheath.
Average radial speed (m s"1) (6.95 ± 0.91) # 104 (3.14 ± 0.19) # 104 Special care should be taken on the last fiberposition (at the anode corner) and appropriatechoosing of the final pinch radius(given by observations or scaling laws)
Sheath thickness (mm) (1.1 ± 0.4) (1.0 ± 0.3) Signal-to-noise ratio of the signals andtemporal resolution should be appropriate.It also depends on the axial speed measurement.
Detachment time (ns) (103 ± 18) (107 ± 33) It depends on the fitting (linear or polynomial)of the axial movement.
However, this should not be the case in a Mather-type plasmafocus, where the anode effective length (axial phase) is muchlarger than the anode radius (radial phase) and sheath width,providing the possibility of placing the optical fibers muchmore separated. In our experiments, the combination of thesignals has been made using positive/negative combinationpairs for detecting two consecutive optical fibers, as shown infigure 3. This configuration not only allows rapid recognitionof consecutive detecting fibers, it also cancels out the signalcoming from stray light emitted elsewhere. A combinedphotodiode signal can be seen in figure 3.
4. Discussion
The movement of the plasma sheath has been measured usingan arrangement of optical fibers which monitor the lightemission from the plasma in the axial phase of the plasmafocus. From the measured signals, the time-varying positionof the sheath can be obtained by measuring the peak timein the Gaussian-like signals. When double peaked signalsare obtained, the first peak is considered for the analysis, sincethis first plasma will end each phase of the sheath movement(either axial or radial). Additionally, a characteristic radialtransit time (!tR in figures 2 and 3) can be obtained fromthe optical fiber located in the anode corner and the diptime in the current derivative trace. Hence, a time-averagedradial speed is obtained using the anode dimensions and thescaling laws known for Mather- and hybrid-type plasma focifor determining the final pinch radius. In our case, the pinchradius of 0.12a has been used [31]. The time of the dip in thedI/dt signal as a minimum radius indicator has been used afterreferences [14, 29]. Regardless of the electrical configurationof the photodiodes (either independent or combined), aposition–time plot can be constructed using the correspondingposition of each optical fiber as shown in figure 4. The verticalerror bars are assigned to the spatial resolution of the fibers inthe load plane, whereas the horizontal ones are assigned to thepossible error on the determination of the time of the peak inthe Gaussian-like curve ( ± 10 ns). Our results show that theplasma sheath moves at a relative constant axial speed, fittinglinearly with correlation coefficients (R) of 0.9977 (9 mbarcase) and 0.992 15 (15 mbar case). Although polynomialfitting can be used instead, the linear approximation is useful
for studying characteristic features of the sheath movement.With these information and current derivative signal, the axialand radial transit times and averaged axial and radial speedsare easily obtained. It can also be seen from the fitting thatthe plasma sheath separates from the insulator at a certaintime after the current starts flowing through the load. Thisis ascribed as the attachment time of the sheath and it is thesummation of the time it takes the plasma to form from theionization of the background gas and the time that the Lorentzforce takes to be capable of lifting off the formed sheath. Thistime has also been observed using different diagnostic methods[8, 24] and it can be predicted using some theoretical models[32, 33]. Besides, the detachment time is usually defined asthe summation of attachment time and the time it takes toseparate the plasma by half its width (as shown in figure 4).On the other hand, from the fibers located during the first halfof the axial movement (fibers 1 and 2 in our case), an initialthickness for the sheath can be estimated by multiplying itsfull-width at half-maximum (FWHM) and the measured axialspeed. It should be noted that, in the 9 mbar case, the FWHMis close to the photodiode temporal resolution indicated bythe manufacturer, which means that this thickness could beoverestimated. If there are serious concerns regarding the moreprecise values of the sheath thickness, then the use of fasterphotodiodes is recommended. However, the measured valueagrees closely with that estimated using electrical diagnosticanalysis [8] and optical images of other very low-energyplasma focus devices [10, 14, 24]. Although this thicknesscould appear too small in comparison with traditional plasmafocus devices, the temporal widths of the photodiode signalstogether with the observations of [10, 14, 24] indicate thatsheath thickness in very low-energy plasma focus lies belowthe centimeter range. Further analysis on the sheath formationand the implications are beyond the scope of this paper. Asummary of the information extracted from the diagnostictechnique together with some considerations is given intable 1.
The capability of determining sheath properties in singleshot basis is a key factor when studying device performanceproperly. When extrapolating data from different shots, thepossibility of data misinterpretation increases since everyshot in plasma focus experiments behaves slightly differentwithin certain parameters. In comparison with magnetic probes
5
Meas. Sci. Technol. 23 (2012) 087002 Technical Design Note
(which also provide single shot measurements), this methodhas attractive advantages such as the absence of perturbationsin the plasma sheath and the spatial resolution. Althoughthe perturbations can be minimized or calculated, they mustbe taken into account. Additionally, the spatial resolution islimited by the capability of constructing tiny loops on theprobe. In our case, there are no perturbations on the sheath andthe spatial resolution is only limited by the available opticsand the diffraction limit. Besides, optical detection also allowsthe combination of the signals into a single scope channel.On the other hand, the detectors (photodiodes) are priceconvenient and can be afforded by small labs. This plasmadiagnostic capability can also be applied using a matrix-likearray of fibers in the image plane monitoring the axial phase,in order to determine sheath curvature and/or speed profilesas a function of radial position without a considerable increasein complexity or cost. The measurement of the plasma sheathkinematic in a single shot without perturbing the plasma isdemonstrated obtaining precise values that can be used forproviding further insight into the plasma properties in plasmafocus discharges.
Acknowledgments
The authors would like to acknowledge Luis Altamirano forfruitful comments on the diagnostic method. The financialsupport from FONDECYT grant 1110940 and PBCT-CONICYT Chile PSD-01 are also acknowledged.
References
[1] Mather J W 1965 Formation of a high density deuteriumplasma focus Phys. Fluids 8 366
[2] Filippov N V, Filippova T I and Vinogradov V P 1962 Hightemperature dense plasma in a non-cylindrical z-pinch Nucl.Fusion Suppl. 2 577
[3] Sadowski M J and Scholtz M 2008 The main issues ofresearch on dense magnetized plasmas in PF dischargesPlasma Sources Sci. Technol. 17 024001
[4] Soto L 2005 New trends and future perspectives on plasmafocus research Plasma Phys. Control. Fusion 47 A361
[5] Soto L, Pavez C, Tarifeno A, Moreno J and Veloso F 2010Studies on scalability and scaling laws for the plasma focus:similarities and differences in devices from 1 MJ to 0.1 JPlasma Sources Sci. Technol. 19 055017
[6] Zakaullah M, Waheed A, Ahmad S, Zeb S and Hussain S S2003 Study of neutron emission in a low energy plasmafocus with beta-source-assisted breakdown Plasma SourcesSci. Technol. 12 443
[7] Ahmad S, Hussain S S, Sadiq M, Shafiq M, Waheed Aand Zakaullah M 2006 Enhanced and reproducible neutronemission from a plasma focus with pre-ionization inducedby depleted uranium (U238) Plasma Phys. Control. Fusion48 745
[8] Veloso F, Pavez C, Moreno J, Galaz V, Zambra M and Soto L2012 Correlations among neutron yield and dynamicaldischarge characteristics obtained from electrical signals ina 400 J plasma focus J. Fusion Energy 31 30
[9] Kies W 1986 Power limits for dynamical pinch discharges?Plasma Phys. Control. Fusion 28 1645
[10] Moreno J, Silva P and Soto L 2003 Optical observations of theplasma motion in a fast plasma focus operating at 50 JPlasma Sources Sci. Technol. 12 39
[11] Krompholz H, Neff W, Ruhl F, Schonbach K and Herziger G1980 Formation of the plasma layer in a plasma focusdevice Phys. Lett. A 77 246
[12] Gribkov V A, Bienkowska B, Borowiecki M, Dubrovsky A V,Ivanova-Stanik I, Karpinski L, Miklaszewski R A,Paduch M, Scholz M and Tomaszewski K 2007 Plasmadynamics in PF-1000 device under full-scale energystorage: part I. Pinch dynamics, shock-wave diffraction, andinertial electrode J. Phys. D: Appl. Phys. 40 1977
[13] Tou T Y 1995 Multislit streak camera investigation of plasmafocus in the steady-state rundown phase IEEE Trans.Plasma Sci. 23 870
[14] Tarifeno-Saldivia A, Pavez C, Moreno J and Soto L 2011Dynamics and density measurements in a small plasmafocus of tens-of-joules-emitting neutrons IEEE Trans.Plasma Sci. 39 756
[15] Zielinska E, Paduch M and Scholz M 2011 Sixteen-frameinterferometer for a study of a pinch dynamics in PF-1000device Contrib. Plasma Phys. 51 279
[16] Bruzzone H and Grondona D 1997 Magnetic probemeasurements of the initial phase in a plasma focus devicePlasma Phys. Control. Fusion 39 1315
[17] Aghamir F M and Behbahani R A 2011 Current sheathbehavior and its velocity enhancement in a low energyMather-type plasma focus device J. Appl. Phys. 109 043301
[18] Al-Hawat S 2004 Axial velocity measurements of currentsheath in a plasma focus device using a magnetic probeIEEE Trans. Plasma Sci. 32 764
[19] Knoblauch P, Raspa V, Di Lorenzo F, Lazarte A, Clausse Aand Moreno C 2010 Correcting magnetic probeperturbations on current density measurements of currentcarrying plasmas Rev. Sci. Instrum. 81 093504
[20] Bhuyan H, Mohanty S R, Neog N K, Bujarbarua Sand Rout R K 2003 Magnetic probe measurements ofcurrent sheet dynamics in a coaxial plasma acceleratorMeas. Sci. Technol. 14 1769
[21] Silva P, Soto L, Moreno J, Sylvester G, Zambra M,Altamirano L, Bruzzone H, Clausse A and Moreno C 2002A plasma focus driven by a capacitor bank of tens of joulesRev. Sci. Instrum. 73 2583
[22] Silva P, Moreno J, Soto L, Birstein L, Mayer R E and Kies W2003 Neutron emission from a fast plasma focus of 400joules Appl. Phys. Lett. 83 3269
[23] Milanese M, Moroso R and Pouzo J 2003 D-D neutron yield inthe 125 J dense plasma focus nanofocus Eur. Phys. J. D27 77
[24] Hassan S M et al 2006 Pinching evidences in a miniatureplasma focus with fast pseudospark switch Plasma SourcesSci. Technol. 15 614
[25] Rout R K, Mishra P, Rawool A M, Kulkarni L Vand Gupta S C 2008 Battery powered tabletop pulsedneutron source based on a sealed miniature plasma focusdevice J. Phys. D: Appl. Phys. 41 205211
[26] Verma R, Roshan M V, Malik F, Lee P, Lee S, Springham S V,Tan T L, Krishnan M and Rawat R S 2008 Compactsub-kilojoule range fast miniature plasma focus as portableneutron source Plasma Sources Sci. Technol. 17 045020
[27] Bilbao L, Bruzzone H and Grondona D 1994 Errors and limitsin the determination of plasma electron density bymeasuring the absolute values of the emitted continuumradiation intensity Meas. Sci. Technol. 5 165
[28] Serban A and Lee S 1995 A simple optical fiber axial speeddetector Rev. Sci. Instrum. 66 4958
[29] Mejia F C, Milanese M, Moroso R and Pouzo J Someexperimental research on anisotropic effects in the neutronemission of dense plasma-focus devices J. Phys. D: Appl.Phys. 30 1499
[30] Soto L, Pavez C, Castillo F, Veloso F, Moreno Jand Auluck S K H 2011 Dense plasma filaments in a
6

Meas. Sci. Technol. 23 (2012) 087002 Technical Design Note
subkilojoule plasma focus 14th Latin American Workshopon Plasma Physics (Mar del Plata, Argentina) J. Phys.Conf. Ser. in preparation
[31] Lee S and Serban A 1996 Dimensions and lifetime of a plasmafocus pinch IEEE Trans. Plasma Sci. 24 1101
[32] Bruzzone H and Vieytes R 1993 The initial phase in plasmafocus devices Plasma Phys. Control. Fusion 35 1745
[33] Bruzzone H, Acuna H and Clausse A 2007 The lift-off stage ofplasma focus discharges Plasma Phys. Control. Fusion49 105
7
Copyright © 2022 FDOKUMEN