
Relationship between the optic nerve sheath diameter (O
282
University of Cape Town Ultrasound as a non-invasive diagnostic tool in paediatric neurosurgery: Relationship between the optic nerve sheath diameter (ONSD) and intracranial pressure (ICP) Thesis presented for the Degree of DOCTOR OF PHILOSOPHY (Neurosurgery) UNIVERSITY OF CAPE TOWN August 2015 Candidate: Doctor Llewellyn Padayachy Supervisor: Professor Anthony Graham Fieggen Co-supervisor: Doctor Tormod Selbekk
-
Upload
khangminh22 -
Category
Documents
-
view
2 -
download
0
Transcript of Relationship between the optic nerve sheath diameter (O

Univers
ity of
Cap
e Tow
n
Ultrasound as a non-invasive diagnostic
tool in paediatric neurosurgery:
Relationship between the optic nerve
sheath diameter (ONSD) and intracranial
pressure (ICP)
Thesis presented for the Degree of DOCTOR OF PHILOSOPHY
(Neurosurgery) UNIVERSITY OF CAPE TOWN
August 2015
Candidate: Doctor Llewellyn Padayachy Supervisor: Professor Anthony Graham Fieggen
Co-supervisor: Doctor Tormod Selbekk

The copyright of this thesis vests in the author. No quotation from it or information derived from it is to be published without full acknowledgement of the source. The thesis is to be used for private study or non-commercial research purposes only.
Published by the University of Cape Town (UCT) in terms of the non-exclusive license granted to UCT by the author.
Univers
ity of
Cap
e Tow
n

II

III
Abstract Background: Assessment of intracranial pressure (ICP) is an essential aspect in the
management of most neurosurgical conditions in children. While invasive ICP monitoring
is considered the criterion standard, the need for a reliable, non-invasive, easy-to-use and
accurate method to detect and monitor raised ICP has inspired the development of many
useful techniques. The present study examined the relationship between transorbital
ultrasound measurement of the optic nerve sheath diameter (ONSD) and invasively
measured ICP in children, as well as the influence of relevant physiological and
demographic variables on this relationship.
Methodology: ONSD measurement was performed using a high frequency, small
footprint linear array probe, prior to invasive ICP measurement. All patients were under
general anaesthesia and being mechanically ventilated. Physiological variables including
systolic blood pressure (SBP), diastolic blood pressure (DBP), mean arterial pressure
(MAP), pulse rate, temperature, respiratory rate and end tidal carbon dioxide (ETCO2)
level were recorded at the time of ONSD measurement. The ONSD measurements were
analysed for repeatability, intra- and inter-observer variability as well for correlation
between images acquired in different planes and those obtained from either eye. The
diagnostic accuracy of ONSD measurement for detecting ICP at different thresholds of
20, 15, 10 and 5 mmHg was analysed. This analysis included evaluation of age-related
thresholds for defining different ONSD cut-off values in children. Dynamic image
acquistion was performed and analysed to evaluate the relevant pulsatile motion of the
ONS as a marker of the sheath stiffness.
Results: One hundred and seventy four children undergoing diagnostic or therapeutic
surgical procedures were included in this study. ONSD measurement demonstrated good
correlation with ICP across the entire patient cohort (r = 0.66, p < 0.001), but was better
in children > 1 year or with a closed anterior fontanelle (AF) (r = 0.7, p < 0.001). Age
above and below 1 year was found to be an appropriate age threshold for defining two
different sets of ONSD cut-off values. The study however, supported using patency of the
AF as a stronger clinical marker for describing different ONSD cut-off values in children.
The second part of this work described a dynamic technique for analysing the pulsatile

IV
motion of the ONS. Analysis of the deformability index (DI) as an indirect marker of ONS
stiffness, revealed a statistically significant relationship with ICP (sensitivity of 90%,
specificity of 87% for detecting ICP ≥ 20 mmHg).
Conclusion: Measurement of the ONSD is a sensitive surrogate marker of raised ICP, but
demonstrated poorer specificity. This relationship was more reliable in older children,
particularly when the AF was closed. Analysis of the dynamic characteristics of the ONS
appeared to provide useful additional information as an independent marker, and may
contribute to our overall understanding of ONSD measurement in raised ICP.

V
Acknowledgements
This work was inspired by the children we work with and the environment we work in,
and has only been possible because of them. There is no scarier prospect than handing
over the care of your child to someone else. I am eternally grateful for the privilege of
being involved in the care of these children, and hope that this work will one day grow to
make a small difference in the quality of care we offer. As is the nature of such work, it
was a product of interactions between many individuals, disciplines and departments. I
would like to acknowledge the important role each has played.
My supervisor Professor Graham Fieggen who agreed to oversee this project from the very conception stages. For providing a calibre of guidance, support and insight that has become synonymous with great leadership.
My co-supervisor Tormod Selbekk, who through countless Facetime chats listened to my ideas and helped to fashion them into a useful technique. Reidar Brekken who has spent hours analysing and re-analysing data to find ways of measuring parameters that were not previously thought of. I will always be thankful for your belief in a concept that was often difficult to quantify.
My colleagues and mentors at the Red Cross War Memorial Children’s Hospital (RCWMCH): Professor Jonathan Peter for providing me with sage advice and warm
wisdom. Professor Anthony Figaji for spreading what can only be called a contagious passion for research.
I would also like to thank Drs Nico Enslin, Mohammed Ben-Hussein, Ncedile Mankhala, Emma Wegoye, Tiago Morgado, Nqobile Thango, Daniel Ochieng and Ursula Rohlwink for each in their own way contributing a vital piece in this puzzle.
The radiology department at RCWMCH, Drs Tracy Kilborn, Nicole Wiesenthaler and Ebrahim Banderker for their compliance and flexibility in allowing me the use of ‘our shared’ ultrasound machine. I would specifically like to thank sonographers Helmien Grovè and Jane Dembe for fine tuning my technique in transorbital sonography, assisting me with ongoing technical expertise and necessary verification of the image quality.
Dr Gaelle Ramon and the team at the research office for their vital support and guidance during this often daunting process.
Dr. Felicia Padayachy, Dr. Vaishali Padayachy and Barbara Harris for tireless proofreading and editorial assistance

VI
Ushma Galal and Henri Carrara for their incredible support with the statistical analysis of the data.
The anaesthetic team, especially Dr. Rebecca Gray for valuable advice and insight.
Dr Travis Pollock for providing insight into the ocular findings related to raised ICP.
The team of students both local and international whose curiosity and willingness to help have made a significant difference in getting this project done.
The Harry Crossley Research Fellowship for the opportunity to travel abroad and expand my insight into a technique that, for neurosurgery is still quite new.

VII
Dedication
This work is dedicated entirely to my most precious girls, who have provided me with
inspiration, love, support, energy and comfort to embark on this journey, knowing full
well that it would take time from them, a thesis is a selfish undertaking, but fortunately
one that can be requited. For Vidya, Shreya, Vaishali and Inez, I am eternally indebted to
you and will always be thankful....
“Nothing that is worth doing can be achieved in our lifetime;
therefore we must be saved by hope.
Nothing which is true or beautiful or good makes complete sense in any immediate context of history;
therefore we must be saved by faith.
Nothing we do, however virtuous, can be accomplished alone;
therefore we must be saved by love.
No virtuous act is quite as virtuous from the standpoint of our friend or foe
as it is from our standpoint.
Therefore we must be saved by the final form of love which is forgiveness.”
....Reinhold Neibuhr

VIII
TABLE OF CONTENTS Page Abstract III Acknowledgements V
Dedication
VII
Table of Contents VIII Abbreviations used XII List of tables XVI List of figures XX Chapter 1 Introduction 1 SECTION A Chapter 2 The eye as a window to the brain 5
2.1. The optic nerve sheath: Anatomical concepts
7
2.2. Transorbital ultrasound 16
Chapter 3 Methods of assessing intracranial
pressure (ICP) 25
3.1. Introduction 25
3.2. Monitoring of ICP 26
3.3. Invasive ICP monitoring 27

IX
3.4. Limitations of invasive ICP monitoring 31
3.5. Non-invasive assessment of ICP 32
3.6. Discussion 50
Chapter 4 Measurement of ONSD as a non-invasive marker of ICP
51
4.1. Studies in children 53
4.2. Adult studies 68 SECTION B Chapter 5 The relationship between ONSD
measurement and invasively measured ICP in children: Methodology
98
5.1. Introduction 98
5.2. Aims of the study 99
5.3. Methods 100
Chapter 6 The relationship between ONSD
measurement and invasively measured ICP in children: Results, discussion and conclusion
107
6.1. General and demographic data,
repeatability, observer variability and correlation testing
108
6.2. Relationship between ONSD measurement
and ICP over the entire patient cohort 122

X
6.3. Relationship between ONSD measurement and ICP: using described age-related thresholds for defining ONSD cut-off values in children
130
6.3.1. Children under 1 year old 131
6.3.2. Children over 1 year old 136
6.3.3. Subcategory analysis of children over 1
year old 144
6.4. The relationship between ONSD measurement and ICP using patency of the anterior fontanelle to describe cut-off values in children
148
6.4.1. Patients with an open anterior fontanelle 149
6.4.2. Patients with a closed anterior fontanelle 154
6.5. Discussion 161
6.6. Conclusion 171
SECTION C Chapter 7 Dynamic assessment of the optic nerve
sheath 172
7.1. Theoretical background 172
7.2. Relationship between pulsatile dynamics of the optic nerve sheath and ICP: an exploratory in-vivo investigation
177

XI
7.2.1. Introduction 177
7.2.2. Methodology 178
7.2.3. Results 184
7.2.4. Discussion 190
7.2.5. Conclusion 194 SECTION D Chapter 8 Perspective and future direction 195 Appendices 198 Reference list 216

XII

XIII
Abbreviations used
ARDS adult respiratory distress syndrome
ACA anterior cerebral artery
AF anterior fontanelle
ALARA as low as reasonably achievable
AMS acute mountain sickness
ANOVA analysis of variance
AUC area under the curve
AUROC area under the receiver operating characteristic curve
AVEAx average of measurements in the axial plane
AVESag average of measurements in the sagittal plane
BMI body-mass-index
CA Cronbach’s alpha statistic
CBF cerebral blood flow
CBV cerebral blood volume
CCT cranial CT
CDI colour Doppler imaging
CNS central nervous system
CPC cerebral performance category
CRA central retinal artery
CRV central retinal vein
CSF cerebrospinal fluid
CT computerised tomography
DBP diastolic blood pressure
DI deformability index
DM diabetes mellitus
DPOAEs distortion product otoacoustic emissions
ED emergency department
EFSUMB European Federation of Societies for Ultrasound in Medicine and Biology
EICP elevated ICP
EP emergency physician

XIV
ETD eyeball transverse diameter
ETCO2 end tidal carbon dioxide
ETT endotracheal tube
ETV endoscopic third ventriculostomy
EVD external ventricular drain
FDA/CDRH Food and Drug Administration Center for Devices and Radiological Health
GCS Glasgow Coma Scale
GOS Glasgow Outcome Score
GWR grey matter-to-white matter ratio
ICA internal carotid artery
ICH intracerebral haemorrhage
ICP intracranial pressure
ICU intensive care unit
IIH idiopathic intracranial hypertension
IOP intraocular pressure
IPI intracranial pressure index
IQR interquartile ranges
IV Intravenous
LEAx left eye axial plane
LESag left eye sagittal plane
LLS Lake Louise Score
LP lumbar puncture
MABP mean arterial blood pressure
MAP mean arterial pressure
MRI magnetic resonance imaging
MS multiple sclerosis
NF Neurofibromatosis
NIRS near infrared spectroscopy
NPV negative predictive value
OA ophthalmic artery
OAE otoacoustic emission
OCT optical coherence tomography
XV
ON optic nerve
OND optic nerve diameter
ONS optic nerve sheath
ONSD optic nerve sheath diameter
ONUS optic nerve ultrasound
OR odds ratio
OSASW orbital subarachnoid space width
oVEMP ocular vestibular evoked myogenic potential
PCC Pearson’s correlation coefficient
PD Parkinson’s disease
PI pulsatility index
PPV positive predictive value
REAx right eye axial plane
RESag right eye sagittal plane
RI resistance index
ROC receiver operating characteristic
RTT Rotterdam teletransducer
rSO2 regional cerebral blood oxygen saturation
SAH Subarchnoid haemorrhage
SAS subarachnoid space
SBP systolic blood pressure
SD standard deviations
SLT scanning laser tomography
SPU septum pellucidum undulation
STROBE strengthening the reporting of observational studies in epidemiology
SVP spontaneous venous pulsations
TBI traumatic brain injury
TCD transcranial Doppler
TMD tympanic membrane displacement
TS tuberous sclerosis
VPS ventriculo-peritoneal shunt
VEP visual evoked potentials

XVI
vODM venous ophthalmodynamometry
VOP venous outflow pressure
VPS ventriculo-peritoneal shunt
yo year old

XVII
List of tables Page
Chapter 2
Table 2.1. Anatomical regions and indications for ocular ultrasound 20
Chapter 3
Table 3.1. Invasive ICP monitoring techniques 30
Table 3.2. Non-invasive ICP monitoring techniques: Transorbital methods 38
Table 3.3. Non-invasive ICP monitoring techniques: Methods utilising the auditory canal
40
Table 3.4. Non-invasive ICP monitoring techniques: Methods based on fluid dynamic properties
44
Table 3.5. Non-invasive ICP monitoring techniques: Electrophysiological techniques
46
Table 3.6. Non-invasive ICP monitoring techniques: Imaging techniques 49
Chapter 4
Table 4.1. Ultrasound-based paediatric studies supporting the use of ONSD measurement
57,58
Table 4.2. MRI-based paediatric studies supporting the use of ONSD measurement
62
Table 4.3. Paediatric studies not supporting the use of ONSD measurement
65
Table 4.4. Adult studies supporting the use of ONSD measurement (non-invasive ICP measurement)
72,73
Table 4.5. Adult studies supporting the use of ultrasound measurement of the ONSD (invasive ICP measurement)
79-81
Table 4.6. MRI-based adult studies supporting the use of ONSD measurement
86
Table 4.7. CT-based adult studies supporting the use of ONSD measurement
91

XVIII
Chapter 6
Table 6.1. Demographic details 109
Table 6.2. Haemodynamic and physiological parameters 110
Table 6.3. LESag values 111
Table 6.4. RESag values 113
Table 6.5. LEAx values 114
Table 6.6. REAx values 115
Table 6.7. Inter-observer variability 117
Table 6.8. AVESsag vs AVEAx ONSD measurements 119
Table 6.9. Right vs Left eye ONSD measurements 121
Table 6.10. Unadjusted and adjusted models for the relationship between ONSD and ICP
124
Table 6.11. Age, ICP and ONSD for specific aetiological groups 125
Table 6.12. Diagnostic accuracyof ONSD for predicting ICP ≥ 20 mmHg in different aetiological groups
125
Table 6.13. Age, ICP and ONSD for ICP dichotomized at 15 mmHg 126
Table 6.14. Age, ICP and ONSD for ICP dichotomised at 10 mmHg 127
Table 6.15. Age, ICP and ONSD for ICP dichotomized at 5 mmHg 128
Table 6.16. Summary of ONSD cut-off values at different ICP thresholds for all patients
129
Table 6.17. Age, ICP and ONSD for ICP dichotomised at 20 mmHg in children ≤ 1 year old
131
Table 6.18. Age, ICP and ONSD for ICP dichotomised at 15 mmHg in children ≤ 1 year old
133
Table 6.19. Age, ICP and ONSD values for ICP dichotomised at 10 mmHg in children ≤ 1 year old
134
Table 6.20. ONSD cut-off values for predicting ICP readings of 20, 15, 10 and 5 mmHg in children ≤ 1 year old
135

XIX
Table 6.21. Age, ICP and ONSD values for ICP dichotomised at 20 mmHg in children > 1 year old
137
Table 6.22. Age, ICP and ONSD values for ICP dichotomised at 15 mmHg in children > 1 year old
139
Table 6.23. Age, ICP and ONSD values for ICP dichotomised at 10 mmHg in children > 1 year old
140
Table 6.24. Age, ICP and ONSD values for ICP dichotomised at 5 mmHg in children > 1 year old
141
Table 6.25. ONSD cut-off values for detecting ICP at thresholds of 20, 15, 10 and 5 mmHg
142
Table 6.26. ONSD cut-off values for detecting ICP ≥ 20 mmHg in children ≤ 1 year and > 1 year old
142
Table 6.27. ONSD cut-off values for detecting ICP at various thresholds using age at 1 year as a dichotomy point
143
Table 6.28. Summary of patient data at different ICP thresholds 144
Table 6.29. Diagnostic accuracy of ONSD in age category > 1 and ≤ 4 years old
145
Table 6.30. Summary of patient data at different ICP thresholds 146
Table 6.31. ONSD cut-off values for various ICP thresholds in patients aged > 4 years
146
Table 6.32. ONSD cut-off values for different ICP thresholds within the various age categories
147
Table 6.33. Age, ICP and ONSD for ICP dichotomised at 20 mmHg in children with an open AF
150
Table 6.34. Age, ICP and ONSD values for ICP dichotomised at 15 mmHg in children with an open AF
152
Table 6.35. Age, ICP and ONSD values for ICP dichotomized at 10 mmHg in children with an open AF
152
Table 6.36. Diagnostic accuracy of ONSD cut-off values for ICP at thresholds of 20, 15, 10 and 5mmHg in children with an open AF
153
Table 6.37. Age, ICP and ONSD values for ICP dichotomsied at 20 mmHg in children with an closed AF
155
Table 6.38. Age, ICP and ONSD values for ICP dichotomisd at 15 mmHg in children with a closed AF
157

XX
Table 6.39. Age, ICP and ONSD values for ICP dichotomized at 10 mmHg in children with a closed AF
158
Table 6.40. Age, ICP and ONSD for ICP dichotomised at 5 mmHg in children a closed AF
159
Table 6.41. Diagnostic accuracy of ONSD measurement for detecting ICP at various thresholds in children with a closed AF
160
Table 6.42. ONSD cut-off values for different ICP thresholds in patients with an open and closed AF
160
Table 6.43. ONSD cut-off values in children > 1 year old and children with a closed AF
169
Chapter 7
Table 7.1. Patient data 184
Table 7.2. Results from analysis of all included datasets 186
Table 7.3. Results from analysis where datasets with out-of-plane motion (grade 2) were excluded
188

XXI
List of Figures
Chapter 2
Figure 2.1. Axial ultrasound image of the eye. 17
Figure 2.2. Ultrasound image showing the ONS. 18
Figure 2.3. Generously applied coupling gel over transparent protective dressing
22
Figure 2.4. Axial imaging 23
Figure 2.5. Sagittal imaging 23
Chapter 4
Figure 4.1. Axial ultrasound image of ONS 56
Figure 4.2. Ultrasound image with ONSD measurement 56
Figure 4.3. Axial T2-weighted MRI showing ONSD measurement 61
Figure 4.4. Axial CT scan demonstrating the
ONS
90
Chapter 6
Figure 6.1. Box-whisker plot of the mean values of each LESag reading 112
Figure 6.2. Box-whisker plot of the mean values of each RESag reading 113
Figure 6.3. Box-whisker plot of the mean values of each LEax reading 114
Figure 6.4 Box-whisker plot of the mean values of each REax reading 115
Figure 6.5. Scatterplot for intra-observer reliability 116
Figure 6.6. Box-whisker plot: measurement 1 (R1) and measurement 2 (R2) (measurement 1 vs measurement 2)
116
Figure 6.7. Box-whisker: observer 1 and observer 2 117
Figure 6.8. Bland-Altman plots. Outer solid lines represent limits of agreement (mean ± 1.96 times standard deviation, central line depicts the mean of differences).
118

XXII
Figure 6.9. Scatter plot: Observer 1 vs Observer 2 118
Figure 6.10. Box-whisker plot AVESag and AVEAx 119
Figure 6.11. Scatter plot of AVESag vs AVEAx 119
Figure 6.12. Scatterplot mean sagittal ONSD vs ICP 120
Figure 6.13. Scatterplot mean axial ONSD vs ICP 120
Figure 6.14. Scatter plot of right eye vs left eye 121
Figure 6.15. Scatterplot of mean ONSD against ICP for entire patient cohort
122
Figure 6.16. Box-whisker graph of ONSD for ICP < 20 mmHg (0), and ≥ 20 mmHg (1)
123
Figure 6.17. AUROC for ONSD of 0.55 cm to predict ICP ≥ 20 mmHg 123
Figure 6.18. Scatterplot of ONSD vs ICP for children ≤ 1 year old 132
Figure 6.19. Box and whisker plot of ONSD for ICP < 20 mmHg (0) and
ICP ≥ 20 mmHg (1) in children ≤ year old
132
Figure 6.20. AUROC for ONSD to detect ICP ≥ 20 mmHg in children ≤ 1
year old
133
Figure 6.21. Scatterplot of ONSD vs ICP in children > 1 year 136
Figure 6.22. Box and whisker plot of ONSD for ICP < 20 mmHg (0) and
ICP ≥ 20 mmHg (1) in children > 1 year old
138
Figure 6.23. AUROC for ONSD to detect ICP ≥ 20 mmHg in children > 1
year old
138
Figure 6.24. Scatterplot for ONSD vs ICP in patients with an open AF 149
Figure 6.25. Box-whisker plot of ONSD for ICP < 20 (0), and ≥ 20 mmHg
(1)
150
Figure 6.26. AUROC of ONSD for detecting ICP ≥ 20 mmHg 151
Figure 6.27. Scatterplot for ONSD vs ICP in patients with a closed AF 154
XXIII
Figure 6.28. Box-whisker plot of ONSD for ICP < 20 (0), and ≥ 20 mmHg
(1)
155
Figure 6.29. AUROC of ONSD for detecting ICP ≥ 20 mmHg 156
Chapter 7
Figure 7.1. Formula for defining the deformability index (∆) 178
Figure 7.2. Axial ultrasound image with different magnification. Gray-scale pattern, tracked from time frame to time frame.
180
Figure 7.3. Transorbital ultrasound images magnified, demonstrating dLeft dRight
181
Figure 7.4. Illustration of the image processing in patient with ICP < 20 mmHg and ICP ≥ 20 mmHg
182
Figure 7.5. Curves superimposed 182
Figure 7.6. Box and whisker plot: DI in ICP < 20 mmHg (high ICP) and ≥ 20 mmHg (normal ICP)
189
Figure 7.7. Receiver operator curve for a cut-off value of ∆ = 0.121 189
Figure 7.8. Illustrating the effect of out-of-plane motion 193

1
Chapter1.
Introduction
Diagnosing neurological disease in children is a formidable challenge for modern medical
practitioners, given the spectrum of conditions and the wide array of clinical presentation.
The presenting features of most paediatric neurosurgical conditions are often due to an
increase in ICP, a condition where early diagnosis is critically important.
The current standard of care for diagnosing raised ICP involves intracranial placement of
an invasive monitoring device. This technique has the distinct benefit of providing
continuous, real-time monitoring, but is generally limited to patients in a neurocritical care
or high care unit.1,2 Disadvantages of invasive ICP monitoring include the risk of
haemorrhage, infection and catheter misplacement.3,4 The ideal ICP monitor would
therefore be non-invasive, portable, easy to use, cost effective and allow for continuous
monitoring.
There has been a longstanding quest for a reliable, non-invasive technique to assess ICP.
In children specifically, decreasing the radiation exposure from repeat computerised
tomography (CT) scans, the potential to avoid unnecessary invasive diagnostic surgical
procedures and the possibility of improving early detection have been the key elements
supporting this avenue of research. The opportunity to make the diagnosis of raised ICP
earlier using an appropriate non-invasive technique, makes the applicability of such a
method broader than just neurocritical care patients. Despite several promising advances,
no single non-invasive method of assessing ICP has been accurate enough as a quantitative
measure of ICP to replace invasive monitoring.4
The use of ultrasound as a diagnostic and navigation modality in neurosurgery has
historically been limited by poor image quality and bulky probes.5 Despite the fact that
one of the earliest descriptions of ultrasound as a diagnostic tool in medicine involved the
attempted diagnosis of a brain tumor,6,7 this modality has enjoyed limited use in
neurosurgery. However, recent advances in image quality and development of novel
techniques have stimulated a resurgence in the use of this modality within neurosurgery,

2
both as a diagnostic and intra-operative navigation tool.7,8,9 The obvious benefit of being
radiation-free, portable, widely available and relatively cost effective, makes this modality
very appealing,10,11 especially in a resource-limited environment.
The diagnostic application of ultrasound in neurosurgery has also been limited by the poor
acoustic properties of the bony skull.7 In children, use of the AF as a sonographic window
has been widely described.12,13 The accessible, natural bony windows in the human skull,
i.e. orbit, auditory canal and AF (neonates), can potentially allow access to important
information about the brain and ICP. In particular, the eye has served as a natural window
to the brain, allowing insight into a variety of neurological and other systemic
conditions.14,15 Transorbital ultrasound measurement of the ONSD as a surrogate marker
of raised ICP has enjoyed increasing interest recently.16-27 The direct cerebrospinal fluid
(CSF) connection between the peri-optic and intracranial subarachnoid spaces, make this
technique a particularly appealing option for assessing ICP.28 This appeal is further
enhanced by the favourable acoustic properties and superficial anatomical location of the
eye, making it very suitable for transorbital sonographic assessment of the ONS.
1.1) Scope of the thesis
This study investigates the relationship between measurement of the ONSD using a high
frequency, small footprint, transorbital ultrasound probe and invasively measured ICP, in
a paediatric patient cohort. The goal of validating and defining optimal ONSD cut-off
values for detecting raised ICP in children is best approached by comparing this technique
to the current ‘gold standard’, which is invasive ICP measurement. In children, this
requires evaluating age-related recommendations for defining ONSD cut-off values. The
described age thresholds range between 1 year and 4 years old (28-34). This study has
therefore used the following age categories for this evaluation, i) ≤ 1 year old, ii) ≥ 1 year
old, iii) subcategory analysis of ages 1 to ≤ 4 years and > 4 years old, to for comparison
with current literature.28-34 The diagnostic accuracy of ONSD measurement was
investigated within these age categories, to describe the nature of the ONS response at
ICP thresholds of 20 mmHg, 15 mmHg, 10 mmHg and 5 mmHg. An alternative

3
physiological and anatomical marker, viz patency of the AF, was also assessed as a
potential clinical marker for defining different ONSD cut-off values in children.
Physiological and demographic factors which may influence this relationship have been
analysed for significance.
The elastic nature of the ONS has been described as a significant factor in the ability of
the ONS to distend when subjected to increasing ICP. Using a dynamic imaging
technique, the final part of this work describes an analysis of the pulsatile motion of the
ONS as a potential marker of its stiffness.
1.2) Outline of the thesis
SECTION A
This section provided an overview of the relevant anatomical and sonographic features of
the eye that allow transorbital sonographic ONSD measurement. The current
measurement techniques for ICP, their underlying principles, benefits and shortcomings
and a specific review of the literature describing ONSD measurement in children and
adults, are included here.
SECTION B
This section described the working hypothesis, aims and methodology. The results are
presented in age-related categories and also use of the AF as a clinical marker for
describing different ONSD cut-off values at various ICP thresholds, followed by a
discussion of the results.
SECTION C

4
This section discussed the available literature using ‘dynamic’ assessment of the ONSD,
and its association with ICP. Novel data is presented using a technique that analyses the
dynamic pulsatile motion of the ONS to describe an index termed the deformability index
(DI). These data were analysed in two groups of patients with ICP above and below 20
mmHg.
SECTION D
This section provided an overview of the study findings, placing them in perspective of
current literature and described future directions for the development of this work.

5
SECTION A
Chapter 2.
The eye as a window to the brain
The eye as a window to the soul is an ancient philosophical concept that can be dated all
the way back to the biblical era. In particular the size of the pupil has been linked to levels
of excitement and arousal.35,36 This realization was perhaps best illustrated by Italian
women in medieval times who used drops from the dangerous night shade plant (later
called ‘belladonna’) to artificially dilate their pupils in an effort to make themselves
appear more attractive. This proved to be quite a dangerous practice, and was later
abandoned, but certainly highlighted their recognition of the eye not only as an organ
facilitating vision, but also as a window into our hidden thoughts and emotions.
These underlying principles were advanced upon in 1964 by the famous psychologist
Eckhardt Hess. In his seminal work, Hess provided evidence that the eye is a valuable tool
in evaluating mental processes.37 This work was built on by others who demonstrated
convincingly that the pupillary response of the eye is linked to cognitive function, a field
of study eventually called ‘cognitive pupillometry”.38-43
The abstract value of the eye as a window into the soul and mind is of great interest, but
as physicians our focus tends to be more on the physical benefit of this natural window to
the brain. The ocular manifestation of systemic diseases including diabetes mellitus (DM),
hypertension, cardiac disease and neurofibromatosis (NF) have been well described.14,44
Examination of the eye specifically as a non-invasive method for detecting underlying
disease of the central nervous system (CNS) remains a very attractive option for
neurodegenerative diseases like multiple sclerosis (MS), Parkinson disease (PD) and
stroke.15
The description of oedema of the optic disc as a consequence of increased ICP was first
made by von Graefe in 1860.45,46 By inflating balloons placed in the subdural space of

6
rhesus monkeys to increase ICP, Hayreh described an increase of CSF in the ONS as being
‘essential for the development of oedema of the optic disc’.46 Subsequent work has
indicated that enlargement of the ONS in conditions of raised ICP may actually precede
oedema of the optic disc.296 Several authors have since described a strong association
between enlargement of the ONS and an increase in ICP.17,28,47-51
This work describes the relationship between transorbital sonographic measurement of the
ONSD and invasively measured ICP. A discussion of the relevant anatomic details is
necessary as the structure of the ONS is fundamental to its ability to distend as ICP
increases and its relation to the bony optic canal is very important in determining the CSF
flow within the ONS.46,52,53 The relevant vascular anatomy described has significant
impact in SECTION C of this work which involves analysis of the dynamic pulsatile
motion of the ONS, a direct consequence of the anatomical relationship between the ONS
and the arteries in proximity to it. The sonographic features of the ONS, the measurement
technique and safety standards are also discussed below.

7
2.1. The optic nerve sheath (ONS): Anatomical concepts
The ONS complex is composed of:
2.1.1 the optic nerve (ON) 2.1.2 the subarachnoid space between the optic nerve and sheath 2.1.3 the optic nerve sheath (ONS) 2.1.4 blood vessels within the optic nerve sheath complex.
2.1.1. The optic nerve (ON)
The optic nerve has a length of about 40 – 50 mm, and an average diameter of about 4
mm. This nerve is a white matter tract of the central nervous system that originates from
within the diencephalon. It grows anteriorly and laterally extending through the optic
canal and into the orbit. The optic nerve itself is surrounded by CSF within the
subarachnoid space and enveloped by the ONS, which is a continuation of the intracranial
dura mater. Anatomically the ON can be divided into 4 parts: an intra-ocular segment, an
intraorbital segment, an intracanalicular segment and an intracranial segment.
2.1.1.1 The intraocular segment (optic nerve head) of the optic nerve measures about 1
mm in length and is 1.5 – 1.8 mm in diameter. It is composed of the lamina cribrosa,
prelaminar region and surface nerve layer, and is the shortest segment of the ON. The
mode of insertion of the ON into the eyeball and the shape of the sclera canal determine
the shape of the optic disc.54 This shape is important for interpreting ophthalmoscopic
findings.
2.1.1.2. The intraorbital segment extends from the eyeball to the optic canal. It is
surrounded by the meningeal sheath consisting of dura, arachnoid and pia mater, and CSF
within the subarachnoid space. It is 20 – 30 mm in length and has about 6 mm of slack to
accommodate orbital movements.46 The central retinal artery perforates the optic nerve

8
with its accompanying vein and runs within the optic nerve to the retina. This part of the
optic nerve has longitudinal and transverse connective tissue septae, which contain blood
vessels. The pia mater has a dense vascular plexus on the surface of the orbital optic nerve.
The ophthalmic artery lies in close proximity to the optic nerve, initially inferolateral, then
usually crosses over the nerve to lie supero-medial to the ON. As the nerve enters the optic
canal, the surrounding dural sheath becomes continuous with the dural lining of the orbit
and optic canal.The orbital segment of the optic nerve is subdivided into a bulbar segment
that is adjacent to the globe and a mid-orbital segment, connecting the bulbar to the
intracanalicular component.54
2.1.1.3. The intracanalicular segment lies in the bony optic canal, surrounded by the
meningeal sheath. The ophthalmic artery lies below and lateral to the ON.
2.1.1.4. The intracranial segment is about 10 mm in length and culminates in the optic
chiasm. The ON lies above the diaphragma sellae initially, then above the cavernous sinus,
and is in close relation to the ophthalmic artery inferolaterally, ICA laterally and ACA
superiorly.
2.1.2. The subarachnoid space between the optic nerve (ON) and optic nerve sheath (ONS)
The ONS itself has a thickness of 0.4 mm, with the subarachnoid compartment estimated
at 0.1 – 0.2 mm in width.49 The subarachnoid space surrounding the optic nerve is a
heterogeneous, blind-ending (cul de sac) space, which holds about 0.1 ml of CSF.52,53
In the bulbar segment, the enlarged subarachnoid space contains a trabeculated network
anchored between the pial and arachnoid layers. These trabeculae are composed of
leptomeningeal cells and delicate collagenous fibrils; occasionally they contain one or two
blood vessels. In the mid-orbital segment the subarachnoid space is distinctly smaller,
containing numerous broad septae and pillars connected through large perforations. These
septae and pillars contain leptomeningeal cells and numerous collagen fibrils.

9
In the intracanalicular segment the subarachnoid space is largely continuous, with one or
two larger pillars.49,53 The hydrodynamics of CSF within the subarachnoid space
surrounding the optic nerve is therefore quite complex. The series of compartments and
septae, as well as the ‘cul de sac’ anatomy of the ONS impact not only on the dynamics
of the flow but also on the direction of CSF flow which may not follow the same principles
as fluid travelling within an ideal tube.53
Direct communication between the perioptic subarachnoid space and the chiasmal cistern
has been demonstrated.46,55 CSF pressure could build up in this perioptic subarachnoid
space if CSF were forced unidirectionally into this compartment via the chiasmal cistern
due to an increase in ICP.
These findings are especially relevant in this study as they explain to some degree the
microstructure determining the expansile nature of the ONS. The description of a
subarachnoid space that is widest at the bulbar segment and narrows progressively in the
mid-orbital and intracanalicular segment of the ON, provides useful information on where
it would be best to measure the diameter of the ONS.50,53
2.1.3. The optic nerve sheath (ONS)
The sheath surrounding the optic nerve is made up of three layers, which are in continuity
with the leptomeninges of the brain. In the optic canal the ON is attached to the
surrounding dura by thick fibrous bands. At the apex of the orbit the ONS is attached to
the annular tendon, to which the various recti muscles are attached. The two layers of the
dura are attached within the optic canal, but split at the orbital end of the canal, with the
outer layer forming the orbital periosteum and the inner layer forming the dural ONS.
The anatomy of the ONS in the optic canal is especially important as it functions
effectively as the ‘access portal’ for CSF entering the ONS from the intracranial
subarachnoid space SAS. The thick fibrous bands connecting the dura and pia in the optic
canal hold the ON firmly in position, but also maintain the dura and optic nerve in close

10
proximity. The subarachnoid space is consequently reduced in size to virtually the size of
a capillary.54
According to Hayreh, the assumption that the bulbous appearance of the ONS was due to
distension caused by an increase in ICP, was a contentious one. He initially suggested that
the firm, non-elastic collagen fibers of the dural ONS were less capable of being stretched
by an increase in CSF volume. This observation was based on experimental evidence from
monkeys showing that the ONS was normally a distended space filled with CSF.46
The anatomy of the sheath in the region of the optic canal plays a crucial role in the
dynamics of CSF between the orbital ONS and the intracranial space. Communication
between these two spaces is almost always present,54,56 but the percolation of CSF through
this space determines the temporal response of ONS distension to an increase in ICP.
The dural sheath accompanies the ON from the optic canal to the sclera. The collagen
fiber architecture of the ONS provides distinctive mechanical properties, as a 1 mm
diameter collagen fiber is estimated to have a resistance of 10 kg.57 The ONS can be
divided into the intracranial, intracanalicular and intraorbital segments.
2.1.3.1. Intracranial segment
This is a very short segment formed by invagination of the cranial dura mater at the
sphenoid planum at the level of the optic canal. This dural invagination forms the
falciform ligament which is a few millimetres in length and does not adhere completely
to the bone.
2.1.3.2. Intracanalicular segment
The relationship between the ONS and the bony and meningeal structures in the optic
canal is important in understanding the movement of CSF between the intracranial and
intra-orbital compartments.

11
Bony structures The optic canal guides the course of the ONS ventrally and laterally. The
anterior clinoid process forms the lateral border of the optic canal, and is attached to the
body of the sphenoid by two bony bridges, which form the roof and the floor of the optic
canal.58
Meningeal structures The dura mater covering the ventral surface of the clinoid process
forms a ‘carotid-oculomotor membrane’ which is in contact with the ONS as the
ophthalmic artery arises from the ICA.
2.1.3.3. Intraorbital segment
The important relations with this segment of the ONS are vascular and nervous elements.
At the exit of the optic canal the ONS is a dense structure, giving rise to the annular tendon.
The ONS runs within the orbital cone, together with the abducens nerve, nasociliary nerve,
superior and inferior branch of the oculomotor nerve and the ophthalmic artery. The tissue
surrounding the ONS is essentially adipose tissue. Five important structures cross the
intraorbital segment of the optic nerve dorsally; these are the trochlear nerve, the frontal
nerve, nasociliary nerve, the ophthalmic artery and the superior ophthalmic vein.
2.1.4. Blood vessels within the optic nerve sheath( ONS) complex
The arterial network within the ONS is quite intricate, but a working understanding of the
anatomical relationship between the ON, the arterial network and the ONS is fundamental
to interpreting the pulsatile dynamic response of the ONS described in SECTION C of
this work. The following anatomical description is not intended to be exhaustive, but
includes the relevant arterial anatomy within the ONS.
2.1.4.1. Arteries within the ONS

12
The ophthalmic artery (OA) is the first major branch of the intracranial segment of the
ICA. It provides the principal arterial supply to the contents of the orbit. The OA arises
from the medial border of the ICA, usually between the distal and proximal carotid ring.
The origin of the OA determines whether it enters the orbit through the superior orbital
fissure or the optic canal. The OA accompanies the optic nerve inferomedially in its
sheath.58,59 Beyond the optic canal, it travels obliquely through the ONS to join the orbital
apex, lateral to the ON. It gives off a recurrent branch in the optic canal which contributes
to the vascular supply of the ON in the canal. The OA crosses the ONS dorsally, to lie
between the medial rectus and superior oblique muscles before giving rise to the anterior
and posterior ethmoidal arteries. It also gives rise to the lacrimal, ciliary, supraorbital,
medial palpebral, infratrochlear and dorsal nasal arteries.
Perhaps the most significant branch of the OA, even though it is the smallest, is the central
retinal artery, which enters the inferior surface of the ON at the junction between the
anterior third and median third, about 20 mm from the optic canal following a short,
serpiginous trajectory. It passes to the center of the optic nerve travelling up to the globe
to supply the retina.
The intraorbital segment of the optic nerve derives its blood supply from the rich
anastomotic network within the pia mater, supplied by the ciliary artery. The optic head
is supplied by branches of the ophthalmic artery; multiple anastomoses between the 11
branches of the ophthalmic artery and the external carotid artery allow sufficient blood
flow to the choroidal and central retinal arteries.
Within the orbit the OA supplies five major branches and the pial network:
The central retinal artery
The first branch of the ophthalmic artery enters the optic nerve 8 -15 mm behind the globe
and arborises in the retina. This end artery supplies the inner two-thirds of the retina and
surface nerve layer of the optic nerve (these branches are seen on fundoscopy). It provides
little to no vascular supply to the prelaminar, laminar and retrolaminar layers. The central
retinal artery may rarely originate from the middle meningeal artery.60

13
The posterior ciliary arteries
The short ciliary branches arise from the ophthalmic artery as it crosses over the optic
nerve. The OA divides into 10 – 20 branches as it moves around the optic nerve anteriorly,
intertwining with branches of the short ciliary nerves. There are 6 – 8 short branches and
2 longer ones which extend anteriorly to the ciliary bodies and supply the choroid.
The lacrimal artery
This branch extends laterally and anteriorly along the superior surface of the lateral rectus
muscle and supplies the lacrimal glands, globe and muscle.
Terminal branches
The terminal branches of the ophthalmic artery are the supratrochlear and supraorbital
arteries, which lie superior and medial to the globe.
The circle of Zinn-Haller
This is a rich vascular network, receiving branches from the short posterior ciliary arteries,
including the recurrent pial branches and recurrent choroidal arteries.
The pial network
This network is made up of small meningeal branches that come off the central retinal
artery as it pierces the pia mater to form an extensive network of vessels.
2.1.4.2. Arterial supply of the optic disc

14
Lamina cribrosa
Blood supply to this area is mainly from fine centripetal branches originating from the
posterior ciliary arteries. Interestingly, the central retinal artery does not supply this
region. The vessels lie in the fibrous septae of the lamina cribrosa and form a dense
capillary network.54,61
Prelaminar region
This area is supplied mostly by centripetal branches from the peripapillary choroidal
vessels, which are mostly end vessels and have little communication with other vessels.
This region may also receive some supply from the vessels in the lamina cribrosa region.
The central retinal artery does not usually contribute blood supply to this region.61
Surface of the optic disc
This surface contains the main retinal vessels and a large number of capillaries, which are
derived from branches of the retinal arterioles. In this part of the optic disc it is common
to find vessels of choroidal origin derived from the prelaminar part of the optic disc which
lies adjacent to it. These may enlarge to form the cilioretinal artery. The capillaries on the
disc are all interconnected, mostly venous, draining into the central retinal vein or its
tributaries. The arterial supply to all the retinal capillaries, except for the cilioretinal artery,
comes from the central retinal artery. The blood supply pattern to the optic head is highly
variable.61
2.1.4.3. Veins
Venous drainage of the optic nerve head is simpler than its arterial supply. The main
venous drainage of the optic disc is carried out by the central retinal vein. The superior
ophthalmic vein exits the orbit via the superior orbital fissure and drains into the cavernous
sinus. The inferior ophthalmic vein drains into the pterygoid venous plexus via the inferior
orbital fissure. There are numerous connections between these veins, which usually

15
accompany the arteries. The central retinal vein is susceptible to increased ICP transmitted
through the CSF as it passes through the subarachnoid space.
There are no described lymphatic vessels or lymphoid tissue within the ONS.61

16
2.2. Transorbital ultrasound
2.2.1. Background
The first reported use of A-scan ultrasonography to examine the eye was performed by
Mundt and Hughes in 1956.63 The lack of anatomical detail and considerable operator
experience required for A-mode ultrasound use limited the widespread use of the
technique. The use of B-mode ultrasonography in ophthalmology was first described by
Baum and Greenwood in 1958, using a water bath immersion technique.64 This technique
was later improved on by Bronson in 1972, who developed a contact method for using
ultrasound which made the examination easier to perform on patients, and later became
commercially available.65 With further advances in the imaging quality of ultrasound
technology, the indications for imaging the eye, orbit, optic nerve and its sheath began
expanding.
Ossoinig initiated the ‘standardised echography’ concept, using A-mode scans, in clinical
settings.66 This early work describing imaging of the ONS was later followed by several
important contributions supporting the technique of ONSD measurement using
ultrasound.49,67,68 The early description of distension of the ONS as a consequence of an
increase in CSF volume in the perioptic subarachnoid space due to raised ICP was made
by Hayreh,46,69 stimulating later work on this topic.28,30,68
Transorbital ultrasonography remains the quickest and simplest method of imaging the
eye and the ONS. The additional benefits of real-time imaging and high spatial resolution
make ultrasound the preferred imaging modality. The unique anatomy of the eye makes it
ideal for ultrasound imaging for the following reasons70 :
It is a fluid-filled, superficial and easily accessible organ.
The acoustically empty anterior chamber (defined by the structures anterior to the lens, extends from the cornea to the iris and contains the aqueous humour) and vitreous cavity make the outline of the normal structures of the eye clearly visible.
Moving the transducer over the eye allows the ultrasound beam to reach all parts of the eye with the required close-to-perpendicular inclination.

17
There is limited demand for depth penetration, requiring only 30 mm depth for the
eye itself and 60 -70 mm for the orbital apex; this allows higher frequency probes than is feasible in other anatomical settings.
The associated shorter wavelength allows better resolution, with the possibility of finer anatomical detail and tissue differentiation.
Figure 2.1. Axial ultrasound image of the eye.
Anterior chamber
Posterior chamber
Lens
Retina

18
Figure 2.2. Ultrasound image showing the ONS.
2.2.2. Sonographic anatomy of the eye (Figures 2.1 and 2.2) :
CSF in perioptic
subarachnoid space
Optic nerve sheath
Optic nerve

19
The cornea appears as an isoechoic layer, just below the soft tissue of the eyelids
The anterior chamber is anechoic
The posterior chamber (extends posteriorly from the iris to the posterior surface of the lens, also contains aqueous humour) is also anechoic
The posterior chamber includes the ciliary body, which in cross section is seen as isoechoic triangles lateral to the lens
The iris appears as linear echogenicities anterior and lateral to the lens
The lens is mostly anechoic, except for a thin echogenic anterior and posterior rim
The vitreous chamber which is the largest of the three chambers, contains vitreous humour and extends from the posterior surface of the lens to the ocular wall
The retina, choroid and sclera (which form the walls of the vitreous chamber) are depicted as a single isoechoic layer
The optic disk appears as a slight discoid protrusion in the vitreous
The optic nerve is depicted as a hypoechoic band, posterior to the optic disk, surrounded by the echogenic retrobulbar fat
Generally the anterior two thirds of the course of the ON can be seen sonographically
The ONS surrounding the nerve is more echogenic
2.2.3. Indications for transorbital sonography

20
According to Brunell71 there are two clinical categories for the use of ophthalmic
ultrasound, i) clinical diagnosis by ophthalmologists, and ii) in emergency departments
for diagnosing ocular trauma and raised ICP. The use of ocular sonography has also been
described by intensive care physicians as well as neurosurgeons for the non-invasive and
early detection of raised ICP.16-18,30,72,73 The broader indications for ocular sonography are
listed in Table 2.1. The specification of the ultrasound probes required for purely
ophthalmological use are different to those used for measuring the ONSD.71
Anatomical region Indication
Front of the eye Foreign bodies
Lens dislocation or subluxation
Afferent pupillary defects
Changes in the size of the anterior chamber
Neoplastic lesions
Optic nerve Increased ICP (measurement of the ONSD)
Neoplastic lesions of the optic nerve and sheath
Vitreous Retinal haemorrhage
Retinal detachment
Vitreous haemorrhage
Vitreous detachment
Lens dislocation
Endophthalmitis
Extraocular Retrobulbar haemorrhage
Globe disruption
Foreign bodies
Artery/vascular Central retinal artery occlusion
Central retinal vein occlusion
Table 2.1. Anatomical regions and indications for transorbital ultrasound
2.2.4. Sonographic technique for imaging of the optic nerve sheath

21
2.2.4.1. Equipment
The ideal transducer is a linear array, high frequency (> 10 Mhz) probe, with a small
footprint to allow adequate imaging of the orbit and its contents, especially in children.
The size and shape of the orbit in smaller children is often a limiting factor to optimal
image quality.74 Although higher frequency transducers are available, in the range of 20
Mhz, their field of view is too limited to evaluate the entire globe. For the purpose of
imaging the ONS, a small footprint, high frequency (> 10 Mhz) probe is recommended.
2.2.4.2. Patient positioning
Patients are usually positioned supine, with the head slightly elevated at about 30 degrees.
This may vary however, depending on clinical history and age. It is preferable to place the
ultrasound machine on the patient’s right side and orient the probe so that the indicator is
pointing towards the patient’s head or toward the patient’s right side.
2.2.4.3. Technique
A generous amount of coupling gel is applied over the closed upper eyelid (Figure 2.3).
The transducer then can float over the layer of gel and won’t come into direct contact with
the patient’s eyelid. The coupling gel optimises image quality and precludes any pressure
being applied to the globe.75 A protective transparent dressing can be placed over the
closed eyelid in sedated or ventilated patients as an additional measure to prevent any
irritation of the conjunctiva. The probe should be held with a pincer grasp between the
thumb and index finger, using the remaining fingers for stability by resting them on the
maxilla, supraorbital ridge or other bony structures (Figure 2.4). This technique is
especially important to prevent any pressure being applied on the globe. The probe is
usually placed over the temporal area of the upper eyelid for optimal visualisation of the
ONS.76

22
The depth should be adjusted to optimise the visualisation of the intended structures, i.e.
the optic nerve, the surrounding CSF space and the ONS.
The gain should be adjusted to create a hypoechoic posterior chamber. If the gain is too
high, echoic artefacts could lead to image distortion, and if the gain is too low, image
quality can be inadequate. Most modern ultrasound machines have default settings to
improve image quality in specific organs.
The eye should be examined in at least two planes: the axial or transverse plane, with the
probe oriented in the horizontal, left to right direction; and the sagittal plane, which is
imaged by rotating the probe and positioning it in a cranial to caudal orientation (Figures
2.3 and 2.4). The imaging should be performed in both eyes.77,78
The mechanical index should always be adjusted lower than the recommended values for
the eye, in order to limit the amount of energy absorbed by the eye (safety guidelines will
be discussed below).
At energy levels used for diagnostic purposes, no known adverse effects have been
described.76,77,78
Figure 2.3. Generously applied coupling gel over transparent protective dressing

23
Figure 2.4. Axial imaging Figure 2.5. Sagittal imaging
2.2.5. Safety of transorbital ultrasonography
The acoustic energy used for diagnostic purposes has no described adverse effects.77, 79
Despite stringent output standards for ocular exposure to diagnostic ultrasound, there is
limited literature on the subject. The recent bioeffects and safety report by the American
Institute of Ultrasound in Medicine (AIUM) makes no specific mention of the eye.80 A
recent review article provides a very helpful summary of the safety recommendations for
transorbital sonography.158 The United States Food and Drug Administration Center for
Devices and Radiological Health (US FDA/CDRH) describes an output intensity limit for
all eye exposure of 50 mW/cm2, recommending the use of a mechanical index (MI) <
0.23, and a thermal index (TI) < 1.81

24
The European Federation of Societies for Ultrasound in Medicine and Biology
(EFSUMB)82 recommend that particular care should be taken to reduce the risk of thermal
and non-thermal effects during investigations of the eye.83 To eliminate potential injury to
the eye it is recommended that ultrasound output power be kept as low as reasonably
achievable (ALARA principle)79,84 without impeding the diagnostic quality of the
examination, and that examination times be kept as short as possible.85,86,158 An equally
important prerequisite is that transorbital sonographic ONS examination only be
performed by operators adequately trained and experienced in performing the technique.
The definition of an experienced operator differs, but this study defined an experienced
operator as having performed more than 25 prior transorbital ultrasound examinations.23
2.2.6. Shortcomings of transorbital ultrasonography
Ocular trauma or disease of the optic nerve complex precludes sonographic examination
of the ONS. The technique requires a certain amount of training or experience, as novice
users may be prone to erroneous measurement.23 The artefactual shadow which is thought
to be due to the poor insonation angle, has been described by some authors and often
makes accurate and repeatable measurement of the echoic borders of the ONS unclear.
The lack of consensus regarding the optimal ONSD cut-off value to detect raised ICP, has
limited universal acceptance of the technique, despite a growing number of studies
demonstrating a good relationship between ONSD and ICP. While the technique causes
very minimal discomfort and is well tolerated by most patients, examinition in small
childen can often be quite challenging.
Transorbital sonography of the ONS is a safe and effective technique for visualising the
lamina cribrosa, optic nerve and its sheath. In our experience and that of numerous other
authors, the technique is promising as a surrogate marker of raised ICP. There are no
described adverse effects when the technique is performed by experienced operators,
utilising correct equipment and according to safety recommendations.78-82
This study focussed on the use of transorbital sonography of the ONS to detect raised ICP,
using thresholds of 20, 15, 10 and 5 mmHg in neurosurgical patients.

25
Chapter 3.
Methods of assessing intracranial pressure
3.1. Introduction
The early work by Guillaume and Janny in 1951,87 followed by Lundberg’s magnum opus
in 1960 88 laid the foundation for monitoring of ICP. Several investigators have since made
significant contributions in this field.60,89-98,122 The association between raised ICP and
poor neurological outcome has been widely reported and has distinct clinical and
therapeutic implications.90,100-102 Although some reports have questioned the merits of
monitoring ICP,103,104 the role of invasive monitoring techniques in a neurocritical care
environment as a diagnostic and therapeutic tool, especially in TBI are widely
supported.92,99,105-108 Invasive ICP monitoring has the distinct benefit of allowing
continuous, real-time analysis of the ICP waveform.88
The benefits of reliably and non-invasively assessing ICP have also been described, and
while invasive ICP monitoring remains the gold standard, development of accurate, non-
invasive alternatives are ongoing.2,109 Perhaps the most significant benefit of a reliable
non-invasive technique, lies in the promise of earlier detection of conditions where the
clinical presentation of raised ICP may be subtle, a scenario perhaps most applicable to
children.
In children determining the threshold for raised ICP is complex because of the variation
in physiological norms associated with different ages. Lower ICP treatment thresholds for
younger children are often considered appropriate, but there is still a lack of data to support
this. The current recommendation in the guidelines for acute medical care of severe
traumatic brain injury in neonates, children and adolescents is a treatment threshold of 20
mmHg for children recommendations.110,111 These guidelines don’t make any age-specific
recommendations. As children are a heterogeneous group with significant age-related
physiological and anatomical variation, there are likely to be differences in ICP treatment
thresholds within children. Chambers et al. described age-related ICP thresholds of 2 to 6

26
years – 6 mmHg, 7 to 10 years – 9 mmHg and 11 to 15 years – 13 mmHg.95 An ICP
threshold of 20 mmHg demonstrated a significant correlation with outcome in children
with traumatic brain injury94. It is possible that cerebral herniation occurs at intracranial
pressures < 20 – 25 mmHg, depending on the type and location of the intracranial space
occupying lesion. It therefore remains specifically relevant to interpret any recommended
ICP threshold in the context of clinical presentation, monitoring of physiological variables
(where appropriate) and imaging findings in an individual patient. Recommendations that
account for age-related ICP thresholds would be ideal.
3.2. Monitoring of ICP
There is still no ideal method for evaluating ICP. While the benefit of continuous, real-
time monitoring provided by invasive ICP monitoring is clear, it comes with distinct
limitations, and the appeal of non-invasive ICP monitoring lies in obviating the need for
placement of an intracranial device, and avoidance of the risks associated with these
procedures. However, current non-invasive ICP monitoring techniques have the limitation
of inadequate accuracy4,109 for detecting elevated ICP. Most non-invasive techniques are
able to provide qualitative estimates of ICP, but lack quantitative value. The benefits and
limitations of invasive and non-invasive ICP monitoring are discussed below.
3.3. Invasive ICP monitoring

27
Invasive ICP monitoring devices are either fluid-coupled or non-fluid-coupled and can be
further classified according to the anatomical compartment into which they are placed.
These include:
3.3.1 Intraventricular monitoring 3.3.2 Intraparenchymal monitoring 3.3.3 Subdural monitoring 3.3.4 Extradural monitoring 3.3.5 Telemetric ICP monitoring 3.3.6 Spinal monitoring
3.3.1. Intraventricular monitoring
Insertion of an external ventricular drain (EVD) and measurement of the cerebrospinal
fluid CSF pressure is still considered the ‘gold standard’ technique for monitoring ICP.88,92
This is a fluid-coupled system, consisting of a catheter placed into the lateral ventricle and
connected to a fluid-filled column, which transmits the ventricular pressure to an external
strain gauge.112 The opportunity to transduce the pressure readings for continuous
monitoring as well as the added benefit of being able to release CSF when ICP is elevated,
make this method very appealing as a diagnostic and therapeutic option. Calibration of the
system is very simple once it is properly zeroed at the level of the external auditory meatus.
A limitation to placement of a ventricular catheter in rasied ICP, is ventricular
compression or anatomical distortion, which can make accurate insertion into the ventricle
quite challenging. As a fluid filled system, blood or debris in the ventricle can cause
obstruction. The main risks associated with EVD placement are infection and
haemorrhage. The risk of infection starts to increase after day 5 post-insertion, and is
reported as between 1 and 11%.113-115 The risk of haemorrhage from EVD placement is
quite low, described as 1.1%, with a 0.5% incidence of clinically significant
haematoma.116
3.3.2. Intraparenchymal monitoring

28
The use of intraparenchymal, fibre-optic, microtransducer probes to monitor ICP has
increased significantly.2,92,112,117-119 These transducers are usually placed and secured
using a twist drill and skull bolt, but can also be placed freehand via a burr hole. The
transducers must be calibrated according to the manufacturer specifications, i.e. either in
air or water, prior to insertion. These devices have a lower rate of infection and
haemorrhage than EVD placement.3,114,120-121
A limitation with microtransducer monitoring is the drift of the readings over time,
described as being about 2.1 mmHg over five days.123,124 Generally these microtransducers
cannot be re-zeroed; however, pneumatic transducers such as the Spiegelberg transducer
may be zeroed in-vivo at set time intervals.95 Variation in the correlation between fibre-
optic microtransducer readings and transduced EVD readings has been reported.125,126 The
use of invasive, intraparenchymal ICP monitoring is generally limited to neurocritical care
or high care units.
3.3.3. Subdural monitoring
The placement of microtransducer probes in the subdural space requires burr hole and
freehand placement, as bolt insertion precludes placement into this space. The indications
are similar to intraparenchymal placement, but potentially carry a lower risk of
intraparenchymal haemorrhage.
3.3.4. Extradural monitoring
The main concern with placement of probes in the extradural space remains poor
reliability. This is thought to have somewhat improved, but the level of accuracy remains
unclear.92
3.3.5. Telemetric (Implantable) ICP monitoring

29
Implantable ICP monitors with a catheter-tip transducer connected to a telemetry unit
implanted in a skin pouch outside the cranium have been used for long-term ICP
monitoring. This technique has the particular advantage of providing continuous data on
ICP patterns and has gained increasing interest,127 particularly in patients with complicated
CSF dynamic disturbances, where repeat invasive pressure monitoring may be required.128
3.3.6. Lumbar spinal monitoring
In the neurocritical care setting lumbar CSF pressure is rarely measured. The use of this
technique is largely limited to certain forms of hydrocephalus and benign intracranial
hypertension. The opening pressure is usually measured with a CSF manometer;
depending on the indication a spinal drain could be inserted. Lumbar puncture (LP)
opening pressures in children may also overestimate ICP, with a recent study
recommending verification of LP opening pressures by formal ICP monitoring.129
Neuroimaging to rule out a space occupying lesion or radiological contraindication is
mandatory prior to performing the LP.

30
Type of placement Advantages Disadvantages
Intraventricular catheter Provides a global measure of ICP Can be used to release CSF for control of ICP Can be calibrated in-vivo
Significant risk of infection, haemorrhage, disconnection Difficult insertion in small ventricles
Intraparenchymal Low complication rate Insertion is simple
Drift of reading over time In-vivo calibration not possible Provides a focal representation of ICP
Subdural Low complication rate Insertion is simple
Drift of reading over time In-vivo calibration not possible Provides a focal representation of ICP
Extradural Simple insertion Minimal risk of infection
Accuracy unreliable
Telemetric Continuous data Indwelling device
Lumbar spine Extracranial procedure Can be performed in ambulatory patients
May not reliably reflect ICP Dangerous if ICP is very high or SOL is present
Table 3.1. Invasive ICP monitoring techniques

31
3.4. Limitations of invasive ICP monitoring
The use of invasive ICP monitoring, despite distinct benefits, is suboptimal in clinical
practice. Insertion of intracranial monitoring devices is performed by neurosurgeons,
however, a significant number of patients with raised ICP are initially seen by non-
neurosurgeons, who do not have access to invasive monitoring. Patients being ventilated
in a neurocritical care environment are good candidates for invasive monitoring, but
ambulant patients are less suitable, and as a result ICP monitoring may not be performed
in many patients in whom it is indicated. Conversely, a suitable non-invasive technique
that could reliably screen patients with raised ICP could identify appropriate candidates
for invasive monitoring.
The risks associated with the procedure, mainly haemorrhage, infection, misplacement
and inaccurate readings, must be weighed against the potential benefits. Sophisticated MR
and CT imaging techniques provide invaluable information regarding space occupying
lesions, oedema, haemorrhage and hydrocephalus. These images are necessary despite
ICP monitoring to describe the actual underlying pathology. ICP monitoring as a
standalone modality may provide imprecise impressions of what is actually occurring,
depending on the experience of the treating clinician, and subsequently may elicit
inappropriate therapeutic interventions. The benefit of multimodal monitoring versus ICP
monitoring alone is a contentious issue.
Invasive ICP monitoring remains the standard against which all non-invasive methods of
assessing ICP are compared.92,116 The gold standard for invasive ICP monitoring remains
measurement via a transduced intraventricular catheter. The risks and limitations
associated with invasive ICP monitoring have inspired considerable efforts towards the
development of non-invasive techniques that are reliable, easy to use, cost-effective and
reproducible.2,3,4,109 A variety of non-invasive techniques have been described for
assessing ICP; their widespread use, however, remains quite limited. The shortcomings of
these non-invasive techniques include the range of cut-off values for detecting raised ICP,
inter-rater variability and qualitative rather than quantitative measurement of ICP.2,3,109

32
For a non-invasive technique to be considered reliable, it would have to correlate well
with invasively measured ICP, predict ICP within 2 mmHg in the 0 – 20 mmHg range,
with a maximum error of 10% for ICP > 20 mmHg, which are the specifications supported
by the Brain Trauma Foundation.130
3.5. Non-invasive assessment of ICP
A method for reliably assessing ICP that does not require surgery and poses no risk of
infection or haemorrhage, is certainly appealling. The ideal technique should be relatively
inexpensive, repeatable, portable, radiation-free, user-friendly and allow continuous
monitoring. The uses of a non-invasive technique could include screening and triage at
point of contact, long-term monitoring (invasive monitoring has a limited duration due to
risk of infection and drift), monitoring of ICP for routine assessment in patients with other
conditions that may present with raised ICP, e.g. chronic hydrocephalus or stroke
survivors.
Methods of non-invasive ICP monitoring usually involve assessing physiological or
anatomical characteristics influenced by an increase in ICP. There are a variety of
techniques, both clinical and technological, qualitative and quantitative for non-invasively
assessing ICP. The accuracy of these techniques varies considerably,2,3,109 and for ease of
reference, can be divided into the following groups:
3.5.1 Clinical assessment
3.5.2 Techniques utilizing the natural bony windows in the skull
3.5.3 Techniques assessing fluid dynamics
3.5.4 Electrophysiological techniques
3.5.5 Imaging techniques

33
3.5.1 Clinical assessment
Clinical neurological assessment remains the most important initial diagnostic and
monitoring tool. Despite notable advances in non-invasive monitoring in the modern era,
ongoing clinical assessment should remain a fundamental pillar of monitoring.
3.5.1.1. History
Careful history taking can be an invaluable tool in making the diagnosis of raised ICP.
The symptoms suggestive of raised ICP are:
Headache Impaired level of consciousness Visual disturbance Nausea and vomiting Developmental delay (in younger children) Failure to thrive (in younger children)
In children with an open anterior fontanelle (AF), increasing head circumference and a
bulging fontanelle are symptoms that parents will often notice themselves.
These symptoms should always raise the suspicion of raised ICP; however they lack
specificity and when interpreted alone can often be misleading to the treating clinician. It
is therefore important to interpret these findings in the appropriate clinical context.
3.5.1.2. Clinical examination
The benefit of the clinical evaluation differs in the paediatric and adult population. In
children with an open AF, where the skull sutures have not yet fused, an abnormal increase
in the head circumference and bulging of the fontanelle are good indicators of raised
ICP.131,132 In severely raised ICP the sutures may often be separated and palpable.
Distended scalp veins may be visible when the head circumference is increased in
longstanding raised ICP.

34
After the sutures have fused, assessment of ICP becomes more difficult. Finding
papilledema on fundoscopy is a reliable indicator of raised ICP,133 however this finding is
not consistent, especially where there is atrophy of the optic nerve.134 Fundoscopic
examination can provide significant additional evidence of underlying raised ICP, which
includes papilledema, haemorrhage, loss of spontaneous venous pulsation and optic
atrophy. Papilledema is usually bilateral and generally develops within 5 days of an
increase in ICP.135,136
Cranial nerve palsies, usually the third and sixth cranial nerves and abnormalities of gaze
(mostly upward gaze palsy) are usually ominous signs that raised ICP may be present.
Bradycardia and hypertension with abnormal respiration (Cushing’s response) may
accompany cerebral herniation syndromes and are late features, usually signalling
critically raised ICP, requiring emergent treatment. The benefit of a thorough history and
clinical examination can therefore, not be emphasized enough.
3.5.2 Techniques utilising the natural bony windows of the skull
The most accessible anatomical windows in the bony skull which can be used to assess
ICP are, transorbital, the auditory canal and the anterior fontanelle (AF) in infants.
3.5.2.1. Transorbital methods
This thesis focused on the use of ONSD measurement, and it is discussed first in this
subsection, but other useful transorbital techniques are also discussed here.
i. Optic nerve sheath diameter (ONSD)
The optic nerve originates ontogenetically from the central nervous system. It is encased
by a dural sheath, with a perineural, subarachnoid space between the nerve and the dural
sheath. This perineural space is filled with CSF and is in direct communication with the

35
intracranial subarachnoid space. An increase in ICP results in displacement of CSF along
its various pathways. The increase in CSF within the space surrounding the optic nerve
results in expansion of the ONS. The region of the ONS located 3mm posterior to the
lamina cribrosa of the retina is considered the most distensible and recommended as the
most consistent region to acquire the ONSD measurement.50 Changes in the ONSD can
be visualized using images from ultrasound, MRI and CT scans.17,30,151-153 Several studies
have demonstrated a strong association between distension of the ONSD and an increase
in ICP.18,19,73,151,154,155 The suggested cut-off values in these studies range between 4.1 -
5.9 mm and the definition of increased ICP also varies considerably, between 14.7 and 30
mmHg.4,18,73,151,154 The main limitations of ultrasound-based ONSD measurements are
hyperechoic artefacts, inter-examination variability, small size of the structures and
measurements, variation in optic nerve sheath cut-off values and heterogeneity of the
patient population.15,18,157,158 These shortcomings are accentuated in children because of
the age-related variations.28-34 Despite these limitations, ONSD measurement has been
described as a useful screening method to detect clinically suspected raised ICP, especially
where invasive monitoring is not readily available.22,23,25,30
ii. Intraocular pressure (IOP)
The appeal of this technique lies in the anatomical proximity and direct communication
between the eye and the intracranial space.137 The indirect transmission of ICP to the orbit
via intervening venous anatomy has long been recognized.138 The use of handheld
tonometers by clinicians without any specialised training, has increased the interest in IOP
as a rapid screening tool for raised ICP.137,139-143 Lehmann et al. demonstrated in their
study on rhesus monkeys that a relationship between IOP and ICP did exist, albeit at rather
high mean values of ICP (46.8mmHg).144 Later studies evaluating the relationship
between IOP and ICP provide mixed results.138,139 A meta-analysis by Yavin et al.
concluded that the pooled diagnostic accuracy suggested IOP may be a useful clinical
adjunct in the detection of raised ICP, but felt the benefit of the technique would be best
assessed in future studies where clinical equipoise exists regarding the use of invasive ICP
monitoring.145 While there appears to be a relationship between an increase in IOP and

36
raised ICP, IOP does not appear sufficiently accurate for predicting individual patient ICP
measurement.146
iii. Pupillometry
Infrared pupillometry has been used to quantitatively measure subtle changes in pupil size
in response to light stimulus. Pupillometers have been found to be more sensitive than
manual scoring for noting small changes in pupil size.147,148 In normal individuals the pupil
decreases by 34-36% in size, in response to a standard light stimulus. This response is
reduced to 20% in head-injured patients, with a reduction of less than 10% associated with
an ICP > 20 mmHg.149,150 While promising, the clinical applicability of this technique
requires further investigation.
iv. Optical coherence tomography (OCT)
OCT is a technique using broad-band near-infrared light. This technology can be used to
quantitatively measure and monitor the thickness of the retinal nerve fibre layer (RNFL)
and the optic nerve head morphology,159 making it a useful, objective method for
distinguishing nerves with papilledema from normal nerves, and optic atrophy. This
application has been found useful in adults and children with raised ICP and
papilledema.160,161
v. Scanning Laser Tomography (SLT)
SLT uses a laser to produce a 3D scan of the retinal surface. It can be used as an alternative
to OCT when measuring the RFNL. The technique has been described as being highly
reproducible.162,163 Though SLT measurement of the optic nerve volume and height have
been found reliable in quantifying papilledema,164 and have been correlated with CSF
pressure measured via LP,165 its value in reliably estimating ICP has yet to be established.

37
vi. Spontaneous venous pulsation (SVP)
SVP occurs due to the variation in the pressure gradient between the intraocular and CSF
pulse pressure when the retinal vein crosses the lamina cribrosa.166 SVP is considered to
be present when ICP is normal,167 however SVP may be absent in normal individuals as
well. The presence of SVP is therefore a very sensitive marker for normal ICP, but should
be interpreted in the context of the patient’s clinical presentation.168
vii. Venous Ophthalmodynamometry (vODM)
This method was originally described by Baurmann in 1925, and involves measurement
of the retinal venous outflow pressure (VOP) while observing the retinal vessels with an
ophthalmoscope.169 The technique usually involves applying a suction cup to the globe in
order to increase the IOP until the central retinal vein (CRV) collapses, and begins to
pulsate, which usually happens at the point when the applied external pressure nears the
VOP, which is an approximate of ICP. The venous outflow pressure which has a close
linear relationship with ICP170 is calculated by adding the pressure from the
ophthalmodynamometer to the IOP. The technique requires the pupils to be dilated and
should be performed by an experienced ophthalmologist. The application of external
ocular pressure could also trigger the oculo-cardiac reflex, leading to hypotension, which
is undesirable, especially if ICP is increased.
Technique Level of operator skill required
Quantitative or qualitative assessment of ICP
Continuous monitoring
Main advantage
Main disadvantage
ONSD Medium Qualitative No Requires minimal
Poor specificity Wide range of described cut-off
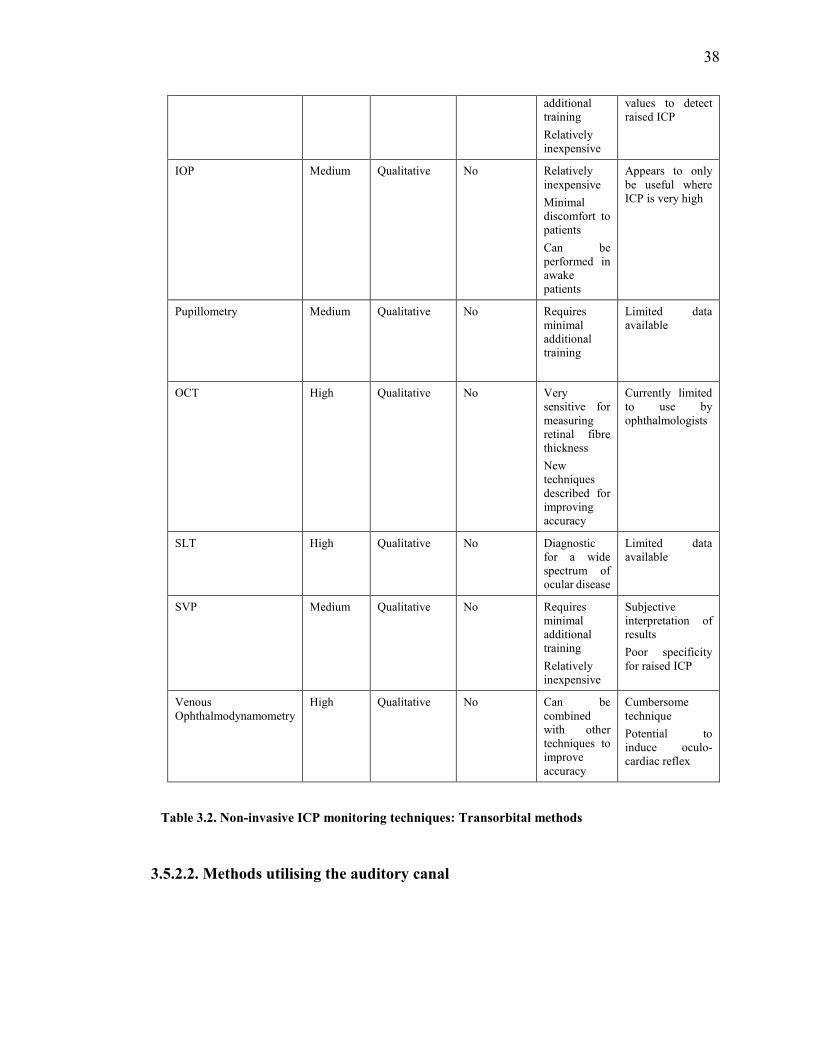
38
additional training Relatively inexpensive
values to detect raised ICP
IOP Medium Qualitative No Relatively inexpensive Minimal discomfort to patients Can be performed in awake patients
Appears to only be useful where ICP is very high
Pupillometry Medium Qualitative No Requires minimal additional training
Limited data available
OCT High Qualitative No Very sensitive for measuring retinal fibre thickness New techniques described for improving accuracy
Currently limited to use by ophthalmologists
SLT High Qualitative No Diagnostic for a wide spectrum of ocular disease
Limited data available
SVP Medium Qualitative No Requires minimal additional training Relatively inexpensive
Subjective interpretation of results Poor specificity for raised ICP
Venous Ophthalmodynamometry
High Qualitative No Can be combined with other techniques to improve accuracy
Cumbersome technique Potential to induce oculo-cardiac reflex
Table 3.2. Non-invasive ICP monitoring techniques: Transorbital methods
3.5.2.2. Methods utilising the auditory canal

39
The cochlea of the ear is in direct communication with the intracranial subarachnoid space
via the cochlear aqueduct. Methods investigating displacement of the tympanic membrane
and measurement of sound generated by movement of the ossicles have been described as
markers of ICP.
i. Tympanic Membrane Displacement (TMD)
Tympanic membrane vibration is usually transmitted through the ossicles in the middle
ear to the cochlea. Contraction of the stapedius and tensor tympani muscles is
accompanied by a small, measurable displacement of the tympanic membrane from its
resting position. As the perilymph and CSF communicate through the cochlear aqueduct,
an increase in ICP is directly transmitted to the footplate of the stapes leading to a change
in the direction and magnitude of the TMD.
Movement of the tympanic membrane caused by stimulation of the stapedial reflex can
be quantitatively assessed. This movement is altered by increased ICP, but limited
accuracy of the technique means it is merely suited to providing qualitative information
about ICP.171,172 In the study by Shimbles et al, no valid measurement of TMD could be
made in about 60% of patients, casting doubt on the clinical value of the technique.173
Patency of the cochlear aqueduct, integrity of the tympanic membrane and strength of the
acoustic reflex influence the TMD, which is further limited by poor inter-subject
reproducibility.174
ii. Otoacoustic emissions (OAEs)
OAEs are sounds originating from movement of the sensory hair cells within the cochlea
in response to auditory stimulation. These sounds can be recorded by a probe placed in
the ear canal. OAE is often used in clinical practice to test for hearing deficits in young
children where cooperation is poor.
Auditory measurements of OAEs that depend on middle-ear function are theoretically
influenced by changes in ICP.175 This method has been used as an alternative to TMD,

40
specifically a technique called distortion product otoacoustic emissions (DPOAEs) has
been shown to change with ICP.175,176 It has the advantage over TMD of not requiring the
middle-ear reflex arc, which involves brainstem pathways. Poor inter-subject variability
limits its use in measuring ICP, but it could be useful for monitoring patients once baseline
ICP has already been measured.4,177
Technique Level of operator skill required
Quantitative or qualitative assessment of ICP
Continuous monitoring
Main advantage
Main disadvantage
TMD Medium Qualitative Potentially Simple, cost-effective
Limited by anatomical variation
OAEs Medium Qualitative Potentially Excludes the brainstem pathway
Difficult in older patients
Table 3.3. Non-invasive ICP monitoring techniques: Methods utilising the auditory canal
3.5.2.3. Assessment of the anterior fontanelle (AF)
The term fontanelle refers to a fibrous, membrane-covered space or ‘soft spot’ occurring
between two juxtaposed cranial bones. There are usually two prominent fontanelles in the
midline, the AF and posterior fontanelle (PF). The AF is roughly diamond shaped and
located at the junction between the sagittal and coronal sutures, between the frontal and
parietal bones. It usually closes between the ages of 6 – 18 months (median age of 13.8
months).178 The PF usually closes by age 8 weeks and is of less clinical significance.
Palpation of the AF, measurement of the head circumference, assessing shape of the head
and palpation of suture ridges during clinical examination are basic, but extremely
valuable assessments which can be performed by health care workers at all levels.
Evaluation of the AF provides a window for determning whether raised ICP is present in
infants. The size and shape of the AF vary significantly according to age, position and

41
pathology and delayed closure of the AF is associated with a number of conditions. The
most common causes, which usually have other associated features as well, include
achondroplasia, congenital hypothyroidism, Down syndrome, rickets and raised ICP.
Raised ICP in infants usually causes a bulging or tense AF, and this should serve as a
warning prompting further investigation.
Described techniques for assessing ICP via the AF include measuring pulsation of the
AF,179,180 use of an aplanation transducer and modified Shiotz tonometer132 and the
Rotterdam Teletransducer (RTT).181 None of these have been widely used in routine
practice and are largely of historical significance. Where the AF is closed or not reliably
patent, other non-invasive techniques may be required to assess ICP.
3.5.3. Methods based on fluid dynamic properties
Studying the dynamic changes in ICP, cerebral blood flow (CBF) and cerebral compliance
can be quite challenging. Non-invasive techniques for assessing these parameters are
therefore rather limited. Ultrasound, MRI and infrared spectroscopy have been used to
examine some of these dynamic changes and will be discussed below.
3.5.3.1. Transcranial Doppler sonography (TCD)
TCD measures the velocity of blood flow through major intracranial vessels by emitting
a high frequency (> 2 MHz) wave, and detecting the frequency shift between the incident
and reflected wave. This difference directly correlates with the speed of blood flow (the
Doppler effect).182
42
TCD as a technique for evaluating cerebral haemodynamics was first described by Aaslid
in 1982.183 It has since been used to measure the cerebral blood flow (CBF) velocity in the
circle of Willis and the vertebrobasilar system, both diagnostically and to adjust treatment
strategies in a variety of neurovascular disorders.184-187 Insonation of one of the arteries,
usually the middle cerebral artery, produces an arterial waveform. Using this arterial
waveform, the most commonly assessed parameters are the peak systolic and diastolic
velocity, mean velocity, resistance index (RI) and pulsatility index (PI). The criteria for
adequate vessel insonation are: the cranial window used, transducer position, angle of
insonation, depth of sample volume, direction of blood flow, relative flow velocity and
experience of the investigator.182,188
The measurement is taken over regions of the skull with the thinnest bony windows
(temporal region, through the eye or at the back of the head). TCD is most suited to
providing a qualitative estimate (low, normal or high) of ICP.189,184
In an adult study, the PI (difference between systolic and diastolic flow velocity divided
by the mean flow velocity) correlated well with ICP (correlation coefficient of 0.938, p <
0.001).184 A study in children with severe traumatic brain injury (TBI) found the PI to be
a less reliable indicator of absolute ICP values,190 while a subsequent study also in children
found TCD to be an excellent first-line examination for identifying patients likely to need
invasive ICP monitoring.191
TCD remains an attractive alternative to invasive ICP because of its ability to detect
cerebral ischemia, its relative cost effectiveness and widespread availability. The main
disadvantages are that it requires a trained and skilled operator to perform and interpret
the measurements and the limited accuracy for estimating absolute ICP.190
Two-depth TCD assessment involves pressure application to the orbit in order to equalize
blood flow in the intra- and extracranial segments of the ophthalmic artery. This technique
was shown to correlate well with absolute ICP measurements,192,193 but also appears
currently limitated by operator dependence and inadequacy of the current indices to
accurately reflect true ICP.

43
3.5.3.2. Magnetic resonance imaging (MRI)-based elastance index
MRI-based cine phase-contrast pulse sequences are used to determine the blood and CSF
volumetric flow rates within the brain. A method described by Alperin uses the arterial
inflow, venous outflow and CSF flow between the cranium and spinal compartment to
calculate changes in intracranial volume; these measurements can then be used to derive
ICP using an elastance index.194,230 Prediction of ICP using this dynamic MRI technique
has been strongly correlated with invasive ICP measurement. In children with
hydrocephalus, dynamic MRI was shown to correlate well with the shunt valve opening
pressure.195 A significant association with symptom resolution in hydrocephalic patients
has also been demonstrated.196 This promising technique still requires investigation in a
larger cohort of patients. It is also quite expensive and impractical for continuous
monitoring.
3.5.3.3. Near infrared spectroscopy (NIRS)
Transcranial NIRS is a method for assessing regional changes in cerebral blood oxygen
saturation (rSO2) and cerebral blood volume (CBV) and CBF.197 NIRS works in the infra-
red spectrum (700-1000 nm) of light, where low absorption allows it to easily pass through
skin and bone resulting in deep-tissue penetration. This light is both scattered and
absorbed as it passes through brain tissue. Variations in the absorption of infrared light by
different substances allow the detection of changes in deoxyhaemoglobin and
oxyhaemoglobin concentration. A significant difference in rSO2 values was demonstrated
in a study of severe TBI patients with normal and raised ICP.198 Changes in cerebral
oxygenation were also shown to correlate with vasogenic ICP slow waves in CSF infusion
studies and patients with TBI.199 NIRS allows for the calculation of certain indices which
have been correlated with cerebrovascular pressure reactivity in patients with TBI.200 At
present NIRS does not provide an estimation of absolute ICP values nor does it facilitate

44
the detection of changes in ICP.109 The technique is also limited by the requirement for
specialised equipment and the extended period required to obtain the required indices.200
Technique Level of operator skill required
Quantitative or qualitative assessment of ICP
Continuous monitoring
Main advantage
Main disadvantage
TCD High Qualitative No Versatile technique with a wide array of indications
Technical expertise limit its widespread use
MRI-based elastance index
Medium Qualitative No Exquisite detail, with potential for describing new indices
High cost with extensive infrastructure required
NIRS Medium Qualitative Yes Allows long-term monitoring
Readings are influenced a number of variables
Table 3.4. Non-invasive ICP monitoring techniques: Methods based on fluid dynamic properties
3.5.4 Electrophysiological techniques
3.5.4.1. Electroencephalography (EEG)
EEG represents spontaneous electrical activity of the cerebral cortex recorded through
electrodes placed on the scalp. These electrical signals are then amplified, filtered and
displayed according to the number of channels required (generally 8 or 16 channels).
The use of a novel technique called EEG power spectrum analysis has recently been
reported on by Chen et al.201 Power spectral analysis allows a graphical representation of
the EEG readings over time. An index called the intracranial pressure index (IPI) was
derived using the EEG power spectrum analysis, and this was then correlated with ICP

45
measurements obtained via lumbar puncture. The authors concluded that there was a
correlation between the IPI and ICP. Its clinical utility will depend on validation in further
studies. EEG can be continuously recorded for 8 -12 hours, before the conductive gel dries
out, requiring the leads to be replaced. Recent development of both wireless, portable and
field deployable EEG systems have improved the application of this technique.201
3.5.4.2. Visual evoked potentials (VEP)
VEPs are recorded from electrodes positioned in the occipital scalp and accurately reflect
disturbances of the visual pathways.202,203 Rosenfeld described a method using flashing
light into the eye and estimating ICP through recordings obtained from a few occipital
EEG electrodes, using the latency of the second negative-going wave (N2).203 A linear
relationship between ICP and the latency of the third positive-going wave (P3) has also
been reported using high-density electrode arrays and independent component analysis
extraction.204 The N2 wave appears to be stable and easily identifiable using flash evoked
VEPs in healthy control patients. Earlier studies by York et al. demonstrated a strong
correlation between the N2 latency of the VEP and ICP in children with hydrocephalus
and young adults with head trauma.205,206 The relationship between a prolonged N2 latency
period and raised ICP has subsequently also been reported in children.207,208 A recent study
has, however, demonstrated a high intersubject variability, suggesting a limited ability to
predict ICP.209
3.5.4.3. Ocular vestibular evoked myogenic potentials (oVEMPs)
This technique employs vestibular stimulation of the extraocular muscles to generate
electromyographic activity. These evoked potentials can be recorded from the

46
contralateral eye using surface electrodes. A recent study has suggested this technique
may have a role in non-invasive ICP assessment.172
Technique Level of operator skill required
Quantitative or qualitative assessment of ICP
Continuous monitoring
Main advantage
Main disadvantage
EEG High Qualitative Yes Allows high quality data that can provide information about other conditions as well, i.e. seizures, ischemia
Requires trained personnel to setup and interpret
VEP High Qualitative Potentially Ability to provide data that on a spectrum of visual abnormalities
Lack of clear evidence to support correlation with ICP
oVEMP Medium Qualitative No Still unclear Paucity of data
Table 3.5. Non-invasive ICP monitoring techniques: Electrophysiological techniques
3.5.5. Imaging techniques

47
Radiological imaging has historically been a fundamental tool in making the diagnosis of
raised ICP. Skull x-rays were used to assess whether chronically raised ICP was present
by detecting separation of the skull sutures, ‘copper beaten’ appearance of the skull and
erosion of the clinoid.210,211,212 This technique has been found less useful in the modern
era.213 Imaging features on CT and MRI consistent with clinical findings of raised ICP
have been well described.210,214-218 These features are discussed below.
3.5.5.1. CT scan
CT scan still remains the most commonly used diagnostic imaging modality when
assessing patients with acutely raised ICP. A variety of findings on CT have been
associated with raised ICP, depending on the underlying aetiology. These findings
include:
Absence/compression of the basal cisterns and/or ventricles Midline shift Enlarged ventricles (hydrocephalus) Transependymal fluid shift Presence of haematoma/space occupying lesion Blood in the subarachnoid space Size of sulci Gray/white differentiation
The benefit of the initial CT scan has been investigated widely in the context of traumatic
brain injury.210,215,218,220 CT scan still forms the cornerstone of acute imaging in
hydrocephalus, where imaging features depend on the aetiology and relate to the level of
obstruction, presence of transependymal fluid shift, volume of CSF in the subarachnoid
space and shape of the the third ventricle.267,268 Planning of specific surgical interventions
for hydrocephalus, eg. endoscopic third ventriculostomy (ETV), usually requires an MRI
scan.
The discussion regarding which of these CT findings and correlate best with raised ICP is
still ongoing.4,109,218-220 While CT scans remain a valuable diagnostic adjunct in the acute

48
diagnosis of raised ICP, it must be remembered that a ‘normal’ CT scan does not rule out
raised ICP. In children the additional radiation exposure to the susceptible, developing
brain and the possible sequelae over the lifetime of the child must always be
considered.221-225 To this effect the ‘image gently’ recommendations for children should
always be kept in mind (www.imagegently.org).
3.5.5.2. MRI scan
MRI provides superb quality images of the brain, but can be time consuming and costly
as a first line diagnostic modality in the acute care setting. MRI techniques for evaluating
ICP are based on the relationship between intracranial compliance and pressure.194,226
Using a motion-sensitive technique to measure the arterial, venous and CSF flow into and
out of the cranial cavity during the cardiac cycle, Alperin et al. demonstrated a strong
correlation between the MRI-derived elastance index and invasively measured ICP.194
These results, however, were found to have poor repeatability in a subsequent study, due
to technical errors in measurement and intra-individual variation, with the authors
suggesting caution when interpreting individual measurements.227 Despite these
shortcomings, specific MRI sequences appear promising, both for screening in acutely
raised ICP and for assessment of ICP in other conditions, like hydrocephalus.229 MRI has
also been used to evaluate the optic nerve sheath diameter as a marker for raised ICP,228
and appears to be more accurate then ultrasound in assessing the CSF filled subarachnoid
space surrounding the optic nerve.231 The current role of MRI as a diagnostic and
monitoring tool in neurosurgery, far outweighs its function as a purely non-invasive
technique for assessing ICP.
Technique Level of operator skill required
Qualitative or quantitative assessment of ICP
Continuous Monitoring
Main advantage
Main disadvantage

49
CT scan Medium Qualitative No Available at most facilities
Radiation exposure to the developing brain
MRI scan High Qualitative No Exquisite soft tissue detail
Not yet widely available
Table 3.6. Non-invasive ICP monitoring techniques: Imaging techniques
3.6. Discussion

50
Despite a relatively long history of innovative thinking inolving the pursuit of suitable
techniques for non-invasively assessing ICP, the process is still in a relatively exploratory
phase. The main limitations remain inadequate diagnostic accuracy for consistently
detecting raised ICP, poor quantitative estimation of ICP and lack of continuous
monitoring capability. Most methods appear suitable to identify subjects with low to
normal ICP or very high ICP, but are poor at detecting moderately raised ICP, which
arguably, is the most important group. The idea of combining selected non-invasive
techniques to improve accuracy, in a ‘non-invasive multi-modality model’ is certainly
appealing in principle.
Non-invasive ICP assessment is still most suitable as a screening tool for patients with
suspected raised ICP. Patients in a neurocritical care unit often require continuous ICP
monitoring, usually as part of a multimodal monitoring approach. These objectives are
currently only achievable using invasive monitoring techniques.
Future development of non-invasive techniques will likely depend on substantial
improvements in the accuracy, ease of use and potential for continuous monitoring. This
need is perhaps most distinct in the children, where early detection of increasing ICP may
facilitate the diagnosis of a number of underlying neurological conditions. The potential
to spare the developing nervous system unnecessary exposure to radiation from repeated
CT scans or limit the need for invasive monitoring in certain cases makes this quest
worthwhile.
This study has identified measurement of the ONSD using transorbital ultrasound as a
promising technique in children, and the next section of this work discusses the role of
ONSD measurement as a non-invasive marker of raised ICP.
51
Chapter 4.
Measurement of the optic nerve sheath diameter (ONSD) as a
non-invasive marker of intracranial pressure (ICP)
The optic nerve originates from the diencephalon and is an extension of the white matter
tract of the central nervous system (CNS). As the optic nerve extends into the orbital cavity
it is enveloped by a dural sleeve which is continuous with the intracranial dura mater. CSF
within the intracranial subarachnoid space is in continuity with the perineural
subarachnoid space surrounding the optic nerve. This perineural space, surrounded by a
dural sheath, is known as the ONS.53,56
An increase in ICP above a certain threshold can result in displacement of CSF from the
intracranial cavity. Depending on the underlying aetiology, this CSF displacement can
often be seen on imaging as a decrease in the volume of CSF surrounding the cerebral
cortex.33,232 The direct continuity between the intracranial and perineural subarachnoid
space allows the displacement of intracranial CSF causing an increase in the CSF volume
within the optic nerve sheath.28,50 This increase in CSF volume within the ONS results in
distension of the ONS and widening of its diameter. The space between the optic nerve
and dural sheath is not a homogeneous space, but rather a trabeculated, septated system
that likely plays a role in the CSF dynamics between the perineural space surrounding the
optic nerve and the subarachnoid space of the intracranial cavity.53
The relationship between an increase in ICP, increase in CSF within the ONS and oedema
of the optic disc was described by Hayreh in 1964.46 The initial ultrasound-based
observation of the thickness of the optic nerve, the amount of perineural fluid and the
thickness of the surrounding dural sheath were described by Ossoinig in his seminal work
entitled “Standardised Echography” in 1979.66 This was later followed by the description
of an increase in subarachnoid fluid surrounding the optic nerve and the link to increased
ICP.47 This observation was validated by Galetta who demonstrated a reduction in the
optic nerve diameter after lumbar puncture in a patient with pseudotumor cerebri.48 Liu

52
demonstrated a linear relationship between subarachnoid pressure of the optic nerve and
ICP in a cadaver model.49
Hansen and Helmke performed a study using specially prepared optic nerve specimens.
The technique involved forcefully injecting gelatin into the perineural space surrounding
the optic nerve, demonstrating that dilatation of the ONS was maximal in the anterior 3
mm segment. The observation that the change in ONSD may be influenced by dural
elasticity and the trabecular network density as well as different pressure loads, remains
an important consideration when interpreting the ONS response to an increase in ICP.
This study marked one of the earliest validations of ultrasonic measurement of pressure-
induced distension of the ONS.28 The distensibility of the ONS, its elastic properties,
individual baseline variability and the bony anatomy of the optic canal were further
explored in experimental studies by the same group, highlighting the complexity of the
relationship between ONS distension and ICP-related changes.50,154
Following on this early work, numerous investigators have explored the relationship
between distension of the ONS and ICP.16-33 The most relevant literature on this topic will
be discussed in this section, reviewing material on paediatric and adult studies involving
ONSD separately. The different modalities for measuring ONSD, i.e ultrasound, MRI and
CT will also be subcategorised under these headings.

53
4.1. Studies in children
Literature evaluating the role of ONSD measurement as a non-invasive marker of ICP in
children is quite sparse. The discussion of paediatric studies has been divided into two
parts. The first part evaluates studies supporting the use of ONSD measurement and the
second part evaluates studies against its use.
4.1.1 Support for the use of ONSD measurement
4.1.1.1. Ultrasound-based measurement
Some of the earliest work on this concept was done by Helmke and Hansen28 who
performed a prospective study on 39 children admitted to the intensive care unit (ICU),
and compared them to 51 control patients. The study aimed to investigate whether the
‘phenomenon’ of ONS distension happened under conditions of acute intracranial
hypertension. 15 patients did not have elevated ICP, while 24 had elevated ICP (7 with
invasive ICP monitoring to verify elevation above 20 mmHg). In control subjects the
range of ONSD measurements differed in the first 4 years of life when compared to ONSD
measurements in older children. The difference between mean ONSD in the ICU groups
with and without raised ICP was 2.3 mm (p = 0.007). This study remains fundamental as
it marks one of the earliest efforts to demonstrate dilatation of the ONS in acutely raised
ICP. Taking into consideration the error under repeated measurements of 0.3 mm, the
authors recommended that in children older than 4 years, an ONSD of 4.5 mm may be
considered ‘borderline’, while an ONSD exceeding 5.0 mm is definitely enlarged, whereas
in children under 4 years old, an ONSD of > 4 .0 mm can be considered ‘definitely’
enlarged.28
Aiming to establish normal age-related values for ONSD in infants and older children (up
to the age of 15 years old), Ballantyne and colleagues conducted a prospective study in

54
102 children without any neurological or ophthalmological disease. This study
demonstrated a clear increase in ONSD during the first year of life, approaching maximum
(adult) values by the age of 2 years. Results from this study suggest that an ONSD value
greater than 4 mm in children under 1 yo, and greater than 4.5 mm in older children should
be considered abnormal.29
Children with ‘shunted hydrocephalus’ were evaluated in a later study by Newman et al,30
comparing 23 children with shunted hydrocephalus with 102 control patients. The shunted
hydrocephalus group was further subdivided into i) normotensive (n=6), ii) symptomatic
but not requiring intervention (n=5) and iii) symptomatic requiring intervention (n=12).
The mean ONSD values were 3.1 ± 0.36 mm in the control group, 2.9 ± 0.5 mm in group
i), 3.1 ± 0.4 mm in group ii) and 5.9 ± 0.6 mm in group iii). The authors demonstrated a
correlation between increasing age and increasing optic nerve sheath diameter (r2 =0.48),
with the greatest increase occurring in the first year of life. The most significant
recommendation from this study was an age related cut-off point for normal ONSD values
of 4.0 mm in children under the age of 1 year, and 4.5 mm in children over the age of 1
year. This finding was consistent with the recommendation by Ballantyne et al,29 but at
odds with the findings from the Helmke study.28
The majority of studies evaluating the role of ONSD measurement, are based on using a
combination of clinical assessment and imaging findings as the reference standard for
diagnosing raised ICP. Malayeri and co-workers conducted a case-controlled, prospective
study on 156 children, 78 control patients and 78 patients symptomatic of raised ICP. The
investigators found a mean ONSD value of 5.6 ± 0.6 mm in the symptomatic group and
3.3 ± 0.6 mm in the control group (p < 0.01). They also found no significant age-related
difference in the ONSD measurement in the symptomatic group, but a significant age-
related difference in the control group, citing a probable difference in the expansile
structure and anatomic characteristics of the optic nerve sheath as a possible explanation
for the disparity. The study made no recommendation regarding the optimal ONSD cut-
off value in children.32
A Malawian study conducted by Beare and colleagues prospectively investigated the
benefit of ONSD measurement in 51 children, 21 with neurological disease and 30 control

55
patients. 14 patients had clinically suspected raised ICP, with a mean ONSD of 5.4 mm.
The mean ONSD was 3.6 mm in the group without clinically raised ICP and 3.5 mm in
the control group. The investigators suggest a cut-off point of 4.2 mm with a sensitivity
of 100% and specificity of 86%, as the upper limit of normal, with measurements ≥ 4.5
mm indicative of raised ICP. A limitation of the study was that the control group included
patients with gastroenteritis and sepsis, both of which are particularly susceptible to
dehydration, making the ONSD values quite difficult to interpret, as they were potentially
lower than would be expected for ‘normal children’. No age-related threshold was
investigated in this study.33
The first study to suggest that ONSD values in children may be higher than previously
desribed was performed by McAuley and colleagues. In a review of ONS ultrasound
examinations in children with a clinical suspicion of hydrocephalus, the study presented
data on 331 examinations performed in 160 children. The authors did not recommend
specific cut-off values in this paper but concluded that the baseline ONSD value in
asymptomatic patients was higher than previously reported by Newman et al.30 The
change in mean ONSD values in symptomatic patients from their own recorded
asymptomatic baseline was significant. Another relevant finding was that in 24/29
(82.8%) patients the ONSD correlated with shunt block, and in 19/24 (79.2%) of these
patients, no change in ventricular configuration was demonstrated on imaging findings.
The authors concluded that ONSD measurement was increased in symptomatic patients
from their own baseline, and that multiple examinations might be useful in evaluating the
ONSD pattern in individual patients, possibly playing a better predictive role in the
assessment of ventriculoperitoneal shunt (VPS) malfunction.234 Even though no specific
cut-off values were provided, this study was significant in that it highlighted the role of
repeat measurement of the ONSD in assessing patients with shunted hydrocephalus.
Tsung et al. reported on 3 paediatric cases of TBI in the emergency department (ED),
concluding that bedside ocular ultrasonography may be useful in the ED for screening
patients with potentially raised ICP prior to performing either lumbar punctures or CT
scans.235

56
The only study in children that specifically compared ONSD measurement to invasive
ICP assessment was performed by Agrawal and co-workers.This study was conducted on
patients admitted to a paediatric neurosurgical ICU, and included only 11 children. The
authors did however manage to demonstrate a difference in the ONSD measurements in
patients with raised ICP compared to those with normal ICP. Using 15 mmHg as the ICP
threshold, the median ONSD was 5.15 mm where ICP was considered raised, compared
to 3.95 mm in the normal ICP group, suggesting that ONSD measurement might be helpful
in selecting TBI patients requiring invasive ICP monitoring, and possibly avoid the risk
of unnecessary procedures. No ONSD cut-off value for predicting raised ICP was
suggested in this study.236
Figure 4.1. Axial ultrasound image of ONS Figure 4.2. Ultrasound image with ONSD measurement
Bulge of the optic disc

57
Author Type of study
Reference standard
Aetiology of raised ICP
Study size Year Type of probe used
Described ONSD values Diagnostic accuracy
Recommendation
Helmke Prospective Clinical symptoms, radiological findings and invasive ICP measurement
TBI, metabolic disorder
39 (51 control patients)
1996 7.5 MHz linear array probe)
< 4 years old – 4 mm, > 4 years old - 4.5 mm (borderline), 5 mm (definitely abnormal)
Not done ONSD is useful in acutely raised ICP, and the upper limit differs in children above and below 4 years old
Ballantyne Prospective Neurologically normal children
Normal (without neurological or ophthalmo-logical disease)
102 1999 7 Mhz sector probe
4.0 mm < 1 year old, 4.5 mm > 1 year old is considered abnormal
Not done Maximal increase in ONSD occurs in the first year of life, with a diminished growth rate over the next 14 years
Newman Prospective Clinical symptoms and signs of raised V/P shunt dysfunction
Shunted hydrocephalus vs control group
125 (102 controls vs 23 with shunted hydro-cephalus)
2002 7 Mhz phased array probe
4.0mm < 1 year old 4.5mm > 1 year old
Not performed ONSD measurement is a reliable technique for rapid diagnosis and monitoring of raised ICP
Malayeri Case-controlled, prospective
Clinical and radiological (CT scan) assessment
Mixed 156 (78 symptomatic, 78 case-controlled)
2005 7.5 Mhz linear probe
Mean 5.6 ± 0.6 mm in symptomatic group, and 3.3 ± 0.6 mm in control group. Children with elevated ICP have an ONSD > 4.55 mm, irrespective of their age.
Not specified Transorbital sonography could be a first-line diagnostic modality in patients with suspected raised ICP.

58
Table 4.1. Ultrasound-based paediatric studies supporting the use of ONSD measurement
Author Type of study
Reference standard
Aetiology of raised ICP
Study size Year Type of probe used
Described ONSD values Diagnostic accuracy
Recommendation
Beare Prospective Clinical signs and symptoms of raised ICP. CT scan diagnosis of raised ICP in 8 patients
Mixed 51 (21 with neurological disease and 30 control patients)
2008 7 Mhz curved array
4.2 mm Sensitivity-100% Specificity-86%
Sonographic ONSD assessment is a useful method in resource limited settings. Control patients had pneumonia, gastro-enteritis, sepsis – the effect of these on the hydration status of the patients and also on ONSD are difficult to predict
McAuley Retrospec-tive
Clinical assessment of raised ICP
Shunted hydrocephalus
160 2009 8 – 13 Mhz linear array probe
The mean change from baseline ONSD in symptomatic patients requiring intervention was 1.29 mm, vs 0.68 mm in symptomatic patients
Not performed Symptomatic patients demonstrate an increase in ONSD from their asymptomatic baseline.
Agrawal Prospective Invasive ICP measurement
TBI 11 2012 10 Mhz pobe
Used historical cut-off value of > 4.5 mm to predict ICP > 15 mmHg
Not specified Only study comparing ONSD to invasive ICP measurement, but in a small number of patients

59
4.1.1.2. MRI – based measurement
MRI provides superb detail when dedicated sequences are performed through the orbit.
The measurement of the ONSD is likely to be less variable between observers than on
ultrasound imaging. The reported measurements in children also appear to be larger on
MRI than on ultrasound,237,238,239 justifying a separate discussion.
The ideal region for measurement of the ONSD was addressed by Shofty and colleagues
in a study reviewing the MRI scans of 115 patients, 86 healthy control patients and 29
patients with idiopathic intracranial hypertension (IIH). A positive correlation between
age and ONSD was demonstrated in the control group (r = 0.414). A potential limitation
to interpreting the results of this study is the location used for the MRI measurement, i.e.
10 mm anterior to the optic foramen, which doesn’t conform to the historically
recommended location 3 mm posterior to the globe.30,50 The authors validated using the
more posterior location because of the possible confounding effect of globe position on
the measurement. The two groups, were each subdivided into 4 age categories. The
authors demonstrated significant differences in ONSD measurement between the two
groups in each of the age categories, concluding that ONSD enlargement on MRI in the
paediatric population, once population-based norms had been established, was an
important non-invasive diagnostic tool for detecting increased ICP.240
Change in ONSD measurement after successful treatment of hydrocephalus was described
by Singhal and co-authors in a retrospective analysis of 16 patients with successfully
treated hydrocephalus via endoscopic third ventriculostomy (ETV) and/or posterior fossa
tumor resection. The study compared ONSD on axial T2-MRI scans pre- and post-surgery.
The mean ONSD pre-surgery was 6.21 mm compared to 5.71 mm (p = 0.0017) post-
surgery. The authors also evaluated other optic nerve parameters, namely optic disc bulge
and optic nerve tortuosity, concluding that serial ONSD measurement and optic disc bulge
might be useful in assessing the outcome of hydrocephalus treatment.238
Change in ONSD as a marker of outcome after a specific treatment intervention, was
investigated in a recent retrospective study by Padayachy et al, using pre- and post-

60
operative MRI scans of patients who had undergone an ETV as treatment for their
hydrocephalus. The study included 24 children (≤ 14 yo) where, among other parameters,
the ONSD was measured pre- and post-operatively. The mean change in ONSD in the
successfully treated group was 0.73 mm (SD 0.26), vs 0.18 mm (SD 0.34) in group where
the ETV had failed (p < 0.0007). Change in ONSD demonstrated a sensitivity of 92.9%,
specificity of 85.7% and a diagnostic odds ratio of 78 for predicting outcome from the
procedure, suggesting that change in ONSD correlated well with outcome from ETV in
hydrocephalus.239
The described normal values for ONSD measurement were challenged in a study by
Steinborn et al, which aimed to validate the accuracy of ONSD measurement by
comparing transbulbar sonography to MRI measurement. The measurements were
performed in a group of 65 patients for a wide range of indications, who had adequate
MRI scans of the brain, which included sequences through the orbit. The mean ONSD
values were 5.86 ± 0.66 mm on MRI and 5.86 ± 0.71 mm for transbulbar sonography,
with an assumed mean normal value in the range of 5 mm for children, depending on age.
The study also demonstrated good correlation between between the two modalities ( CCC
= 0.68), dependent on image quality.237
In a later study on 99 normal children, the same author described an overall mean ONSD
of 5.75 ± 0.52 mm on ultrasound and 5.69 ± 0.31 mm on MRI. The most significant
finding of this study is the ONSD value of around 5.7 mm which is substantially larger
than previously reported values in children.34

61
Figure 4.3. Axial T2-weighted MRI showing ONSD measurement
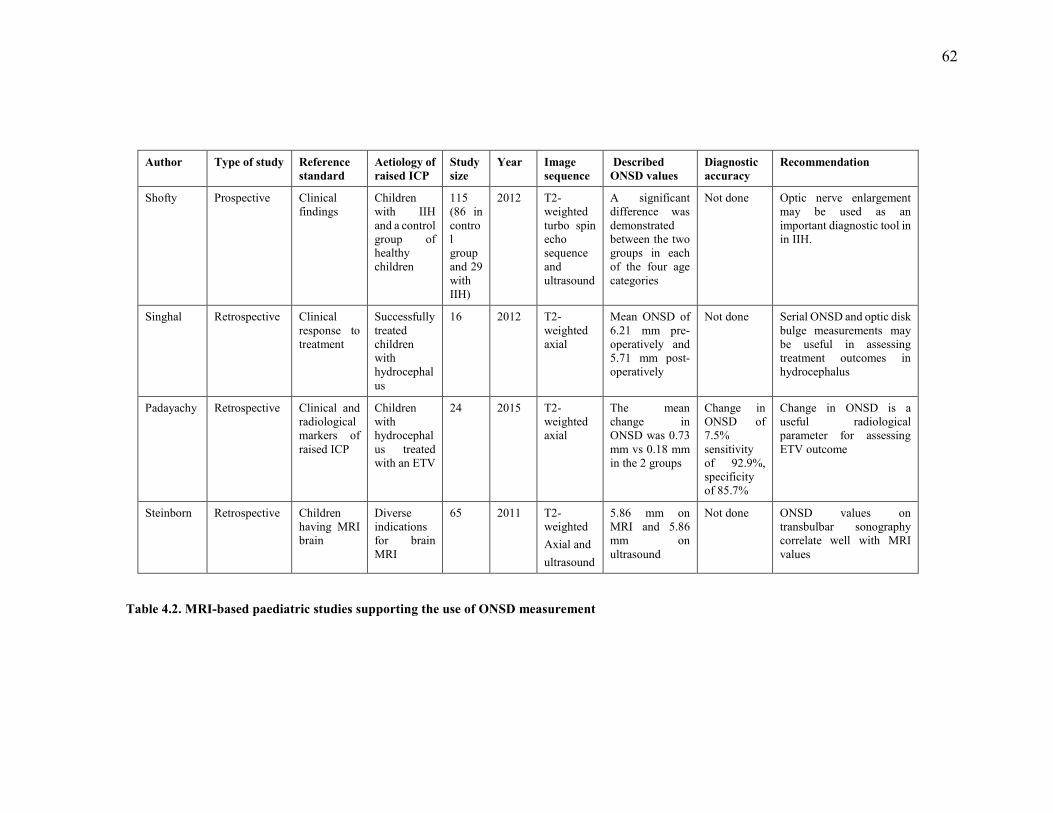
62
Author Type of study Reference standard
Aetiology of raised ICP
Study size
Year Image sequence
Described ONSD values
Diagnostic accuracy
Recommendation
Shofty Prospective Clinical findings
Children with IIH and a control group of healthy children
115 (86 in control group and 29 with IIH)
2012 T2-weighted turbo spin echo sequence and ultrasound
A significant difference was demonstrated between the two groups in each of the four age categories
Not done Optic nerve enlargement may be used as an important diagnostic tool in in IIH.
Singhal Retrospective Clinical response to treatment
Successfully treated children with hydrocephalus
16 2012 T2-weighted axial
Mean ONSD of 6.21 mm pre-operatively and 5.71 mm post-operatively
Not done Serial ONSD and optic disk bulge measurements may be useful in assessing treatment outcomes in hydrocephalus
Padayachy Retrospective Clinical and radiological markers of raised ICP
Children with hydrocephalus treated with an ETV
24 2015 T2-weighted axial
The mean change in ONSD was 0.73 mm vs 0.18 mm in the 2 groups
Change in ONSD of 7.5% sensitivity of 92.9%, specificity of 85.7%
Change in ONSD is a useful radiological parameter for assessing ETV outcome
Steinborn Retrospective Children having MRI brain
Diverse indications for brain MRI
65 2011 T2-weighted Axial and ultrasound
5.86 mm on MRI and 5.86 mm on ultrasound
Not done ONSD values on transbulbar sonography correlate well with MRI values
Table 4.2. MRI-based paediatric studies supporting the use of ONSD measurement

63
4.1.2. Studies not supporting the use of ONSD measurement in children
Several studies examining the value of ONSD measurement in children have found the
technique to be of limited benefit. All of these studies were performed using transorbital
ultrasound.72,241,242
The use of sonographic ONSD measurement was directly compared to fundoscopy in a
study using ONSD measurement performed ‘during the daytime’ in 128 children with
syndromic craniosynostosis. The authors found ONSD measurement less sensitive than
fundoscopy when screening for raised ICP, and contrary to previous studies,30,46 found
that a widened ONSD did not precede papilledema. This study also demostrated no
relationship between increase in ONSD and age. While invasive ICP monitoring was
performed in some patients, no comparison was made between ONSD and direct ICP
measurement. The authors did, however, raise an interesting question regarding the
change in ONSD in chronic or repetitive ICP elevation rather than acutely raised ICP. The
study ultimately found that ONSD measurement was not accurate enough to replace
fundoscopy as a screening tool for increased ICP.241
Perhaps the most convincing work demonstrating a limited value of ONSD measurement
was performed by Le and co-workers, who prospectively investigated 64 children
presenting to the emergency department with suspected raised ICP. 24 (37%) had a
confirmed diagnosis of raised ICP (CT scan criteria/invasive ICP monitoring/LP). The
ONSD cut-off values for normality used in this study were based on recommendations
from earlier studies.23,30,243 The authors tested the sensitivity and specificity of ONSD
values of > 4.5 mm, as well > 5 mm for predicting raised ICP. Using 4.5 mm as a cut-off
point provided a sensitivity of 83%, and specificity of 38%, whereas 5.0 mm as a cut-off
point decreased the sensitivity to 78% and increased the specificity to 68%. The authors
concluded that the use of a mean ONSD measurement was not adequate to guide clinical
decision making in children with suspected raised intracranial pressure.242
In a more recent study aimed at evaluating the role of ONSD measurement as a screening
tool for VPS failure, Hall and co-workers prospectively evaluated 39 children presenting
to the emergency department with a VPS in situ for hydrocephalus. The mean ONSD was

64
4.5 ± 0.9 mm in patients with clinical shunt failure and 5.0 ± 0.6 mm in patients without
clinical shunt failure (p < 0.03). Using historical cut-off figures of > 4.0 mm in children
under 1 year and > 4.5 mm in children over 1 year (30), a low sensitivity and specificity
for predicting VPS dysfunction was demonstrated (61.1% and 22.2% respectively). The
decision regarding VPS failure was based entirely on the neurosurgical decision to
operate. The authors acknowledge that lack of invasive ICP measurement limited the
ability to interpret the accuracy of ONSD measurement.72

65
Author Type of study
Criterion standard
Aetiology of raised ICP
Study size
Year Modality Described ONSD values
Diagnostic accuracy
Recommendation
Driessen Prospective Clinical signs of raised ICP
Syndromic craniosynostosis
128 2011 Ultrasound vs fundoscopy
Not specified Sensitivity-11%; Specificity-97%
ONSD is less sensitive than fundoscopy for screening in raised ICP
Le Prospective Clinical findings and imaging (CT scans) findings suggestive of raised ICP
Mixed 64 2009 Ultrasound Used mean ONSD of 4.5 and 5.0 mm as cut-off points
Using 4.5 mm sensitivity of 83%, and specificity of 38%. Using 5.0 mm sensitivity decrease to 78% and specificity increased to 68%
Sensitivity of 83% (95% CI: 0.6 – 0.94) and specificity of 38% (95% CI: 0.23 – 0.54)
Hall Prospective Clinical presentation in patients with a V/P shunt
Shunted hydrocephalus
39 2013 Ultrasound Mean ONSD value of 4.5 ± 0.9 in patients with shunt failure, and 5.0 ± 0.6 in patients without shunt failure
Sensitivity 61.1% and specificity of 22.2%
Bedside ocular ultrasound measurement is insensitive and nonspecific for identifying potential VPS dysfunction in children presenting to the ED. Multiple operators performed the imaging resulting in a wide range of measurements which may have affected the accuracy of the technique
Table 4.3. Paediatric studies not supporting the use of ONSD measurement

66
4.1.3. Discussion
The diagnostic accuracy of ONSD measurement for detecting raised ICP varies
considerably.31,157,261 In children this issue is further complicated by the description of age
categories defined at 1 and 4 years old to describe different upper ONSD limits.28-31 The
variation in the recommended age categories makes interpretation of the ONSD
measurement in children particularly challenging.
The recommendation of age above and below 1 year as a threshold for defining different
ONSD values for children was supported in the study by Newman,30 however other
authors only describe a significant difference between mean ONSD measurements in the
asymptomatic group.32 The use of ONSD cut-off values of 4.2 mm and 4.5 mm to predict
raised ICP, has also yielded inconsistent findings.32,72,241,242
A review paper described the recommended ONSD upper limit of normal in children as31
:
4 mm for patients ≤ 1 year, 4.5 mm for patients aged between 1 and 4 years, 5 mm for patients > 4 years old
Recent work using a high resolution ultrasound probe describes an ONSD upper limit of
around 5.7 mm in children, substantially greater than previously reported, but doesn’t
mention any specific age-related variation.34
Issues like observer-varliability, different imaging modalities to visualise the ONS and
limited data using invasively measured ICP for comparison, have hampered the
widespread use of this technique as a non-invasive surrogate marker of ICP in children.
The only study in children comparing ONSD to invasively measured ICP did not
recommend any cut-off value for ONSD.236
The positive relationship between ONSD enlargement and increasing ICP in children has
been demonstrated in a number of studies,23,28-30,32,33,50,234,238-240 however the diagnostic
accuracy varies.

67
These studies demonstrate that the relationship between ONSD and ICP in children
certainly warrants further investigation. The current literature also highlights a distinct
paucity of data evaluating this non-invasive technique in children and the need for a
prospective study comparing ONSD measurement to the gold standard of directly
measured ICP.
In an effort to address some of these shortcomings, the working hypothesis of this thesis
was that ONSD measurement had a positive relationship with invasively measured ICP
and the study therefore aimed to address some of the disparity surrounding inter-observer
variability, age-related thresholds in children and limited understanding of the elastic
nature of the ONS.
The following section discusses the available literature evaluating ONSD measurement in
adults.

68
4.2. Adult studies
The volume of adult literature evaluating ONSD measurement as a non-invasive marker
of ICP is significantly larger than in children. The majority of available literature
compares ONSD to clinical or image-based assessment of ICP 21-26,244 however, there are
a number of papers comparing ONSD to directly measured ICP.16-20,73,154,155,245-247 Some
of these studies support the use of ONSD while others have found it of little value. This
section will analyse these studies according to the reference standard and modality used.
These studies will then be discussed together at the end of the chapter.
4.2.1. Support for the use of ONSD as a marker of raised ICP
Several studies evaluating ONSD measurement have demonstrated a significant
relationship between ONSD and ICP. Most of these studies were performed using
ultrasound, but some have used MRI and more recently also CT scans.
4.2.1.1. Ultrasound-based studies
i. Non-invasive ICP assessment (clinical and imaging-based assessment)
The majority of studies evaluating the role of sonographic ONSD measurement were
performed in an emergency department (ED) setting. The reference standard in most of
these studies is clinical assessment or CT-evidence of raised ICP, given the lack of access
to invasive ICP measurement in this environment.
Aiming to evaluate the convenience and utility of optic nerve ultrasound (ONUS) in the
ED, Girisgin and co-workers reported their findings in 28 patients admitted to the
emergency department with evidence of elevated ICP (EICP) on cranial CT scan (CCT).
The findings were compared to 26 healthy volunteers. The mean ONSD measurement in

69
patients with EICP findings on CCT was 6.4 mm (SD 0.7), compared to a mean of 4.6
mm (SD 0.3) in the control group (p < 0.001). The authors did not suggest a cut-off value,
but recommended ONUS as a useful and practical method for evaluation and follow-up
of ICP.22
Several subsequent used an ONSD cut-off of > 5mm to evaluate the accuracy for detecting
suspected raised ICP.
One of the earliest studies evaluating the use of ONSD in a clinical setting in was
performed on 35 adults with suspected raised ICP. The mean ONSD in patients with
evidence of raised ICP on CT scan was 6.27 mm, compared with a mean of 4.42 mm in
patients without evidence of raised ICP. The difference between ONSD measurements in
the two groups was described as 1.85 mm (p = 0.001). Using a previously recommended
ONSD cut-off value > 5.0 mm (248,249,154), the authors demonstrated a sensitivity of
100% and specificity of 95%.243
Using the described ONSD cut-off of 5 mm, Tayal et al. (the same team as the earlier
Blaivas study), performed a prospective blinded observational study in the emergency
department on 59 adult patients with a mean age of 38 years, suspected of having raised
ICP. The mean ONSD in patients with CT evidence of raised ICP was 6.37 mm, and in
the group without evidence of raised ICP, the mean ONSD was 4.94 mm. Using 5 mm as
a cut-off point, the study described a sensitivity of 100%, and specificity of 63% for
predicting raised ICP.23
A comparison of clinical findings, ONUS and CT evidence of raised ICP in100 adults
with head injury, interestingly demonstrated a poor correlation between clinical features
of raised ICP and CT findings suggestive of raised ICP (p = 0.9267). The mean ONSD in
the group with CT evidence of raised ICP was 5.8 ± 0.57 mm, vs 3.5 ± 0.75 mm (p <
0.0001) in the group without evidence of raised ICP on CT. Using a cut-off value for
ONSD of > 5 mm for predicting raised ICP on CT, the study demonstrated good diagnostic
accuracy (sensitivity of 98.6%, specificity of 92.6%).24
Again using CT evidence of raised ICP as the reference standard, Major and co-workers
evaluated 26 adult patients presenting to the ED to determine if ONSD could accurately

70
predict the presence of raised ICP. Using an ONSD value > 0.5 cm, the described
sensitivity was 86% with specificity of 100%.25
The use of ONSD measurement specifically in the hyperacute phase (within 6 hours) to
detect intracranial haemorrhage (ICH), was investigated by Skoloudik and colleagues This
study included 31 patients with ICH, comparing them to 31 control patients. Sonographic
ONSD measurements were performed at 3 and 12 mm behind the globe. Relative ONSD
enlargement of > 0.66 mm (> 21%) demonstrated an accuracy of 90.3% for predicting an
ICH volume > 2.5cm3. The authors then used an ONSD value of > 5mm, demonstrating a
sensitivity of 0.708 (95% CI 0.620 – 0.708), specificity of 1.000 (0.697 – 1.000), positive
predictive value of 1.000 (95% CI 0.875 – 1.000) and a negative predictive value of 0.500
(0.348 – 0.652), concluding that enlargement of the ONSD may be detectable in the
hyperacute stage of increased ICP.(26) The use of ONSD to evaluate the clinical evolution
of ICH beyond the acute stage was also later confirmed.250
Qayyum et al. investigated the value of an ONSD > 5 mm for predicting features of raised
ICP on CT scan in 24 adult patients, demonstrating a sensitivity of 100% and specificity
of 75% for predicting elevated ICP on CCT scan. An interesting observation was the good
quality of images, despite the limited intrinsic ability of the ultrasound machine,
suggesting that a high specification machine / probe was not necessary to perform ONSD
measurement.251
In an ICU-based study on 101 adults (60 with suspected raised ICP and 41 control
patients), a lower optimal ONSD-cut-off value of 4.716 mm was demonstrated. Shirodkar
et al. The mean ONSD in the control group was 4.6 ± 0.09 mm for females and 4.8 ± 0.10
mm for males, vs 5.1 ± 0.62 mm for females and 5.08 ± 0.58 mm for males in the study
group. 35 patients displayed radiological findings consistent with raised ICP, in this
subgroup the mean ONSD was 5.4 mm for females and 5.44 mm for males. Diagnostic
accuracy analysis demonstrated a sensitivity of 77.8% and specificity of 100% for
predicting raised ICP on imaging.244
Bauerle and co-investigators conducted a prospective study in 40 adult volunteers to
establish normal values and to assess the intra- and inter-observer reliability of ONSD

71
measurement. The mean ONSD was 5.4 ± 0.6 mm, with a wide range of normality
between 4.3 – 7.6 mm and no significant difference between the right and left eyes. The
investigators also demonstrated no correlation between ONSD and age, gender or body-
mass-index (BMI), but found that transorbital B-mode ultrasound was a reliable method
for assessing ONSD, highlighting the need for additional studies investigating this
technique.27

72
Author Type of study
Comparison standard
Aetiology of raised ICP
Study size
Year Frequency and type of probe
Described ONSD value
Diagnostic accuracy
Recommendation
Blaivas Prospective CT scan Mixed 35 2002 10 MHz linear array probe
5.0 mm Sensitivity of 100% and specificity of 95%
There is a close correlation between ONSD on ocular ultrasound and evidence of raised ICP on CT scan
Girisgin Prospective CT scan Hetero-geneous population with findings of EICP on cranial CT scan
28 patients with EICP, and 26 control patients
2007 7.5 MHz linear probe
6.4 (0.7) mm in patients with EICP, and 4.6 (0.3) mm in control patients
Not performed ONSD measurement can be used to identify patients at risk for raised ICP, potentially prior to lumbar puncture and CT scan
Tayal Prospective blinded observational
CT scan Mixed 59 2007 7.5 MHz, linear array probe
5.0 mm Sensitivity 100%, specificity 63%
Bedside ONSD measurement using ultrasound is beneficial for detecting raised ICP in the ED
Goel Prospective blinded observational
Clinical findings and CT scan
Head injury 100 2008 7.5 MHz linear array probe
5.0 mm Sensitivity 98.6%, specificity 92.8%, positive predictive value 97.26%, negative predictive value 96.3%
ONUS is potentially useful in head injury patients by avoiding unnecessary CT scans and serial monitoring to detect enlarging hematomas
Major Prospective observational
CT scan Trauma and non-trauma patients
26 2010 7.5 MHz probe
> 5 mm Sensitivity of 86% and specificity of 100% for raised ICP. Sensitivity of 60% and specificity of 100% for detecting any acute intracranial abnormality
ONSD measurement with minimal training is a useful marker of raised ICP on CT scan

73
Table 4.4. Adult studies supporting the use of ONSD measurement (non-invasive ICP measurement)
Author Type of study
Comparison standard
Aetiology of raised ICP
Study size
Year Frequency and type of probe
Described ONSD value
Diagnostic accuracy
Recommendation
Skoloudik Prospective (bi-centre)
CT scan Patients with ICH
31 ICH patients, 31 control patients
2011 10 and 12 MHz linear array probes
Enlargement of the ONSD > 0.66 mm (>21%)demonstrated a 90.3% accuracy for predicting ICH volume > 2.5cm3
Using an ONSD cut-off of > 5mm demonstrated sensitivity of 0.708 and specificity of 1.0 for predicting ICH > 2.5cm3
Sonography of the ONSD may be useful in detecting raised ICP in the hyperacute phase after ICH
Qayyum Prospective diagnostic
CT scan Mixed 24 2013 7.5 MHz linear array probe
> 5.0 mm Sensitivity of 100% and specificity of 75%
Ultrasound measurement of the ONSD is accurate for detecting intracranial hypertension
Shirodkar Prospective observational
CT/MRI scan
Not specified (patients presenting with clinical symptom of raised ICP)
101 (41 control, 60 study patients)
2014 10 MHz linear array probe
4.716 mm Sensitivity of 84.6% in females and 75% in males, specificity of 100% in both genders
Bedside ONSD measurement is a useful test for identifying raised ICP
Bauerle Prospective study
Clinical presentation
Healthy subjects
40 2012 9-3 MHz linear array probe
5.4 ± 0.6 mm as the mean in normal subjects
Nil Transorbital B-mode sonography is a reliable method to assess the ONSD.

74
Summary – Ultrasound-based ONSD measurement (non-invasive ICP measurement)
Most studies comparing ONSD measurement to clinical assessment or CT-based evidence
of raised ICP have used 5.0 mm as a default cut-off value for predicting raised ICP. None
of these studies evaluated an optimal cut-off value within their own environment, but
rather validated pre-existing described values with variable diagnostic accuracy.22-26,243,251
This limitation is described and acknowledged in most of these studies, and is entirely due
to the lack of access to invasive ICP measurement in the ED setting. These studies,
however, are important as they reflect the reality faced in most acute care units. The need
for invasive ICP monitoring, as the ‘gold standard’ against which ONSD measurement
should be validated has been highlighted repeatedly. The literature describing invasive
ICP measurement as the reference standard will be discussed in the following section.
ii. Invasive ICP assessment

75
Early work by Hansen and Helmke50 involved a prospective, in vivo study in twelve adult
patients with clinical suspicion of raised ICP. Patients underwent a lumbar spinal infusion
test, where Ringer’s lactate was delivered into the thecal sac via lumbar. CSF pressure
was transduced via a second spinal needle. Ultrasound evaluation of the ONS was
performed in B-mode at regular intervals of 2 – 4 minutes during these infusion tests.
Changes in the ONSD were clearly demonstrated, with maximum dilation of 0.7 – 3.1 mm
(15 – 89%) from the baseline diameter. ONSD of > 5 mm consistently coincided with CSF
pressures of ≥ 30 mmHg. Testing the correlation between ONSD and CSF pressure
yielded a high correlation coefficient (r > 0.83). The authors made the observation that
changes in ICP would remain undetected by ONSD measurement if the ICP was too low
(average ICP 22 mmHg), attributing this observation to the elastic structure, i.e.
specialized collagen fibril texture, which determines the sheath’s pressure response. Two
very important statements from this seminal paper are that “that elastic structures
determine the sheath’s pressure response” and “At higher CSF pressure levels, the ONS
may lose its ability for further dilation, which corresponds to a depleted capacity for
further expansion.” These observations likely form the fundamental principles of the ONS
response to change in ICP. The pressure threshold for sheath dilation was found to be
above the range of normal ICP (18 – 30 mmHg). The authors conclude that serial ONS
assessment provides a fast, non-invasive estimate of the level of CSF pressure, but cannot
accurately estimate absolute ICP.154
Despite a number of studies using clinical assessment and imaging features as a surrogate
marker of raised ICP against which ONSD measurement was compared,21,23,29,243 it was
almost a decade later that Geeraerts and colleagues16 performed a prospective blinded
observational study comparing ONSD measurements to invasively measured ICP. This
study included 31 adult patients with severe TBI and compared them to 31 control
patients, examining the relationship between ONSD measured on admission to ICU and
raised ICP (> 20 mmHg for 30 minutes) within the first 48 hours after trauma. The mean
ONSD in TBI patients with raised ICP was 6.25 ± 0.5 mm, in TBI patients with normal
ICP was 5.05 ± 0.7 mm, and in control patients was 4.85 ± 0.4 mm (p < 0.0001 vs control
and normal ICP groups). The authors suggest an optimal ONSD cut-off value of 5.9 mm,
with a sensitivity of 87% and a specificity of 94% for predicting raised ICP in the first 48

76
hours.16,17 The same team later published results from a prospective study in 37 adult TBI
patients evaluating the relationship between ultrasound measurement of ONSD and
invasively measured ICP, again demonstrating a strong relationship between mean ONSD
and ICP (r = 0.71) and described a cut-off ONSD value of 5.86 mm (sensitivity of 95%,
specificity of 79%) for predicting raised ICP, concluding that ONSD was a promising
method for estimating ICP and also that changes in ONSD were strongly related to
changes in ICP.17
The concept of combining two non-invasive techniques to assess ICP and potentially
improve their accuracy, was described by Soldatos and co-workers.19 This study
investigated the relationship between ONSD measurement, TCD and invasively measured
ICP in 76 critical care patients. The investigators reported a good correlation between
ONSD measurement, non-invasive (TCD) (r = 0.8, 95% CI: 0.62 – 0.9, p < 0.0001) and
invasive ICP (r = 0.68, 95% CI: 0.43 – 0.83, p = 0.0002) measurement of ICP in severe
TBI, but poor correlation in moderate TBI (r = 0.32, p = 0.11) and in healthy control
individuals (r = 0.29, p = 0.15). The best ONSD cut-off value to predict an elevated ICP
(> 20 mmHg) was 5.7 mm, with a sensitivity of 74.1% and specificity of 100%.19
Also using an ICP threshold of 20 mmHg, Moretti and Pizzi demonstrated that ONSD
measurement may be useful as a screening tool to assess the need for invasive ICP
monitoring, but could not be used for absolute ICP measurement. In this prospective study
including 53 patients with intracerebral haemorrhage (n = 23) and subarachnoid
haemorrhage (n = 30), as well as 53 control patients, the group with ICP > 20mmHg
demonstrated a mean ONSD of 6.2 ± 0.6 mm compared with 5.0 ± 0.5 mm in the low ICP
group ( p < 0.01). The mean ONSD in the control group was 4.9 ± 0.4 mm. Correlation
between ONSD and ICP at admission was significant (r = 0.69, p < 0.01). The optimal
ONSD cut-off point for detecting an ICP > 20 mmHg, was 5.2 mm with a sensitivity of
94% (95% CI: 88 – 100), specificity of 76% (95% CI: 65 – 87).20
Rajajee et al. performed a prospective blinded observational study on 65 patients in the
ICU. All patients in the study had either had an EVD or intraparenchymal ICP monitor in
situ. The authors used individual as well as mean ONSD values to account for possible
fluctuation in the ICP during ONSD measurement. For the individual ONSD

77
measurements the median was 0.53 cm for ICP > 20 mmHg, and 0.4 cm for ICP < 20
mmHg (p < 0.0001). An ONSD of 0.48 cm demonstrated a sensitivity of 96% and
specificity of 94% for predicting ICP > 20 mmHg. The authors suggested that the optimal
criteria for ONSD measurement should be validated internally.18 The same author later
published a retrospective review of this data, aiming to assess the accuracy of ONSD
measurement in patients with acutely fluctuating ICP. 73 patients were included in the
review. ‘Acutely fluctuating ICP’ was defined as measurements above and below 20
mmHg during the same ONSD measurement cluster or a change in ICP of > 10 mmHg,
demonstrating that the specificity and positive predictive value of ONSD measurement
declined when ICP fluctuated acutely, suggesting this may be due to a delay in reversal of
the nerve sheath distension.51
In another study also based in the neurocritical care unit, Frumin and co-workers
investigated 27 patients with invasively measured ICP. The optimal ONSD for predicting
raised ICP (> 20 mmHg) in this study was 5.2 mm, with a sensitivity of 83.3% (95% CI
= 35.9 – 99.6%), specificity of 100% (95% CI = 83.9 – 100%), positive predictive value
(PPV) of 100% (95% CI = 48 – 100%) and negative predictive value (NPV) of 95.5%
(95% CI = 77.2 – 99.9%).246
Despite not providing diagnostic accuracy analysis, the study by Cammarata and
colleagues which compared ONSD measurement in 11 TBI patients in the ICU with 10
non-trauma ICU patients, demonstrating a significant difference between the two. The
ONSD in control patients was 5.51 ± 0.32 mm, 5.52 ± 0.36 mm in head trauma patients
with normal ICP (< 20 mmHg) and 7.0 ± 0.58 mm in head trauma patients with raised ICP
(> 20 mmHg).245
Using an ICP threshold of 20 cmH20, Kimberly and co-workers conducted a prospectively
studied 15 adult patients. The authors performed 38 ocular ultrasound examinations,
demonstrating a mean ONSD of 5.4 ± 0.49 mm in the group with ICP >20 cmH20, and
4.4 ± 0.49 mm in the group with ICP < 20 cm H20, with a mean difference between the
two groups of 1.2 mm. The study also supported an optimal cut-off value for ONSD > 5.0
mm, which yielded a sensitivity of 88% and a specificity of 93% for detecting raised ICP.73
78
Also using an ICP threshold of 20 cm H20 measured during LP, Amini and colleagues
reported an ONSD > 5 mm demonstrating a sensitivity and specificity of 100% for
predicting ICP ≥ 20 cm H20. In this study of 50 non-traumatised patients, 36 patients had
a normal ICP and 14 had increased ICP.247
A blinded cross-sectional study conducted only in Chinese patients also used a lumbar
CSF opening pressure of 20 cm H20. The study conducted by Wang et al included 279
subjects and sought to identify potential factors influencing the relationship between
ONSD and ICP. A much lower ONSD cut-off point of 4.1 mm, with a sensitivity of 95%
and a specificity of 92% was reported in this study. The authors described a number of
possibilities for the discrepancy between their findings and previous reports,
acknowledging that little was known about the factors influencing the relationship
between ICP and ONSD, ascribing the inconsistency of their lower ONSD values to
differences in ethnicity and severity of illness.155

79
Author Type of study
Aetiology of raised ICP
Study size
Year Frequency and type of probe
ICP threshold
Described ONSD value
Diagnostic accuracy
Recommendation
Hansen Prospective Patients undergoing neurological testing
12 1997 7.5 Mhz probe
Nil Nil ONS distension occurs within a limited CSF pressure interval. A threshold of 22mmHg needs to be exceeded for an increase in ONSD to be detected. The lumbar infusion test performed would not be reproducible in most other centres
Geeraerts (2007)
Prospective blinded observational
TBI 31 TBI patients, 31 control patients
2007 7.5MHz linear probe
20 mmHg 5.9 mm Sensitivity of 87%, and specificity of 94%
ONSD measurement in the early posttraumatic period predicts raised ICP in the 48 hours following TBI
Geeraerts (2008)
Prospective TBI 37 2008 7.5 MHz linear array
20 mmHg 5.86 mm Sensitivity of 95%, specificity of 79% for predicting ICP > 20 mmHg
ONSD measurement in sedated neurocritical care patients is a promising method for predicting raised ICP
Soldatos Prospective TBI 76 (50 TBI and 20 control patients)
2008 9 MHz linear array
20 mmHg 5.7 mm Sensitivity 74.1%, specificity 100%
ONSD measurement correlates well with non-invasive (TCD) and invasive ICP measurement in TBI
Moretti Prospective blinded observational
Spontaneous ICH
53 patients with intracranial pathology, 53 control patients
2009 7.5MHz linear array probe
20 mmHg 5.2 mm predictive of ICP > 20 mmHg
Sensitivity of 94%, specificity of 76%
Ultrasound measurement of the ONSD is a useful in the early diagnostic evaluation of patients with ICH

80
Author Type of study
Aetiology of raised ICP
Study size
Year Frequency and type of probe
ICP threshold
DescribedONSD value
Diagnostic accuracy
Recommendation
Rajajee Prospective blinded observational
Mixed 65 2011 13-6 MHz, linear array rpobe
20 mmHg 4.8 mm Sensitivity of 96%, specificity of 94%
ONSD measurement is an accurate, non-invasive technique for detecting raised ICP in a neurocritical care setting, performed by an experienced operator
Cammarata
Unclear TBI 11 head injured patients (10 control patients)
2011 10 MHz linear array probe
20 mmHg With ICP > 20mmHg, ONSD ± 7mm, with ICP < 20 mmHg, ONSD ± 5.5 mm
Not done Ocular ultrasound is a good alternative for rapid indirect evaluation of ICP in head trauma patients
Frumin Prospective blinded observational
Mixed 27 2014 5 -10 MHz linear array probe
20 mmHg 5.2 mm Sensitivity of 83.3%, specificity of 100%, positive predictive value of 100%, negative predictive value of 95.5%
Bedside ultrasound is useful for early diagnosis of raised ICP in the emergency department
Kimberly
Prospective blinded observational
TBI and ICH
15 2008 10MHz linear probe
20 cm H20 ONSD > 5.0 mm
Sensitivity of 88%, specificity of 93%
Bedside measurement of ONSD correlates well with invasively measured ICP. Small patient sample. Using a ICP cut-off of 20cm H20, makes comparison slightly difficult
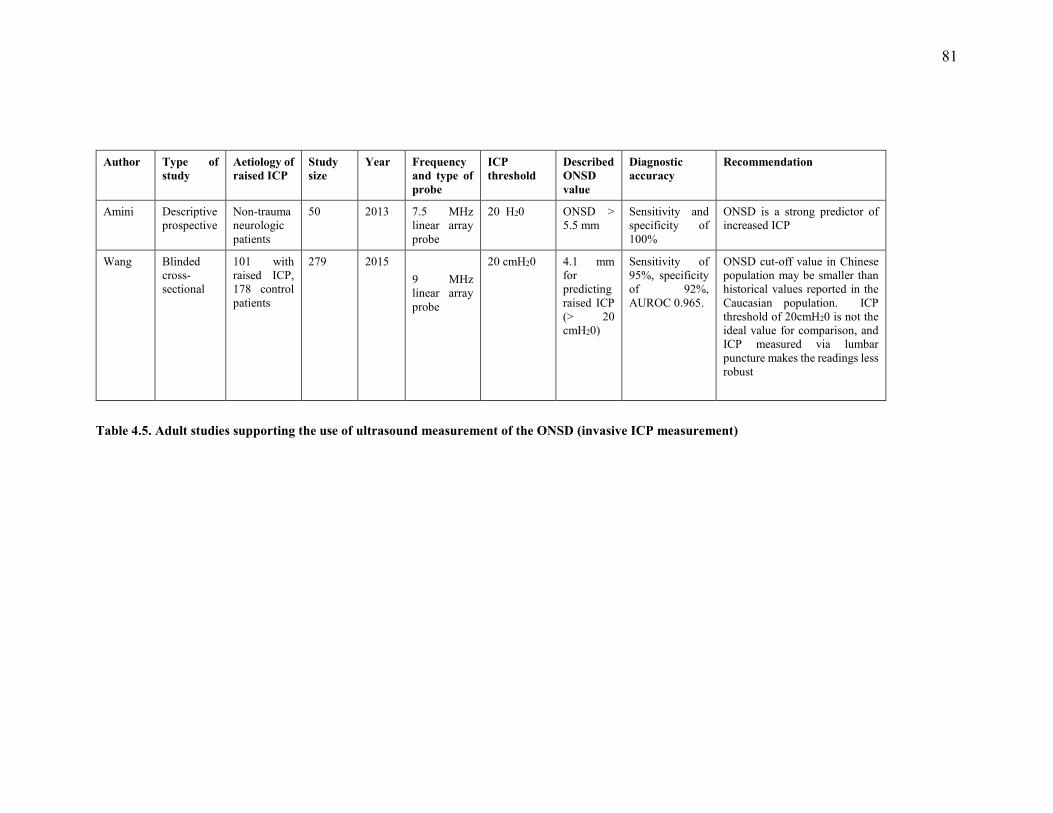
81
Table 4.5. Adult studies supporting the use of ultrasound measurement of the ONSD (invasive ICP measurement)
Author Type of study
Aetiology of raised ICP
Study size
Year Frequency and type of probe
ICP threshold
Described ONSD value
Diagnostic accuracy
Recommendation
Amini Descriptive prospective
Non-trauma neurologic patients
50 2013 7.5 MHz linear array probe
20 H20 ONSD > 5.5 mm
Sensitivity and specificity of 100%
ONSD is a strong predictor of increased ICP
Wang Blinded cross-sectional
101 with raised ICP, 178 control patients
279 2015 9 MHz linear array probe
20 cmH20 4.1 mm for predicting raised ICP (> 20 cmH20)
Sensitivity of 95%, specificity of 92%, AUROC 0.965.
ONSD cut-off value in Chinese population may be smaller than historical values reported in the Caucasian population. ICP threshold of 20cmH20 is not the ideal value for comparison, and ICP measured via lumbar puncture makes the readings less robust

82
Summary – Ultrasound based measurement of the ONSD (invasive ICP measurement)
These studies all support a significant relationship between ONSD and increasing ICP.
The reported ONSD cut-off values however, range from 4.1-5.9 mm.16-20,73,154,155,245-247
The variable diagnostic accuracy reflects the discrepancy regarding optimal ONSD cut-
off values to detect raised ICP. Studies using an ICP threshold of 20 mmHg, describe
ONSD cut-off values between 4.8 and 5.9 mm and three studies using 20 cmH20 as the
ICP threshold, describe ONSD cut-off values between 4.1 and 5.5 mm. These findings
underscore the fact that using different ICP thresholds in these studies may influence the
variability of described ONSD cut-off values, but it certainly isn’t the only factor. The
variation in individual baseline measurements and the difficulty in estimating the
distensibility of the ONS are perhaps the the two most significant factors responsible for
the poor specificity of this technique.252 The effect of treatment modalities, sedation,
physiological parameters that influence ICP and site of measurement (some studies use
LP opening pressures) likely also have some effect on the relationship between ONSD
and ICP. The imaging modality used for ONSD measurement has been described as a
significant factor. MRI and CT-based studies will therefore be discussed separately in the
following sections.

83
4.2.1.2. MRI-based studies
MRI provides exquisite detail and multiplanar imaging of the ONS, but unfortunately
limits simultaneous measurement of ICP. Relatively limited access to MRI and the
necessity for patient transfer to specialised MRI suites are the major limitations with this
modality.
Using MRI measurements acquired before and after drainage of subdural collections,
Watanabe et al studied 12 adult patients who underwent bur-hole drainage of subdural
collections. A high ICP in this group was defined as > 20 cmH20. Coronal fat saturated
T2-weighted, fast spin echo sequences of the orbit were performed, demonstrating a mean
ONSD before surgery of 6.1 ± 0.7 mm, and after surgery of 4.8 ± 0.9 mm (p = 0.003). An
acknowledged limitation of the study was the use of subdural pressure measurement,
which may not be representative of ventricular pressure, due to resistance from
membranes within the subdural space. The authors proposed an ONSD measurement of
5.8 mm taken just behind the globe as the upper limit of normal, suggesting that a value
of 6.0 mm would be indicative of raised ICP in this population.253
The study by Geeraerts et al. described ONSD measurements which were strikingly
similar to previous reports from the same group, using ultrasound to measure the ONSD.
This retrospective analysis on 38 adult patients with severe TBI, reviewed T2-weighted
turbo spin-echo, fat-suppressed images acquired on a 3 Tesla MRI scanner, and compared
the results with 36 healthy volunteers. Both the ONSD and optic nerve diameter (OND)
were measured and correlated with ICP, using a threshold of 20 mmHg for raised ICP.
The mean ONSD in TBI patients with raised ICP was 6.31 ± 0.5 mm, in TBI patients with
ICP < 20 mmHg was 5.29 ± 0.48 mm, and in healthy volunteers ONSD was 5.08 ± 0.52
mm. The inter-observer variability was 0.11 mm, which is lower that reported in
ultrasound-based studies than. The authors suggested an optimal ONSD cut-off of 5.82
mm, with a sensitivity of 90% and specificity of 92% for predicting raised ICP.151
In a unique study, Xie et al. attempted to predict lumbar CSF pressure using a formula
which includes orbital subarachnoid space width (OSASW), BMI and mean arterial blood

84
pressure (MABP). This was a prospective observational, comparative study on 72 patients
with neurological disease requiring a lumbar puncture, aiming to evaluate the OSASW as
a surrogate marker for ICP and develop an MRI-based method for assessing CSF-pressure.
The MRI sequences in this study were performed on a 3-Tesla machine in an oblique
coronal plane, perpendicular to the optic nerve, with measurements performed at distances
of 3, 9 and 15 mm posterior to the globe. MR imaging was performed 24 – 48 hours prior
to the lumbar puncture being performed. The authors also performed a bi-spectral OCT
analysis of retinal nerve fibre thickness and measured intraocular pressure (IOP) as other
non-invasive markers of ICP. The ICP measurements in this cohort ranged from 3.7
mmHg to 26.5 mmHg (increased ICP defined as > 20 mmHg). The authors performed a
four-step analysis of the data to identify and control for potential confounding factors, i.e.
body-mass-index (BMI) and mean arterial blood pressure (MABP), to best describe the
relationship between the OSASW and ICP. Applying the described analytic models to the
data, the authors derived formulas for assessing ICP, based on OSASW, BMI and MABP.
These formulas were applied to a subset of 30 test group patients and found to be
‘relatively precise’ in assessing ICP, concluding that MRI-assisted OSASW measurement
could be a helpful non-invasive tool in ICP measurement.254
In a study examining astronauts after exposure to microgravity during a space mission,
Kramer and colleagues retrospectively analysed images from 8 astronauts, acquired using
a 3-Tesla MRI scanner. Aiming to demonstrate the spectrum of intraorbital and
intracranial findings following such a mission, the authors analysed a number of
parameters, similar to those observed in idiopathic intracranial hypertension (IIH)
including: OND, posterior flattening of the globe, optic nerve protrusion, kinking of the
optic nerve sheath, central T2 hyperintensity of the optic nerve and concavity of the
pituitary dome. The mean ONSD measured at 4 mm behind the sclera was 6.2 mm ± 1.1
(range 4.7 – 10.8), and the mean OND was 3.0 mm ± 0.5 (range 2.4 – 4.5) The measured
ONSD values in this study were considerably larger than other reported MRI
measurements.151 The retrolaminar OND and ONSD appeared larger in cases where there
was associated optic nerve kinking and central T2 hyperintensity of the optic nerve. The
abnormal findings of the OND and ONSD in this group certainly highlight their value as
radiological markers of raised ICP.255
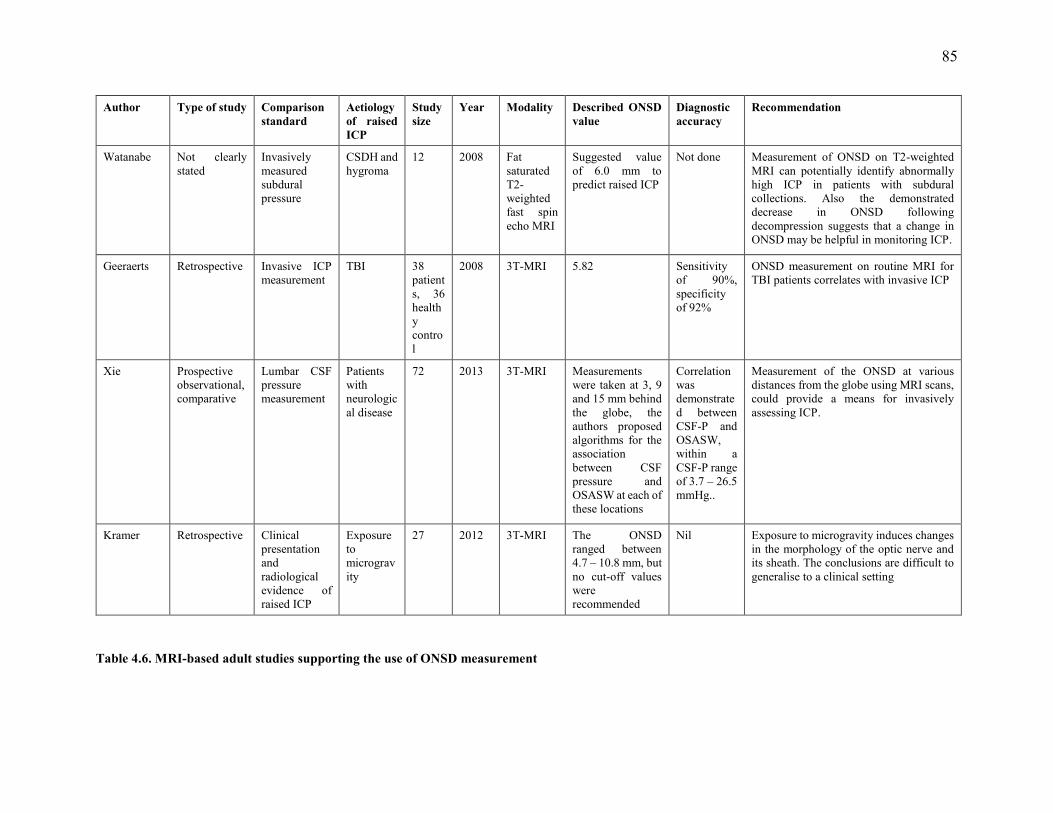
85
Table 4.6. MRI-based adult studies supporting the use of ONSD measurement
Author Type of study Comparison standard
Aetiology of raised ICP
Study size
Year Modality Described ONSD value
Diagnostic accuracy
Recommendation
Watanabe Not clearly stated
Invasively measured subdural pressure
CSDH and hygroma
12 2008 Fat saturated T2-weighted fast spin echo MRI
Suggested value of 6.0 mm to predict raised ICP
Not done Measurement of ONSD on T2-weighted MRI can potentially identify abnormally high ICP in patients with subdural collections. Also the demonstrated decrease in ONSD following decompression suggests that a change in ONSD may be helpful in monitoring ICP.
Geeraerts Retrospective Invasive ICP measurement
TBI 38 patients, 36 healthy control
2008 3T-MRI 5.82 Sensitivity of 90%, specificity of 92%
ONSD measurement on routine MRI for TBI patients correlates with invasive ICP
Xie Prospective observational, comparative
Lumbar CSF pressure measurement
Patients with neurological disease
72 2013 3T-MRI Measurements were taken at 3, 9 and 15 mm behind the globe, the authors proposed algorithms for the association between CSF pressure and OSASW at each of these locations
Correlation was demonstrated between CSF-P and OSASW, within a CSF-P range of 3.7 – 26.5 mmHg..
Measurement of the ONSD at various distances from the globe using MRI scans, could provide a means for invasively assessing ICP.
Kramer Retrospective Clinical presentation and radiological evidence of raised ICP
Exposure to microgravity
27 2012 3T-MRI The ONSD ranged between 4.7 – 10.8 mm, but no cut-off values were recommended
Nil Exposure to microgravity induces changes in the morphology of the optic nerve and its sheath. The conclusions are difficult to generalise to a clinical setting

86
Summary - MRI-based studies
The number of MRI studies are quite limited and the described ONSD cut-off value in
these studies are 5.8 and 5.82 mm, to detect ICP above 20 cmH20 and 20 mmHg,
respectively. Kramer,255 however described a range of values between 4.7 and 10.8 mm,
which are substantially larger than any other reported ONSD values. The values described
in the other three studies, however, fall within the range described in previous ultrasound-
based reports of 4.1 – 5.9 mm.16-20,73,154,155,245-247 Three of the four studies were performed
using a 3 Telsa Machine, which raises the question of whether images on 1.5 Tesla
machine are sufficient, however reports in children 238-240 and the study by Watanabe,253
suggests that these images are adequate. The general agreement is that MRI-derived
measurement has lower inter-observer variability and provides better detail of the
structures within the ONS complex.
87
4.2.1.3. CT-based studies
More recently there has been an interest in CT-based measurement of the ONSD. This is
especially interesting, as CT scans are widely used as an early imaging modality in the
acute care setting, to detect features of raised ICP.
The first study to investigate ONSD measurement on the initial CT scan and outcome
from severe TBI was prospective study involving 77 TBI patients admitted to the
neurosurgical ICU. ONSD measured on initial CT scan correlated well with survival and
Glasgow outcome score (GOS) at 6 months (p = 0.03). The mean ONSD in the non-
survivor group was 7.8 ± 0.1 mm versus 6.8 ± 0.1 mm in the survivor group. The optimal
ONSD cut-off value was > 7.3 mm, with a sensitivity of 86.4% and a specificity of 74.6%
for predicting mortality.256
In large, prospective cohort study involving 400 adults with healthy eyes and optic nerves,
Vaiman and colleagues investigated the correlation between ONSD, the eyeball and the
optic canal. The study demonstrated that the ONSD varied between 3.65 mm and 5.17
mm at different locations within the orbit (3 mm and 10 mm behind the globe
respectively), and suggested that measurement at a distance of 10mm, rather than 3mm
posterior to the globe was more suitable, largely due to changes in the ONSD caused by
eyeball movements.50 Use of the ONSD/ETD (Eyeball Transverse Diameter) index, with
a normal described value of 0.19, is suggested as a means of improving the precision of
this technique.257
Aiming to determine whether ONSD measured on intial CT scan could predict
neurological outcome, Kim et al performed a retrospective analysis of 98 comatose
cardiac arrest patients. The study used the cerebral performance category [CPC] scale to
measure neurological outcome in post-cardiac arrest patients. The additional predictive
feature assessed on brain CT scan was the grey matter-to-white matter ratio (GWR). The
intra- and inter-rater correlation for ONSD measured on CT scan was 0.888 and 0.833
respectively. The mean ONSD was 5.57 ± 0.30 mm in the good CPC group and 6.29 ±
0.46 mm in the poor CPC group (p < 0.001). A cut-off value of 5.87 mm for ONSD, 1.21

88
for GWR and 3 for Glasgow Coma Scale (GCS) most accurately predicted poor
neurological outcome. The authors then adjusted these to gain a specificity of 100%,
resulting in ONSD of 6.21 mm (sensitivity of 55.9%, 95% CI: 43.3 – 67.9%) and GWR
of 1.23 mm (sensitivity of 83.8%, 95% CI: 72.9 – 91.6%). The authors concluded that
ONSD measured on initial brain CT scan acquired within 24 hours of return of
spontaneous circulation following a cardiac arrest, was associated with neurologic
outcome, and combining ONSD and GWR potentially improved prognostic performance,
compared to either variable used alone.258
Use of a portable bedside CT scan was investigated by Sekhon et al. in a retrospective
study of 57 adult patients aimed at assessing the relationship between ONSD measurement
and ICP. All patients in the study had invasive ICP monitoring. The mean ONSD
measurement was 6.7 mm (SD 0.75) and the mean ICP during CT was 21.3 mmHg (SD
8.4). The correlation between ONSD and ICP was significant (r = 0.74 p < 0.001). Using
an ONSD cut-off value of 6.0 mm for predicting ICP > 20 mmHg demonstrated a
sensitivity of 97%, specificity of 42%, positive predictive value of 67% and a negative
predictive value of 92%. The authors performed a simple (model A) and multivariable
linear regression models (models B and C). Model A demonstrated an R2 value of 0.56,
model B (comparing CT predictors of raised ICP to invasive ICP readings) demonstrated
an R2 of 0.21, while model C (addition of ONSD to CT predictors of ICP) improved the
R2 value to 0.60. The ONSD measurements also demonstrated excellent agreement
between raters of 0.89 (95% CI: 0.83 – 0.93) and between the right and left sides of 0.96
(95% CI: 0.93 – 0.98). The authors concluded that ONSD measured on non-contrast,
portable CT scan demonstrated a strong association with invasively measured ICP, was
highly discriminatory of ICP > 20 mmHg, and demonstrated superior predictive value for
increased ICP when compared to classical CT findings associated with raised ICP.153 The
same author later published a separate retrospective study on 220 patients, involving 2
centres, aimed at evaluating the relationship between ONSD measured on CT scan and
mortality in patients with severe TBI. In a univariate analysis, a 1mm increase in ONSD
demonstrated a twofold increase in odds of hospital mortality (OR 2.1, 95% CI: 1.4 – 3.2,
p < 0.001). With multivariable adjustment, the relationship persisted (OR 2.0, 95% CI:
1.2 – 3.2, p = 0,007). Linear regression indicated that ONSD was associated with increased

89
ICP (> 20 mmHg) in the first 48 hours, with and without multivariable adjustment. The
authors determined that estimation of increased ONSD on initial CT scan in patients with
severe TBI was associated with mortality, and also demonstrated a linear relationship with
invasively measured ICP.259
Figure 4.4. Axial CT scan demonstrating the ONS

90
Table 4.7. CT-based adult studies supporting the use of ONSD measurement
Author Type of study Comparison Standard
Aetiology of raised ICP
Study size
Year Modality Described ONSD value Diagnostic accuracy Recommendation
Legrand Prospective observational
Clinical outcome (ICU mortality)
TBI 77 2013 CT scan (initial)
> 7.3 mm Sensitivity 86.4% and specificity 74.6% for predicting ICU mortality
ONSD measurement on initial CT scan correlates well with mortality in ICU after severe TBI
Vaiman Prospective cohort
Nil (normative data)
Normal subjects
400 2014 CT scan ONSD varies between 3.65 and 5.17mm at different locations in the orbit (3 and 10 mm behind the globe
Not done Calculating the ONSD/ETD index is more precise the ONSD measurement alone and measurement at 10 mm behind the globe is most stable
Kim Retrospective Clinical outcome (Post-cardiac arrest neurologic outcome)
Comatose patients who had a cardiac arrest
98 2014 CT scan (initial)
ONSD 5.87 mm accurately predicted poor neurological outcome. The prognostic performance was increased when combined with GWR (1.23)
Not done Combining ONSD and GWR measured on initial CT scan could provide prognostic information in cardiac arrest patients
Sekhon, Griesdale
Retrospective Invasive ICP monitoring
TBI with raised ICP
57 2014 CT scan (portable)
ONSD > 6 mm was tested to predict ICP > 20 mmHg
Sensitivity of 97%, specificity of 42%, PPV of 67%, NPV of 92%, AUROC of 0.83
ONSD measured on non-contrast portable CT scan was highly predictive of ICP > 20 mmHg, superior to classical CT findings
Sekhon, McBeth
Retrospective Invasive ICP monitoring, clinical outcome
TBI 220 2014 CT scan (porta-ble)
Nil Nil A 1mm increase in ONSD demonstrates twofold increase in odds of hospital mortality.

91
Summary – CT based studies
Measurement of the ONSD on CT scan seems like a sensible approach, given the
widespread used of CT as an early diagnostic modality in patients with raised ICP. The
values described in the studies above range from 5.87 – 7.3 mm, when used to predict
mortality from TBI and ICP above 20 mmHg. The study by Sekhon and colleague 242
demonstrated that measurement of ONSD on bedside portable CT scan is a better predictor
of raised ICP than classical CT findings associated with raised ICP. Definition of the ONS
on CT scan is dependent on the imaging window used and not alwys as clear as the
appearance on MRI, this may influence the inter-observer variability
92
4.2.2. Studies not supporting the use of ONSD measurement
Blehar and co-investigators set out to compare visual with coronal axis measurements in
27 healthy volunteers. The mean ONSD in the coronal view was 3.4 mm, which did not
correlate (R: 0.51 – 0.69) with axial view measurements taken at various distances
posterior to the globe (2, 3, 6, 9, 12 and 15 mm). The persistently larger axial view
measurement was thought to be due to artefactual shadowing, which in the opinion of the
authors was a likely explanation for the discrepancy in ONSD values described in the
literature.260
Assessing both unilateral and bilateral injuries, Strumwasser and co-workers investigated
the accuracy of ONSD for detecting elevated ICP. This was prospective blinded study on
10 trauma patients requiring ICP monitoring. Using data obtained from performing 114
ONSD measurements, the authors demonstrated poor correlation of ONSD measurement
with unilateral (R2 = 0.45, p < 0.01) and bilateral head injury (R2 = 0.21, p = 0.01). No
significant difference in ONSD measurement was found pre- and post-ICP monitor
insertion (p = 0.3). Despite a very small number of patients in the study, the authors
concluded quite firmly that measurement of ONSD was not reliable enough as a basis for
clinical decision-making regarding ICP assessment, and suggested the technique be used
with caution.261
Keyes and colleagues conducted a study on 57 adult volunteers to evaluate the relationship
between increased ONSD and acute mountain sickness (AMS) related to rapid ascent. The
authors found an increased ONSD at high altitude in subjects with AMS, but demonstrated
no clear correlation between the variables they examined, i.e AMS symptoms, oxygen
saturation, clinical response to oxygen and dexamethasone Lake Louise Score (LLS). The
mean ONSD values of 0.4 cm in all subjects at baseline and 0.43cm in subjects with AMS
symptoms 18 hours after ascent to 4300 m, while significantly different, are both relatively
small measurements when compared to ONSD measurements described in other
studies.17,18,19,20,24,253 The authors acknowledged this discrepancy and attributed this to
differences in ascent profile and the scanning technique used in their study. They

93
concluded that raised ICP might not play a role in mild to moderate AMS, and that optic
nerve sheath measurement with ultrasound might not be an adequate tool to investigate
this issue.262
Caffery and colleagues performed a prospective observational trial involving 51 adult
patients presenting to the emergency department, who underwent an LP. In all cases the
underlying aetiology was non-traumatic. Raised ICP was defined as an opening pressure
on LP of ≥ 20 cmH20, and an ONSD cut-off value of ≥ 5 mm was defined as abnormal.
24 (47%) of patients had opening pressures greater than 20 cmH20. There was a correlation
between mean ONSD and opening CSF pressure (r = 0.53). The cut-off value of ≥ 5 mm
yielded a sensitivity of 0.75 (0.53 – 0.9) and a specificity of 0.44 (0.25 – 0.65). The best
cut-off value found by the authors was 5.5 mm, with a sensitivity of 0.58 (0.37 – 0.78)
and specificity of 0.74 (0.54 – 0.89). The authors found that the cut-off value of ≥ 5 mm
resulted in misidentification of 25% of patients with elevated ICP, and therefore
questioned the utility of ONSD measurement in non-traumatic patients with suspected
raised ICP.263

94
Summary - adult studies not supporting the use of ONSD measurement
The use of ONSD measurement as a non-invasive technique to predict raised ICP has
also demonstrated limited diagnostic accuracy, using values > 5 mm to detect raised
ICP resulted in misidentification of 25% of patients.(263) The issues involving
measurement in a single plane, user variability and diagnostic modality all contribute
to the inconsistency in reported diagnostic accuracy.72,193,241,242,260,261,263 The poor
specificity of ONSD measurement may also make it less accurate than other non-
invasive techniques.193
95
4.2.3. Discussion
The majority of available literature evaluating the use of ONSD measurement in adults
are from studies performed in the ED or ICU, using transorbital ultrasound. As a result,
the reference standard against which ONSD was measured in these studies was often
clinical or radiological evidence of raised ICP. The most commonly used ONSD cut-
off value was > 5mm.21-26,251,244 Not surprisingly this value is different in studies
comparing ONSD to invasive measurement of CSF pressure, with a range of 4.1 -5.9
mm.17,18,19,20,73,155,246,247 The difficulty in describing a universally acceptable reference
range is largely due to variation in the definition of raised ICP, inter-observer
variability, patient heterogeneity and a limited understanding of the elastic
characteristics of the ONS. The use of MRI and CT imaging of the ONSD also further
dilutes the value of this technique. Despite clear description of a strong relationship
between ONSD and increasing ICP, the optimism surrounding this technique is blurred
by the lack of consensus regarding optimal cut-off values. A pooled diagnostic odds
ratio (OR) of 51 (95% CI: 22-121) for detecting raised ICP was described in a meta
analyses, favouring the diagnostic accuracy of ONSD measurement.157 The best ONSD
cut-off values for predicting raised ICP ranged between 5 - 5.9 mm with a diagnostic
OR of 25.68 (95% CI: 14.405 – 45.571) in a review by Moretti and Pizzi,31 which also
described the upper ONSD limit in children as: 4 mm for patients aged < 1 year, 4.5
mm for patients aged between 1 and 4 years old and 5 mm for patients aged > years.
A research group was recently formed to establish an individual patient-level database
and possibly define standardised ONSD cut-off values. This study group however
excludes patients under the age of 18 years, but the results of this effort will be eagerly
awaited.264 The specific limitations of ONSD measurement have been highlighted in
a number of studies which have found the technique inadequate for detecting raised
ICP.263, 260, 261,193,242,72,241 There are however no descriptions of any complications
related directly to the use of transorbital sonographic measurement of the ONSD.31
The lack of adequate specificity implies that a widened ONS may be present despite
the absence of raised ICP, which is perhaps best explained in the work by Hansen and
Helmke,154,252 describing the importance of the elastic characteristics or stiffness of the
ONS as a factor determining the distensibility of the ONS. Improved understanding of

96
the elastic character of the ONS would certainly help with our interpretation of ONSD
measurement and could help to differentiate a widened ONS due to individual baseline
variation from one caused by raised ICP. The description of ‘hysteresis’ of the ONS
by the same authors,252 further complicates our understanding of the ONS response,
but raises very important issues fundamental to improving our understanding of this
technique. An analysis of the dynamic response of the ONS would be helpful in
deciphering the elastic nature of the ONS.
The current literature highlights the need for a prospective study comparing ONSD to
invasively measured ICP, defined according to an accepted treatment threshold. The
ONSD study group is a promising initiative aiming to answer some of these questions
in adults.264 Unfortunately patients under the age of 18 years are excluded from this
study.

97
SECTION B
Chapter 5.
The relationship between optic nerve sheath diameter
(ONSD) measurement and invasively measured intracranial
pressure (ICP) in children: Methodology
5.1. Introduction
As discussed in the preceding chapter, the need for a reliable, non-invasive technique
to assess ICP in children is fundamental.
The working hypothesis for this study was that ONSD measurement was a good
surrogate marker of increasing ICP. ONSD was compared to the criterion standard of
invasive ICP measurement in a large cohort of paediatric patients undergoing a
neurosurgical procedure. Relevant physiological and demographic variables were
analysed to best describe the the relationship between ONSD and ICP. Recommended
age-related ONSD cut-off values that best predicted raised ICP28,29,30,32 were examined
by selecting a range of ICP thresholds and analysing the relationship between ICP and
ONSD at these thresholds.
98
5.2. Aims of the study
Primary aim:
To describe the relationship between ONSD and directly measured ICP in children
Secondary aims:
To identify and analyse confounding variables which may influence this relationship;
To examine the correlation between individual repeat measurements acquired in the same plane of the same eye as an assessment of repeatability of the technique;
To examine the correlation between mean ONSD measurements by the same observer at different timepoints as a marker of intra-observer variability;
To examine the inter-observer variability;
To examine correlation between the mean values in the sagittal and axial plane;
To examine correlation between the mean values acquired in each eye;
To determine the diagnostic accuracy of ONSD for detecting ICP above and below 20 mmHg (using 20 mmHg as a recommended treatment threshold), across the entire cohort of patients;
To examine the relationship between ONSD and ICP across the entire cohort of patients, at various ICP thresholds: 20 mmHg; 15 mmHg; 10 mmHg; 5 mmHg
To examine described age-related cut-off values for ONSD 28-30,32 :
≤ 1 year old; > 1 year old; Children between 1 and 4 years old and those above 4 years old
To examine the use of patency of the AF as a reliable clinical marker for
defining different ONSD cut-off values in children. 5.3. Methods

99
Study design: This study was a prospective, observational analysis of a paediatric
cohort of patients who had direct measurement of ICP and concurrent ultrasound
measurement of the ONSD.
Reporting of data in this study was in accordance with the ‘strengthening the reporting
of observational studies in epidemiology’ (STROBE) guidelines.265,266 (included as
appendix I)
Patients: Paediatric patients under the age of 14 years old treated at the Red Cross War
Memorial Children’s Hospital, Cape Town, were eligible for enrolment into the study,
if they were undergoing a surgical procedure for diagnostic or therapeutic purposes,
and appropriate informed consent was obtained from the parents/caregivers to be
enrolled into the study. The study was conducted between March 2013 and August
2014.
Inclusion criteria were:
Patients requiring invasive ICP monitoring, based on clinical/radiological findings;
Patients undergoing surgical procedures to treat suspected raised ICP, e.g. VPS insertion, evacuation of space occupying lesions and decompressive procedures;
Patients undergoing a neurosurgical procedure during which measurement of ICP could be performed safely, without negatively impacting the patients well-being.
Exclusion criteria were:
Patients who had ocular pathology, e.g. orbital trauma or cataract, which would preclude sonographic measurement of the ONSD;
Patients with signs of critically raised ICP, needing urgent surgery;
Patients who were haemodynamically unstable between ONSD acquisition and ICP measurement;

100
Patients receiving medication that would decrease ICP between ONSD imaging and ICP measurement, i.e. mannitol, hypertonic saline or steroids;
Time between ONSD imaging and ICP measurement exceeded 1 hour.
Acquisition of the ONSD images did not influence the management of patients during
the study, as this was purely an observational study.
5.3.1. Acquisition of ONS images
All ultrasound image-acquisition was performed by a single investigator, experienced
in the use of ultrasound in neurosurgical patients. The investigator was blinded to the
actual invasive ICP measurement at the time of image acquisition, as the ONSD
measurements were always performed just prior to ICP measurement. While the
investigator was blinded to actual ICP measurement, some bias may still have existed
as the reason for patients requiring surgery was often known to the investigator. Repeat
measurements of the ONSD were performed by two investigators, experienced in the
use of transorbital ultrasound in 30 cases. Data from the examinations were used to
test repeatability, intra- and inter-observer variability.
In all cases, patients had undergone anaesthetic induction and were being mechanically
ventilated. ONSD measurement was performed when haemodynamic parameters were
most stable, just prior to insertion of the ICP monitor. All ONSD measurements were
performed with patients in the supine position, with the head central and elevated to
approximately 30 degrees. A clear film protective dressing was placed over both eyes
to protect the globe from any potential injury. A layer of coupling gel was applied over
the closed upper eyelid. To identify and image the ONS the ultrasound probe with the
smallest available footprint – a 7-15 Mhz linear array probe with a ‘hockey stick’
configuration (See Figure 2.3) (Philips, Bothell, USA) was used in all cases.
Positioning of the probe over the eye was always carefully performed. This process
included use of the middle finger and left hand to palpate the bony surface of the
superior orbital rim, glabella and inferior orbital rim, to ensure that the application of
the probe over the surface of the eyelid never exerted any pressure on the globe itself.
101
Recommended techniques for imaging of the ONS are discussed under ocular
sonography (Chapter 3, Section B).
The depth was set to 4 cm as a default setting and the magnification was then adjusted
to provide the best quality of imaging for individual patients. The setting with the
lowest MI and TI (as discussed below were always chosen). ONSD measurement was
performed at an angle perpendicular to the optic nerve, at a depth of 3 mm posterior to
the lamina cribrosa of the sclera surface.
Three measurements were acquired in the sagittal plane, followed by clockwise
rotation of the probe and acquisition of three measurements in the axial plane for each
eye to ensure that the measurements could be appropriately analysed for correlation
and accuracy. The mean binocular ONSD measurement for each patient was then
obtained. This mean value was used for comparison with the invasively recorded ICP
reading. The digital calliper measuring tool on the ultrasound machine was used to
measure the ONSD. All images were saved in both JPEG and DICOM format on a
secure external hard drive. The time of image acquisition, the length of the imaging
and the time from ONSD measurement to ICP measurement were recorded.
5.3.2. Measures to ensure safety of the technique
The FDA/CDRH recommend using an MI < 0.23, and a TI < 1.81 The 2006 revised
statement by the EFSUMB (described in chapter 3) were used to guide our clinical
safety practice when performing ocular ultrasonography.82,82 We adjusted the output
settings on our machine to comply with these recommendations. In keeping with the
ALARA (As Low As Reasonably Achievable) principle suggested in both the safety
guidelines, we kept the image acquisition time to a minimum.

102
5.3.3. Haemodynamic and intracranial parameters
Measurement of the ONSD was performed when the haemodynamic parameters were
stable. The AF was palpated and described as open or closed. In cases where the AF
was almost closed and barely palpable it was classified as closed. The systolic blood
pressure (SBP), diastolic blood pressure (DBP), mean arterial pressure (MAP), pulse
rate, respiratory rate, temperature, weight and end tidal carbon dioxide (ETCO2) were
all recorded at the time of ONSD measurement. Any medication given after ONSD
measurement was documented. If any of these agents given between ONSD
measurement and ICP measurement were thought to affect the ICP, data from these
patients were excluded from the analysis.
5.3.4. Measurement of ICP
All ICP measurements were recorded at the time of surgery. Intraparenchymal
microsensor probes were generally inserted for ICP monitoring in TBI and
craniosynostosis patients, using the initial and most stable reading from the monitor.
A ventricular catheter was inserted if CSF drainage was required. For the remainder
of patients requiring ventricular catheter insertion, CSF pressure was measured by
connecting a CSF manometer to the ventricular catheter immediately after cannulating
the ventricle. Particular care was taken not to lose any CSF between ventricular
cannulation and connection of the manometer. The external auditory meatus was used
as a reference point for ‘zeroing’ the CSF manometer readings. In cases where
measurement was not possible or where the reading was not considered accurate, the
data were excluded.
Patients in whom intraparenchymal microsensors were placed had ICP recorded
directly in mmHg, and patients with ventricular catheter placement had ICP measured
at insertion of the catheter with a CSF manometer in cm H20. All ICP recordings were
then converted to mmHg (1 mmHg = 1.36 cmH20) for uniformity and to allow
comparison of data with similar published studies.

103
5.3.5. Anaesthetic protocol
The goal during each anaesthetic was to maintain normotension, normothermia,
normonatremia, normocapnia and normovolemia. The agents used for induction,
maintenance and analgesia differed depending on the procedure and anaesthetist. The
effect of the anaesthetic on the ICP is always a challenging factor to quantify;
especially volatile anaesthetics are known to cause cerebral vasodilation and a
presumed increase in CBF. The effect of reduced smooth muscle tension in the vessel
wall and subsequent vasodilation predominates when anaesthesia is maintained above
1.0 MAC.269,270 ONSD image acquisition and ICP measurement were always
performed during the same anaesthesia/procedure. Minimum alveolar concentration
(MAC) of the volatile agent used was maintained as constant as possible between
ONSD image acquisition and invasive ICP measurement. MAC values ranged between
0.5 – 1.2 MAC. Use of positive end expiratory pressure (PEEP) was in accordance
with the study by Pulitano et al,271 and age appropriate tidal volumes were used to
maintain normocarbia. Selected physiological parameters recorded at the time of
ONSD acquisition were included in a multivariate regression model to test for effect
on the relationship between ONSD and ICP.
Briefly, the anaesthetic for specific procedures involved:
Hydrocephalus (VPS/EVD/ETV)
Induction was with sevoflurane, oxygen and air or nitrous oxide if no intravenous (IV) access was available. IV access was secured after induction. If IV access was present on arrival intravenous induction with propofol and remifentanil was performed
Maintenance was with isoflurane, oxygen and air. Analgesia consisted of an opiate based regime utilising a remifentanil infusion, fentanyl boluses and/or morphine with intravenous paracetamol
Craniofacial/TBI
Induction was with sevoflurane, oxygen and air or nitrous oxide. IV access was secured after induction
Maintenance was with isoflurane, oxygen and air. Analgesia was administered as a sufentanil infusion with IV paracetamol

104
Intracranial tumour resection
Intravenous induction was followed by a target controlled infusion of propofol for maintenance using the Paedfusor regime. Analgesia was achieved with a sufentanil infusion and IV paracetamol
5.3.6. Sample size calculation
Based on results from a local pilot study, the sample size estimate for comparison of
means was calculated at 58 patients, to achieve 80% power, with an alpha of 5 (p <
0.05). Based on the available literature the results were expected to differ according to
age category, with described age-related variation at 1 year, between 1 and 4 years and
old above 4 years old. Due to the variation and inconsistency in the ages of patients at
presentation, and aiming to recruit around 58 patients into each of the 3 age categories,
the total sample size for the study was set at 174 patients across all ages (≤ 14 years
old). With an estimated 10% loss due to exclusion criteria and data loss, the study
aimed to recruit 192 patients.
5.3.7. Statistical analysis
Data were tested for normality of distribution using the Shapiro-Wilks test. Parametric
data were reported as means and standard deviations (SD) and non-parametric data
reported as medians and interquartile ranges (IQR). All analyses were done using Stata
IC version 12.0 (Stata Corporation LP, College Station, Texas, USA) statistical
software. The general association between means of numeric variables was tested by
applying either Pearson’s (PCC) or Spearman’s correlation coefficient (SCC),
depending on normality of data distribution. Analysis of variance (ANOVA) testing
was used to determine within and between group variances for the individual ONSD
readings acquired per eye.
Cronbach’s alpha statistic (α), which is a model of internal consistency, was used to
test correlation and covariance for within observer testing, i.e. repeatability and intra-

105
observer testing. Bland-Altmann analysis was used to test inter-observer agreement,
using limits of agreement and mean differences. Statistical significance was set at p <
0.05 and all significance testing was two sided. The independent Student t-test was
used for comparing mean values, and the Wilcoxon sum rank test/Mann-Whitney test
was used to compare median values. The diagnostic accuracy of ONSD measurements
to detect ICP at various thresholds was described using sensitivity, specificity, positive
predictive values (PPV), negative predictive values (NPV), area under the receiver
operating characteristic (AUROC) curves and odds ratios (OR), as well as their 95%
confidence intervals.
The association between ONSD, ICP and various physiological parameters was tested
in a univariate model. A multivariate regression model was then used to test the effect
of the significant covariables on the relationship between ONSD and ICP.
5.3.8. Study approval
Approval for the study was granted by the Human Research Ethics Committee of the
University of Cape Town (HREC REF: 674/2013). Approval for this study was also
granted by the Research Committee of the Red Cross War Memorial Children’s
Hospital. Written consent was obtained from parents/care-givers for all children
included in the study.

106
Chapter 6.
The relationship between optic nerve sheath diameter
(ONSD) measurement and invasively measured intracranial
pressure (ICP) in children: Results, discussion and conclusion
The results in this section are presented in four parts:
6.1 General and demographic data, repeatability, observer variability and correlation testing;
6.2 Relationship between ONSD and ICP over entire patient cohort;
6.3 Relationship between ONSD and ICP according to historically described age-related thresholds;
6.4 Using the anterior fontanelle (AF) as a clinical marker for defining OSND cut-off values in children
The results are followed by the:
6.5 Discussion;
6.6 Conclusion

107
6.1. General and demographic data, repeatability, observer
variability and correlation testing
6.1.1. Demographic data
In total, ONSD measurements were performed on 195 patients. Data from 21 patients
were excluded for the following reasons:
i. Haemodynamic instability or time between ONSD imaging and ICP measurement exceeded 1 hour: n = 5
ii. Physiological manipulation required to optimise ICP: n = 2 Hyperventilation to decrease PaCO2 Change in head position
iii. ICP lowering agents administered between ONSD imaging and ICP measurement: n = 3
Steroid administration Mannitol Hypertonic saline
iv. Incomplete datasets: n = 3
v. Equipment failure: n = 1
vi. Initial ICP measurement inaccurate: n = 7 Inaccurate catheter placement Loss of CSF prior to measurement
Data for the remaining 174 patients were available for the final analysis. In total 2,062
out of a total of 2,088 (98.8%) ONSD measurements (acquiring 3 images in the axial
plane and 3 images in the sagittal plane from each eye) were suitable for the analysis,
with no measurement performed on 26 images because the image quality was
considered suboptimal.
Most excluded patient data (n =7) resulted from inaccurate measurement of ICP,
mostly due to loss of CSF at the time of measurement during ventricular catheter

108
insertion. This exclusion was necessary to ensure the quality of the invasive ICP
measurement.
There were 52 (30.9%) females and 122 (69.1%) males, with a female to male ratio of
0.43:1. The median age was 36 months (IQR 8-82). 56 (32.2%) children were ≤ 1 year
old and 118 (67.8%) > 1 year old. The aetiology reflected the typical spectrum of
neurological disease encountered in routine practice and included: hydrocephalus
(52.9%), traumatic brain injury (17.2%), tumour (with or without hydrocephalus)
(9.2%), craniosynostosis (9.2%), cystic malformation (6.9%), other (4.6%) [Chiari I
malformation, spinal dysraphism, effusion and macrocephaly]. Demographic details
are summarised in the table below.
Parameter Total ICP < 20 mmHg ICP ≥ 20 mmHg
Number (%) 174 100 (57.5%) 74 (42.5%)
Age (median age in months)
36 (8 – 82) 16.5 (IQR 4 – 72.5)
59.5 (IQR 21 -91)
Aetiology
Hydrocephalus 92 (52.9%) 54 37
Traumatic brain injury 30 (17.2%) 20 10
Tumour 16 (9.2%) 0 16
Craniosynostosis 16 (9.2%) 9 7
Cystic malformation 12 (6.9%) 11 1
Other (Chiari I malformation, spinal dysraphism, subdural effusion, macrocephaly)
8 (4.6%) 6 3
Gender
Female 52 29 23
Male 122 71 51
Table 6.1. Demographic details

109
6.1.2. Intra-operative haemodynamic parameters
Physiological parameters were recorded at the time of ONSD image acquisition, these
parameters included: SBP, DBP, MAP, pulse rate, respiratory rate, end tidal CO2,
weight and temperature. These physiological parameters were analysed in two groups
according to ICP, < 20 mmHg and ≥ 20 mmHg (Table 6.2). The relationship between
individual potential confounding variables, both physiological and demographic, and
ONSD were tested in a univariate model. Statistically significant variables were then
entered into a multivariate logistic regression model.
Physiological Parameter ICP < 20mmHg ICP ≥ 20 mmHg p – value
Systolic Blood pressure (mean and SD in mmHg)
81.77 (21.5) 88.94 (13.3) p = 0.02*
Diastolic blood pressure (mean and SD in mmHg)
49.48 (16.1) 51.65 (12.4) p = 0.39
Mean arterial blood pressure (mean and SD in mmHg)
62.87 (17.4) 67.05 (10.6) p = 0.1
Pulse rate (mean and SD in beats per minute)
121.75 (27.3) 114.91 (26.6) p = 0.14
Respiratory rate (median and IQR in breaths per minute)
21.00 (17 – 26) 19.00 (15.5 – 23) p = 0.89
Temperature (median and IQR in degrees Celsius)
36.40 (36.05 – 36.6) 36.20 (35.7 – 36.5) p = 0.06
Weight (median and IQR in kilogr ANOVA)
12.00 (IQR 5.27 – 20)
16.50 (IQR 9.2 – 21.95)
p = 0.15
End tidal CO2 (median and IQR in mmHg)
4.10 (3.6 – 4.8) 4.40 (4 – 4.6) p = 0.26
ICP (mean and SD in mmHg)
11.68 (4.5) 23.87 (4.3) p < 0.001*
ONSD (mean and SD in mm)
5.08 (0.76) 6.28 (0.64) p < 0.001*
Table 6.2. Haemodynamic and physiological parameters
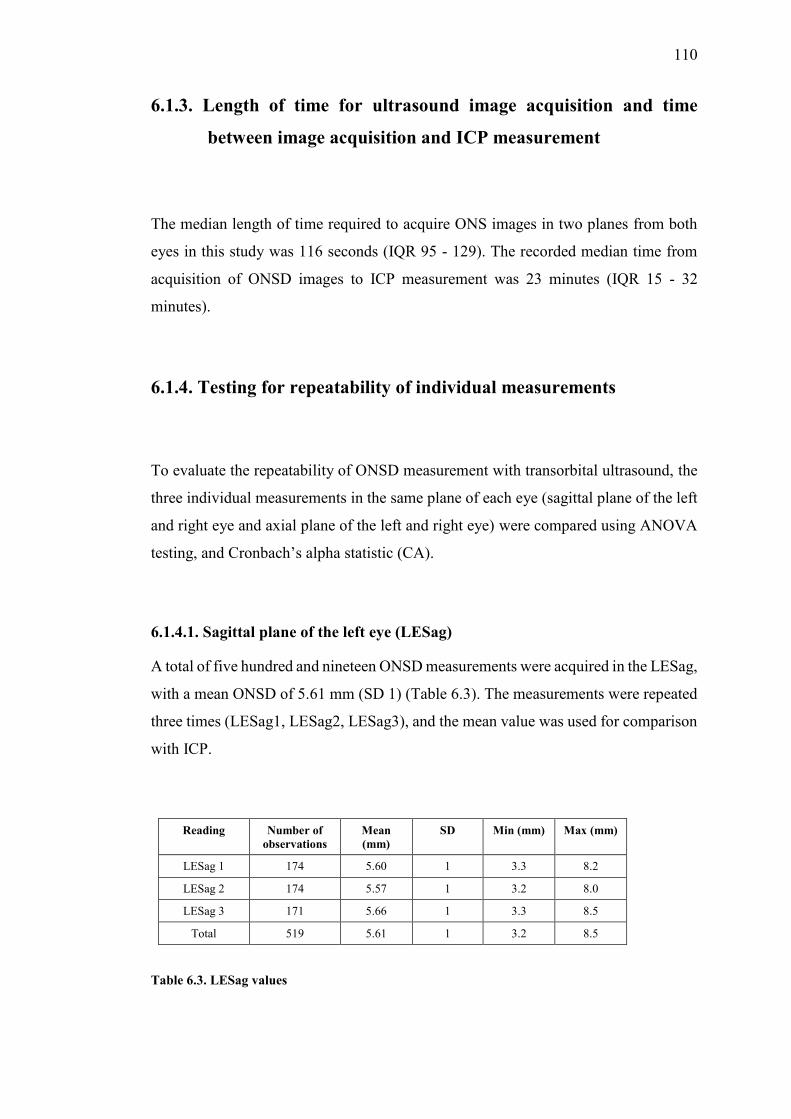
110
6.1.3. Length of time for ultrasound image acquisition and time
between image acquisition and ICP measurement
The median length of time required to acquire ONS images in two planes from both
eyes in this study was 116 seconds (IQR 95 - 129). The recorded median time from
acquisition of ONSD images to ICP measurement was 23 minutes (IQR 15 - 32
minutes).
6.1.4. Testing for repeatability of individual measurements
To evaluate the repeatability of ONSD measurement with transorbital ultrasound, the
three individual measurements in the same plane of each eye (sagittal plane of the left
and right eye and axial plane of the left and right eye) were compared using ANOVA
testing, and Cronbach’s alpha statistic (CA).
6.1.4.1. Sagittal plane of the left eye (LESag)
A total of five hundred and nineteen ONSD measurements were acquired in the LESag,
with a mean ONSD of 5.61 mm (SD 1) (Table 6.3). The measurements were repeated
three times (LESag1, LESag2, LESag3), and the mean value was used for comparison
with ICP.
Reading Number of observations
Mean (mm)
SD Min (mm) Max (mm)
LESag 1 174 5.60 1 3.3 8.2
LESag 2 174 5.57 1 3.2 8.0
LESag 3 171 5.66 1 3.3 8.5
Total 519 5.61 1 3.2 8.5
Table 6.3. LESag values

111
Comparison of the individual measurements demonstrated excellent correlation (α =
0.97, CA). No statistically significant difference was demonstrated between the
readings (F = 0.33, 2 degrees of freedom, p = 0.72) using ANOVA testing. (Figure
6.1)
Figure 6.1. Box-whisker plot of the mean values of each LESag reading
6.1.4.2. Sagittal plane of the right eye (RESag)
A total of five hundred and fifteen ONSD measurements were performed in the RESag,
with a mean ONSD of 5.63 mm (SD 0.99) (Table 6.4).
These results demonstrated excellent correlation between the measurements (α = 0.97,
CA). There was no statistically significant difference between these readings
according to analysis of variance testing (F = 0.17, 2 degrees of freedom, p = 0.84).
(Figure 6.2).
.2.4
.6.8
LESag1 LESag2LESag3
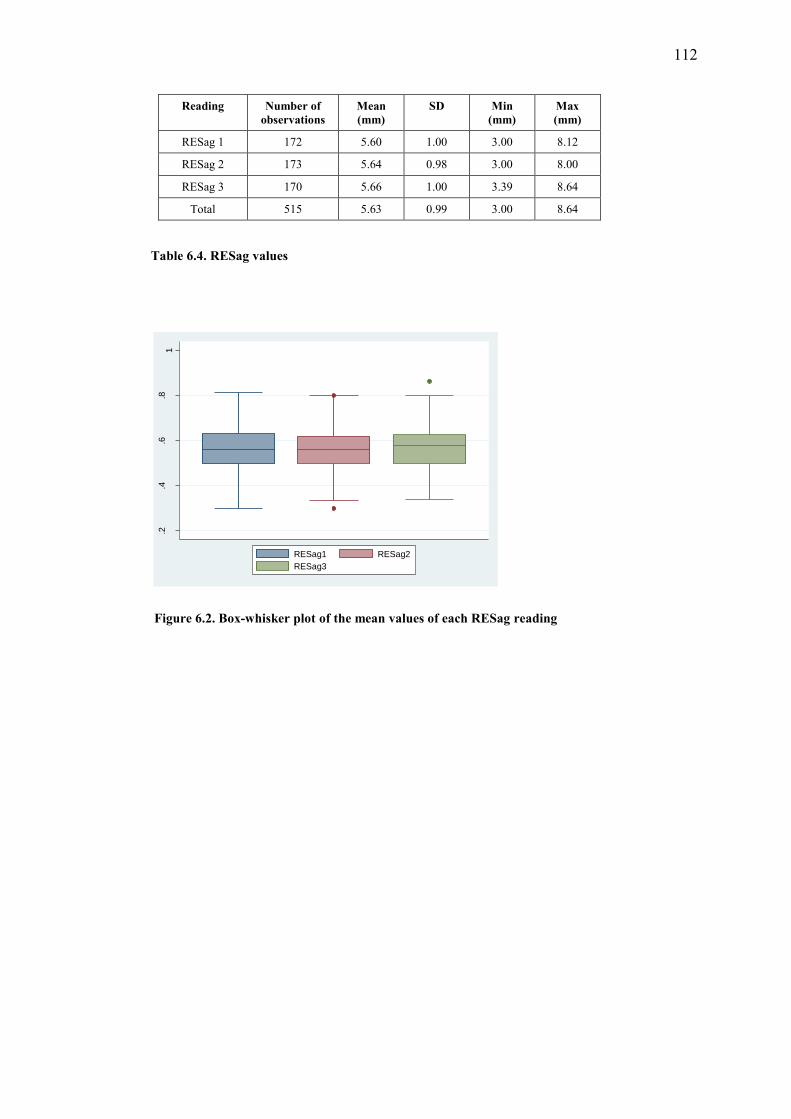
112
Reading Number of observations
Mean (mm)
SD Min (mm)
Max (mm)
RESag 1 172 5.60 1.00 3.00 8.12
RESag 2 173 5.64 0.98 3.00 8.00
RESag 3 170 5.66 1.00 3.39 8.64
Total 515 5.63 0.99 3.00 8.64
Table 6.4. RESag values
Figure 6.2. Box-whisker plot of the mean values of each RESag reading
.2.4
.6.8
1
RESag1 RESag2RESag3

113
6.1.4.3 Axial plane of the left eye (LEAx)
A total of five hundred and eighteen ONSD measurements were acquired in the LEAx,
with a mean ONSD of 5.51 mm (SD 0.98) (Table 6.5).
Reading Number of observations
Mean (mm)
SD Min (mm)
Max (mm)
LEAx 1 174 5.49 0.97 3.0 7.58
LEAx 2 173 5.50 0.96 3.4 8.0
LEAx 3 171 5.55 1.00 3.0 7.87
Total 518 5.51 0.98 3.0 8.0
Table 6.5. LEAx values
These measurements also demonstrated excellent correlation (α = 0.98, CA). Using
ANOVA testing demonstrated no statistically significant variation between these
readings (F = 0.21, 2 degrees of freedom, p = 0.81).(Figure 6.3)
Figure 6.3. Box-whisker plot of the mean values of each LEAx reading
.3.4
.5.6
.7.8
LEAx1 LEAx2LEAx3

114
6.1.4.4. Axial plane of the right eye (REAx)
In this plane, there were five hundred and ten ONSD measurements, with a mean
ONSD of 5.59 mm (SD 0.96). (Table 6.6)There was excellent correlation between the
individual measurements (α = 0.98, CA). There was no statistically significant
difference between the individual readings in this plane according to ANOVA testing
(F = 0.10, 2 degrees of freedom, p = 0.91). (Figure 6.4)
Reading Number of observations
Mean (mm)
SD Min (cm) Max (cm)
REAx 1 173 5.62 0.97 3.0 8.0
REAx 2 172 5.59 0.96 3.3 7.8
REAx 3 165 5.58 0.96 3.5 7.5
Total 510 5.59 0.96 3.0 8.0
Table 6.6. REAx values
Figure 6.4. Box-whisker plot of the mean values of each REax reading
.3.4
.5.6
.7.8
REAx1 REAx2REAx3

115
6.1.5. Testing for intra-observer variability
To assess the intra-observer variability, repeat measurements of the ONSD were
performed on 41 randomly selected patients at a later time, by the same observer,
blinded to the original measurements. The mean ONSD at the first reading was 5.58
mm (SD 0.85) and at the second reading was 5.56 mm (SD 0.84) (p = 0.92). The intra-
observer variability testing demonstrating excellent correlation (α = 0.99, CA) (Figures
6.5 and 6.6).
Figure 6.5. Scatterplot for intra-observer reliability
Figure 6.6. Box-whisker plot: measurement 1 (R1 AVE ONSD) and measurement 2 (R2 AVE ONSD)
.4.5
.6.7
.4 .5 .6 .7 R2 AVE ONSD
R1 AVE ONSD Fitted values
.4.5
.6.7
R1 AVE ONSD R2 AVE ONSD

116
6.1.6. Testing for inter-observer variability
The test for inter-observer variability was performed by comparing the ONSD
measurements performed independently by two observers experienced in the use of
transorbital ultrasonography. Inter-observer variability was tested by comparing the
mean ONSD measurements performed in 30 patients. The data were correlated using
Pearson’s correlation coefficient (PCC) and Bland-Altman analysis to test for
agreement between the observers. The mean ONSD measurement by observer 1 was
5.63 mm (SD 0.071) and by observer 2 was 5.36 mm (SD 0.064). (Table 6.7 and Figure
6.7)
Observer Number of observations
Mean ONSD (in mm)
SD Minimum (in mm)
Maximum (in mm)
Observer 1 30 5.63 0.71 3.87 6.89
Observer 2 30 5.36 0.64 3.47 6.31
Table 6.7. Inter-observer variability
Figure 6.7. Box-whisker plot. Observer 1 and Observer 2
.3.4
.5.6
.7
Observer1 Observer2

117
Figure 6.8. Bland-Altman plots. Outer solid lines represent limits of agreement (mean ± 1.96 times standard deviation, central line depicts the mean of differences).
Bland-Altmann analysis revealed a mean difference between the two observers of 0.28
mm (95% CI: 0.014 – 0.041), with limits of agreement between -0.44 – 0.99. (Figure
6.8). Correlation between the 2 observers was very good (r = 0.87, p < 0.001,
PCC).(Figure 6.9)
Figure 6.9. Scatter plot: Observer 1 vs Observer 2
lave
onsd
- va
veon
sd
Average.367 .6505
-.056
.098675.4
.5.6
.7
.3 .4 .5 .6 .7
Observer1 Fitted values
r = 0.87

118
6.1.7. Correlation between sagittal and axial imaging
The relationship between ONSD measurements performed in the sagittal and axial
plane were examined, as well as their respective relationship with ICP.
The average value of the three ONSD measurements performed in the sagittal
(AVESag) and axial (AVEAx) plane of both eyes were calculated and the mean values
in each plane were compared. (Table 6.8)
The mean AVESag value was 5.62 mm (SD 0.96) and the mean AVEAx value was
5.56 mm (SD 0.92) (p = 0.55, Student’s t-test).(Figure 6.10) The correlation between
AVESag and AVEAx was excellent (r = 0.93, p < 0.001, PCC). (Figure 6.11)
Plane Number of observations
Mean (mm)
SD Min (mm) Max (mm)
AVESag 174 5.62 0.96 3.39 8.00
AVEAax 174 5.56 0.92 3.38 7.54
Table 6.8. AVESag vs AVEAx ONSD measurements
Figure 6.10. Box-whisker plot AVESag and AVEAx Figure 6.11. Scatter plot of AVESag vs AVEAx
.3.4
.5.6
.7.8
AVESag AVEAx
.3.4
.5.6
.7.8
.3 .4 .5 .6 .7 .8AVEAx
AVESag Fitted values
r = 0.93
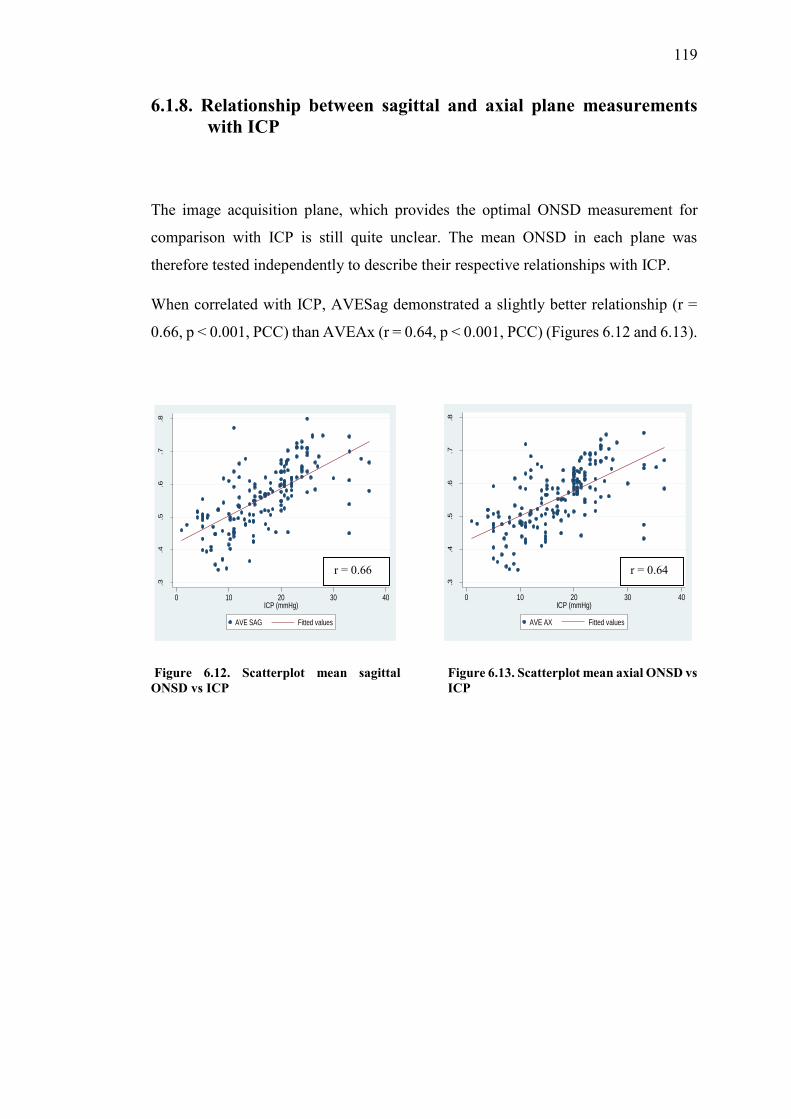
119
6.1.8. Relationship between sagittal and axial plane measurements with ICP
The image acquisition plane, which provides the optimal ONSD measurement for
comparison with ICP is still quite unclear. The mean ONSD in each plane was
therefore tested independently to describe their respective relationships with ICP.
When correlated with ICP, AVESag demonstrated a slightly better relationship (r =
0.66, p < 0.001, PCC) than AVEAx (r = 0.64, p < 0.001, PCC) (Figures 6.12 and 6.13).
Figure 6.12. Scatterplot mean sagittal ONSD vs ICP
Figure 6.13. Scatterplot mean axial ONSD vs ICP
.3.4
.5.6
.7.8
0 10 20 30 40ICP (mmHg)
AVE SAG Fitted values
.3.4
.5.6
.7.8
0 10 20 30 40ICP (mmHg)
AVE AX Fitted values
r = 0.66 r = 0.64

120
6.1.9. Correlation between right and left eye measurements
The correlation between ONSD measured in the right and left eye was tested using the
mean values of three hundred and forty eight (sagittal and axial) measurements from
the right left eye. The mean ONSD in the right eye was 5.61 mm (SD 0.95) and in the
left eye was 5.55 mm (SD 0.97) (Table 6.9)
Eye Number of observations
Mean (mm)
SD Min (mm) Max (mm)
Right 348 5.61 0.95 3.30 7.9
Left 348 5.56 0.97 3.17 8.2
Table 6.9. Right vs Left eye ONSD measurements
Correlation of the ONSD measurements between the two eyes was excellent (r = 0.9,
p < 0.001, PCC).(Figure 6.14)
Figure 6.14. Scatter plot of right eye vs left eye
.3.4
.5.6
.7.8
.3 .4 .5 .6 .7 .8right eye
Left eye Fitted values
r = 0.9

121
6.2. Relationship between ONSD measurement and ICP over
the entire cohort of patients
The treatment threshold of 20 mmHg was used to evaluate the relationship between
ONSD and ICP over the entire cohort of patients in this study. This relationship was
further assessed at ICP thresholds of 15, 10 and 5 mmHg to evaluate relevant ONSD
cut-off values for these ICP readings.
6.2.1. ICP dichotomised at 20 mmHg for all patients
There were one hundred and seventy four patients included in this study. The median
age was 36 (IQR 8 – 82) months. 100 patients had an ICP < 20 mmHg, with a mean
ICP reading of 11.68 mmHg (SD 4.5) and 74 patients had an ICP ≥ 20 mmHg, with a
mean ICP reading of 23.87 mmHg (SD 4.33). The correlation between mean ONSD
and ICP over the entire cohort was good (r = 0.66, p < 0.001, PCC).(Figure 6.15)
Figure 6.15. Scatterplot of mean ONSD against ICP for entire patient cohort
.3.4
.5.6
.7.8
0 10 20 30 40ICP (mmHg)
AVE ONSD Fitted values
r = 0.66
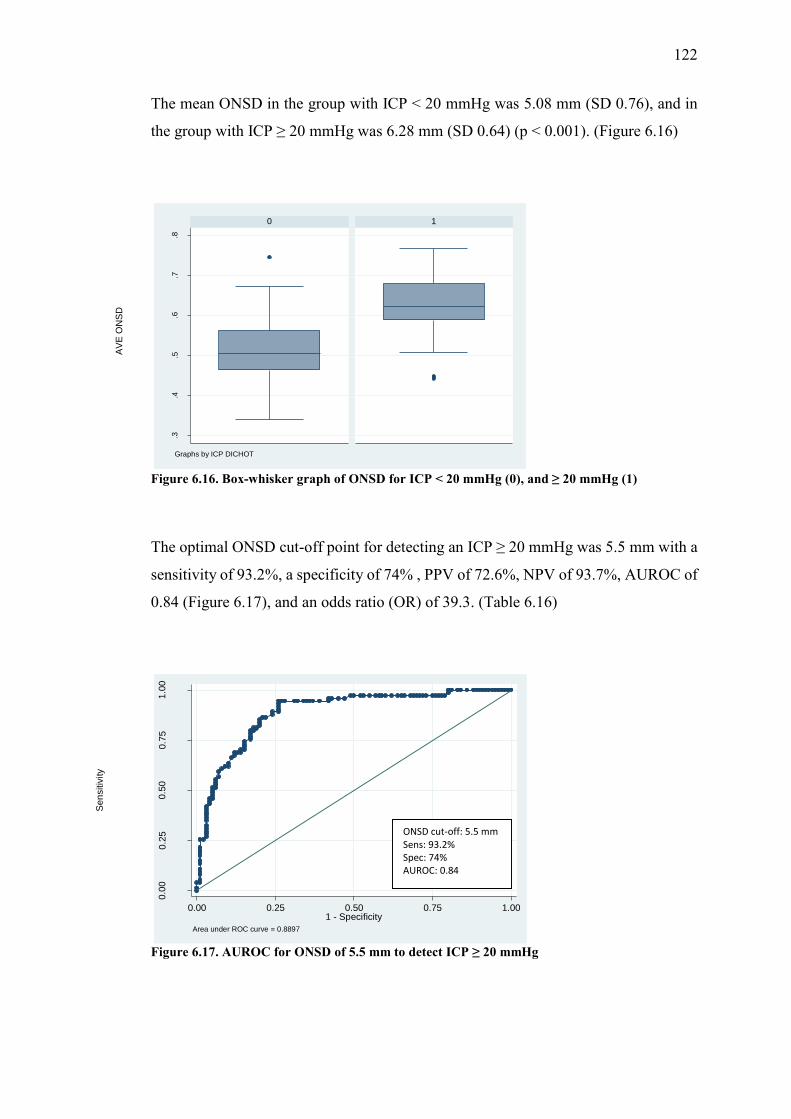
122
The mean ONSD in the group with ICP < 20 mmHg was 5.08 mm (SD 0.76), and in
the group with ICP ≥ 20 mmHg was 6.28 mm (SD 0.64) (p < 0.001). (Figure 6.16)
Figure 6.16. Box-whisker graph of ONSD for ICP < 20 mmHg (0), and ≥ 20 mmHg (1)
The optimal ONSD cut-off point for detecting an ICP ≥ 20 mmHg was 5.5 mm with a
sensitivity of 93.2%, a specificity of 74% , PPV of 72.6%, NPV of 93.7%, AUROC of
0.84 (Figure 6.17), and an odds ratio (OR) of 39.3. (Table 6.16)
Figure 6.17. AUROC for ONSD of 5.5 mm to detect ICP ≥ 20 mmHg
.3.4
.5.6
.7.8
0 1
AVE
ON
SD
Graphs by ICP DICHOT
0.00
0.25
0.50
0.75
1.00
Sens
itivi
ty
0.00 0.25 0.50 0.75 1.001 - Specificity
Area under ROC curve = 0.8897
ONSD cut-off: 5.5 mm Sens: 93.2% Spec: 74% AUROC: 0.84

123
Applying a linear regression model to the data and controlling for age, revealed that
with a baseline value of 4.03 mm, for every 10 mmHg increase in ICP the ONSD
increased by 0.75 mm (95% CI: 0.62 – 0.88, R2 = 0.52, p < 0.001). In the group with
ICP ≥ 20 mmHg, with a baseline value of 5.69 mm this change in ONSD was 0.24 mm
(95% CI: 0.09 – 0.5, R2 = 0.03, p = 0.16) for every 10 mmHg increase in ICP.
The effects of certain physiological and demographic variables were tested in a
univariate analysis. Variables found to have a significant effect on the relationship
between ONSD and ICP were entered into a multivariate logistic regression model to
adjust for this effect. In the unadjusted model, the OR was 39.28, for an ONSD value
of 5.5 mm to detect an ICP ≥ 20 mmHg. In the adjusted model (adjusted for
confounding variables, SBP, temperature, ETCO2, age, pulse and aetiology) the OR
was reduced to 26.88. Even though the OR decreased in the adjusted model, the
relationship between ONSD and ICP remained statistically significant in both the
unadjusted and adjusted models (Table 6.10).
Variable Odds ratio (OR)
95% Confidence interval
p – value
Unadjusted model for ONSD of 5.5 mm to predict ICP ≥ 20
mmHg
39.28 14.28 – 108.03 p < 0.001
Adjusted model for ONSD of 5.5 mm to predict ICP ≥ 20
mmHg
26.88 8.54 – 84.62 p < 0.001
SBP 1.00 0.97 – 1.03 p = 0.9
Temperature 0.48 0.24 – 0.98 p = 0.06
ETCO2 1.03 0.62 – 1.71 p = 0.92
Age (months)
1.01 0.99– 1.01 p = 0.85
Pulse 1.00 0.98 – 1.02 p = 0.87
Aetiology 0.92 0.71 – 1.21 p = 0.57
Table 6.10. Unadjusted and adjusted models for the relationship between ONSD and ICP
Various aetiologies for raised ICP in children have been described in studies evaluating
the usefulness of ONSD measurement.28,29,30-34,161 Aetiology was therefore analysed

124
to assess its effect on the ONSD measurement in this study. Results were reported in
each aetiological group, and are summarised in Table 6.11.
Aetiology Number (%) Age in months median (IQR)
ICP in mmHg mean (SD)
ONSD in mm mean (SD)
Hydrocephalus 92 (52.9) 22.50 (5 -74) 16.9 (7.9) 5.4 (0.9)
TBI 30 (17.2) 80.50 (55 -94) 16.4 (6.9) 5.8 (0.9)
Tumour 16 (9.2) 66.50 (29 – 105.5) 23.4 (2.6) 6.4 (0.7)
Craniosynostosis 16 (9.2) 15.50 (12 – 26) 17.5 (3.1) 6.1 (0.4)
Intracranial cyst 12 (6.9) 0.55 (0.185 – 25) 13.0 (7.9) 4.8 (0.9)
Other 8 (4.6) 60.00 (30 – 75.5) 9.7 (7.3) 5.4 (0.8)
Table 6.11. Age, ICP and ONSD for specific aetiological groups
The diagnostic accuracy of ONSD measurement for detecting ICP ≥ 20 mmHg in each
aetiological group are summarised in Table 6.12. No diagnostic accuracy analysis was
performed in the tumour group as all patients in this group had an ICP ≥ 20 mmHg.
Aetiology ONSD cut-off value (mm)
Sensitivity%(95%
CI)
Specificity%(95%
CI)
PPV% (95% CI)
NPV% (95% CI)
AUROC (95% CI)
OR (95%CI)
Hydrocephalus 5.50 91.9 (78.1-98.3)
83.6 (71.2-92.2)
79.1 (64-90)
93.9 (83.1-98.7)
0.88 (0.81-0.94)
57.90 (15.2-216)
TBI 5.79 80.0 (44.4-97.5)
65 (40.8-84.6)
53.3 (26.6-78.7)
86.7 (59.5-98.3)
0.73 (0.56-0.89)
7.43 (1.33-39.4)
Craniosynostosis 6.17 85.7 (42.1-99.6)
88.9 (51.8-99.7)
85.7 (42.1-99.6)
88.9 (51.8-99.7)
0.87 (0.7-1)
48.00 (3.09-100)
Intracranial cysts 4.50 50 (1.26-98.7)
20 (6.67-65.2)
12.5 (3.16-52.7)
75 (19.4-99.4)
0.4 (0-0.912)
0.43 (0-100)
Other 5.50 100 (15.8-100)
83.3 (35.9-99.6)
66.7 (9.43-99.2)
100 (47.8-100)
0.92 (0.75-1)
N/A
Table 6.12. Diagnostic accuracy of ONSD for detecting ICP ≥ 20 mmHg in different aetiological groups.
6.2.2. ICP dichotomised at 15 mmHg for all patients

125
Seventy three patients had an ICP < 15 mmHg, with a mean ICP of 9.71 mmHg (SD
3.54) and 101 patients had an ICP ≥ 15 mmHg, with a mean ICP of 22.04 mmHg (SD
4.84). The mean ONSD in the group with ICP < 15 mmHg was 4.92 mm (SD 0.8),
compared to 6.08 mm (SD 0.7) (p < 0.001) in the group with ICP ≥ 15 mmHg. The
results and comparative p – values for the difference between groups with ICP above
and below 15 mmHg are summarised in Table 6.13.
ICP in mmHg N (%) Median age in months (IQR)
Mean ICP in mmHg (SD)
Mean ONSD in mm (SD)
Overall 174 36 (8 -82) 16.87 (7.5) 5.59 (0.9)
< 15 73 (42) 17 (3 – 76) 9.71 (3.54) 4.92 (0.8)
≥ 15 101 (58) 40 (14 - 82) 22.04 (4.84) 6.08 (0.7)
p – value p = 0.18 p < 0.001 p < 0.001
Table 6.13. Age, ICP and ONSD for ICP dichotomised at 15 mmHg
The optimal ONSD cut-off point for detecting ICP ≥ 15 mmHg was 5.29 mm, with a
sensitivity of 88.1%, a specificity of 78.1% and an OR of 26.4 (Table 6.16).
6.2.3. ICP dichotomised at 10 mmHg for all patients.

126
Thirty one patients had an ICP < 10 mmHg, with a mean ICP of 6.23 mmHg (SD 2.11)
and 143 patients had an ICP ≥ 10 mmHg, with a mean ICP of 19.17 mmHg (SD
6.1).The results and comparative p – values (comparing values above and below 10
mmHg) for this group are summarised in the Table 6.14.
ICP in mmHg N (%) Median age in months (IQR)
Mean ICP in mmHg (SD)
Mean ONSD in mm (SD)
Overall 174 36 (8 - 82) 16.87 (7.5) 5.59 (0.9)
< 10 31 (17.8) 55 (1.6 – 82) 6.23 (2.11) 4.60 (0.7)
≥ 10 143 (82.2) 34 (8 – 82) 19.17 (6.1) 5.81 (0.8)
p – value p = 0.58 p < 0.001 p < 0.001
Table 6.14. Age, ICP and ONSD for ICP dichotomised at 10 mmHg
The optimal ONSD cut-off point for detecting an ICP ≥ 10 mmHg was 5.04 mm, with
a sensitivity of 79%, a specificity of 74.2% and an OR of 10.8 (Table 6.16).
6.2.4. ICP dichotomised at 5 mmHg for all patients

127
Five patients had an ICP < 5 mmHg, with a mean ICP of 3 mmHg (SD 1.4) and one
hundred and sixty nine patients had ICP ≥ 5 mmHg, with a mean ICP of 17.28 mmHg
(SD 7.2). The mean ONSD in the group with ICP < 5 mmHg was 4.98 mm (SD 0.2),
compared to a mean ONSD of 5.61 mm (SD 0.9) (p = 0.13) in the group with ICP ≥ 5
mmHg. The results and comparative p – values are summarised in Table 6.15.
ICP in mmHg N (%) Median age in months (IQR)
Mean ICP in mmHg (SD)
Mean ONSD in mm (SD)
Overall 174 36 (8 -82) 16.87 (7.5) 5.59 (0.9)
< 5 5 (2.9) 76 (75 – 143) 3.00 (1.4) 4.98 (0.2)
≥ 5 169 (97.1) 34 (8 – 81) 17.28 (7.2) 5.61 (0.9)
p – value p = 0.01 p < 0.001 p = 0.13
Table 6.15. Age, ICP and ONSD for ICP dichotomised at 5 mmHg
The optimal ONSD cut-off point for detecting ICP ≥ 5 mmHg was 5 mm, with a
sensitivity of 72.8%, a specificity of 60% and an OR 4.01 (Table 6.16).
The diagnostic accuracy of ONSD measurement for detecting ICP at thresholds of 20,
15, 10 and 5 mmHg across the entire patient cohort are summarised in Table 6.16.
ICP (mmHg)
ONSD cut-off
(mm)
Sensitivity% (95%CI)
Specificity % (95%CI)
PPV% (95%CI)
NPV %
(95%CI)
AUROC (95%CI)
OR (95%CI)
≥ 20 5.50 93.2 (84.9-97.8)
74 (64.3-82.3)
72.6 (62.5- 81.3)
93.7 (85.8- 97.9)
0.84 (0.78-0.89)
39.30 (14.6-105)
≥ 15 5.29 88.1 (80.2-93.7)
78.1 (66.9-86.9)
84.8 (76.4-91)
82.6 (71.6- 90.7)
0.83 (0.77-0.89)
26.40 (11.7-59.6)

128
≥ 10 5.04 79 (71.4-85.4)
74.2 (55.4-88.1)
93.4 (87.4- 97.1)
43.4 (29.8- 57.7)
0.77 (0.68 - 0.85)
10.80 (4.47-26.1)
≥ 5 5.00 72.8 (65.4-79.3)
60 (14.7-94.7)
98.4 (94.3- 99.8)
6.12 (1.28- 16.9)
0.66 (0.42-0.91)
4.01 (0.77 - .)
Table 6.16. Summary of ONSD cut-off values at different ICP values for all patients
129
6.3. Relationship between ONSD measurement and ICP:
using described age-related thresholds for defining
ONSD cut-off values in children
The use of transorbital ultrasound as a non-invasive imaging tool to measure the
ONSD in children is perhaps even more appealing than it is in adults. The limitation
in children remains the disparity regarding the optimal cut-off values for different age
groups. The available literature uses either 1 year of age 29,30 or 4 years of age28,31,32,33
as suggested age-related thresholds for defining different ONSD cut-off values to
detect raised ICP in children.
This section of the study aims to evaluate the current age-related recommendations for
ONSD cut-off values in children. The relationship between ONSD and ICP was
assessed within the following age categories:
6.3.1. Under 1 year old (≤ 1 year old);
6.3.2. Above 1 year (> 1 year old);
6.3.3. Subcategory analysis of children > 1 year:
i. Ages between 1 year (> 1 year old) and 4 years (≤ 4 years old);
ii. Older than 4 years (> 4 years old)

130
6.3.1. Children under 1 year old (≤ 1 year old)
The relationship between ONSD and ICP in this age group was analysed to describe
the optimal ONSD cut-off value for detecting ICP at thresholds of 20, 15, 10 and 5
mmHg.
6.3.1.1. ICP dichotomised at 20 mmHg
There were fifty six patients aged ≤ 1 year old. The median age in this group was 4.0
(IQR 1 – 8) months. Forty six patients had an ICP < 20 mmHg with a mean ICP reading
of 12.23 mmHg (SD 3.77) and 10 patients had an ICP ≥ 20 mmHg, with a mean ICP
reading of 22.53 mmHg (SD 4.06). The results and comparative p – values are
summarised in Table 6.17. There was good correlation between ONSD and ICP (r =
0.65, p < 0.001, PCC) in this group.(Figure 6.18)
ICP in mmHg N (%) Median age in months (IQR)
Mean ICP in mmHg (SD)
Mean ONSD in mm (SD)
Overall 56 4.0 (1 – 8) 14.07 (5.49) 4.9 (0.8)
< 20 46 (82.1) 3.5 (0.75 – 8) 12.23 (3.77) 4.8 (0.8)
≥ 20 10 ( 17.9) 7.5 (2 – 8) 22.53 (4.06) 5.6 (0.8)
p – value p = 0.095 p < 0.001 p = 0.003
Table 6.17. Age, ICP and ONSD for ICP dichotomised at 20 mmHg in children ≤ 1 year old

131
Figure 6.18. Scatterplot of ONSD vs ICP for children ≤ 1 year old
The mean ONSD in the group with ICP < 20 mmHg was 4.8 mm (SD 0.8) compared
to 5.6 mm (SD 0.8) (p = 0.003) in the group with ICP ≥ 20 mmHg (Figure 6.19).
Figure 6.19. Box and whisker plot of ONSD for ICP < 20 mmHg (0) and ICP ≥ 20 mmHg (1) in children ≤ 1 year old
.3.4
.5.6
.7.8
0 10 20 30 40ICP (mmHg)
AVE ONSD Fitted values
.3.4
.5.6
.7.8
0 1
AVE
ON
SD
Graphs by ICP DICHOT
r = 0.65

132
In children under the age of 1 year, the optimal ONSD cut-off point for detecting an
ICP ≥ 20mmHg was 5.16 mm with a sensitivity of 80%, specificity of 76.1% , PPV of
42.1%, NPV of 94.6%, an AUROC of 0.81 (Figure 6.20) and a diagnostic OR of 12.7
(Table 6.20)
Figure 6.20. AUROC for ONSD to detect ICP ≥ 20 mmHg in children ≤ 1 year old.
6.3.1.2. ICP dichotomised at 15 mmHg
Thirty four children in this group had an ICP < 15 mmHg and 22 children had an ICP
≥ 15 mmHg. The results are summarised in Table 6.18.
ICP in mmHg N (%) Median age in months (IQR)
Mean ICP in mmHg (SD)
Mean ONSD in mm (SD)
Overall 56 4.0 (1 – 8) 14.07 (5.49) 4.90 (0.8)
< 15 34 (60.7) 1.8 (0.5) 10.63 (2.96) 4.56 (0.8)
≥ 15 22 (39.3) 7.5 (4 – 8) 19.40 (4.04) 5.50 (0.6)
p – value p < 0.001 p < 0.001 p < 0.001
Table 6.18. Age, ICP and ONSD for ICP dichotomised at 15 mmHg in children ≤ 1 year old
0.00
0.25
0.50
0.75
1.00
Sens
itivi
ty
0.00 0.25 0.50 0.75 1.001 - Specificity
Area under ROC curve = 0.8076
ONSD: 5.16 mm Sens: 80% Spec: 76% AUROC: 0.81

133
The optimal ONSD cut-off value to detect an ICP ≥ 15 mmHg in this age group was
4.97 mm, with a sensitivity of 86.4%, specificity of 82.4% and an OR of 29.6 (Table
6.20).
6.3.1.3. ICP dichotomised at 10 mmHg
Twelve children in this age group had an ICP < 10 mmHg and 44 children had an ICP
≥ 10 mmHg, the results and comparative p – values are summarised in Table 6.19.
Table 6.19. Age, ICP and ONSD for ICP dichotomised at 10 mmHg in children ≤ 1 year old
In the group of patients under 1 year of age, the optimal ONSD cut-off value for
detecting an ICP ≥ 10 mmHg was 4.3 mm, with a sensitivity of 90.9%, specificity of
66.7% and an OR of 20 (Table 6.20).
ICP (in mmHg) N (%) Median age in months (IQR)
Mean ICP in mmHg (SD)
Mean ONSD in mm (SD)
Overall 56 4 (1 – 8) 14.07 (5.49) 4.9 (0.8)
< 10 mmHg 12 (21.4) 1 (0.11 – 3) 7.39 (1.44) 4.0 (0.5)
≥ 10 mmHg 44( 78.6) 5 (1.63 – 8) 15.89 (4.71) 5.2 (0.7)
p – value p = 0.02 p < 0.001 p < 0.001

134
6.1.3.4. ICP dichotomised at 5 mmHg
Of the fifty six patients under 1 year old, the minimum ICP was 5 mmHg, so none of
the patients in this group had an ICP <5 mmHg.
The diagnostic accuracy of the ONSD cut-off values for predicting ICP readings of 20,
15, 10 and 5 mmHg in children under the age of 1 year are summarised in Table 6.17.
ICP (mmHg)
ONSD cut-off (mm)
Sensitivity% (95%CI)
Specificity %
(95%CI)
PPV% (95%CI)
NPV %
(95%CI)
AUROC (95%CI)
OR (95%CI)
≥ 20 5.16 80 (44.4-97.5)
76.1 (61.2-87.4)
42.1 (20.3-66.5)
94.6 (81.8-99.3)
0.81 (0.64-0.93)
12.7 (2.58 - .)
≥ 15 4.97 86.4 (65.1-97.1)
82.4 (65.5-93.2)
76 (54.9-90.6)
90.3 (74.2-98)
0.84 (0.75-0.94)
29.6 (6.85-125)
≥ 10 4.30 90.9 (78.3-97.5)
66.7 (34.9-90.1)
90.9 (78.3-97.5)
66.7 (34.9-90.1)
0.79 (0.64-0.93)
20 (4.33-93.2)
≥ 5 Nil Nil Nil Nil Nil Nil Nil
Table 6.20. ONSD cut-off values for predicting ICP readings of 20, 15, 10 and 5 mmHg in children < 1 yo

135
6.3.2. Children above 1 year old (> 1 year old)
One hundred and eighteen children over the age of 1 year were evaluated as a
combined group in this section. The median age was 65.5 months (IQR 35 – 94), with
a mean ICP of 18.19 mmHg (SD 7.94), and a mean ONSD measurement of 5.92 mm
(0.7). There was good correlation between ONSD and ICP (r = 0.7, p < 0.001, PCC)
in this age group. (Figure 6.21). The diagnostic accuracy of ONSD measurement was
analysed at ICP thresholds of 20, 15, 10 and 5 mmHg.
Figure 6.21. Scatterplot of ONSD vs ICP in children > 1 year
.4.5
.6.7
.8
0 10 20 30 40ICP (mmHg)
AVE ONSD Fitted values
r = 0.7

136
6.3.2.1. ICP dichotomised at 20 mmHg
In this age group fifty four patients had an ICP < 20 mmHg, with a median age of 64.5
months (IQR 42 – 94) and a mean ICP reading of 11.22 mmHg (SD 5.02). Sixty four
patients had an ICP ≥ 20 mmHg with a median age of 66.5 months (IQR 32.5 – 95)
and a mean ICP reading of 24.08 mmHg (SD 4.37). The results and comparative p –
values are summarised in Table 6.21.
ICP N (%) Median age in months (IQR)
Mean ICP in mmHg (SD)
Mean ONSD in mm (SD)
Overall 118 65.5 (35 – 94) 18.19 (7.94) 5.92 (0.8)
< 20 mmHg 54 64.5 (42 – 94) 11.22 (5.02) 5.36 (0.6)
≥ 20 mmHg 64 66.5 (32.5 – 95) 24.08 (4.37) 6.38 (0.5)
p – value p = 0.96 p < 0.001 p < 0.001
Table 6.21. Age, ICP and ONSD for ICP dichotomised at 20 mmHg in children > 1 year old
The mean ONSD in the group with ICP < 20 mmHg was 5.4 mm (SD 0.6), compared
to 0.64 cm (SD 0.05) in the group with ICP ≥ 20 mmHg (p < 0.001). (Figure 6.22)

137
Figure 6.22. Box and whisker plot of ONSD for ICP < 20 mmHg (0) and ICP ≥ 20 mmHg (1) in children > 1 year old
The ONSD value with the best diagnostic accuracy for detecting an ICP ≥ 20 mmHg
was 5.75 mm, with a sensitivity of 85.9%, specificity of 70.4% , PPV of 77.5%, NPV
of 80.9% and AUROC of 0.78 (Figure 6.23). The diagnostic OR was 14.5. (Table 6.25)
Figure 6.23. AUROC for ONSD to detect ICP ≥ 20 mmHg in children > 1 year old
6.3.2.2. ICP dichotomised at 15 mmHg
.4.5
.6.7
.8
0 1A
VE
ON
SD
Graphs by ICP DICHOT
0.00
0.25
0.50
0.75
1.00
Sen
sitiv
ity
0.00 0.25 0.50 0.75 1.001 - Specificity
Area under ROC curve = 0.8889
ONSD: 5.75 mm Sens: 85.9% Spec: 70.4% AUROC: 0.78

138
In this age group, thirty nine children had an ICP < 15 mmHg and seventy nine children
had an ICP ≥ 15 mmHg. The data and comparative p – values are summarised in Table
6.22.
ICP N (%) Median age in months (IQR)
Mean ICP in mmHg (SD)
Mean ONSD in mm (SD)
Overall 118 65.5 (35 – 94) 18.19 (7.94) 5.92 (0.7)
< 15 mmHg 39 (33.1) 75.0 (55 - 98) 8.91 (3.85) 5.20 (0.63)
≥ 15 mmHg 79 (66.9) 61.0 (30 - 92) 22.78 (4.81) 6.30 (0.59)
p – value p = 0.11 p < 0.001 p < 0.001
Table 6.22. Age, ICP and ONSD for ICP dichotomised ay 15 mmHg in children > 1 year old
The cut-off value for ONSD that best predicted an ICP ≥ 15 mmHg was 5.49 mm, with
a sensitivity of 93.7%, specificity of 74.4% and an OR of 42.9 (Table 6.25).
6.3.2.3. ICP dichotomised at 10 mmHg

139
Nineteen children had an ICP < 10 mmHg and ninety nine had an ICP ≥ 10 mmHg in
this age group. The results are summarised in Table 6.32.
ICP N (%) Median age in months (IQR)
Mean ICP in mmHg (SD)
Mean ONSD in mm (SD)
Overall 118 65.5 (35 – 94) 18.19 (7.94) 5.92 (0.7)
< 10 mmHg 19 75.0 (57 – 116) 5.50 (2.2) 4.98 (0.5)
≥ 10 mmHg 99 65.0 (32 - 94) 20.63 (6.1) 6.09 (0.7 )
p – value p = 0.08 p < 0.001 p < 0.001
Table 6.23. Age, ICP and ONSD for ICP dichotomised at 10 mmHg in children > 1 year old
The cut-off value for ONSD that best predicted an ICP ≥ 10 mmHg was 5.2 mm, with
sensitivity of 88.9%, specificity of 84.2% and an OR of 42.7 (Table 6.34).
6.3.2.4. ICP dichotomised at 5 mmHg

140
There were five children in this age category with an ICP < 5 mmHg and one hunded
and thirteen with an ICP ≥ 5 mmHg. Table 6.24 summarises the results and
comparative p – values in this group.
ICP N (%) Median age in months (IQR)
Mean ICP in mmHg (SD)
Mean ONSD in mm (SD)
Overall 118 65.5 (35 – 94) 18.19 (7.94) 5.92 (0.7)
< 5 mmHg 5 76.0 (75 – 143) 3.00 (1.4) 4.98 (0.2)
≥ 5 mmHg 113 65.0 (34 – 94) 18.87 (7.42) 5.96 (0.8)
p – value p = 0.12 p < 0.001 p = 0.005
Table 6.24. Age, ICP and ONSD for ICP dichotomised at 5 mmHg in children > 1 year old
The cut-off value for ONSD that best predicted an ICP ≥ 5 mmHg was 5.1 mm, with
a sensitivity of 81.4%, specificity of 60% and an OR of 6.6. (Table 6.25)
The diagnostic accuracy of ONSD measurement for detecting ICP at thresholds of 20,
15, 10 and 5 mmHg in children > 1 year old, are summarised in Table 6.25.

141
ICP (mmHg)
ONSD cut-off (mm)
Sensitivity% (95%CI)
Specificity% (95%CI)
PPV% (95%CI)
NPV% (95%CI)
AUROC (95%CI)
OR (95%CI)
≥ 20 5.75 85.9 (75 – 93.4)
70.4 (56.4 – 82)
77.5 (66 – 86.5)
80.9 (66.7 – 90.9)
0.78 (0.71 – 0.86)
14.5 (5.87 – 35.8)
≥ 15 5.49 93.7 (85.8 – 97.9)
74.4 ( 57.9 - 87)
88.1 (79.2 – 94.1)
85.3 (68.9 – 95)
0.84 (0.77 – 0.92)
42.9 (13.8 - 133)
≥ 10 5.20 88.9 (81-94.3)
84.2 (60.4 – 96.6)
96.7 (90.7 – 99.3)
59.3 (38.8 – 77.6)
0.87 (0.78 – 0.96)
42.7 (11.2 - 159)
≥ 5 5.10 81.4 (73 – 88.1)
60 (14.7 – 94.7)
97.9 (92.5 – 99)
12.5 (2.7 – 32.4)
0.71 (0.46 – 0.95)
6.6 (1.2 - 35)
Table 6.25. ONSD cut-off values for detecting ICP at thresholds of 20, 15, 10 and 5 mmHg
In children above and below the age of 1 year, the diagnostic accuracy of ONSD
measurement for detecting ICP ≥ 20 mmHg are summarised in Table 6.26.
Age ONSD cut-off (mm) for ICP ≥ 20 mmHg
Sensitivity% (95%CI)
Specificity% (95%CI)
PPV% (95%CI)
NPV% (95%CI)
AUROC (95%CI)
OR (95%CI)
All ages
5.50 93.2 (84.9 – 97.80)
74 (64.3 – 82.3)
72.6 (62.5 – 81.3)
93.7 (85.8 – 97.9)
0.84 (0.78 – 0.89)
39.3 (14.6 – 105)
≤ 1 year
5.16 80 (44.4 – 97.5)
76.1 (61.2 – 87.4)
42.1 (20.3 – 66.5)
94.6 (81.8 – 99.3)
0.81 (0.64 – 0.93)
12.7 (2.58 - 100)
> 1 year
5.75 85.9 (75 – 93.4)
70.4 (56.4 – 82)
77.5 (66 – 86.5)
80.9 (66.7 – 90.9)
0.78 (0.71 – 0.86)
14.5 (5.87 – 35.8)
Table 6.26. ONSD cut-off values for detecting ICP ≥ 20 mmHg in children ≤ 1 year and > 1 year old.
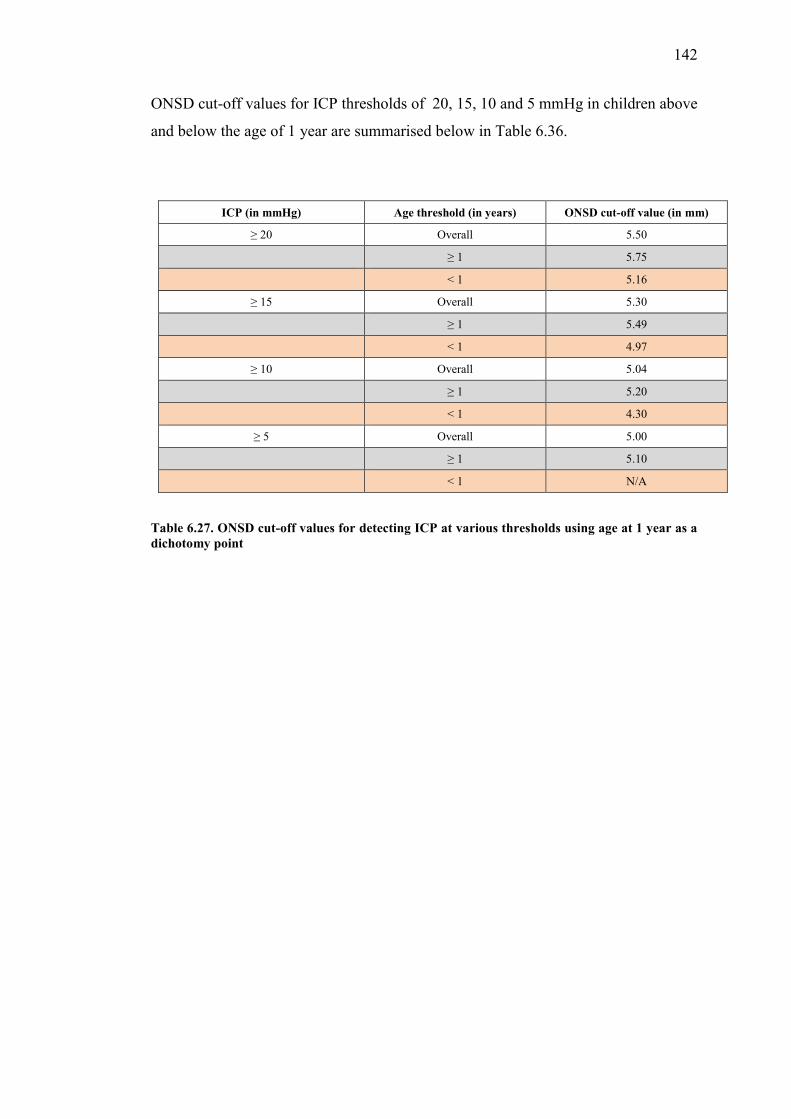
142
ONSD cut-off values for ICP thresholds of 20, 15, 10 and 5 mmHg in children above
and below the age of 1 year are summarised below in Table 6.36.
ICP (in mmHg) Age threshold (in years) ONSD cut-off value (in mm)
≥ 20 Overall 5.50
≥ 1 5.75
< 1 5.16
≥ 15 Overall 5.30
≥ 1 5.49
< 1 4.97
≥ 10 Overall 5.04
≥ 1 5.20
< 1 4.30
≥ 5 Overall 5.00
≥ 1 5.10
< 1 N/A
Table 6.27. ONSD cut-off values for detecting ICP at various thresholds using age at 1 year as a dichotomy point

143
6.3.3. Subcategory analysis of children over the age of 1 year
For comparison with the literature, a subgroup analysis of children over the age of 1
year was performed to determine the validity of age at 4 years as an age-related
threshold.28,31
6.3.3.1. Children aged between 1 and 4 years (> 1 and ≤ 4 years old)
Of the one hundred and eighteen children over the age of 1 year, thirty nine were > 1
and ≤ 4 years old. The data for children in this age category are summarised according
to ICP thresholds in Table 6.28. (A detailed analysis for this age category is included
in the appendix, appendix II)
ICP in mmHg N (%) Median age in months (IQR)
Mean ICP in mmHg (SD)
Mean ONSD in mm (SD)
Overall 39 23 (17 – 35) 19.15 (6.04) 5.94 (0.6)
< 20 mmHg 16 (41) 22.5 (16.5 – 34.5) 13.75 (4.3) 5.43 (0.6)
≥ 20 mmHg 23 (59) 23 (18 – 35) 22.91 (3.8) 6.29 (0.4)
< 15 mmHg 8 (20.5) 25.5 (16.5 – 43) 10.78 (4.1) 5.28 (0.6)
≥ 15 mmHg 31 (79.5) 23 (18 – 34) 21.31 (4.3) 6.11 (0.5)
< 10 mmHg 2 (5) 43 (42 – 44) 4.5 (0.7) 4.92 (0.4)
≥ 10 mmHg 37 (95) 23 (17 – 34) 19.94 (5.1) 6.00 (0.6)
< 5 mmHg 1 (2.5) 42 4 5.20
≥ 5 mmHg 38 (97.5) 23 (17 – 34) 19.55 (5.6) 5.96 (0.6)
Table 6.28. Summary of patient data at different ICP thresholds
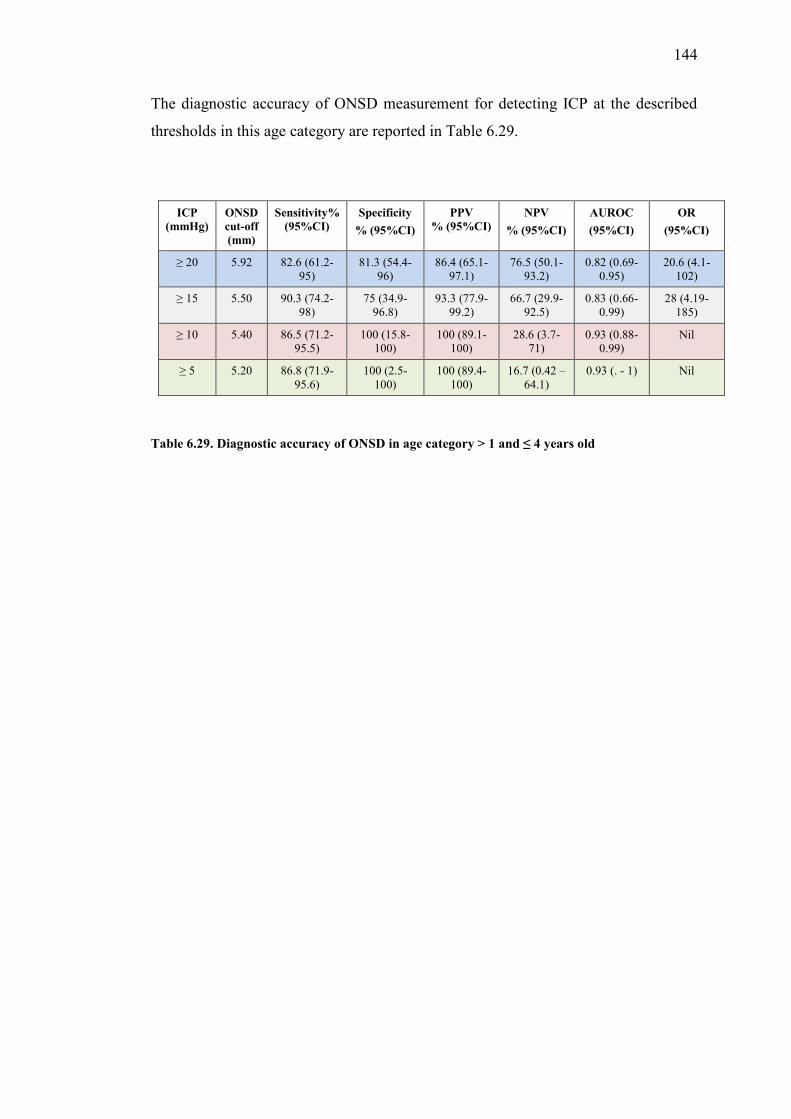
144
The diagnostic accuracy of ONSD measurement for detecting ICP at the described
thresholds in this age category are reported in Table 6.29.
ICP (mmHg)
ONSD cut-off (mm)
Sensitivity% (95%CI)
Specificity % (95%CI)
PPV % (95%CI)
NPV % (95%CI)
AUROC (95%CI)
OR (95%CI)
≥ 20 5.92 82.6 (61.2-95)
81.3 (54.4-96)
86.4 (65.1-97.1)
76.5 (50.1-93.2)
0.82 (0.69-0.95)
20.6 (4.1-102)
≥ 15 5.50 90.3 (74.2-98)
75 (34.9-96.8)
93.3 (77.9-99.2)
66.7 (29.9-92.5)
0.83 (0.66-0.99)
28 (4.19-185)
≥ 10 5.40 86.5 (71.2-95.5)
100 (15.8-100)
100 (89.1-100)
28.6 (3.7-71)
0.93 (0.88-0.99)
Nil
≥ 5 5.20 86.8 (71.9-95.6)
100 (2.5-100)
100 (89.4-100)
16.7 (0.42 – 64.1)
0.93 (. - 1) Nil
Table 6.29. Diagnostic accuracy of ONSD in age category > 1 and ≤ 4 years old

145
6.3.3.2. Children over 4 years of age (> 4 years old)
There were seventy nine children over the age of 4 years in this study. The data for
this age group are summarised according to ICP dichotomised at thresholds of 20, 15,
10 and 5 mmHg respectively in Table 6.30.
ICP in mmHg N (%) Median age in months (IQR)
Mean ICP in mmHg (SD)
Mean ONSD in mm (SD)
Overall 79 82 (65 – 108) 17.72 (8.7) 5.90 (0.8)
< 20 mmHg 38 (48.1 ) 81.5 (63 – 107) 10.15 (5) 5.33 (0.6)
≥ 20 mmHg 41 (51.9) 87 (69 – 125) 24.74 (4.6) 6.43 (0.6)
< 15 mmHg 31 (39.2) 86 (63 -114) 8.43 (3.7) 5.22 (0.6)
≥ 15 mmHg 48 (60.8) 82 (68 – 107) 23.72 (4.9) 6.34 (0.6)
< 10 mmHg 17 (21.5) 76 (57 – 116) 5.61 (2.3) 4.99 (0.5)
≥ 10 mmHg 62 (78.5) 89 (69 – 107) 21.04 (6.6) 6.15 (0.7)
< 5 mmHg 4 (5.1) 109.5 (75.5 – 148.5)
2.75 (1.5) 4.93 (0.2)
≥ 5 mmHg 75 (94.9) 82 (65 – 107) 18.52 (8.2) 5.96 (0.8)
Table 6.30. Summary of patient data at different ICP thresholds
The diagnostic accuracy of ONSD measurement for detecting ICP at the described
thresholds, in this age category, is summarised in Table 6.31.
ICP (mmHg)
ONSD cut-off (mm)
Sensitivity% (95%CI)
Specificity % (95%CI)
PPV %
(95%CI)
NPV %
(95%CI)
AUROC (95%CI)
OR (95%CI)
≥ 20 5.70 87.8 (73.8 – 95.9)
68.4 (51.3 – 82.5)
75 (60.4 – 86.4)
83.9 (66.3 – 94.5)
0.78 (0.69 – 0.87)
15.6 (5 – 48.2)
≥ 15 5.49 93.8 (82.8 – 98.7)
74.2 (55.4 -88.1)
84.9 (72.4 – 93.3)
88.5 (69.8 – 97.6)
0.84 (0.75 – 0.93)
43.1 (10.9 – 167)
≥ 10 5.20 88.7 (78.1 – 95.3)
82.4 (56.6 – 96.2)
94.8 (85.6 – 98.9)
66.7 (43 – 85.4)
0.86 (0.75 – 0.96)
36.7 (8.8 – 150)
≥ 5 5.00 80 (69.2 – 88.4)
75 (19.4 – 99.4)
98.4 (91.2 -100)
16.7 (3.6 – 41.1)
0.78 (0.53 – 1)
12 (1.6 - .)
Table 6.31. ONSD cut-off values for various ICP thresholds in patients aged > 4 years

146
The optimal ONSD cut-off values for detecting ICP at thresholds of 20, 15, 10 and 5 mmHg, within the various described age categories are summarised below in Table 6.32.
ICP in mmHg Age threshold (in years) ONSD cut-off values (in mm)
≥ 20 Overall 5.50
≤ 1 5.16
> 1 - ≤ 4 5.94
> 4 5.70
≥ 15 Overall 5.30
≤ 1 4.97
> 1 - ≤ 4 5.50
> 4 5.49
≥ 10 Overall 5.04
≤ 1 4.30
> 1 - ≤ 4 5.40
> 4 5.20
≥ 5 Overall 5.00
≤ 1 Nil
> 1 - ≤ 4 5.20
> 4 5.00
Table 6.32. ONSD cut-off values for different ICP thresholds within the various age categories

147
6.4. The relationship between ONSD and ICP using patency
of the anterior fontanelle (AF) to describe ONSD cut-off
values
The concept of using age limits in children to describe different cut-off values for
ONSD has been analysed in the preceding section. The inconsistency of current
recommendations contributes to the difficulty in describing acceptable ONSD cut-off
values in children. Using patency of the AF as a clinical marker for defining different
ONSD cut-off values may be a valuable alternative to approaching this challenge, and
perhaps standardising these recommendations. Closure of the AF is quite variable,
usually between 6 and 18 months, but the AF can usually be classified as either open,
if reliably palpable or closed if not palpable. This section examined the validity of
using patency of the AF as a physiological and anatomical indicator to define the
diagnostic accuracy of ONSD measurement in children and also compared these
results to the age-related findings described earlier.

148
6.4.1. Patients with an open anterior fontanelle (AF)
Of the one hundred and seventy four patients included in this study, sixty two (35.6%)
had an open AF, and one hundred and twelve (64.4%) had a closed AF. The diagnostic
accuracy of ONSD for detecting ICP at thresholds of 20, 15, 10 and 5 mmHg were
analysed within these two groups.
The median age of the sixty two patients in this group was 5 months (IQR 1 – 8).
Correlation between ONSD and ICP in the group of patients with an open AF was fair
(r = 0.56, p < 0.001, PCC) in the (Figure 6.30).
Figure 6.24. Scatterplot for ONSD vs ICP in patients with an open AF
.3.4
.5.6
.7.8
0 10 20 30 40ICP (mmHg)
AVE ONSD Fitted values
r = 0.56
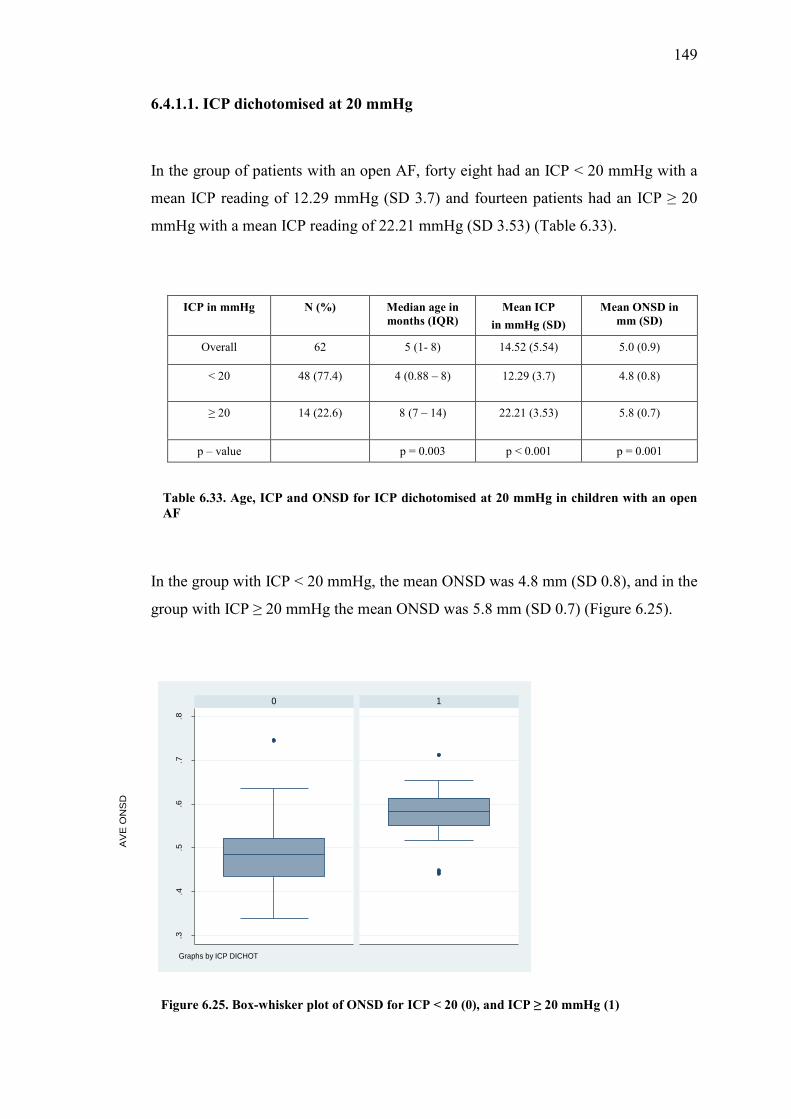
149
6.4.1.1. ICP dichotomised at 20 mmHg
In the group of patients with an open AF, forty eight had an ICP < 20 mmHg with a
mean ICP reading of 12.29 mmHg (SD 3.7) and fourteen patients had an ICP ≥ 20
mmHg with a mean ICP reading of 22.21 mmHg (SD 3.53) (Table 6.33).
ICP in mmHg N (%) Median age in months (IQR)
Mean ICP in mmHg (SD)
Mean ONSD in mm (SD)
Overall 62 5 (1- 8) 14.52 (5.54) 5.0 (0.9)
< 20 48 (77.4) 4 (0.88 – 8) 12.29 (3.7) 4.8 (0.8)
≥ 20 14 (22.6) 8 (7 – 14) 22.21 (3.53) 5.8 (0.7)
p – value p = 0.003 p < 0.001 p = 0.001
Table 6.33. Age, ICP and ONSD for ICP dichotomised at 20 mmHg in children with an open AF
In the group with ICP < 20 mmHg, the mean ONSD was 4.8 mm (SD 0.8), and in the
group with ICP ≥ 20 mmHg the mean ONSD was 5.8 mm (SD 0.7) (Figure 6.25).
Figure 6.25. Box-whisker plot of ONSD for ICP < 20 (0), and ICP ≥ 20 mmHg (1)
.3.4
.5.6
.7.8
0 1
AV
E O
NS
D
Graphs by ICP DICHOT

150
In patients with an open AF, the ONSD cut-off value with the best diagnostic accuracy
for detecting an ICP ≥ 20 mmHg was 5.16 mm with a sensitivity of 85.7%, specificity
of 75%, PPV of 50%, NPV of 94.7%, an AUROC of 0.804 (Figure 6.32) and a
diagnostic OR of 18.(Table 6.36)
Figure 6.26. AUROC of ONSD for detecting ICP ≥ 20mmHg
6.4.1.2. ICP dichotomised at 15 mmHg
There were thirty six children in this group with an ICP < 15 mmHg and twenty six
with an ICP ≥ 15 mmHg. The results and their comparative p – values are summarised
in table 6.34.
0.00
0.25
0.50
0.75
1.00
Sen
sitiv
ity
0.00 0.25 0.50 0.75 1.001 - Specificity
Area under ROC curve = 0.8490
ONSD: 5.16 mm Sensitivity: 85.7% Specificity: 75 % AUROC: 0.804
151
ICP in mmHg N (%) Median age in months (IQR)
Mean ICP in mmHg (SD)
Mean ONSD in mm (SD)
Overall 62 5 (1 – 8) 14.52 (5.54) 5.0 (0.9)
< 15 36 (58.1) 2.5 (0.5 – 7) 10.79 (2.96) 4.6 (0.8)
≥ 15 26 (41.9) 8 (5 – 10) 19.7 (3.82) 5.6 (0.6)
p – value p = 0.002 p < 0.001 p < 0.001
Table 6.34. Age, ICP and ONSD values for ICP dichotomised at 15 mmHg in children with an open AF
In the group with an open AF, the optimal ONSD cut-off value for predicting an ICP
≥ 15 mmHg was 5 mm with a sensitivity of 88.5%, specificity of 83.3% and an OR of
38.3 (Table 6.36).
6.4.1.3. ICP dichotomised at 10 mmHg
There were twelve children in this group with an ICP < 10 mmHg and 50 with an ICP
≥ 10 mmHg. Table 6.35 summarises the results and comparative p – values.
Table 6.35. Age, ICP and ONSD values for ICP dichotomized at 10 mmHg in children with an open AF
ICP N (%) Median age in months (IQR)
Mean ICP in mmHg (SD)
Mean ONSD in mm (SD)
Overall 62 5 (1 – 8) 14.5 (5.53) 5.0 (0.9)
< 10 mmHg 12 (19.4) 1 (0.11 – 3) 7.39 (1.44) 4.0 (0.5)
≥ 10 mmHg 50 (80.6) 6.5 (2 – 9) 16.24 (4.72) 5.2 (0.7)
p – value p = 0.009 p < 0.001 p < 0.001

152
In patients with an open AF, the optimal ONSD cut-off value for predicting an ICP ≥
10 mmHg was 4.4 mm, with a sensitivity of 86%, specificity of 75% and an OR of
18.4.(Table 6.36)
6.1.4.4. ICP dichotomised at 5 mmHg
None of the patients with an open AF in this study had an ICP < 5 mmHg.
The diagnostic accuracy of ONSD measurements for detecting ICP at thresholds of
20, 15, 10 and 5 mmHg in children with an open AF, are summarised below in table
6.36
ICP (mmHg)
ONSD cut-off
(mm)
Sensitivity% (95%CI)
Specificity %
(95%CI)
PPV% (95%CI)
NPV %
(95%CI)
AUROC (95%CI)
OR (95%CI)
≥ 20 5.16 85.7 (57.2 – 98.2) 75 (60.4 – 86.4)
50 (29.1 – 70.9)
94.7 (82.3 – 99.4)
0.804 (0.69 – 0.92)
18 (3.84 - 100)
≥ 15 5.00 88.5 (69.8 – 97.6) 83.3 (67.2 – 93.6)
79.3 (60.3 – 92)
90.0 (75.7 – 98.1)
0.86 (0.77 – 0.95)
38.3 (9.01 – 160)
≥ 10 4.40 86 (73.3 – 94.2) 75 (42.8 – 94.5)
93.5 (82.1 – 98.6)
56.3 (29.9 – 80.2)
0.81 (0.67 – 0.94)
18.4 (4.2 – 79.5)
≥ 5 Nil Nil Nil Nil Nil Nil Nil
Table 6.36. Diagnostic accuracy of ONSD cut-off values for ICP at thresholds of 20, 15, 10 and 5mmHg in children with an open AF
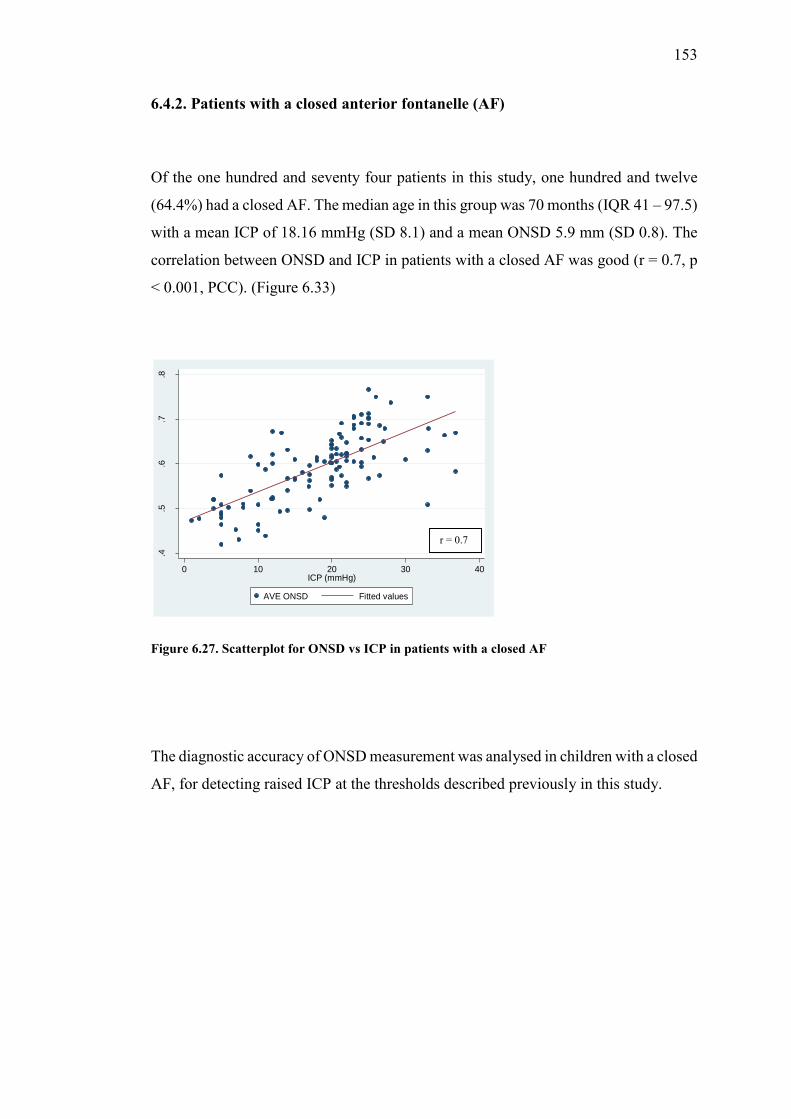
153
6.4.2. Patients with a closed anterior fontanelle (AF)
Of the one hundred and seventy four patients in this study, one hundred and twelve
(64.4%) had a closed AF. The median age in this group was 70 months (IQR 41 – 97.5)
with a mean ICP of 18.16 mmHg (SD 8.1) and a mean ONSD 5.9 mm (SD 0.8). The
correlation between ONSD and ICP in patients with a closed AF was good (r = 0.7, p
< 0.001, PCC). (Figure 6.33)
Figure 6.27. Scatterplot for ONSD vs ICP in patients with a closed AF
The diagnostic accuracy of ONSD measurement was analysed in children with a closed
AF, for detecting raised ICP at the thresholds described previously in this study.
.4.5
.6.7
.8
0 10 20 30 40ICP (mmHg)
AVE ONSD Fitted values
r = 0.7
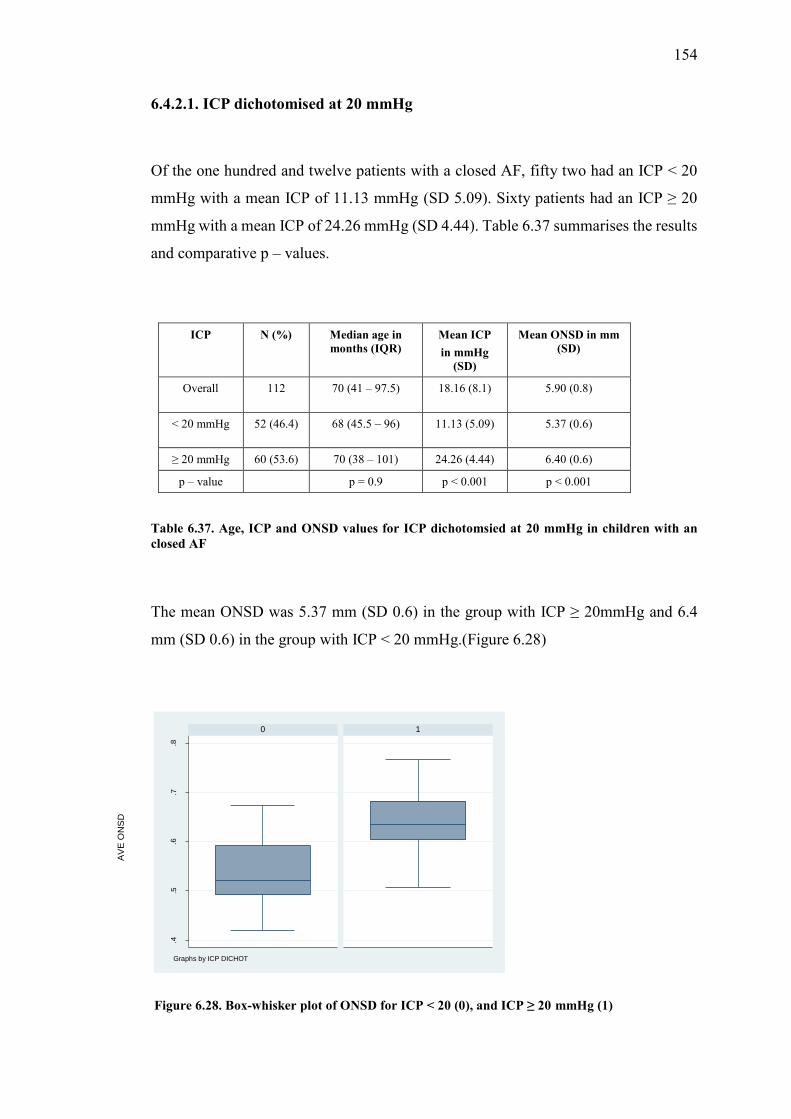
154
6.4.2.1. ICP dichotomised at 20 mmHg
Of the one hundred and twelve patients with a closed AF, fifty two had an ICP < 20
mmHg with a mean ICP of 11.13 mmHg (SD 5.09). Sixty patients had an ICP ≥ 20
mmHg with a mean ICP of 24.26 mmHg (SD 4.44). Table 6.37 summarises the results
and comparative p – values.
ICP N (%) Median age in months (IQR)
Mean ICP in mmHg
(SD)
Mean ONSD in mm (SD)
Overall 112 70 (41 – 97.5) 18.16 (8.1) 5.90 (0.8)
< 20 mmHg 52 (46.4) 68 (45.5 – 96) 11.13 (5.09) 5.37 (0.6)
≥ 20 mmHg 60 (53.6) 70 (38 – 101) 24.26 (4.44) 6.40 (0.6)
p – value p = 0.9 p < 0.001 p < 0.001
Table 6.37. Age, ICP and ONSD values for ICP dichotomsied at 20 mmHg in children with an closed AF
The mean ONSD was 5.37 mm (SD 0.6) in the group with ICP ≥ 20mmHg and 6.4
mm (SD 0.6) in the group with ICP < 20 mmHg.(Figure 6.28)
Figure 6.28. Box-whisker plot of ONSD for ICP < 20 (0), and ICP ≥ 20 mmHg (1)
.4.5
.6.7
.8
0 1
AV
E O
NS
D
Graphs by ICP DICHOT

155
In patients with a closed AF, the optimal ONSD cut-off value for detecting an ICP ≥
20 mmHg was 5.81 mm with a sensitivity of 85%, specificity of 73.1%, PPV of 78.5%,
NPV of 80.9%, AUROC of 0.79 (Figure 6.29) and an OR of 15.4.(Table 6.41)
Figure 6.29. AUROC of ONSD for detecting ICP ≥ 20 mmHg
6.4.2.2. ICP dichotomised at 15 mmHg
0.00
0.25
0.50
0.75
1.00
Sen
sitiv
ity
0.00 0.25 0.50 0.75 1.001 - Specificity
Area under ROC curve = 0.8881
ONSD: 5.81 mm Sensitivity: 85 % Specificity: 73.1 % AUROC: 0.79

156
There were thirty seven children in this group with an ICP < 15 mmHg and seventy
five with an ICP ≥ 15mmHg. Table 6.38 summarises the results and comparative p –
values.
ICP N (%) Median age in months (IQR)
Mean ICP in mmHg (SD)
Mean ONSD in mm (SD)
Overall 112 70 (41 – 97.5) 18.16 (8.1) 5.92 (0.8)
< 15 mmHg 37 (33) 76 (57 – 98) 8.7 (3.8) 5.20 (0.6)
≥ 15 mmHg 75 (67) 66 (33 – 93) 22.9 (4.9) 6.30 (0.6)
p – value p = 0.09 p < 0.001 p < 0.001
Table 6.38. Age, ICP and ONSD values for ICP dichotomisd at 15 mmHg in children with a closed AF
In patients with a closed AF, the cut-off value for ONSD that best predicted an ICP ≥
15 mmHg was 5.5 mm with a sensitivity of 93.3%, specificity of 73% and an OR of
37.8.(Table 6.41)
6.4.2.3. ICP dichotomised at 10 mmHg

157
There were nineteen patients in this group with an ICP < 10 mmHg and ninety three
patients with an ICP ≥ 10 mmHg. The results and comparative p – values are
summarised in table 6.39.
ICP N (%) Median age in months (IQR)
Mean ICP in mmHg (SD)
Mean ONSD in mm (SD)
Overall 112 70 (41 – 97.5) 18.16 (8.1) 5.92 (0.8)
< 10 mmHg 19 (17) 75 (57 – 116) 5.5 (2.2) 4.98 (0.5)
≥ 10 mmHg 93 (83) 69 (35 – 97) 20.75 (6.2) 6.10 (0.7)
p – value p = 0.15 p < 0.001 p < 0.001
Table 6.39. Age, ICP and ONSD values for ICP dichotomized at 10 mmHg in children with a closed AF
In patients with a closed AF, the ONSD cut-off value that best predicted an ICP ≥ 10
mmHg was 5.2 mm with a sensitivity of 89.2%, specificity of 84.2 and an OR of 44.3
(Table 6.41).
6.4.2.4. ICP dichotomised at 5 mmHg

158
Five patients in this group had an ICP < 5 mmHg and one hundred and seven patients
had an ICP ≥ 5 mmHg. Table 6.40 summarises the results and comparative p
– values in this group.
ICP N (%) Median age in months (IQR)
Mean ICP in mmHg (sd)
Mean ONSD in mm (sd)
Overall 112 70 (41 – 97.5) 18.16 (8.1) 5.92 (0.8)
< 5 mmHg 5 (4.5) 76 (75 – 143) 3 (1.4) 4.98 (0.2)
≥ 5 mmHg 107 (95.5) 67 (39 – 97) 18.9 (7.6) 5.97 (0.8)
p – value p = 0.15 p < 0.001 p = 0.005
Table 6.40. Age, ICP and ONSD for ICP dichotomised at 5 mmHg in children a closed AF
In patients with a closed AF, the ONSD cut-off value that best predicted an ICP ≥ 5
mmHg was 5 mm, with a sensitivity of 86.9%, specificity of 60% and an OR of 10
(Table 6.41).
The diagnostic accuracy of ONSD measurement for detecting ICP at thresholds of 20,
15, 10 and 5 mmHg in children with a closed AF are summarised below in Table 6.4.

159
ICP (mmHg)
ONSD cut-off (mm)
Sensitivity% (95%CI)
Specificity %
(95%CI)
PPV% (95%CI)
NPV %
(95%CI)
AUROC (95%CI)
OR (95%CI)
≥ 20 5.80 85 (73.4 – 92.9)
73.1 (59 – 84.4)
78.5 (66.5 – 87.7)
80.9 (66.7 – 90.9)
0.79 (0.71 – 0.87)
15.4 (6.1 – 38.8)
≥ 15 5.50 93.3 (85.1 – 97.8)
73 (55.9 – 86.2)
87.5 (78.2 – 93.8)
84.4 (67.2 – 94.7)
0.83 (0.75 – 0.91)
37.8 (12.1 – 118)
≥ 10 5.20 89.2 (81.1 – 94.7)
84.2 (60.4 – 96.6)
96.5 (90.1 – 99.3)
61.5 (40.6 – 79.8)
0.87 (0.78 – 0.96)
44.3 (11.5 – 167)
≥ 5 5.00 86.9 (79 – 92.7)
60 (14.7 – 94.7)
97.9 (92.6 – 99.7)
17.6 (3.8 – 43.4)
0.74 (0.49 – 0.98)
10 (3.8 – 54.4)
Table 6.41. Diagnostic accuracy of ONSD measurement for detecting ICP at various thresholds in children with a closed AF
A summary of the results from assessing patency of the AF as a clinical marker for
describing different ONSD cut-off values in children at ICP thresholds of 20, 15, 10 and
5 mmHg, are provided in table 6.42.
ICP threshold (in mmHg) Patency of AF ONSD cut-off value (in mm)
≥ 20 Overall 5.50
Open AF 5.16
Closed AF 5.81
≥ 15 Overall 5.30
Open AF 5.00
Closed AF 5.50
≥ 10 Overall 5.04
Open AF 4.40
Closed AF 5.20
≥ 5 Overall 5.00
Open AF Nil
Closed AF 5.00
Table 6.42. ONSD cut-off values for different ICP thresholds in patients with an open and closed AF
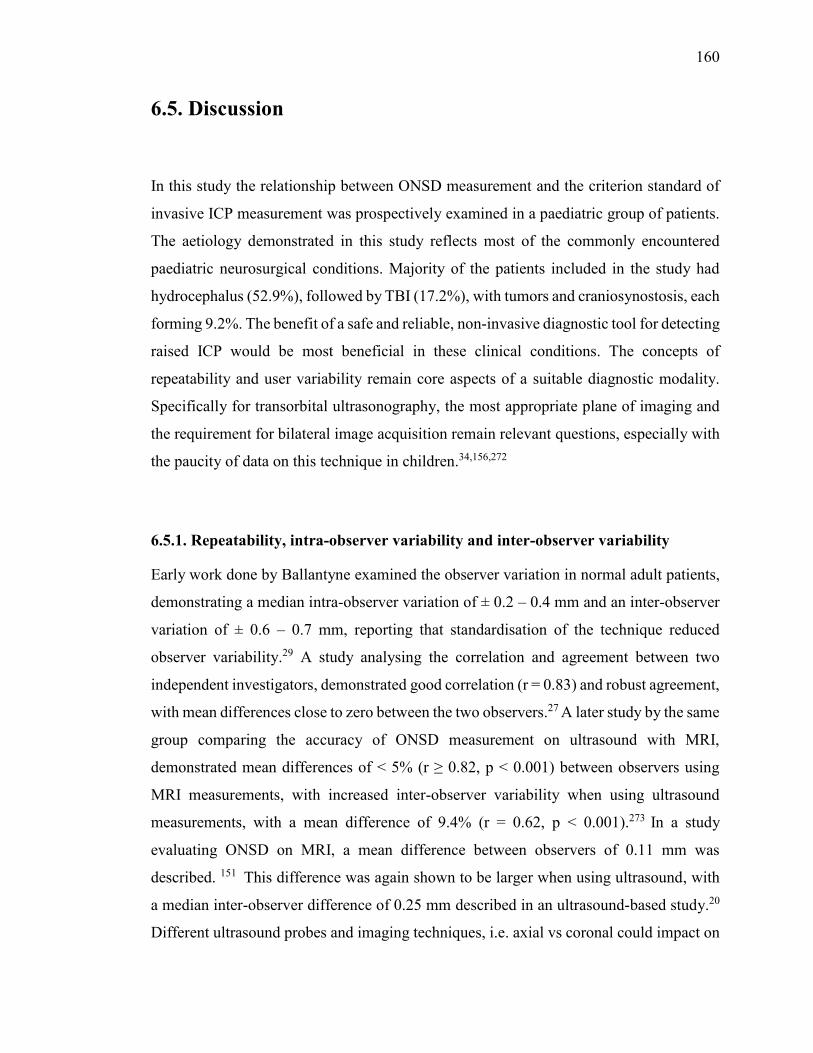
160
6.5. Discussion
In this study the relationship between ONSD measurement and the criterion standard of
invasive ICP measurement was prospectively examined in a paediatric group of patients.
The aetiology demonstrated in this study reflects most of the commonly encountered
paediatric neurosurgical conditions. Majority of the patients included in the study had
hydrocephalus (52.9%), followed by TBI (17.2%), with tumors and craniosynostosis, each
forming 9.2%. The benefit of a safe and reliable, non-invasive diagnostic tool for detecting
raised ICP would be most beneficial in these clinical conditions. The concepts of
repeatability and user variability remain core aspects of a suitable diagnostic modality.
Specifically for transorbital ultrasonography, the most appropriate plane of imaging and
the requirement for bilateral image acquisition remain relevant questions, especially with
the paucity of data on this technique in children.34,156,272
6.5.1. Repeatability, intra-observer variability and inter-observer variability
Early work done by Ballantyne examined the observer variation in normal adult patients,
demonstrating a median intra-observer variation of ± 0.2 – 0.4 mm and an inter-observer
variation of ± 0.6 – 0.7 mm, reporting that standardisation of the technique reduced
observer variability.29 A study analysing the correlation and agreement between two
independent investigators, demonstrated good correlation (r = 0.83) and robust agreement,
with mean differences close to zero between the two observers.27 A later study by the same
group comparing the accuracy of ONSD measurement on ultrasound with MRI,
demonstrated mean differences of < 5% (r ≥ 0.82, p < 0.001) between observers using
MRI measurements, with increased inter-observer variability when using ultrasound
measurements, with a mean difference of 9.4% (r = 0.62, p < 0.001).273 In a study
evaluating ONSD on MRI, a mean difference between observers of 0.11 mm was
described. 151 This difference was again shown to be larger when using ultrasound, with
a median inter-observer difference of 0.25 mm described in an ultrasound-based study.20
Different ultrasound probes and imaging techniques, i.e. axial vs coronal could impact on
161
ONSD measurement and inter-observer reliability with a reported adjusted difference of
0.21 mm between observers, using a ‘standard probe’.274 Lagreze also described smaller
coefficients of variation using MRI compared to ultrasound.231
The factors described by Bauerle et al 27,273 were specifically addressed in the current
study, by testing the relationship between repeat measurements performed in the same
plane of the same eye, as a test for repeatability, and by testing intra-and inter-observer
reliability. Three ONSD measurements were performed to allow adequate testing for the
repeatability of measurements. The results from this study demonstrated excellent
repeatability between each of the three ONSD measurements performed in the same plane
of each eye (α = 0.97 – 0.98, CA). These findings were consistent in both the axial and
sagittal plane.
The intra-observer variability was excellent with mean ONSD values of 5.56 mm (SD
0.85) and 5.58 mm (SD 0.84), from the first and second measurement respectively (α =
0.99, CA).
Inter-observer testing revealed a mean difference of 0.28 mm between observers. This is
consistent with other described values of 0.2 mm and 0.34 mm.17,20,28,34,274 Correlation
between the two observers was very good (r = 0.87, p < 0.001, PCC). These findings
confirm that ONSD measurement on ultrasound yields consistent and acceptable intra-
and inter-observer variability.
6.5.2. Sagittal versus axial plane and correlation of values between right and left eye
The ideal plane in which to measure the ONSD is still unclear. Axial images were usually
obtained because of the ease of acquisition and the size of the ultrasound probes used.
Early work by Hansen suggested that the axial plane provided more accurate
measurements,154 but this was based on a relatively small sample size and did not factor
in the benefit of the smaller footprint probes available today. As the ONS is not a perfect
sphere,260,275 there is likely to be some difference in the measurements acquired in different
planes, even if only minimal.
162
When evaluating the optimal plane for measurement, i.e. sagittal vs axial, this study
demonstrated a slight advantage in the sagittal plane over the axial plane (r = 0.66 vs r =
0.64). This difference however, was minimal, suggesting that measurement in either plane
was an acceptable option. This study allowed adequate imaging in the sagittal plane
largely because of the small footprint, high frequency probe used, a feature that
differentiates it from most other studies which used high frequency probes with a larger
footprint.23,30,33,234,241 Acquiring ONSD images in both planes and using the average of the
two measurements, where possible, is likely the safer alternative, given the variety of
probes available on the market. The image acquisition is also influenced by the
unfavourable intromission angle of 180˚ to the ON which limits lateral resolution and in
children the age of the child and size of the orbit also play an important role.34
Differences between measurements obtained in the left and right eye were analysed and
the results demonstrated a good correlation between ONSD values from both eyes (r =
0.9, p < 0.001, PCC). The benefit of using the mean value of ONSD measurements from
both eyes however, remains a logical option based on described individual anatomical
variation and the possibility of unilateral pathology.46,154 Given the findings from this
study and the excellent correlation demonstrated between the three measurements, if the
imaging quality is considered adequate, it may be acceptable to perform two
measurements in each eye, in either the sagittal or axial plane (depending on the probe
shape and size), and use the mean ONSD measurement for estimating ICP.
6.5.3. Analysis over the entire cohort
The linear relationship between ONSD and ICP has been described in a number of
publications, recommending the technique as a simple bedside method for non-invasively
assessing ICP.17,18,20,30,156,157 The diagnostic accuracy for raised ICP and the optimal cut-
off values are however, still unclear,31,157,261 making the relationship between ONSD and
ICP, a promising research avenue with significant clinical implications, particularly in
children.
163
Specific limitations of this technique have hampered its widespread use; these include
poor specificity, variation in the recommended ONSD cut-off values for predicting raised
ICP, inter-rater variability and a limited understanding of the elastic properties of the
ONS. The recommended ONSD cut-off value in adults ranges widely, from 4.1 – 5.9
mm.17-20,73,155 In children there are recommended age-related upper limits of ONSD
measurement. These age-related thresholds in children however, are inconsistent. Using
age at 1 year to define different upper limits of normality for ONSD was supported by
Ballantyne and Newman,29,30 while other authors recommend 4 years as the appropriate
age-related threshold.28,32 In a review by Moretti and Pizzi, age categories of < 1 year old,
1- 4 years old and > 4 years old were described with specific ONSD upper limits for each
cateogory.31
The issue of the optimal cut-off point is further limited by the sub-millimetric
measurements involved in this technique, the wide variation in individual baseline values
and limited knowledge about the elastic nature of the ONS.
Evaluating the entire patient cohort in this study, demonstrated a mean ONSD in the group
with ICP < 20 mmHg of 5.08 mm (SD 0.76), and in the group with ICP ≥ 20 mmHg of
6.28 mm (SD 0.64) (p < 0.001). The optimal ONSD cut-off point in this study for detecting
ICP ≥ 20 mmHg across the entire patient cohort, was 5.5 mm with good diagnostic
accuracy revealing a sensitivity of 93.2%, a specificity of 74% and an OR of 39.3 (Table
6.16). In a multivariate model adjusting for appropriate confounding variables, the OR
was adjusted to 26.9 (Table 6.10), suggesting that the likelihood of detecting an ONSD
measurement > 5.5 mm is 26.9 times higher in children with an ICP ≥ 20 mmHg than in
children with an ICP < 20 mmHg. In a recent systematic review, Dubourg at al describe
an even higher pooled diagnostic OR of 51, and recommended that a high sensitivity be
favoured over a high specificity when using sonographic ONSD measurement to estimate
ICP.157 It is worth noting that this review only included work done in adults.
The number of patients included in the present study made it possible to perform both
linear and logistic regression analyses. The described change in ONSD from a baseline
diameter of 4.03 mm, was 0.75 mm (95% CI: 0.62 – 0.88, R2 = 0.52, p < 0.001), after
controlling for age as a confounding variable, for every 10 mmHg change in ICP. This is

164
useful in describing the relationship between ONS distension and increase in ICP. This
relationship was weaker when ICP was ≥ 20 mmHg, i.e. 0.24 mm (95% CI: 0.09 – 0.5, R2
= 0.03, p = 0.16) for every 10 mmHg change in ICP, suggesting a variation in the response
of the ONS at different ICP thresholds. This is consistent with experimental data reporting
that ONSD distensibility differed at certain ICP thresholds, and likely approached a
maximum distensibility at higher ICP values.154,252 The described change in ONSD was
0.25 mm for every 10 mmHg increase in ICP in the Hansen study, but no baseline diameter
was described.154 These findings underscore the need to investigate the elasticity of the
ONS as a marker of its stiffness or distensibility.
The mean ONSD values, mean ICP values and relevant ONSD cut-off values in different
aetiologies have been described in the results section (Table 6.11). Despite the sample size
calculation in this study being based on age and not aetiology, the difference in
aetiological groups is noteworthy. The higher cut-off values detected for children with
craniosynostosis (6.17 mm) and lower cut-off values with intracranial cysts (4.5 mm)
suggest that aetiology may have a role to play in determining the baseline ONSD and the
response to an increase in ICP. While the mean ICP in these two groups was also
significantly different (p = 0.047, Student’s t-test), this finding does raise the concern that
ONSD cut-off recommendations should take aetiology into account.
The diagnostic accuracy of ONSD measurements were also examined at ICP thresholds
of 15 mmHg, 10 mmHg and 5 mmHg. The benefit of describing the ONSD at these ICP
thresholds relates to the lack of uniformity regarding the optimal treatment threshold for
raised ICP in children. Determining ONSD cut-off values at various ICP thresholds may
provide additional diagnostic benefit in a clinical environment.
The ONSD cut-off values with the best diagnostic accuracy for ICP ≥ 15 mmHg, ≥ 10
mmHg and ≥ 5 mmHg described in this study were 5.3 mm, 5.04 mm and 5 mm
respectively (Table 6.16). The diagnostic accuracy of ONSD was better for detecting an
ICP ≥ 20 mmHg than it was for and ICP ≥ 5 mmHg (OR of 39.5 vs. 4.01). These values
do support a significant overall relationship between ONSD and increasing ICP in this
study. The paediatric literature evaluating ONSD measurement suggests that age is very
likely a confounding factor.22,23,28,29,30,33 For this reason the historically described age

165
thresholds of 1 year old 29,30 and 4 years old 28,31 were used to subcategorise the data for
further analysis and comparison to published data.
6.5.1. Age-related threshold
This study was unique in that it described ONSD cut-off values for various ICP thresholds
and analysed the diagnostic accuracy of ONSD measurement for detecting ICP at
thresholds ranging from 20 to 5 mmHg. This analysis was performed in the specific age
categories, i.e. ≤ 1 year old and > 1 year old, and a subgroup analysis, i.e. ages > 1 to ≤ 4
years and > 4 years old.
≤ 1 year: the highest diagnostic accuracy for predicting ICP ≥ 20 mmHg was achieved
with an ONSD cut-off value of 5.16 mm, sensitivity of 80%, specificity of 76.1% and an
OR of 12.7 (Table 6.23). At ICP thresholds of 15 and 10 mmHg, the optimal ONSD cut-
off values were 4.97 mm and 4.3 mm, respectively (Table 6.18). There were no ICP
measurements under 5 mmHg in this age category. In children ≤ 1 year old, the diagnostic
accuracy of ONSD measurement for detecting an ICP ≥ 15 mmHg was the strongest, with
an OR of 29.6.
> 1 to ≤ 4 years: 39 patients fell into this age category. The optimal ONSD cut-off value
for detecting an ICP ≥ 20 mmHg was 5.92 mm, with a sensitivity of 82.6%, specificity of
81.3% and OR of 20.6 (Table 6.23). At ICP thresholds of 15, 10 and 5 mmHg, the optimal
ONSD values were 5.5, 5.4 and 5.2 mm respectively. Comparing these values to the next
age category, i.e. > 4 years old, demonstrated ONSD values that were at odds with
descriptions in the literature,31 as the optimal ONSD values described here were higher
than those in the > 4 years old category, making this age category less useful as a
recommendation.
> 4 years old: there were 79 patients in this age category. The optimal ONSD cut-off
value for detecting ICP ≥ 20 mmHg was 5.75 mm, with a sensitivity of 82.9%, specificity
of 71.1% and an OR of 11.9 (Table 6.28). The ONSD cut-off values described in this age
category were lower than in the previous category and similar to the results from children
aged > 1 year (Table 6.29).

166
Children above the age of 1 year were analysed as a combined group. A total of 118
children were included in this age category, with an optimal ONSD cut-off value of 5.75
mm for predicting an ICP ≥ 20 mmHg, sensitivity of 85.9 %, specificity of 70.4% and an
OR of 14.5.
The ONSD cut-off values in this study appear larger than the described historic values in
children,28, 29,30,33 but are similar to values reported more recently.34,237 A likely
explanation for this finding is the high frequency, small footprint probe used, which
provides excellent image quality, allowing clearer identification of the ONS borders.34,237
The group of patients analysed in this study were under general anaesthesia, and were
already due have a surgical procedure, which potentially biases the results, especially
when comparing them to existing literature in children, which are almost entirely based
on a clinical and image-based suspicion of raised ICP.23,28,29,30,31,32,33 The value of 5.75
mm for predicting an ICP ≥ 20 mmHg in older children described in this study was
consistent with some of the adult literature.17,20,31,151
The described ONSD cut-off values at 15, 10 and 5 mmHg respectively are interesting
findings, as they underscore the relationship between ONSD and increasing ICP, and
possibly serve to flag patients at potential risk of developing raised ICP, in the correct
clinical context.
The relationship between ONSD and ICP in children below the age of 1 year appeared
less robust than this relationship in children older than 1 year (r = 0.65 vs. r = 0.7).
Interestingly though, the ONSD cut-off value of 4.3 mm for predicting an ICP ≥ 10
mmHg, was consistent with values described by Newman et al,30 suggesting that some
children in this group may become clinically symptomatic at an ICP above 10 mmHg. The
best OR in children above and below the age of 1 year was described for detecting and
ICP ≥ 15 mmHg (OR 42.9 and 29.6, respectively).
The ONSD cut-off values at various ICP thresholds described in this study (Table 6.27)
may be quite helpful in decision-making where patients are thought to be at risk of raised
ICP. Even though 20 mmHg may represent a preferred treatment threshold, described in

167
children with TBI 111,276 in some centres, this threshold may differ in other centres treating
children.
v) Anterior Fontanelle (AF)
Current literature in children suggests an age-related upper limit of ONSD to best detect
raised ICP.28-34 The studies on which these recommendations were based however, largely
compare ONSD to clinical and image-based estimates of ICP. The age-related ONSD
values recommended for children can be quite useful, but the lack of uniformity makes
the question of the appropriate upper limit of ONSD in children more difficult to
determine. Data from this study support the use of age at 1 year as an appropriate age at
which to describe different ONSD cut-off values for detecting raised ICP in children
(Table 6.27). The difficulty however, lies in using very different values for children that
may be just above or below the age of 1 year, based on absolute age-related cut-off values.
This can be quite problematic, given the physiological heterogeneity encountered in
children of similar age.
In an effort to simplify and improve the implementation of ONSD measurement in
children, this study evaluated the patency of the AF as a clinical marker for determining
the upper threshold of ONSD in children, and compared these findings to using age at 1
year.
The ONSD measurements listed in table 6.42 serve to demonstrate the significant
difference between the two groups when using patency of the AF as a physiological
threshold. This finding makes clinical and physiological sense as the open AF serves as a
reliable clinical window for assessing ICP in neonates, and as such the measurement of
ONSD in this group of patients is potentially less of a requirement. The presence of this
natural window suggests that compliance of the bony skull is still present, making the
displacement of CSF along the subarachnoid space somewhat unreliable, as explained by
the Monroe-Kellie doctrine. Therefore using transorbital ultrasound ONSD measurement
after the AF has closed is conceivably a physiologically more balanced approach, where
the need for a reliable, non-invasive technique to detect raised ICP becomes more prudent.

168
In patients with an open AF the ONSD measurement that best predicted an ICP of ≥ 20
mmHg was 5.16 mm, compared to 5.81 mm in patients with a closed fontanelle (p =
0.007). This difference in ONSD cut-off values between the two groups was consistent at
ICP thresholds of 15 and 10 mmHg. None of the patients in this study who had an open
AF also had an ICP reading below 5 mmHg, hence no recommendation was made
regarding the optimal ONSD cut-off for ICP < 5 mmHg in this group. The correlation
between ONSD and ICP was also much better in children with a closed AF than those
with an open AF (r = 0.7 vs r = 0.56, p < 0.001, PCC).
In this study, the ONSD measurements in children with a closed AF compare very well
with those for children over the age of 1 year old, for all the described ICP thresholds.
(Table 6.47).
ICP threshold (in mmHg)
ONSD cut-off in children over 1 year old (in mm)
ONSD cut-off in children with a closed AF (in mm)
≥ 20 5.75 5.81
≥ 15 5.49 5.50
≥ 10 5.20 5.20
≥ 5 5.10 5.00
Table 6.43. ONSD cut-off values in children > 1 year old and children with a closed AF
vi) Limitations
This study was conducted on patients undergoing anaesthesia and a neurosurgical
procedure. Despite efforts to control for possible confounding variables, this may bias the
results when compared to studies performed on awake patients. Assessment of the
presence and patency of the AF remains a subjective clinical marker, albeit a reliable one.
Palpation to determine whether the AF is normal, bulging or sunken could potentially vary

169
depending on patient position and examination technique; however, assessment of the AF
is a fundamental clinical tool which all paediatric clinicians should be comfortable with.
The use of this clinical assessment as a marker for describing ONSD upper limits may
therefore be more helpful than using different values for children that are 1 year old versus
those that are only slightly older. The described inter-observer variability in this study,
while consistent with descriptions in the literature, needs to be factored into the
interpretation of the findings. The ONSD values were compared to the initial and most
stable ICP value at surgery, ideally the ICP trend and repeated ONSD measurement
should be evaluated to determine the relationship between between these two parameters.
6.6. Conclusion

170
This study aimed to validate the technique of sonographic ONSD measurement by
comparison to directly measured ICP in a large cohort of paediatric patients. A good
correlation between ONSD and ICP was demonstrated, with age at 1 year supported as an
appropriate age at which to define different ONSD cut-off values for detecting raised ICP
in children. Additionally, use of the AF was recommended as a more suitable clinical
marker than age for defining these different ONSD cut-off values in children. Results from
this study may likely serve as a platform for further work and recommendations using
ONSD measurement to estimate ICP in children.

171
SECTION C
Chapter 7. Dynamic assessment of the ONS
7.1. Theoretical background
The current technique of ONSD measurement involves static ultrasound image acquisition
to determine the size of the ONS. The literature generally supports a good level of
diagnostic accuracy for this technique.31,157,158 The static imaging technique however,
provides limited information about the elasticity of the ONS and we therefore have little
idea about the degree to which the ONS is distended from its baseline value. Hansen and
colleagues describe a variation in the response of the ONS after exposure to different ICP
levels and for different lengths of time, reporting that the tensile characteristics of the ONS
have an influence on its response to change in ICP.50 The challenges when interpreting the
ONSD measurement present mostly in cases where the sheath elasticity is low or where
the ability to return to its baseline size is impaired.154,252 An improved understanding of
the elastic nature and subsequent distensibility of the ONS which ultimately determine it’s
reponse to change in ICP, would add significantly to our current understanding. A
dynamic assessment of the ONS response under conditions of normal and raised ICP could
provide valuable information regarding the elastic nature and distensibility of the ONS.
Available literature describing a dynamic assessment of the ONS, generally compare the
ONSD measured before and after a particular intervention or involve dynamic assessment
of ocular blood flow using Doppler flow measurement. There are currently no data
specifically evaluating the dynamic response of the ONS as a direct function of pulsation
induced motion.
The importance of evaluating the distensibility and elastic characteristics of the ONS were
perhaps best emphasised in the study by Hansen.252 This was a post-mortem study
performed on 10 optic nerve preparations, demonstrating that the ONS did not completely
return to it’s baseline value after reduction in the SAS pressure, especially when the
applied pressure exceeded 45mmHg. The investigators reported that the elastic properties

172
of the sheath influenced it’s capability to retract after exposure to high pressures,
suggesting that the ONSD be interpreted with caution in certain circumstances due to an
observation they call the ‘plastical deformation’ of the ONS.252
The ‘dynamic change’ in ONSD due to hyperventilation induced CO2 fluctuation,was
examined in 14 patients undergoing anterior cervical spine surgery. The study described
a rapid response in ONSD caused by change in ETCO2. The investigators used a flexible
clamp to hold the ultrasound probe in position in order to assess the dynamic response.
The ONSD was measured at two seperate ETCO2 levels, i.e. 30 mmHg and 40 mmHg and
at 1 and 5 minutes after reaching each of these levels, demonstrating a significant change
between the ONSD values.277
Drainage of CSF to reduce ICP and the subsequent change in ONSD measurement was
reported by Moretti and Pizzi (20). This study was performed on 63 adult patients
presenting with SAH (n = 34) or ICH (n = 29). The mean ONSD was 6.16 ± 0.57 mm in
patients with an ICP > 20mmHg, and 5.0 ± 0.49 mm in the group with low ICP. The
ONSD decreased from 5.89 ± 0.61 mm to 5 ± 0.33 mm in cases where CSF was released
to control ICP. The optimal ONSD cut-off for identifying an ICP > 20 mmHg was 5.2 mm
(sensitivity of 93.1%, specificity of 73.85%).20
The use of mannitol to control increased ICP and the rate of ONSD variation was
described in a study evaluating 13 severe TBI patients. The median ONSD prior to
mannitol osmotherapy was 6.3 mm (6.1 - 6.7) versus 5.7 mm (5.5 – 6.3) (p = 0.0007) after
mannitol administration, with a change in median ICP from a baseline of 35 mmHg to 25
mmHg. TCD derived pulsatility indices also showed a significant decrease after mannitol
administration. The authors conclude that change in ONSD can be useful to monitor
interventions such as osmotherapy, but cautioned that there was some heterogeneity in the
ONSD response to changes in ICP.278
Using ultrasound analysis of the ONS, Whiteley and colleagues aimed to determine
whether ICP increased to > 20 mmHg during robot-assisted laparoscopic radical
prostatectomy (RARLP).279 Initial measurement of the ONSD was performed after
induction of general anesthesia and then again at the end of the procedure. The mean

173
preoperative ONSD was 4.5 ± 0.5 mm, and the mean post-operative ONSD was 5.5 ± 0.5
mm. A 10 mmHg rise in MAP resulted in a 0.023 mm increase in postoperative ONSD.
Based on the ONSD findings, the authors concluded that ICP rises to > 20mmHg during
RALRP surgery 279 A similar study, also during RALRP surgery demonstrated a 12.5%
increase in ONSD after CO2 pneumoperitoneum and steep Trendelenberg positioning.280
The change in ONSD related to a ‘quick’ change in ICP was studied in 18 ventilated, TBI
patients. ONSD measurements were taken 30-60 seconds prior to suctioning, during
suctioning and 30-60 seconds after suctioning of the endotracheal tube (ETT). ICP
increased to > 20 mmHg in all patients during ETT suctioning, which was associated with
an increase in the ONSD to > 5 mm, with both parameters returning to baseline after
suctioning. Correlation between ONSD and ICP was good (R2 = 0.8). An ONSD cut-off
value of > 5.0 mm to detect ICP > 20 mmHg, demonstrated a sensitivity of 94%,
specificity of 98%, confirming that ultrasonography of the ONSD is accurate to detect not
only increased ICP but also immediate changes in ICP.281
Aiming to describe the ONSD response to LP and its potential for detecting raised ICP
Bauerle et al. studied 10 newly diagnosed patients with IIH, comparing the findings to 25
control patients. The study describes an optimal ONSD cut-off value of 5.8mm and a
significant reduction in ONSD after LP.156
Karakitsos and colleagues reported that patients with an OND measurement of > 5.9 mm
(sensitivity of 74% and specificity of 65%) and a 2.5 mm increase in OND between
repeated measurements (sensitivity of 81% and specificity of 70%) had a high probability
to progress to brain tamponade and death.
The mean admission OND measurement of 4.84 ± 1.2 mm in the brain injury patients was
significantly higher than that found in the control group at 3.49 ± 1.1 mm (p < 0.001).282
A recent case report also describing a decrease in ONSD measurement in a patient with
idiopathic intracranial hypertension (IIH), used measurements 30 minutes prior to and 30
minutes after performing the LP. The opening and closing CSF pressures were measured
via CSF manometry, demonstrating a ‘real-time’ reduction in ONSD, within 30 minutes
of LP induced pressure changes.283

174
The only other description involving dynamic assessment of the ONS, uses Doppler
sonography to assess blood flow. A novel and promising dynamic technique described by
Querfurth et al 284 involved color Doppler imaging to to measure arterial pulsatility indices
for both the OA and CRA. By combining an adaptation of the Balliart
ophthalmodynamometer, the VOP measured by CRV occlusion was combined with the
arterial pulsatility indices to create an empiric index using venous and arterial parameters
(VOP / Gosling Pulsatility Index [GPI]), which correlated better with absolute ICP (r =
0.95, p < 0.005, ICP = 0.29 + 0.74 [VOP/ GPI (OA)]) than either parameter alone. Studies
by the same group described ocular hemodynamics, using colour Doppler sonography to
measure blood flow velocity and resistance indices in the OA, CRA and vODM and
demonstrated a good relationship with actual ICP at mild to moderately elevated
levels.285,286
Using spectral Doppler imaging to determine the blood flow velocity in the CRA and
CRV, Miller and co-workers demonstrated a reduction in these parameters in children
with elevated ICP.287
Data on this technique in children is quite sparse, as most studies evaluating the dynamic
orbital and optic nerve blood flow using colour Doppler have been described in the context
of diabetic retinopathy and other vascular eye disease.288,289
A very promising study performed in patients with glaucoma, evaluated the relationship
between ONSD and retrobulbar blood flow velocity using colour Doppler imaging (CDI).
The authors demonstrated that there was a negative correlation between ONSD and
retrobulbar flow velocities in glaucoma patients but not in healthy patients, concluding
that the pressures determining the ONSD can have a significant impact on ocular blood
flow. This study makes an interesting comment regarding the elasticity of the ONS and
its potential effect on the ONSD and ocular blood flow.292

175
Summary – available literature describing dynamic assessment of the ONSD
Change in ONSD measurements performed before and after interventions including
hyperventilation, drainage of CSF, administration of mannitol , tracheal manipulation and
LP appear to correlate well with the induced change in ICP.20,156,277,278,281,156 These
reported changes in ONSD are useful in understanding the relationship between the ONS
and ICP. The variability in the ONS response depending on the degree of ICP elevation,
time of exposure and underlying elastic nature of the ONS described by Hansen, however,
is still an important factor.50,68,154,252 The described techniques assessing dynamic ocular
blood flow velocity using Doppler imaging are certainly promising,284-287,292 but as the
authors acknowledge, still require validation in larger studies.
The use of a dynamic imaging technique to detect pulsatile motion of the ONS and
subsequent variation in this motion has not been described before. The possibility that
such a technique could allow us some insight into the elastic nature and response of the
ONS and evaluate differences in this elasticity at high and low ICP states is a promising
one. The final section of this work describes a novel technique for analysing the pulsatile
motion of the ONS and its possible relationship with ICP.
7.2. Relationship between pulsatile dynamics of the optic nerve sheath and intracranial pressure: an exploratory in-vivo investigation
176
7.2.1. Introduction
The relationship between ICP and optic nerve sheath diameter (ONSD) has been described
by several authors, but with varying accuracy.17,18,20,30,156,157 As discussed in the previous
section of this work, the relationship between the ONSD and ICP in children is important,
but may involve a number of confounding variables. In children, age above or below 1
year and patency of the AF play an important role in defining ONSD cut-off values. The
elastic nature of the ONS however, remains a poorly understood factor in its response to
changes in ICP.
The final part of this study describes a novel, dynamic imaging analysis aimed at
evaluating the motion of the ONS. An increase in ICP resulting in CSF displacement and
subsequent distension of the ONS may lead to increased stiffness of the sheath. Analyzing
ONS dynamics may then provide information that is complementary to the static
measurements of ONSD. The objective of this part of the study was therefore to develop
a method for analyzing in-vivo dynamic properties of the ONS using transorbital
ultrasound imaging, and to investigate a possible relationship with ICP. This work was
based on the idea that cardiovascular pulsation, (i.e. caused directly by arterial pulsation,
or transmission of pulsatility through the CSF) induced motion of the ONS. Hypothesizing
that the ONS becomes stiffer with increasing ICP, it was suggested that the transverse
motion (i.e. perpendicular to the ONS) was more equal on each side of the sheath with
high ICP compared to normal ICP. This was quantified by the absolute difference between
the transverse pulsatile displacements on the left (dLeft) and right (dRight) side of the ONS,
normalized by the sum of displacements. The value of this parameter indicates how much
the ONS deforms during cardiovascular pulsation, and was therefore interpreted
physically as a measure of deformability, and referred to as the deformability index.
(Figure 7.1)

177
∆=|𝑑𝐿𝑒𝑓𝑡 − 𝑑𝑅𝑖𝑔ℎ𝑡|
𝑑𝐿𝑒𝑓𝑡 + 𝑑𝑅𝑖𝑔ℎ𝑡
Figure 7.1 Formula for defining the Deformability Index Δ
According to the hypothesis, since the ability to deform was inversely related to
stiffness,297,298 this parameter was expected to be smaller in the group with ICP ≥ 20
mmHg when compared to the group with ICP < 20 mmHg.
7.2.2. Methodology
i. Patients
This was an exploratory research study, retrospectively analyzing data from 16 patients
(age ≤ 14 years old) managed at the Red Cross War Memorial Children’s Hospital
(RCWMCH) (Cape Town, South Africa). This study was nested within the parent study
evaluating the relationship between ONSD and invasively measured ICP, and formed part
of a collaborative research initiative between the Department of Neurosurgery at the
University of Cape Town (UCT) and The Foundation for Scientific and Industrial
Research (SINTEF), Trondheim, Norway. Inclusion criteria were the same as described
in the previous section of this work.

178
ii. Image acquisition
A single investigator experienced in the use of transorbital ultrasonography acquired
ultrasound images from both eyes, using a 15 MHz linear array probe (L15-7io, Philips,
Bothell, USA). All images were acquired after the patients were anaesthetised, intubated
and being mechanically ventilated, prior to insertion of the invasive ICP monitor. The
image acquisition technique was the same as for measurement of the ONSD described in
the earlier section of this work. The acquired dynamic/video images ranged in length from
5 to 10 seconds per eye and were all acquired in the axial plane, for uniformity. The elbow
of the investigators dominant arm was stabilised against the bed to further minimise
movement during image acquisition. The machine settings were exactly the same as for
the static image acquisition. Physiological parameters were recorded at the time of image
acquisition as in the ONSD measurement technique. Ultrasound acquisition was
performed when the haemodynamic parameters were stable. The image depth varied from
3 to 5 cm, and spatial image resolution from 0.06 to 0.11 mm per pixel. The temporal
resolution varied from 40 to 56 frames per second.
iii. Image processing
The anonymised imaging data were then processed by the engineers at SINTEF, and the
analysis was performed according to anatomical specification agreed upon by the
neurosurgery and engineering team. The acquired images were then magnified to the
required size to identify specific regions on either side of the ONS complex before image
processing.(Figure 7.2) The objective of the image processing was to utilise the high
temporal resolution of the ultrasound images for analyzing motion related to
cardiovascular pulsation on each side of the ONS.
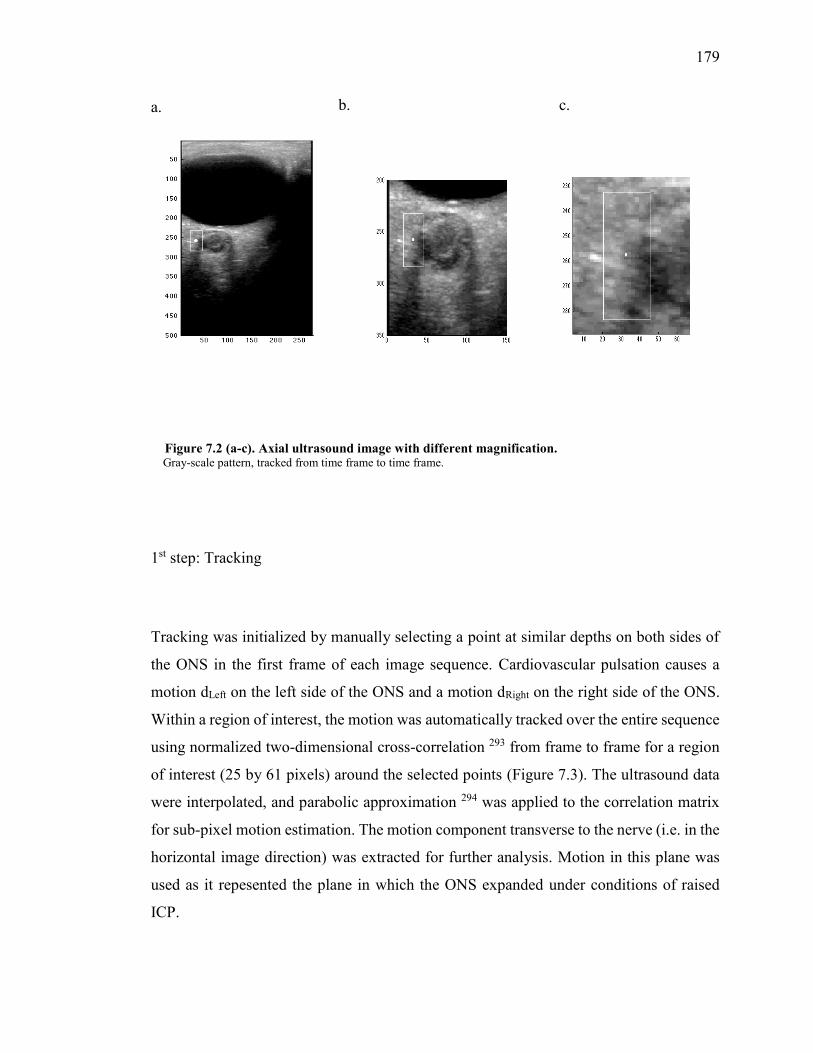
179
a.
b.
c.
Figure 7.2 (a-c). Axial ultrasound image with different magnification. Gray-scale pattern, tracked from time frame to time frame.
1st step: Tracking
Tracking was initialized by manually selecting a point at similar depths on both sides of
the ONS in the first frame of each image sequence. Cardiovascular pulsation causes a
motion dLeft on the left side of the ONS and a motion dRight on the right side of the ONS.
Within a region of interest, the motion was automatically tracked over the entire sequence
using normalized two-dimensional cross-correlation 293 from frame to frame for a region
of interest (25 by 61 pixels) around the selected points (Figure 7.3). The ultrasound data
were interpolated, and parabolic approximation 294 was applied to the correlation matrix
for sub-pixel motion estimation. The motion component transverse to the nerve (i.e. in the
horizontal image direction) was extracted for further analysis. Motion in this plane was
used as it repesented the plane in which the ONS expanded under conditions of raised
ICP.
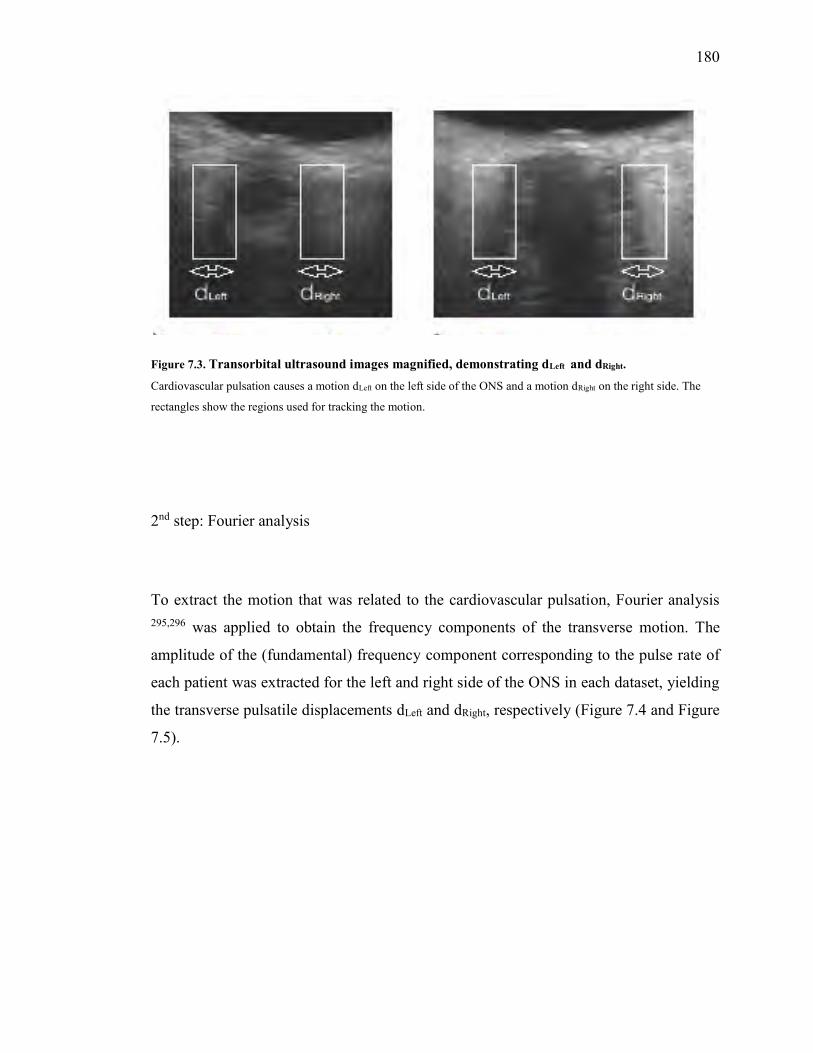
180
Figure 7.3. Transorbital ultrasound images magnified, demonstrating dLeft and dRight.
Cardiovascular pulsation causes a motion dLeft on the left side of the ONS and a motion dRight on the right side. The
rectangles show the regions used for tracking the motion.
2nd step: Fourier analysis
To extract the motion that was related to the cardiovascular pulsation, Fourier analysis 295,296 was applied to obtain the frequency components of the transverse motion. The
amplitude of the (fundamental) frequency component corresponding to the pulse rate of
each patient was extracted for the left and right side of the ONS in each dataset, yielding
the transverse pulsatile displacements dLeft and dRight, respectively (Figure 7.4 and Figure
7.5).
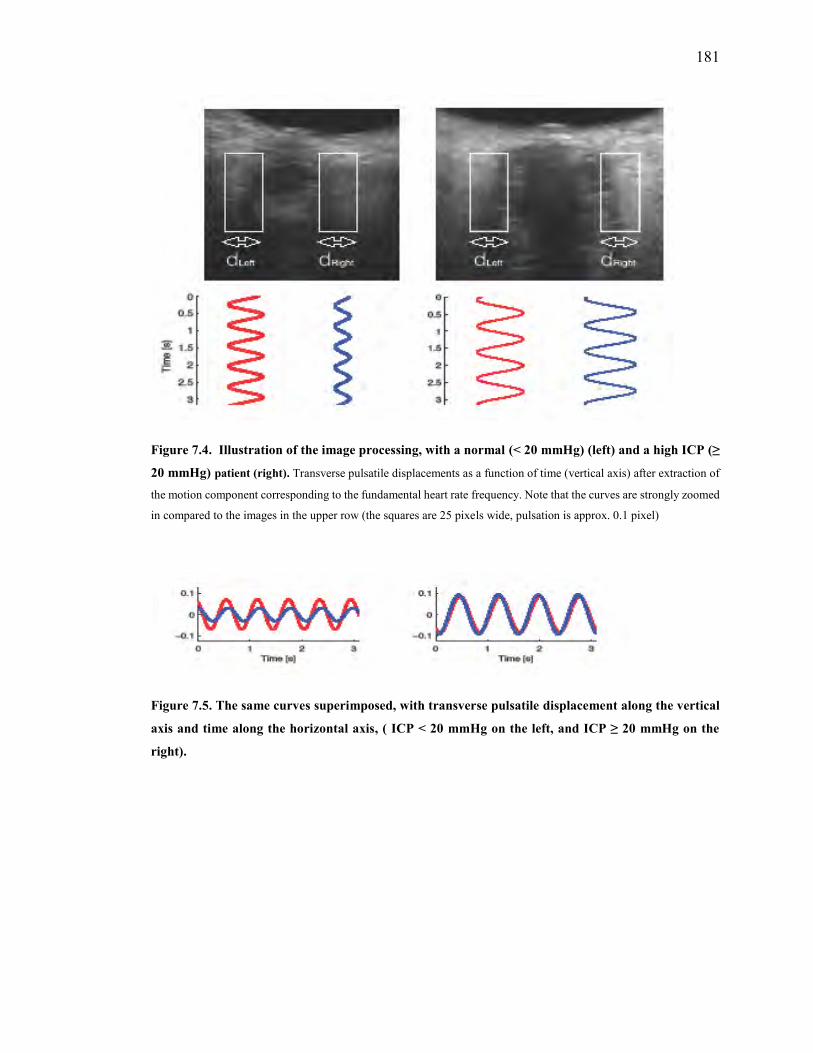
181
Figure 7.4. Illustration of the image processing, with a normal (< 20 mmHg) (left) and a high ICP (≥
20 mmHg) patient (right). Transverse pulsatile displacements as a function of time (vertical axis) after extraction of
the motion component corresponding to the fundamental heart rate frequency. Note that the curves are strongly zoomed
in compared to the images in the upper row (the squares are 25 pixels wide, pulsation is approx. 0.1 pixel)
Figure 7.5. The same curves superimposed, with transverse pulsatile displacement along the vertical
axis and time along the horizontal axis, ( ICP < 20 mmHg on the left, and ICP ≥ 20 mmHg on the
right).

182
iv. Data analysis and statistics
Since the data were retrospectively analyzed, we expected some out-of-plane motion.,
Despite stabilising the arm during image acquisition, there was likely still some movement
which caused this out-of-plane motion. This out-of plane motion is known to deteriorate
correlation-based tracking. 293,294 To address and compensate for this issue, each dataset
was graded with regard to acquisition-based artefactual movement, by one blinded
operator. The grading was performed on a scale from 0-2 as described below:
- Grade 0: steady acquisition, barely perceivable probe movement - Grade 1: perceivable probe motion, no loss of ONS appearance - Grade 2: distinct probe movement, with some loss of ONS appearance
The motion analysis was run five times for the left and five times for right side of the
ONS, in both eyes for each dataset (appendix III). This was to account for variability due
to the manual initialization of the tracking region. The mean of the five displacement
values was used as the motion estimate, and the variation was quantified using pooled
standard deviation.
Δ was calculated using equation (1), and one-sided Mann-Whitney U-test was used to
statistically compare the two groups. Diagnostic accuracy was investigated using receiver
operating characteristic (ROC) curves. The algorithm was then implemented in Matlab
for analysis. (MathWorks, Natick, MA, USA).

183
7.2.3. Results
Sixteen patients were included in this analysis. The median age in the group with ICP <
20 mmHg was 45 months (IQR 9.5 – 83), and the median age in the group with ICP ≥ 20
mmHg was 80 months (IQR 35.5 – 122) (p = 0.3). Demographic and physiological data
are summarised in table 7.1.
Patient Age (months) Gender Heart rate (bpm) Diagnosis ICP
(mmHg)
A 120 M 78 Posterior fossa tumour (hydrocephalus) 28
B 116 F 103 Hydrocephalus 33
C 132 M 168 Trauma 32
D 33 M 117 Posterior fossa tumour (hydrocephalus) 37
E 24 F 92 Hemispheral tumour 20
F 124 F 112 Hydrocephalus 30
G 38 F 69 Hydrocephalus 26
H 44 M 134 Hydrocephalus 36
I 36 M 100 Tethered cord 10
J 9 M 150 Hydrocephalus 8
K 72 F 92 Chiari1malformation 5
L 54 M 102 Spinal dysraphism 10
M 144 M 80 Hydrocephalus 10
N 10 M 120 Hydrocephalus 11
O 8 M 130 Hydrocephalus 10
P 94 M 103 Trauma 10
Table 7.1. Patient data

184
A total of thirty two datasets were analysed from all sixteen patients initially, including
those with out-of plane motion artefact.(Table 7.2) The transverse pulsatile displacement
on each side of the ONS was assessed five times for each dataset (individual
measurements included in appendix III). The mean value of transverse pulsatile
displacement dLeft and dRight of the ONS for both eyes yielded a value of 8.3 (SD 0.54),
measured in percentage of a pixel.
Seven datasets were scored as grade 2 by the blinded operator and were subsequently
excluded, leaving twenty five datasets for further analysis. The twenty five datasets were
analysed according to ICP and divided into a group with ICP ≥ 20 mmHg, and a group
with ICP < 20 mmHg, comprising ten and fifteen datasets, respectively.(Table 7.3)

185
Patient Left eye Right eye
dLeft dRight Δ dLeft dRight Δ
Group with ICP ≥ 20mmHg
A 8.12 8.99 0.05 7.34 1.55 0.65*
B 7.76 8.75 0.06 9.88 9.23 0.03
C 3.08 6.25 0.34* 2.73 3.42 0.11
D 5.17 4.17 0.11 9.13 11.42 0.11
E 15.37 13.58 0.06 13.74 17.44 0.12
F 20.49 26.12 0.12 12.81 10.87 0.08
G 4.78 11.23 0.40* 11.22 9.79 0.07
H 6.76 5.37 0.11 3.51 5.97 0.26*
Group with ICP < 20 mmHg
I 5.65 3.16 0.28 2.52 3.78 0.20
J 4.01 1.83 0.37 5.70 3.63 0.22
K 13.68 8.38 0.24 7.22 3.04 0.41
K 7.98 4.60 0.27 9.12 11.78 0.13
M 17.47 10.64 0.24 13.84 12.23 0.06*
N 5.20 3.62 0.18 1.52 5.69 0.58
O 15.94 16.83 0.03* 8.15 3.96 0.35
P 4.90 5.61 0.07* 5.52 10.32 0.30
Table 7.2. Results from analysis of all included datasets Transverse pulsatile displacements dLeft and dRight were measured in percentage of a pixel. * Values that are wrongly classified using a cut-off value of 0.121.

186
The DI (Figure 7.1) of the ONS was then calculated for each dataset. The median DI was
Δ = 0.11 for the group with ICP ≥ 20 mmHg, compared to Δ = 0.24 for the group with
ICP < 20 mmHg (p = 0.002, Mann-Whitney U-test). Fig 7.6 shows a boxplot illustrating
the median and spread for each group.

187
Patient Left eye Right eye
dLeft dRight Δ Grade dLeft dRight Δ Grade
Group with ICP ≥ 20 mmHg
A - - - 2 - - - 2
B 7.76 8.75 0.06 1 9.88 9.23 0.03 1
C - - - 2 2.73 3.42 0.11 1
D 5.17 4.17 0.11 1 - - - 2
E 15.37 13.58 0.06 0 13.74 17.44 0.12 1
F 20.49 26.12 0.12 1 - - - 2
G - - - 2 11.22 9.79 0.07 1
H 6.76 5.37 0.11 1 3.51 5.97 0.26* 0
Group with ICP < 20 mmHg
I 5.65 3.16 0.28 0 2.52 3.78 0.20 0
J 4.01 1.83 0.37 1 5.70 3.63 0.22 0
K 13.68 8.38 0.24 1 7.22 3.04 0.41 0
L 7.98 4.60 0.27 1 9.12 11.78 0.13 0
M 17.47 10.64 0.24 0 - - - 2
N 5.20 3.62 0.18 0 1.52 5.69 0.58 1
O 15.94 16.83 0.03* 1 8.15 3.96 0.35 0
P 4.90 5.61 0.07* 0 5.52 10.32 0.30 1
Table 7.3. Results from analysis where datasets with out-of-plane motion (grade 2) were excluded Transverse pulsatile displacements dLeft and dRight were measured in percentage of a pixel. * Values that are wrongly classified using a cut-off value of 0.121.

188
Figure 7.6. Box and whisker plot: DI in ICP ≥ 20 mmHg (high ICP) and < 20 mmHg (normal ICP).
Choosing a cut-off value of Δ = 0.121 demonstrated a sensitivity of 90% and a specificity
of 87%. AUROC was 0.85 (95% CI: 0.61- 0.97). Three out of twenty five (12%) datasets
would be wrongly classified using this cut-off value.(Figure 7.7)
Figure 7.7. Receiver operator curve for a cut-off value of Δ = 0.121. Demonstrated a sensitivity of 90%, a specificity of 87% and an AUC of 0.85.

189
7.2.4. Discussion
The hypothesis of this study was that increased ICP leads to increased stiffness (i.e.
reduced deformability) of the ONS. The aim of this study was therefore to develop a
method for analyzing the pulsatile dynamic properties of the ONS as a marker of sheath
stiffness, using transorbital ultrasound imaging, and to further investigate a possible
relationship with ICP. The DI was formulated as an index to quantify the measurable
displacement of the ONS during the captured pulsatile dynamic imaging of the ONS. The
arterial architecture and it’s variability within the ONS, described in chapter 2, played an
important role in the decision to perform measurements on both the left and the right side
of the ONS, and calculate the relative motion, resulting in formulation of the DI.
The most important finding of this study was the difference between the deformability of
the ONS in the group with ICP ≥ 20 mmHg compared to the group with ICP < 20 mmHg,
thus clearly supporting the hypothesis. ROC analysis demonstrated an AUC of 0.85, and
suggested a cut-off value of Δ = 0.121, with lower values indicating ICP mmHg and higher
values indicating ICP < 20 mmHg in this study.
The main limitations of this study were the relatively small number of patients, and the
fact that the analysis was performed retrospectively and not in a blinded fashion. The
peadiatric cohort examined may warrant further validation of the technique in an adult
study population. Further, although an exploratory research design was suitable for
providing insight into the unknown relation between ONS motion and ICP, this may limit
the ability to draw definite conclusions. Not withstanding these limitations, the difference
between the two groups in this study appears convincing. These are however preliminary
data and care should be taken not to overestimate the value for patient-specific diagnosis.
It has been shown previously that the retrobulbar segment of the ONS is distensible and
therefore dilates when ICP is increased.28,46,50,56 The technique of ONSD measurement
has gained steady support as a non-invasive surrogate marker of raised ICP.16-34 However,
measurement of the ONSD alone has not yet provided a completely accurate assessment
of ICP, largely because the described optimal cut-off value for ONSD measurement in
patients has varied considerably.23,28-33,157,261 Data from SECTION C of this study
supported the use of ONSD as a marker of raised ICP in children, but the described

190
variability in diagnostic accuracy underscores the need to explore the dynamic nature of
the ONS. The noted variation in ONSD between studies is likely due to a more complex
relationship between the ONS and ICP.154,252 The magnitude of ONS distension caused by
the increase in pressure within the subarachnoid space may depend on a variety of factors,
including the degree to which ICP is increased, the rapidity of the increase in ICP and the
elastic characteristics of the ONS, all of which influence the capability for distension and
retraction of the ONS.252 The relationship between ICP and nerve sheath distension is
therefore integrally related to the stiffness of the sheath itself.
This study investigated how pulsatile forces deform the ONS dynamically during the
cardiac cycle, rather than the absolute distention related to the increased pressure within
the ONS. This approach may contribute to an overall improvement in assessing the ONS
in cases of suspected increased ICP, either as an individual marker or by augmenting the
interpretation of ONSD measurements. The concept of pulsatile dynamics of the ONS
could also improve specificity when compared to ONSD measurement alone, by
differentiating between pathological distension of the ONS due to raised ICP and a
widened ONS not related to raised ICP.
Since the data were retrospectively analyzed, image acquisition was not optimized with
respect to avoiding out-of-plane motion, which may deteriorate correlation-based
tracking. To investigate the effect of the out-of-plane motion, we also processed the
excluded datasets. We found that if all datasets were included (Table 7.2) the median of
the group with ICP ≥ 20 mmHg and the group with ICP < 20 mmHg would still be
significantly different (p = 0.03). However, the AUC would be reduced to 0.69 (95% CI:
0.46-0.87), and 7 out of 32 datasets (22%) would have been wrongly classified. The
example in Fig 7.8, shows the influence of out-of-plane motion for the (excluded) right
eye dataset of patient A. In this dataset, a clear out-of-plane motion occurs at
approximately 3 seconds into the sequence. An option for this dataset might therefore be
to constrain the analysis to the period from 4 to 10 seconds. Instead, we chose to let one
blinded operator grade the datasets, and exclude those interpreted to have extensive out-
of-plane motion (grade 2). Although improving the quality of the study, the grading is to
some extent subjective, with no definite cut-off. Indeed, some out-of-plane motion could
still be seen in some of the remaining images (grade 1), and might therefore still be an

191
explanation to why the approach failed for some of the remaining datasets (12%). The
possibility of minimizing out-of-plane motion by further stabilisation of the image
acquisition technique should be taken into account in protocols for future studies.
Also, the calculated displacements were small, and extracted by extensive spatial (region
of interest window) and temporal (Fourier) averaging. Accuracy, reproducibility and
possible technical refinements of this novel ultrasound processing method should be
further studied. Finally, it could be of interest to consider additional information, e.g.
longitudinal motion, phase content of the Fourier transform (i.e. delay between motion at
left and right side of the nerve) and perhaps other motion components than the
fundamental heart rate frequency.
Figure 7.8. Illustrating the effect of out-of-plane motion (patient A, right eye)

192 The upper row in Figure 7.8. shows the ultrasound image sequence at 2, 3 and 4 seconds into the sequence. The
appearance of the ONS at 3 seconds is clearly different compared with the appearance at 2 and 4 seconds, thus scoring
an out-of-plane motion grade 2 (and hence excluded from the analysis). Lower: transverse motion on left (blue line) and
right side (black) of the ONS (before extraction of the heart rate frequency component). At approximately 3 seconds,
the processing method interpreted the out-of-plane motion as if the left side had a large pulsatile motion, with duration
approximately the same as the heart cycle (78 bpm, i.e. 0.77 second period). The analysis therefore failed for this dataset.
7.2.5. Conclusion
This study illustrates the feasibility of non-invasive transorbital ultrasound for assessing
optic nerve sheath pulsatile dynamics. The preliminary results demonstrate a significant
difference between patient groups with ICP ≥ 20 mmHg versus those with ICP < 20
mmHg, and thus support the suggested hypothesis of a relationship between deformability
of the ONS and ICP. The suggested measure may therefore be relevant as a non-invasive
marker of raised ICP and contribute to our understanding of the ONS response to changes
in ICP. Further validation of this technique in prospective, blinded studies would be
helpful.

193
SECTION D
Chapter 8. Perspective and future direction
The use of transorbital ultrasound measurement of the ONSD as a surrogate marker of
ICP is certainly an elegant technique. The major shortcoming in children is the lack of
consensus regarding age appropriate cut-off values, mostly due to the lack of studies
comparing ONSD to directly measured ICP. This work has specifically addressed this
shortfall in the literature by comparing these two parameters. The finding that age at 1
year is a more appropriate age at which to define different ONSD cut-off values, is
important as it demonstrates that there are a different set of values best suited to patients
before and after a certain threshold. The previously described age categories of >1 to ≤
4 years and above 4 years of age, were found to be of less clinical value in this study. This
finding may serve to clarify this discordance in the literature. This study also described
the best diagnostic accuracy for a range of appropriate ICP thresholds which, in children
may be of specific benefit.
Compliance of the skull differs significantly in patients with an open AF compared to
those where the AF has closed. This physiological concept, well described by the Monroe-
Kellie doctrine served as the basis for evaluating use of the AF as a more reliable clinical
marker for defining different ONSD cut-off values in children. Using patency of the AF
for describing ONSD cut-off values in children was a further recommendation of this
study.
All current published work assessing the ONS as a marker of ICP, have been based on
static measurements of the ONSD. These measurements have generally demonstrated a
strong relationship with ICP and change in ICP, though the diagnostic accuracy for
detecting raised ICP has varied considerably. The reasons for this variability have been
described and some of these issues in children have been addressed in this study. The
limited specificity of this technique has been suggested as a factor preventing its
widespread use.

194
Analysis of the pulsatile dynamic response of the ONS as a marker of its stiffness in states
of normal and raised ICP has not been described before. The dynamic analysis in the final
part of this work uses relative motion on both sides of the ONS, referred to as the DI, to
describe the pulsatile motion of the ONS. This index has potential to improve our overall
understanding of the ONS as a marker of ICP, and possibly improve the accuracy of this
technique by differentiating a widened ONSD that is a normal variant from one that is due
to raised ICP, based on the stiffness of the ONS.
Future work will involve testing the validity of the DI in a larger prospective, blinded
study.This study should ideally include adult and paediatric patients and should allow
analysis over a spectrum of normal and raised ICP values. The value of a laboratory-based
study, using cadaver models to evaluate the ONS response and test the dynamic
parameters described in this study would be an ideal scientific environment.
Use of a combination of appropriate non-invasive techniques is an appealing option to
potentially improve their diagnostic accuracy. In this light, future planned work involves
combining the measurement of the ONSD, with other features detectable on transorbital
ultrasound, especially bulge of the optic nerve head (described in raised ICP) 238,255 and
measurement of the optic nerve diameter (OND) to try and better define the physiological
and morphological changes in the ONS during increases in ICP. Combining the dynamic
assessment technique described in this work with standard ONSD and possibly with
Doppler flow assessment of the occular vessels 285,286 may improve the accuracy of this
promising diagnostic technique. The use of three dimensional imaging of the ONS is an
interesting option which may in time help to better delineate the ONS.290,291 The option of
measuring the IOP and interpreting this together with data from the ONS may also serve
to provide a more holistic picture of the effect that raised ICP has on the ONS complex.
The value of repeat ONSD measurement in individual patients, before and after treatment
may also serve to provide reference ranges for individual patients which would make it
more applicable in monitoring certain groups of patients, especially those with V/P
shunts.234
The eye and its ONS complex, apart from its primary role as an organ of vision, can also
provide valuable information about ICP, and the search to better understand and interpret

195
the changes that occur in this anatomical structure during changes in ICP remains a
fascinating avenue of research.

196
Appendices
Appendix I
Strobe checklist

197
STROBE Statement—checklist of items that should be included in reports of observational studies Item
No Recommendation Title and abstract 1 (a) Indicate the study’s design with a commonly used term in the title or the
abstract (b) Provide in the abstract an informative and balanced summary of what was done and what was found
Introduction Background/rationale 2 Explain the scientific background and rationale for the investigation being
reported Objectives 3 State specific objectives, including any prespecified hypotheses
Methods Study design 4 Present key elements of study design early in the paper Setting 5 Describe the setting, locations, and relevant dates, including periods of
recruitment, exposure, follow-up, and data collection Participants 6 (a) Cohort study—Give the eligibility criteria, and the sources and methods
of selection of participants. Describe methods of follow-up Case-control study—Give the eligibility criteria, and the sources and methods of case ascertainment and control selection. Give the rationale for the choice of cases and controls Cross-sectional study—Give the eligibility criteria, and the sources and methods of selection of participants (b) Cohort study—For matched studies, give matching criteria and number of exposed and unexposed Case-control study—For matched studies, give matching criteria and the number of controls per case
Variables 7 Clearly define all outcomes, exposures, predictors, potential confounders, and effect modifiers. Give diagnostic criteria, if applicable
Data sources/ measurement
8* For each variable of interest, give sources of data and details of methods of assessment (measurement). Describe comparability of assessment methods if there is more than one group
Bias 9 Describe any efforts to address potential sources of bias Study size 10 Explain how the study size was arrived at Quantitative variables 11 Explain how quantitative variables were handled in the analyses. If
applicable, describe which groupings were chosen and why Statistical methods 12 (a) Describe all statistical methods, including those used to control for
confounding (b) Describe any methods used to examine subgroups and interactions (c) Explain how missing data were addressed (d) Cohort study—If applicable, explain how loss to follow-up was addressed Case-control study—If applicable, explain how matching of cases and controls was addressed Cross-sectional study—If applicable, describe analytical methods taking account of sampling strategy

198
Results Participants 13* (a) Report numbers of individuals at each stage of study—eg numbers
potentially eligible, examined for eligibility, confirmed eligible, included in
the study, completing follow-up, and analysed
(b) Give reasons for non-participation at each stage
(c) Consider use of a flow diagram
Descriptive
data
14* (a) Give characteristics of study participants (eg demographic, clinical, social)
and information on exposures and potential confounders
(b) Indicate number of participants with missing data for each variable of
interest
(c) Cohort study—Summarise follow-up time (eg, average and total amount)
Outcome data 15* Cohort study—Report numbers of outcome events or summary measures over
time
Case-control study—Report numbers in each exposure category, or summary
measures of exposure
Cross-sectional study—Report numbers of outcome events or summary
measures
Main results 16 (a) Give unadjusted estimates and, if applicable, confounder-adjusted
estimates and their precision (eg, 95% confidence interval). Make clear which
confounders were adjusted for and why they were included
(b) Report category boundaries when continuous variables were categorized
(c) If relevant, consider translating estimates of relative risk into absolute risk
for a meaningful time period
Other analyses 17 Report other analyses done—eg analyses of subgroups and interactions, and
sensitivity analyses
Discussion Key results 18 Summarise key results with reference to study objectives
Limitations 19 Discuss limitations of the study, taking into account sources of potential bias
or imprecision. Discuss both direction and magnitude of any potential bias

199
Interpretation 20 Give a cautious overall interpretation of results considering objectives,
limitations, multiplicity of analyses, results from similar studies, and other
relevant evidence
Generalisability 21 Discuss the generalisability (external validity) of the study results
Other information Funding 22 Give the source of funding and the role of the funders for the present study
and, if applicable, for the original study on which the present article is based

200
Appendix II
Details of analysis in age categories 1 to 4 years old and above 4 year old
i. Children aged 1 to 4 years old (> 1 and ≤ 4 years old)
i) ONSD for ICP dichotomised at 20 mmHg
Thirty nine children were > 1 and ≤ 4 years old, the median age in this group was 23
months (IQR 17 - 35). Sixteen patients had an ICP < 20 mmHg, with a mean ICP
reading of 13.75 mmHg (SD 4.34), and twenty three patients had an ICP ≥ 20 mmHg,
with a mean reading of 22.91 mmHg (SD 3.77) (Table IIa). The correlation between
ONSD and ICP in this age group was good (r = 0.65, p < 0.001, PCC) (Figure IIa).
ICP in mmHg N (%) Median age in months (IQR)
Mean ICP in mmHg (SD)
Mean ONSD in mm (SD)
Overall 39 23 (17 – 35) 19.15 (6.04) 5.94 (0.6)
< 20 mmHg 16 (41%) 22.5 (16.5 – 34.5) 13.75 (4.3) 5.43 (0.6)
≥ 20 mmHg 23 (59%) 23 (18 – 35) 22.91 (3.8) 6.29 (0.4)
p – value p = 0.95 p < 0.001 p < 0.001
Table IIa. Age, ICP and ONSD values for ICP dichotomised at 20 mmHg in patients aged > 1 and ≤ 4 years old
Figure IIa. Scatterplot for ONSD against ICP in patients aged > 1 and ≤ 4 years old.
.45
.5.5
5.6
.65
.7
0 10 20 30 40ICP (mmHg)
AVE ONSD Fitted values
r = 0.65

201
The mean ONSD in the group with ICP < 20 mmHg was 5.43 mm (SD 0.6), and in the
group with ICP ≥ 20 mmHg, was 6.29 mm (SD 0.4) (p < 0.001) (Figure IIb).
Figure IIb. Box and whisker plot of ONSD for ICP < 20 mmHg (0) and ICP ≥ 20 mmHg (1) in patients aged > 1 and ≤ 4 years old
In this age group, the optimal ONSD for predicting an ICP ≥ 20 mmHg was 5.92 mm,
with a sensitivity of 82.6%, specificity of 81.3%, PPV of 86.4%, NPV of 76.5%. The
AUROC was 0.82 (Figure IIc), with an OR of 20.6 (Table 6.23)
Figure IIc. AUROC for ONSD to detect ICP ≥ 20 mmHg in patients aged > 1 and ≤ 4 years old
.45
.5.5
5.6
.65
.7
0 1
AV
E O
NS
D
Graphs by icpdichot20
0.00
0.25
0.50
0.75
1.00
Sen
sitiv
ity
0.00 0.25 0.50 0.75 1.001 - Specificity
Area under ROC curve = 0.9117
ONSD: 5.92 mm Sensitivity: 82.6 % Specificity: 81.3% AUROC: 0.82

202
ii) ONSD for ICP dichotomised at 15 mmHg
There were thirty nine children in this group, eight had an ICP < 15 mmHg and thirty
one had an ICP ≥ 15 mmHg. The data and comparative p –values are summarised in
table IIb.
ICP in mmHg N (%) Median age in months (IQR)
Mean ICP in mmHg (SD)
Mean ONSD in mm (SD)
Overall 39 23 (17 – 35) 19.15 (6.04) 5.94 (0.6)
< 15 mmHg 8 (20.5) 25.5 (16.5 – 43) 10.78 (4.1) 5.28 (0.6)
≥ 15 mmHg 31 (79.5) 23 (18 – 34) 21.31 (4.3) 6.11 (0.5)
p – value p = 0.47 p < 0.001 p = 0.006
Table IIb. Age, ICP and ONSD values for ICP dichotomised at 15 mmHg in patients aged > 1 and ≤ 4 years old
The optimal ONSD cut-off value for detecting ICP ≥ 15 mmHg in this age group was
5.52 mm, with a sensitivity of 90.3%, specificity of 75% and an OR of 28 (Table II).
iii) ONSD for ICP dichotomised at 10 mmHg
Of the thirty nine children in this group, two had an ICP < 10 mmHg and thirty seven
had an ICP ≥ 10 mmHg. The data and comparative p – values are summarised in table
IIc.
ICP in mmHg N (%) Median age in months (IQR)
Mean ICP in mmHg (SD)
Mean ONSD in mm (SD)
Overall 39 23 (17 – 35) 19.15 (6.04) 5.94 (0.6)
< 10 mmHg 2 (5) 43 (42 – 44) 4.5 (0.7) 4.92 (0.4)
≥ 10 mmHg 37 (95) 23 (17 – 34) 19.94 (5.1) 6 (0.6)
p – value p = 0.03 p = 0.002 p = 0.017

203
Table IIc. Age, ICP and ONSD values for ICP dichotomised at 10 mmHg in patients aged > 1 and ≤ 4 years old
The optimal ONSD cut-off value for predicting an ICP ≥ 10 mmHg in this age group
was 5.41 mm, with a sensitivity of 86.5% and a specificity of 100%. The OR was not
defined (Table 6.23).
iv) ONSD for ICP dichotomised at 5 mmHg
One patient in this age group had an ICP < 5 mmHg, with a reading of 4 mmHg. Thirty
eight patients had an ICP ≥ 5 mmHg, with a mean ICP reading of 19.55 mmHg (SD
5.6) (Table IId).
ICP in mmHg N (%) Median age in months (IQR)
Mean ICP in mmHg (SD)
Mean ONSD in mm (SD)
Overall 39 23 (17 – 35) 19.15 (6.04) 5.94 (0.6)
< 5 mmHg 1 (2.5) 42 4 5.2
≥ 5 mmHg 38 23 (17 – 34) 19.55 (5.6) 5.96 (0.6)
Table IId. Age, ICP and ONSD values for ICP dichotomised at 5 mmHg in patients aged > 1 and ≤ 4 years old
The ONSD measurement for the patient with ICP < 5 mmHg was 5.2 mm. The mean
reading in the group with ICP ≥ 5 mmHg was 5.96 mm (SD 0.6). The optimal ONSD

204
cut-off value for predicting an ICP ≥ 5 mmHg was 5.2 mm, with a sensitivity of 86.8%
and specificity of 100% (Table IIe).
ICP (mmHg)
ONSD cut-off (mm)
Sensitivity% (95%CI)
Specificity % (95%CI)
PPV % (95%CI)
NPV % (95%CI)
AUROC (95%CI)
OR (95%CI)
≥ 20 5.94 82.6 (61.2-95)
81.3 (54.4-96)
86.4 (65.1-97.1)
76.5 (50.1-93.2)
0.82 (0.69-0.95)
20.6 (4.1-102)
≥ 15 5.5 90.3 (74.2-98)
75 (34.9-96.8)
93.3 (77.9-99.2)
66.7 (29.9-92.5)
0.83 (0.66-0.99)
28 (4.19-185)
≥ 10 5.4 86.5 (71.2-95.5)
100 (15.8-100)
100 (89.1-100)
28.6 (3.7-71)
0.93 (0.88-0.99)
Nil
≥ 5 5.2 86.8 (71.9-95.6)
100 (2.5-100)
100 (89.4-100)
16.7 (0.42 – 64.1)
0.93 (. - 1) Nil
Table IIe. Relationship between various ICP thresholds and ONSD in patients aged > 1 and ≤ 4 years
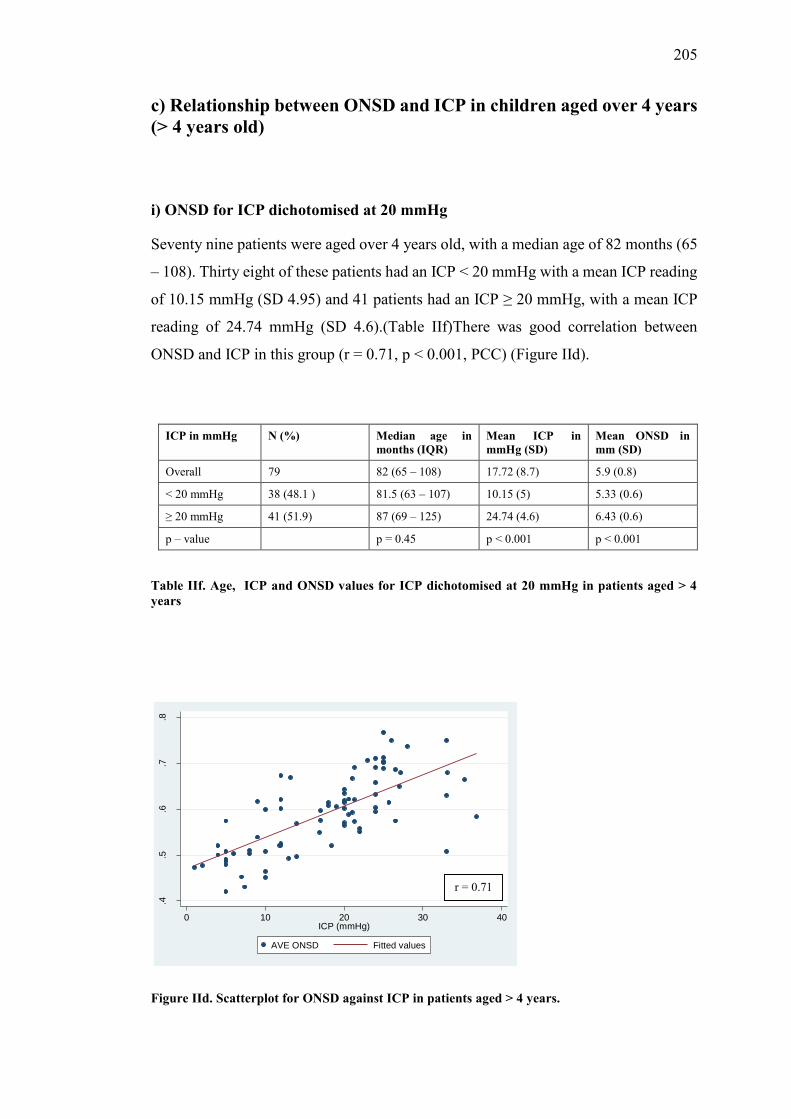
205
c) Relationship between ONSD and ICP in children aged over 4 years (> 4 years old)
i) ONSD for ICP dichotomised at 20 mmHg
Seventy nine patients were aged over 4 years old, with a median age of 82 months (65
– 108). Thirty eight of these patients had an ICP < 20 mmHg with a mean ICP reading
of 10.15 mmHg (SD 4.95) and 41 patients had an ICP ≥ 20 mmHg, with a mean ICP
reading of 24.74 mmHg (SD 4.6).(Table IIf)There was good correlation between
ONSD and ICP in this group (r = 0.71, p < 0.001, PCC) (Figure IId).
ICP in mmHg N (%) Median age in months (IQR)
Mean ICP in mmHg (SD)
Mean ONSD in mm (SD)
Overall 79 82 (65 – 108) 17.72 (8.7) 5.9 (0.8)
< 20 mmHg 38 (48.1 ) 81.5 (63 – 107) 10.15 (5) 5.33 (0.6)
≥ 20 mmHg 41 (51.9) 87 (69 – 125) 24.74 (4.6) 6.43 (0.6)
p – value p = 0.45 p < 0.001 p < 0.001
Table IIf. Age, ICP and ONSD values for ICP dichotomised at 20 mmHg in patients aged > 4 years
Figure IId. Scatterplot for ONSD against ICP in patients aged > 4 years.
.4.5
.6.7
.8
0 10 20 30 40ICP (mmHg)
AVE ONSD Fitted values
r = 0.71

206
The mean ONSD in the group with ICP < 20 mmHg was 5.33 mm (SD 0.6), and 6.43
mm (SD 0.6) in the group with ICP ≥ 20 mmHg (Figure IIe).
Figure IIe. Box and whisker plot of ONSD for ICP < 20 mmHg (0) and ICP ≥ 20 mmHg (1) in patients aged > 4 years.
The optimal ONSD cut-off value for detecting ICP ≥ 20 mmHg was 5.7 mm, with a
sensitivity of 87.8%, specificity of 68.4%, PPV of 75%, NPV 83.9%. The AUROC
was 0.78 (Figure IIf), with a diagnostic OR of 15.6 (Table IIj).
Figure IIf. AUROC for ONSD to detect ICP ≥ 20 mmHg in patients aged > 4 years.
.4.5
.6.7
.8
0 1
AVE
ONS
D
Graphs by icpdichot20
0.00
0.25
0.50
0.75
1.00
Sen
sitiv
ity
0.00 0.25 0.50 0.75 1.001 - Specificity
Area under ROC curve = 0.8829
ONSD: 5.7 mm Sensitivity: 87.8% Specificity: 68.4% AUROC: 0.78

207
ii) ONSD for ICP dichotomised at 15 mmHg
Thirty one children had an ICP < 15 mmHg and forty eight children had an ICP ≥ 15
mmHg, the results are summarised in table IIg.
ICP in mmHg N (%) Median age in months (IQR)
Mean ICP in mmHg (SD)
Mean ONSD in mm (SD)
Overall 79 82 (65 – 108) 17.72 (8.7) 5.9 (0.8)
< 15 mmHg 31 (39.2) 86 (63 -114) 8.43 (3.7) 5.22 (0.6)
≥ 15 mmHg 48 (60.8) 82 (68 – 107) 23.72 (4.9) 6.34 (0.6)
p – value p = 0.96 p < 0.001 p < 0.001
Table IIg. Age, ICP and ONSD values for ICP dichotomised at 15 mmHg in patients aged > 4 years old

208
The optimal ONSD cut-off value for detecting ICP ≥ 15 mmHg in this group was 5.49
mm, with a sensitivity of 93.8%, specificity of 74.2% and a diagnostic OR of 43.1
(Table IIj).
iii) ONSD for ICP dichotomised at 10 mmHg
Seventeen children in this group had an ICP < 10 mmHg and sixty two children ahd
an ICP ≥ 10 mmHg. The results are summarised in table IIh.
ICP in mmHg N (%) Median age in months (IQR)
Mean ICP in mmHg (SD)
Mean ONSD in mm (SD)
Overall 79 82 (65 – 108) 17.72 (8.7) 5.9 (0.8)
< 10 mmHg 17 (21.5) 76 (57 – 116) 5.61 (2.3) 4.99 (0.5)
≥ 10 mmHg 62 (78.5) 89 (69 – 107) 21.04 (6.6) 6.15 (0.7)
p – value p = 0.82 p < 0.001 p < 0.001
Table IIh. Age, ICP and ONSD values for ICP dichotomised at 10 mmHg in patients aged > 4
years old
The optimal ONSD cut-off value for detecting ICP ≥ 10 mmHg was 5.2 mm, with a
sensitivity of 88.7%, specificity of 82.4% and a diagnostic OR of 36.7 (Table IIj).
iv) ONSD for ICP dichotomised at 5 mmHg
Four children in this group had an ICP < 5mmHg and seventy five children had an ICP
≥ 5 mmHg. The results are summarised in table II i
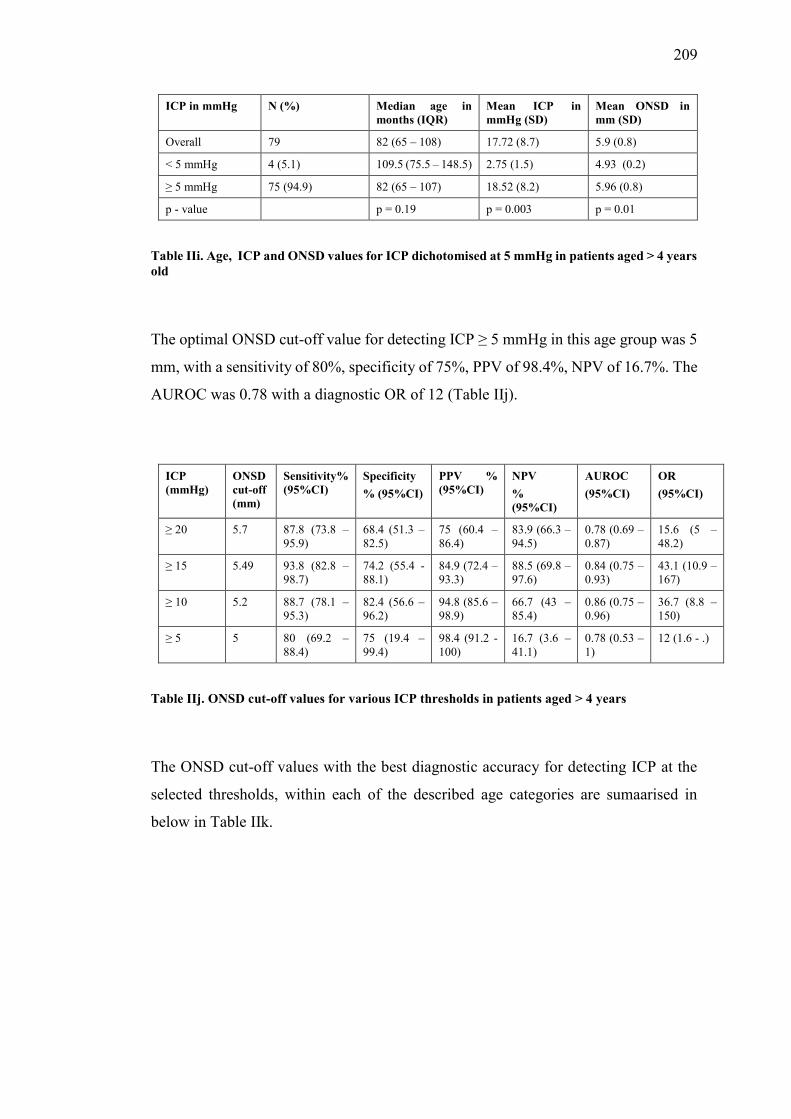
209
ICP in mmHg N (%) Median age in months (IQR)
Mean ICP in mmHg (SD)
Mean ONSD in mm (SD)
Overall 79 82 (65 – 108) 17.72 (8.7) 5.9 (0.8)
< 5 mmHg 4 (5.1) 109.5 (75.5 – 148.5) 2.75 (1.5) 4.93 (0.2)
≥ 5 mmHg 75 (94.9) 82 (65 – 107) 18.52 (8.2) 5.96 (0.8)
p - value p = 0.19 p = 0.003 p = 0.01
Table IIi. Age, ICP and ONSD values for ICP dichotomised at 5 mmHg in patients aged > 4 years old
The optimal ONSD cut-off value for detecting ICP ≥ 5 mmHg in this age group was 5
mm, with a sensitivity of 80%, specificity of 75%, PPV of 98.4%, NPV of 16.7%. The
AUROC was 0.78 with a diagnostic OR of 12 (Table IIj).
ICP (mmHg)
ONSD cut-off (mm)
Sensitivity% (95%CI)
Specificity % (95%CI)
PPV % (95%CI)
NPV % (95%CI)
AUROC (95%CI)
OR (95%CI)
≥ 20 5.7 87.8 (73.8 – 95.9)
68.4 (51.3 – 82.5)
75 (60.4 – 86.4)
83.9 (66.3 – 94.5)
0.78 (0.69 – 0.87)
15.6 (5 – 48.2)
≥ 15 5.49 93.8 (82.8 – 98.7)
74.2 (55.4 -88.1)
84.9 (72.4 – 93.3)
88.5 (69.8 – 97.6)
0.84 (0.75 – 0.93)
43.1 (10.9 – 167)
≥ 10 5.2 88.7 (78.1 – 95.3)
82.4 (56.6 – 96.2)
94.8 (85.6 – 98.9)
66.7 (43 – 85.4)
0.86 (0.75 – 0.96)
36.7 (8.8 – 150)
≥ 5 5 80 (69.2 – 88.4)
75 (19.4 – 99.4)
98.4 (91.2 -100)
16.7 (3.6 – 41.1)
0.78 (0.53 – 1)
12 (1.6 - .)
Table IIj. ONSD cut-off values for various ICP thresholds in patients aged > 4 years
The ONSD cut-off values with the best diagnostic accuracy for detecting ICP at the
selected thresholds, within each of the described age categories are sumaarised in
below in Table IIk.

210
ICP in mmHg Age threshold (in years) ONSD cut-off values (in mm)
≥ 20 Overall 5.5
≤ 1 5.16
> 1 - ≤ 4 5.94
> 4 5.7
≥ 15 Overall 5.3
≤ 1 4.97
> 1 - ≤ 4 5.5
> 4 5.49
≥ 10 Overall 5.04
≤ 1 4.3
> 1 - ≤ 4 5.4
> 4 5.2
≥ 5 Overall 5
≤ 1 Nil
> 1 - ≤ 4 0.52
> 4 0.5
Table 6.IIk. ONSD cut-off values for different ICP thresholds within the various age categories

211
Appendix III
Dynamic study: additional data
Individual measurements for motion Dleft and Dright for the left eye:
Left eye
Left side of ONS (dLeft) Right side of ONS (dRight)
A 7.85 7.53 8.36 8.46 8.41 8.94 9.12 8.78 8.93 9.17
B 7.51 7.51 7.55 8.50 7.74 8.90 8.80 8.56 8.50 8.98
C 3.16 2.79 3.56 2.94 2.97 6.26 6.14 6.31 6.28 6.28
D 5.28 4.21 5.91 5.36 5.08 4.25 3.83 4.37 4.18 4.22
E 15.53 15.25 15.53 15.28 15.28 13.62 12.67 13.83 13.80 14.00
F 20.37 20.96 20.92 19.98 20.24 26.01 26.38 26.09 26.02 26.10
G 4.45 4.22 4.56 5.6 5.06 11.4 11.28 11.18 11.28 11.01
H 6.8 6.96 6.68 6.29 7.09 5.41 5.50 5.27 5.09 5.58
I 5.78 4.84 5.64 4.46 7.53 3.25 2.81 3.28 3.24 3.22
J 3.85 4.14 4.01 3.84 4.21 1.94 1.70 1.56 1.99 1.94
K 13.61 14.30 14.33 12.57 13.61 8.13 8.80 8.63 8.29 8.03
L 7.68 7.25 8.49 7.68 8.78 4.50 4.32 4.97 5.07 4.12
M 18.06 17.59 17.73 16.75 17.21 10.30 11.03 11.05 11.39 9.42
N 5.02 5.18 5.16 5.17 5.48 3.81 3.62 3.58 3.64 3.47
O 18.25 15.69 16.61 13.95 15.18 17.07 16.59 16.5 16.81 17.16
P 5.68 4.23 4.75 5.47 4.38 5.56 5.12 5.37 6.01 6.01
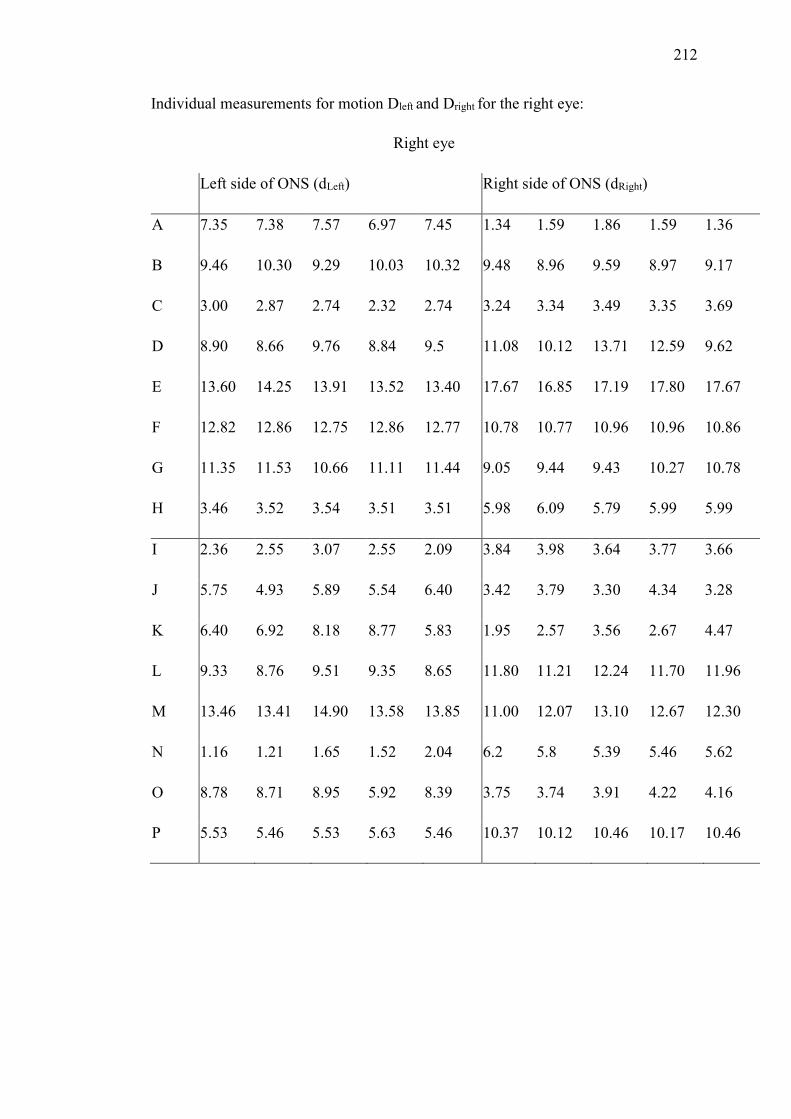
212
Individual measurements for motion Dleft and Dright for the right eye:
Right eye
Left side of ONS (dLeft) Right side of ONS (dRight)
A 7.35 7.38 7.57 6.97 7.45 1.34 1.59 1.86 1.59 1.36
B 9.46 10.30 9.29 10.03 10.32 9.48 8.96 9.59 8.97 9.17
C 3.00 2.87 2.74 2.32 2.74 3.24 3.34 3.49 3.35 3.69
D 8.90 8.66 9.76 8.84 9.5 11.08 10.12 13.71 12.59 9.62
E 13.60 14.25 13.91 13.52 13.40 17.67 16.85 17.19 17.80 17.67
F 12.82 12.86 12.75 12.86 12.77 10.78 10.77 10.96 10.96 10.86
G 11.35 11.53 10.66 11.11 11.44 9.05 9.44 9.43 10.27 10.78
H 3.46 3.52 3.54 3.51 3.51 5.98 6.09 5.79 5.99 5.99
I 2.36 2.55 3.07 2.55 2.09 3.84 3.98 3.64 3.77 3.66
J 5.75 4.93 5.89 5.54 6.40 3.42 3.79 3.30 4.34 3.28
K 6.40 6.92 8.18 8.77 5.83 1.95 2.57 3.56 2.67 4.47
L 9.33 8.76 9.51 9.35 8.65 11.80 11.21 12.24 11.70 11.96
M 13.46 13.41 14.90 13.58 13.85 11.00 12.07 13.10 12.67 12.30
N 1.16 1.21 1.65 1.52 2.04 6.2 5.8 5.39 5.46 5.62
O 8.78 8.71 8.95 5.92 8.39 3.75 3.74 3.91 4.22 4.16
P 5.53 5.46 5.53 5.63 5.46 10.37 10.12 10.46 10.17 10.46

213

214
Reference list
1 Luerssen, TG. Intracranial pressure: Current status in monitoring and
management. Seminars in Pediatric Neurology. 1997; 4(3): 146-155.
2 Wiegand C, Richards P. Measurement of intracranial pressure in children: a
critical review of current methods. Developmental Medicine and Child
Neurology. 2007; 49(12): 935-941.
3 Anderson RC, Kan P, Klimo P, Brockmeyer DL, Walker ML, Kestle JR.
Complications of intracranial pressure monitoring in children with head
trauma. Journal of Neurosurgery: Pediatrics. 2004; 101(2): 53-58.
4 Rosenberg JB, Shiloh AL, Savel RH, Eisen LA Non-invasive methods of
estimating intracranial pressure. Neurocritical Care. 2011; 15(3): 599-608.
5 Harvey CJ, Pilcher JM, Eckersley RJ, Blomley MJ, Cosgrove DO. Advances
in ultrasound. Clinical Radiology. 2002; 57(3): 157-177.
6 Newman PG, Rozycki GS. The history of ultrasound. Surgical clinics of North
America. 1998; 78(2): 179-195.
7 Chandler WF, Knake JE, McGillicuddy JE, Lillehei KO, Silver TM.
Intraoperative use of real-time ultrasonography in neurosurgery. Journal of
Neurosurgery. 1982; 57(2): 157-163.

215
8 Comeau RM, Sadikot AF, Fenster A, Peters TM. Intraoperative ultrasound for
guidance and tissue shift correction in image-guided neurosurgery. Medical
Physics. 2000; 27(4): 787-800.
9 Sosna J, Barth MM, Kruskal JB, Kane RA. Intraoperative sonography for
neurosurgery. Journal of Ultrasound in Medicine. 2005; 24(12): 1671-1682.
10 Sutcliffe JC. The value of intraoperative ultrasound in neurosurgery. British
Journal of Neurosurgery. 1991; 5(2): 169-178.
11 Ivanov M, Wilkins S, Poeata I, Brodbelt A. Intraoperative ultrasound in
neurosurgery–a practical guide. British Journal of Neurosurgery. 2010; 24(5):
510-517.
12 Slovis TL, Kuhns LR. Real-time sonography of the brain through the anterior
fontanelle. American Journal of Roentgenology. 1981; 136(2): 277-286.
13 Leijser LM, de Vries LS, Cowan F.M. Using cerebral ultrasound effectively in
the newborn infant. Early human development. 2006; 82(12): 827-835.
14 Foster P, Khaw KT. The eye: window to the soul or a mirror of systemic
health? Heart. 2009; 95(5): 348-349.
15 London A, Benhar I, Schwartz M. The retina as a window to the brain—from
eye research to CNS disorders. Nature Reviews Neurology. 2013; 9(1): 44-53

216
16 Geeraerts T, Launey Y, Martin L, et al. Ultrasonography of the optic nerve
sheath may be useful for detecting raised intracranial pressure after severe brain
injury. Intensive Care Medicine. 2007; 33(10): 1704-1711.
17 Geeraerts T, Duranteau J, Benhamou D. Ocular sonography in patients with
raised intracranial pressure: the papilloedema revisited. Critical Care. 2008;
12(3): 150.
18 Rajajee V, Vanaman M, Fletcher JJ, Jacobs TL. Optic nerve ultrasound for the
detection of raised intracranial pressure. Neurocritical Care. 2011; 15(3): 506-
515.
19 Soldatos T, Karakitsos D, Chatzimichail K, Papathanasiou M, Gouliamos A,
Karabinis A. Optic nerve sonography in the diagnostic evaluation of adult brain
injury. Critical Care. 2008; 12(3): R67.
20 Moretti R, Pizzi B, Cassini F, Vivaldi N. Reliability of optic nerve ultrasound
for the evaluation of patients with spontaneous intracranial
hemorrhage. Neurocritical Care. 2009; 11(3): 406-410.
21 Blaivas M, Theodoro D, Sierzenski PR. A study of bedside ocular
ultrasonography in the emergency department. Academic Emergency
Medicine. 2002; 9(8): 791-799.
22 Girisgin AS, Kalkan E, Kocak S, Cander B, Gul M, Semiz M. The role of optic
nerve ultrasonography in the diagnosis of elevated intracranial
pressure. Emergency Medicine Journal. 2007; 24(4): 251-254.

217
23 Tayal VS, Neulander M, Norton HJ, Foster T, Saunders T, Blaivas M.
Emergency department sonographic measurement of optic nerve sheath
diameter to detect findings of increased intracranial pressure in adult head
injury patients. Annals of Emergency Medicine. 2007; 49(4): 508-514.
24 Goel RS, Goyal NK, Dharap SB, Kumar M, Gore MA. Utility of optic nerve
ultrasonography in head injury. Injury. 2008; 39(5): 519-524.
25 Major R, Girling S, Boyle A. Ultrasound measurement of optic nerve sheath
diameter in patients with a clinical suspicion of raised intracranial pressure.
Emergency Medicine Journal. 2011; 28(8): 679-81.
26 Školoudík D, Herzig R, Fadrná T, et al. Distal enlargement of the optic nerve
sheath in the hyperacute stage of intracerebral haemorrhage. British Journal of
Ophthalmology. 2010; 95(2) pp.217.
27 Bäuerle J, Lochner P, Kaps M, Nedelmann M. Intra‐ and inter-obsever
reliability of sonographic assessment of the optic nerve sheath diameter in
healthy adults. Journal of Neuroimaging. 2012; 22(1): 42-45.
28 Helmke K, Hansen HC. Fundamentals of transorbital sonographic evaluation
of optic nerve sheath expansion under intracranial hypertension. Pediatric
Radiology. 1996; 26(10): 701-705.
29 Ballantyne J, Hollman A, Hamilton R, et al. Transorbital optic nerve sheath
ultrasonography in normal children. Clinical Radiology. 1999; 54(11): 740-
742.

218
30 Newman WD, Hollman AS, Dutton GN, Carachi R. Measurement of optic
nerve sheath diameter by ultrasound: a means of detecting acute raised
intracranial pressure in hydrocephalus. British Journal of Ophthalmology.
2002; 86(10): 1109-1113.
31 Moretti R, Pizzi B. Ultrasonography of the optic nerve in neurocritically ill
patients. Acta Anaesthesiologica Scandinavica. 2011; 55(6): 644-652.
32 Malayeri AA, Bavarian S, Mehdizadeh M. Sonographic evaluation of optic
nerve diameter in children with raised intracranial pressure. Journal of
Ultrasound in Medicine. 2005; 24(2): 143-147.
33 Beare NA, Kampondeni S, Glover SJ, et al. Detection of raised intracranial
pressure by ultrasound measurement of optic nerve sheath diameter in African
children. Tropical Medicine International Health. 2008; 13(11): 1400-1404.
34 Steinborn M, Friedmann M, Hahn H, et al. Normal values for transbulbar
sonography and magnetic resonance imaging of the optic nerve sheath diameter
(ONSD) in children and adolescents. Ultraschall in der Medizin. 2015; 36(1):
54-58.
35 Bradley MM, Miccoli L, Escrig MA, Lang PJ. The pupil as a measure of
emotional arousal and autonomic activation. Psychophysiology. 2008; 45(4):
602-607.
36 Partala T, Surakka V. Pupil size variation as an indication of affective
processing. International Journal of Human-Computer Studies. 2003; 59(1):
185-198.

219
37 Hess EH, Polt JM. Pupil size in relation to mental activity during simple
problem-solving. Science. 1964; 143(3611): 1190-1192.
38 Beatty J, Kahneman D. Pupillary changes in two memory tasks. Psychonomic
Science. 1966; 5(10): 371-372.
39 Kahneman D, Tursky B, Shapiro D, Crider A. Pupillary, heart rate, and skin
resistance changes during a mental task. Journal of Experimental Psychology.
1969; 79(1p1): 164.
40 Kahneman D, Peavler WS. Incentive effects and pupillary changes in
association learning. Journal of Experimental Psychology. 1969; 79(2p1): 312.
41 Beatty J. Task-evoked pupillary responses, processing load, and the structure
of processing resources. Psychological Bulletin. 1982; 91(2): 276.
42 Beatty J, Lucero-Wagoner B. The pupillary system. Handbook of
Psychophysiology. 2000; 2: 142-162.
43 Laeng B, Sirois S, Gredebäck G. Pupillometry a window to the
preconscious? Perspectives on Psychological Science. 2012; 7(1): 18-27.
44 Kaye LD, Rothner AD, Beauchamp GR, Meyers SM, Estes ML. Ocular
findings associated with neurofibromatosis type II. Ophthalmology.
1992; 99(9): 1424-1429.

220
45 Von Graefe A. Complications of optic neuritis with cerebral disease. Archives
of Ophthalmology. 1860; 7: 58.
46 Hayreh SS. Pathogenesis of oedema of the optic disc (papilloedema): a
preliminary report. The British Journal of Ophthalmology. 1964; 48(10): 522.
47 Ossoinig KC, Cennamo G, Frazier-Byrne S. Echographic differential diagnosis
of optic-nerve lesions. Ultrasonography in Ophthalmology. 1981; 29: 327-332.
48 Galetta S, Frazier BS, Smith JL. Echographic correlation of optic nerve sheath
size and cerebrospinal fluid pressure. Journal of Neuro-Ophthalmology. 1989;
9(2): 79-82.
49 Liu D, Kahn M. Measurement and relationship of subarachnoid pressure of the
optic nerve to intracranial pressures in fresh cadavers. American Journal of
Ophthalmology. 1993; 116 (5): 548-556.
50 Hansen HC, Helmke K. The subarachnoid space surrounding the optic nerves.
An ultrasound study of the optic nerve sheath. Surgical and Radiologic
Anatomy. 1996; 18(4): 323-328.
51 Rajajee V, Fletcher JJ, Rochlen LR, Jacobs TL. Comparison of accuracy of
optic nerve ultrasound for the detection of intracranial hypertension in the
setting of acutely fluctuating vs stable intracranial pressure: post-hoc analysis
of data from a prospective, blinded single center study. Critical Care. 2012;
16(3): R79.

221
52 Killer HE, Jaggi GP, Flammer J, Miller NR, Huber AR, Mironov A.
Cerebrospinal fluid dynamics between the intracranial and the subarachnoid
space of the optic nerve. Is it always bidirectional? Brain. 2007; 130(2): 514-
520.
53 Killer HE, Laeng HR, Flammer J, Groscurth P. Architecture of arachnoid
trabeculae, pillars, and septa in the subarachnoid space of the human optic
nerve: anatomy and clinical considerations. British Journal of Ophthalmology.
2003; 87(6): 777-781.
54 Hayreh SS. Ischemic Optic Neuropathies (Springer Science and Business
Media). Chapter 2: Structure of the optic nerve. 2011; XII: 7-34.
55 Rothman MI, Zoarski GH, Sutton D. The orbit. Textbook of Radiology and
Imaging. 2003; 2: 1573-1595.
56 Hayreh SS. The sheath of the optic nerve. Ophthalmologica. 1984; 189(1-2):
54-63.
57 Francois P, Lescanne E, Velut S. The dural sheath of the optic nerve:
descriptive anatomy and surgical applications. Advances and Technical
Standards in Neurosurgery. 2011; 36: 187-198.
58 Seoane E, Rhoton Jr AL, de Oliveira E. Microsurgical anatomy of the dural
collar (carotid collar) and rings around the clinoid segment of the internal
carotid artery. Neurosurgery. 1998; 42(4): 869-884.
59 Snell RS, Lemp MA. Clinical anatomy of the eye. Second edition. Wiley-
Blackwell. 1997; 278-285.

222
60 Saul TG, Ducker TB. Effect of intracranial pressure monitoring and aggressive
treatment on mortality in severe head injury. Journal of Neurosurgery.
1982; 56(4): 498-503.
61 McAllister AS. A review of the vascular anatomy of the optic nerve head and
its clinical implications. Cureus. 2013; 5(2): e98.
62 Biousse V, Newman NJ. Ischemic optic neuropathies. New England Journal of
Medicine. 2015; 372: 2428-2436.
63 Mundt GH, William FH. Ultrasonics in ocular diagnosis. American journal of
Ophthalmology. 1956; 41(3): 488-498.
64 Baum G, Greenwood I. The application of ultrasonics locating techniques to
ophthalmology: Theoretic considerations and acoustic properties of ocular
media: Part I, reflective properties. American Journal of Ophthalmology. 1958;
46(5): 319-329.
65 Bronson NR, Turner FT. A simple B-scan ultrasonoscope. Archives of
Ophthalmology. 1973; 90(3): 237-238.
66 Ossoinig KC. Standardized echography: basic principles, clinical applications,
and results. International Ophthalmology Clinics. 1979; 19(4): 127-210.
67 Cennamo G, Gangemi M, Stella L. The correlation between endocranial
pressure and optic nerve diameter: an ultrasonographic study. Ophthalmic
Echography. 1987; 603-606.

223
68 Hansen HC, Helmke K, Kunze K. Optic nerve sheath enlargement in acute
intracranial hypertension. Neuro-ophthalmology. 1994; 14(6): 345-354.
69 Hayreh SS. Blood supply of the optic nerve head and its role in optic atrophy,
glaucoma, and oedema of the optic disc. The British Journal of
Ophthalmology. 1969; 53(11): 721-748.
70 Fledelius HC. Ultrasound in ophthalmology. Ultrasound in Medicine Biology.
1997; 23(3): 365-375.
71 Brunell KS. Ophthalmic ultrasonography. Journal of Diagnostic Medical
Sonography. 2014; 30(3): 136-142.
72 Hall MK, Spiro DM, Sabbaj A, Moore CL, Hopkins KL, Meckler GD. Bedside
optic nerve sheath diameter ultrasound for the evaluation of suspected pediatric
ventriculoperitoneal shunt failure in the emergency department. Child's
Nervous System. 2013; 29(12): 2275-2280.
73 Kimberly HH, Shah S, Marill K, Noble V. Correlation of optic nerve sheath
diameter with direct measurement of intracranial pressure. Academic
Emergency Medicine. 2008; 15(2): 201-204.
74 Silva CT, Brockley CR, Crum A, Mandelstam SA. Pediatric ocular
sonography. Seminars in Ultrasound, CT and MRI. 2011; 32(1): 14-27.

224
75 Kilker BA, Holst JM, Hoffmann B. Bedside ocular ultrasound in the
emergency department. European Journal of Emergency Medicine. 2014;
21(4): 246-253.
76 Ramji FG, Slovis TL, Baker JD. Orbital sonography in children. Pediatric
Radiology. 1996; 26(4): 245-258.
77 Lizzi FL, Mortimer AJ. Bioeffects considerations for the safety of diagnostic
ultrasound–preface. Journal of Ultrasound in Medicine. 1988; 7(9): S1-S38.
78 Fielding JA. Ocular ultrasound. Clinical Radiology. 1996; 51(8): 533-544.
79 Silverman RH, Lizzi FL, Ursea BG, et al. Safety levels for exposure of cornea
and lens to very high-frequency ultrasound. Journal of Ultrasound in
Medicine. 2001; 20(9): 979-986.
80 Fowlkes JB, Holland CK. Mechanical bioeffects from diagnostic ultrasound:
AIUM consensus statements. Journal of Ultrasound in Medicine. 2000; 19(2):
69-72.
81 United States Department of Health and Human Services, Food and Drug
Administration, Center for Devices and Radiological Health. Information for
Manufacturers Seeking Marketing Clearance of Diagnostic Ultrasound
Systems and Transducers. Washington, DC. 2008.
http://www.fda.gov/cdrh/ode/guidance/560.pdf.
82 Nelson TR, Fowlkes JB, Abramowicz JS, Church CC. Ultrasound Biosafety
Considerations for the Practising Sonographer and Sonologist. Journal of
Ultrasound in Medicine. 2009; 28: 139-150.

225
83 European Federation for Societies of Ultrasound in Medicine and Biology
(EFSUMB) Clinical safety statement for diagnostic ultrasound safety. Tours,
France. 1998. European Journal of Ultrasound. 1998; 8: 67-68.
84 Toms DA. The mechanical index, ultrasound practices, and the ALARA
principle. Journal of Ultrasound in Medicine. 2006; 25(4): 560-561.
85 Bioeffects Committee of the American Institute of Ultrasound in Medicine.
American Institute of Ultrasound in Medicine consensus report on potential
bioeffects of diagnostic ultrasound: executive summary. Journal of Diagnostic
Medical Sonography. 2011; 27(1): 3-13.
86 Kendall CJ, Prager TS, Cheng H, Gombos D, Tang RA, Schiffman JS.
Diagnostic Ophthalmic Ultrasound for Radiologists. Neuroimaging Clinics of
North America. 2015; 25(3): 327-365.
87 Guillaume J, Janny P. Continuous intracranial manometry; importance of the
method and first results. Revue Neurologique. 1951; 84(2): 131.
88 Lundberg, N. Continuous Recording and Control of Ventricular Fluid Pressure
in Neurosurgical Practice. Acta Psychiatrica Et Neurologica Scandanavica
(Suppl 149). 1960; (36): 1-193.
89 Miller JD, Becker DP, Ward JD, Sullivan HG, Adams WE, Rosner MJ.
Significance of intracranial hypertension in severe head injury. Journal of
Neurosurgery. 1977; 47(4): 503-516.

226
90 Becker DP, Miller JD, Ward JD, Greenberg RP, Young HF, Sakalas R. The
outcome from severe head injury with early diagnosis and intensive
management. Journal of Neurosurgery. 1977; 47(4): 491-502.
91 Narayan RK, Greenberg RP, Miller JD, et al. Improved confidence of outcome
prediction in severe head injury: a comparative analysis of the clinical
examination, multimodality evoked potentials, CT scanning, and intracranial
pressure. Journal of Neurosurgery. 1981; 54(6): 751-762.
92 Czosnyka M, Pickard JD. Monitoring and interpretation of intracranial
pressure. Journal of Neurology, Neurosurgery and Psychiatry. 2004; 75(6):
813-821.
93 Marmarou A, Maset AL, Ward JD, et al. Contribution of CSF and vascular
factors to elevation of ICP in severely head-injured patients. Journal of
Neurosurgery. 1987; 66(6): 883-890.
94 Michaud LJ, Rivara FP, Grady MS, Reay DT. Predictors of survival and
severity of disability after severe brain injury in children. Neurosurgery. 1992;
31(2): 254-26.
95 Chambers IR, Siddique MS, Banister K, Mendelow AD. Clinical comparison
of the Spiegelberg parenchymal transducer and ventricular fluid pressure.
Journal of Neurology, Neurosurgery and Psychiatry. 2001; 71(3): 383-385.
96 Davson H, Hollingsworth G, Segal MB. The mechanismof drainage of the
cerebrospinal fluid. Brain. 1970; 93: 665-678.

227
97 Juul N, Morris GF, Marshall SB, Marshall LF. Intracranial hypertension and
cerebral perfusion pressure: influence on neurological deterioration and
outcome in severe head injury. Journal of Neurosurgery. 2000; 92(1): 1-6.
98 Avezaat CJ, Van Eijndhoven JH, Wyper DJ. Cerebrospinal fluid pulse pressure
and intracranial volume-pressure relationships. Journal of Neurology,
Neurosurgery and Psychiatry. 1979; 42(8): 687-700.
99 Padayachy LC, Figaji AA, Bullock MR. Intracranial pressure monitoring for
traumatic brain injury in the modern era. Child's Nervous System. 2010; 26(4):
441-452.
100 Marshall LF, Smith RW, Shapiro HM. The outcome with aggressive treatment
in severe head injuries: Part I: the significance of intracranial pressure
monitoring. Journal of Neurosurgery. 1979; 50(1): 20-25.
101 Smith M. Monitoring intracranial pressure in traumatic brain injury. Anesthesia
& Analgesia. 2008; 106(1): 240-248.
102 Chesnut RM, Marshall LF, Marshall SB. Medical management of intracranial
pressure. Head Injury. 1993; 4: 229-263.
103 Salim A, Hannon M, Brown C, et al. Intracranial pressure monitoring in severe
isolated pediatric blunt head trauma. The American Surgeon. 2008; 74(11):
1088-1093.

228
104 Shafi S, Diaz-Arrastia R, Madden C, Gentilello L. Intracranial pressure
monitoring in brain-injured patients is associated with worsening of survival.
Journal of Trauma and Acute Care Surgery. 2008; 64(2): 335-340.
105 Saul TG, Ducker TB. Effect of intracranial pressure monitoring and aggressive
treatment on mortality in severe head injury. Journal of Neurosurgery.
1982; 56(4): 498-503.
106 Citerio G, Andrews PJ. Intracranial pressure. Intensive Care Medicine. 2004;
30(10): 1882-1885.
107 Czosnyka M, Smielewski P, Kirkpatrick P, Laing RJ, Menon D, Pickard JD.
Continuous assessment of the cerebral vasomotor reactivity in head injury.
Neurosurgery. 1997; 41: 11-17.
108 Treggiari MM, Schutz N, Yanez ND, Romand JA. Role of intracranial pressure
values and patterns in predicting outcome in traumatic brain injury: a
systematic review. Neurocritical Care. 2007; 6(2): 104-112.
109 Kristiansson H, Nissborg E, Bartek Jr J, Andresen M, Reinstrup P, Romner B.
Measuring elevated intracranial pressure through noninvasive methods: a
review of the literature. Journal of Neurosurgical Anesthesiology. 2013; 25(4):
372-385.
110 Adelson PD, Bratton, SL, Carney NA, et al. Guidelines for the acute medical
management of severe traumatic brain injury in infants, children, and
adolescents. Chapter 5. Indications for intracranial pressure monitoring in

229
pediatric patients with severe traumatic brain injury. Pediatric Critical Care
Medicine. 2003; 4(3 Suppl): S19-24.
111 Morris KP, Forsyth RJ, Parslow RC, et al. UK Paediatric Traumatic Brain
Injury Study Group. Intracranial pressure complicating severe traumatic brain
injury in children: monitoring and management. Intensive Care Medicine.
2006; 32(10): 1606-1612.
112 Rickert K, Sinson G. Intracranial pressure monitoring. Operative Techniques
in General Surgery. 2003; 5(3): 170-175.
113 Lozier AP, Sciacca RR, Romagnoli MF, Connolly Jr ES. Ventriculostomy-
related infections: a critical review of the literature. Neurosurgery. 2002; 51(1):
170-182.
114 Ghajar J. Intracranial pressure monitoring techniques. New Horizons. 1995;
3(3): 395-399.
115 Paramore CG, Turner DA. Relative risks of ventriculostomy infection and
morbidity. Acta Neurochirurgica. 1994; 127(1-2): 79-84.
116 Raboel PH, Bartek J, Andresen M, Bellander BM, Romner B. Intracranial
pressure monitoring: invasive versus non-invasive methods—a review. Critical
care Research and Practice. 2012; 2012(12): 1-14.
117 Koskinen LOD, Olivecrona M. Clinical experience with the intraparenchymal
intracranial pressure monitoring Codman MicroSensor system. Neurosurgery.
2005; 56(4): 693-698.

230
118 Poca MA, Sahuquillo J, Arribas M, Báguena M, Amorós S, Rubio E. Fiberoptic
intraparenchymal brain pressure monitoring with the Camino V420 monitor:
reflections on our experience in 163 severely head-injured patients. Journal of
Neurotrauma. 2002; 19(4): 439-448.
119 Kass MA, Heuer DK, Higginbotham EJ, et al. The Ocular Hypertension
Treatment Study: a randomized trial determines that topical ocular hypotensive
medication delays or prevents the onset of primary open-angle glaucoma.
Archives of Ophthalmology. 2002; 120(6): 701-713.
120 Eddy VA, Vitsky JL, Rutherford EJ, Morris Jr JA. Aggressive use of ICP
monitoring is safe and alters patient care. The American Surgeon. 1995; 61(1):
24-29.
121 Münch E, Weigel R, Schmiedek P, Schürer L. The Camino intracranial
pressure device in clinical practice: reliability, handling characteristics and
complications. Acta Neurochirurgica. 1998; 140(11): 1113-1120.
122 Marmarou A, Anderson RL, Ward JD, et al. Impact of ICP instability and
hypotension on outcome in patients with severe head trauma. Special
Supplements. 1991; 75(1): 59-66.
123 Crutchfield JS, Narayan RK, Robertson CS, Michael LH. Evaluation of a
fiberoptic intracranial pressure monitor. Journal of Neurosurgery. 1990; 72(3):
482-487.

231
124 Piper I, Barnes A, Smith D, Dunn L. The Camino intracranial pressure sensor:
is it optimal technology? An internal audit with a review of current intracranial
pressure monitoring technologies. Neurosurgery. 2001; 49(5): 1158-1165.
125 Schickner DJ, Young RF. Intracranial pressure monitoring: fiberoptic monitor
compared with the ventricular catheter. Surgical Neurology. 1992; 37(4): 251-
254.
126 Chambers IR, Mendelow AD, Sinar EJ, Modha P. A clinical evaluation of the
Camino subdural screw and ventricular monitoring kits. Neurosurgery. 1990;
26(3): 421-423.
127 Zhong J, Dujovny M, Park HK, Perez E, Perlin A, Diaz F. Advances in ICP
monitoring techniques. Neurological Research. 2003; 25: 339-350.
128 Lilja A, Andresen M, Hadi A, Christoffersen D, Juhler M. Clinical experience
with telemetric intracranial pressure monitoring in a Danish neurosurgical
center. Clinical Neurology and Neurosurgery. 2014; 120: 36-40.
129 Cartwright C, Igbaseimokumo U. Lumbar Puncture Opening Pressure Is Not a
Reliable Measure of Intracranial Pressure in Children. Journal of Child
Neurology. 2015; 30(2): 170-173.
130 Bratton SL, Chestnut RM, Ghajar J, et al. Guidelines for the management of
severe traumatic brain injury. VI. Indications for intracranial pressure
monitoring. Journal of Neurotrauma. 2006; 24(S1): S37-44.

232
131 Hanlo PW, Gooskens RH, Faber JA, et al. Relationship between anterior
fontanelle pressure measurements and clinical signs in infantile hydrocephalus.
Child's Nervous System. 1996. 12(4): 200-209.
132 Wealthall SR, Smallwood R. Methods of measuring intracranial pressure via
the fontanelle without puncture. Journal of Neurology, Neurosurgery and
Psychiatry. 1974; 37(1): 88-96.
133 Tuite GF, Chong WK, Evanson J, et al. The effectiveness of papilledema as an
indicator of raised intracranial pressure in children with craniosynostosis.
Neurosurgery. 1996; 38(2): 272-278.
134 Sajjadi SA, Harirchian MH, Sheikhbahaei N, Mohebbi MR, Malekmadani MH,
Saberi H. The relation between intracranial and intraocular pressures: study of
50 patients. Annals of Neurology. 2006; 59(5): 867-870.
135 Hedges TR, Zaren HA. The relationship of optic nerve tissue pressure to
intracranial and systemic arterial pressure. American Journal of
Ophthalmology. 1973; 75(1): 90-98.
136 Hedges TR. Papilledema: its recognition and relation to increased intracranial
pressure. Survey of Ophthalmology. 1974; 19(4): 201-223.
137 Lashutka MK, Chandra A, Murray HN, Phillips GS, Hiestand BC. The
relationship of intraocular pressure to intracranial pressure. Annals of
Emergency Medicine. 2004; 43(5): 585-591.

233
138 Salman MS. Can intracranial pressure be measured non-invasively? The
Lancet. 1997; 350(9088): 1367.
139 Czarnik T, Gawda R, Kolodziej W, Latka D, Sznajd-Weron K, Weron R.
Associations between intracranial pressure, intraocular pressure and mean
arterial pressure in patients with traumatic and non-traumatic brain
injuries. Injury. 2009; 40(1): 33-39.
140 Han Y, McCulley TJ, Horton JC. No correlation between intraocular pressure
and intracranial pressure. Annals of Neurology. 2008; 64(2): 221-224.
141 Kirk T, Jones K, Miller S, Corbett J. Measurement of intraocular and
intracranial pressure: is there a relationship? Annals of Neurology. 2011; 70(2):
323-326.
142 Muchnok T, Deitch K, Giraldo P. Can intraocular pressure measurements be
used to screen for elevated intracranial pressure in emergency department
patients? The Journal of Emergency Medicine. 2012; 43(3): 532-537.
143 Spentzas T, Henricksen J, Patters AB, Chaum E. Correlation of intraocular
pressure with intracranial pressure in children with severe head
injuries. Pediatric Critical Care Medicine. 2010; 11(5): 593-598.
144 Lehman RA, Krupin T, Podos SM. Experimental effect of intracranial
hypertension upon intraocular pressure. Journal of Neurosurgery. 1972; 36(1):
60-66.

234
145 Yavin D, Luu J, James MT, et al. Diagnostic accuracy of intraocular pressure
measurement for the detection of raised intracranial pressure: meta-analysis: a
systematic review. Journal of Neurosurgery. 2014; 121(3): 680-687.
146 Li Z, Yang Y, Lu Y, et al. Intraocular pressure vs intracranial pressure in
disease conditions: a prospective cohort study (Beijing iCOP study). BMC
Neurology. 2012; 12(1): 66.
147 Larson MD, Muhiudeen I. Pupillometric analysis of the absent light
reflex. Archives of neurology. 1995; 52(4): 369-372.
148 Du R, Meeker M, Bacchetti P, Larson MD, Holland MC, Manley GT.
Evaluation of the portable infrared pupillometer. Neurosurgery. 2005; 57(1):
198-203.
149 Taylor WR, Chen JW, Meltzer H, et al. Quantitative pupillometry, a new
technology: normative data and preliminary observations in patients with acute
head injury: technical note. Journal of Neurosurgery. 2003; 98(1): 205-213.
150 Boev AN, Fountas KN, Karampelas I, et al. Quantitative pupillometry:
normative data in healthy pediatric volunteers. Journal of Neurosurgery:
Pediatrics. 2005; 103(6 Suppl): 496-500.
151 Geeraerts T, Newcombe VF, Coles JP, et al. Use of T2-weighted magnetic
resonance imaging of the optic nerve sheath to detect raised intracranial
pressure. Critical Care. 2008; 12(5): R114.

235
152 Gibby WA, Cohen MS, Goldberg HI, Sergott RC. Pseudotumor cerebri: CT
findings and correlation with vision loss. American Journal of Roentgenology.
1993; 160(1): 143-146.
153 Sekhon MS, Griesdale DE, Robba C, et al. Optic nerve sheath diameter on
computed tomography is correlated with simultaneously measured intracranial
pressure in patients with severe traumatic brain injury. Intensive Care
Medicine. 2014; 40(9): 1267-1274.
154 Hansen HC, Helmke K. Validation of the optic nerve sheath response to
changing cerebrospinal fluid pressure: ultrasound findings during intrathecal
infusion tests. Journal of Neurosurgery. 1997; 87(1): 34-40.
155 Wang L, Feng L, Yao Y, et al. Optimal optic nerve sheath diameter threshold
for the identification of elevated opening pressure on lumbar puncture in a
Chinese population. PloS one. 2015; 10(2): e0117939.
156 Bäuerle J, Nedelmann M. Sonographic assessment of the optic nerve sheath in
idiopathic intracranial hypertension. Journal of Neurology. 2011; 258(11):
2014-2019.
157 Dubourg J, Javouhey E, Geeraerts T, Messerer M, Kassai B. Ultrasonography
of optic nerve sheath diameter for detection of raised intracranial pressure: a
systematic review and meta-analysis. Intensive Care Medicine. 2011; 37(7):
1059-1068.
158 Soldatos T, Chatzimichail K, Papathanasiou M, Gouliamos A. Optic nerve
sonography: a new window for the non-invasive evaluation of intracranial
pressure in brain injury. Emergency Medicine Journal. 2009; 26(9): 630-634.

236
159 Hee MR, Izatt JA, Swanson EA, et al. Optical coherence tomography of the
human retina. Archives of Ophthalmology. 1995; 113(3): 325-332.
160 Scott CJ, Kardon RH, Lee AG, Frisen L, Wall M. Diagnosis and grading of
papilledema in patients with raised intracranial pressure using optical
coherence tomography vs clinical expert assessment using a clinical staging
scale. Archives of Opthalmology. 2010; 128(6): 705-711.
161 Driessen C, Eveleens J, Bleyen I, Van Veelen ML, Joosten K, Mathiijssen I.
Optical coherence tomography: a quantitative tool to screen for papilledema in
craniosynostosis. Childs Nerv Syst. 2014; 30: 1067-1073.
162 Kruse FE, Burk RO, Völcker HE, Zinser G, Harbarth U. Reproducibility of
topographic measurements of the optic nerve head with laser tomographic
scanning. Ophthalmology. 1989; 96(9): 1320-1324.
163 Rohrschneider K, Burk RO, Kruse FE, Völcker HE. Reproducibility of the
optic nerve head topography with a new laser tomographic scanning
device. Ophthalmology. 1998; 101(6): 1044-1049.
164 Trick GL, Vesti E, Tawansy K, Skarf B, Gartner J. Quantitative evaluation of
papilledema in pseudotumor cerebri. Investigative Ophthalmology Visual
Science. 1998; 39(10): 1964-1971.
165 Heckmann JG, Weber M, Jünemann AG, Neundörfer B, Mardin CY. Laser
scanning tomography of the optic nerve vs CSF opening pressure in idiopathic
intracranial hypertension. Neurology. 2004; 62(7): 1221-1223.

237
166 Jacks AS, Miller NR. Spontaneous retinal venous pulsation: aetiology and
significance. Journal of Neurology, Neurosurgery and Psychiatry. 2003; 74(1):
7-9.
167 Levin BE. The clinical significance of spontaneous pulsations of the retinal
vein. Archives of Neurology. 1978; 35(1): 37-40.
168 Wong SH, White RP. The clinical validity of the spontaneous retinal venous
pulsation. Journal of Neuro-Ophthalmology. 2013; 33(1): 17-20.
169 Baurmann M. On the origin and clinical significance of retinal venous pulse.
Zusammenkunft Deutschen Ophthalmologie. 1925; 45: 53-59.
170 Firsching R, Schütze M, Motschmann M, Behrens-Baumann W. Venous
ophthalmodynamometry: a noninvasive method for assessment of intracranial
pressure. Journal of Neurosurgery. 2000; 93(1): 33-36.
171 Samuel M, Burge DM, Marchbanks RJ. Quantitative assessment of intracranial
pressure by the tympanic membrane displacement audiometric technique in
children with shunted hydrocephalus. European Journal of Pediatric Surgery.
1998; 8(4): 200-207.
172 Jerin C, Berman A, Krause E, Ertl-Wagner B, Gürkov R. Ocular vestibular
evoked myogenic potential frequency tuning in certain Meniere's
disease. Hearing Research. 2014; 310: 54-59.
238
173 Shimbles S, Dodd C, Banister K, Mendelow AD, Chambers IR. Clinical
comparison of tympanic membrane displacement with invasive intracranial
pressure measurements. Physiological Measurement. 2005; 26(6): 1085.
174 Silverman CA, Linstrom CJ. How to measure cerebrospinal fluid pressure
invasively and noninvasively. Journal of Glaucoma. 2013; 22: S26-S28.
175 Voss SE, Horton NJ, Tabucchi TH, Folowosele FO, Shera CA. Posture-
induced changes in distortion-product otoacoustic emissions and the potential
for noninvasive monitoring of changes in intracranial pressure. Neurocritical
Care. 2006; 4(3): 251-257.
176 Büki B, Avan P, Lemaire JJ, Dordain M, Chazal J, Ribari O. Otoacoustic
emissions: a new tool for monitoring intracranial pressure changes through
stapes displacements. Hearing Research. 1996; 94(1): 125-139.
177 Frank AM, Alexiou C, Hulin P, Janssen T, Arnold W, Trappe AE. Non-
invasive measurement of intracranial pressure changes by otoacoustic
emissions (OAEs) - a report of preliminary data. Zentralblatt fur
Neurochirurgie. 1999; 61(4): 177-180.
178 Kiesler J, Ricer R. The abnormal fontanel. American Family Physician. 2003;
67(12): 2547-2552.

239
179 Purin VR. Measurement of the cerebrospinal fluid pressure in the infant
without puncture. A new method. Pediatriya. 1964; 43: 82-85.
180 Vidyasagar D, Raju TNK. A simple noninvasive technique of measuring
intracranial pressure in the newborn. Pediatrics. 1977; 59(6): 957-961.
181 Peters RJA, Hanlo PW, Gooskens RHJ, Braun KPJ, Tulleken CAF, Willemse
J. Non-invasive ICP monitoring in infants: the Rotterdam Teletransducer
revisited. Child's Nervous System. 2005; 11(4): 207-213.
182 Lupetin AR, Davis DA, Beckham I, Dash N. Transcranial Doppler
Sonography. Part 1. Principles, technique, and normal appearences.
Radiographics. 1995; 15(1): 179-191.
183 Aaslid R, Markwalder TM, Nornes H. Noninvasive intracrianial doppler
ultrasound recording of flow velocity in basal cerebral arteries. Journal of
Neurosurgery. 1982; 57: 769-774.
184 Bellner J, Romner B, Reinstrup P, Kristiansson KA, Ryding E, Brandt L.
Transcranial Doppler sonography pulsatility index (PI) reflects intracranial
pressure (ICP). Surgical Neurology. 2004; 62(1): 45-51.
185 Adams RJ. TCD in sickle cell disease: an important and useful test. Pediatric
Radiology. 2005; 35(3): 229-234.

240
186 Radolovich DK, Aries MJH, Castellani G, et al. Pulsatile intracranial pressure
and cerebral autoregulation after traumatic brain injury. Neurocritical
Care. 2011; 15(3): 379-386.
187 Leliefeld PH, Gooskens RH, Peters RJ, et al. New transcranial Doppler index
in infants with hydrocephalus: transsystolic time in clinical
practice. Ultrasound in Medicine Biology. 2009; 35(10): 1601-1606.
188 Krejza J, Mariak Z, Babikian V. Importance of Angle Correction in the
Measurement of Blood Flow Velocity with Transcranial Doppler Sonography.
American Journal of Neuroradiology. 2001; 22: 1743-1747.
189 Voulgaris SG, Partheni M, Kaliora H, Haftouras N, Pessach IS, Polyzoidis KS.
Early cerebral monitoring using the transcranial Doppler pulsatility index in
patients with severe brain trauma. Annals of Transplantation. 2005; 11(2):
CR49-CR52.
190 Figaji AA, Zwane E, Fieggen AG, Siesjo P, Peter JC. Transcranial Doppler
pulsatility index is not a reliable indicator of intracranial pressure in children
with severe traumatic brain injury. Surgical Neurology. 2009; 72(4): 389-394.
191 Melo JRT, Di Rocco F, Blanot S, et al. Transcranial Doppler can predict
intracranial hypertension in children with severe traumatic brain
injuries. Child's Nervous System. 2011; 27(6): 979-984.
192 Ragauskas A, Matijosaitis V, Zakelis R, et al. Clinical assessment of
noninvasive intracranial pressure absolute value measurement
method. Neurology. 2012; 78(21): 1684-1691.

241
193 Ragauskas A, Bartusis L, Piper I, et al. Improved diagnostic value of a TCD-
based non-invasive ICP measurement method compared with the sonographic
ONSD method for detecting elevated intracranial pressure. Neurological
Research. 2014; 36(7): 607-614.
194 Alperin NJ, Lee SH, Loth F, Raksin PB, Lichtor T. MR-intracranial pressure
(ICP): a method to measure intracranial elastance and pressure noninvasively
by means of MR imaging: baboon and human study 1. Radiology. 2000;
217(3): 877-885.
195 Muehlmann M, Koerte IK, Laubender RP, et al. Magnetic resonance–based
estimation of intracranial pressure correlates with ventriculoperitoneal shunt
valve opening pressure setting in children with hydrocephalus. Investigative
Radiology. 2013; 48(7): 543-547.
196 Glick RP, Niebruegge J, Lee SH, Egibor O, Lichtor T, Alperin N. Early
experience from the application of a noninvasive magnetic resonance imaging-
based measurement of intracranial pressure in hydrocephalus. Neurosurgery.
2006; 59(5): 1052-1061.
197 Ghosh A, Elwell C, Smith M. Cerebral near-infrared spectroscopy in adults: a
work in progress. Anesthesia and Analgesia. 2012; 115(6): 1373-1383.
198 Kampfl A, Pfausler B. Denchev D, Jaring P, Schmutzhard E. Near Infrared
Spectroscopy (NIRS) in Patients with Severe Brain Injury and Elevated
Intracranial Pressure. Acta Neurochirurgica Supplements. 1997; 70: 112-114.

242
199 Weerakkody RA, Czosnyka M, Zweifel C, et al. Near infrared spectroscopy as
possible non-invasive monitor of slow vasogenic ICP waves. Acta
Neurosurgical Supplement. 2012; 114: 181-185.
200 Zweifel C, Castellani G, Czosnyka M, et al. Continuous assessment of cerebral
autoregulation with near-infrared spectroscopy in adults after subarachnoid
hemorrhage. Stroke. 2010; 41(9): 1963-1968.
201 Chen H, Wang J, Mao S, Dong W, Yang H. A new method of intracranial
pressure monitoring by EEG power spectrum analysis. Canadian Journal of
Neurological Sciences. 2012; 39(4): 483-487.
202 Liasis A, Thompson DA, Hayward R, Nischal KK. Sustained raised
intracranial pressure implicated only by pattern reversal visual evoked
potentials after cranial vault expansion surgery. Pediatric neurosurgery.
2003; 39(2): 75-80.
203 Rosenfeld JP, Owen RL. Instrumental conditioning of photic evoked
potentials: mechanisms and properties of late component modification.
Physiology and Behavior. 1972; 9(5): 851-858.
204 Wu X, Ji Z. Non-invasive detection for intracranial high pressure with FVEP
picked-up by independent component analysis. Journal of Biomedical
Engineering. 2007; 24(5): 1015-1018.
205 York DH, Pulliam MW, Rosenfeld JG, Watts C. Relationship between visual
evoked potentials and intracranial pressure. Journal of Neurosurgery. 1981;
55(6): 909-916.

243
206 York D, Legan M, Benner S, Watts C. Further studies with a noninvasive
method of intracranial pressure estimation. Neurosurgery. 1984; 14(4): 456-
461.
207 Desch LW. Longitudinal stability of visual evoked potentials in children and
adolescents with hydrocephalus. Developmental Medicine Child
Neurology. 2001; 43(02): 113-117.
208 Zhao YL, Zhou JY, Zhu GH. Clinical experience with the noninvasive ICP
monitoring system. Intracranial Pressure and Brain Monitoring XII. 2005; 151-
155.
209 Andersson L, Sjölund J, Nilsson J. Flash visual evoked potentials are unreliable
as markers of ICP due to high variability in normal subjects. Acta
Neurochirurgica. 2012; 154(1): 121-127.
210 Hiler M, Czosnyka M, Hutchinson P, et al. Predictive value of initial
computerized tomography scan, intracranial pressure, and state of
autoregulation in patients with traumatic brain injury. Journal of Neurosurgery.
2006; 104(5): 731-737.
211 Tuite GF, Evanson J, Chong WK, Thompson DN, Harkness WF, Jones BM, et
al. The beaten copper cranium: a correlation between intracranial pressure,
cranial radiographs, and computed tomographic scans in children with
craniosynostosis. Neurosurgery. 1996; 39(4): 691-699.
212 Thompson P, Toga AW. A surface-based technique for warping three-
dimensional images of the brain. Medical Imaging. 1996; 15(4): 402-417.

244
213 Reed MJ, Browning JG, Wilkinson AG, Beattie T. Can we abolish skull x-rays
for head injury? Archives of Disease in Childhood. 2005; 90(8): 859-864.
214 Sadhu VK, Sampson J, Haar FL, Pinto RS, Handel SF. Correlation between
computed tomography and intracranial pressure monitoring in acute head
trauma patients 1. Radiology. 1979; 133(2): 507-509.
215 Eisenberg HM, Gary Jr HE, Aldrich EF, et al. Initial CT findings in 753 patients
with severe head injury: a report from the NIH Traumatic Coma Data
Bank. Journal of Neurosurgery. 1990; 73(5): 688-698.
216 Eide PK. The relationship between intracranial pressure and size of cerebral
ventricles assessed by computed tomography. Acta Neurochirurgica. 2003;
145(3): 171-179.
217 Miller MT, Pasquale M, Kurek S, et al. Initial head computed tomographic scan
characteristics have a linear relationship with initial intracranial pressure after
trauma. Journal of Trauma and Acute Care Surgery. 2004; 56(5): 967-973.
218 Kouvarellis AJ, Rohlwink UK, Sood V, Van Breda D, Gowen MJ, Figaji AA.
The relationship between basal cisterns on CT and time-linked intracranial
pressure in paediatric head injury. Child's Nervous System. 2011; 27(7): 1139-
1144.

245
219 Mizutani T, Manaka S, Tsutsumi H. Estimation of intracranial pressure using
computed tomography scan findings in patients with severe head injury.
Surgical Neurology. 1990; 33(3): 178-184.
220 Toutant SM, Klauber MR, Marshall LF. Absent or compressed basal cisterns
on first CT scan: ominous predictors of outcome in severe head injury. Journal
of neurosurgery. 1984; 61(4): 691-694.
221 Pauwels EK, Bourguignon MH. Radiation dose features and solid cancer
induction in pediatric computed tomography. Medical Principles and Practice.
2012; 21(6): 508-515.
222 Krille L, Zeeb H, Jahnen A. Computed tomographies and cancer risk in
children: a literature overview of CT practices, risk estimations and an
epidemiologic cohort study proposal. Radiation and Environmental
Biophysics. 2012; 51(2): 103-111.
223 Smyth MD, Narayan P, Tubbs RS, et al. Cumulative diagnostic radiation
exposure in children with ventriculoperitoneal shunts: a review. Child’s
Nervous System. 2008; 24(4): 493-497.
224 Pearce MS, Salotti JA, Little MP, et al. Radiation exposure from CT scans in
childhood and subsequent risk of leukaemia and brain tumours: a retrospective
cohort study. The Lancet. 2012; 380(9840): 499-505.
225 Brenner DJ, Hall EJ. Computed tomography: an increasing source of radiation
exposure. New England Journal of Medicine. 2007; 357(22): 2277-2284.

246
226 Zhang X, Burstein R, Levy D. Local action of the proinflammatory cytokines
IL-1β and IL-6 on intracranial meningeal nociceptors. Cephalalgia. 2012;
32(1): 66-72.
227 Marshall I, MacCormick I, Sellar R, Whittle I. Assessment of factors affecting
MRI measurement of intracranial volume changes and elastance index. British
Journal of Neurosurgery. 2008; 22(3): 389-397.
228 Gass A, Barker GJ, Riordan-Eva P, et al (1996). MRI of the optic nerve in
benign intracranial hypertension. Neuroradiology. 1996; 38(8): 769-773.
229 Raskin PB, Alperin N, Sivaramakrishnan A, Surapaneni S, Lichtor T.
Noninvasive intracranial compliance and pressure based on dynamic magnetic
resonance imaging of blood flow and cerebrospinal fluid flow: review of
principles, implementation, and other noninvasive approaches. Neurosurgical
Focus. 2003; 14(4): 1-8.
230 Alperin N, Hushek SG, Lee SH, Sivaramakrishnan A, Lichtor T (2005). MRI
study of cerebral blood flow and CSF flow dynamics in an upright posture: the
effect of posture on the intracranial compliance and pressure. Intracranial
Pressure and Brain Monitoring XII. 2005; 177-181.
231 Lagreze WA, Lazzaro A, Weigel M, Hansen H, Hennig J, Bley TA.
Morphometry of the retrobulbar human optic nerve: comparison between
conventional sonography and ultrafast magnetic resonance
sequences. Investigative Ophthalmology and Visual Science. 2007; 48(5):
1913.
232 Greitz D. Radiological assessment of hydrocephalus: new theories and
implications for therapy. Neurosurgical Review. 2004; 27(3): 145-165.

247
233 Dinçer A, Özek MM. Radiologic evaluation of pediatric hydrocephalus. Child's
Nervous System. 2011; 27(10): 1543-1562.
234 McAuley D, Paterson A, Sweeney L. Optic nerve sheath ultrasound in the
assessment of paediatric hydrocephalus. Child's Nervous System. 2009; 25(1):
87-90.
235 Tsung JW, Blaivas M, Cooper A, Levick NR. A rapid noninvasive method of
detecting elevated intracranial pressure using bedside ocular ultrasound:
application to 3 cases of head trauma in the pediatric emergency department.
Pediatric Emergency Care. 2005; 21(2): 94-98.
236 Agrawal S, Brierley J. Optic nerve sheath measurement and raised intracranial
pressure in paediatric traumatic brain injury. European Journal of Trauma and
Emergency Surgery. 2012; 38(1): 75-77.
237 Steinborn M, Fiegler J, Kraus V, et al. High resolution ultrasound and magnetic
resonance imaging of the optic nerve and the optic nerve sheath: anatomic
correlation and clinical importance. Ultraschall in der Medizin. 2011; 32(6):
608-613.
238 Singhal A, Yang MM, Sargent MA, Cochrane DD. Does optic nerve sheath
diameter on MRI decrease with clinically improved pediatric hydrocephalus?
Child's Nervous System. 2013; 29(2): 269-274.
239 Padayachy LC, Kilborn T, Carrara H, Figaji AA, Fieggen GA. Change in optic
nerve sheath diameter as a radiological marker of outcome from endoscopic

248
third ventriculostomy in children. Child's Nervous System. 2015; 31(5): 721-
728.
240 Shofty B, Ben-Sira L, Constantini S, Freedman S, Kesler A. Optic nerve sheath
diameter on MR imaging: establishment of norms and comparison of pediatric
patients with idiopathic intracranial hypertension with healthy controls.
American Journal of Neuroradiology. 2012; 33(2): 366-369.
241 Driessen C, Van Veelen ML, Lequin M, Joosten KM, Mathijssen I. Nocturnal
ultrasound measurements of optic nerve sheath diameter correlate with
intracranial pressure in children with craniosynostosis. Plastic and
Reconstructive Surgery. 2012; 130(3): 448-451.
242 Le A, Hoehn ME, Smith ME, Spentzas T, Schlappy D, Pershad J. Bedisde
sonographic measurement of optic nerve sheath diameter as a predictor of
increased intracranial pressure in children. Annals of Emergency Medicine.
2009; 53(6): 785-791.
243 Blaivas M, Theodoro D, Sierzenski PR. Elevated Intracranial Pressure
Detected by Bedside Emergency Ultrasonography of the Optic Nerve Sheath.
Academic Emergency Medicine. 2003; 10(4): 376-381.
244 Shirodkar CG, Rao SM, Mutkule DP, Harde YR, Venkategowda PM, Mahesh
MU. Optic nerve sheath diameter as a marker for evaluation and
prognostication of intracranial pressure in Indian patients: An observational
study. Indian Journal of Critical Care Medicine. 2014; 18(11): 728-734.

249
245 Cammarata G, Ristagno G, Cammarata A, Mannanici G, Denaro C, Gullo A.
Ocular ultrasound to detect intracranial hypertension in trauma
patients. Journal of Trauma and Acute Care Surgery. 2011; 71(3): 779-781.
246 Frumin E, Schlang J, Wiechmann W, et al. Prospective analysis of single
operator sonographic optic nerve sheath diameter measurement for diagnosis
of elevated intracranial pressure. Western Journal of Emergency
Medicine. 2014; 15(2): 217.
247 Amini A, Kariman H, Dolatabadi AA, et al. Use of the sonographic diameter
of optic nerve sheath to estimate intracranial pressure. The American Journal
of Emergency Medicine. 2013; 31(1): 236-239.
248 Guthoff R, Thijssen JM. Ultrasound in ophthalmologic diagnosis: a practical
guide. Georg Thieme Verlag. 1991.
249 Ossoinig KC. Standardized echography of the optic nerve. Ophthalmic
Echography. 1993; 13: 3-99.
250 Lochner P, Mader C, Nardone R, et al. Sonography of the optic nerve sheath
beyond the hyperacute stage of intracerebral hemorrhage. Journal of
Ultrasound. 2014; 17(3): 225-228.
251 Qayyum H, Ramlakhan S. Can ocular ultrasound predict intracranial
hypertension? A pilot diagnostic accuracy evaluation in a UK emergency
department. European Journal of Emergency Medicine. 2013; 20(2): 91-97.

250
252 Hansen HC, Lagreze W, Krueger O, Helmke K. Dependence of the optic nerve
sheath diameter on acutely applied subarachnoidal pressure–an experimental
ultrasound study. Acta Ophthalmologica. 2011; 89(6): e528-e532.
253 Watanabe A, Kinouchi H, Horikoshi T, Uchida M, Ishigame K. Effect of
intracranial pressure on the diameter of the optic nerve sheath. Journal of
Neurosurgery. 2008; 109(2): 255-258.
254 Xie X, Zhang X, Fu J, Wang H, et al. Noninvasive intracranial pressure
estimation by orbital subarachnoid space measurement: the Beijing Intracranial
and Intraocular Pressure (iCOP) study. Critical Care. 2013; 17(4): 162.
255 Kramer LA, Sargsyan AE, Hasan KM, Polk JD, Hamilton DR. Orbital and
intracranial effects of microgravity: findings at 3-T MR
imaging. Radiology. 2012; 263(3): 819-827.
256 Legrand A, Jeanjean P, Delanghe F, Peltier J, Lecat B, Dupont H. Estimation
of optic nerve sheath diameter on an initial brain computed tomography scan
can contribute prognostic information in traumatic brain injury
patients. Critical Care. 2013; 17(2): R61.
257 Vaiman M, Gottlieb P, Bekerman I. Quantitative relations between the eyeball,
the optic nerve, and the optic canal important for intracranial pressure
monitoring. Head Face Medicine. 2014; 10(1): 32.
258 Hwan Kim Y, Ho Lee J, Kun Hong C, et al. Feasibility of Optic Nerve Sheath
Diameter Measured on Initial Brain Computed Tomography as an Early

251
Neurologic Outcome Predictor After Cardiac Arrest. Academic Emergency
Medicine. 2014; 21(10): 1121-1128.
259 Sekhon MS, McBeth P, Zou J, et al. Association between optic nerve sheath
diameter and mortality in patients with severe traumatic brain
injury. Neurocritical care. 2014; 21(2): 245-252.
260 Blehar DJ, Gaspari RJ, Montoya A, Calderon R. Correlation of visual axis and
coronal axis measurements of the optic nerve sheath diameter. Journal of
Ultrasound in Medicine. 2008; 27(3): 407-411.
261 Strumwasser A, Kwan RO, Yeung L, et al. Sonographic optic nerve sheath
diameter as an estimate of intracranial pressure in adult trauma. Journal of
Surgical Research. 2011; 170(2): 265-271.
262 Keyes LE, Paterson R, Boatright D, Browne V, Leadbetter G, Hackett P. Optic
nerve sheath diameter and acute mountain sickness.Wilderness environmental
medicine. 2013; 24(2): 105-111.
263 Caffery TS, Perret JN, Musso MW, Jones GN. Optic nerve sheath diameter and
lumbar puncture opening pressure in nontrauma patients suspected of elevated
intracranial pressure. The American Journal of Emergency Medicine. 2014;
32(12): 1513-1515.
264 Dubourg J, Messerer M, Karakitsos D, et al. Individual patient data systematic
review and meta-analysis of optic nerve sheath diameter ultrasonography for
detecting raised intracranial pressure: protocol of the ONSD research group.
Systematic Reviews. 2013; 2(1): 1-6.
252
265 Von Elm E, Altman DG, Egger M, Pocock SJ, Gøtzsche PC, Vandenbroucke
JP. Strobe Initiative The Strengthening the Reporting of Observational Studies
in Epidemiology (STROBE) statement: guidelines for reporting observational
studies. Preventive Medicine. 2007; 45(4): 247-251.
266 Vandenbroucke JP, Von Elm E, et al. Strengthening the Reporting of
Observational Studies in Epidemiology (STROBE): explanation and
elaboration. Annals of Internal Medicine. 2007; 147(8): W-163.
267 Schoeman, JF, Van Zyl LE, Laubscher JA, Donald PR. Serial CT scanning in
childhood tuberculous meninigitis: prognostic features in 198 cases. Journal of
Child Neurology. 1995; 10 (4): 320-329.
268 Bruwer GE, Van der Westhuizen S, Lombard CJ, Schoeman JF. Can CT
predict the level of CSF block in tuberculous hydrocephalus? Child's Nervous
System. 2004; 20 (3): 183-187.
269 Drummond JC, Todd MM. Scheller MS, Shapiro HM. A comparison of the
direct cerebral vasodilating potencies of halothane and isoflurane in the New
Zealand white rabbit. Anesthesiology. 1986; (5): 462-467.
270 Matta BF, Heath KJ, Tipping K, Summors AC. Direct cerebral vasodilatory
effects of sevoflurane and isoflurane. Anesthesiology. 1999; 91(3): 677-680.
271 Pulitanò S, Mancino A, Pietrini D, et al. Effects of positive end expiratory
pressure (PEEP) on intracranial and cerebral perfusion pressure in pediatric

253
neurosurgical patients. Journal of neurosurgical anesthesiology. 2013; 25(3):
330-334.
272 Potgieter DW, Kippin A, Ngu F, McKean C. Can accurate ultrasonographic
measurement of the optic nerve sheath diameter (a non-invasive measure of
intracranial pressure) be taught to novice operators in a single training session?
Anaesthesia and Intensive Care. 2011; 39: 95-100.
273 Bäuerle J, Schuchardt F, Schroeder L, Egger K, Weigel M, Harloff A.
Reproducibility and accuracy of optic nerve sheath diameter assessment using
ultrasound compared to magnetic resonance imaging. BMC Neurology. 2013;
13(1): 187.
274 Shah S, Kimberly H, Marill K, Noble VE. Ultrasound techniques to measure
the optic nerve sheath: is a specialized probe necessary? Medical Science
Monitor. 2009; 15(5): MT63-MT68.
275 Geeraerts T, Bergès O, Merceron S, et al. Reply to Copetti and
Cattarossi. Intensive Care Medicine. 2009; 35(8): 1490-1491.
276 Adelson PD, Bratton SL, Carney NA, et al. Guidelines for the acute medical
management of severe traumatic brain injury in infants, children, and
adolescents. Chapter 6. Threshold for treatment of intracranial hypertension
Pediatric Critical Care Medicine. 2003; 4(3 Suppl): S25-27.

254
277 Kim JY, Min HG, Ha SI, Jeong HW, Seo H, Kim JU. Dynamic optic nerve
sheath diameter responses to short-term hyperventilation measured with
sonography in patients under general anesthesia. Korean Journal of
Anesthesiology. 2014; 67(4): 240-245.
278 Launey Y, Nesseler N, Le Maguet P, Mallédant Y, Seguin P. Effect of
osmotherapy on optic nerve sheath diameter in patients with increased
intracranial pressure. Journal of Neurotrauma. 2014; 31(10): 984-988.
279 Whiteley JR, Taylor J, Henry M, Epperson TI, Hand WR. Detection of elevated
intracranial pressure in robot-assisted laparoscopic radical prostatectomy using
ultrasonography of optic nerve sheath diameter. Journal of Neurosurgical
Anesthesiology. 2015; 27(2): 155-159.
280 Kim MS, Bai SJ, Lee JR, Choi YD, Kim YJ, Choi SH. Increase in intracranial
pressure during carbon dioxide pneumoperitoneum with steep trendelenburg
positioning proven by ultrasonographic measurement of optic nerve sheath
diameter. Journal of Endourology, 2014; 28(7): 801-806.
281 Maissan IM, Dirven PJ, Haitsma IK, Hoeks SE, Gommers D, Stolker RJ.
Ultrasonographic measured optic nerve sheath diameter as an accurate and
quick monitor for changes in intracranial pressure. Journal of Neurosurgery.
2015; 1-5.
282 Karakitsos D, Soldatos T, Gouliamos A, et al. Transorbital sonographic
monitoring of optic nerve diameter in patients with severe brain injury.
Transplantation Proceedings. 2006; 38(10): 3700-3706.

255
283 Singleton J, Dagan A, Edlow JA, Hoffmann B. Real-time optic nerve sheath
diameter reduction measured with bedside ultrasound after therapeutic lumbar
puncture in a patient with idiopathic intracranial hypertension. The American
Journal of Emergency Medicine. 2015; 33(6): 860.e5-860.e7.
284 Querfurth HW, Arms SW, Lichy CM, Irwin WT, Steiner T. Prediction of
intracranial pressure from noninvasive transocular venous and arterial
hemodynamic measurements. Neurocritical Care. 2004; 1(2): 183-194.
285 Querfurth HW, Lagrèze WD, Hedges TR, Heggerick PA. Flow velocity and
pulsatility of the ocular circulation in chronic intracranial hypertension. Acta
Neurologica Scandinavica. 2002; 105(6): 431-440.
286 Querfurth HW, Lieberman P, Arms S, Mundell S, Bennett M, Van Horne C.
Ophthalmodynamometry for ICP prediction and pilot test on Mt. Everest. BMC
Neurology. 2010; 10(1): 106.
287 Miller MM, Chang T, Keating R, Crouch E, Sable C. Blood flow velocities are
reduced in the optic nerve of children with elevated intracranial
pressure. Journal of Child Neurology. 2009; 24(1): 30-35.
288 Goebel W, Lieb WE, Ho A, Sergott RC, Farhoumand R, Grehn F. Color
Doppler imaging: a new technique to assess orbital blood flow in patients with
diabetic retinopathy. Investigative Ophthalmology & Visual science. 1995;
36(5): 864-870.
256
289 Baxter GM, Williamson TH, McKillop G, Dufton GN. Color Doppler
Ultrasound of Orbital and Optic Nerve Blood Flow: Effects of Posture and
Timolol 0.5%. Investigative Ophthalmology and Visual science. 1992; 33(3):
604-610.
290 Garcia JP, Garcia PT,Rosen RB, Finger PT. A 3-dimensional ultrasound C-
scan imaging technique for optic nerve measurements. Ophthalmology.
2004; 111(6): 1238-1243.
291 Zhang Y, Karl WC, Van Der Wilden G, et al. Automated 3-D intraocular
ultrasound detection of elevated intracranial pressure. In Biomedical Imaging
(ISBI). 9th IEEE International Symposium. 2012; 1571-1574.
292 Willekens K, Pinto LA, Vandewalle E, Marques-Neves C, Stalmans I. Higher
optic nerve sheath diameters are associated with lower ocular blood flow
velocities in glaucoma patients. Graefes Archive for Clinical and Experimental
Ophthalmology. 2014; 252: 477-483.
293 Lewis JP. Fast template matching. In Vision interface.1995; 95(120123): 15-
19.
294 Tappert FD. The parabolic approximation method. In Wave propagation and
underwater acoustics (Springer Berlin Heidelberg). 1977; 224-287.
295 Stein EM, Weiss GL. Introduction to Fourier analysis on Euclidean spaces.
Princeton university press (Vol. 1). 1971.

257
296 Pinsky MA. Introduction to Fourier analysis and wavelets. (Pacific Grove:
Brooks/Cole). 2002; 181-194.
297 Lee SS, Kim NJ, Sun K, et al. Association between arterial stiffness and the
deformability of red blood cells (RBCs). Clinical Hemorheology and
Microcirculation. 2006; 34(4): 475-482.
298 Tsai CHD, Sakuma S, Arai F, Kaneko M. A new dimensionless index for
evaluating cell stiffness-based deformability in microchannel. Biomedical
Engineering (IEEE Transactions). 2014; 61(4): 1187-1195.

258