Effects of thermal discharges on the microstructural growth ofMercenaria mercenaria
24
Effects of Thermal Discharges on the Microstructural Growth of Mercenaria mercenaria Michael J. Kennish and Richard K. Olsson Department of Geology, Rutgers University New Brunswick, New Jersey 08903, U.S.A. ABSTRACT / The effects of thermal discharges from the Oyster Creek Nuclear Generating Station at Barnegat Bay, New Jersey, are recorded in the microstructural growth of Mercenaria mercenaria, a common coastal marine pelecypod. The analysis of the shell microstructure shows that this bivalve acts as an effective monitor of the environmental conditions existing in the marine waters adjacent to the power station. Many physiological and environmental events such as spawning, winter (freeze) shocks, summer (heat) shocks, thermal shocks, tidal cycles, and major storms are clearly recorded in the shell microstructure. The exact time of occurrence of these events can be determined by counting daily growth increments backwards from the outer shell margins of freshly killed individuals. Microstructural growth patterns reflected in Barnegat Bay specimens indicate that these pelecypods were affected mainly by temperature extremes, temperature variations, tides, type of substratum, and age. Growth patterns in specimens from areas surrounding Oyster Creek (affected by thermal effluent) are significantly different from those from other bay localities (unaffected by thermal effluent). Mercenaria mercenaria within approximately a 1.6km radius of Oyster Creek show a lower summer growth rate (10 percent to 25 percent lower) and a greater number of growth breaks (2 to 6 more per clam) than those away from the creek. The lower summer growth rates occur in bivalves subjected to the effluent because the added heat during the summer months causes water temperatures to exceed a critical threshold for optimum growth in the species. The greater number of growth breaks takes place, in turn, because many of the breaks (thermal shock breaks) are generated by rapidly fluctuating temperatures associated with abrupt shutdowns, massive load reductions and rapid renewal of operations following shutdowns or load reduction periods at the nuclear power station. In addition, the effluent may be upsetting natural spawning events in the clams when abrupt changes in power station operations overlap with spawning periods. In this respect, spawning may be precluded by sharp temperature changes which result in physiological shocks to the animal. Received July 9, 1974. Introduction In 1963, the Jersey Central Power & Light Company initiated construction of a 1,600 megawatt power plant called the Oyster Creek Nuclear Generating Sta- tion. The plant was built on a 324-hect- are site in Lacey Township, New Jer- sey, between Forked River and Oyster Creek (Fig. 1). Plant operations began in December, 1969, and since that time thermal effluent has been discharged into Barnegat Bay by way of Oyster Creek. The effluent has raised water tempera- tures 10~ to 13~ above ambient levels at the plant site and 4 ~ to 5~ above am- bient levels at the mouth of Oyster Creek. The effects of thermal addition on the aquatic life of the outlet canal and Barne- gat Bay have drawn a great deal of at- tention in recent years. Much of the research on this problem has been con- ducted by Loveland and others (1966- 1972). Although a large volume of data has been collected on the behavior of the aquatic organisms subjected to the efflu- ent, there has been no attempt at using the fauna or flora of the bay to directly monitor the daily effects of the effluent. This is mainly because few organisms in the bay permanently record daily events, and of those that do, none has been studied in detail. The study of certain taxa, however, can shed light on the daily effects of ther- real addition. Potentially useful in this respect are a number of bivalve species whose shell growth patterns record envi- ronmental and ontogenetic events throughout their life span. Organisms best suited for this type of study are those that continually secrete shell mate- rial daily (additive growth), thereby leav- ing a day by day history of their activity. These organisms should also have growth patterns that are well known and amenable to study. Of all the species existing in Barnegat Bay, only Mercen- aria mercenaria (Linnaeus) possesses these growth characteristics. (For the convenience of the reader only the spe- cies name mercemiHa will henceforth be used in the text.) Environmental Geology Vol, 1, pp 41-64 @ 1975 by Springer-Verlag New York Inc. 41
-
Upload
independent -
Category
Documents
-
view
0 -
download
0
Transcript of Effects of thermal discharges on the microstructural growth ofMercenaria mercenaria

Effects of Thermal Discharges on the Microstructural Growth of Mercenaria mercenaria
Michael J. Kennish and Richard K. Olsson Department of Geology, Rutgers University New Brunswick, New Jersey 08903, U.S.A.
ABSTRACT / The effects of thermal discharges from the Oyster Creek Nuclear Generating Station at Barnegat Bay, New Jersey, are recorded in the microstructural growth of Mercenaria mercenaria, a common coastal marine pelecypod. The analysis of the shell microstructure shows that this bivalve acts as an effective monitor of the environmental condit ions existing in the marine waters adjacent to the power station. Many physiological and environmental events such as spawning, winter (freeze) shocks, summer (heat) shocks, thermal shocks, tidal cycles, and major storms are clearly recorded in the shell microstructure. The exact time of occurrence of these events can be determined by counting daily growth increments backwards from the outer shell margins of freshly killed individuals.
Microstructural growth patterns reflected in Barnegat Bay specimens indicate that these pelecypods were affected mainly by temperature extremes, temperature variations, tides, type of substratum, and age. Growth patterns in specimens from areas surrounding Oyster Creek (affected by thermal effluent) are significantly different from those from other bay localities (unaffected by thermal effluent). Mercenaria mercenaria within approximately a 1.6km radius of Oyster Creek show a lower summer growth rate (10 percent to 25 percent lower) and a greater number of growth breaks (2 to 6 more per clam) than those away from the creek. The lower summer growth rates occur in bivalves subjected to the effluent because the added heat during the summer months causes water temperatures to exceed a critical threshold for optimum growth in the species. The greater number of growth breaks takes place, in turn, because many of the breaks (thermal shock breaks) are generated by rapidly fluctuating temperatures associated with abrupt shutdowns, massive load reductions and rapid renewal of operations fol lowing shutdowns or load reduction periods at the nuclear power station.
In addition, the effluent may be upsetting natural spawning events in the clams when abrupt changes in power station operations overlap with spawning periods. In this respect, spawning may be precluded by sharp temperature changes which result in physiological shocks to the animal.
Received July 9, 1974.
Introduction
In 1963, the Jersey Central Power & Light Company initiated construction of a 1,600 megawatt power plant called the Oyster Creek Nuclear Generating Sta- tion. The plant was built on a 324-hect- are site in Lacey Township, New Jer- sey, between Forked River and Oyster Creek (Fig. 1). Plant operations began in December, 1969, and since that time thermal effluent has been discharged into Barnegat Bay by way of Oyster Creek. The effluent has raised water tempera- tures 10 ~ to 13~ above ambient levels at the plant site and 4 ~ to 5~ above am- bient levels at the mouth of Oyster Creek.
The effects of thermal addition on the aquatic life of the outlet canal and Barne- gat Bay have drawn a great deal of at- tention in recent years. Much of the research on this problem has been con- ducted by Loveland and others (1966- 1972). Although a large volume of data has been collected on the behavior of the aquatic organisms subjected to the efflu- ent, there has been no attempt at using the fauna or flora of the bay to directly monitor the daily effects of the effluent. This is mainly because few organisms in the bay permanently record daily events, and of those that do, none has been studied in detail.
The study of certain taxa, however, can shed light on the daily effects of ther- real addition. Potentially useful in this respect are a number of bivalve species whose shell growth patterns record envi- ronmental and ontogenetic events throughout their life span. Organisms best suited for this type of study are those that continually secrete shell mate- rial daily (additive growth), thereby leav- ing a day by day history of their activity. These organisms should also have growth patterns that are well known and amenable to study. Of all the species existing in Barnegat Bay, only Mercen- aria mercenaria (Linnaeus) possesses these growth characteristics. (For the convenience of the reader only the spe- cies name mercemiHa will henceforth be used in the text.)
Environmental Geology Vol, 1, pp 41-64 @ 1975 by Springer-Verlag New York Inc. 41

2 Michael J. Kennish and Richard K. Olsson
0 1 2 I I I km Toms River
Figure 1. Map of Barnegat Bay, New Jersey. The inset on the upper left-hand part of the map shows the location of Barnegat Bay in relationship to the state of New Jersey. (After Phillips 1972.)
Cedar Creek
74 ~
Stouts Creek
Forked River ' ~
Power ~ plant �9
Oyster ~ Waretown Cr
i;Yi:i!!il i!!i! �84 i i'i �84184184 i �84 ~ 'zi
i Z
~ i ~! h ) . i ~ ~
. " 5 �84 ,
Ocear}
The aim of this research project was to analyze the microstructural growth patterns of mercenaria from Barnegat Bay, New Jersey, to determine the ef- fects of thermal addition on them. Valves of specimens were sectioned perpendicular to the shell surface from umbone to the outer shell margin, and acetate peel replicas of the etched cross sections made. In this way the outer prismatic shell layer could be studied microscopically and the life history of the organisms decifered on a daily basis. This technique, called the microstructur-
al shell growth or growth increment anal- ysis technique, was first initiated by Barker (1964), and later extended by Pannella and MacClintock (I 968), Clark (1968, 1974), Far row and House (1968), Rhoads and Pannella (1970), Far row (1971, 1972), and Cunliffe (1974).
Preliminary results of this inves- tigation indicate that mercenaria is a powerful tool for ecological and paleo- ecological research. Because the shell of mercenaria continuously records both physiological and environmental events, it is suggested that the bivalve be used in
the future as an economically feasi~ and practical method of monitoring e vironmental parameters in coastal [] rine waters. However , additional exper mentation with mercenaria must l conducted in order to determine the a plicability of its shell growth patten to specific environmentally relate problems.
Characteristics of Barnegat Bay
Barnegat Bay is a shallow lagoe: type estuary between 39 ~ 42 'N and 41 05 'N latitude along the east coast~ New Jersey (Fig. 1). The bay is sepan ed from the Atlantic Ocean by a barri~ island some 64 km long oriented rough north-south. The barrier is a rather cot tinuous feature with the exception ~ Barnegat |nJet in the southern part ofth bay, where the bay communicates freel with the Atlantic Ocean. The bay i bounded on the west by the New Jersc mainland, along which salt marshes an streams are prominent.
The bay region extends for 48 kr along the coast as an elongate and irregt lar tidal basin which is 2 to 6.5 km widi The surface area is estimated to be ove 167,400,000 sq m whereas the volumei approximately 238,000,000 cu m. Th average water depth is less than 2 m a[ though the deepest part, the Intracoast~ Waterway, averages 3 to 4 m in deptt The shallowness of the bay and the loc~ tion of the barrier island regulate tide~ salinities, currents, and temperatures Because the barrier is breached at Bar negat Inlet, maximum tidal range (Table 1) and salinities (Fig. 2) occur that area. Table 2 illustrates the range 0 bottom salinity at three central bay local ities recorded by Loveland and other

Table 1 Tide Characteristics in Barnegat Bay
Posit ion
Location (see Fig. 9) Lat i tude Long i tude
Difference (t ime di f ference on Sandy Hook)
High water Low water
Range Mean tide
Mean Spring level
deg. min. deg. min. hr. Mantoloking 40 02 74 03 +5 Coates Point 39 57 74 07 +4 Toms River (town)- 39 57 74 12 +4 Waretown 39 47 74 11 +2 Oyster Creek Channel 39 47 74 08 +2
(off Sedge Island) Barnegat Inlet 39 46 74 06 --0 Harvey Cedars 39 42 74 08 +3
min. hr. min. m m m 34 +5 34 .15 .18 .06 19 +4 28 .15 .18 .06 37 +4 47 .18 .21 .09 33 +2 49 .18 .21 .09 16 +2 17 .18 .21 .09
20 - 0 21 .94. 1.20 .46 15 +4 02 .24 .30 .12
Data from the Tide Tables, High and Low Water Predictions, U. S. Coast and GeodetLc Survey, 1965.
Figure 2. Salinity prof i le of Barnegat Bay for August and September, 1963; Salinity is given as thousands of parts per mill ion. The l ine of prof i le (A-A') is Figure 1. (After Carpenter 1963.)
A A u g u s t 5 A '
co o A August 27 A'
121
A September 14-15 A'
0 8 I I I I I I
Kilometers
16 I I I I
Table 2 Ranges of Bottom Salinity Recorded at Three Central Bay Localities in 1971-1972
Location Depth (see Fig. 1) (meters)
Sal ini ty ranges (in parts per thousand) and dates recorded
1971 1972
Light 1, Stouts Creek 2.3 19.73 - 26.13 19.01 - 27.32 (12 /9 /71) - (8 /6 /71) (4 /5 /72) - (8 /1 /72)
Light 2, Forked River 2.1 19.54 - 27.03 19.90 - 27.97 (9 /22 /71) - (8 /6 /71) (5 /16 /72) - (8 /1 /72)
Light 3, Oyster Creek 1.9 19.36 - 26.67 20.31 - 25.98 (9 /22 /71) - (8 /6 /71) (5 /16 /72) - (8 /1 /72)
43

4 Michael J. Kennish and Richard K. Olsson
o i 2 I I I km
WE
(1972) for various dates in 1971 - 1972. Salinity tends to be lowest in the spring and fall when precipitation is greatest and highest in the summer when evapo- ration is high and precipitation low. Be- cause of the enclosure of the bay, cur- rents are strongly influenced by wind
action. Winds affect the tidal currents and water levels and agitate the sub- strate to create a considerable amount of turbidity.
Fig. 3 shows the distribution of the different kinds of substrates in Barnegat Bay, based on data collected by Phillips
Figure 3. Sediment distribution in Barnegat Bay.
(Fig. 4) and the authors. Barnegat I]~ possesses a sandy substrate. The cot position of the substrate at any particul: locality depends on its proximity to Ba negat lnlet and the mainland. From Ba negat Inlet westward towards Oyst~ Creek and the mainland, there is a tel dency for sediment to become fin~ grained, to be less well sorted, and t contain a higher concentration of organi material. All areas east of the Intracoa~ tal Waterway are derived from the A lantic Ocean as indicated by the pre ence of several islands (for exampl~ Sedge and Clam Islands) and the at sence of seaward building spits. The l= tracoastal Waterway, trending nortt south marks a zone of sharp change i the composition of the substrate. Her~ the percentage of silt and clay increase whereas sediment sorting decreases i: relationship to the area to the east. "l-h Intracoastal Waterway behaves as a sin collecting mud from terrestrial source along the mainland. Sediment composi tion on the western margin of the bay i controlled mainly by proximity I, streams and marshlands along the mair land from which the fine sediment frar tion is derived.
The substrate composition exert some control over the distribution 0 mercenaria in the bay. Populations at, extremely meager to absent in sand muds, such as at the mouths of Stout Creek, Forked River, and Oyster Creek Their abundance increases in mudd, sands, although in the Intracoastal Wa terway they decrease to near zero. Eas of the Intracoastal Waterway popul~ tions are most abundant in the fin~ sands. In general, the distribution ant density of mercenaria within any popu lation is uniform. In substrates rich il muds, however, densities within popula tions are low.
Campbell (1965) determined the dis tribution and density of quahogs in th~

Thermal Discharge and Mercenaria 4 5
Figure 4. Median grain diameter (M2) and sorting coefficient (So) values of sediment samples collected from various localities in Barnegat Bay. Values are presented as M2/S o. M 2 values are in microns; S O values are dimensionless. (After Phillips 1972.)
vicimty of Forked River and Oyster Creek prior to the onset of thermal addi- tion (Fig. 5). Fig. 5 illustrates the patchy distribution of quahogs in Barnegat Bay and the uniformity in density. Except for one small patch south of Oyster Creek, in which a moderate degree of concen- tration is observed, most of the area shows a similar density pattern. The dis- tribution and density patterns do not seem to have changed significantly over the past eight years even with the onset of thermal addition. According to the Bureau of Fisheries and Wildlife (1963), and Campbell (1965), Barnegat Bay supports a quahog fishery ranging from recreational to moderately commercial in value.
Thermal add i t ion
With the onset of operations at the Oyster Creek Nuclear Generating Sta- tion, circulation patterns in Forked Riv- er, Oyster Creek, and adjacent bay areas were altered. Figure 6 shows the present flow patterns in these areas. Water used in cooling plant condensers is drawn from Forked River and Barnegat Bay by way of a dredged canal that connects the South Branch of Forked River to Oyster Creek. Heated water is then discharged into the outlet canal that flows into Oys- ter Creek and Barnegat Bay. The dis- tance from the discharge site to the mouth of Oyster Creek is about 3 km. A large amount of heat is dissipated in the outlet canal before the effluent reaches the bay.
in the fall of 1971, the plant at tained its peak operating capacity of 1930 megawatts thermal. At this level about 1,738 cu m of water per minute are con- tinuously pumped through the plant.
183 �9 . 1 . 3
1.3
185 12o �9 . . . . 1 . 3
/
kJ ~oCe an
When water temperatures in the outlet canal adjacent to the plant exceed 35.6~ dilution pumps are started in order to prevent water temperatures in the bay from reaching the 35~ limit set by the State of New Jersey, Department of Public Utilities. Four dilution pumps are available. The number used at any one time depends on the level at which the plant is operating and the water tem- peratures recorded in the outlet canal. Temperatures are continuously mOni- tored by sensors located on the U.S. Highway 9 bridge and in Barnegat Bay.
Although water temperatures in the bay have been kept below the 35~ limit, they have risen substantially above am- bient at the mouth of Oyster Creek. Water temperatures recorded in Barne- gat Bay between March 23 and Septem- ber 29, 1973, parallel, those monitored by koveland and others (Table 3) in pre- vious years. Surface and bottom temper- atures at a number of localities IYom Stouts Creek to Barnegat Beach on both sides of the Intracoastal Waterway show that temperatures at the mouth of Oyster Creek are consistently 3 ~ to 5~ above

6 Michael J. Kennish and Richard K. Olsson
0 1 2 I I I km
ire meter
Forked River
) . . . . . . . . . ]
z . . l y .
ambient whenever the plant is operating. A comparison of monthly ambient sur- face and bottom temperatures taken in 1973 at the northern extremity of Stouts Creek (station 23, Fig. 9) to those affect- ed by the effluent at the mouth of Oyster Creek (station 1, Fig. 9) are illustrated in Fig. 7. Both surface and bottom temper- atures at the mouth of Oyster Creek are well above ambient levels, especially in the summer. During late April, May, and late September, 1973, temperatures at the mouth of Oyster Creek correspond- ed to ambient temperatures. At these
times, the nuclear power plant was not operating.
Well developed thermal plumes exist adjacent to Oyster Creek whenever the plant is operating. Temperatures of the surface and bottom waters in that area of the bay on various days of 1973 are shown in Figs. 8 a - 8 h , which indicate the magnitude and extent of the plumes. It is clear that the heated effluent dissi- pates rapidly. Nearly all of the effects are restricted to a 1.6 km radius around the Oyster Creek Canal. Because of the shallowness of the bay, surface tempera-
Figure 5. Distribution and density of quahogs in Barnegat Bay. (After Campbell 1965.)
tures in the affected area do not di~ significantly from those along the bott0
Besides being affected by the heat effluent, water temperatures in the are most strongly influenced by ls meteorological conditions. Water re: peratures tend to be related directly air temperatures, because of the shall0 ness of the bay. This is evident in Tat 4 which compares water temperatur recorded at a number of central bay l calities to monthly air temperatures Tuckerton, New Jersey.
M a t e r i a l s a n d M e t h o d s
To evaluate the magnitude and extc of the effects of the thermal addition~ mercenaria populations in Barne~ Bay, samples were collected at regul intervals along two separate traverses roughly east-west and north-south dire tions from the mouth of Oyster Cret (Fig. 9). To evaluate populations r. affected by the effluent, two samplit localities were established to provide control group of specimens. One located along the extreme northern rnz gin of Stouts Creek (station 23) appr0~ mately 750 m west of buoy C and 5.5k northeast of the mouth of Oyster Cre~ whereas the second was located adjace: to Gul f Point (station 31) about 7.5 k south of the mouth of Oyster Creek. ]
addi t ion to the traverses and eontr groups, samples were collected at number of randomly selected stations~ the mouth of Oyster Creek.
Although all age groups were sat pied, only clams younger than four yea: of age were analyzed because micr, growth patterns in older varieties wet obliterated by crossed-lamellar she structure and extremely small incr, merits of growth. From about 250 m~

Figure 6. Flow characterist ics at Forked River, Oyster Creek, and adjacent bay localities.
\
f - J P o w e
I / / Dam . , . Dilution ---
* . . . . . Forked R i v e t
.~ ,, ~" O y s t e r CreeY" ~ Flow
0 1
km
Flow
Table 3 Ranges of Temperature Recorded at Three Central Bay Localities During 1970
Location Temperature (see Fig. 1) range (~
Light 1, Stouts Creek Light 2, Forked River Light 3, Oyster Creek
3.49- 28.2 1.58 - 27.5 1.10-31.0
After Busch, 1971.
F i g u r e 7. Comparison of surface and bottom temperatures at the mouths of Oyster Creek (station 1) and Stouts Creek (station 23). Data for 1973.
%- "0
o
E qJ I---
35
30
25
2 0 -
15
10
5
I M
Z' // !
/ i i / I / /
d
t A
I M
/
~- " \ \ ~
\ \
surface e - - - - - e Station 1 bottom
e------e, Station 1 surface
e ~ Station 23 bottom
e - - - - ~ Station 23
I I J
Year 1973
I S
\
I O
47

Figure 8a. Surface temperatures at the mouth of Oyster Creek and adjacent areas, March 24, 1973. Temperatures in degrees centigrade and contoured in one-half degree intervals.
Figure 8r Surface temperatures at the mouth of Oyster Creek and adjacent areas, June 8, 1973. Temperatures in degrees centigrade and contoured in one-half degree intervals.
Figure 8b. Bottom temperatures at the mouth of Oyster Creek and adjacent areas, March 24, 1973. Temperatures in degrees centigrade and contoured in one-half degree intervals.
Figure 8d. Bottom temperatures at the mouth of Oyster Creek and adjacent areas, June 8, 1973. Temperatures in degrees centigrade and contoured in one-half degree intervals.
48
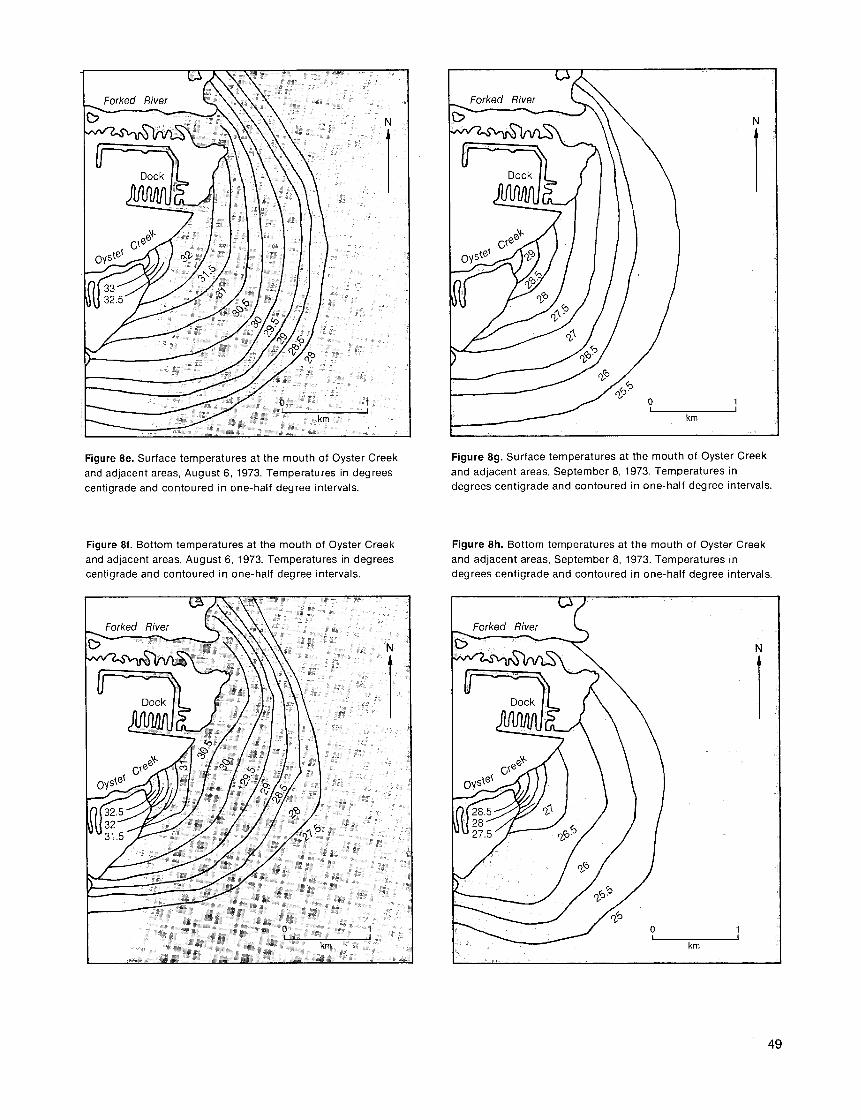
Figure 8e. Surface temperatures at the mouth of Oyster Creek and adjacent areas, August 6, 1973. Temperatures in degrees centigrade and contoured in one-half degree intervals.
km
N
Figure 8g. Surface temperatures at the mouth of Oyster Creek and adjacent areas, September 8, 1973. Temperatures in degrees centigrade and contoured in one-half degree intervals.
Figure 8f. Bottom temperatures at the mouth of Oyster Creek and adjacent areas, August 6, 1973. Temperatures in degrees centigrade and contoured in one-half degree intervals.
Figure 8h. Bottom temperatures at the mouth of Oyster Creek and adjacent areas, September 8, 1973. Temperatures in degrees centigrade and contoured in one-half degree intervals.
km
N
49

0 Michael J. Kennish and Richard K. Oisson
Tab le 4 Water Tempera tu res Recorded at Buoys in Barnega t Bay, C o m p a r e d to M o n t h l y A i r T e m p e r a t u r e s at Tucker ton , New Jersey
Temperatures in ~
Water temperature Monthly air temperature
Location Date (see Fig. 9) Surface Bottom Average maximum Average minimum Avera!
3/24/73 Buoy F 4.7 4.2 12.5 3.1 7.7 4/23/73 Buoy F 17.0 16.0 16.2 5.6 10.9 5/31/73 Buoy D1 19.1 18.6 19.7 9.6 14.6
Buoy F 18.9 18.2 6/8/73 Buoy C 24.0 23,0 26.5 17.8 22.2
Buoy C1 23.8 22.8 Buoy D 23.5 23.3 Buoy D1 25.0 24.8 Buoy F 23.4 23.0
6/27/73 Buoy D 23.9 23.2 Buoy D1 23.6 23.4 Buoy F 24,5 23.8 Buoy G 24.0 23.5
8/6/73 Buoy D 25.5 25.2 29.4 19.2 24.3 Buoy F 26,2 25.7 Buoy G 26.8 25.8
9/8/73 Buoy D1 26.5 25.1 26.8 14.9 20.8 Buoy F 26.2 25.0 Buoy G 26.5 25.0
9/29/73 Buoy D1 20,0 19.5 Buoy F 19.8 19.3 Buoy G 20.1 19.6
Monthly air temperature data from the climatological data, U. S. Department of Commerce National Oceanic and Atmospheric Administration Environmental Data Service, New Jersey: volume 78, 1973.
cenaria collected, over 125 valves were sectioned along the axis of maximum growth as defined by MacClintock (1967). Acetate peels of polished and acid-etched cross sections of these valves were made according to the method described by Rhoads and Pan- nella (1970). Microstructural growth patterns in each peel were analyzed un- der a phase contrast petrographic micro- scope.
The basic unit of growth studied was the daily growth increment. Growth rates in bivalves were determined by measuring absolute widths of growth increments in each specimen (by means of a graduated ocular in the phase con- trast petrographic microscope) from the ventral margin to the umbone. In addi- tion to growth rates, data were gathered
on periods of growth cessation. Each growth break was analyzed and correlat- ed with specific environmental and phy- siological events. Data were collected on three years of growth in each specimen (1971-1973) . Because the volume of data accumulated was large, much of it was pooled together by estimating grand means, standard deviations, and other statistical parameters, to condense it into a more understandable form.
Microstructural Growth Patterns in Mercenaria from Barnegat Bay
Cyclic growth patterns
Growth in mercenaria occurs by the addition of a daily increment of calcium carbonate to the outer edge of its shell,
the thickness of which is dependent on number of environmental and physiol0~ ical factors. Chief among these are te~ perature (which seems to be the majo controlling factor), tides, substratur type, water depth, and age of the organ ism. Growth occurs only when th valves of the animal are open and wate is freely pumped. This takes place a night. During the day conchiolin-ric surfaces are precipitated resulting in di ly increments of growth (MacClintoc and Pannella 1969). Besides dail: growth, mercenaria display subdail t bidaily, tidal, and annual microgrowl: patterns (Table 5).
The cyclical growth pattern that i most conspicuous in mercenaria fr0~ Barnegat Bay is an annual one. This pat tern results from seasonal variations i~

Thermal Discharge and Mercenaria 5 1
Figure 9. Sampling localities in Barnegat Bay, illustrating the trends of the traverses. The solid line trending north-south and connecting the seven buoys (labelled dots) represents the Intracoastal Waterway.
0 1 2 I I I krn
Stouts Creek
the thickness of individual growth incre- ments generated by seasonal tempera- ture changes. Because seasonal charac- teristics are similar from one year to the next, but not exactly alike, annual peri- odicities do not correspond precisely with the number of days in a calendar year. In general, there are 340 to 380 daily increments from one winter break to the next.
Daily summer growth increments in specimens from localities unaffected by the thermal effluent are 15 to 150/x thick (Figs. 16a, 16b, 1 6 c ) w h e r e a s those strongly affected by it are 5 to 100 thick (Figs. 16d, 16e). Daily win te r growth increments range from 1 to 50/z at all bay localities irrespective of the effluent (Figs�9 161, 16g). Growth incre- ments of the spring and fall range be- tween 10 and 75 /z.
Within an annual cycle or even within a single season of growth, daily growth increments are clustered into monthly (Fig. 17d) and fortnightly (Fig. 17c) units, suggesting lunar monthly and tidal periodicities. Although occasionally obvious, these patterns are not as well developed as those in intertidal clams from other New Jersey localities. This is mainly because all the clams we collect- ed from Barnegat Bay were restricted to a subtidal environment, and were less strongly influenced by tidal cyclicity.
Bidaily patterns (Fig. 17b), although present, are not common. They consist of one thick increment of growth fol- lowed by a thin one, both of which are of variable thickness. These patterns often are ~epeated for several days to several weeks at a time and only during the spring, summer, and fall. They charac- teristically appear and disappear abrupt- ly. Possibly a biological timing system
W
Oyst'
' 16 26
27 28
30
E1 17
29
G
�9 31
(clock) sporadically triggers the opening and closing of the animal 's valves on a bidaily basis. If this is the case, biologi- cal rhythms are responsible for the ob- served patterns (Thompson and Barn- well 1970).
Within daily summer growth incre- ments it is often possible to identify sub- daily layers. These layers appear as vague surfaces that subdivide a daily
39 ~
D1
18 19 20 21 22
%
S e d g e ~ Island
O Island ~. i Inlet
increment of growth into two (equal or unequal) parts (Fig. 17a). These patterns seem to persist for a greater length of time than bidaily patterns. Apparently, interruption of nightly shell secretion by an environmental event, such as a low tide, is of sufficient magnitude to cause subdaily patterns, whereas uninterrupt- ed growth results in undivided daily in- crements of growth.

2 Michael J. Kennish and Richard K. Olsson
T a b l e 5 M i c r o s t r u c t u r a l G r o w t h P a t t e r n s in Mercenaria rnercenaria f r o m B a r n e g a t Bay
Pattern Periodicity Description
Subdaily <1 day
Daily 1 day
Bidaily 2 days
Tidal 14 days
Lunar-month 28 days
Annual 340-380 day~
This pattern is observed as thin, weakly defined increments having imperceptible boundaries. It represents alternating periods of shell secretion and nondeposition within a 24-hour period.
Daily growth appears as a layer of calcium carbonate that is bounded by two distinct conchiolin surfaces.
A bidaily growth pattern consists of pairs of growth increments-one thick increment that is followed by a thin one. The cause of this pattern is unknown.
Tidal patterns appear as a cluster of five to eight thin daily increments that are followed by a cluster of five to eight thick daily increments. Alternating neap and spring tides generate this pattern.
Monthly patterns are groupings of pairs of tidal clusters with one tidal cluster commonly more conspicuous than the next. The synodic month periodicity produces this pattern.
The yearly cycle is composed of a long sequence of thin daily increments followed by a long sequence of thick daily increments. Seasonal temperature changes are responsible for this cyclical pattern with low winter temperatures yielding thin daily increments and high summer temperatures yielding thick daily increments.
Growth breaks
Another aspect of microstructural growth patterns monitored in mercenar ia from Barnegat Bay are characteristic breaks in shell growth caused by specific environmental and physiological events. Daily shell deposition is occasionally interrupted by freeze shocks, heat shocks, thermal shocks, spawning events, major storms, neap tides, and local disturbances (Table 6). Each kind of break can be identified by microstruc- tural analysis because each one is sur- rounded by a unique pattern of daily growth increments that reflects the envi- ronmental or physiological event pro- ducing it. The exact time of occurrence of the breaks, in turn, is determined by
dating the last increment prior to death and counting backwards on each incre- ment from ventral tip to umbone. In this sense each individual is used as a geo- chronometer.
Shock breaks are the most abundant type of growth break. This is particularly true for clams drawn from thermally affected waters. Growth breaks are dis- tinctly different in specimens from the mouth of Oyster Creek. More than 95 percent of the growth breaks identified in mercenar ia from station 1, for example, are shock breaks. These breaks are of three types depending on the mode of origin: (1) winter- (freeze-) shock breaks; (2) summer- (heat-) shock breaks; and (3) thermal-shock breaks. Winter- and summer-shock breaks are composed of
very thin indistinct increments prior I and following the break, a massive ir dentation of the outer prismatic shell la! er bordered by a dark periostracal ban,, marking the break itself, and transgres~ ing crossed-lamellar shell structure r~ placing prismatic shell structure througt out the duration of the stressed peri0 (Figs. 18a, 18b, 18c, 18e). Therma shock breaks can be distinguishc from freeze- or heat-shock breaks their sudden occurrence, their lack e growth deceleration prior to the brea and massive slow down in growth f0l lowing the break (Figs. 18d, 18f, 181 18h), Some thermal-shock breaks ar structurally similar to freeze- and heal shock breaks. In these cases there is~ V-shaped depression in the prismati~ shell layer, a dark periostracal bar,~ marking the break site itself and trans gressing crossed-iamellar shell structur~ (Figs. 18g, 18h). Still other thermal shock breaks occur in a series (Fig. 18d with each break correlating to a period e sharp temperature change.
The abundance of crossed-lamella shell structure along shock breaks is in dicative of an extremely severe stres~ The animal responds to hostile environ mental conditions by extending crossed lamellar structure to its outer prismali~ layer to strengthen its shell. There seern~ to be a causal relationship between th~ type of stress on the clam and the kind 0 shell structure reflected in the outer pri~ matic layer.
All shock breaks in mercenar ia fro~ Barnegat Bay represent a response Ic periods of temperature stress. This ca: be shown by correlating the time of th~ year during which each break occurs t~ the temperatures existing in the bay that time. Winter- (freeze-) shock breaks for example, tend to occur betweer November and March of each year Between November 15 and Decembe 25, 1972, 11 out of 15 clams from stati0r 1 (73 percent of the sample), 9 out of I" clams from station 23 (53 percent of the sample), and 1 out of 5 clams from sta tion 31 (20 percent of the sample) expe rienced freeze-shock breaks. The re mainder of the clams had freeze-shocl

Thermal Discharge and Mercenaria 5 3
breaks between January and March, when water temperatures dropped to their lowest point. In some clams the breaks occurred more than once per win- ter suggesting that when low winter tem- peratures reoccur growth cessation can also reoccur.
Summer- (heat-) shock breaks (Table 7) emerge when temperatures reach maximum levels which are well above the optimum level of physiological func- tion in the bivalve (optimum temperature for mercenaria growth is approximately 20 ~ C). Because ambient temperatures in Barnegat Bay between June and Septem- ber are between 23 ~ and 28~ (in July and Ausust they are consistently above 25~ and those at the mouth of Oyster Creek are 3 ~ to 5~ higher during the same period, it seems likely that high temperatures cause these growth breaks. Several other lines of evidence support this conclusion. First, summer- (heat-) shock breaks are structurally similar in every detail to winter- (freeze-) shock breaks (Figs. 18a, 18b, 18c, lSe)indicat- ing that the same environmental factor may be responsible for both patterns. Second, shock breaks (excluding ther- mal shocks) occur in the summer and winter when temperatures in the bay are at extreme levels, which implies that a causal relationship exists between tem- perature extremes and the temporary cessation of growth.
Thermal-shock breaks are found only in populations directly affected by the thermal effluent. These breaks correlate well with periods of temperature fluctua- tions caused by temporary shutdowns, massive load reductions, and rapid re- newal of operations following shutdowns or load reduction periods at the nuclear power station. Table 8 records the abrupt changes in plant operations for the interval between June, 1972, and June, Z973, and compares them to ther- mal shocks monitored by mercenaria at station 1.
That temperature fluctuations asso- ciated with rapid changes in the outfall waters are substantial enough to cause these growth breaks is indicated by tem- perature data collected at station 1 be-
T a b l e 6 G r o w t h B r e a k s in Mercenaria mercenaria f r o m B a r n e g a t B a y
Type of break Description
Freeze-shock break
Heat-shock break
Thermal-shock break
Spawn break
Storm break
Neap-tide break
This break is characterized by a deep v-shaped indentation in the outer prismatic shell layer, and the development of a dark periostracal band that extends from the outer margin of the prismatic layer to the inner homogeneous layer. Daily growth increments gradually decrease in thickness as the break is approached and gradually increase in thickness going away from it. Crossed-lamellar shell structure replaces prismatic shell structure on one or both sides of the break. The gradual decrease of increment thickness approaching the break reflects the gradual decrease in water temperature associated with the onset of winter. The break itself often marks the first freeze of winter, and the gradual increase of increment thickness fol lowing the break indicates the slow recovery from the freeze shock.
A heat-shock break is structurally similar to a freeze-shock break, but is characteristically developed during the summer months. It apparently occurs when the organism is shocked by excessively high water temperatures.
A thermal-shock break appears as a sudden break in the normal pattern of growth increment addition. There is usually no slow down of growth prior to the break, massive slow down fol lowing the break, and transgressing crossed-lamellar shell structure throughout the stressed period. This break correlates well with rapid f luctuations in water temperatures associated with sharp changes in operations at the Oyster Creek Nuclear Generating Station.
In this break the normal pattern of daily growth increment addit ion is abruptly interrupted by a break in growth and immediately fol lowed by a sequence of thin, indistinct increments. The sudden occurrence of the break corresponds to the tr iggering of the spawning event when the proper temperature is attained. The thin increments associated with the break reflect the period during which the clam stops feeding. Transgressing crossed-lamellar shell structure is generally absent.
A storm break appears as a break in the normal deposi- t ional pattern of shell growth which is abruptly fol lowed by recovery. The thickness of growth increments prior to and fol lowing the break is not significantly altered. Crossed-lamellar shell structure is generally lacking.
This break in growth is preceeded by a rapid decrease in the thickness of growth increments and fol lowed by a rapid increase in the thickness of the growth increments. Such a break coincides with neap tides. Crossed-lamellar shell structure is usually absent.

4 Michael J. Kennish and Richard K. Olsson
Tab le 7 S u m m e r (Heat) Shock Breaks in Mercenar ia mercena r i a f rom Three Bay Loca l i t ies
Data for 1972-1973
Station location No. of (see Fig. 9) M. mercenaria
No. and percent of M. mercenaria with summer (heat) shock breaks
1972 1973
1" 15 9 (60%) 7 (47%) 23 17 7 (41%) 14 (82%) 31 5 2 (40%) 3 (60%)
*Location affected by thermal effluent.
tween May 3 1 and June 8, 1973, (Fig. 7) and the corresponding microstructural growth patterns reflected in the bivalves from that locality. The bottom tempera- ture on May 31 was 19.3~ (power plant nonoperational) wheras on Jt:ne 8, just nine days later, the temperature had ris- en to 28~ (power plant operational). (This represents a temperature increase of nearly 9~ within several d a y s - a temperature change that normally takes several months to attain at other bay
localities unaffected by the effluent.) This temperature change was recorded as thermal shock breaks in more than 46 percent of the individuals at station 1.
In addition to the level of temperature change, rnercenaria is also affected by the frequency of temperature change. On June 3, 16, and 30, 1973, for exam- ple, abrupt temperature fluctuations occurred, which correlated with 21 ther- mal-shock breaks recorded by 15 clams at station 1. Concurrent with these
breaks was a decrease in growth whict persisted for the entire summer (Fig. 12i
There also is evidence suggesting tha: the effluent may be adversely affectin~ other physiological functions in the bi valve. For example, spawning break~ were not observed in clams at station I in 1973, which is in sharp contrast t~ clams at the control sites. At stations 2i and 31, six out of 17 and one out of five specimens respectively, had spawnin! breaks. There are four possible reason~ for the lack of spawning breaks in indi. viduals at station 1. There may hav~ been an insufficient number of clams c01. lected and analyzed. Some of the mef.
cenar ia may have spawned, but the event was not recorded in the shell mi crostructure. Because the natural popu. lation of m e r c e n a r i a at station 1 is small. the level of natural spawning stimulation in the form of sexual products dis. charged into the water column may alse have been low, which could have resull. ed in little natural spawning. In this case certain individuals may have spawned but the chance of mass spawning takint place was low (Thorson 1946). The ef fects of the thermal addition may have
Tab le 8 Cor re la t i on Be tween T h e r m a l - S h o c k Breaks in Mercenar ia mercenar ia f rom Sta t ion 1 and Abrup t Changes in Opera t i ons at the Oyster Creek Nuc lear Genera t i ng Sta t ion
Date of change
Plant Renewal after Large load Renewal Number of Percent of shutdown shutdown reduction after large thermal-shock breaks population with
load reduction observed thermal-shock break~
4/15/73
12/29/72 6/3/73
1/10/73
11/10/72 11/11/72
8/9/72 8/14/72
5/2/72 6/20/72
6/30/73
12/3/73
6/16/73
12/4/73
7 47 3 13
10 40 11 47 8 33 7 33 7 33 0 0 6 27 0 0 0 0 4 27 4 27 3 20

Thermal Discharge and Mercenaria 5 5
altered the normal physiological function of the bivalve, thereby affecting spawn- ing events.
That the effluent could have affected natural spawning events in mercenaria at station I is shown by the temperature changes in 1973 at the mouth of Oyster Creek. Spawning in mercenaria that were unaffected by the effluent took place in June and early July when tem- peratures were rising slowly between 21 ~ and 25~ However , this span of temper- atures was trangressed at station 1 with- in a matter of hours aRer the power plant renewed operations on June 3. The bi- valves probably never adjusted to the abrupt temperature increase, were ther- mally shocked, and in this condition could not have spawned. Subsequent shocks later in the month, likewise ad- versely affected the normal physiology of the bivalves and eliminated any possi- bility of adjustment to water tempera- tures. This prevented later spawning episodes. Thus, the chance overlap of thermal shocks with normal periods of spawning possibly can preclude spawn- ing events.
Most evident in mercenaria speci- mens taken from the mouth of Oyster Creek is the large number of growth breaks, owing to the abundance of ther- mal-shock breaks recorded in those specimens.
Thermal-shock breaks in mercenaria
specimens gives an indication of the areal extent of the effects of the effluent. The number of thermal-shock breaks per clam, in turn, yields information on the magnitude of these effects. Of the total expanse of the bay only a small region is affected by the effluent. Only nine of the 31 stations (stations 1,4, 7, 9, 10, 12, 13, 15, and 25 in Fig. 9) sampled had mer- cenaria with thermal shocks, and they were all within a 1.6 km radius of the outlet canal of Oyster Creek. All nine stations were subjected to the outfall waters.
The effect of the thermal effluent is most acute on populations living closest to the outlet canal. For example, the number of thermal-shock breaks per clam is much higher at stations 1 and 4
"6 $ Q_
E
"5
2 c 63 l
7 4 9 10 12
Station location
(distance from Oyster Creek increases)
13 25 15
Figure 18 (above). Mean number of thermal-shock breaks per clam for populations of clams from various localities at the mouth of Oyster Creek.
Figure 11 (below). Percentage of thermal-shock breaks (as a percentage of the total number of growth breaks) per population of clams from locations at the mouth of Oyster Creek.
100-
~, 80- .s
s
60-
~ 40-
0 o $ 20-
13.-
~i �84 'i. :
1 7 4 9 10 12 13 25 15
Station location
(distance from Oyster Creek increases)
6 Michael J. Kennish and Richard K. Olsson
%- r
o O
EL
c - 2 ~ O r
C
E
8 r
O
~
40
30
20
10
\
X
\
b'
J~ t J
z J \).
~ - - - ~ Station 31
Station 23
~ - - - -~ Station 1 (affected)
I I I I I I I I I I I I I I t I I I I I I I I I I I I I I I I M A M J J A S O N D J F M A M J J A S O N D J F M A M J J A S
1971 1972 1973
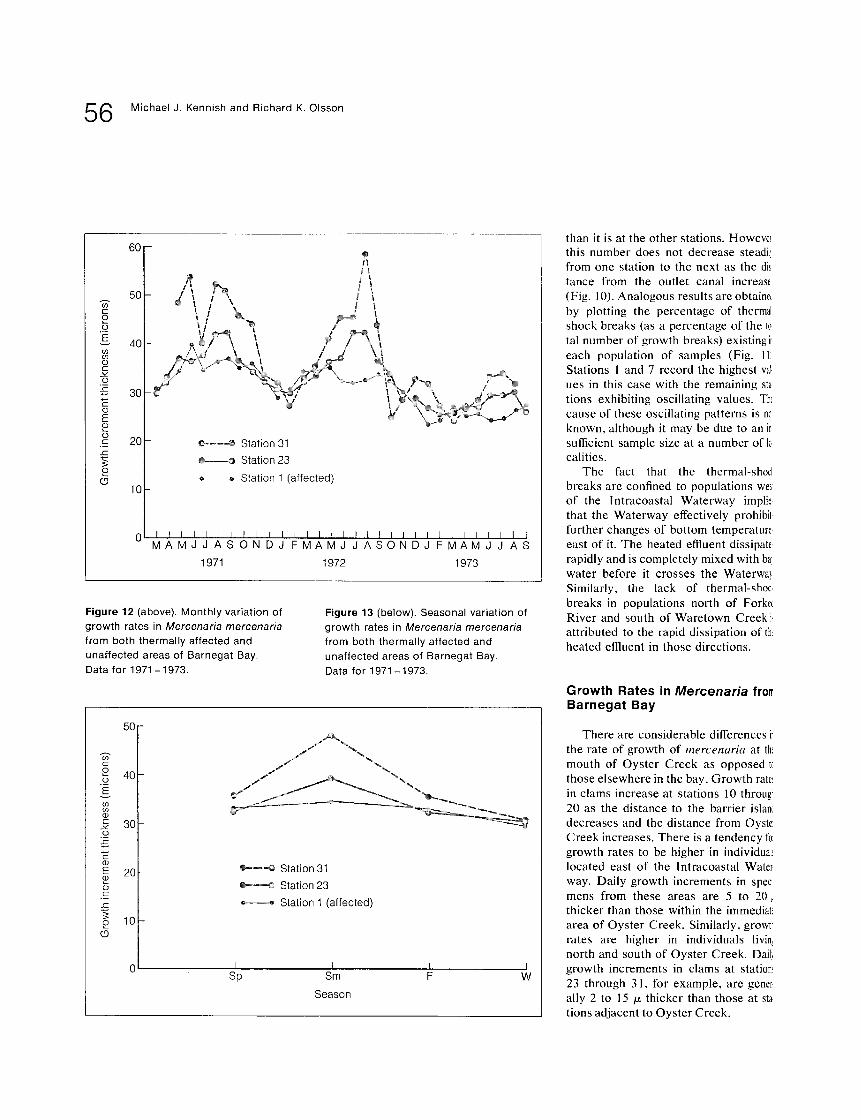
Figure 12 (above). Monthly variation of growth rates in Mercenaria mercenaria from both thermally affected and unaffected areas of Barnegat Bay. Data for 1971-1973.
F i g u r e 1 3 ( b e l o w ) . Seasonal variation of growth rates in Mercenaria mercenaria from both thermally affected and unaffected areas of Barnegat Bay. Data for 1971-1973.
50
O b 40 g
3O o
o3
E 2O o c
4q o 10
~.-m-e Station 31
e - - - - r Station 23
Station 1 (affected)
P Sp
L Sm
Season
I W
than it is at the other stations. However this number does not decrease steadil! from one station to the next as the dis tance from the outlet canal increase (Fig. 10). Analogous results are obtaine~ by plotting the percentage of thermal shock breaks (as a percentage of the to tal number of growth breaks) existing ir each populat ion of samples (Fig. lli Stations 1 and 7 record the highest val. ues in this case with the remaining sta t ions exhibiting oscillating values. Th: cause of these oscillating patterns is nc known, although it may be due to an in sufficient sample size at a number of 1~ calities.
The fact that the thermal-shod breaks are confined to populations wes of the lntracoastal Waterway implie. that the Waterway effectively prohibit. further changes of bottom temperature, east of it. The heated effluent dissipate rapidly and is completely mixed with ba' water before it crosses the Waterwa! Similarly, the lack of thermal-shod breaks in populat ions north of Forke~ River and south of Ware town Creek i at tr ibuted to the rapid dissipation of th~ heated effluent in those directions.
G r o w t h R a t e s i n Mercenaria f r o ~ B a r n e g a t B a y
There are considerable differences ir the rate of growth of mercenaria at th~ mouth of Oys te r Creek as opposed t~ those elsewhere in the bay. Growth rate~ in clams increase at stations 10 througt 20 as the distance to the barrier islan~ decreases and the distance from Oyste: Creek increases. There is a tendency to: growth rates to be higher in individua/~ located east of the lntracoastal Water way. Dai ly growth inc rements in speci mens from these areas are 5 to 20~ thicker than those within the immediat~ area of Oyster Creek. Similarly, growtt rates are higher in individuals livin~ north and south of Oyster Creek. Dail! growth increments in clams at stati0n~ 23 through 31, for example, are gener ally 2 to 15 /~ thicker than those at sta t ions adjacent to Oyster Creek.

Thermal Discharge and Mercenaria 5 7
The variation of growth rates in mer- cenaria subjected to the thermal effluent compared to those which are not is shown in Fig. 12, which shows growth rates for populations of samples from stations 1, 23, and 31 during 1971 to 1973.
Clams at these three sites vary partic- ularly in relation to (1) thickness of mean daily growth increments and (2) seasonal growth rates. Growth is considerably 1" less in mercenaria at station 1 than in those at stations 23 and 31. At station 1, for example, the thickness of the mean daily growth increment per month in mercenaria never exceeded 39/x during 23 the three years of recorded growth. Yet, the thickness of the mean daily growth increment per, month in mercenaria at station 23 surpassed 41 microns during 31 both 1971 and 1972, and at station 31 exceeded 50 /z twice during the same time period.
Seasonal growth rates for the popula- tion of samples from these three stations are shown in Fig. 13. Seasonal growth rates in mercenaria at station 1 are rath- er uniform, but low, during the entire year with summer growth only slightly greater than winter growth, and approxi- mately the same as spring and fall growth. Growth rates in individuals from the control sites, however, are clearly greater during the summer than during other seasons of the year. Growth rates tend to be sharply lower in the winter 1" with intermediate rates occurring in the spring and fall. Spring and fall growth tends to be of about the same magnitude. The effects of seasonality, therefore, are 23 most pronounced in mercenaria away from the thermal effluent.
In comparing seasonal growth rates of clams at the mouth of Oyster Creek to 31 those from the control sites, a number of facts become evident. Growth in the clams at station 1 is 8 percent, 16 per- cent, and 11 percent less during the summers of 1971, 1972, and 1973, respectively, than in the clams at station 23, and 25 percent, 31 percent, and 23 percent less during the summers of 1971, 1972, and 1973, respectively, than in the clams at station 31 (Table 9).
T a b l e 9 T h i c k n e s s of t h e M e a n Da i l y G r o w t h I n c r e m e n t p e r S e a s o n of
Mercenar ia mercenar ia f r o m B o t h T h e r m a l l y A f f e c t e d a n d U n a f f e c t e d A r e a s of B a r n e g a t Bay
Bracketed values are the standard deviations, unbracketed values are the means. Mean values are in microns.
Station location Number of (see Fig. 9) M. mercenaria
Mean and standard deviation values
Season 1971 1972 1973
15 Spring 32 (1.7) 34 (0.5) 25 (1.0) Summer 36 (2.1) 32 (0.9) 25 (1.6) Fall 35 (0.8) 30 (1.7) - Winter -- 29 (1.8) 25 (2.3)
17 Spring 33 (3.4) 33 (1.9) 26 (1.2) Summer 39 (3.5) 38 (3.1) 28 (1.6) Fall 34 (0.7) 30 (3.4) - Winter - 30 (1.2) 26 (1.7)
5 Spring - 35 (4.1) 26 (2.1) Summer 48 (6.2) 47 (6.7) 32 (1.1) Fall 44 (1.0) 26 (2.8) -- Winter - 30 (3.2) 30 (2.9)
*Location affected by thermal effluent.
T a b l e 10 M e a n T h i c k n e s s o f t h e 20 L a r g e s t S u m m e r G r o w t h
I n c r e m e n t s o f Mercenar ia mercenar ia f r o m B o t h T h e r m a l l y
A f f e c t e d a n d U n a f f e c t e d A r e a s o f B a r n e g a t Bay
Station location (see Fig. 9)
Mean thickness of the 20 largest summer
Number of growth increments M. mercenaria Year (in microns) Standard deviation
15
17
1971 65 1972 58 1973 41
1971 71 1972 68 1973 49
1971 81 1972 85 1973 49
9.3 12.1 8.5
13.9 10.7 11.4
7.7 11.3 15.3
*Location affected by thermal effluent.
That summer growth is slower for mercenaria at station 1 is also supported by data on the mean thickness of the 20 largest growth increments per summer (Table 10). The thickness of the mean
growth increments in the clams at station 1 is 9 percent, 15 percent, and 15 per- cent less during the summers of 1971, 1972, and 1973, respectively, than in the clams at station 23, and 21 percent, 32

8 Michael J. Kennish and Richard K. Olsson
o r
o
100
90
80
70
60
50
40
30
20
10
0
/ f
Station 31 /
Station 23 / / Station 1 [ /
I I ~ I -1 0 1 2 3 4 5 6 7 8
Phi size
percent, and 16 percent less during the summers of 1971, 1972, and 1973, re- spectively, than in the clams at station 31.
Although growth rates at these three localities vary greatly in the summer, they tend to be similar during other sea- sons of the year. Table 9 indicates that daily growth usually ranges between 25 and 35 /x during the spring and fall, growth being only slightly greater at sta- tion 31 than at the other stations. Growth rates are most constant at all bay localities in the winter when daily
b5
U
A
I 1 2 3 4 5
Age (years)
increments are added at a rate of about 20 to 30/z.
Growth rates in individuals at other bay localities depend on their proximity to the Oyster Creek Canal. Clams away from the canal have growth rates compa- rable to those of the control sites. Only a few populations, which are directly af- fected by the effluent, within a 1.6 km radius of the canal outlet have individu- als with growth rates about the same as those at station 1.
Fac to rs affect ing growth ra tes of mercenaria at the mouth of Oyster Creek
A number of factors could be contri- buting to the unusual growth rates of mercenaria at the mouth of Oyster Creek. Chief among these are the effects
Figure 15. Schematic and simplified growth curves for Mercenaria mercenaria
from Barnegat Bay. U = M. mercenar ia
from areas unaffected by the thermal effluent; A = M. mercenaria from areas affected by the thermal effluent.
Figure 14. Cumulative curves of sediment samples collected at stations 1, 23, and 31.
of: (1) temperature, (2) food supply,(3| substrate type, and (4) age of the bi~" valves.
Temperature. It is suggested th~ temperature is the primary environmer} tal factor regulating growth in mercenar. ia at the mouth of Oyster Creek. The main effect of the increased temperature of the outfall waters is to suppress sum- mer growth.
Growth rates in mercenaria from Barnegat Bay increase with increasing temperature and peak between 20 ~ and 25~ However , the growth rate does not increase indefinitely with increasing temperature. There is some temperature above which the growth rate is curtailed. Apparently, this temperature threshold is surpassed at the mouth of Oyster Creek during the summer, when temper. atures rise 3 ~ to 5~ above the ambient level. Fig. 7 shows that bottom temper- atures at the mouth of Oyster Creek exceeded 30~ during July and Augus~ 1973, and reached a maximum of 32~ on August 6. Ansell (1968) noted that growth in mercenaria ceases above 31% and H. H. Haskin I indicated that tht! bivalve's growth becomes hindered i above 26~ This implies that temper~! tures at the mouth of Oyster Creek are i of sufficient magnitude to cause the iowl summer growth rates observed in met- cenaria living there.
Food supply. Phytoplankton availa- bility also may influence the growth rates of mercenaria at Oyster Creek. Mount- ford (1970) indicated that gross produc- tivity in Oyster Creek was significantly lower in 1969 (pre-operational phase of the power plant) than in 1970 (post-op- erational phase of the power plant) However , Loveland and others (1972) found that 1969 was a year of exception. ally high productivity throughout Barne- gat Bay which would account for the large difference. Loveland and others
1Personal communication, 1974.

Figure 16. Note: The direction of growth (from the umbone to the ventral margin) in each photo is from left to right. (a) Summer growth in a Mercenaria mercenaria specimen from station 23 showing large daily growth increments. (b) Summer growth in an individual from station 31. Note the conchiolin rich layers (thin, dark bands) separating large, undivided calcium carbonate layers (thick, light bands). (c) Summer growth in a specimen from an area in Barnegat Bay that is unaffected by thermal effluent from the Oyster Creek Nuclear Generating Station. (d, e) Summer growth in clams from station 1. Note the extremely thin daily growth increments as compared to those of (a), (b), and (c). (f, g) Typical winter growth in Mercenaria mercenaria from Barnegat Bay. Daily growth increments are much thinner during the winter than during the summer.
59

Figure 17. Note: The direction of growth (from the umbone to the ventral margin) in each photo is from left to right. (a) Typical subdaily growth pattern in Mercenaria mercenaria from Barnegat Bay. Note the indistinct layers (arrows) which have subdivided the daily growth increments. (b) Bidaily growth pattern in an individual from an area that is unaffected by thermal effluent. Note the alternating thin and thick growth increments (arrows). (c) Fortnightly tidal cycle with a neap tide break (downward pointing arrow). Note the thin daily growth increments which correspond to neap tides (horizontal arrows) as compared to the thick daily growth increments which correspond to spring tides (increments between the horizontal arrows). (d) Monthly cyclical growth pattern showing the clustering of tidal cycles. The rhythmic pattern is reflected on the outer shell as an undulating pattern (arrows). (e) Spawning break (downward pointing arrow) in a specimen which has been unaffected by the thermal effluent. Note the slight decrease in the thickness of daily growth increments just prior to and following the break (horizontal arrows). (f) Storm break (downward pointing arrow) in a clam from Barnegat Bay. Note the sudden occurence of the break with no slow down in growth prior to or following the break. Note also the silt grains at the base of the break which were trapped between the shell and the organism's mantle during the storm and subsequently incorporated into the shell.
60

Thermal Discharge and Mercenaria 61
also discovered that Oyster Creek has not been consistently the locality of low- est primary productivity in the bay since the plant became operational in 1969. For example, Waretown had the lowest average productivity in 1969, buoy G in 1970, Oyster Creek in 1971, and Stouts Creek in 1972. It seems that Oyster Creek has not been exceptionally dif- ferent over the past four years, in terms of gross productivity, than other locali- ties unaffected by the effluent.
These facts, and the fact that peak productivity of phytoplankton occurs in the summer, do not explain the lower summer growth rates of mercenar ia lo- cated at the mouth of Oyster Creek. The higher summer productivity does corre- late well with the higher summer-growth rates observed in bivalves unaffected by the effluent. It seems likely that the food supply is not the major cause of the low summer-growth rates observed in mer- cenaria from effluent-affected areas.
Subs t ra te type. Growth in mercenar - ia of Barnegat Bay is dependent, in part at least, on the substratum. Clams living in muddy substrates grow slower than those living in sands. Clams at station 31 which live in fine sands with 10 percent mud grow much faster than those living in sandy muds at station 1 with 75 per- cent mud and station 23 with 65 percent mud. Cumulative curves of the sediment size distribution of samples from each locality are shown in Fig. 14. Sediment at station 31 is coarser grained and better sorted than sediment at the other two localities. Station 1 contains the highest percentage of mud and has the most poorly sorted sediment of any area sampled in the bay. This suggests that a negative relationship exists between growth in mercenar ia and the concentra- tion of mud in the substrate.
Summer growth may be limited by substrate composition when other fac- tors such as temperature and food avail- ability are optimal. Thus, clams at sta- tion 31 are able to grow more rapidly in the summer than those at stations 1 and 23, because the low percentage of mud and the high temperatures in the summer allow the organisms there to feed more
efficiently on the large biomass ofphyto- plankton. In the colder months of the year, however, when food availability is lower and the ability of the animal to consume it is also less, mercenar ia throughout the bay grow at low, but uniform rates regardless of the type of substrate. In the winter, therefore, growth may not be limited by substrate type.
Alternately, growth may be slower in clams on muds than o n sands, because there is more food available to the organ- isms where sands are abundant. In this respect, the type of substrate reflects the circulation patterns which bring food to the bivalves. The bivalves, being suspen- sion feeders, depend on a continual sup- ply of phytoplankton (mainly diatoms) that fall through the water column. Above sandy substrates the water circu- lation is good and large amounts of food reach the bivalves, whereas above mud- dy substrates, where the water circula- tion is poor, the opposite is true.
If either of the above hypotheses is correct, it leaves unexplained why sum- mer growth rates are so low in mercenar -
ia sampled at certain localities around Oyster Creek. Stations 4, 7, 9, 10, and I I, for example, have substrates with rather low mud content (compared to stations 1 and 23), but clams at these localities have growth rates similar to those at station 1, indicating that another environmental factor other than sub- strate is retarding growth at Oyster Creek. Because stations 4, 7, 9, 10, and 11 are strongly subjected to the outfall waters, it is suggested that the thermal effluent rather than the substrate is the major factor controlling growth rates in rnercenaria at these areas.
A g e o f the bivalves . The single factor that most strongly controls the growth rate in mercenar ia is age. Clams in Bar- negat Bay grow fastest in their second year of growth and slowest in their first and last years. Initial and gerontic growth are analogous to each other. The approximate average growth increment during these stages is 10 to 15 /z. The gerontic stage is generally reached by the fifth summer of growth. As the
youthful stage gives way to the adult stage, growth slows sharply from about the second summer onward (Fig. 15).
Summary and Conclusions
M e r c e n a r i a mercenar ia (Linnaeus) is an excellent monitor of environmental conditions in coastal marine waters. Dai- ly events are recorded within the shell of this species due to its characteristic pat- tern of shell growth. The organism adds a daily layer of calcium carbonate to the outer margin of its shell, the thickness of which is strongly influenced by environ- mental parameters such as temperature, tides, type of substrate, food supply, and water depth. At times of environmental or biological stress associated with tem- perature extremes and fluctuations, ma- jor storms, neap tides, and spawning events the daily growth pattern is inter- rupted. Such interruptions are recorded as disturbance bands or growth breaks in the shell.
Because water temperature appears to be the most critical factor regulating shell growth patterns in mercenar ia , the effects of thermal effluent from the Oys- ter Creek Nuclear Generating Station at Barnegat Bay, New Jersey on natural populations of the bivalve in the bay were investigated. Bottom temperatures recorded within a 1.6 km radius of the mouth of Oyster Creek (along a well developed thermal plume) show that water temperatures are increased 0 ~ to 5~ above ambient levels whenever the plant is operating.
This temperature increase has had an effect on mercenar ia living within the limits of the thermally stressed area. This is shown by the marked difference in the microgrowth patterns of mercen- aria sampled within the thermal plume and outside the plume. Analysis of growth increments on the valves of three- and four-year-old individuals yields the following conclusions:
I. Subdaily, daily, bidaily, tidal (fortnightly), monthly, and an- nual periodicity growth patterns are reflected in mercenar ia from Barnegat Bay.

62

Thermal Discharge and Mercenaria 63
2. ~ t l m m e r growth rates in l t l C t ' C d l l -
aria from areas subjected to the thermal effluent are lower than those from areas unaffected by it.
3. (it+owth rates in mcrcenar ia unaf- fected by the effluent are greatest in the sumnler when tempera ture and food supply are peaking, while the opposi te is true in the winter.
4. Growth rates are higher in mer- uenaria living in sands than in those living in muds.
5. Growth rates depend strongly on age. Mercenar ia in Barnegat Bay grow most rapidly during the second year. Growth decreases rapidly with age into the gerontic stage.
6. Periods of growth cessat ion in me#uenaria in the bay corre- spond to summer (heat) shocks, winter (freeze) shocks, thermal
Figure 18 (opposite). Note: The direct ion of growth (from the umbone to the ventral margin) in each photo is from left to right. The scale for each photo is equivalent to the scale shown in photo (a). (a, b, c) Typical f reeze-shock breaks (downward pointing arrows) in Mercenaria mercenaria
from Barnegat Bay showing deep v-shaped indentat ions in the outer prismatic shell layer. Note the thin daily growth increments pr ior to and fo l lowing the breaks, and the well developed transgressing crossed- lamel lar shell structure (horizontal arrows). (d) A sequence of three thermal -shock breaks (downward point ing arrows) in a clam from station 1. Note the three bands of transgressing crossed- lamel lar shell structure (horizontal arrows). The breaks correspond to the abrupt temperature changes at stat ion 1 that occurred in November, 1972, when the Oyster Creek Nuclear Power Station f luctuated operations suddenly. (e) Summer (heat) shock break (downward point ing arrow). Note the decrease in growth pr ior to and following the break and the transgressing crossed-lamellar shell structure (horizontal
shocks, m~tior storms, spawning periods, neap tides, and local dis- tu rbances o f u n k n o w n or ig in .
7. More than g0 percent of all growth breaks are shock breaks related to periods of tempera l u r e s t r e s s .
g. Thermal -shock breaks are con spicuously dcvclopcd in, and rc stricted to, merue#zaria subjected to the thermal elfhient, l h e s e breaks accounl for the hit+ger number of growth breaks ob- served in the ind iv idua ls at t i le mouth of Oys te r ( r e e k as com- pared to specirnens at ethel- bay Ioculities.
9. Periods of shutdowns, massive load reductions, and rapid renew- al of operat ions (following shill- downs and load reductions) at the O y s t e r ( ' r eek N u c l e a r ( i ene ra t - ing Station correlate exactly wi th
arrows). This pattern is very similar to those in (a), (b), and (c). (f) Thermal-shock break (downward point ing arrow) in a specimen from station 1, Note the sudden occurrence of the break and the large reduct ion of growth subsequent to the break (horizontal arrow). The break correlates exact ly with rapid temperature changes at stat ion 1 in June. 1973. The temperature changes were caused by abrupt changes in operat ions at the nuclear power station. (g) Two thermal -shock breaks (downward point ing arrows) in a clam affected by the thermal effluent. The breaks correspond to abrupt changes in operat ions at the nuclear power plant on December 29, 1972 and January 10, 1973. Note the slow recovery from the thermal shocks (horizontal arrow). (h) Typical thermal-shock break in an individual from stat ion 1 (downward point ing arrow). Note its sudden occurrence, the transgressing crossed- lamel lar shell structure and the slow recovery of growth after the break (horizontal arrow). Compare this break to the breaks in (a), (b), (c), and (e).
theNnal shock breaks recorded in IIICI'C'CI}glI'I~I frol l l the nlOtlth o f ( )ys ter ( r e e k .
tO. ,'~pawnhlg in t l l d l 'Cd lb : l l i d in J{:.tr- llOgttl l~ay o c c t l r s in , ] l l l le l i nd Citl--
ly July when water tenlperatut+es are rising t'rtl111 2 l <' to 25'+( ".
11. Spav,.ning breaks are absent (for 1971 and 1973) f rom the nficro- structure of the populat ion of clams most sttongly affected by the thermal elttuent (station I).
12. ( ; rowth breaks occur most fre- quently in old mur(cHaria.
l h e s e conclusions indic: t le that growth in muruunaria is strongly depen- dent on environmental lactors, the most important of which is temperature. In atcas of Barnegat Bay unaflected by the efllllCllt ##ldrccHaria behaves like an ani- nlal in its norlherrl range, grovr faster during the Stlmnler wllen tempera tures are high and s lower in lhe winter when tempera tures are low. Periods of growth cessation occur most frequenlly during periods of l e n l p e r L l l t l r c S l l eSs . t : o r e x
ample , in thc wintct+ growlh is gcncru l l y hahed dur ing the fitst f reez ing per iod and may bc s t lbseqt lcn l ly d iscon t inued when len lpera l t i r cs d rop It) OXll+C111cly low levels, tXroezo-shock breaks reocct l r n losl e l ten m .JlillUill-y, J.Cbl-illn-y. {i l ld March. Ninlilar types of growth breaks, he,il shock bre',iks, occur in the summer when temperatures rise wen above the optimunl temperature l\)r growth in the species. Maximunl ambient bay temper- attires range from 25' It) 2g<'( ".
Quahogs affected by the thermal elt]ueni are adversely aflcctcd not only by temper,Hure ext remes , but also by t empera tu re l] t lCtt l : i t ions. The I l lahl el L feel produced by high tenlperutilre levels is to subdue stimnlcr growth. Exposure of thc bivalves to sharp temperature changes, meanwhile , results in telnpc,- rary cessation of growth due to physio- logical shocks. Also, when thermal shocks overlap with natural spawning periods of the anhnal, spawning may be prechided. For these reasons it is sug- gesled that scheduled shtl tdowns of the nuclear power station be made in the fall rather than in the spring to el iminate the

4 Michael J. Kennish and Richard K. Olsson
chance over lap of these events . More - over , wheneve r possible, shutdowns and renewals of plant operat ions should be made in stages over at least a span of one week to enable the organisms to accli- mate to the tempera ture changes.
G r o w t h patterns in m e r c e n a r i a from thermally affected areas may be influ- enced by factors o ther than temperature . Mos t significant among these are the type of substrate and the food supply. Al though these factors do not seem to be as important as the tempera ture in regu- lating microstructural growth patterns, more research is needed to determine the magnitude and extent of their effects.
An additional problem that must be dealt with in future research is the effect of the effluent on mortal i ty in m e r c e n a r i a
populat ions in the bay. Da ta col lec ted on the season of death and the age at the t ime of death on death assemblages should de termine whether mortal i ty in populat ions around the mouth of Oys te r Creek is a census type related to the effluent or that mortal i ty is normal and totally unrelated to it.
There are several ways that these problems can be studied. One is to study microstructural pat terns of death assem- blages of natural populat ions in the area. Ano the r way is to invest igate micro- structural pat terns and mortal i ty rates of t ransplanted specimens, some of which would be suspended in baskets above the substrate and others t ransplanted to the substrate. In this manner mortal i ty in the bivalves can be correla ted specifical- ly to the daily effects of the thermal effluent.
ACKNOWLEDGMENTS
Sincere thanks are ex tended to James E. Cunliffe of the T e x a c o Oil Company at Tulsa, Oklahoma, Harold H. Haskin , and Rober t E. Love land of the Depar t - ment of Zoo logy at Rutgers Univers i ty for their laboratory and field suggestions, and Raymond C. Murray o f the Depar t - ment of Geo logy at Rutgers Univers i ty for his r ecommenda t ions and for the use o f his photographic equipment . Norbe r t
P. Psuty of the Marine Science Cen te r of Rutgers Univers i ty and Harold H. Has- kin are also thanked for the use of their field equipment .
Financial support for this project in the form of research grants from the Penrose Bequest of the Geologica l Soci- ety of Amer ica , the Socie ty of Sigma X1, and the Je r sey Central Power & Light C o m p a n y is gratefully acknowledged.
REFERENCES
Ansell, A. D., 1968, The rate of growth of the hard clam Mercenaria rnercenaria (L) throughout the geographical range: Jour- nal Du Conseil. Conseil International Pour L'Exploration De La Mer., v. 31, p. 364-409.
Barker, R. M., 1964, Microstnlctural varia- tion in pelecypod shells: Malacologia, v. 2, p. 69-86.
Bureau of Sports Fisheries and Wildlife, U.S. Department of the Interior, 1963, Dis- tribution of shellfish resources, Atlantic Coast of New Jersey Manasquan Inlet to Little Egg Harbor.
Busch, D. A., 1971, Tube building, growth and sediment relationships in populations of Peetblaria Gouldii from Barnegat Bay: Rutgers Univ., unpub. M. S. thesis, 74 p.
Campbell, R., 1965, Effect of the effluent from an atomic power plant on the adja- cent portion of Barnegat Bay, New Jer- sey: Special interim rept. to the U. S. Dept. Health, Education and Welfare, Public Health Service, Bur. State Ser- vices, 9 p.
Carpenter, J. H., 1963, Concentration distri- bution for material discharged into Barne- gat Bay: Pritchard-Carpenter, Consul- tants, and The John Hopkins University, Baltimore 18, Maryland, unpub., rept. 13p.
Clark, G. R., 1968, Mollusk shell: daily growth lines: Science, v. 161, p. 800- 802.
- - 1 9 7 4 , Periodic growth and biological rhythms in experimentally grown bivalves, in Rosenberg, G. D., and S. K. Runcorn, eds., Biological clocks and changes in rate of the earth's rotation: New York, John Wiley, Inc., (in press).
Cunliffe, J. E., 1974, Description, interpre- tation, and preservation of growth incre- ment patterns in shells of Cenozoic bi- valves: Rutgers Univ., unpub. Ph.D. dis- sert. 171 p.
Farrow, G. E., 1971, Periodicity structures in the bivalve shell: experiments to estab-
lish growth controls in Ceras todermu edu- la from the Thames Estuary: Paleontolo- gy, v. 14, p. 571-588.
- - 1 9 7 2 , Periodicity structures in the bi- valve shell: analysis of stunting in Cerasto- derma edula from the Berry Inlet (South Wales): Paleontology, v. 15, p. 61-72.
Farrow, G. E., and M. R. House, 1968, Daily growth banding in the shell of the cockle Cardium edule: Nature, v. 219, p. 1384- 1386.
Loveland, R. E., and others, 1972, The qual- itative and quantitative analysis of the benthic flora and fauna c~f Barnegat Bay before and after the onset of thermal addi- tion: eighth progress rept., Rutgers Univ., unpub, research rept., 81 p.
MacClintock, C., 1967, Shell structure of pate[Ioid and bellerophontoid gastropods (Mollusca): Yale Univ., Peabody Mus. Nat. Hist., Bull. 22, 140 p.
MacClintock, C., and G. Pannella, 1969, Time of calcification in the bivalve mol- lusk Mercenaria mercenaria during the 24 hour period (abs.): Geol. Soc. America, Ann. Mtg. Program, v. 1, p. 140.
Mountford, K., 1970, The seasonal plankton cycle in Barnegat Bay, New Jersey: Rut- gers Univ., unpub. M. S. thesis, 66 p.
Pannella, G., and C. MacClintock, 1968, Biological and environmental rhythms reflected in molluscan shell growth: Pa- leontological Soc., Mere. 2, p. 64-80.
Phillips, F. X., 1972, The ecology of the benthic macroinvertebrates of Barnegat Bay, New Jersey: Rutgers Univ., unpub. Ph. D. dissert. 156 p.
Rhoads, D. C., and G. Pannella, 1970, The use of molluscan shell growth patterns in ecology and paleoecology: Lethaia, v. 3, p. 143- 161.
Thompson, I. L., and F. H. Barnwell, 1970. Biological clock control and shell growth in the bivalve Mercenaria mercenari~ (abs.): Geol. Soc. America, Ann. Mtg. Program, v. 2, p. 704.
Thorson, G., 1946, Reproduction and larval development of Danish marine bottom invertebrates, with special reference to the planktonic larvae of the Sound (Oresund): Medd. Komm. Danmarks Fisk. Havun- ders., Ser Planktgn, v. 4, p. 1-523.