Influence of host genetic origin and geographic location on QPX disease in Northern quahogs (= hard...
11
INFLUENCE OF HOST GENETIC ORIGIN AND GEOGRAPHIC LOCATION ON QPX DISEASE IN NORTHERN QUAHOGS (=HARD CLAMS), MERCENARIA MERCENARIA LISA M. RAGONE CALVO, 1 * SUSAN E. FORD, 2 JOHN N. KRAEUTER, 2 DALE F. LEAVITT, 3 ROXANNA SMOLOWITZ 4 AND EUGENE M. BURRESON 1 1 Virginia Institute of Marine Science, College of William and Mary, P.O. Box 1346, Rt. 1208, Gloucester Point, VA 23062; 2 Haskin Shellfish Research Laboratory, Rutgers University, Port Norris, NJ 08349; 3 Roger Williams University, Bristol, RI 02809; 4 Marine Biological Laboratory, Woods Hole, MA 02543 ABSTRACT QPX (Quahog Parasite Unknown) a protistan pathogen of northern quahogs (=hard clams), Mercenaria mercenaria, has caused disease outbreaks in maritime Canada, and in Massachusetts, New York, New Jersey, and Virginia, USA. Although epizootics have occurred in wild hard clam populations, the parasite has most seriously affected cultured hard clams, suggesting that aquaculture practices may promote or predispose clams to the disease. In this investigation the influence of clam genetic origin and the geographic location at where they are grown on QPX disease susceptibility was examined in a common garden experiment. Aquaculture stocks were acquired from hatcheries in Massachusetts, New Jersey, Virginia, South Carolina, and Florida and spawned at a single hatchery in Virginia. All stocks were originally, although not exclusively, derived from wild hard clam populations from each state. The seed clams were deployed at two sites, New Jersey and Virginia, and evaluated during the subsequent 2.5 y for growth, survival, and QPX disease. At both sites, South Carolina- and Florida-derived clam stocks exhibited significantly higher QPX prevalence and lower survival than New Jersey and Massachusetts clam stocks. Levels in the Virginia stock were intermediate. In Virginia, mortality at the termination of the experiment was 78%, 52%, 36%, 33%, and 20% in the Florida, South Carolina, Virginia, Massachusetts, and New Jersey hard clam stocks, respectively. Mortality was significantly correlated with QPX prevalence. Maximum QPX prevalence in the South Carolina and Florida stocks ranged from 19% to 21% and 27% to 29%, respectively, whereas in the Virginia, New Jersey, and Massachusetts stocks prevalence was 10% or less. Similar trends were observed in New Jersey where mortality at the termination of the experiment was estimated to be 53%, 40%, 20%, 6%, and 4% in the Florida, South Carolina, Virginia, Massachusetts, and New Jersey clam stocks, respectively. QPX prevalence peaked at 18% in the Florida stock, 38% in the South Carolina, 18% in the Virginia, and 5% in the New Jersey and Massachusetts stocks. These results suggest that host genotype is an important determinant in susceptibility to QPX disease. As such, hard clam culturist should consider the genetic origin of clam seed stocks an important component of their QPX disease avoidance/management strategies. KEY WORDS: QPX, quahog hard clam, Mercenaria, parasite, disease, genetics, environment, aquaculture INTRODUCTION Wild and cultured northern quahogs (=hard clams), Mer- cenaria mercenaria represent an important natural resource in coastal and estuarine lagoons along the east coast of the United States. Wild stocks have long supported commercial and recreational fisheries in these areas; however, in some regions harvests have been declining over the last two decades. In contrast, aquaculture production of hard clams has increased in the last 25+ years. Clams are being cultured along the eastern seaboard of the United States from Maine to Florida. Unlike other bivalve aquaculture species, hard clam seed cannot be found naturally in quantities suitable for commercial applications, and hard clam aquaculture is solely dependent on hatchery-produced seed. Commercial hatcheries have devel- oped from Maine to Florida. These hatcheries supply hundreds of farms with seed and a significant amount of seed is trans- ferred between states. Because of industry’s dependence on hatchery production of juvenile clams, and because clam seed is often in short supply, growers often plant whatever seed is available or costs the least when they are ready to plant. The genetic composition of clam seed can vary significantly from region to region (Menzel 1989) and genetic data and anecdotal evidence suggests that growth and survival traits are heritable (Hilbish 2001). Commercial hatcheries and research institutions have used selective breeding strategies to enhance hard clam growth and survival performance; however, rigorous genetic studies have been limited and there is great potential for marked enhancement of economically important performance charac- teristics through further domestication. Historically disease has not been a problem for the industry, but in the early1990s QPX emerged as a locally serious disease problem and has caused significant losses of cultured hard clams in Massachusetts (Smolowitz et al. 1998), New Jersey (Ford et al. 2002) and Virginia (Ragone Calvo et al. 1998); and of wild clams in Massachusetts and New York (Smolowitz unpublished, Dove et al. 2004). The epizootiology of QPX is poorly understood. Based on morphological and molecular analyses, QPX is a protist that has been tentatively classified as a member of the Thraustochytriidae family within the phylum Labyrinthulomycota (Whyte et al. 1994, Maas et al. 1999, Ragan et al. 2000, Stokes et al. 2002). Thraustochytrids are widely distributed in marine and estuarine environments and typically are associated with detrital sediments, benthic algae, and marine plants. Several organisms within the phylum can cause disease (Polglase 1980, McLean & Porter 1982, Bower 1987). It seems that QPX, like other thraustochytrids, is widely distributed in areas from Canada to at least as far south as Virginia. QPX may be an opportunistic parasite, which may cause marked morbidity and mortality in clams that are *Corresponding author. E-mail: [email protected] Current address: Haskin Shellfish Research Laboratory, Rutgers University, Port Norris, NJ 08349 Journal of Shellfish Research, Vol. 26, No. 1, 109–119, 2007. 109
-
Upload
independent -
Category
Documents
-
view
2 -
download
0
Transcript of Influence of host genetic origin and geographic location on QPX disease in Northern quahogs (= hard...

INFLUENCE OF HOST GENETIC ORIGIN AND GEOGRAPHIC LOCATION ON
QPX DISEASE IN NORTHERN QUAHOGS (=HARD CLAMS),
MERCENARIA MERCENARIA
LISA M. RAGONE CALVO,1* SUSAN E. FORD,2 JOHN N. KRAEUTER,2 DALE F. LEAVITT,3
ROXANNA SMOLOWITZ4AND EUGENE M. BURRESON
1
1Virginia Institute of Marine Science, College ofWilliam andMary, P.O. Box 1346, Rt. 1208, GloucesterPoint, VA 23062; 2Haskin Shellfish Research Laboratory, Rutgers University, Port Norris, NJ 08349;3Roger Williams University, Bristol, RI 02809; 4Marine Biological Laboratory, Woods Hole, MA 02543
ABSTRACT QPX (Quahog Parasite Unknown) a protistan pathogen of northern quahogs (=hard clams), Mercenaria
mercenaria, has caused disease outbreaks in maritime Canada, and in Massachusetts, New York, New Jersey, and Virginia,
USA.Although epizootics have occurred inwild hard clampopulations, the parasite hasmost seriously affected culturedhard clams,
suggesting that aquaculture practices may promote or predispose clams to the disease. In this investigation the influence of clam
genetic origin and the geographic location at where they are grown onQPX disease susceptibility was examined in a common garden
experiment. Aquaculture stocks were acquired fromhatcheries inMassachusetts, New Jersey, Virginia, South Carolina, and Florida
and spawned at a single hatchery in Virginia. All stocks were originally, although not exclusively, derived from wild hard clam
populations from each state. The seed clams were deployed at two sites, New Jersey and Virginia, and evaluated during the
subsequent 2.5 y for growth, survival, and QPX disease. At both sites, South Carolina- and Florida-derived clam stocks exhibited
significantly higher QPXprevalence and lower survival thanNew Jersey andMassachusetts clam stocks. Levels in the Virginia stock
were intermediate. In Virginia, mortality at the termination of the experiment was 78%, 52%, 36%, 33%, and 20% in the Florida,
South Carolina, Virginia,Massachusetts, and New Jersey hard clam stocks, respectively.Mortality was significantly correlated with
QPX prevalence. MaximumQPX prevalence in the South Carolina and Florida stocks ranged from 19% to 21% and 27% to 29%,
respectively, whereas in the Virginia, New Jersey, and Massachusetts stocks prevalence was 10% or less. Similar trends were
observed in New Jersey where mortality at the termination of the experiment was estimated to be 53%, 40%, 20%, 6%, and 4% in
the Florida, South Carolina, Virginia, Massachusetts, and New Jersey clam stocks, respectively. QPX prevalence peaked at 18% in
the Florida stock, 38% in the South Carolina, 18% in the Virginia, and 5% in the New Jersey and Massachusetts stocks. These
results suggest that host genotype is an important determinant in susceptibility to QPX disease. As such, hard clam culturist should
consider the genetic origin of clam seed stocks an important component of their QPX disease avoidance/management strategies.
KEY WORDS: QPX, quahog hard clam, Mercenaria, parasite, disease, genetics, environment, aquaculture
INTRODUCTION
Wild and cultured northern quahogs (=hard clams), Mer-
cenaria mercenaria represent an important natural resource incoastal and estuarine lagoons along the east coast of the UnitedStates. Wild stocks have long supported commercial and
recreational fisheries in these areas; however, in some regionsharvests have been declining over the last two decades. Incontrast, aquaculture production of hard clams has increased in
the last 25+ years. Clams are being cultured along the easternseaboard of the United States from Maine to Florida.
Unlike other bivalve aquaculture species, hard clam seedcannot be found naturally in quantities suitable for commercial
applications, and hard clam aquaculture is solely dependent onhatchery-produced seed. Commercial hatcheries have devel-oped fromMaine to Florida. These hatcheries supply hundreds
of farms with seed and a significant amount of seed is trans-ferred between states. Because of industry’s dependence onhatchery production of juvenile clams, and because clam seed is
often in short supply, growers often plant whatever seed isavailable or costs the least when they are ready to plant. Thegenetic composition of clam seed can vary significantly from
region to region (Menzel 1989) and genetic data and anecdotal
evidence suggests that growth and survival traits are heritable(Hilbish 2001). Commercial hatcheries and research institutionshave used selective breeding strategies to enhance hard clam
growth and survival performance; however, rigorous geneticstudies have been limited and there is great potential for markedenhancement of economically important performance charac-teristics through further domestication.
Historically disease has not been a problem for the industry,but in the early1990s QPX emerged as a locally serious diseaseproblem and has caused significant losses of cultured hard
clams in Massachusetts (Smolowitz et al. 1998), New Jersey(Ford et al. 2002) and Virginia (Ragone Calvo et al. 1998); andof wild clams in Massachusetts and New York (Smolowitz
unpublished, Dove et al. 2004). The epizootiology of QPX ispoorly understood. Based on morphological and molecularanalyses, QPX is a protist that has been tentatively classified as
a member of the Thraustochytriidae family within the phylumLabyrinthulomycota (Whyte et al. 1994,Maas et al. 1999, Raganet al. 2000, Stokes et al. 2002). Thraustochytrids are widelydistributed in marine and estuarine environments and typically
are associated with detrital sediments, benthic algae, and marineplants. Several organisms within the phylum can cause disease(Polglase 1980, McLean & Porter 1982, Bower 1987).
It seems that QPX, like other thraustochytrids, is widelydistributed in areas from Canada to at least as far south asVirginia. QPX may be an opportunistic parasite, which may
cause marked morbidity and mortality in clams that are
*Corresponding author. E-mail: [email protected]
Current address: Haskin Shellfish Research Laboratory, Rutgers
University, Port Norris, NJ 08349
Journal of Shellfish Research, Vol. 26, No. 1, 109–119, 2007.
109

disadvantaged. The parasite has not been found in hatcheryseed suggesting it is acquired after planting (Ford et al. 1997).
Little is known about interactions between QPX, the hardclam, and the environment. Severe outbreaks of the disease indense wild hard clam populations in Canada, New York, andNew Jersey point to host density as an important factor in QPX
epizootics. Ford et al. (2002) found that QPX prevalenceincreased with increased planting density in a field experiment;however, the trend was not statistically significant. The parasite
appears to be more prevalent in cultured clam plots than in wildclam populations suggesting that culture practices may increasethe susceptibility of clams to QPX. Increased density might play
an important role, but another aquaculture-associated factorthat seems to be important is seed source. Under present culturepractices aquacultured seed may originate from non-localstocks and sources. Anecdotal evidence from Massachusetts,
suggested that nonlocal clams imported from New Jerseysuffered greater losses to QPX than local stocks. In New Jersey,clams originating from South Carolina clam lineages exhibited
heavy QPX infections and suffered mortalities of 26% to 92%,whereas clams from local New Jersey stocks, planted in adjacentplots, exhibited few QPX infections and experienced little
mortality (Ford et al. 2002). Ford et al. (2002) suggest thatQPX causes disease and mortality in non-local clam stocks thatmay be disadvantaged in some way, perhaps by unfavorable
genotype-environment interactions.Selection of clam seed may be an achievable management
strategy for QPX disease avoidance. In developing such astrategy it is important to understand the interactions between
host genetics and QPX disease dynamics. This study examinedthe effects of genetic origin of source populations and thegeographic location in which they are grown on host suscepti-
bility and QPX pathogenicity.
METHODS
Nursery and Hatchery Production of Test Stocks
Five clam stocks, representing lines from 5 geographicorigins, Massachusetts (MA), New Jersey (NJ), Virginia(VA), South Carolina (SC), and Florida (FL), were produced
in spring 1999 at the Virginia Institute of Marine Science(VIMS). Brood stocks for the study strains were obtained fromcommercial and research hatcheries from the respective states.
All of the stocks had been selectively bred for fast growththrough at least several generations and were presently beingused by industry. All stocks were originally, although not
exclusively, derived from wild hard clam populations from eachstate. Clams were reared following standard hatchery tech-niques and clam seed was then grown in upwellers at VIMS in
Wachapreague, VA until planting in October 1999.
Initial Planting and Grow-out of Seed
In October 1999, clam seed was planted at QPX enzootic
areas in Virginia, New Jersey, andMassachusetts. However, wereport here only on the results from the Virginia andNew Jerseysites as significant weather related losses of clam seed occurredearly in the study at the Massachusetts location. The extent of
the loss was initially underestimated and subsequent samplenumbers were too low for rigorous statistical analyses. TheVirginia site was located in an intertidal area of Burton Bay
(37�35#, 75�37#) (Fig. 1). Salinity at the site ranged from 28–33ppt and the sediment was sandy. The New Jersey site waslocated in Tuckerton (39�32#, 74�20#) in a low intertidal area
with salinity ranging from 29–33 ppt and muddy sediments(Fig. 1). In each location, four replicate 5 ft 3 5 ft (1.52 m 3
1.52 m) plots of each strain were planted at a density of 50 clams
Figure 1. Maps showing the locations of the New Jersey and Virginia field sites. Maps derived using http://maps.google.com.
RAGONE CALVO ET AL.110

ft–2 (538 clams m–2) (1,250 clams per plot, 5,000 per strain,25,000 per location). These densities are similar to those used by
commercial operations, but are considerably higher than mostreported natural population densities (Fegley 2001). Replicateplots were distributed according to a randomized block design.Distance between plots was approximately 0.61 m. Clam seed
was evenly broadcast within the plots and 0.5$ (12.7 mm) meshnetting was secured on top of the plots to reduce predation. Theplots were examined biweekly to monthly and nets were cleaned
as required by collaborating industry members and or projectpersonnel. Prior to field deployment an initial sample of 60clams from each stock was examined for parasites and disease
using standard histological methods.
Replanting of the New Jersey Site
Severe winter conditions in early 2000 resulted in significant
losses of clam seed at the New Jersey site. In New Jerseyprotective nets were lost as a result of icing and predation byducks caused nearly a total loss of the stocks. This site was
replanted in June 2000 with seed from the original spawns of theMA, NJ, SC and FL stocks, which had overwintered in floats inWachapreague, VA. Unfortunately no seed was available fromthe originally spawned VA stock. As a substitute a second
Virginia seed stock was obtained from a local commercialhatchery (Middle Peninsula Aquaculture Corporation, North,VA). The substitute seed was produced in the summer of 1999
and held through the fall and winter in land-based upwellers atthe commercial hatchery site. The seed was produced fromsecond-generation brood stock clams that were originally
derived from a cross of moderate salinity North River, Virginiawild clams and a commercial hatchery stock containing selectedVirginia and Florida clams.
All plots were replanted as described above for the originalplanting regimen, receiving 1,250 clams per plot, except for theFlorida stock plots, which received only 716 clams per plotbecause of limited availability of seed. Samples taken from the
new plantings were examined in the samemanner as initial plants.
Sampling Strategy
Clam size, condition, survival, and QPX prevalence andintensity were assessed in April/May, August/September, and
November/December 2000; April/May, August and November2001; and April 2002. On each sample date clams were sampledfrom each replicate plot by random coring. Grids were overlaid
over plots and grid blocks were randomly selected for coring.Core size varied depending on sediment conditions at eachparticular site. In Virginia five 15.2-cm diameter cores were
sampled (total area 0.091 m2). In New Jersey, which hadmuddier sediments, it was necessary to use a smaller core andten 10.2-cm diameter cores were taken (total area 0.081m2). Thenumbers of live and dead (articulated valves, known as ‘‘boxes’’
and paired disarticulated valves) clams within each core wereenumerated for the determination of survival/mortality rates.Shell length, height, and width of 25 clams from each plot were
measured. Instantaneous (daily) growth rates were calculatedfor each sampling interval. Clam samples for disease diagnosis(n ¼ 15) and for the determination of condition index (n ¼ 10)
were collected from pooled core samples for each plot, yieldinga composite sample size of 60 for disease diagnosis and 40 forcondition index of each stock at each location.
On the final sample date, all plots were completely dug toremove all remaining live and dead clams. In New Jersey, plots
were dugmanually by rake and hand. In Virginia plots were dugusing a hydraulic dredge. All live and dead clams wereenumerated for calculation of final mortality estimates.
Disease Diagnosis
Gross and histological evaluations of clams sampled at each
sampling period from each plot were conducted in a standard-ized, systematic method. After samples were collected they wereimmediately transported to the respective laboratory, main-
tained at 4�C and usually processed within 18–96 h. Shell size(length, height, and width), total weight, external shell charac-teristics (such as localized or generalized checks in the shell,gaping, chips or any other external characteristic) were noted
for each animal. The clams were then shucked and examinedgrossly for any abnormal swellings or nodules in the mantles,which can signify the presence of QPX. Tissues were fixed in
Davidson’s AFA (alcohol, formalin, and acetic acid) solution(Shaw & Battle 1957).
Clams <25 mm in shell height were sectioned sagittally and
both sections were embedded, cut face down, for histologicalanalysis. For larger clams, three tissue pieces were embeddedand sectioned. The first piece was a transverse section
through the clam that included the digestive gland, gonad,gills, mantle and stomach, and foot (posterior dorsal toanterior-ventral). The second piece of tissue contained heart,kidney, and pericardial tissue. The third was a small section
of mantle dissected from the area adjacent to the siphonswhere QPX cells often lodge. Tissues were processed inparaffin in one or two blocks (depending on animal size and
noted lesions), sectioned at 6 mm and stained using standardmethods. The intensity of QPX was assessed for each of thefive tissue types within an individual section: mantle, gill,
dorsal tissues (heart, kidney, pericardium, and dorsal intes-tine), ventral tissues (ventral intestine, foot, ganglion, andsinus), and visceral mass. Intensity was scored based on theestimated number of live parasites: 1¼ 1–5, 2¼ 6–25, 3¼ 26–
50, and 4 ¼ >50 per tissue type. Infection intensity scores foreach of the five tissue locations were summed to yield a QPXintensity index. Histological and gross observations, along
with morphometric measurements, were tracked for eachindividual clam.
Condition Index
Condition index is commonly used to evaluate the overall
condition of the organism. The calculation of the conditionindex used in this study normalizes the dry soft tissue mass ofthe clam to the shell cavity volume.
Individual clams were labeled and weighed. Clams were
shucked and soft tissues were removed, weighed, and dehy-drated in a 60�C oven for 48 h, after which they were reweighed.Condition index (CI) was calculated by the formula
CI ¼ tissue dry weight=ðtotal weight� shell weightÞ ð1Þ
in which the shell cavity volume is equated to the weight of the
tissue and fluid contained therein, under the assumption thatthey have a specific gravity of approximately 1 (1 gm mL–1)(Lawrence & Scott 1982).
INFLUENCE OF HOST GENETICS AND LOCATION ON QPX 111

Water Parameters
Temperature data loggers (Onset Hobo, Bourne, MA) were
deployed at each site for the continuous monitoring of temper-ature on an hourly basis. Salinity was measured using hand heldrefractometers on all sample dates and periodically betweensample dates.
Statistical Analysis
The significance of the effects of clam stock and block onhard clam growth (length, height, width, whole weight), condi-tion, survival, and QPX prevalence and intensity index by date
was determined by a two-way analysis of variance (Zar 1984)using SAS statistical software (SAS Institute Inc, Cary, NC,USA). Mortality and prevalence values were arcsine trans-formed prior to analysis and all data were examined for
homogeneity of variance using Cochran test (Winer 1971).Main effects of stock and block (¼ plot) and the interactionof stock and block were tested for dependent variables (size,
condition, and QPX intensity index) that had within blocksubsampling using the type III mean square for the interactionof stock and block as an error term. Differences in mean
variables between stocks were further examined by Scheffemultiple comparison test. Prevalence and mortality data werearcsine transformed prior to analysis. Spearman Rank correla-
tion tests were conducted to examine the relationship of QPXprevalence and mortality. Differences were considered signifi-cant at a ¼ 0.05.
RESULTS
Temperature
In Virginia mean monthly temperatures during the studyperiod ranged from 2.9�C to 27.7�C (Fig. 2). In New Jerseytemperatures were generally 1�C to 3�C lower than at theVirginia site and mean monthly temperature during the study
ranged from 0.1�C to 25.3�C (Fig. 2).
Growth
Average shell length of seed clams at the time of planting atthe Virginia site in October 1999 ranged from 8.6–9.6 mm (Fig.3). Florida clams appeared larger, but they differed significantly
only from the Virginia stock, which had the smallest mean shelllength of the five stocks. The effect of stock on shell length wassignificant in spring, summer, and fall 2000 but not thereafter. Onthe final sample date inApril 2002, 2.5 y post planting,mean shell
lengths of the five stocks ranged from 48.3–52.0mm (Table 1 andFig. 3). Similar trends were observed for shell height and width,andwhole weight. On nearly all sample dates the effects of block,
and stock by block interactions, on the variables length, height,and width were significant indicating that the effect of stock onthese variables was to some degree dependent on location within
the block. Daily growth rates for each sampling interval did notdiffer significantly among the five clam stocks (Fig. 4).
In New Jersey average shell length of seed clams at the time
of replanting in June 2000 ranged from 9.3–15.9 mm (Fig. 3).Florida clams were significantly larger than all other stocks atplanting and the VA clams were significantly smaller than allother stocks, which were statistically similar in size. Over the
course of the study VA clams were consistently the smallest, and
SC and FL were consistently the largest (Fig. 3). On the final
sample date, April 2002, mean shell lengths of the five stocksranged from 39.4–46.5 mm (Table 2). Mean shell length of theFL and SC clams was significantly larger than that of the VA
clams and the SC clams were significantly larger than the MAclams. Similar trends were observed for mean shell height,width, and whole weight. As in Virginia, on nearly all sample
dates the effects of block and stock by block interactions on thevariables length, height, and width were significant, indicatingthat the effect of stock on these variables was to some degreedependent on placement within the blocks. Daily growth rates,
calculated for each sampling interval, did not significantly differamong the five clam stocks (Fig. 4).
Figure 3. Mean shell length (mm) of hard clams from the Virginia (top)
and New Jersey (bottom) grow-out sites from time of planting, fall 1999
for Virginia and spring 2000 for New Jersey, through the termination
of the experiment in spring 2002. Means are contrasted for the 5 clam
stocks tested:Massachusetts ( MA), New Jersey ( NJ), Virginia
( VA), South Carolina ( SC), and Florida ( FL). Error bars
represent standard deviation (n ¼ 3 for Virginia and n ¼ 4 for New
Jersey).
Figure 2. Daily temperature (�C) at the Virginia and New Jersey hard
clam grow-out sites from October 1999 through April 2002.
RAGONE CALVO ET AL.112

Condition
Little variability in condition index was observed among
clam stocks at either site (Fig. 5). Mean condition indices werehighest in summer and spring and lowest in the fall. Statisticallysignificant differences in condition index among stocks wereobserved on some dates, but a consistent trend among stocks
was not apparent. In general the NJ and MA clams had thehighest condition indices at both sites.
Mortality
Differences among strains with respect to survival werestriking, particularly in the second and third year of theinvestigation. In Virginia the first estimate of mortality wasmade inMay 2000, eight months after planting.Meanmortality
at this time ranged from 18% to 32% with no significantdifferences among stocks (Fig. 6). Estimated mortality changedlittle through October 2000 and ranged from 10% to 45% in
spring and summer 2001. The effect of stock on mortality wassignificant in spring 2001, but not in summer 2001. In the spring,mortality in the FL andMA clams was significantly higher than
that in the SC stock. In fall 2001 differences among stocks weregreater because mortality of FL clams increased from 45% inAugust to 60% in November. At this time, mortality in the FL
clams was significantly higher than that in the NJ and MAstocks, which respectively exhibited 28% and 16% mortality.At the termination of the experiment in April 2002, based ontotal counts of all live and dead clams remaining in the plots,
final mean cumulative mortality was determined to be 78% inFL, 52% in SC, 36% in VA, 33% inMA, and 20% in NJ clams
(Table 1). Mortality in the FL stock was significantly higherthan all other stocks.Mortality in the SC stock was significantlyhigher than in the NJ stock. Total harvest yield demonstrated
similar rankings of losses among stocks (Table 3).In New Jersey, the first estimate of mortality was made in
November 2000, five months after replanting. Meanmortality of
the five stocks at this time ranged from 14.9% to 40.1%, but nosignificant differences among stocks were found (Fig. 6). InMay2001 mean mortality was estimated to be 22.1% in the NJ clams,
23.5% in theMAclams, 40.6% in the VA clams, 42.9% in the SCclams, and 63.6% in the FL clams. Differences among stockswere not statistically significant. In November 2001 mortality
was significantly higher in VA, SC, and FL clams (51.3, 60.4, and77.4%, respectively) than inMAandNJ clams (26.4 and 24.7%).At the termination of the study, based on total live and deadcounts, mortality was estimated to be 52.7% in FL clams, 39.8%
in SC clams, 19.6% in VA clams, 4.3% in NJ clams, and 6.2% inMA clams (Table 2). Mortality in the FL stock was significantlyhigher than that of MA, NJ, and VA clams, but it did not
significantly differ from the SC stock. Mortality in the SC clamswas significantly higher than MA and NJ, but did not differsignificantly from VA, which did not differ significantly from the
two more northern stocks. As in Virginia, total harvest yielddemonstrated similar ranking of losses among stocks (Table 3).
QPX Prevalence
QPX prevalence is based on individuals having detectableinfections containing live QPX cells. Some additional individualshad infections containing moribund or dead QPX with no live
QPX cells apparent (Table 4). QPX was not detected in clams
TABLE 1.
Virginia site. Two-way ANOVA for effects of stock and block and multiple comparison (Scheffe’s test) for difference between stockmeans of variables measured on the final sample date. Means with like scripts do not significantly differ.
Variable Effect df MS F P Mean Stock
Shell length Stock 4 208.054 1.96 0.1704 52.03 SC a
Block 3 332.825 16.94 <0.0001 50.04 FL a
Stock 3 Block 12 106.128 5.40 <0.0001 49.36 NJ a
48.56 MA a
48.33 VA a
Condition index Stock 4 1.209 0.51 0.7272 6.45 MA a
Block 3 5.708 5.05 0.0022 6.23 SC a
Stock 3 Block 12 2.354 2.08 0.0239 6.22 FL a
6.09 NJ a
6.01 VA a
Mortality Stock 4 0.1871 29.57 <0.0001 77.98 FL a
Block 3 0.0182 2.87 0.0846 51.75 SC b
35.78 VA bc
32.70 MA bc
20.44 NJ c
QPX Prevalence Stock 4 0.0017 11.57 0.0006 28.9 FL a
Block 3 0.0031 2.05 0.1652 21.3 SC a
10.0 VA ab
1.7 NJ b
0 MA b
QPX intensity Stock 4 12.842 5.92 0.0086 1.33 FL a
Block 3 1.264 0.67 0.5721 0.50 SC a
Stock 3 Block 12 2.168 1.15 0.3250 0.23 VA ab
0.10 NJ b
0.00 MA b
INFLUENCE OF HOST GENETICS AND LOCATION ON QPX 113

sampled at the initiation of the experiment in October 1999, nor
in May 2000. In Virginia, clams began to exhibit detectableinfections in July 2000, less than one year after planting (Fig. 7).Mean prevalence was 11% in FL clams, significantly higherthan in the other four stocks (0% to 3%). No infections were
detected in clams sampled in fall 2000; however, in May 2001infections were observed in all clam stocks: 10% in SC, 9% inFL, 7% in NJ, 3% in VA, and 2% in MA. In August 2001 and
November 2001, prevalence remained low in MA, NJ, and VAclams (0–4%), but significantly increased in SC and FL to 19%to 20% and 27% to 29% respectively. On the final sample date
in spring 2002, QPX prevalence remained high in the SC and FLstocks (21% and 29% respectively) and prevalence in the VAclams increased to 10%. Prevalence in the SC and FL clams was
again significantly higher than in the NJ and MA clam stocks,but not from that in the VA clams (Table 1). QPX prevalencesignificantly correlated with mortality in summer and fall 2001and spring 2002 (Table 5).
QPX was first observed in clams planted at the New Jerseysite in May 2001, 11 mo after planting. Prevalence at this timewas 10% in FL, 8% in VA, 7% in SC, 2% inMA, and 0% inNJ
(Fig. 6). QPX was detected only in VA and FL stocks in August2001 at respectively 10% and 5% prevalence. In November2001 QPX prevalence was 18.3% in FL, 15% in SC and
significantly higher than the 0% in the three more northernstocks. On the final sample date in April 2002, QPX prevalencein MA and NJ clams (0 and 5%, respectively) was significantlylower than that in SC clams (38.3%). Prevalence in the FL
clams (11.7%) and the VA clams (18.3%) did not differ
significantly from the other three stocks. QPX prevalencesignificantly correlated with mortality in May, August and
November 2001, and April 2002 (Table 5).
QPX Infection Characterization
Infection intensity, like prevalence, showed no obviousseasonal pattern. Mean infection intensities were relativelylow until the August 2001 sample in Virginia when intensity
in the FL stock began to climb rapidly and that of the SC stockbegan a more gradual increase (Fig. 8). In Virginia, FL and SCclams generally exhibited the highest QPX intensities among
the five tested stocks. The effect of stock on QPX intensity wassignificant on the two final sample dates. In spring 2002,infection intensities in the FL and SC stocks were significantlyhigher than in the NJ, and MA, whereas the intensity in the VA
stock did not significantly differ from the more northern orsouthern stocks (Table 1). With the exception of the MA stock,which had only 4 individuals with detectable infections during
the entire study, the distribution of QPX within host tissues wasfairly consistent among stocks. The most frequently observedinfection location was mantle tissue; between 46% and 52% of
the infected individuals from the FL, SC, VA, and NJ exhibitedinfections that were restricted to the mantle. No mantle infec-tions were observed in the few infectedMA clams. Although less
common, in all stocks, infections were also observed in variouscombinations involving mantle, gill, visceral mass, dorsal, andventral tissues.
In New Jersey also, intensity generally remained <0.5; onlythe SC showed a pronounced intensity peak, but not until thefinal sample in April 2002 (Fig. 8). Clams from the FL, SC, andVA stocks generally exhibited similar QPX intensity, which was
higher than that in the MA and NJ stocks (Fig. 8). The effect ofstock on QPX infection intensity was significant only in spring2002 when intensities in the SC and VA stocks were significantly
higher than that in the NJ and MA clams, whereas intensity inthe FL stock did not differ significantly from the others. Infec-tions at the New Jersey location, as in Virginia, most commonlyoccurred in mantle tissue (48%).
In general, regardless of stock, lower-intensity infectionstended to be localized in mantle tissue, whereas more severeinfections were more likely to be multifocal and encompass
more than one tissue type. There did not appear to be a strongassociation between clam stock and the distribution of theparasite within host tissues at either grow-out location.
DISCUSSION
A common-garden experiment was conducted at two geo-graphically separate sites to examine the effect of host geneticorigin and geographic location of growout on QPX disease inhard clams. Progeny of five commercially popular and impor-
tant hard clam stocks from five states were hatchery reared at asingle location and transplanted to grow-out sites in Virginiaand New Jersey. The northern stocks, Massachusetts and New
Jersey, consistently had the lowest QPX levels and the bestsurvival.
The results of this investigation demonstrate clearly that
susceptibility of hard clams to QPX significantly varies withstock origin. The northern stocks consistently had the lowestQPX levels and the best survival. At the New Jersey and
Figure 4. Mean growth per day (mm) of hard clams from the Virginia
(top) and New Jersey (bottom) grow-out sites from time of planting, fall
1999 for Virginia and spring 2000 for New Jersey, through the termination
of the experiment in spring 2002. Means are contrasted for the 5
clam stocks tested: Massachusetts (n MA), New Jersey ( NJ), Virginia
( VA), South Carolina ( SC), and Florida (h FL). Error bars represent
standard deviation (n ¼ 3 for Virginia and n ¼ 4 for New Jersey).
RAGONE CALVO ET AL.114
Virginia sites, the South Carolina and Florida clam stocks
exhibited significantly higher QPX prevalences and lowersurvival than the New Jersey and Massachusetts stocks. Clamsfrom Virginia had QPX prevalence and survival rates that were
intermediate between the ‘‘northern’’ and ‘‘southern’’ stocks.Though it is premature to state that all Massachusetts or NewJersey clam stocks are more resistant to QPX than all southern
stocks, our results are supported by anecdotal and published(Ford et al. 2002) evidence suggesting that clams of southernorigin are more susceptible to QPX than local Virginia, NewJersey, or Massachusetts stocks. The most severe QPX disease
associated losses of commercially cultured clams in Virginiaoccurred in stocks originating from Florida (Ragone Calvo,unpublished). Reports of clam producers indicate that in New
Jersey andVirginia, QPX epizootics in cultured hard clams haveabated following the voluntary (New Jersey) and mandatory(Virginia) restrictions on importing clam seed produced from
South Carolina and Florida brood stocks. Likewise in Massa-chusetts, QPX-associated mortalities of cultured hard clamshave decreased because the practice of importing seed from out-of-area stocks has ceased (R. Smolowitz, unpublished). Never-
theless, in Massachusetts, significant losses still occur despitethe use of local clam seed, which proved to be highly resistant toQPX in our study. Other factors, aside from host genotype, such
as environmental conditions and parasite abundance, mayexplain the persistent epizootics in Massachusetts.
Variation in resistance to disease by geographically distinct
populations has been demonstrated for oysters (Haskin & Ford1979, Bushek & Allen 1996), but our study is the first to clearlydocument this for hard clams. The marked differences in QPX
susceptibility among stocks, suggests that there is a high degree
of genetic control of this trait. Several studies have indicatedthat growth and survival traits in hard clams are heritable(Hilbish 2001). Quantitative genetic analyses have demon-
strated a high degree of genetic variation in growth rates inwild and cultured hard clam populations (Hilbish 2001, Camaraet al. 2006). Clams having genes from southern population
appear to exhibit higher growth rates than those having genesfrom more northern populations. Additionally, there is someindication that the magnitude of genetic variation in these traitsdepends on the environment in which the hard clams are grown
(Rawson & Hilbish 1991, Camara et al. 2006). Consistently wefound considerably larger differences inmean size among stocksat the final sampling in New Jersey compared with Virginia (see
Tables 1 and 2). The significant stock x block interactions in ourstudy indicate that environmental differences over even veryshort distances can have a marked effect on clam growth. It
seems that particular stocks responded better to certain verylocal conditions (i.e., downstream vs. upstream, offshore vs.inshore, center vs. edge). Although we found no stock x blockinteractions with respect to QPX infections in our experimental
sites, genotype-environment interactions over longer distancesmay help explain variation in QPX susceptibility amongdifferent hard clam source populations. Additional common
garden experiments conducted in multiple environments usingmore than one stock from each region are required to furtherassess this hypothesis.
In comparing the overall performance among stocks withinand between sites it is important to keep inmind that at theNewJersey site the FL stock, because of limited availability, was
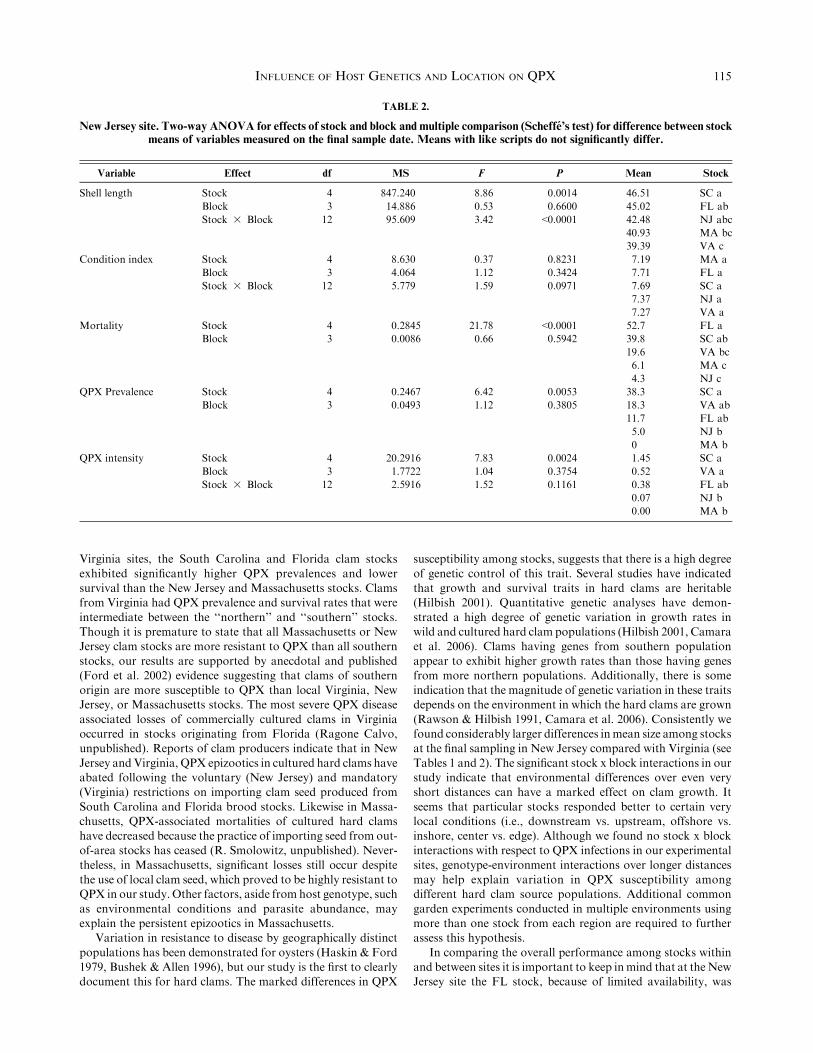
TABLE 2.
New Jersey site. Two-way ANOVA for effects of stock and block and multiple comparison (Scheffe’s test) for difference between stockmeans of variables measured on the final sample date. Means with like scripts do not significantly differ.
Variable Effect df MS F P Mean Stock
Shell length Stock 4 847.240 8.86 0.0014 46.51 SC a
Block 3 14.886 0.53 0.6600 45.02 FL ab
Stock 3 Block 12 95.609 3.42 <0.0001 42.48 NJ abc
40.93 MA bc
39.39 VA c
Condition index Stock 4 8.630 0.37 0.8231 7.19 MA a
Block 3 4.064 1.12 0.3424 7.71 FL a
Stock 3 Block 12 5.779 1.59 0.0971 7.69 SC a
7.37 NJ a
7.27 VA a
Mortality Stock 4 0.2845 21.78 <0.0001 52.7 FL a
Block 3 0.0086 0.66 0.5942 39.8 SC ab
19.6 VA bc
6.1 MA c
4.3 NJ c
QPX Prevalence Stock 4 0.2467 6.42 0.0053 38.3 SC a
Block 3 0.0493 1.12 0.3805 18.3 VA ab
11.7 FL ab
5.0 NJ b
0 MA b
QPX intensity Stock 4 20.2916 7.83 0.0024 1.45 SC a
Block 3 1.7722 1.04 0.3754 0.52 VA a
Stock 3 Block 12 2.5916 1.52 0.1161 0.38 FL ab
0.07 NJ b
0.00 MA b
INFLUENCE OF HOST GENETICS AND LOCATION ON QPX 115

planted at about half the density of the other four stocks. Onewould expect lower planting densities to result in higher growthrates as well as to impede parasite transmission resulting inlower infection rates. In contrast, the FL clams, which were not
only at low density, but larger at the time of planting, did notmaintain a proportionately higher mean shell length in compar-ison with the other four stocks, and at times had the highest QPX
and mortality at the site. We must also note that between-sitecomparisons of the Virginia source stocks should only be madewith the caveat that the VA stocks used in New Jersey and
Virginia were produced from different brood stocks and underdifferent conditions. Nevertheless, the relative performance ofthe VA and FL stocks at the New Jersey and Virginia sites wassimilar.
Initial mortality estimates were made in Virginia in May2000, eight months after planting and in New Jersey inNovember 2000, five months after replanting. At this time
mortality ranged from about 15% to 40%. This initial mortal-ity was not associated with QPX infections and was likelyrelated to planting stress or small predators, and in the case of
the Virginia planting, winter-associated stress. The early mor-tality is consistent with that typically observed in commercialclam culture operations. In Virginia, QPX prevalence maxima
were 10% in the FL and SC stocks, and <5% in the othersthrough spring 2001, but beginning that summer, both preva-lence and intensity began to rise in the FL and SC stocks.Thereafter, a significant and positive correlation existed
between QPX prevalence and mortality, suggesting an associ-
ation of the mortality with progressively developing QPXdisease. At theNew Jersey site, a significant correlation betweenQPX prevalence and mortality existed at all sample dates, even
though maximum prevalence never exceeded 10% throughsummer 2001. Given the low prevalence it seems unlikely thatthe 50% to 60% mortality observed in the FL and SC stocks at
this time can be explained by QPX alone. More likely thepositive correlation between mortality and QPXmay have beena sign of stress in the southern stocks that led to mortality
from factors other than QPX as well as in increased suscepti-bility to infection.
InVirginia,mortality significantly correlated withQPXprev-
alence on the final three sample dates, summer and fall 2001,and spring 2002. At this time QPX prevalence in the SC and FLstocks ranged between 20% and 30% and mortality wasestimated to be from about 30% to 78%. This is consistent with
other studies that have shown the occurrence of high mortalityat relatively low, 20% to 48%, QPX prevalence (Ragone Calvoet al. 1998; R. Smolowitz, unpublished); however, other studies
have reported high mortality associated with much higher, up to80%, QPX prevalence (Ford et al. 2002). Few studies havesampled QPX-infected populations frequently enough to ade-
quately characterize epizootics. To date it seems that the generalpattern of QPX epizootics varies from situation to situation. Insome instances, high mortality is associated with relativelyhigh prevalence, whereas in other instances, lethal QPX infec-
tions may develop at a constant, low rate over time resulting in
Figure 6. Mean percent mortality of hard clams from the Virginia (top)
and New Jersey (bottom) grow-out sites from time of planting, fall 1999
for Virginia and spring 2000 for New Jersey, through the termination
of the experiment in spring 2002. Means are contrasted for the 5 clam
stocks tested:Massachusetts ( MA), New Jersey ( NJ), Virginia
( VA), South Carolina ( SC), and Florida ( FL). Mortality
on the final sample date was based on collection clams from whole plots,
those on other dates were based on random core samples. Error bars
represent standard error (n ¼ 3 for Virginia and n ¼ 4 for New Jersey).
Figure 5. Mean condition index of hard clams from the Virginia (top) and
New Jersey (bottom) grow-out sites from summer 2000 for Virginia and
fall 2000 for New Jersey through the termination of the experiment in
spring 2002. Means are contrasted for the 5 clam stocks tested:
Massachusetts ( MA), New Jersey ( NJ), Virginia ( VA),
South Carolina ( SC), and Florida ( FL). Error bars represent
standard deviation (n ¼ 3 for Virginia and n ¼ 4 for New Jersey).
RAGONE CALVO ET AL.116

persistent, but low mortality rates. Thus, a large proportion of
the clam population is never detectably infected at any giventime, even though cumulative mortality can be high. In thepresent study, spring, summer, and fall sampling over a period of
nearly 3 y enabled an assessment of cumulative mortality duringthe entire ‘‘market’’ growing period but perhaps did not enabledetection of an instantaneous peak inmortality, whichmay havebeen evident with a more frequent, monthly sampling scheme.
Field estimation of hard clam mortalities is a challengingtask particularly over a period of 2–3 y or longer. QPX infectedhard clams tend to rise to the sediment surface and may be
washed to net edges and the fragile shells of very small seedclams that die early in the study may disintegrate by the end ofthe study and be lost from mortality counts. The apparent
decline in cumulative mortality between the fall 2001 and spring2002 samplings in New Jersey may be because of the disinte-gration of smaller valves during the winter months. Also, handraking and diggingmay less effectively recover small dead clams
relative to coring and sieving even though one would expectestimates based on the total plot to be more accurate than
estimates based on random core subsamples. Nevertheless, final
sampling mortalities fell into the same rank order as thoseobtained by core-sampling the previous fall (Fig. 6).
At both the New Jersey and Virginia sites the most severe
infections were observed in clams from the FL and SC stocks.Although we did not sample on a frequent basis, we found noevidence of seasonal pattern in QPX prevalence and intensityduring the 2.5 y of the study. Rather, the prevalence and
intensity pattern in the susceptible clams showed a generallyincreasing trend over time. High prevalence and intensity wasnot recorded until year two of the study, and the highest mean
intensity was observed on the final sample date in April 2002,supporting previous studies indicating that the disease typicallyaffects clams that have been in the field for approximately 12 or
more months (Ford et al. 1997).The reason for the association of higher QPX susceptibility
with clams of southern origin cannot be determined from thepresent study; however, two hypotheses can be proposed. The
first stems from the fact that QPXhas never been reported southof Virginia even though clam aquaculture is extensive along thesoutheasternUnited States coast. The apparent absence of QPX
in this region may be because of its intolerance of hightemperature. In culture, QPX cells grow best at 20�C to 23�Cand suffer 50% mortality at 29�C (Brothers et al. 2000; D.
Bugge & B. Allam, SUNY Stony Brook, personal communica-tion, June 2006). Consequently, southern stocksmay never havebeen exposed to selective mortality caused by the parasite. In
contrast, northern stocks are likely to have experienced selectivemortality, albeit for an unknown period, that may haveincreased resistance in the surviving populations.
A second hypothesis is that stocks of southern origin, which
may be genetically selected for life in a relatively warmenvironment, are poorly adapted to the colder temperaturesof the northern climes. Their ability to mount a defense against
invading parasites may be compromised as temperaturesdecline. Further, Thraustochytrids inhabit the mantle cavitiesof bivalves (Perkins 1973, Porter 1990), and QPX or QPX-like
organisms are present in the pallial fluid of hard clams, asdetermined by PCR (Lyons et al. 2005). If activity, includingfiltration rate, of southern clams grown in the north declinesfaster in the fall and increases more slowly in the spring
TABLE 4.
Percent of examined clams from each site and stock having only
live QPX cells, only dead QPX cells, and both live and dead QPX
cells (sample sizes ranged from 270–360).
Site & Clam
Stock
% Only
Live QPX
% Only
Dead QPX
% Live & Dead
QPX
Virginia
FL 11.5 0 5.2
MA 0.6 1.1 0.6
NJ 0.6 0.3 0.6
SC 3.6 0.6 3.6
VA 1.4 0.3 1.4
New Jersey
FL 4.7 5.8 2.8
MA 0 1.4 0.3
NJ 8.3 0.6 0.6
SC 7.7 0 1.9
VA 4.7 2.3 1.7
TABLE 3.
Final harvest statistics for clams grown in Virginia and New Jersey including: mean and standard deviation of percent mortality, thetotal number of live and dead clams removed from plots on the final sample date; mean and standard deviation of percent yield, total
number of live clams sampled during and at the end of the study divided by the initial number planted and multiplied by 100; and mean
and standard deviation of % recovery, the total number of live and dead clams sampled during and at the end of the study divided by theinitial number planted and multiplied by 100. All means based on n ¼ 4 except for Virginia FL which had n ¼ 3.
Site Stock % Mortality SD % Yield SD % Recovery SD
Virginia MA 32.7 7.98 43.2 16.55 61.1 20.6
NJ 20.4 4.52 49.4 14.23 61.1 18.4
VA 35.8 11.27 41.8 4.29 63.4 8.1
SC 51.7 10.04 32.4 5.08 57.6 9.6
FL 77.9 7.33 22.5 4.24 62.2 6.0
New Jersey MA 6.1 4.79 77.5 32.6 84.2 31.1
NJ 4.3 0.73 82.2 12.5 87.4 12.4
VA 19.6 11.68 28.2 19.6 40.0 18.7
SC 39.8 39.79 40.6 6.1 67.9 5.3
FL 52.7 14.14 33.7 6.9 67.6 6.7
INFLUENCE OF HOST GENETICS AND LOCATION ON QPX 117

compared with local stocks, the proliferation and/or accumu-lation of QPX in the mantle cavity may be favored. It may berelevant in this respect that no QPX infections were detected in
the fall 2000 samples, but were found at both sites and in moststocks in the spring of 2001 implying that the parasites hadproliferated to detectable levels at relatively low to moderatetemperatures and that this had happened to the greatest extent
in the southern stocks.It is not possible, from the available data, to differentiate
between these hypotheses. For instance, the apparent failure
of southern stocks to mount an adequate defense againstQPX could be because of lack of selection for resistance or to
an impaired response at low temperatures. The proposedmechanisms are not mutually exclusive and both may contrib-ute to the observed susceptibility differences.
Prior to the emergence of QPX, hard clam aquaculturistsoften purchased seed clams from southern hatcheries. Thesouthern seed was more readily available, less costly, availableearlier in the season allowing earlier planting and a longer
growing season, and/or offered faster growth rates than seedfrom more northern hatcheries. In the present study growthrates of the FL and SC clam stocks did not differ significantly
from the stocks having more northern origins and failed tosupport anecdotal evidence suggesting that southern clamstocks grow faster than northern clam stocks. However,
qualitatively, the southern clams appeared larger than thenorthern stocks throughout the study at both sites.
This study clearly demonstrates that the genetic origin of
clam stocks can have profound effects on hard clam suscepti-bility to QPX disease. As such, hard clam culturist shouldconsider the geographic origin of clam seed an importantcomponent of their QPX disease avoidance/management strat-
egies. In particular, southern stocks should not be used toproduce seed to be grown in the area where QPX isenzootic. Our results indicate that two stocks (Massachusetts
and New Jersey) had the best survival in both New Jerseyand Virginia. These could form the basis for a selective
Figure 7. Mean QPX prevalence (%) of hard clams from the Virginia
(top) and New Jersey (bottom) grow-out sites from time of planting,
fall 1999 for Virginia and spring 2000 for New Jersey, through the
termination of the experiment in spring 2002.Means are contrasted for the
5 clam stocks tested: Massachusetts ( MA), New Jersey ( NJ),
Virginia ( VA), South Carolina ( SC), and Florida ( FL).
Error bars represent standard error (n¼ 3 for Virginia and n¼ 4 for New
Jersey).
Figure 8. Mean QPX intensity in hard clams from the Virginia (top) and
New Jersey (bottom) grow-out sites from time of planting, fall 1999 for
Virginia and spring 2000 for New Jersey, through the termination of
the experiment in spring 2002. Means are contrasted for the 5 clam
stocks tested:Massachusetts ( MA), New Jersey ( NJ), Virginia
( VA), South Carolina ( SC), and Florida ( FL). Error bars
represent standard deviation (n ¼ 3 for Virginia and n ¼ 4 for New
Jersey).
TABLE 5.
Spearman rank correlation of QPX and clam mortality by
site and date.
Site Date r p
Virginia 7–31–00 0.147 0.5476
5–31–01 0.097 0.6916
8–16–01 0.456 0.0500
11–12–01 0.458 0.0484
4–24–02 0.646 0.0028
New Jersey 5–7–01 0.740 0.0013
8–17–01 0.529 0.0212
11–13–01 0.537 0.0192
4–24–02 0.662 0.0039
RAGONE CALVO ET AL.118

breeding strategy for the development of QPX disease resistantstocks.
ACKNOWLEDGMENTS
Many individuals contributed to the success of this project.The authors thank; in Virginia; Rita Crockett for disease
diagnosis, Tom Gallivan and Nate Geyerhahn for oversightof the field component, the many VIMS staff and students whoassisted with field collections and clam processing, Dr. Standish
Allen and the Aquaculture Genetics and Breeding Center staff
for production of clam seed, cooperating industry memberswho supplied brood stock clams, Dr. Mark Camara for
assistance with statistical analyses, and Katherine Davis-Small;for assistance with administration of the grant. The authors alsothank; in New Jersey; George Mathis for use of his site;assistance in establishing and maintaining field sites; and for
assisting with collections, Robert Barber for histological pro-cessing of clams and disease diagnosis, and Beth Mello formanaging field collections and clam processing. This project
was funded by the Saltonstall-Kennedy Program (Grant Num-ber NA96FD0075). VIMS contribution number 2811.
LITERATURE CITED
Bower, S. M. 1987. Labyrinthuloides haliotidis n. sp. (Protozoa: Laby-
rinthomorpha), a pathogenic parasite of small juvenile abalone in a
British Columbia mariculture facility. Can. J. Zool. 65:1996–2007.
Brothers, C., E. Marks & R. Smolowitz. 2000. Conditions affecting the
growth and zoosporulation of the protistan parasite QPX in culture.
Biol. Bull. 199:200–201.
Bushek, D. & S. K. Allen, Jr. 1996. Host-parasite interactions among
broadly distributed populations of the eastern oyster Crassostrea
virginica, and the protozoan Perkinsus marinus. Mar. Ecol. Prog.
Ser. 139:127–141.
Camara, M. D., S. K. Allen, Jr., R. B. Carnegie & K. S. Reese. 2006.
Out-crossing among commercial strains of the northern quahog,
Mercenaria mercenaria: survival, growth and implications for
selective breeding. J. Shellfish Res. 25:403–416.
Dove, A. D. M., P. R. Bowser & R. M. Cerrato. 2004. Histological
analysis of an outbreak of QPX disease in wild hard clams
Mercenaria mercenaria in New York. J. Aquat. Anim. Health 16:
246–250.
Fegley, S. R. 2001. Demography and dynamics of hard clam popula-
tions. In: J. N. Kraeuter &M. Castagna, editors. The biology of the
hard clam,Mercenaria mercenaria (Linne). 31, Amsterdam: Elsevier
Scientific Publishers, pp. 261–280.
Ford, S. E., J. N. Kraeuter, R. D. Barber & G. Mathis. 2002. Aqua-
culture associated factors in QPX disease of hard clams: density and
seed source. Aquaculture 208:23–38.
Ford, S. E., R. Smolowitz, L. Ragone-Calvo, R. D. Barber & J. N.
Kraeuter. 1997. Evidence that QPX (Quahog Parasite Unknown) is
not present in hatchery-produced hard clam seed. J. Shellfish Res.
16:519–521.
Haskin, H. H. & S. E. Ford. 1979. Development of resistance to
Minchinia nelsoni (MSX) mortality in laboratory-reared and native
oyster stocks in Delaware Bay. U.S. Mar. Fish. Rev. 41:54–63.
Hilbish, T. J. 2001. Genetics of Hard Clams,Mercenaria mercenaria. In:
J. N. Kraeuter & M. Castagna, editors. The biology of the hard
clam, Mercenaria mercenaria (Linne). 31, Amsterdam: Elsevier
Scientific Publishers. pp. 261–280.
Lawrence, D. R. & G. I. Scott. 1982. The determination and use of
condition index of oysters. Estuaries 5:23–27.
Lyons, M. M., J. E. Ward, R. Smolowitz, K. R. Uhlinger & R. J. Gast.
2005. Lethal marine snow: pathogen of bivalve mollusc concealed in
marine aggregates. Limnol. Oceanogr. 50:1983–1988.
Maas, P. A. Y., S. J. Kleinschuster, M. J. Dykstra, R. Smolowitz &
J. Parent. 1999. Molecular characterization of QPX (Quahog
Parasite Unknown), a pathogen of Mercenaria mercenaria. J.
Shellfish Res. 18:561–567.
McLean, N. & D. Porter. 1982. The yellow spot disease of Tritonia
diomedea Bergh, 1894 (Mollusca: Gastropoda; Nudibranchia):
encapsulation of the Traustochytreaceous parasite by host amoe-
bocytes. J. Parasitol. 68:243–252.
Menzel, R. W. 1989. The biology, fishery and culture of quahog clams,
Mercenaria. In: J. J. Manzi & M. Castagna, editors. Clam
mariculture in North America. Amsterdam: Elsevier. pp. 201–242.
Perkins, F. O. 1973. A new species of marine Labyrinthulid. Arkiv fur
Mikrobiologie 90:1–17.
Polglase, J. L. 1980. A preliminary report on the Thraustochytrid(s) and
Labyrinthulid(s) associated with a pathological condition in the
lesser octopus Eledone cirrhosa. Botanica Marina 23:699–706.
Porter, D. 1990. Phylum Labyrinthomycota. In: L. Margulis, J. O.
Corliss, M. Melkonian, & D. J. Chapman, editors. Handbook of
rotoctista. Boston: Jones and Bartlett. pp. 388–398.
Ragan, M. A., G. S. MacCallum, C. A. Murphy, J. J. Cannone, R. R.
Gutell & S. E. McGladdery. 2000. Protistant parasite QPX of hard-
shell clam Mercenaria mercenaria is a member of Labyrinthulomy-
cota. Dis. Aquat. Org. 42:185–190.
Ragone Calvo, L. M., J. G.Walker & E. M. Burreson. 1998. Prevalence
and distribution of QPX, Quahog Parasite Unknown, in hard clams,
Mercenaria mercenaria, in Virginia, USA. Dis. Aquat. Org. 33:209–
219.
Rawson, P. D. & T. J. Hilbish. 1991. Heritability of juvenile growth for
the hard clam Mercenaria mercenaria (L.). Evolution Int. J. Org.
Evolution 45:1924–1935.
Shaw, B. L. & H. I. Battle. 1957. The gross and microscopic anatomy of
the digestive tract of the oyster Crassostrea virginica (Gmelin). Can.
J. Zool. 35:325–347.
Smolowitz, R., D. Leavitt & F. Perkins. 1998. Observations of a
protistan disease similar to QPX in Mercenaria mercenaria (hard
clams) from the coast of Massachusetts. J. Invertebr. Pathol. 71:
9–25.
Stokes, N. A., L. M. Ragone Calvo, K. S. Reece & E. M. Burreson.
2002. Molecular diagnostics, field validation, and phylogenetic
analysis of quahog parasite unknown (QPX), a pathogen of the
hard clam Mercenaria mercenaria. Dis. Aquat. Org. 52:233–247.
Whyte, S. K., R. J. Cawthorn & S. E. McGladdery. 1994. QPX
(Quahaug Parasite X) a pathogen of northern quahaug Mercenaria
mercenaria from the Gulf of St. Lawrence, Canada.Dis. Aquat. Org.
19:129–136.
Winer, B. J. 1971. Statistical Principles in Experimental Design. New
York: McGraw Hill. 907 pp.
Zar, J. H. 1984. Biostatistical analysis. Englewood Cliffs: Prentice-Hall.
718 pp.
INFLUENCE OF HOST GENETICS AND LOCATION ON QPX 119