
Data Quality Assurance for Volunteered Geographic Information
17
Data Quality Assurance for Volunteered Geographic Information Ahmed Loai Ali 1,3 and Falko Schmid 1,2 1 Cognitive Systems Group, University of Bremen, Germany 2 SFB/TR 8 Spatial Cognition, University of Bremen, Germany 3 Faculty of Computers and Information, Assiut University, Egypt {loai,schmid}@informatik.uni-bremen.de Abstract. The availability of technology and tools enables the public to participate in the collection, contribution, editing, and usage of geo- graphic information, a domain previously reserved for mapping agencies or companies. The data of Volunteered Geographic Information (VGI) systems, such as OpenStreetMap (OSM), is based on the availability of technology and participation of individuals. However, this combination also implies quality issues related to the data: some of the contributed entities can be assigned to wrong or implausible classes, due to individual interpretation of the submitted data, or due to misunderstanding about available classes. In this paper we propose two methods to check the integrity of VGI data with respect to hierarchical consistency and clas- sification plausibility. These methods are based on constraint checking and machine learning methods. They can be used to check the validity of data during contribution or at a later stage for collaborative manual or automatic data correction. Keywords: Spatial Data Quality, Volunteered Geographic Information, Geographic Information Systems, Spatial data classification 1 Introduction During the last decade, low-cost sensing devices like handheld GPS receivers or smartphones became available and accessible for many consumers. In the same period powerful open GIS software and web technologies have been developed. The availability of technology and tools enables the public to participate in the collection, contribution, editing, and usage of geographic information, a domain previously reserved for mapping agencies or large organizations. Volunteered Geographic Information (VGI) [11], the voluntary collection and contribution of geo-spatial data by interested individuals became a large and vital movement. VGI projects like OpenStreetMap 1 (OSM) result in large scale data sets of geo- graphic data covering many parts of the world. This new way of geographic data production changed not only the way of data processing but also applications and services built on it [4, 9, 28]. 1 http://www.OpenStreetMap.org
-
Upload
independent -
Category
Documents
-
view
0 -
download
0
Transcript of Data Quality Assurance for Volunteered Geographic Information

Data Quality Assurance for VolunteeredGeographic Information
Ahmed Loai Ali 1,3 and Falko Schmid 1,2
1 Cognitive Systems Group, University of Bremen, Germany2 SFB/TR 8 Spatial Cognition, University of Bremen, Germany
3 Faculty of Computers and Information, Assiut University, Egypt{loai,schmid}@informatik.uni-bremen.de
Abstract. The availability of technology and tools enables the publicto participate in the collection, contribution, editing, and usage of geo-graphic information, a domain previously reserved for mapping agenciesor companies. The data of Volunteered Geographic Information (VGI)systems, such as OpenStreetMap (OSM), is based on the availability oftechnology and participation of individuals. However, this combinationalso implies quality issues related to the data: some of the contributedentities can be assigned to wrong or implausible classes, due to individualinterpretation of the submitted data, or due to misunderstanding aboutavailable classes. In this paper we propose two methods to check theintegrity of VGI data with respect to hierarchical consistency and clas-sification plausibility. These methods are based on constraint checkingand machine learning methods. They can be used to check the validityof data during contribution or at a later stage for collaborative manualor automatic data correction.
Keywords: Spatial Data Quality, Volunteered Geographic Information,Geographic Information Systems, Spatial data classification
1 Introduction
During the last decade, low-cost sensing devices like handheld GPS receivers orsmartphones became available and accessible for many consumers. In the sameperiod powerful open GIS software and web technologies have been developed.The availability of technology and tools enables the public to participate in thecollection, contribution, editing, and usage of geographic information, a domainpreviously reserved for mapping agencies or large organizations. VolunteeredGeographic Information (VGI) [11], the voluntary collection and contribution ofgeo-spatial data by interested individuals became a large and vital movement.VGI projects like OpenStreetMap1 (OSM) result in large scale data sets of geo-graphic data covering many parts of the world. This new way of geographic dataproduction changed not only the way of data processing but also applicationsand services built on it [4, 9, 28].
1 http://www.OpenStreetMap.org

2 Data Quality Assurance for Volunteered Geographic Information
There exist a huge number of services based on e.g., OSM data, such as mapproviders, trip advisers, navigation applications. Depending on the service, reli-able data is necessary. However, without coordinated action, the experience andtraining of experts, and industrial grade sensing devices it is hard to guaranteedata of homogeneous quality.
The absence of a clear classification system in, e.g., OSM, the ambiguousnature of spatial entities, and the large number of users with diverse motivationsand backgrounds foster the generation of data of mixed quality. Whatever a bodyof water is a pond or a lake, whatever a grassland is a meadow, natural reserve,a park, or a garden is not just a question of a proper, crisp definition, but alsoa question of perception, conceptualization, and cultural background. What isa pond somewhere, might be a lake in a different environment, a river might bea creek or a stream. In addition to rather conceptual issues, many contributedentities are incompletely classified or wrongly attributed due to the open andloose attributation mechanism in OSM. As a result, a significant amount ofdata is not correctly classified and can cause errors whenever they are addressedby algorithms, such as rendering, analysis, or routing. This situation triggersquestions about the quality of VGI data, suitable mechanisms for guaranteeingand fostering high quality contributions, and correcting problematic data.
Hence, it becomes increasingly important to analyze the heterogeneous qual-ity of VGI data. Several studies investigate the quality of VGI by applyinggeographic data quality measures, such as feature completeness, positional ac-curacy, and attribute consistency [10, 16, 19]. These approaches usually requireusing reference data sets to evaluate the VGI data. However, these data sets arein many cases not available.
In this paper we present two approaches for analyzing the quality of VGIdata: one by constraint checking and one by machine learning, i.e., we are ana-lyzing the available data only with respect to consistency and plausibility basedon contributions themselves. The results can be used to re-classify existing dataand to provide guidance and recommendations for contributors during the con-tribution process. Recommendations can be directly generated from the datasource itself by analyzing the distribution of the contributed feature in the sur-rounding area, thus the locality of entitles is preserved and no global rules areapplied to locally generated data.
2 Related Work
In VGI, contributors produce geographic information without necessarily beingeducated surveyors or cartographers. In open platforms such as OSM, the mo-tivation for contribution can be highly diverse, and the quality of contributionsalso depends on the used equipments and methods. Thus, the combination ofdiverse educational backgrounds, different views on required data and its qual-ity, as well as technical constraints lead to data of mixed quality. Hence, theassessment of VGI data quality became a focus in VGI related research.

Data Quality Assurance for Volunteered Geographic Information 3
Quality of VGI data has various perspectives and notions: completeness,positional accuracy, attribute consistency, logical consistency, and lineage [12].The quality can be assessed by basically three different methods: comparisonwith respect to reference data, semantic analysis, and intrinsic data analysis.
One approach to assess the quality of VGI data is by means of a directcomparison with reference data collected with a certain quality standards. Thechallenge of this approach is to identify a robust mutual mapping function be-tween the entities of both data sets. In [13, 16] the authors are able to show ahigh overall positional accuracy of OSM data in comparison with authoritativedata. In terms of completeness, some studies conclude that some areas are wellmapped and complete relative to others. They also show a tight relation betweencompleteness and urbanization [13, 20].
Different aspects have influence on the quality of VGI data, e.g., the combi-nation of loose contribution mechanisms, and the lack of strict mechanisms forchecking the integrity of new and existing data are major sources of the hetero-geneous quality of VGI data [17]. Amongst others, semantic inconsistency is oneof the essential problems of VGI data quality [7]. In [18] and [26] the authorspresent methods for improving the semantic consistency of VGI. The analysis ofsemantic similarity is applied to enhance the quality of VGI by suggesting tagsand detecting outliers in existing data [18, 26], as well as by ontological reason-ing about the contributed information (e.g., [24]). Another approach for tacklingquality issues is the development of appropriate interfaces for the data generationand submission. In [22, 23] the authors demonstrate that task-specific interfacessupport the generation of high quality data even under difficult conditions.
An alternative approach is evaluating the available data along three intrinsicdimensions [12]:
– Crowdsourcing evaluation: the quality of data can be evaluated manuallyby means of cooperative crowdsourcing techniques. In such an approach,the quality is ensured through checking and editing of objects by multiplecontributors, e.g., by joint data cleaning with gamification methods [1].
– Social measures: this approach focuses on the assessment of the contributorsthemselves as a proxy measure to the quality of their contributions. [13, 16]use the number of contributors as a measure for data quality, [21] analyzesthe individual activity, [17] investigates positive and negative edits, [2] isresearching fitness-for-purpose of the contributed data.
– Geographic context : this approach is based on analyzing the geographic con-text of contributed entities. This approach relates to Tobler’s first law ofgeography which states that ”all things are related, but nearby things aremore related than distant things” [25].
3 Managing Quality of VGI Data
A big challenge for VGI is the quality management of the contributed databecause of its multidimensional heterogeneity (knowledge and education, mo-tivation for contribution, and technical equipment). The problem requires the
4 Data Quality Assurance for Volunteered Geographic Information
development of tools advising contributors during the entity creation process,but also to correct already existing data of questionable quality. Amongst oth-ers, quality problems can be general accuracy issues, geometric or topologicalconstraint violations, hierarchical inconsistencies, and wrong or incomplete clas-sification. In this work we focus on hierarchical inconsistencies and wrong orincomplete classification. Whenever we use the term ”wrong” in our study wemean the assignment of a potentially wrong class or tag to the respective entitydue to labeling ambiguity. ”Wrong” entities will be detected by our classificationand consistency checking algorithms. This is only an indicator for a potentialconflict.
In the case of OSM, it is known that the data set contains large amounts ofproblematic data (e.g., see Section 2). On the other hand, we can assume that asignificantly larger part of the data is of sufficient quality: the large amount ofvolunteers constantly improving the data set and the large number of commercialapplications built on top of the data set are good indicators for it. Given thatthis rather unprovable statement is true, we can use the data itself for qualityassessment by learning its properties and using the results as an input for theprocesses described in our approach.
Figure 1 describes the two phase approach: in the Classification phase, wecan either apply machine learning algorithms to learn classifiers of the so farcontributed data, or we can define classification constraints the data has to sat-isfy. Some of the before mentioned quality issues could be solved if at the pointof data generation or contribution the integrity with existing data is checked.Depending on the potential problem to be addressed, different automatic ap-proaches for satisfying inherent constraints are available, e.g., [6].
Hence, in the Consistency Checking phase we propose three approaches forchecking the consistency of the data: during Contribution Checking the contribu-tion tool should inform users during the contribution process about potentiallyproblematic data based on the generated classifier. Contributors can now con-sider the hints generated by the system about an object and can take actions tocorrect it if necessary. After contribution, the new data can be used to train theclassifier again (if checking is based on an learning approach). Manual Checkingshould provide tools allowing the identification of problematic entities in theexisting data set. They can be presented to volunteers for checking and correct-ing, ideally based on plausible suggestions. And finally, Automatic Checking cancorrect obviously wrong data automatically, if the correction can be computedwithout human assistance.
4 Tackling Areal Consistency and ClassificationPlausibility
The majority of data quality studies focus on point-like or linear geographicentities, such as points of interest or road networks (see Section 2). In this workwe focus on quality issues related to areal entities, that is extended geometricentities. Our methods can be applied to entities of all possible scales, from very

Data Quality Assurance for Volunteered Geographic Information 5
Fig. 1. Proposed approaches to ensure VGI quality, see Section 3 for a detailed de-scription.
large administrative or natural entities to rather small ones like buildings or parkbenches.
The focus of our work is the quality of the classification of the contributeddata. We are particularly interested in:
– Hierarchical consistency of administrative data: we check if administrativeelements are used according to intrinsic, logical rules.
– Classification plausibility of areal entities: the correct classification of enti-ties can be difficult, especially when contributors are not aware of potentialconflicts due to similar concepts. Here we focus on ambiguity issues resultingfrom the availability of two or more possible classification options of entities(e.g., park vs. garden vs. grass).
Our study is build on OSM data. We will use notions typically used in theOSM tagging scheme, such as: keys and values.
5 Hierarchical consistency analysis
Administrative boundaries are political geographic entities with a strict inher-ent structure, such as continents consist of countries, countries consisting ofstates and states consisting of districts, etc. In OSM2 administrative bound-
2 http://wiki.openstreetmap.org/wiki/Key:admin_level#admin_level

6 Data Quality Assurance for Volunteered Geographic Information
aries are defined as subdivisions of areas/territories/jurisdictions recognized bygovernments or other organizations for administrative purposes. Administrativeboundaries range from large groups of nation states right down to small adminis-trative districts and suburbs, with an indication of this size/level of importance,given by tag ’admin level’ which takes a value from 1 to 10”. However, as coun-tries can have different administrative partitioning, some levels might not beapplicable or the classification schema may not be sufficient. In this case it canbe extended to 11 levels (e.g., in Germany and Netherlands).
Typically, administrative boundaries around administrative Units U are struc-tured such that every administrative unit typically belongs to one administrativelevel of 1 to 11 (exceptions are, e.g., city states):
∀u ∈ Ui where 1 ≤ i ≤ 11 (1)
Each administrative unit where i > 1 is contained in an administrative unitof a higher level; all together the contained units exhaustively cover the territoryof the containing unit:
∀ua ∈ Ui>1,∃ub ∈ Uj>i : ua ⊂ ub (2)
Administrative units on one level can share borders but do not intersect eachother:
∀Uj , Uk ⊂ Ui : Uj ∩ Uk = ∅ (3)
However, there are exceptions from this strict hierarchy, such as exclaves,enclaves, city states, or embassies. Still, the vast majority of administrative unitsfollow a clear and exhaustive hierarchical ordering. This allows checking theintegrity of the available administrative data in OSM by checking the followingtype of outliers:
– Duplication: in the case of duplication, entities belong to two or more differ-ent administrative units. See Figure 2(a).
– Inconsistency : hierarchical inconsistency occurs when entities of higher ad-ministrative units are contained in units of lower levels or the same level.See Figure 2(b)
– Incorrect Values: incorrect values occur throughout the OSM data set, prob-ably due to the import from different classification schemes. Typically thevalue of admin level tag is not a numerical value between 1-11.
5.1 Consistency Analysis Results and Discussion
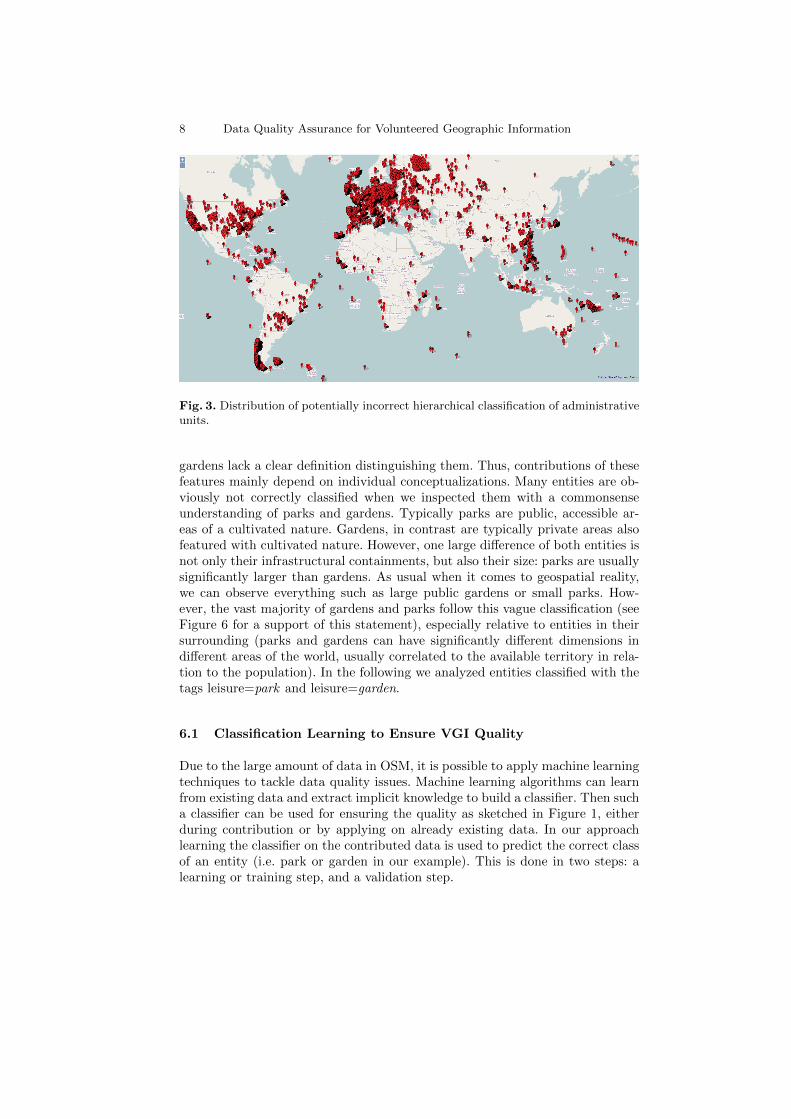
We applied the consistency rules on the complete OSM data set downloaded atJanuary 20th, 2014. At the time of analysis, the OSM data contained 259,667 ge-ographic entities classified as administrative units (admin level = value). 24,410entities, thus about 10% of all administrative units contained problematic as-signments, see Figure 3. We identified 14,842 duplications, 9,305 inconsistenciesand 263 incorrect values.

Data Quality Assurance for Volunteered Geographic Information 7
(a) Duplication (b) Inconsistency
Fig. 2. Incorrect classification plausibility (Duplication & Inconsistency). In a) a partof Bremen city is within Bremerhaven, in b) units on level 11 contain elements of level8 and 9.
Figure 2(a) illustrates an example for duplication: a part of the administrativeunit representing Bremen city, is part of another unit representing Bremerhavencity. Figure 2(b) shows an instance of inconsistency: some administrative unitsof level 8 and 9 are contained by administrative units of level 11.
Of course, not all of the 24,410 detections represent wrong data, some casesalready represent the mentioned special cases, some inconsistencies might bedetected due to incomplete presence of administrative hierarchies. However, aplausibility check as sketched in Section 3 would draw the attention of the con-tributor towards potential errors.
6 Classification Plausibility Analysis
When users contribute data to OSM, they have a large range of possibilities toclassify the data. In some cases classifying entities is not straightforward; de-pending on the perspective of the contributor different possible classes may beapplicable. A water body can still be a pond or already be a lake, the grasscovered area can be a park, a garden, meadow or grassland. In many cases thereis no definite answer, especially as in OSM there is no explicit classificationsystem, just recommendations. However, utilizing spatial data requires homoge-neous handling of data of identical concepts. Only if the same type of entities areidentically classified, algorithms can access them properly for analysis, rendering,or reasoning. However, in many cases users contribute data with wrong classifi-cations either due to conceptual ambiguity or due to a different understandingof the available concepts.
In this work we exemplify our approach on analysing classification plausibil-ity of entities, which are classified either as park or garden. We chose these classesas they are good examples for classification ambiguity: within OSM, parks and
8 Data Quality Assurance for Volunteered Geographic Information
Fig. 3. Distribution of potentially incorrect hierarchical classification of administrativeunits.
gardens lack a clear definition distinguishing them. Thus, contributions of thesefeatures mainly depend on individual conceptualizations. Many entities are ob-viously not correctly classified when we inspected them with a commonsenseunderstanding of parks and gardens. Typically parks are public, accessible ar-eas of a cultivated nature. Gardens, in contrast are typically private areas alsofeatured with cultivated nature. However, one large difference of both entities isnot only their infrastructural containments, but also their size: parks are usuallysignificantly larger than gardens. As usual when it comes to geospatial reality,we can observe everything such as large public gardens or small parks. How-ever, the vast majority of gardens and parks follow this vague classification (seeFigure 6 for a support of this statement), especially relative to entities in theirsurrounding (parks and gardens can have significantly different dimensions indifferent areas of the world, usually correlated to the available territory in rela-tion to the population). In the following we analyzed entities classified with thetags leisure=park and leisure=garden.
6.1 Classification Learning to Ensure VGI Quality
Due to the large amount of data in OSM, it is possible to apply machine learningtechniques to tackle data quality issues. Machine learning algorithms can learnfrom existing data and extract implicit knowledge to build a classifier. Then sucha classifier can be used for ensuring the quality as sketched in Figure 1, eitherduring contribution or by applying on already existing data. In our approachlearning the classifier on the contributed data is used to predict the correct classof an entity (i.e. park or garden in our example). This is done in two steps: alearning or training step, and a validation step.

Data Quality Assurance for Volunteered Geographic Information 9
In the first step our system learns a classifier based on the properties of pre-classified entities of a training set [3, 14]. In this work, the training set consistsof entities representing parks and gardens, Dtrain = (E1, E2, ..., En), where eachEntity E is represented by a set of features (such as: size, location ...etc.) andis assigned to a class C (i.e. park or garden), E = (F1, F2, ..., C). This step triesto identify a function, f(E) = C to predict the class C of a given entity E.
In the second step the generated classifier is used for classification: we applyit on a test set to measure the accuracy of the classifier. The test set only containsentities not used for training. The classifier performance is evaluated accordingto classification accuracy on the test entities [3, 14].
6.2 Experiments and Setup
As described previously, we focus on classification plausability in case of similarlyapplicable classes, in our case parks (leisure = park) and gardens (leisure =garden). We use data from Germany, the United Kingdom (UK), and Austria.According to [13, 16], OSM data is of acceptable quality in Germany and theUK. In our study we use data downloaded on December 20th, 2013.
0
100
200
300
400
500
600
700
800
900
1000
1100
1200
1300
1400
1500
Ber
linB
rem
enD
ortm
und
Dus
seld
orf
Esse
nFr
ankf
urt
Ham
burg
Col
ogne
Mun
chen
Stut
tgar
tB
irmin
gham
Bra
dfor
dB
risto
lEd
inbu
rgh
Gla
sgow
Leed
sLi
verp
ool
Lond
onM
anch
este
rSh
effie
ldD
ornb
irnG
raz
Inns
bruc
kK
lage
nfur
tLi
nzSa
lzbu
rgSt
. Pöl
ten
Vie
nna
Vila
chW
els
Garden Park
Germany UK Austria
Fig. 4. Number of Parks and Gardens within the selected data set.
We selected data from the ten densest (population/area) cities of each coun-try. Figure 4 shows the selected cities and the present number of parks and

10 Data Quality Assurance for Volunteered Geographic Information
gardens within each city. We decided to use cities as spatial units, as they definegraspable spatial regions. In our experiments we follow the locality assumptionof Tobler’s first law of geography: different cities in the same country might havea closer understanding of parks and gardens than cities of different countries.Thus, it will be more likely to produce meaningful results if we apply a learnedclassifier from one city on the data of another city in the same country. Learningareal properties in Hong Kong and applying them on data of Perth/Australiamight not be valid due to the size of the available territory. The same holds forthe idea of learning global parameters for parks and gardens — spatial entitieshave a strong grounding in local culture and history of a particular country, ap-plying global rules on local data will lead in many cases to wrong classificationsdue to different local concepts.
0%10%20%30%40%50%60%70%80%90%
100%
1 2 3 4 5 6 7
Garden Park
Sqm
103−10
4
104−10
5
105−10
6
102−10
3
10−10
2
<10
>10
6
Count
(a) Birmingham
0%5%
10%15%20%25%30%35%40%45%
Tiny Very small Small Medium Large Very large Huge
Garden Park
Sqm
103−10
4
104−10
5
105−10
6
102−10
3
10−10
2
<10
>10
6
Count
(b) London
Fig. 5. Distribution of parks and gardens areas in London and Birmingham.
In the following we learned the classifiers of 10 cities per country, and appliedthem mutually to every other city. By assessing the classification accuracy, thismethod allows identifying the most accurate classifiers for a city, and the iden-tification of biased classifiers due to biased or ambiguous classification practiceswithin specific cities.
In our study we applied a straightforward approach to distinguish betweenparks and gardens: we compared their size. Size is not probably enough to reliablydistinguish between gardens and parks, especially if we consider other relatedclasses such as meadows or grassland. When we have a closer look into how theclasses are populated, we can see that the distribution can be rather clear, asit is, e.g., the case in Birmingham (see Figure 5(a)). There are also places witha less clear separation, e.g., the case of London (see Figure 5(b)), where parksand gardens seem to have a large conceptual overlap. However, our intentionbehind choosing the area is to detect incorrect classification at a very earlypoint of contribution, when no other features are yet provided. Confronted withan ’early-warning’, users can reconsider the class they selected and modify itif required. However, especially a review of the existing data, as suggested inSection 3, can be fed by such a classifier. Figure 6 shows the mean areas of parks

Data Quality Assurance for Volunteered Geographic Information 11
and gardens. It clearly shows that the areas per class are generally distinct andcan be used to distinguish between entities of the two classes.
Feature Selection The areas of each class have a specific distribution in eachcity. Figure 6 shows that parks are more likely to be large (i.e., tens of thousandsto millions sqm), while gardens are more likely to cover rather smaller areas(i.e., a few sqm to a few thousands sqm). Although there are rare cases (i.e.Royal Botanic Gardens in the UK about one million sqm, however, they canbe considered to be parks) corrupting the distribution; the majority of entitiesfollow a common distribution. This distribution might also be similar in othercities, even if the data does not reflect it. By learning these distributions, wecan distinguish between parks and gardens, and apply the learned classifiersto other cities and check the existing data or to guide contributors during thecontribution process.
05
101520253035404550556065707580
Ber
linB
rem
enD
ortm
und
Dus
seld
orf
Esse
nFr
ankf
urt
Ham
burg
Col
ogne
Mun
chen
Stut
tgar
tB
irmin
gham
Bra
dfor
dB
risto
lEd
inbu
rgh
Gla
sgow
Leed
sLi
verp
ool
Lond
onM
anch
este
rSh
effie
ldD
ornb
irnG
raz
Inns
bruc
kK
lage
nfur
tLi
nzSa
lzbu
rgSt
. Pöl
ten
Vie
nna
Vila
chW
els
x10³ Sqm Garden Park
Germany UK Austria
Fig. 6. Mean area size of parks and gardens for the selected data set.
Classifier Training Building a classifier basically can be done using EagerLearning (EL) or Lazy Learning (LL). In EL a training set is used to builda complete classifier before receiving any test entities. Bayesian classification,support vector machines (SVM), neural network (NN), and decision trees areexamples for EL algorithms. In LL, generalization beyond the training data

12 Data Quality Assurance for Volunteered Geographic Information
is delayed until a query is made to the system. K-nearest neighbours (KNN)and case based reasoning (CBR) are examples of lazy learning [3, 14]. In OSMa set of pre-classified entities is already stored, and the classification processis performed on new entities at contribution time. The new entity is classifiedbased on similarity to existing entities. Hence, it is a good idea to follow the lazylearning paradigm to develop a classifier.
We decided to use KNN [5, 27] for building a classifier. KNN classifies entitiesbased on closest training examples. It works as follows: the unclassified entity isclassified by checking the K nearest classified neighbours. The similarity betweenthe unclassified entity and the training set is calculated by a similarity measure,such as euclidean distance.
Training Set
Test Set Ber
lin
Bre
men
Dort
mund
Duss
eldorf
Ess
en
Fra
nkfu
rt
Ham
burg
Colo
gne
Munch
en
Stu
ttgart
Class.Acc.
Berlin 80.43 76.78 76.23 72.25 74.07 82.03 56.44 79.38 78.94 82.2 75.23
Bremen 71.93 72.28 70.18 70.18 69.12 72.28 59.30 72.98 71.23 71.93 71.70
Dortmund 54.14 55.79 83.31 82.26 82.41 32.93 76.84 81.05 76.84 32.93 82.26
Dusseldorf 43.59 59.08 85.74 91.38 91.18 19.69 86.36 87.28 78.26 19.69 89.95
Essen 77.44 71.95 79.27 79.88 82.32 75.00 66.16 80.49 78.35 75.00 80.69
Frankfurt 89.68 79.13 75.00 62.39 65.37 92.66 47.94 78.67 78.21 92.89 88.07
Hamburg 54.15 55.87 59.03 61.27 61.76 51.69 61.06 58.97 57.90 51.79 61.36
Cologne 78.13 79.09 81.49 80.05 80.05 77.16 66.35 80.53 80.29 77.16 80.13
Munchen 72.50 71.02 79.37 77.90 79.17 69.16 62.48 78.49 78.88 69.25 78.65
Stuttgart 93.58 74.33 80.75 65.24 67.38 94.65 54.01 74.33 78.61 94.65 76.11
Table 1. Classification accuracy for parks and gardens of cities in Germany.
Classifier Validation During the validation process we use independent datasets for training and testing or we use the same data set for mutually appliedclassifiers (with this method, we evaluate if a classifier from a different city can beapplied to another city). In the latter case, we use K-fold cross validation (CV)[15] to show the validity of our classification. In CV a training set is divided intoK disjointed equal sets, where each set has roughly the same class distribution.Then the classifier is trained K times3, and each time a different set is used as atest set. Afterwards the performance of the classifier is measured as the averageof developed classifiers [15]. We build classifiers for each city in a country. Theresults can be inspected in Tables 1, 2 and 3. The rows of the tables represent
3 5 and 10 are recommended values for K

Data Quality Assurance for Volunteered Geographic Information 13
the accuracies of different classifiers for the data of each city as a test set. Theseclassifiers were generated based on the data of other cities as training sets andare represented in the columns. The last column ”Class. Acc.” shows the averageclassification accuracy of parks and gardens within each city based on the topthree classifiers (italic red values).
Training Set
Test Set Bir
min
gham
Bra
dfo
rd
Bri
stol
Edin
burg
h
Gla
sgow
Lee
ds
Liv
erp
ool
London
Manch
este
r
Sheffi
eld
Class.Acc.
Birmingham 99.73 0.99 70.03 92.65 90.79 92.67 0.94 69.27 1.29 94.73 92.73
Bradford 59.49 84.81 73.42 54.43 67.09 70.25 84.81 74.68 81.65 68.99 72.78
Bristol 72.73 79.55 78.64 67.27 75.91 79.09 79.55 76.82 79.55 81.82 78.03
Edinburgh 65.23 44.44 59.14 59.32 63.26 63.26 44.62 59.50 51.61 60.75 60.63
Glasgow 74.30 45.55 67.18 70.23 69.72 73.03 45.80 67.94 61.07 69.97 71.76
Leeds 75.96 57.87 72.34 70.43 77.45 75.96 58.09 73.40 58.94 77.66 77.02
Liverpool 86.05 89.53 88.37 80.23 87.21 89.53 89.53 87.21 89.53 90.70 87.60
London 68.26 64.88 72.51 66.77 72.02 72.22 65.05 73.03 68.12 72.83 72.63
Manchester 67.38 92.20 80.85 63.83 73.05 78.01 92.20 79.43 91.49 79.43 73.29
Sheffield 71.55 72.41 78.88 70.26 74.14 77.59 72.41 73.71 73.71 78.02 75.72
Table 2. Classification accuracy for parks and gardens of cities in the UK.
Classifier Assessment Depending on just one training and test set mightresult in biased classifiers. Furthermore, we aim to detect possible incorrect clas-sifications based on the similarity between cities within the same country. Thus,we build mutual classifiers between cities at the same country. One challengeis to assess the classifier performance. The accuracy of a classifier applied ona given test set is expressed by the percentage of correctly classified entities(please see the next section for a deeper discussion on the measurability of theresults). However, in some cases accuracies are biased due to overfitting or un-derfitting [3, 14]. A reason can be unbalanced population of the training or thetest set. This happens for instance when the classifiers created from Liverpool orManchester are applied on the Birmingham data (see Table 2). The Receiver Op-eration Characteristics (ROC) curve is a useful measure to asses the performanceof classifiers. The ROC curve represents the relative trade-off between benefitsand costs of the classifier. In particular the Area Under the ROC Curve (AUC)is a useful measure to asses a classifier. The closer the value of a AUC is to 1,the higher its performance. Good classifiers should have AUC value between 0.5and 1 [8]. Tables 1, 2, and 3 represent the accuracies of the generated classifiers,while AUC measures are dropped due to space restrictions. A combination of

14 Data Quality Assurance for Volunteered Geographic Information
Training Set
Test Set Dorn
bir
n
Gra
z
Innsb
ruck
Kla
gen
furt
Lin
z
Salz
burg
St.
Polt
en
Vie
nna
Vilach
Wel
s
Class.Acc.
Dornbirn 100 84.62 84.62 84.62 23.08 53.85 84.62 76.92 15.38 76.92 82.05
Graz 63.06 77.71 64.33 77.71 31.85 68.15 77.71 74.52 35.03 60.51 51.59
Innsbruck 80.19 66.04 83.02 66.04 52.83 50.94 66.04 66.98 47.17 47.17 67.30
Klagenfurt 72.13 73.77 70.49 70.49 31.15 62.30 73.77 75.41 47.54 49.18 65.57
Linz 41.52 34.66 43.32 34.66 62.09 37.91 34.66 38.63 61.01 40.07 48.01
Salzburg 56.60 67.92 59.43 67.92 39.62 70.75 67.92 64.15 42.45 58.49 60.38
St. Polten 100 100 100 100 25.00 80.00 100 95.00 30.00 55.00 X
Vienna 59.39 70.36 58.45 70.36 38.93 62.10 70.36 68.28 37.50 61.86 65.69
Vilach 34.29 31.43 34.29 31.43 68.57 48.57 31.43 31.43 77.14 22.86 59.02
Wels 56.25 56.25 56.25 56.25 31.25 56.25 56.25 50.00 50.00 37.50 56.25
Table 3. Classification accuracy for parks and gardens of cities in Austria.
accuracy and AUC is used to determine the classification accuracy of parks andgardens for each city. We select the three top classifiers with the highest AUCmeasures (italic red values), and neglect biased classifiers with AUC less thanor equal 0.5 (blue values). The classification accuracy is measured on the basisof the average accuracy.
Results Discussion Our results show that the cities in Germany and the UKhave a classification accuracy from 70% to 90% for parks and gardens (see Tables1 and 2). This means, according to our generated classifiers and their mutualapplication in other cities, about 10% to 30% of all analyzed entities within eachcity might be incorrectly classified. In Austria (see Table 3) we achieve poorerresults. This might be due to the relative low number of entities in the availabledata set, or to already existing classification problems. In some of the cities, e.g.,St. Polten only one class of entities is available or predominant and causes theclassifier to be highly biased and practically unusable (see Figure 4 and Table3).
Of course, the classification results have to be interpreted with care. In none ofthe selected data sets, we had a qualified reference data set of known good quality.We selected the data sets as they were, and tried to identify two size classeswithin them: one for gardens and one for parks. In most cities we could identifygood classifiers, however, their accuracies are not verifiable to full extend. As wehave no clear ground truth, we cannot claim the correctness of the classifiers.With our approach we were able to identify a large set of entities worth lookingat again. All samples we inspected showed clear evidence for entities that havebeen classified in an inappropriate way: ”parks” around residential buildings in
Data Quality Assurance for Volunteered Geographic Information 15
residential areas, as well as ”gardens” with typical park facilities such as ways,playgrounds, or larger water bodies.
Although these samples were randomly chosen, they showed indicators for thevalidity of our approach. There are other evidences about that our results pointin the right direction. In April 2014 we reviewed all entities that were detected asoutliers in this paper. Of the originally 24,410 detected conflicts of the hierarchyconsistency analysis (see Section 5) 10,635 entities had been already correctedor removed by the OSM community. Thus, in about 40% our approach pointedto entities identified as incorrect by crowdsourcing reviewers. The classificationplausibility analysis resulted in 2,023 problematic entities in Germany, 2,516 inthe UK, and 1,062 in Austria. About 8% of the German entities, 8% of theUK entities, and 11% of the Austrian entities have been revised since then. Itis necessary to state that they have been revised without explicitly pointing tothem. An appropriate infrastructure, e.g., a website or a gamified entitiy checker,can help to point users to the detected entities and revise them if necessary.
Also, the developed a very simple classifiers. If we want to successfully dis-tinguish more than two classes, we need to consider more features than justsize, thus we have to learn, e.g., typically contained or surrounding features ofentities. By applying the approach as discussed in Section 3, we can select thedetected entities and present them in a crowdsourcing manner to volunteers forinspection. The potentially re-classified entities could be used for rebuilding theclassifier with clearer evidence.
7 Conclusion and Future Work
In this work we propose a new approach to manage the quality of VGI dataduring contribution, and on the existing data set manually or automatically.We presented two approaches to tackle VGI quality. We mainly focused on theproblem of potentially wrong classifications that might lead to heterogeneousdata quality. We developed two methods to tackle hierachical consistency andclassification issues based on ambiguity of potential entity classes.
With our first method, constraint based checking of hierarchical elements,we are able to detect all inconsistencies in the existing OpenStreetMap data set.With our second method, we can identify potentially wrong areal classificationsin the OpenStreetMap data set by learning classifiers of different entity classes.The results show that we can identify a large number of existing problems inOSM data with both approaches. These detected conflicts could be presentedto voluntary users to validate the entities’ class, potentially based on sugges-tions generated along with it. For more complex classifiers being able to detectmultiple possible classes, like, e.g., the ”green areas” on a map (parks, gardens,meadow, grassland, scrub, etc.) we need to develop meaningful classifiers con-sidering sets of features to be learned. We also need to think about appropriateways to implement the proposed quality assurance methods, e.g., by means ofgamification of user-based validation of the detect problematic data.

16 Data Quality Assurance for Volunteered Geographic Information
Acknowledgements
We gratefully acknowledge support provided by the German Academic ExchangeService (DAAD), as well as the German Research Foundation (DFG) via theTransregional Collaborative Research Center on Spatial Cognition SFB/TR8.Furthermore, we would like to thank the anonymous reviewers for their valuablecomments.
References
1. Arteaga, M. G. Historical map polygon and feature extractor. In Proceed-ings of ACM MapInteract, 1st International Workshop on Map Interaction (2013),F. Schmid and C. Kray, Eds., ACM.
2. Barron, C., Neis, P., and Zipf, A. A comprehensive framework for intrinsicOpenStreetMap quality analysis. Transactions in GIS 18 (2014).
3. Bishop, C. M. Pattern Recognition and Machine Learning (Information Scienceand Statistics). Springer-Verlag New York, Inc., Secaucus, NJ, USA, 2006.
4. Coleman, D. J., Georgiadou, Y., Labonte, J., et al. Volunteered geographicinformation: the nature and motivation of produsers. International Journal ofSpatial Data Infrastructures Research 4, 1 (2009), 332–358.
5. Cover, T., and Hart, P. Nearest Neighbor pattern classification. IEEE Trans-actions on Information Theory 13, 1 (1967), 21–27.
6. Devogele, T., Parent, C., and Spaccapietra, S. On spatial database inte-gration. International Journal of Geographical Information Science 12, 4 (1998),335–352.
7. Elwood, S., Goodchild, M. F., and Sui, D. Z. Researching volunteered ge-ographic information: Spatial data, geographic research, and new social practice.Annals of the Association of American Geographers 102, 3 (2012), 571–590.
8. Fawcett, T. An introduction to ROC analysis. Pattern recognition letters 27, 8(2006), 861–874.
9. Feick, R., and Roche, S. Valuing volunteered geographic information (VGI):Opportunities and challenges arising from a new mode of GI use and production.In Proceedings of the 2nd GEOValue Workshop (2010), HafenCity University Ham-burg, Germany, pp. 75–79.
10. Girres, J.-F., and Touya, G. Quality assessment of the french OpenStreetMapdataset. Transactions in GIS 14, 4 (2010), 435–459.
11. Goodchild, M. F. Citizens as sensors: the world of volunteered geography. Geo-Journal 69, 4 (2007), 211–221.
12. Goodchild, M. F., and Li, L. Assuring the quality of volunteered geographicinformation. Spatial statistics 1 (2012), 110–120.
13. Haklay, M. How good is volunteered geographical information? a comparativestudy of OpenStreetMap and Ordnance Survey datasets. Environment and plan-ning. B, Planning & design 37, 4 (2010), 682.
14. Han, J., Kamber, M., and Pei, J. Data Mining: Concepts and Techniques,3rd ed. Morgan Kaufmann Publishers Inc., San Francisco, CA, USA, 2011.
15. Kohavi, R., et al. A study of Cross-Validation and Bootstrap for accuracyestimation and model selection. In IJCAI (1995), vol. 14, pp. 1137–1145.

Data Quality Assurance for Volunteered Geographic Information 17
16. Ludwig, I., Voss, A., and Krause-Traudes, M. A comparison of the streetnetworks of Navteq and OSM in Germany. In Advancing Geoinformation Sciencefor a Changing World. Springer, 2011, pp. 65–84.
17. Mooney, P., and Corcoran, P. The annotation process in OpenStreetMap.Transactions in GIS 16, 4 (2012), 561–579.
18. Mulligann, C., Janowicz, K., Ye, M., and Lee, W.-C. Analyzing the spatial-semantic interaction of points of interest in volunteered geographic information. InSpatial information theory. Springer, 2011, pp. 350–370.
19. Neis, P., Zielstra, D., and Zipf, A. The street network evolution of crowd-sourced maps: OpenStreetMap in Germany 2007–2011. Future Internet 4, 1 (2011),1–21.
20. Neis, P., Zielstra, D., and Zipf, A. Comparison of volunteered geographicinformation data contributions and community development for selected worldregions. Future Internet 5, 2 (2013), 282–300.
21. Neis, P., and Zipf, A. Analyzing the contributor activity of a volunteered ge-ographic information project: The case of OpenStreetMap. ISPRS InternationalJournal of Geo-Information 1, 2 (2012), 146–165.
22. Schmid, F., Frommberger, L., Cai, C., and Dylla, F. Lowering the barrier:How the what-you-see-is-what-you-map paradigm enables people to contribute vol-unteered geographic information. In Proceedings of the 4th Annual Symposium onComputing for Development (2013), ACM, p. 8.
23. Schmid, F., Frommberger, L., Cai, C., and Freksa, C. What you see iswhat you map: Geometry-preserving micro-mapping for smaller geographic objectswith mapit. In Geographic Information Science at the Heart of Europe. SpringerInternational Publishing, 2013, pp. 3–19.
24. Schmid, F., Kutz, O., Frommberger, L., Kauppinen, T., and Cai, C. In-tuitive and natural interfaces for geospatial data classification. In Workshop onplace-related knowledge acquisition research (P-KAR), Kloster Seeon, Germany(2012).
25. Tobler, W. R. A computer movie simulating urban growth in the detroit region.Economic geography 46 (1970), 234–240.
26. Vandecasteele, A., and Devillers, R. Improving volunteered geographic dataquality using semantic similarity measurements. ISPRS-International Archives ofthe Photogrammetry, Remote Sensing and Spatial Information Sciences 1, 1 (2013),143–148.
27. Witten, I. H., and Frank, E. Data Mining: Practical Machine Learning Toolsand Techniques, 2 ed. Morgan Kaufmann, San Francisco, 2005.
28. Zook, M., Graham, M., Shelton, T., and Gorman, S. Volunteered geographicinformation and crowdsourcing disaster relief: a case study of the Haitian earth-quake. World Medical & Health Policy 2, 2 (2010), 7–33.