
Geographic impressions in Facebook political ads - Applied ...
20
Geographic impressions in Facebook political ads Adina Gitomer 1* , Pavel V. Oleinikov 2 , Laura M. Baum 3 , Erika Franklin Fowler 4 and Saray Shai 5 Introduction e online political advertising terrain remains largely underdeveloped, especially in comparison to the large body of work describing television advertising (Ansolabehere and Iyengar 1995; Geer 2006; Franz et al. 2008; Mattes and Redlawsk 2015; Fowler et al. 2016). What is certain, however, is that online political advertising is increasingly preva- lent among campaigns and the public alike. It has been reported that digital ads have swollen, and continue to swell, in both number and spend; for instance, between the 2014 and 2018 U.S. midterm elections, spending on digital media campaigns rose by 2400%. 1 Political advertisers have thereby demonstrated a clear interest in taking their Abstract Online political advertising is becoming increasingly popular as political campaigns recognize the utility of social network platforms, like Facebook, for reaching and engag- ing with voters. Yet, contrary to the wealth of information about campaign advertising on TV, little is known about advertising online, as comprehensive data only recently became available to scholars. Moreover, the newly available data is often aggregated, incomplete, and imprecise. Here, we present an analysis of Facebook political ad data, supplemented with funding-related meta-data obtained through human coding and a partnership with the Center for Responsive Politics. Through computational tools— namely, network analysis—we aim to use this data to describe and categorize political ad funding behavior on Facebook. Specifically, we focus on the geographic concentra- tion of ads, and discover that most ads reach an audience in a single geographic region (i.e., U.S. state) or in a wide range of regions, and very few reach an audience spanning a small number of regions. We use this observation to partition funding entities into three groups based on their relationships to regionally-concentrated ads. We then examine the differences between these groups via bipartite networks connecting funding entities to their geographic audiences, as well as content they support. Our findings reveal that geographic impressions play an important role in online political advertising, and can be used to classify funding entities. As a result, this study repre- sents a step toward ensuring political funding transparency and demystifying online political advertising more broadly. Keywords: Political advertising, Online campaigns, Bipartite networks, Transparency in politics Open Access © The Author(s) 2021. Open Access This article is licensed under a Creative Commons Attribution 4.0 International License, which permits use, sharing, adaptation, distribution and reproduction in any medium or format, as long as you give appropriate credit to the original author(s) and the source, provide a link to the Creative Commons licence, and indicate if changes were made. The images or other third party material in this article are included in the article’s Creative Commons licence, unless indicated otherwise in a credit line to the mate- rial. If material is not included in the article’s Creative Commons licence and your intended use is not permitted by statutory regulation or exceeds the permitted use, you will need to obtain permission directly from the copyright holder. To view a copy of this licence, visit http:// creativecommons.org/licenses/by/4.0/. RESEARCH Gitomer et al. Appl Netw Sci (2021) 6:18 https://doi.org/10.1007/s41109-020-00350-7 Applied Network Science *Correspondence: [email protected] 1 Network Science Institute, Northeastern University, Boston, MA, USA Full list of author information is available at the end of the article 1 Digital spending hits record in us midterms despite restrictions. https://www.straitstimes.com/world/united-states/ digital-spending-hits-record-in-us-midterms-despite-restrictions, November 2018. Accessed 24 Aug 2020
-
Upload
khangminh22 -
Category
Documents
-
view
2 -
download
0
Transcript of Geographic impressions in Facebook political ads - Applied ...

Geographic impressions in Facebook political adsAdina Gitomer1*, Pavel V. Oleinikov2, Laura M. Baum3, Erika Franklin Fowler4 and Saray Shai5
IntroductionThe online political advertising terrain remains largely underdeveloped, especially in comparison to the large body of work describing television advertising (Ansolabehere and Iyengar 1995; Geer 2006; Franz et al. 2008; Mattes and Redlawsk 2015; Fowler et al. 2016). What is certain, however, is that online political advertising is increasingly preva-lent among campaigns and the public alike. It has been reported that digital ads have swollen, and continue to swell, in both number and spend; for instance, between the 2014 and 2018 U.S. midterm elections, spending on digital media campaigns rose by 2400%.1 Political advertisers have thereby demonstrated a clear interest in taking their
Abstract
Online political advertising is becoming increasingly popular as political campaigns recognize the utility of social network platforms, like Facebook, for reaching and engag-ing with voters. Yet, contrary to the wealth of information about campaign advertising on TV, little is known about advertising online, as comprehensive data only recently became available to scholars. Moreover, the newly available data is often aggregated, incomplete, and imprecise. Here, we present an analysis of Facebook political ad data, supplemented with funding-related meta-data obtained through human coding and a partnership with the Center for Responsive Politics. Through computational tools—namely, network analysis—we aim to use this data to describe and categorize political ad funding behavior on Facebook. Specifically, we focus on the geographic concentra-tion of ads, and discover that most ads reach an audience in a single geographic region (i.e., U.S. state) or in a wide range of regions, and very few reach an audience spanning a small number of regions. We use this observation to partition funding entities into three groups based on their relationships to regionally-concentrated ads. We then examine the differences between these groups via bipartite networks connecting funding entities to their geographic audiences, as well as content they support. Our findings reveal that geographic impressions play an important role in online political advertising, and can be used to classify funding entities. As a result, this study repre-sents a step toward ensuring political funding transparency and demystifying online political advertising more broadly.
Keywords: Political advertising, Online campaigns, Bipartite networks, Transparency in politics
Open Access
© The Author(s) 2021. Open Access This article is licensed under a Creative Commons Attribution 4.0 International License, which permits use, sharing, adaptation, distribution and reproduction in any medium or format, as long as you give appropriate credit to the original author(s) and the source, provide a link to the Creative Commons licence, and indicate if changes were made. The images or other third party material in this article are included in the article’s Creative Commons licence, unless indicated otherwise in a credit line to the mate-rial. If material is not included in the article’s Creative Commons licence and your intended use is not permitted by statutory regulation or exceeds the permitted use, you will need to obtain permission directly from the copyright holder. To view a copy of this licence, visit http://creat iveco mmons .org/licen ses/by/4.0/.
RESEARCH
Gitomer et al. Appl Netw Sci (2021) 6:18 https://doi.org/10.1007/s41109-020-00350-7 Applied Network Science
*Correspondence: [email protected] 1 Network Science Institute, Northeastern University, Boston, MA, USAFull list of author information is available at the end of the article
1 Digital spending hits record in us midterms despite restrictions. https ://www.strai tstim es.com/world /unite d-state s/digit al-spend ing-hits-recor d-in-us-midte rms-despi te-restr ictio ns, November 2018. Accessed 24 Aug 2020

Page 2 of 20Gitomer et al. Appl Netw Sci (2021) 6:18
messages online. Meanwhile, the Internet’s massive user base suggests that the reach of these ads is indeed vast (Dommett and Power 2019). For example, Facebook—the focus of this paper—reported 2.27 billion users in 2018 alone, and that figure has only gone up since (Clement 2020). Incidentally, a number of studies juxtaposing social media with more conventional media (e.g., television and newspaper) and advertising have consistently found differences with respect to both implementation strategies and pub-lic effects (Varol 2018; Kaid 2002; Kim et al. 2016; Morris and Ogan 1996). Thus, given online political advertising’s growing salience and apparent distinction, there is a strong incentive to analyze its general form and effects as a phenomenon of its own.
More specifically, concerns around transparency in political ad funding are height-ened in the online environment. Within the last decade, political advertising activity has shifted away from political action committees, and toward super PACs, 501c4 organiza-tions, and 527s (Ridout et al. 2015). The latter set of interest groups stand out because they are permitted to spend unlimited sums of money on political advertising and can often evade disclosing their contributing donors (Dowling and Wichowsky 2013; Fowler et al. 2020a). In addition, the rise of multi-issue non-membership groups (Franz et al. 2015) has meant that there are many more new, amorphous groups with unclear rela-tionships to official campaigns (Victor and Reinhardt 2018), whose names do not convey any information about where their money comes from. This has a variety of implications. For one, studies have shown that group-sponsored ads—and in particular, unknown group-sponsored ads—are extremely effective (Brooks and Murov 2012; Dowling and Wichowsky 2015; Ridout et al. 2015; Weber et al. 2012). If we consider the effective-ness of an ad, as many studies do, to be its persuasiveness (the extent to which it raises favorability toward the issue in question) minus its backlash (the extent to which it low-ers favorability toward the issue in question), this may be because group-sponsored ads can garner persuasiveness with less risk of backlash (Brooks and Murov 2012; Dowling and Wichowsky 2015). Further, if a funding group is anonymous, or simply new and unknown, consumers cannot be influenced by their preexisting perceptions of the group when evaluating their ads, which otherwise tends to be a major predictor of success in advertising. Ultimately, anonymous funding can be seen as a technique to obscure political incentives behind ads without sacrificing effectiveness, but enhancing it. This is a problem on TV, but it is an even bigger problem online, where there are even more ways that ad sponsors can present information—for example, spending across multiple pages with different names. Put differently, as we move online, the effort to make politi-cal advertising more transparent must escalate.
The arrival of online ad libraries in the summer of 2018 were a welcome development in the effort toward transparency (Leathern 2018). Citing a need for more accountability among advertisers and the platform itself, Facebook launched an archive in 2018 that stores all of the active political ads published on the site, with some additional infor-mation about them, including funder identification.2 This mainly implies that access to Facebook’s political ad data has only very recently become available to researchers. Although inaccuracies in the archive persist (Oleinikov 2020), and the set of active
2 About the ad library. https ://www.faceb ook.com/busin ess/help/24050 92116 18330 7. Accessed 24 Aug 2020.
Page 3 of 20Gitomer et al. Appl Netw Sci (2021) 6:18
ads alone hardly tells the whole story, the newly provided data represent an important opportunity to begin investigating the Facebook advertising world, and consolidating the struggle for greater transparency.
In light of all of the above, we present a data-driven approach to categorizing and char-acterizing funding behavior behind political ads on Facebook. With the overarching goal of increased donor transparency, we aim to make the set of funding entities more navi-gable by identifying meaningful ways to define and group them. Namely, we discover that describing ads according to their geographic reach provides a salient framework for thinking about the universe of advertisements, as well as the set of entities that back them.
Data and methodsOur core dataset comes from a collaboration with the Wesleyan Media Project—the leading source for tracking and analyzing digital ads and spending in real time.3 It includes nearly all of the presidential and senatorial election-related political ads posted on Facebook between October 7th, 2019 and May 18th, 2020. The ads were collected through robust keyword searches, where keywords were generated based on candidates running for senate or the presidency. A unique advertisement is represented by a numer-ical “ad ID,” and is associated with about 20 informational fields from the AWS archive hosted by Facebook, in addition to the search terms responsible for procuring the ad.
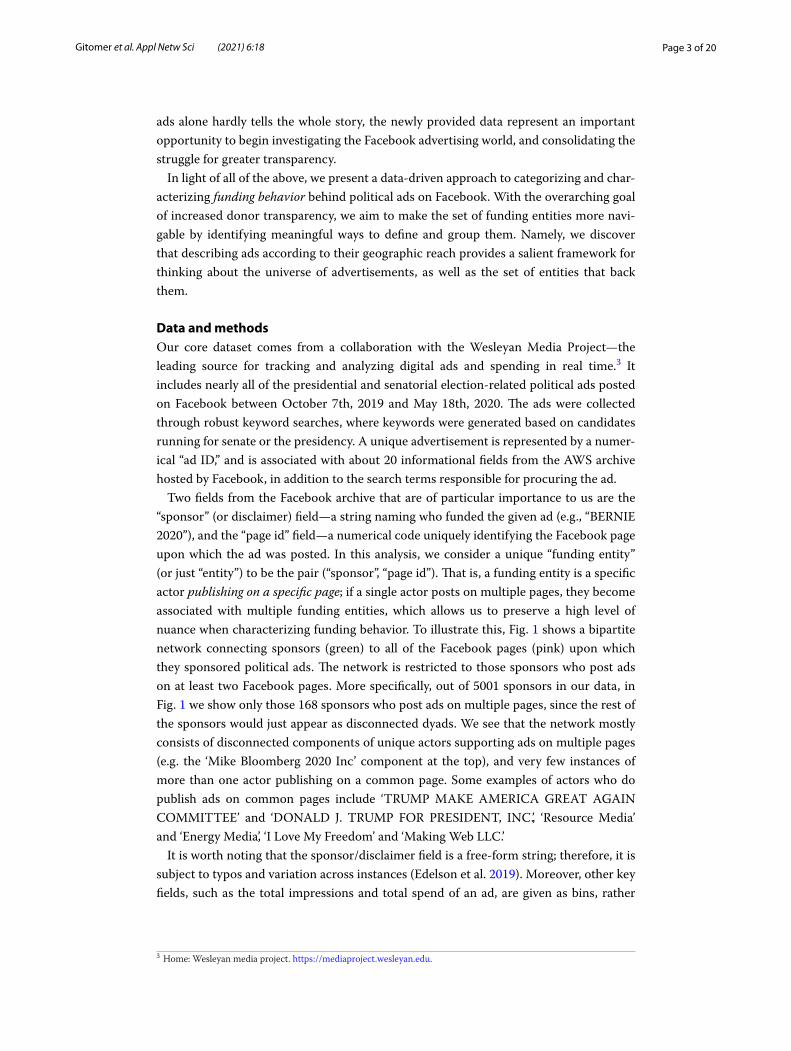
Two fields from the Facebook archive that are of particular importance to us are the “sponsor” (or disclaimer) field—a string naming who funded the given ad (e.g., “BERNIE 2020”), and the “page id” field—a numerical code uniquely identifying the Facebook page upon which the ad was posted. In this analysis, we consider a unique “funding entity” (or just “entity”) to be the pair (“sponsor”, “page id”). That is, a funding entity is a specific actor publishing on a specific page; if a single actor posts on multiple pages, they become associated with multiple funding entities, which allows us to preserve a high level of nuance when characterizing funding behavior. To illustrate this, Fig. 1 shows a bipartite network connecting sponsors (green) to all of the Facebook pages (pink) upon which they sponsored political ads. The network is restricted to those sponsors who post ads on at least two Facebook pages. More specifically, out of 5001 sponsors in our data, in Fig. 1 we show only those 168 sponsors who post ads on multiple pages, since the rest of the sponsors would just appear as disconnected dyads. We see that the network mostly consists of disconnected components of unique actors supporting ads on multiple pages (e.g. the ‘Mike Bloomberg 2020 Inc’ component at the top), and very few instances of more than one actor publishing on a common page. Some examples of actors who do publish ads on common pages include ‘TRUMP MAKE AMERICA GREAT AGAIN COMMITTEE’ and ‘DONALD J. TRUMP FOR PRESIDENT, INC.’, ‘Resource Media’ and ‘Energy Media’, ‘I Love My Freedom’ and ‘Making Web LLC.’
It is worth noting that the sponsor/disclaimer field is a free-form string; therefore, it is subject to typos and variation across instances (Edelson et al. 2019). Moreover, other key fields, such as the total impressions and total spend of an ad, are given as bins, rather
3 Home: Wesleyan media project. https ://media proje ct.wesle yan.edu.
Page 4 of 20Gitomer et al. Appl Netw Sci (2021) 6:18
than as precise values. In Fig. 2, we show the impression bin versus the spend bin for each ad. Firstly, Fig. 2 demonstrates how the bins are not only inexact, but also incongru-ent—as the numbers rise, so, too, do the bin sizes. In this work, we always use the lower bounds of these bins as the safest estimate; still, summing estimated values (e.g., to cal-culate a funding entity’s total spend) can result in large errors, especially when an entity funds a large number of low-priced ads. Figure 2 also allows us to observe that the same ad price can generate a range of impressions. This implies that other ad attributes, such as content and demographic reach, may play a role in determining how many impres-sions each dollar buys (Ali et al. 2019).
Another valuable attribute provided for each ad is the distribution of geographic regions in which users were shown the ad. More specifically, each ad is associated with a vector that maps a region to the non-zero percentage of impressions (i.e., views) that came from that region, so that the sum over all of the percentages given is 100. If a region is responsible for 0% of an ad’s impressions, it does not appear in the vector; therefore, the vector length indicates the number of regions hit by the ad. For our pur-poses, “region” is interchangeable with “U.S. state or Washington D.C..” The presence of non-state regions in our data is insignificant, but there are the occasional impressions
Fig. 1 A bipartite network connecting each sponsor (green) with all the Facebook pages (pink) on which it sponsored at least one political ad. Node size and label size are according to degree. The network only visualizes sponsors who post ads on at least two Facebook pages—that is, no dyads are included

Page 5 of 20Gitomer et al. Appl Netw Sci (2021) 6:18
from Puerto Rico and Canada. When discussing the region vector, it is important to dis-tinguish between intentional targeting and the set of users to whom the Facebook algo-rithm chooses to show the ad. Namely, the region vector does not necessarily refer to an entity’s preliminary intentions, or desire to target a specific state—it simply reveals an ad’s eventual reach. Ultimately, the region vector is relatively precise and sufficiently refined, making it a field of interest.
In conjunction with the core dataset of Facebook ads and their attributes, we also uti-lize a meta-data file with supplementary entity classification. This file is a product of a partnership with the Center for Responsive Politics—an organization that monitors and analyzes campaign donations—and the work of the Wesleyan Media Project team.4 The meta-data introduces information such as the election type that an entity is associated with (e.g., presidential, senatorial, etc.), and whether the entity represents an interest group or an official campaign. Beyond these fields and among others, the file encodes an entity’s “disclosure type,” or the extent to which it discloses its donor list: fully, par-tially, or not at all. Considering our underlying goal of funding transparency, this field is especially noteworthy. Unfortunately, a major feature of the meta-data file at large is that it is mostly blank; even though 70% of spending and 57% of ads were classified, only 22% of entities were identified [see Table 6.2 in Fowler et al. (2020b)]. After merging the core data with the meta-data, we are left with 631,816 unique ads funded by 2251 unique funding entities, which is the set our analysis will focus on.
Fig. 2 Heat map of each ad’s spend bin (x value) versus its impression bin (y value); the color bar refers to the number of ads with the corresponding (x,y) value. Notice the variant bin sizes (inter-axis and intra-axis), as well as the fact that the same spend bin can generate a number of impression bins
4 Home: Center for responsive politics. https ://www.opens ecret s.org.

Page 6 of 20Gitomer et al. Appl Netw Sci (2021) 6:18
Networks emerge as a powerful tool and central method throughout our analy-sis because they emphasize connectivity, and can draw out subsurface relationships between entities. We construct bipartite networks in particular, where funding entities always represent one set of the nodes. The significance of such networks depends on what is chosen as the second set of nodes, but in general, our bipartite networks are useful for their ability to expose entity clustering around external items, such as ad con-tent or strategy. We use network analyses to validate potential partitions, both structur-ally through network statistics, and visually through curated visualizations. In much the same vein, we employ networks to compare behavior across found partition groups.
AnalysisIn our first attempt to characterize funding behavior behind political ads on Facebook, we examine the activity levels of funding entities. In Fig. 3, we show the distribution of each entity’s total number of ads (left), estimated total spend (middle), and estimated total impressions, or number of users who were shown the ad (right). Recall that the total spend and impressions are obtained by summing the estimated lower bound for each ad (see Fig. 2 for more information). We observe that all three distributions have a heavy tail, meaning funding entities typically exhibit behavior at all scales, as opposed to groups or “types” of behavior. For instance, the complementary cumulative distribution function (CCDF) shown in the left panel indicates that entities sponsor every possible number of ads between 1 and 1,000,000, without clear boundaries as to what constitutes funding “a lot” of ads versus “a few.” Therefore, grouping entities according to the num-ber of ads they fund is untenable.
Instead, we discover a way to break up the universe of advertisements based on how concentrated they are in a singular geographic region. Recall that each ad is associ-ated with a vector that reports the percentage of impressions that came from each region (i.e., state). If the maximum percentage in the vector is 100, this means that all of the impressions came from one region, or that every user who was shown the ad is located in the same state. On the other hand, if the maximum percentage is low, this means that users from many distinct regions were shown the ad. This is justified
a distribution ofunique number of ads per funding entity
b distribution of total spend per funding entity
c distribution of total impressions per
funding entity
Fig. 3 Complementary cumulative distribution function (CCDF) of funding entities’ (a) total number of unique ads (b) estimated total spend (c) estimated total impressions. For a given x value, the CCDF is defined as the number of funding entities that, for example, spent at least x dollars on their ads in aggregate. Note that some funding entities have an estimated total spend and estimated total impressions equal to zero as a consequence of summing the lower ends of each ad’s respective bins

Page 7 of 20Gitomer et al. Appl Netw Sci (2021) 6:18
by the fact that the sum of the percentages in the vector always equals 100; hence, if the largest percentage is small, the vector must comprise many other small values in order to reach 100.
In Fig. 4a we show the extent to which ads are regionally-concentrated. Specifically, we map each ad to the maximum percentage in its region vector, and plot the distri-bution of the obtained values. We notice an interesting pattern, wherein ads are either very strongly regionally-concentrated or very weakly regionally-concentrated, with little activity in the middle. The tall bar on the right (95–100%) indicates that 259,463 ads—41%—have a very high maximum region percentage, meaning they are chiefly viewed in a singular region. In contrast, the 3 tallest bars on the left (5–10%, 10–15%, 15–20%) collectively reveal that 278,776 ads—44%—have a very small maximum region percent-age, meaning they are not significantly concentrated in any one region. Putting these two facts together, we get that only 15% of ads manifest something in between regional con-centration and regional dispersion.
The same pattern arises when we plot the total spend on ads per maximum percentage bin (Fig. 4c), as well as the total impressions received by ads per maximum percentage bin (Fig. 4d). For example, the last bar in Fig. 4c indicates that over 50 million dollars were spent on ads with a maximum region percentage between 95 and 100. Similarly, in
a number of of ads per max percentage bin
c total spend per max percentage bin d total impressions per max percentage bin
b number of of ads per number of regions bin
Fig. 4 Each ad is mapped to the ‘maximum percentage’ from its region vector, indicating how regionally-concentrated it is. If the max percentage is close to 100, it means that almost all impressions came from one region, while if it’s close to 0, it means that many regions impressed upon the ad. a Histogram of max percentage per ad; inset: zoom-in on the last bin showing that most ads in this bin get 100% of their impressions from one region. b Histogram of the number of regions that impressed upon the ad. c Histogram of the amount of estimated dollars spent on an ad versus its max percentage value. d Histogram of the estimated number of users who were shown an ad versus its max percentage value

Page 8 of 20Gitomer et al. Appl Netw Sci (2021) 6:18
Fig. 4b we observe that the number of unique regions from which ads gain impressions is typically either large (i.e., close to 50) or small (i.e., close to 1), with very few ads in between (e.g., only 3052 ads get impressions from 20 distinct regions).5
Drawing on the results above, we define an ad to be regionally-dominated if it receives ≥99% of its impressions from a singular region. Intuitively then, a regionally-dominated ad is an ad that is only seen in one state (or D.C.). Figure 4 reveals that 35% of the ads in our dataset are regionally-dominated, with at least $53,058,600 invested in them, and at least 3,164,925,000 users having viewed them. We observe very similar behavior when we use the Gini coefficient of the region vector instead of the maximum percentage defined above (see Section 2 in the Additional file 1).
Next, we consider funding entities’ relationships to regionally-dominated ads. In Fig. 5, we show the distribution of percentages of regionally-dominated ads per funding entity. We observe that 676 entities (30%) have 0% (none) of their ads regionally-dominated, 762 entities (36%) have at least 99% of their ads regionally-dominated, and the remain-ing 813 entities (34%) fall somewhere in between. Thus, a partition emerges, splitting the entities into three respective groups: the “Non-Regional group,” the “Partially-Regional group,” and the “Regional group.”
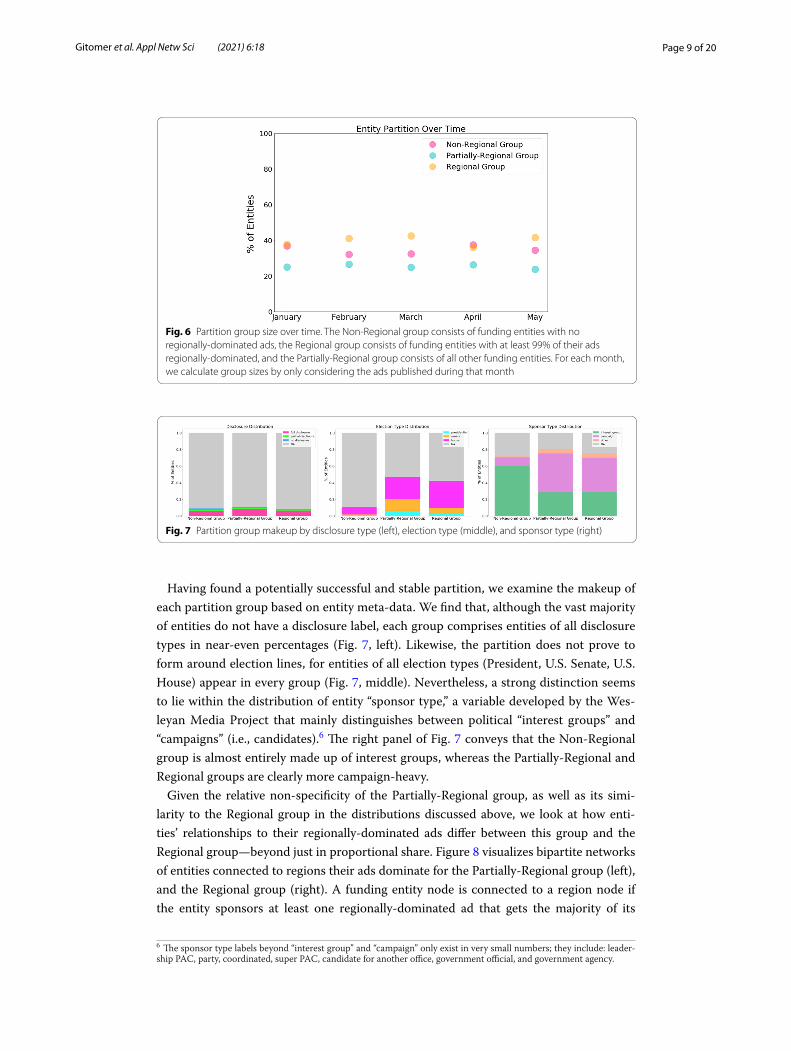
The marked evenness of this partition is somewhat surprising, especially when not-ing that gender-dominated ads and age-dominated ads do not yield similar results. To clarify, every ad in our dataset is also associated with an age range (13–24, 25–44, 45–64, 65+) and gender (“male,” “female,” “unknown”) vector, which functions similarly to the region vector. When trying to partition funding entities based on their percentage of age-dominated ads (that is, at least 99% of the impressions came from one age group) and their percentage of gender-dominated ads (that is, at least 99% of impressions came from one gender group), we find that 87% of entities have 0 of the former, and 78% have 0 of the latter. See section 1 of the Additional file 1 for further elaboration on the distinc-tion between regional, age-based, and gendered impressions. What’s more, the region-based partition is remarkably stable over time, as demonstrated in Fig. 6.
Fig. 5 Distribution of the percentage of regionally-dominated ads per funding entity
5 Keep in mind that a percentage in the region vector can be extremely small, so there may be regions counted in this measure that do not necessarily supply serious engagement.
Page 9 of 20Gitomer et al. Appl Netw Sci (2021) 6:18
Having found a potentially successful and stable partition, we examine the makeup of each partition group based on entity meta-data. We find that, although the vast majority of entities do not have a disclosure label, each group comprises entities of all disclosure types in near-even percentages (Fig. 7, left). Likewise, the partition does not prove to form around election lines, for entities of all election types (President, U.S. Senate, U.S. House) appear in every group (Fig. 7, middle). Nevertheless, a strong distinction seems to lie within the distribution of entity “sponsor type,” a variable developed by the Wes-leyan Media Project that mainly distinguishes between political “interest groups” and “campaigns” (i.e., candidates).6 The right panel of Fig. 7 conveys that the Non-Regional group is almost entirely made up of interest groups, whereas the Partially-Regional and Regional groups are clearly more campaign-heavy.
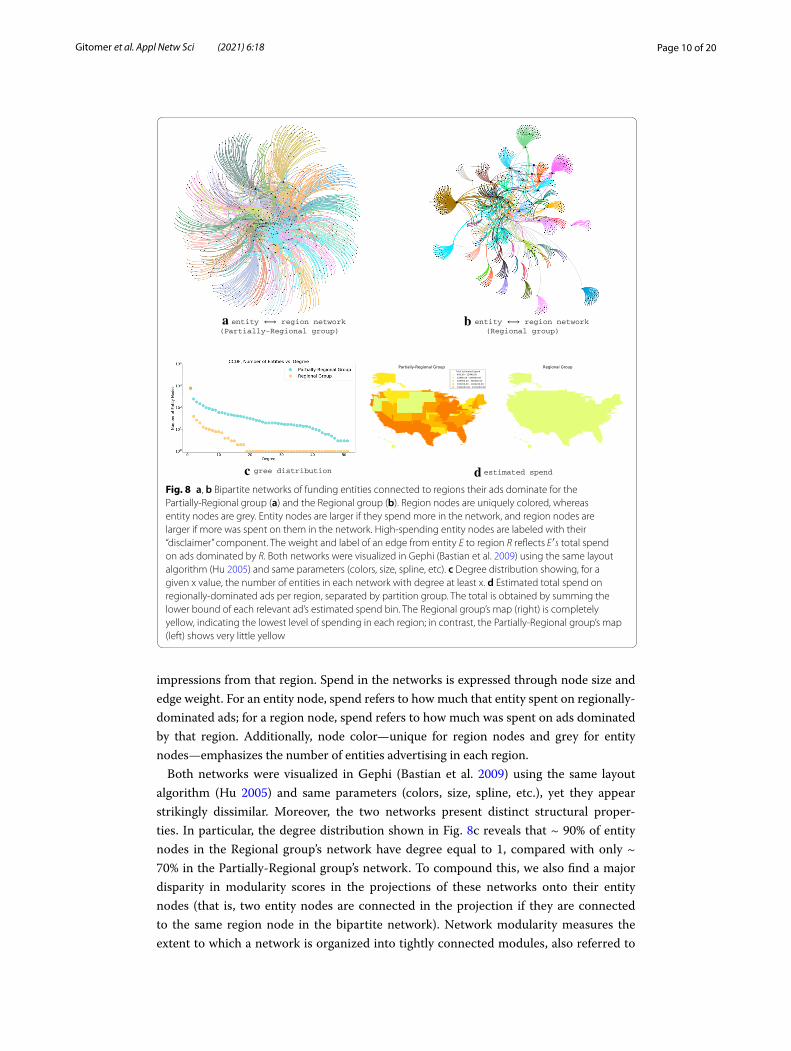
Given the relative non-specificity of the Partially-Regional group, as well as its simi-larity to the Regional group in the distributions discussed above, we look at how enti-ties’ relationships to their regionally-dominated ads differ between this group and the Regional group—beyond just in proportional share. Figure 8 visualizes bipartite networks of entities connected to regions their ads dominate for the Partially-Regional group (left), and the Regional group (right). A funding entity node is connected to a region node if the entity sponsors at least one regionally-dominated ad that gets the majority of its
Fig. 6 Partition group size over time. The Non-Regional group consists of funding entities with no regionally-dominated ads, the Regional group consists of funding entities with at least 99% of their ads regionally-dominated, and the Partially-Regional group consists of all other funding entities. For each month, we calculate group sizes by only considering the ads published during that month
Fig. 7 Partition group makeup by disclosure type (left), election type (middle), and sponsor type (right)
6 The sponsor type labels beyond “interest group” and “campaign” only exist in very small numbers; they include: leader-ship PAC, party, coordinated, super PAC, candidate for another office, government official, and government agency.
Page 10 of 20Gitomer et al. Appl Netw Sci (2021) 6:18
impressions from that region. Spend in the networks is expressed through node size and edge weight. For an entity node, spend refers to how much that entity spent on regionally-dominated ads; for a region node, spend refers to how much was spent on ads dominated by that region. Additionally, node color—unique for region nodes and grey for entity nodes—emphasizes the number of entities advertising in each region.
Both networks were visualized in Gephi (Bastian et al. 2009) using the same layout algorithm (Hu 2005) and same parameters (colors, size, spline, etc.), yet they appear strikingly dissimilar. Moreover, the two networks present distinct structural proper-ties. In particular, the degree distribution shown in Fig. 8c reveals that ~ 90% of entity nodes in the Regional group’s network have degree equal to 1, compared with only ~ 70% in the Partially-Regional group’s network. To compound this, we also find a major disparity in modularity scores in the projections of these networks onto their entity nodes (that is, two entity nodes are connected in the projection if they are connected to the same region node in the bipartite network). Network modularity measures the extent to which a network is organized into tightly connected modules, also referred to
New Hampshire
South Carolina
Iowa
Illinois
Georgia
Nevada
California
Virginia
Massachusetts
West Virginia
Pennsylvania
North Carolina
Washington, District of Columbia
Texas
New York
Indiana
WashingtonOhio
Mississippi
Rhode Island
New Jersey
Florida
Minnesota
Colorado
Michigan
Wisconsin
Arizona
Kentucky
Oklahoma
Arkansas
Missouri
Maryland
Connecticut
Alabama
Kansas
Maine
Tennessee
Oregon
Delaware
South Dakota
Utah
Vermont
Alaska
Idaho
New Mexico
Louisiana
Nebraska
Wyoming
North Dakota
Montana
Hawaii
BERNIE 2020
TOM STEYER 2020
Mike Bloomberg 2020 Inc
Iowa
North Carolina
New Hampshire
South Carolina
Mississippi
Massachusetts
New York
Kentucky
Arkansas
New Jersey
Illinois
Alabama
Florida
Pennsylvania
Washington
California
Minnesota
Colorado
Louisiana
Nebraska
Maryland
Michigan
Missouri
Washington, District of Columbia
Wisconsin
Virginia
North DakotaTennessee
South Dakota
Vermont
Georgia
Indiana
Connecticut
Ohio
West Virginia
Delaware
Rhode Island
Maine
New Mexico
Wyoming
Oregon
Kansas
Nevada
Utah
Oklahoma
Arizona
Texas
Hawaii
Idaho
Alaska
Montana
Priorities USA
Priorities USA
UNITE THE COUNTRY
AMERICANS FOR PROSPERITY ACTIO...
Mike Bloomberg 2020 Inc
Mike Bloomberg 2020 Inc
Mike Bloomberg 2020 Inc
Everytown for Gun Safety Actio...
Priorities USA Action. 202-455...
Priorities USA Action. 202-455...
Priorities USA and Majority Fo...
Priorities USA and Majority Fo...
entity region network (Partially-Regional group)
entity region network (Regional group)
gree distribution estimated spend
a b
c dFig. 8 a, b Bipartite networks of funding entities connected to regions their ads dominate for the Partially-Regional group (a) and the Regional group (b). Region nodes are uniquely colored, whereas entity nodes are grey. Entity nodes are larger if they spend more in the network, and region nodes are larger if more was spent on them in the network. High-spending entity nodes are labeled with their “disclaimer” component. The weight and label of an edge from entity E to region R reflects E ′s total spend on ads dominated by R. Both networks were visualized in Gephi (Bastian et al. 2009) using the same layout algorithm (Hu 2005) and same parameters (colors, size, spline, etc). c Degree distribution showing, for a given x value, the number of entities in each network with degree at least x. d Estimated total spend on regionally-dominated ads per region, separated by partition group. The total is obtained by summing the lower bound of each relevant ad’s estimated spend bin. The Regional group’s map (right) is completely yellow, indicating the lowest level of spending in each region; in contrast, the Partially-Regional group’s map (left) shows very little yellow
Page 11 of 20Gitomer et al. Appl Netw Sci (2021) 6:18
as communities (Newman 2006). Using the Clauset–Newman–Moore greedy modular-ity maximization algorithm (Clauset et al. 2004) to extract communities, we obtain 6 communities with a modularity score of .17 in the Partially-Regional group’s network (Fig. 8a), and 13 communities with a modularity score of .63 in the Regional group’s network (Fig. 8b). In other words, the Regional group network has a significantly larger modularity score, or more strongly defined community structure, which is exactly what one would expect from just looking at the visualizations. Overall then, entities in the Regional group are more likely than those in the Partially-Regional group to have all of their regionally-dominated ads concentrated in one particular region, as opposed to many. At the same time, despite individually investing in a wider set of regions, the enti-ties in the Partially-Regional group outspend the entities in the Regional group in almost every single region, as can be seen in the maps in Fig. 8d.
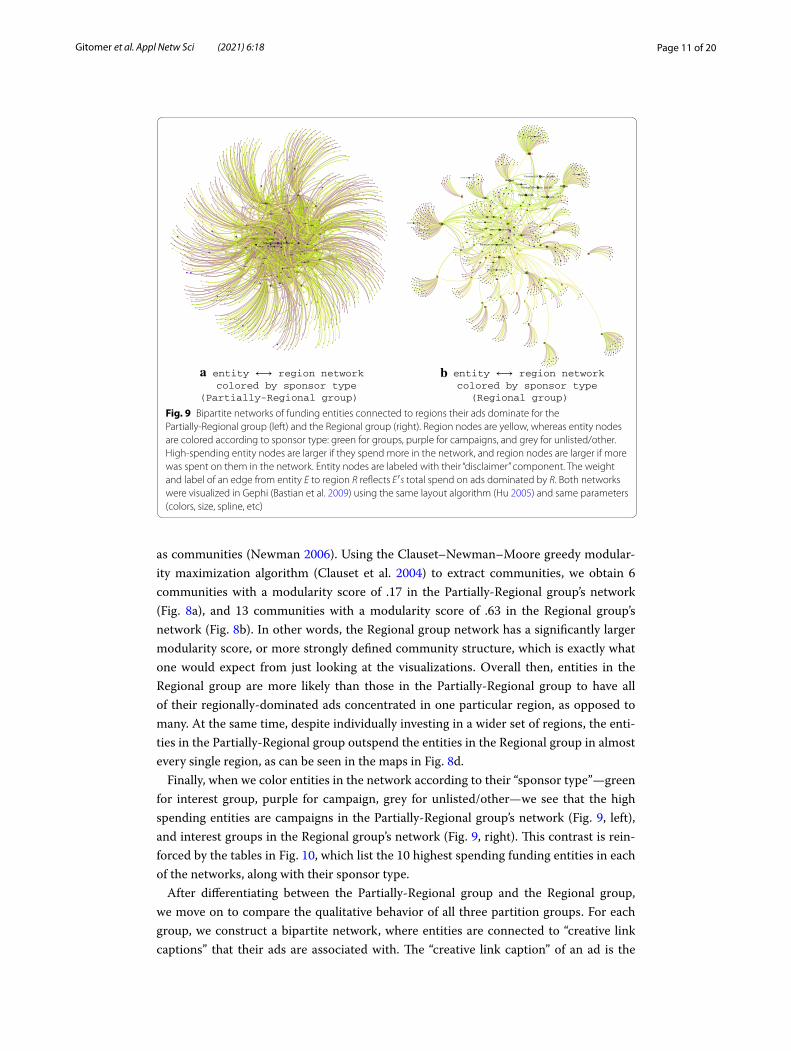
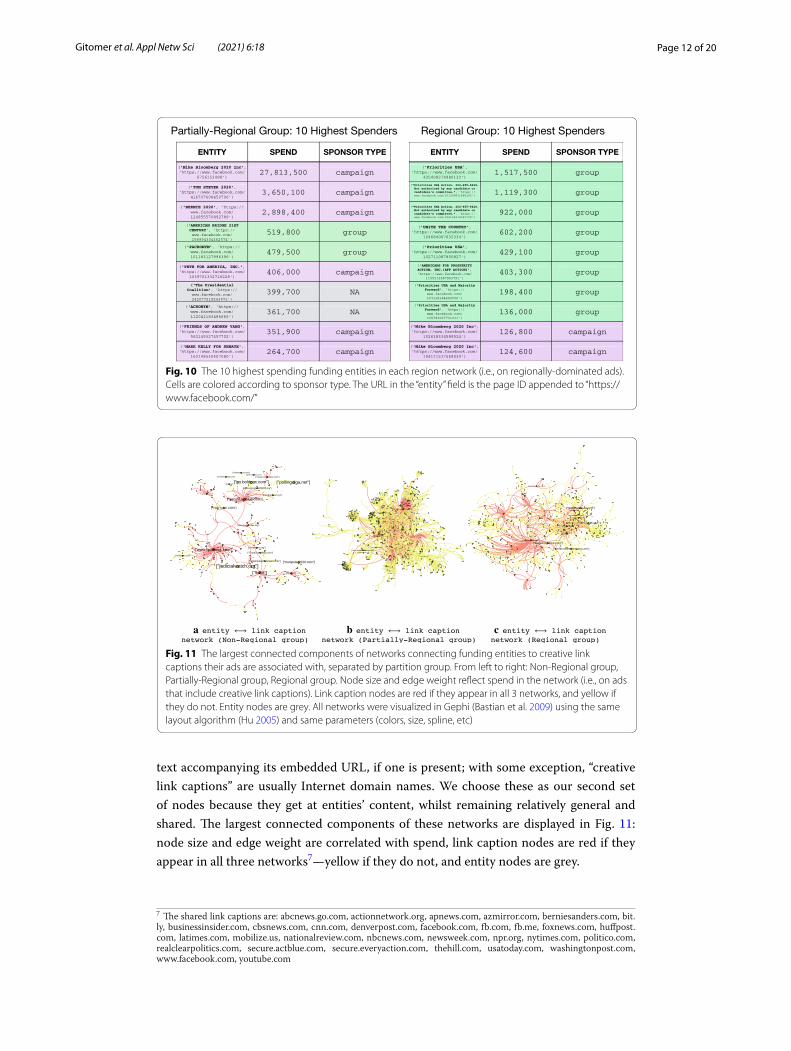
Finally, when we color entities in the network according to their “sponsor type”—green for interest group, purple for campaign, grey for unlisted/other—we see that the high spending entities are campaigns in the Partially-Regional group’s network (Fig. 9, left), and interest groups in the Regional group’s network (Fig. 9, right). This contrast is rein-forced by the tables in Fig. 10, which list the 10 highest spending funding entities in each of the networks, along with their sponsor type.
After differentiating between the Partially-Regional group and the Regional group, we move on to compare the qualitative behavior of all three partition groups. For each group, we construct a bipartite network, where entities are connected to “creative link captions” that their ads are associated with. The “creative link caption” of an ad is the
New Hampshire
South Carolina
Iowa
Illinois
Georgia
Nevada
California
Virginia
Massachusetts
West Virginia
Pennsylvania
North Carolina
Washington, District of Columbia
Texas
New York
Indiana
WashingtonOhio
Mississippi
Rhode Island
New Jersey
Florida
Minnesota
Colorado
Michigan
Wisconsin
Arizona
Kentucky
Oklahoma
Arkansas
Missouri
Maryland
Connecticut
Alabama
Kansas
Maine
Tennessee
Oregon
Delaware
South Dakota
Utah
Vermont
Alaska
Idaho
New Mexico
Louisiana
Nebraska
Wyoming
North Dakota
Montana
Hawaii
BERNIE 2020
TOM STEYER 2020
Mike Bloomberg 2020 Inc
entity region network colored by sponsor type
(Partially-Regional group)
Iowa
North Carolina
New Hampshire
South Carolina
Mississippi
Massachusetts
New York
Kentucky
Arkansas
New Jersey
Illinois
Alabama
Florida
Pennsylvania
Washington
California
Minnesota
Colorado
Louisiana
Nebraska
Maryland
Michigan
Missouri
Washington, District of Columbia
Wisconsin
Virginia
North DakotaTennessee
South Dakota
Vermont
Georgia
Indiana
Connecticut
Ohio
West Virginia
Delaware
Rhode Island
Maine
New Mexico
Wyoming
Oregon
Kansas
Nevada
Utah
Oklahoma
Arizona
Texas
Hawaii
Idaho
Alaska
Montana
Priorities USA
Priorities USA
UNITE THE COUNTRY
AMERICANS FOR PROSPERITY ACTIO...
Mike Bloomberg 2020 Inc
Mike Bloomberg 2020 Inc
Mike Bloomberg 2020 Inc
Everytown for Gun Safety Actio...
Priorities USA Action. 202-455...
Priorities USA Action. 202-455...
Priorities USA and Majority Fo...
Priorities USA and Majority Fo...
entity region network colored by sponsor type
(Regional group)
a b
Fig. 9 Bipartite networks of funding entities connected to regions their ads dominate for the Partially-Regional group (left) and the Regional group (right). Region nodes are yellow, whereas entity nodes are colored according to sponsor type: green for groups, purple for campaigns, and grey for unlisted/other. High-spending entity nodes are larger if they spend more in the network, and region nodes are larger if more was spent on them in the network. Entity nodes are labeled with their “disclaimer” component. The weight and label of an edge from entity E to region R reflects E ′s total spend on ads dominated by R. Both networks were visualized in Gephi (Bastian et al. 2009) using the same layout algorithm (Hu 2005) and same parameters (colors, size, spline, etc)
Page 12 of 20Gitomer et al. Appl Netw Sci (2021) 6:18
text accompanying its embedded URL, if one is present; with some exception, “creative link captions” are usually Internet domain names. We choose these as our second set of nodes because they get at entities’ content, whilst remaining relatively general and shared. The largest connected components of these networks are displayed in Fig. 11: node size and edge weight are correlated with spend, link caption nodes are red if they appear in all three networks7—yellow if they do not, and entity nodes are grey.
ENTITY SPEND SPONSOR TYPE
('Mike Bloomberg 2020 Inc', 'https://www.facebook.com/
6756153498')27,813,500 campaign
('TOM STEYER 2020', 'https://www.facebook.com/
416707608450706')3,650,100 campaign
('BERNIE 2020', 'https://www.facebook.com/124955570892789')
2,898,400 campaign
('AMERICAN BRIDGE 21ST CENTURY', 'https://www.facebook.com/156994304362574')
519,800 group
('PACRONYM', 'https://www.facebook.com/101183127996396')
479,500 group
('PETE FOR AMERICA, INC.', 'https://www.facebook.com/
1039701332716228')406,000 campaign
('The Presidential Coalition', 'https://www.facebook.com/242077219243971')
399,700 NA
('ACRONYM', 'https://www.facebook.com/112041183486666')
361,700 NA
('FRIENDS OF ANDREW YANG', 'https://www.facebook.com/
562149327457702')351,900 campaign
('MARK KELLY FOR SENATE', 'https://www.facebook.com/
163148530407080')264,700 campaign
ENTITY SPEND SPONSOR TYPE
( , 'https://www.facebook.com/
425408274980132')1,517,500 group
("Priorities USA Action. 202-455-8428. Not authorized by any candidate or candidate's committee.", 'https://www.facebook.com/101359811498192')
1,119,300 group
("Priorities USA Action. 202-455-8428. Not authorized by any candidate or candidate's committee.", 'https://www.facebook.com/106158314342739')
922,000 group
('UNITE THE COUNTRY', 'https://www.facebook.com/
104684067632334')602,200 group
('Priorities USA', 'https://www.facebook.com/
102711087850827')429,100 group
('AMERICANS FOR PROSPERITY ACTION, INC.(AFP ACTION)', 'https://www.facebook.com/
1155212867963791')
403,300 group
('Priorities USA and Majority Forward', 'https://www.facebook.com/107118184262556')
198,400 group
('Priorities USA and Majority Forward', 'https://www.facebook.com/105783027731211')
136,000 group
('Mike Bloomberg 2020 Inc', 'https://www.facebook.com/
102618334589524')126,800 campaign
('Mike Bloomberg 2020 Inc', 'https://www.facebook.com/
106111517569034')124,600 campaign
Regional Group: 10 Highest SpendersPartially-Regional Group: 10 Highest Spenders
Fig. 10 The 10 highest spending funding entities in each region network (i.e., on regionally-dominated ads). Cells are colored according to sponsor type. The URL in the “entity” field is the page ID appended to “https://www.facebook.com/”
ba c
Fig. 11 The largest connected components of networks connecting funding entities to creative link captions their ads are associated with, separated by partition group. From left to right: Non-Regional group, Partially-Regional group, Regional group. Node size and edge weight reflect spend in the network (i.e., on ads that include creative link captions). Link caption nodes are red if they appear in all 3 networks, and yellow if they do not. Entity nodes are grey. All networks were visualized in Gephi (Bastian et al. 2009) using the same layout algorithm (Hu 2005) and same parameters (colors, size, spline, etc)
7 The shared link captions are: abcnews.go.com, actionnetwork.org, apnews.com, azmirror.com, berniesanders.com, bit.ly, businessinsider.com, cbsnews.com, cnn.com, denverpost.com, facebook.com, fb.com, fb.me, foxnews.com, huffpost.com, latimes.com, mobilize.us, nationalreview.com, nbcnews.com, newsweek.com, npr.org, nytimes.com, politico.com, realclearpolitics.com, secure.actblue.com, secure.everyaction.com, thehill.com, usatoday.com, washingtonpost.com, www.facebook.com, youtube.com

Page 13 of 20Gitomer et al. Appl Netw Sci (2021) 6:18
Again, all three networks look remarkably different, despite identical visualization processes. In the Non-Regional group’s network, entity nodes tend to cluster around link caption nodes, while the opposite is true in the Partially-Regional group’s network. Meanwhile, entities in the Regional group’s network exhibit a balanced mix of both clus-tering habits. This characterization is partially substantiated by the ratio of entity nodes to link caption nodes in each network—55:45 in the Non-Regional group, 22:78 in the Partially-Regional group, and 39:61 in the Regional group. Moreover, a similar relation-ship between partition groups emerges in the sponsor type distributions of each net-work’s 10 highest spending entities. That is, the Non-Regional group’s highest spenders are predominantly interest groups (80%), the Partially-Regional group’s highest spend-ers are predominantly campaigns (90%), and the Regional group’s highest spenders are evenly split between the two types. In addition, the net worth of each network8, or the total spend over all of the link caption nodes, varies dramatically across groups. We have $1,061,100 in the Non-Regional group, $99,432,000 in the Partially-Regional group, and $4,160,500 in the Regional group—yet another measure that places the Regional group in the middle.
To begin inspecting content-based distinctions, we identify the prominent link cap-tions in each network. The table in Fig. 12 lists the 5 creative link captions with the high-est degree from each network, as well as their degree and spend. The variant rankings of “secure.actblue.com” and “secure.winred.com”—the donation sites for the Democratic and Republican parties, respectively—suggest disparate partisan makeup among the three partition groups, and hence disparate content output.9
Our concluding set of results continue to investigate the way content interacts with regional strategy, but with a slightly different angle. Our main goal in this segment is
CREATIVE LINK
CAPTIONDEGREE SPEND
"www.facebook.com" 60 82,300
"secure.actblue.com" 35 65,800
"fb.me"16 91,900
"youtube.com" 4 7,100
"fb.com"9 19,000
CREATIVE LINK
CAPTIONDEGREE SPEND
"secure.actblue.com" 153 19,196,800
"www.facebook.com" 109 165,900
"secure.winred.com" 70 2,719,800
"fb.me"55 170,700
"youtube.com" 32 5,100
CREATIVE LINK
CAPTIONDEGREE SPEND
"www.facebook.com" 75 100,900
"secure.winred.com" 42 36,700
"fb.me"33 43,100
"youtube.com" 27 1,700
"secure.actblue.com" 17 3,100
Non-Regional Group Partially-Regional Group Regional Group
Fig. 12 The 5 creative link caption nodes with the highest degree in each network, along with their degree and spend
9 “secure.winred.com” is present among entities in the Non-Regional group, but it does not appear in the largest con-nected component. Instead, it makes up its own isolated component, with 8 entity neighbors, and a total spend of $43,000.
8 The idea of the “net worth” of a “network” should probably go viral.

Page 14 of 20Gitomer et al. Appl Netw Sci (2021) 6:18
to consider the extent to which an ad’s content is correlated with its regional behavior, or whether or not it is regionally-dominated. Included in our data is a string repre-senting each ad’s “creative body,” or its central text. Often, funding entities reproduce multiple instances of the same ad text—that is, they publish multiple unique ad IDs with the exact same creative body string, but potentially other differences (e.g., with respect to spend, audience, attached image, etc.). To explore how such text equiva-lency relates to regionally-dominated ads versus non-regionally-dominated ads, we hone in on entities in the Partially-Regional group, for they sponsor ads of both sorts. More specifically, we look at their distribution of regionally-dominated ads and non-regionally-dominated ads per recycled ad text. As Fig. 13a shows, it is most common for all versions of the same ad text to be either regionally-dominated (100% on the x-axis) or not (0% on the x-axis). Generally, however, a repeat ad text in the Partially-Regional group has a 45% chance of having no regionally-dominated instances, a 26% chance of having entirely regionally-dominated instances, and a 29% chance of having mixed instances. These numbers change quite a bit when we consider interest groups and campaigns independently (see Fig. 13c, d). We find that groups have a 65% chance of having 0 regionally-dominated versions for a given text, whereas campaigns only have a 37% chance. Beyond that, 16% of interest groups’ recycled texts—compared
a percentage of regionally-dominated ads for ad texts with multiple versions, or associated ad IDs.
b number of distinct regions dominated for ad texts with at least
1 regionally-dominating version.
c same as (a) but for ads sponsored by interest groups only
d same as (a) but for ads sponsored by candidate campaigns only
Fig. 13 a Number of ad duplicates (with the exact same creative body) versus the percentage of duplicates that are regionally-dominated (that is, they receive at least 99% of their impressions from one region). b Number of regions dominated across all regionally-dominated ads with the same text, for ad texts with only regionally-dominated versions (top) and some regionally-dominated versions (bottom). c Same as in a, but only for ads sponsored by interest groups. d Same as in a, but only for ads sponsored by candidate campaigns

Page 15 of 20Gitomer et al. Appl Netw Sci (2021) 6:18
with 34% of campaigns’ recycled texts—are associated with both regionally-domi-nated and non-regionally-dominated versions. Further, upon examining the number of distinct regions dominated by a specific text across all funding entities, we see that one text is typically reserved for one region alone (Fig. 13b). At the same time, this is 21% more likely if the ad text has exclusively regionally-dominated versions, rather than a mix (Fig. 13b, top vs. bottom).
A case study of the entity “(’FRIENDS OF ANDREW YANG’, ’https://www.facebook.com/562149327457702’)” and their recycled ad texts confirms the above phenomena. Note that the entity in question represents a presidential campaign, and has 47% of their ads regionally-dominated. Figure 14a visualizes a network where unique ad IDs are con-nected to the unique ad text they contain. Blue nodes represent non-regionally-dom-inated ads, and red nodes represent regionally-dominated ads; ad text nodes are grey, and sized according to the number of distinct regions they dominate. For ease of expla-nation, we will refer to an ad text and its neighbors as a “flower.” In the given network, there are 70 blue flowers (that is, 70 unique ad texts with only non-regionally-dominated versions), 48 mixed flowers (that is, 48 unique ad texts with both regionally-dominated and non-regionally-dominated versions), and 98 red flowers (that is, 98 unique ad texts with only regionally-dominated versions). The red flowers shown only ever dominate in one region, while a handful of mixed flowers dominate in multiple regions. To be clear, this is non-trivial—there is nothing preventing a red flower from being dominated by multiple regions. Figure 14b exemplifies this trend by offering a close-up of two salient flowers—one mixed and one red-only—along with their associated text. The red flower is concentrated in Iowa, and is about participating in the Iowa caucus; the mixed flower dominates three distinct regions, and is meant for fundraising purposes.
a b
Fig. 14 a Network of “flowers” connecting each unique ad text (i.e., a flower’s center node) with all of the ads that use that exact text as their creative body. The ad text instances/associated ad IDs (petal nodes) are colored based on whether or not they are regionally-dominated: nodes representing regionally-dominated ads ( ≥99% of impressions come from one region) are red, and nodes representing non-regionally-dominated ads are blue. b Zoom-in on two flowers, one containing regionally-dominated ads only (right), and one containing both regionally-dominated and non-regionally-dominated ads (left). The text at the top is the ad text associated with the flower center, and thus every ad ID node connected to it
Page 16 of 20Gitomer et al. Appl Netw Sci (2021) 6:18
The fundraising-oriented text of the mixed flower displayed in Fig. 14b leads us to question how fundraising figures into regional behavior more broadly. At a first pass, we designate ads to be about fundraising if they have “secure.actblue.com” or “secure.winred.com” as their creative link caption. Surely, we miss some fundraising ads through this measure, but it is also unlikely to turn up false positives. We discover that out of every such fundraising ad that the Partially-Regional group publishes, 41% would be part of a blue flower, 56% would be part of a mixed flower, 2% would be part of a red flower, and 1% would not be part of a flower at all because their ad text is one of a kind. In other words, a fundraising ad (by our definition) is most likely to share ad text with both regionally-dominated and non-regionally dominated versions, and least likely to share ad text with exclusively regionally-dominated versions.
DiscussionGiven the tendency of funding entities in our data to demonstrate a range of behaviors, rather than discrete groups of behaviors, our findings related to the regional distribution of ads and the entity partition they prompt are noteworthy. Yet, they are also notewor-thy in and of themselves. The emergence of “regionally-dominated” ads, for example, is simultaneously salient in the data, and understandable on a practical level. That is, some ads are only seen in one region, intentionally or otherwise. While we can’t directly com-ment on the intentions of entities, as noted earlier, it is reasonable to assume that most regionally-dominated ads are indeed meant for an audience in the region they dominate. This is especially reasonable knowing that, upon purchasing an ad, entities can request for it to circulate in specific regions.10 In any case, the partition over all entities based on their relationships to regionally-dominated ads is extremely useful. For one, it provides an intuitive framework for thinking about the universe of entities through their interest in particular regions, and the scope of their audiences. This works to accentuate strategic and positional differences between sets of entities. Additionally, the partition allows us to split up the 2251 entities into three clean and meaningful groups, thus making the data “smaller” and more manageable to navigate and analyze.
It certainly would have been compelling to have been able to draw this partition along disclosure type lines, and identify a way to predict non-disclosure funding enti-ties. Instead, our results suggest equal amounts of each disclosure type in every parti-tion group, making every group of interest as far as transparency is concerned. At the same time, the strongest result from the disclosure type distributions is perhaps the dearth of disclosure labels in the meta-data; ultimately, little can be drawn from our dis-closure information, since it only exists in trace amounts. Election type likewise does not strongly correlate with partition groups, although one might expect that some races are regionally-concentrated (or at least more regionally-concentrated than others). The sponsor type distributions hence provide our only partial distinction, by showing a sig-nificant concentration of interest group entities in the Non-Regional group, and not in the others. On the upside, interest groups comprise precisely those actors capable of evasively hiding their donor lists, so it is helpful to know where to find them.
10 Facebook for business, ad targeting. https ://www.faceb ook.com/busin ess/ads/ad-targe ting.
Page 17 of 20Gitomer et al. Appl Netw Sci (2021) 6:18
While the difference between the Non-Regional group and the Regional group is quite obvious (no regionally-dominated ads vs. all regionally-dominated ads), the difference between the Regional group and the Partially-Regional group is less clear. However, when we construct networks for each of these groups, connecting funding entities to regions their ads regionally dominate, we encounter divergent structures. Through degree distri-butions and modularity assessments, we find that entities in the Partially-Regional group are significantly more likely than entities in the Regional group to concentrate their ads in more than one region. This implies that entities in the Regional group most frequently produce regionally-dominated ads because they have a genuine interest in some region, while entities in the Partially-Regional group use regionally-dominated ads as a strategic method. Consequently, we can confidently distinguish between the Regional group and the Partially-Regional group. In addition, we can conclude that regionally-dominated ads may serve a number of purposes.
Having validated our discovered entity partition extensively, we proceed to explore the qualitative differences between its three groups. In assembling networks separated by partition group, where funding entities are connected to their creative link captions, we observe multiple patterns and points of contrast, visually and beyond. Importantly, by taking the net worth of each network, we confirm that our biggest players/highest spenders lie within the Partially-Regional group. We also see that, by many measures, the Regional group falls in between the Non-Regional group and the Partially-Regional group. On the contrary, one might expect to see the Partially-Regional group play that role, since entities in this group sample strategies from the other two. The reasons driv-ing this phenomenon deserve further scrutiny. Encouragingly, our investigation of each network’s most popular creative link captions reveals varying partisan leanings between partition groups. This indicates content-based distinctions between the groups, and marks the beginning of the search for more (Conover et al. 2011). Moreover, it reinforces the integrity of the partition, along with our choice to study it.
Finally, we hone in on entities in the Partially-Regional group in order to explore how the presence of regionally-dominated ads interacts with messaging. Although there is still uncertainty around the precise relationship between an ad’s regional concentration and its content, our results offer important insight. First, in line with previous findings, we see that regionally-dominated ads are used in various ways: broadly speaking, some are organized around a specific text, and others are not. We find that this is dependent, to an extent, on whether the funding entity behind a given text represents a group or a campaign; for example, campaigns are 15% more likely than groups to publish an ad text with a mixture of regionally-dominated and non-regionally-dominated versions. Still, among themselves, both groups and campaigns publish more texts with mixed regional behavior than texts with regionally-dominating behavior only. The scenarios wherein specific texts exclusively exhibit regionally-dominating behavior suggest that certain content is simply meant for a regional audience. To go even further, the fact that only one distinct region is typically dominated in such instances implies that certain con-tent is not just meant for a regional audience, but for a particular regional audience. On the flipside, when regional behavior is not organized around text—that is, when some text has both regionally-dominated and non-regionally-dominated versions—we are poised to conclude that regional concentration is being used for strategic ends. This is

Page 18 of 20Gitomer et al. Appl Netw Sci (2021) 6:18
substantiated by the increased likelihood for such texts to reach multiple regions, as well as the discovery that ads linking to fundraising sites (i.e., ads that inherently center strat-egy) in the Partially-Regional group are most commonly associated with such texts, and least commonly associated with those with regionally-dominating behavior only.
It is crucial to point out that the content analysis here bases content similarity on string equality, meaning one divergent punctuation mark is enough to register two ad texts as dissimilar. Therefore, it is possible that two very similar yet non-equal texts are fed to two distinct regions, which adds nuance to the finding that some regional-con-centration is organized around specific text. Put another way, we may say that unique strings of text are reserved for unique regions, but we may not go as far as to say that unique messages or ideas are reserved for unique regions. In fact, empirical observation of select entities’ recycled ad texts supports the opposite claim, as does the known exist-ence of alpha/beta testing in advertising (Ridout 2014). Thus, while our results highlight useful trends, as outlined above, subtle differences between textual messaging remains an underdeveloped area of interest.
Conclusions and future workWhile much remains to be learned about political advertisements on Facebook, and in particular, how they are funded, this study makes important headway. Most signifi-cantly, we discover a hard-to-come-by partition over all of the funding entities, dividing them into three near-equal groups. Because the partition distinguishes between entities based on their relationships to regionally-dominated ads, or the extent to which their advertisements are concentrated in individual regions, it brings out strategic differences between sets of entities. We additionally lay some groundwork for parsing how these disparate strategies operate in terms of content. Beyond that—and perhaps more crucial to the continuation of this work—the partition breaks up the universe of entities, and offers smaller pieces of the data as units of analysis. In other words, through our par-tition, the task of investigating political ad funding on Facebook becomes much more tractable.
Alas, political advertising and campaigning are ever-evolving practices, and their Face-book form is certainly no exception. Therefore, we cannot say definitively that this parti-tion and its related findings will stand the test of time. Comfort may be found in the fact that the partition group sizes are quite stable month-to-month, but it is still unsure what would be the case given a different set of candidates and a different election cycle. Nev-ertheless, it is also unlikely that our results will become completely obsolete—for one, the presence of regionally-dominated ads is strong, and as we have seen, multi-purpose. Overall, then, this work successfully takes a step toward demystifying the mechanics of online political advertising.
Moving forward, we would like to utilize the results presented here in order to per-form funding entity classification at the individual level. That is, we hope to provide pathways for filling in the empty fields in the meta-data file—especially when it comes to entity disclosure type. We imagine associating each entity with an attribute vector drawn from the meta-data file, with support for unlisted entries. Once that is complete, we can make various networks, separated by partition group, and cross-compare attribute simi-larity with detected communities and/or clustering in the networks. Such a procedure
Page 19 of 20Gitomer et al. Appl Netw Sci (2021) 6:18
would ultimately provide label suggestions for unlabelled entities, and thus hasten the process of individual entity classification. Developing a partially automated, expedited tool for entity classification would be a major, long-lasting step toward ensuring funding transparency in online political advertising.
In addition, our study lays groundwork for looking into spatial questions surrounding digital advertising, and in particular, what makes it successful. Namely, the regional ad clustering we have shown lends itself quite nicely to correlation with polling data, and measurement of how the two move together, if at all. Through such an approach, we may also be able to gain insights into how campaigns react to polling information, or, should there be a puzzling misalignment between polls and ad placement, the extent to which they respond to non-public data.
Supplementary informationSupplementary information accompanies this paper at https ://doi.org/10.1007/s4110 9-020-00350 -7.
Additional file 1. Supplementary Information.
AcknowledgementsWe are grateful to the Center for Responsive Politics for partnering with us on the entity classifications. We thank Michael Franz, Travis Ridout, and all of the members of Delta Lab for their feedback along the way. Finally, we thank the anony-mous reviewers for their comments, which helped us improve the paper.
Authors’ contributionsAG, PO, LB, EFF and SS designed the study. PO acquired the data. AG and SS analyzed the data. AG, PO, LB, EFF and SS interpreted the results and wrote the paper. All authors revised the work, and read and approved the final manuscript.
FundingThe authors recognize support from the James L. Knight Foundation (# GR-2019-60044), Democracy Fund (R-201912-05114), and Wesleyan University.
Availability of data and materialsThe datasets used in this article, as well as the code to analyze it and create figures will be made available from the cor-responding author upon reasonable request.
Competing interestsThe authors declare that they have no competing interests.
Author details1 Network Science Institute, Northeastern University, Boston, MA, USA. 2 Quantitative Analysis Center, Wesleyan Univer-sity, Middletown, CT, USA. 3 Wesleyan Media Project, Wesleyan University, Middletown, CT, USA. 4 Department of Gov-ernment, Wesleyan University, Middletown, CT, USA. 5 Department of Mathematics and Computer Science, Wesleyan University, Middletown, CT, USA.
Received: 23 September 2020 Accepted: 26 December 2020
ReferencesAli M, Sapiezynski P, Korolova A, Mislove A, Rieke A (2019) Ad delivery algorithms: the hidden arbiters of political messag-
ing. arXiv preprint arXiv :1912.04255 Ansolabehere S, Iyengar S (1995) Going negative: how political advertisements shrink and polarize the electorate. Free
Press, New YorkBastian M, Heymann S, Jacomy M et al (2009) Gephi: an open source software for exploring and manipulating networks.
ICWSM 8(2009):361–362Brooks DJ, Murov M (2012) Assessing accountability in a post-citizens united era the effects of attack ad sponsorship by
unknown independent groups. Am Polit Res 40(3):383–418Clauset A, Newman ME, Moore C (2004) Finding community structure in very large networks. Phys Rev E 70(6):066111Clement J (2020) Number of monthly active facebook users worldwide as of 2nd quarter 2020. https ://www.stati sta.
com/stati stics /26481 0/numbe r-of-month ly-activ e-faceb ook-users -world wide, August 2020. Accessed 24 Aug 2020Conover MD, Ratkiewicz J, Francisco MR, Gonçalves B, Menczer F, Flammini A (2011) Political polarization on twitter.
ICWSM 133(26):89–96Dommett K, Power S (2019) The political economy of facebook advertising: election spending, regulation and targeting
online. Polit Q 90(2):257–265

Page 20 of 20Gitomer et al. Appl Netw Sci (2021) 6:18
Dowling CM, Wichowsky A (2013) Does it matter who’s behind the curtain? Anonymity in political advertising and the effects of campaign finance disclosure. Am Polit Res 41(6):965–996
Dowling CM, Wichowsky A (2015) Attacks without consequence? Candidates, parties, groups, and the changing face of negative advertising. Am J Polit Sci 59(1):19–36
Edelson L, Sakhuja S, Dey R, McCoy D (2019) An analysis of united states online political advertising transparency. CoRR, arXiv :abs/1902.04385
Fowler EF, Franz M, Ridout T (2016) Political advertising in the United States. Routledge, New YorkFowler EF, Franz MM, Ridout TN (2020a) Online political advertising in the United States. In: Persily N, Tucker JA (eds)
Social media and democracy: the state of the field, prospects for reform, SSRC anxieties of democracy. Cambridge University Press, Cambridge
Fowler EF, Franz MM, Ridout TN (2020b) Online political advertising in the United States. The state of the field, prospects for reform, social media and democracy, p 111
Franz MM, Fowler EF, Ridout TN (2015) Loose cannons or loyal foot soldiers? Toward a more complex theory of interest group advertising strategies. Am J Polit Sci 60:738–751
Franz MM, Freedman P, Goldstein K, Ridout TN (2008) Campaign advertising and American democracy. Temple University Press, Philadelphia
Geer JG (2006) In defense of negativity: attack ads in presidential campaigns. University of Chicago Press, ChicagoHu Y (2005) Efficient, high-quality force-directed graph drawing. Math J 10(1):37–71Kaid LL (2002) Political advertising and information seeking: comparing exposure via traditional and internet channels. J
Advertis 31(1):27–35Kim Y, Gonzenbach W, Vargo C, Kim Y (2016) First and second levels of intermedia agenda setting: Political advertising,
newspapers, and twitter during the 2012 U.S. presidential election. Int J Commun 10:4550–4569Leathern R (2018) Shining a light on ads with political content. https ://about .fb.com/news/2018/05/ads-with-polit ical-
conte nt/, May 2018. Accessed 24 Aug 2020Mattes K, Redlawsk DP (2015) The positive case for negative campaigning. University of Chicago Press, ChicagoMorris M, Ogan C (1996) The internet as mass medium. J Comput Mediat Commun. https ://doi.
org/10.1111/j.1083-6101.1996.tb001 74.xNewman ME (2006) Modularity and community structure in networks. Proc Natl Acad Sci 103(23):8577–8582Oleinikov P (2020) Long-term monitoring helps identify gaps in facebook reporting. https ://delta lab.resea rch.wesle yan.
edu/2020/08/03/faceb ooks-repor ts/, August 2020. Accessed 24 Aug 2020Ridout TN (2014) The market research, testing and targeting behind American political advertising. In: Lees-Marshment J,
Conley B, Cosgrove K (eds) Political marketing in the U.S. Routledge, New YorkRidout TN, Franz MM, Fowler EF (2015) Sponsorship, disclosure, and donors: limiting the impact of outside group ads.
Polit Res Q 68(1):154–166Varol O (2018) Deception strategies and threats for online discussions. First Monday. https ://doi.org/10.5210/fm.v22i5
.7883Victor JN, Reinhardt GY (2018) Competing for the platform: how organized interests affect party positioning in the United
States. Party Polit 24(3):265–277Weber C, Dunaway J, Johnson T (2012) It’s all in the name: source cue ambiguity and the persuasive appeal of campaign
ads. Polit Behav 34(3):561–584
Publisher’s NoteSpringer Nature remains neutral with regard to jurisdictional claims in published maps and institutional affiliations.