Modeling and Sensitivity Analysis of Acoustic Release of Doxorubicin from Unstabilized Pluronic P105...
8
Technology in Cancer Research and Treatment ISSN 1533-0346 Volume 6, Number 1, February (2007) ©Adenine Press (2007) Modeling and Sensitivity Analysis of Acoustic Release of Doxorubicin from Unstabilized Pluronic P105 using an Artificial Neural Network Model www.tcrt.org This paper models steady state acoustic release of Doxorubicin (Dox) from Pluronic P105 micelles using Artificial Neural Networks (ANN). Previously collected release data were compiled and used to train, validate, and test an ANN model. Sensitivity analysis was then performed on the following operating conditions: ultrasonic frequency, power density, Plu- ronic P105 concentration, and temperature. The model showed that drug release was most efficient at lower frequencies. The analysis also demonstrated that release increases as the power density increases. Sensitivity plots of ultrasound intensity revealed a drug release threshold of 0.015 W/cm 2 and 0.38 W/cm 2 at 20 and 70 kHz, respectively. The presence of a power density threshold provides strong evidence that cavitation plays an important role in acoustically activated drug release from polymeric micelles. Based on the developed model, Dox release is not a strong function of temperature, suggesting that thermal effects do not play a major role in the physical mechanism involved. Finally, sensitivity plots of P105 con- centration indicated that higher release was observed at lower copolymer concentrations. Key words: Artificial neural networks; Polymeric micelles; Ultrasonic stimulus; Doxorubicin; and Pluronic P105. Introduction Pluronic P105 copolymer forms dense micelles at a concentration of 4% or above (1). These micelles are capable of encapsulating chemotherapeutic agents and releasing their contents using acoustic energy (2-11). Similarly, we have shown that acoustically activated drug release increases with increasing power densi- ties and decreasing frequencies (4). Our research group has also reported that P105 micelles stabilized with an interpenetrating network of N,N-diethylacryl- amide can be acoustically stimulated to release Doxorubicin (Dox) (2). Re- cently, we have shown that acoustically activated drug release from unstabilized Pluronic P105 micelles is highly correlated to the appearance of a subharmonic peak in acoustic spectra, revealing the important role of cavitation in this release phenomenon (3). In all of our experiments, a custom made ultrasonic exposure chamber with fluorescence detection was used to investigate drug release from micelles. The apparatus was designed to measure real-time release kinetics of Dox from different micellar systems including stabilized and unstabilized Plu- ronic P105 micelles. Dox exhibits a substantial decrease in fluorescence when transferred from the hydrophobic poly-propylene-oxide (PPO) core of the mi- celle to the surrounding aqueous solution (2, 6). Mechanistic models were used to predict the kinetics of release and re-encapsula- tion in an attempt to optimize the application of ultrasound in future in vivo ex- Ghaleb A. Husseini, Ph.D. 1,2,* Nabil M. Abdel-Jabbar, Ph.D. 1,3 Farouq S. Mjalli 4 William G. Pitt, Ph.D. 2 1 Chemical Engineering Department American University of Sharjah Sharjah, United Arab Emirates 2 Department of Chemical Engineering Brigham Young University Provo, Utah 84602, USA 3 Chemical Engineering Department Jordan University of Science and Technology Irbid, Jordan 4 Chemical Engineering Department University of Malaya Kuala Lumpur, Malaysia * Corresponding Author: Ghaleb A. Husseini Email: [email protected] 49
Transcript of Modeling and Sensitivity Analysis of Acoustic Release of Doxorubicin from Unstabilized Pluronic P105...

Technology in Cancer Research and TreatmentISSN 1533-0346Volume 6, Number 1, February (2007)©Adenine Press (2007)
Modeling and Sensitivity Analysis of Acoustic Release of Doxorubicin from Unstabilized Pluronic
P105 using an Artificial Neural Network Model
www.tcrt.org
This paper models steady state acoustic release of Doxorubicin (Dox) from Pluronic P105
micelles using Artificial Neural Networks (ANN). Previously collected release data were
compiled and used to train, validate, and test an ANN model. Sensitivity analysis was then
performed on the following operating conditions: ultrasonic frequency, power density, Plu-
ronic P105 concentration, and temperature. The model showed that drug release was most
efficient at lower frequencies. The analysis also demonstrated that release increases as the
power density increases. Sensitivity plots of ultrasound intensity revealed a drug release
threshold of 0.015 W/cm2 and 0.38 W/cm2 at 20 and 70 kHz, respectively. The presence of
a power density threshold provides strong evidence that cavitation plays an important role in
acoustically activated drug release from polymeric micelles. Based on the developed model,
Dox release is not a strong function of temperature, suggesting that thermal effects do not
play a major role in the physical mechanism involved. Finally, sensitivity plots of P105 con-
centration indicated that higher release was observed at lower copolymer concentrations.
Key words: Artificial neural networks; Polymeric micelles; Ultrasonic stimulus; Doxorubicin;
and Pluronic P105.
Introduction
Pluronic P105 copolymer forms dense micelles at a concentration of 4% or above (1). These micelles are capable of encapsulating chemotherapeutic agents and releasing their contents using acoustic energy (2-11). Similarly, we have shown that acoustically activated drug release increases with increasing power densi-ties and decreasing frequencies (4). Our research group has also reported that P105 micelles stabilized with an interpenetrating network of N,N-diethylacryl-amide can be acoustically stimulated to release Doxorubicin (Dox) (2). Re-cently, we have shown that acoustically activated drug release from unstabilized Pluronic P105 micelles is highly correlated to the appearance of a subharmonic peak in acoustic spectra, revealing the important role of cavitation in this release phenomenon (3). In all of our experiments, a custom made ultrasonic exposure chamber with fluorescence detection was used to investigate drug release from micelles. The apparatus was designed to measure real-time release kinetics of Dox from different micellar systems including stabilized and unstabilized Plu-ronic P105 micelles. Dox exhibits a substantial decrease in fluorescence when transferred from the hydrophobic poly-propylene-oxide (PPO) core of the mi-celle to the surrounding aqueous solution (2, 6).
Mechanistic models were used to predict the kinetics of release and re-encapsula-tion in an attempt to optimize the application of ultrasound in future in vivo ex-
Ghaleb A. Husseini, Ph.D.1,2,*
Nabil M. Abdel-Jabbar, Ph.D.1,3
Farouq S. Mjalli4
William G. Pitt, Ph.D.2
1Chemical Engineering DepartmentAmerican University of SharjahSharjah, United Arab Emirates2Department of Chemical EngineeringBrigham Young UniversityProvo, Utah 84602, USA3Chemical Engineering DepartmentJordan University of Science and TechnologyIrbid, Jordan4Chemical Engineering DepartmentUniversity of MalayaKuala Lumpur, Malaysia
*Corresponding Author:Ghaleb A. HusseiniEmail: [email protected]
49

50 Husseinietal.
Technology in Cancer Research & Treatment, Volume 6, Number 1, February 2007
periments (6). That study showed that the model with zero-order release and first-order re-encapsulation most closely predicted experimental data compared to the three other pro-posed models. Although this mechanistic model was able to approximate the kinetics of both release and re-encapsula-tion, the range of data used in that study encompasses lim-ited operating conditions including power density, frequency, Pluronic P105 concentration, and temperature.
The complex nature of this novel drug delivery system prompts the need for a modeling technique that can be used to predict drug release at a wider range of operating condi-tions. Such models can be utilized to mimic and extrapolate the behavior of drug loaded micelles without the need for further extensive experimentation.
In the research described in this paper, artificial neural net-work models (ANNs) were used to predict drug release as a function of the four variables mentioned above. Such modeling entails using a large number of experimental data to reconcile model predictions with actual release measure-ments in order to validate the ANN model. The next section provides a brief background and describes the methodology used in neural network modeling.
Neural Networks Modeling: Background and Methodology
The development of artificial neural networks started in the early middle of the last century to help cognitive scientists in understanding the complexity of the nervous system. These models evolved steadily and were adopted in many areas of science. Basically, ANNs are numerical structures inspired by the learning process of the human brain. They are con-structed and used as alternative mathematical tools to solve a diversity of problems in the fields of system identifica-tion, forecasting, pattern recognition, classification, process control, and many others (12-15). The interest in ANN as a mathematical modeling tool resulted in the consolidation of its theoretical background and the development of its under-lying learning and optimization algorithms.
Our area of interest in this paper is the modeling and simu-lation using Pluronic P105 micelles as drug delivery ve-hicles and acoustic power as a trigger mechanism. The implementation of empirical correlations for this complex system involves a great deal of mathematical difficulties and in many instances lacks the desired accuracy. Neuron-based modeling can be used confidently as a substitute in such situations. This is due to the favorable features en-tailed in their use, such as simplicity, fault and noise toler-ance, plasticity (the ability to retain its prediction efficiency even after the removal or damage of some of its neurons), black box modeling methodology, and robustness (the ca-pability to adapt to process changes).
ANNs can be categorized, in terms of their topology, as sin-gle and multi-layer feedforward networks (FFNN), feedback networks (FBNN), recurrent networks (RNN), and self-orga-nized networks. In addition, they can be further categorized in terms of application, connection type, and learning method. The most commonly used type of networks is the feedforward networks (FFNN) shown in Figure 1. This network topology is composed of one input layer, one output layer, and a mini-mum of one hidden layer. The term feedforward describes the way in which the output of the FFNN is calculated using its input layer-by-layer throughout the network. No matter how complex the network is, its building block is a simple structure called the neuron. It performs a weighted sum of its inputs and calculates an output using certain predefined acti-vation functions. Activation functions for the hidden units are needed to introduce the nonlinearity into the network. Sig-moidal functions, such as logistic and tanh, and the Gaussian function, are the most common choices of activation func-tions. The neural system architecture is defined by the num-ber of neurons and the way by which the neurons are intercon-nected. The network is fed with a set of input-output pairs and trained to reproduce the outputs. The training is done by adjusting the neurons weights and biases using an optimiza-tion algorithm that attempts to minimize the quadratic error between experimental data and computed outputs. The per-formance function used in the optimization is usually based on the squared difference between the actual observed output ai and the network prediction ti for n sample points (14, 15).
Input-target training data are usually pretreated in order to improve the numerical condition of the optimization and training process. Thus, the data is normally divided into three subsets: training, validation, and testing. The training subset is used to accomplish network learning and fit net-work weights by minimizing an appropriate error function. Backpropagation is the training technique usually used for this purpose. It refers to the method for computing the gradi-
Performance Index = 1n Σ(ti – ai)2|
n
i=1[1]
Output
Linear neuron
Nonlinear neuron
Input(1)
Input(n)
Figure 1: General structure of a three layers feedforward ANN.

Technology in Cancer Research & Treatment, Volume 6, Number 1, February 2007
Artificial Neural Network Model 51
ent of the case-wise error function with respect to the weights of the feedforward network. The performance of the network is then independently compared by evaluating the error func-tion using the validation subset. The testing subset data is then used to measure the generalization of the network (i.e., how accurately the network predicts outputs for inputs that are not in the training set). This process is sometimes re-ferred to as hold-out validation.
Selecting the network structure is a crucial step in the over-all design of ANNs. The structure must be optimized to reduce computer processing, achieve good performance and avoid overfitting. The selection of the best number of hidden units depends on many factors. The size of the train-ing set, the amount of noise in the targets, the complexity of the sought function to be modeled, the type of activation functions used and the training algorithm all have interact-ing effects on the sizes of the hidden layers. There is no way to determine the best number of hidden units without training several networks and estimating the generalization error of each. If there are few hidden units, then high train-ing and high generalization errors due to underfitting may occur. On the other hand, if many hidden layers are used, low training error can be achieved, but network generaliza-tion degrades (16). A good reference on the feedforward networks and its applications is given by Fine (17).
Materials and Methods
Materials
Pluronic P-105 was provided by BASF Corp. (Mount Olive, NJ); Doxorubicin (Dox) was obtained from the University of Utah Hospital (Salt Lake City, UT) in a 1:5 mixture with lac-tose and from Pharmacia & Upjohn Company (Kalamazoo, MI); it was dissolved in phosphate buffered saline (PBS) and sterilized by filtration through a 0.2 μm filter (Millipore Bil-lerica, MA). The pH of PBS was 7.4.
Drug Encapsulation in Pluronic Micelles
Stock solutions of Pluronic (BASF, Mount Olive, NJ) were prepared by dissolving P105 in a PBS solution to the desired final concentration. Dox was dissolved into the P105 solu-tions at room temperature (37 ºC) to produce a final Dox con-centration of 10 μg/ml. The same drug concentration was also prepared in PBS (pH =7.4).
Measuring Ultrasound-triggered Release of Dox From Pluronic P105 Micelles
The chamber was built to measure the change of fluorescence level with and without the application of ultrasound. Details were described previously (4). Briefly, an argon-ion laser
beam at 488 nm was directed to either a cuvette or a tube containing the encapsulated drug. The emissions were col-lected using a fiber optic collector and filtered to remove the excitation wavelength. Then these emissions were quantified using a photodetector on an oscilloscope and subsequently stored on a computer for further analysis (4).
The decrease in fluorescence of the encapsulated drug solu-tion was assumed to be directly proportional to the amount of drug released relative to a known baseline. The fluores-cence of Dox in PBS, in the absence of Pluronic, was mea-sured to simulate 100% release. Then the percent release was calculated as follows:
where, IUS is the fluorescence intensity upon exposure to ul-trasound, IPBS is the fluorescence intensity in a solution of Dox in PBS, and IP105 is the intensity recorded when the drug is encapsulated in Pluronic P105 (which corresponds to 0% release or 100% encapsulation).
In these experiments, the fluorescence intensity of the drug in PBS was measured both with and without the application of ultrasound. Ultrasonic power at 67, 80, and 90 kHz was generated using a Sonicor SC-100 ultrasound bath (Sonicor Instr., Copaique, N. Y.). The intensity of ultrasound was controlled by adjusting the input voltage using a variable A.C. transformer (Variac). Ultrasound at 20 kHz was gen-erated using a probe transducer (Sonics and Materials, New-ton, CT) inserted into the water bath. While the sonication at 47 kHz was performed in a Cole-Parmer sonication bath (Cole-Parmer, Mount Vernon, IL). The insonation inten-sity was determined using a calibrated hydrophone (Bruel and Kjaer model 8103, Decatur, GA). The power densities used in data collection fell in the range of 0-0.06 W/cm2 at 20 kHz, and 0-2.8 W/cm2 at 47, 67, 80, and 90 kHz. Three different temperatures were used in these experiments: 24 ºC, 37 ºC, and 56 ºC. Finally, four polymeric concentra-tions were used in the modeling: 0.1%, 1%, 5%, and 10%. Further details can be found in (4).
Ultrasonic power at 67, 80, and 90 kHz was generated using a Sonicor SC-100 ultrasound bath (Sonicor Instr., Copaique, N. Y.), which employs two flat piezoelectric transducer mounted on the underside of the stainless steel tank. The waveform can be described as a 67, 80, or 90 kHz signal that is amplitude modulated sinusoidally at about 120 Hz. The geometry of the bath creates standing waves, and the tube or cuvette with the sample was placed in a region of high power density (or intensity), usually directly above one of the transducers. The insonation intensity at the sampling point was determined us-ing a calibrated hydrophone (Bruel and Kjaer model 8103, Decatur, GA). The intensity of ultrasound was controlled by
% release = × 100%IP105 – IUSIP105 – IPBS
[2]
52 Husseinietal.
Technology in Cancer Research & Treatment, Volume 6, Number 1, February 2007
adjusting the input voltage using a variable A.C. transformer (Variac). In other experiments, 20 kHz ultrasound was gener-ated using a probe transducer (Sonics and Materials, Newton, CT) inserted adjacent to the tube or cuvette in the water bath. This instrument produced a continuous sinusoidal waveform, and acoustic waves radiate spherically from the tip of the probe. Reflections in the water bath created standing waves. Again, the intensity at the sampling point was measured with the hydrophone. Further details can be found in (4).
Results and Discussion
ANNs were applied to model acoustically activated drug re-lease from polymeric micelles. The aim is to predict drug release as a function of the following input variables: fre-quency, power density, polymer concentration, and tem-perature. The MATLAB neural networks toolbox (18) was used for this analysis.
Drug release experimental data (3, 4) were grouped in five vectors (four inputs and one output) and were sorted and pre-processed to fall in the range [-1, 1] by calculating the minimum and maximum of each vector variable and then scal-ing the data with respect to these limits. This was achieved using the MATLAB function premnmx. This improves the efficiency of the network training. The data set with 359 data points was subdivided into three subsets namely: training, validation, and testing. The size ratio of these subsets was 2(training):1(validation):1(testing), respectively.
The network structure was selected after running some prelim-inary simulations to explore the training speed and response
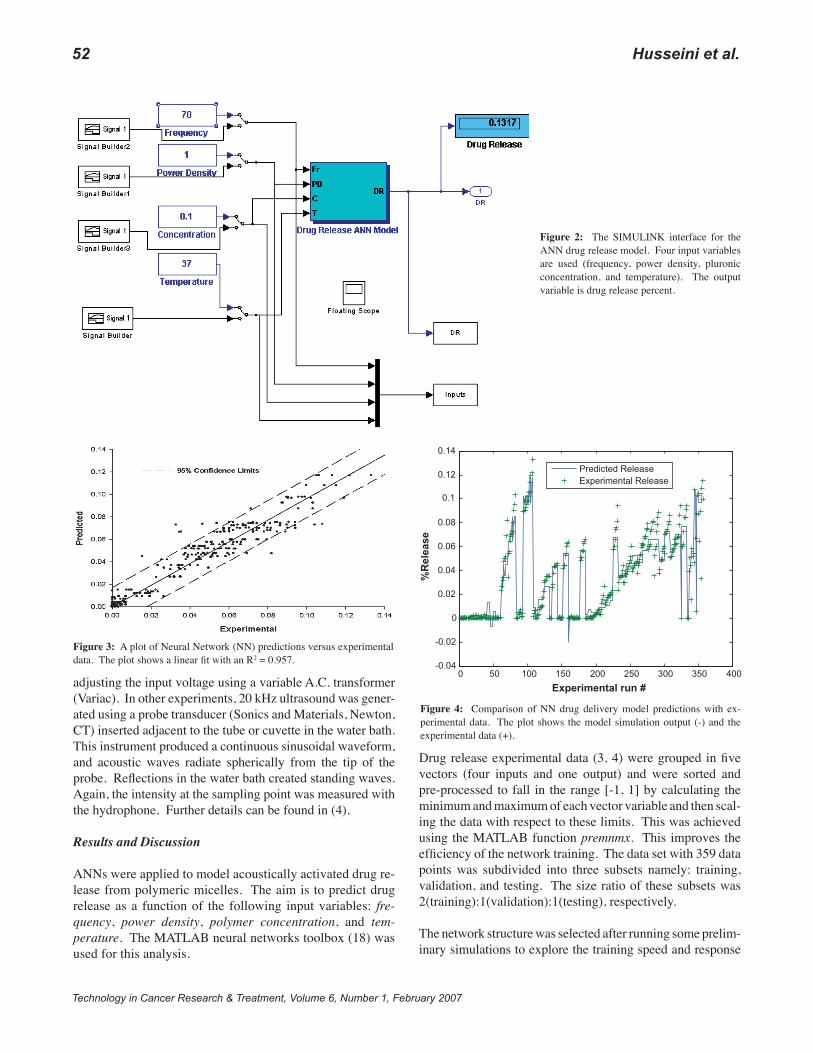
Figure 2: The SIMULINK interface for the ANN drug release model. Four input variables are used (frequency, power density, pluronic concentration, and temperature). The output variable is drug release percent.
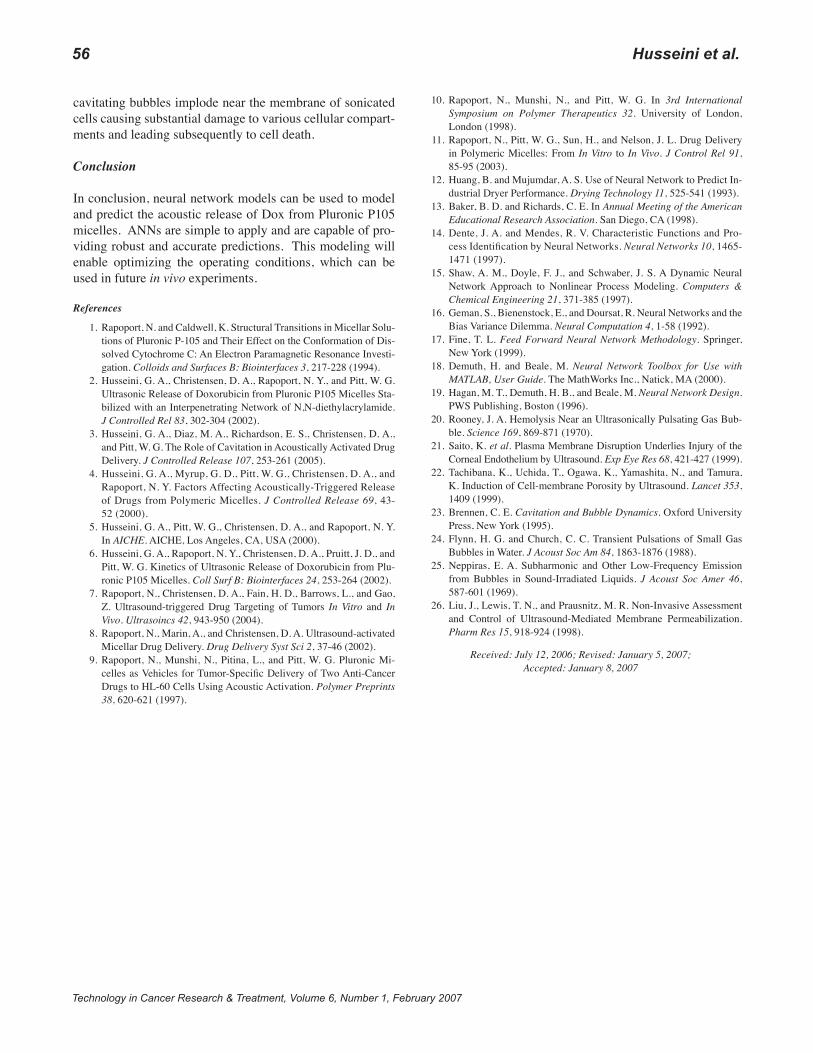
Figure 3: A plot of Neural Network (NN) predictions versus experimental data. The plot shows a linear fit with an R2 = 0.957.
0 50 100 150 200 250 300 350 400-0.04
-0.02
0
0.02
0.04
0.06
0.08
0.1
0.12
0.14
Experimental run #
%R
elea
se
Predicted ReleaseExperimental Release
Figure 4: Comparison of NN drug delivery model predictions with ex-perimental data. The plot shows the model simulation output (-) and the experimental data (+).

Technology in Cancer Research & Treatment, Volume 6, Number 1, February 2007
Artificial Neural Network Model 53
time of different structures. To keep the network structure as simple as possible, three layers were used in all networks: one input layer, one hidden layer, and one output layer. The number of neurons in the input and output layers was limited to the number of input and output variables provided. Con-sequently, four neurons were used in the input layer and one neuron in the output layer. On the other hand, the number of neurons in the hidden layer was selected after testing the per-formance of different network combinations. It was observed that the least number of neurons in the hidden layer, which converged to a final acceptable solution, was eight neurons. This structure ensures training with reasonable speed for a specific network performance. The constituents of the net-work layers (i.e., types of neurons used), were taken to be tan-sigmoidal for the input and hidden layers, whereas linear neurons were used for the output layer. This is a common choice for function approximation neural networks (18).
The optimization algorithm used for network training was the Levenberg-Marquardt. The MATLAB routine trainlm with memory reduction was used for the optimization. Previously, we found that this algorithm attains fast learning speed and high performance relative to other optimization algorithms. The details of this algorithm are given by Hagan (19). The optimization performance target was set to 1 × 10⁻⁵.
Based on this selected network structure, the training process achieved the performance target for maximum training epochs of 3000. The learning rate was chosen to be 0.1. This value ensures stable fast learning. The training took approximately 10 minutes without any violation to the validation error. Fig-
ure 2 represents the SIMULINK interface for the ANN drug release model. As mentioned earlier, four input variables are used (frequency, power density, pluronic concentration, and temperature). The output variable is drug release. Figure 3 shows a linear correlation between experimental and network predictions of drug release (R2 = 0.957). As can be seen from the figure, the network gave accurate predictions with most predictions within the 95% confidence limit. Figure 4 shows the complete experimental dataset and the corresponding ANN predictions. Additionally, Figure 5 shows neural net-work training versus the standard square of error. Clearly, the square of error decreases as the number of epochs increases.
Following the training of the network, post-processing of the output data vector was performed using the same scaling parameters determined in the pre-processing stage. The MATLAB function postmnmx was used for this pur-pose. A Matlab/Simulink simulation model was built for the trained network. This was achieved by converting the Matlab network structure into a Simulink block and defin-ing the Input/Output ports, data processing, and simulation parameters. The model input was configured in a form of pre-assigned sequences for the four input variables. These sequences allow the user to vary input variables simultane-ously or individually in order to characterize the effect of these variables on drug release. As such, different sensitiv-ity profiles were obtained as shown below.
Effect of Ultrasonic Frequency on Drug Release
Figure 6 depicts a sensitivity plot of Dox release versus fre-quency at several power densities, a constant bath tempera-ture of 37 ºC, and a Pluronic P105 concentration of 10%. The plot indicates that drug release from micelles was most efficient at lower frequencies. This is in agreement with all
0 500 1000 1500 2000 2500 30000
50
100
150
200
250
300
Sq
uar
ed E
rro
r
Epoch
Figure 5: Variation of Standard Square of Error with Neural Network train-ing Epochs.
20 30 40 50 60 70 80 900
2
4
6
8
10
12
14
16
18
20
Frequency (kHz)
% R
elea
se
0.2 W/cm2
0.3 W/cm20.4 W/cm2
0.5 W/cm2
Figure 6: The drug release sensitivity plots of frequency. (Power densities = 0.2, 0.3, 0.4, and 0.5 W/cm2, Temp = 37 ºC, Concentration = 10%).

54 Husseinietal.
Technology in Cancer Research & Treatment, Volume 6, Number 1, February 2007
previously published data (4). At higher frequencies, higher power densities are needed to obverse the same amount of Dox release as those measured at lower frequencies. Lower frequencies have more energy capable of perturbing the mi-celles (either by microstreaming or shock waves during cavi-tation events), thus allowing Dox to escape out of the micelle and into the surrounding aqueous environment.
Drug Release as a Function of Power Density
Figures 7 and 8 demonstrate that release increases as the pow-er density increases. This behavior is expected because high-er ultrasonic intensities are capable of perturbing the micelles more vigorously, which leads to the drug release observed here. Figures 7 and 8 indicate the presence of a release thresh-old at approximately 0.02 and 0.38 W/cm2 for 20 and 70 kHz, respectively. This power density threshold has been related to the emergence of a subharmonic peak in acoustic spectra, which would indicate that cavitation events play an important role in this release phenomenon. It should be noted here that drug release versus the power density is linear at 20 kHz while it shows a non-linear behavior at 70 kHz. This is mainly due to the nature of the fitting function used in ANN that attempts to fit all experimental data collected at this higher frequency.
Drug Release as a Function of Temperature
Figure 9 shows a sensitivity plot of Dox release versus tem-perature at several power densities, a Pluronic Concentration of 10%, and 70 kHz ultrasound. It suggests that hyperther-mic effects do not play a major role in the amount of drug released. However, the role of temperature becomes more pronounced at lower power densities. This confirms previ-ous reports that the observed drug release is not attributed to
the increase in the local temperature of the sonicated regions, but rather to non-thermal mechanical effects (8).
Drug Release as a Function of Pluronic Concentration
Figure 10 shows the sensitivity plot of Dox release versus weight percent of Pluronic P105 at a power density of 1 W/cm2, a temperature of 37 ºC, and two different frequen-cies. Higher drug release from P105 micelles as the con-centration of the copolymer decreases may be attributed to the higher local concentration of the drug in the coploymer’s core. The increase in the hydrophobic/hydrophobic interac-tion between the PPO core of the micelle and Dox at higher P105 concentration reduces micellar perturbation caused by ultrasound. Thus, less drug molecules are able to diffuse out
0 0.02 0.04 0.06 0.08 0.1 0.12 0.14 0.16 0.18 0.20
2
4
6
8
10
12
14
16
18
20
Power Density (W/Cm2)
%R
elea
se
Frequency=20 kHz, Temp=37 C, Conc=10%
0 0.1 0.2 0.3 0.4 0.5 0.6 0.7 0.8 0.9 10
2
4
6
8
10
12
14
Power Density (W/Cm2)
%R
elea
se
Frequency=70 kHz, Temp=37 C, Conc=10%
Figure 7: The drug release sensitivity plot of power density at 20 kHz. (Temp = 37 ºC, Concentration = 10%).
Figure 8: The drug release sensitivity plot of power density at 70 kHz. (Temp = 37 ºC, Concentration = 10 %).
20 25 30 35 40 45 50 55 600
2
4
6
8
10
12
14
16
18
20
Temp (C)
%R
elea
se
0.8 W/cm2
0.9 W/cm2
1.0 W/cm2
Figure 9: The drug release sensitivity plot of temperature. (Power densities = 0.8, 0.9, and 1 W/cm2, Concentration = 10%, Frequency = 70 kHz).

Technology in Cancer Research & Treatment, Volume 6, Number 1, February 2007
Artificial Neural Network Model 55
of the micelle, which in turn minimizes observed release. We speculate that these micellar perturbations are caused by mi-crostreaming or shock waves during cavitation events.
Our previous research has shown that drug release is not based on ultrasonic thermal effect. Instead, there are sev-eral non-thermal effects caused by ultrasound that include oscillating bubbles, radiation pressure, radiation torque, and acoustic streaming. These effects play an important role in increasing the convection and subsequent transport of the drug. Cavitation occurs when a gas bubble expands and con-tracts in size in response to the oscillating pressure during sonication. Bubbles with a natural resonance frequency that match the frequency of ultrasonic activation are capable of achieving the highest amplitude of cavitation or oscillation. When the power density increases the size of the bubble ap-proaches the resonance size that causes extreme non-linear bubble oscillations. This results in the destruction of the bubble. The collapse is typically attributed to the increase in the inward-moving water surface so that it overcomes the pressure inside the bubble. This phenomenon is referred to as transient or collapse cavitation. It is capable of creating shock waves, increasing the local pressure by 100 atm, and the local temperature by several thousands of degrees (K). Several reports in literature have shown that shockwaves can cause substantial cell damage and possible cell lysis. Anoth-er adverse bioeffect is caused by free radicals generated dur-ing bubble collapse. It is important to note here that stable (non-inertial) cavitation, where bubbles are able to cavitate without imploding, is capable of causing some bio-effects (20). As the bubble oscillates, high shear stresses are created near the bubble surface that can create micropores in the cell membrane, thereby making the cell more permeable to other macromolecules present in the vicinity (21, 22).
Subharmonic and higher harmonic emissions are charac-teristics of cavitation events (both stable and collapse) and are caused by bubbles oscillating at half (f/2), and nf/2 of the driving frequency (f), respectively. In addition to these harmonic emissions, collapse cavitation has been correlated with the intensity of the non-harmonic background noise generated by shock waves as bubbles are destroyed. Figure 8 suggests that the release of Dox from P105 micelles has a threshold of acoustic intensity of approximately 0.38 W/cm2 at 70 kHz. Several studies have shown that inertial cavita-tion has an apparent threshold (this is one of the reasons why cell lysis is usually attributed to inertial cavitation events) (23-25). However, Liu et al. (26) have shown that under certain conditions hemolysis (red blood cell lysis) is caused by stable or non-inertial cavitation. Stable cavitation does not have an intensity threshold because any level of pressure oscillation will cause the bubble to expand and contract in an acoustic field. Again, it is important to keep in mind that biological effects of stable cavitation have a power density threshold; although, substantially lower than that observed for inertial cavitation. The presence of a power density threshold in Figures 7 and 8 suggest that acoustically activat-ed drug release from unstablilized P105 micelles is caused by collapse rather than stable cavitation. The threshold of collapse cavitation increases as the frequency of ultrasound increases. For example, the onset of collapse cavitation at 20 kHz occurs at approximately 0.015 W/cm2 while at 70 kHz this threshold increases to 0.38 W/cm2.
Although most of our studies were conducted using an iso-thermal water bath at 37 ºC, to simulate physiological condi-tions, we have investigated the effect of temperature upon re-lease. This was done in an attempt to rule out the possibility that the absorption of ultrasonic energy by the micelle raises the local temperature and activates release by decreasing the local viscosity of the micellar core, thus rendering Dox mol-ecules more mobile. Figure 9 shows that Dox release is not a strong function of temperature, suggesting that thermal ef-fects do not play an important role in the physical mechanism involved with this drug delivery technique.
Finally, it is worth mentioning here that several factors should be considered when measuring the release of chemotherapy drugs in vivo whereby micelles are able to circulate freely in the blood stream. The hydrophobic nature of anti-neo-plastic agents will complicate the sequestration process after the drug has been released via ultrasonic stimulus. Other hydrophobic molecules circulating in blood, e.g., albumin, will compete with Pluronic micelles to re-encapsulate acous-tically released drug molecules. Additionally, ultrasound has to be carefully focused and controlled to prevent cell lysis in the healthy tissues surrounding the sonicated tumor. Sonoly-sis (cell lysis observed when tissues are exposed to acous-tic energy) is caused by transient cavitation events whereby
10-3 10-2 10-18
10
12
14
16
18
20
P105 Conc (%)
%R
elea
se
80 kHz
20 kHz
Figure 10: The drug release sensitivity plots of Pluronic P105 concen-tration. (Power density = 1 W/cm2, Temp = 37 ºC, Frequency = 20 kHz and 90 kHz).
56 Husseinietal.
Technology in Cancer Research & Treatment, Volume 6, Number 1, February 2007
cavitating bubbles implode near the membrane of sonicated cells causing substantial damage to various cellular compart-ments and leading subsequently to cell death.
Conclusion
In conclusion, neural network models can be used to model and predict the acoustic release of Dox from Pluronic P105 micelles. ANNs are simple to apply and are capable of pro-viding robust and accurate predictions. This modeling will enable optimizing the operating conditions, which can be used in future in vivo experiments.
References
10.
11.
12.
13.
14.
15.
16.
17.
18.
19.
20.
21.
22.
23.
24.
25.
26.
Rapoport, N., Munshi, N., and Pitt, W. G. In 3rd International Symposium on Polymer Therapeutics 32. University of London, London (1998).Rapoport, N., Pitt, W. G., Sun, H., and Nelson, J. L. Drug Delivery in Polymeric Micelles: From In Vitro to In Vivo. J Control Rel 91, 85-95 (2003).Huang, B. and Mujumdar, A. S. Use of Neural Network to Predict In-dustrial Dryer Performance. Drying Technology 11, 525-541 (1993).Baker, B. D. and Richards, C. E. In Annual Meeting of the American Educational Research Association. San Diego, CA (1998).Dente, J. A. and Mendes, R. V. Characteristic Functions and Pro-cess Identification by Neural Networks. Neural Networks 10, 1465-1471 (1997).Shaw, A. M., Doyle, F. J., and Schwaber, J. S. A Dynamic Neural Network Approach to Nonlinear Process Modeling. Computers & Chemical Engineering 21, 371-385 (1997).Geman, S., Bienenstock, E., and Doursat, R. Neural Networks and the Bias Variance Dilemma. Neural Computation 4, 1-58 (1992).Fine, T. L. Feed Forward Neural Network Methodology. Springer, New York (1999).Demuth, H. and Beale, M. Neural Network Toolbox for Use with MATLAB, User Guide. The MathWorks Inc., Natick, MA (2000).Hagan, M. T., Demuth, H. B., and Beale, M. Neural Network Design. PWS Publishing, Boston (1996).Rooney, J. A. Hemolysis Near an Ultrasonically Pulsating Gas Bub-ble. Science 169, 869-871 (1970).Saito, K. et al. Plasma Membrane Disruption Underlies Injury of the Corneal Endothelium by Ultrasound. Exp Eye Res 68, 421-427 (1999).Tachibana, K., Uchida, T., Ogawa, K., Yamashita, N., and Tamura, K. Induction of Cell-membrane Porosity by Ultrasound. Lancet 353, 1409 (1999).Brennen, C. E. Cavitation and Bubble Dynamics. Oxford University Press, New York (1995).Flynn, H. G. and Church, C. C. Transient Pulsations of Small Gas Bubbles in Water. J Acoust Soc Am 84, 1863-1876 (1988).Neppiras, E. A. Subharmonic and Other Low-Frequency Emission from Bubbles in Sound-Irradiated Liquids. J Acoust Soc Amer 46, 587-601 (1969).Liu, J., Lewis, T. N., and Prausnitz, M. R. Non-Invasive Assessment and Control of Ultrasound-Mediated Membrane Permeabilization. Pharm Res 15, 918-924 (1998).
1.
2.
3.
4.
5.
6.
7.
8.
9.
Rapoport, N. and Caldwell, K. Structural Transitions in Micellar Solu-tions of Pluronic P-105 and Their Effect on the Conformation of Dis-solved Cytochrome C: An Electron Paramagnetic Resonance Investi-gation. Colloids and Surfaces B: Biointerfaces 3, 217-228 (1994).Husseini, G. A., Christensen, D. A., Rapoport, N. Y., and Pitt, W. G. Ultrasonic Release of Doxorubicin from Pluronic P105 Micelles Sta-bilized with an Interpenetrating Network of N,N-diethylacrylamide. J Controlled Rel 83, 302-304 (2002).Husseini, G. A., Diaz, M. A., Richardson, E. S., Christensen, D. A., and Pitt, W. G. The Role of Cavitation in Acoustically Activated Drug Delivery. J Controlled Release 107, 253-261 (2005).Husseini, G. A., Myrup, G. D., Pitt, W. G., Christensen, D. A., and Rapoport, N. Y. Factors Affecting Acoustically-Triggered Release of Drugs from Polymeric Micelles. J Controlled Release 69, 43-52 (2000).Husseini, G. A., Pitt, W. G., Christensen, D. A., and Rapoport, N. Y. In AICHE. AICHE, Los Angeles, CA, USA (2000).Husseini, G. A., Rapoport, N. Y., Christensen, D. A., Pruitt, J. D., and Pitt, W. G. Kinetics of Ultrasonic Release of Doxorubicin from Plu-ronic P105 Micelles. Coll Surf B: Biointerfaces 24, 253-264 (2002).Rapoport, N., Christensen, D. A., Fain, H. D., Barrows, L., and Gao, Z. Ultrasound-triggered Drug Targeting of Tumors In Vitro and In Vivo. Ultrasoincs 42, 943-950 (2004).Rapoport, N., Marin, A., and Christensen, D. A. Ultrasound-activated Micellar Drug Delivery. Drug Delivery Syst Sci 2, 37-46 (2002).Rapoport, N., Munshi, N., Pitina, L., and Pitt, W. G. Pluronic Mi-celles as Vehicles for Tumor-Specific Delivery of Two Anti-Cancer Drugs to HL-60 Cells Using Acoustic Activation. Polymer Preprints 38, 620-621 (1997).
Received: July 12, 2006; Revised: January 5, 2007; Accepted: January 8, 2007